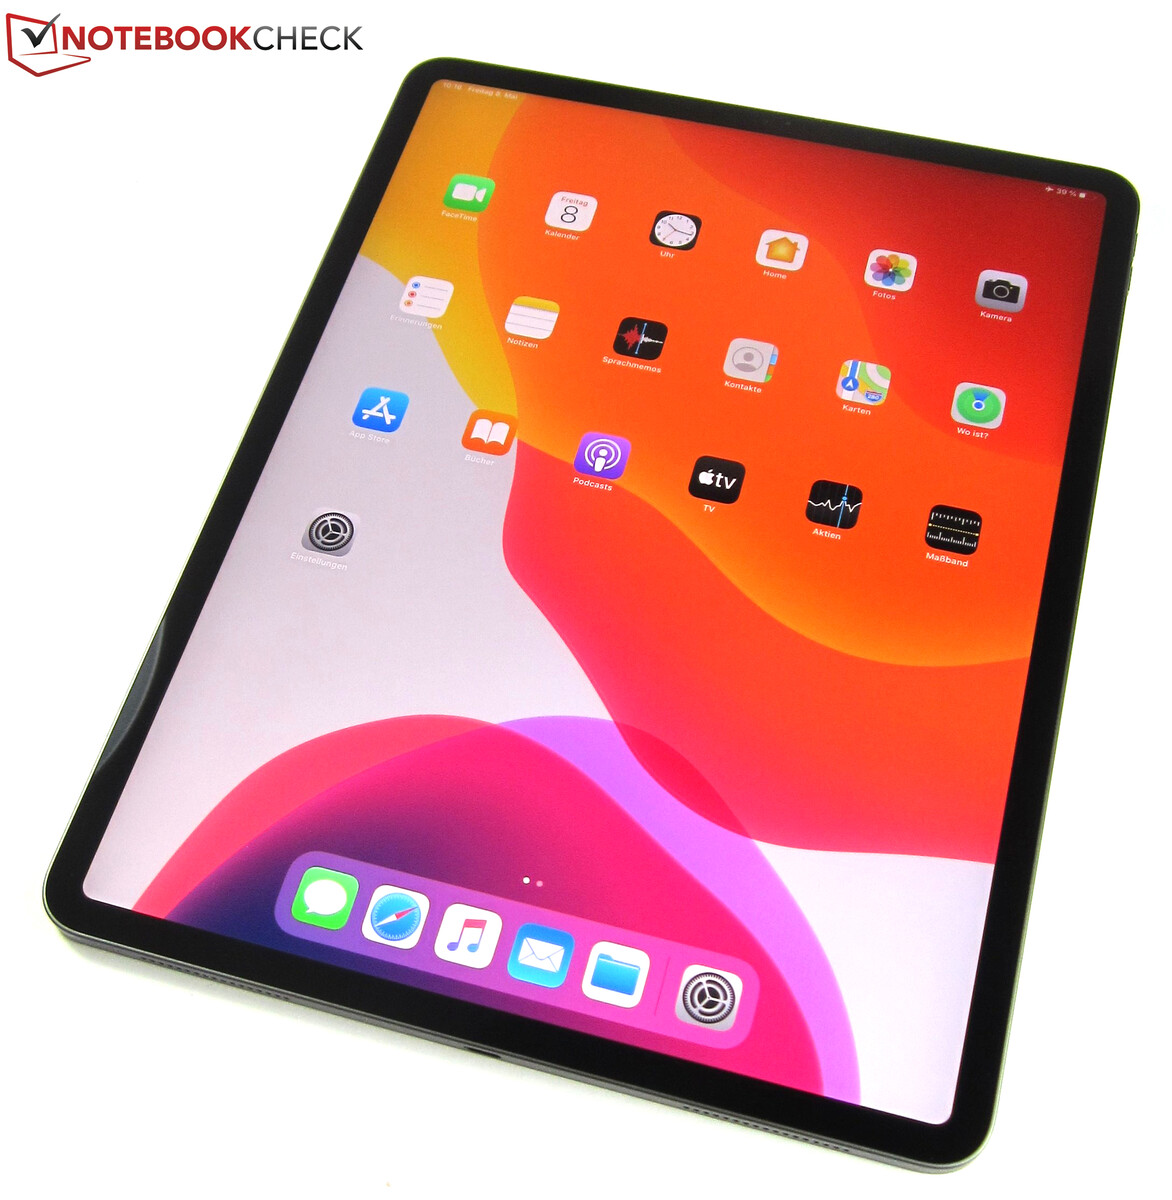
Breve Análise do Apple iPad Pro 12.9 (2020): Ajustes finos no carro-chefe
Avaliação | Data | Modelo | Peso | Altura | Size | Resolução | Preço |
|---|---|---|---|---|---|---|---|
| 89.3 % v7 (old) | 05/2020 | Apple iPad Pro 12.9 2020 A12Z Bionic, A12Z Bionic GPU | 641 g | 5.9 mm | 12.90" | 2732x2048 | |
| 90.2 % v7 (old) | 11/2018 | Apple iPad Pro 12.9 2018 A12X Bionic, A12X Bionic GPU | 633 g | 5.9 mm | 12.90" | 2732x2048 | |
| 90.4 % v7 (old) | 04/2020 | Apple iPad Pro 11 2020 A12Z Bionic, A12Z Bionic GPU | 471 g | 5.9 mm | 11.00" | 2388x1668 | |
| 88.1 % v7 (old) | 03/2020 | Microsoft Surface Pro 7 i7-1065G7, Iris Plus Graphics G7 (Ice Lake 64 EU) | 790 g | 8.5 mm | 12.30" | 2736x1824 | |
| 87.8 % v7 (old) | 10/2019 | Samsung Galaxy Tab S6 SM-T860 SD 855, Adreno 640 | 420 g | 5.7 mm | 10.50" | 2560x1600 |


| |||||||||||||||||||||||||
iluminação: 87 %
iluminação com acumulador: 625 cd/m²
Contraste: 1330:1 (Preto: 0.47 cd/m²)
ΔE ColorChecker Calman: 1.3 | ∀{0.5-29.43 Ø4.73}
ΔE Greyscale Calman: 1.8 | ∀{0.09-98 Ø4.97}
99.7% sRGB (Calman 2D)
Gamma: 2.23
CCT: 6765 K
| Apple iPad Pro 12.9 2020 IPS, 2732x2048, 12.9" | Apple iPad Pro 12.9 2018 IPS, 2732x2048, 12.9" | Apple iPad Pro 11 2020 IPS, 2388x1668, 11" | Microsoft Surface Pro 7 IPS, 2736x1824, 12.3" | Samsung Galaxy Tab S6 SM-T860 Super AMOLED, 2560x1600, 10.5" | |
|---|---|---|---|---|---|
| Screen | 15% | 16% | 5% | -47% | |
| Brightness middle (cd/m²) | 625 | 632 1% | 617 -1% | 435 -30% | 446 -29% |
| Brightness (cd/m²) | 599 | 605 1% | 585 -2% | 422 -30% | 445 -26% |
| Brightness Distribution (%) | 87 | 91 5% | 84 -3% | 90 3% | 86 -1% |
| Black Level * (cd/m²) | 0.47 | 0.32 32% | 0.36 23% | 0.32 32% | |
| Contrast (:1) | 1330 | 1975 48% | 1714 29% | 1359 2% | |
| Colorchecker dE 2000 * | 1.3 | 1.1 15% | 0.94 28% | 1.18 9% | 2.7 -108% |
| Colorchecker dE 2000 max. * | 2.7 | 2.4 11% | 1.87 31% | 2.27 16% | 5.4 -100% |
| Greyscale dE 2000 * | 1.8 | 1.7 6% | 1.4 22% | 1.12 38% | 2.1 -17% |
| Gamma | 2.23 99% | 2.21 100% | 2.156 102% | 2.3 96% | 2.05 107% |
| CCT | 6765 96% | 6794 96% | 6733 97% | 6502 100% | 6468 100% |
| Colorchecker dE 2000 calibrated * | 3.49 | ||||
| Color Space (Percent of AdobeRGB 1998) (%) | 60 | ||||
| Color Space (Percent of sRGB) (%) | 96 |
* ... menor é melhor
Cintilação da tela / PWM (modulação por largura de pulso)
| Tela tremeluzindo/PWM detectado | 58820 Hz | ≤ 13 % configuração de brilho | 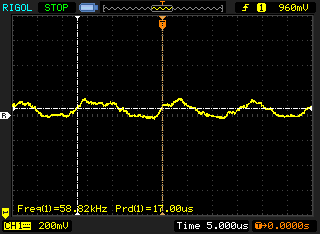 |
A luz de fundo da tela pisca em 58820 Hz (pior caso, por exemplo, utilizando PWM) Cintilação detectada em uma configuração de brilho de 13 % e abaixo. Não deve haver cintilação ou PWM acima desta configuração de brilho. A frequência de 58820 Hz é bastante alta, então a maioria dos usuários sensíveis ao PWM não deve notar nenhuma oscilação. [pwm_comparison] Em comparação: 52 % de todos os dispositivos testados não usam PWM para escurecer a tela. Se PWM foi detectado, uma média de 7794 (mínimo: 5 - máximo: 343500) Hz foi medida. | |||
Exibir tempos de resposta
| ↔ Tempo de resposta preto para branco | ||
|---|---|---|
| 24.4 ms ... ascensão ↗ e queda ↘ combinadas | ↗ 8.4 ms ascensão | 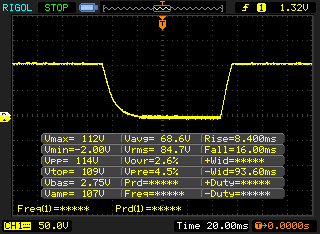 |
| ↘ 16 ms queda | ||
| A tela mostra boas taxas de resposta em nossos testes, mas pode ser muito lenta para jogadores competitivos. Em comparação, todos os dispositivos testados variam de 0.1 (mínimo) a 240 (máximo) ms. » 57 % de todos os dispositivos são melhores. Isso significa que o tempo de resposta medido é pior que a média de todos os dispositivos testados (19.9 ms). | ||
| ↔ Tempo de resposta 50% cinza a 80% cinza | ||
| 46.8 ms ... ascensão ↗ e queda ↘ combinadas | ↗ 18.4 ms ascensão | 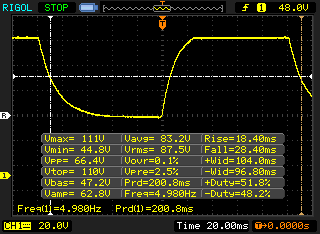 |
| ↘ 28.4 ms queda | ||
| A tela mostra taxas de resposta lentas em nossos testes e será insatisfatória para os jogadores. Em comparação, todos os dispositivos testados variam de 0.165 (mínimo) a 636 (máximo) ms. » 80 % de todos os dispositivos são melhores. Isso significa que o tempo de resposta medido é pior que a média de todos os dispositivos testados (31.1 ms). | ||
| 3DMark | |
| 1280x720 offscreen Ice Storm Unlimited Score | |
| Apple iPad Pro 11 2020 | |
| Média Apple A12Z Bionic (110582 - 110846, n=2) | |
| Apple iPad Pro 12.9 2020 | |
| Apple iPad Pro 12.9 2018 | |
| Samsung Galaxy Tab S6 SM-T860 | |
| 1280x720 offscreen Ice Storm Unlimited Graphics Score | |
| Apple iPad Pro 11 2020 | |
| Média Apple A12Z Bionic (220422 - 221941, n=2) | |
| Apple iPad Pro 12.9 2020 | |
| Apple iPad Pro 12.9 2018 | |
| Samsung Galaxy Tab S6 SM-T860 | |
| 1280x720 offscreen Ice Storm Unlimited Physics | |
| Apple iPad Pro 12.9 2020 | |
| Média Apple A12Z Bionic (40279 - 40299, n=2) | |
| Apple iPad Pro 11 2020 | |
| Apple iPad Pro 12.9 2018 | |
| Samsung Galaxy Tab S6 SM-T860 | |
| AnTuTu v8 - Total Score | |
| Apple iPad Pro 12.9 2020 | |
| Média Apple A12Z Bionic (712218 - 751846, n=2) | |
| Apple iPad Pro 11 2020 | |
| Basemark ES 3.1 / Metal - offscreen Overall Score | |
| Apple iPad Pro 12.9 2020 | |
| Média Apple A12Z Bionic (5657 - 5709, n=2) | |
| Apple iPad Pro 11 2020 | |
| Apple iPad Pro 12.9 2018 | |
| Média da turma Tablet (255 - 5784, n=7, últimos 2 anos) | |
| Jetstream 2 - 2.0 Total | |
| Média da turma Tablet (35.8 - 395, n=58, últimos 2 anos) | |
| Apple iPad Pro 11 2020 (Safari 14.1) | |
| Apple iPad Pro 11 2020 (Chrome 80) | |
| Apple iPad Pro 12.9 2020 (Safari 13) | |
| Média Apple A12Z Bionic (124.5 - 127.4, n=3) | |
| Samsung Galaxy Tab S6 SM-T860 (Chrome 77.0.3865.116) | |
| JetStream 1.1 - 1.1 Total | |
| Apple iPad Pro 12.9 2018 (Safari Mobile 12) | |
| Apple iPad Pro 11 2020 (Chrome 80) | |
| Média Apple A12Z Bionic (272 - 274, n=2) | |
| Apple iPad Pro 12.9 2020 (Safari 13) | |
| Microsoft Surface Pro 7 (Microsoft Edge 44.18362.449.0) | |
| Samsung Galaxy Tab S6 SM-T860 (Chrome 77.0.3865.116) | |
| WebXPRT 3 - Overall | |
| Média da turma Tablet (108 - 480, n=10, últimos 2 anos) | |
| Apple iPad Pro 11 2020 (Safari 14.1) | |
| Apple iPad Pro 11 2020 (Chrome 80) | |
| Apple iPad Pro 12.9 2018 (Safari Mobile 12) | |
| Média Apple A12Z Bionic (140 - 194, n=3) | |
| Apple iPad Pro 12.9 2020 (Safari 13) | |
| Samsung Galaxy Tab S6 SM-T860 (Chrome 77.0.3865.116) | |
| Speedometer 2.0 - Result 2.0 | |
| Média da turma Tablet (2.59 - 790, n=37, últimos 2 anos) | |
| Apple iPad Pro 11 2020 (Safari 14.1) | |
| Média Apple A12Z Bionic (135 - 154, n=2) | |
| Apple iPad Pro 12.9 2020 (Safari 13) | |
| Samsung Galaxy Tab S6 SM-T860 (Chrome 77.0.3865.116) | |
| Octane V2 - Total Score | |
| Média da turma Tablet (763 - 138481, n=73, últimos 2 anos) | |
| Apple iPad Pro 12.9 2018 (Safari Mobile 12) | |
| Apple iPad Pro 12.9 2020 (Safari 13) | |
| Média Apple A12Z Bionic (42372 - 43057, n=3) | |
| Apple iPad Pro 11 2020 (Safari 14.1) | |
| Apple iPad Pro 11 2020 (Chrome 80) | |
| Microsoft Surface Pro 7 (Microsoft Edge 44.18362.449.0) | |
| Samsung Galaxy Tab S6 SM-T860 (Chrome 77.0.3865.116) | |
| Mozilla Kraken 1.1 - Total | |
| Média da turma Tablet (243 - 27101, n=67, últimos 2 anos) | |
| Samsung Galaxy Tab S6 SM-T860 (Chrome 77.0.3865.116) | |
| Microsoft Surface Pro 7 (Microsoft Edge 44.18362.449.0) | |
| Apple iPad Pro 11 2020 (Chrome 80) | |
| Apple iPad Pro 12.9 2020 (Safari 13) | |
| Média Apple A12Z Bionic (646 - 646, n=2) | |
| Apple iPad Pro 12.9 2018 (Safari Mobile 12) | |
* ... menor é melhor
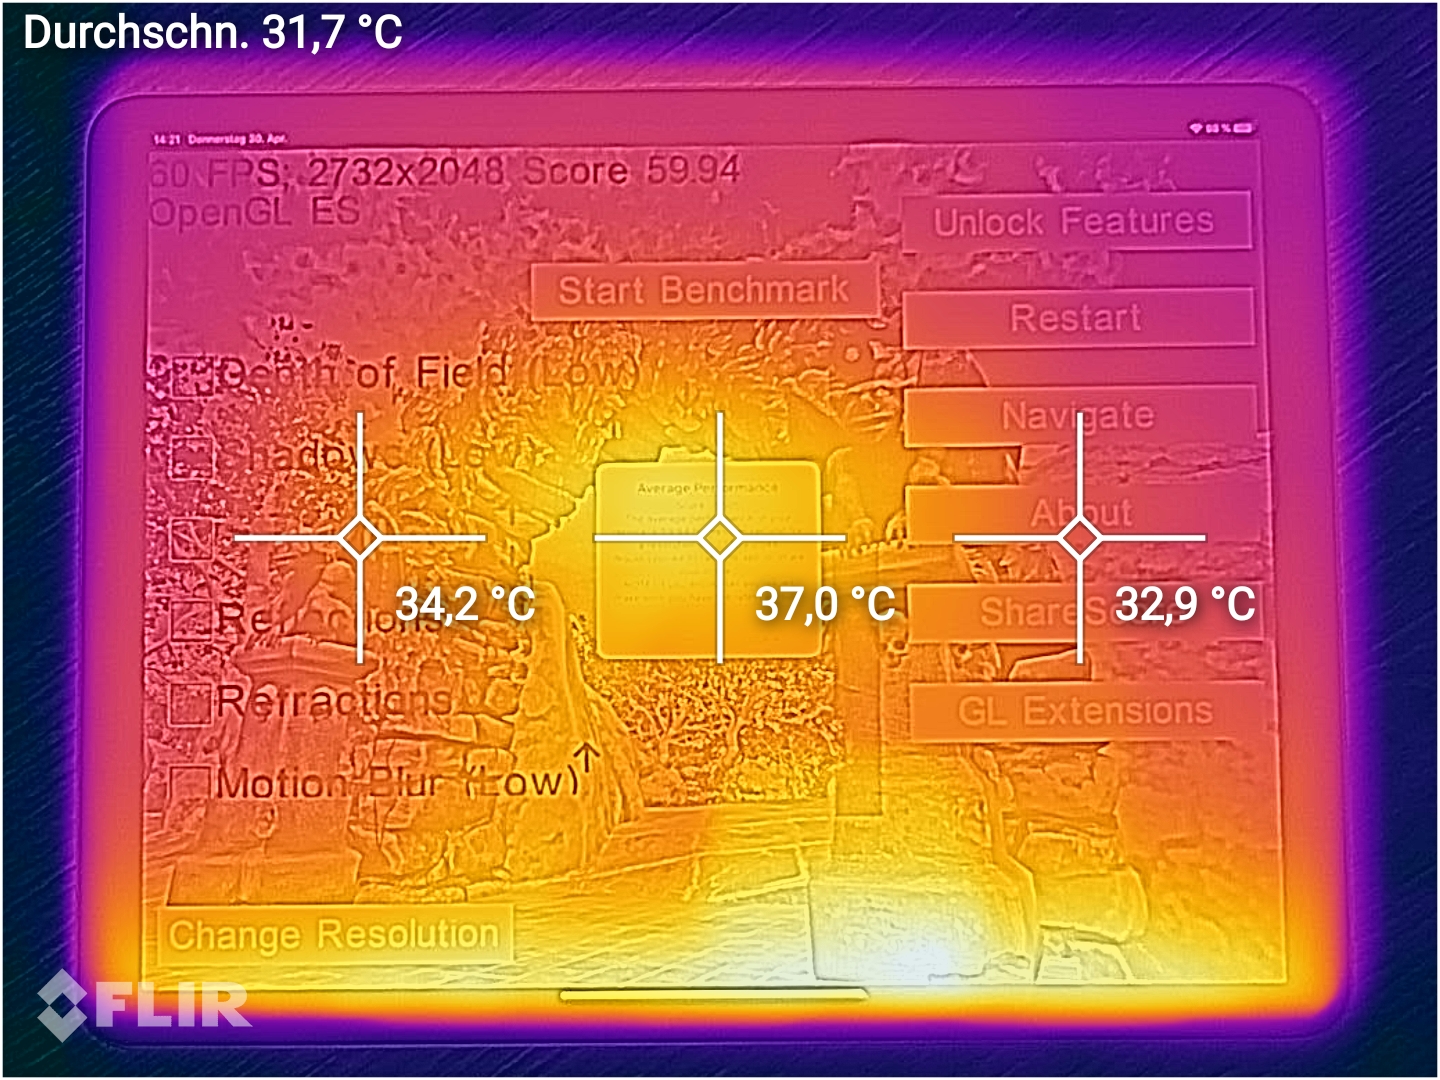
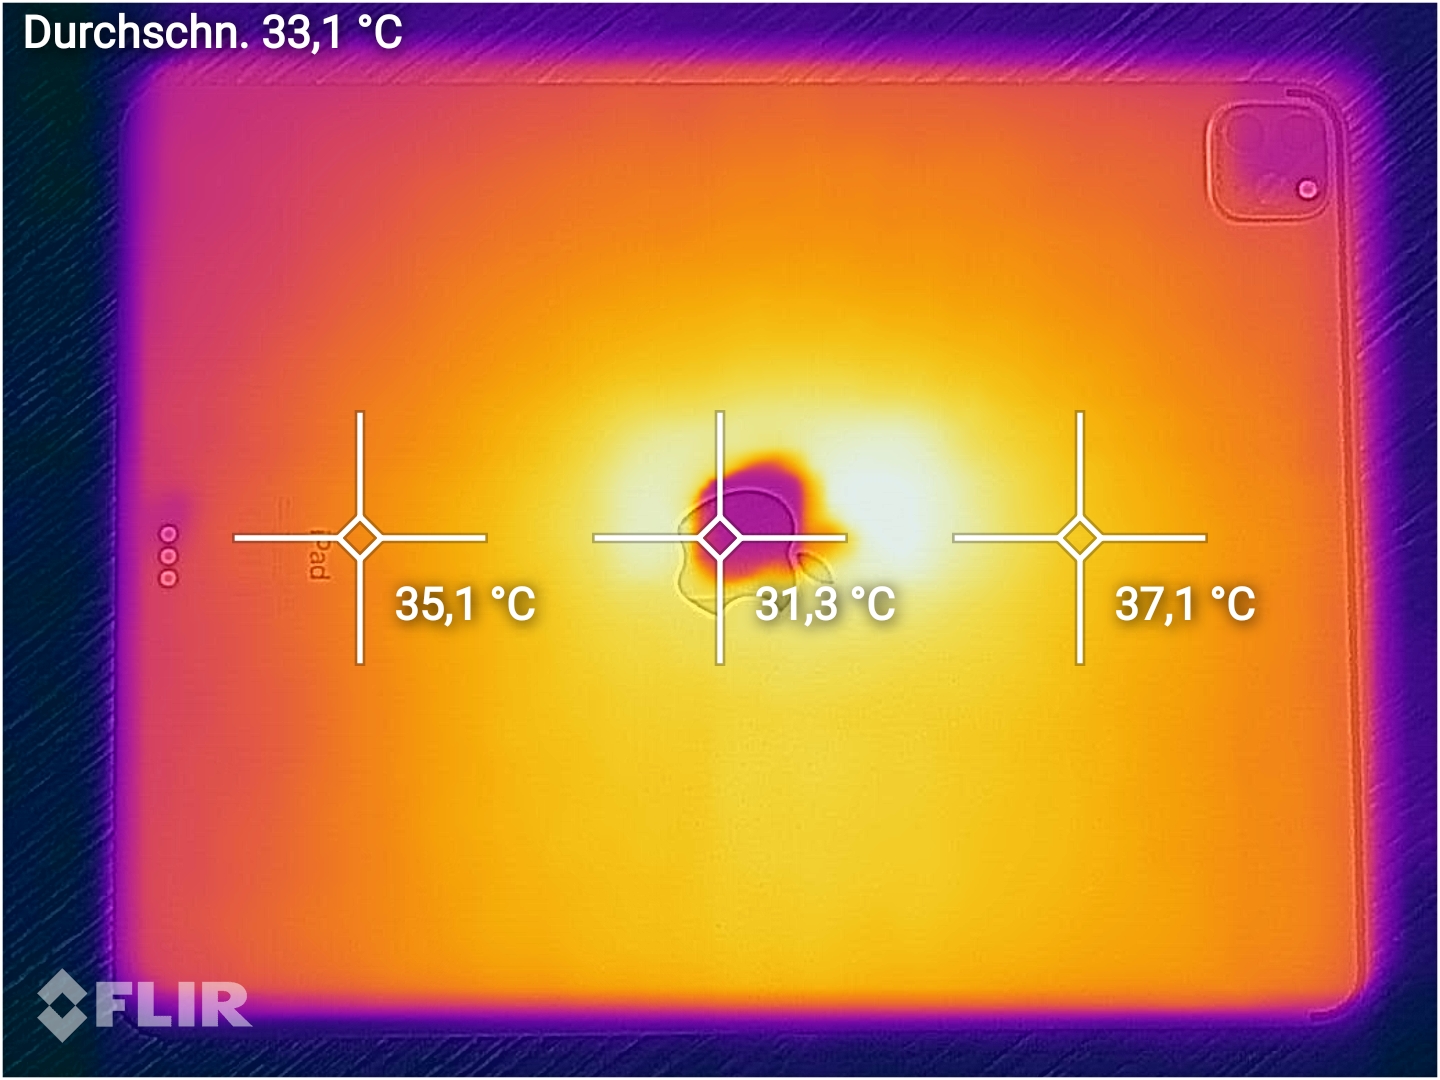
(+) A temperatura máxima no lado superior é 39.1 °C / 102 F, em comparação com a média de 33.6 °C / 92 F , variando de 20.7 a 53.2 °C para a classe Tablet.
(+) A parte inferior aquece até um máximo de 37.4 °C / 99 F, em comparação com a média de 33.2 °C / 92 F
(±) Em uso inativo, a temperatura média para o lado superior é 33.6 °C / 92 F, em comparação com a média do dispositivo de 30 °C / ### class_avg_f### F.
Apple iPad Pro 12.9 2020 análise de áudio
(±) | o volume do alto-falante é médio, mas bom (###valor### dB)
Graves 100 - 315Hz
(±) | graves reduzidos - em média 6.6% menor que a mediana
(±) | a linearidade dos graves é média (10.6% delta para a frequência anterior)
Médios 400 - 2.000 Hz
(+) | médios equilibrados - apenas 4.2% longe da mediana
(+) | médios são lineares (4.6% delta para frequência anterior)
Altos 2 - 16 kHz
(+) | agudos equilibrados - apenas 4.1% longe da mediana
(+) | os máximos são lineares (5.5% delta da frequência anterior)
Geral 100 - 16.000 Hz
(+) | o som geral é linear (11.2% diferença em relação à mediana)
Comparado com a mesma classe
» 11% de todos os dispositivos testados nesta classe foram melhores, 4% semelhantes, 85% piores
» O melhor teve um delta de 7%, a média foi 20%, o pior foi 129%
Comparado com todos os dispositivos testados
» 7% de todos os dispositivos testados foram melhores, 2% semelhantes, 91% piores
» O melhor teve um delta de 4%, a média foi 24%, o pior foi 134%
Microsoft Surface Pro 7 análise de áudio
(-) | alto-falantes não muito altos (###valor### dB)
Graves 100 - 315Hz
(±) | graves reduzidos - em média 10.2% menor que a mediana
(±) | a linearidade dos graves é média (12.1% delta para a frequência anterior)
Médios 400 - 2.000 Hz
(+) | médios equilibrados - apenas 4.6% longe da mediana
(±) | a linearidade dos médios é média (10.2% delta para frequência anterior)
Altos 2 - 16 kHz
(+) | agudos equilibrados - apenas 3.1% longe da mediana
(+) | os máximos são lineares (6.8% delta da frequência anterior)
Geral 100 - 16.000 Hz
(±) | a linearidade do som geral é média (21.5% diferença em relação à mediana)
Comparado com a mesma classe
» 58% de todos os dispositivos testados nesta classe foram melhores, 11% semelhantes, 32% piores
» O melhor teve um delta de 6%, a média foi 20%, o pior foi 57%
Comparado com todos os dispositivos testados
» 61% de todos os dispositivos testados foram melhores, 7% semelhantes, 33% piores
» O melhor teve um delta de 4%, a média foi 24%, o pior foi 134%
| desligado | |
| Ocioso | |
| Carga |
|
Key:
min: | |
| Apple iPad Pro 12.9 2020 9720 mAh | Apple iPad Pro 12.9 2018 mAh | Apple iPad Pro 11 2020 7538 mAh | Microsoft Surface Pro 7 mAh | Samsung Galaxy Tab S6 SM-T860 7040 mAh | |
|---|---|---|---|---|---|
| Power Consumption | -8% | 11% | -169% | 30% | |
| Idle Minimum * (Watt) | 1.22 | 1.42 -16% | 1.3 -7% | 4.4 -261% | 1.96 -61% |
| Idle Average * (Watt) | 8.68 | 9.35 -8% | 3.5 60% | 8.7 -0% | 2.8 68% |
| Idle Maximum * (Watt) | 8.75 | 9.38 -7% | 5.6 36% | 9.6 -10% | 2.82 68% |
| Load Average * (Watt) | 11.72 | 12.75 -9% | 12.5 -7% | 44 -275% | 5.31 55% |
| Load Maximum * (Watt) | 15.25 | 14.96 2% | 19.2 -26% | 61 -300% | 11.91 22% |
* ... menor é melhor
| Apple iPad Pro 12.9 2020 9720 mAh | Apple iPad Pro 12.9 2018 mAh | Apple iPad Pro 11 2020 7538 mAh | Microsoft Surface Pro 7 mAh | Samsung Galaxy Tab S6 SM-T860 7040 mAh | |
|---|---|---|---|---|---|
| Duração da bateria | 6% | 14% | -44% | 14% | |
| Reader / Idle (h) | 30.5 | 31.5 3% | 33.4 10% | 11.5 -62% | 21.3 -30% |
| H.264 (h) | 12.3 | 15 22% | 15.6 27% | 6.7 -46% | 14.5 18% |
| WiFi v1.3 (h) | 15.1 | 13.3 -12% | 15 -1% | 9.8 -35% | 9.3 -38% |
| Load (h) | 2.8 | 3.1 11% | 3.3 18% | 1.9 -32% | 5.7 104% |
Pro
Contra
Veredicto: Expandindo sua liderança

O iPad Pro é atualmente o melhor tablet do mercado. É extremamente rápido, sua tela True Tone bem calibrada é uma benção para usuários criativos, a experiência do usuário é tremendamente suave, seus quatro alto-falantes integrados produzem excelente som estéreo e o tablet também está entre os melhores em termos de duração da bateria.
A Apple otimizou ainda mais o que já foi o melhor tablet do mercado com algumas atualizações cautelosas.
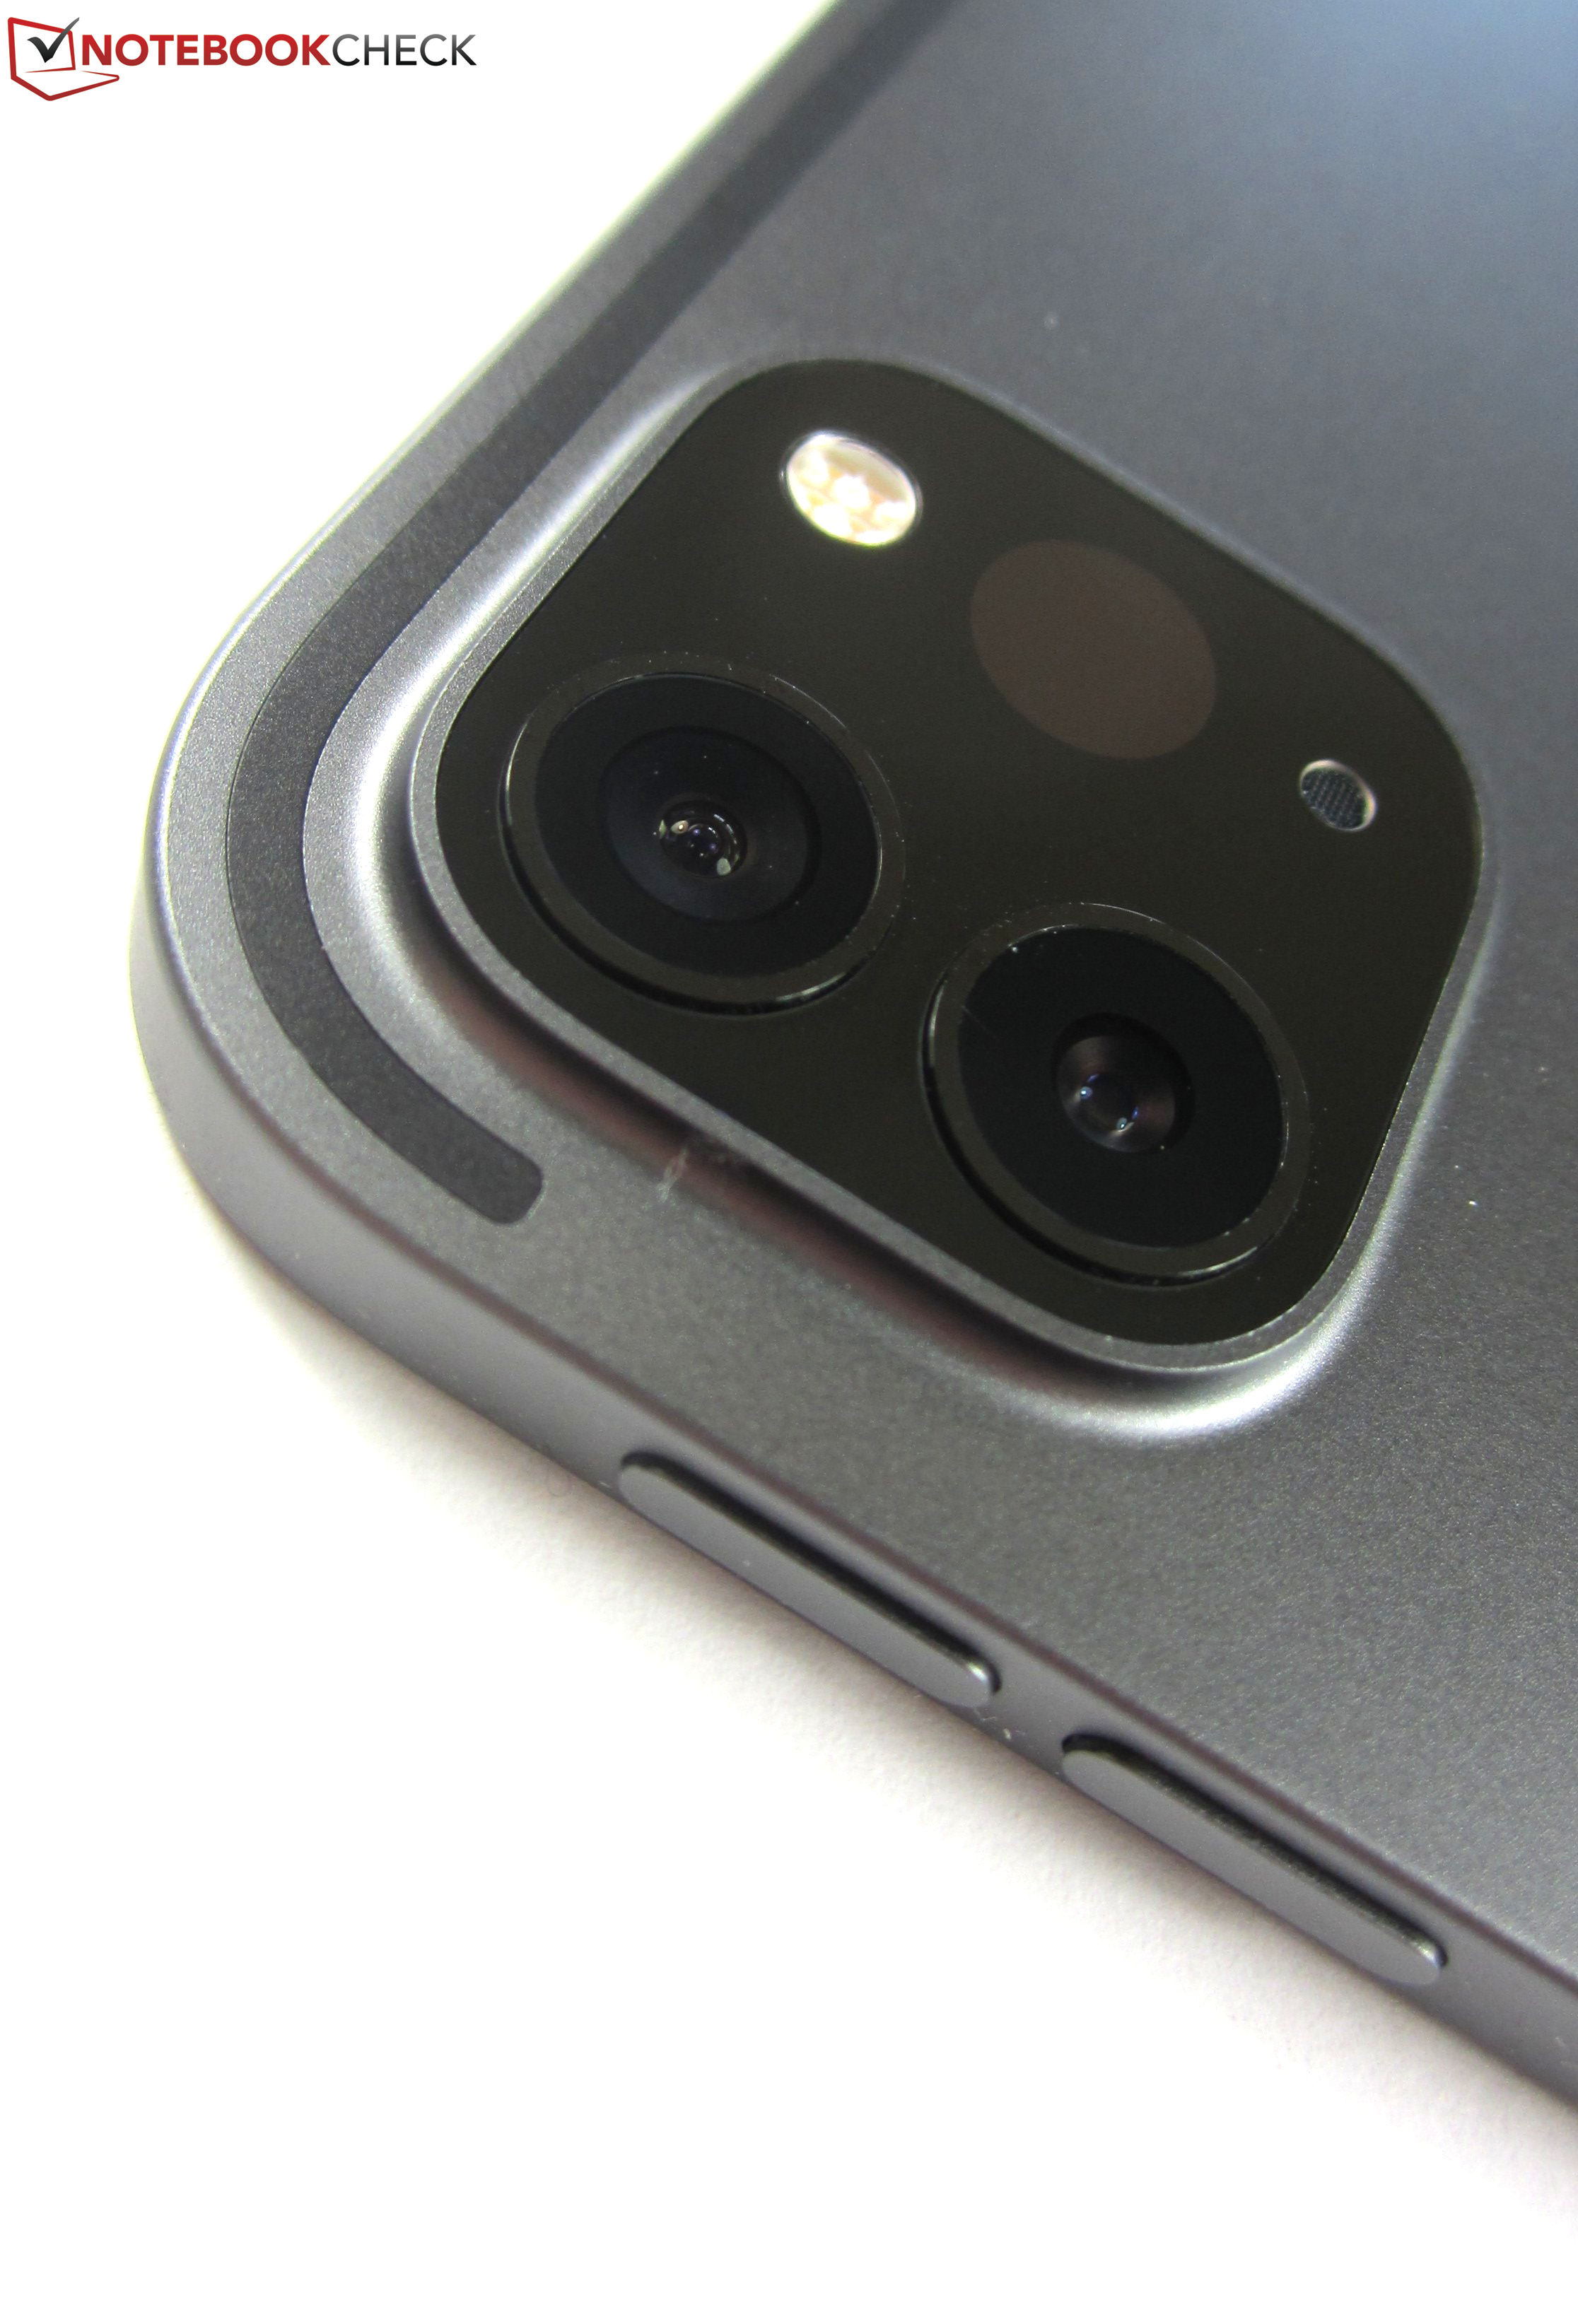
Todas estas características já estavam presentes na versão anterior. Entretanto, algumas atualizações conservadoras, como uma câmera atualizada com um sensor LiDAR, uma CPU um pouco mais rápida e 6 GB de RAM por padrão, independentemente da configuração de armazenamento, agora separam ainda mais o iPad Pro de outros tablets da Apple, sem mencionar as alternativas do Android.
Graças à sua tela maior, o iPad Pro 12.9 (2020) como o carro-chefe atual da série iPad Pro é ainda mais adequado para casos de uso profissional do que o iPad Pro 11 (2020). Dito isto, todo o seu potencial só pode ser desbloqueado através de acessórios, que como o próprio tablet, são bastante caros.. O Magic Keyboard, que deverá ser lançado no final de maio, deverá torna-lo quase um notebook.
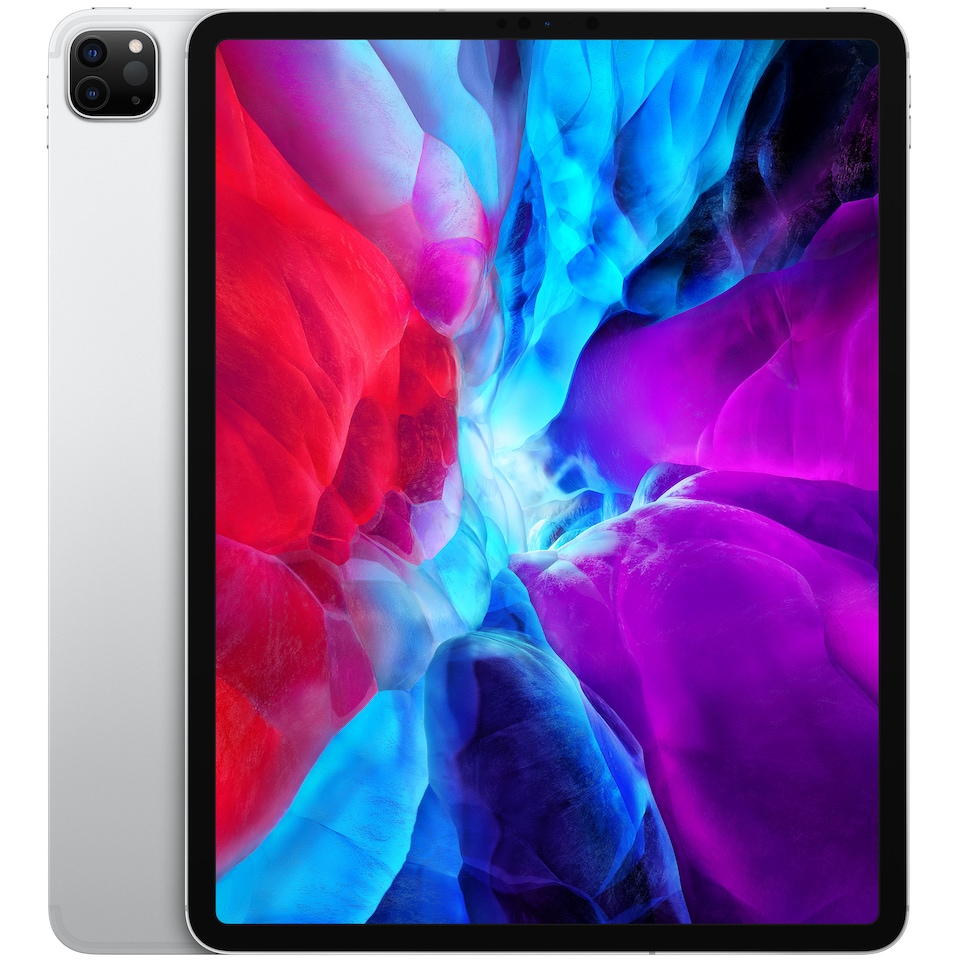
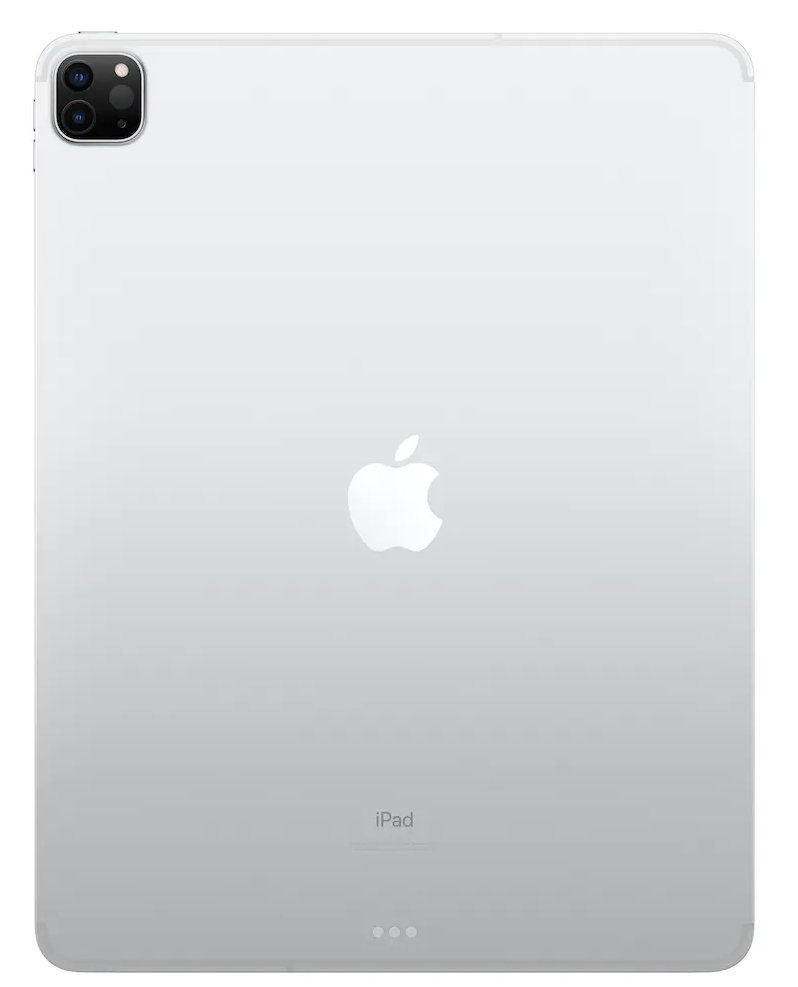
Apple iPad Pro 12.9 2020
- 05/13/2020 v7 (old)
Manuel Masiero
Price comparison
