Breve Análise do Tablet Apple iPad Pro 11 2020 – É assim como se faz uma atualização
Avaliação | Data | Modelo | Peso | Altura | Size | Resolução | Preço |
|---|---|---|---|---|---|---|---|
| 90.4 % v7 (old) | 04/2020 | Apple iPad Pro 11 2020 A12Z Bionic, A12Z Bionic GPU | 471 g | 5.9 mm | 11.00" | 2388x1668 | |
| 89.8 % v7 (old) | 11/2018 | Apple iPad Pro 11 2018 A12X Bionic, A12X Bionic GPU | 468 g | 5.9 mm | 11.00" | 2388x1668 | |
| 88.1 % v7 (old) | 03/2020 | Microsoft Surface Pro 7 i7-1065G7, Iris Plus Graphics G7 (Ice Lake 64 EU) | 790 g | 8.5 mm | 12.30" | 2736x1824 | |
| 87.8 % v7 (old) | 10/2019 | Samsung Galaxy Tab S6 SM-T860 SD 855, Adreno 640 | 420 g | 5.7 mm | 10.50" | 2560x1600 | |
| 83.4 % v7 (old) | 04/2018 | Huawei MediaPad M5 10.8 Kirin 960s, Mali-G71 MP8 | 498 g | 7.3 mm | 10.80" | 2560x1600 |


| |||||||||||||||||||||||||
iluminação: 84 %
iluminação com acumulador: 617 cd/m²
Contraste: 1714:1 (Preto: 0.36 cd/m²)
ΔE ColorChecker Calman: 0.94 | ∀{0.5-29.43 Ø4.71}
ΔE Greyscale Calman: 1.4 | ∀{0.09-98 Ø4.96}
99.9% sRGB (Calman 2D)
Gamma: 2.156
CCT: 6733 K
| Apple iPad Pro 11 2020 IPS, 2388x1668, 11" | Apple iPad Pro 11 2018 IPS, 2388x1668, 11" | Microsoft Surface Pro 7 IPS, 2736x1824, 12.3" | Samsung Galaxy Tab S6 SM-T860 Super AMOLED, 2560x1600, 10.5" | Huawei MediaPad M5 10.8 IPS, 2560x1600, 10.8" | |
|---|---|---|---|---|---|
| Screen | -8% | -11% | -79% | -76% | |
| Brightness middle (cd/m²) | 617 | 639 4% | 435 -29% | 446 -28% | 382 -38% |
| Brightness (cd/m²) | 585 | 591 1% | 422 -28% | 445 -24% | 378 -35% |
| Brightness Distribution (%) | 84 | 87 4% | 90 7% | 86 2% | 92 10% |
| Black Level * (cd/m²) | 0.36 | 0.45 -25% | 0.32 11% | 0.24 33% | |
| Contrast (:1) | 1714 | 1420 -17% | 1359 -21% | 1592 -7% | |
| Colorchecker dE 2000 * | 0.94 | 0.92 2% | 1.18 -26% | 2.7 -187% | 2.8 -198% |
| Colorchecker dE 2000 max. * | 1.87 | 2.59 -39% | 2.27 -21% | 5.4 -189% | 6 -221% |
| Greyscale dE 2000 * | 1.4 | 1.3 7% | 1.12 20% | 2.1 -50% | 3.5 -150% |
| Gamma | 2.156 102% | 2.22 99% | 2.3 96% | 2.05 107% | 2.33 94% |
| CCT | 6733 97% | 6656 98% | 6502 100% | 6468 100% | 6903 94% |
| Colorchecker dE 2000 calibrated * | 3.49 | ||||
| Color Space (Percent of AdobeRGB 1998) (%) | 60 | ||||
| Color Space (Percent of sRGB) (%) | 96 |
* ... menor é melhor
Cintilação da tela / PWM (modulação por largura de pulso)
| Tela tremeluzindo/PWM detectado | 1316 Hz | 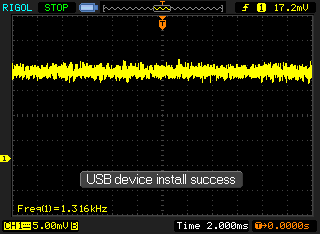 | |
A luz de fundo da tela pisca em 1316 Hz (pior caso, por exemplo, utilizando PWM) . A frequência de 1316 Hz é bastante alta, então a maioria dos usuários sensíveis ao PWM não deve notar nenhuma oscilação. [pwm_comparison] Em comparação: 52 % de todos os dispositivos testados não usam PWM para escurecer a tela. Se PWM foi detectado, uma média de 7757 (mínimo: 5 - máximo: 343500) Hz foi medida. | |||
Exibir tempos de resposta
| ↔ Tempo de resposta preto para branco | ||
|---|---|---|
| 24 ms ... ascensão ↗ e queda ↘ combinadas | ↗ 9 ms ascensão | 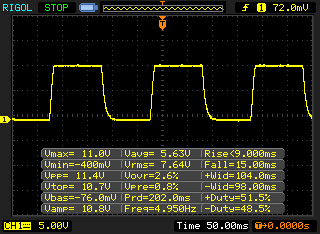 |
| ↘ 15 ms queda | ||
| A tela mostra boas taxas de resposta em nossos testes, mas pode ser muito lenta para jogadores competitivos. Em comparação, todos os dispositivos testados variam de 0.1 (mínimo) a 240 (máximo) ms. » 54 % de todos os dispositivos são melhores. Isso significa que o tempo de resposta medido é pior que a média de todos os dispositivos testados (19.8 ms). | ||
| ↔ Tempo de resposta 50% cinza a 80% cinza | ||
| 52 ms ... ascensão ↗ e queda ↘ combinadas | ↗ 25 ms ascensão | 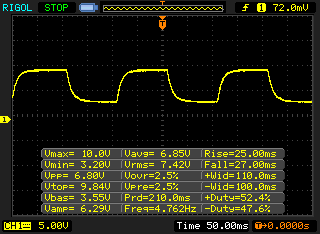 |
| ↘ 27 ms queda | ||
| A tela mostra taxas de resposta lentas em nossos testes e será insatisfatória para os jogadores. Em comparação, todos os dispositivos testados variam de 0.165 (mínimo) a 636 (máximo) ms. » 88 % de todos os dispositivos são melhores. Isso significa que o tempo de resposta medido é pior que a média de todos os dispositivos testados (31 ms). | ||
| 3DMark | |
| 1280x720 offscreen Ice Storm Unlimited Score | |
| Apple iPad Pro 11 2020 | |
| Média Apple A12Z Bionic (110582 - 110846, n=2) | |
| Samsung Galaxy Tab S6 SM-T860 | |
| Huawei MediaPad M5 10.8 | |
| 1280x720 offscreen Ice Storm Unlimited Graphics Score | |
| Apple iPad Pro 11 2020 | |
| Média Apple A12Z Bionic (220422 - 221941, n=2) | |
| Samsung Galaxy Tab S6 SM-T860 | |
| Huawei MediaPad M5 10.8 | |
| 1280x720 offscreen Ice Storm Unlimited Physics | |
| Média Apple A12Z Bionic (40279 - 40299, n=2) | |
| Apple iPad Pro 11 2020 | |
| Samsung Galaxy Tab S6 SM-T860 | |
| Huawei MediaPad M5 10.8 | |
| AnTuTu v8 - Total Score | |
| Média Apple A12Z Bionic (712218 - 751846, n=2) | |
| Apple iPad Pro 11 2020 | |
| Apple iPad Pro 11 2018 | |
| Basemark ES 3.1 / Metal - offscreen Overall Score | |
| Média Apple A12Z Bionic (5657 - 5709, n=2) | |
| Apple iPad Pro 11 2020 | |
| Apple iPad Pro 11 2018 | |
| Média da turma Tablet (255 - 5784, n=6, últimos 2 anos) | |
| Jetstream 2 - 2.0 Total | |
| Média da turma Tablet (35.8 - 420, n=55, últimos 2 anos) | |
| Apple iPad Pro 11 2020 (Safari 14.1) | |
| Apple iPad Pro 11 2020 (Chrome 80) | |
| Média Apple A12Z Bionic (124.5 - 127.4, n=3) | |
| Samsung Galaxy Tab S6 SM-T860 (Chrome 77.0.3865.116) | |
| JetStream 1.1 - 1.1 Total | |
| Apple iPad Pro 11 2018 (Safari 13) | |
| Apple iPad Pro 11 2020 (Chrome 80) | |
| Média Apple A12Z Bionic (272 - 274, n=2) | |
| Microsoft Surface Pro 7 (Microsoft Edge 44.18362.449.0) | |
| Samsung Galaxy Tab S6 SM-T860 (Chrome 77.0.3865.116) | |
| Huawei MediaPad M5 10.8 (Chrome 65) | |
| WebXPRT 3 - Overall | |
| Média da turma Tablet (168 - 520, n=10, últimos 2 anos) | |
| Apple iPad Pro 11 2020 (Safari 14.1) | |
| Apple iPad Pro 11 2020 (Chrome 80) | |
| Apple iPad Pro 11 2018 (Safari 13) | |
| Média Apple A12Z Bionic (140 - 194, n=3) | |
| Samsung Galaxy Tab S6 SM-T860 (Chrome 77.0.3865.116) | |
| Speedometer 2.0 - Result 2.0 | |
| Média da turma Tablet (6.8 - 790, n=33, últimos 2 anos) | |
| Apple iPad Pro 11 2020 (Safari 14.1) | |
| Média Apple A12Z Bionic (135 - 154, n=2) | |
| Apple iPad Pro 11 2018 (IOS 12.1.1) | |
| Samsung Galaxy Tab S6 SM-T860 (Chrome 77.0.3865.116) | |
| Octane V2 - Total Score | |
| Média da turma Tablet (1633 - 138481, n=71, últimos 2 anos) | |
| Apple iPad Pro 11 2018 (Safari 13) | |
| Média Apple A12Z Bionic (42372 - 43057, n=3) | |
| Apple iPad Pro 11 2020 (Safari 14.1) | |
| Apple iPad Pro 11 2020 (Chrome 80) | |
| Microsoft Surface Pro 7 (Microsoft Edge 44.18362.449.0) | |
| Samsung Galaxy Tab S6 SM-T860 (Chrome 77.0.3865.116) | |
| Huawei MediaPad M5 10.8 (Chrome 65) | |
| Mozilla Kraken 1.1 - Total | |
| Huawei MediaPad M5 10.8 (Chrome 65) | |
| Samsung Galaxy Tab S6 SM-T860 (Chrome 77.0.3865.116) | |
| Média da turma Tablet (243 - 16233, n=65, últimos 2 anos) | |
| Microsoft Surface Pro 7 (Microsoft Edge 44.18362.449.0) | |
| Apple iPad Pro 11 2020 (Chrome 80) | |
| Média Apple A12Z Bionic (646 - 646, n=2) | |
| Apple iPad Pro 11 2018 (Safari 13) | |
* ... menor é melhor
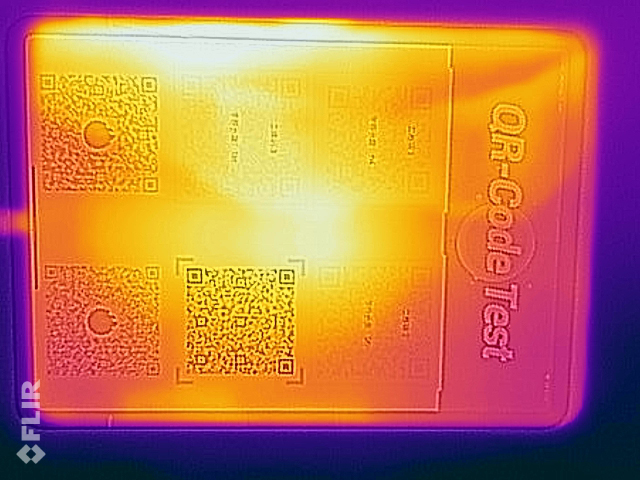
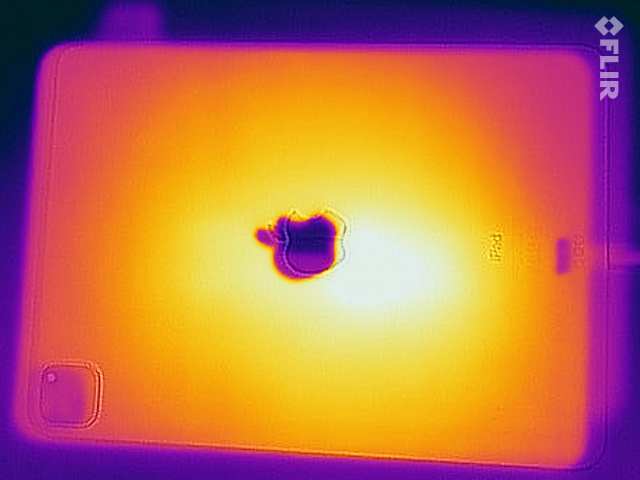
(+) A temperatura máxima no lado superior é 37.9 °C / 100 F, em comparação com a média de 33.7 °C / 93 F , variando de 20.7 a 53.2 °C para a classe Tablet.
(±) A parte inferior aquece até um máximo de 40.1 °C / 104 F, em comparação com a média de 33.2 °C / 92 F
(±) Em uso inativo, a temperatura média para o lado superior é 33.2 °C / 92 F, em comparação com a média do dispositivo de 30 °C / ### class_avg_f### F.
Apple iPad Pro 11 2020 análise de áudio
(±) | o volume do alto-falante é médio, mas bom (###valor### dB)
Graves 100 - 315Hz
(±) | graves reduzidos - em média 6.3% menor que a mediana
(±) | a linearidade dos graves é média (7.6% delta para a frequência anterior)
Médios 400 - 2.000 Hz
(±) | médios mais altos - em média 6.4% maior que a mediana
(+) | médios são lineares (6% delta para frequência anterior)
Altos 2 - 16 kHz
(+) | agudos equilibrados - apenas 1.9% longe da mediana
(+) | os máximos são lineares (6.2% delta da frequência anterior)
Geral 100 - 16.000 Hz
(+) | o som geral é linear (13% diferença em relação à mediana)
Comparado com a mesma classe
» 23% de todos os dispositivos testados nesta classe foram melhores, 4% semelhantes, 74% piores
» O melhor teve um delta de 7%, a média foi 20%, o pior foi 129%
Comparado com todos os dispositivos testados
» 13% de todos os dispositivos testados foram melhores, 3% semelhantes, 85% piores
» O melhor teve um delta de 4%, a média foi 23%, o pior foi 134%
Apple iPad Pro 11 2018 análise de áudio
(±) | o volume do alto-falante é médio, mas bom (###valor### dB)
Graves 100 - 315Hz
(±) | graves reduzidos - em média 8.9% menor que a mediana
(±) | a linearidade dos graves é média (12.2% delta para a frequência anterior)
Médios 400 - 2.000 Hz
(+) | médios equilibrados - apenas 1.9% longe da mediana
(+) | médios são lineares (2.4% delta para frequência anterior)
Altos 2 - 16 kHz
(+) | agudos equilibrados - apenas 1.9% longe da mediana
(+) | os máximos são lineares (6.4% delta da frequência anterior)
Geral 100 - 16.000 Hz
(±) | a linearidade do som geral é média (16.5% diferença em relação à mediana)
Comparado com a mesma classe
» 38% de todos os dispositivos testados nesta classe foram melhores, 5% semelhantes, 57% piores
» O melhor teve um delta de 7%, a média foi 20%, o pior foi 129%
Comparado com todos os dispositivos testados
» 28% de todos os dispositivos testados foram melhores, 6% semelhantes, 66% piores
» O melhor teve um delta de 4%, a média foi 23%, o pior foi 134%
| desligado | |
| Ocioso | |
| Carga |
|
Key:
min: | |
| Apple iPad Pro 11 2020 7538 mAh | Apple iPad Pro 11 2018 7736 mAh | Microsoft Surface Pro 7 mAh | Samsung Galaxy Tab S6 SM-T860 7040 mAh | Huawei MediaPad M5 10.8 7500 mAh | |
|---|---|---|---|---|---|
| Power Consumption | -6% | -186% | 23% | -7% | |
| Idle Minimum * (Watt) | 1.3 | 1.2 8% | 4.4 -238% | 1.96 -51% | 2.01 -55% |
| Idle Average * (Watt) | 3.5 | 4.1 -17% | 8.7 -149% | 2.8 20% | 5.4 -54% |
| Idle Maximum * (Watt) | 5.6 | 7.5 -34% | 9.6 -71% | 2.82 50% | 5.44 3% |
| Load Average * (Watt) | 12.5 | 13.6 -9% | 44 -252% | 5.31 58% | 8.55 32% |
| Load Maximum * (Watt) | 19.2 | 15.2 21% | 61 -218% | 11.91 38% | 11.53 40% |
* ... menor é melhor
| Apple iPad Pro 11 2020 7538 mAh | Apple iPad Pro 11 2018 7736 mAh | Microsoft Surface Pro 7 mAh | Samsung Galaxy Tab S6 SM-T860 7040 mAh | Huawei MediaPad M5 10.8 7500 mAh | |
|---|---|---|---|---|---|
| Duração da bateria | 4% | -50% | -2% | -22% | |
| Reader / Idle (h) | 33.4 | 34.3 3% | 11.5 -66% | 21.3 -36% | 22.4 -33% |
| H.264 (h) | 15.6 | 16.4 5% | 6.7 -57% | 14.5 -7% | 11.7 -25% |
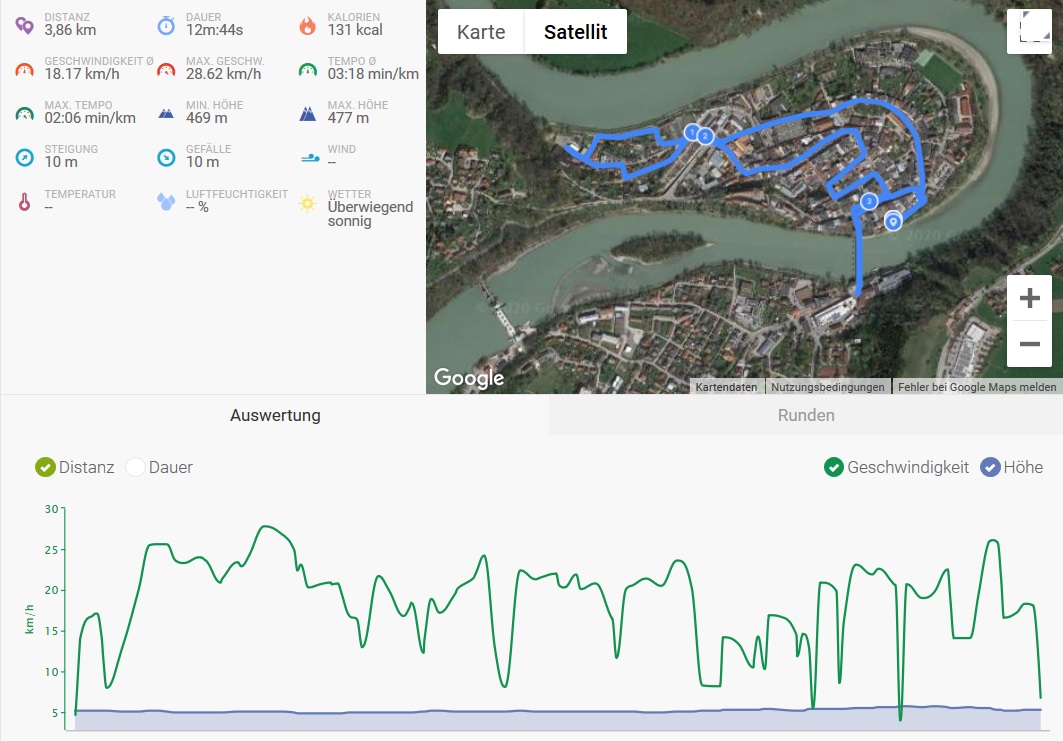
| WiFi v1.3 (h) | 15 | 15.3 2% | 9.8 -35% | 9.3 -38% | 10.8 -28% |
| Load (h) | 3.3 | 3.5 6% | 1.9 -42% | 5.7 73% | 3.3 0% |
Pro
Contra
Veredicto – Atualizações sensatas e um preço mais baixo

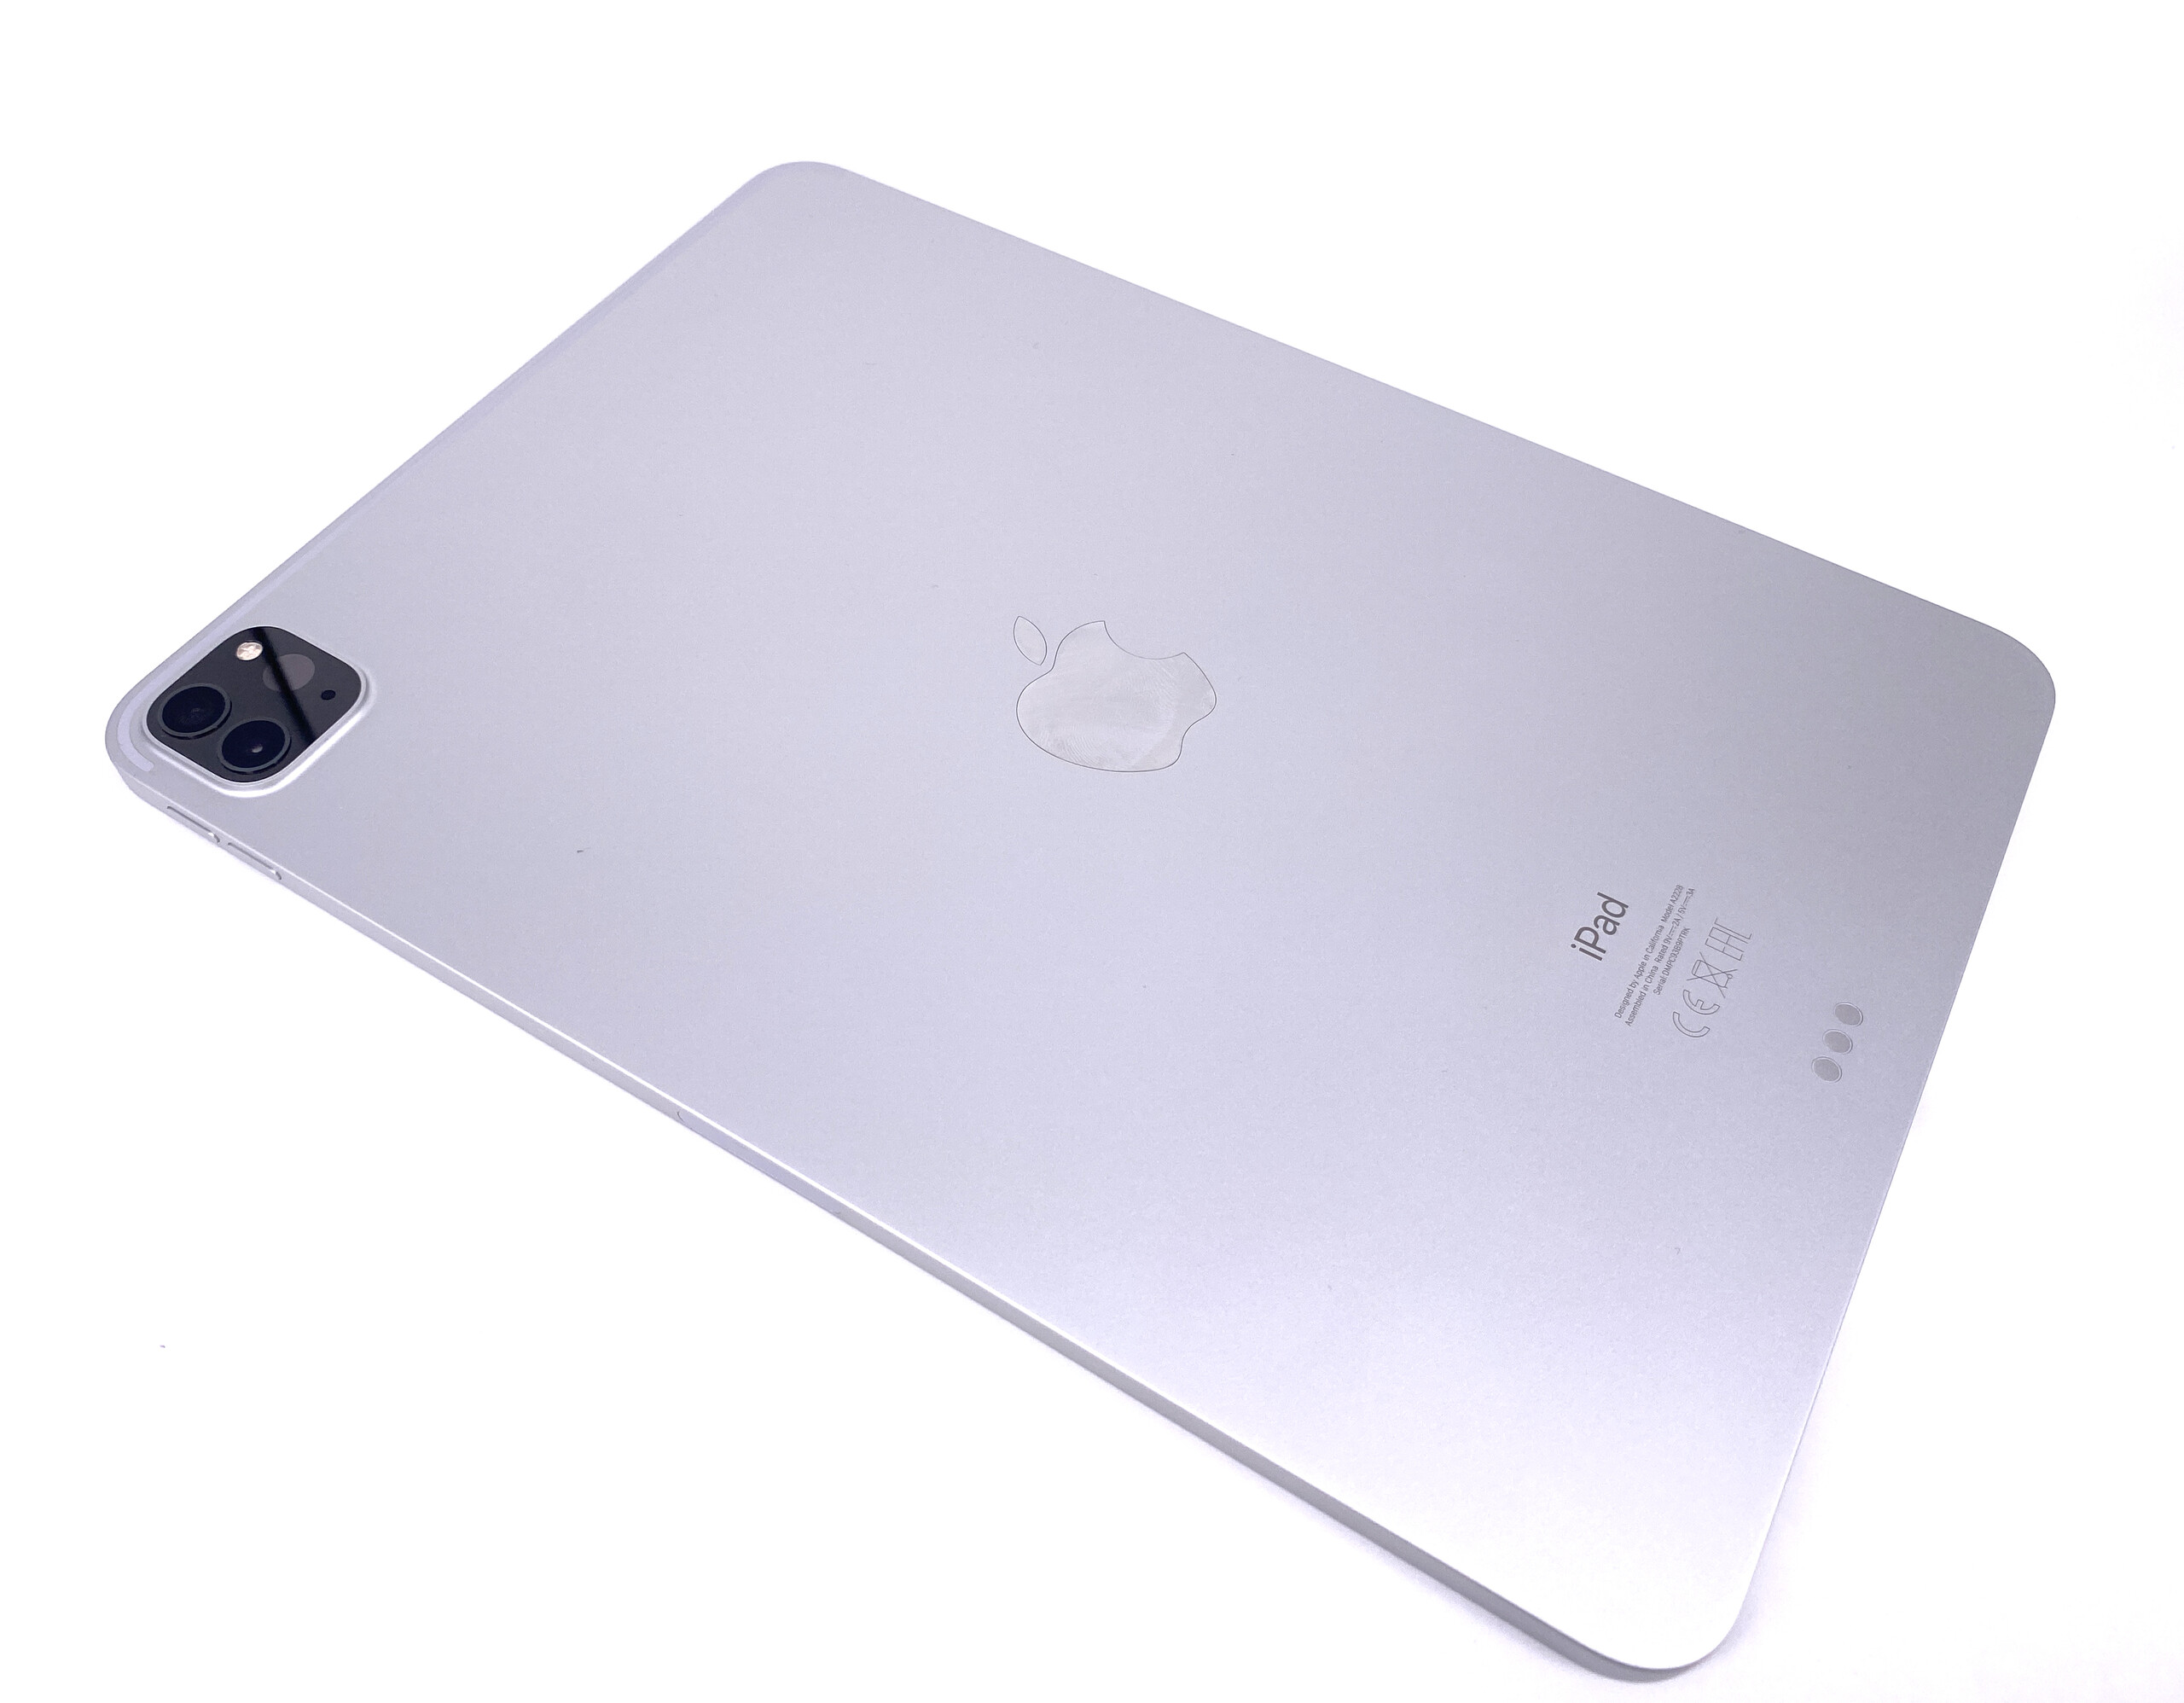
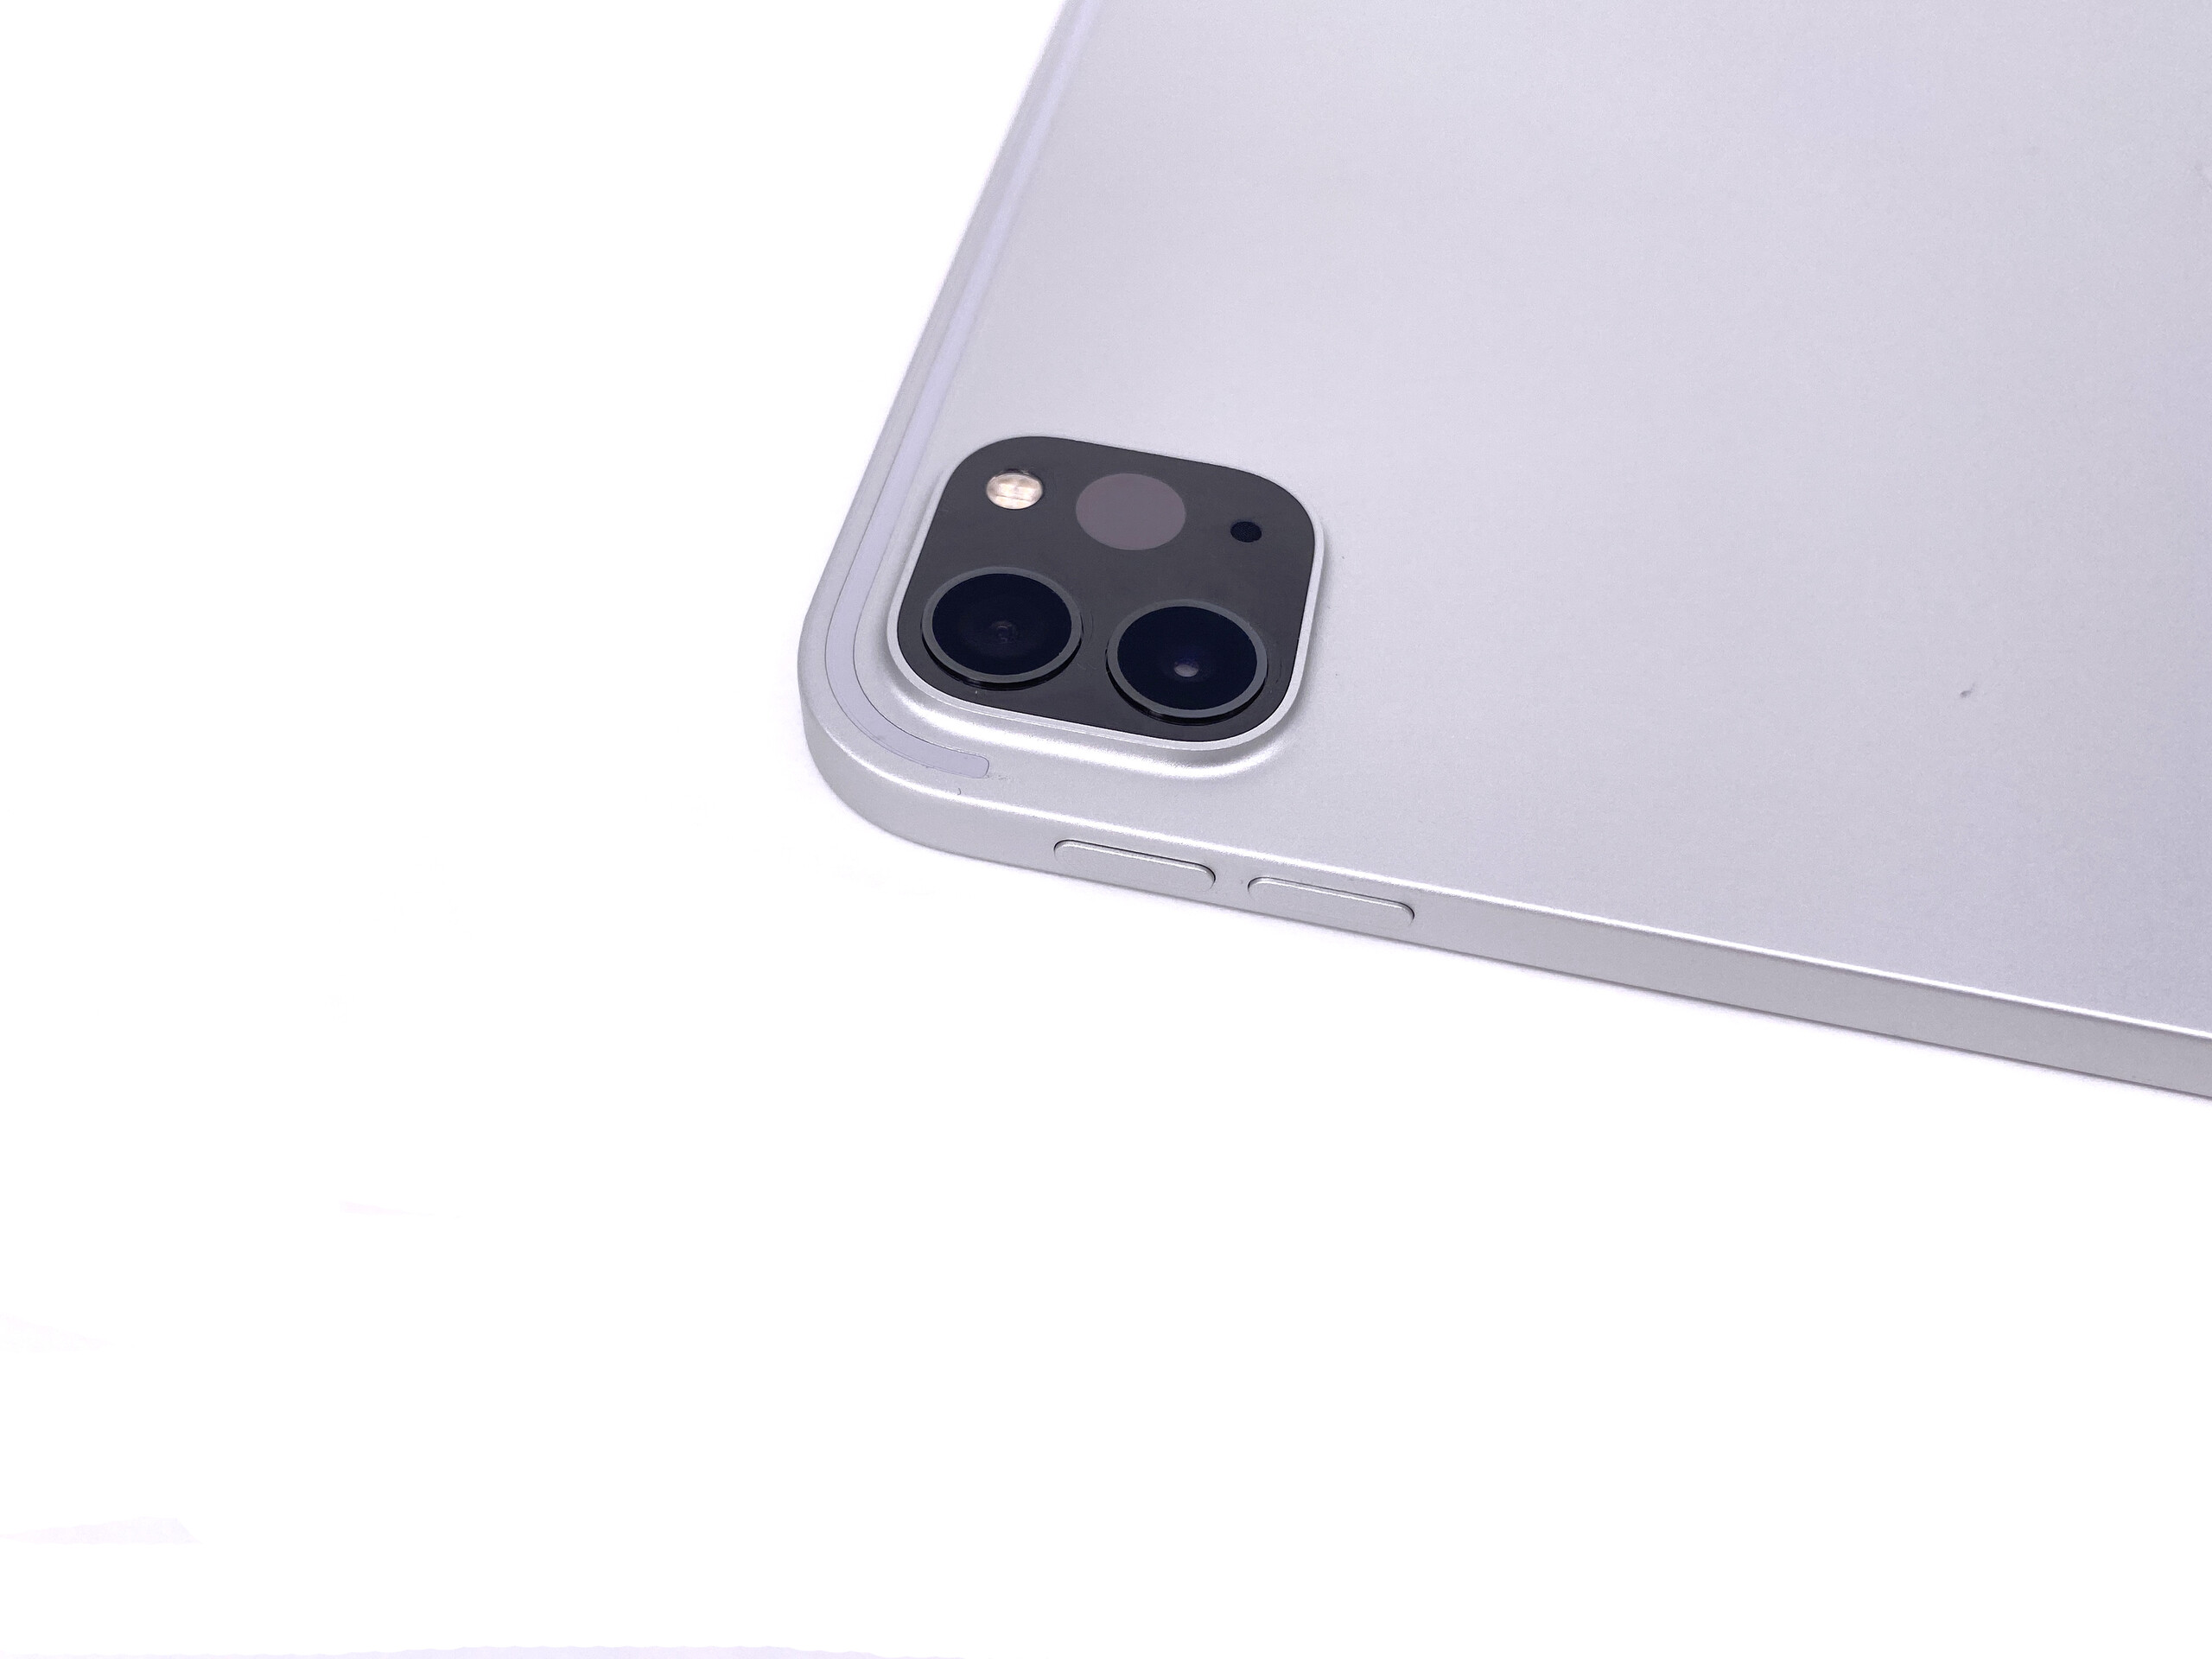
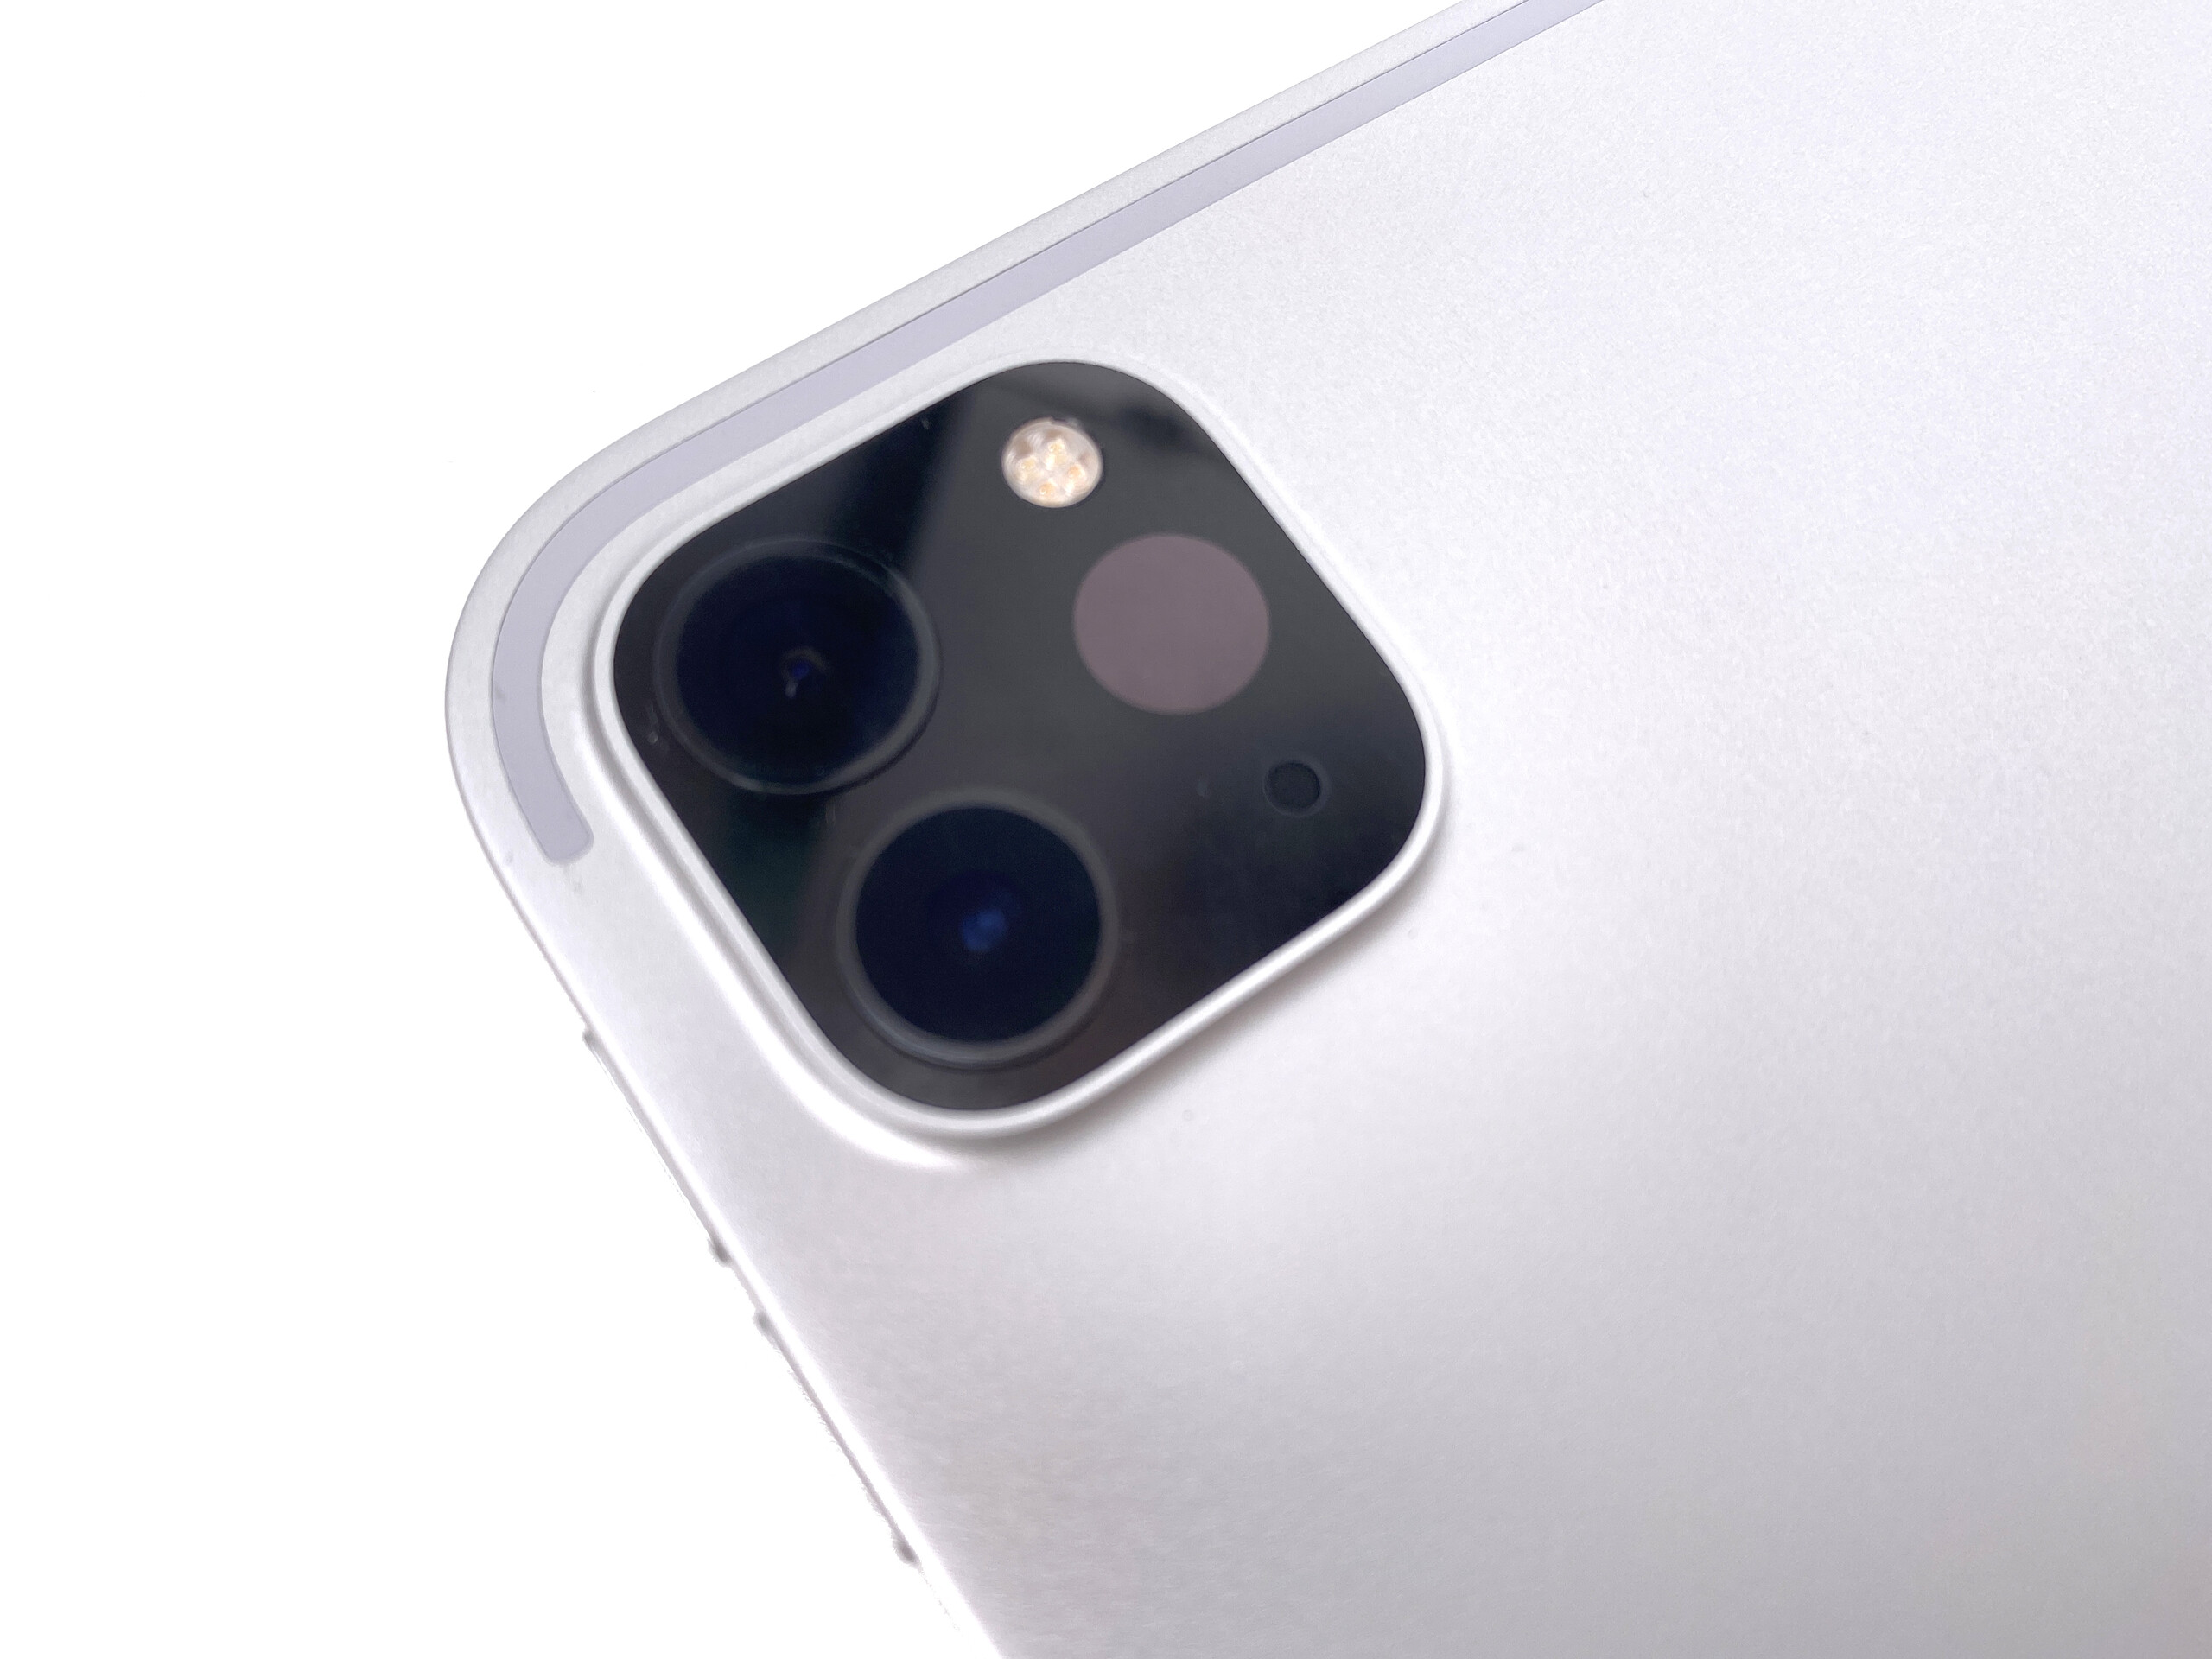
A Apple fez algumas melhorias em seu modelo iPad Pro 11 2020 e até reduziu os preços da maioria das configurações. Embora isso possa parecer uma grande pechincha, o Apple iPad Pro ainda não sai barato. No entanto, muitos de seus aspectos também refletem os preços premium: Apesar de já serem a referência no setor de tablets, as câmeras foram aprimoradas ainda mais. Embora não possam corresponder às mais recentes câmeras de smartphones de gama alta, são mais do que capazes de tirar belas fotos.
A ampla gama de acessórios foi expandida com o Magic Keyboard e a porta USB Type-C também abre o tablet Apple para hardware de terceiros. Graças ao novo cursor, por exemplo, um mouse USB normal agora pode ser usado para navegar pelo sistema.
O dispositivo é poderoso, equipado com Wi-Fi e armazenamento rápidos, além de uma tela com muita precisão de cores e capaz de exibir animações extremamente fluentes graças à sua taxa de atualização de 120 Hz.
Atualizações sensatas e preços mais moderados: O Apple iPad Pro 11 é, mais uma vez, uma boa escolha em 2020, se você puder pagar.
Como a Apple fez atualizações razoáveis no geral, mesmo uma atualização da geração anterior pode valer a pena. O fato de a carcaça ser um pouco flexível demais é a única desvantagem real.
Nota: Como muitos de nossos benchmarks ainda não são compatíveis com o iPad OS 13.4 e o Magic Keyboard será lançado em maio como um acessório importante, atualizaremos nossa análise assim que as novas informações estiverem disponíveis.
Apple iPad Pro 11 2020
- 04/11/2020 v7 (old)
Florian Schmitt
Price comparison
