Breve Análise do Tablet Apple iPad Pro 12.9 (2018, LTE, 256 GB)


Comparação de imagens
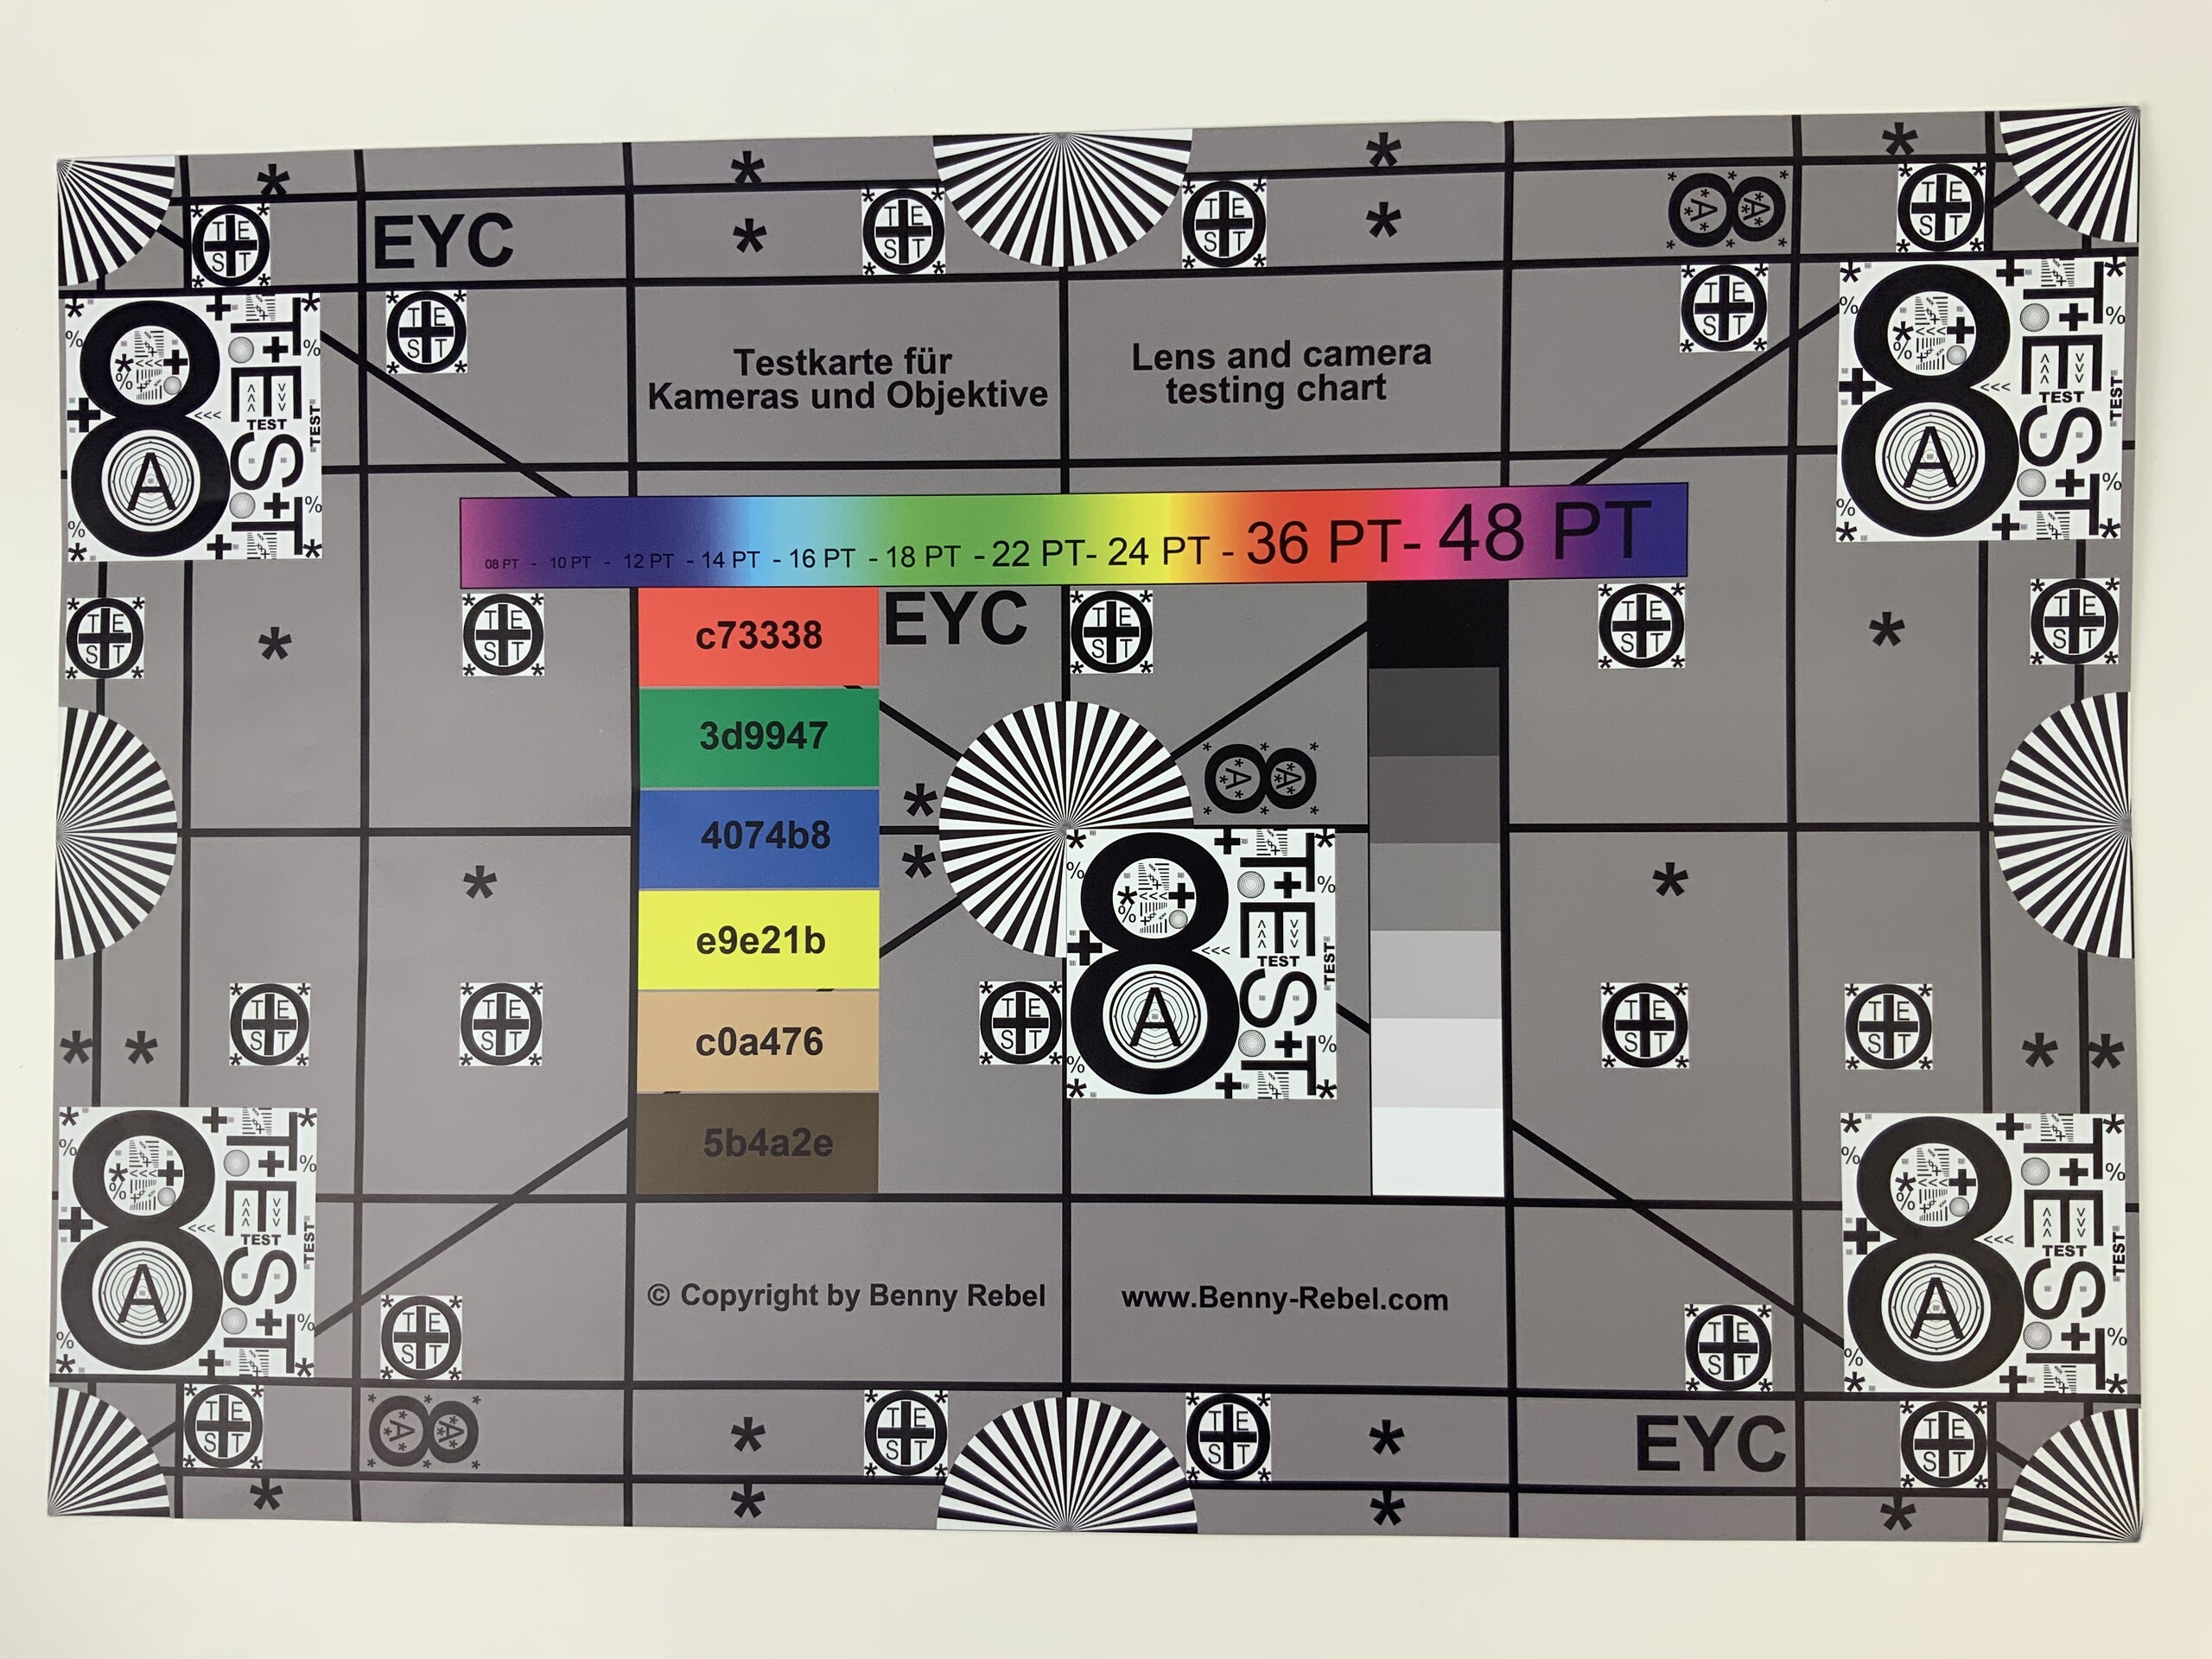
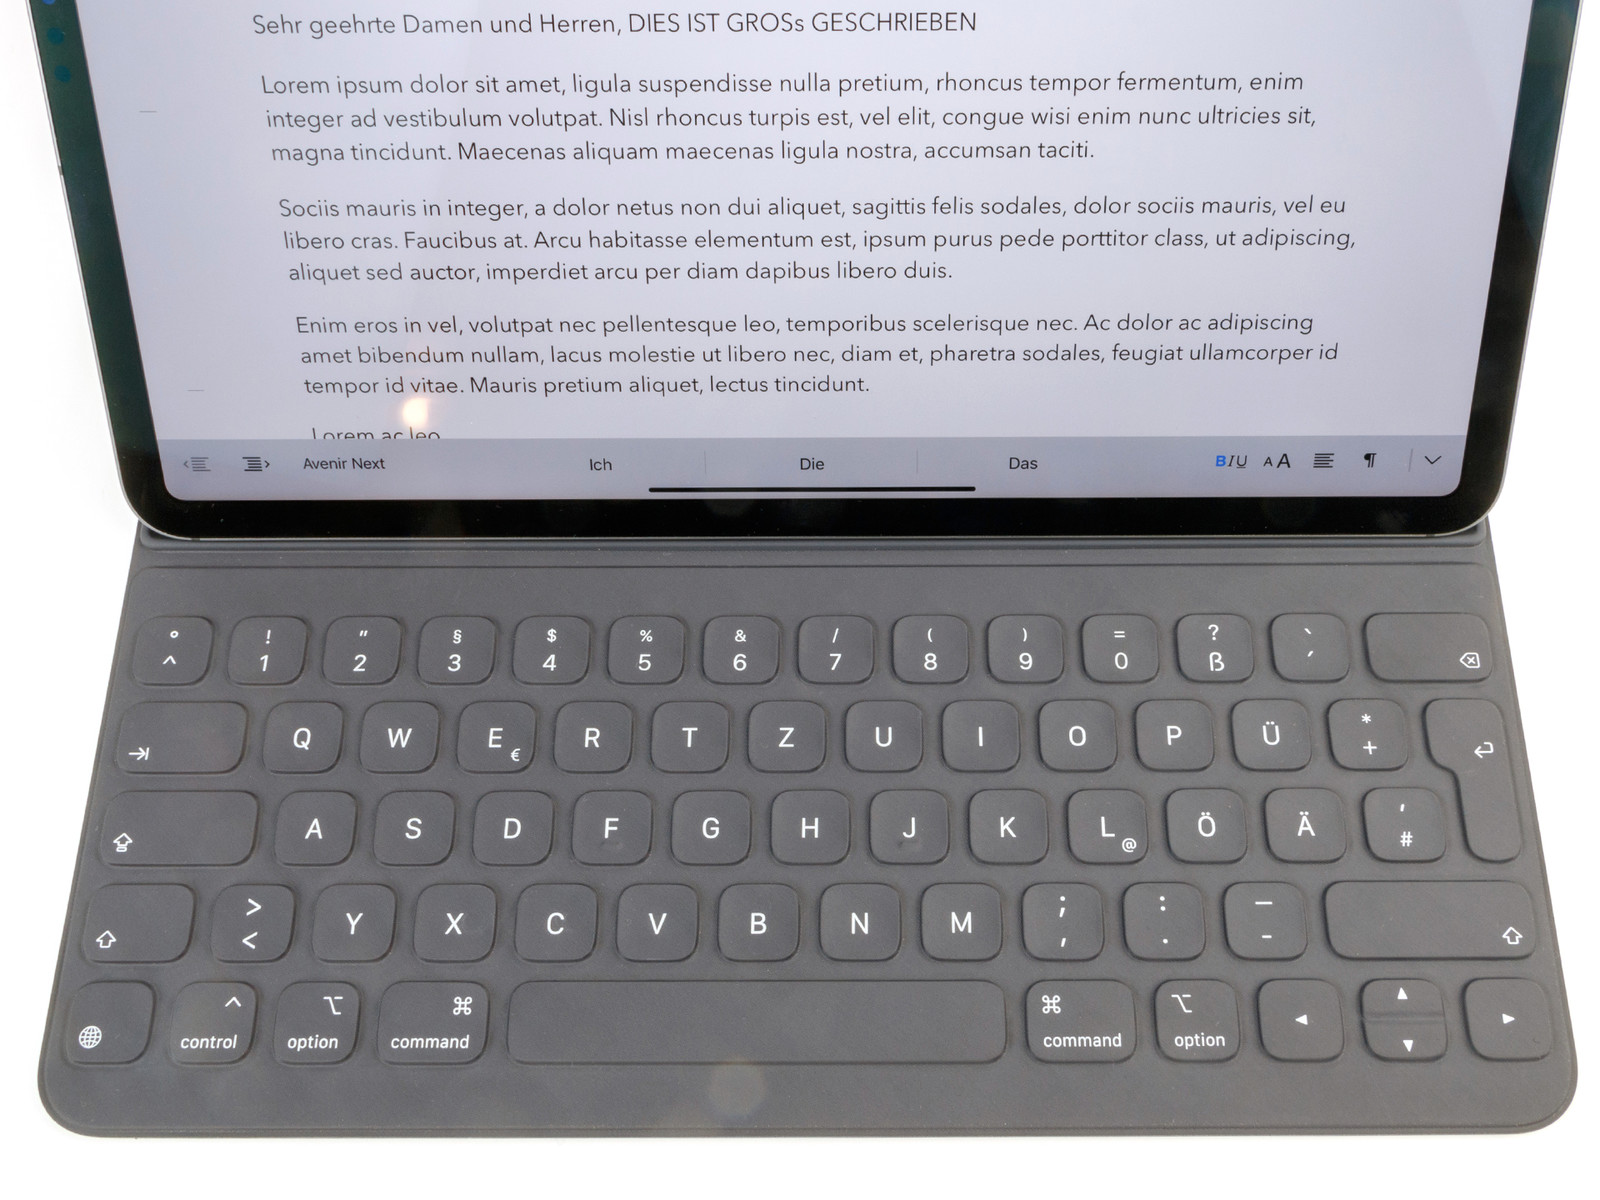
Escolha uma cena e navegue pela primeira imagem. Um clique muda a posição nas telas sensíveis ao toque. Um clique na imagem ampliada abre o original em uma nova janela. A primeira imagem mostra a fotografia em escala do dispositivo de teste.
Scene 1Scene 2Scene 3


| |||||||||||||||||||||||||
iluminação: 91 %
iluminação com acumulador: 632 cd/m²
Contraste: 1975:1 (Preto: 0.32 cd/m²)
ΔE ColorChecker Calman: 1.1 | ∀{0.5-29.43 Ø4.71}
ΔE Greyscale Calman: 1.7 | ∀{0.09-98 Ø4.96}
99.7% sRGB (Calman 2D)
Gamma: 2.21
CCT: 6794 K
| Apple iPad Pro 12.9 2018 IPS, 2732x2048, 12.9" | Apple iPad Pro 12.9 2017 IPS, 2732x2048, 12.9" | Samsung Galaxy Tab S4 Super AMOLED, 2560x1600, 10.5" | Huawei MediaPad M5 10.8 Pro IPS, 2560x1600, 10.8" | Microsoft Surface Pro 6, Core i5, 128 GB IPS, 2736x1834, 12.3" | Apple iPad 6 2018 IPS, 2048x1536, 9.7" | |
|---|---|---|---|---|---|---|
| Screen | -1% | -57% | -201% | -78% | -22% | |
| Brightness middle (cd/m²) | 632 | 650 3% | 474 -25% | 384 -39% | 463 -27% | 530 -16% |
| Brightness (cd/m²) | 605 | 614 1% | 477 -21% | 360 -40% | 450 -26% | 513 -15% |
| Brightness Distribution (%) | 91 | 90 -1% | 91 0% | 84 -8% | 83 -9% | 92 1% |
| Black Level * (cd/m²) | 0.32 | 0.42 -31% | 0.8 -150% | 0.32 -0% | 0.61 -91% | |
| Contrast (:1) | 1975 | 1548 -22% | 480 -76% | 1447 -27% | 869 -56% | |
| Colorchecker dE 2000 * | 1.1 | 1 9% | 2.5 -127% | 6.83 -521% | 3.76 -242% | 1.2 -9% |
| Colorchecker dE 2000 max. * | 2.4 | 1.9 21% | 5.8 -142% | 12.7 -429% | 7.35 -206% | 3.2 -33% |
| Greyscale dE 2000 * | 1.7 | 1.5 12% | 2.1 -24% | 7.5 -341% | 3.18 -87% | 1 41% |
| Gamma | 2.21 100% | 2.25 98% | 2.08 106% | 2.199 100% | 2.53 87% | 2.28 96% |
| CCT | 6794 96% | 6734 97% | 6281 103% | 8544 76% | 6994 93% | 6588 99% |
| Colorchecker dE 2000 calibrated * | 2.68 | |||||
| Color Space (Percent of AdobeRGB 1998) (%) | 59 | |||||
| Color Space (Percent of sRGB) (%) | 90 |
* ... menor é melhor
Cintilação da tela / PWM (modulação por largura de pulso)
| Tela tremeluzindo / PWM não detectado |  | ||
[pwm_comparison] Em comparação: 52 % de todos os dispositivos testados não usam PWM para escurecer a tela. Se PWM foi detectado, uma média de 7744 (mínimo: 5 - máximo: 343500) Hz foi medida. | |||
Exibir tempos de resposta
| ↔ Tempo de resposta preto para branco | ||
|---|---|---|
| 23.2 ms ... ascensão ↗ e queda ↘ combinadas | ↗ 7.6 ms ascensão | 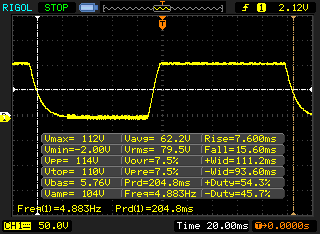 |
| ↘ 15.6 ms queda | ||
| A tela mostra boas taxas de resposta em nossos testes, mas pode ser muito lenta para jogadores competitivos. Em comparação, todos os dispositivos testados variam de 0.1 (mínimo) a 240 (máximo) ms. » 53 % de todos os dispositivos são melhores. Isso significa que o tempo de resposta medido é pior que a média de todos os dispositivos testados (19.8 ms). | ||
| ↔ Tempo de resposta 50% cinza a 80% cinza | ||
| 49.6 ms ... ascensão ↗ e queda ↘ combinadas | ↗ 18.8 ms ascensão | 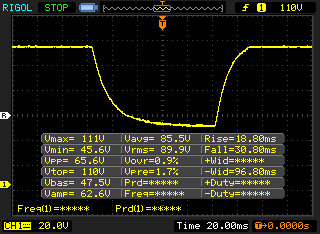 |
| ↘ 30.8 ms queda | ||
| A tela mostra taxas de resposta lentas em nossos testes e será insatisfatória para os jogadores. Em comparação, todos os dispositivos testados variam de 0.165 (mínimo) a 636 (máximo) ms. » 86 % de todos os dispositivos são melhores. Isso significa que o tempo de resposta medido é pior que a média de todos os dispositivos testados (30.9 ms). | ||
| AnTuTu v7 - Total Score | |
| Média Apple A12X Bionic (552676 - 566378, n=2) | |
| Apple iPad Pro 12.9 2018 | |
| Apple iPad Pro 12.9 | |
| Samsung Galaxy Tab S4 | |
| Huawei MediaPad M5 10.8 Pro | |
| Apple iPad 6 2018 | |
| Basemark ES 3.1 / Metal - offscreen Overall Score | |
| Apple iPad Pro 12.9 2018 | |
| Média Apple A12X Bionic (5216 - 5300, n=2) | |
| Média da turma Tablet (255 - 5784, n=6, últimos 2 anos) | |
| Apple iPad Pro 12.9 | |
| Apple iPad 6 2018 | |
| JetStream 1.1 - 1.1 Total | |
| Apple iPad Pro 12.9 2018 (Safari Mobile 12) | |
| Média Apple A12X Bionic (278 - 279, n=2) | |
| Apple iPad Pro 12.9 2017 (Safari Mobile 10) | |
| Microsoft Surface Pro 6, Core i5, 128 GB | |
| Apple iPad 6 2018 (Safari Mobile 11.3) | |
| Apple iPad Pro 12.9 (Safari Mobile 9.0) | |
| Samsung Galaxy Tab S4 (Samsung Browser 8.0) | |
| Huawei MediaPad M5 10.8 Pro (Chrome 68.0.3440.91) | |
| Octane V2 - Total Score | |
| Média da turma Tablet (1633 - 138481, n=71, últimos 2 anos) | |
| Apple iPad Pro 12.9 2018 (Safari Mobile 12) | |
| Média Apple A12X Bionic (44425 - 45734, n=2) | |
| Apple iPad Pro 12.9 2017 (Safari Mobile 10) | |
| Apple iPad 6 2018 (Safari Mobile 11.3) | |
| Microsoft Surface Pro 6, Core i5, 128 GB | |
| Apple iPad Pro 12.9 (Safari Mobile 9.0) | |
| Samsung Galaxy Tab S4 (Samsung Browser 8.0) | |
| Huawei MediaPad M5 10.8 Pro (Chrome 68.0.3440.91) | |
| Mozilla Kraken 1.1 - Total | |
| Huawei MediaPad M5 10.8 Pro (Chrome 68.0.3440.91) | |
| Samsung Galaxy Tab S4 (Samsung Browser 8.0) | |
| Média da turma Tablet (243 - 16233, n=65, últimos 2 anos) | |
| Apple iPad Pro 12.9 (Safari Mobile 9.0) | |
| Microsoft Surface Pro 6, Core i5, 128 GB | |
| Apple iPad 6 2018 (Safari Mobile 11.3) | |
| Apple iPad Pro 12.9 2017 (Safari Mobile 10) | |
| Apple iPad Pro 12.9 2018 (Safari Mobile 12) | |
| Média Apple A12X Bionic (603 - 614, n=2) | |
| WebXPRT 3 - Overall | |
| Média da turma Tablet (168 - 520, n=10, últimos 2 anos) | |
| Apple iPad Pro 12.9 2018 (Safari Mobile 12) | |
| Microsoft Surface Pro 6, Core i5, 128 GB (Edge 18) | |
| Média Apple A12X Bionic (172 - 182, n=2) | |
| Apple iPad Pro 12.9 (Safari Mobile 12) | |
| Apple iPad 6 2018 (Safari Mobile 10) | |
| Samsung Galaxy Tab S4 (Samsung Browser 8.0) | |
| Huawei MediaPad M5 10.8 Pro (Chrome 68.0.3440.91) | |
| WebXPRT 2015 - Overall | |
| Média Apple A12X Bionic (380 - 386, n=2) | |
| Apple iPad Pro 12.9 2018 (Safari Mobile 12) | |
| Apple iPad Pro 12.9 2017 (Safari Mobile 10) | |
| Apple iPad Pro 12.9 (Safari Mobile 9.0) | |
| Apple iPad 6 2018 (Safari Mobile 11.3) | |
| Samsung Galaxy Tab S4 (Samsung Browser 8.0) | |
| Huawei MediaPad M5 10.8 Pro (Chrome 68.0.3440.91) | |
* ... menor é melhor
Battle Bay
PUBG Mobile
Arena of Valor
Asphalt 9: Legends
World of Tanks Blitz
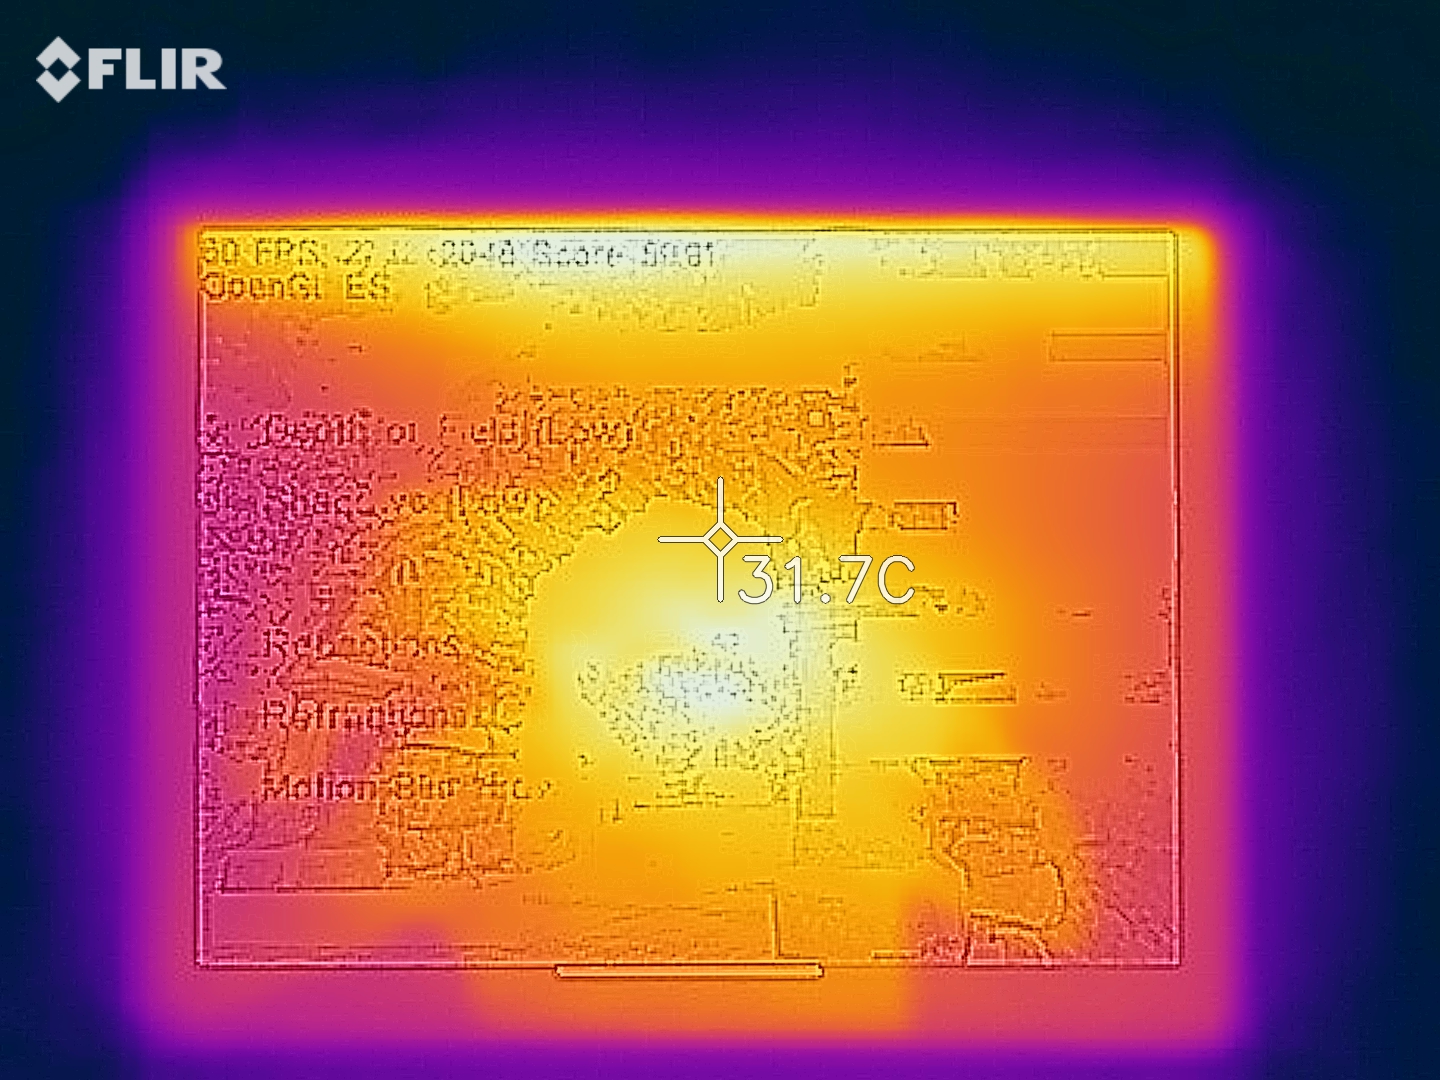
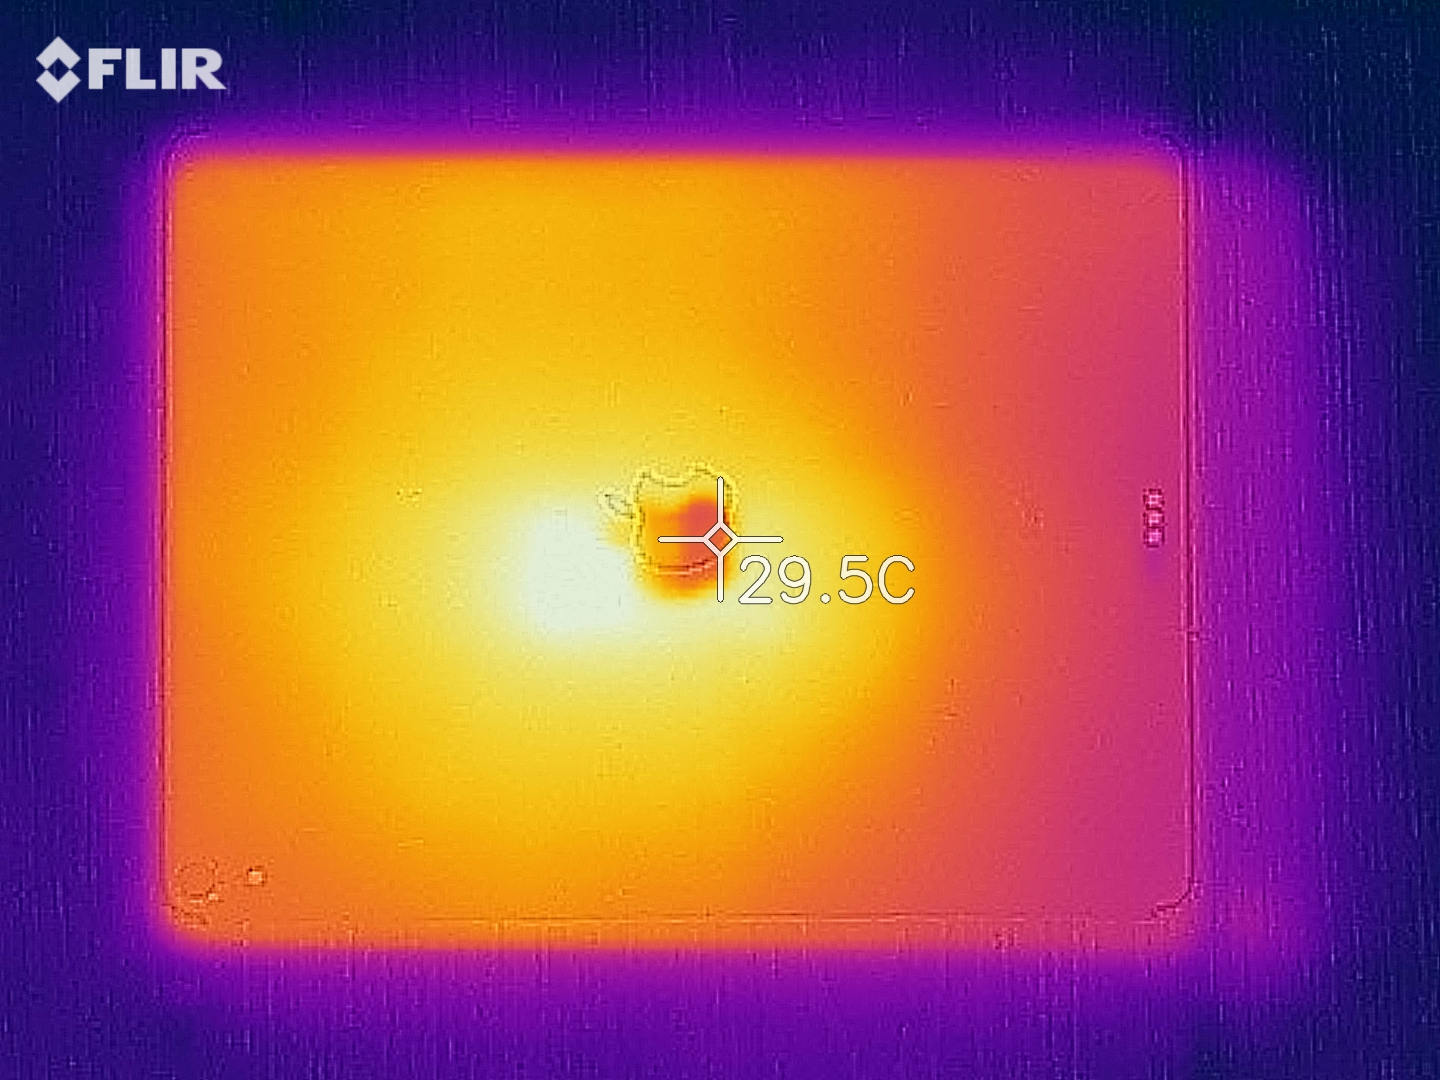
(+) A temperatura máxima no lado superior é 38.3 °C / 101 F, em comparação com a média de 33.7 °C / 93 F , variando de 20.7 a 53.2 °C para a classe Tablet.
(+) A parte inferior aquece até um máximo de 38.8 °C / 102 F, em comparação com a média de 33.2 °C / 92 F
(±) Em uso inativo, a temperatura média para o lado superior é 32.3 °C / 90 F, em comparação com a média do dispositivo de 30 °C / ### class_avg_f### F.
Apple iPad Pro 12.9 2018 análise de áudio
(+) | os alto-falantes podem tocar relativamente alto (###valor### dB)
Graves 100 - 315Hz
(±) | graves reduzidos - em média 7.8% menor que a mediana
(±) | a linearidade dos graves é média (12.1% delta para a frequência anterior)
Médios 400 - 2.000 Hz
(+) | médios equilibrados - apenas 3.1% longe da mediana
(+) | médios são lineares (4.4% delta para frequência anterior)
Altos 2 - 16 kHz
(+) | agudos equilibrados - apenas 2.2% longe da mediana
(+) | os máximos são lineares (4.1% delta da frequência anterior)
Geral 100 - 16.000 Hz
(+) | o som geral é linear (9.7% diferença em relação à mediana)
Comparado com a mesma classe
» 4% de todos os dispositivos testados nesta classe foram melhores, 3% semelhantes, 93% piores
» O melhor teve um delta de 7%, a média foi 20%, o pior foi 129%
Comparado com todos os dispositivos testados
» 4% de todos os dispositivos testados foram melhores, 1% semelhantes, 95% piores
» O melhor teve um delta de 4%, a média foi 23%, o pior foi 134%
Samsung Galaxy Tab S4 análise de áudio
(±) | o volume do alto-falante é médio, mas bom (###valor### dB)
Graves 100 - 315Hz
(-) | quase nenhum baixo - em média 18% menor que a mediana
(-) | graves não são lineares (18.7% delta para frequência anterior)
Médios 400 - 2.000 Hz
(+) | médios equilibrados - apenas 4.3% longe da mediana
(+) | médios são lineares (1.9% delta para frequência anterior)
Altos 2 - 16 kHz
(+) | agudos equilibrados - apenas 3.3% longe da mediana
(±) | a linearidade dos máximos é média (7% delta para frequência anterior)
Geral 100 - 16.000 Hz
(±) | a linearidade do som geral é média (19.2% diferença em relação à mediana)
Comparado com a mesma classe
» 53% de todos os dispositivos testados nesta classe foram melhores, 6% semelhantes, 41% piores
» O melhor teve um delta de 7%, a média foi 20%, o pior foi 129%
Comparado com todos os dispositivos testados
» 46% de todos os dispositivos testados foram melhores, 7% semelhantes, 46% piores
» O melhor teve um delta de 4%, a média foi 23%, o pior foi 134%
| desligado | |
| Ocioso | |
| Carga |
|
Key:
min: | |
| Apple iPad Pro 12.9 2018 mAh | Apple iPad Pro 12.9 2017 10875 mAh | Samsung Galaxy Tab S4 7300 mAh | Huawei MediaPad M5 10.8 Pro 7500 mAh | Apple iPad 6 2018 mAh | Microsoft Surface Pro 6, Core i5, 128 GB mAh | |
|---|---|---|---|---|---|---|
| Power Consumption | 11% | 40% | -5% | -1% | -86% | |
| Idle Minimum * (Watt) | 1.42 | 1.55 -9% | 1.76 -24% | 3.3 -132% | 2.2 -55% | 4.3 -203% |
| Idle Average * (Watt) | 9.35 | 8.58 8% | 4.22 55% | 4.2 55% | 7.8 17% | 8.7 7% |
| Idle Maximum * (Watt) | 9.38 | 8.59 8% | 4.25 55% | 7 25% | 7.9 16% | 9.4 -0% |
| Load Average * (Watt) | 12.75 | 10.09 21% | 4.52 65% | 10.4 18% | 12.6 1% | 24.5 -92% |
| Load Maximum * (Watt) | 14.96 | 10.61 29% | 7.35 51% | 13.8 8% | 12.8 14% | 36 -141% |
* ... menor é melhor
| Apple iPad Pro 12.9 2018 mAh | Apple iPad Pro 12.9 2017 10875 mAh | Samsung Galaxy Tab S4 7300 mAh | Huawei MediaPad M5 10.8 Pro 7500 mAh | Apple iPad 6 2018 mAh | Microsoft Surface Pro 6, Core i5, 128 GB mAh | |
|---|---|---|---|---|---|---|
| Duração da bateria | 15% | -15% | -15% | -6% | -37% | |
| Reader / Idle (h) | 31.5 | 48.7 55% | 20.5 -35% | 20.9 -34% | 17.8 -43% | |
| H.264 (h) | 15 | 11.3 -25% | 12.3 -18% | 10.5 -30% | ||
| WiFi v1.3 (h) | 13.3 | 12.3 -8% | 8.3 -38% | 11.2 -16% | 11.9 -11% | 9.1 -32% |
| Load (h) | 3.1 | 4.3 39% | 4.1 32% | 3.7 19% | 3.1 0% | 2 -35% |
Pro
Contra
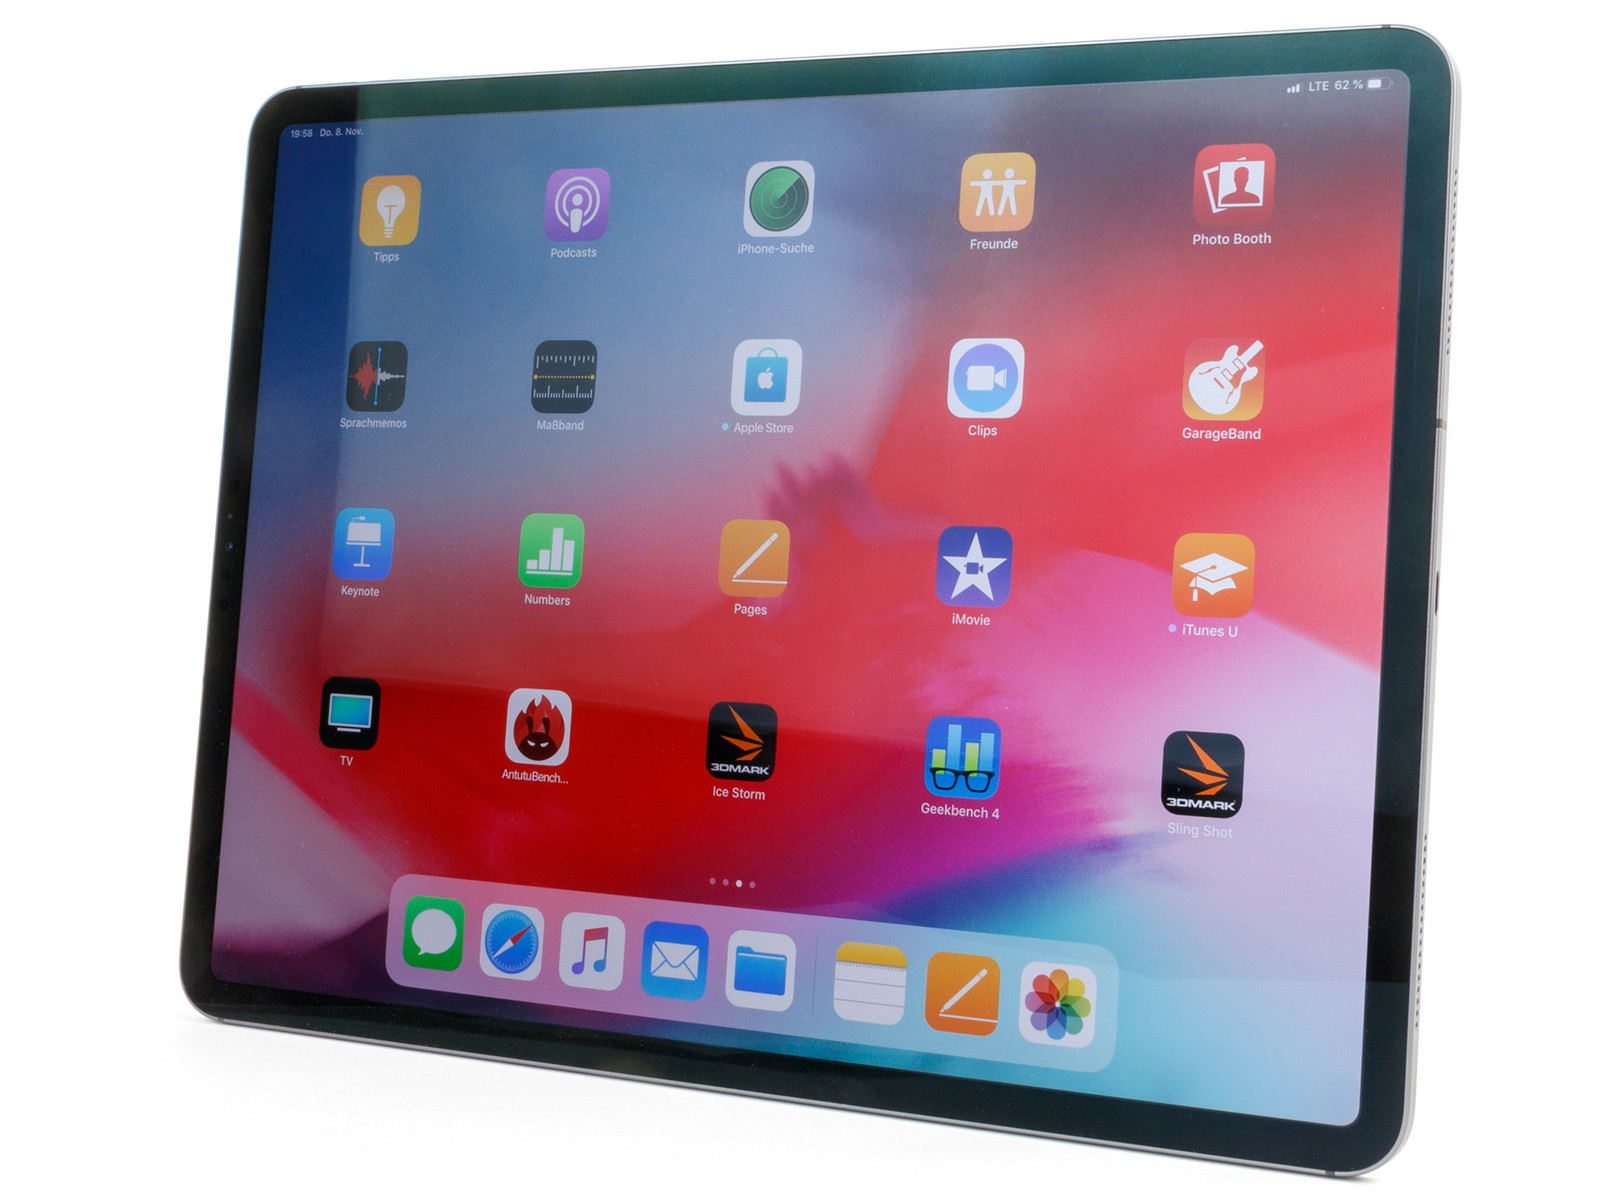
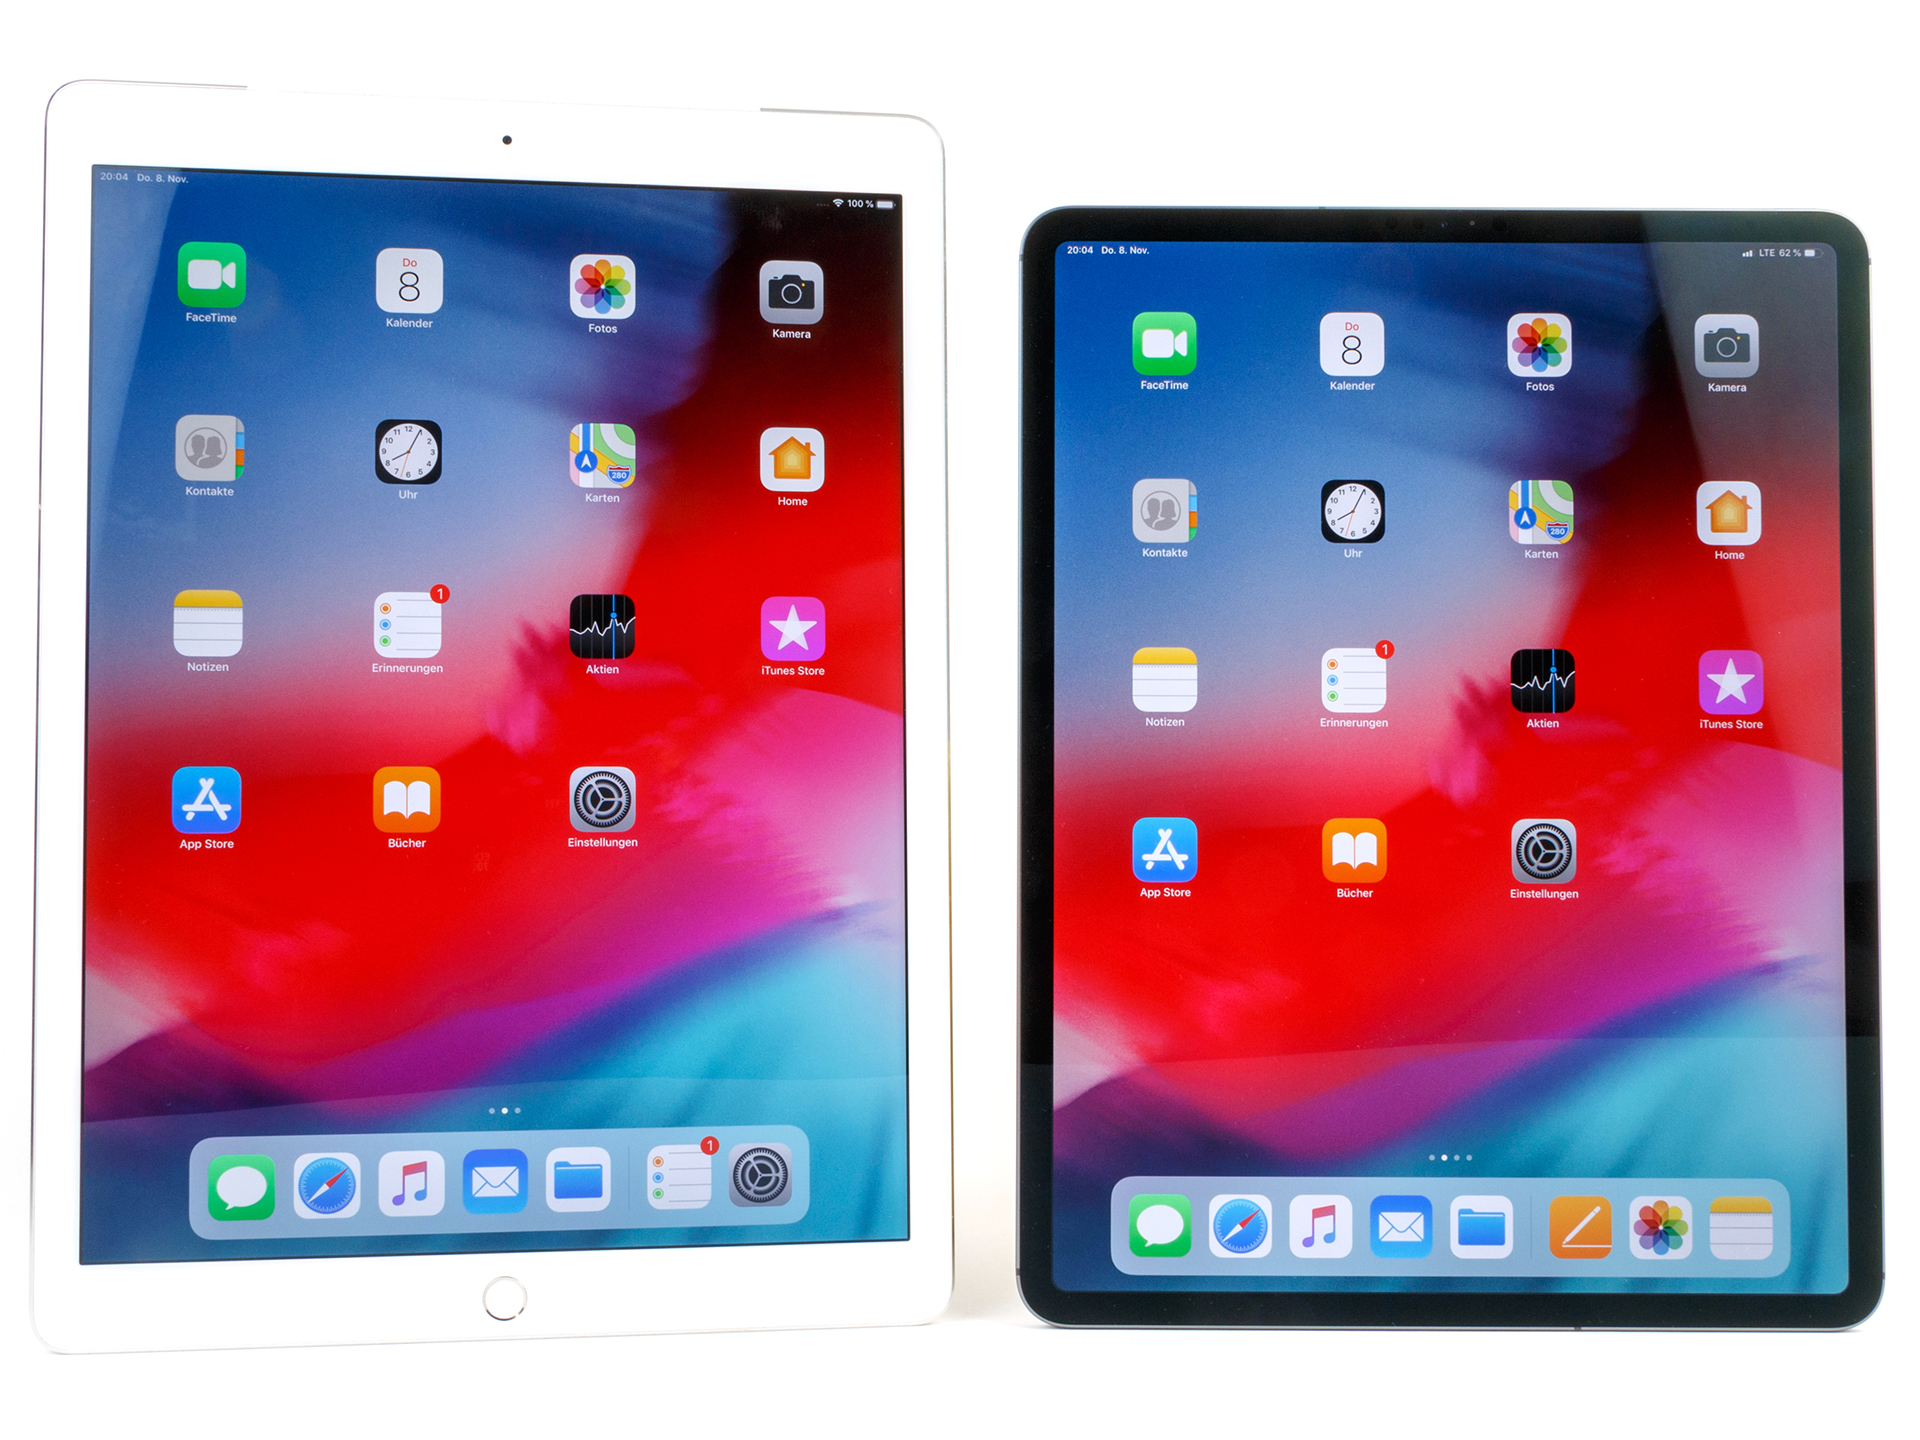
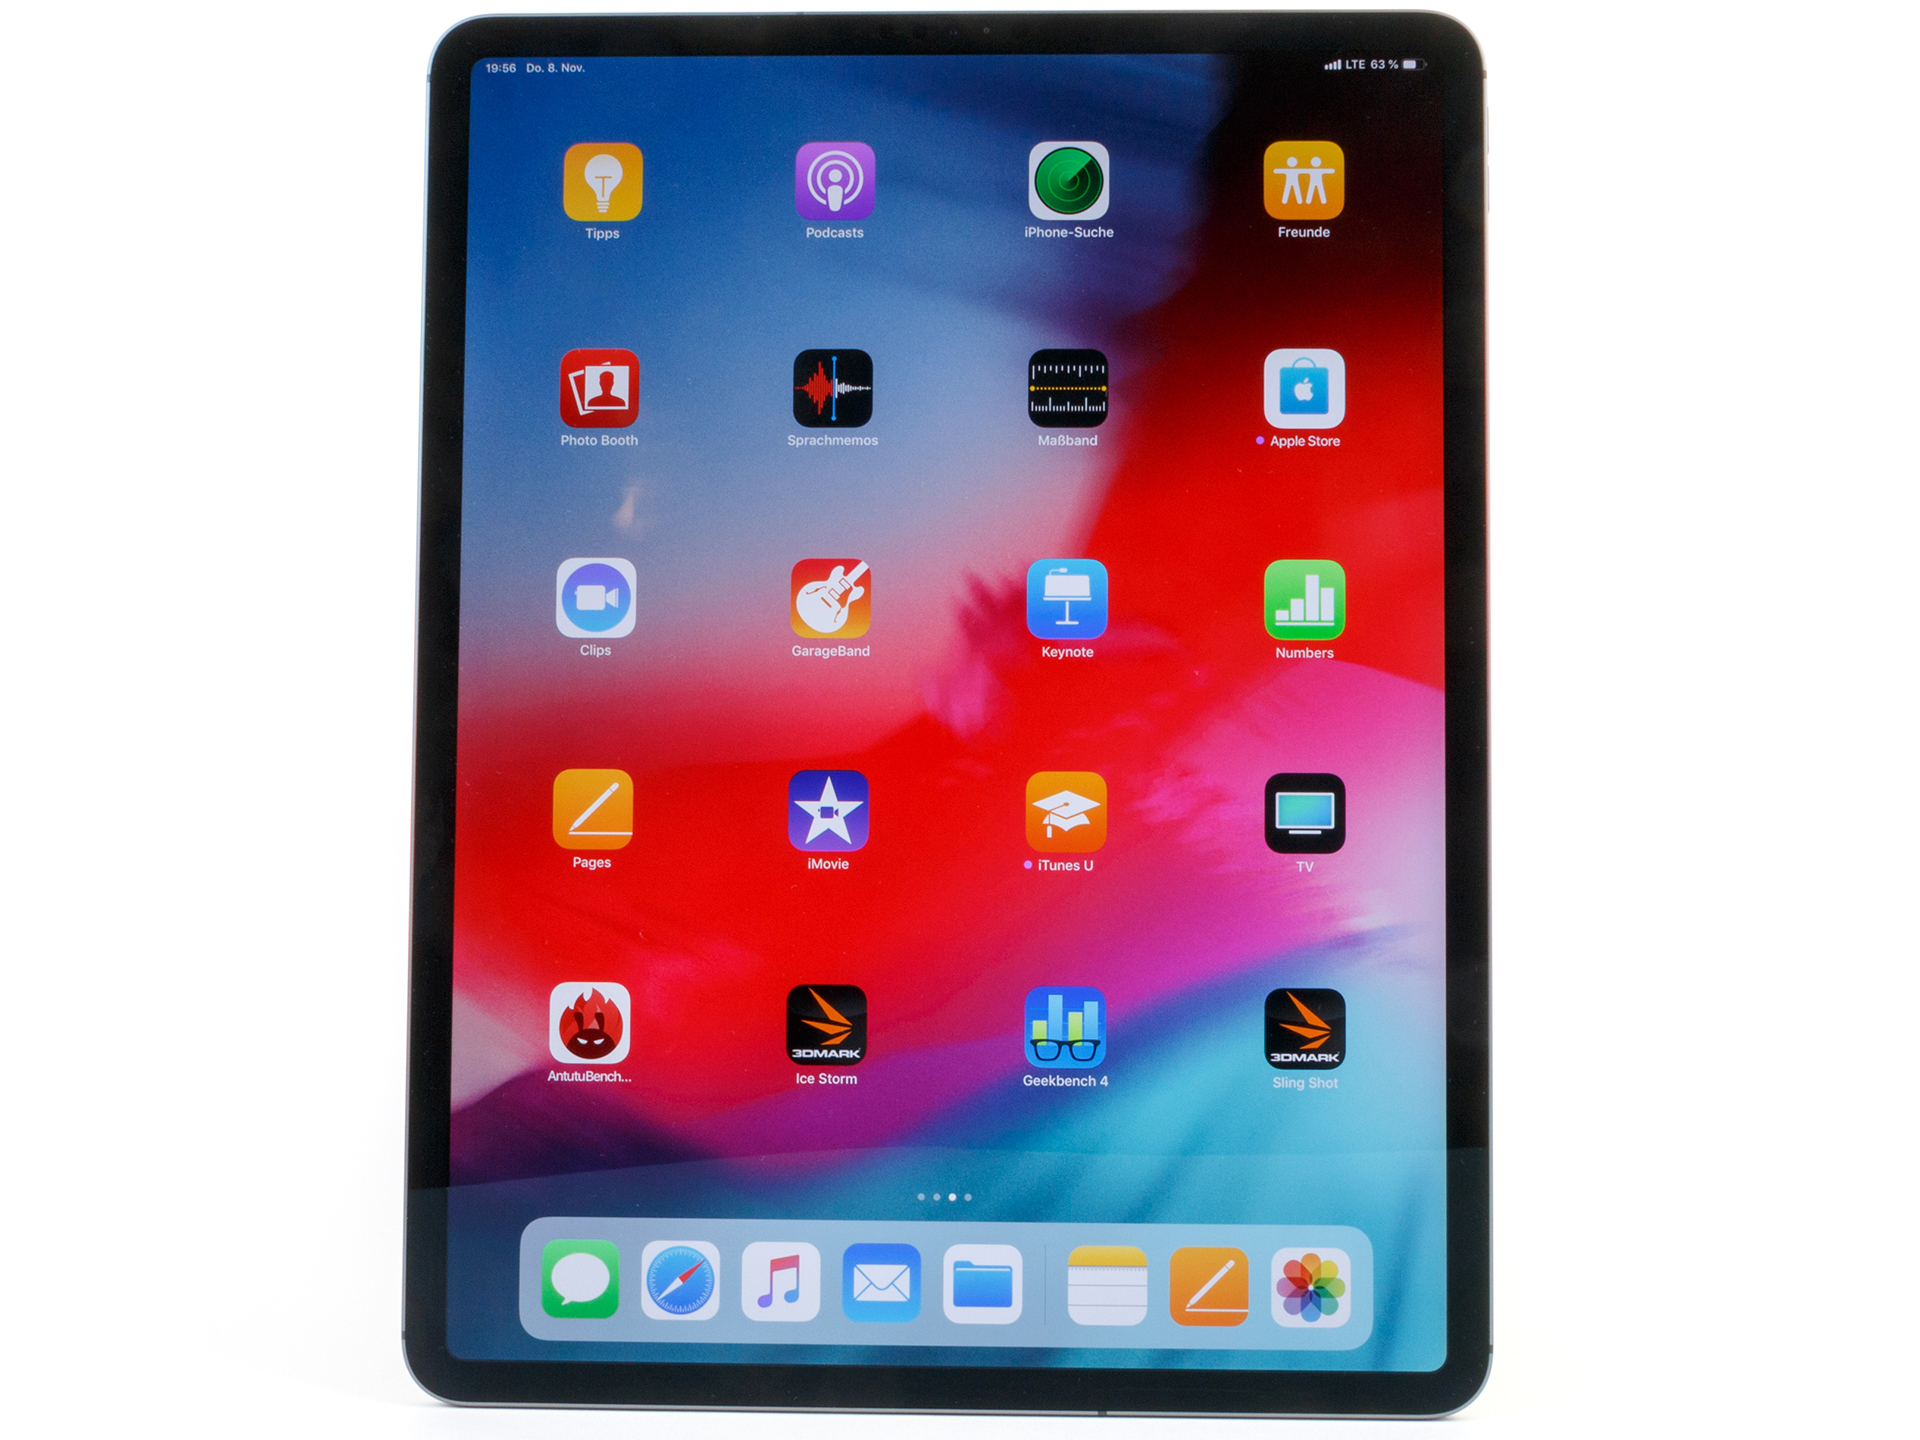
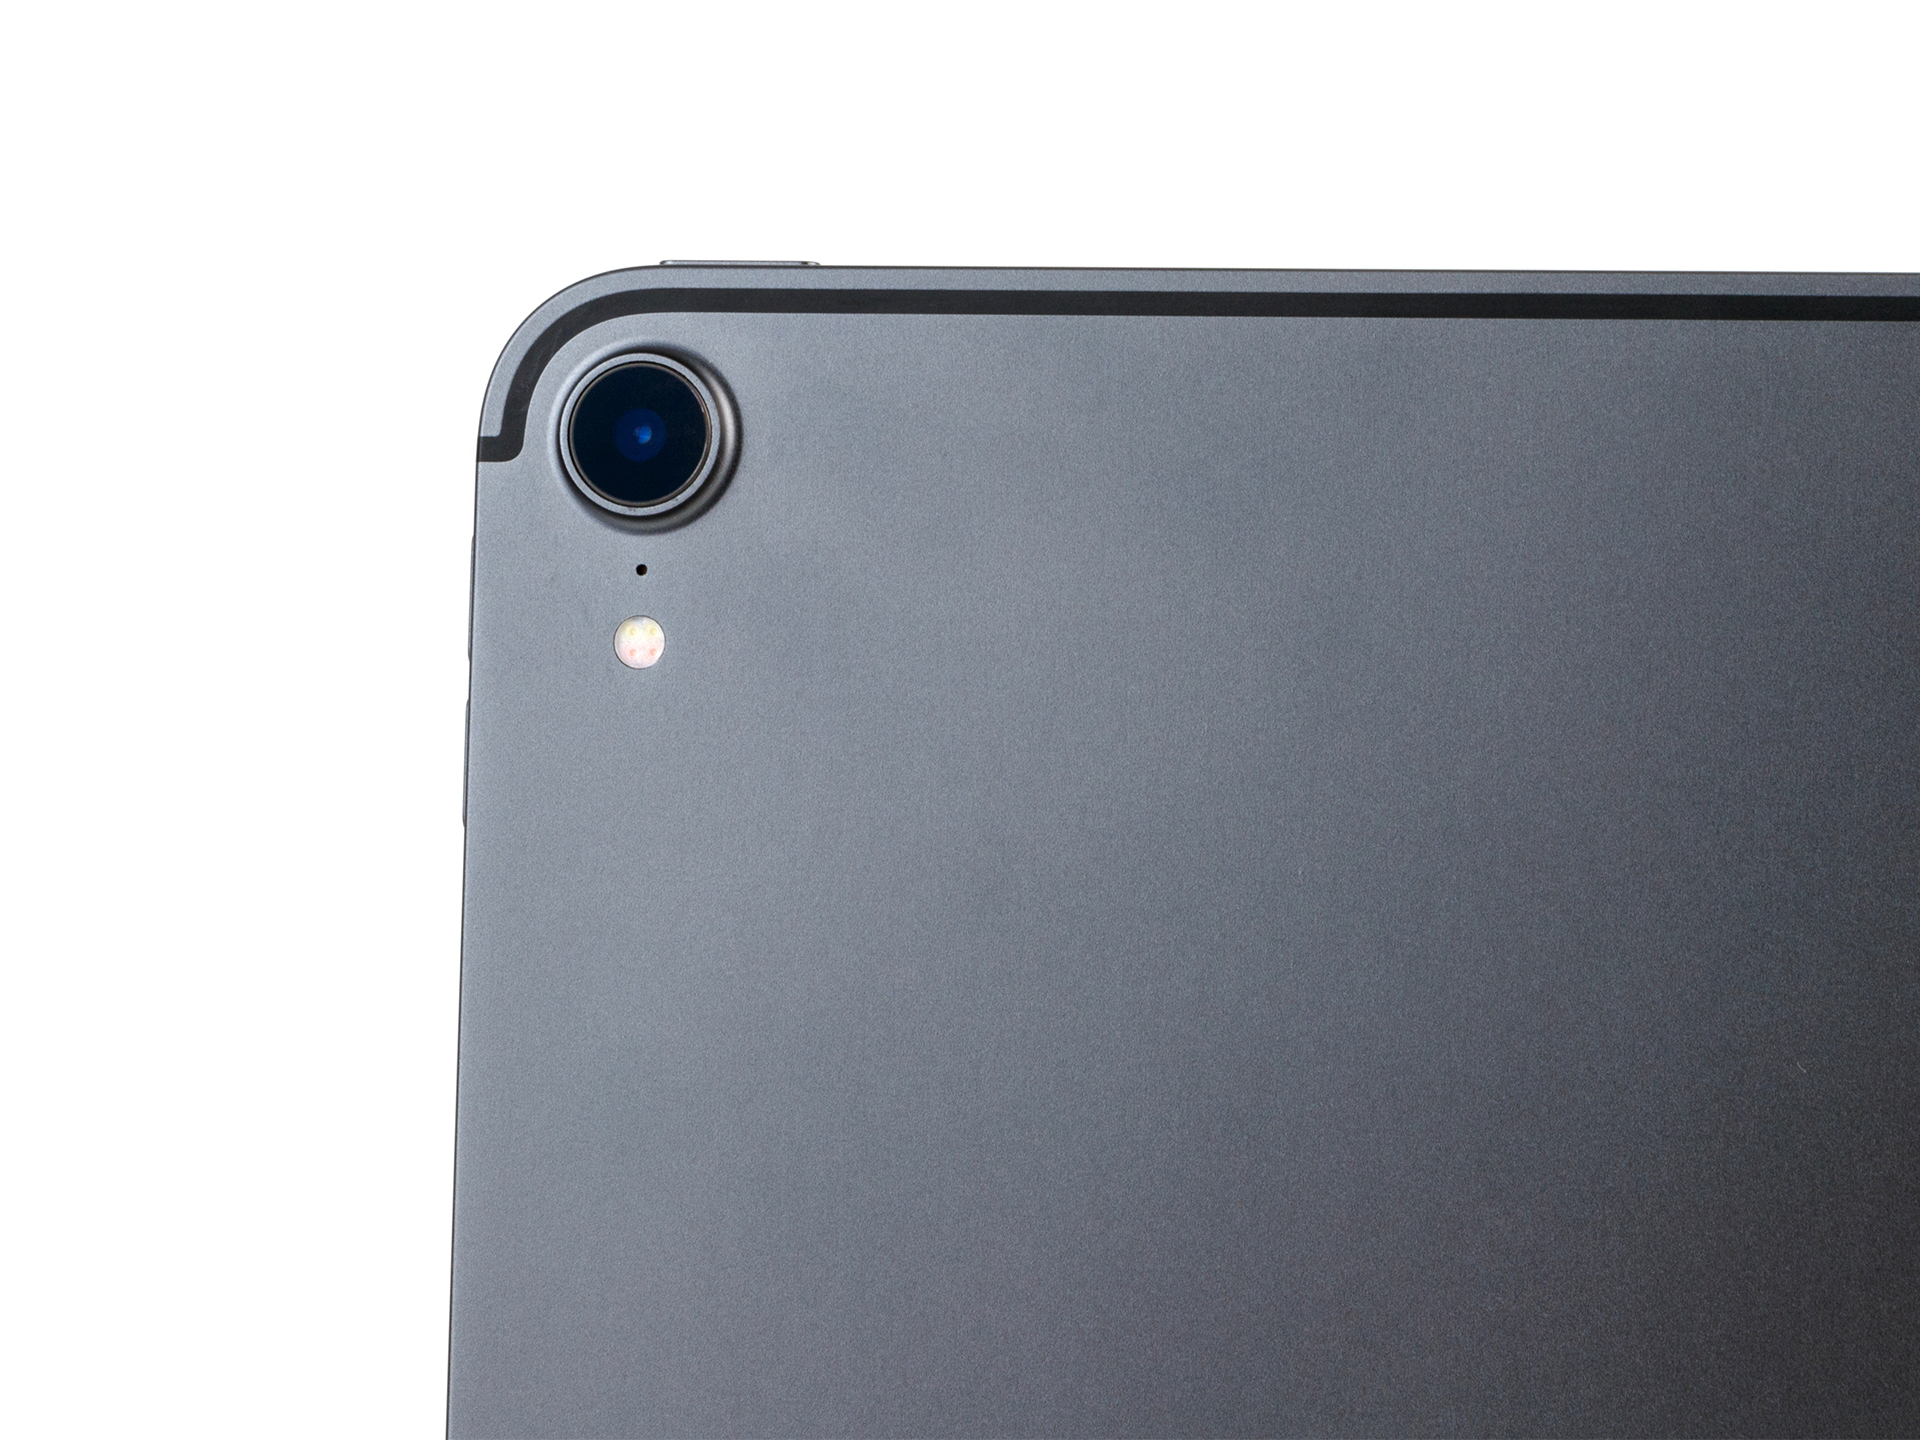
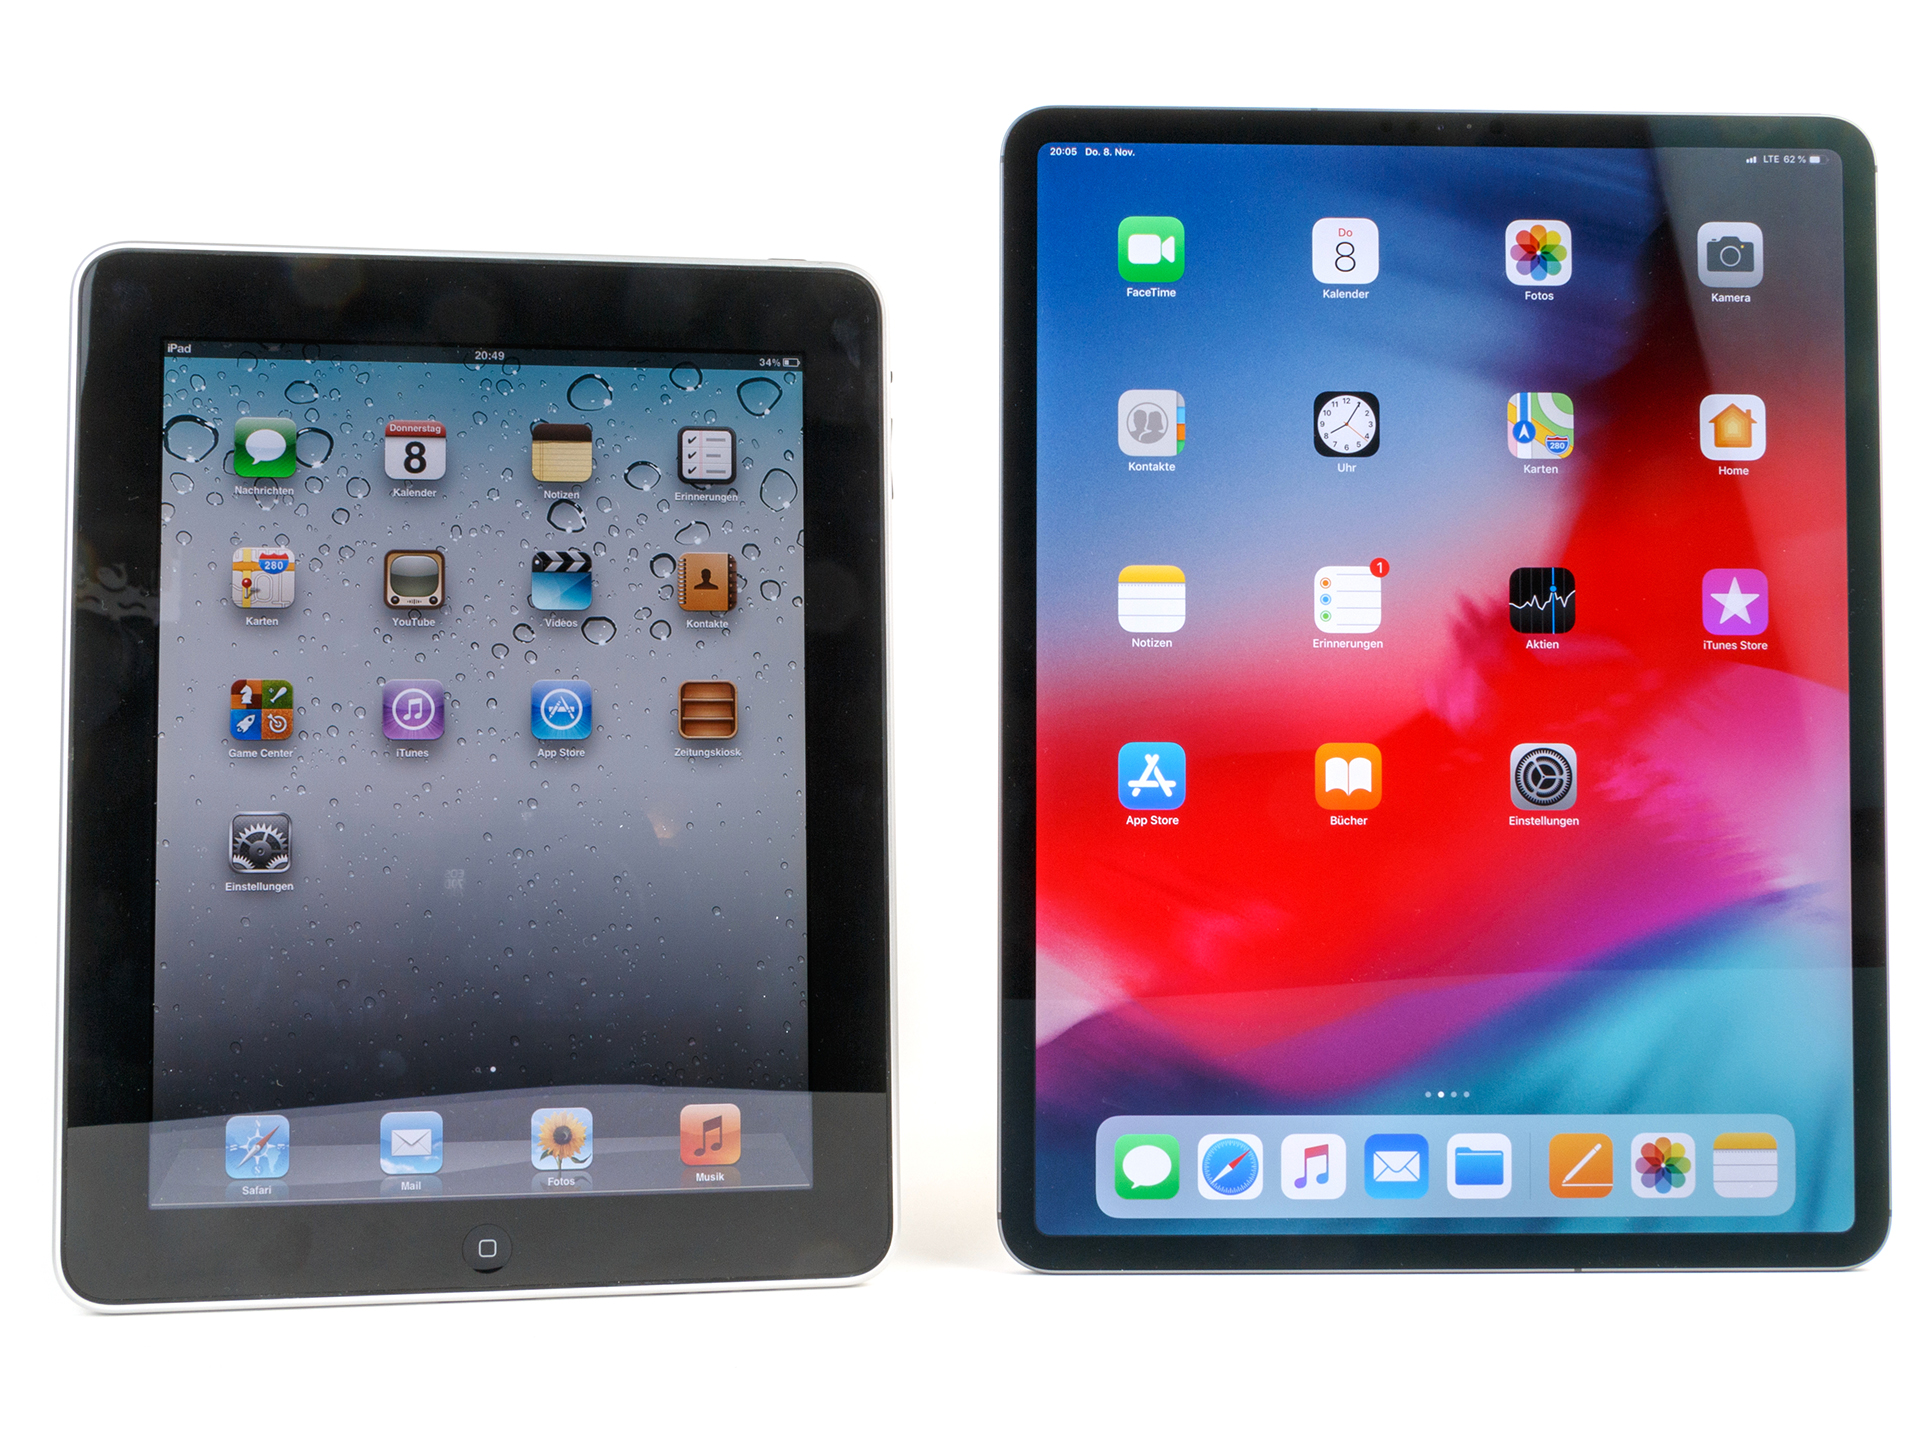
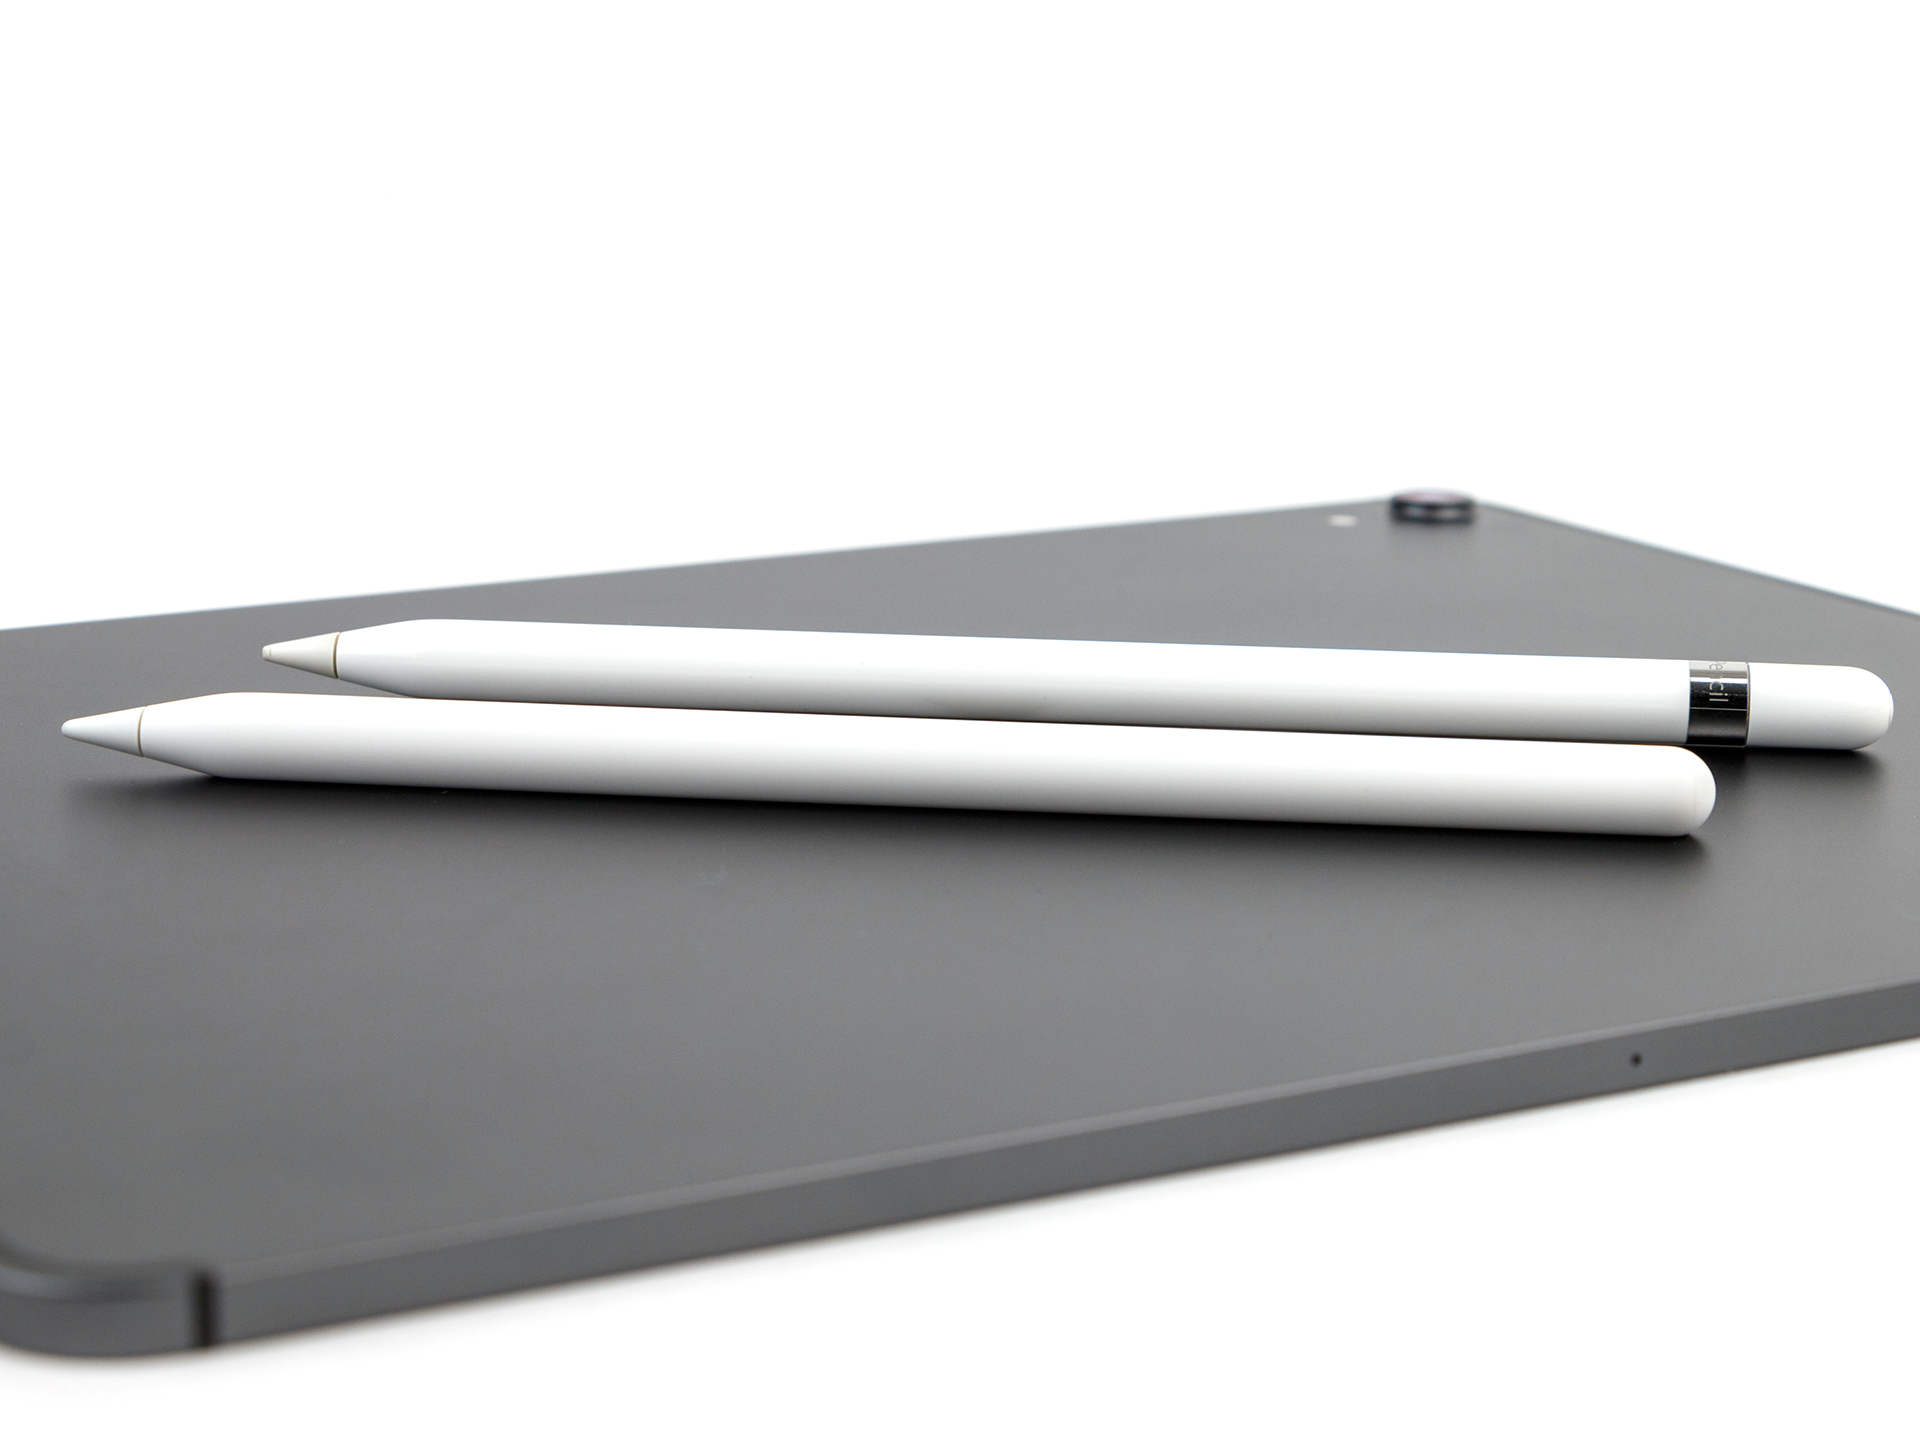
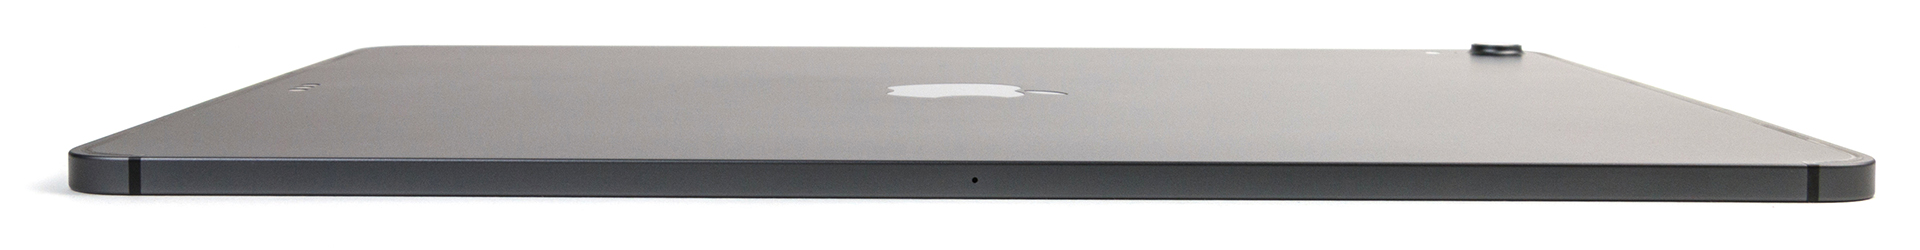
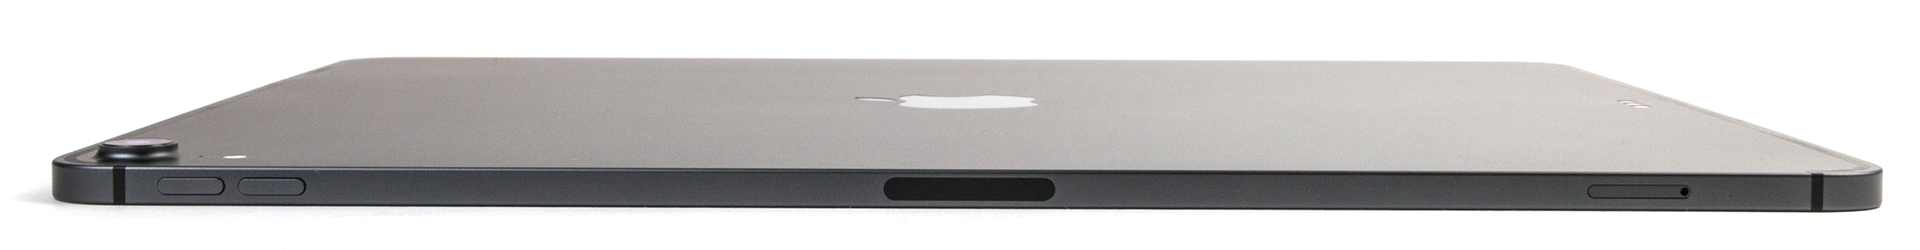
O Apple iPad Pro 12.9 (2018) não apenas nos impressionou durante o keynote da Apple, mas também quando recebemos nosso dispositivo de teste pela primeira vez. Sim, ainda é um enorme tablet, mas é mais fino e mais leve que seus antecessores. A nova Apple Pencil também é ótima na mão.
Uma grande atração do novo iPad Pro 12.9 será seu desempenho alegado, que a Apple afirma que superará 92% de todos os portáteis lançados em 2018. Notavelmente, isso inclui alguns modelos Core i7. A empresa também se orgulha de que o desempenho da GPU A12X deve rivalizar com o Xbox One S. A Apple realmente fez tudo certo com essas enormes alegações, e o novo iPad Pro 12.9 não consegue corresponder às expectativas. O A12X Bionic é atualmente o SoC baseado em ARM mais rápido que foi lançado no mercado, mas não há uma maneira precisa de comparar seu desempenho com processadores x86.
O iPad Pro 12.9 de terceira geração é um fantástico tablet e é atualmente o melhor tablet baseado em ARM que o dinheiro pode comprar. No entanto, o iOS continua a impedir que o iPad Pro seja um substituto genuíno de portátil, o que é uma pena, pois é poderoso o suficiente para ser um.
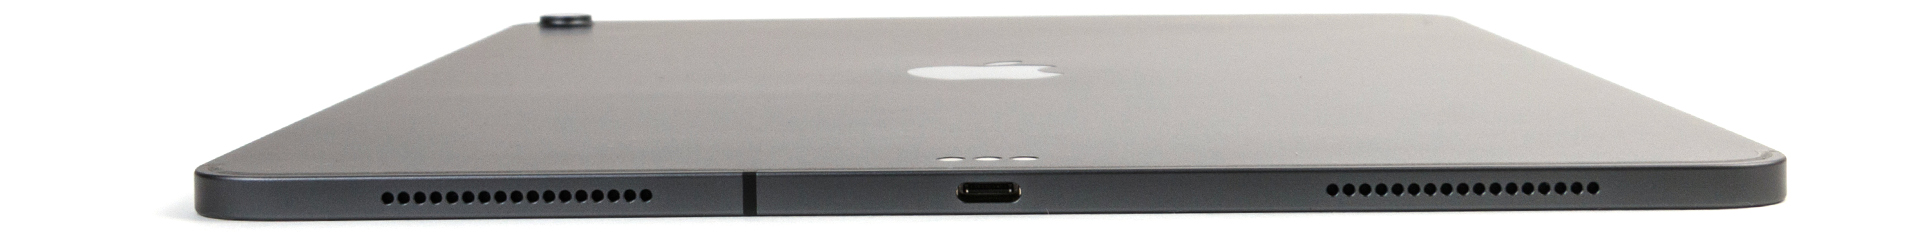
A maior falha do iPad Pro 12.9 é o iOS. O sistema operacional não tem um sistema de arquivos utilizável, e o dispositivo atualmente também não pode ler unidades flash USB, para citar apenas alguns problemas que temos com o iOS. O Galaxy Tab S4 é infinitamente mais flexível a esse respeito. Os usuários que precisam apenas de um dispositivo leve para e-mails, consumo de mídia e aplicativos de escritório, ficarão satisfeitos com o novo iPad Pro 12.9, embora seja extremamente caro. No entanto, depois de três gerações, a Apple não cumpriu sua promessa de criar um tablet que possa substituir um portátil.
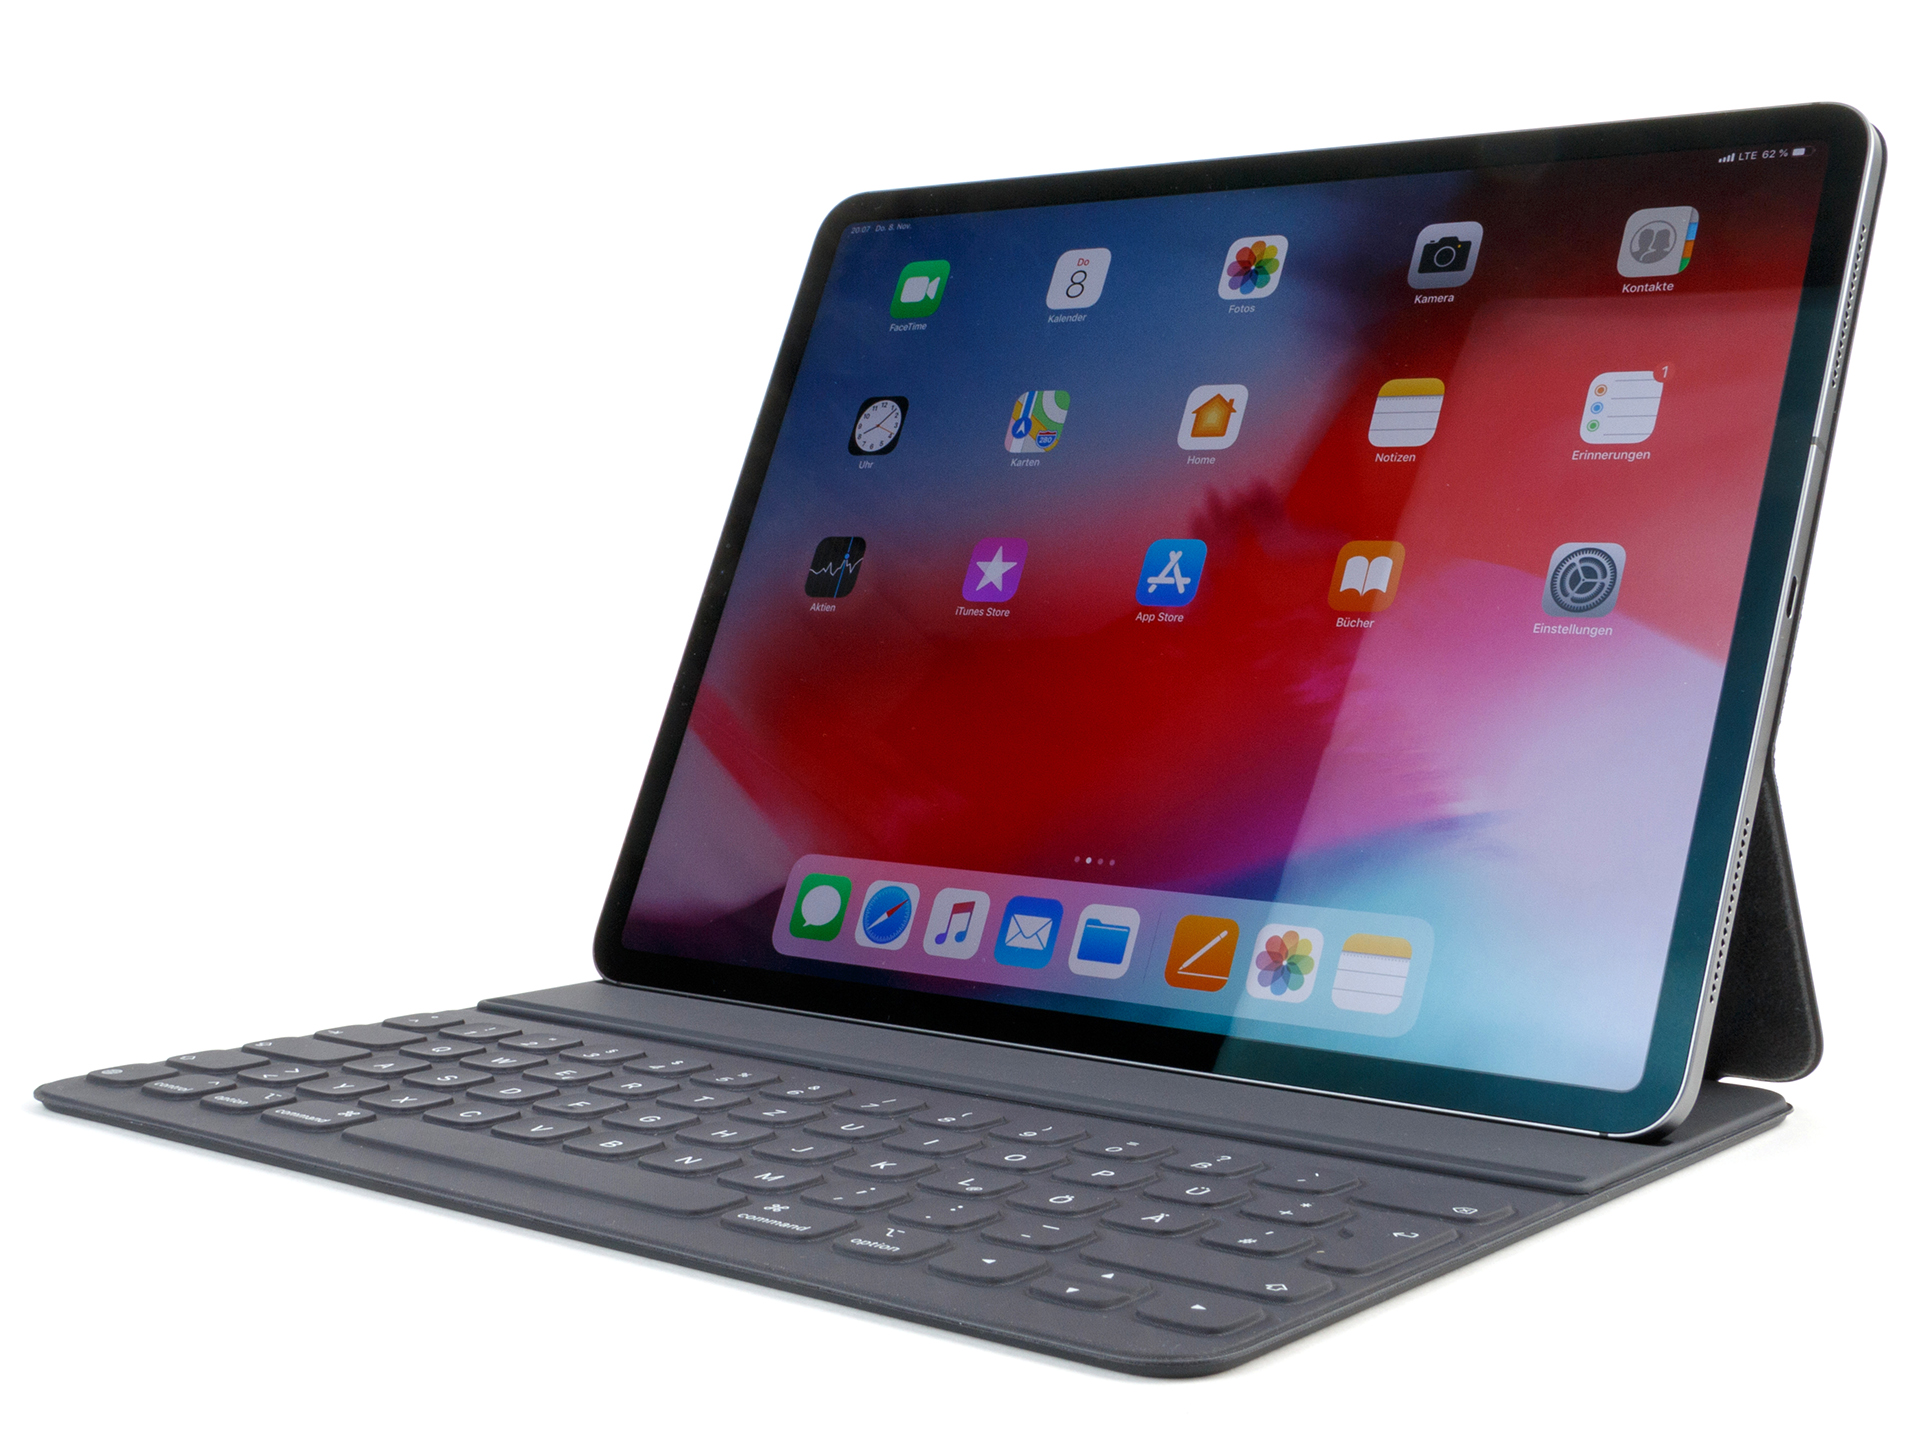
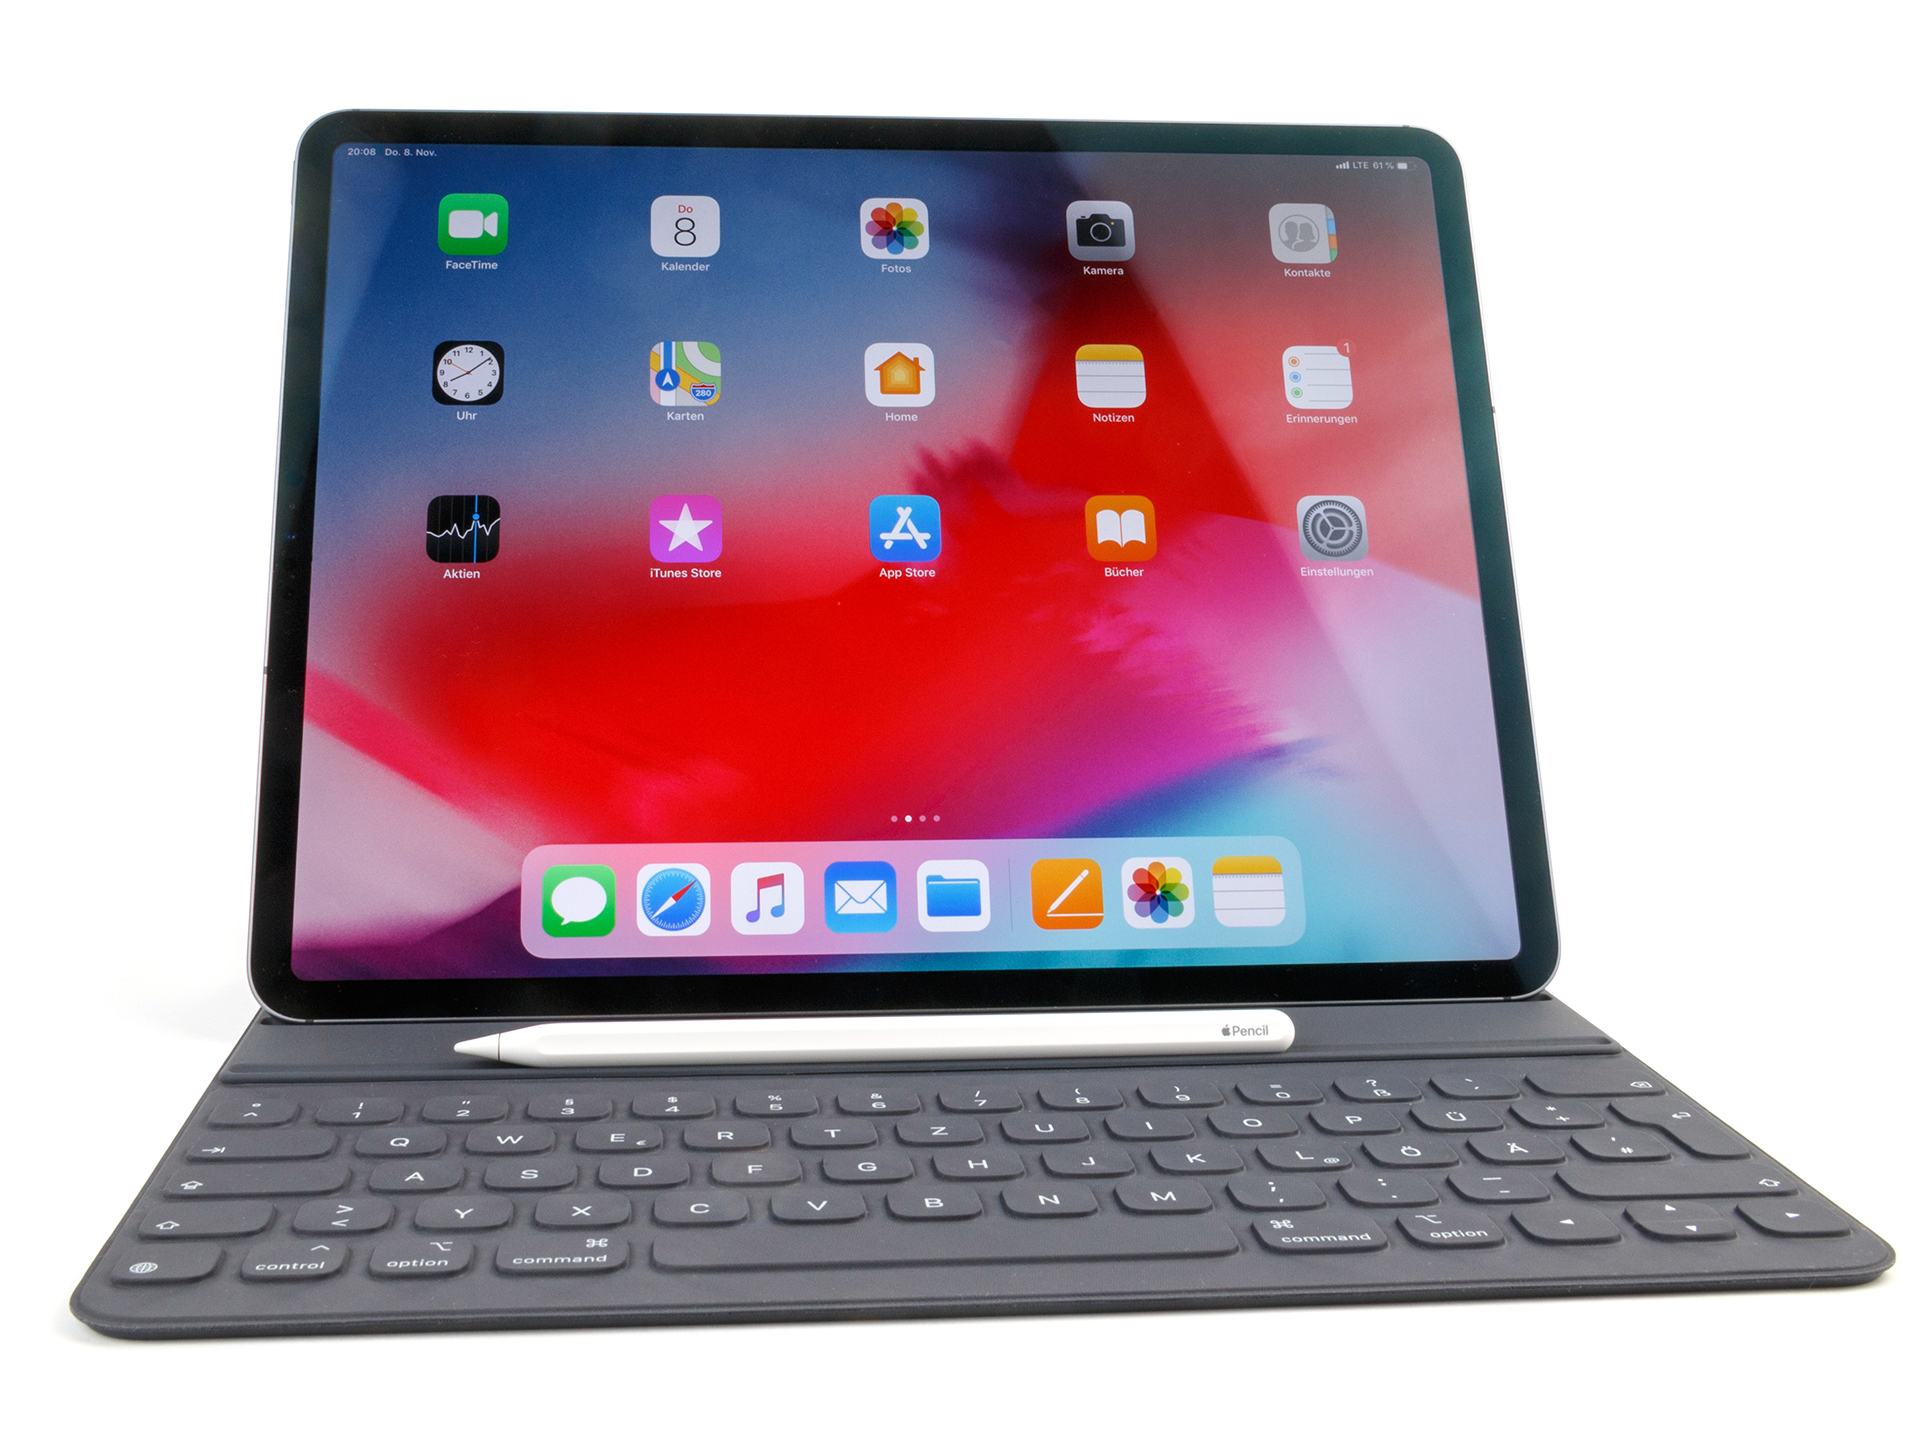
O novo iPad Pro 12.9 é ótimo para quem valoriza o Apple Pencil e sabe usá-lo. Recomendamos pegar o modelo menor se você planeja usar o dispositivo em movimento. Além disso, a versão de 64 GB deve ter armazenamento suficiente para a maioria dos usuários que querem apenas um tablet grande para consumo de mídia.
Apple iPad Pro 12.9 2018
- 09/16/2019 v7 (old)
Daniel Schmidt
Price comparison
