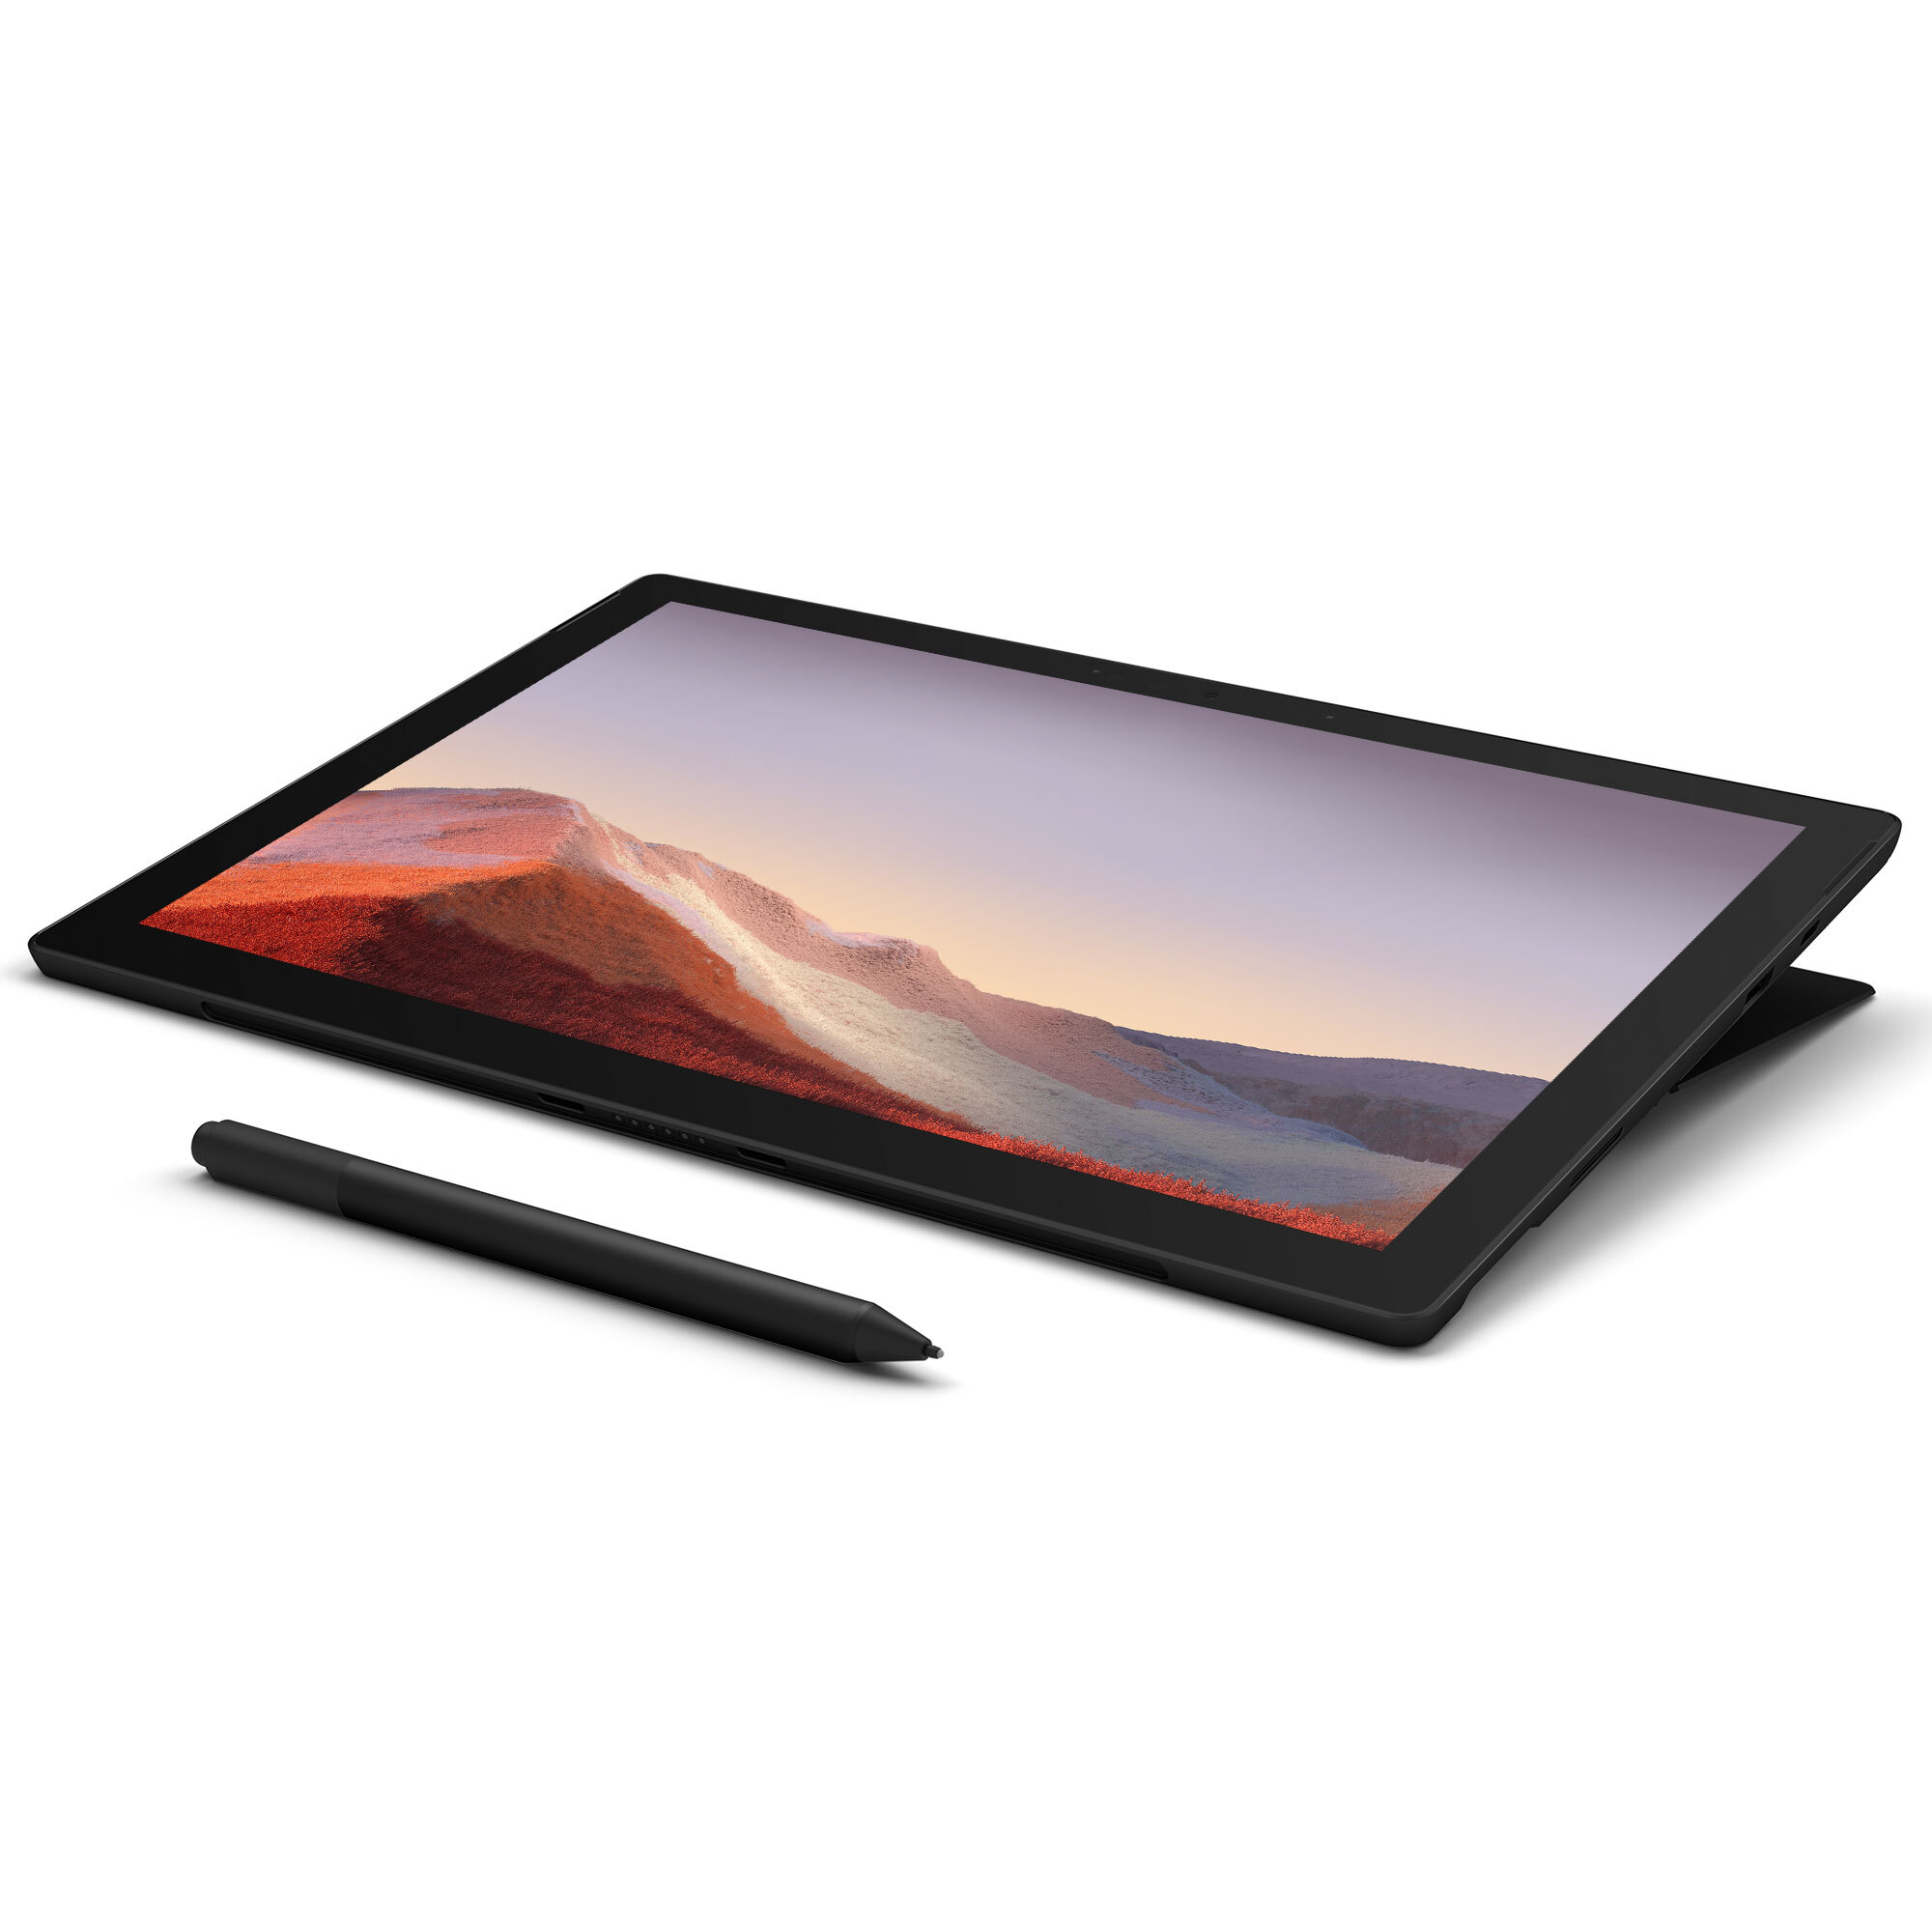
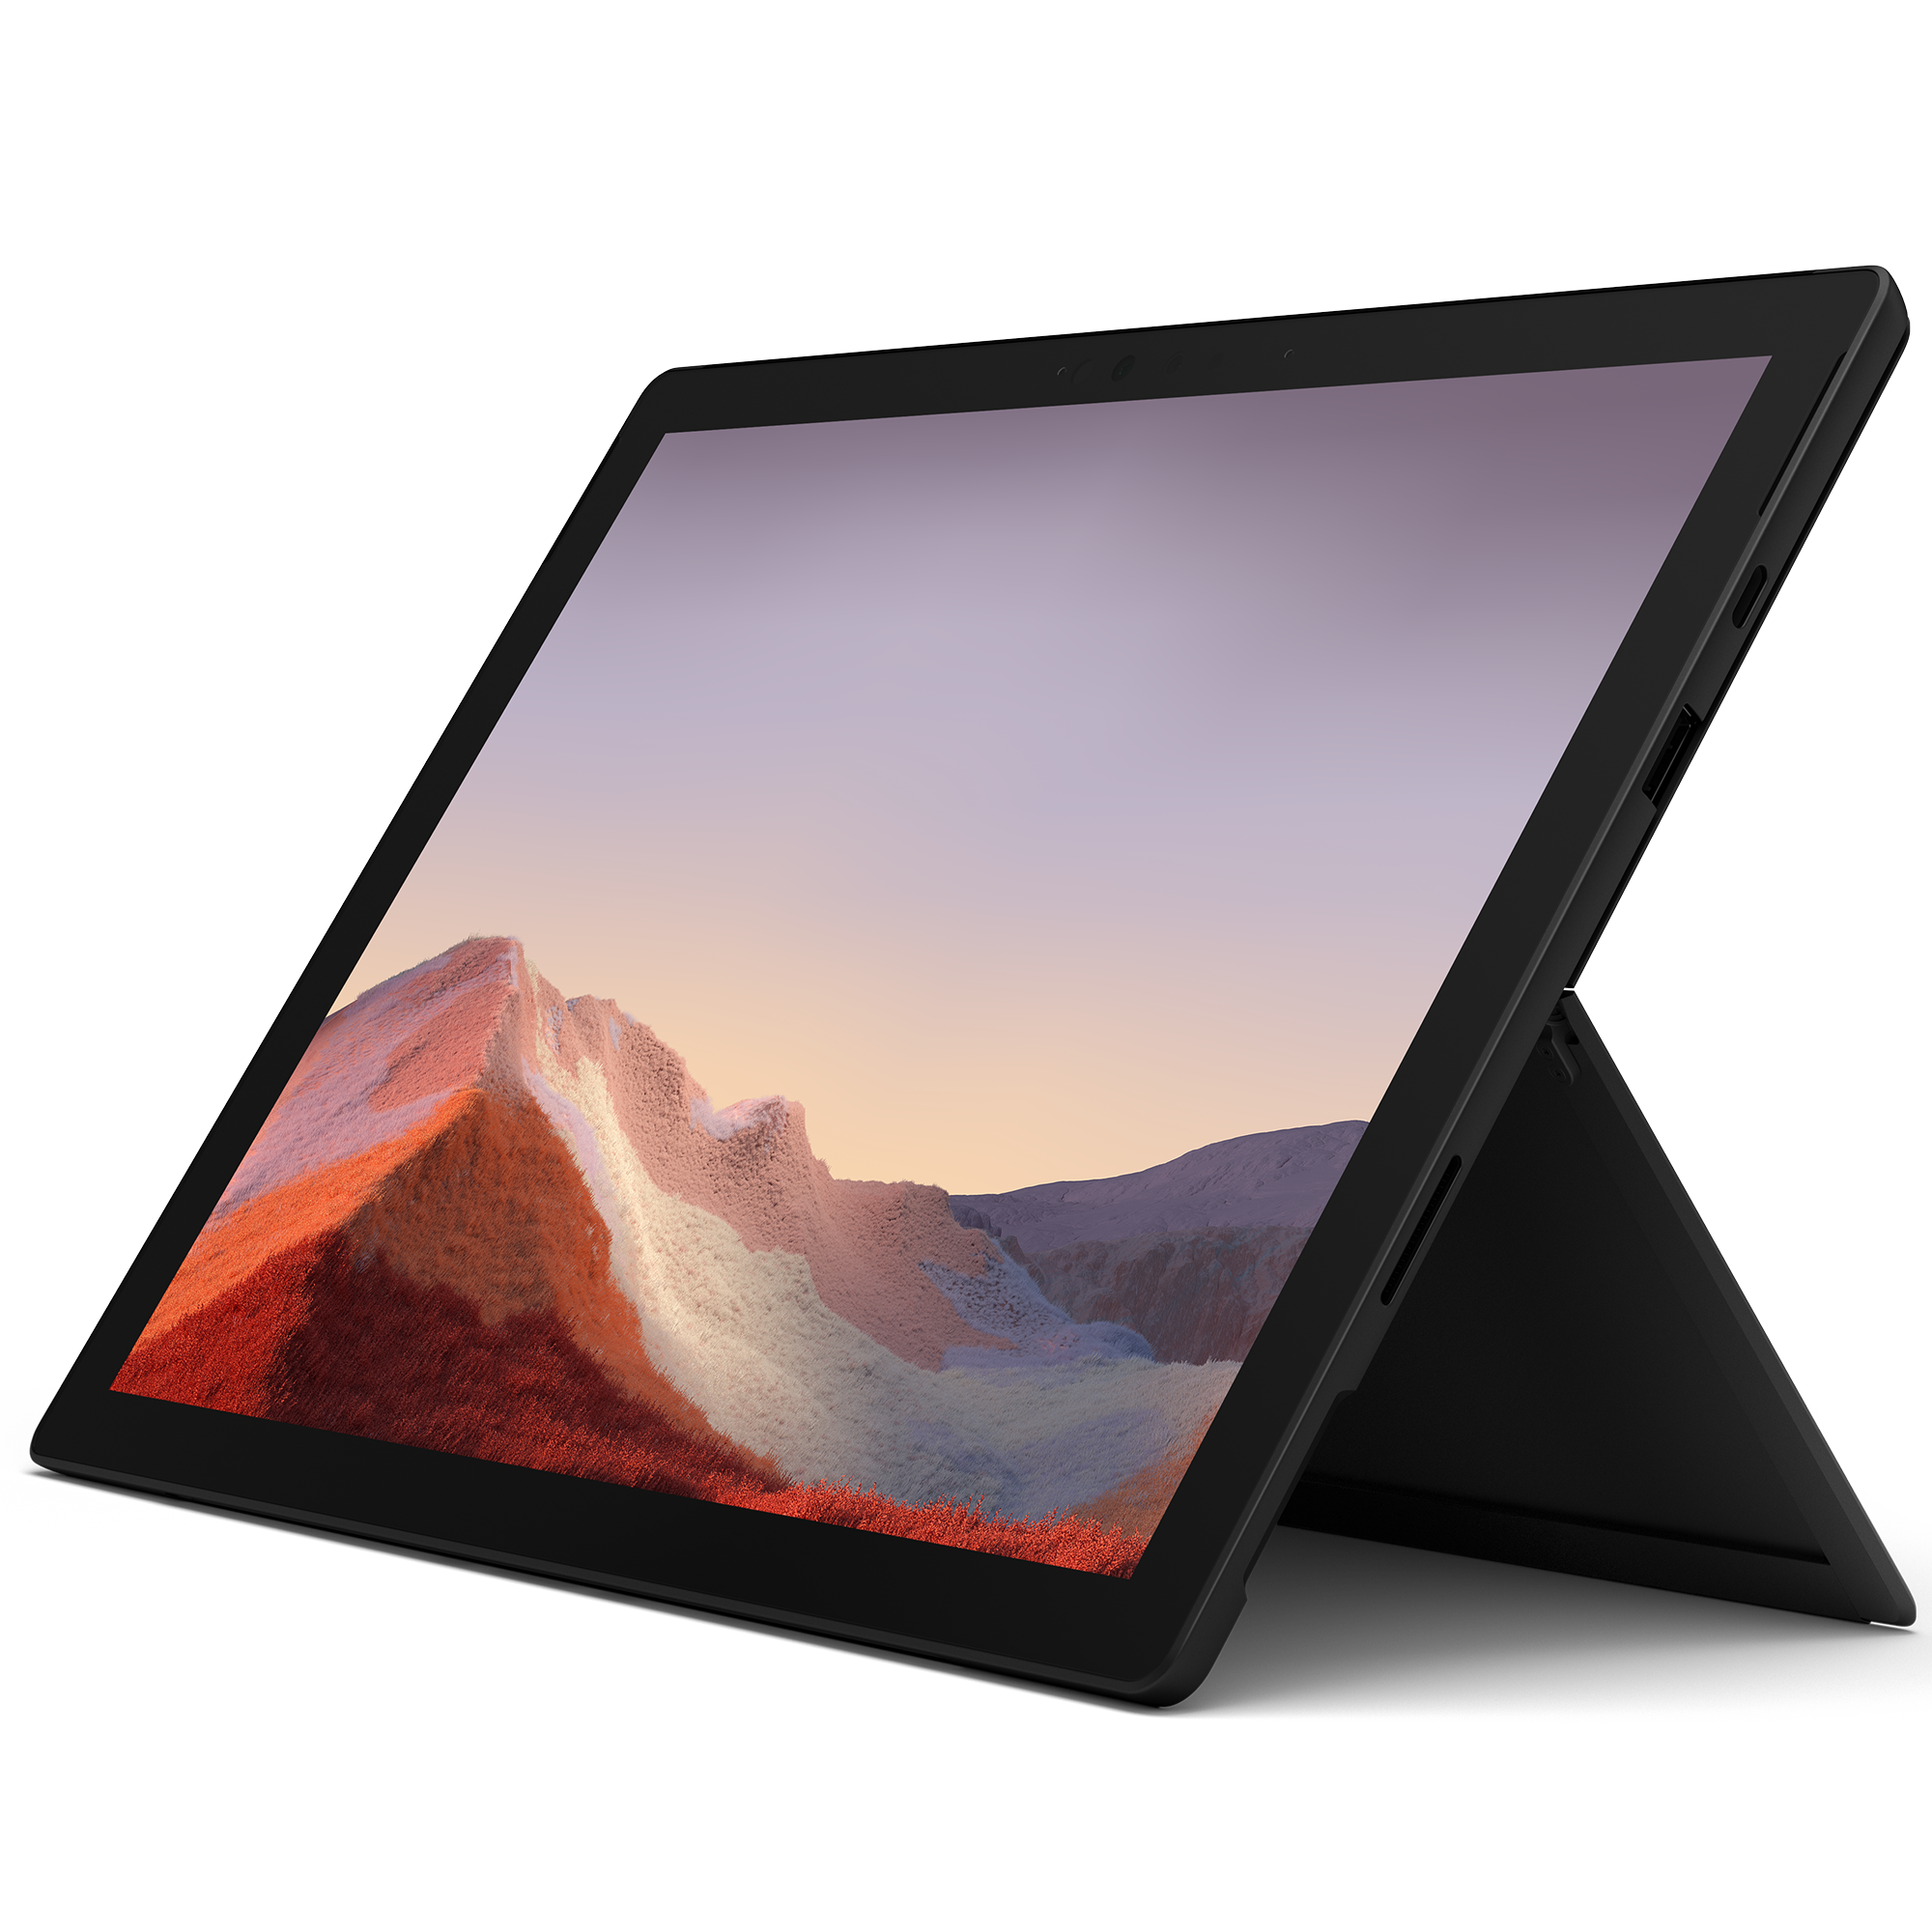
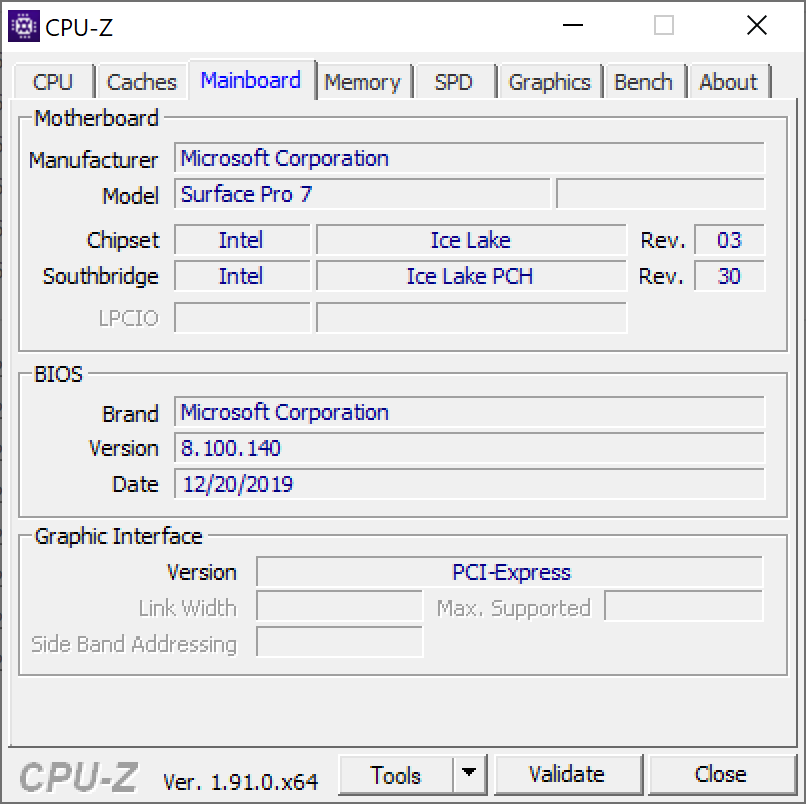
Breve Análise do Microsoft Surface Pro 7: Uma atualização i7 com Desempenho de GPU Extra
Avaliação | Data | Modelo | Peso | Altura | Size | Resolução | Preço |
|---|---|---|---|---|---|---|---|
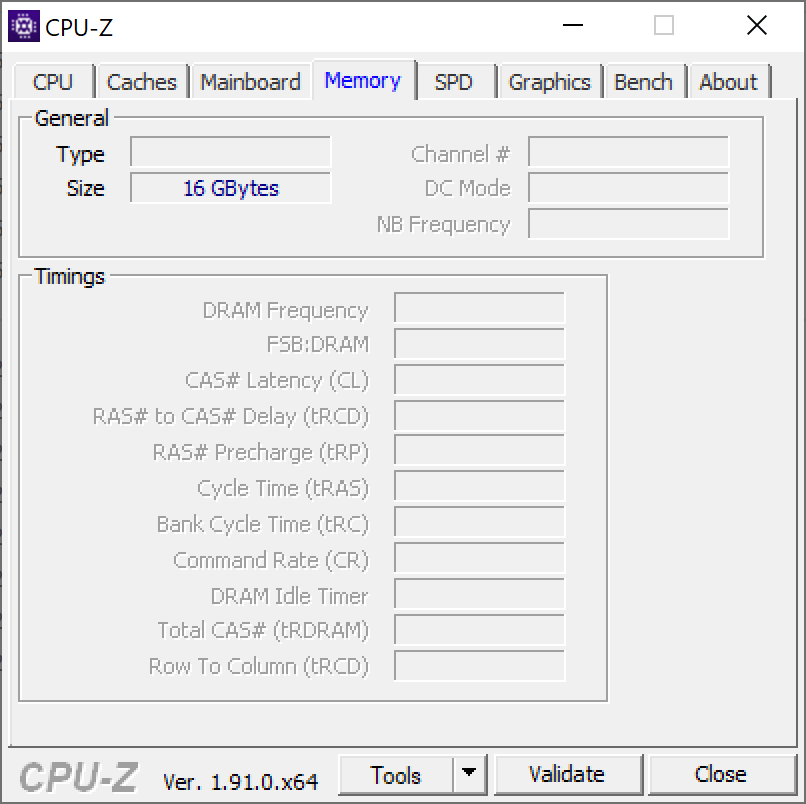
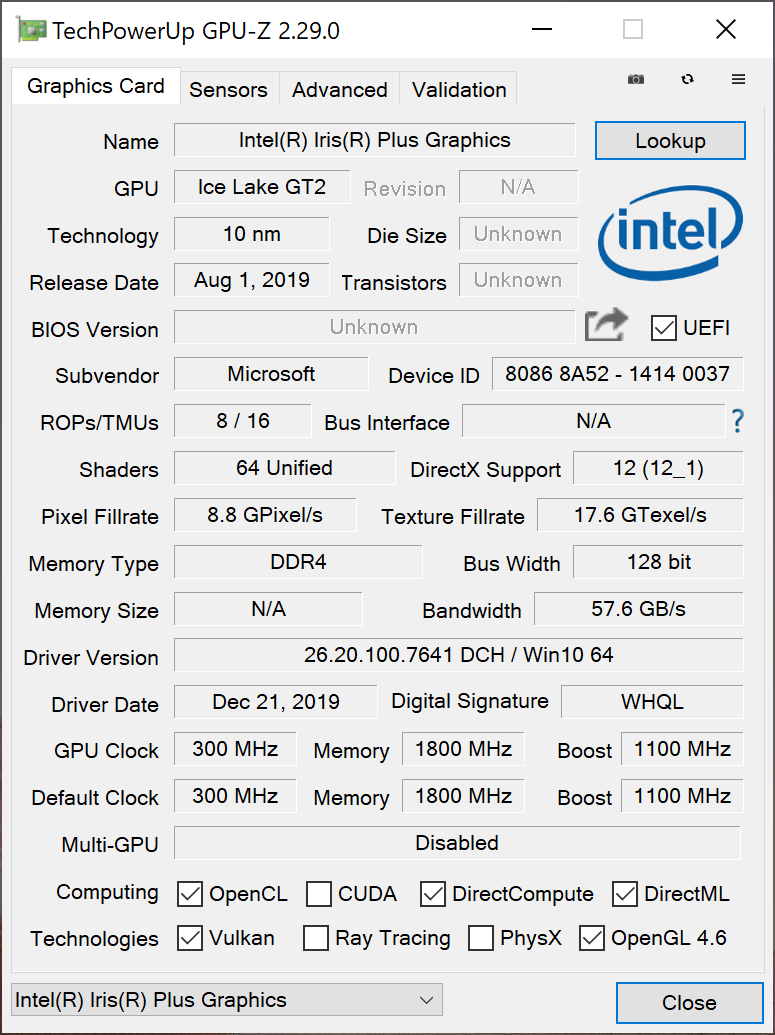
| 88.1 % v7 (old) | 03/2020 | Microsoft Surface Pro 7 i7-1065G7, Iris Plus Graphics G7 (Ice Lake 64 EU) | 790 g | 8.5 mm | 12.30" | 2736x1824 | |
| 88.4 % v7 (old) | 11/2019 | Microsoft Surface Pro 7 Core i5-1035G4 i5-1035G4, Iris Plus Graphics G4 (Ice Lake 48 EU) | 1.1 kg | 8.5 mm | 12.30" | 2736x1824 | |
| 89.6 % v6 (old) | 08/2017 | Microsoft Surface Pro (2017) i7 i7-7660U, Iris Plus Graphics 640 | 1.1 kg | 8.5 mm | 12.30" | 2736x1824 | |
| 86.3 % v7 (old) | 10/2019 | Dell XPS 13 7390 2-in-1 Core i7 i7-1065G7, Iris Plus Graphics G7 (Ice Lake 64 EU) | 1.3 kg | 13 mm | 13.40" | 1920x1200 | |
| 88.4 % v7 (old) | 12/2019 | HP Spectre x360 13-aw0013dx i7-1065G7, Iris Plus Graphics G7 (Ice Lake 64 EU) | 1.2 kg | 16.9 mm | 13.30" | 1920x1080 |
| SD Card Reader | |
| average JPG Copy Test (av. of 3 runs) | |
| Microsoft Surface Book 2 15 (Toshiba Exceria Pro SDXC 64 GB UHS-II) | |
| Dell XPS 13 7390 2-in-1 Core i7 (Toshiba Exceria Pro M501 64 GB UHS-II) | |
| Microsoft Surface Pro 6, Core i7, 512 GB (Toshiba Exceria Pro M501 microSDXC 64GB) | |
| Microsoft Surface Pro 7 (Toshiba Exceria Pro M501 microSDXC 64GB) | |
| Chuwi UBook Pro (Toshiba Exceria Pro M501 64 GB UHS-II) | |
| Microsoft Surface Go MHN-00003 (Toshiba Exceria Pro M501) | |
| Média da turma Convertible (28.1 - 197, n=23, últimos 2 anos) | |
| Microsoft Surface Pro (2017) i7 (Toshiba Exceria Pro M401 64 GB) | |
| maximum AS SSD Seq Read Test (1GB) | |
| Microsoft Surface Book 2 15 (Toshiba Exceria Pro SDXC 64 GB UHS-II) | |
| Dell XPS 13 7390 2-in-1 Core i7 (Toshiba Exceria Pro M501 64 GB UHS-II) | |
| Média da turma Convertible (28.9 - 254, n=22, últimos 2 anos) | |
| Microsoft Surface Pro 7 (Toshiba Exceria Pro M501 microSDXC 64GB) | |
| Microsoft Surface Pro (2017) i7 (Toshiba Exceria Pro M401 64 GB) | |
| Microsoft Surface Pro 6, Core i7, 512 GB (Toshiba Exceria Pro M501 microSDXC 64GB) | |
| Microsoft Surface Go MHN-00003 (Toshiba Exceria Pro M501) | |
| Chuwi UBook Pro (Toshiba Exceria Pro M501 64 GB UHS-II) | |
| |||||||||||||||||||||||||
iluminação: 90 %
iluminação com acumulador: 435 cd/m²
Contraste: 1359:1 (Preto: 0.32 cd/m²)
ΔE ColorChecker Calman: 1.18 | ∀{0.5-29.43 Ø4.73}
calibrated: 3.49
ΔE Greyscale Calman: 1.12 | ∀{0.09-98 Ø4.97}
96% sRGB (Argyll 1.6.3 3D)
60% AdobeRGB 1998 (Argyll 1.6.3 3D)
65.7% AdobeRGB 1998 (Argyll 3D)
95.8% sRGB (Argyll 3D)
63.7% Display P3 (Argyll 3D)
Gamma: 2.3
CCT: 6502 K
| Microsoft Surface Pro 7 LG Philips LP123WQ112604, IPS, 2736x1824, 12.3" | Microsoft Surface Pro 7 Core i5-1035G4 LG Philips LP123WQ112604, IPS, 2736x1824, 12.3" | Dell XPS 13 7390 2-in-1 Core i7 Sharp LQ134N1, IPS, 1920x1200, 13.4" | Chuwi UBook Pro BOE TV123WAM-ND0, IPS, 1920x1280, 12.3" | Microsoft Surface Pro 6, Core i7, 512 GB LGPhilips LP123WQ112604, IPS, 2736x1824, 12.3" | |
|---|---|---|---|---|---|
| Display | 1% | 8% | -1% | 3% | |
| Display P3 Coverage (%) | 63.7 | 66 4% | 69.9 10% | 63.3 -1% | 67.1 5% |
| sRGB Coverage (%) | 95.8 | 93.8 -2% | 99.2 4% | 94 -2% | 95.5 0% |
| AdobeRGB 1998 Coverage (%) | 65.7 | 66.9 2% | 71.5 9% | 65.1 -1% | 67.9 3% |
| Response Times | 10% | -12% | 14% | 2% | |
| Response Time Grey 50% / Grey 80% * (ms) | 40 ? | 34.8 ? 13% | 47.6 ? -19% | 30.8 ? 23% | 43 ? -8% |
| Response Time Black / White * (ms) | 28 ? | 26.4 ? 6% | 29.2 ? -4% | 26.8 ? 4% | 25 ? 11% |
| PWM Frequency (Hz) | 250 ? | 21550 ? | 2500 ? | 22000 ? | |
| Screen | -92% | -16% | -90% | -58% | |
| Brightness middle (cd/m²) | 435 | 480.4 10% | 549.8 26% | 867.6 99% | 484 11% |
| Brightness (cd/m²) | 422 | 485 15% | 520 23% | 818 94% | 473 12% |
| Brightness Distribution (%) | 90 | 91 1% | 86 -4% | 83 -8% | 91 1% |
| Black Level * (cd/m²) | 0.32 | 0.48 -50% | 0.39 -22% | 0.78 -144% | 0.33 -3% |
| Contrast (:1) | 1359 | 1001 -26% | 1410 4% | 1112 -18% | 1467 8% |
| Colorchecker dE 2000 * | 1.18 | 5 -324% | 2.12 -80% | 4.64 -293% | 4.29 -264% |
| Colorchecker dE 2000 max. * | 2.27 | 7.72 -240% | 3.66 -61% | 9.22 -306% | 6.46 -185% |
| Colorchecker dE 2000 calibrated * | 3.49 | 2.44 30% | 1.37 61% | 2.31 34% | 1.34 62% |
| Greyscale dE 2000 * | 1.12 | 5.9 -427% | 2.6 -132% | 6.1 -445% | 4.3 -284% |
| Gamma | 2.3 96% | 2.38 92% | 2.3 96% | 2.22 99% | 2.51 88% |
| CCT | 6502 100% | 7805 83% | 6884 94% | 7346 88% | 7315 89% |
| Color Space (Percent of AdobeRGB 1998) (%) | 60 | 60.3 0% | 65.4 9% | 59 -2% | 62 3% |
| Color Space (Percent of sRGB) (%) | 96 | 93.2 -3% | 99.7 4% | 93.7 -2% | 95 -1% |
| Média Total (Programa/Configurações) | -27% /
-62% | -7% /
-11% | -26% /
-61% | -18% /
-39% |
* ... menor é melhor
Exibir tempos de resposta
| ↔ Tempo de resposta preto para branco | ||
|---|---|---|
| 28 ms ... ascensão ↗ e queda ↘ combinadas | ↗ 16 ms ascensão | 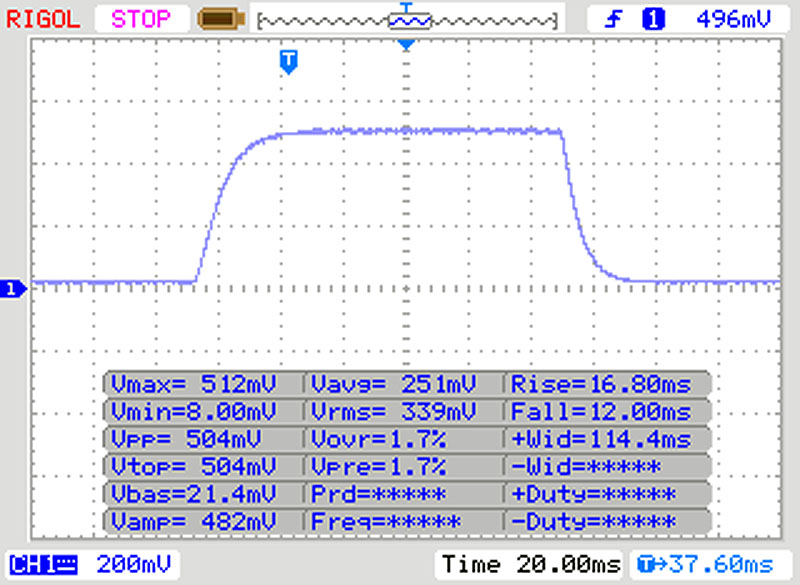 |
| ↘ 12 ms queda | ||
| A tela mostra taxas de resposta relativamente lentas em nossos testes e pode ser muito lenta para os jogadores. Em comparação, todos os dispositivos testados variam de 0.1 (mínimo) a 240 (máximo) ms. » 71 % de todos os dispositivos são melhores. Isso significa que o tempo de resposta medido é pior que a média de todos os dispositivos testados (19.9 ms). | ||
| ↔ Tempo de resposta 50% cinza a 80% cinza | ||
| 40 ms ... ascensão ↗ e queda ↘ combinadas | ↗ 19 ms ascensão | 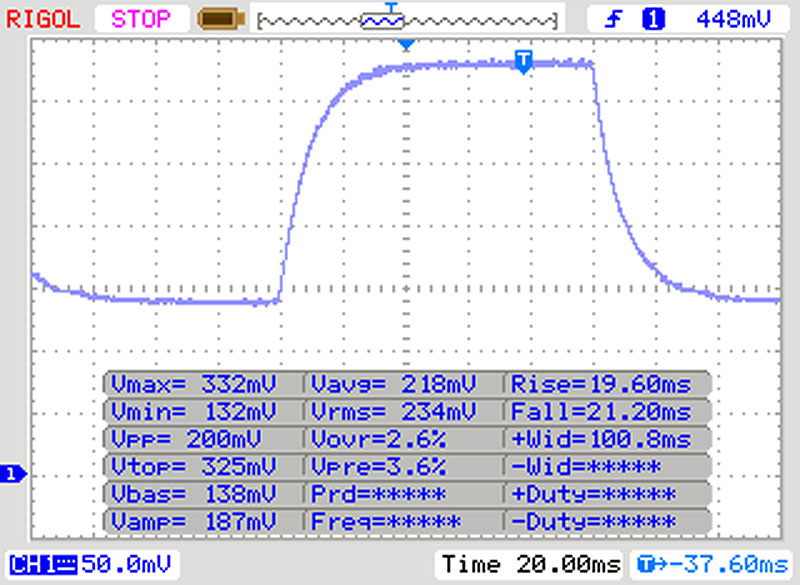 |
| ↘ 21 ms queda | ||
| A tela mostra taxas de resposta lentas em nossos testes e será insatisfatória para os jogadores. Em comparação, todos os dispositivos testados variam de 0.165 (mínimo) a 636 (máximo) ms. » 61 % de todos os dispositivos são melhores. Isso significa que o tempo de resposta medido é pior que a média de todos os dispositivos testados (31.1 ms). | ||
Cintilação da tela / PWM (modulação por largura de pulso)
| Tela tremeluzindo/PWM detectado | 250 Hz | ≤ 50 % configuração de brilho | 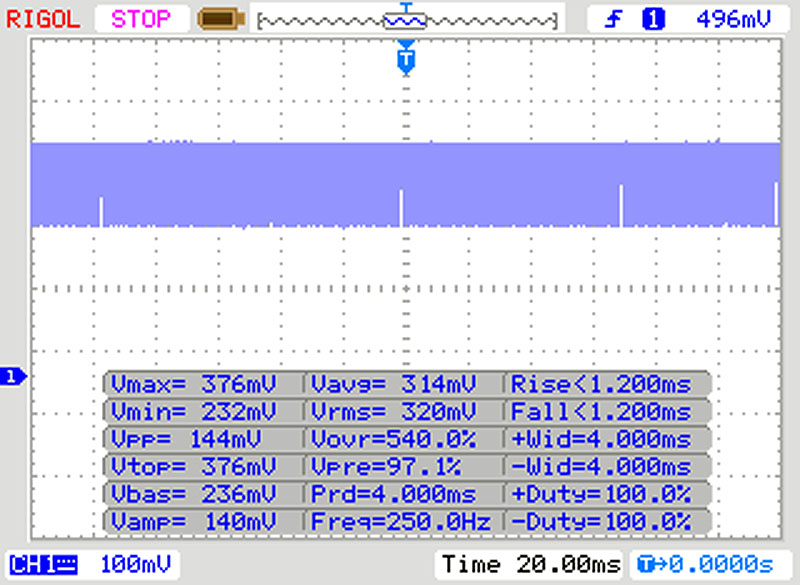 |
A luz de fundo da tela pisca em 250 Hz (pior caso, por exemplo, utilizando PWM) Cintilação detectada em uma configuração de brilho de 50 % e abaixo. Não deve haver cintilação ou PWM acima desta configuração de brilho. A frequência de 250 Hz é relativamente baixa, portanto, usuários sensíveis provavelmente notarão cintilação e sentirão fadiga ocular na configuração de brilho indicada e abaixo. [pwm_comparison] Em comparação: 52 % de todos os dispositivos testados não usam PWM para escurecer a tela. Se PWM foi detectado, uma média de 7798 (mínimo: 5 - máximo: 343500) Hz foi medida. | |||
| PCMark 8 Home Score Accelerated v2 | 3660 pontos | |
| PCMark 8 Work Score Accelerated v2 | 3440 pontos | |
| PCMark 10 Score | 4367 pontos | |
Ajuda | ||
| Microsoft Surface Pro 7 Toshiba KBG40ZNS256G NVMe | Microsoft Surface Pro 7 Core i5-1035G4 Toshiba BG4 KBG40ZPZ256G | Microsoft Surface Pro (2017) i7 Samsung PM971 KUS040202M | Microsoft Surface Pro 6, Core i7, 512 GB Toshiba KBG30ZPZ512G | Média Toshiba KBG40ZNS256G NVMe | |
|---|---|---|---|---|---|
| CrystalDiskMark 5.2 / 6 | -5% | -16% | -39% | -13% | |
| Write 4K (MB/s) | 131.3 | 118.5 -10% | 131.6 0% | 83.2 -37% | 112.1 ? -15% |
| Read 4K (MB/s) | 52.4 | 54.1 3% | 43.34 -17% | 43.84 -16% | 50.6 ? -3% |
| Write Seq (MB/s) | 1613 | 1166 -28% | 905 -44% | 636 -61% | 961 ? -40% |
| Read Seq (MB/s) | 1613 | 1676 4% | 985 -39% | 900 -44% | 1562 ? -3% |
| Write 4K Q32T1 (MB/s) | 411.6 | 330.5 -20% | 421.6 2% | 192.9 -53% | 299 ? -27% |
| Read 4K Q32T1 (MB/s) | 415.6 | 393.1 -5% | 498.9 20% | 247.4 -40% | 359 ? -14% |
| Write Seq Q32T1 (MB/s) | 2340 | 1569 -33% | 970 -59% | 861 -63% | 1366 ? -42% |
| Read Seq Q32T1 (MB/s) | 1568 | 2390 52% | 1670 7% | 1615 3% | 2170 ? 38% |
| Write 4K Q8T8 (MB/s) | 410.9 | 380 ? -8% | |||
| Read 4K Q8T8 (MB/s) | 1033 | 852 ? -18% | |||
| AS SSD | -31% | -275% | -60% | -23% | |
| Seq Read (MB/s) | 1881 | 1590 -15% | 1070 -43% | 1154 -39% | 1752 ? -7% |
| Seq Write (MB/s) | 703 | 714 2% | 171 -76% | 393.6 -44% | 720 ? 2% |
| 4K Read (MB/s) | 52.3 | 50.7 -3% | 41 -22% | 34.42 -34% | 47.3 ? -10% |
| 4K Write (MB/s) | 154.1 | 109.4 -29% | 0.2 -100% | 68.9 -55% | 118.6 ? -23% |
| 4K-64 Read (MB/s) | 1048 | 924 -12% | 1015 -3% | 494.1 -53% | 866 ? -17% |
| 4K-64 Write (MB/s) | 703 | 294.6 -58% | 34 -95% | 171.3 -76% | 402 ? -43% |
| Access Time Read * (ms) | 0.069 | 0.066 4% | 0.04 42% | 0.213 -209% | 0.1034 ? -50% |
| Access Time Write * (ms) | 0.221 | 0.697 -215% | 7.6 -3339% | 0.3 -36% | 0.3076 ? -39% |
| Score Read (Points) | 1288 | 1133 -12% | 1164 -10% | 644 -50% | 1088 ? -16% |
| Score Write (Points) | 927 | 475 -49% | 52 -94% | 280 -70% | 592 ? -36% |
| Score Total (Points) | 2826 | 2157 -24% | 1774 -37% | 1225 -57% | 2197 ? -22% |
| Copy ISO MB/s (MB/s) | 1160 | 1177 1% | 1036 -11% | 985 -15% | 926 ? -20% |
| Copy Program MB/s (MB/s) | 454.7 | 406 -11% | 386 -15% | 143.1 -69% | 372 ? -18% |
| Copy Game MB/s (MB/s) | 991 | 923 -7% | 582 -41% | 676 -32% | 714 ? -28% |
| Média Total (Programa/Configurações) | -18% /
-21% | -146% /
-181% | -50% /
-52% | -18% /
-19% |
* ... menor é melhor

| 3DMark 11 Performance | 4504 pontos | |
| 3DMark Cloud Gate Standard Score | 14315 pontos | |
| 3DMark Fire Strike Score | 2833 pontos | |
| 3DMark Time Spy Score | 793 pontos | |
Ajuda | ||
| Rocket League | |
| 1920x1080 Quality AA:Medium FX | |
| Microsoft Surface Pro 7 | |
| Dell XPS 13 7390 2-in-1 Core i7 | |
| HP Spectre x360 13-aw0013dx | |
| Microsoft Surface Pro (2017) i7 | |
| Microsoft Surface Pro 7 Core i5-1035G4 | |
| 1920x1080 High Quality AA:High FX | |
| Microsoft Surface Pro 7 | |
| Dell XPS 13 7390 2-in-1 Core i7 | |
| HP Spectre x360 13-aw0013dx | |
| Microsoft Surface Pro (2017) i7 | |
| Microsoft Surface Pro 7 Core i5-1035G4 | |
| Shadow of the Tomb Raider - 1280x720 Lowest Preset | |
| Microsoft Surface Pro 7 | |
| Dell XPS 13 7390 2-in-1 Core i7 | |
| HP Spectre x360 13-aw0013dx | |
| Microsoft Surface Pro 7 Core i5-1035G4 | |
| Microsoft Surface Pro 6, Core i7, 512 GB | |
| baixo | média | alto | ultra | |
|---|---|---|---|---|
| BioShock Infinite (2013) | 112.5 | 72.8 | 60.2 | 21.96 |
| Rise of the Tomb Raider (2016) | 49.16 | 30 | 15.97 | 12.56 |
| Rocket League (2017) | 95.7 | 67.5 | 44.7 | |
| Shadow of the Tomb Raider (2018) | 33 | 14 | 13 |
Barulho
| Ocioso |
| 30.3 / 30.3 / 30.3 dB |
| Carga |
| 31.4 / 33.7 dB |
 | ||
30 dB silencioso 40 dB(A) audível 50 dB(A) ruidosamente alto |
||
min: | ||
(±) A temperatura máxima no lado superior é 40.1 °C / 104 F, em comparação com a média de 35.4 °C / 96 F , variando de 19.6 a 60 °C para a classe Convertible.
(±) A parte inferior aquece até um máximo de 41 °C / 106 F, em comparação com a média de 36.9 °C / 98 F
(+) Em uso inativo, a temperatura média para o lado superior é 28.7 °C / 84 F, em comparação com a média do dispositivo de 30.3 °C / ### class_avg_f### F.
(±) Os apoios para as mãos e o touchpad podem ficar muito quentes ao toque, com um máximo de 39.4 °C / 102.9 F.
(-) A temperatura média da área do apoio para as mãos de dispositivos semelhantes foi 28 °C / 82.4 F (-11.4 °C / -20.5 F).
Microsoft Surface Pro 7 análise de áudio
(-) | alto-falantes não muito altos (###valor### dB)
Graves 100 - 315Hz
(±) | graves reduzidos - em média 10.2% menor que a mediana
(±) | a linearidade dos graves é média (12.1% delta para a frequência anterior)
Médios 400 - 2.000 Hz
(+) | médios equilibrados - apenas 4.6% longe da mediana
(±) | a linearidade dos médios é média (10.2% delta para frequência anterior)
Altos 2 - 16 kHz
(+) | agudos equilibrados - apenas 3.1% longe da mediana
(+) | os máximos são lineares (6.8% delta da frequência anterior)
Geral 100 - 16.000 Hz
(±) | a linearidade do som geral é média (21.5% diferença em relação à mediana)
Comparado com a mesma classe
» 58% de todos os dispositivos testados nesta classe foram melhores, 11% semelhantes, 32% piores
» O melhor teve um delta de 6%, a média foi 20%, o pior foi 57%
Comparado com todos os dispositivos testados
» 61% de todos os dispositivos testados foram melhores, 7% semelhantes, 33% piores
» O melhor teve um delta de 4%, a média foi 24%, o pior foi 134%
Apple MacBook 12 (Early 2016) 1.1 GHz análise de áudio
(+) | os alto-falantes podem tocar relativamente alto (###valor### dB)
Graves 100 - 315Hz
(±) | graves reduzidos - em média 11.3% menor que a mediana
(±) | a linearidade dos graves é média (14.2% delta para a frequência anterior)
Médios 400 - 2.000 Hz
(+) | médios equilibrados - apenas 2.4% longe da mediana
(+) | médios são lineares (5.5% delta para frequência anterior)
Altos 2 - 16 kHz
(+) | agudos equilibrados - apenas 2% longe da mediana
(+) | os máximos são lineares (4.5% delta da frequência anterior)
Geral 100 - 16.000 Hz
(+) | o som geral é linear (10.2% diferença em relação à mediana)
Comparado com a mesma classe
» 7% de todos os dispositivos testados nesta classe foram melhores, 2% semelhantes, 91% piores
» O melhor teve um delta de 5%, a média foi 18%, o pior foi 53%
Comparado com todos os dispositivos testados
» 5% de todos os dispositivos testados foram melhores, 1% semelhantes, 94% piores
» O melhor teve um delta de 4%, a média foi 24%, o pior foi 134%
| desligado | |
| Ocioso | |
| Carga |
|
Key:
min: | |
| Microsoft Surface Pro 7 i7-1065G7, Iris Plus Graphics G7 (Ice Lake 64 EU), Toshiba KBG40ZNS256G NVMe, IPS, 2736x1824, 12.3" | Microsoft Surface Pro 6, Core i7, 512 GB i7-8650U, UHD Graphics 620, Toshiba KBG30ZPZ512G, IPS, 2736x1824, 12.3" | Microsoft Surface Pro (2017) i7 i7-7660U, Iris Plus Graphics 640, Samsung PM971 KUS040202M, IPS, 2736x1824, 12.3" | Microsoft Surface Pro 7 Core i5-1035G4 i5-1035G4, Iris Plus Graphics G4 (Ice Lake 48 EU), Toshiba BG4 KBG40ZPZ256G, IPS, 2736x1824, 12.3" | Dell XPS 13 7390 2-in-1 Core i7 i7-1065G7, Iris Plus Graphics G7 (Ice Lake 64 EU), Toshiba BG4 KBG40ZPZ512G, IPS, 1920x1200, 13.4" | Média Intel Iris Plus Graphics G7 (Ice Lake 64 EU) | Média da turma Convertible | |
|---|---|---|---|---|---|---|---|
| Power Consumption | 17% | 0% | -1% | 26% | 12% | 4% | |
| Idle Minimum * (Watt) | 4.4 | 3.2 27% | 4.2 5% | 4.5 -2% | 2.6 41% | 3.91 ? 11% | 4.29 ? 2% |
| Idle Average * (Watt) | 8.7 | 8.7 -0% | 10.1 -16% | 9.2 -6% | 5.3 39% | 7.33 ? 16% | 7.08 ? 19% |
| Idle Maximum * (Watt) | 9.6 | 10.4 -8% | 14 -46% | 9.6 -0% | 7 27% | 9.16 ? 5% | 8.68 ? 10% |
| Load Average * (Watt) | 44 | 29.2 34% | 37.4 15% | 42 5% | 43.1 2% | 39.2 ? 11% | 44 ? -0% |
| Load Maximum * (Watt) | 61 | 40.8 33% | 34 44% | 63.5 -4% | 49 20% | 49.8 ? 18% | 67.3 ? -10% |
| Witcher 3 ultra * (Watt) | 38.1 | 43.1 |
* ... menor é melhor
| Microsoft Surface Pro 7 i7-1065G7, Iris Plus Graphics G7 (Ice Lake 64 EU), 45 Wh | Microsoft Surface Pro 7 Core i5-1035G4 i5-1035G4, Iris Plus Graphics G4 (Ice Lake 48 EU), 45 Wh | Microsoft Surface Pro (2017) i7 i7-7660U, Iris Plus Graphics 640, 45 Wh | Dell XPS 13 7390 2-in-1 Core i7 i7-1065G7, Iris Plus Graphics G7 (Ice Lake 64 EU), 51 Wh | Média da turma Convertible | |
|---|---|---|---|---|---|
| Duração da bateria | 32% | 12% | -8% | 71% | |
| Reader / Idle (h) | 11.5 | 22.3 94% | 27.7 ? 141% | ||
| H.264 (h) | 6.7 | 10.2 52% | 15.3 ? 128% | ||
| WiFi v1.3 (h) | 9.8 | 10 2% | 8.2 -16% | 9 -8% | 11.9 ? 21% |
| Load (h) | 1.9 | 1.9 0% | 1.9 0% | 1.779 ? -6% | |
| Witcher 3 ultra (h) | 1.9 |
Pro
Contra
Após nossa extensa análise inicial do SKU i5 do Breve Análise do Microsoft Surface Pro 7: (Core i5, 8 GB) agora também pudemos analisar o modelo mais poderoso e percebemos rapidamente que o modelo mais rápido não é muito diferente do irmão mais acessível. Especialmente ao analisar os recursos sustentados de carga de trabalho da CPU. O desempenho da GPU, por outro lado, foi um grande sucesso, pois melhorou significativamente. Além disso, nem as baixas temperaturas nem a duração da bateria precisavam ser sacrificadas pelo ganho extra.
A questão é: vale a pena?
O Surface Pro 7 equipado com Intel Core i7 foi projetado para usuários avançados que precisam de um pouco mais de desempenho, especialmente quando se trata de potência gráfica.
Como pudemos provar em nossos benchmarks de sistema, não é o desempenho da CPU que diferencia o SKU i7. O desempenho gráfico é onde realmente brilha e o custo extra gera o retorno mais óbvio do investimento. Para mais detalhes sobre a série Surface, consulte nossa análise anterior.
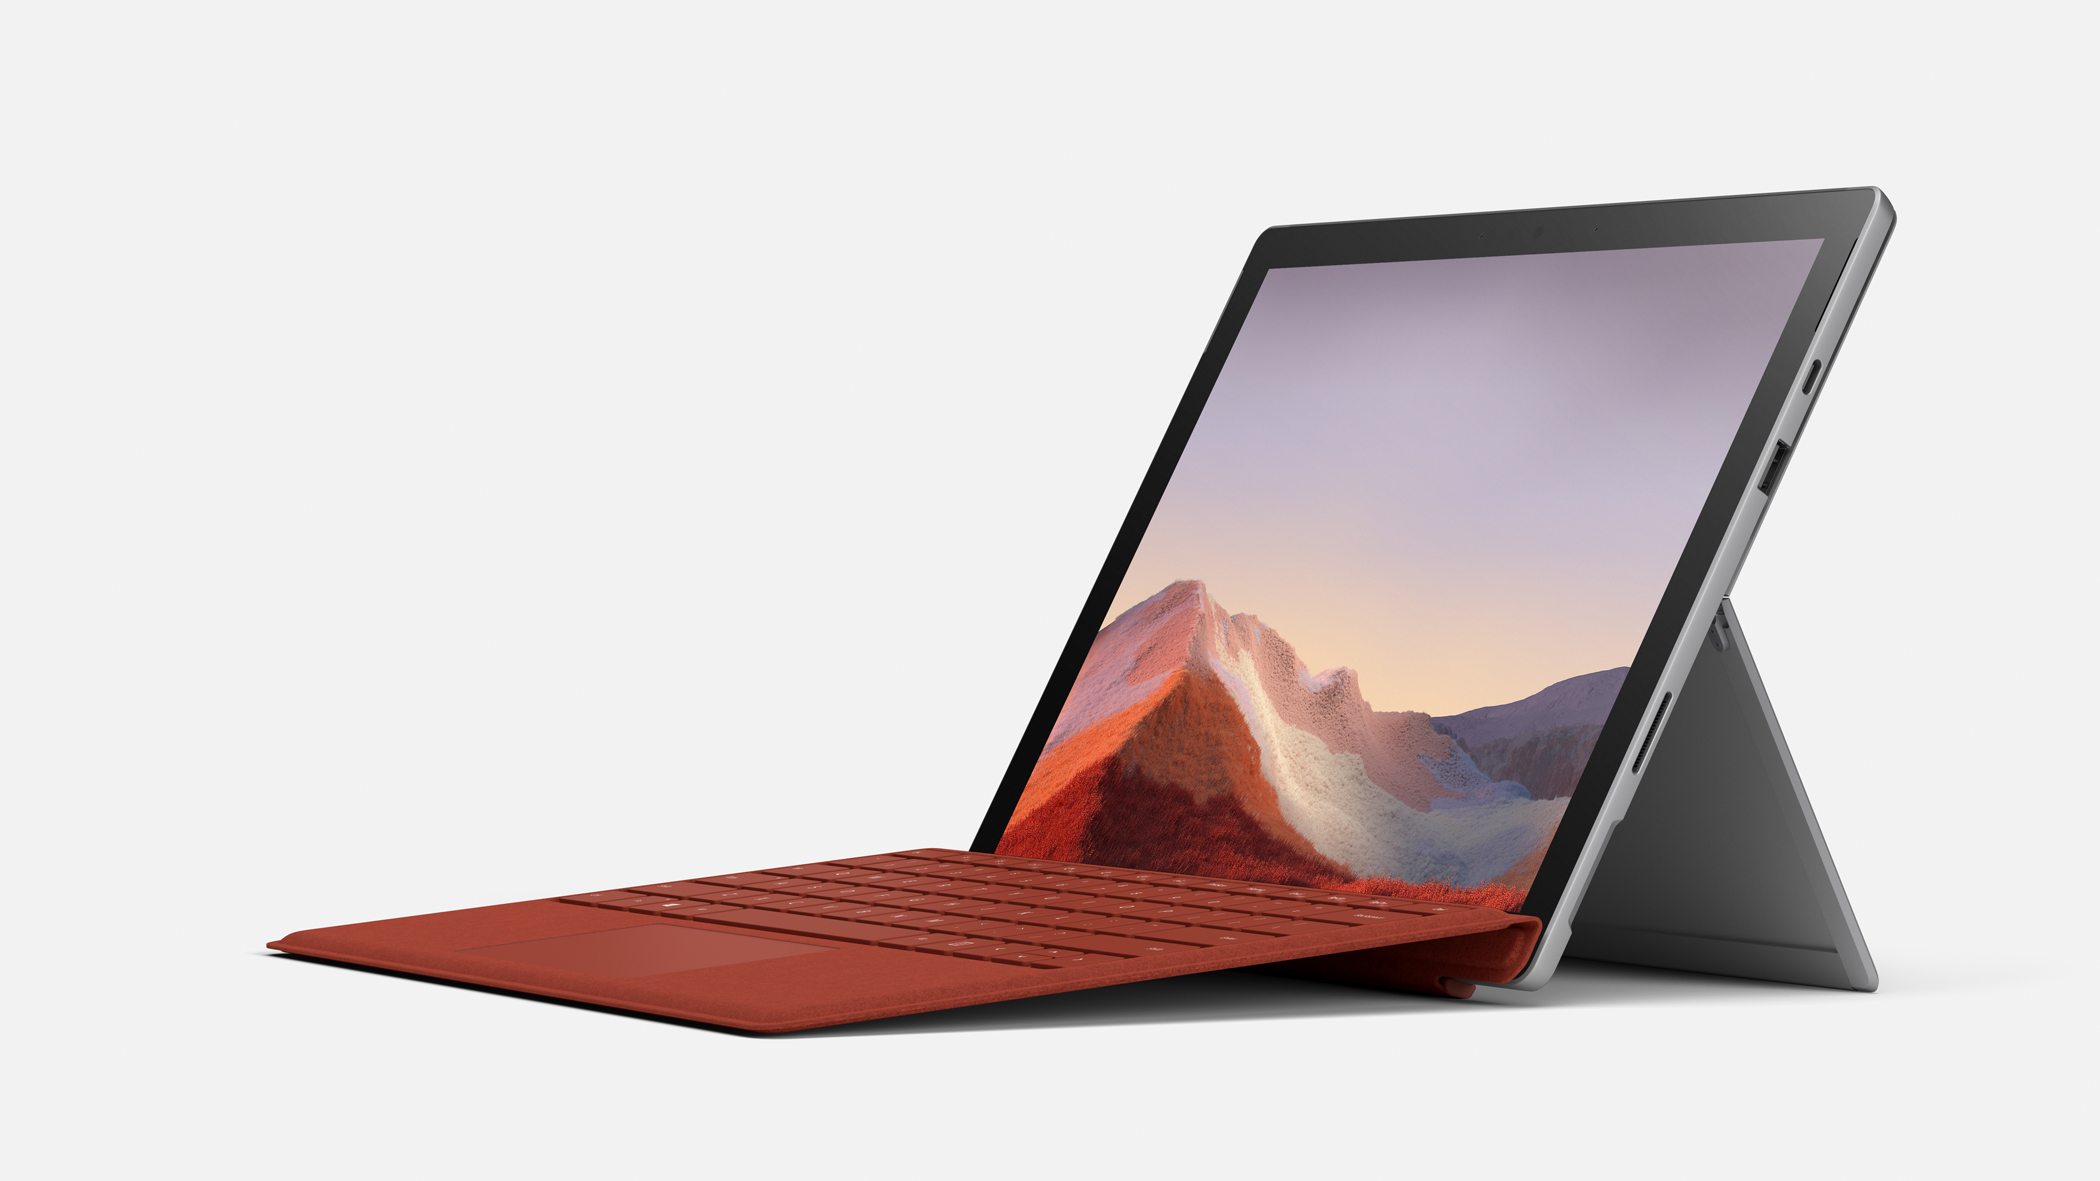
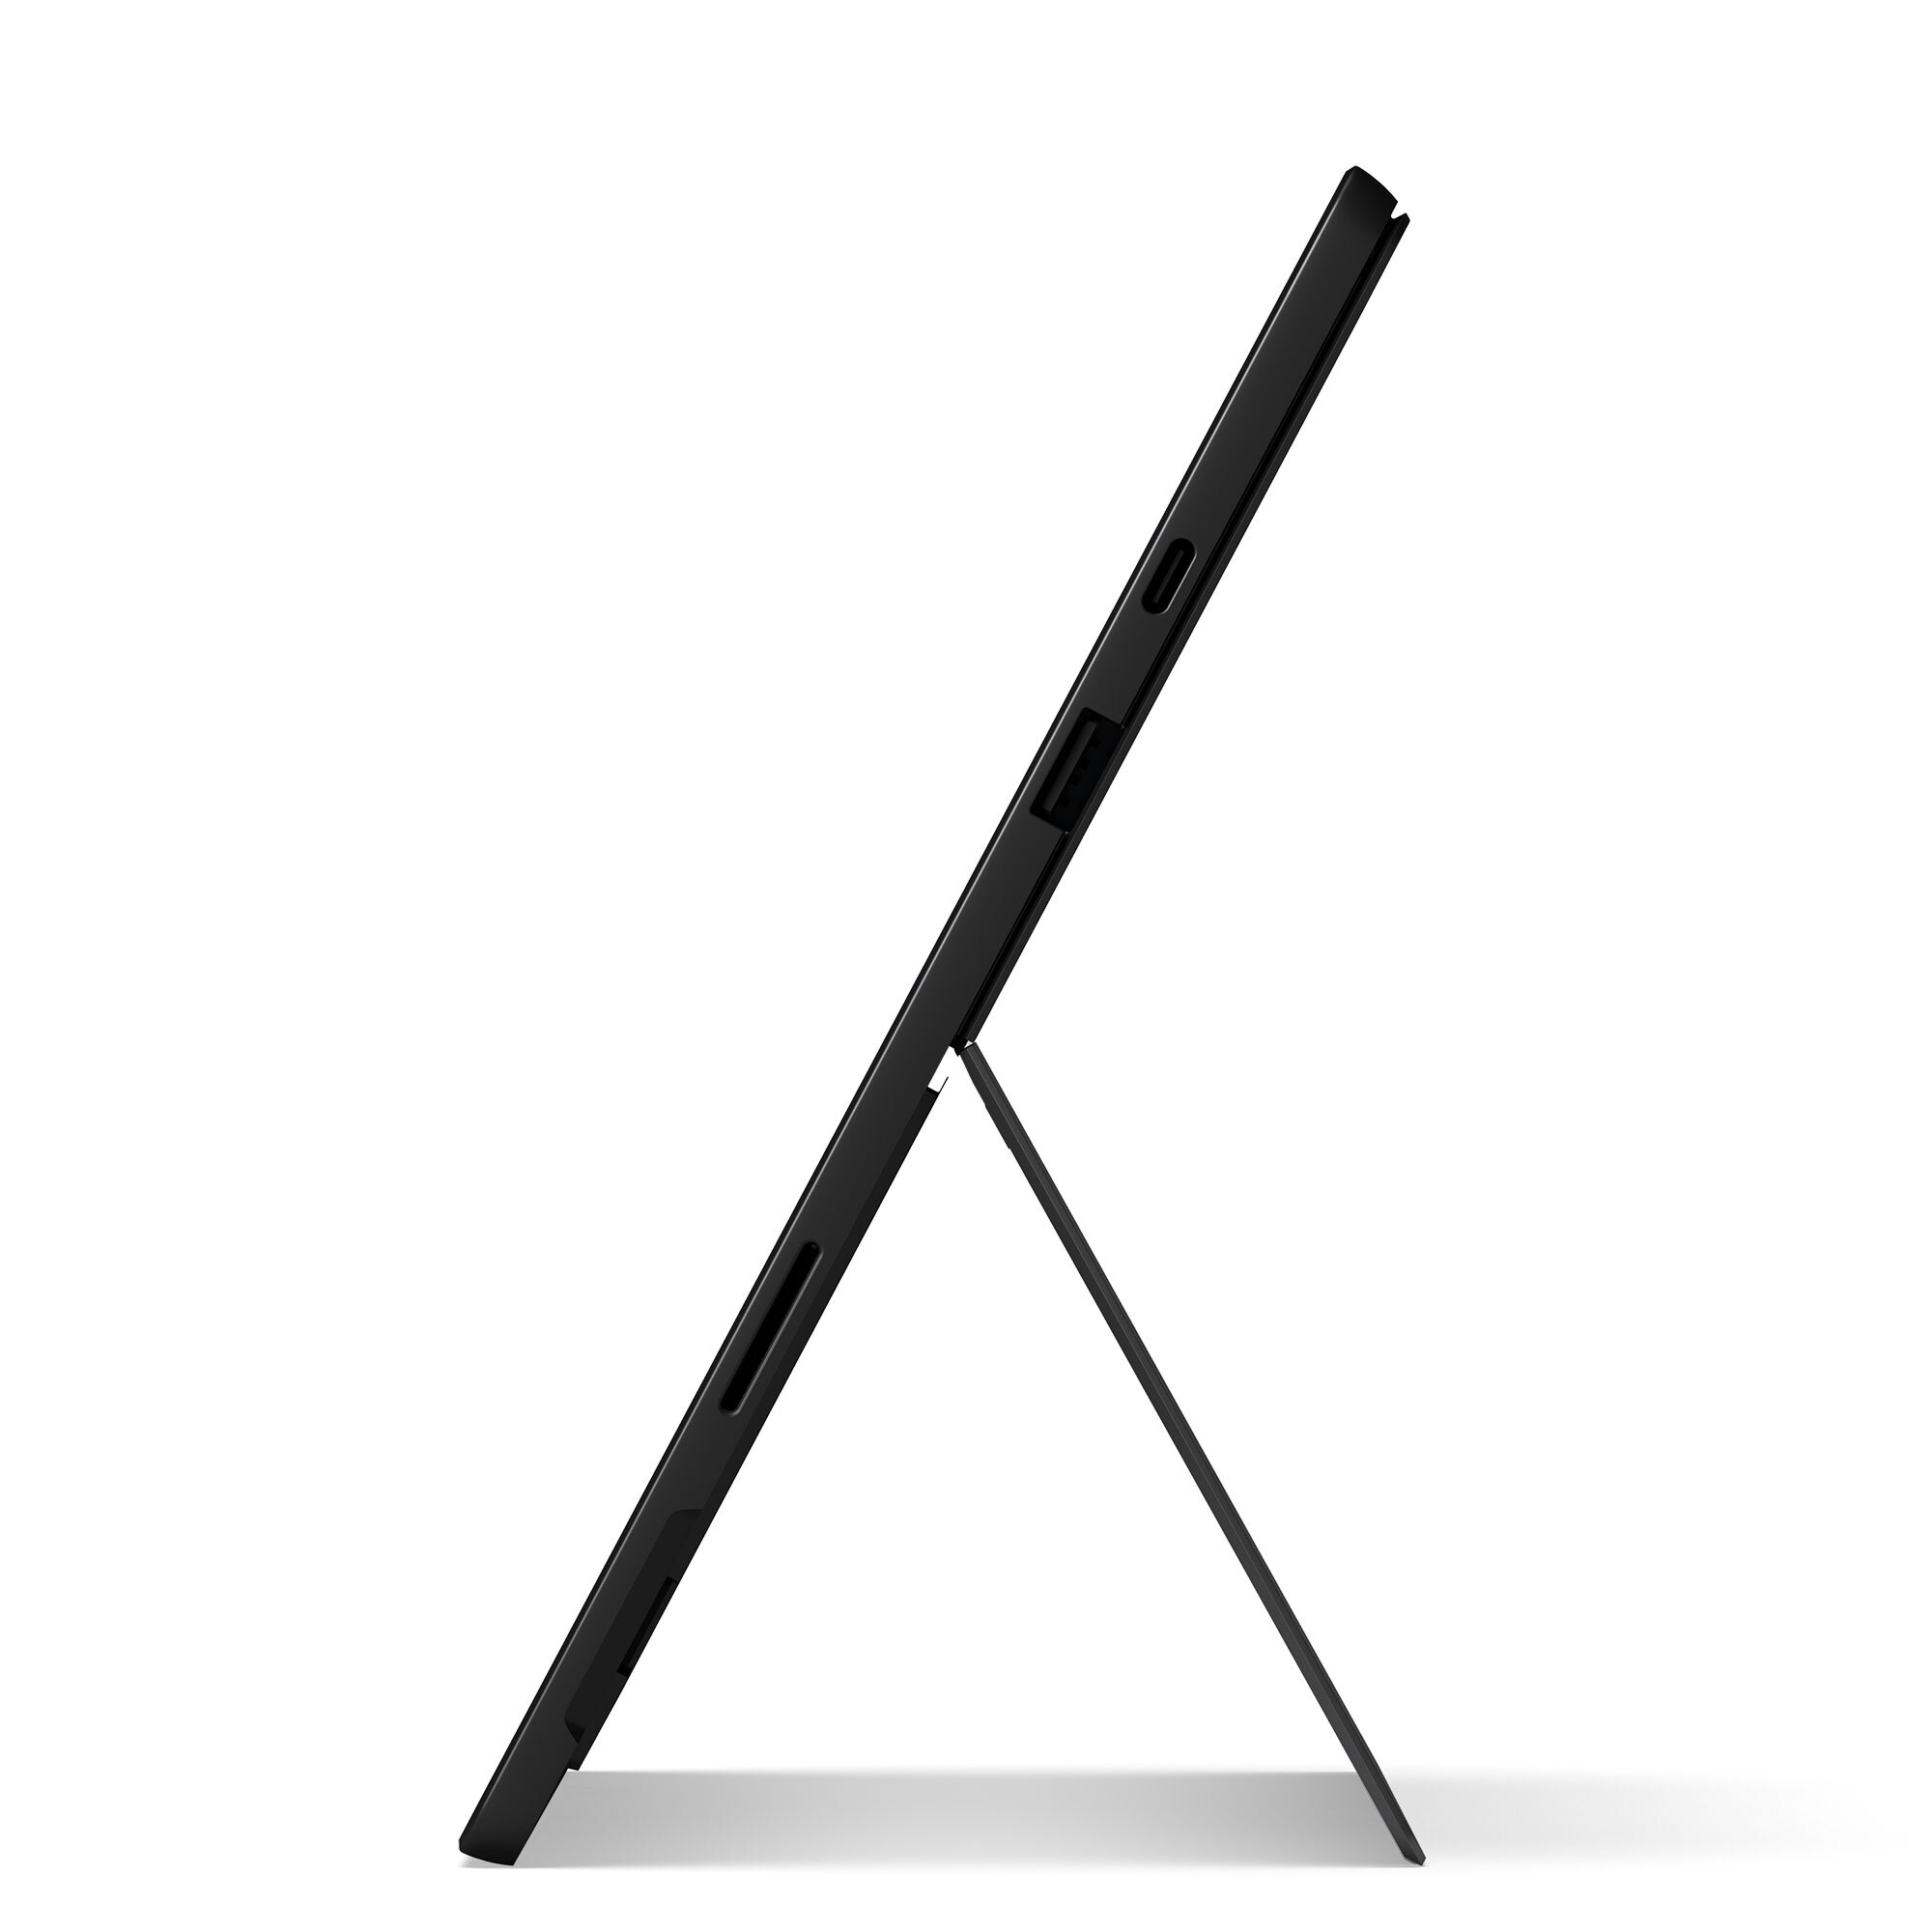
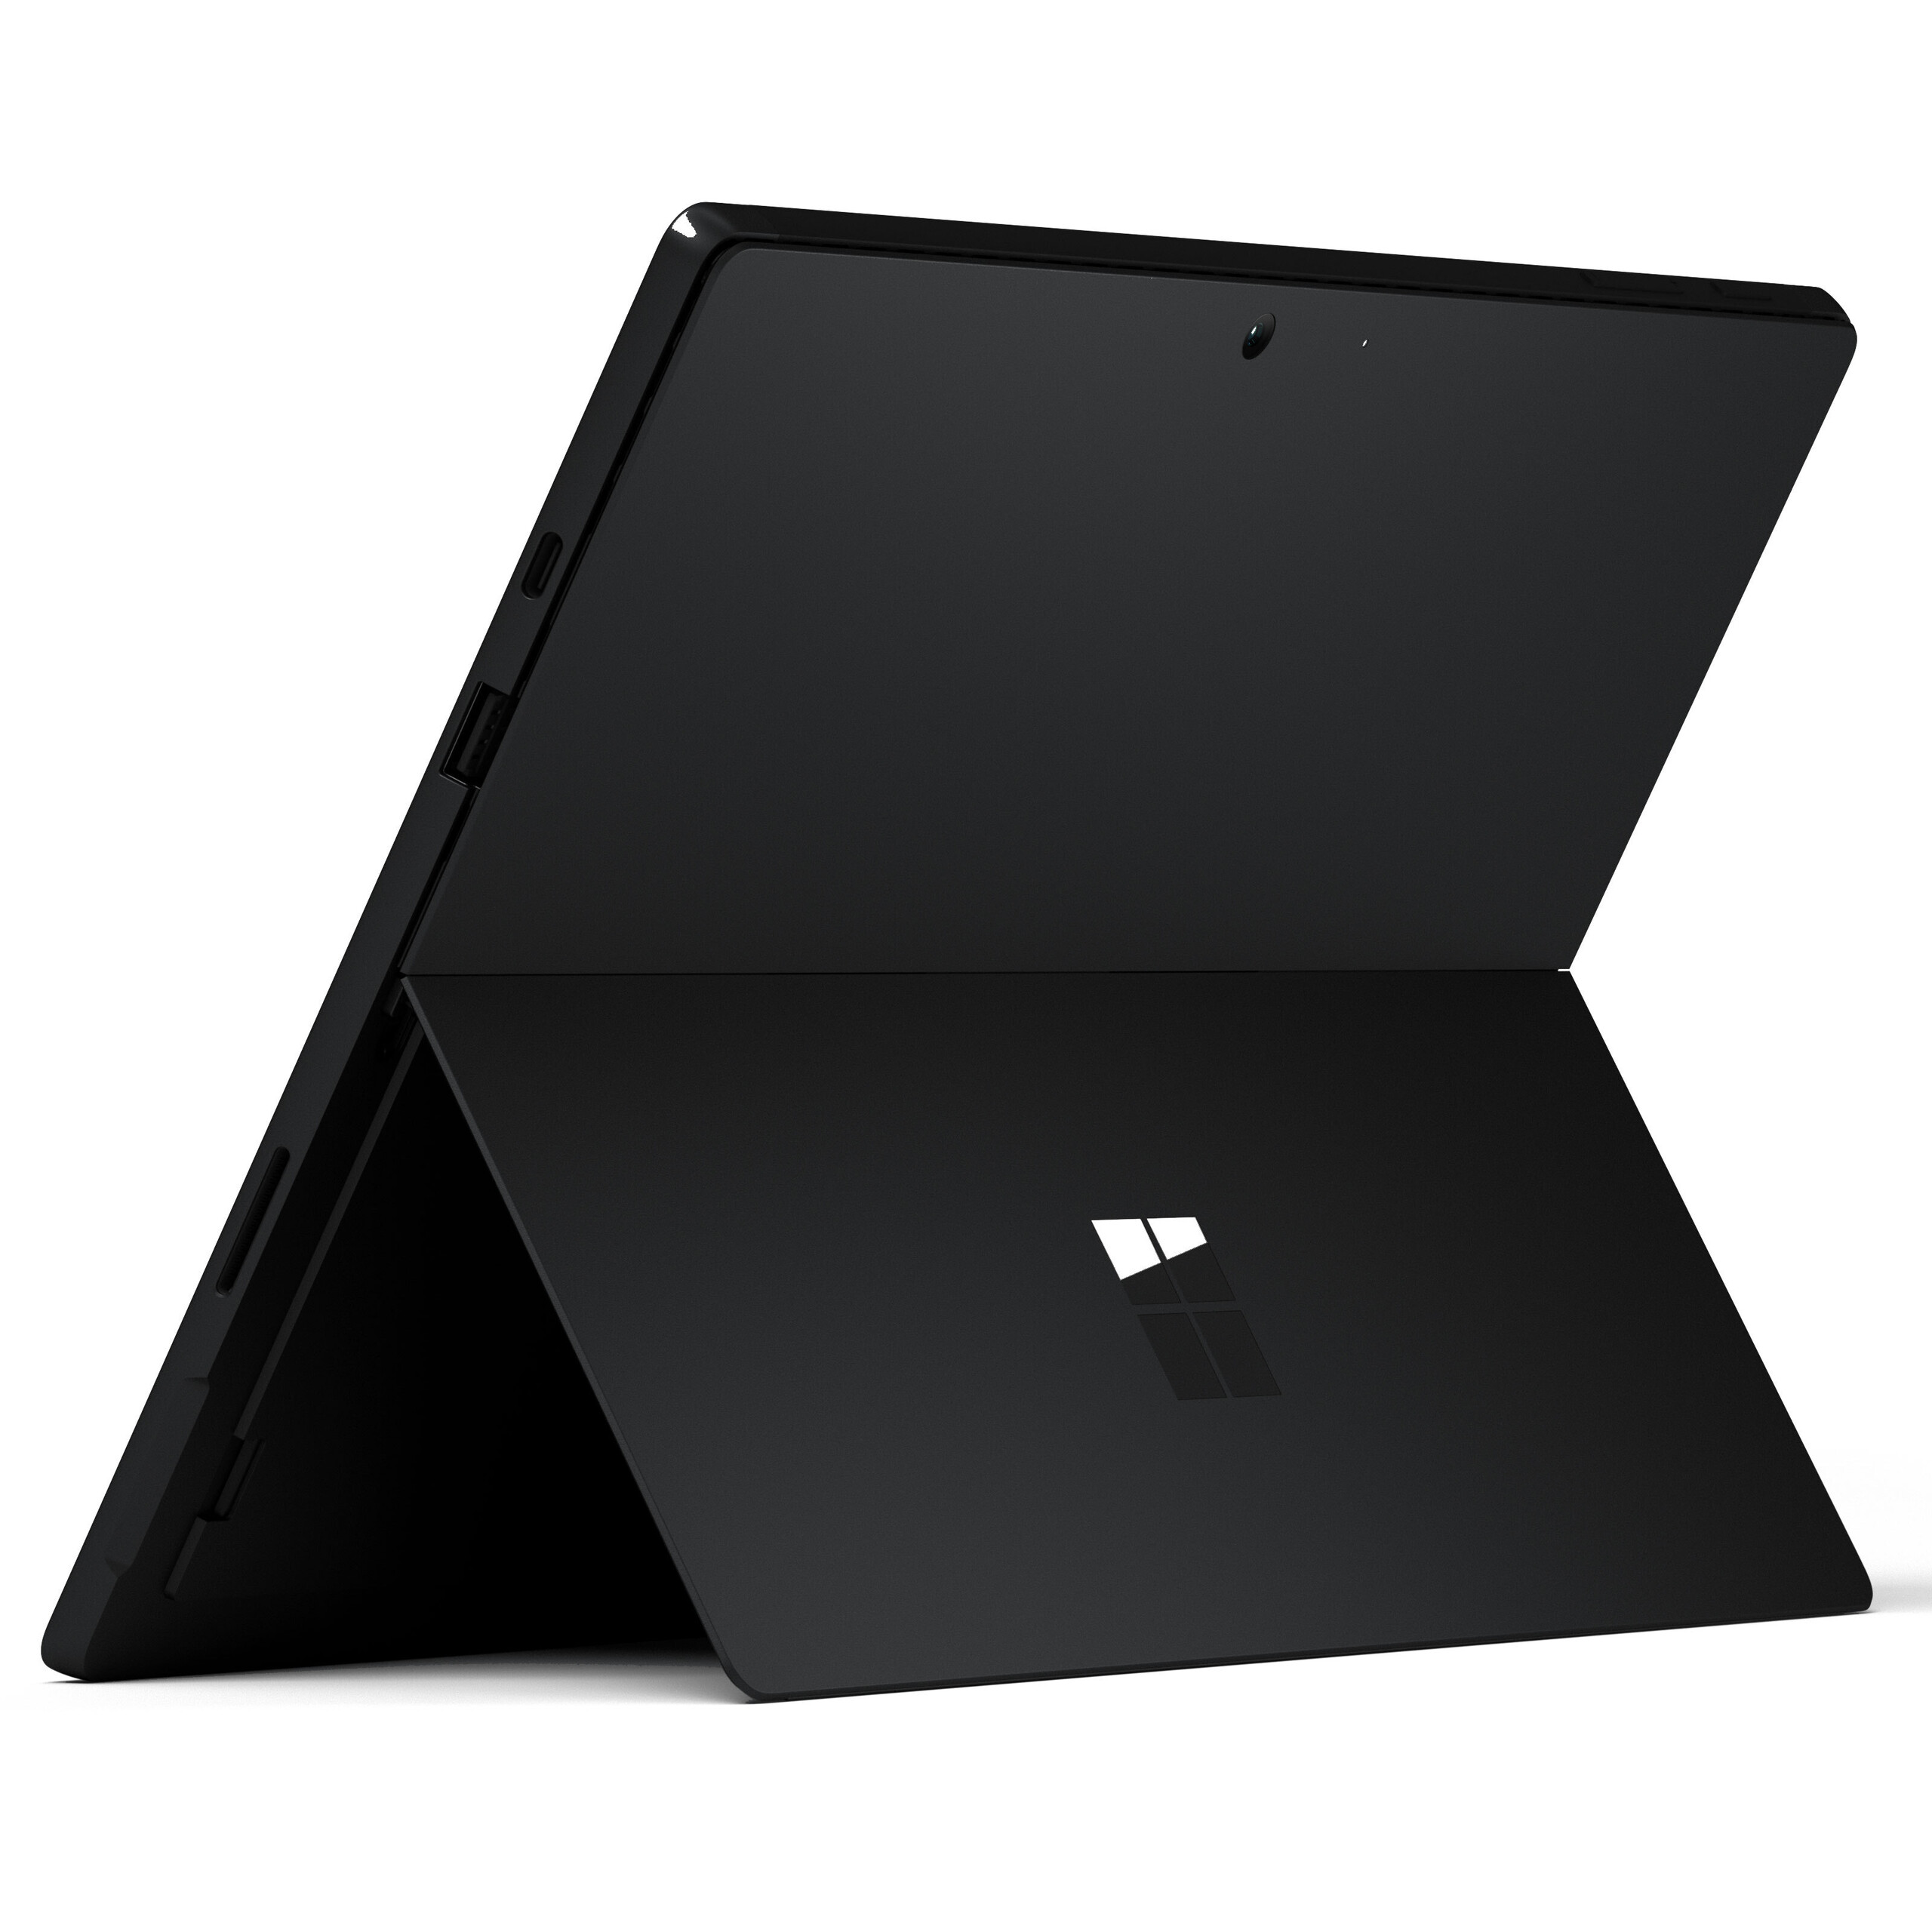
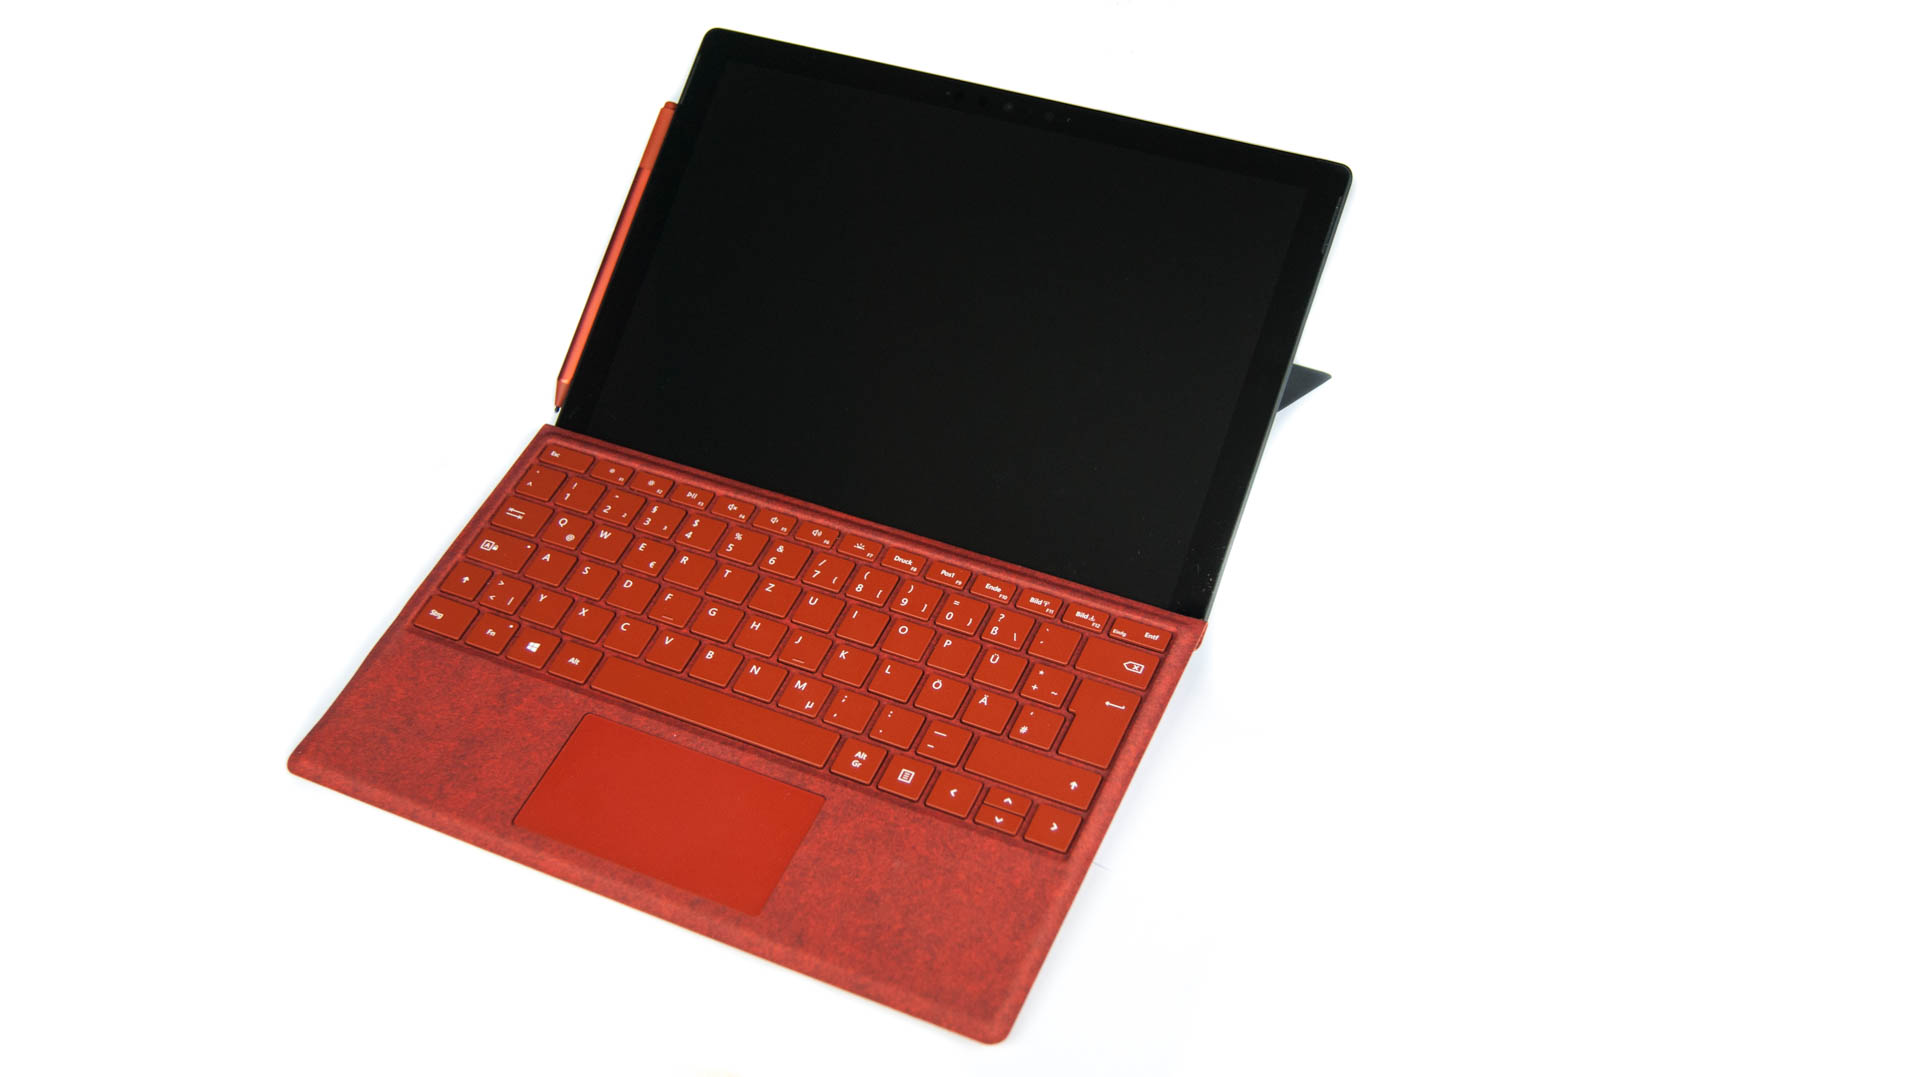
Microsoft Surface Pro 7
- 02/20/2020 v7 (old)
Nino Ricchizzi
Price comparison
