Breve Análise do Portátil Microsoft Surface (i7-7660U)
| |||||||||||||||||||||||||
iluminação: 89 %
iluminação com acumulador: 398 cd/m²
Contraste: 948:1 (Preto: 0.42 cd/m²)
| Microsoft Surface Laptop i7 ID: MEI96A2, Name: Panasonic VVX14T092N00, , 2256x1504, 13.5" | Microsoft Surface Laptop i5 ID: MEI96A2, Name: Panasonic VVX14T092N00, , 2256x1504, 13.5" | Microsoft Surface Pro (2017) i7 LG Display LP123WQ112604, , 2736x1824, 12.3" | Apple MacBook Pro 13 2017 Touchbar i5 APPA034, , 2560x1600, 13.3" | Dell XPS 13 9360 FHD i7 Iris SHP1449, , 1920x1080, 13.3" | |
|---|---|---|---|---|---|
| Display | |||||
| Display P3 Coverage (%) | 67.8 | 66.6 | 98.6 | 51.6 | |
| sRGB Coverage (%) | 94.3 | 96.5 | 100 | 77.4 | |
| AdobeRGB 1998 Coverage (%) | 69.5 | 67.8 | 86.5 | 53.3 | |
| Response Times | |||||
| Response Time Grey 50% / Grey 80% * (ms) | 50.8 ? | 37 ? | 48 ? | 41.2 ? | |
| Response Time Black / White * (ms) | 37.2 ? | 25 ? | 33.6 ? | 30 ? | |
| PWM Frequency (Hz) | 22130 ? | 119000 ? | 19530 ? | ||
| Screen | 4% | 16% | 15% | 43% | |
| Brightness middle (cd/m²) | 398 | 384.2 -3% | 482 21% | 551 38% | 461 16% |
| Brightness (cd/m²) | 393 | 378 -4% | 466 19% | 514 31% | 418 6% |
| Brightness Distribution (%) | 89 | 90 1% | 92 3% | 88 -1% | 85 -4% |
| Black Level * (cd/m²) | 0.42 | 0.36 14% | 0.395 6% | 0.48 -14% | 0.2 52% |
| Contrast (:1) | 948 | 1067 13% | 1220 29% | 1148 21% | 2305 143% |
| Colorchecker dE 2000 * | 1.8 | 4 | 0.8 | 5.4 | |
| Colorchecker dE 2000 max. * | 4.2 | 7.2 | 1.4 | 12.2 | |
| Greyscale dE 2000 * | 1.2 | 5.7 | 1 | 5.4 | |
| Gamma | 2.21 100% | 2.28 96% | 2.16 102% | 2.15 102% | |
| CCT | 6708 97% | 7950 82% | 6672 97% | 7258 90% | |
| Color Space (Percent of AdobeRGB 1998) (%) | 63.7 | 62 | 48.6 | ||
| Color Space (Percent of sRGB) (%) | 94.2 | 96 | 76.9 | ||
| Média Total (Programa/Configurações) | 4% /
4% | 16% /
16% | 15% /
15% | 43% /
43% |
* ... menor é melhor
| PCMark 8 Home Score Accelerated v2 | 4182 pontos | |
| PCMark 8 Creative Score Accelerated v2 | 5509 pontos | |
| PCMark 8 Work Score Accelerated v2 | 4700 pontos | |
| PCMark 10 Score | 3812 pontos | |
Ajuda | ||
| Microsoft Surface Laptop i7 Samsung PM971 KUS040202M | Microsoft Surface Laptop i5 Toshiba THNSN0128GTYA | Microsoft Surface Pro (2017) i7 Samsung PM971 KUS040202M | Lenovo ThinkPad P51s 20HB000SGE Samsung SSD PM961 1TB M.2 PCIe 3.0 x4 NVMe (MZVLW1T0) | Dell XPS 13 9360 FHD i7 Iris Toshiba XG4 NVMe (THNSN5512GPUK) | |
|---|---|---|---|---|---|
| CrystalDiskMark 3.0 | -65% | 5% | 47% | 32% | |
| Read Seq (MB/s) | 1021 | 425.6 -58% | 1308 28% | 1189 16% | 1314 29% |
| Write Seq (MB/s) | 973 | 128.2 -87% | 961 -1% | 1138 17% | 617 -37% |
| Read 512 (MB/s) | 253 | 278.5 10% | 227.5 -10% | 782 209% | 1058 318% |
| Write 512 (MB/s) | 778 | 126.7 -84% | 792 2% | 959 23% | 502 -35% |
| Read 4k (MB/s) | 53 | 22.15 -58% | 53.6 1% | 54.8 3% | 37.31 -30% |
| Write 4k (MB/s) | 130.4 | 40.45 -69% | 136.3 5% | 161.4 24% | 133.6 2% |
| Read 4k QD32 (MB/s) | 453.3 | 77.8 -83% | 485.6 7% | 642 42% | 425.1 -6% |
| Write 4k QD32 (MB/s) | 389.7 | 41.18 -89% | 421.5 8% | 549 41% | 431.3 11% |

| 3DMark | |
| 1280x720 Cloud Gate Standard Graphics | |
| Apple MacBook Pro 13 2017 | |
| Microsoft Surface Pro (2017) i7 | |
| Dell XPS 13 9360 FHD i7 Iris | |
| Microsoft Surface Laptop i7 | |
| Microsoft Surface Laptop i5 | |
| 1920x1080 Fire Strike Graphics | |
| Apple MacBook Pro 13 2017 | |
| Microsoft Surface Pro (2017) i7 | |
| Dell XPS 13 9360 FHD i7 Iris | |
| Microsoft Surface Laptop i7 | |
| Microsoft Surface Laptop i5 | |
| 3DMark 06 Standard Score | 13164 pontos | |
| 3DMark 11 Performance | 2561 pontos | |
| 3DMark Cloud Gate Standard Score | 7558 pontos | |
| 3DMark Fire Strike Score | 1236 pontos | |
| 3DMark Time Spy Score | 476 pontos | |
Ajuda | ||
| Overwatch | |
| 1920x1080 Epic (Render Scale 100 %) AA:SM AF:16x | |
| Apple MacBook Pro 13 2017 | |
| 1920x1080 High (Render Scale 100 %) AA:SM AF:4x | |
| Apple MacBook Pro 13 2017 | |
| Dell XPS 13 9360 FHD i7 Iris | |
| Microsoft Surface Pro (2017) i7 | |
| 1366x768 Medium (Render Scale 100 %) AA:FX AF:2x | |
| Apple MacBook Pro 13 2017 | |
| Microsoft Surface Pro (2017) i7 | |
| Dell XPS 13 9360 FHD i7 Iris | |
| Microsoft Surface Laptop i7 | |
| 1280x720 Low (Render Scale 100 %) AA:FX AF:1x | |
| Apple MacBook Pro 13 2017 | |
| Microsoft Surface Pro (2017) i7 | |
| Dell XPS 13 9360 FHD i7 Iris | |
| Microsoft Surface Laptop i7 | |
| The Evil Within 2 - 1280x720 Low Preset AA:T | |
| Microsoft Surface Laptop i7 | |
| Middle-earth: Shadow of War - 1280x720 Lowest Preset | |
| Microsoft Surface Laptop i7 | |
| FIFA 18 | |
| 1920x1080 Medium Preset | |
| Microsoft Surface Laptop i7 | |
| 1280x720 Low Preset | |
| Microsoft Surface Laptop i7 | |
| F1 2017 | |
| 1920x1080 Medium Preset AF:4x | |
| Dell XPS 13 9360 FHD i7 Iris | |
| Microsoft Surface Laptop i7 | |
| 1280x720 Ultra Low Preset | |
| Microsoft Surface Laptop i7 | |
| Dell XPS 13 9360 FHD i7 Iris | |
| Team Fortress 2 | |
| 1920x1080 maximum AA:8x MS AF:16x | |
| Microsoft Surface Laptop i7 | |
| 1920x1080 high AF:16x | |
| Microsoft Surface Laptop i7 | |
| 1366x768 medium AF:4x | |
| Microsoft Surface Laptop i7 | |
| Playerunknown's Battlegrounds (PUBG) - 1280x720 Very Low Preset | |
| Microsoft Surface Laptop i7 | |
| Rocket League | |
| 1920x1080 High Quality AA:High FX | |
| Apple MacBook Pro 13 2017 | |
| Microsoft Surface Pro (2017) i7 | |
| Dell XPS 13 9360 FHD i7 Iris | |
| Microsoft Surface Laptop i7 | |
| 1920x1080 Quality AA:Medium FX | |
| Apple MacBook Pro 13 2017 | |
| Microsoft Surface Pro (2017) i7 | |
| Dell XPS 13 9360 FHD i7 Iris | |
| Microsoft Surface Laptop i7 | |
| 1280x720 Performance | |
| Microsoft Surface Pro (2017) i7 | |
| Apple MacBook Pro 13 2017 | |
| Microsoft Surface Laptop i7 | |
| Dell XPS 13 9360 FHD i7 Iris | |
| Titanfall 2 | |
| 1920x1080 High / Enabled AA:TS AF:8x | |
| Apple MacBook Pro 13 2017 | |
| 1366x768 Medium / Disabled AF:4x | |
| Apple MacBook Pro 13 2017 | |
| 1280x720 Low / Disabled AF:Trilinear | |
| Microsoft Surface Laptop i7 | |
| Apple MacBook Pro 13 2017 | |
| Dota 2 Reborn | |
| 1920x1080 ultra (3/3) best looking | |
| Microsoft Surface Laptop i7 | |
| Microsoft Surface Pro (2017) i7 | |
| 1920x1080 high (2/3) | |
| Microsoft Surface Pro (2017) i7 | |
| Microsoft Surface Laptop i7 | |
| 1366x768 med (1/3) | |
| Microsoft Surface Pro (2017) i7 | |
| Microsoft Surface Laptop i7 | |
| 1280x720 min (0/3) fastest | |
| Microsoft Surface Pro (2017) i7 | |
| Microsoft Surface Laptop i7 | |
| Battlefield 1 | |
| 1920x1080 High Preset AA:T | |
| Apple MacBook Pro 13 2017 | |
| Microsoft Surface Pro (2017) i7 | |
| 1366x768 Medium Preset AA:FX | |
| Apple MacBook Pro 13 2017 | |
| Microsoft Surface Pro (2017) i7 | |
| 1280x720 Low Preset | |
| Apple MacBook Pro 13 2017 | |
| Microsoft Surface Laptop i7 | |
| Microsoft Surface Pro (2017) i7 | |
| The Witcher 3 | |
| 1920x1080 Ultra Graphics & Postprocessing (HBAO+) | |
| Apple MacBook Pro 13 2017 | |
| 1366x768 Medium Graphics & Postprocessing | |
| Apple MacBook Pro 13 2017 | |
| 1024x768 Low Graphics & Postprocessing | |
| Microsoft Surface Pro (2017) i7 | |
| Apple MacBook Pro 13 2017 | |
| Dell XPS 13 9360 FHD i7 Iris | |
| Microsoft Surface Laptop i7 | |
| Sims 4 | |
| 1920x1080 Ultra Preset | |
| Microsoft Surface Pro (2017) i7 | |
| Microsoft Surface Laptop i7 | |
| 1920x1080 High Preset | |
| Microsoft Surface Laptop i7 | |
| Diablo III - 1920x1080 High AA:on | |
| Microsoft Surface Laptop i7 | |
| World of Warcraft - 1280x1024 high | |
| Microsoft Surface Laptop i7 | |
| baixo | média | alto | ultra | |
|---|---|---|---|---|
| World of Warcraft (2005) | 28.5 | |||
| Diablo III (2012) | 35.2 | |||
| Sims 4 (2014) | 28.6 | 20.2 | ||
| The Witcher 3 (2015) | 16.4 | |||
| Dota 2 Reborn (2015) | 68 | 55 | 27.6 | 23 |
| Overwatch (2016) | 53.6 | 24.1 | ||
| Battlefield 1 (2016) | 29.2 | |||
| Titanfall 2 (2016) | 45 | |||
| Rocket League (2017) | 96 | 33.9 | 24.9 | |
| Team Fortress 2 (2017) | 99 | 48 | 31.8 | |
| Playerunknown's Battlegrounds (PUBG) (2017) | 22.9 | |||
| F1 2017 (2017) | 38 | 15 | ||
| FIFA 18 (2017) | 69 (some slowdowns in game) | 38 (some slowdowns in game) | ||
| Middle-earth: Shadow of War (2017) | 28 | |||
| The Evil Within 2 (2017) | 13.8 |
Barulho
| Ocioso |
| 30.9 / 30.9 / 30.9 dB |
| Carga |
| 40.2 / 40.2 dB |
 | ||
30 dB silencioso 40 dB(A) audível 50 dB(A) ruidosamente alto |
||
min: | ||
(+) A temperatura máxima no lado superior é 37 °C / 99 F, em comparação com a média de 35.9 °C / 97 F , variando de 21.4 a 59 °C para a classe Subnotebook.
(±) A parte inferior aquece até um máximo de 40 °C / 104 F, em comparação com a média de 39.2 °C / 103 F
(+) Em uso inativo, a temperatura média para o lado superior é 25.4 °C / 78 F, em comparação com a média do dispositivo de 30.8 °C / ### class_avg_f### F.
(+) Os apoios para as mãos e o touchpad são mais frios que a temperatura da pele, com um máximo de 30 °C / 86 F e, portanto, são frios ao toque.
(±) A temperatura média da área do apoio para as mãos de dispositivos semelhantes foi 28.2 °C / 82.8 F (-1.8 °C / -3.2 F).
Microsoft Surface Laptop i7 análise de áudio
(±) | o volume do alto-falante é médio, mas bom (###valor### dB)
Graves 100 - 315Hz
(±) | graves reduzidos - em média 7.7% menor que a mediana
(-) | graves não são lineares (15.9% delta para frequência anterior)
Médios 400 - 2.000 Hz
(+) | médios equilibrados - apenas 3.8% longe da mediana
(+) | médios são lineares (4.6% delta para frequência anterior)
Altos 2 - 16 kHz
(+) | agudos equilibrados - apenas 1.6% longe da mediana
(+) | os máximos são lineares (4.4% delta da frequência anterior)
Geral 100 - 16.000 Hz
(+) | o som geral é linear (11.9% diferença em relação à mediana)
Comparado com a mesma classe
» 13% de todos os dispositivos testados nesta classe foram melhores, 5% semelhantes, 82% piores
» O melhor teve um delta de 5%, a média foi 18%, o pior foi 53%
Comparado com todos os dispositivos testados
» 9% de todos os dispositivos testados foram melhores, 2% semelhantes, 89% piores
» O melhor teve um delta de 4%, a média foi 24%, o pior foi 134%
Microsoft Surface Laptop i5 análise de áudio
(-) | alto-falantes não muito altos (###valor### dB)
Graves 100 - 315Hz
(±) | graves reduzidos - em média 7.1% menor que a mediana
(±) | a linearidade dos graves é média (11.8% delta para a frequência anterior)
Médios 400 - 2.000 Hz
(+) | médios equilibrados - apenas 4.1% longe da mediana
(+) | médios são lineares (5.6% delta para frequência anterior)
Altos 2 - 16 kHz
(+) | agudos equilibrados - apenas 1.2% longe da mediana
(+) | os máximos são lineares (4.7% delta da frequência anterior)
Geral 100 - 16.000 Hz
(±) | a linearidade do som geral é média (15.6% diferença em relação à mediana)
Comparado com a mesma classe
» 36% de todos os dispositivos testados nesta classe foram melhores, 5% semelhantes, 59% piores
» O melhor teve um delta de 5%, a média foi 18%, o pior foi 53%
Comparado com todos os dispositivos testados
» 23% de todos os dispositivos testados foram melhores, 5% semelhantes, 72% piores
» O melhor teve um delta de 4%, a média foi 24%, o pior foi 134%
Apple MacBook Pro 13 2017 Touchbar i5 análise de áudio
(+) | os alto-falantes podem tocar relativamente alto (###valor### dB)
Graves 100 - 315Hz
(±) | graves reduzidos - em média 11.5% menor que a mediana
(±) | a linearidade dos graves é média (10.8% delta para a frequência anterior)
Médios 400 - 2.000 Hz
(±) | médios mais altos - em média 5.2% maior que a mediana
(+) | médios são lineares (6.4% delta para frequência anterior)
Altos 2 - 16 kHz
(+) | agudos equilibrados - apenas 2.2% longe da mediana
(+) | os máximos são lineares (5.7% delta da frequência anterior)
Geral 100 - 16.000 Hz
(+) | o som geral é linear (11.9% diferença em relação à mediana)
Comparado com a mesma classe
» 13% de todos os dispositivos testados nesta classe foram melhores, 5% semelhantes, 82% piores
» O melhor teve um delta de 5%, a média foi 18%, o pior foi 53%
Comparado com todos os dispositivos testados
» 9% de todos os dispositivos testados foram melhores, 2% semelhantes, 89% piores
» O melhor teve um delta de 4%, a média foi 24%, o pior foi 134%
| desligado | |
| Ocioso | |
| Carga |
|
Key:
min: | |
| Microsoft Surface Laptop i7 i7-7660U, Iris Plus Graphics 640, Samsung PM971 KUS040202M, IPS, 2256x1504, 13.5" | Microsoft Surface Laptop i5 i5-7200U, HD Graphics 620, Toshiba THNSN0128GTYA, IPS, 2256x1504, 13.5" | Dell XPS 13 9360 FHD i7 Iris i7-7560U, Iris Plus Graphics 640, Toshiba XG4 NVMe (THNSN5512GPUK), IPS, 1920x1080, 13.3" | Microsoft Surface Pro (2017) i7 i7-7660U, Iris Plus Graphics 640, Samsung PM971 KUS040202M, IPS, 2736x1824, 12.3" | Apple MacBook Pro 13 2017 i5-7360U, Iris Plus Graphics 640, Apple SSD AP0128, IPS, 2560x1600, 13.3" | |
|---|---|---|---|---|---|
| Power Consumption | 9% | 6% | -28% | -7% | |
| Idle Minimum * (Watt) | 2.7 | 3.2 -19% | 3.32 -23% | 4.2 -56% | 3.7 -37% |
| Idle Average * (Watt) | 7.6 | 6.5 14% | 5.27 31% | 10.1 -33% | 5.2 32% |
| Idle Maximum * (Watt) | 7.8 | 6.8 13% | 6.32 19% | 14 -79% | 7.6 3% |
| Load Average * (Watt) | 37.5 | 28.2 25% | 32 15% | 37.4 -0% | 41.6 -11% |
| Witcher 3 ultra * (Watt) | 31.7 | 38.1 -20% | |||
| Load Maximum * (Watt) | 41.6 | 36 13% | 45.9 -10% | 34 18% | 50.5 -21% |
* ... menor é melhor
| Microsoft Surface Laptop i7 i7-7660U, Iris Plus Graphics 640, 45 Wh | Microsoft Surface Laptop i5 i5-7200U, HD Graphics 620, 45 Wh | Dell XPS 13 9360 FHD i7 Iris i7-7560U, Iris Plus Graphics 640, 60 Wh | Microsoft Surface Pro (2017) i7 i7-7660U, Iris Plus Graphics 640, 45 Wh | Apple MacBook Pro 13 2017 i5-7360U, Iris Plus Graphics 640, 54.5 Wh | |
|---|---|---|---|---|---|
| Duração da bateria | 22% | 32% | -4% | 2% | |
| H.264 (h) | 12.8 | 15 17% | 10.2 -20% | 11.4 -11% | |
| WiFi v1.3 (h) | 7.6 | 10 32% | 10.9 43% | 8.2 8% | 11.4 50% |
| Load (h) | 1.9 | 2.1 11% | 2.6 37% | 1.9 0% | 1.3 -32% |
| Reader / Idle (h) | 22.5 | 25.4 | |||
| Witcher 3 ultra (h) | 1.9 |
Pro
Contra
Não é fácil para nós tirar uma conclusão definitiva sobre o Microsoft Surface Laptop i7. O Intel Core i7-7660U era e continua sendo uma faca de dois gumes. Por um lado, temos os resultados decepcionantes com o desempenho do Turbo, e parece que a Microsoft não aprendeu nada com os erros do passado, que cometeu com o Surface Pro i7 (2017).
Por causa do afogamento, a maior velocidade de Turbo do Intel Core i7-7660U não pode ser totalmente utilizada sob carga contínua. Em termos de preço, é preciso pagar um de 350 Euros (~$407) pelo i7 sobre o i5-7200U.
Por outro lado, a primeira desvantagem é cancelada; saiba que o i7 não é o único contribuinte para o preço. É preciso também ter em conta o SSD significativamente mais rápido e a GPU Iris Plus Graphics 640, que está integrada ao Intel Core i7-7660U. Este é o momento e o lugar para criticar o lento SSD da Toshiba no modelo i5 e elogiar o veloz SSD Samsung no portátil i7. A mais poderosa Iris Plus Graphics 640 é, em todo sentido, a melhor solução para aplicativos com uso intensivo de gráficos, embora isso não torne o Surface baseado em i7 em um portátil de jogos.
Como é o caso do modelo i5, a variante i7 também não conta com uma porta tipo USB-C e um leitor de cartões SD, mesmo que essas coisas não sejam críticas para cada comprador. O material da superfície de Alcantara também não desempenha um papel decisivo, embora seja uma mudança agradável em comparação com as superfícies de plástico habituais. Não há nada de ruim para dizer sobre a qualidade de construção, e a carcaça também é de alta qualidade. Ela deixa uma boa impressão geral. A mobilidade também pode ser descrita como muito boa, graças à longa duração da bateria. Com os portáteis Superfície, a Microsoft tem como alvo estudantes, que não devem ter problemas para passar um dia na faculdade com o modelo i5 mais acessível.
Em conclusão, a pergunta inicial ainda está aberta, se é recomendável optar por um Surface i7. Em nossa opinião, o único ponto de crítica é a queda de desempenho constantemente mencionada que ocorre após alguns minutos no modo Turbo. Apesar de tudo isso, o portátil i7 ainda é um dispositivo rápido com melhor desempenho de CPU e GPU, mesmo durante o afogamento. Tendo em conta o SSD Samsung mais rápido, a decisão de optar por um Surface i7 parece absolutamente razoável.
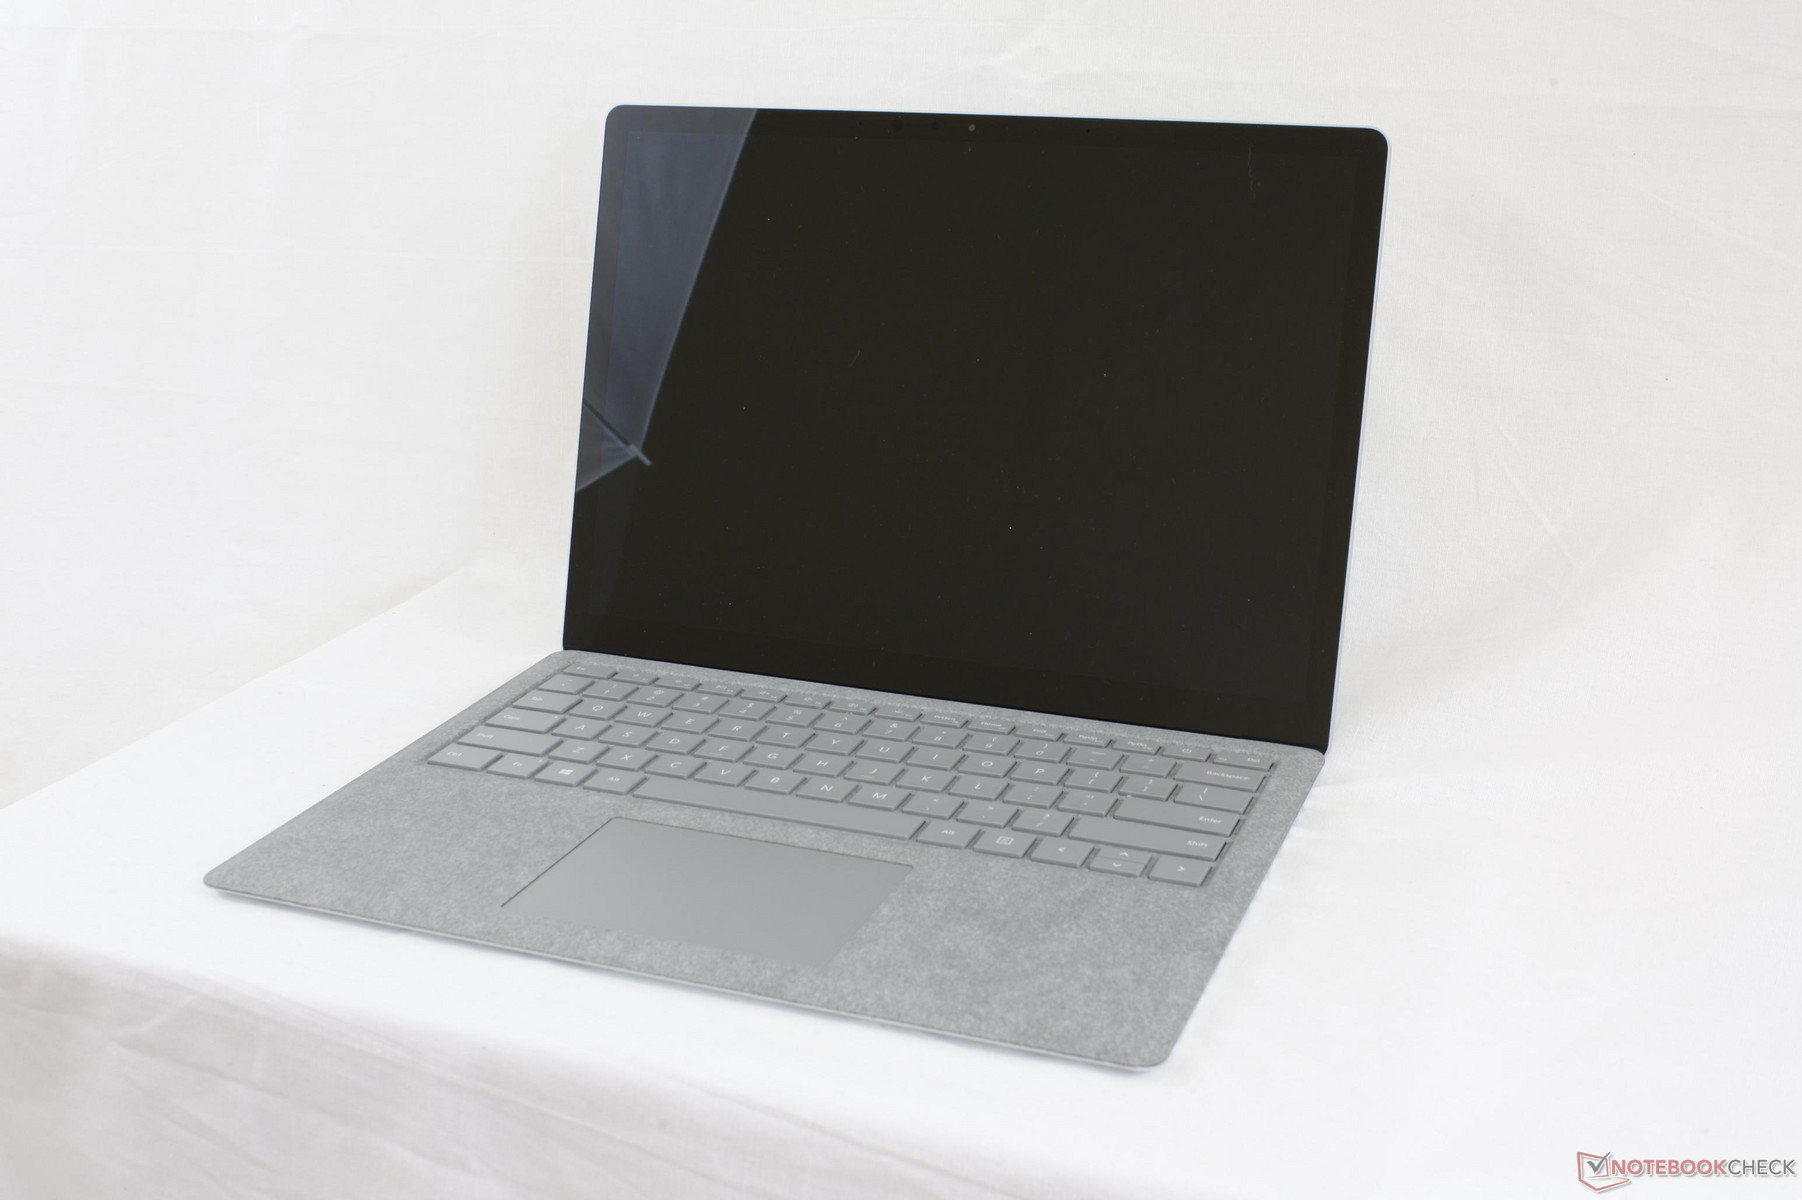
Microsoft Surface Laptop i7
- 10/24/2017 v6 (old)
Klaus Hinum, Daniel Puschina