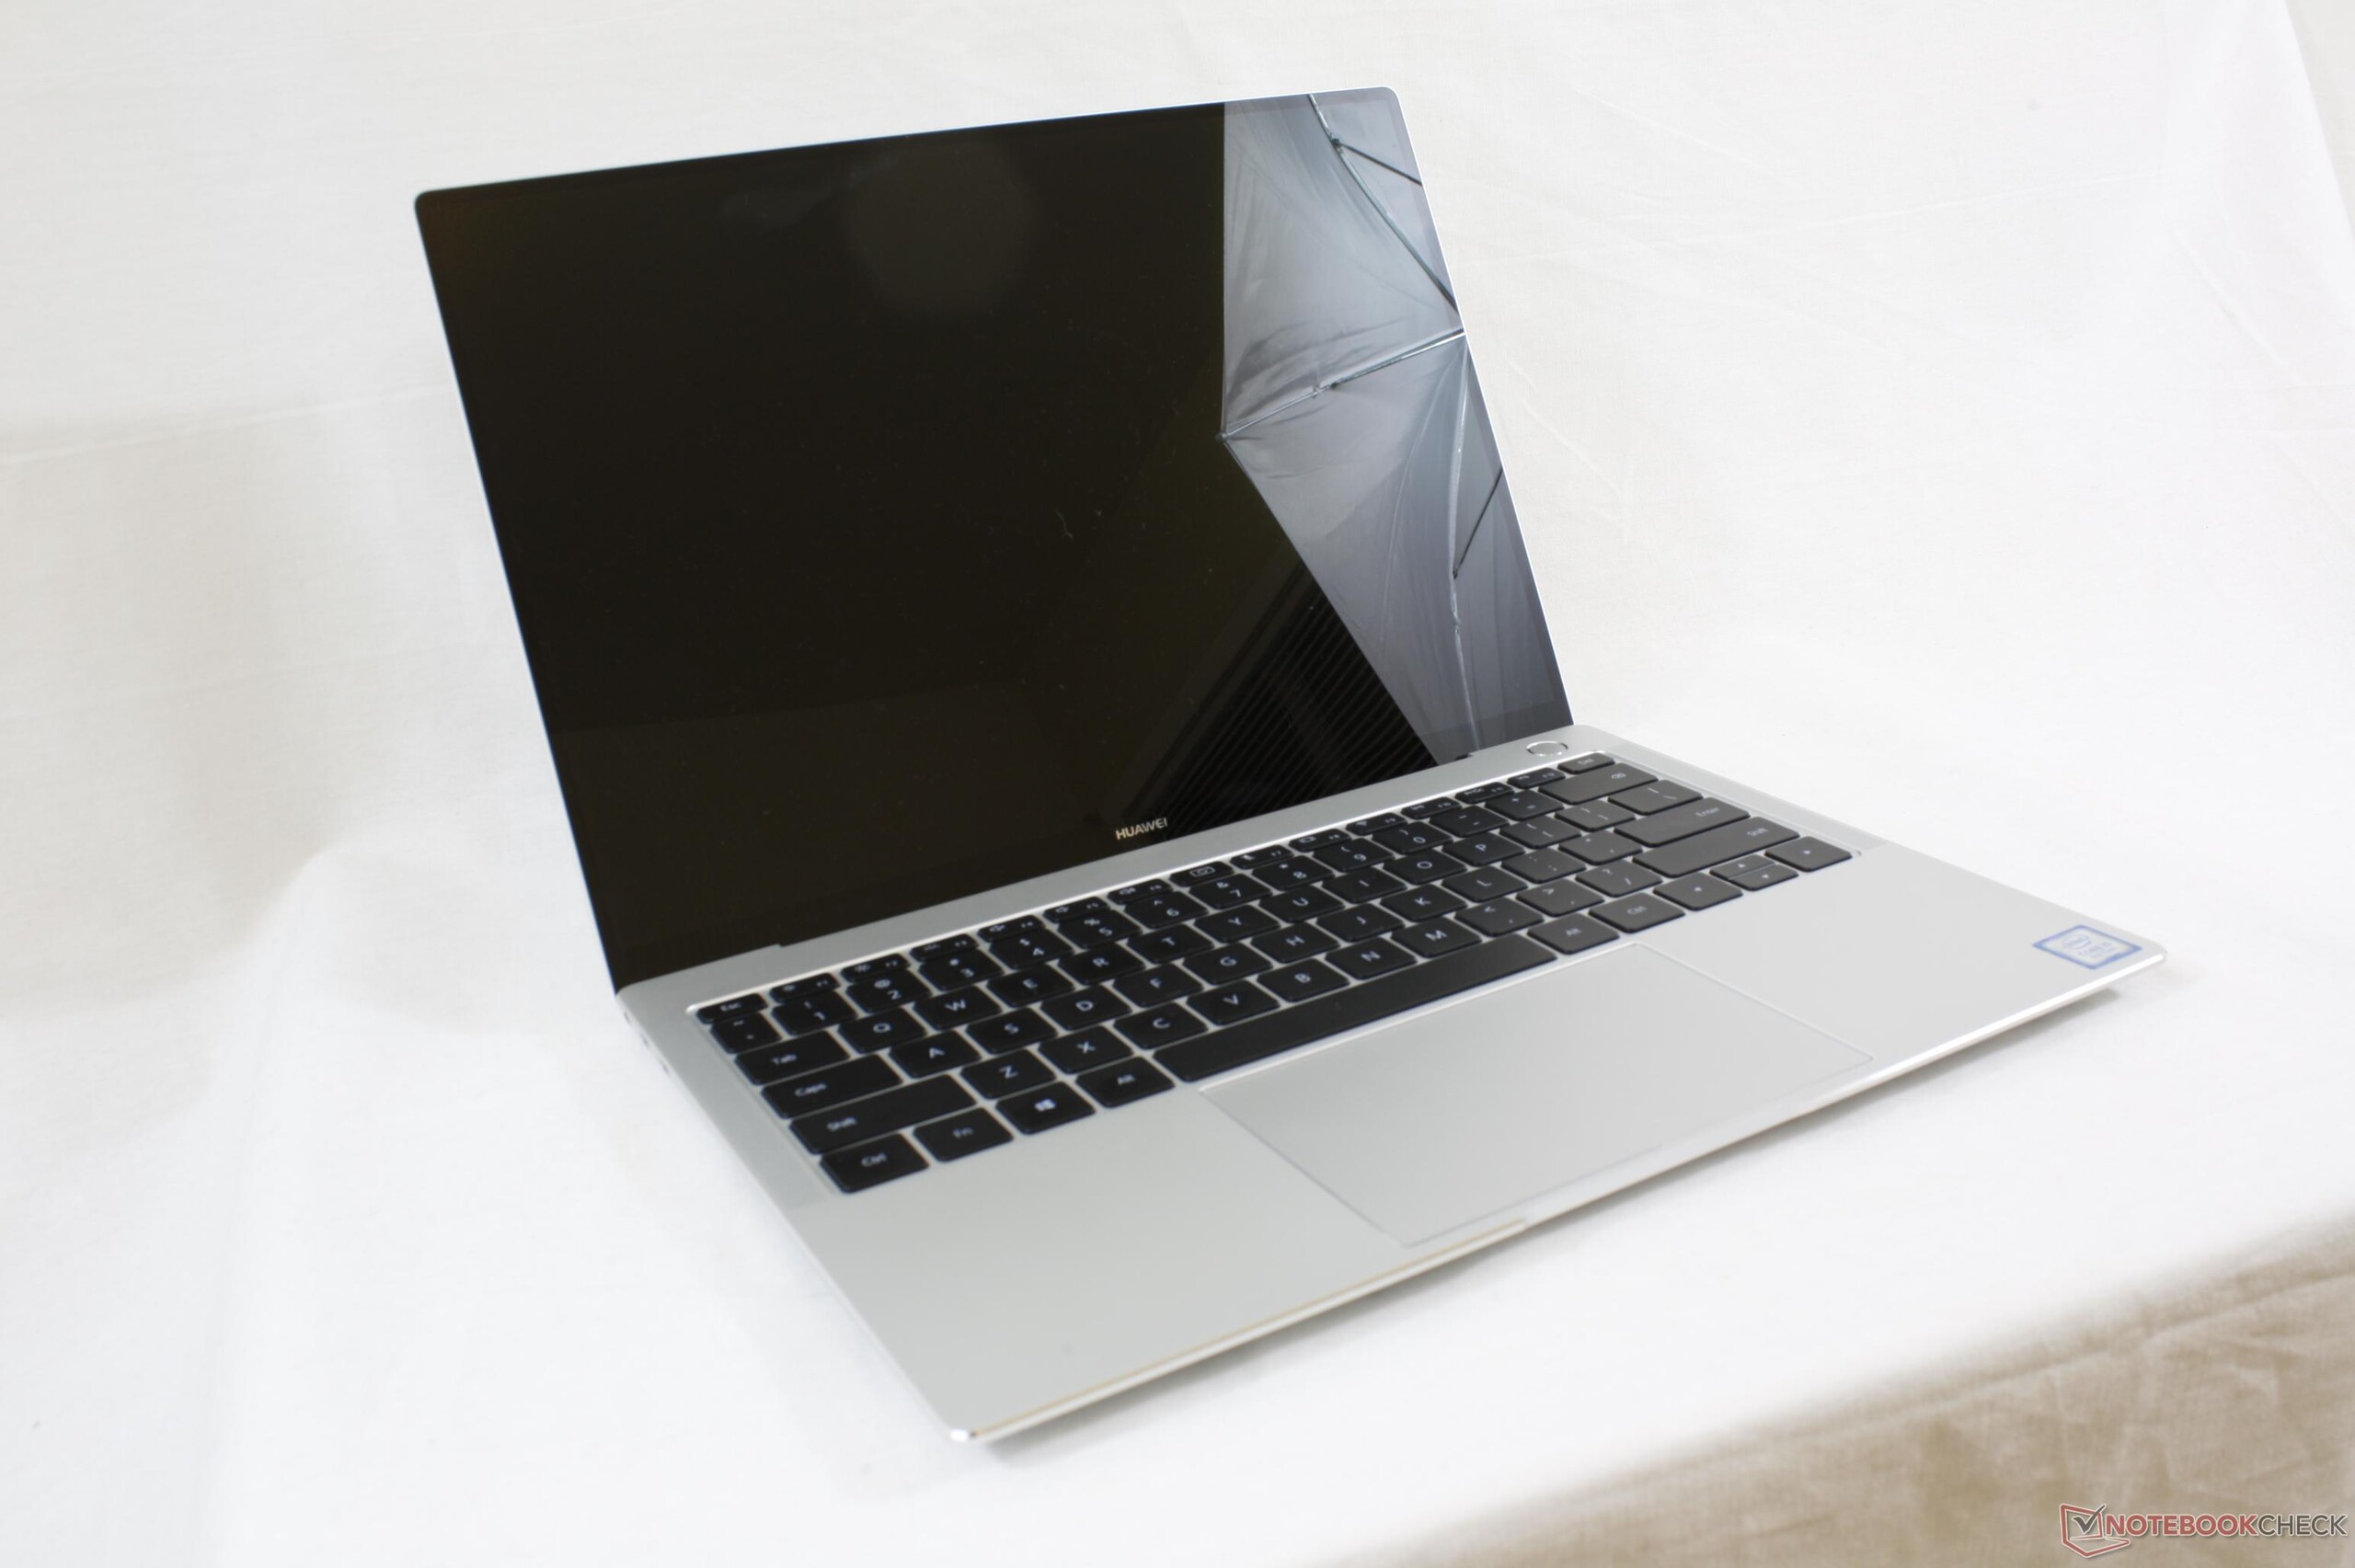
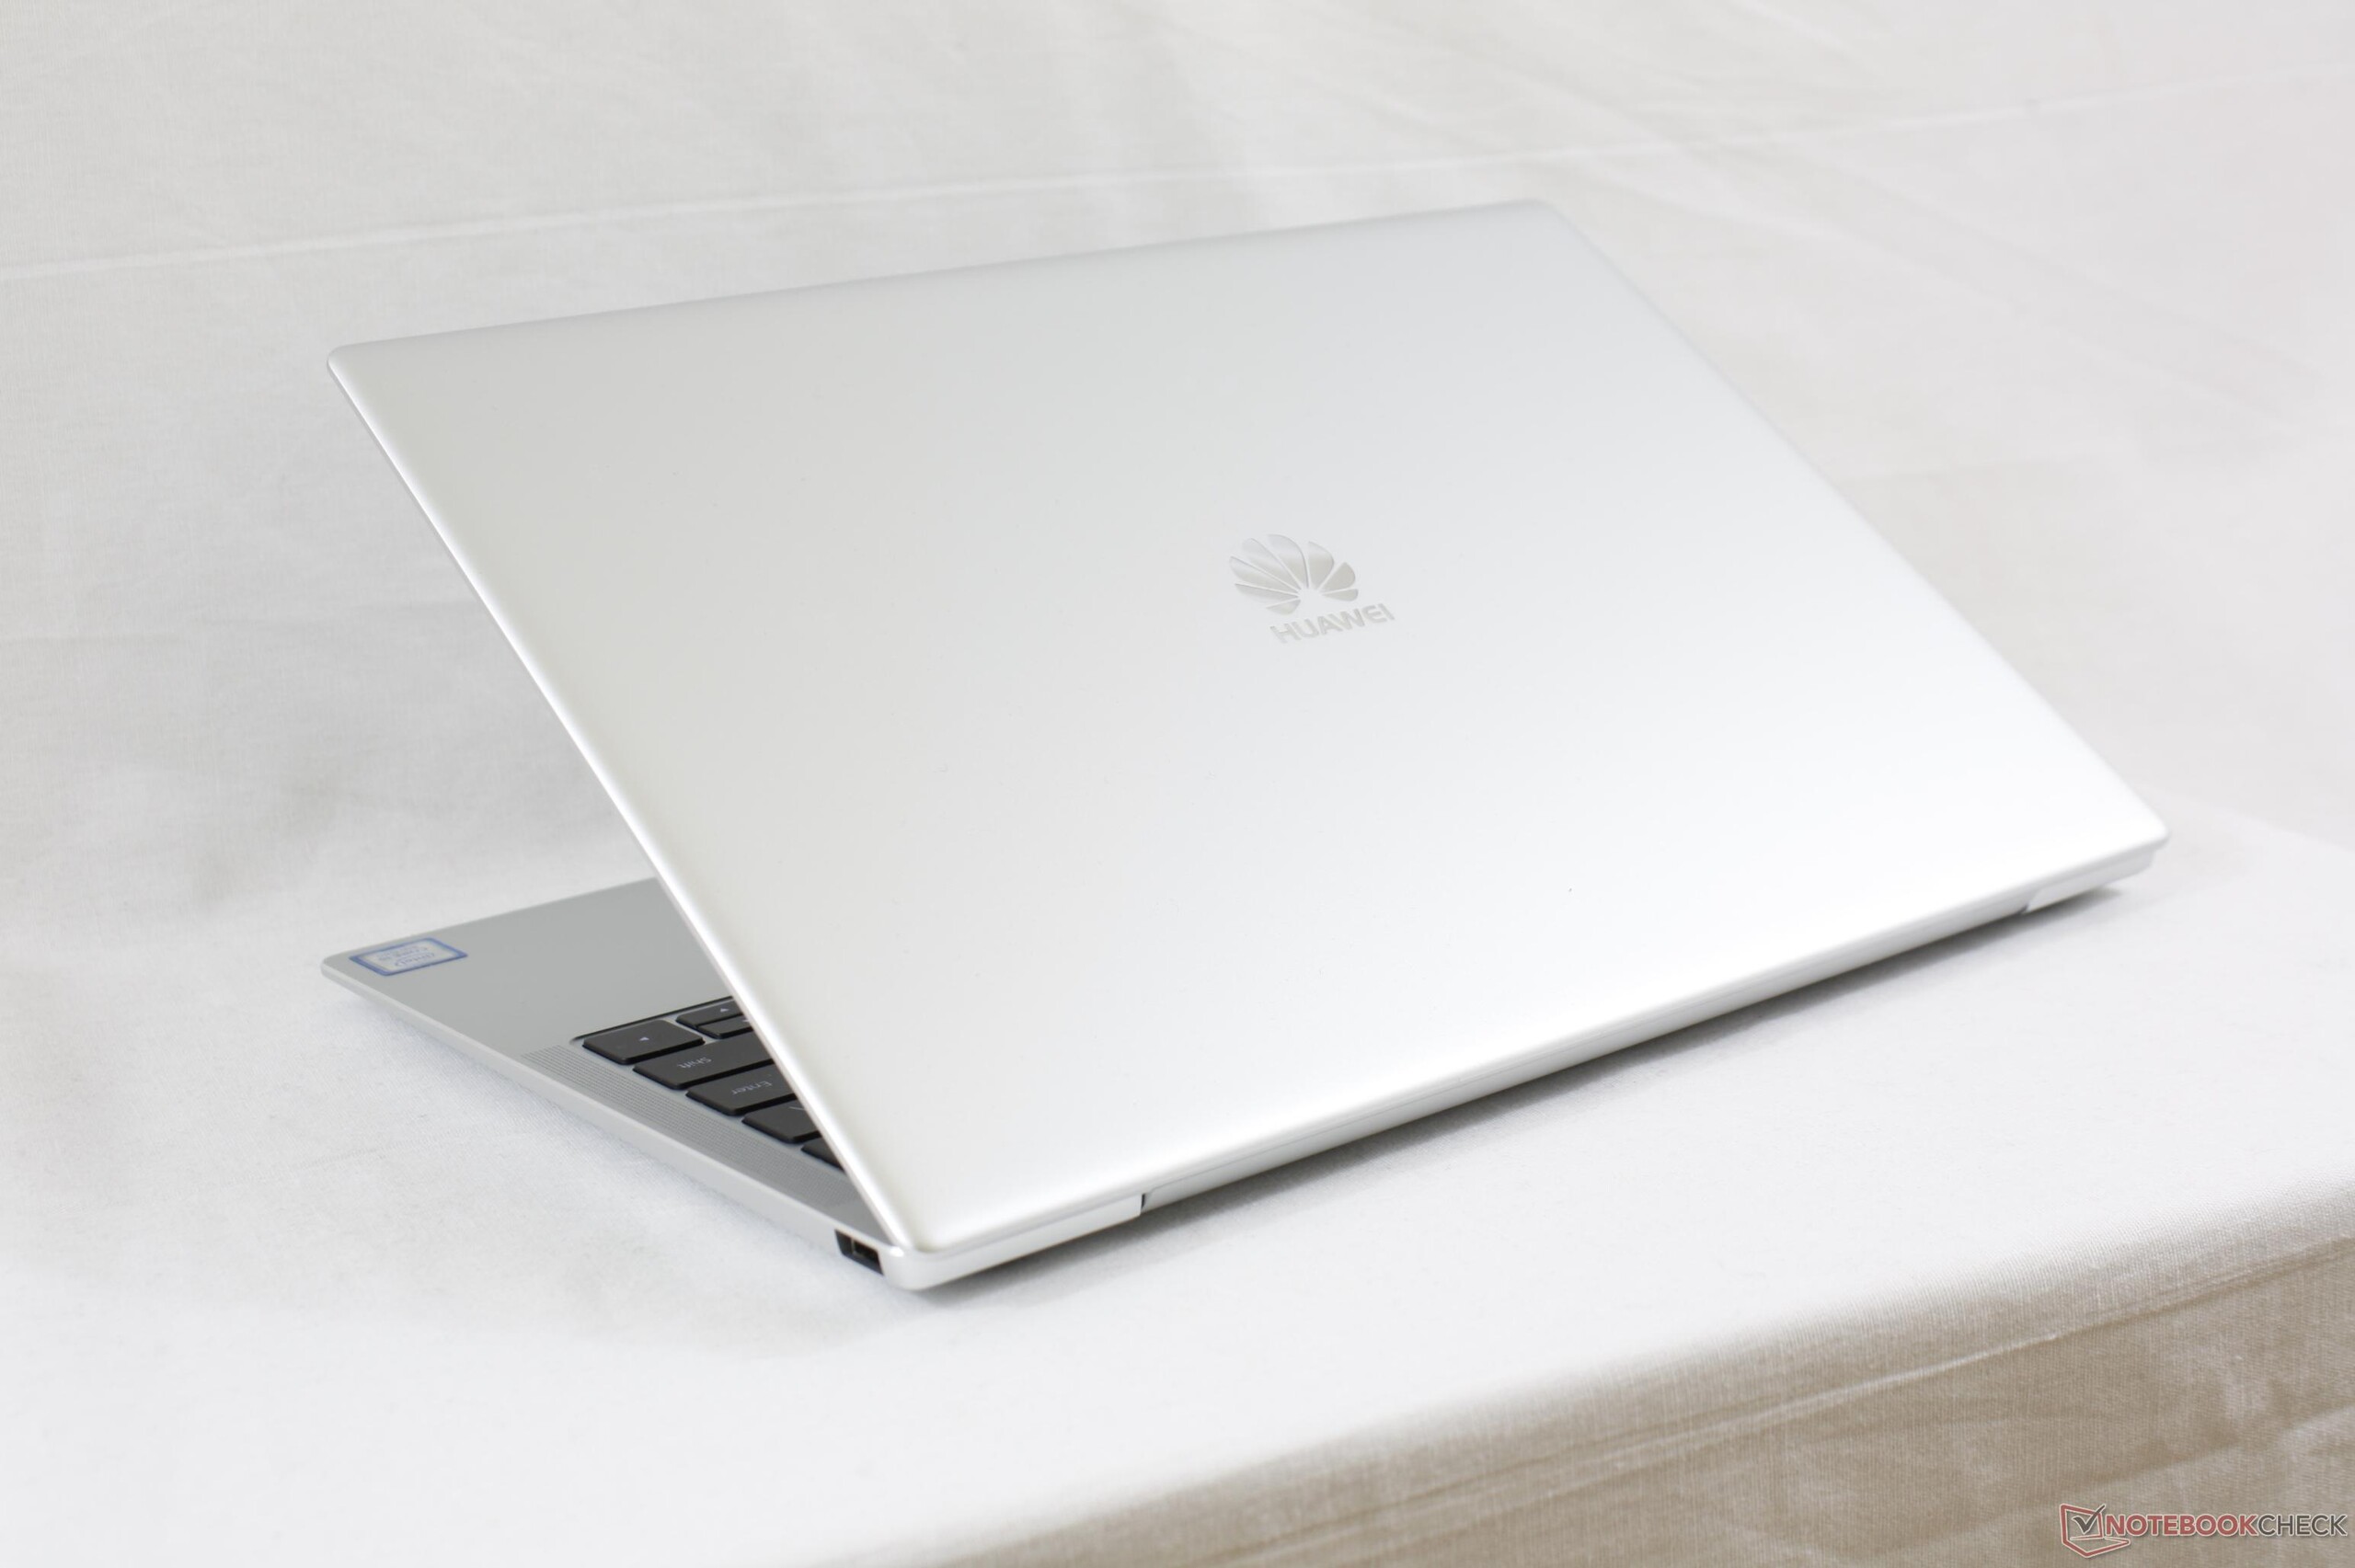
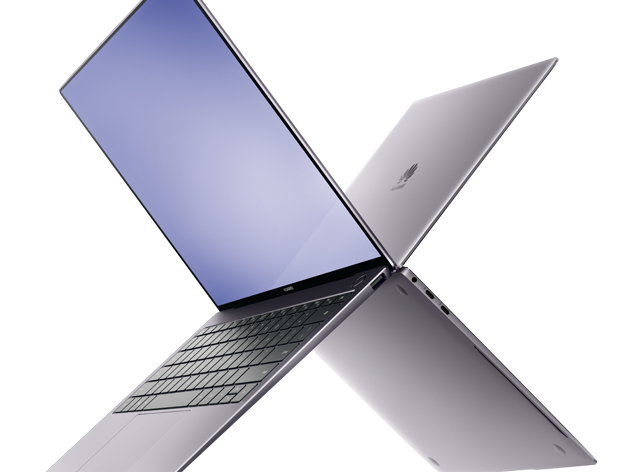
Breve Análise do Portátil Huawei Matebook X Pro (i5-8250U, MX150)
| Networking | |
| iperf3 transmit AX12 | |
| Huawei MateBook X | |
| Microsoft Surface Laptop i5 | |
| Huawei Matebook X Pro i5 | |
| Dell XPS 13 9370 i7 UHD | |
| iperf3 receive AX12 | |
| Dell XPS 13 9370 i7 UHD | |
| Huawei Matebook X Pro i5 | |
| Microsoft Surface Laptop i5 | |
| Huawei MateBook X | |
| |||||||||||||||||||||||||
iluminação: 84 %
iluminação com acumulador: 442.7 cd/m²
Contraste: 1428:1 (Preto: 0.31 cd/m²)
ΔE ColorChecker Calman: 2.24 | ∀{0.5-29.43 Ø4.71}
calibrated: 1.11
ΔE Greyscale Calman: 9.7 | ∀{0.09-98 Ø4.96}
95% sRGB (Argyll 1.6.3 3D)
61.6% AdobeRGB 1998 (Argyll 1.6.3 3D)
67.6% AdobeRGB 1998 (Argyll 3D)
95.2% sRGB (Argyll 3D)
65.9% Display P3 (Argyll 3D)
Gamma: 1.42
CCT: 6227 K
| Huawei Matebook X Pro i5 Tianma XM, IPS, 13.9", 3000x2000 | Huawei MateBook X Chi Mei CMN8201 / P130ZDZ-EF1, , 13.3", 2160x1440 | Dell XPS 13 9370 i7 UHD ID: Sharp SHP148B, Name: LQ133D1, Dell P/N: 8XDHY, IPS, 13.3", 3840x2160 | Asus Zenbook UX3430UN-GV174T Chi Mei CMN14D2 / N140HCE-EN1, IPS, 14", 1920x1080 | Apple MacBook Pro 13 2017 APPA033, IPS, 13.3", 2560x1600 | Microsoft Surface Laptop i5 ID: MEI96A2, Name: Panasonic VVX14T092N00, IPS, 13.5", 2256x1504 | |
|---|---|---|---|---|---|---|
| Display | 0% | 4% | 1% | 28% | 2% | |
| Display P3 Coverage (%) | 65.9 | 65.8 0% | 68.9 5% | 65.6 0% | 99.2 51% | 67.8 3% |
| sRGB Coverage (%) | 95.2 | 96.2 1% | 98.4 3% | 97.4 2% | 99.9 5% | 94.3 -1% |
| AdobeRGB 1998 Coverage (%) | 67.6 | 66.8 -1% | 69.5 3% | 67.8 0% | 87.1 29% | 69.5 3% |
| Response Times | 12% | -72% | 14% | -10% | -36% | |
| Response Time Grey 50% / Grey 80% * (ms) | 40.4 ? | 33 ? 18% | 69.6 ? -72% | 30 ? 26% | 42.8 ? -6% | 50.8 ? -26% |
| Response Time Black / White * (ms) | 25.6 ? | 24 ? 6% | 44 ? -72% | 25 ? 2% | 28.8 ? -13% | 37.2 ? -45% |
| PWM Frequency (Hz) | 3759 ? | |||||
| Screen | 9% | -5% | -30% | 21% | 9% | |
| Brightness middle (cd/m²) | 442.7 | 408 -8% | 478.5 8% | 377 -15% | 588 33% | 384.2 -13% |
| Brightness (cd/m²) | 428 | 395 -8% | 466 9% | 339 -21% | 561 31% | 378 -12% |
| Brightness Distribution (%) | 84 | 88 5% | 86 2% | 76 -10% | 92 10% | 90 7% |
| Black Level * (cd/m²) | 0.31 | 0.45 -45% | 0.43 -39% | 0.4 -29% | 0.45 -45% | 0.36 -16% |
| Contrast (:1) | 1428 | 907 -36% | 1113 -22% | 943 -34% | 1307 -8% | 1067 -25% |
| Colorchecker dE 2000 * | 2.24 | 1.55 31% | 3.09 -38% | 3.33 -49% | 1.7 24% | 1.8 20% |
| Colorchecker dE 2000 max. * | 7.19 | 2.19 70% | 5.94 17% | 8.02 -12% | 3.5 51% | 4.2 42% |
| Colorchecker dE 2000 calibrated * | 1.11 | 2.06 -86% | 3.5 -215% | |||
| Greyscale dE 2000 * | 9.7 | 1.91 80% | 2.4 75% | 4.89 50% | 1.9 80% | 1.2 88% |
| Gamma | 1.42 155% | 2.34 94% | 2.063 107% | 2.37 93% | 2.33 94% | 2.21 100% |
| CCT | 6227 104% | 6491 100% | 6883 94% | 7620 85% | 6738 96% | 6708 97% |
| Color Space (Percent of AdobeRGB 1998) (%) | 61.6 | 61 -1% | 69.47 13% | 62 1% | 77.92 26% | 63.7 3% |
| Color Space (Percent of sRGB) (%) | 95 | 96 1% | 98.36 4% | 98 3% | 99.94 5% | 94.2 -1% |
| Média Total (Programa/Configurações) | 7% /
8% | -24% /
-12% | -5% /
-19% | 13% /
18% | -8% /
2% |
* ... menor é melhor
Exibir tempos de resposta
| ↔ Tempo de resposta preto para branco | ||
|---|---|---|
| 25.6 ms ... ascensão ↗ e queda ↘ combinadas | ↗ 11.6 ms ascensão | 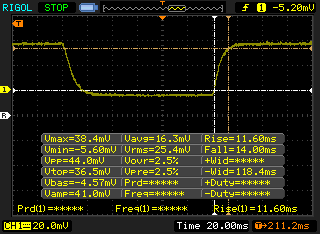 |
| ↘ 14 ms queda | ||
| A tela mostra taxas de resposta relativamente lentas em nossos testes e pode ser muito lenta para os jogadores. Em comparação, todos os dispositivos testados variam de 0.1 (mínimo) a 240 (máximo) ms. » 61 % de todos os dispositivos são melhores. Isso significa que o tempo de resposta medido é pior que a média de todos os dispositivos testados (19.8 ms). | ||
| ↔ Tempo de resposta 50% cinza a 80% cinza | ||
| 40.4 ms ... ascensão ↗ e queda ↘ combinadas | ↗ 19.2 ms ascensão | 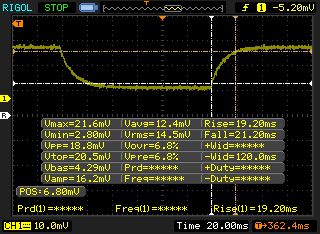 |
| ↘ 21.2 ms queda | ||
| A tela mostra taxas de resposta lentas em nossos testes e será insatisfatória para os jogadores. Em comparação, todos os dispositivos testados variam de 0.165 (mínimo) a 636 (máximo) ms. » 64 % de todos os dispositivos são melhores. Isso significa que o tempo de resposta medido é pior que a média de todos os dispositivos testados (31 ms). | ||
Cintilação da tela / PWM (modulação por largura de pulso)
| Tela tremeluzindo / PWM não detectado | 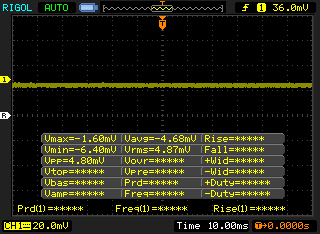 | ||
[pwm_comparison] Em comparação: 52 % de todos os dispositivos testados não usam PWM para escurecer a tela. Se PWM foi detectado, uma média de 7757 (mínimo: 5 - máximo: 343500) Hz foi medida. | |||
* ... menor é melhor
| PCMark 10 - Score | |
| Apple MacBook Pro 13 2017 | |
| Dell XPS 13 9370 i7 UHD | |
| HP EliteBook x360 1020 G2 | |
| Asus Zenbook UX3430UN-GV174T | |
| Huawei Matebook X Pro i5 | |
| PCMark 8 Home Score Accelerated v2 | 3478 pontos | |
| PCMark 8 Creative Score Accelerated v2 | 4747 pontos | |
| PCMark 8 Work Score Accelerated v2 | 4339 pontos | |
| PCMark 10 Score | 3445 pontos | |
Ajuda | ||
| Huawei Matebook X Pro i5 Samsung PM961 MZVLW256HEHP | Huawei MateBook X LITEON CB1-SD256 | HP EliteBook x360 1020 G2 Samsung PM961 NVMe MZVLW512HMJP | Microsoft Surface Book 2 Samsung PM961 MZVLW256HEHP | Apple MacBook Pro 13 2017 Apple SSD AP0128 | Dell XPS 13 9370 i5 UHD Toshiba XG5 KXG50ZNV256G | |
|---|---|---|---|---|---|---|
| CrystalDiskMark 5.2 / 6 | -22% | 32% | 2% | 3% | 8% | |
| Write 4K (MB/s) | 116.5 | 68.1 -42% | 142.4 22% | 140.6 21% | 16.02 -86% | 121.4 4% |
| Read 4K (MB/s) | 42.18 | 28.95 -31% | 44.08 5% | 43.62 3% | 22.9 -46% | 33.42 -21% |
| Write Seq (MB/s) | 1079 | 529 -51% | 1520 41% | 343.3 -68% | 722 -33% | 385.3 -64% |
| Read Seq (MB/s) | 1030 | 711 -31% | 1351 31% | 1452 41% | 1807 75% | 1958 90% |
| Write 4K Q32T1 (MB/s) | 225.7 | 306.4 36% | 436.6 93% | 344.4 53% | 416.5 85% | 375.7 66% |
| Read 4K Q32T1 (MB/s) | 302.9 | 501 65% | 426.6 41% | 457.2 51% | 538 78% | 364.1 20% |
| Write Seq Q32T1 (MB/s) | 1174 | 496.9 -58% | 1572 34% | 344.3 -71% | 733 -38% | 1069 -9% |
| Read Seq Q32T1 (MB/s) | 3394 | 1297 -62% | 3112 -8% | 2885 -15% | 3121 -8% | 2564 -24% |

| 3DMark 11 Performance | 3782 pontos | |
| 3DMark Ice Storm Standard Score | 33063 pontos | |
| 3DMark Cloud Gate Standard Score | 9120 pontos | |
| 3DMark Fire Strike Score | 2507 pontos | |
Ajuda | ||
| baixo | média | alto | ultra | |
|---|---|---|---|---|
| BioShock Infinite (2013) | 162 | 86.2 | 74.2 | 27.9 |
| The Witcher 3 (2015) | 18 | |||
| Batman: Arkham Knight (2015) | 43 | 38 | 20 | 17 |
| Overwatch (2016) | 95.2 | 43 | 25.1 |
Barulho
| Ocioso |
| 27.9 / 27.9 / 27.9 dB |
| Carga |
| 36.2 / 45.2 dB |
 | ||
30 dB silencioso 40 dB(A) audível 50 dB(A) ruidosamente alto |
||
min: | ||
| Huawei Matebook X Pro i5 GeForce MX150, i5-8250U, Samsung PM961 MZVLW256HEHP | Asus Zenbook UX3430UN-GV174T GeForce MX150, i5-8250U, SK Hynix HFS256G39TND-N210A | Dell XPS 13 9370 FHD i5 UHD Graphics 620, i5-8250U, Toshiba XG5 KXG50ZNV256G | Apple MacBook Pro 13 2017 Iris Plus Graphics 640, i5-7360U, Apple SSD AP0128 | Microsoft Surface Laptop i5 HD Graphics 620, i5-7200U, Toshiba THNSN0128GTYA | HP EliteBook x360 1020 G2 HD Graphics 620, i7-7600U, Samsung PM961 NVMe MZVLW512HMJP | |
|---|---|---|---|---|---|---|
| Noise | -5% | 2% | -2% | 4% | 5% | |
| desligado / ambiente * (dB) | 27.9 | 30 -8% | 29.1 -4% | 30.2 -8% | 28.2 -1% | 28.3 -1% |
| Idle Minimum * (dB) | 27.9 | 30 -8% | 29.1 -4% | 30.2 -8% | 28.2 -1% | 28.3 -1% |
| Idle Average * (dB) | 27.9 | 30 -8% | 29.1 -4% | 30.2 -8% | 28.2 -1% | 28.3 -1% |
| Idle Maximum * (dB) | 27.9 | 33.1 -19% | 29.1 -4% | 30.2 -8% | 29 -4% | 29.3 -5% |
| Load Average * (dB) | 36.2 | 37.6 -4% | 32.2 11% | 32.9 9% | 30.3 16% | 32.2 11% |
| Witcher 3 ultra * (dB) | 45 | |||||
| Load Maximum * (dB) | 45.2 | 37.6 17% | 37.3 17% | 39.3 13% | 39.3 13% | 34.5 24% |
* ... menor é melhor
(-) A temperatura máxima no lado superior é 48.6 °C / 119 F, em comparação com a média de 35.9 °C / 97 F , variando de 21.4 a 59 °C para a classe Subnotebook.
(-) A parte inferior aquece até um máximo de 47 °C / 117 F, em comparação com a média de 39.2 °C / 103 F
(+) Em uso inativo, a temperatura média para o lado superior é 3.2 °C / 38 F, em comparação com a média do dispositivo de 30.8 °C / ### class_avg_f### F.
(+) Jogando The Witcher 3, a temperatura média para o lado superior é 5.3 °C / 42 F, em comparação com a média do dispositivo de 30.8 °C / ## #class_avg_f### F.
(+) Os apoios para as mãos e o touchpad estão atingindo a temperatura máxima da pele (34.4 °C / 93.9 F) e, portanto, não estão quentes.
(-) A temperatura média da área do apoio para as mãos de dispositivos semelhantes foi 28.2 °C / 82.8 F (-6.2 °C / -11.1 F).
Huawei Matebook X Pro i5 análise de áudio
(±) | o volume do alto-falante é médio, mas bom (###valor### dB)
Graves 100 - 315Hz
(±) | graves reduzidos - em média 9.7% menor que a mediana
(±) | a linearidade dos graves é média (13.3% delta para a frequência anterior)
Médios 400 - 2.000 Hz
(+) | médios equilibrados - apenas 4.7% longe da mediana
(±) | a linearidade dos médios é média (7.4% delta para frequência anterior)
Altos 2 - 16 kHz
(+) | agudos equilibrados - apenas 3% longe da mediana
(±) | a linearidade dos máximos é média (9.2% delta para frequência anterior)
Geral 100 - 16.000 Hz
(±) | a linearidade do som geral é média (17.7% diferença em relação à mediana)
Comparado com a mesma classe
» 49% de todos os dispositivos testados nesta classe foram melhores, 7% semelhantes, 44% piores
» O melhor teve um delta de 5%, a média foi 18%, o pior foi 53%
Comparado com todos os dispositivos testados
» 35% de todos os dispositivos testados foram melhores, 8% semelhantes, 57% piores
» O melhor teve um delta de 4%, a média foi 23%, o pior foi 134%
Apple MacBook 12 (Early 2016) 1.1 GHz análise de áudio
(+) | os alto-falantes podem tocar relativamente alto (###valor### dB)
Graves 100 - 315Hz
(±) | graves reduzidos - em média 11.3% menor que a mediana
(±) | a linearidade dos graves é média (14.2% delta para a frequência anterior)
Médios 400 - 2.000 Hz
(+) | médios equilibrados - apenas 2.4% longe da mediana
(+) | médios são lineares (5.5% delta para frequência anterior)
Altos 2 - 16 kHz
(+) | agudos equilibrados - apenas 2% longe da mediana
(+) | os máximos são lineares (4.5% delta da frequência anterior)
Geral 100 - 16.000 Hz
(+) | o som geral é linear (10.2% diferença em relação à mediana)
Comparado com a mesma classe
» 7% de todos os dispositivos testados nesta classe foram melhores, 2% semelhantes, 90% piores
» O melhor teve um delta de 5%, a média foi 18%, o pior foi 53%
Comparado com todos os dispositivos testados
» 5% de todos os dispositivos testados foram melhores, 1% semelhantes, 94% piores
» O melhor teve um delta de 4%, a média foi 23%, o pior foi 134%
| desligado | |
| Ocioso | |
| Carga |
|
Key:
min: | |
| Huawei Matebook X Pro i5 i5-8250U, GeForce MX150, Samsung PM961 MZVLW256HEHP, IPS, 3000x2000, 13.9" | Huawei MateBook X i5-7200U, HD Graphics 620, LITEON CB1-SD256, , 2160x1440, 13.3" | Dell XPS 13 9370 i7 UHD i5-8550U, UHD Graphics 620, Toshiba XG5 KXG50ZNV512G, IPS, 3840x2160, 13.3" | Microsoft Surface Laptop i5 i5-7200U, HD Graphics 620, Toshiba THNSN0128GTYA, IPS, 2256x1504, 13.5" | Apple MacBook Pro 13 2017 i5-7360U, Iris Plus Graphics 640, Apple SSD AP0128, IPS, 2560x1600, 13.3" | Asus Zenbook UX3430UN-GV174T i5-8250U, GeForce MX150, SK Hynix HFS256G39TND-N210A, IPS, 1920x1080, 14" | |
|---|---|---|---|---|---|---|
| Power Consumption | 2% | 3% | 32% | 20% | 2% | |
| Idle Minimum * (Watt) | 3.5 | 4.6 -31% | 5 -43% | 3.2 9% | 3.7 -6% | 4.5 -29% |
| Idle Average * (Watt) | 8.9 | 11 -24% | 8.3 7% | 6.5 27% | 5.2 42% | 7.8 12% |
| Idle Maximum * (Watt) | 12.3 | 12 2% | 8.8 28% | 6.8 45% | 7.6 38% | 8.1 34% |
| Load Average * (Watt) | 54.2 | 39.5 27% | 46.4 14% | 28.2 48% | 41.6 23% | 52 4% |
| Witcher 3 ultra * (Watt) | 42.4 | |||||
| Load Maximum * (Watt) | 52.1 | 34.6 34% | 48.6 7% | 36 31% | 50.5 3% | 59 -13% |
* ... menor é melhor
| Huawei Matebook X Pro i5 i5-8250U, GeForce MX150, 57.4 Wh | Huawei MateBook X i5-7200U, HD Graphics 620, 40 Wh | Dell XPS 13 9370 i7 UHD i5-8550U, UHD Graphics 620, 52 Wh | Microsoft Surface Laptop i5 i5-7200U, HD Graphics 620, 45 Wh | Apple MacBook Pro 13 2017 i5-7360U, Iris Plus Graphics 640, 54.5 Wh | Asus Zenbook UX3430UN-GV174T i5-8250U, GeForce MX150, 48 Wh | |
|---|---|---|---|---|---|---|
| Duração da bateria | -25% | -23% | 4% | -9% | -7% | |
| Reader / Idle (h) | 20.7 | 8.5 -59% | 13.7 -34% | 22.5 9% | 22.8 10% | |
| WiFi v1.3 (h) | 9.3 | 5.6 -40% | 7.8 -16% | 10 8% | 11.4 23% | 8.1 -13% |
| Load (h) | 2.2 | 2.7 23% | 1.8 -18% | 2.1 -5% | 1.3 -41% | 1.8 -18% |
Pro
Contra
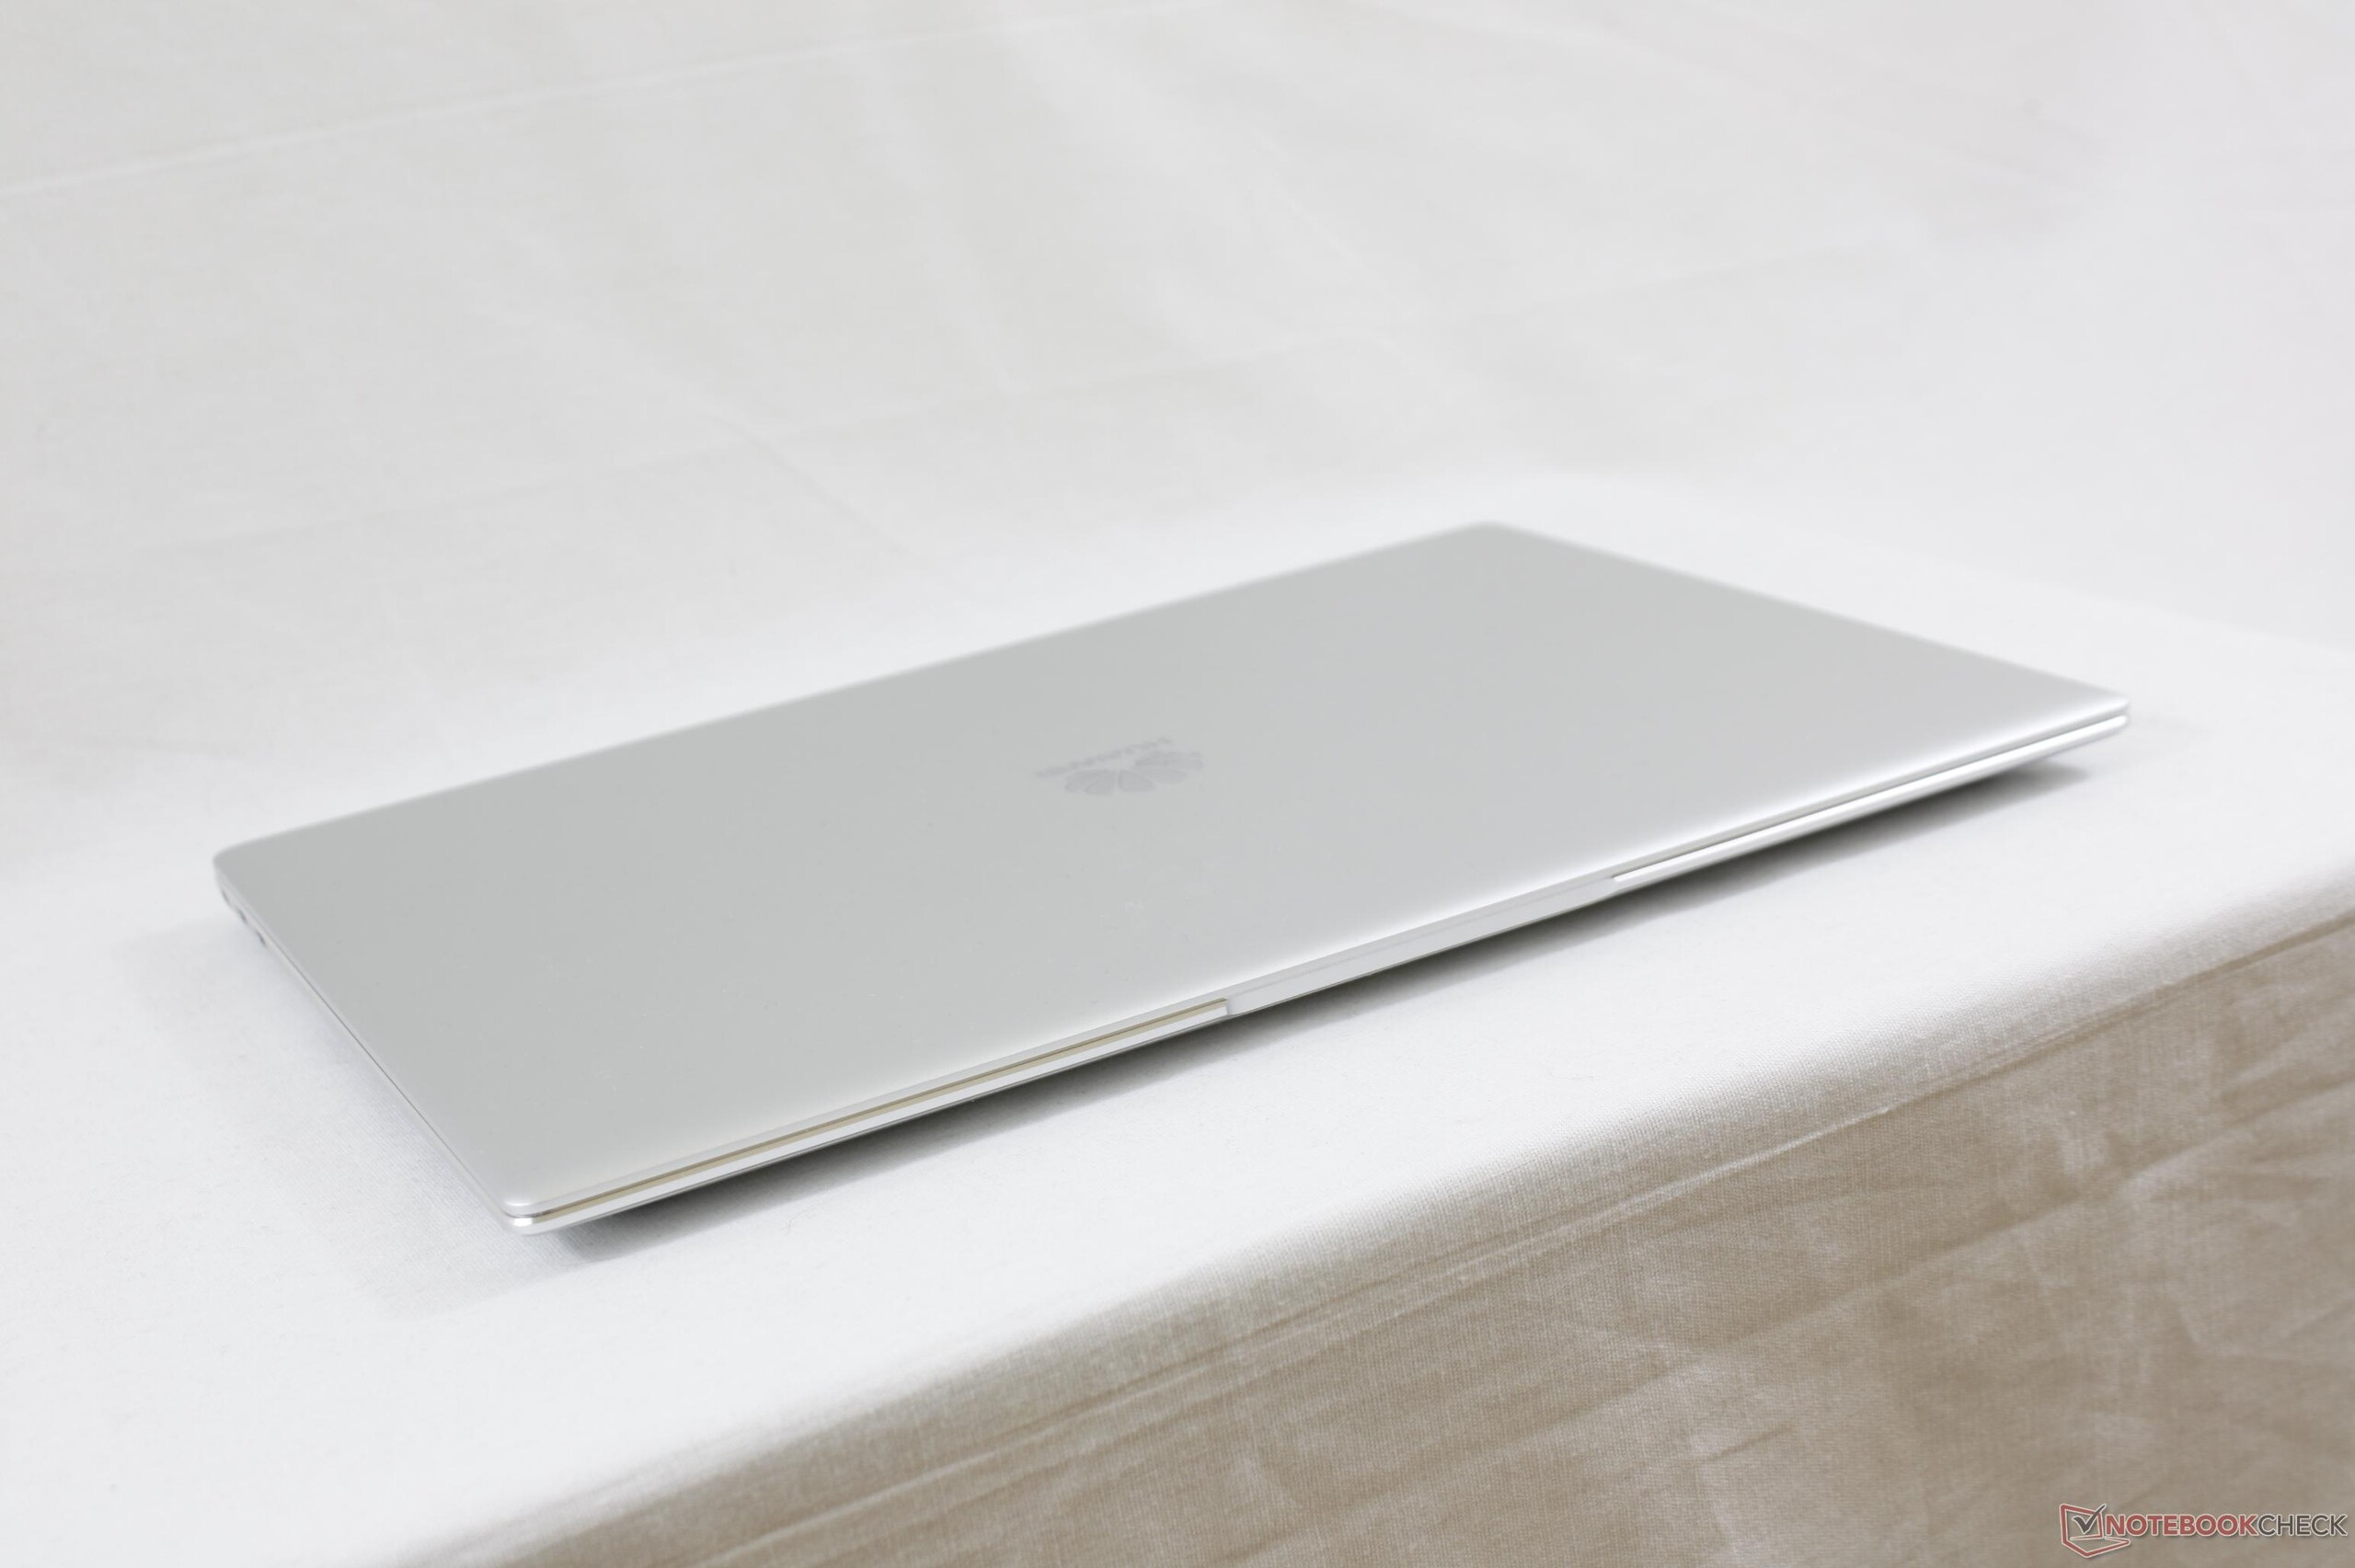
A Huawei conseguiu criar uma fatia significativa do mercado de smartphones com seus smartphones bem recebidos e estamos começando a ver esse mesmo nível de qualidade e cuidado com a segunda geração do MateBook X. Em vez de ir cegamente por um design mais fino somente pela aparência, o MateBook X Pro se atreve a ser um pouco mais grosso do que seu antecessor em troca de gráficos discretos, uma bateria maior e um desempenho mais rápido que os usuários realmente podem sentir. O resultado final é um sistema muito equilibrado em design e potência. A Huawei só recentemente entrou no mercado mundial de portáteis há apenas um ano, mas este dispositivo já parece um produto de um fabricante veterano a par das famílias XPS, Spectre e Zenbook.
É claro que a Huawei precisa fazer mais do que apenas ser comparável à concorrência. É aí que o preço muito agressivo entra em jogo, dado que o MateBook X Pro, de nível básico, com CPU i5-8250U e gráficos integrados é vendido por $1.200, mais um vale-presente de $300. Ao todo, os usuários estariam economizando centenas quando comparado ao XPS 13 ou Spectre 13. A faixa de $900 é preenchida por portáteis tradicionais como o IdeaPad, a série Yoga 700, VivoBook, Inspiron, ou Envy onde o MateBook X Pro é, sem dúvida, uma opção mai potente que todos os mencionados anteriormente, em termos de qualidade. Os usuários que desejam gráficos dedicados da Nvidia, no entanto, terão que gastar $1.500 para obter tudo o que o portátil carro-chefe oferece.
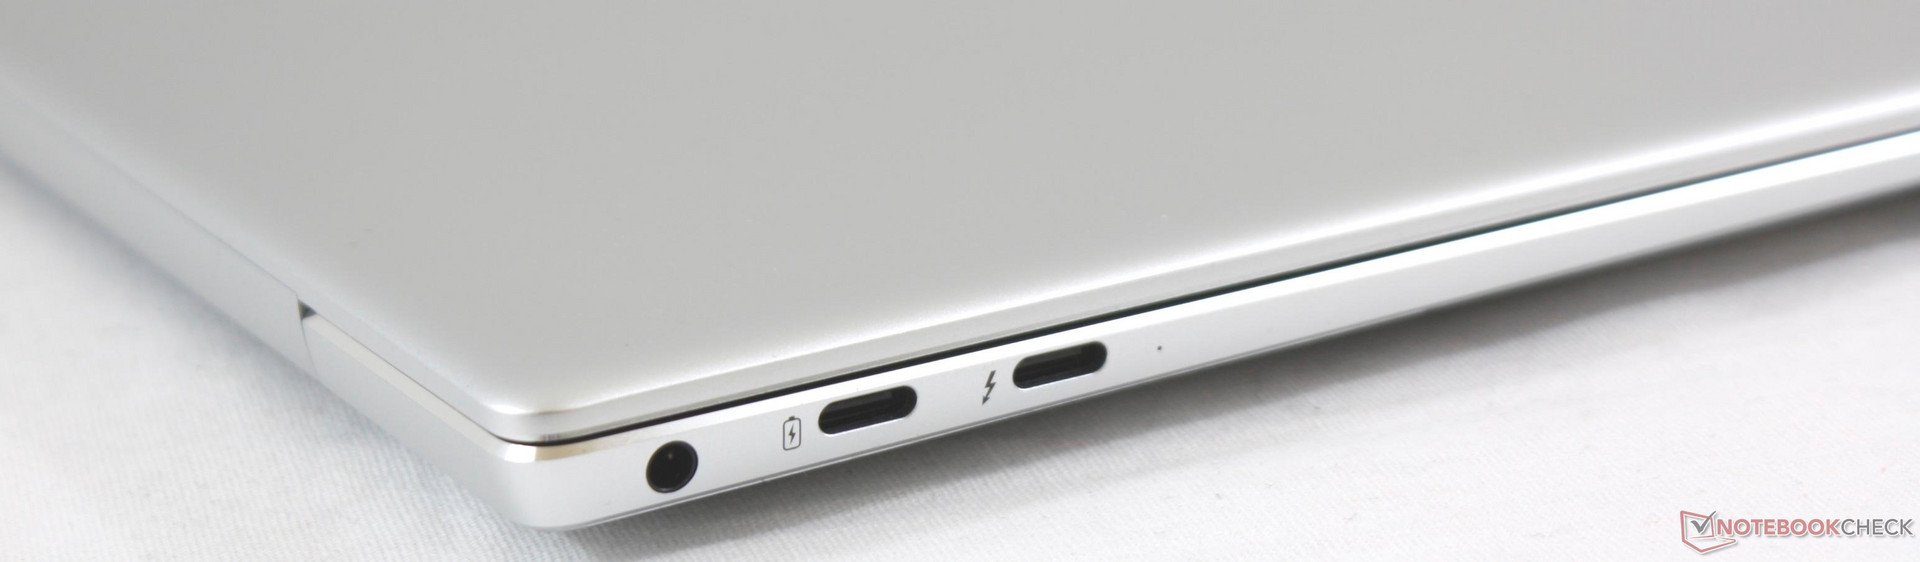
Ainda há muito espaço para melhorias no que esperamos que aconteça para um MateBook X teórico de terceira geração. Por um lado, os marcos estreitos, peso leve e tela de vidro Gorilla Glass estão apenas gritando por um formato de 360 graus, ao estilo XPS 2-em-1 ou Yoga 920. O posicionamento da webcam não é melhor do que na série XPS. Também houve alguns recortes ocultos em termos de desempenho, como mostram os testes de estresse do processador acima, e o uso astuto de uma GPU GeForce MX150 'Max-Q' mais lenta, em vez da GeForce MX150 totalmente equipada. A falta de leitores de cartão pode irritar os criadores de conteúdo, enquanto os botões do trackpad integrado são suaves e inferiores à mesma solução na série MacBook. Se a Huawei incluísse os recursos NFC, IR e SIM, o MateBook X Pro poderia ter atraído ainda mais os usuários corporativos que valorizam a segurança e conveniência adicionais.
Sólido design digno do título de carro-chefe e uma imensa melhoria em relação ao MateBook X original, em termos de potência. As promoções pesadas do fabricante tornam o MateBook X Pro muito atraente para qualquer um que esteja considerando um Ultrabook por menos de $1000 USD. É essencialmente um portátil de alta qualidade por um preço médio.
Huawei Matebook X Pro i5
- 05/20/2018 v6 (old)
Allen Ngo
Price comparison
