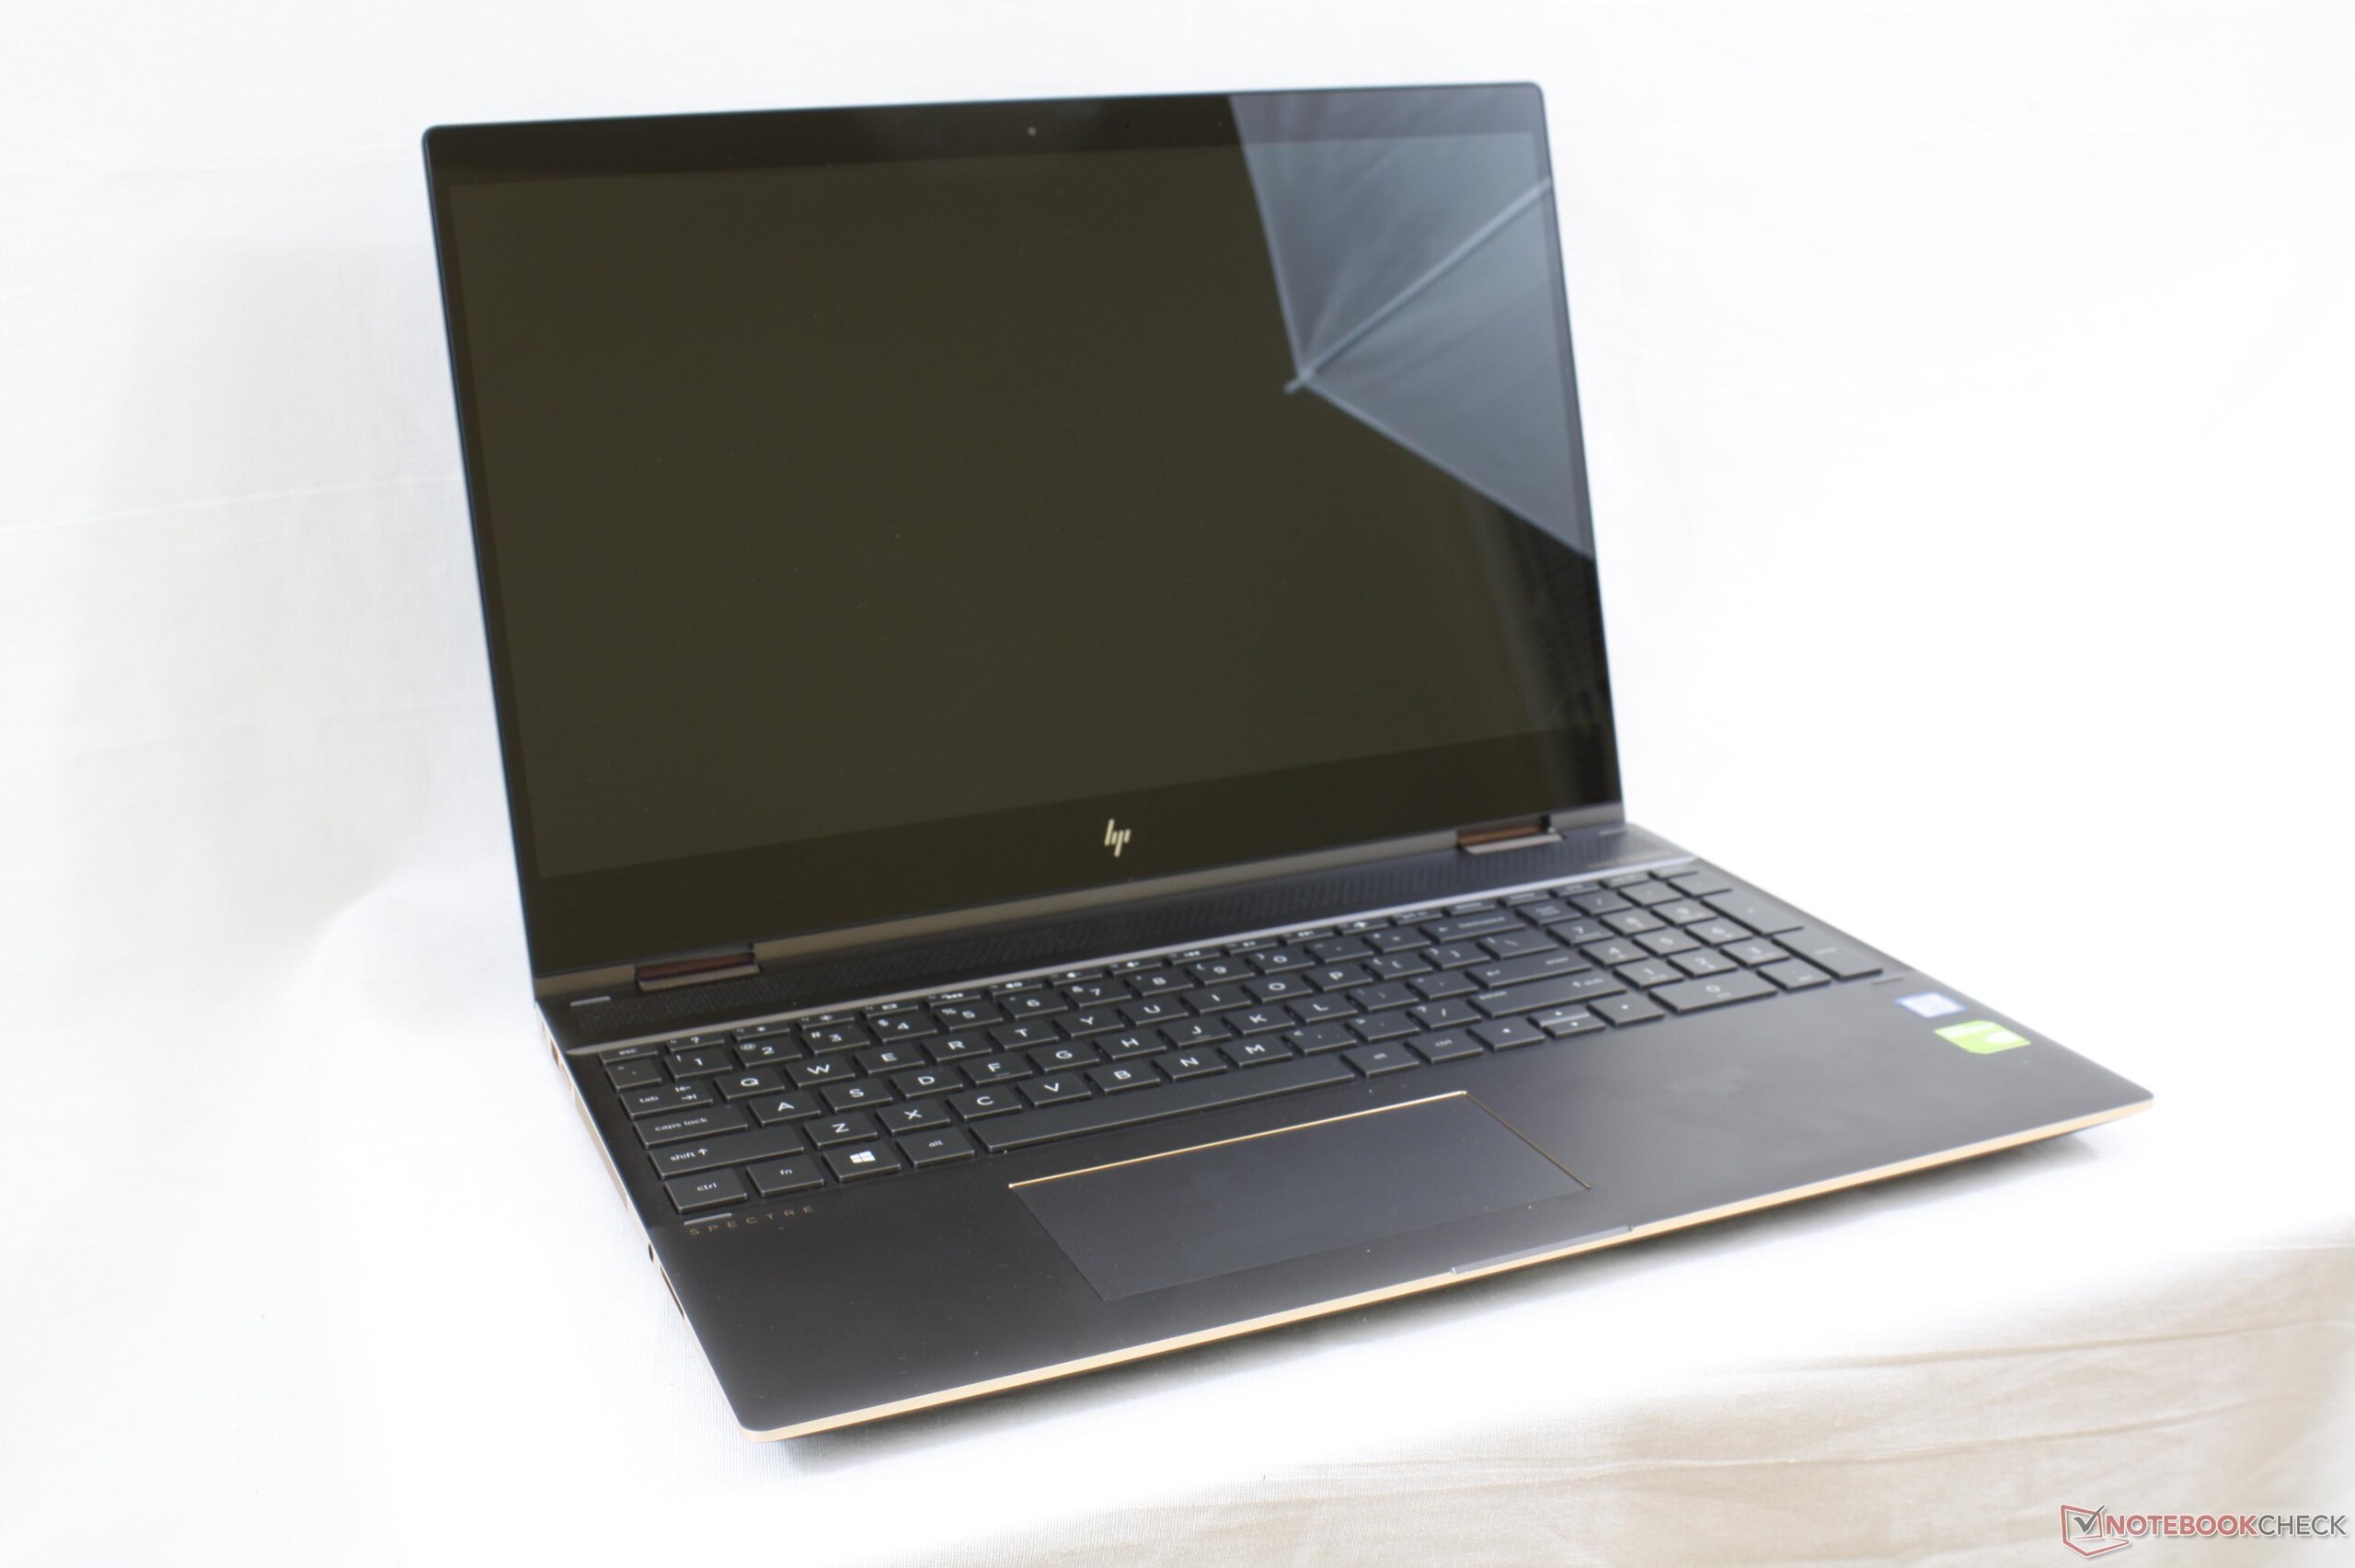
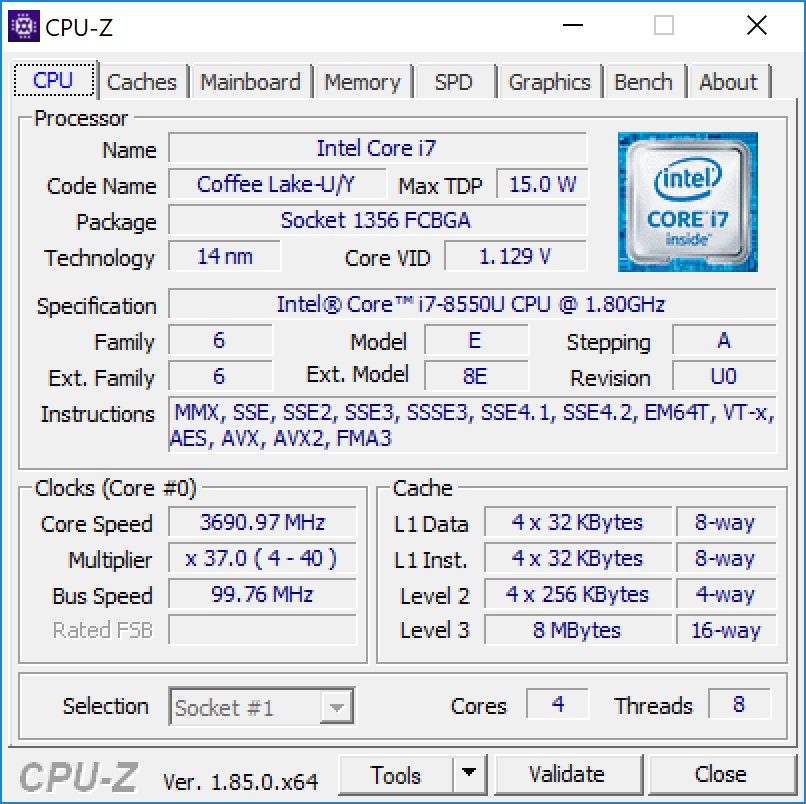
Breve Análise do Conversível HP Spectre x360 15 2018 (i7-8550U, GeForce MX150)
| SD Card Reader | |
| average JPG Copy Test (av. of 3 runs) | |
| HP Spectre x360 15-ch011nr (Toshiba Exceria Pro SDXC 64 GB UHS-II) | |
| HP Spectre x360 15t-bl100 (Toshiba Exceria Pro SDXC 64 GB UHS-II) | |
| Dell XPS 15 2018 i5 FHD 97Wh | |
| maximum AS SSD Seq Read Test (1GB) | |
| HP Spectre x360 15t-bl100 (Toshiba Exceria Pro SDXC 64 GB UHS-II) | |
| HP Spectre x360 15-ch011nr (Toshiba Exceria Pro SDXC 64 GB UHS-II) | |
| Dell XPS 15 2018 i5 FHD 97Wh | |
| Networking | |
| iperf3 transmit AX12 | |
| Dell XPS 15 2018 i5 FHD 97Wh | |
| HP Spectre x360 15-ch011nr | |
| Gigabyte Aero 15X v8 | |
| iperf3 receive AX12 | |
| Gigabyte Aero 15X v8 | |
| HP Spectre x360 15-ch011nr | |
| Dell XPS 15 2018 i5 FHD 97Wh | |
| |||||||||||||||||||||||||
iluminação: 84 %
iluminação com acumulador: 329.3 cd/m²
Contraste: 1062:1 (Preto: 0.31 cd/m²)
ΔE ColorChecker Calman: 4.78 | ∀{0.5-29.43 Ø4.72}
calibrated: 3.51
ΔE Greyscale Calman: 7.9 | ∀{0.09-98 Ø4.97}
90.4% sRGB (Argyll 1.6.3 3D)
58.8% AdobeRGB 1998 (Argyll 1.6.3 3D)
66.3% AdobeRGB 1998 (Argyll 3D)
90.7% sRGB (Argyll 3D)
68.5% Display P3 (Argyll 3D)
Gamma: 2.24
CCT: 8323 K
| HP Spectre x360 15-ch011nr BOE0730, IPS, 15.6", 3840x2160 | HP Spectre x360 15t-bl100 BOE06C3, IPS, 15.6", 3840x2160 | Dell XPS 15 2018 i5 FHD 97Wh Sharp SHP149A LQ156M1, LED IGZO IPS InfinityEdge, 15.6", 1920x1080 | Dell XPS 15 9575 i7-8705G Sharp SHP148D, IPS, 15.6", 3840x2160 | Gigabyte Aero 15X v8 LGD05C0, IPS, 15.6", 1920x1080 | Asus ZenBook Pro 15 UX580GE AU Optronics B156ZAN03.1, IPS, 15.6", 3840x2160 | |
|---|---|---|---|---|---|---|
| Display | -4% | 1% | 14% | -2% | 28% | |
| Display P3 Coverage (%) | 68.5 | 66.6 -3% | 66 -4% | 78.7 15% | 63.6 -7% | 85.9 25% |
| sRGB Coverage (%) | 90.7 | 86.9 -4% | 96.5 6% | 97.9 8% | 93.8 3% | 100 10% |
| AdobeRGB 1998 Coverage (%) | 66.3 | 63.5 -4% | 66.7 1% | 79.2 19% | 64.9 -2% | 99.1 49% |
| Response Times | -8% | -19% | -27% | 58% | 1% | |
| Response Time Grey 50% / Grey 80% * (ms) | 38 ? | 41.2 ? -8% | 49 ? -29% | 48.4 ? -27% | 16.8 ? 56% | 44 ? -16% |
| Response Time Black / White * (ms) | 27.6 ? | 29.6 ? -7% | 30 ? -9% | 34.8 ? -26% | 11.2 ? 59% | 22.8 ? 17% |
| PWM Frequency (Hz) | 943 ? | 1000 | 961 ? | 1000 ? | ||
| Screen | 10% | 28% | 29% | 22% | 14% | |
| Brightness middle (cd/m²) | 329.3 | 338.7 3% | 413 25% | 488 48% | 313 -5% | 357.6 9% |
| Brightness (cd/m²) | 316 | 325 3% | 378 20% | 440 39% | 300 -5% | 350 11% |
| Brightness Distribution (%) | 84 | 91 8% | 86 2% | 81 -4% | 78 -7% | 85 1% |
| Black Level * (cd/m²) | 0.31 | 0.28 10% | 0.29 6% | 0.3 3% | 0.33 -6% | 0.35 -13% |
| Contrast (:1) | 1062 | 1210 14% | 1424 34% | 1627 53% | 948 -11% | 1022 -4% |
| Colorchecker dE 2000 * | 4.78 | 4.9 -3% | 2.44 49% | 3.16 34% | 1.29 73% | 4.12 14% |
| Colorchecker dE 2000 max. * | 11.75 | 8.7 26% | 4.46 62% | 8.8 25% | 2.04 83% | 9.91 16% |
| Colorchecker dE 2000 calibrated * | 3.51 | 2.48 29% | 4.23 -21% | |||
| Greyscale dE 2000 * | 7.9 | 5.5 30% | 2.48 69% | 3.3 58% | 0.69 91% | 1.8 77% |
| Gamma | 2.24 98% | 2.08 106% | 2.43 91% | 2.178 101% | 2.43 91% | 2.17 101% |
| CCT | 8323 78% | 7498 87% | 7006 93% | 6811 95% | 6550 99% | 6613 98% |
| Color Space (Percent of AdobeRGB 1998) (%) | 58.8 | 63.5 8% | 62 5% | 71.7 22% | 60 2% | 87.5 49% |
| Color Space (Percent of sRGB) (%) | 90.4 | 86.92 -4% | 96 6% | 97.9 8% | 94 4% | 100 11% |
| Média Total (Programa/Configurações) | -1% /
5% | 3% /
17% | 5% /
18% | 26% /
22% | 14% /
15% |
* ... menor é melhor
Exibir tempos de resposta
| ↔ Tempo de resposta preto para branco | ||
|---|---|---|
| 27.6 ms ... ascensão ↗ e queda ↘ combinadas | ↗ 15.6 ms ascensão | 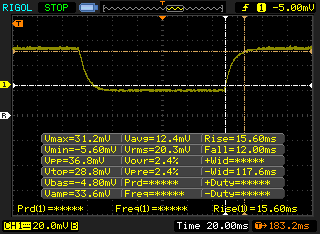 |
| ↘ 12 ms queda | ||
| A tela mostra taxas de resposta relativamente lentas em nossos testes e pode ser muito lenta para os jogadores. Em comparação, todos os dispositivos testados variam de 0.1 (mínimo) a 240 (máximo) ms. » 70 % de todos os dispositivos são melhores. Isso significa que o tempo de resposta medido é pior que a média de todos os dispositivos testados (19.8 ms). | ||
| ↔ Tempo de resposta 50% cinza a 80% cinza | ||
| 38 ms ... ascensão ↗ e queda ↘ combinadas | ↗ 20.4 ms ascensão | 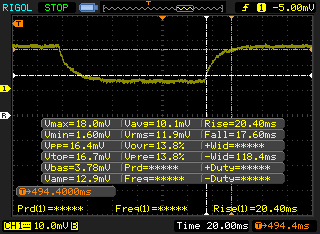 |
| ↘ 17.6 ms queda | ||
| A tela mostra taxas de resposta lentas em nossos testes e será insatisfatória para os jogadores. Em comparação, todos os dispositivos testados variam de 0.165 (mínimo) a 636 (máximo) ms. » 55 % de todos os dispositivos são melhores. Isso significa que o tempo de resposta medido é pior que a média de todos os dispositivos testados (31 ms). | ||
Cintilação da tela / PWM (modulação por largura de pulso)
| Tela tremeluzindo/PWM detectado | 943 Hz | ≤ 99 % configuração de brilho | 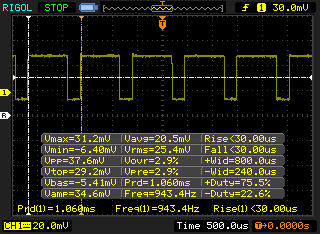 |
A luz de fundo da tela pisca em 943 Hz (pior caso, por exemplo, utilizando PWM) Cintilação detectada em uma configuração de brilho de 99 % e abaixo. Não deve haver cintilação ou PWM acima desta configuração de brilho. A frequência de 943 Hz é bastante alta, então a maioria dos usuários sensíveis ao PWM não deve notar nenhuma oscilação. [pwm_comparison] Em comparação: 52 % de todos os dispositivos testados não usam PWM para escurecer a tela. Se PWM foi detectado, uma média de 7753 (mínimo: 5 - máximo: 343500) Hz foi medida. | |||
| PCMark 8 Home Score Accelerated v2 | 3482 pontos | |
| PCMark 8 Work Score Accelerated v2 | 4323 pontos | |
| PCMark 10 Score | 3938 pontos | |
Ajuda | ||
| HP Spectre x360 15-ch011nr SK hynix PC401 NVMe 500 GB | HP Spectre x360 15t-bl100 Samsung PM961 NVMe MZVLW512HMJP | Dell XPS 15 9575 i7-8705G SK hynix PC401 NVMe 500 GB | Gigabyte Aero 15X v8 Toshiba NVMe THNSN5512GPU7 | Dell XPS 15 2018 i5 FHD 97Wh Lite-On CA3-8D256-Q11 | |
|---|---|---|---|---|---|
| AS SSD | 53% | 3% | 0% | -174% | |
| Copy Game MB/s (MB/s) | 1042 | 1134 9% | 944 -9% | 465.9 -55% | |
| Copy Program MB/s (MB/s) | 486.8 | 534 10% | 487.9 0% | 117.2 -76% | |
| Copy ISO MB/s (MB/s) | 1668 | 1936 16% | 1523 -9% | 632 -62% | |
| Score Total (Points) | 2037 | 3781 86% | 2132 5% | 2536 24% | 750 -63% |
| Score Write (Points) | 757 | 1556 106% | 807 7% | 939 24% | 58 -92% |
| Score Read (Points) | 859 | 1493 74% | 921 7% | 1092 27% | 492 -43% |
| Access Time Write * (ms) | 0.051 | 0.026 49% | 0.051 -0% | 0.046 10% | 0.889 -1643% |
| Access Time Read * (ms) | 0.054 | 0.04 26% | 0.044 19% | 0.119 -120% | 0.086 -59% |
| 4K-64 Write (MB/s) | 545 | 1262 132% | 637 17% | 742 36% | 19.19 -96% |
| 4K-64 Read (MB/s) | 646 | 1206 87% | 649 0% | 847 31% | 301.8 -53% |
| 4K Write (MB/s) | 93.2 | 141.1 51% | 94.3 1% | 80.4 -14% | 5.12 -95% |
| 4K Read (MB/s) | 38.76 | 51.9 34% | 41.38 7% | 23.36 -40% | 32.5 -16% |
| Seq Write (MB/s) | 1189 | 1530 29% | 752 -37% | 1163 -2% | 340.3 -71% |
| Seq Read (MB/s) | 1739 | 2342 35% | 2302 32% | 2213 27% | 1574 -9% |
* ... menor é melhor

| 3DMark 11 Performance | 4969 pontos | |
| 3DMark Cloud Gate Standard Score | 12588 pontos | |
| 3DMark Fire Strike Score | 3267 pontos | |
Ajuda | ||
| baixo | média | alto | ultra | |
|---|---|---|---|---|
| BioShock Infinite (2013) | 197.4 | 114.2 | 96 | 35.2 |
| Batman: Arkham Knight (2015) | 60 | 51 | 20 | |
| Rise of the Tomb Raider (2016) | 67.4 | 43.1 | 23 | 18.5 |
Barulho
| Ocioso |
| 29.2 / 29.2 / 29.2 dB |
| Carga |
| 29.2 / 45.7 dB |
 | ||
30 dB silencioso 40 dB(A) audível 50 dB(A) ruidosamente alto |
||
min: | ||
| HP Spectre x360 15-ch011nr GeForce MX150, i5-8550U, SK hynix PC401 NVMe 500 GB | HP Spectre x360 15t-bl100 GeForce MX150, i5-8550U, Samsung PM961 NVMe MZVLW512HMJP | Dell XPS 15 9575 i7-8705G Vega M GL / 870, i7-8705G, SK hynix PC401 NVMe 500 GB | Gigabyte Aero 15X v8 GeForce GTX 1070 Max-Q, i7-8750H, Toshiba NVMe THNSN5512GPU7 | Asus ZenBook Pro 15 UX580GE GeForce GTX 1050 Ti Mobile, i9-8950HK, Samsung SSD PM961 1TB M.2 PCIe 3.0 x4 NVMe (MZVLW1T0) | Dell XPS 15 2018 i5 FHD 97Wh GeForce GTX 1050 Mobile, i5-8300H, Lite-On CA3-8D256-Q11 | |
|---|---|---|---|---|---|---|
| Noise | -2% | -1% | -21% | -9% | -7% | |
| desligado / ambiente * (dB) | 28.6 | 28.4 1% | 28.2 1% | 29 -1% | 28 2% | 30.3 -6% |
| Idle Minimum * (dB) | 29.2 | 28.4 3% | 28.2 3% | 30 -3% | 28.6 2% | 30.3 -4% |
| Idle Average * (dB) | 29.2 | 28.4 3% | 28.2 3% | 31 -6% | 29.9 -2% | 30.3 -4% |
| Idle Maximum * (dB) | 29.2 | 28.4 3% | 28.2 3% | 35 -20% | 30.5 -4% | 30.3 -4% |
| Load Average * (dB) | 29.2 | 41.6 -42% | 29 1% | 49 -68% | 42.5 -46% | 37.1 -27% |
| Witcher 3 ultra * (dB) | 38.4 | 36.1 6% | 44.7 -16% | 51 -33% | 44.8 -17% | 43.3 -13% |
| Load Maximum * (dB) | 45.7 | 41.6 9% | 47.4 -4% | 54 -18% | 44.8 2% | 43 6% |
* ... menor é melhor
(-) A temperatura máxima no lado superior é 46.4 °C / 116 F, em comparação com a média de 36.8 °C / 98 F , variando de 21 a 71 °C para a classe Multimedia.
(-) A parte inferior aquece até um máximo de 49 °C / 120 F, em comparação com a média de 39.1 °C / 102 F
(+) Em uso inativo, a temperatura média para o lado superior é 27.7 °C / 82 F, em comparação com a média do dispositivo de 31.3 °C / ### class_avg_f### F.
(±) Jogando The Witcher 3, a temperatura média para o lado superior é 36.3 °C / 97 F, em comparação com a média do dispositivo de 31.3 °C / ## #class_avg_f### F.
(+) Os apoios para as mãos e o touchpad estão atingindo a temperatura máxima da pele (33 °C / 91.4 F) e, portanto, não estão quentes.
(-) A temperatura média da área do apoio para as mãos de dispositivos semelhantes foi 28.7 °C / 83.7 F (-4.3 °C / -7.7 F).
HP Spectre x360 15-ch011nr análise de áudio
(±) | o volume do alto-falante é médio, mas bom (###valor### dB)
Graves 100 - 315Hz
(-) | quase nenhum baixo - em média 22.3% menor que a mediana
(±) | a linearidade dos graves é média (11.5% delta para a frequência anterior)
Médios 400 - 2.000 Hz
(+) | médios equilibrados - apenas 2.4% longe da mediana
(±) | a linearidade dos médios é média (7.5% delta para frequência anterior)
Altos 2 - 16 kHz
(+) | agudos equilibrados - apenas 4% longe da mediana
(+) | os máximos são lineares (6.2% delta da frequência anterior)
Geral 100 - 16.000 Hz
(±) | a linearidade do som geral é média (17.7% diferença em relação à mediana)
Comparado com a mesma classe
» 51% de todos os dispositivos testados nesta classe foram melhores, 7% semelhantes, 42% piores
» O melhor teve um delta de 5%, a média foi 17%, o pior foi 45%
Comparado com todos os dispositivos testados
» 35% de todos os dispositivos testados foram melhores, 8% semelhantes, 57% piores
» O melhor teve um delta de 4%, a média foi 23%, o pior foi 134%
Apple MacBook 12 (Early 2016) 1.1 GHz análise de áudio
(+) | os alto-falantes podem tocar relativamente alto (###valor### dB)
Graves 100 - 315Hz
(±) | graves reduzidos - em média 11.3% menor que a mediana
(±) | a linearidade dos graves é média (14.2% delta para a frequência anterior)
Médios 400 - 2.000 Hz
(+) | médios equilibrados - apenas 2.4% longe da mediana
(+) | médios são lineares (5.5% delta para frequência anterior)
Altos 2 - 16 kHz
(+) | agudos equilibrados - apenas 2% longe da mediana
(+) | os máximos são lineares (4.5% delta da frequência anterior)
Geral 100 - 16.000 Hz
(+) | o som geral é linear (10.2% diferença em relação à mediana)
Comparado com a mesma classe
» 7% de todos os dispositivos testados nesta classe foram melhores, 2% semelhantes, 91% piores
» O melhor teve um delta de 5%, a média foi 18%, o pior foi 53%
Comparado com todos os dispositivos testados
» 5% de todos os dispositivos testados foram melhores, 1% semelhantes, 94% piores
» O melhor teve um delta de 4%, a média foi 23%, o pior foi 134%
| desligado | |
| Ocioso | |
| Carga |
|
Key:
min: | |
| HP Spectre x360 15-ch011nr i5-8550U, GeForce MX150, SK hynix PC401 NVMe 500 GB, IPS, 3840x2160, 15.6" | HP Spectre x360 15t-bl100 i5-8550U, GeForce MX150, Samsung PM961 NVMe MZVLW512HMJP, IPS, 3840x2160, 15.6" | Dell XPS 15 2018 i5 FHD 97Wh i5-8300H, GeForce GTX 1050 Mobile, Lite-On CA3-8D256-Q11, LED IGZO IPS InfinityEdge, 1920x1080, 15.6" | Dell XPS 15 9575 i7-8705G i7-8705G, Vega M GL / 870, SK hynix PC401 NVMe 500 GB, IPS, 3840x2160, 15.6" | Asus ZenBook Pro 15 UX580GE i9-8950HK, GeForce GTX 1050 Ti Mobile, Samsung SSD PM961 1TB M.2 PCIe 3.0 x4 NVMe (MZVLW1T0), IPS, 3840x2160, 15.6" | Acer Swift 3 SF315-41-R6J9 R7 2700U, Vega 10, Micron SSD 1100 SED 512GB, M.2 (MTFDDAV512TBN), IPS, 1920x1080, 15.6" | |
|---|---|---|---|---|---|---|
| Power Consumption | -25% | 10% | -18% | -69% | 30% | |
| Idle Minimum * (Watt) | 5.3 | 11.6 -119% | 2.9 45% | 6.2 -17% | 11.7 -121% | 5.9 -11% |
| Idle Average * (Watt) | 9.8 | 13.8 -41% | 5.8 41% | 12.9 -32% | 18.5 -89% | 8.6 12% |
| Idle Maximum * (Watt) | 12.6 | 14.2 -13% | 7.5 40% | 13.6 -8% | 22.8 -81% | 8.7 31% |
| Load Average * (Watt) | 73 | 67.9 7% | 77.5 -6% | 76.1 -4% | 97.5 -34% | 32.8 55% |
| Witcher 3 ultra * (Watt) | 67.6 | 59 13% | 84 -24% | 84.3 -25% | 102.9 -52% | 38.2 43% |
| Load Maximum * (Watt) | 80 | 76.9 4% | 107 -34% | 99.4 -24% | 111.1 -39% | 40.9 49% |
* ... menor é melhor
| HP Spectre x360 15-ch011nr i5-8550U, GeForce MX150, 84 Wh | HP Spectre x360 15t-bl100 i5-8550U, GeForce MX150, 79.2 Wh | Dell XPS 15 2018 i5 FHD 97Wh i5-8300H, GeForce GTX 1050 Mobile, 97 Wh | Dell XPS 15 9575 i7-8705G i7-8705G, Vega M GL / 870, 75 Wh | Asus ZenBook Pro 15 UX580GE i9-8950HK, GeForce GTX 1050 Ti Mobile, 71 Wh | Acer Swift 3 SF315-41-R6J9 R7 2700U, Vega 10, 49 Wh | |
|---|---|---|---|---|---|---|
| Duração da bateria | -6% | 17% | -38% | -31% | -35% | |
| Reader / Idle (h) | 15.5 | 15.6 1% | 11.2 -28% | 14 -10% | 13.3 -14% | |
| WiFi v1.3 (h) | 10.4 | 8.5 -18% | 15.7 51% | 7 -33% | 6.3 -39% | 5.3 -49% |
| Load (h) | 2.3 | 2.3 0% | 1.9 -17% | 1.1 -52% | 1.3 -43% | 1.3 -43% |
| Witcher 3 ultra (h) | 1 |
Pro
Contra
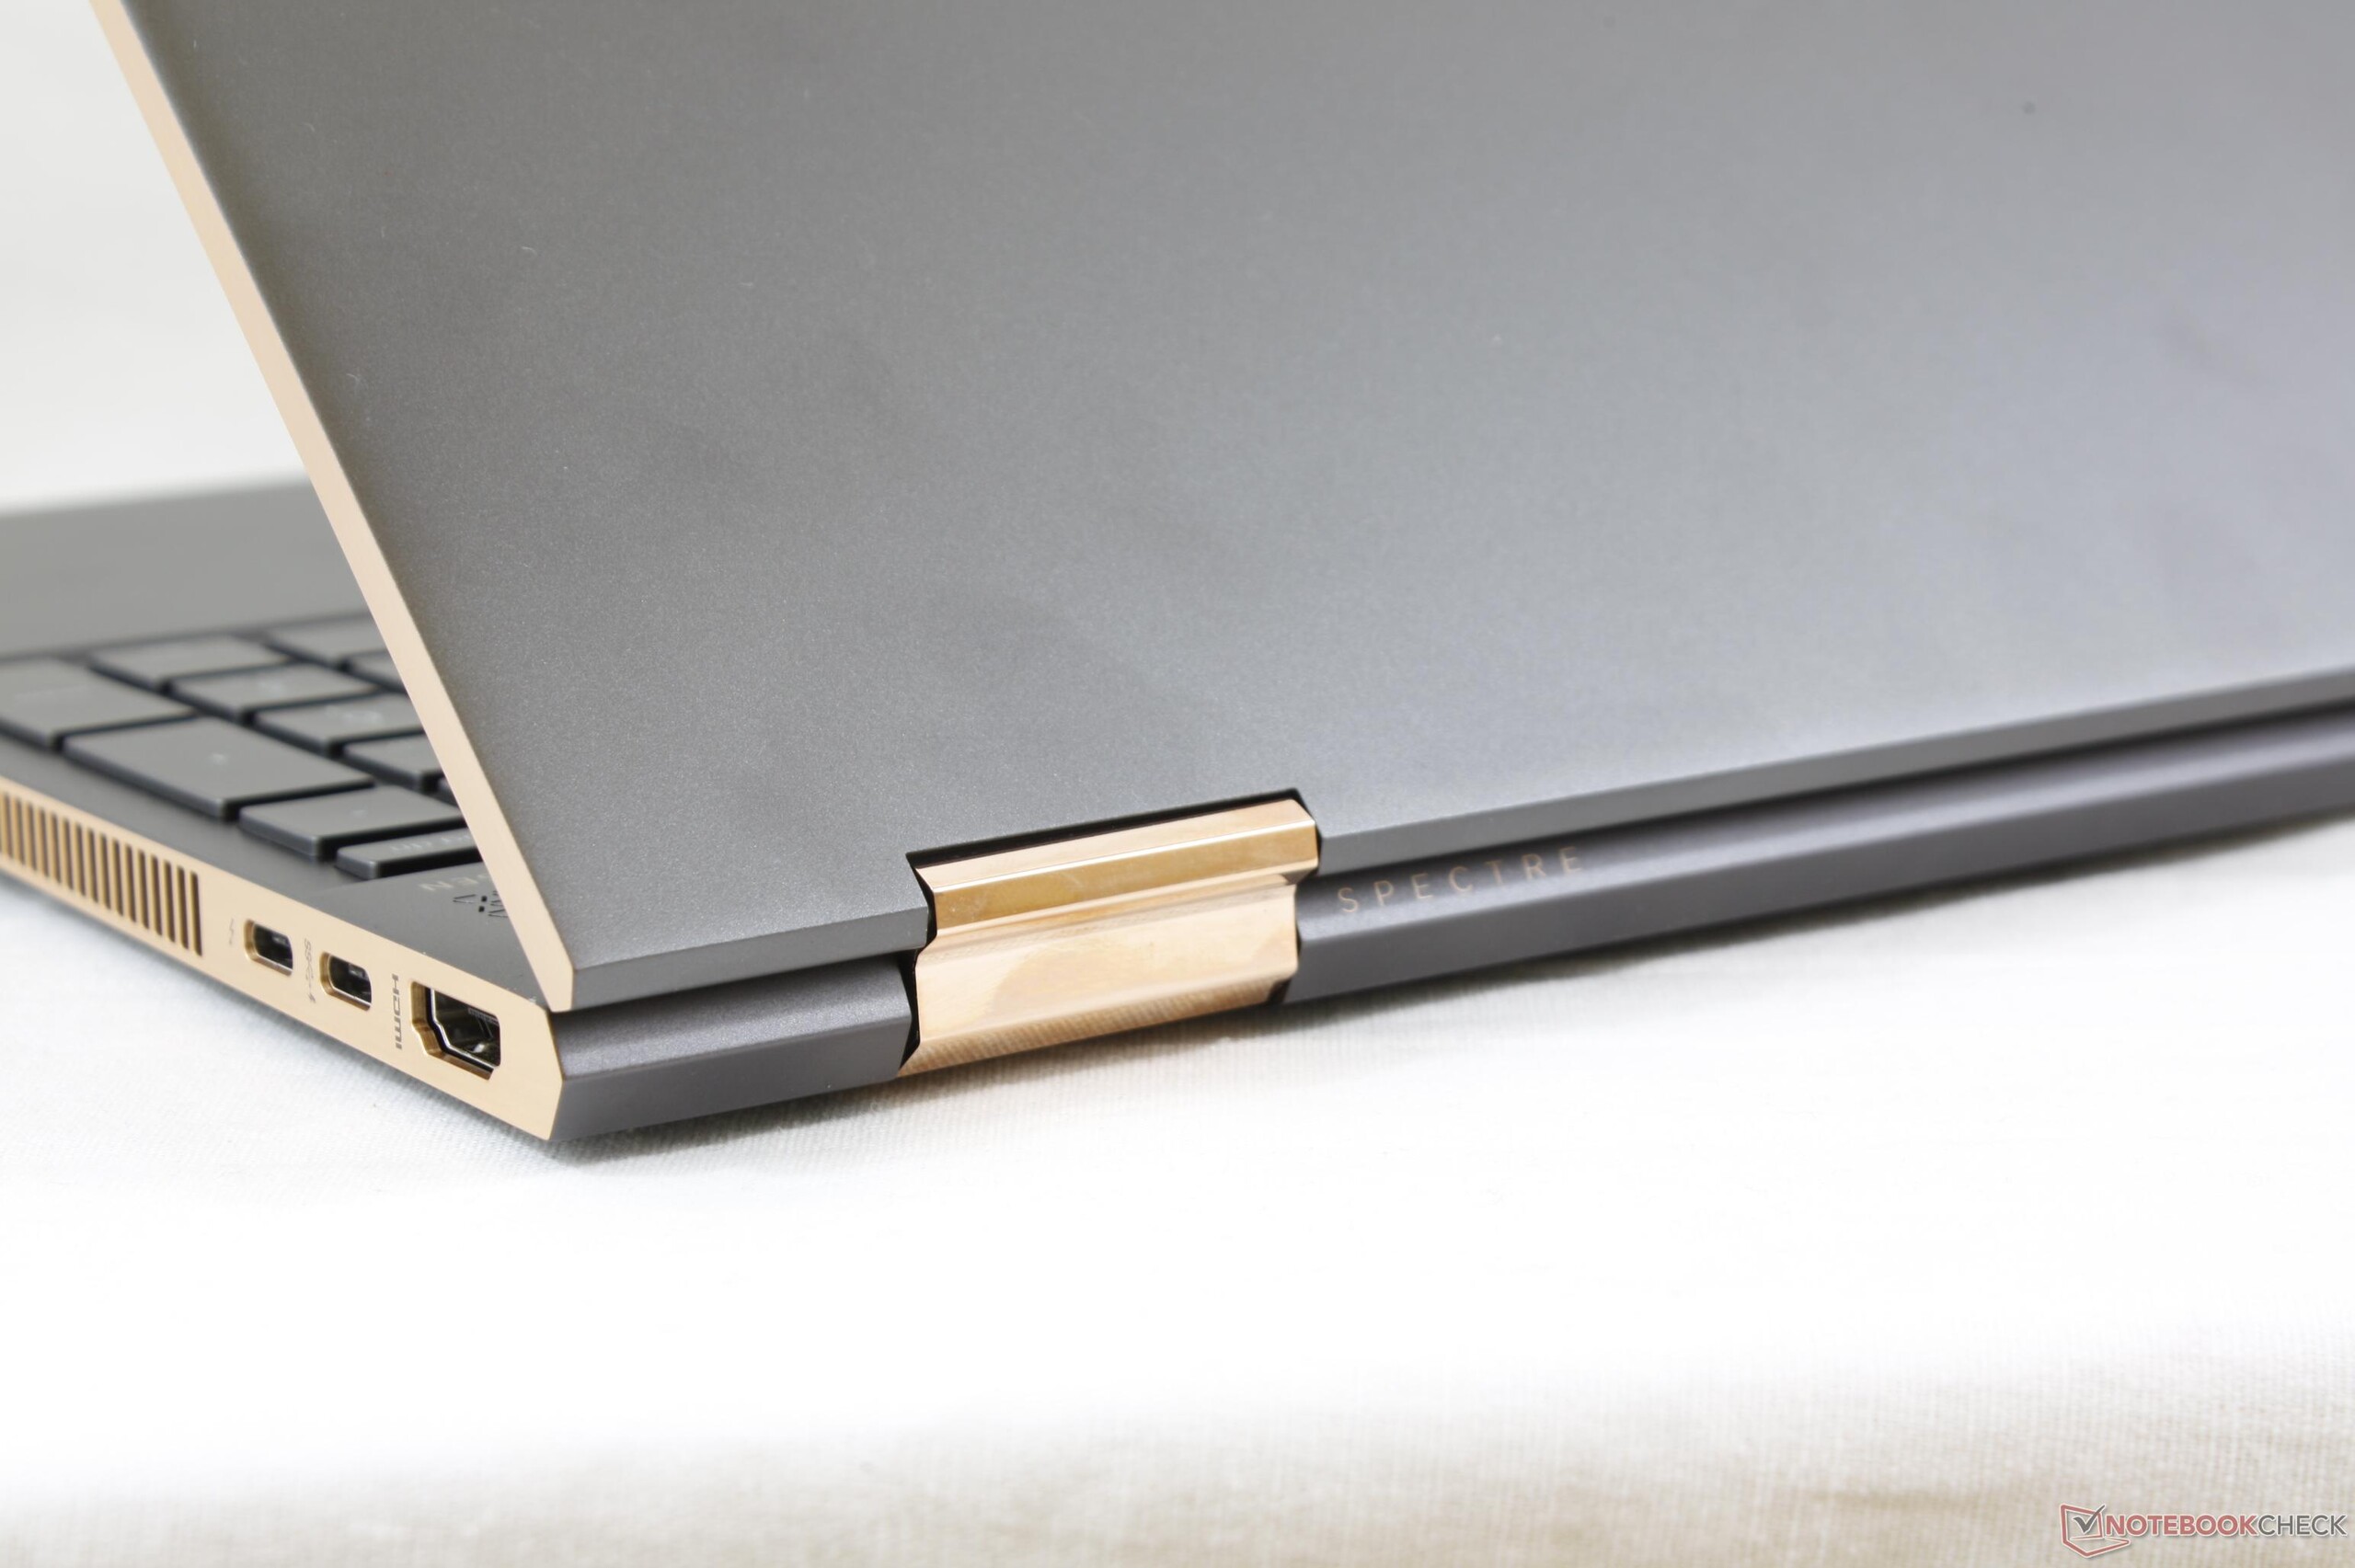
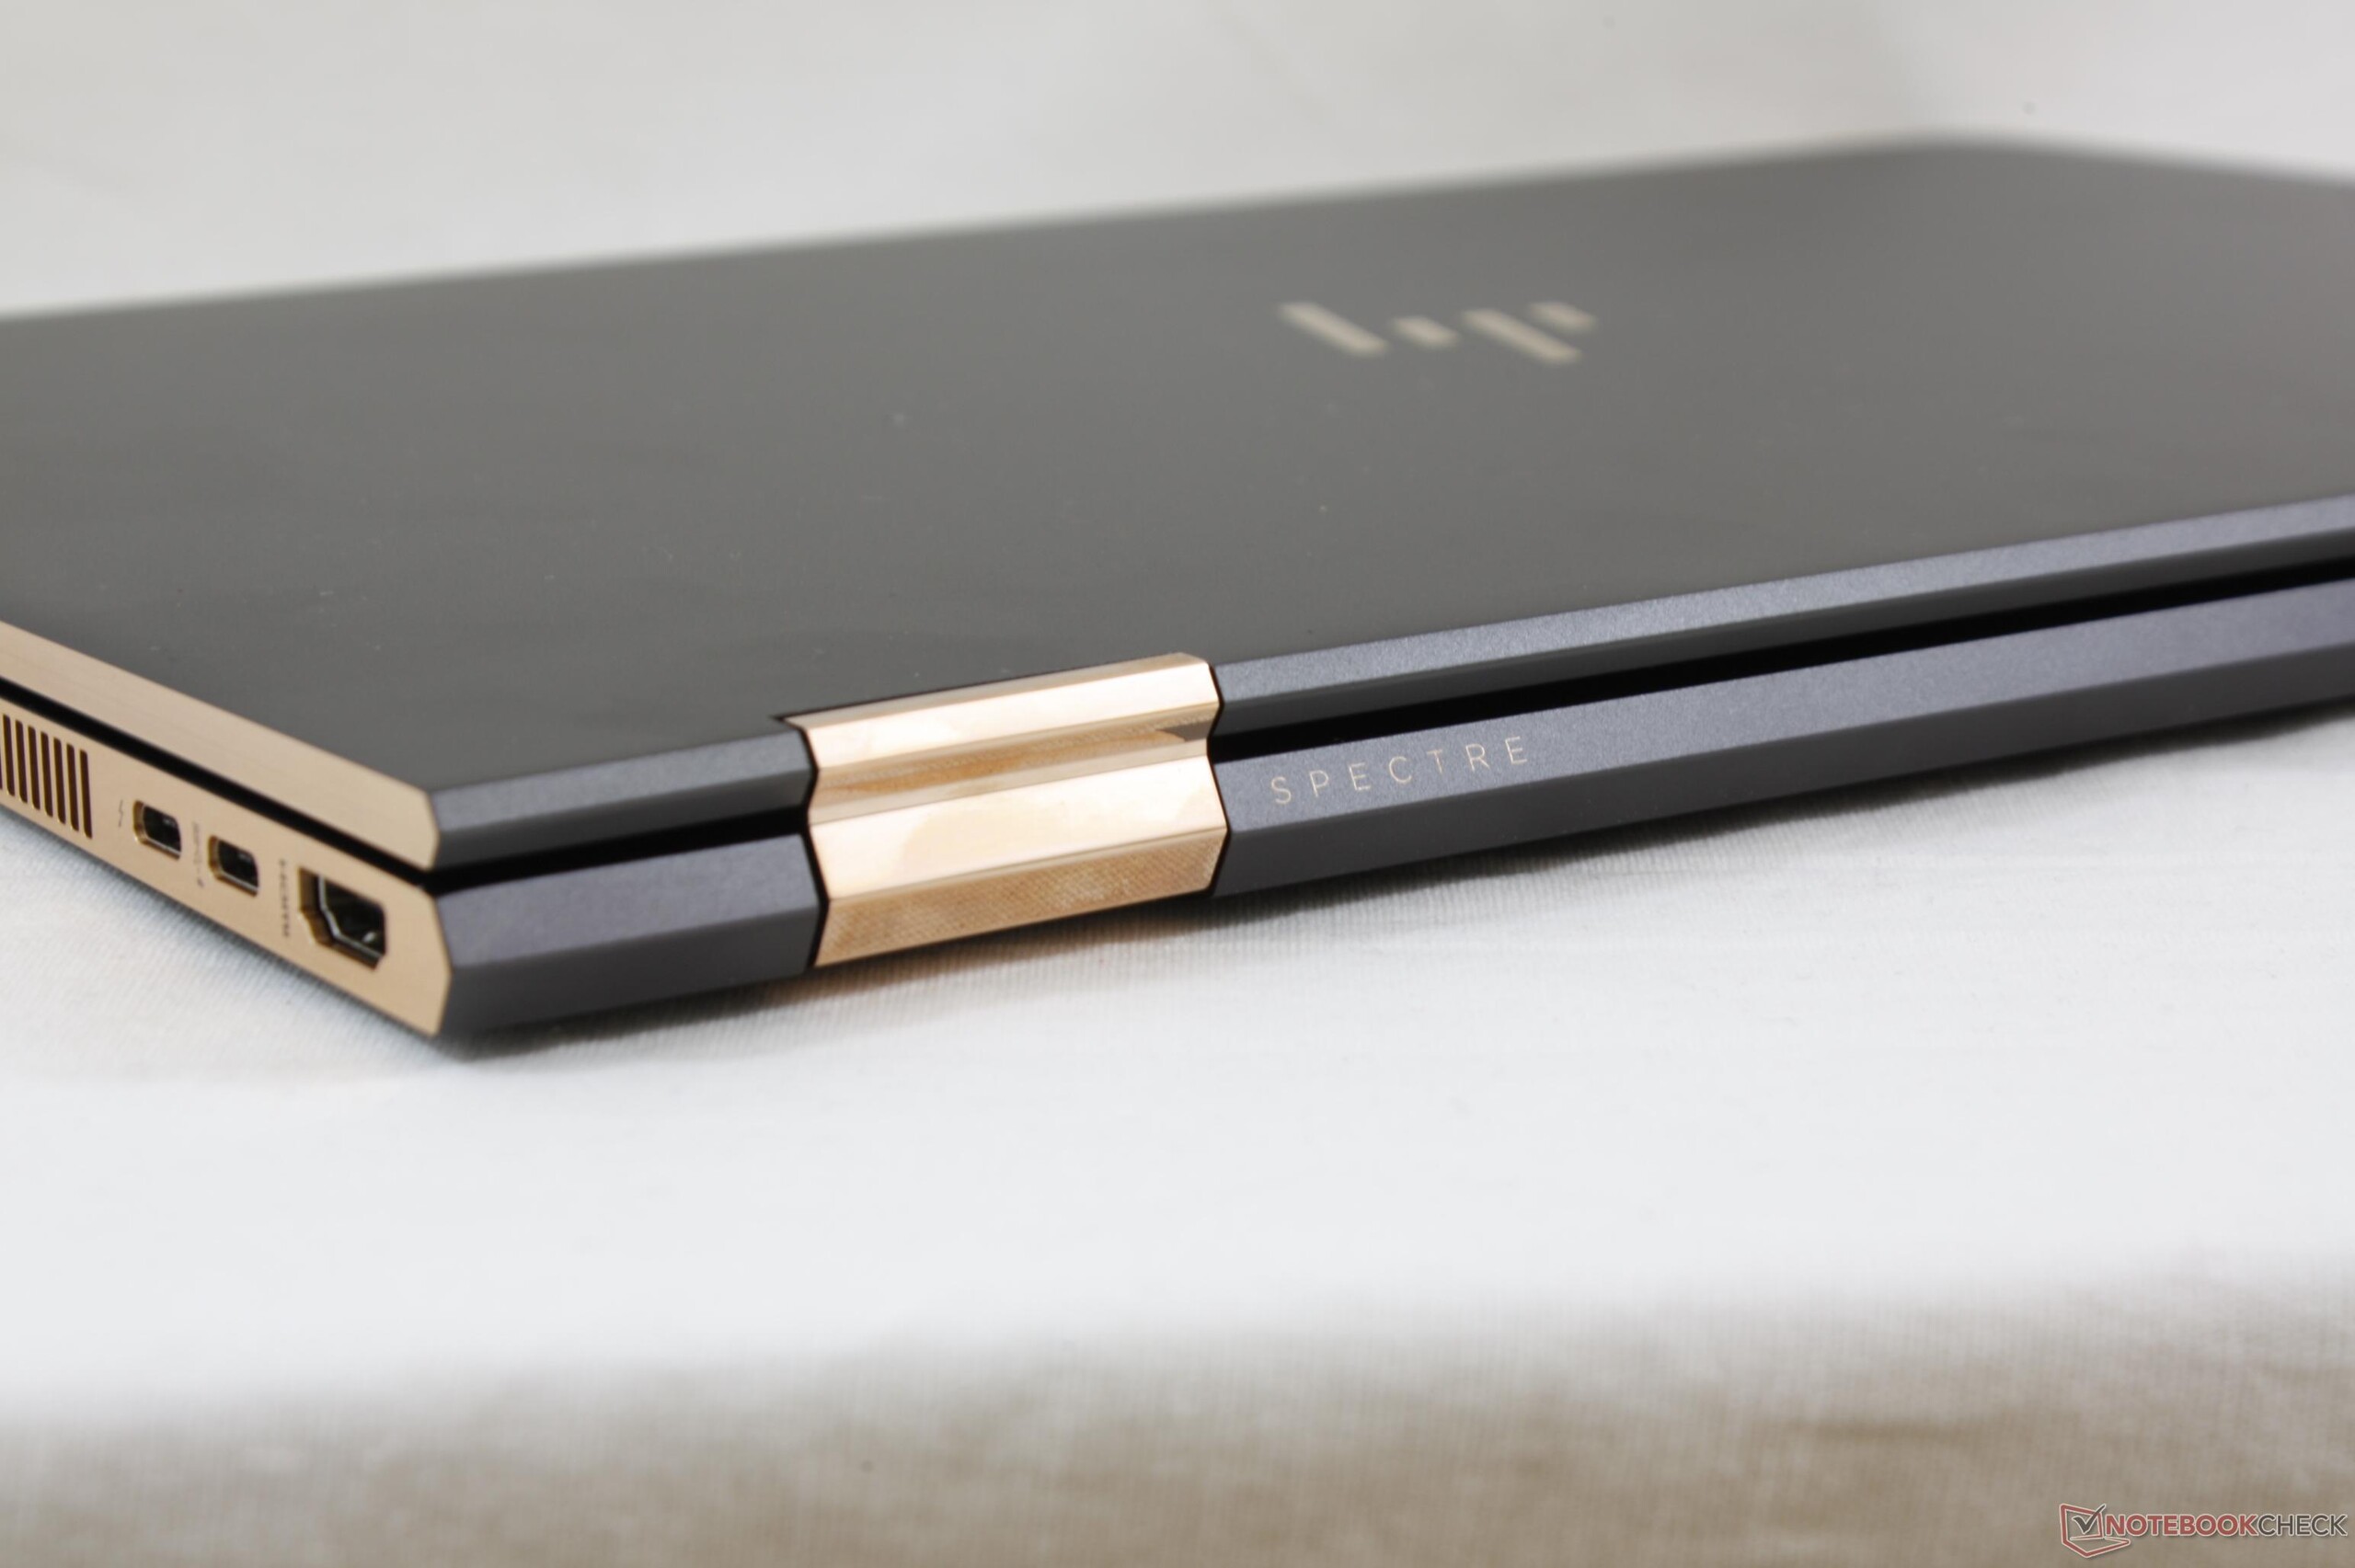
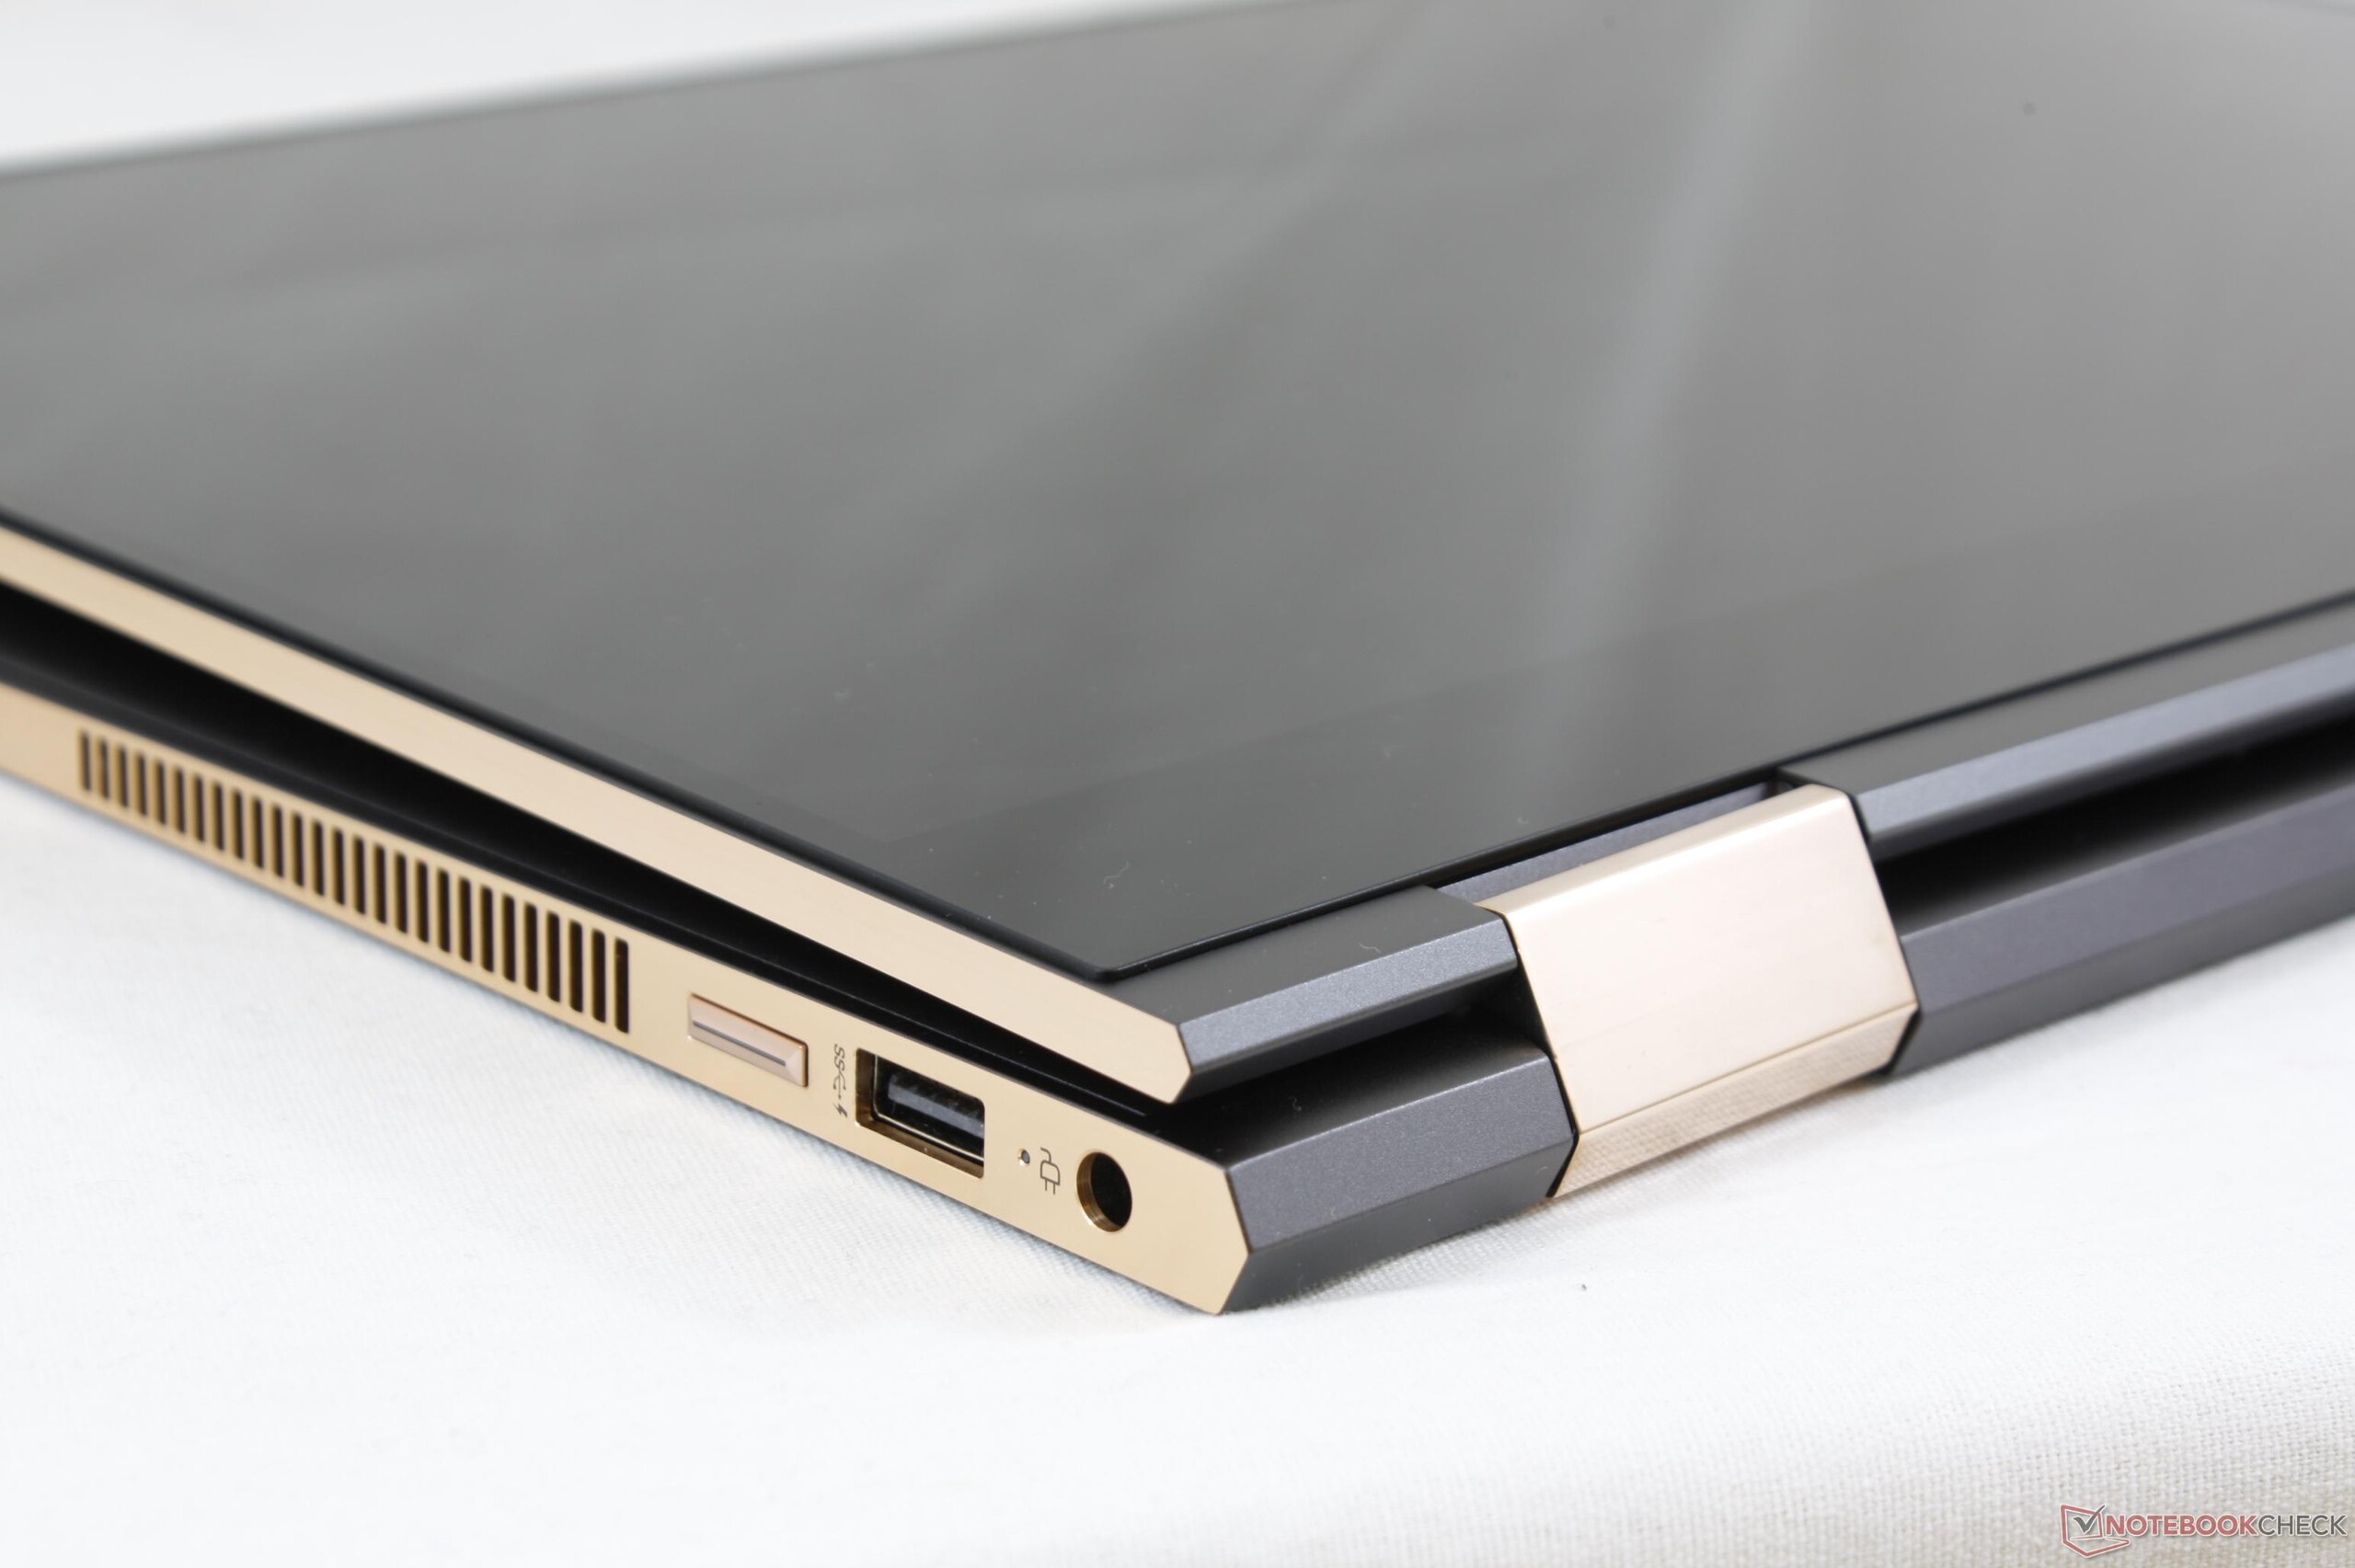
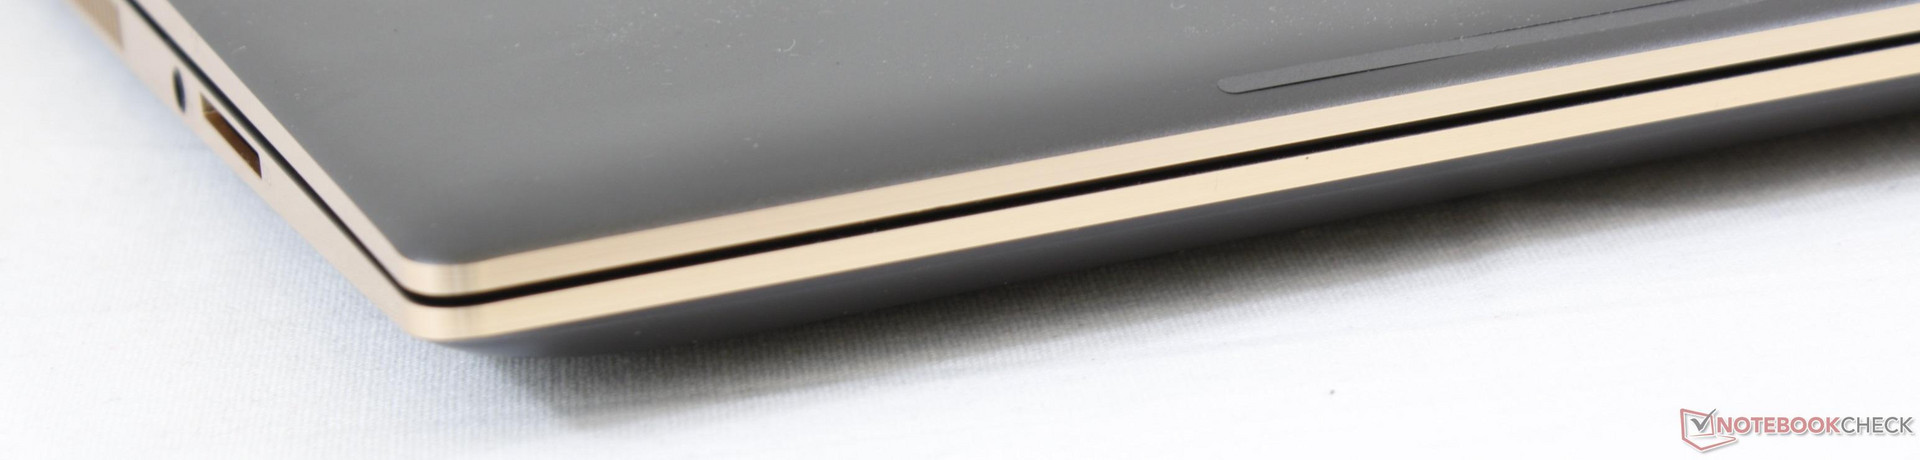
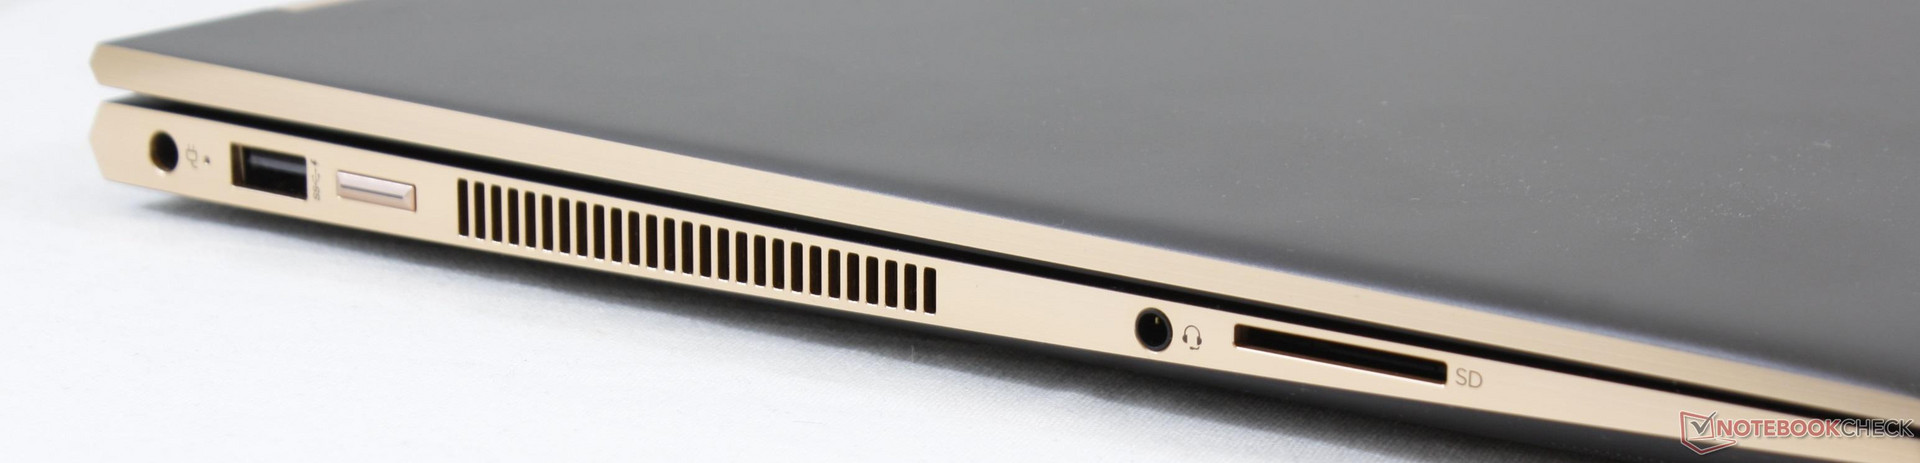
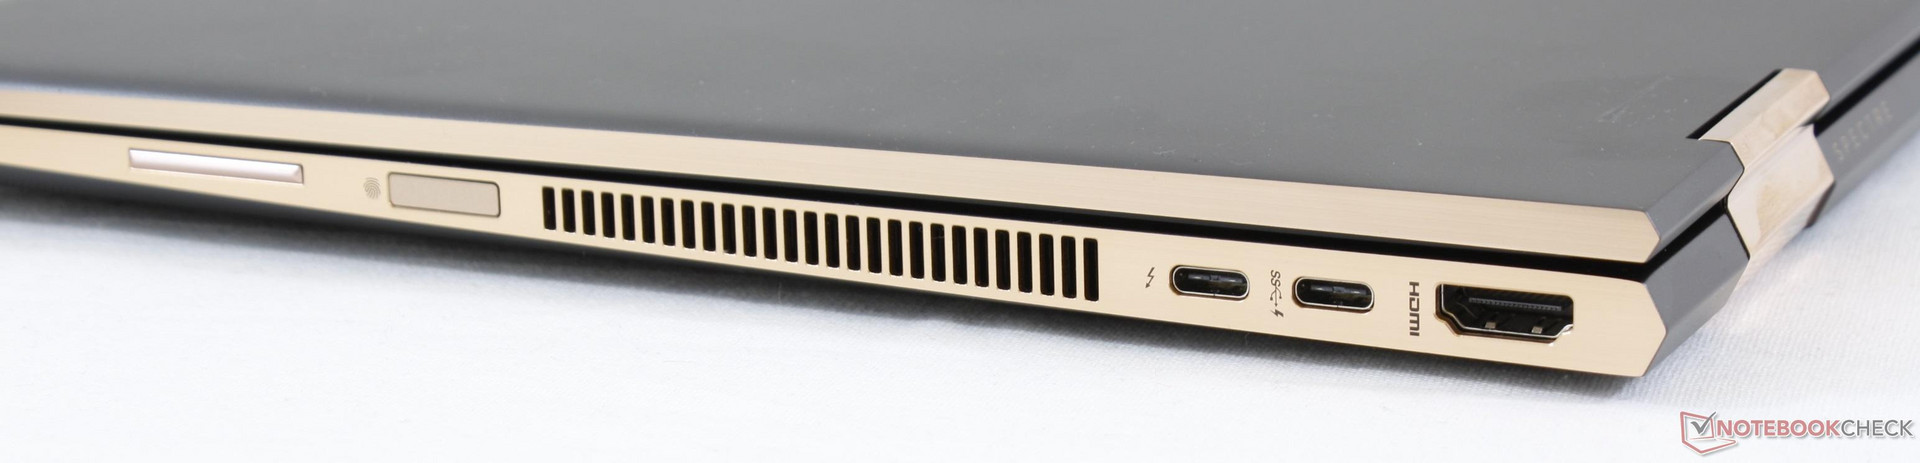
Enquanto a maioria dos OEMs tendem a ficar mais finos, menores e mais leves em cada geração sucessora, o HP teve a coragem de ficar um pouco mais grosso e a aposta valeu a pena. A terceira geração do Spectre x360 15 é mais silenciosa com temperaturas do núcleo mais baixas do que no modelo do ano passado, ao mesmo tempo em que oferece mais recursos para justificar o aumento do tamanho marginal. Talvez o melhor de tudo, a HP não encontrou a necessidade de reposicionar a webcam ou colocar portas USB tipo A, leitores SD de tamanho completo ou o tradicional teclado numérico - todos atributos importantes para ter produtividade. Não podemos necessariamente dizer o mesmo de portáteis concorrentes como o popular Dell XPS 15 9570 ou MacBook Pro 15.
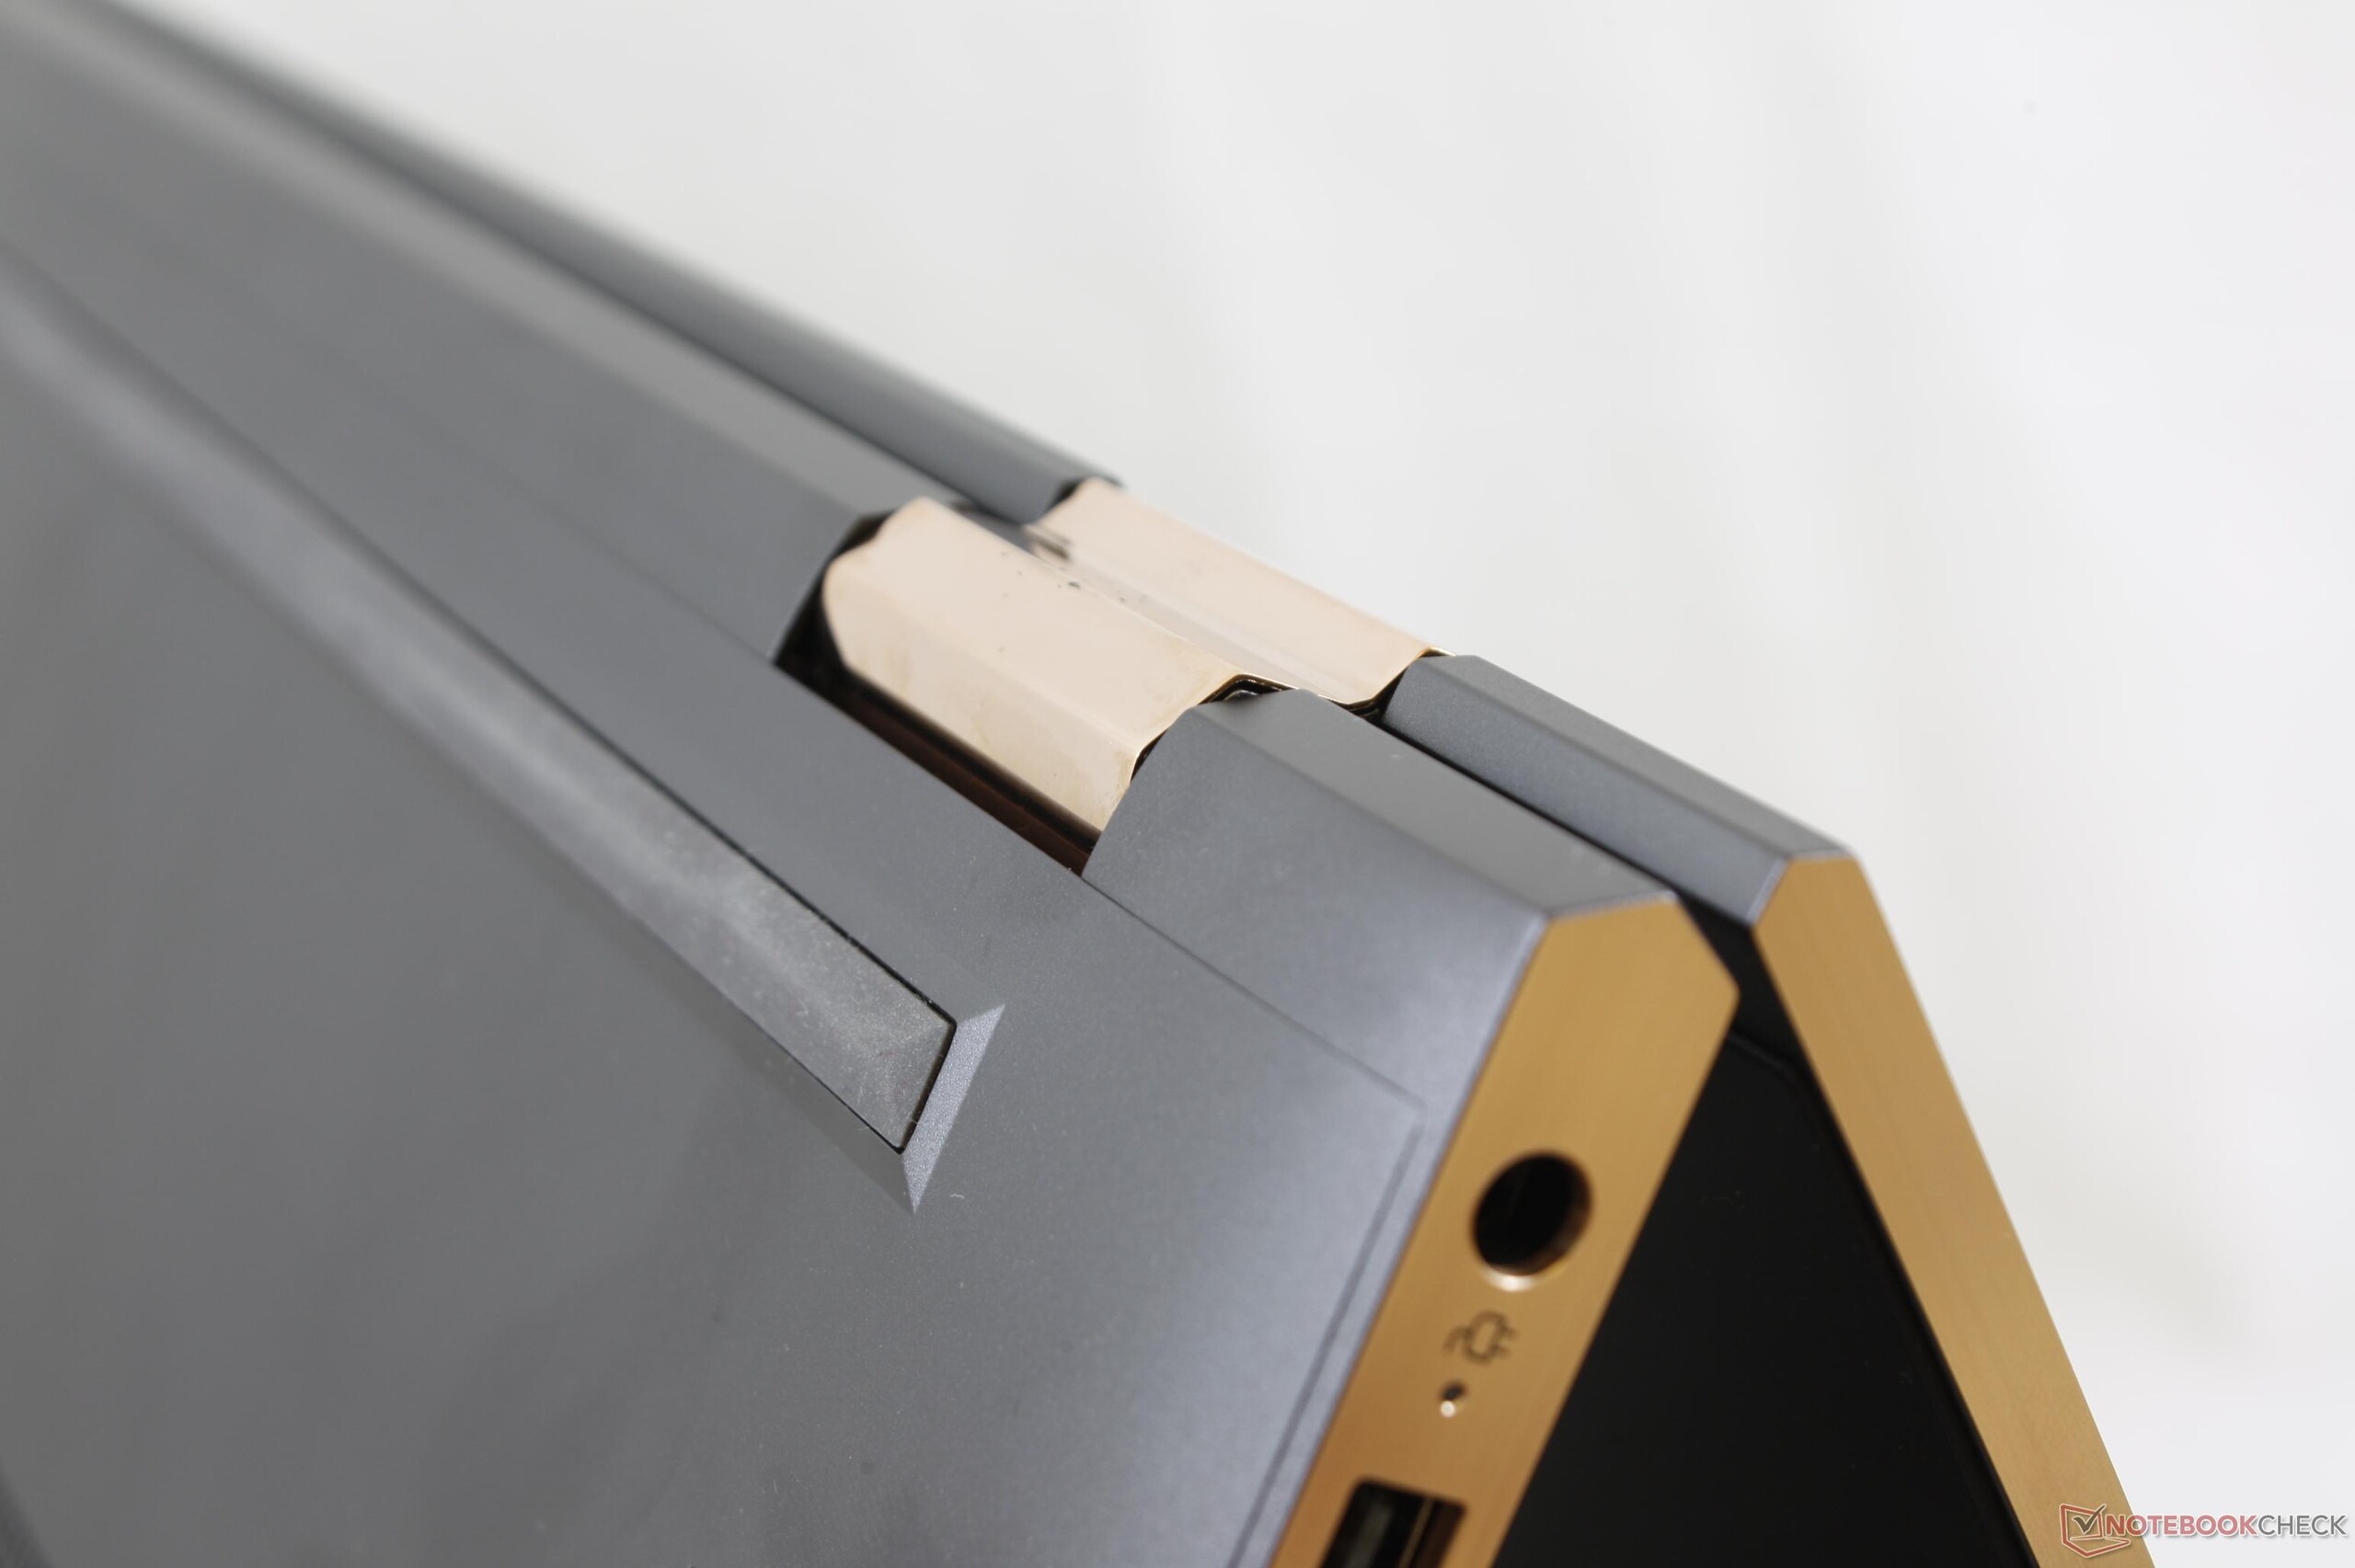
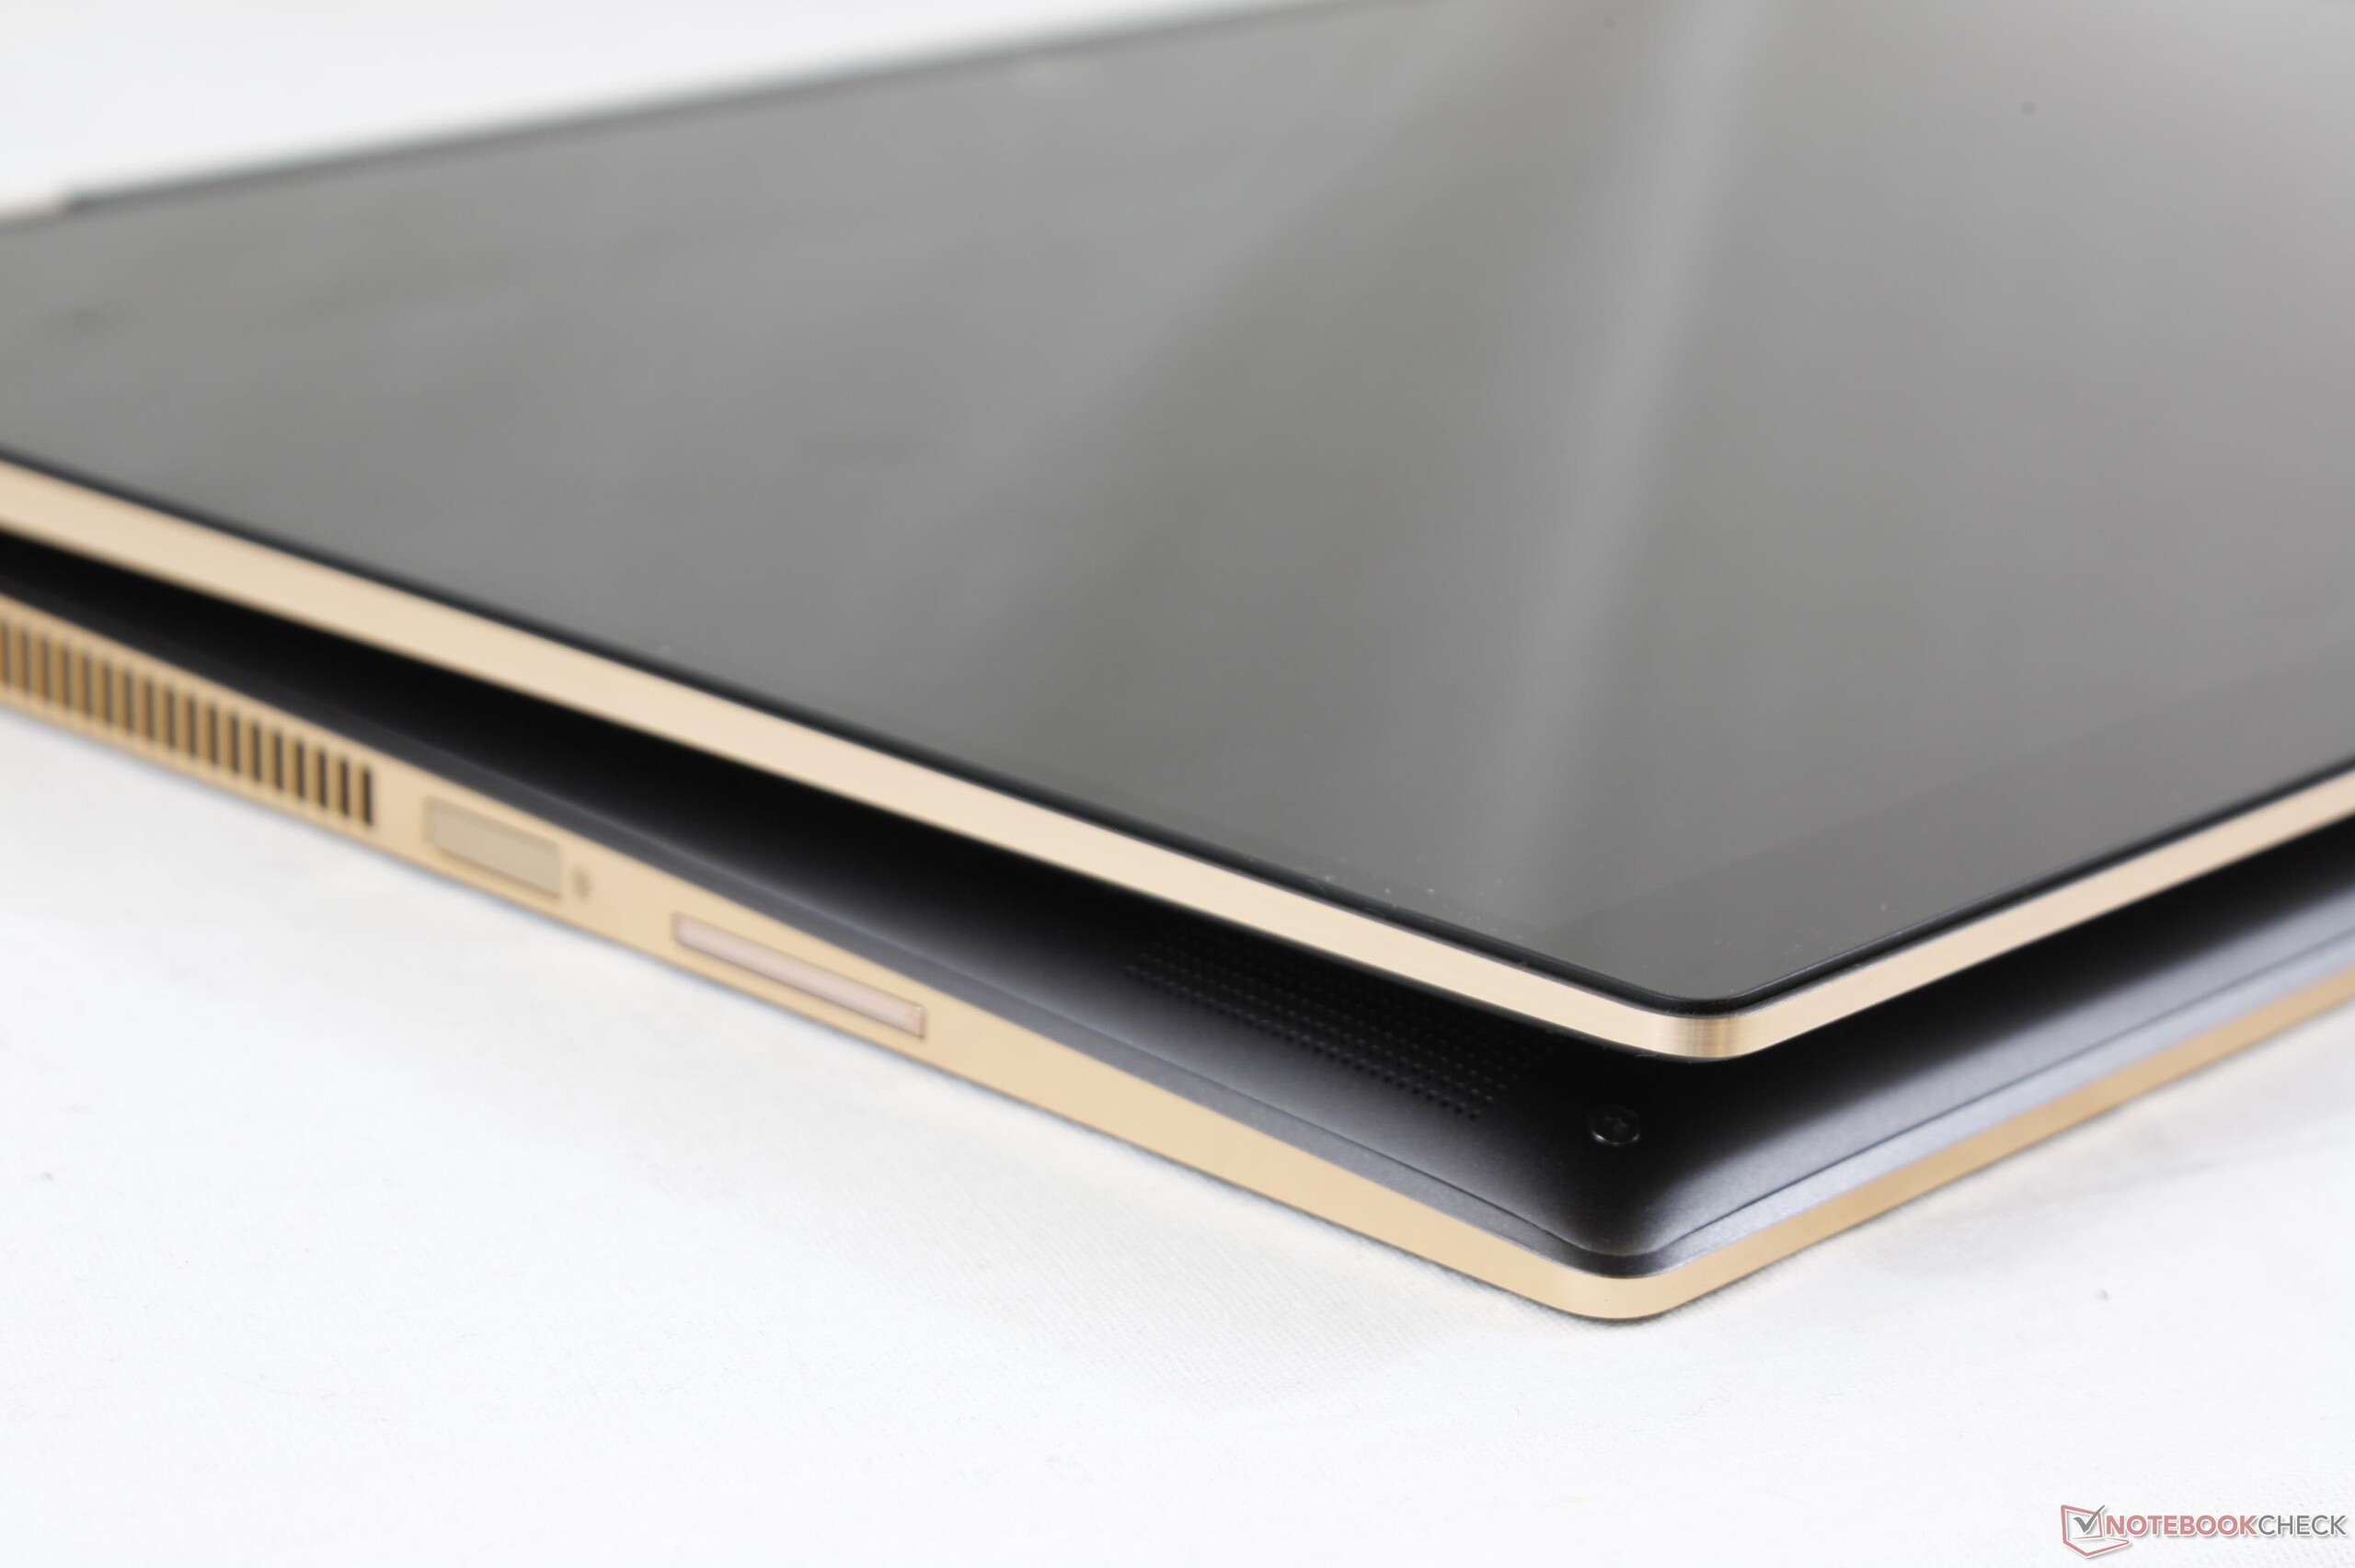
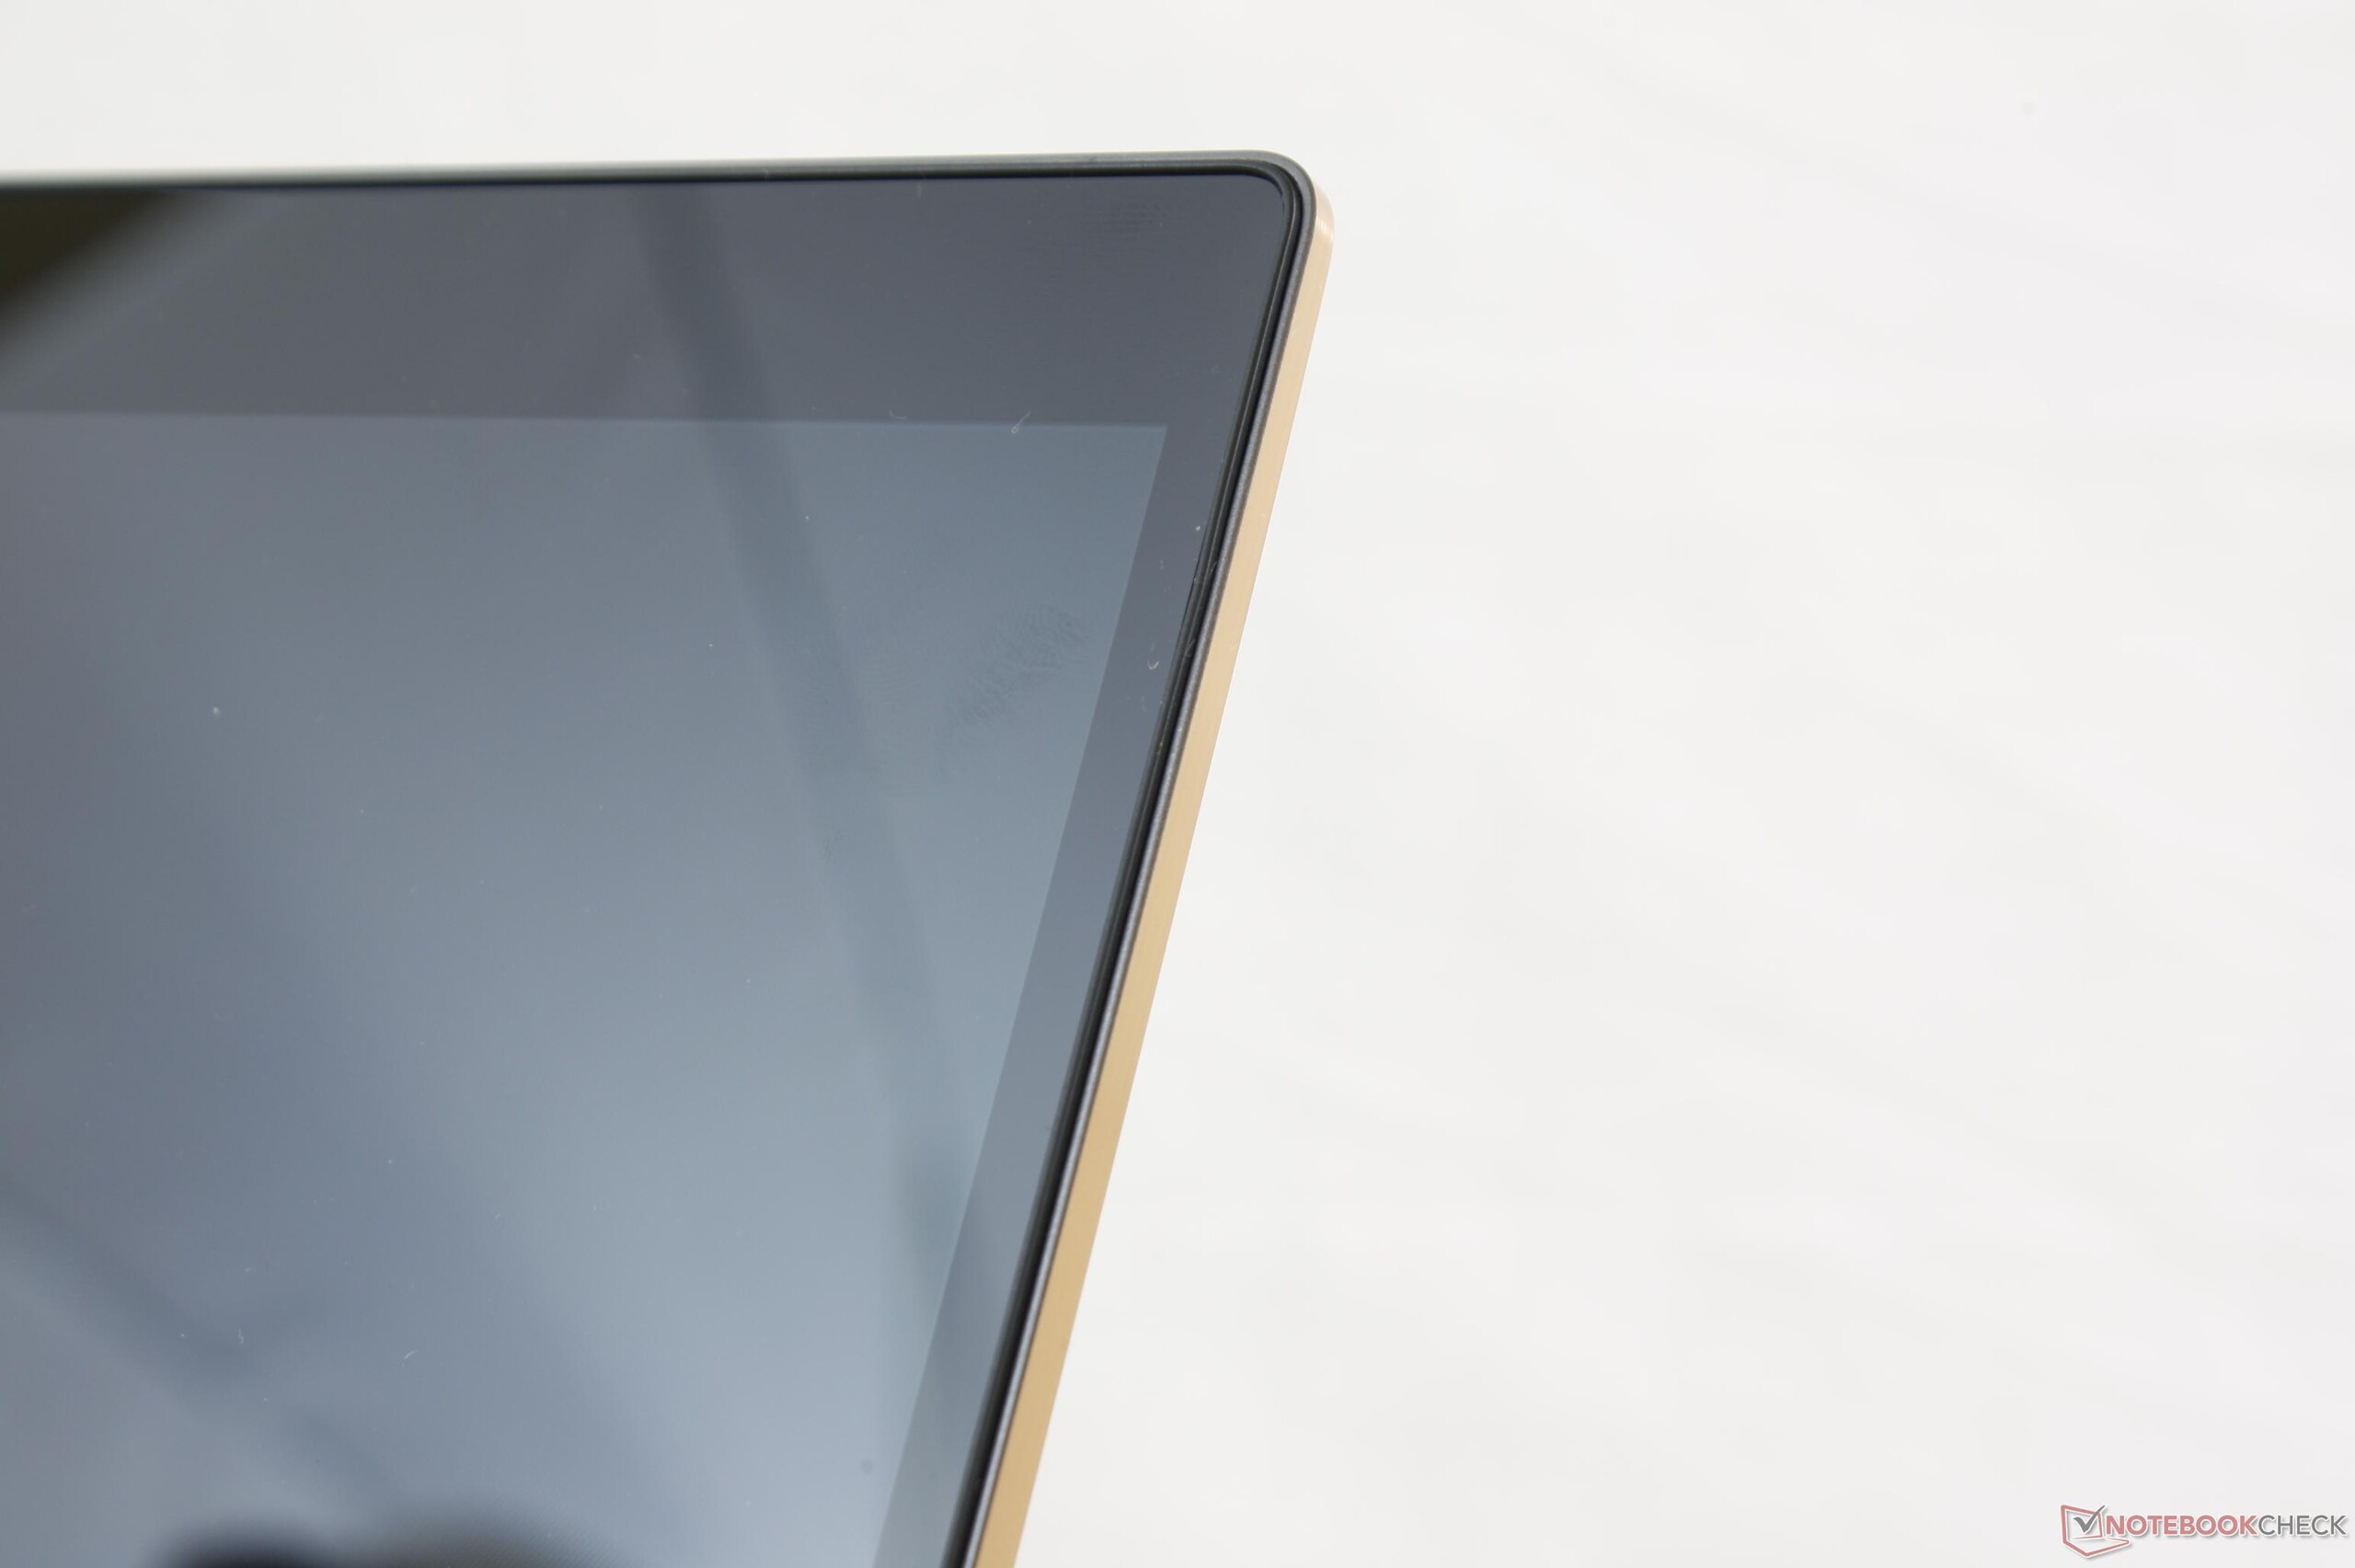
Sendo um pouco maior que o 2017 Spectre x360 15, no entanto, o modelo 2018 não resolve o principal problema que vem afligindo a série Spectre x360 desde 2016. Ou seja, este ainda é um portátil pesado e um pouco desconfortável para usar no modo tablet. O marco superior ainda é bastante grosso em comparação com a concorrência e esperamos que a HP tenha aumentado a luz de fundo da tela para uma melhor usabilidade em ambientes externos. Por outro lado, estes são preços justos para pagar por uma máquina bem construída e inflexível, digna de estar de igual para igual com o XPS 15 9575 e 9570.
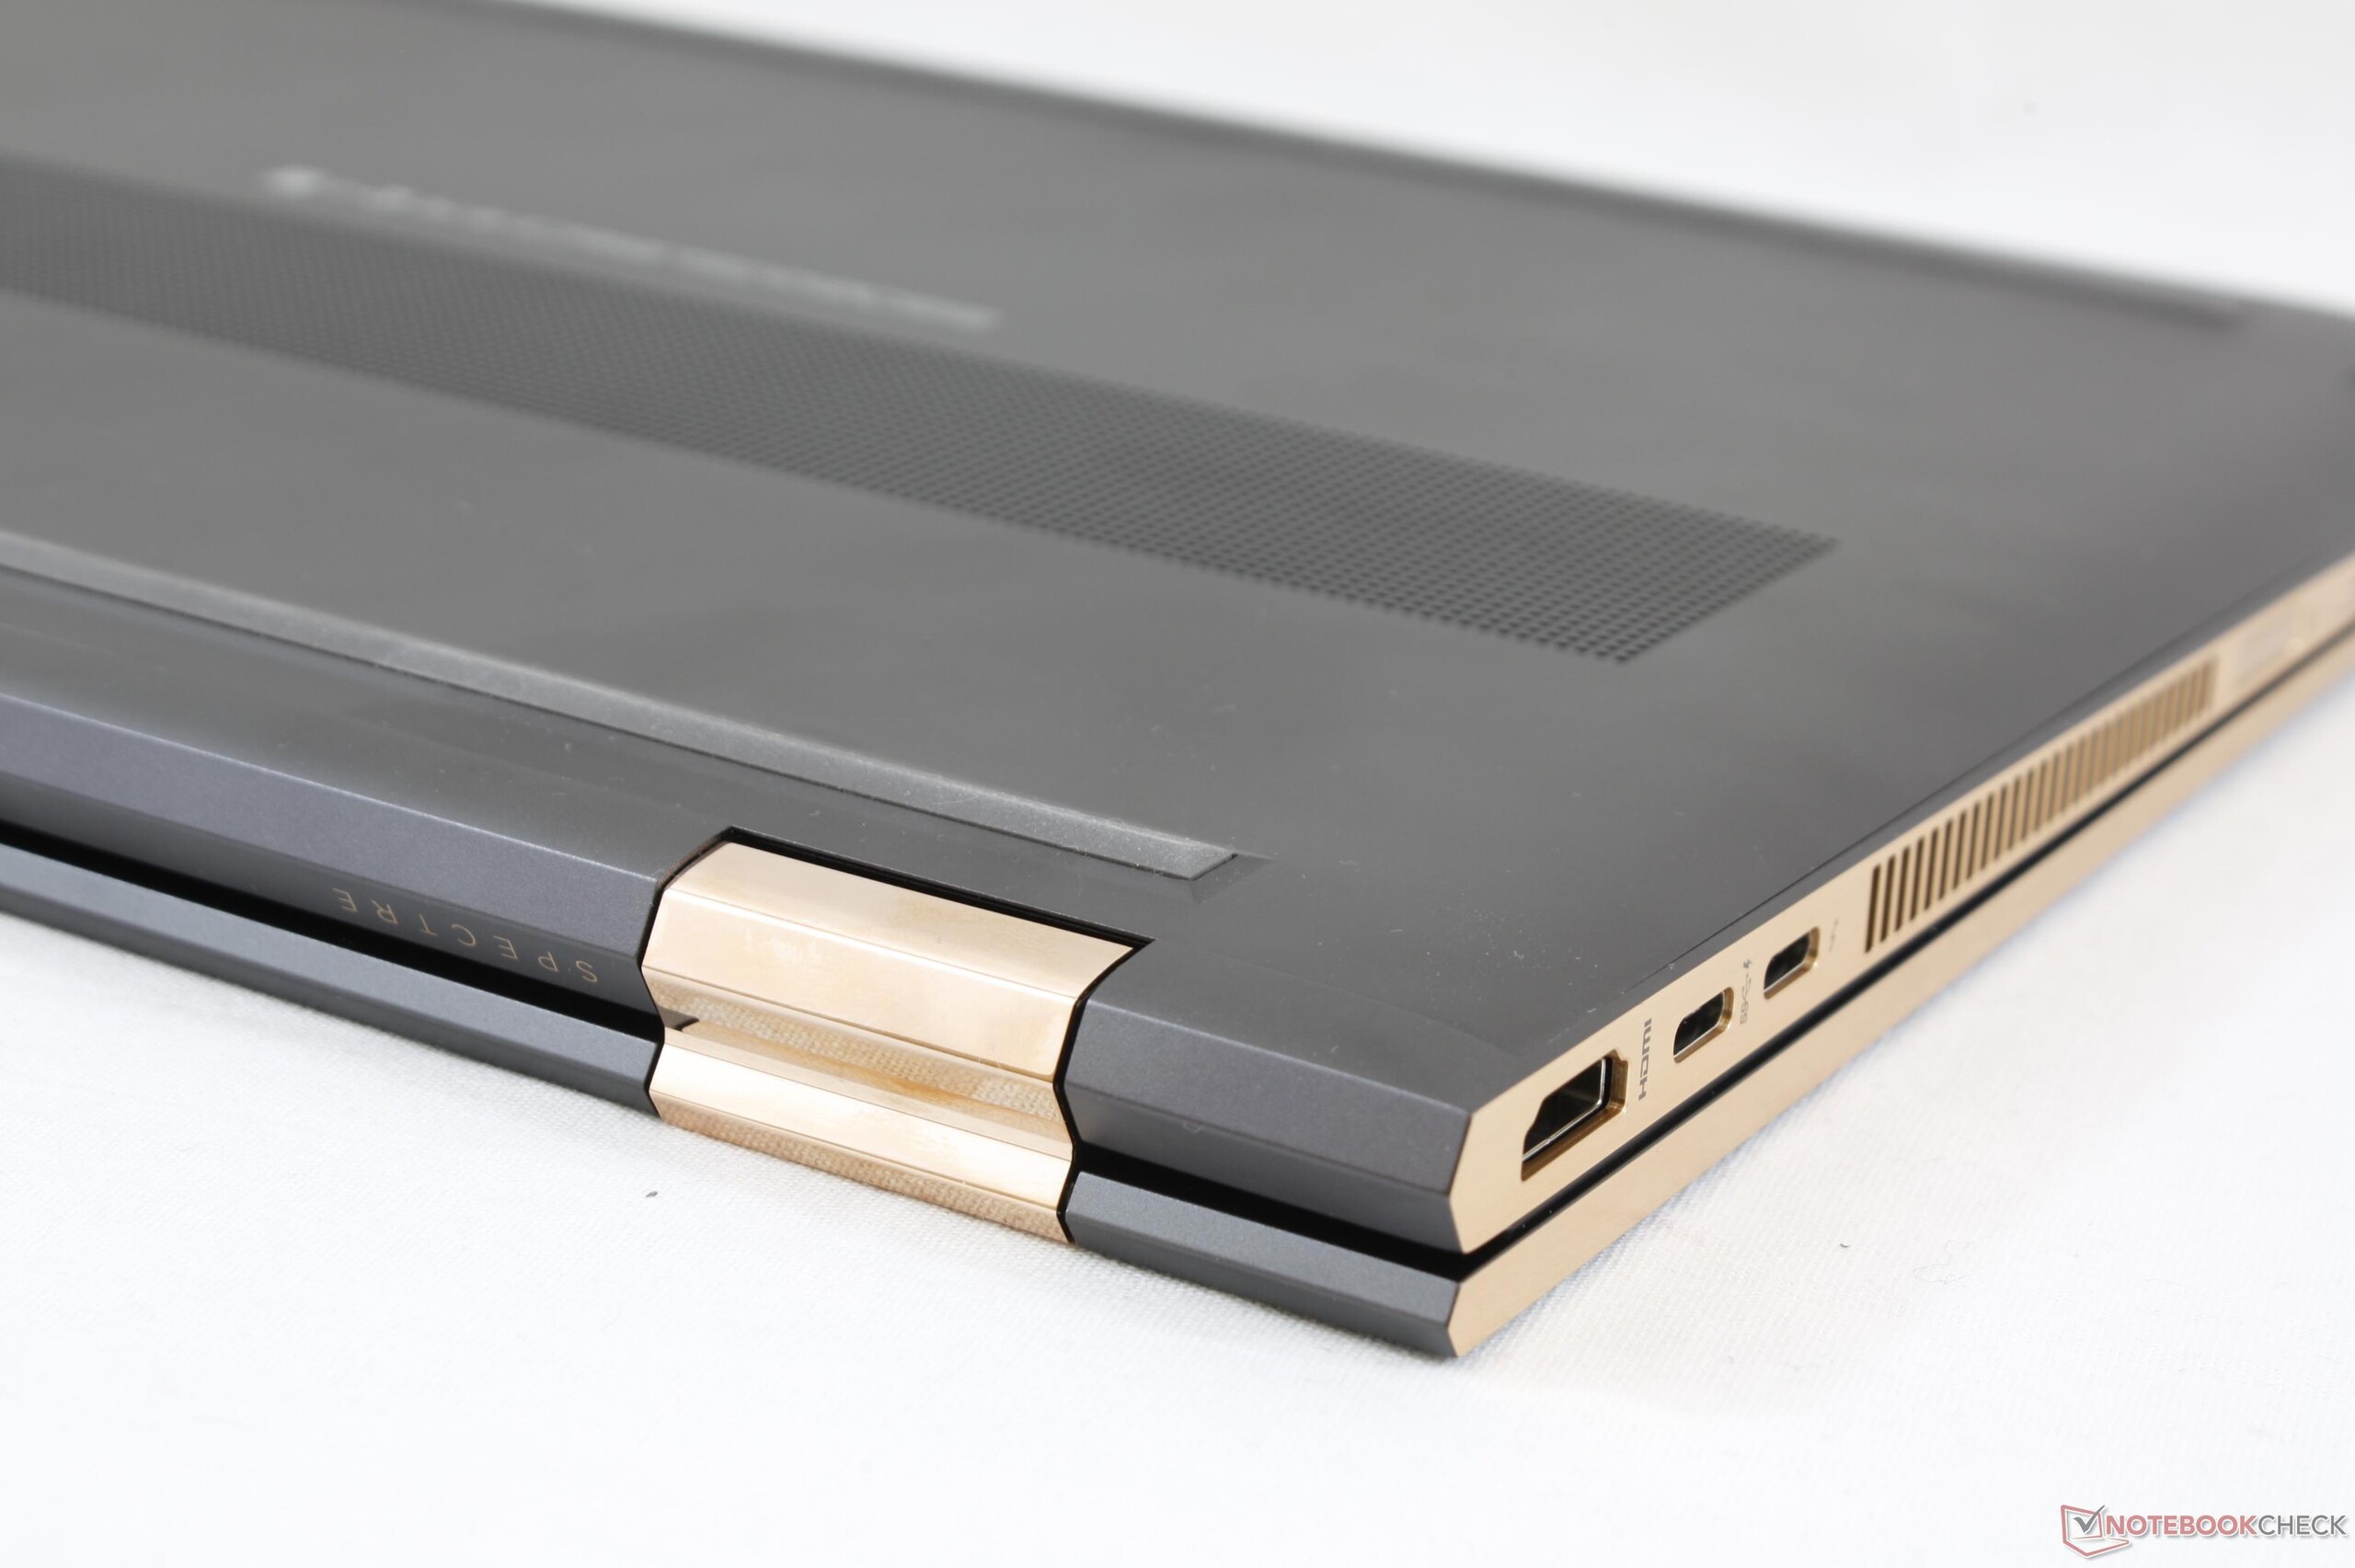
As temperaturas frias e tranquilas desta configuração de 90 W Kaby Lake-R nos deixou animados para testar a mais potente configuração de 150 W do Kaby Lake-G. Deve ser interessante ver como este mesmo chassi consegue lidar com um processador mais exigente em uma análise futura.
O 2017 Spectre x360 15 foi um dos melhores conversíveis de 15 polegadas disponível e a atualização de 2018 não é diferente. Nosso 2-em-1 favorito agora é mais silencioso, mais frio e mais cheio de recursos do que antes. Os usuários que originalmente desistiram pelo peso e tamanho da série Spectre x360 15, no entanto, não mudarão de ideia.
HP Spectre x360 15-ch011nr
- 06/29/2018 v6 (old)
Allen Ngo
Price comparison
