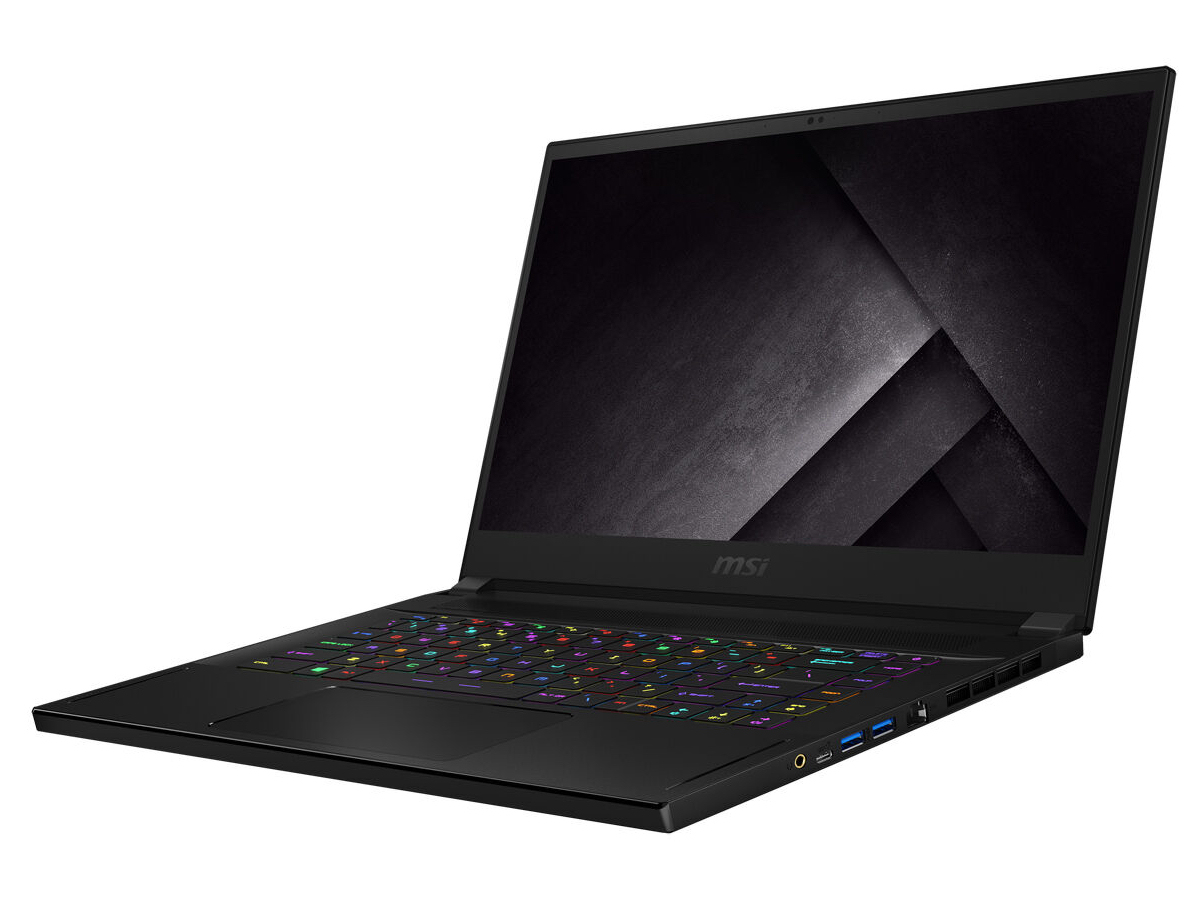
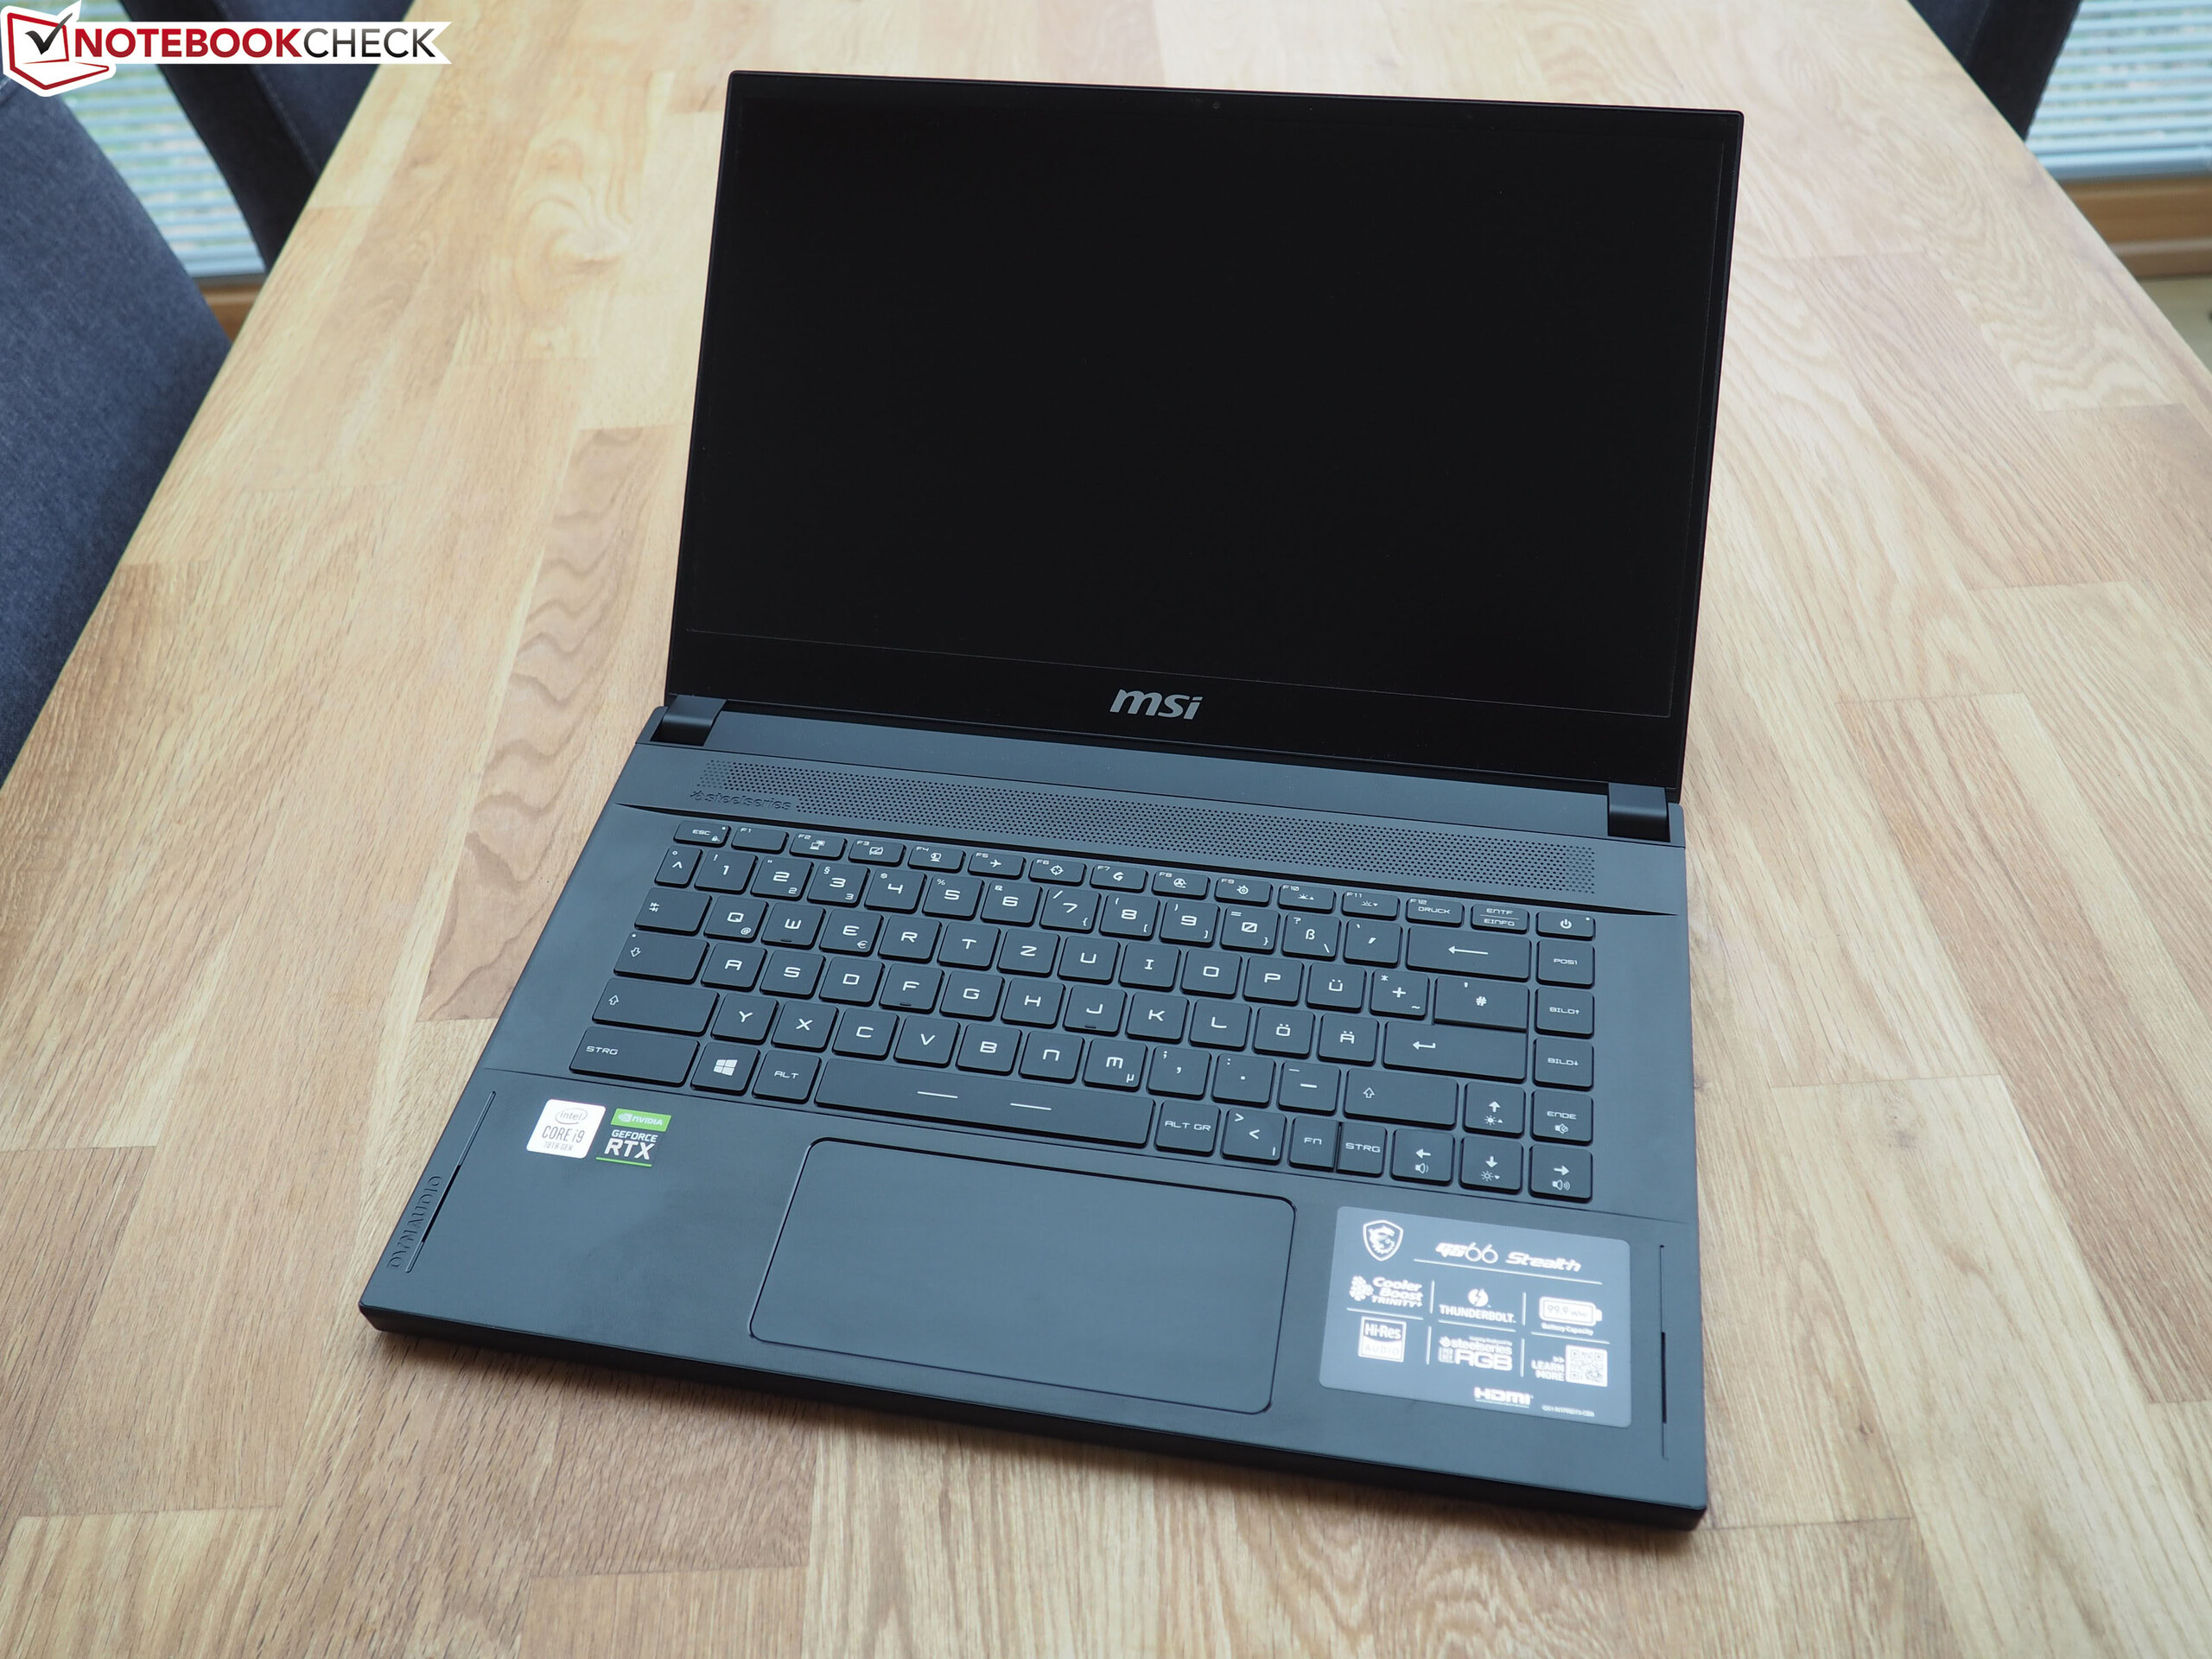
Breve Análise do MSI GS66 Stealth 10SE: Portátil de jogos elegante com tela de 240 Hz
Avaliação | Data | Modelo | Peso | Altura | Size | Resolução | Preço |
|---|---|---|---|---|---|---|---|
| 82.5 % v7 (old) | 08/2020 | MSI GS66 Stealth 10SE-045 i7-10750H, GeForce RTX 2060 Mobile | 2.2 kg | 19.8 mm | 15.60" | 1920x1080 | |
| 84.2 % v7 (old) | 09/2019 | Razer Blade 15 GTX 1660 Ti i7-9750H, GeForce GTX 1660 Ti Mobile | 2.1 kg | 19.9 mm | 15.60" | 1920x1080 | |
| 83.7 % v7 (old) | 06/2020 | Dell G5 15 SE 5505 P89F R7 4800H, Radeon RX 5600M | 2.4 kg | 21.6 mm | 15.60" | 1920x1080 | |
| 83.3 % v7 (old) | 07/2020 | Lenovo Legion 5 15IMH05H i5-10300H, GeForce RTX 2060 Mobile | 2.5 kg | 26.1 mm | 15.60" | 1920x1080 | |
| 82.7 % v7 (old) | 06/2020 | Asus TUF Gaming A15 FA506IV-HN172 R7 4800H, GeForce RTX 2060 Mobile | 2.2 kg | 24.9 mm | 15.60" | 1920x1080 | |
| 81.3 % v7 (old) | 02/2020 | Schenker XMG Core 15 GK5CP6V i7-9750H, GeForce GTX 1660 Ti Mobile | 2 kg | 26 mm | 15.60" | 1920x1080 |


| |||||||||||||||||||||||||
iluminação: 91 %
iluminação com acumulador: 272 cd/m²
Contraste: 1007:1 (Preto: 0.27 cd/m²)
ΔE ColorChecker Calman: 2.42 | ∀{0.5-29.43 Ø4.71}
calibrated: 0.88
ΔE Greyscale Calman: 4.5 | ∀{0.09-98 Ø4.96}
91% sRGB (Argyll 1.6.3 3D)
69% AdobeRGB 1998 (Argyll 1.6.3 3D)
68.9% AdobeRGB 1998 (Argyll 3D)
98.3% sRGB (Argyll 3D)
67.5% Display P3 (Argyll 3D)
Gamma: 2.188
CCT: 7369 K
| MSI GS66 Stealth 10SE-045 Sharp LQ156M1JW03, IPS, 1920x1080, 15.6" | MSI GS66 Stealth 10SFS AUO B156HAN12.0 (AUO328E), IPS, 1920x1080, 15.6" | Razer Blade 15 GTX 1660 Ti BOE NV156FHM-N4K, IPS, 1920x1080, 15.6" | Dell G5 15 SE 5505 P89F BOE NV156FH, WVA, 1920x1080, 15.6" | Lenovo Legion 5 15IMH05H BOE CQ NV156FHM-NX1, IPS, 1920x1080, 15.6" | Asus TUF Gaming A15 FA506IV-HN172 LM156LF-2F01, IPS, 1920x1080, 15.6" | Schenker XMG Core 15 GK5CP6V BOEhydis NV156FHM-N4G (BOE084D), IPS, 1920x1080, 15.6" | |
|---|---|---|---|---|---|---|---|
| Display | 2% | -4% | -7% | -42% | -41% | -6% | |
| Display P3 Coverage (%) | 67.5 | 69.5 3% | 65.3 -3% | 63 -7% | 38.8 -43% | 38.92 -42% | 63.3 -6% |
| sRGB Coverage (%) | 98.3 | 99.6 1% | 91.8 -7% | 90.1 -8% | 57.8 -41% | 58.5 -40% | 91.2 -7% |
| AdobeRGB 1998 Coverage (%) | 68.9 | 70.8 3% | 66.5 -3% | 64.1 -7% | 40.09 -42% | 40.22 -42% | 65 -6% |
| Response Times | -5% | -5% | -37% | -90% | -157% | 14% | |
| Response Time Grey 50% / Grey 80% * (ms) | 12 ? | 14 ? -17% | 13.6 ? -13% | 20.4 ? -70% | 26 ? -117% | 34 ? -183% | 8.8 ? 27% |
| Response Time Black / White * (ms) | 10.4 ? | 9.6 ? 8% | 10 ? 4% | 10.8 ? -4% | 17 ? -63% | 24 ? -131% | 10.4 ? -0% |
| PWM Frequency (Hz) | 23580 ? | 200 ? | 198.4 ? | ||||
| Screen | 6% | -26% | -25% | -58% | -64% | -8% | |
| Brightness middle (cd/m²) | 272 | 316 16% | 312.7 15% | 292 7% | 301 11% | 280 3% | 324 19% |
| Brightness (cd/m²) | 259 | 311 20% | 305 18% | 290 12% | 277 7% | 254 -2% | 296 14% |
| Brightness Distribution (%) | 91 | 92 1% | 90 -1% | 77 -15% | 77 -15% | 88 -3% | 88 -3% |
| Black Level * (cd/m²) | 0.27 | 0.21 22% | 0.27 -0% | 0.27 -0% | 0.26 4% | 0.15 44% | 0.27 -0% |
| Contrast (:1) | 1007 | 1505 49% | 1158 15% | 1081 7% | 1158 15% | 1867 85% | 1200 19% |
| Colorchecker dE 2000 * | 2.42 | 3.03 -25% | 4.57 -89% | 3.99 -65% | 5.12 -112% | 5.89 -143% | 4.07 -68% |
| Colorchecker dE 2000 max. * | 6.93 | 7.32 -6% | 6.81 2% | 6.11 12% | 8.86 -28% | 19 -174% | 6.39 8% |
| Colorchecker dE 2000 calibrated * | 0.88 | 1.1 -25% | 2.91 -231% | 3.02 -243% | 4.88 -455% | 4.79 -444% | 1.49 -69% |
| Greyscale dE 2000 * | 4.5 | 3.9 13% | 4.3 4% | 3.3 27% | 3.47 23% | 4.08 9% | 4.01 11% |
| Gamma | 2.188 101% | 2.42 91% | 2.29 96% | 2.25 98% | 2.37 93% | 2.33 94% | 2.6 85% |
| CCT | 7369 88% | 7439 87% | 7098 92% | 7047 92% | 7062 92% | 7303 89% | 7350 88% |
| Color Space (Percent of AdobeRGB 1998) (%) | 69 | 65 -6% | 59.4 -14% | 58.1 -16% | 37 -46% | 37 -46% | 59 -14% |
| Color Space (Percent of sRGB) (%) | 91 | 100 10% | 91.3 0% | 89.7 -1% | 57 -37% | 58 -36% | 91 0% |
| Média Total (Programa/Configurações) | 1% /
4% | -12% /
-19% | -23% /
-23% | -63% /
-59% | -87% /
-72% | 0% /
-5% |
* ... menor é melhor
Exibir tempos de resposta
| ↔ Tempo de resposta preto para branco | ||
|---|---|---|
| 10.4 ms ... ascensão ↗ e queda ↘ combinadas | ↗ 6 ms ascensão | 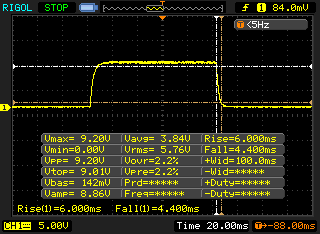 |
| ↘ 4.4 ms queda | ||
| A tela mostra boas taxas de resposta em nossos testes, mas pode ser muito lenta para jogadores competitivos. Em comparação, todos os dispositivos testados variam de 0.1 (mínimo) a 240 (máximo) ms. » 28 % de todos os dispositivos são melhores. Isso significa que o tempo de resposta medido é melhor que a média de todos os dispositivos testados (19.8 ms). | ||
| ↔ Tempo de resposta 50% cinza a 80% cinza | ||
| 12 ms ... ascensão ↗ e queda ↘ combinadas | ↗ 7.6 ms ascensão | 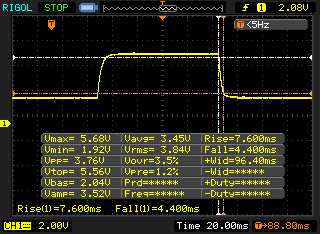 |
| ↘ 4.4 ms queda | ||
| A tela mostra boas taxas de resposta em nossos testes, mas pode ser muito lenta para jogadores competitivos. Em comparação, todos os dispositivos testados variam de 0.165 (mínimo) a 636 (máximo) ms. » 25 % de todos os dispositivos são melhores. Isso significa que o tempo de resposta medido é melhor que a média de todos os dispositivos testados (31 ms). | ||
Cintilação da tela / PWM (modulação por largura de pulso)
| Tela tremeluzindo/PWM detectado | 23580 Hz | ≤ 19 % configuração de brilho | 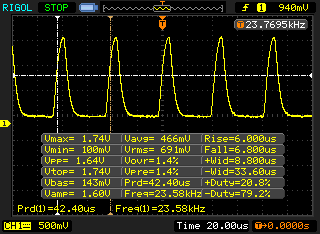 |
A luz de fundo da tela pisca em 23580 Hz (pior caso, por exemplo, utilizando PWM) Cintilação detectada em uma configuração de brilho de 19 % e abaixo. Não deve haver cintilação ou PWM acima desta configuração de brilho. A frequência de 23580 Hz é bastante alta, então a maioria dos usuários sensíveis ao PWM não deve notar nenhuma oscilação. [pwm_comparison] Em comparação: 52 % de todos os dispositivos testados não usam PWM para escurecer a tela. Se PWM foi detectado, uma média de 7754 (mínimo: 5 - máximo: 343500) Hz foi medida. | |||
* ... menor é melhor
| PCMark 8 Home Score Accelerated v2 | 4539 pontos | |
| PCMark 8 Creative Score Accelerated v2 | 4314 pontos | |
| PCMark 8 Work Score Accelerated v2 | 5908 pontos | |
| PCMark 10 Score | 4984 pontos | |
Ajuda | ||
| DPC Latencies / LatencyMon - interrupt to process latency (max), Web, Youtube, Prime95 | |
| Dell G5 15 SE 5505 P89F | |
| MSI GS66 Stealth 10SFS | |
| Gigabyte Aero 15 OLED XB-8DE51B0SP | |
| MSI GS66 10SGS | |
| MSI GS66 Stealth 10SE-045 | |
| Razer Blade 15 RZ09-0328 | |
| Asus TUF Gaming A15 FA506IV-HN172 | |
| Lenovo Legion 5 15IMH05H | |
* ... menor é melhor
| MSI GS66 Stealth 10SE-045 Samsung SSD PM981 MZVLB1T0HALR | Dell G5 15 SE 5505 P89F Samsung PM991 MZ9LQ512HALU | Lenovo Legion 5 15IMH05H Samsung PM991 MZALQ512HALU | Asus TUF Gaming A15 FA506IV-HN172 Kingston OM8PCP3512F-AB | Schenker XMG Core 15 GK5CP6V Samsung SSD 970 EVO Plus 500GB | MSI GS66 Stealth 10SFS Samsung SSD PM981 MZVLB1T0HALR | Razer Blade 15 GTX 1660 Ti Samsung SSD PM981 MZVLB256HAHQ | |
|---|---|---|---|---|---|---|---|
| CrystalDiskMark 5.2 / 6 | -20% | -21% | -18% | -14% | -4% | -14% | |
| Write 4K (MB/s) | 156.3 | 142.1 -9% | 145.4 -7% | 219.8 41% | 102 -35% | 131.3 -16% | 135 -14% |
| Read 4K (MB/s) | 47.65 | 46.43 -3% | 51.6 8% | 50.2 5% | 41.39 -13% | 45.84 -4% | 41.1 -14% |
| Write Seq (MB/s) | 2374 | 1108 -53% | 1007 -58% | 979 -59% | 1649 -31% | 2370 0% | 1427 -40% |
| Read Seq (MB/s) | 2045 | 1622 -21% | 1145 -44% | 1990 -3% | 1367 -33% | 1509 -26% | 1494 -27% |
| Write 4K Q32T1 (MB/s) | 431.3 | 467 8% | 468.4 9% | 516 20% | 379 -12% | 481.5 12% | 494.9 15% |
| Read 4K Q32T1 (MB/s) | 509 | 525 3% | 528 4% | 298.3 -41% | 401.2 -21% | 560 10% | 578 14% |
| Write Seq Q32T1 (MB/s) | 2385 | 1203 -50% | 1381 -42% | 982 -59% | 3276 37% | 2392 0% | 1417 -41% |
| Read Seq Q32T1 (MB/s) | 3505 | 2288 -35% | 2291 -35% | 1907 -46% | 3417 -3% | 3232 -8% | 3251 -7% |
| Write 4K Q8T8 (MB/s) | 981 | ||||||
| Read 4K Q8T8 (MB/s) | 300.9 | ||||||
| AS SSD | -61% | -48% | -45% | -7% | -17% | -48% | |
| Seq Read (MB/s) | 2612 | 1386 -47% | 2012 -23% | 1682 -36% | 2261 -13% | 1065 -59% | 1829 -30% |
| Seq Write (MB/s) | 2368 | 1234 -48% | 1261 -47% | 904 -62% | 2393 1% | 2360 0% | 1315 -44% |
| 4K Read (MB/s) | 51.1 | 41.32 -19% | 43.66 -15% | 60.2 18% | 54.6 7% | 48.09 -6% | 51.3 0% |
| 4K Write (MB/s) | 135.9 | 128 -6% | 109.3 -20% | 164.8 21% | 118.4 -13% | 110.7 -19% | 106 -22% |
| 4K-64 Read (MB/s) | 1635 | 854 -48% | 851 -48% | 472.5 -71% | 1376 -16% | 1635 0% | 917 -44% |
| 4K-64 Write (MB/s) | 1831 | 721 -61% | 780 -57% | 845 -54% | 2299 26% | 1829 0% | 1212 -34% |
| Access Time Read * (ms) | 0.042 | 0.098 -133% | 0.117 -179% | 0.087 -107% | 0.07 -67% | 0.071 -69% | 0.063 -50% |
| Access Time Write * (ms) | 0.028 | 0.095 -239% | 0.036 -29% | 0.02 29% | 0.031 -11% | 0.034 -21% | 0.104 -271% |
| Score Read (Points) | 1947 | 1034 -47% | 1096 -44% | 701 -64% | 1657 -15% | 1790 -8% | 1152 -41% |
| Score Write (Points) | 2204 | 973 -56% | 1016 -54% | 1101 -50% | 2657 21% | 2176 -1% | 1450 -34% |
| Score Total (Points) | 5138 | 2536 -51% | 2643 -49% | 2143 -58% | 5175 1% | 4950 -4% | 3177 -38% |
| Copy ISO MB/s (MB/s) | 2334 | 1284 -45% | 1481 -37% | 675 -71% | 1539 -34% | ||
| Copy Program MB/s (MB/s) | 569 | 401.9 -29% | 467.5 -18% | 248.4 -56% | 513 -10% | ||
| Copy Game MB/s (MB/s) | 1401 | 1013 -28% | 734 -48% | 535 -62% | 1150 -18% | ||
| Média Total (Programa/Configurações) | -41% /
-46% | -35% /
-38% | -32% /
-35% | -11% /
-10% | -11% /
-12% | -31% /
-36% |
* ... menor é melhor

Continuous load read: DiskSpd Read Loop, Queue Depth 8
| 3DMark 11 Performance | 18163 pontos | |
| 3DMark Cloud Gate Standard Score | 36138 pontos | |
| 3DMark Fire Strike Score | 14290 pontos | |
| 3DMark Time Spy Score | 6038 pontos | |
Ajuda | ||
| BioShock Infinite - 1920x1080 Ultra Preset, DX11 (DDOF) | |
| Lenovo Legion 5 15IMH05H | |
| MSI GS66 Stealth 10SE-045 | |
| Razer Blade 15 GTX 1660 Ti | |
| Asus TUF Gaming A15 FA506IV-HN172 | |
| Shadow of the Tomb Raider - 1920x1080 Highest Preset AA:T | |
| Média da turma Gaming (96 - 116, n=2, últimos 2 anos) | |
| Gigabyte Aero 15 OLED XB-8DE51B0SP | |
| MSI GS66 10SGS | |
| MSI GS66 Stealth 10SFS | |
| Razer Blade 15 RZ09-0328 | |
| Lenovo Legion 5 15IMH05H | |
| MSI GS66 Stealth 10SE-045 | |
| Dell G5 15 SE 5505 P89F | |
| Razer Blade 15 GTX 1660 Ti | |
| Metro Exodus - 1920x1080 Ultra Quality AF:16x | |
| Gigabyte Aero 15 OLED XB-8DE51B0SP | |
| MSI GS66 10SGS | |
| Dell G5 15 SE 5505 P89F | |
| MSI GS66 Stealth 10SE-045 | |
| Far Cry 5 - 1920x1080 Ultra Preset AA:T | |
| Média da turma Gaming (70 - 151, n=6, últimos 2 anos) | |
| MSI GS66 Stealth 10SE-045 | |
| Lenovo Legion 5 15IMH05H | |
| Call of Duty Modern Warfare 2019 - 1920x1080 Maximum Settings AA:T2X Filmic SM | |
| Schenker XMG Core 15 GK5CP6V | |
| MSI GS66 Stealth 10SE-045 | |
| Red Dead Redemption 2 - 1920x1080 High Settings | |
| Gigabyte Aero 15 OLED XB-8DE51B0SP | |
| Lenovo Legion 5 15IMH05H | |
| MSI GS66 Stealth 10SE-045 | |
| Schenker XMG Core 15 GK5CP6V | |
| baixo | média | alto | ultra | |
|---|---|---|---|---|
| BioShock Infinite (2013) | 336 | 290 | 268.3 | 135.8 |
| The Witcher 3 (2015) | 280.6 | 196.7 | 117.7 | 63.4 |
| Far Cry 5 (2018) | 128 | 96 | 90 | 86 |
| Shadow of the Tomb Raider (2018) | 114 | 93 | 86 | 77 |
| Metro Exodus (2019) | 140.9 | 69.9 | 53.4 | 42.2 |
| Call of Duty Modern Warfare 2019 (2019) | 143.9 | 97.3 | 80.8 | 70.7 |
| Red Dead Redemption 2 (2019) | 118.5 | 81.9 | 54.9 | 35.1 |
| Doom Eternal (2020) | 209.2 | 136.9 | 124.6 | 121.9 |
| Gears Tactics (2020) | 243.5 | 144.4 | 95.9 | 62.8 |
| F1 2020 (2020) | 230 | 150 | 131 | 93 |
| Death Stranding (2020) | 146.6 | 102 | 93.1 | 91 |
Barulho
| Ocioso |
| 29 / 30 / 40 dB |
| Carga |
| 51 / 54 dB |
 | ||
30 dB silencioso 40 dB(A) audível 50 dB(A) ruidosamente alto |
||
min: | ||
| MSI GS66 Stealth 10SE-045 i7-10750H, GeForce RTX 2060 Mobile | MSI GS66 Stealth 10SFS i9-10980HK, GeForce RTX 2070 Super Max-Q | Razer Blade 15 GTX 1660 Ti i7-9750H, GeForce GTX 1660 Ti Mobile | Dell G5 15 SE 5505 P89F R7 4800H, Radeon RX 5600M | Lenovo Legion 5 15IMH05H i5-10300H, GeForce RTX 2060 Mobile | Asus TUF Gaming A15 FA506IV-HN172 R7 4800H, GeForce RTX 2060 Mobile | Schenker XMG Core 15 GK5CP6V i7-9750H, GeForce GTX 1660 Ti Mobile | Média da turma Gaming | |
|---|---|---|---|---|---|---|---|---|
| Noise | -6% | 4% | 11% | 4% | 4% | -0% | 11% | |
| desligado / ambiente * (dB) | 25 | 30 -20% | 28.5 -14% | 28 -12% | 30.7 -23% | 30.2 -21% | 30 -20% | 24.1 ? 4% |
| Idle Minimum * (dB) | 29 | 32 -10% | 30.3 -4% | 28 3% | 30.7 -6% | 30.2 -4% | 30 -3% | 26 ? 10% |
| Idle Average * (dB) | 30 | 34 -13% | 30.5 -2% | 28 7% | 30.7 -2% | 30.2 -1% | 31 -3% | 27.4 ? 9% |
| Idle Maximum * (dB) | 40 | 39 2% | 30.5 24% | 28 30% | 30.7 23% | 30.2 24% | 33 17% | 30.1 ? 25% |
| Load Average * (dB) | 51 | 53 -4% | 41 20% | 28 45% | 36.6 28% | 40 22% | 48 6% | 43.6 ? 15% |
| Witcher 3 ultra * (dB) | 48 | 48 -0% | 48 -0% | 50.6 -5% | 47 2% | 49 -2% | 51 -6% | |
| Load Maximum * (dB) | 54 | 53 2% | 51.9 4% | 50.6 6% | 50.9 6% | 49 9% | 51 6% | 54.2 ? -0% |
* ... menor é melhor
(-) A temperatura máxima no lado superior é 53 °C / 127 F, em comparação com a média de 40.4 °C / 105 F , variando de 21.2 a 68.8 °C para a classe Gaming.
(-) A parte inferior aquece até um máximo de 53 °C / 127 F, em comparação com a média de 43.2 °C / 110 F
(+) Em uso inativo, a temperatura média para o lado superior é 27.4 °C / 81 F, em comparação com a média do dispositivo de 33.9 °C / ### class_avg_f### F.
(-) Jogando The Witcher 3, a temperatura média para o lado superior é 42.6 °C / 109 F, em comparação com a média do dispositivo de 33.9 °C / ## #class_avg_f### F.
(+) Os apoios para as mãos e o touchpad estão atingindo a temperatura máxima da pele (35 °C / 95 F) e, portanto, não estão quentes.
(-) A temperatura média da área do apoio para as mãos de dispositivos semelhantes foi 28.8 °C / 83.8 F (-6.2 °C / -11.2 F).
| MSI GS66 Stealth 10SE-045 i7-10750H, GeForce RTX 2060 Mobile | MSI GS66 Stealth 10SFS i9-10980HK, GeForce RTX 2070 Super Max-Q | Razer Blade 15 GTX 1660 Ti i7-9750H, GeForce GTX 1660 Ti Mobile | Dell G5 15 SE 5505 P89F R7 4800H, Radeon RX 5600M | Lenovo Legion 5 15IMH05H i5-10300H, GeForce RTX 2060 Mobile | Asus TUF Gaming A15 FA506IV-HN172 R7 4800H, GeForce RTX 2060 Mobile | Schenker XMG Core 15 GK5CP6V i7-9750H, GeForce GTX 1660 Ti Mobile | Média da turma Gaming | |
|---|---|---|---|---|---|---|---|---|
| Heat | -0% | -17% | -3% | 8% | 9% | 2% | -0% | |
| Maximum Upper Side * (°C) | 53 | 53 -0% | 52 2% | 53 -0% | 46.3 13% | 42.9 19% | 48 9% | 45.2 ? 15% |
| Maximum Bottom * (°C) | 53 | 55 -4% | 52.2 2% | 57.6 -9% | 44.4 16% | 49.9 6% | 59 -11% | 48.1 ? 9% |
| Idle Upper Side * (°C) | 29 | 28 3% | 38 -31% | 27.4 6% | 28.1 3% | 27.8 4% | 27 7% | 31 ? -7% |
| Idle Bottom * (°C) | 29 | 29 -0% | 40.4 -39% | 31 -7% | 29.4 -1% | 27 7% | 28 3% | 34.2 ? -18% |
* ... menor é melhor
MSI GS66 Stealth 10SE-045 análise de áudio
(+) | os alto-falantes podem tocar relativamente alto (###valor### dB)
Graves 100 - 315Hz
(-) | quase nenhum baixo - em média 30.3% menor que a mediana
(±) | a linearidade dos graves é média (8.1% delta para a frequência anterior)
Médios 400 - 2.000 Hz
(±) | médios mais altos - em média 7.7% maior que a mediana
(±) | a linearidade dos médios é média (7.3% delta para frequência anterior)
Altos 2 - 16 kHz
(+) | agudos equilibrados - apenas 3.3% longe da mediana
(+) | os máximos são lineares (6% delta da frequência anterior)
Geral 100 - 16.000 Hz
(±) | a linearidade do som geral é média (24% diferença em relação à mediana)
Comparado com a mesma classe
» 86% de todos os dispositivos testados nesta classe foram melhores, 4% semelhantes, 9% piores
» O melhor teve um delta de 6%, a média foi 18%, o pior foi 132%
Comparado com todos os dispositivos testados
» 72% de todos os dispositivos testados foram melhores, 6% semelhantes, 22% piores
» O melhor teve um delta de 4%, a média foi 23%, o pior foi 134%
| desligado | |
| Ocioso | |
| Carga |
|
Key:
min: | |
| MSI GS66 Stealth 10SE-045 i7-10750H, GeForce RTX 2060 Mobile | MSI GS66 Stealth 10SFS i9-10980HK, GeForce RTX 2070 Super Max-Q | Razer Blade 15 GTX 1660 Ti i7-9750H, GeForce GTX 1660 Ti Mobile | Dell G5 15 SE 5505 P89F R7 4800H, Radeon RX 5600M | Lenovo Legion 5 15IMH05H i5-10300H, GeForce RTX 2060 Mobile | Asus TUF Gaming A15 FA506IV-HN172 R7 4800H, GeForce RTX 2060 Mobile | Schenker XMG Core 15 GK5CP6V i7-9750H, GeForce GTX 1660 Ti Mobile | Média da turma Gaming | |
|---|---|---|---|---|---|---|---|---|
| Power Consumption | -16% | -41% | 22% | 33% | 22% | 15% | -23% | |
| Idle Minimum * (Watt) | 7 | 13 -86% | 18.7 -167% | 6.5 7% | 3.2 54% | 5.4 23% | 9 -29% | 13 ? -86% |
| Idle Average * (Watt) | 18 | 16 11% | 30.7 -71% | 10.6 41% | 8.3 54% | 10 44% | 12 33% | 19 ? -6% |
| Idle Maximum * (Watt) | 31 | 27 13% | 33.9 -9% | 11 65% | 8.7 72% | 10.5 66% | 18 42% | 24.6 ? 21% |
| Load Average * (Watt) | 107 | 109 -2% | 93.4 13% | 84.1 21% | 82 23% | 135 -26% | 86 20% | 110.7 ? -3% |
| Witcher 3 ultra * (Watt) | 146 | 155 -6% | 158.9 -9% | 152.9 -5% | 151 -3% | 144 1% | 126 14% | |
| Load Maximum * (Watt) | 186 | 236 -27% | 195.3 -5% | 180.4 3% | 195 -5% | 147 21% | 173 7% | 259 ? -39% |
* ... menor é melhor
| MSI GS66 Stealth 10SE-045 i7-10750H, GeForce RTX 2060 Mobile, 99.9 Wh | Dell G5 15 SE 5505 P89F R7 4800H, Radeon RX 5600M, 51 Wh | Lenovo Legion 5 15IMH05H i5-10300H, GeForce RTX 2060 Mobile, 60 Wh | Asus TUF Gaming A15 FA506IV-HN172 R7 4800H, GeForce RTX 2060 Mobile, 48 Wh | Schenker XMG Core 15 GK5CP6V i7-9750H, GeForce GTX 1660 Ti Mobile, 46 Wh | MSI GS66 10SGS i7-10750H, GeForce RTX 2080 Super Max-Q, 99.99 Wh | MSI GS66 Stealth 10SFS i9-10980HK, GeForce RTX 2070 Super Max-Q, 99.99 Wh | Razer Blade 15 GTX 1660 Ti i7-9750H, GeForce GTX 1660 Ti Mobile, 65 Wh | Média da turma Gaming | |
|---|---|---|---|---|---|---|---|---|---|
| Duração da bateria | 15% | 32% | 12% | -39% | 18% | 10% | -14% | 14% | |
| Reader / Idle (h) | 9 | 11.2 24% | 14.1 57% | 9.8 9% | 6.1 -32% | 10.2 13% | 8.4 -7% | 8.27 ? -8% | |
| H.264 (h) | 6.6 | 9.2 39% | 5.4 -18% | 8.32 ? 26% | |||||
| WiFi v1.3 (h) | 6.4 | 6.2 -3% | 7.2 13% | 6.2 -3% | 3.6 -44% | 6.9 8% | 6.1 -5% | 5.5 -14% | 7.11 ? 11% |
| Load (h) | 1.2 | 1.5 25% | 1.4 17% | 1.9 58% | 0.7 -42% | 1.6 33% | 1.7 42% | 1.502 ? 25% |
Pro
Contra
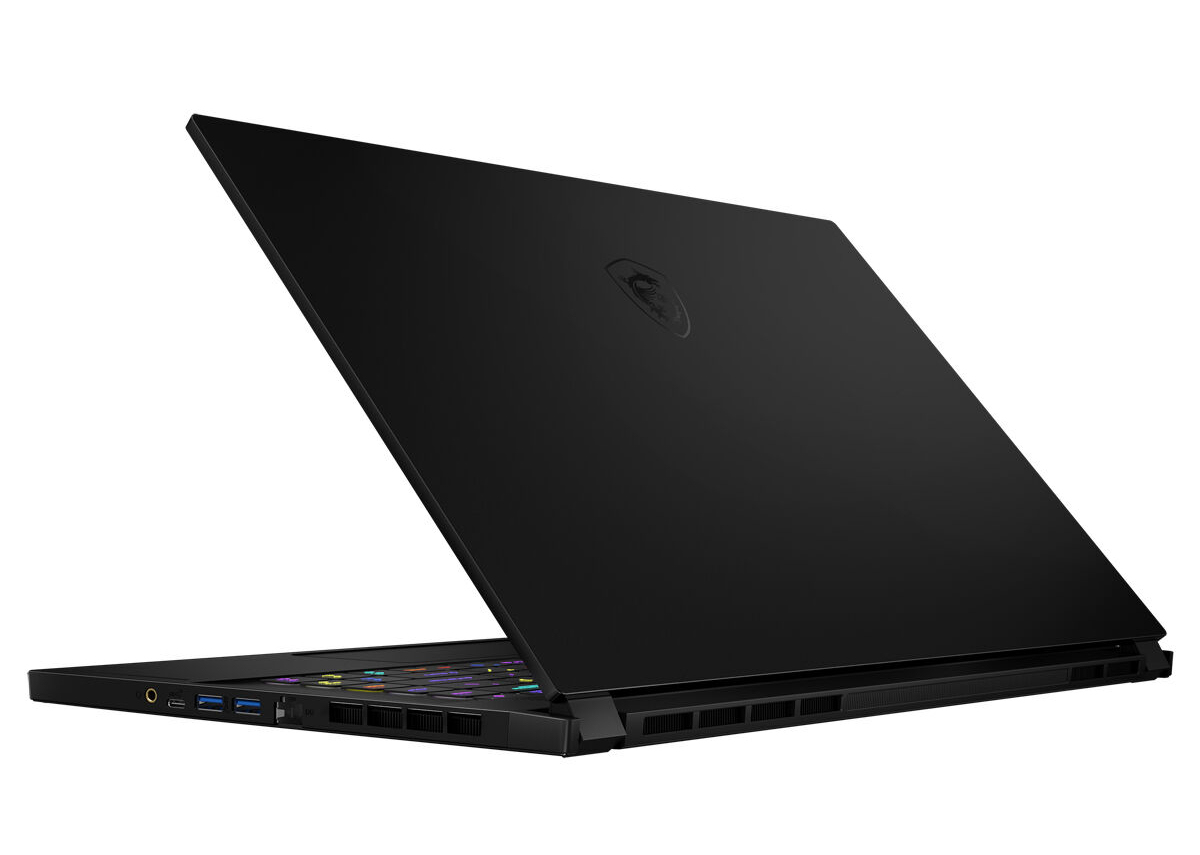
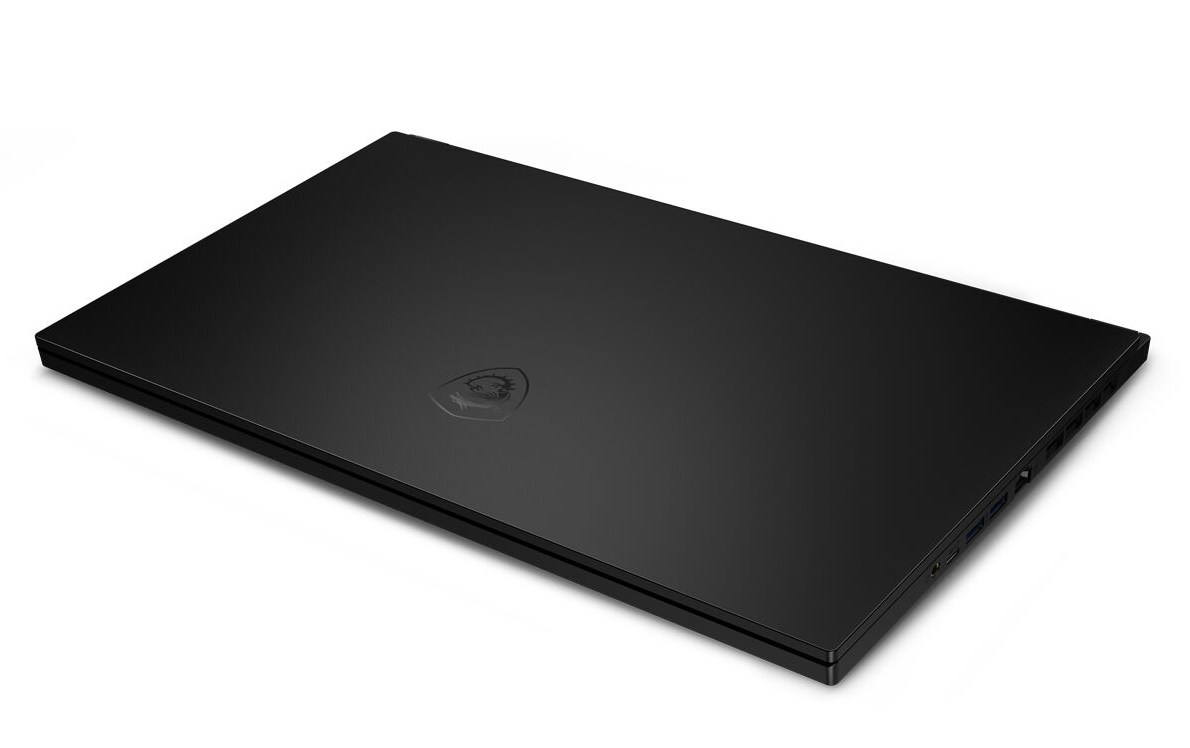
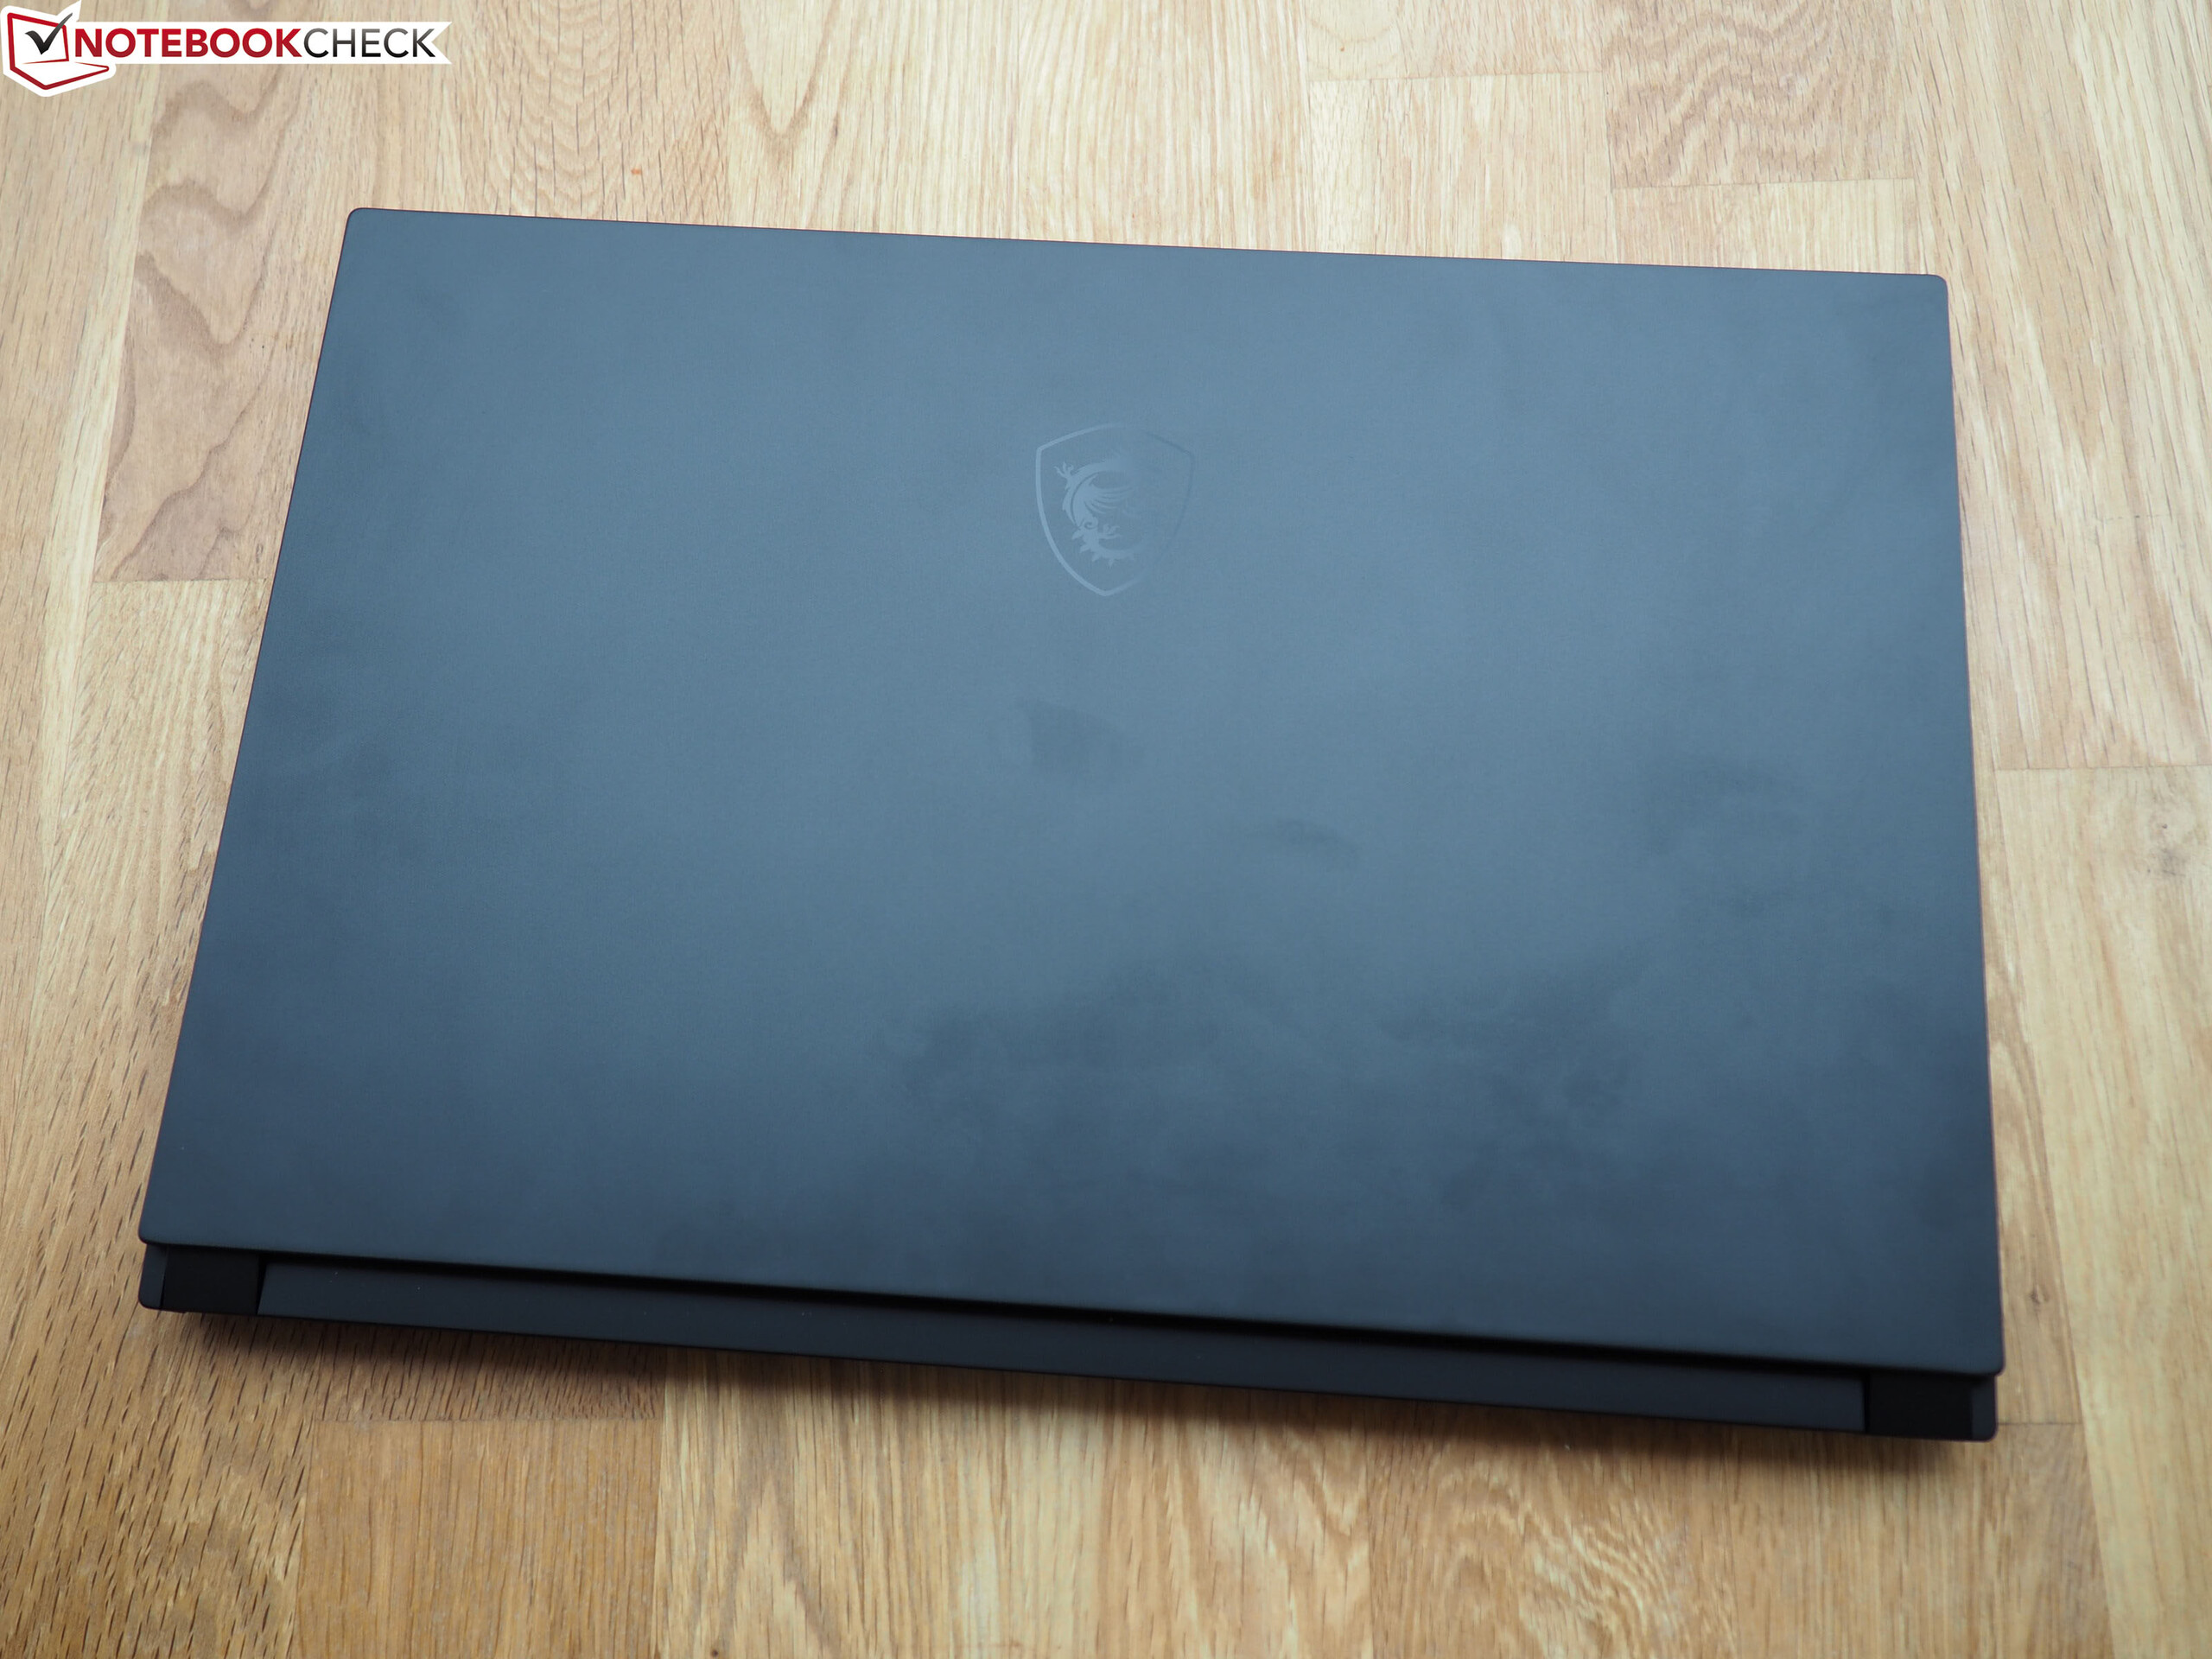
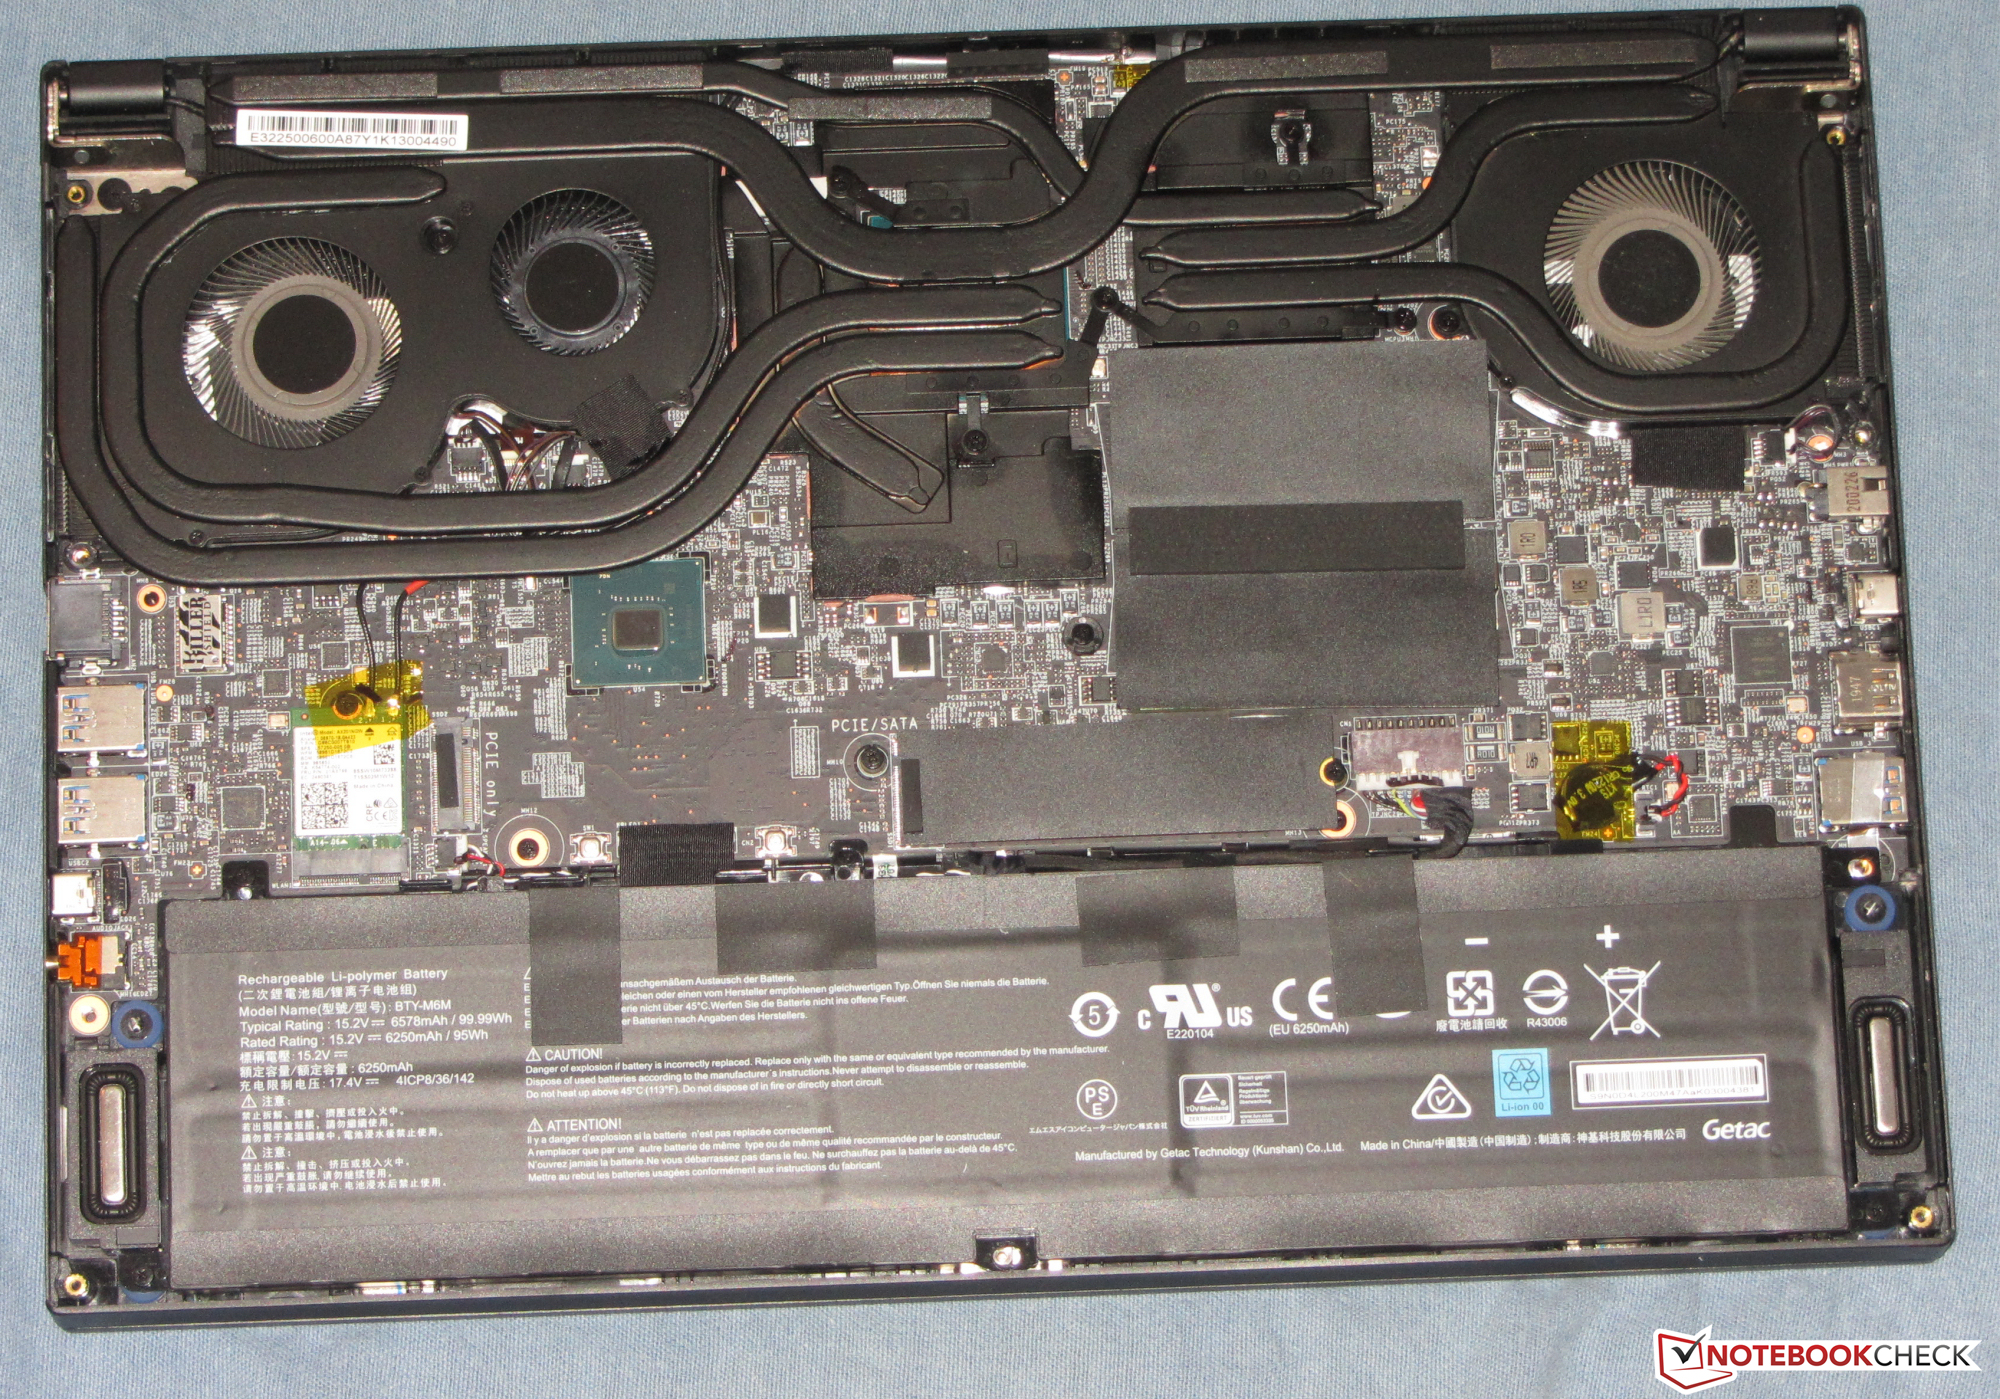
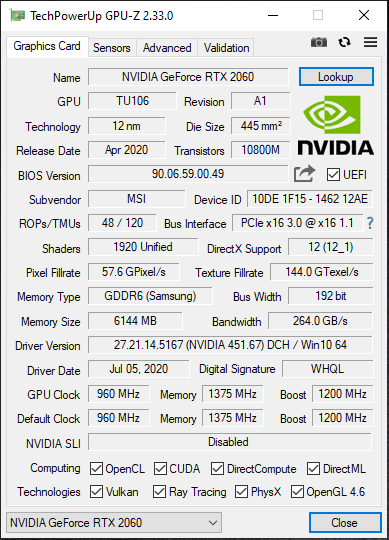
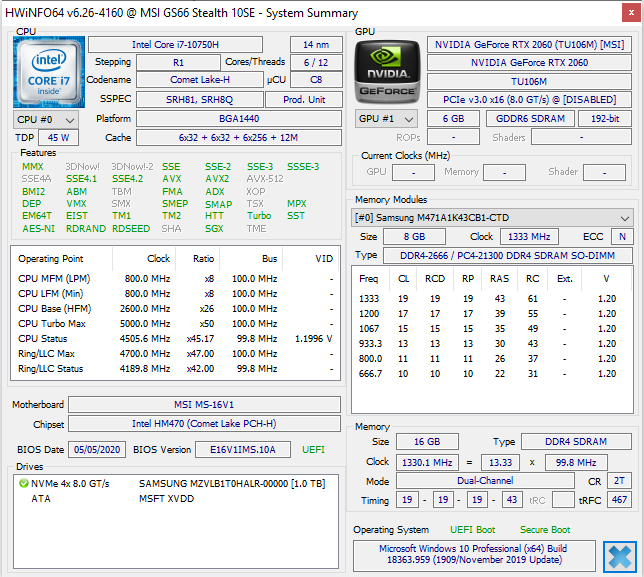
O MSI GS66 possui uma carcaça de metal compacta e elegante que provou ser muito suscetível às digitais. Destro do chassi há um processador Core i7-8550U e um núcleo gráfico GeForce GTX 2060, que juntos rodam todos os jogos de computador modernos sem problemas na tela mate Full HD. Configurações de qualidade altas a máximas sempre podem ser selecionadas.
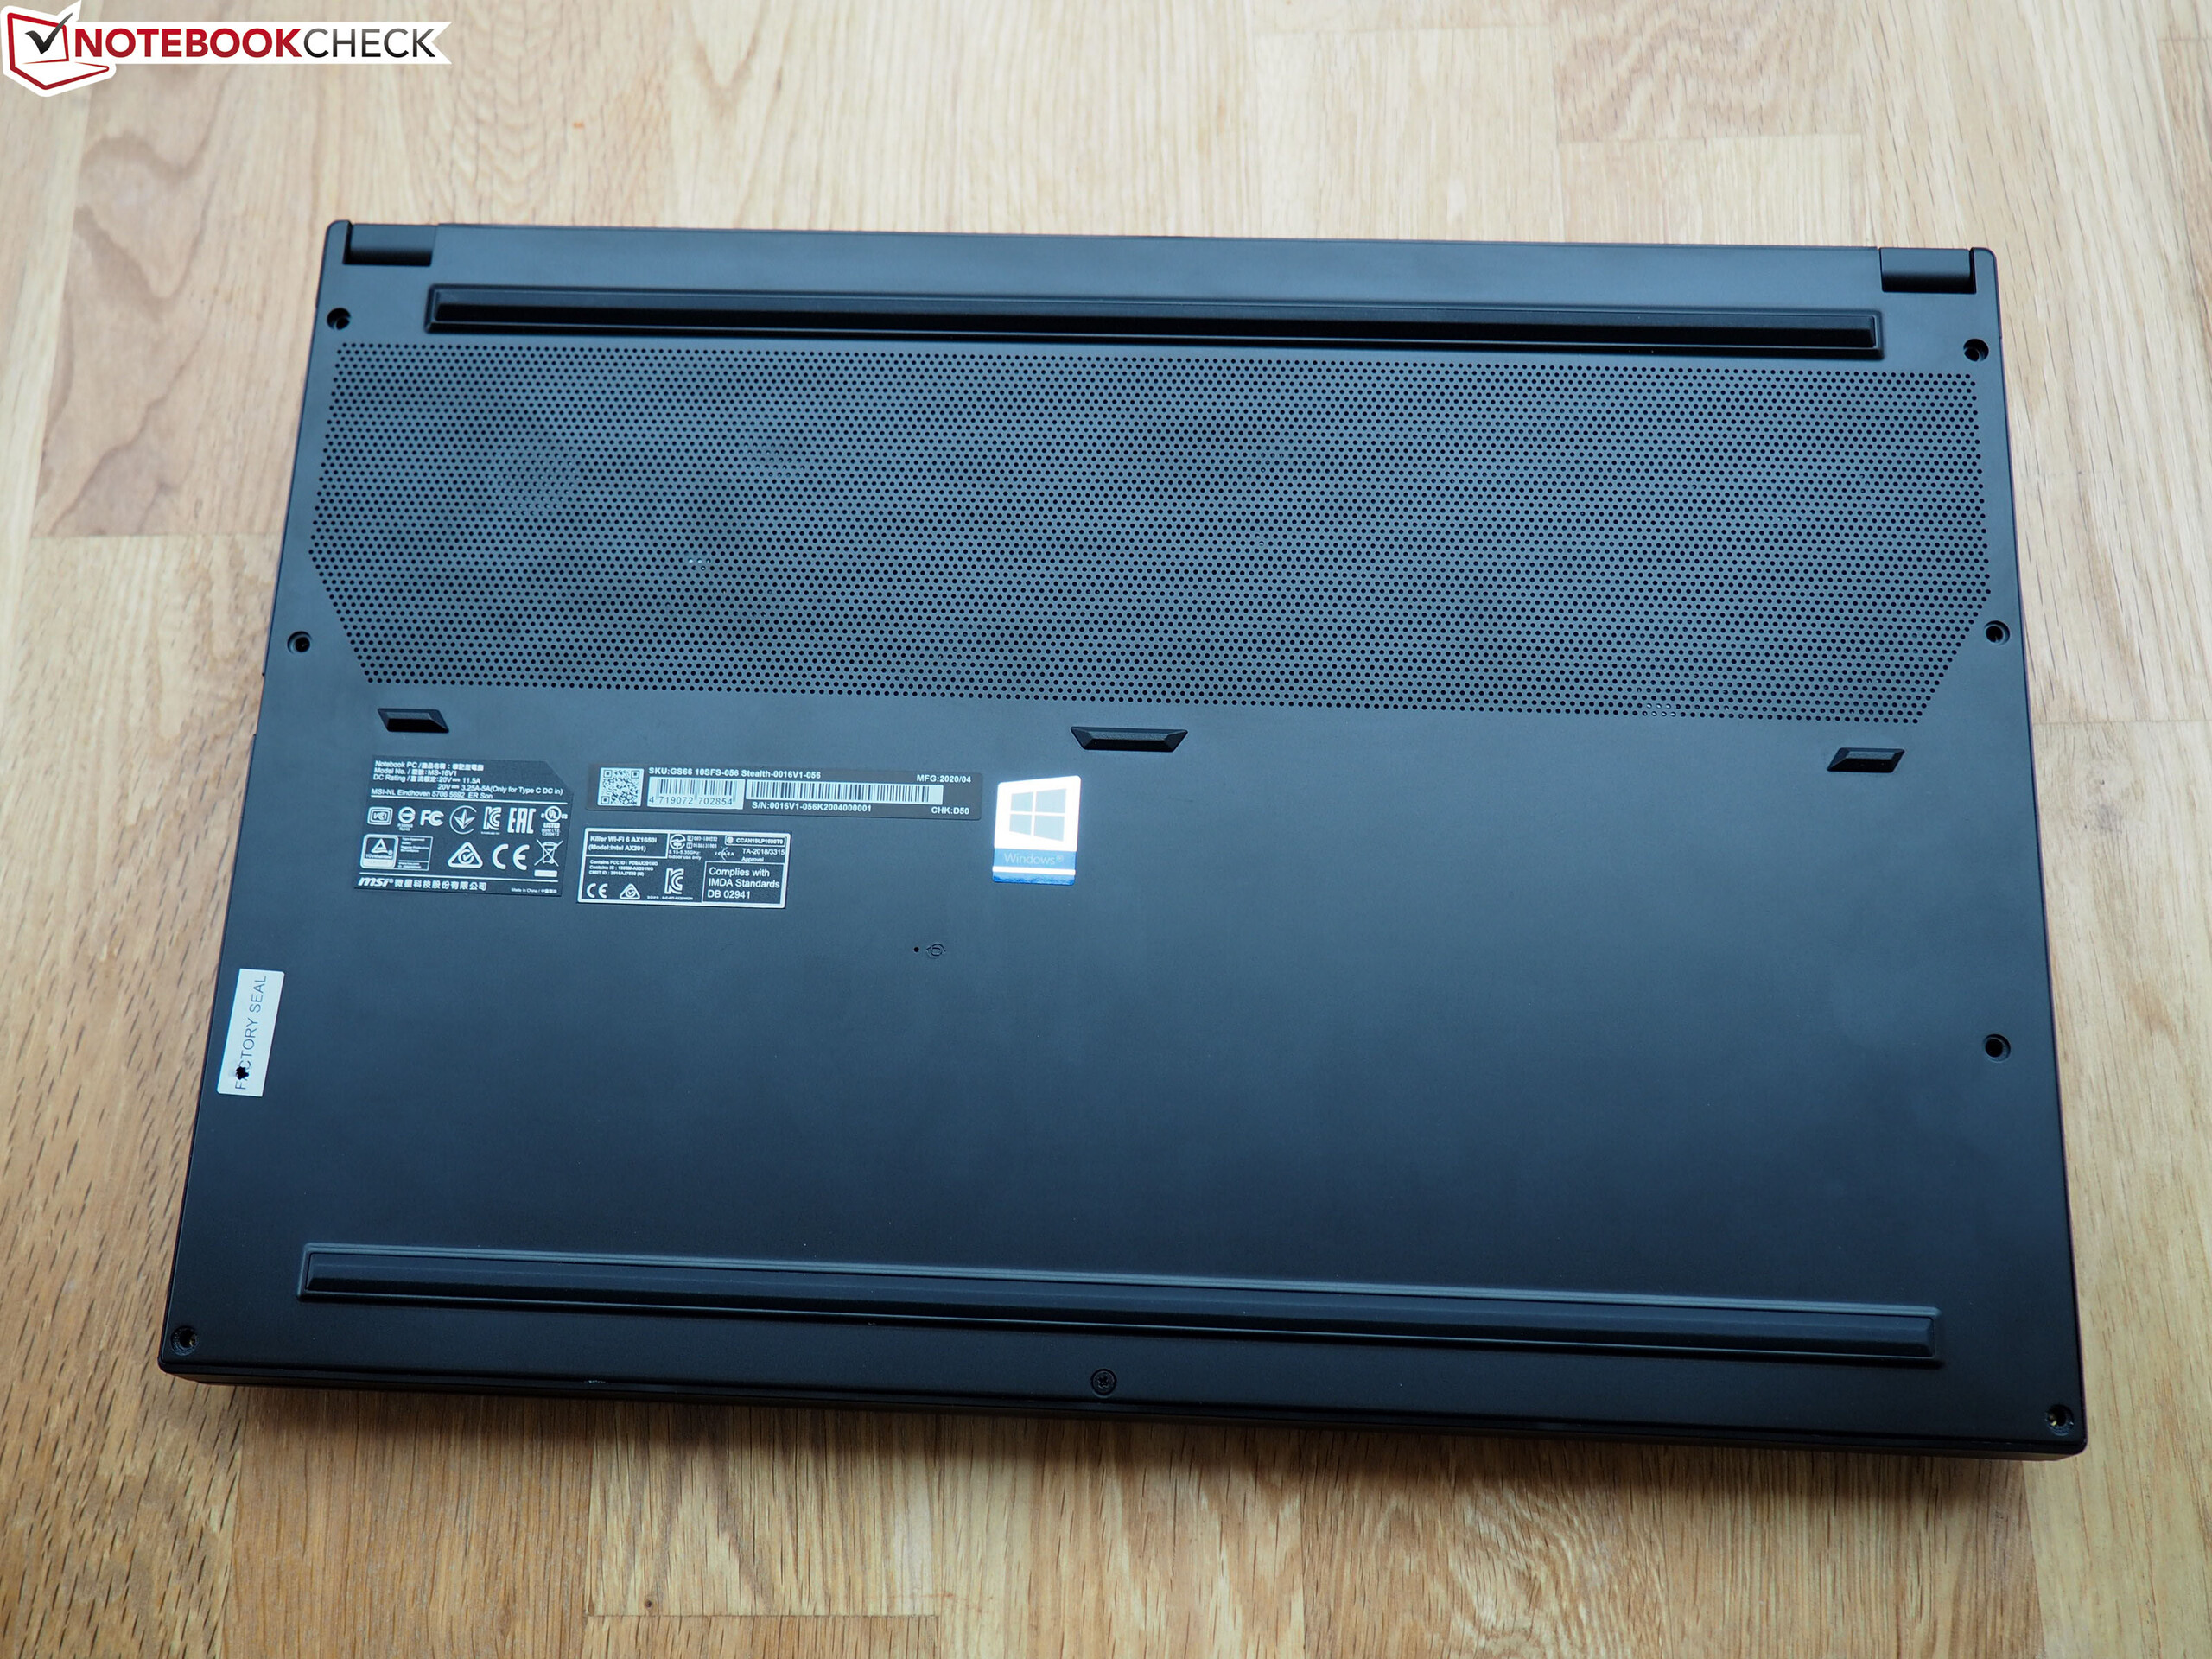
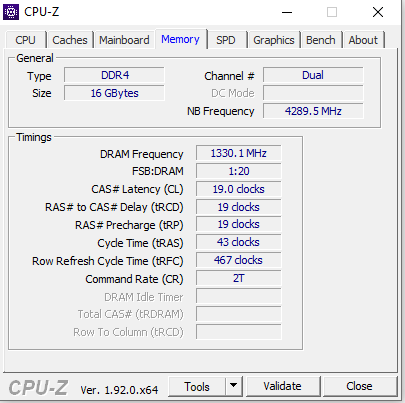
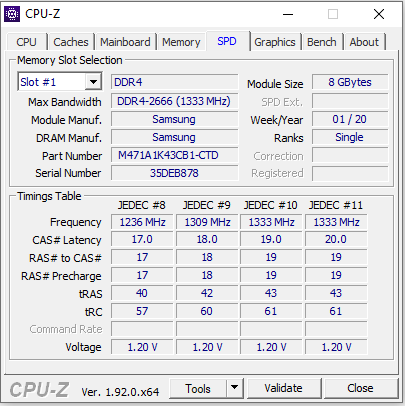
O hardware tem acesso a 16 GB de RAM (modo de canal duplo). Uma atualização de até 64 GB seria possível. Um SSD NVMe rápido de 1 TB fornece o espaço de armazenamento necessário. Se o espaço de armazenamento acabar, o portátil pode ser expandido com um segundo SSD NVMe. As medidas de manutenção/atualização exigem a remoção da tampa inferior da carcaça.
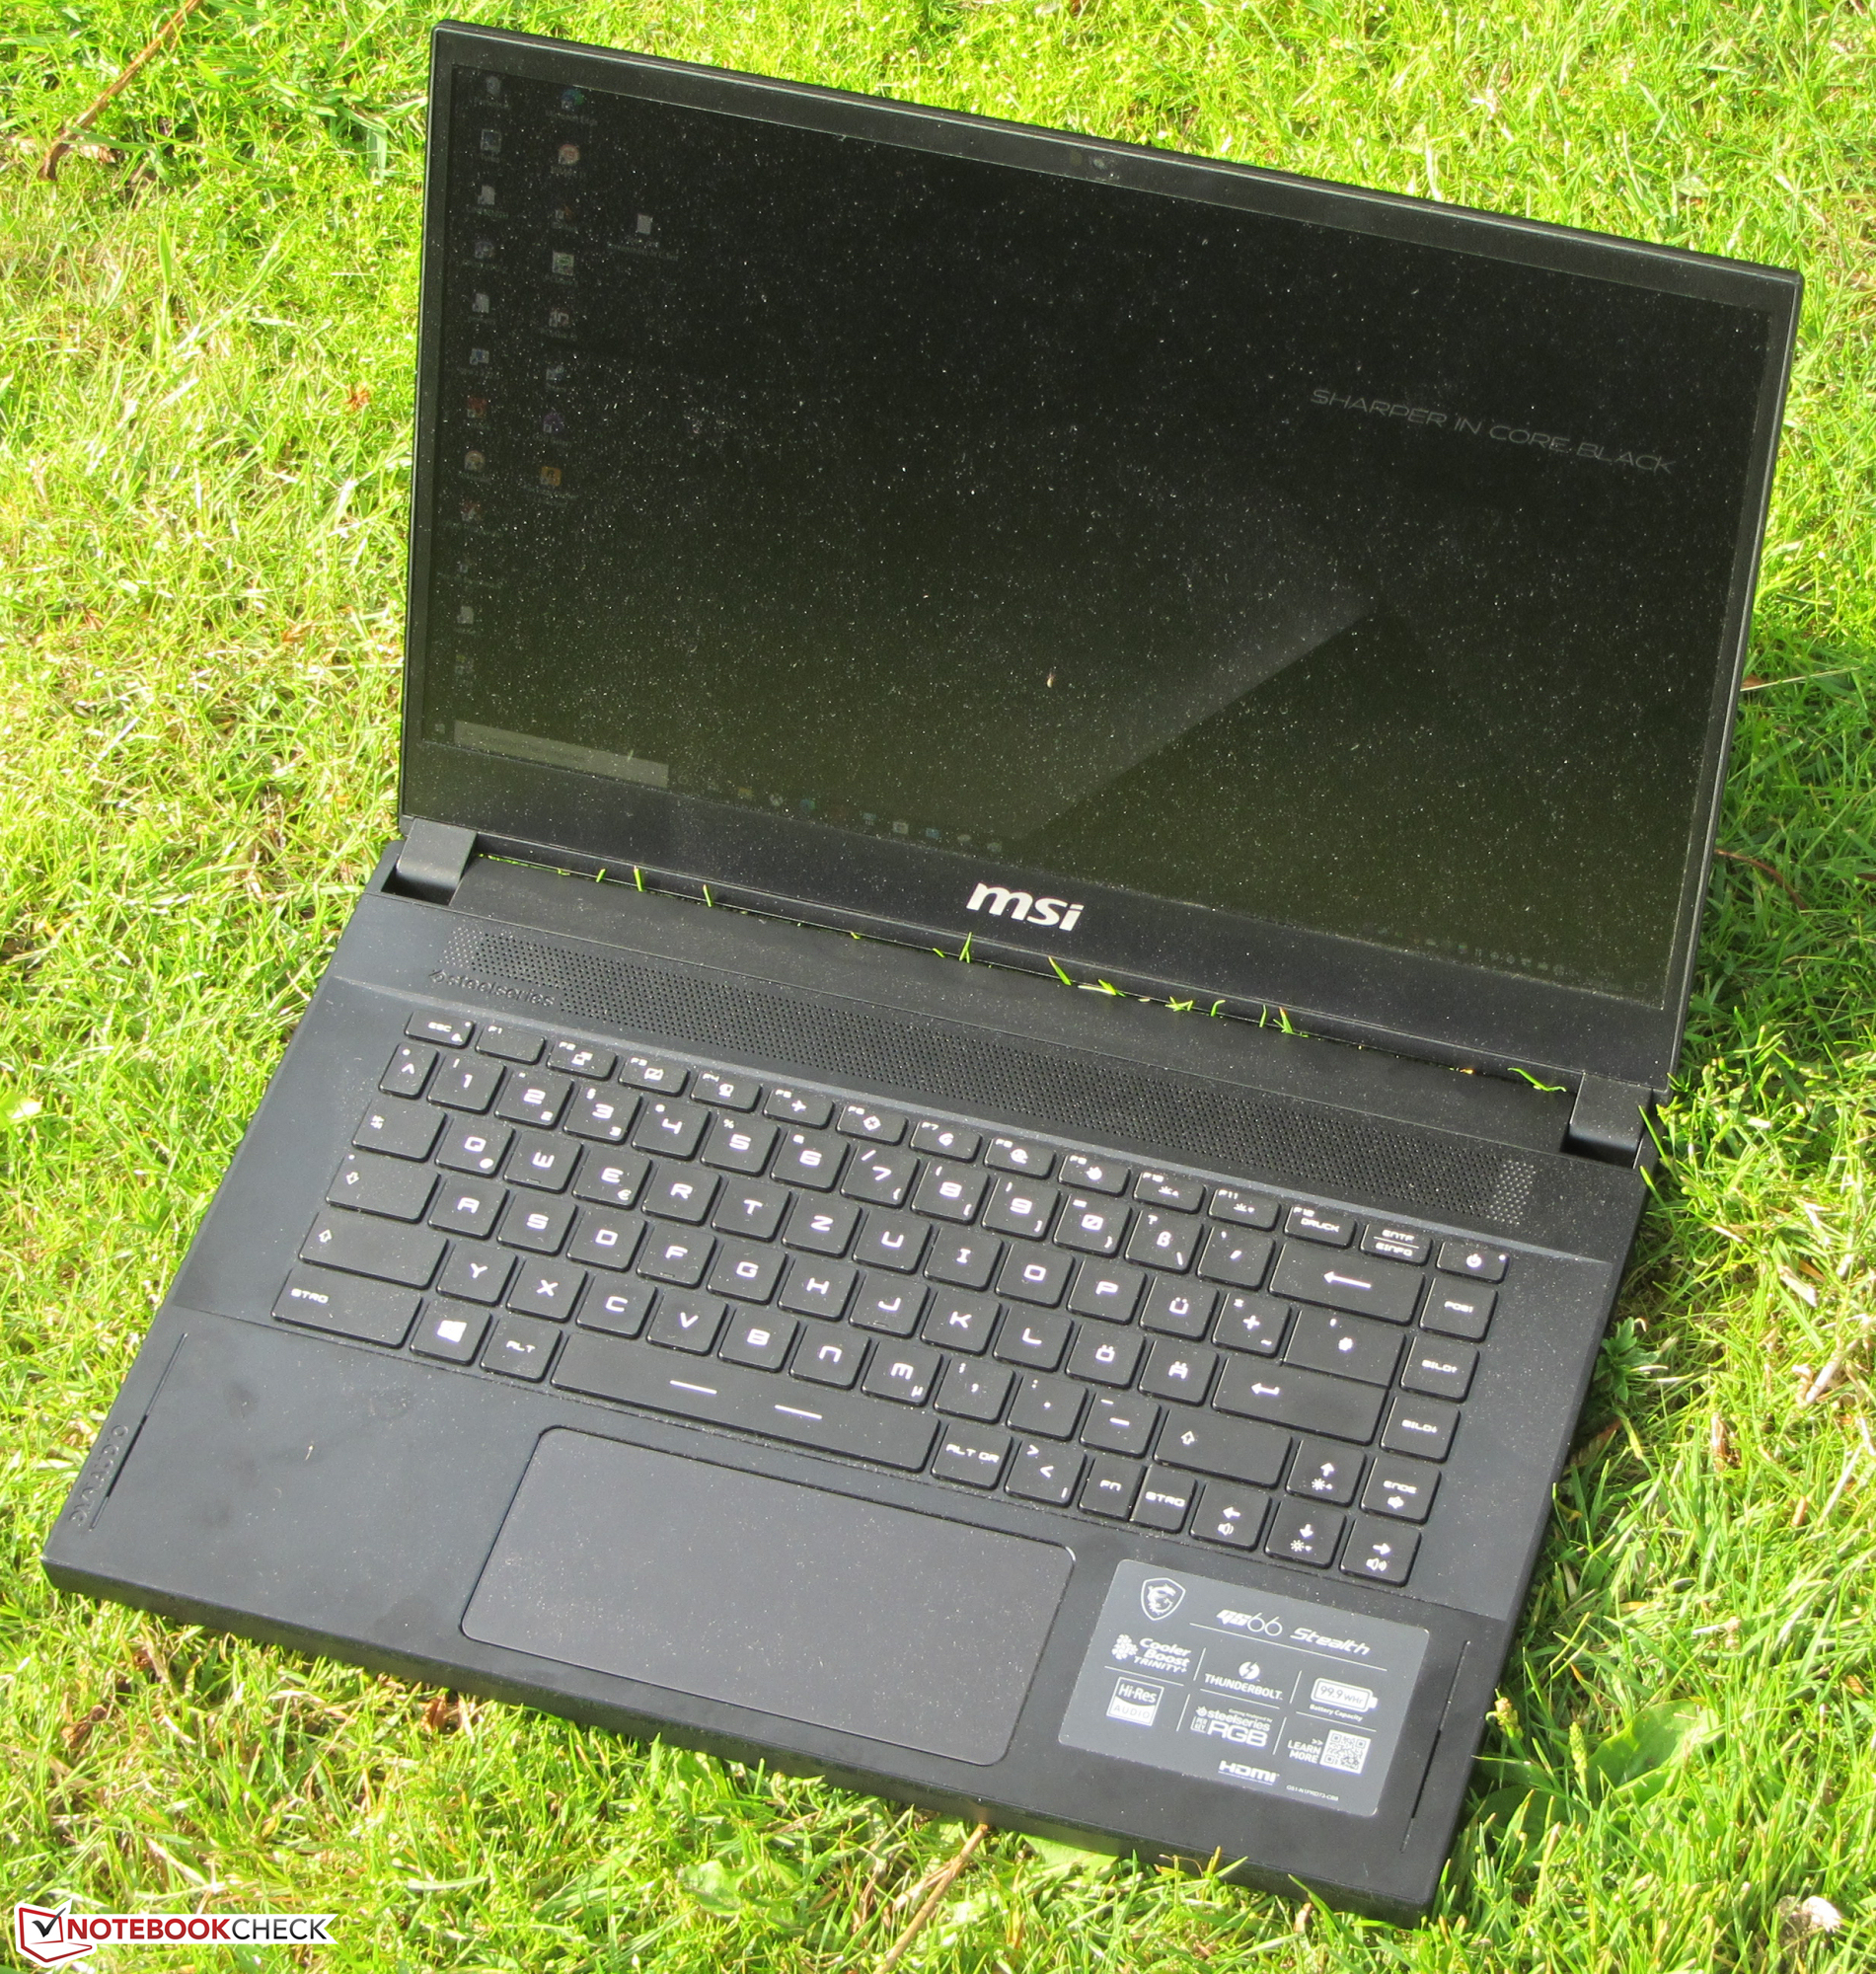
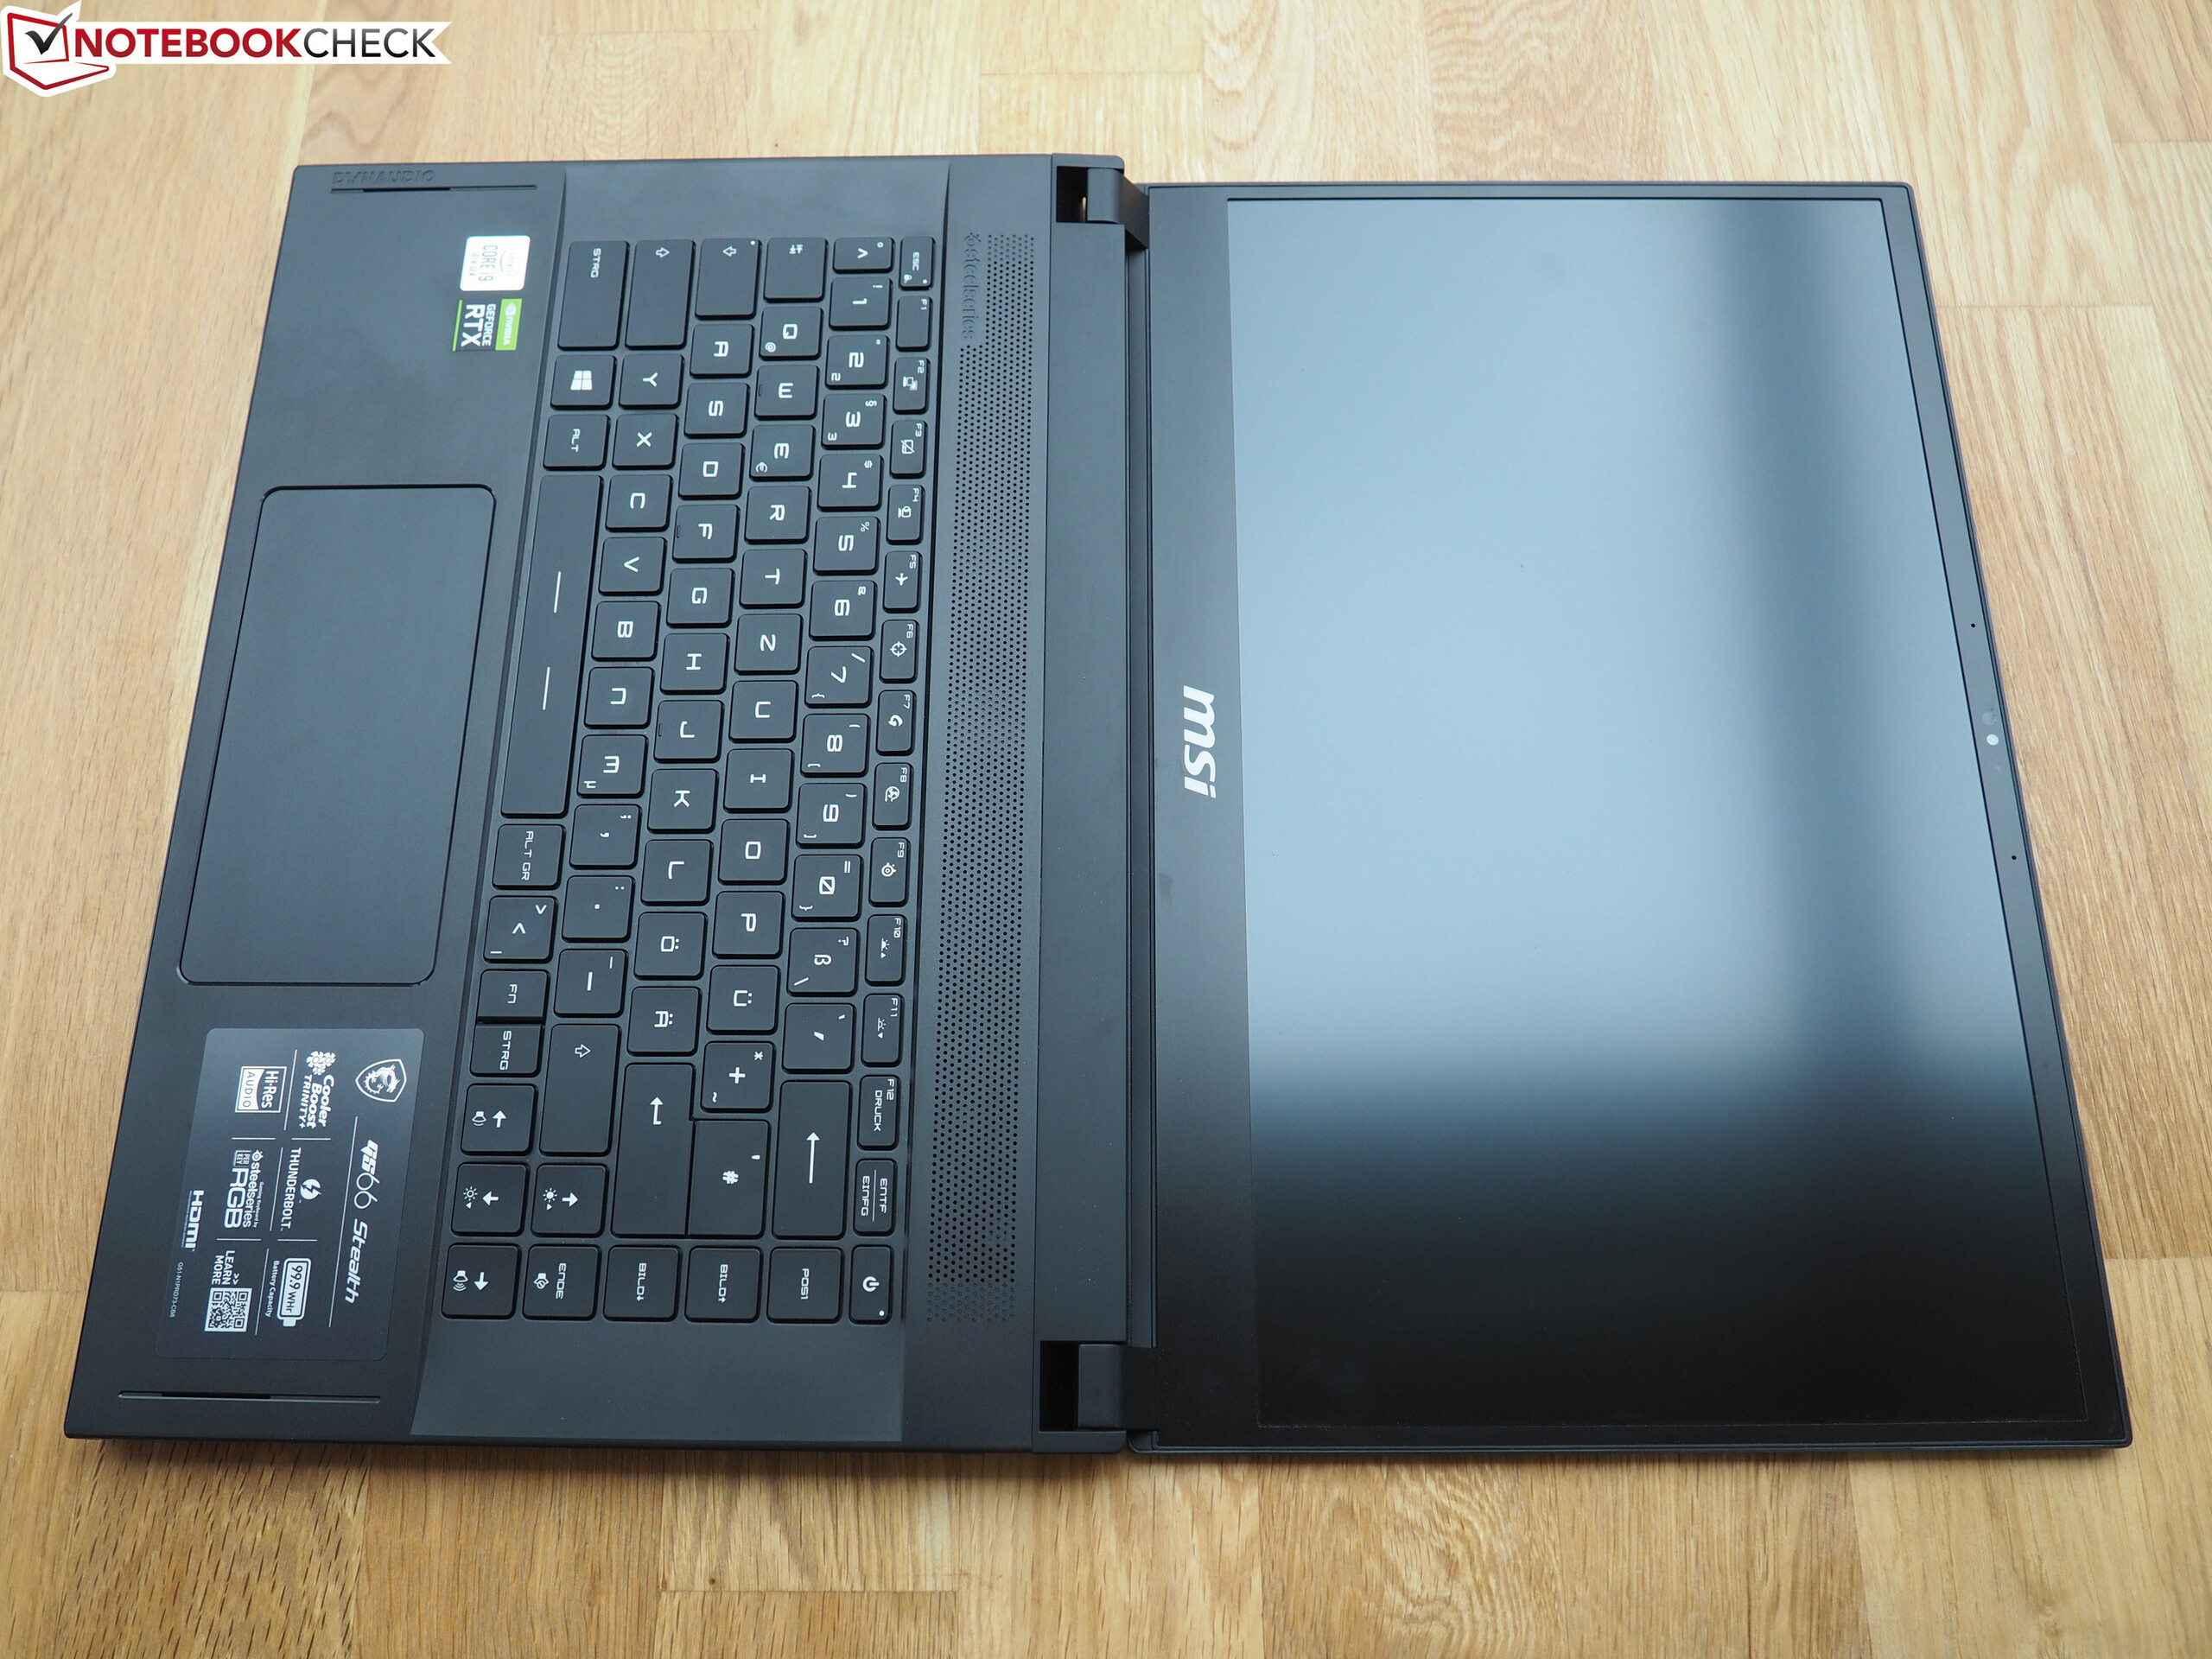
O destaque do portátil é a tela IPS de 240 Hz.
A tela ganha pontos com tempos de resposta curtos, ângulos de visão estáveis, um bom contraste e uma ótima reprodução de cores. Por outro lado, o brilho máximo é baixo. Um portátil nessa faixa de preço deve oferecer mais a esse respeito.
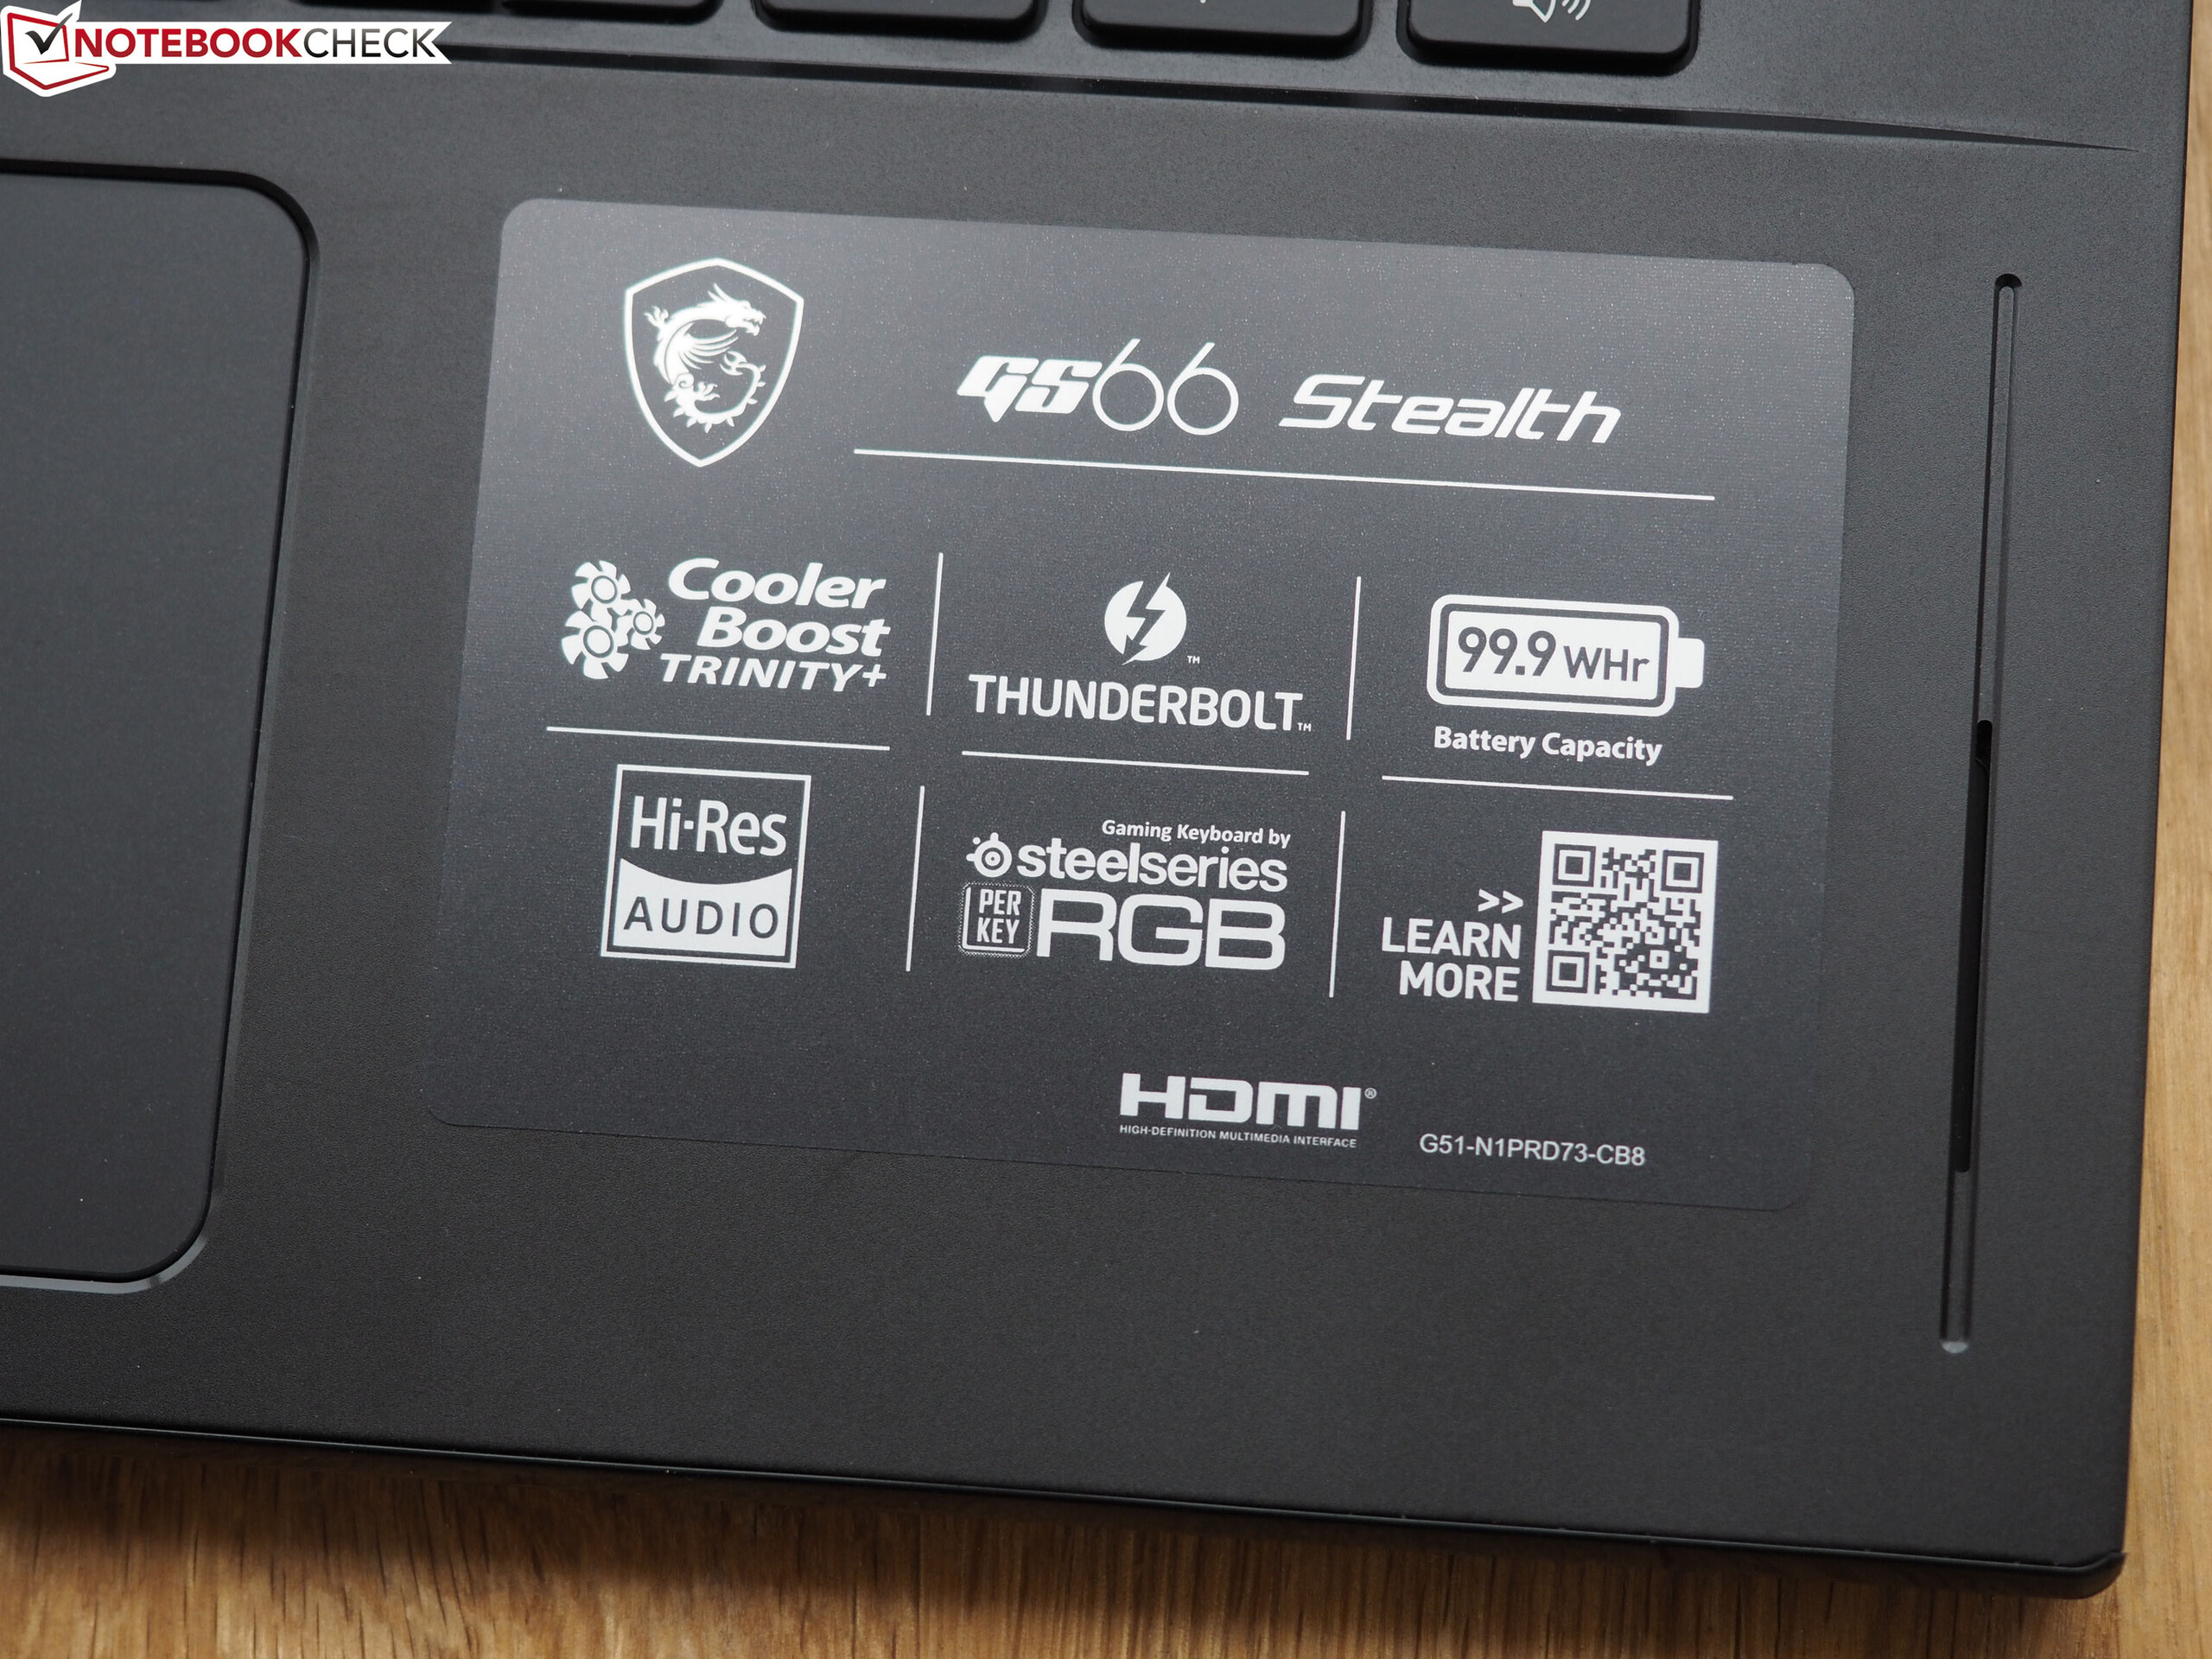
Em princípio, as durações da bateria são mais do que adequadas para um portátil para jogos. Mas se você as vê em relação à capacidade da bateria (99,9 Wh), as coisas parecem diferentes. Os concorrentes obtêm tempos duração semelhantes ou parcialmente melhores com baterias que têm apenas metade da capacidade da bateria do GS66. O alto consumo de energia em uso ocioso e sob carga baixa é perceptível aqui.
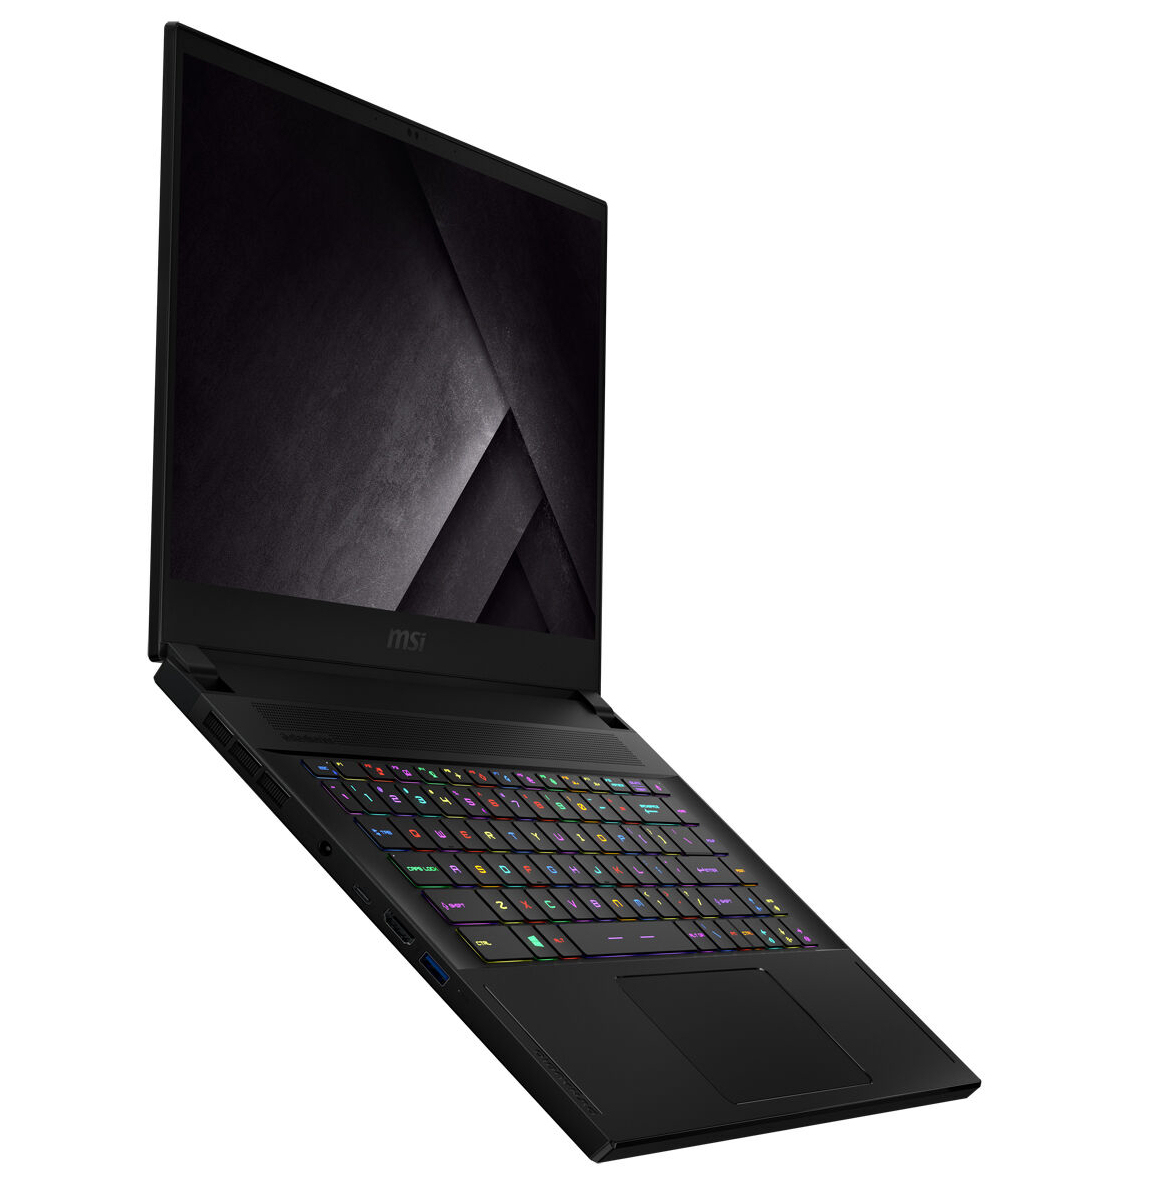
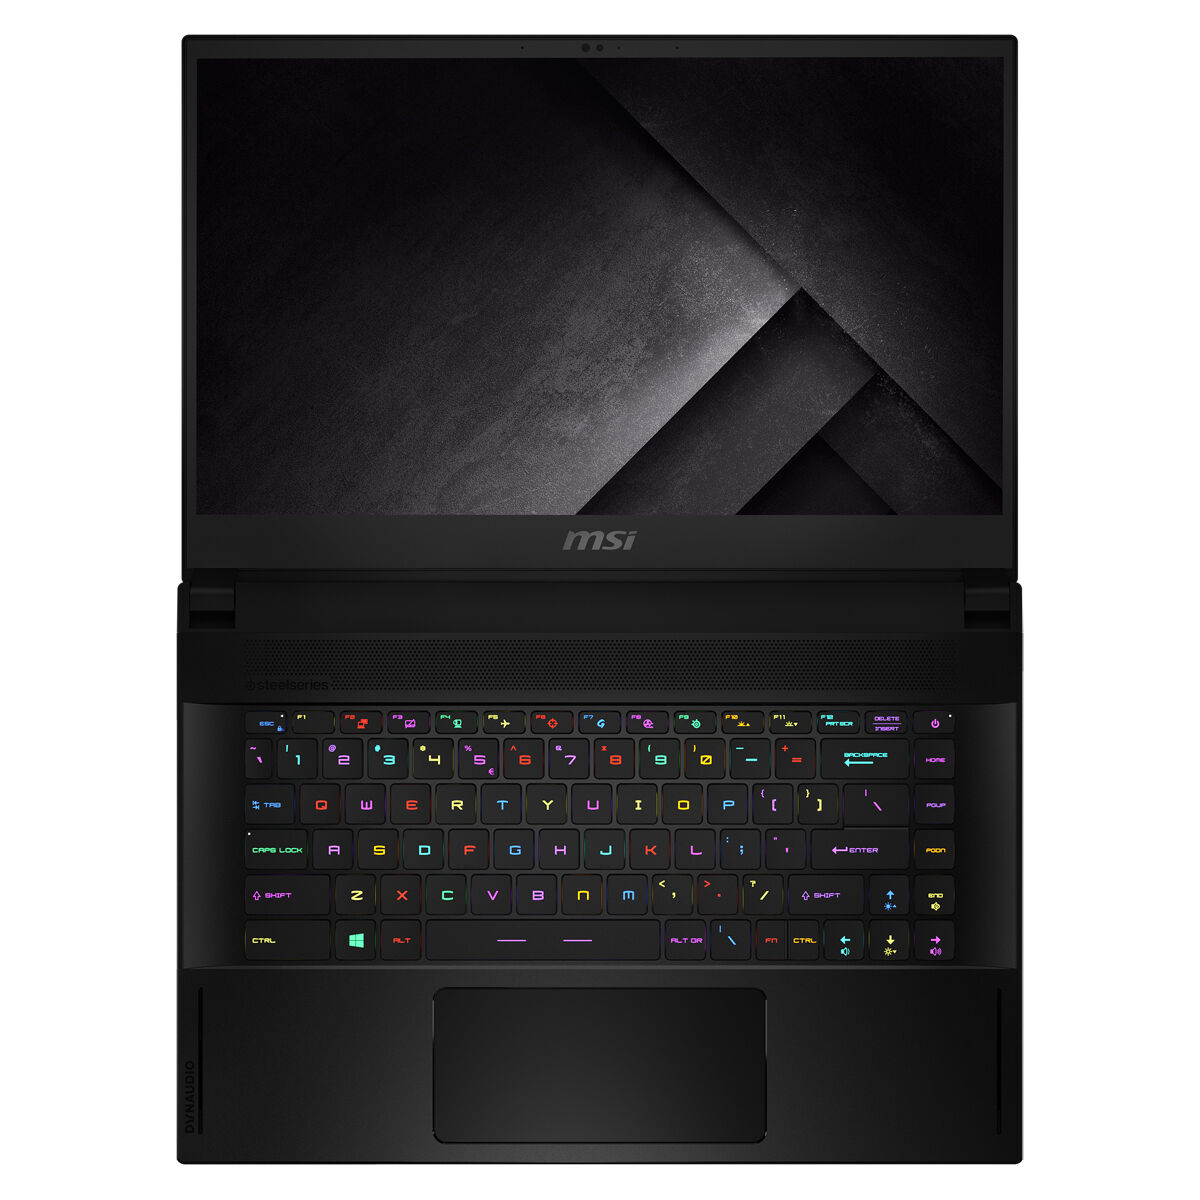
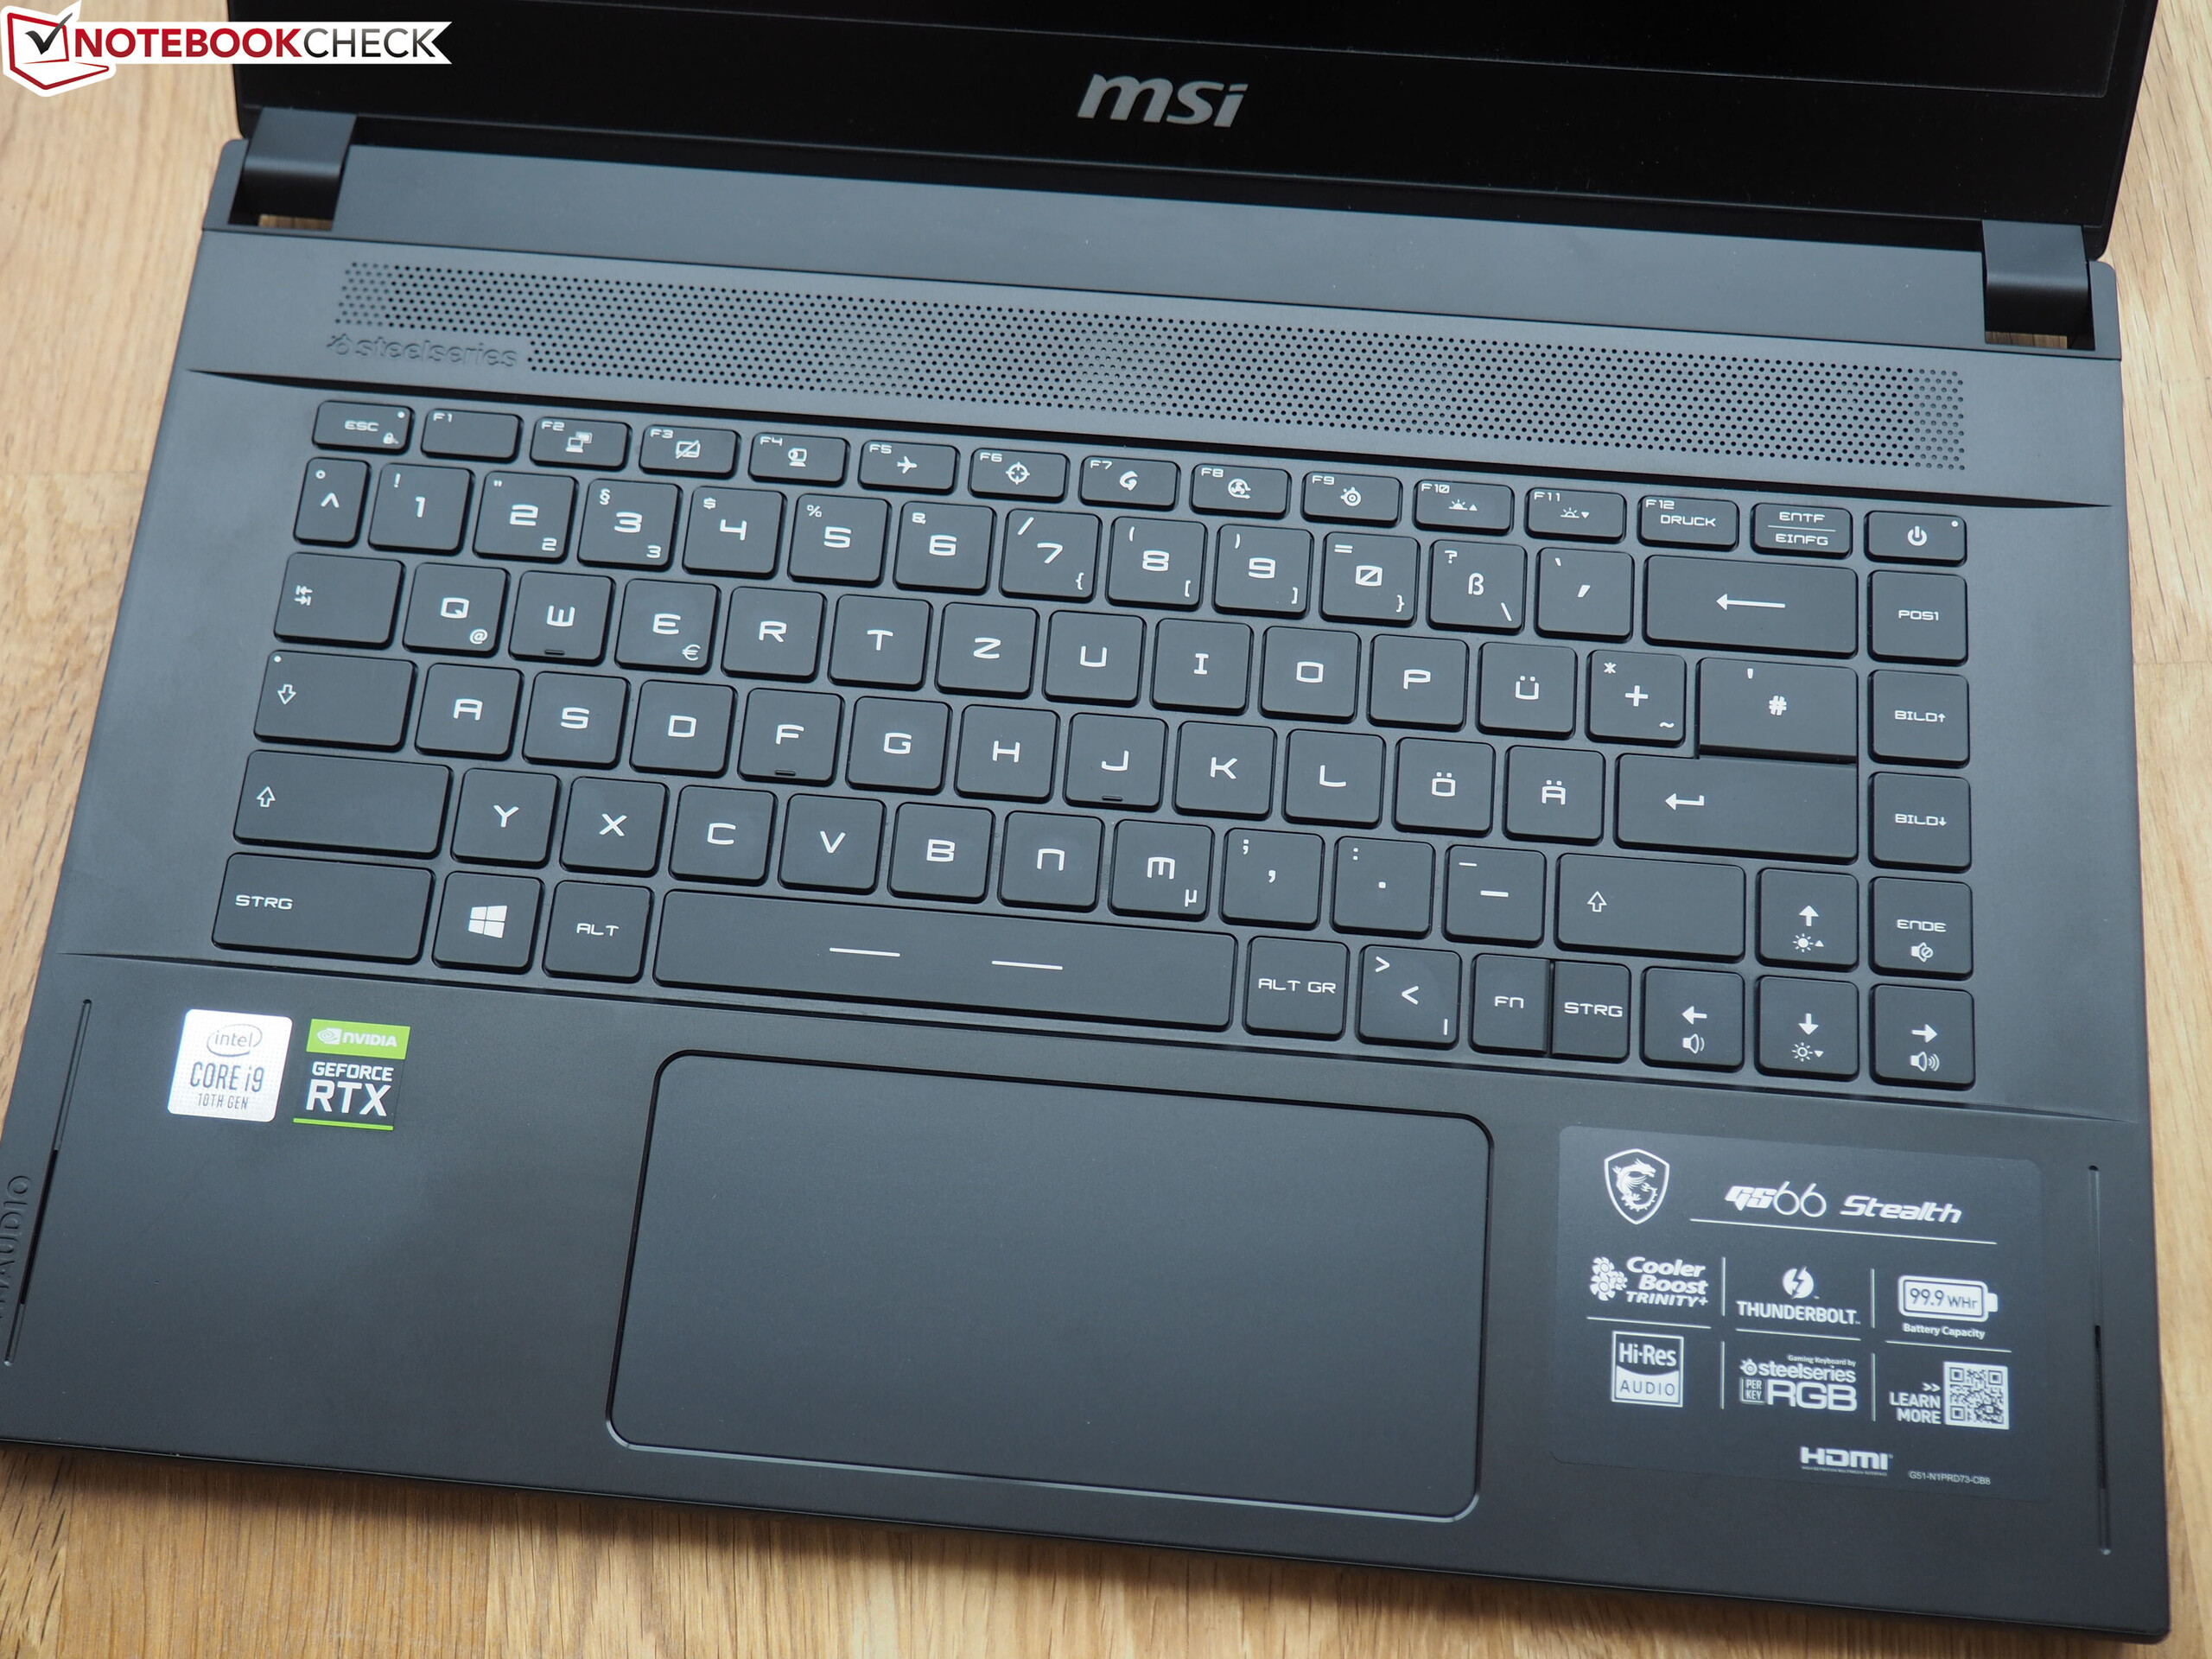
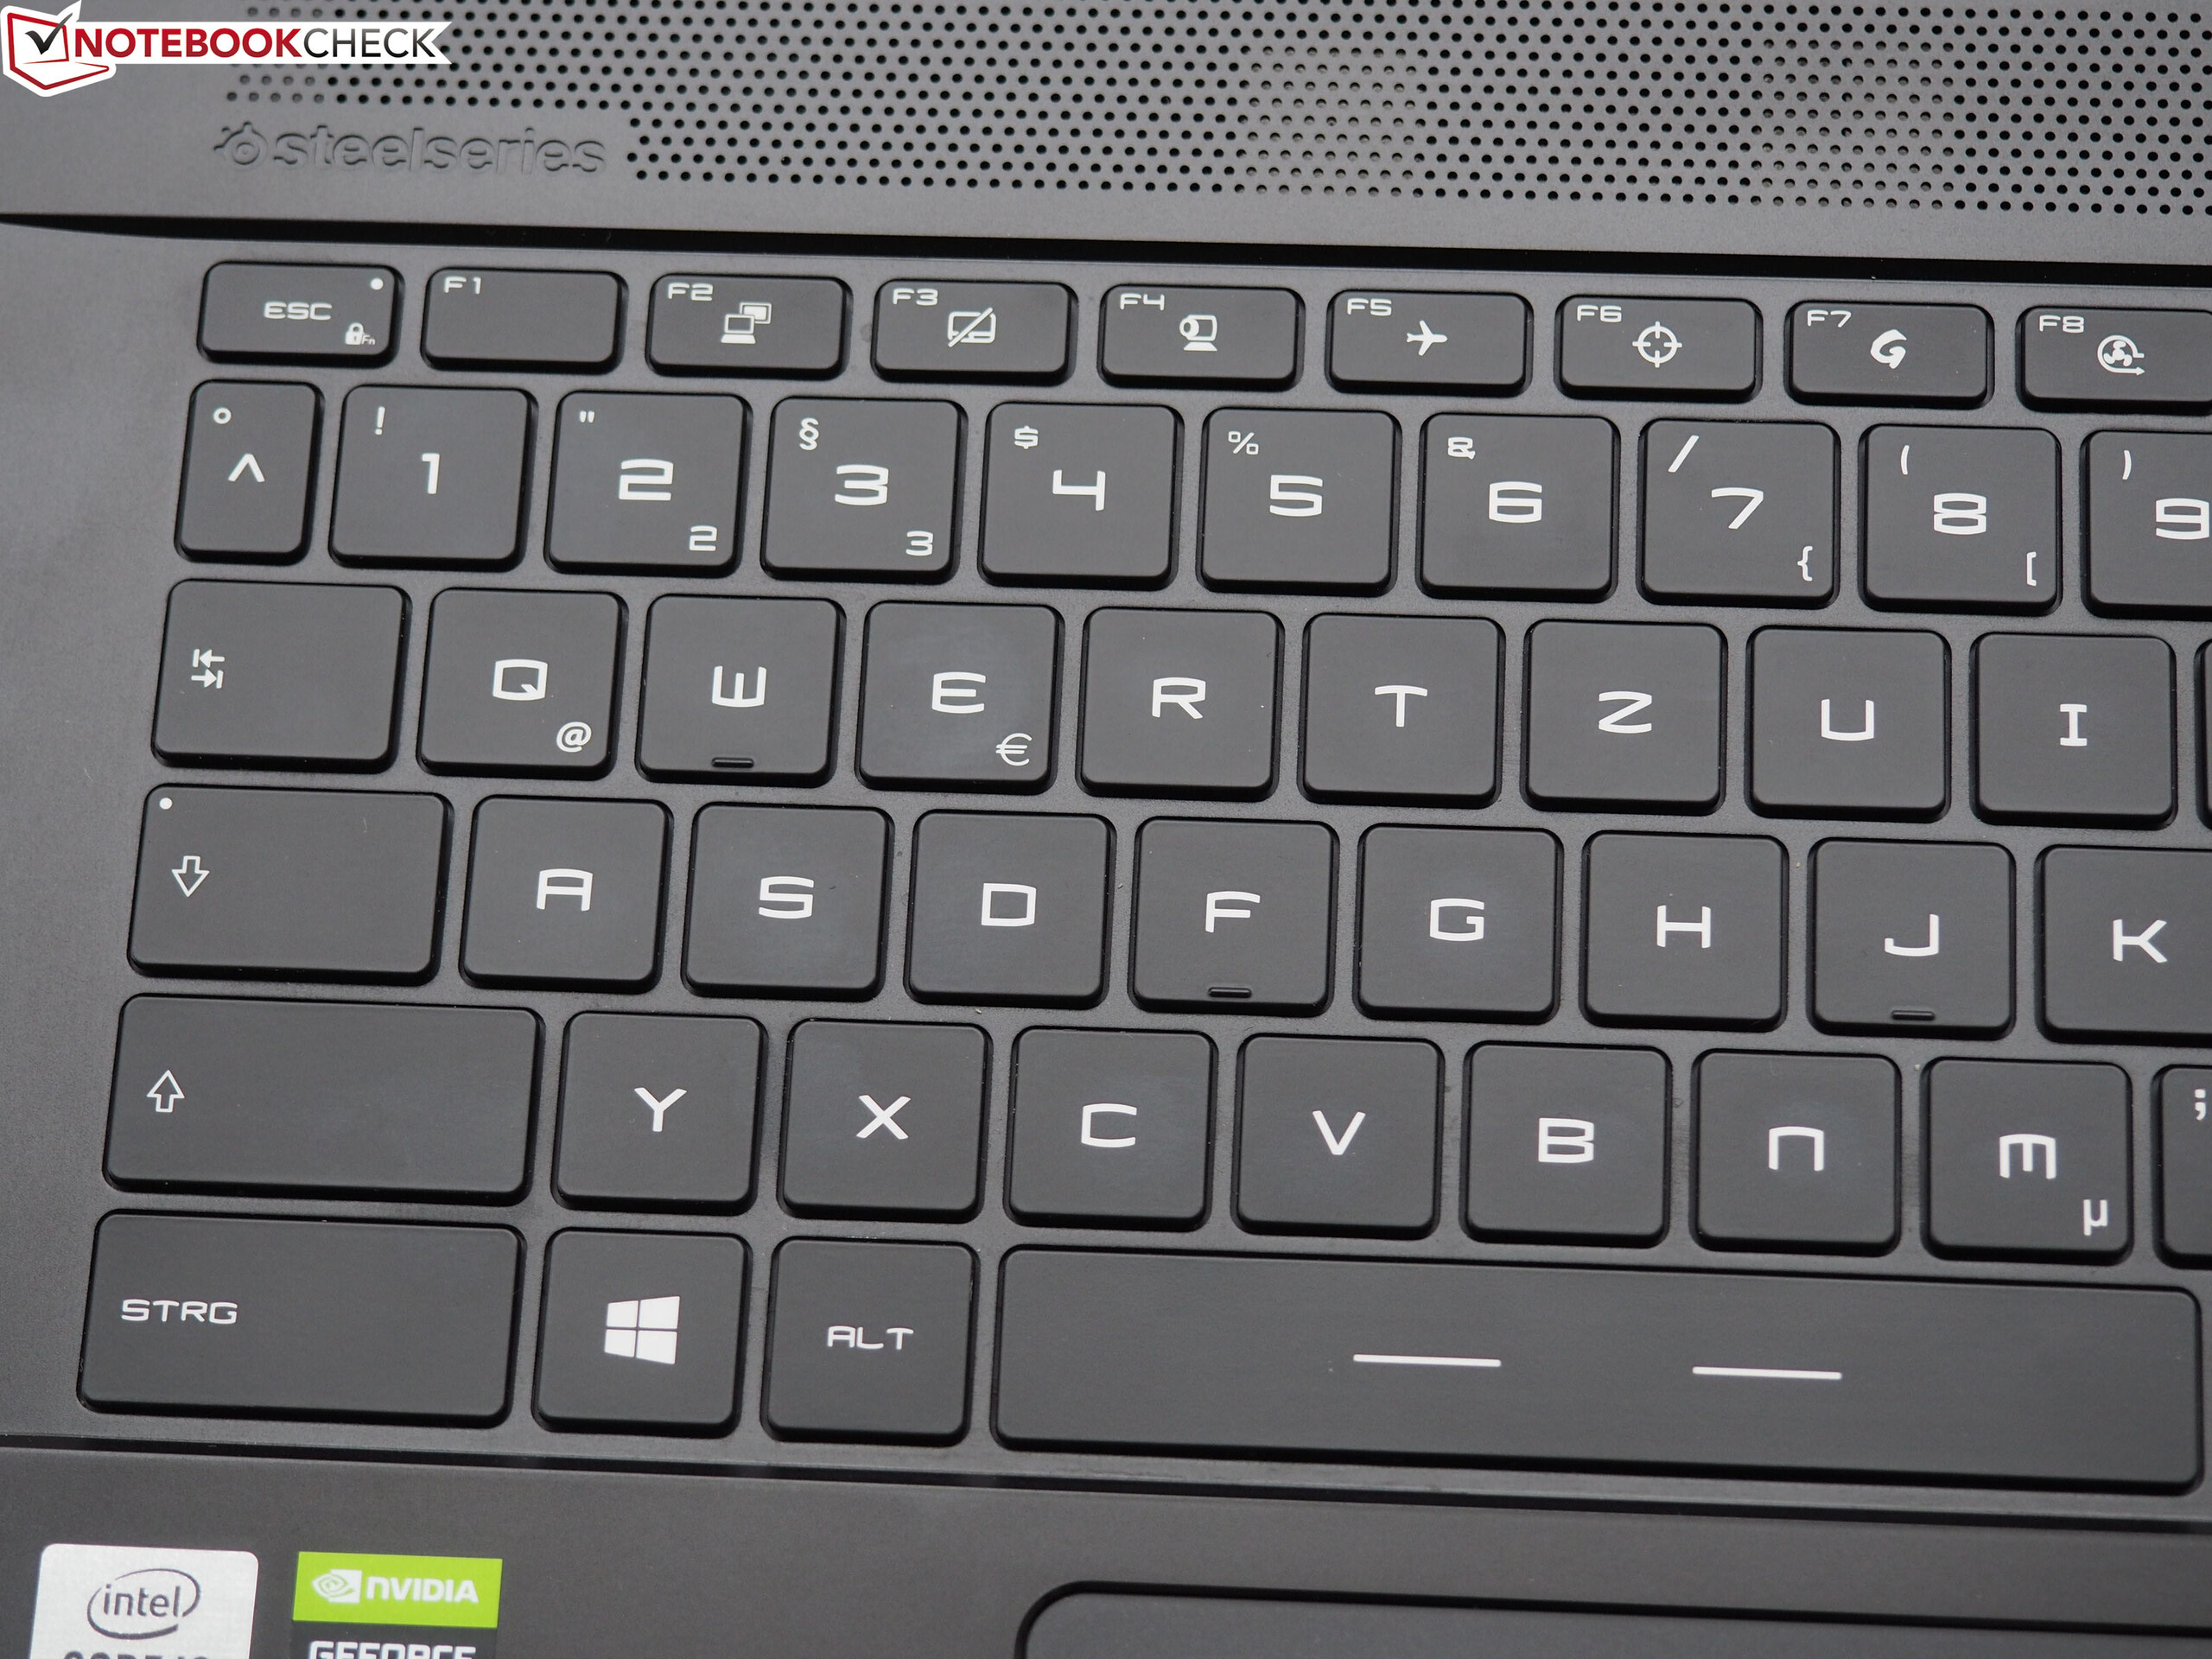
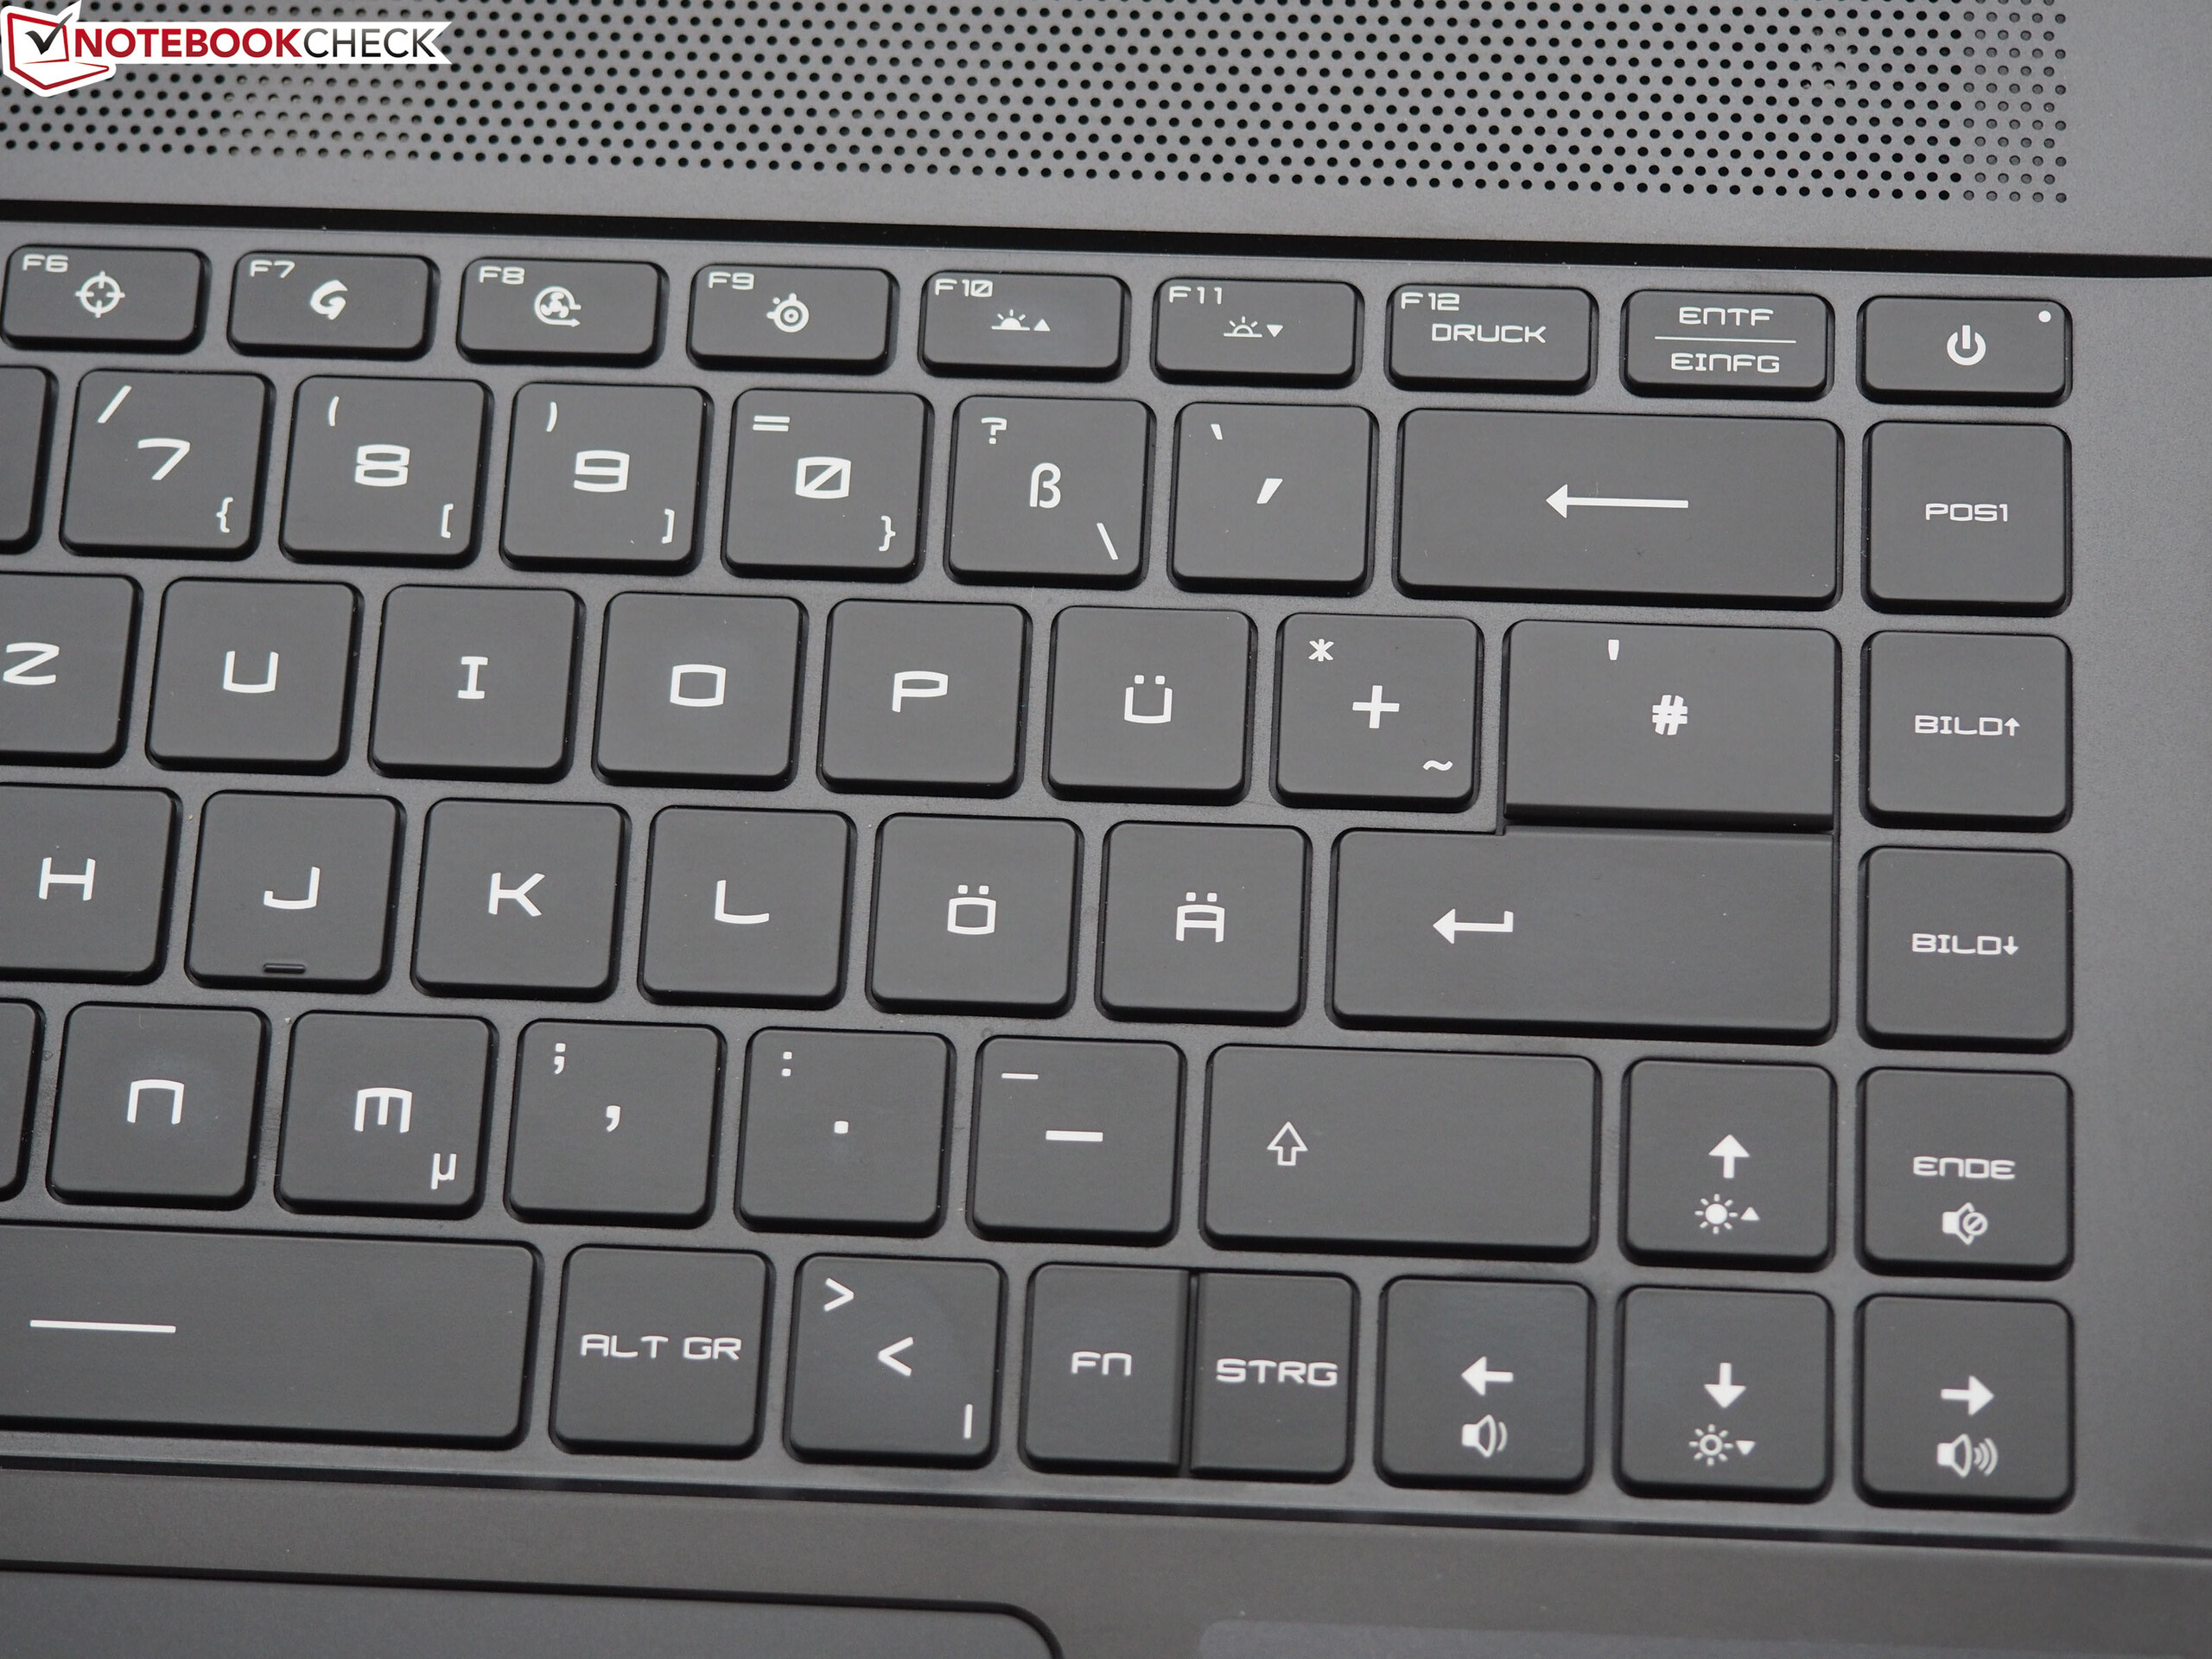
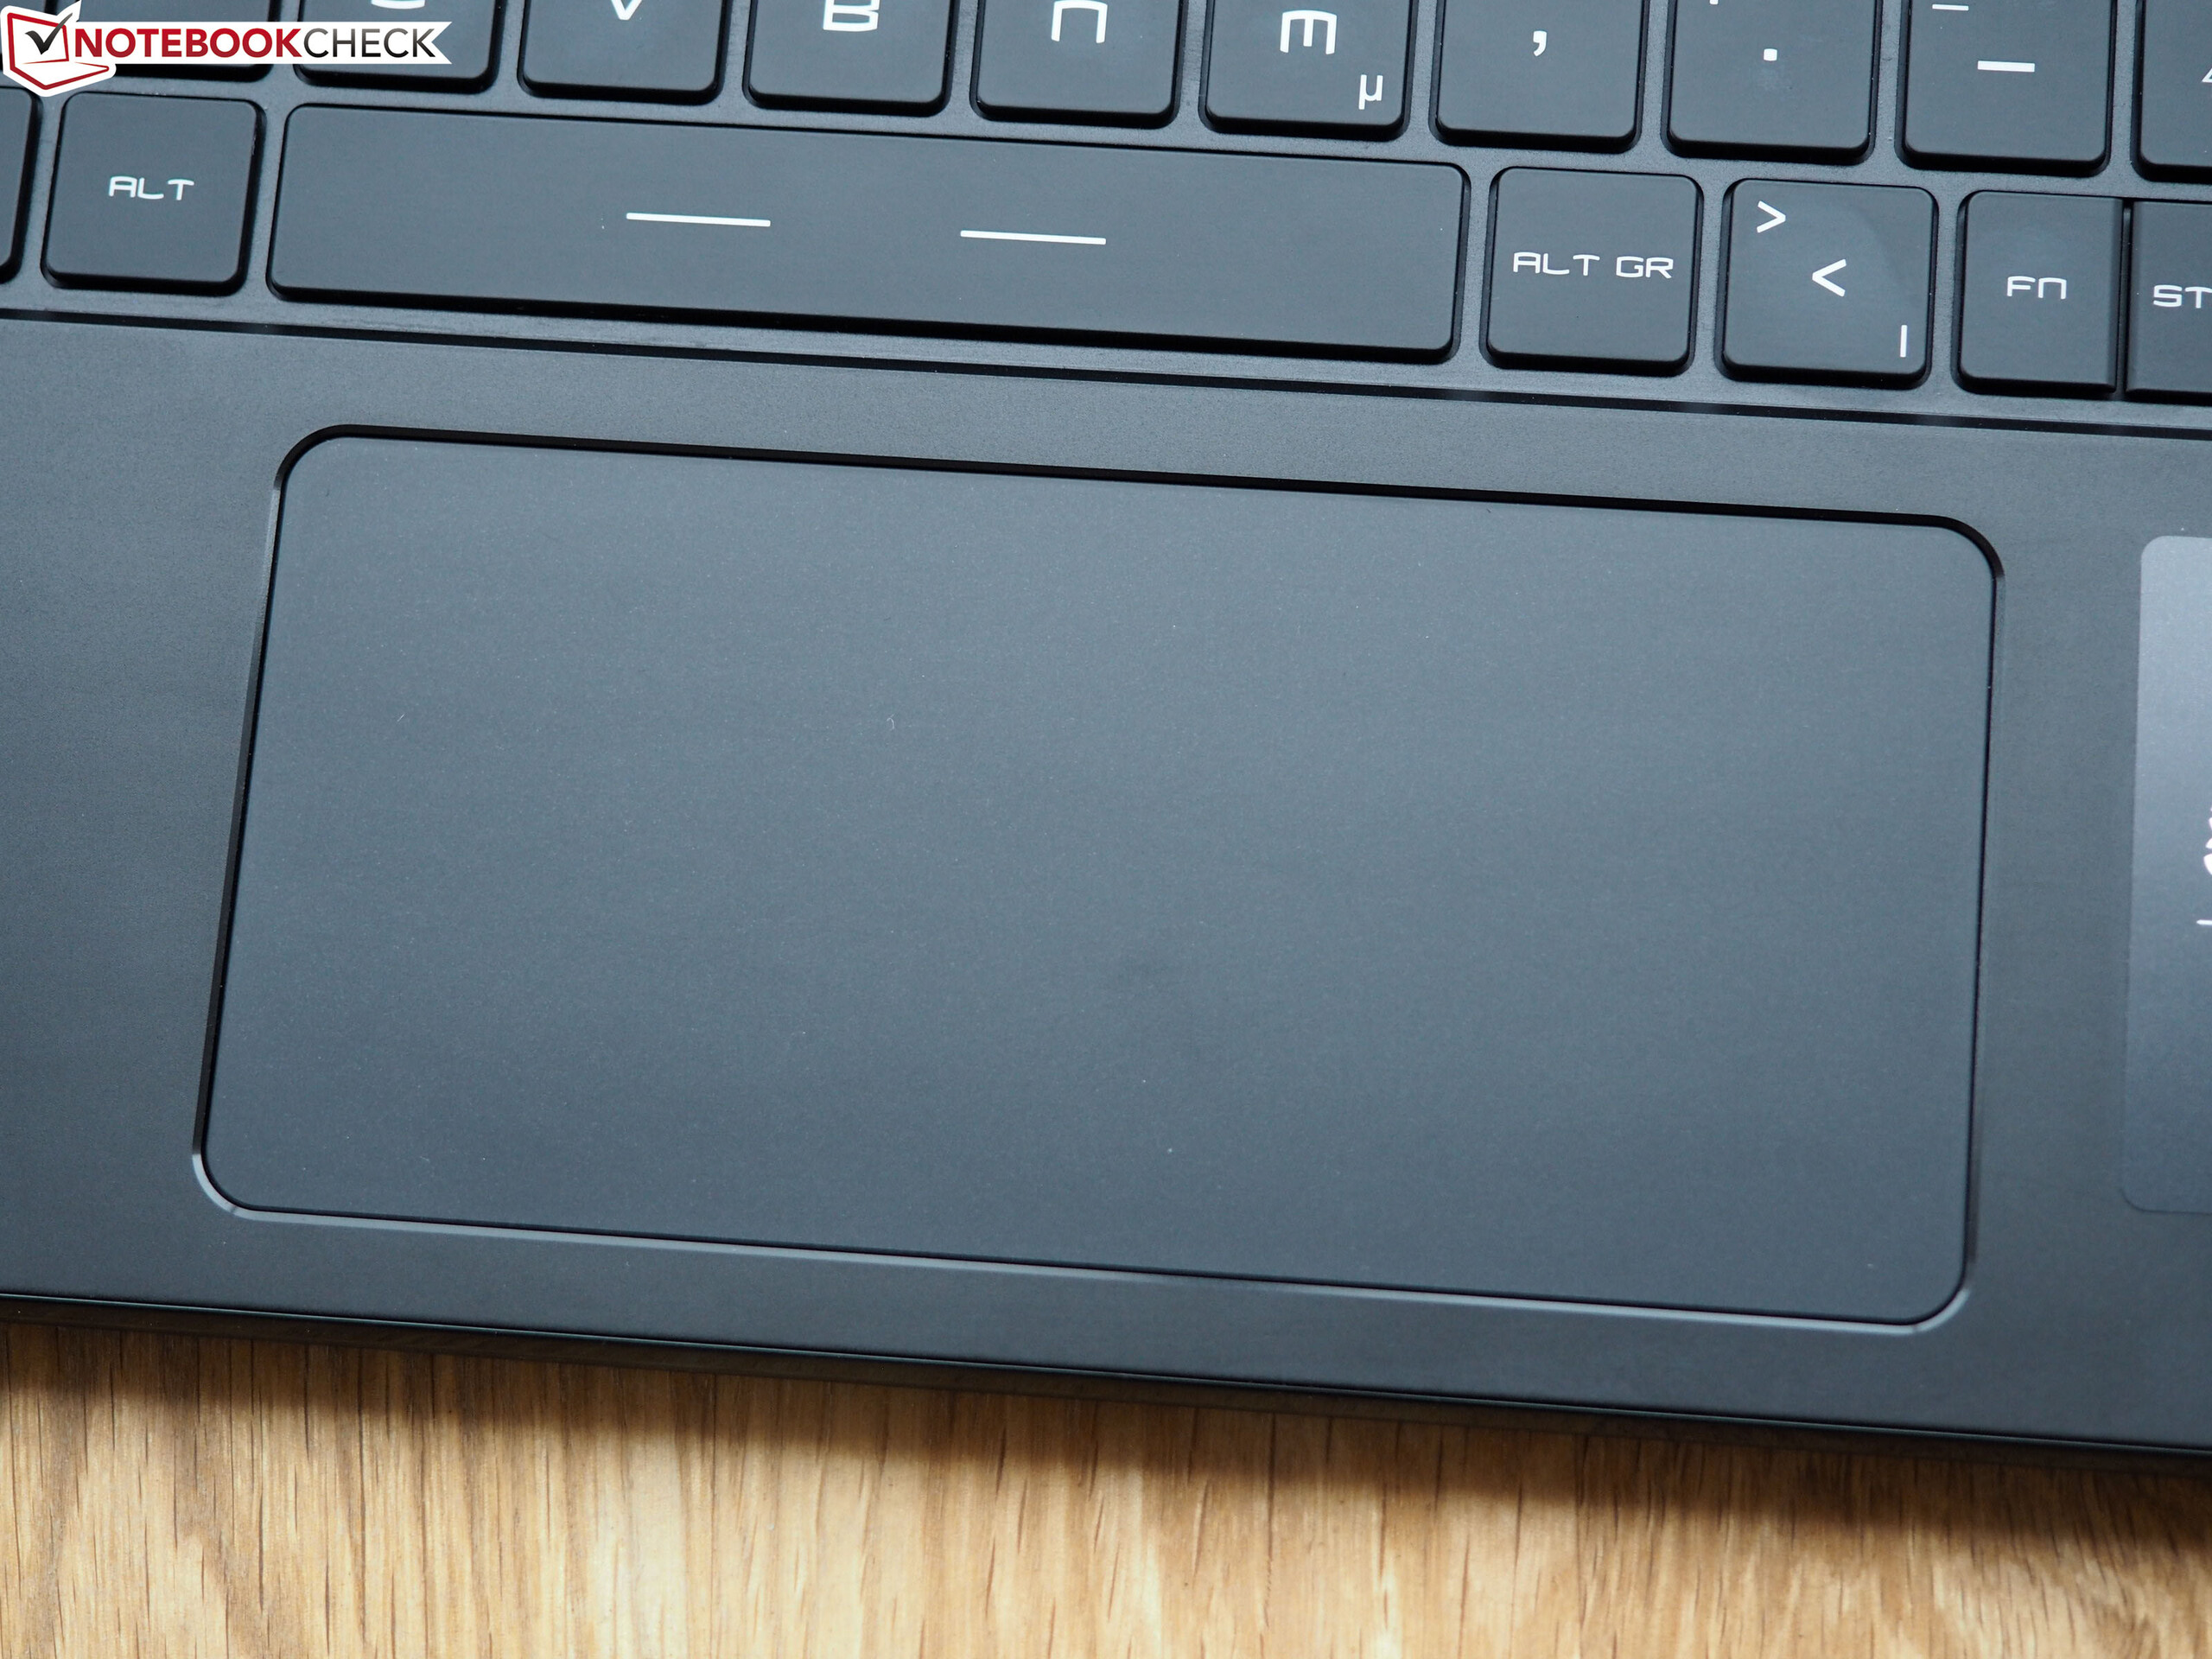
O teclado chiclet (iluminação RGB) provou ser adequado para o uso diário. Além disso, a versátil configuração de portas inclui, entre outras coisas, uma porta Thunderbolt 3 que permite a conexão de soluções de docking extensas ou uma GPU externa. A bateria não pode ser carregada por meio das portas Thunderbolt 3 ou USB Type-C 3.2 Gen 2. Conectamos um adaptador de alimentação de 45 watts, mas não conseguimos acionar um processo de carregamento com ele.process with it.
MSI GS66 Stealth 10SE-045
- 08/05/2020 v7 (old)
Sascha Mölck
Price comparison
