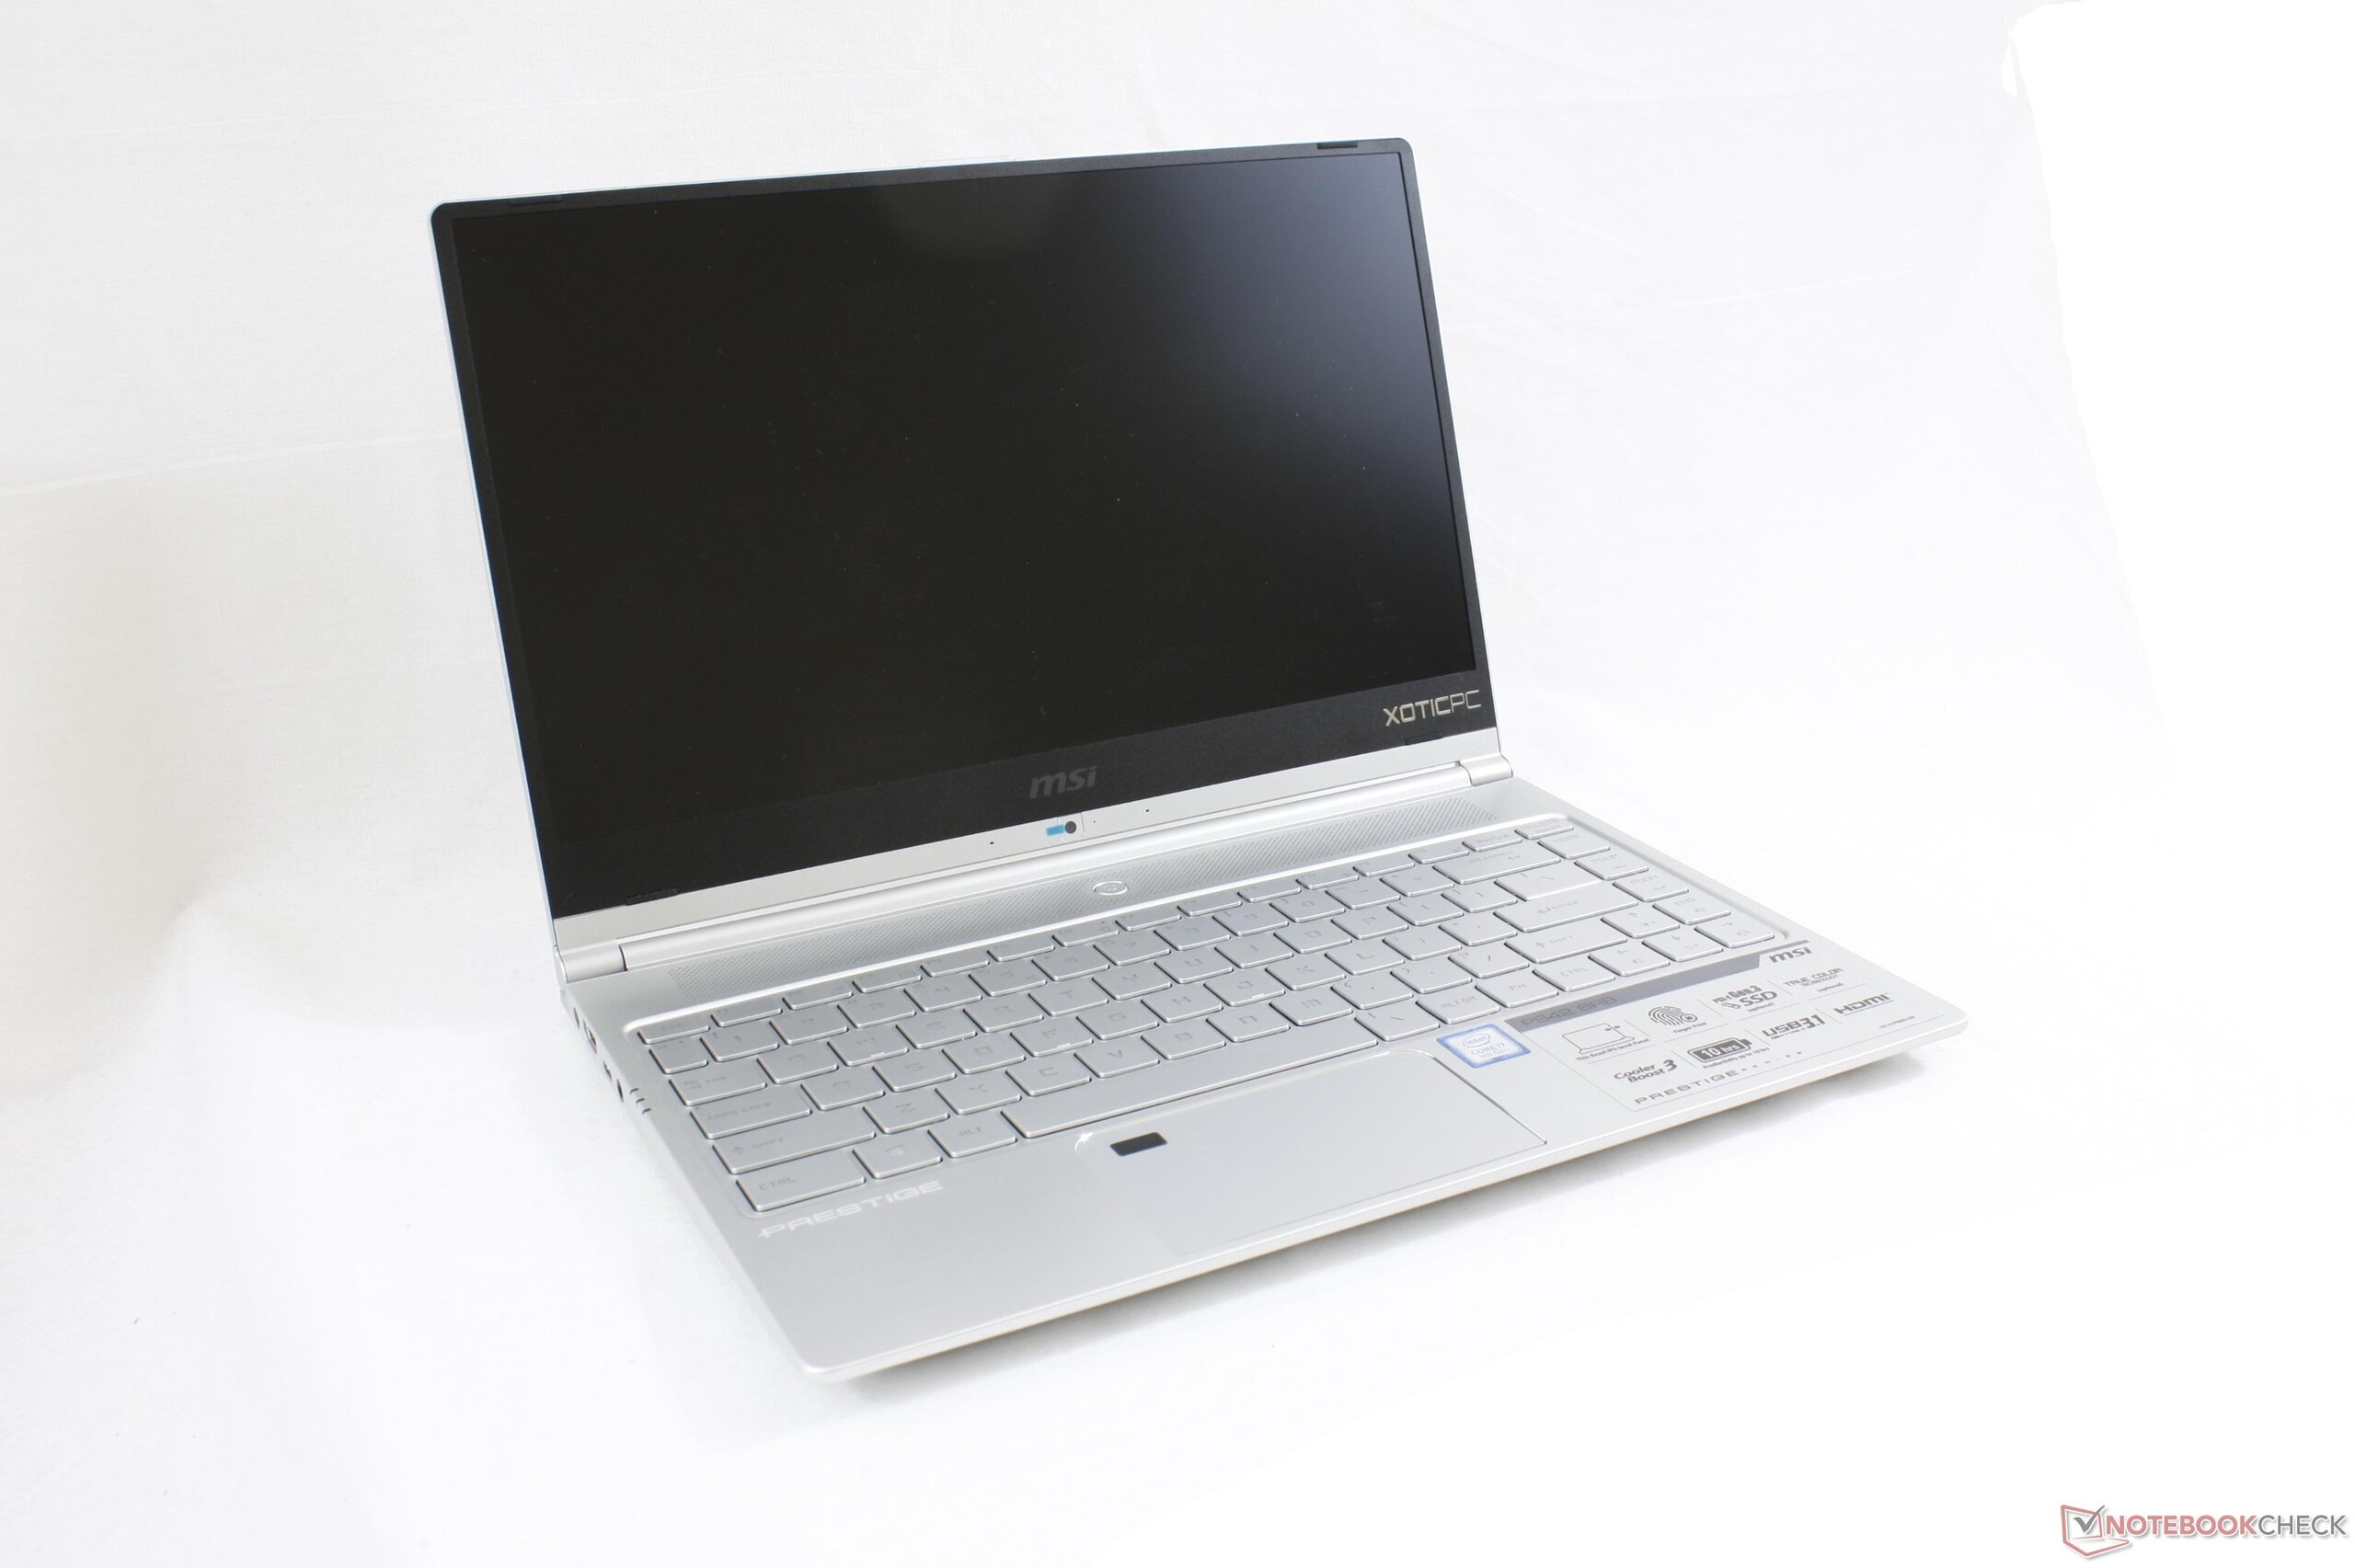
Breve Análise do Portátil MSI PS42 8RB Prestige (i7-8550U, GeForce MX150)
| SD Card Reader | |
| average JPG Copy Test (av. of 3 runs) | |
| Dell XPS 13 9370 i7 UHD (Toshiba Exceria Pro UHS-II) | |
| Lenovo ThinkPad T480s-20L7002AUS (Toshiba Exceria Pro SDXC 64 GB UHS-II) | |
| MSI Prestige PS42 8RB-059 (Toshiba Exceria Pro SDXC 64 GB UHS-II) | |
| maximum AS SSD Seq Read Test (1GB) | |
| Dell XPS 13 9370 i7 UHD (Toshiba Exceria Pro UHS-II) | |
| Lenovo ThinkPad T480s-20L7002AUS (Toshiba Exceria Pro SDXC 64 GB UHS-II) | |
| MSI Prestige PS42 8RB-059 (Toshiba Exceria Pro SDXC 64 GB UHS-II) | |
| Networking | |
| iperf3 transmit AX12 | |
| Huawei Matebook X Pro i5 | |
| Dell XPS 13 9370 i7 UHD | |
| MSI Prestige PS42 8RB-059 | |
| iperf3 receive AX12 | |
| Dell XPS 13 9370 i7 UHD | |
| Huawei Matebook X Pro i5 | |
| MSI Prestige PS42 8RB-059 | |
| |||||||||||||||||||||||||
iluminação: 86 %
iluminação com acumulador: 285.4 cd/m²
Contraste: 921:1 (Preto: 0.31 cd/m²)
ΔE ColorChecker Calman: 1 | ∀{0.5-29.43 Ø4.71}
calibrated: 0.98
ΔE Greyscale Calman: 1.4 | ∀{0.09-98 Ø4.96}
98.91% sRGB (Argyll 1.6.3 3D)
63.82% AdobeRGB 1998 (Argyll 1.6.3 3D)
69.6% AdobeRGB 1998 (Argyll 3D)
98.6% sRGB (Argyll 3D)
67.5% Display P3 (Argyll 3D)
Gamma: 2.25
CCT: 6699 K
| MSI Prestige PS42 8RB-059 CMN N140HCE-EN2, IPS, 14", 1920x1080 | Dell XPS 13 9370 i7 UHD ID: Sharp SHP148B, Name: LQ133D1, Dell P/N: 8XDHY, IPS, 13.3", 3840x2160 | Huawei Matebook X Pro i5 Tianma XM, IPS, 13.9", 3000x2000 | Lenovo ThinkPad T480s-20L7002AUS NV140FHM-N46, TFT-LCD, 14", 1920x1080 | Asus Zenbook UX3430UN-GV174T Chi Mei CMN14D2 / N140HCE-EN1, IPS, 14", 1920x1080 | HP Spectre x360 13t-ae000 LGD0588, IPS, 13.3", 3840x2160 | |
|---|---|---|---|---|---|---|
| Display | 1% | -3% | -41% | -2% | 4% | |
| Display P3 Coverage (%) | 67.5 | 68.9 2% | 65.9 -2% | 39.69 -41% | 65.6 -3% | 71.9 7% |
| sRGB Coverage (%) | 98.6 | 98.4 0% | 95.2 -3% | 59.2 -40% | 97.4 -1% | 98.1 -1% |
| AdobeRGB 1998 Coverage (%) | 69.6 | 69.5 0% | 67.6 -3% | 41 -41% | 67.8 -3% | 73.1 5% |
| Response Times | -90% | -10% | -33% | 6% | -41% | |
| Response Time Grey 50% / Grey 80% * (ms) | 34.4 ? | 69.6 ? -102% | 40.4 ? -17% | 44 ? -28% | 30 ? 13% | 51.6 ? -50% |
| Response Time Black / White * (ms) | 24.8 ? | 44 ? -77% | 25.6 ? -3% | 34 ? -37% | 25 ? -1% | 32.4 ? -31% |
| PWM Frequency (Hz) | 25000 ? | 3759 ? | 990 | |||
| Screen | -29% | -61% | -149% | -77% | -16% | |
| Brightness middle (cd/m²) | 285.4 | 478.5 68% | 442.7 55% | 288.3 1% | 377 32% | 329.8 16% |
| Brightness (cd/m²) | 269 | 466 73% | 428 59% | 281 4% | 339 26% | 318 18% |
| Brightness Distribution (%) | 86 | 86 0% | 84 -2% | 86 0% | 76 -12% | 74 -14% |
| Black Level * (cd/m²) | 0.31 | 0.43 -39% | 0.31 -0% | 0.21 32% | 0.4 -29% | 0.25 19% |
| Contrast (:1) | 921 | 1113 21% | 1428 55% | 1373 49% | 943 2% | 1319 43% |
| Colorchecker dE 2000 * | 1 | 3.09 -209% | 2.24 -124% | 6.16 -516% | 3.33 -233% | 2.37 -137% |
| Colorchecker dE 2000 max. * | 3.65 | 5.94 -63% | 7.19 -97% | 18.99 -420% | 8.02 -120% | 4.08 -12% |
| Colorchecker dE 2000 calibrated * | 0.98 | 2.06 -110% | 1.11 -13% | 4.51 -360% | 3.5 -257% | |
| Greyscale dE 2000 * | 1.4 | 2.4 -71% | 9.7 -593% | 6.3 -350% | 4.89 -249% | 2.8 -100% |
| Gamma | 2.25 98% | 2.063 107% | 1.42 155% | 2.517 87% | 2.37 93% | 2.145 103% |
| CCT | 6699 97% | 6883 94% | 6227 104% | 6886 94% | 7620 85% | 6441 101% |
| Color Space (Percent of AdobeRGB 1998) (%) | 63.82 | 69.47 9% | 61.6 -3% | 37.67 -41% | 62 -3% | 67 5% |
| Color Space (Percent of sRGB) (%) | 98.91 | 98.36 -1% | 95 -4% | 58.9 -40% | 98 -1% | 98 -1% |
| Média Total (Programa/Configurações) | -39% /
-31% | -25% /
-43% | -74% /
-114% | -24% /
-52% | -18% /
-16% |
* ... menor é melhor
Exibir tempos de resposta
| ↔ Tempo de resposta preto para branco | ||
|---|---|---|
| 24.8 ms ... ascensão ↗ e queda ↘ combinadas | ↗ 14.8 ms ascensão | 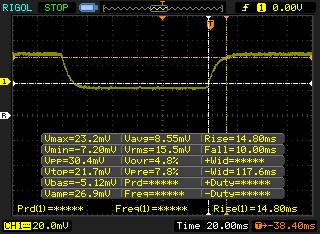 |
| ↘ 10 ms queda | ||
| A tela mostra boas taxas de resposta em nossos testes, mas pode ser muito lenta para jogadores competitivos. Em comparação, todos os dispositivos testados variam de 0.1 (mínimo) a 240 (máximo) ms. » 58 % de todos os dispositivos são melhores. Isso significa que o tempo de resposta medido é pior que a média de todos os dispositivos testados (19.8 ms). | ||
| ↔ Tempo de resposta 50% cinza a 80% cinza | ||
| 34.4 ms ... ascensão ↗ e queda ↘ combinadas | ↗ 18 ms ascensão | 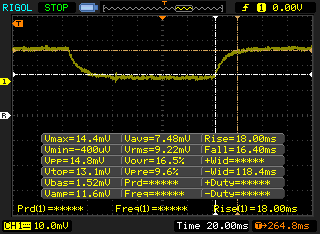 |
| ↘ 16.4 ms queda | ||
| A tela mostra taxas de resposta lentas em nossos testes e será insatisfatória para os jogadores. Em comparação, todos os dispositivos testados variam de 0.165 (mínimo) a 636 (máximo) ms. » 48 % de todos os dispositivos são melhores. Isso significa que o tempo de resposta medido é pior que a média de todos os dispositivos testados (31 ms). | ||
Cintilação da tela / PWM (modulação por largura de pulso)
| Tela tremeluzindo/PWM detectado | 25000 Hz | ≤ 22 % configuração de brilho | 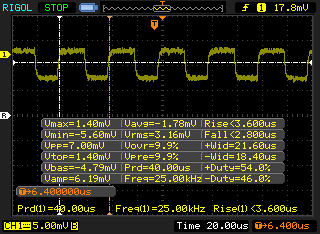 |
A luz de fundo da tela pisca em 25000 Hz (pior caso, por exemplo, utilizando PWM) Cintilação detectada em uma configuração de brilho de 22 % e abaixo. Não deve haver cintilação ou PWM acima desta configuração de brilho. A frequência de 25000 Hz é bastante alta, então a maioria dos usuários sensíveis ao PWM não deve notar nenhuma oscilação. [pwm_comparison] Em comparação: 52 % de todos os dispositivos testados não usam PWM para escurecer a tela. Se PWM foi detectado, uma média de 7757 (mínimo: 5 - máximo: 343500) Hz foi medida. | |||
| PCMark 8 Home Score Accelerated v2 | 3740 pontos | |
| PCMark 8 Work Score Accelerated v2 | 5077 pontos | |
| PCMark 10 Score | 3753 pontos | |
Ajuda | ||
| MSI Prestige PS42 8RB-059 Toshiba KSG60ZMV512G | Dell XPS 13 9370 i7 UHD Toshiba XG5 KXG50ZNV512G | Huawei Matebook X Pro i5 Samsung PM961 MZVLW256HEHP | Lenovo ThinkPad T480s-20L7002AUS Samsung PM961 MZVLW256HEHP | Lenovo ThinkPad 13 20J1005TPB Intel SSD 600p SSDPEKKW256G7 | Média Toshiba KSG60ZMV512G | |
|---|---|---|---|---|---|---|
| AS SSD | 61% | 96% | 141% | 44% | -3% | |
| Copy Game MB/s (MB/s) | 587 | 503 -14% | 486.3 -17% | 546 ? -7% | ||
| Copy Program MB/s (MB/s) | 439.5 | 570 30% | 312.3 -29% | 326 ? -26% | ||
| Copy ISO MB/s (MB/s) | 700 | 585 -16% | 739 6% | 563 ? -20% | ||
| Score Total (Points) | 1110 | 1911 72% | 2575 132% | 3048 175% | 1305 18% | 1089 ? -2% |
| Score Write (Points) | 442 | 596 35% | 620 40% | 921 108% | 655 48% | 412 ? -7% |
| Score Read (Points) | 436 | 926 112% | 1329 205% | 1435 229% | 449 3% | 446 ? 2% |
| Access Time Write * (ms) | 0.076 | 0.055 28% | 0.036 53% | 0.038 50% | 0.033 57% | 0.064 ? 16% |
| Access Time Read * (ms) | 0.154 | 0.059 62% | 0.058 62% | 0.055 64% | 0.081 47% | 0.112 ? 27% |
| 4K-64 Write (MB/s) | 311.3 | 444.8 43% | 399.6 28% | 706 127% | 481.7 55% | 285 ? -8% |
| 4K-64 Read (MB/s) | 363.2 | 678 87% | 1039 186% | 1183 226% | 278.2 -23% | 373 ? 3% |
| 4K Write (MB/s) | 82.2 | 107.4 31% | 103.1 25% | 97.8 19% | 113.9 39% | 87 ? 6% |
| 4K Read (MB/s) | 26.86 | 29.36 9% | 48.33 80% | 42.09 57% | 33.1 23% | 25.3 ? -6% |
| Seq Write (MB/s) | 481 | 435.8 -9% | 1170 143% | 1172 144% | 590 23% | 391 ? -19% |
| Seq Read (MB/s) | 460.4 | 2205 379% | 2416 425% | 2094 355% | 1375 199% | 467 ? 1% |
* ... menor é melhor

| 3DMark | |
| 1920x1080 Fire Strike Graphics | |
| Dell XPS 15 9575 i5-8305G | |
| Dell XPS 15 2018 i5 FHD 97Wh | |
| MSI Prestige PS42 8RB-059 | |
| Média NVIDIA GeForce MX150 (2323 - 3739, n=44) | |
| Huawei Matebook X Pro i5 | |
| Dell Latitude 5591 | |
| Apple MacBook Pro 13 2018 Touchbar i5 | |
| Asus VivoBook S410UQ-NH74 | |
| Lenovo Ideapad 720S-13ARR | |
| 1280x720 Cloud Gate Standard Graphics | |
| Dell XPS 15 9575 i5-8305G | |
| Dell XPS 15 2018 i5 FHD 97Wh | |
| MSI Prestige PS42 8RB-059 | |
| Média NVIDIA GeForce MX150 (16227 - 22183, n=43) | |
| Huawei Matebook X Pro i5 | |
| Dell Latitude 5591 | |
| Apple MacBook Pro 13 2018 Touchbar i5 | |
| Asus VivoBook S410UQ-NH74 | |
| HP EliteBook x360 1030 G3 | |
| Lenovo Ideapad 720S-13ARR | |
| 3DMark 11 Performance | 5021 pontos | |
| 3DMark Cloud Gate Standard Score | 13394 pontos | |
| 3DMark Fire Strike Score | 3312 pontos | |
Ajuda | ||
| BioShock Infinite - 1920x1080 Ultra Preset, DX11 (DDOF) | |
| Dell G3 15 3579 | |
| Dell XPS 15 9575 i5-8305G | |
| MSI Prestige PS42 8RB-059 | |
| Média NVIDIA GeForce MX150 (27.8 - 35.2, n=33) | |
| Huawei Matebook X Pro i5 | |
| Asus VivoBook S410UQ-NH74 | |
| HP EliteBook 755 G5 3UN79EA | |
| HP EliteBook x360 1030 G3 | |
| Rise of the Tomb Raider - 1920x1080 Very High Preset AA:FX AF:16x | |
| Dell G3 15 3579 | |
| Dell XPS 15 9575 i5-8305G | |
| MSI Prestige PS42 8RB-059 | |
| Média NVIDIA GeForce MX150 (14.8 - 26, n=23) | |
| Asus VivoBook S410UQ-NH74 | |
| The Witcher 3 - 1920x1080 Ultra Graphics & Postprocessing (HBAO+) | |
| Dell XPS 15 9575 i5-8305G | |
| Dell G3 15 3579 | |
| MSI Prestige PS42 8RB-059 | |
| Média NVIDIA GeForce MX150 (6.5 - 17, n=25) | |
| Apple MacBook Pro 13 2018 Touchbar i5 | |
| baixo | média | alto | ultra | |
|---|---|---|---|---|
| BioShock Infinite (2013) | 187.2 | 113.1 | 95.6 | 34.8 |
| The Witcher 3 (2015) | 66.8 | 39.6 | 22.1 | 11.8 |
| Rise of the Tomb Raider (2016) | 77.1 | 42.5 | 22.1 | 18.8 |
Barulho
| Ocioso |
| 28.7 / 28.7 / 28.7 dB |
| Carga |
| 33.4 / 45 dB |
 | ||
30 dB silencioso 40 dB(A) audível 50 dB(A) ruidosamente alto |
||
min: | ||
| MSI Prestige PS42 8RB-059 GeForce MX150, i5-8550U, Toshiba KSG60ZMV512G | Dell XPS 13 9370 i7 UHD UHD Graphics 620, i5-8550U, Toshiba XG5 KXG50ZNV512G | Huawei Matebook X Pro i5 GeForce MX150, i5-8250U, Samsung PM961 MZVLW256HEHP | Lenovo ThinkPad T480s-20L7002AUS UHD Graphics 620, i5-8250U, Samsung PM961 MZVLW256HEHP | HP EliteBook x360 1030 G3 UHD Graphics 620, i5-8250U, Samsung PM871b MZNLN128HAHQ | Asus Zenbook UX3430UN-GV174T GeForce MX150, i5-8250U, SK Hynix HFS256G39TND-N210A | |
|---|---|---|---|---|---|---|
| Noise | 3% | -2% | 2% | 6% | -5% | |
| desligado / ambiente * (dB) | 28.3 | 28 1% | 27.9 1% | 28.1 1% | 28.5 -1% | 30 -6% |
| Idle Minimum * (dB) | 28.7 | 28 2% | 27.9 3% | 28.1 2% | 28.5 1% | 30 -5% |
| Idle Average * (dB) | 28.7 | 28 2% | 27.9 3% | 28.1 2% | 28.5 1% | 30 -5% |
| Idle Maximum * (dB) | 28.7 | 28 2% | 27.9 3% | 28.1 2% | 28.5 1% | 33.1 -15% |
| Load Average * (dB) | 33.4 | 32.5 3% | 36.2 -8% | 35.5 -6% | 31.3 6% | 37.6 -13% |
| Witcher 3 ultra * (dB) | 38.2 | 45 -18% | ||||
| Load Maximum * (dB) | 45 | 42.2 6% | 45.2 -0% | 41.5 8% | 33.5 26% | 37.6 16% |
* ... menor é melhor
(-) A temperatura máxima no lado superior é 47 °C / 117 F, em comparação com a média de 34.3 °C / 94 F , variando de 21.2 a 62.5 °C para a classe Office.
(-) A parte inferior aquece até um máximo de 63.4 °C / 146 F, em comparação com a média de 36.8 °C / 98 F
(+) Em uso inativo, a temperatura média para o lado superior é 22.5 °C / 73 F, em comparação com a média do dispositivo de 29.5 °C / ### class_avg_f### F.
(±) Jogando The Witcher 3, a temperatura média para o lado superior é 33.5 °C / 92 F, em comparação com a média do dispositivo de 29.5 °C / ## #class_avg_f### F.
(+) Os apoios para as mãos e o touchpad são mais frios que a temperatura da pele, com um máximo de 29 °C / 84.2 F e, portanto, são frios ao toque.
(±) A temperatura média da área do apoio para as mãos de dispositivos semelhantes foi 27.5 °C / 81.5 F (-1.5 °C / -2.7 F).
MSI Prestige PS42 8RB-059 análise de áudio
(-) | alto-falantes não muito altos (###valor### dB)
Graves 100 - 315Hz
(-) | quase nenhum baixo - em média 23.5% menor que a mediana
(±) | a linearidade dos graves é média (13.1% delta para a frequência anterior)
Médios 400 - 2.000 Hz
(+) | médios equilibrados - apenas 3.9% longe da mediana
(±) | a linearidade dos médios é média (8.1% delta para frequência anterior)
Altos 2 - 16 kHz
(+) | agudos equilibrados - apenas 4.9% longe da mediana
(±) | a linearidade dos máximos é média (7.1% delta para frequência anterior)
Geral 100 - 16.000 Hz
(±) | a linearidade do som geral é média (27.4% diferença em relação à mediana)
Comparado com a mesma classe
» 86% de todos os dispositivos testados nesta classe foram melhores, 5% semelhantes, 10% piores
» O melhor teve um delta de 7%, a média foi 21%, o pior foi 53%
Comparado com todos os dispositivos testados
» 84% de todos os dispositivos testados foram melhores, 4% semelhantes, 13% piores
» O melhor teve um delta de 4%, a média foi 23%, o pior foi 134%
Apple MacBook 12 (Early 2016) 1.1 GHz análise de áudio
(+) | os alto-falantes podem tocar relativamente alto (###valor### dB)
Graves 100 - 315Hz
(±) | graves reduzidos - em média 11.3% menor que a mediana
(±) | a linearidade dos graves é média (14.2% delta para a frequência anterior)
Médios 400 - 2.000 Hz
(+) | médios equilibrados - apenas 2.4% longe da mediana
(+) | médios são lineares (5.5% delta para frequência anterior)
Altos 2 - 16 kHz
(+) | agudos equilibrados - apenas 2% longe da mediana
(+) | os máximos são lineares (4.5% delta da frequência anterior)
Geral 100 - 16.000 Hz
(+) | o som geral é linear (10.2% diferença em relação à mediana)
Comparado com a mesma classe
» 7% de todos os dispositivos testados nesta classe foram melhores, 2% semelhantes, 90% piores
» O melhor teve um delta de 5%, a média foi 18%, o pior foi 53%
Comparado com todos os dispositivos testados
» 5% de todos os dispositivos testados foram melhores, 1% semelhantes, 94% piores
» O melhor teve um delta de 4%, a média foi 23%, o pior foi 134%
| desligado | |
| Ocioso | |
| Carga |
|
Key:
min: | |
| MSI Prestige PS42 8RB-059 i5-8550U, GeForce MX150, Toshiba KSG60ZMV512G, IPS, 1920x1080, 14" | Dell XPS 13 9370 i7 UHD i5-8550U, UHD Graphics 620, Toshiba XG5 KXG50ZNV512G, IPS, 3840x2160, 13.3" | Huawei Matebook X Pro i5 i5-8250U, GeForce MX150, Samsung PM961 MZVLW256HEHP, IPS, 3000x2000, 13.9" | Asus Zenbook UX3430UN-GV174T i5-8250U, GeForce MX150, SK Hynix HFS256G39TND-N210A, IPS, 1920x1080, 14" | HP EliteBook x360 1030 G3 i5-8250U, UHD Graphics 620, Samsung PM871b MZNLN128HAHQ, IPS, 1920x1080, 13.3" | Lenovo ThinkPad T480s-20L7002AUS i5-8250U, UHD Graphics 620, Samsung PM961 MZVLW256HEHP, TFT-LCD, 1920x1080, 14" | |
|---|---|---|---|---|---|---|
| Power Consumption | 5% | 1% | 5% | 22% | 27% | |
| Idle Minimum * (Watt) | 5.6 | 5 11% | 3.5 37% | 4.5 20% | 3.8 32% | 3.1 45% |
| Idle Average * (Watt) | 6.5 | 8.3 -28% | 8.9 -37% | 7.8 -20% | 7.5 -15% | 6.4 2% |
| Idle Maximum * (Watt) | 7.9 | 8.8 -11% | 12.3 -56% | 8.1 -3% | 8.6 -9% | 9.4 -19% |
| Load Average * (Watt) | 62.3 | 46.4 26% | 54.2 13% | 52 17% | 33.1 47% | 29.8 52% |
| Witcher 3 ultra * (Watt) | 55.7 | 42.4 24% | ||||
| Load Maximum * (Watt) | 67 | 48.6 27% | 52.1 22% | 59 12% | 31.8 53% | 31.2 53% |
* ... menor é melhor
| MSI Prestige PS42 8RB-059 i5-8550U, GeForce MX150, 50 Wh | Apple MacBook Pro 15 2018 (2.6 GHz, 560X) i7-8850H, Radeon Pro 560X, 83 Wh | Dell XPS 13 9370 i7 UHD i5-8550U, UHD Graphics 620, 52 Wh | Huawei Matebook X Pro i5 i5-8250U, GeForce MX150, 57.4 Wh | Lenovo ThinkPad T480s-20L7002AUS i5-8250U, UHD Graphics 620, 57 Wh | Asus Zenbook UX3430UN-GV174T i5-8250U, GeForce MX150, 48 Wh | HP EliteBook x360 1030 G3 i5-8250U, UHD Graphics 620, 56.2 Wh | |
|---|---|---|---|---|---|---|---|
| Duração da bateria | -32% | -25% | -2% | -40% | -7% | 21% | |
| Reader / Idle (h) | 16.8 | 13.7 -18% | 20.7 23% | 22.8 36% | 23 37% | ||
| WiFi v1.3 (h) | 14.9 | 10.2 -32% | 7.8 -48% | 9.3 -38% | 9 -40% | 8.1 -46% | 10 -33% |
| Load (h) | 2 | 1.8 -10% | 2.2 10% | 1.8 -10% | 3.2 60% | ||
| Witcher 3 ultra (h) | 1.5 |
Pro
Contra

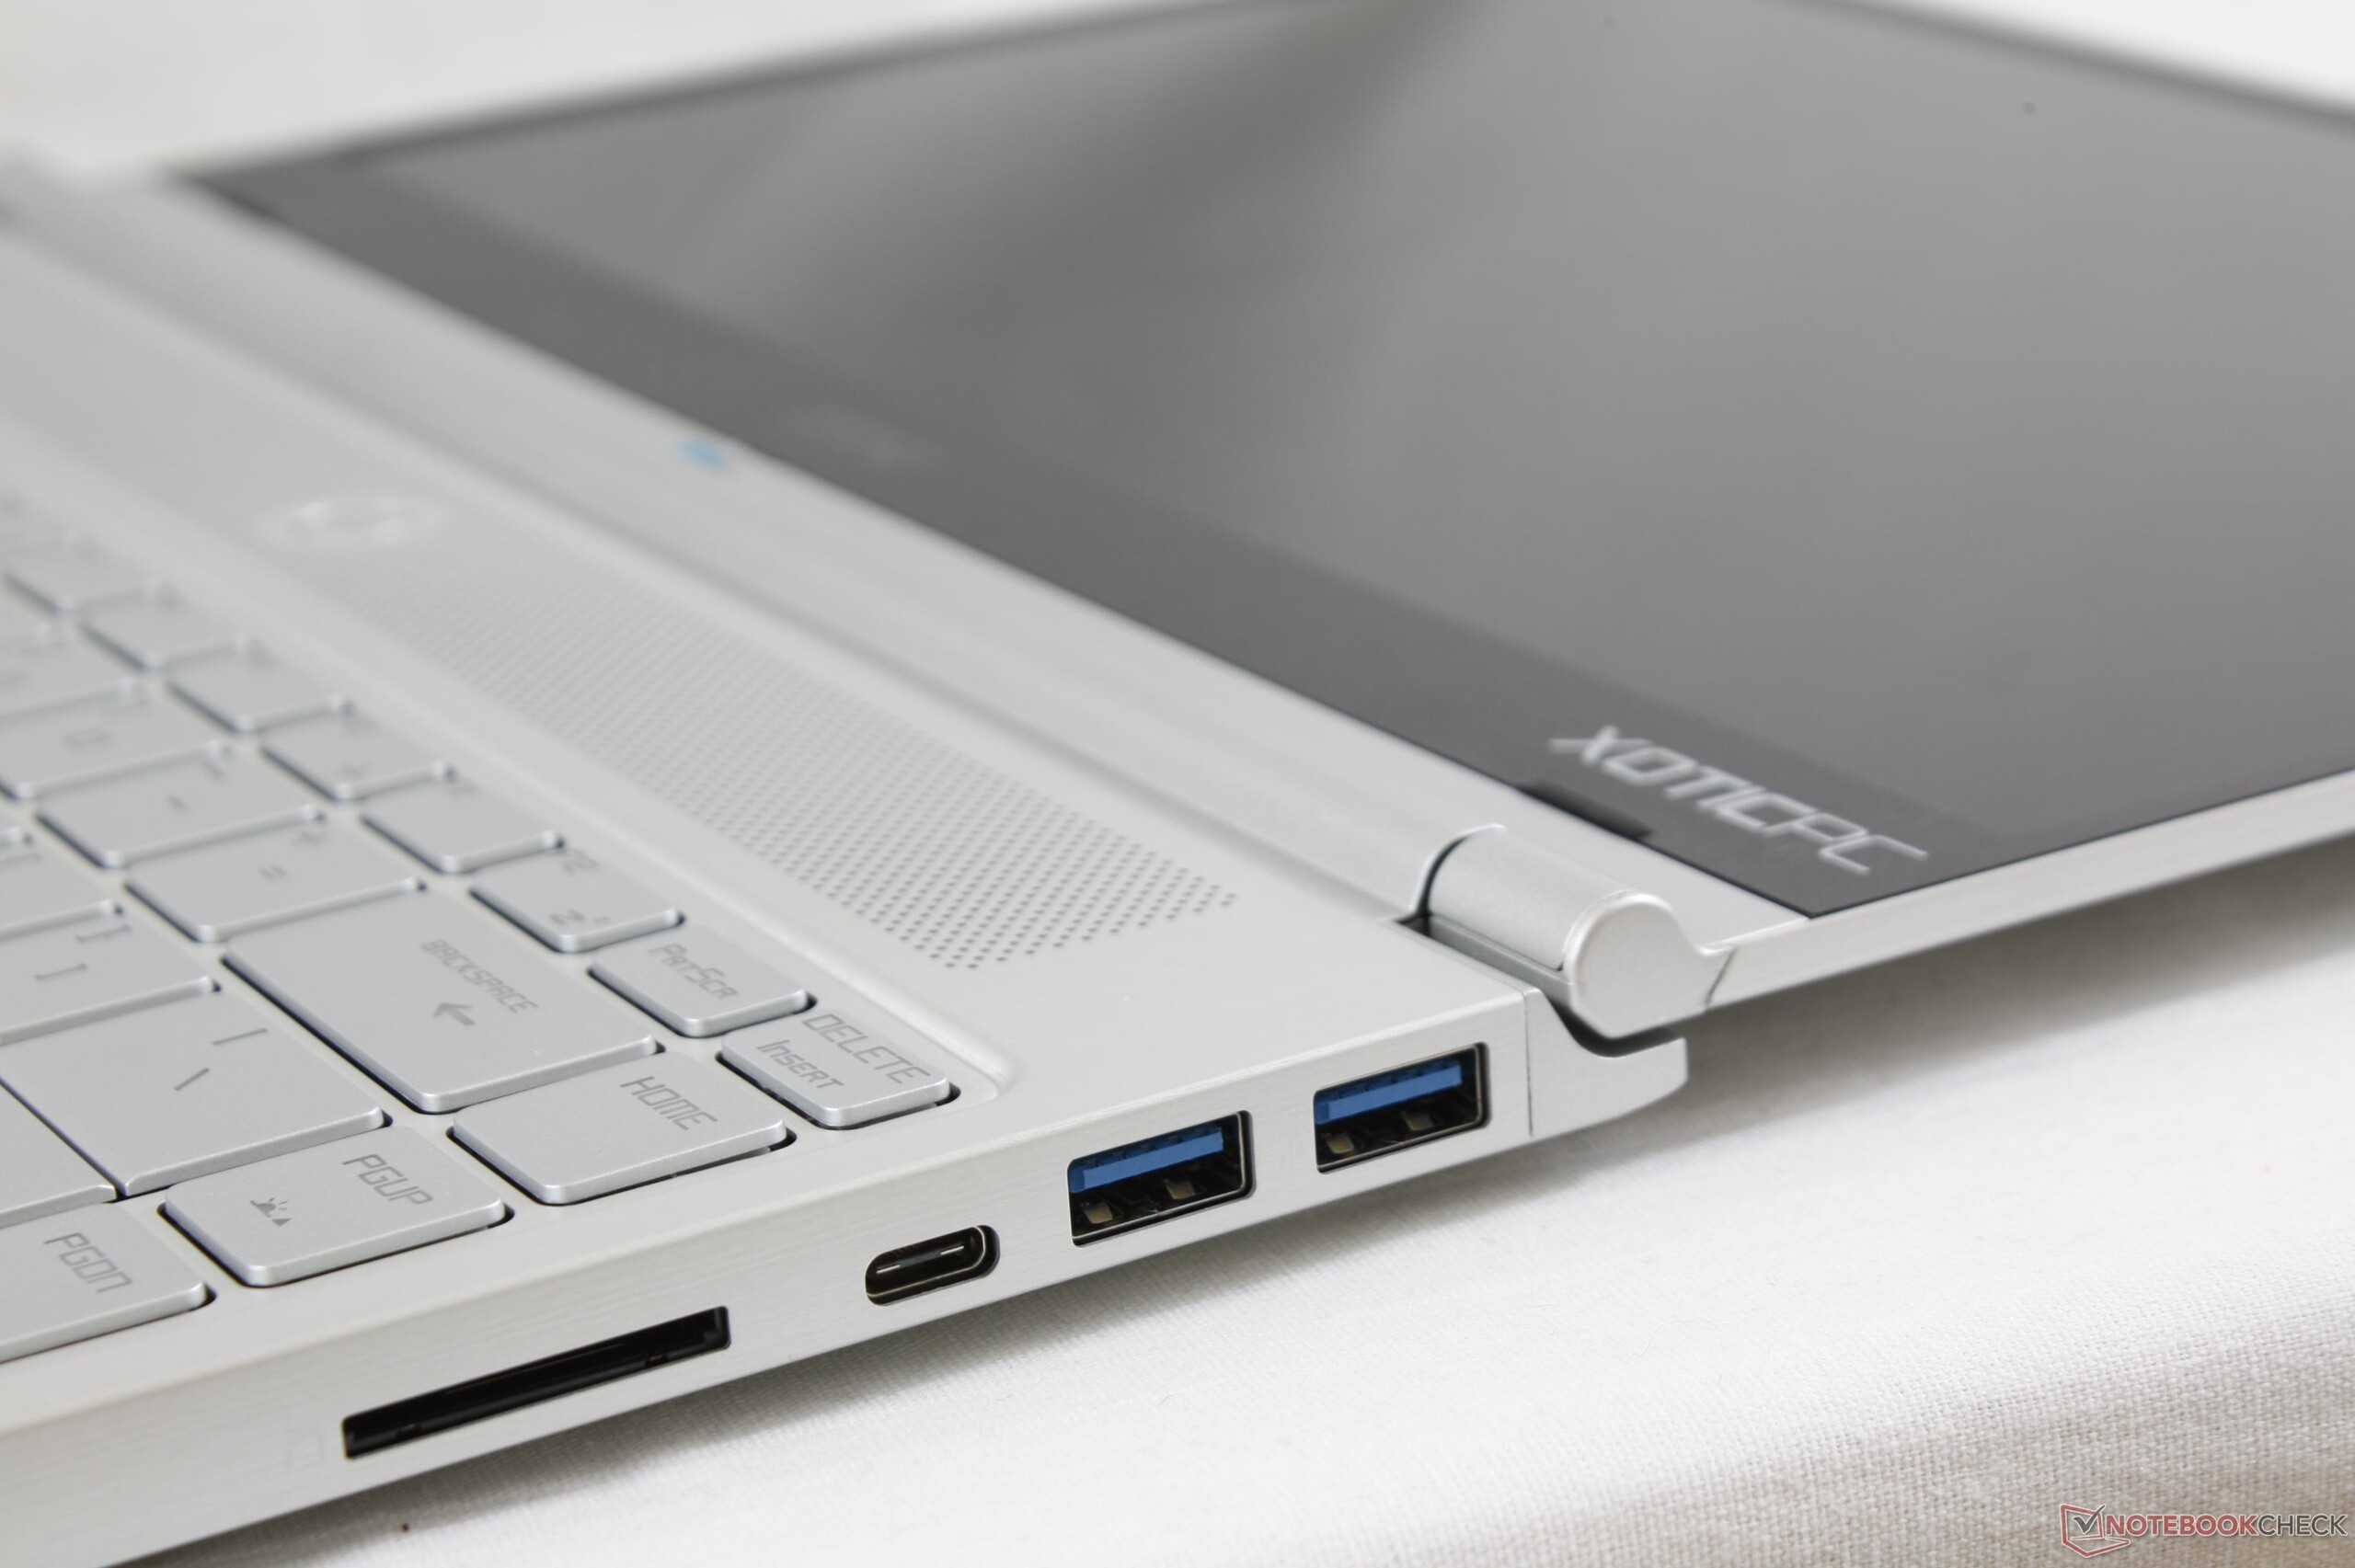
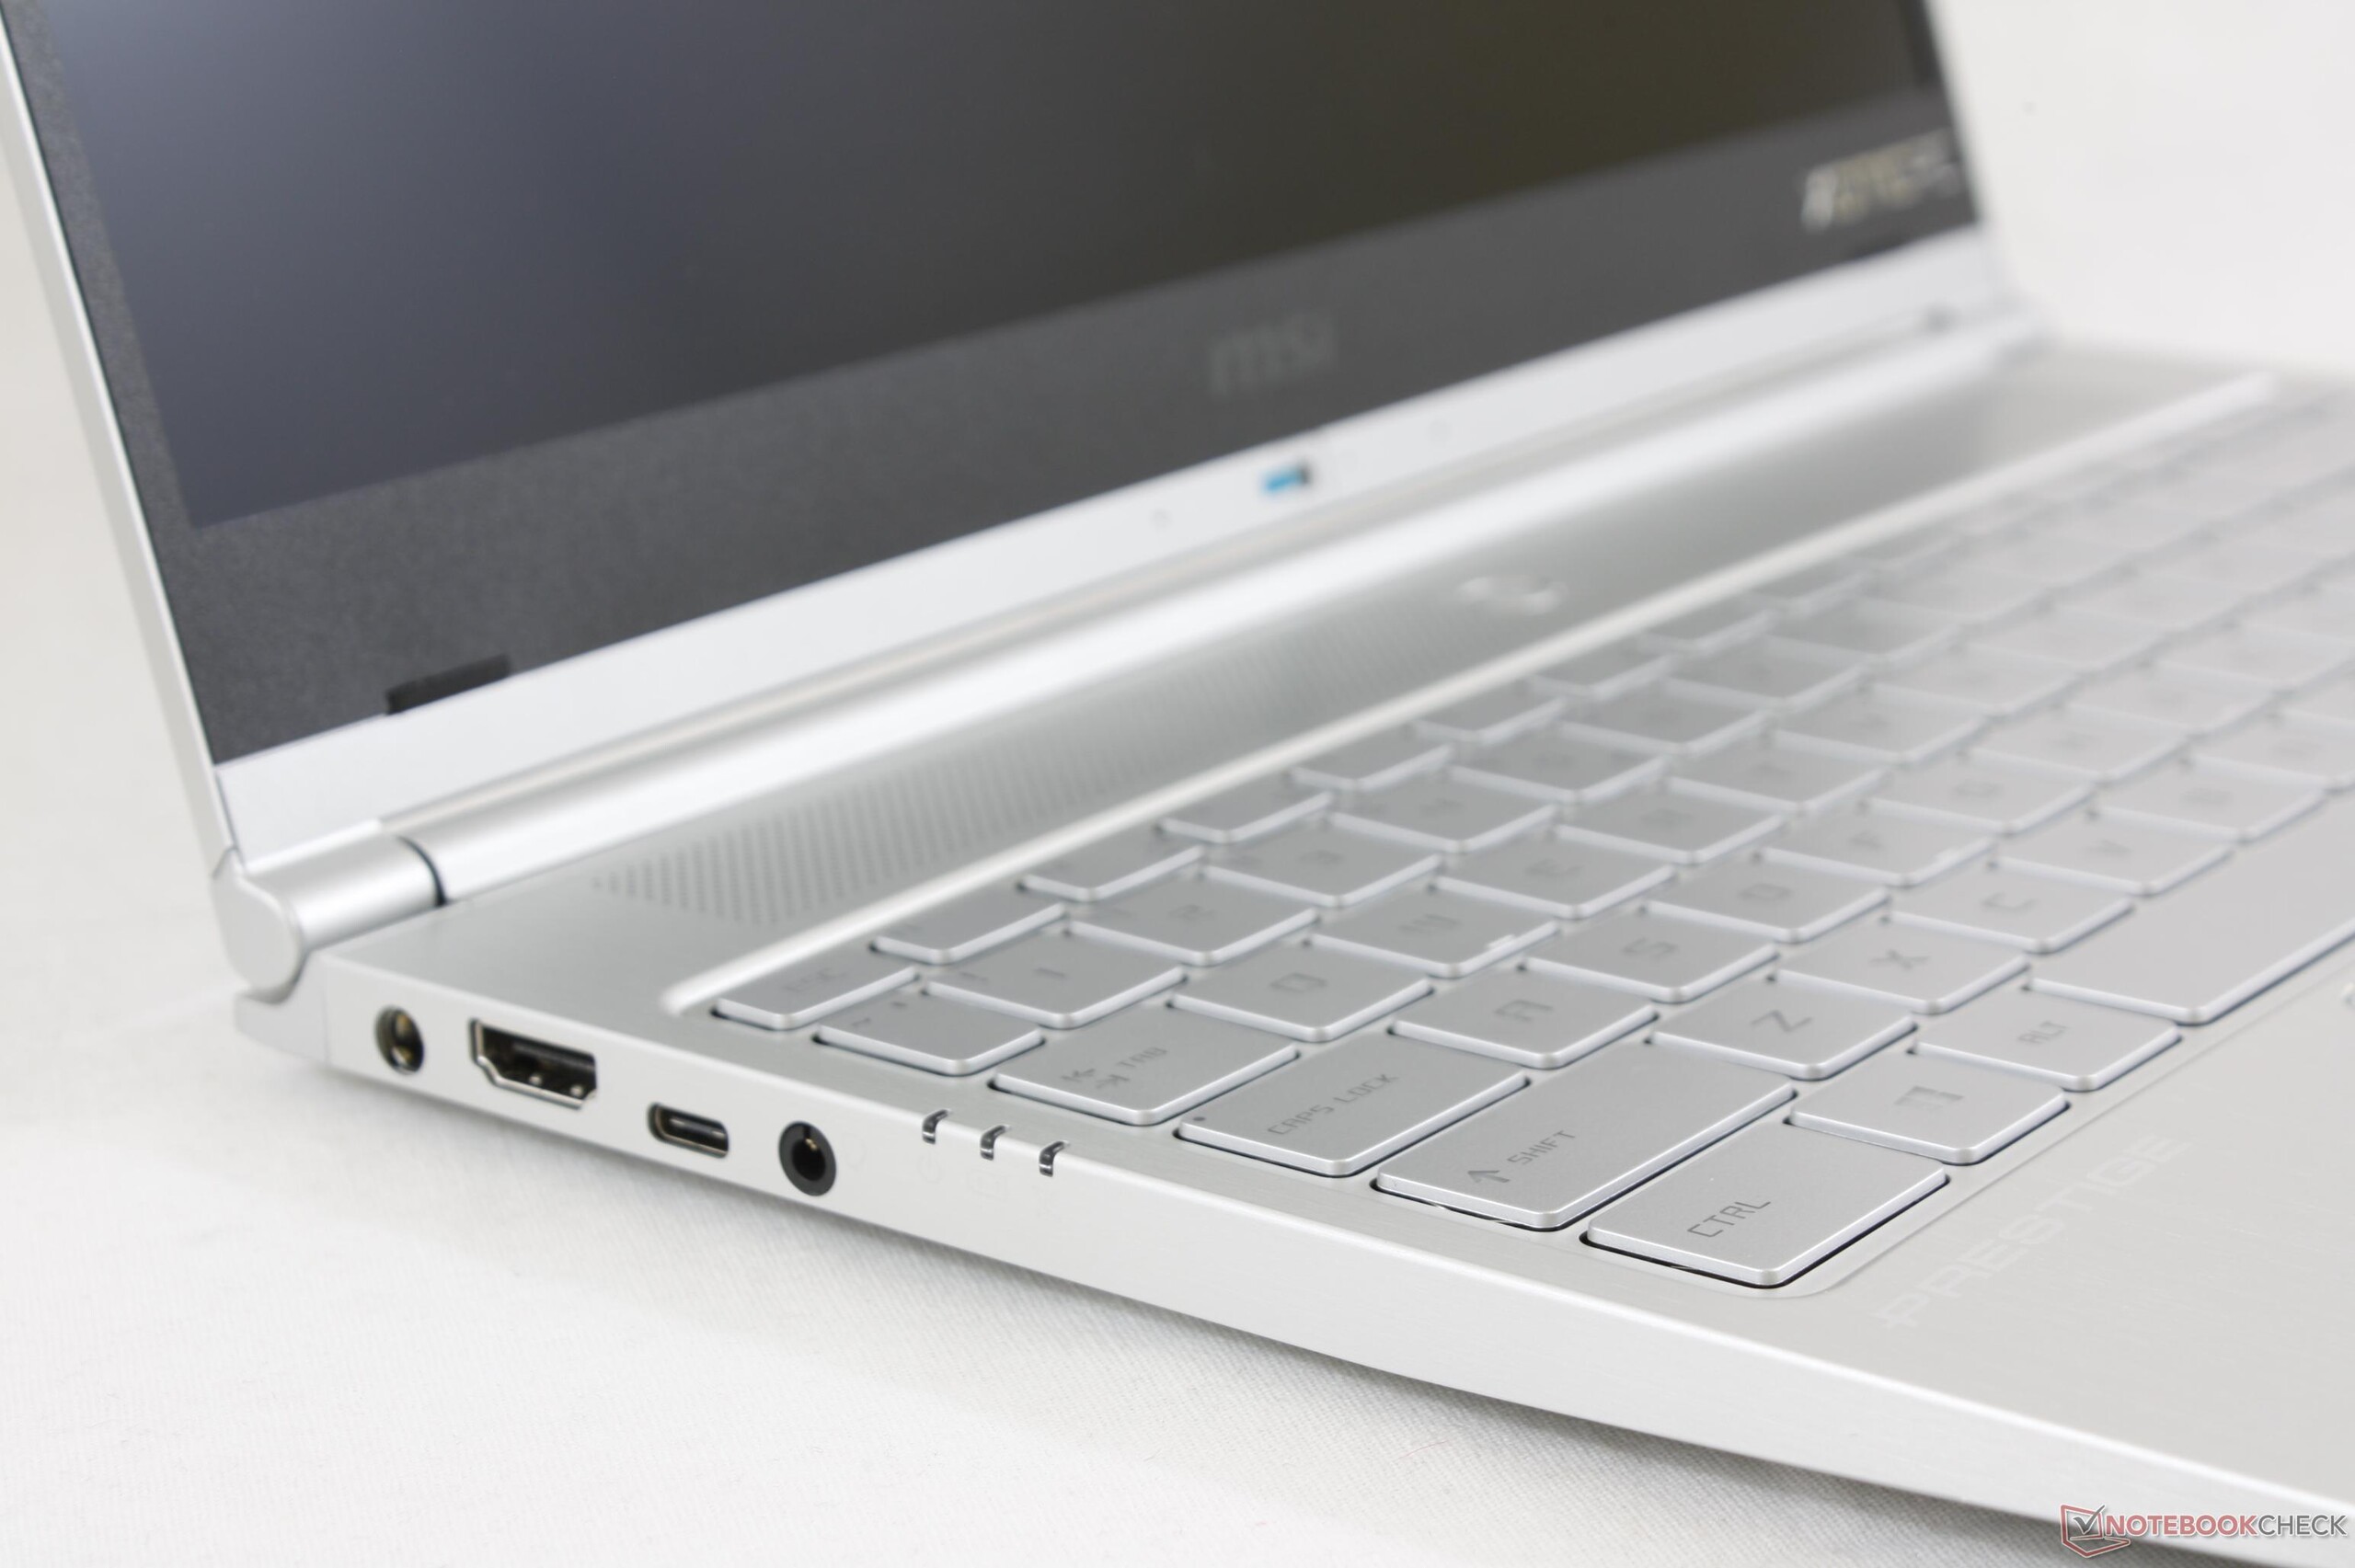
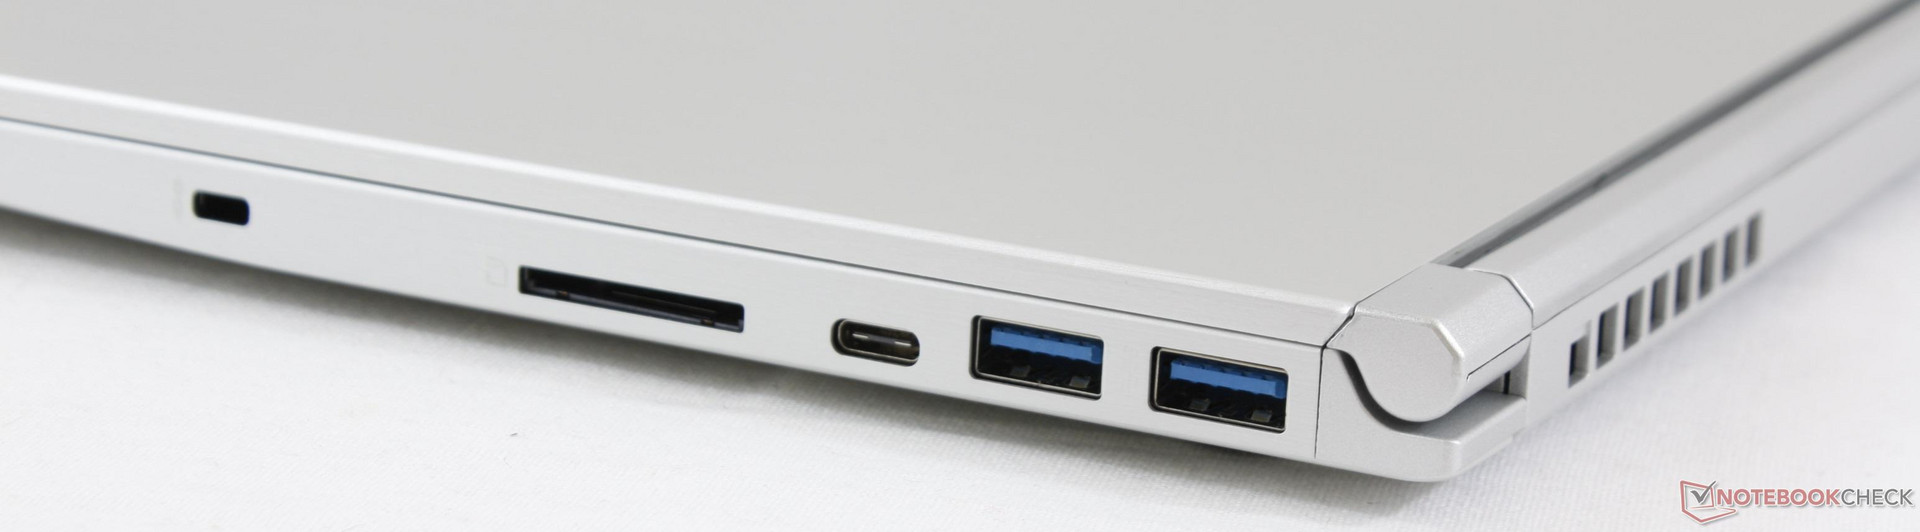
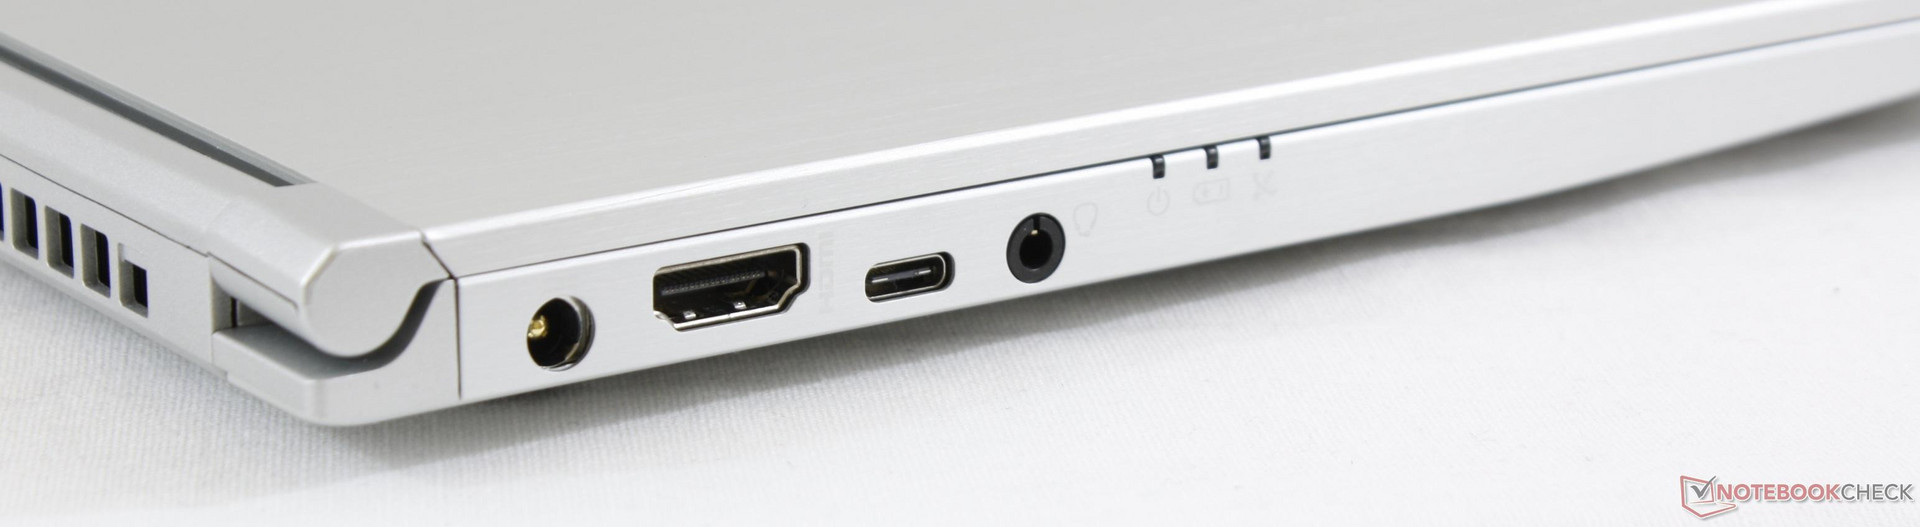
O MSI PS42 tem muito a seu favor, mas o punhado de recortes é difícil de ignorar. Por um lado, a falta de Thunderbolt 3 limita a conectividade e versatilidade. Isso não teria sido um problema se o PS42 fosse mais barato, mas é vendido pelo mesmo preço que o XPS 13, HP Spectre 13, ou MateBook X Pro, que todos têm Thunderbolt 3 como padrão. A tela mais escura, o WiFi 1x1 mais lento, a RAM de um canal, a CPU com desempenho fraco, a omissão de NVMe e o chassi menos rígido, são decepcionantes quando a maioria dos concorrentes oferece melhores opções.
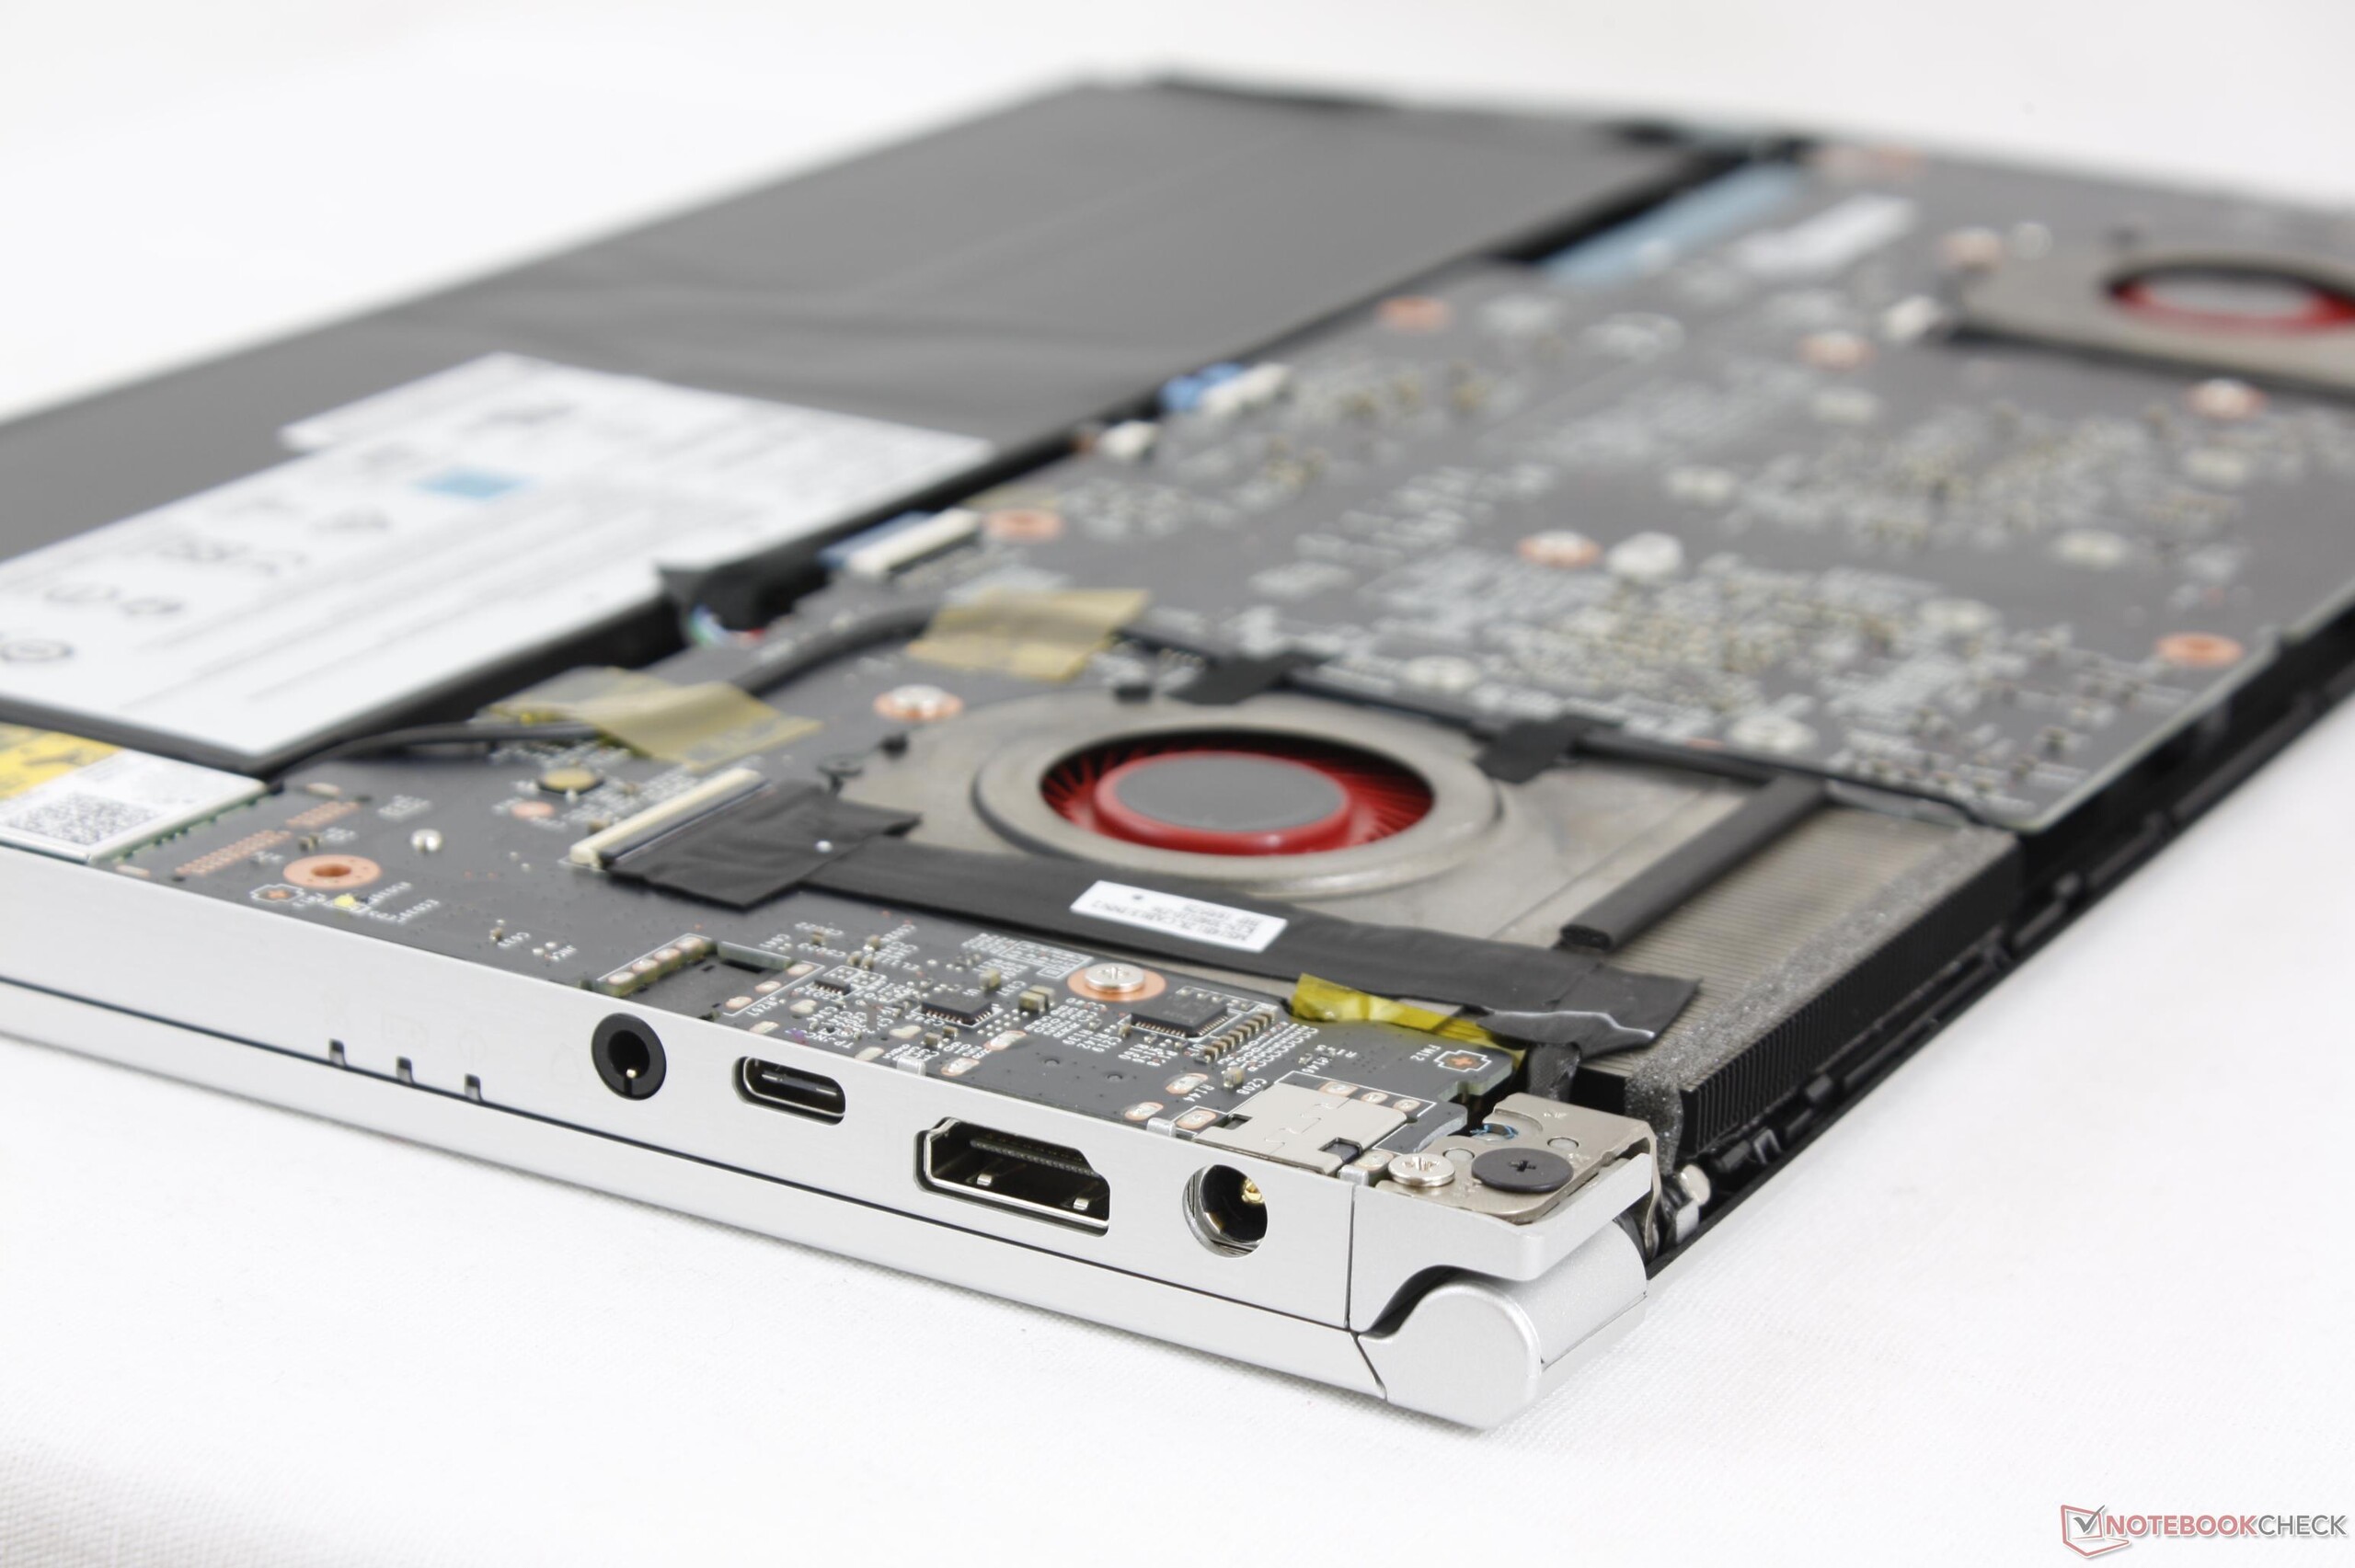
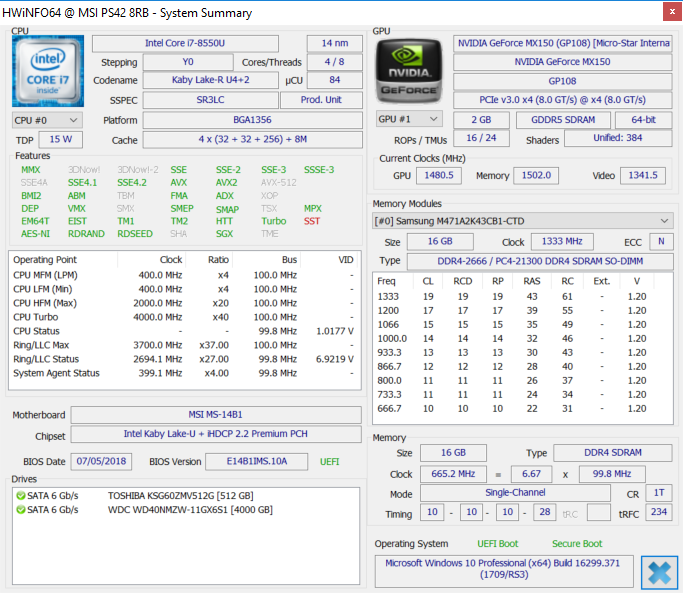
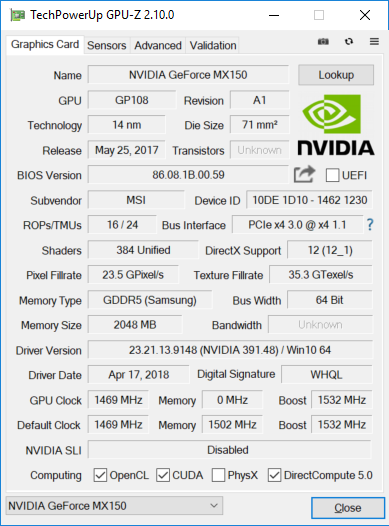
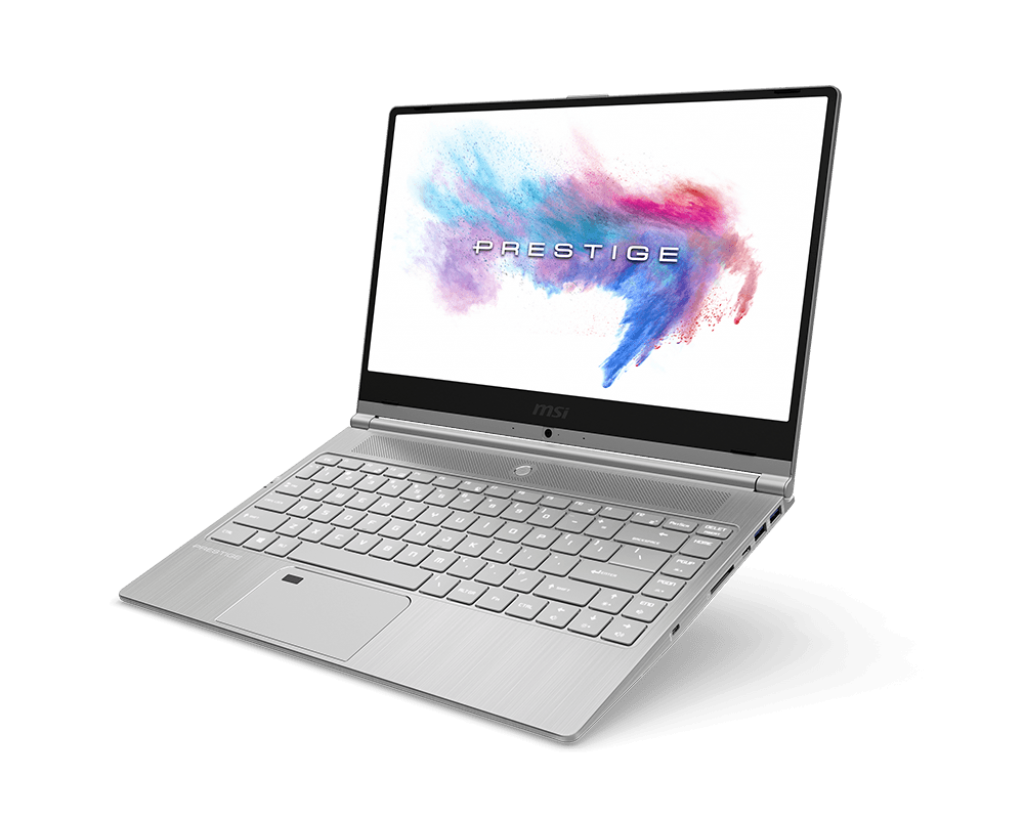
As qualidades redentoras do PS42 são sua leveza, tela mate muito precisa de 1080p e GPU GeForce MX150 com potência plena. Este é provavelmente o único portátil de 14 polegadas que usa uma GPU MX150 de 25 W '1D10' em vez da versão mais lenta de 10 W. Os usuários podem jogar ou executar tarefas com uso intensivo de gráficos sem temer o afogamento da GPU.
Se o desempenho e a portabilidade da GPU são indispensáveis, o PS42 pode ser uma boa opção. Caso contrário, o MateBook X Pro de 13,9 polegadas é superior em quase todos os outros aspectos, essencialmente pelo mesmo preço demandado de $1.000.
O PS42 é uma primeira tentativa respeitável de um Ultrabook tradicional da MSI com seu potente desempenho gráfico, peso leve, e cores precisas. No entanto, o seu punhado de recortes significa que a MSI tem um longo caminho a percorrer antes de poder ficar cara-a-cara com os veteranos fabricantes de Ultrabooks.
MSI Prestige PS42 8RB-059
- 10/26/2019 v7 (old)
Allen Ngo
Price comparison
