Breve Análise do Portátil Huawei MateBook 14 (i7-8565U, GeForce MX250)
| Networking | |
| iperf3 transmit AX12 | |
| Huawei MateBook 14 KLV-W29 | |
| Asus ZenBook S13 UX392FN | |
| Huawei Matebook X Pro i5 | |
| LG Gram 14Z980-U.AAW5U1 | |
| iperf3 receive AX12 | |
| Asus ZenBook S13 UX392FN | |
| Huawei MateBook 14 KLV-W29 | |
| Huawei Matebook X Pro i5 | |
| LG Gram 14Z980-U.AAW5U1 | |
| |||||||||||||||||||||||||
iluminação: 95 %
iluminação com acumulador: 401.7 cd/m²
Contraste: 956:1 (Preto: 0.42 cd/m²)
ΔE ColorChecker Calman: 4.11 | ∀{0.5-29.43 Ø4.72}
calibrated: 1.36
ΔE Greyscale Calman: 6.1 | ∀{0.09-98 Ø4.97}
98.6% sRGB (Argyll 1.6.3 3D)
62.7% AdobeRGB 1998 (Argyll 1.6.3 3D)
68.1% AdobeRGB 1998 (Argyll 3D)
97.8% sRGB (Argyll 3D)
66.6% Display P3 (Argyll 3D)
Gamma: 2.19
CCT: 7222 K
| Huawei MateBook 14 KLV-W29 Chi Mei CMN8C02, IPS, 14", 2160x1440 | Huawei Matebook X Pro i5 Tianma XM, IPS, 13.9", 3000x2000 | LG Gram 14Z980-U.AAW5U1 LG Philips LP140WF7-SPG1, IPS, 14", 1920x1080 | Asus ZenBook S13 UX392FN Tianma XM, IPS, 13.9", 1920x1080 | Dell XPS 13 9380 2019 ID: AUO 282B B133ZAN Dell: 90NTH, IPS, 13.3", 3840x2160 | Lenovo Yoga C930-13IKB B139HAN03_0, IPS, 13.9", 1920x1080 | |
|---|---|---|---|---|---|---|
| Display | -2% | -3% | 0% | -4% | -3% | |
| Display P3 Coverage (%) | 66.6 | 65.9 -1% | 64.7 -3% | 67.5 1% | 64.7 -3% | 64.3 -3% |
| sRGB Coverage (%) | 97.8 | 95.2 -3% | 94.3 -4% | 95.8 -2% | 93.1 -5% | 94.6 -3% |
| AdobeRGB 1998 Coverage (%) | 68.1 | 67.6 -1% | 66 -3% | 69 1% | 65.3 -4% | 66.2 -3% |
| Response Times | 0% | -4% | -8% | -43% | -4% | |
| Response Time Grey 50% / Grey 80% * (ms) | 38 ? | 40.4 ? -6% | 36.8 ? 3% | 47.2 ? -24% | 58 ? -53% | 40.8 ? -7% |
| Response Time Black / White * (ms) | 27.2 ? | 25.6 ? 6% | 30 ? -10% | 24.8 ? 9% | 36 ? -32% | 27.6 ? -1% |
| PWM Frequency (Hz) | ||||||
| Screen | 9% | -6% | 21% | 1% | -17% | |
| Brightness middle (cd/m²) | 401.7 | 442.7 10% | 333.8 -17% | 466 16% | 404 1% | 316 -21% |
| Brightness (cd/m²) | 386 | 428 11% | 307 -20% | 462 20% | 389 1% | 291 -25% |
| Brightness Distribution (%) | 95 | 84 -12% | 83 -13% | 90 -5% | 85 -11% | 83 -13% |
| Black Level * (cd/m²) | 0.42 | 0.31 26% | 0.4 5% | 0.33 21% | 0.37 12% | 0.36 14% |
| Contrast (:1) | 956 | 1428 49% | 835 -13% | 1412 48% | 1092 14% | 878 -8% |
| Colorchecker dE 2000 * | 4.11 | 2.24 45% | 3.54 14% | 1.93 53% | 3.72 9% | 5.9 -44% |
| Colorchecker dE 2000 max. * | 8.93 | 7.19 19% | 5.8 35% | 4.26 52% | 7.38 17% | 12.9 -44% |
| Colorchecker dE 2000 calibrated * | 1.36 | 1.11 18% | 2.36 -74% | 1.99 -46% | 2.06 -51% | 1.3 4% |
| Greyscale dE 2000 * | 6.1 | 9.7 -59% | 4.7 23% | 1.7 72% | 4.44 27% | 8.6 -41% |
| Gamma | 2.19 100% | 1.42 155% | 2.14 103% | 2.15 102% | 2.34 94% | 2.1 105% |
| CCT | 7222 90% | 6227 104% | 6261 104% | 6382 102% | 7095 92% | 6854 95% |
| Color Space (Percent of AdobeRGB 1998) (%) | 62.7 | 61.6 -2% | 61.2 -2% | 62.2 -1% | 60 -4% | 60.7 -3% |
| Color Space (Percent of sRGB) (%) | 98.6 | 95 -4% | 94.7 -4% | 95.7 -3% | 93 -6% | 94.5 -4% |
| Média Total (Programa/Configurações) | 2% /
6% | -4% /
-5% | 4% /
13% | -15% /
-6% | -8% /
-13% |
* ... menor é melhor
Exibir tempos de resposta
| ↔ Tempo de resposta preto para branco | ||
|---|---|---|
| 27.2 ms ... ascensão ↗ e queda ↘ combinadas | ↗ 17.2 ms ascensão | 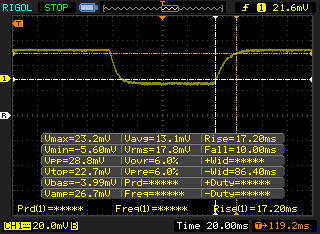 |
| ↘ 10 ms queda | ||
| A tela mostra taxas de resposta relativamente lentas em nossos testes e pode ser muito lenta para os jogadores. Em comparação, todos os dispositivos testados variam de 0.1 (mínimo) a 240 (máximo) ms. » 69 % de todos os dispositivos são melhores. Isso significa que o tempo de resposta medido é pior que a média de todos os dispositivos testados (19.9 ms). | ||
| ↔ Tempo de resposta 50% cinza a 80% cinza | ||
| 38 ms ... ascensão ↗ e queda ↘ combinadas | ↗ 19.6 ms ascensão | 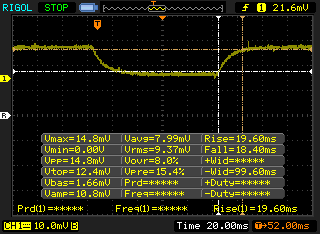 |
| ↘ 18.4 ms queda | ||
| A tela mostra taxas de resposta lentas em nossos testes e será insatisfatória para os jogadores. Em comparação, todos os dispositivos testados variam de 0.165 (mínimo) a 636 (máximo) ms. » 55 % de todos os dispositivos são melhores. Isso significa que o tempo de resposta medido é pior que a média de todos os dispositivos testados (31.1 ms). | ||
Cintilação da tela / PWM (modulação por largura de pulso)
| Tela tremeluzindo / PWM não detectado |  | ||
[pwm_comparison] Em comparação: 52 % de todos os dispositivos testados não usam PWM para escurecer a tela. Se PWM foi detectado, uma média de 7784 (mínimo: 5 - máximo: 343500) Hz foi medida. | |||
| PCMark 8 Home Score Accelerated v2 | 3612 pontos | |
| PCMark 8 Work Score Accelerated v2 | 4796 pontos | |
| PCMark 10 Score | 4205 pontos | |
Ajuda | ||
| Huawei MateBook 14 KLV-W29 Samsung SSD PM981 MZVLB512HAJQ | Huawei Matebook X Pro i5 Samsung PM961 MZVLW256HEHP | LG Gram 14Z980-U.AAW5U1 SK Hynix SC313 HFS256G39TNF | Dell XPS 13 9380 2019 SK hynix PC401 HFS256GD9TNG | Asus ZenBook S13 UX392FN WDC PC SN520 SDAPNUW-512G | Lenovo Yoga C930-13IKB SK hynix PC401 HFS256GD9TNG | |
|---|---|---|---|---|---|---|
| AS SSD | -25% | -70% | -45% | -15% | -55% | |
| Seq Read (MB/s) | 1225 | 2416 97% | 476.1 -61% | 2035 66% | 1224 0% | 1850 51% |
| Seq Write (MB/s) | 1386 | 1170 -16% | 487.4 -65% | 658 -53% | 907 -35% | 661 -52% |
| 4K Read (MB/s) | 56.4 | 48.33 -14% | 30.57 -46% | 39.74 -30% | 41.46 -26% | 38.04 -33% |
| 4K Write (MB/s) | 137.6 | 103.1 -25% | 66.1 -52% | 105.7 -23% | 126.2 -8% | 95 -31% |
| 4K-64 Read (MB/s) | 1190 | 1039 -13% | 352.9 -70% | 461 -61% | 1021 -14% | 434.3 -64% |
| 4K-64 Write (MB/s) | 1377 | 399.6 -71% | 263.1 -81% | 300.1 -78% | 1251 -9% | 266.3 -81% |
| Access Time Read * (ms) | 0.046 | 0.058 -26% | 0.092 -100% | 0.061 -33% | 0.053 -15% | 0.069 -50% |
| Access Time Write * (ms) | 0.026 | 0.036 -38% | 0.055 -112% | 0.051 -96% | 0.027 -4% | 0.056 -115% |
| Score Read (Points) | 1369 | 1329 -3% | 431 -69% | 704 -49% | 1185 -13% | 657 -52% |
| Score Write (Points) | 1653 | 620 -62% | 378 -77% | 471 -72% | 1468 -11% | 427 -74% |
| Score Total (Points) | 3743 | 2575 -31% | 1040 -72% | 1479 -60% | 3250 -13% | 1373 -63% |
| Copy ISO MB/s (MB/s) | 1837 | 739 -60% | 514 -72% | 893 -51% | 1404 -24% | 539 -71% |
| Copy Program MB/s (MB/s) | 473.6 | 312.3 -34% | 259.3 -45% | 287.9 -39% | 402.4 -15% | 209.7 -56% |
| Copy Game MB/s (MB/s) | 1216 | 486.3 -60% | 521 -57% | 618 -49% | 902 -26% | 340 -72% |
* ... menor é melhor

| 3DMark 11 Performance | 4681 pontos | |
| 3DMark Cloud Gate Standard Score | 13455 pontos | |
| 3DMark Fire Strike Score | 3350 pontos | |
| 3DMark Time Spy Score | 1240 pontos | |
Ajuda | ||
| The Witcher 3 - 1366x768 Medium Graphics & Postprocessing | |
| Lenovo Legion Y730-15ICH i5-8300H | |
| MSI GF63 8RC-040XPL | |
| Razer Blade Stealth i7-8565U | |
| Huawei MateBook 14 KLV-W29 | |
| Asus GL552JX-CN154H | |
| Média NVIDIA GeForce MX250 (30 - 40, n=27) | |
| Asus ZenBook S13 UX392FN | |
| Asus VivoBook S410UQ-NH74 | |
| Rise of the Tomb Raider - 1366x768 Medium Preset AF:2x | |
| Lenovo Legion Y730-15ICH i5-8300H | |
| Razer Blade Stealth i7-8565U | |
| Huawei MateBook 14 KLV-W29 | |
| Média NVIDIA GeForce MX250 (39 - 46.2, n=5) | |
| Asus ZenBook S13 UX392FN | |
| Asus VivoBook S410UQ-NH74 | |
| Dell XPS 13 9380 2019 | |
| baixo | média | alto | ultra | |
|---|---|---|---|---|
| The Witcher 3 (2015) | 64.5 | 36.5 | 21 | 11.9 |
| Rise of the Tomb Raider (2016) | 74.9 | 43.7 | 24.1 | 19.4 |
| Overwatch (2016) | 171.7 | 122.5 | 58 | 35 |
| Huawei MateBook 14 KLV-W29 GeForce MX250, i7-8565U, Samsung SSD PM981 MZVLB512HAJQ | Huawei Matebook X Pro i5 GeForce MX150, i5-8250U, Samsung PM961 MZVLW256HEHP | LG Gram 14Z980-U.AAW5U1 UHD Graphics 620, i5-8250U, SK Hynix SC313 HFS256G39TNF | Asus ZenBook S13 UX392FN GeForce MX150, i7-8565U, WDC PC SN520 SDAPNUW-512G | Lenovo Yoga C930-13IKB UHD Graphics 620, i5-8250U, SK hynix PC401 HFS256GD9TNG | Razer Blade Stealth i7-8565U GeForce MX150, i7-8565U, Lite-On CA3-8D256-Q11 | |
|---|---|---|---|---|---|---|
| Noise | -0% | 3% | -1% | 3% | -3% | |
| desligado / ambiente * (dB) | 28.1 | 27.9 1% | 28.2 -0% | 28.1 -0% | 29.3 -4% | 28.4 -1% |
| Idle Minimum * (dB) | 28.1 | 27.9 1% | 28.4 -1% | 28.1 -0% | 29.3 -4% | 28.5 -1% |
| Idle Average * (dB) | 28.1 | 27.9 1% | 28.4 -1% | 28.1 -0% | 29.3 -4% | 29 -3% |
| Idle Maximum * (dB) | 29.7 | 27.9 6% | 28.4 4% | 29 2% | 29.7 -0% | 29.1 2% |
| Load Average * (dB) | 31.2 | 36.2 -16% | 35.7 -14% | 41.1 -32% | 31.8 -2% | 42.8 -37% |
| Witcher 3 ultra * (dB) | 44.5 | 45 -1% | 41.1 8% | 41.4 7% | ||
| Load Maximum * (dB) | 47.5 | 45.2 5% | 34.2 28% | 41.1 13% | 32.7 31% | 41.6 12% |
* ... menor é melhor
Barulho
| Ocioso |
| 28.1 / 28.1 / 29.7 dB |
| Carga |
| 31.2 / 47.5 dB |
 | ||
30 dB silencioso 40 dB(A) audível 50 dB(A) ruidosamente alto |
||
min: | ||
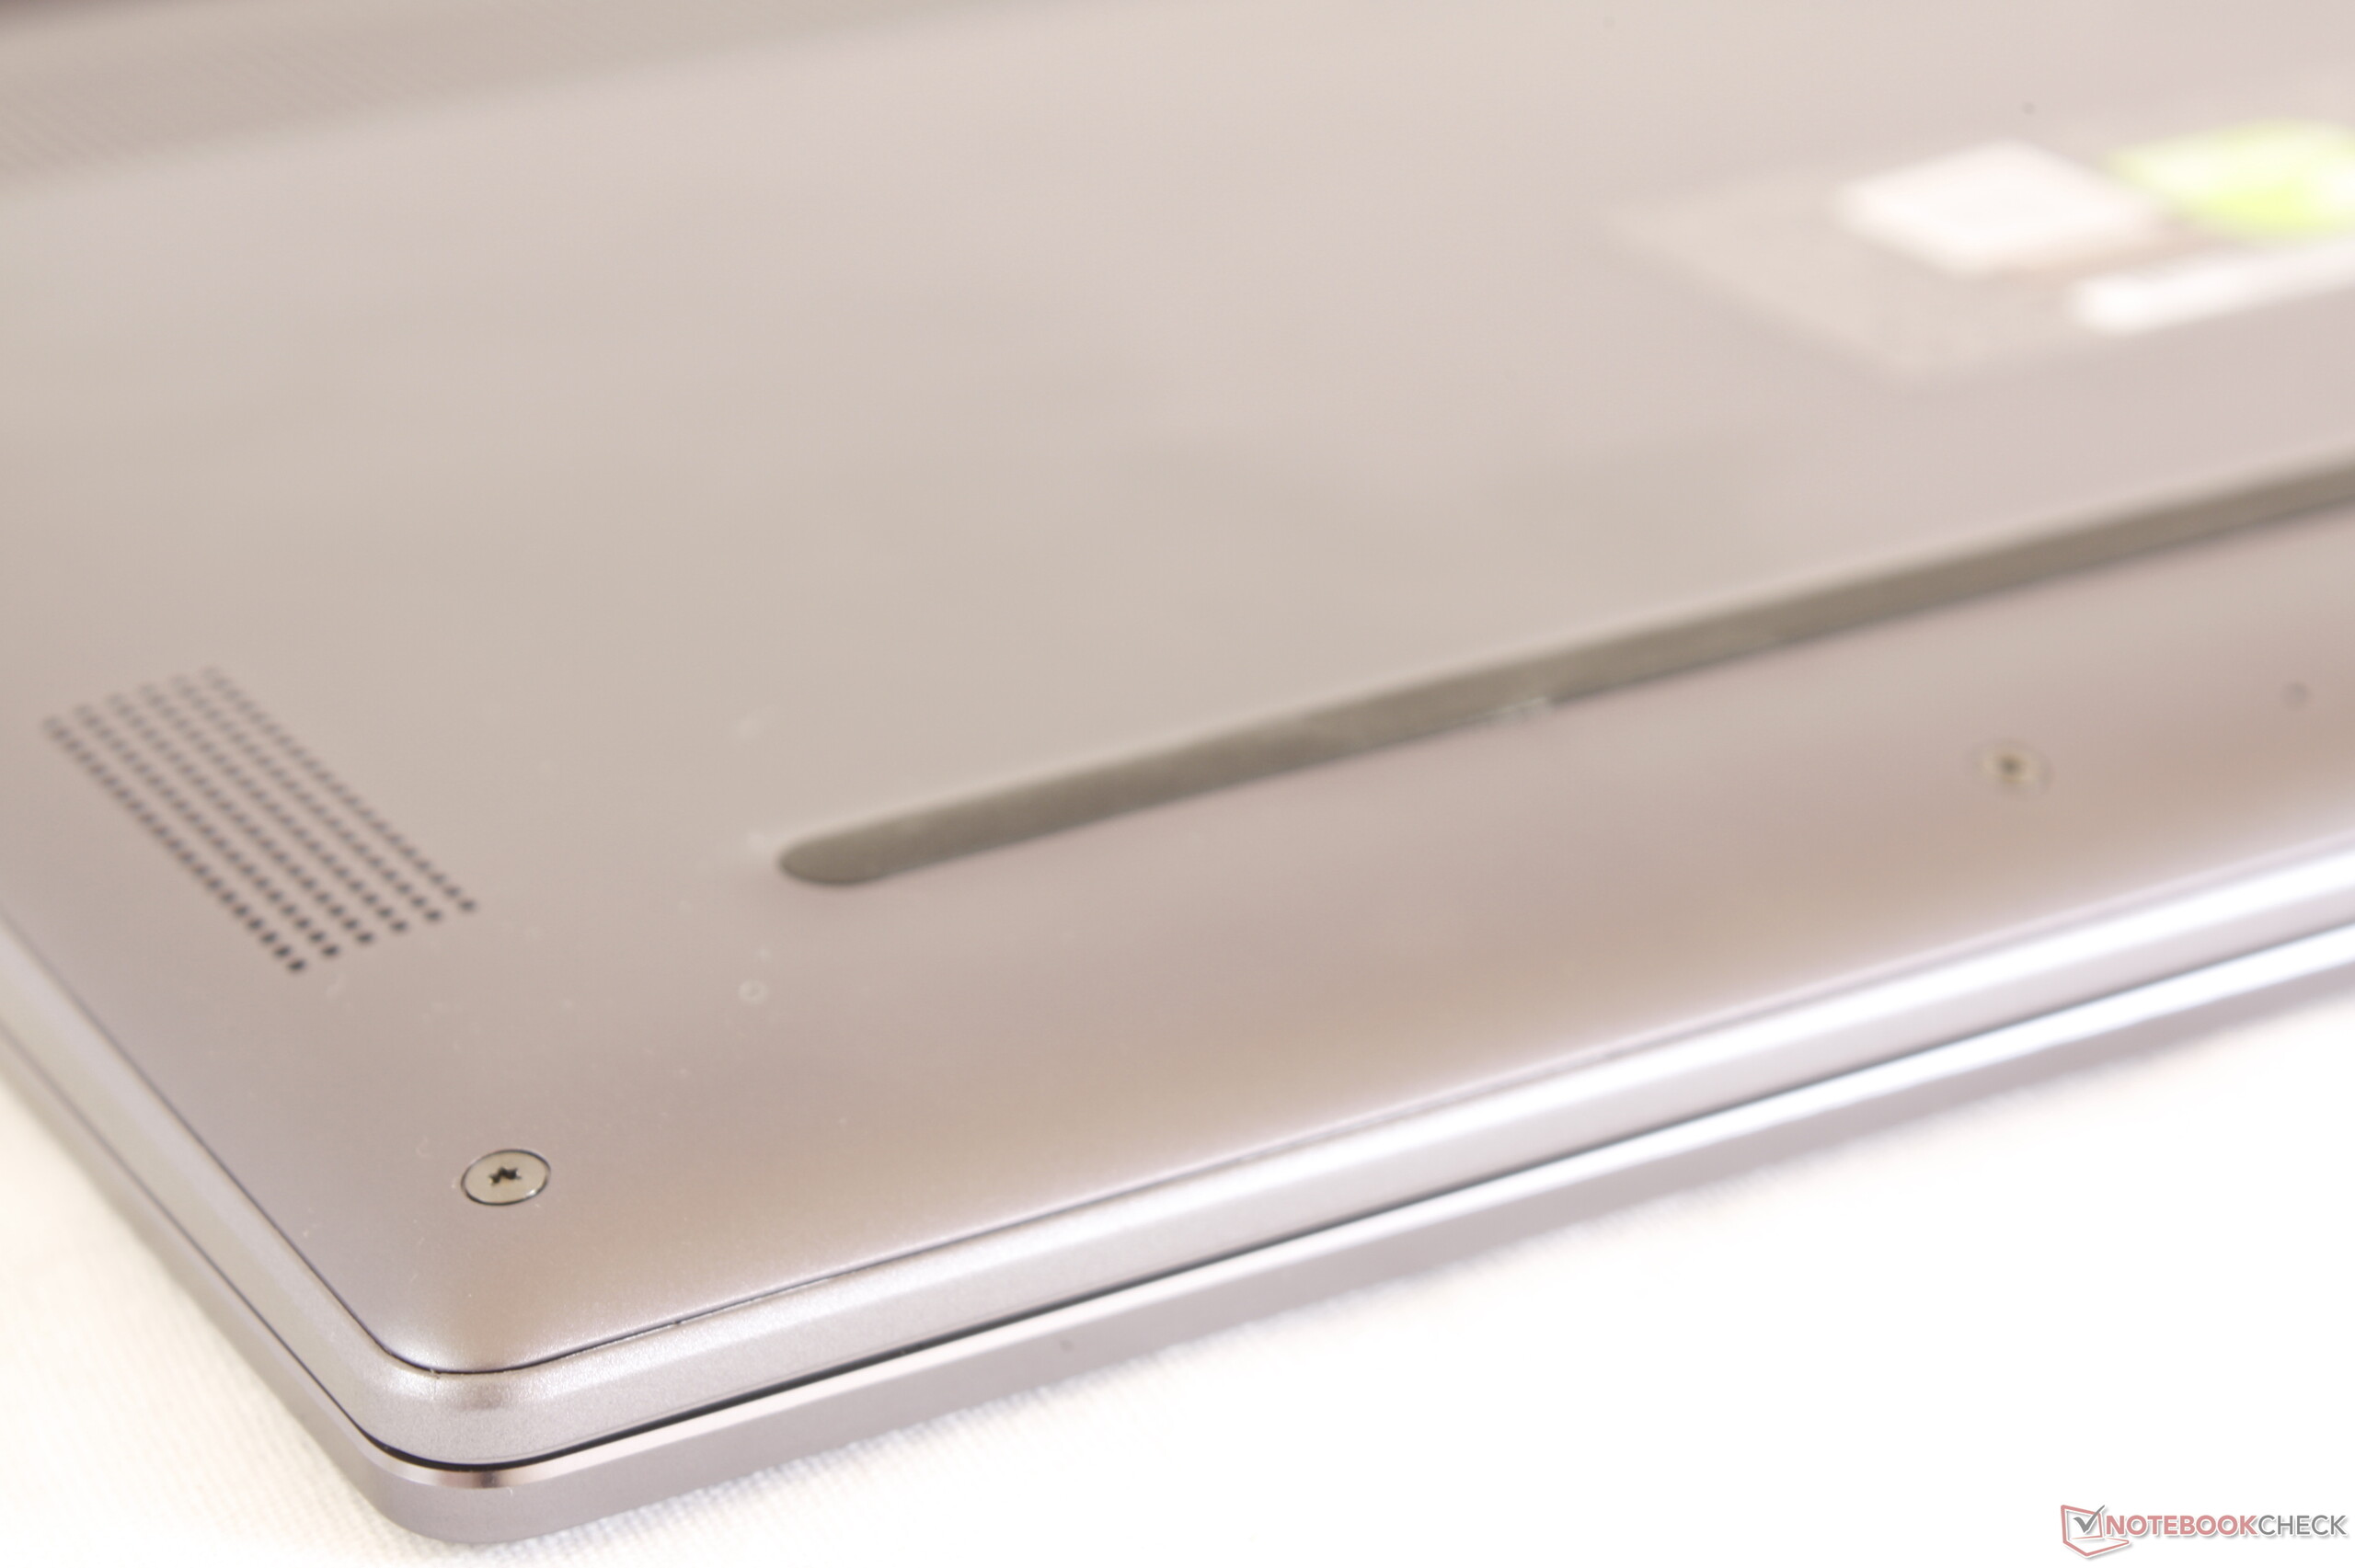
(-) A temperatura máxima no lado superior é 48.2 °C / 119 F, em comparação com a média de 35.9 °C / 97 F , variando de 21.4 a 59 °C para a classe Subnotebook.
(-) A parte inferior aquece até um máximo de 53.6 °C / 128 F, em comparação com a média de 39.2 °C / 103 F
(+) Em uso inativo, a temperatura média para o lado superior é 30.2 °C / 86 F, em comparação com a média do dispositivo de 30.8 °C / ### class_avg_f### F.
(±) Jogando The Witcher 3, a temperatura média para o lado superior é 37.4 °C / 99 F, em comparação com a média do dispositivo de 30.8 °C / ## #class_avg_f### F.
(±) Os apoios para as mãos e o touchpad podem ficar muito quentes ao toque, com um máximo de 36.8 °C / 98.2 F.
(-) A temperatura média da área do apoio para as mãos de dispositivos semelhantes foi 28.2 °C / 82.8 F (-8.6 °C / -15.4 F).
Huawei MateBook 14 KLV-W29 análise de áudio
(±) | o volume do alto-falante é médio, mas bom (###valor### dB)
Graves 100 - 315Hz
(±) | graves reduzidos - em média 14.4% menor que a mediana
(±) | a linearidade dos graves é média (13.8% delta para a frequência anterior)
Médios 400 - 2.000 Hz
(±) | médios mais altos - em média 5.1% maior que a mediana
(+) | médios são lineares (5.4% delta para frequência anterior)
Altos 2 - 16 kHz
(+) | agudos equilibrados - apenas 3.1% longe da mediana
(+) | os máximos são lineares (6.6% delta da frequência anterior)
Geral 100 - 16.000 Hz
(±) | a linearidade do som geral é média (19.9% diferença em relação à mediana)
Comparado com a mesma classe
» 63% de todos os dispositivos testados nesta classe foram melhores, 8% semelhantes, 29% piores
» O melhor teve um delta de 5%, a média foi 18%, o pior foi 53%
Comparado com todos os dispositivos testados
» 51% de todos os dispositivos testados foram melhores, 7% semelhantes, 42% piores
» O melhor teve um delta de 4%, a média foi 24%, o pior foi 134%
Apple MacBook 12 (Early 2016) 1.1 GHz análise de áudio
(+) | os alto-falantes podem tocar relativamente alto (###valor### dB)
Graves 100 - 315Hz
(±) | graves reduzidos - em média 11.3% menor que a mediana
(±) | a linearidade dos graves é média (14.2% delta para a frequência anterior)
Médios 400 - 2.000 Hz
(+) | médios equilibrados - apenas 2.4% longe da mediana
(+) | médios são lineares (5.5% delta para frequência anterior)
Altos 2 - 16 kHz
(+) | agudos equilibrados - apenas 2% longe da mediana
(+) | os máximos são lineares (4.5% delta da frequência anterior)
Geral 100 - 16.000 Hz
(+) | o som geral é linear (10.2% diferença em relação à mediana)
Comparado com a mesma classe
» 7% de todos os dispositivos testados nesta classe foram melhores, 2% semelhantes, 91% piores
» O melhor teve um delta de 5%, a média foi 18%, o pior foi 53%
Comparado com todos os dispositivos testados
» 5% de todos os dispositivos testados foram melhores, 1% semelhantes, 94% piores
» O melhor teve um delta de 4%, a média foi 24%, o pior foi 134%
| desligado | |
| Ocioso | |
| Carga |
|
Key:
min: | |
| Huawei MateBook 14 KLV-W29 i7-8565U, GeForce MX250, Samsung SSD PM981 MZVLB512HAJQ, IPS, 2160x1440, 14" | Huawei Matebook X Pro i5 i5-8250U, GeForce MX150, Samsung PM961 MZVLW256HEHP, IPS, 3000x2000, 13.9" | LG Gram 14Z980-U.AAW5U1 i5-8250U, UHD Graphics 620, SK Hynix SC313 HFS256G39TNF, IPS, 1920x1080, 14" | Asus ZenBook S13 UX392FN i7-8565U, GeForce MX150, WDC PC SN520 SDAPNUW-512G, IPS, 1920x1080, 13.9" | Lenovo Yoga C930-13IKB i5-8250U, UHD Graphics 620, SK hynix PC401 HFS256GD9TNG, IPS, 1920x1080, 13.9" | Razer Blade Stealth i7-8565U i7-8565U, GeForce MX150, Lite-On CA3-8D256-Q11, IPS, 1920x1080, 13.3" | |
|---|---|---|---|---|---|---|
| Power Consumption | 11% | 40% | 18% | 21% | -11% | |
| Idle Minimum * (Watt) | 3.7 | 3.5 5% | 2.7 27% | 3.4 8% | 3.3 11% | 6.7 -81% |
| Idle Average * (Watt) | 9.3 | 8.9 4% | 6 35% | 6.3 32% | 6.8 27% | 8.6 8% |
| Idle Maximum * (Watt) | 12.8 | 12.3 4% | 6.5 49% | 10.4 19% | 9.5 26% | 9.4 27% |
| Load Average * (Watt) | 58.8 | 54.2 8% | 32.5 45% | 51 13% | 40.8 31% | 64.1 -9% |
| Witcher 3 ultra * (Watt) | 55.8 | 42.4 24% | 39 30% | 63.7 -14% | ||
| Load Maximum * (Watt) | 65 | 52.1 20% | 35.5 45% | 62.7 4% | 57 12% | 64.1 1% |
* ... menor é melhor
| Huawei MateBook 14 KLV-W29 i7-8565U, GeForce MX250, 57.4 Wh | Huawei Matebook X Pro i5 i5-8250U, GeForce MX150, 57.4 Wh | LG Gram 14Z980-U.AAW5U1 i5-8250U, UHD Graphics 620, 72 Wh | Dell XPS 13 9380 2019 i5-8265U, UHD Graphics 620, 52 Wh | Asus ZenBook S13 UX392FN i7-8565U, GeForce MX150, 50 Wh | Lenovo Yoga C930-13IKB i5-8250U, UHD Graphics 620, 60 Wh | |
|---|---|---|---|---|---|---|
| Duração da bateria | 7% | 50% | 1% | 4% | 9% | |
| Reader / Idle (h) | 23.9 | 20.7 -13% | 37.3 56% | 17.2 -28% | 28.5 19% | 23.9 0% |
| WiFi v1.3 (h) | 8.4 | 9.3 11% | 12 43% | 8.3 -1% | 8.4 0% | 9.2 10% |
| Load (h) | 1.8 | 2.2 22% | 2.7 50% | 2.4 33% | 1.7 -6% | 2.1 17% |
Pro
Contra
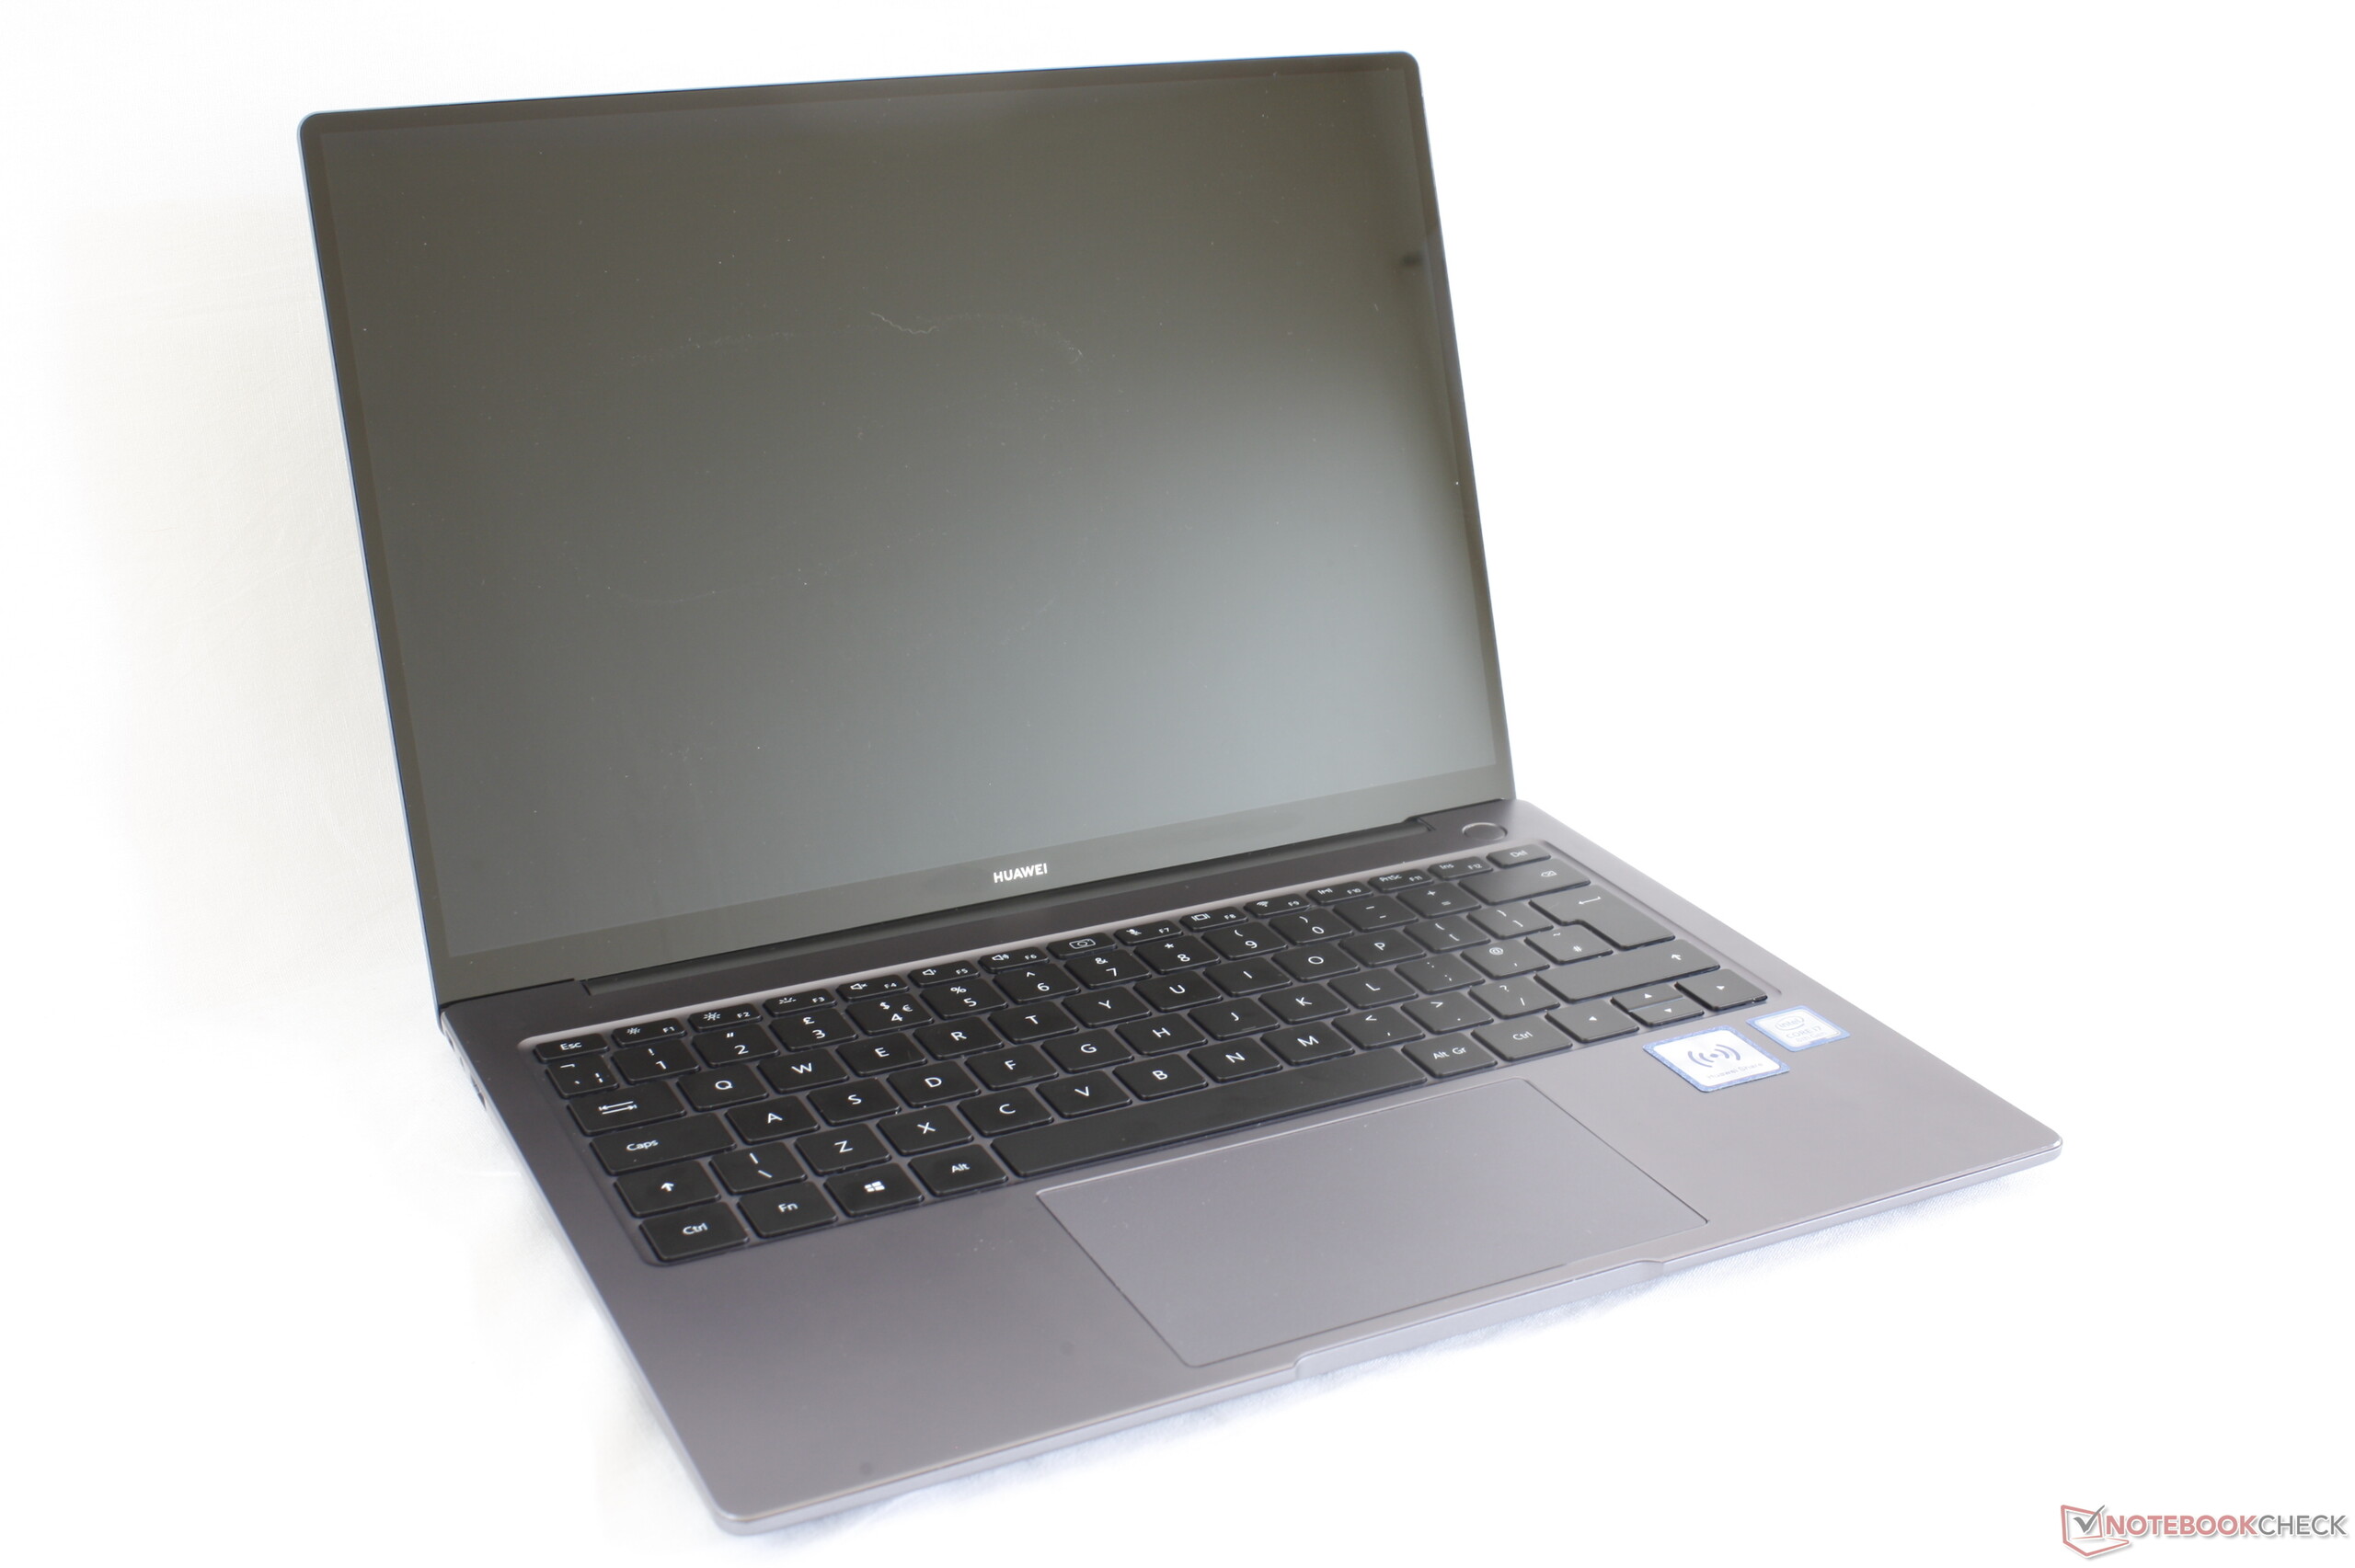
O MateBook 14 faz com que o Portátil Microsoft Surface tenha um visual obsoleto. É indubitavelmente o portátil 3:2 superior em termos de recursos, qualidade de construção, tela e especialmente em desempenho gráfico por aproximadamente o mesmo preço. Se a combinação de um formato singular e GPU de desempenho relativamente alto for atraente, o MateBook 14 será perfeito para você.
Se a sua intenção é principalmente a reprodução de multimídia ou jogos, em vez de processamento de texto ou navegação, no entanto, um Ultrabook 16: 9 mais tradicional, com conectividade Thunderbolt 3 como o Asus ZenBook S13 UX392 ou o Razer Blade Stealth seriam melhores para você. O MX250 no MateBook 14 é quase igual ao MX150 no MateBook 13 e o desempenho do Turbo Boost da CPU continua fraco.
O próximo MateBook X Pro 2019 terá exatamente as mesmas opções de CPU e GPU que o MateBook 14, mas em um chassi ainda mais fino com mais portas USB tipo C e uma tela táctil de maior resolução. A desvantagem, é claro, será a faixa de preço mais alta entre 1.600 e 2.000 Euros, em comparação a <1500 Euros do MateBook 14. Se você achar o MateBook X Pro atraente, mas estiver desanimado pelo seu preço mais alto, então pode valer a pena dar uma olhada no MateBook 14.
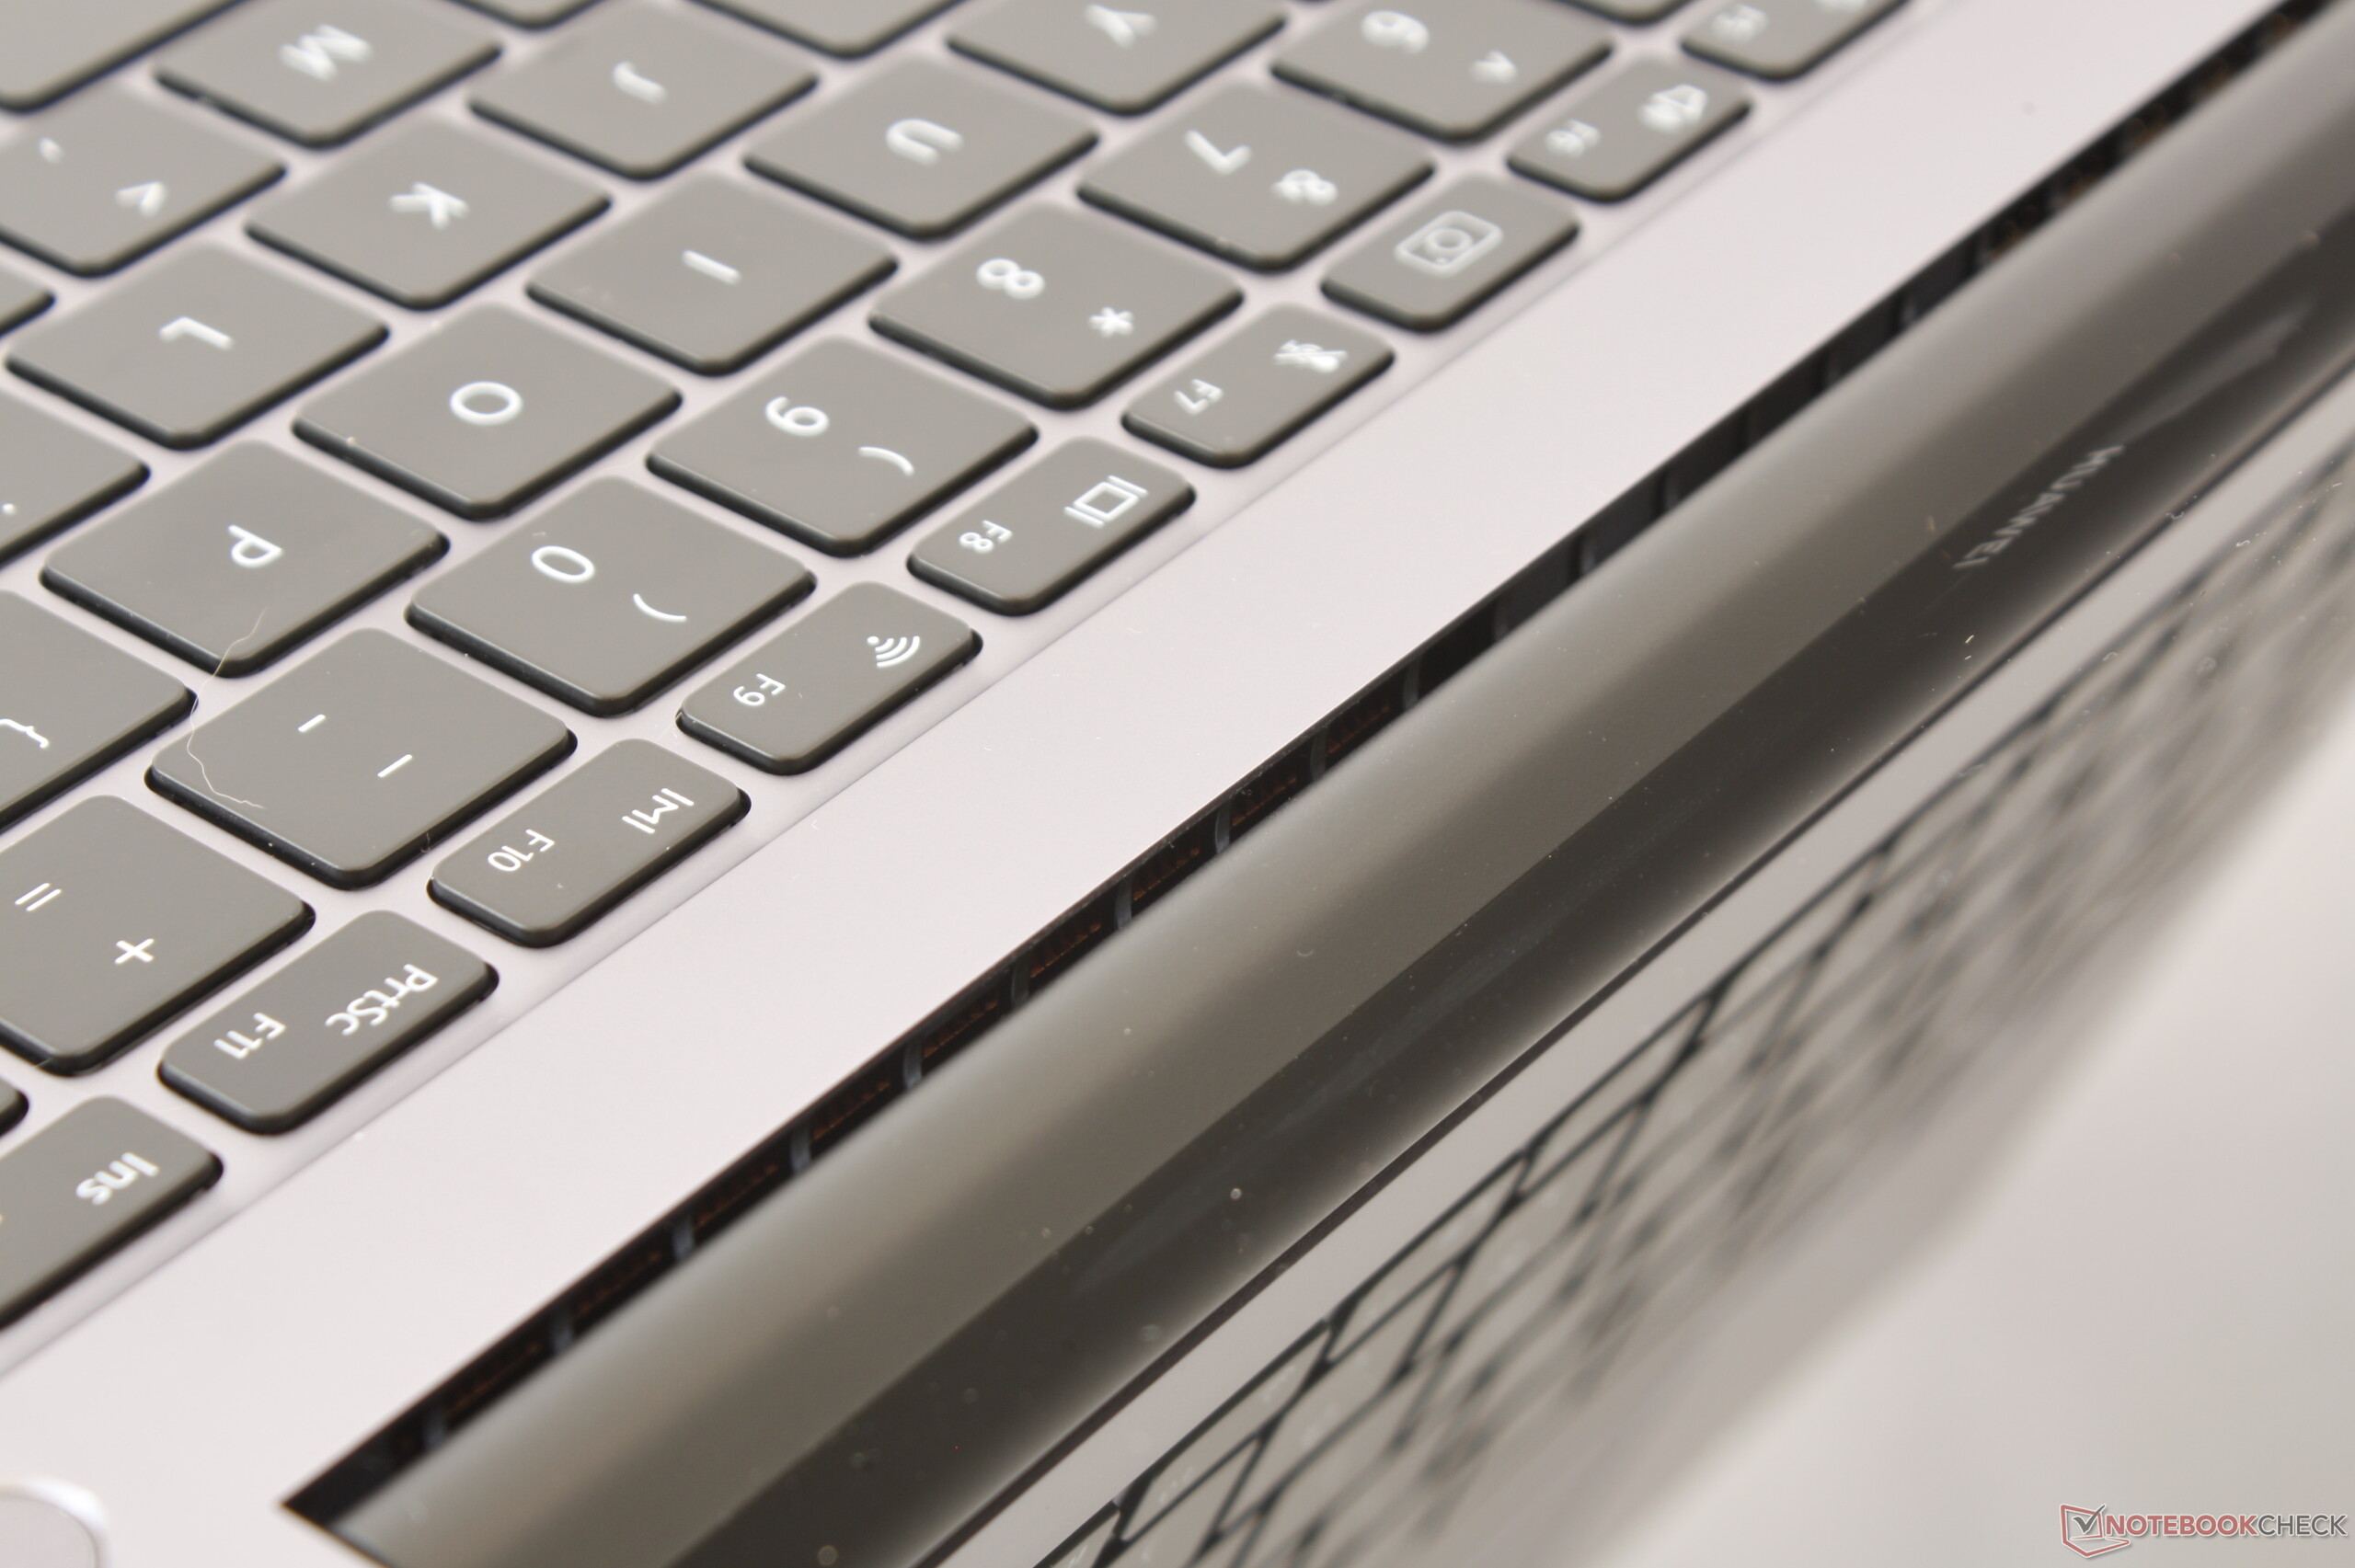
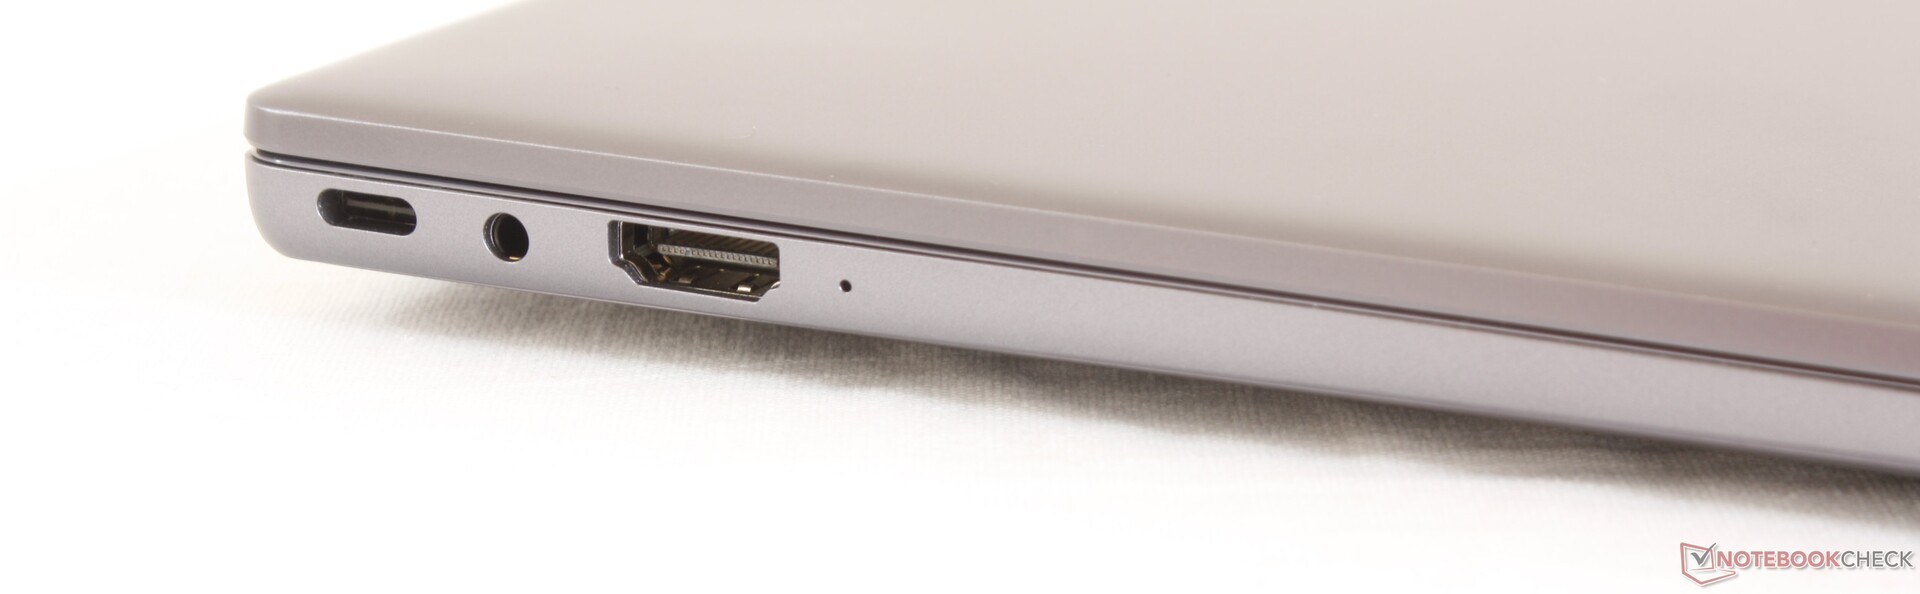
A CPU Core i7-8565U e a GPU GeForce MX250 de 25W oferecem muito pouco sobre o Core i7-8550U e a GeForce MX150 de 25 W como encontrado no MateBook 13. Embora seja um dos melhores Ultrabooks 3:2 do mercado, certamente poderia ser melhor em termos de opções de portas, resposta do teclado e posicionamento da webcam.
Huawei MateBook 14 KLV-W29
- 05/06/2019 v6 (old)
Allen Ngo
Price comparison
