Breve Análise do Conversível Dell XPS 15 9575 (i5-8305G, Vega M GL, FHD)
| SD Card Reader | |
| average JPG Copy Test (av. of 3 runs) | |
| HP Spectre x360 15t-bl100 (Toshiba Exceria Pro SDXC 64 GB UHS-II) | |
| Dell XPS 15 9575 i5-8305G (Toshiba Exceria Pro M501 UHS-II) | |
| Dell XPS 15 9560 (i7-7700HQ, UHD) (Toshiba Exceria Pro SDXC 64 GB UHS-II) | |
| maximum AS SSD Seq Read Test (1GB) | |
| Dell XPS 15 9560 (i7-7700HQ, UHD) (Toshiba Exceria Pro SDXC 64 GB UHS-II) | |
| HP Spectre x360 15t-bl100 (Toshiba Exceria Pro SDXC 64 GB UHS-II) | |
| Dell XPS 15 9575 i5-8305G (Toshiba Exceria Pro M501 UHS-II) | |
| Networking | |
| iperf3 transmit AX12 | |
| Dell XPS 15 9575 i5-8305G | |
| Dell XPS 15 9560 (i7-7700HQ, UHD) | |
| LG Gram 15Z975 | |
| iperf3 receive AX12 | |
| Dell XPS 15 9560 (i7-7700HQ, UHD) | |
| LG Gram 15Z975 | |
| Dell XPS 15 9575 i5-8305G | |
| |||||||||||||||||||||||||
iluminação: 87 %
iluminação com acumulador: 418.5 cd/m²
Contraste: 1196:1 (Preto: 0.35 cd/m²)
ΔE ColorChecker Calman: 3.5 | ∀{0.5-29.43 Ø4.71}
calibrated: 2.51
ΔE Greyscale Calman: 5.3 | ∀{0.09-98 Ø4.96}
92.1% sRGB (Argyll 1.6.3 3D)
57.9% AdobeRGB 1998 (Argyll 1.6.3 3D)
63.9% AdobeRGB 1998 (Argyll 3D)
92.5% sRGB (Argyll 3D)
63.3% Display P3 (Argyll 3D)
Gamma: 2.2
CCT: 7500 K
| Dell XPS 15 9575 i5-8305G Sharp SHP148E, IPS, 15.6", 1920x1080 | Dell XPS 15 9560 (i7-7700HQ, UHD) IGZO IPS, 15.6", 3840x2160 | HP Spectre x360 15t-bl100 BOE06C3, IPS, 15.6", 3840x2160 | LG Gram 15Z975 ID: LGD052A, Name: LG Philips LP156WFA-SPC1, IPS, 15.6", 1920x1080 | Microsoft Surface Book 2 15 LG Philips LGD0554, IPS, 15", 3240x2160 | Apple MacBook Pro 15 2017 (2.9 GHz, 560) 15.4", 2880x1800 | |
|---|---|---|---|---|---|---|
| Display | 35% | -1% | -14% | |||
| Display P3 Coverage (%) | 63.3 | 89.7 42% | 66.6 5% | 54.9 -13% | ||
| sRGB Coverage (%) | 92.5 | 100 8% | 86.9 -6% | 77.1 -17% | ||
| AdobeRGB 1998 Coverage (%) | 63.9 | 100 56% | 63.5 -1% | 56.3 -12% | ||
| Response Times | -8% | 21% | 32% | 34% | 22% | |
| Response Time Grey 50% / Grey 80% * (ms) | 53.6 ? | 57.2 ? -7% | 41.2 ? 23% | 35.2 ? 34% | 37.6 ? 30% | 42.4 ? 21% |
| Response Time Black / White * (ms) | 36.4 ? | 39.2 ? -8% | 29.6 ? 19% | 25.6 ? 30% | 22.4 ? 38% | 28 ? 23% |
| PWM Frequency (Hz) | 1000 ? | 962 | 1000 | 21930 ? | ||
| Screen | -5% | -7% | -19% | 29% | 31% | |
| Brightness middle (cd/m²) | 418.5 | 370.1 -12% | 338.7 -19% | 273 -35% | 446 7% | 534 28% |
| Brightness (cd/m²) | 391 | 356 -9% | 325 -17% | 276 -29% | 444 14% | 502 28% |
| Brightness Distribution (%) | 87 | 87 0% | 91 5% | 89 2% | 89 2% | 86 -1% |
| Black Level * (cd/m²) | 0.35 | 0.37 -6% | 0.28 20% | 0.22 37% | 0.25 29% | 0.31 11% |
| Contrast (:1) | 1196 | 1000 -16% | 1210 1% | 1241 4% | 1784 49% | 1723 44% |
| Colorchecker dE 2000 * | 3.5 | 5.3 -51% | 4.9 -40% | 4.77 -36% | 1.7 51% | 1.8 49% |
| Colorchecker dE 2000 max. * | 7.57 | 9.9 -31% | 8.7 -15% | 10.76 -42% | 2.7 64% | 3.8 50% |
| Colorchecker dE 2000 calibrated * | 2.51 | |||||
| Greyscale dE 2000 * | 5.3 | 4.6 13% | 5.5 -4% | 8.6 -62% | 1.7 68% | 2.4 55% |
| Gamma | 2.2 100% | 2.31 95% | 2.08 106% | 1.7 129% | 2.11 104% | 2.27 97% |
| CCT | 7500 87% | 6284 103% | 7498 87% | 6678 97% | 6384 102% | 6563 99% |
| Color Space (Percent of AdobeRGB 1998) (%) | 57.9 | 88.3 53% | 63.5 10% | 50.2 -13% | 58.6 1% | 77.92 35% |
| Color Space (Percent of sRGB) (%) | 92.1 | 100 9% | 86.92 -6% | 76.9 -17% | 92.9 1% | 99.94 9% |
| Média Total (Programa/Configurações) | 7% /
3% | 4% /
-2% | -0% /
-11% | 32% /
30% | 27% /
29% |
* ... menor é melhor
Exibir tempos de resposta
| ↔ Tempo de resposta preto para branco | ||
|---|---|---|
| 36.4 ms ... ascensão ↗ e queda ↘ combinadas | ↗ 19.2 ms ascensão | 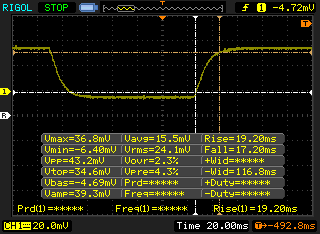 |
| ↘ 17.2 ms queda | ||
| A tela mostra taxas de resposta lentas em nossos testes e será insatisfatória para os jogadores. Em comparação, todos os dispositivos testados variam de 0.1 (mínimo) a 240 (máximo) ms. » 95 % de todos os dispositivos são melhores. Isso significa que o tempo de resposta medido é pior que a média de todos os dispositivos testados (19.8 ms). | ||
| ↔ Tempo de resposta 50% cinza a 80% cinza | ||
| 53.6 ms ... ascensão ↗ e queda ↘ combinadas | ↗ 26 ms ascensão | 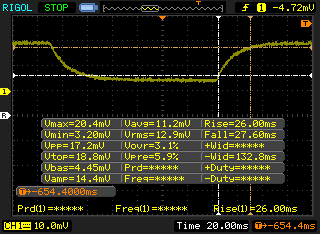 |
| ↘ 27.6 ms queda | ||
| A tela mostra taxas de resposta lentas em nossos testes e será insatisfatória para os jogadores. Em comparação, todos os dispositivos testados variam de 0.165 (mínimo) a 636 (máximo) ms. » 90 % de todos os dispositivos são melhores. Isso significa que o tempo de resposta medido é pior que a média de todos os dispositivos testados (31 ms). | ||
Cintilação da tela / PWM (modulação por largura de pulso)
| Tela tremeluzindo/PWM detectado | 1000 Hz | ≤ 25 % configuração de brilho | 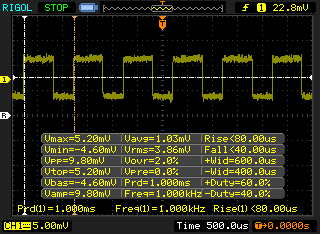 |
A luz de fundo da tela pisca em 1000 Hz (pior caso, por exemplo, utilizando PWM) Cintilação detectada em uma configuração de brilho de 25 % e abaixo. Não deve haver cintilação ou PWM acima desta configuração de brilho. A frequência de 1000 Hz é bastante alta, então a maioria dos usuários sensíveis ao PWM não deve notar nenhuma oscilação. [pwm_comparison] Em comparação: 52 % de todos os dispositivos testados não usam PWM para escurecer a tela. Se PWM foi detectado, uma média de 7754 (mínimo: 5 - máximo: 343500) Hz foi medida. | |||
| wPrime 2.10 - 1024m | |
| HP Envy x360 15-bq102ng | |
| Asus ROG Strix GL702ZC-GC204T | |
| Dell Inspiron 15 7000 7577 | |
| LG Gram 13Z980-A | |
| Dell XPS 15 9575 i5-8305G | |
| Dell XPS 15 9560 (i7-7700HQ, UHD) | |
| MSI GP62-2QEi781FD | |
| Intel Hades Canyon NUC8i7HVK | |
| Eurocom Sky X4C | |
* ... menor é melhor
| PCMark 10 - Score | |
| Intel Hades Canyon NUC8i7HVK | |
| Dell XPS 15 9575 i5-8305G | |
| Microsoft Surface Book 2 15 | |
| Apple MacBook Pro 15 2017 (2.9 GHz, 560) | |
| HP Spectre x360 15t-bl100 | |
| LG Gram 15Z975 | |
| HP Envy x360 15-bq102ng | |
| PCMark 8 | |
| Home Score Accelerated v2 | |
| Intel Hades Canyon NUC8i7HVK | |
| Dell XPS 15 9575 i5-8305G | |
| Apple MacBook Pro 15 2017 (2.9 GHz, 560) | |
| Microsoft Surface Book 2 15 | |
| Dell XPS 15 9560 (i7-7700HQ, UHD) | |
| LG Gram 15Z975 | |
| HP Envy x360 15-bq102ng | |
| HP Spectre x360 15t-bl100 | |
| Work Score Accelerated v2 | |
| Intel Hades Canyon NUC8i7HVK | |
| Dell XPS 15 9575 i5-8305G | |
| LG Gram 15Z975 | |
| Microsoft Surface Book 2 15 | |
| Dell XPS 15 9560 (i7-7700HQ, UHD) | |
| Apple MacBook Pro 15 2017 (2.9 GHz, 560) | |
| HP Spectre x360 15t-bl100 | |
| HP Envy x360 15-bq102ng | |
| Creative Score Accelerated v2 | |
| Intel Hades Canyon NUC8i7HVK | |
| Dell XPS 15 9575 i5-8305G | |
| Dell XPS 15 9560 (i7-7700HQ, UHD) | |
| HP Spectre x360 15t-bl100 | |
| Microsoft Surface Book 2 15 | |
| Apple MacBook Pro 15 2017 (2.9 GHz, 560) | |
| LG Gram 15Z975 | |
| HP Envy x360 15-bq102ng | |
| PCMark 8 Home Score Accelerated v2 | 4693 pontos | |
| PCMark 8 Creative Score Accelerated v2 | 6303 pontos | |
| PCMark 8 Work Score Accelerated v2 | 5134 pontos | |
| PCMark 10 Score | 4702 pontos | |
Ajuda | ||
| Dell XPS 15 9575 i5-8305G Toshiba XG5 KXG50ZNV256G | Dell XPS 15 9560 (i7-7700HQ, UHD) Lite-On CX2-8B512-Q11 | HP Spectre x360 15t-bl100 Samsung PM961 NVMe MZVLW512HMJP | LG Gram 15Z975 SK Hynix HFS256G39TND-N210A | Asus Zephyrus M GM501 Samsung SM961 MZVKW512HMJP m.2 PCI-e | |
|---|---|---|---|---|---|
| AS SSD | 138% | 232% | -34% | 191% | |
| Copy Game MB/s (MB/s) | 250.5 | 540 116% | 1134 353% | 179.8 -28% | |
| Copy Program MB/s (MB/s) | 174.9 | 411.5 135% | 534 205% | 141.2 -19% | |
| Copy ISO MB/s (MB/s) | 392.7 | 1272 224% | 1936 393% | 197.5 -50% | |
| Score Total (Points) | 1113 | 2810 152% | 3781 240% | 1003 -10% | 3649 228% |
| Score Write (Points) | 307 | 1022 233% | 1556 407% | 339 10% | 1446 371% |
| Score Read (Points) | 595 | 1206 103% | 1493 151% | 442 -26% | 1471 147% |
| Access Time Write * (ms) | 0.056 | 0.034 39% | 0.026 54% | 0.232 -314% | 0.041 27% |
| Access Time Read * (ms) | 0.146 | 0.034 77% | 0.04 73% | 0.08 45% | 0.046 68% |
| 4K-64 Write (MB/s) | 181.2 | 789 335% | 1262 596% | 246.7 36% | 1198 561% |
| 4K-64 Read (MB/s) | 337.1 | 962 185% | 1206 258% | 366.5 9% | 1218 261% |
| 4K Write (MB/s) | 92.7 | 112.2 21% | 141.1 52% | 67.6 -27% | 90.2 -3% |
| 4K Read (MB/s) | 24.78 | 41.34 67% | 51.9 109% | 26.24 6% | 43.42 75% |
| Seq Write (MB/s) | 334.3 | 1207 261% | 1530 358% | 248.5 -26% | 1580 373% |
| Seq Read (MB/s) | 2335 | 2026 -13% | 2342 0% | 488.1 -79% | 2091 -10% |
* ... menor é melhor

| 3DMark | |
| 1920x1080 Fire Strike Graphics | |
| Asus FX503VM-EH73 | |
| HP Omen 15-ce002ng | |
| Intel Hades Canyon NUC8i7HVK | |
| Asus Zenbook Pro UX550VE-DB71T | |
| Dell XPS 15 9575 i5-8305G | |
| Dell XPS 15 9560 (i7-7700HQ, UHD) | |
| HP Pavilion 17 FHD V3A33AV | |
| HP Spectre x360 15t-bl100 | |
| HP Envy x360 15-bq102ng | |
| Intel Skull Canyon NUC6i7KYK | |
| Fire Strike Extreme Graphics | |
| Asus FX503VM-EH73 | |
| Intel Hades Canyon NUC8i7HVK | |
| Asus Zenbook Pro UX550VE-DB71T | |
| Dell XPS 15 9575 i5-8305G | |
| Dell XPS 15 9560 (i7-7700HQ, UHD) | |
| HP Pavilion 17 FHD V3A33AV | |
| HP Envy x360 15-bq102ng | |
| Intel Skull Canyon NUC6i7KYK | |
| 1920x1080 Fire Strike Score | |
| Asus FX503VM-EH73 | |
| HP Omen 15-ce002ng | |
| Intel Hades Canyon NUC8i7HVK | |
| Asus Zenbook Pro UX550VE-DB71T | |
| Dell XPS 15 9575 i5-8305G | |
| Dell XPS 15 9560 (i7-7700HQ, UHD) | |
| HP Pavilion 17 FHD V3A33AV | |
| HP Spectre x360 15t-bl100 | |
| HP Envy x360 15-bq102ng | |
| Intel Skull Canyon NUC6i7KYK | |
| 3DMark 11 | |
| 1280x720 Performance GPU | |
| Asus FX503VM-EH73 | |
| Intel Hades Canyon NUC8i7HVK | |
| HP Omen 15-ce002ng | |
| Dell XPS 15 9575 i5-8305G | |
| Asus Zenbook Pro UX550VE-DB71T | |
| HP Pavilion 17 FHD V3A33AV | |
| HP Spectre x360 15t-bl100 | |
| HP Envy x360 15-bq102ng | |
| Intel Skull Canyon NUC6i7KYK | |
| 1280x720 Performance Combined | |
| Intel Hades Canyon NUC8i7HVK | |
| HP Omen 15-ce002ng | |
| Asus Zenbook Pro UX550VE-DB71T | |
| Dell XPS 15 9575 i5-8305G | |
| Asus FX503VM-EH73 | |
| HP Pavilion 17 FHD V3A33AV | |
| HP Spectre x360 15t-bl100 | |
| Intel Skull Canyon NUC6i7KYK | |
| HP Envy x360 15-bq102ng | |
| 3DMark 06 Standard Score | 16707 pontos | |
| 3DMark 11 Performance | 9326 pontos | |
| 3DMark Ice Storm Standard Score | 111847 pontos | |
| 3DMark Cloud Gate Standard Score | 21322 pontos | |
| 3DMark Fire Strike Score | 6235 pontos | |
| 3DMark Fire Strike Extreme Score | 3052 pontos | |
Ajuda | ||
| Rise of the Tomb Raider - 1920x1080 Very High Preset AA:FX AF:16x | |
| Asus FX503VM-EH73 | |
| Dell Inspiron 15 7000 7577 4K | |
| Intel Hades Canyon NUC8i7HVK | |
| Asus Zenbook Pro UX550VE-DB71T | |
| Dell XPS 15 9575 i5-8305G | |
| Acer Nitro 5 Spin NP515-51-86CX | |
| Asus G501VW-FY081T | |
| Lenovo ThinkPad T480-20L6S01V00 | |
| Intel Skull Canyon NUC6i7KYK | |
| baixo | média | alto | ultra | |
|---|---|---|---|---|
| BioShock Infinite (2013) | 202.7 | 172 | 152 | 51.7 |
| Metro: Last Light (2013) | 105.8 | 80.9 | 40.8 | |
| Thief (2014) | 78.8 | 72.6 | 41.1 | |
| The Witcher 3 (2015) | 77.8 | 43.8 | 23.7 | |
| Batman: Arkham Knight (2015) | 111 | 97 | 53 | |
| Metal Gear Solid V (2015) | 60 | 60 | 60 | 54 |
| Fallout 4 (2015) | 86.1 | 45.2 | 36 | |
| Rise of the Tomb Raider (2016) | 131.1 | 79.7 | 40.6 | 31.7 |
| Ashes of the Singularity (2016) | 54.1 | 36.4 | 32.3 | |
| Overwatch (2016) | 184.3 | 108.2 | 50 | |
| Mafia 3 (2016) | 45 | 34 | 24 | |
| Prey (2017) | 135 | 86.6 | 69.1 | 61 |
| Dirt 4 (2017) | 40.9 | 16.3 | 9.7 | |
| F1 2017 (2017) | 80 | 65 | 39 | |
| Final Fantasy XV Benchmark (2018) | 9 |
Barulho
| Ocioso |
| 27.8 / 27.8 / 27.8 dB |
| HDD |
| 27.8 dB |
| Carga |
| 35 / 44.2 dB |
 | ||
30 dB silencioso 40 dB(A) audível 50 dB(A) ruidosamente alto |
||
min: | ||
| Dell XPS 15 9575 i5-8305G Vega M GL / 870, i5-8305G, Toshiba XG5 KXG50ZNV256G | Dell XPS 15 9560 (i7-7700HQ, UHD) GeForce GTX 1050 Mobile, i7-7700HQ, Lite-On CX2-8B512-Q11 | HP Spectre x360 15t-bl100 GeForce MX150, i5-8550U, Samsung PM961 NVMe MZVLW512HMJP | Microsoft Surface Book 2 15 GeForce GTX 1060 Mobile, i7-8650U, Samsung PM961 MZVLW256HEHP | Dell Inspiron 15 7000 7577 GeForce GTX 1060 Max-Q, i5-7300HQ, Samsung PM961 MZVLW256HEHP | Apple MacBook Pro 15 2017 (2.9 GHz, 560) Radeon Pro 560, i7-7820HQ | |
|---|---|---|---|---|---|---|
| Noise | -12% | -0% | -4% | 2% | -5% | |
| desligado / ambiente * (dB) | 27.8 | 28.4 -2% | 28.4 -2% | 29.1 -5% | 28 -1% | 30.8 -11% |
| Idle Minimum * (dB) | 27.8 | 29 -4% | 28.4 -2% | 29.1 -5% | 28 -1% | 31 -12% |
| Idle Average * (dB) | 27.8 | 29 -4% | 28.4 -2% | 29.1 -5% | 28 -1% | 31 -12% |
| Idle Maximum * (dB) | 27.8 | 32.2 -16% | 28.4 -2% | 29.1 -5% | 28 -1% | 31 -12% |
| Load Average * (dB) | 35 | 47.1 -35% | 41.6 -19% | 35.7 -2% | 30.3 13% | 31.3 11% |
| Witcher 3 ultra * (dB) | 44.2 | 52 -18% | 36.1 18% | 39.5 11% | ||
| Load Maximum * (dB) | 44.2 | 47.1 -7% | 41.6 6% | 45.3 -2% | 46.5 -5% | 41.8 5% |
* ... menor é melhor
(±) A temperatura máxima no lado superior é 44.8 °C / 113 F, em comparação com a média de 36.8 °C / 98 F , variando de 21 a 71 °C para a classe Multimedia.
(±) A parte inferior aquece até um máximo de 40 °C / 104 F, em comparação com a média de 39.1 °C / 102 F
(+) Em uso inativo, a temperatura média para o lado superior é 26.2 °C / 79 F, em comparação com a média do dispositivo de 31.3 °C / ### class_avg_f### F.
(±) Jogando The Witcher 3, a temperatura média para o lado superior é 36.7 °C / 98 F, em comparação com a média do dispositivo de 31.3 °C / ## #class_avg_f### F.
(+) Os apoios para as mãos e o touchpad são mais frios que a temperatura da pele, com um máximo de 31.2 °C / 88.2 F e, portanto, são frios ao toque.
(-) A temperatura média da área do apoio para as mãos de dispositivos semelhantes foi 28.7 °C / 83.7 F (-2.5 °C / -4.5 F).
Dell XPS 15 9575 i5-8305G análise de áudio
(-) | alto-falantes não muito altos (###valor### dB)
Graves 100 - 315Hz
(-) | quase nenhum baixo - em média 16.7% menor que a mediana
(±) | a linearidade dos graves é média (11.2% delta para a frequência anterior)
Médios 400 - 2.000 Hz
(+) | médios equilibrados - apenas 4.5% longe da mediana
(+) | médios são lineares (6.9% delta para frequência anterior)
Altos 2 - 16 kHz
(+) | agudos equilibrados - apenas 2.8% longe da mediana
(±) | a linearidade dos máximos é média (8.4% delta para frequência anterior)
Geral 100 - 16.000 Hz
(±) | a linearidade do som geral é média (23% diferença em relação à mediana)
Comparado com a mesma classe
» 81% de todos os dispositivos testados nesta classe foram melhores, 5% semelhantes, 14% piores
» O melhor teve um delta de 5%, a média foi 17%, o pior foi 45%
Comparado com todos os dispositivos testados
» 69% de todos os dispositivos testados foram melhores, 5% semelhantes, 26% piores
» O melhor teve um delta de 4%, a média foi 23%, o pior foi 134%
Apple MacBook 12 (Early 2016) 1.1 GHz análise de áudio
(+) | os alto-falantes podem tocar relativamente alto (###valor### dB)
Graves 100 - 315Hz
(±) | graves reduzidos - em média 11.3% menor que a mediana
(±) | a linearidade dos graves é média (14.2% delta para a frequência anterior)
Médios 400 - 2.000 Hz
(+) | médios equilibrados - apenas 2.4% longe da mediana
(+) | médios são lineares (5.5% delta para frequência anterior)
Altos 2 - 16 kHz
(+) | agudos equilibrados - apenas 2% longe da mediana
(+) | os máximos são lineares (4.5% delta da frequência anterior)
Geral 100 - 16.000 Hz
(+) | o som geral é linear (10.2% diferença em relação à mediana)
Comparado com a mesma classe
» 7% de todos os dispositivos testados nesta classe foram melhores, 2% semelhantes, 90% piores
» O melhor teve um delta de 5%, a média foi 18%, o pior foi 53%
Comparado com todos os dispositivos testados
» 5% de todos os dispositivos testados foram melhores, 1% semelhantes, 94% piores
» O melhor teve um delta de 4%, a média foi 23%, o pior foi 134%
| Dell XPS 15 9575 i5-8305G i5-8305G, Vega M GL / 870, 75 Wh | Dell XPS 15 9560 (i7-7700HQ, UHD) i7-7700HQ, GeForce GTX 1050 Mobile, 97 Wh | HP Spectre x360 15t-bl100 i5-8550U, GeForce MX150, 79.2 Wh | Apple MacBook Pro 15 2017 (2.9 GHz, 560) i7-7820HQ, Radeon Pro 560, Wh | LG Gram 15Z975 i5-8250U, UHD Graphics 620, 60 Wh | Dell Inspiron 15 7000 7577 i5-7300HQ, GeForce GTX 1060 Max-Q, 56 Wh | |
|---|---|---|---|---|---|---|
| Duração da bateria | 11% | 36% | 3% | 36% | -2% | |
| Reader / Idle (h) | 11.1 | 13.9 25% | 15.6 41% | 18 62% | 11 -1% | |
| WiFi v1.3 (h) | 9.4 | 7.2 -23% | 8.5 -10% | 11.3 20% | 7.3 -22% | 6.9 -27% |
| Load (h) | 1.3 | 1.7 31% | 2.3 77% | 1.1 -15% | 2.2 69% | 1.6 23% |
| Witcher 3 ultra (h) | 1.3 |
Pro
Contra
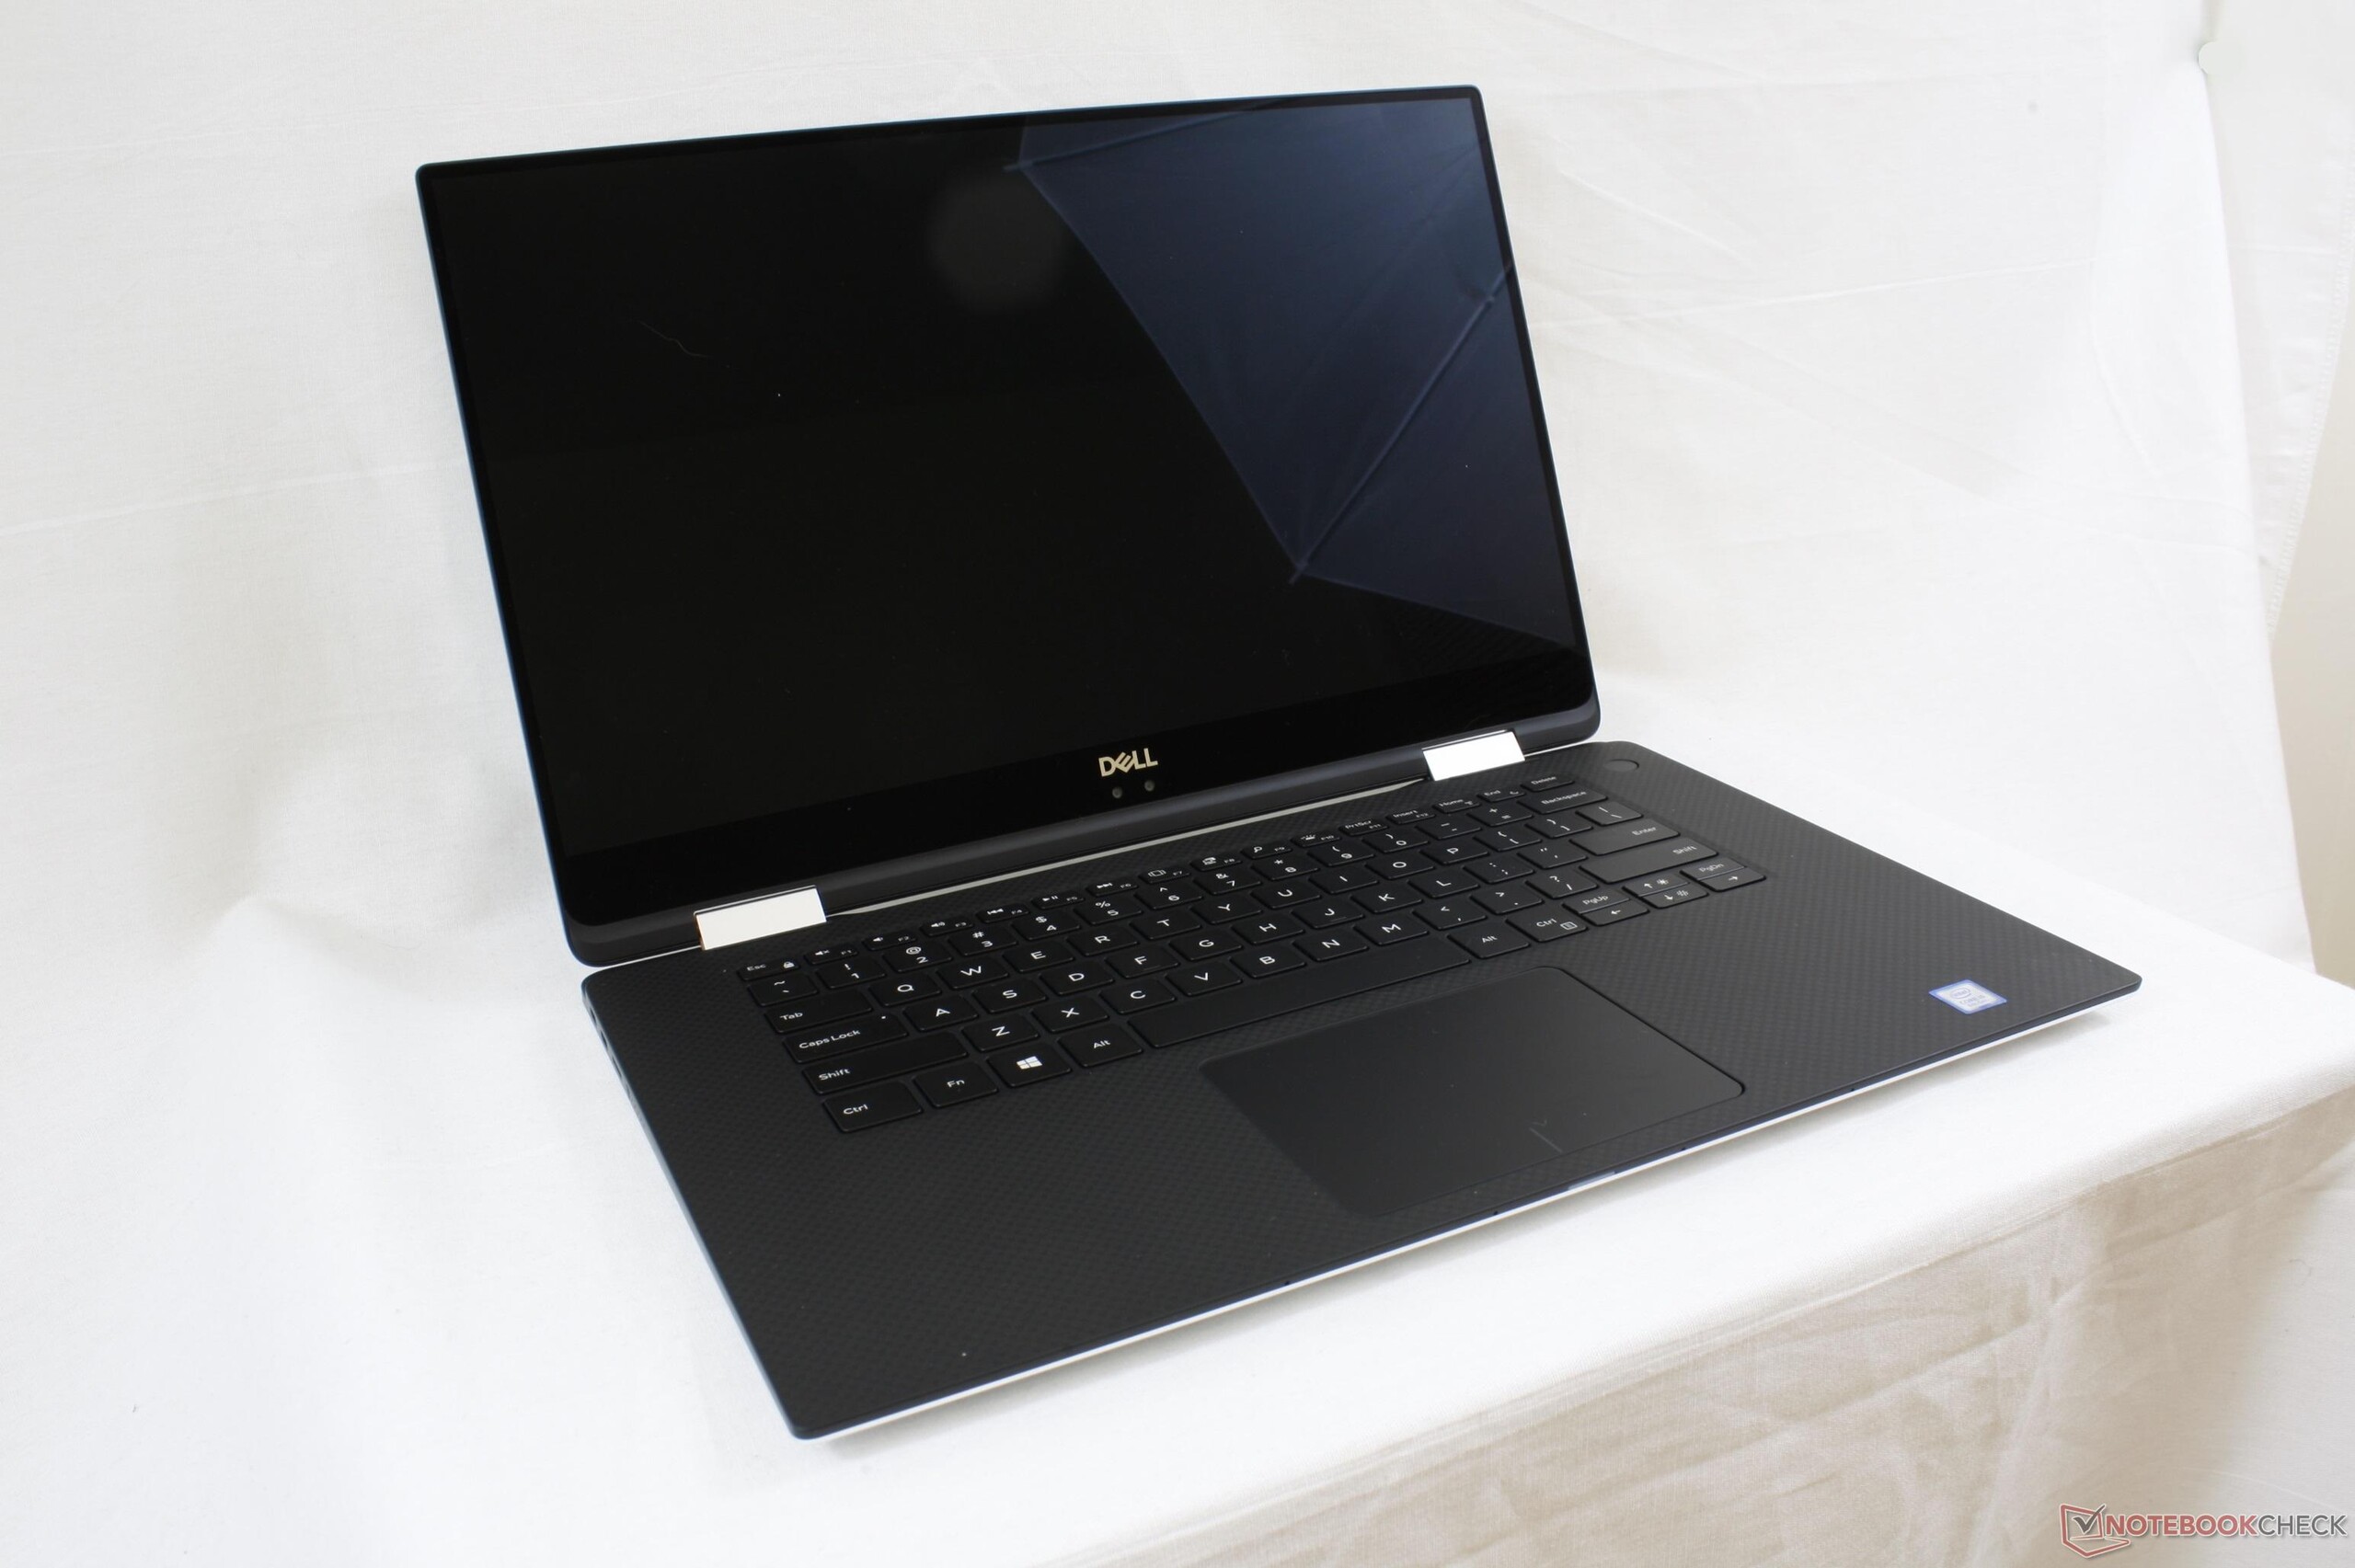
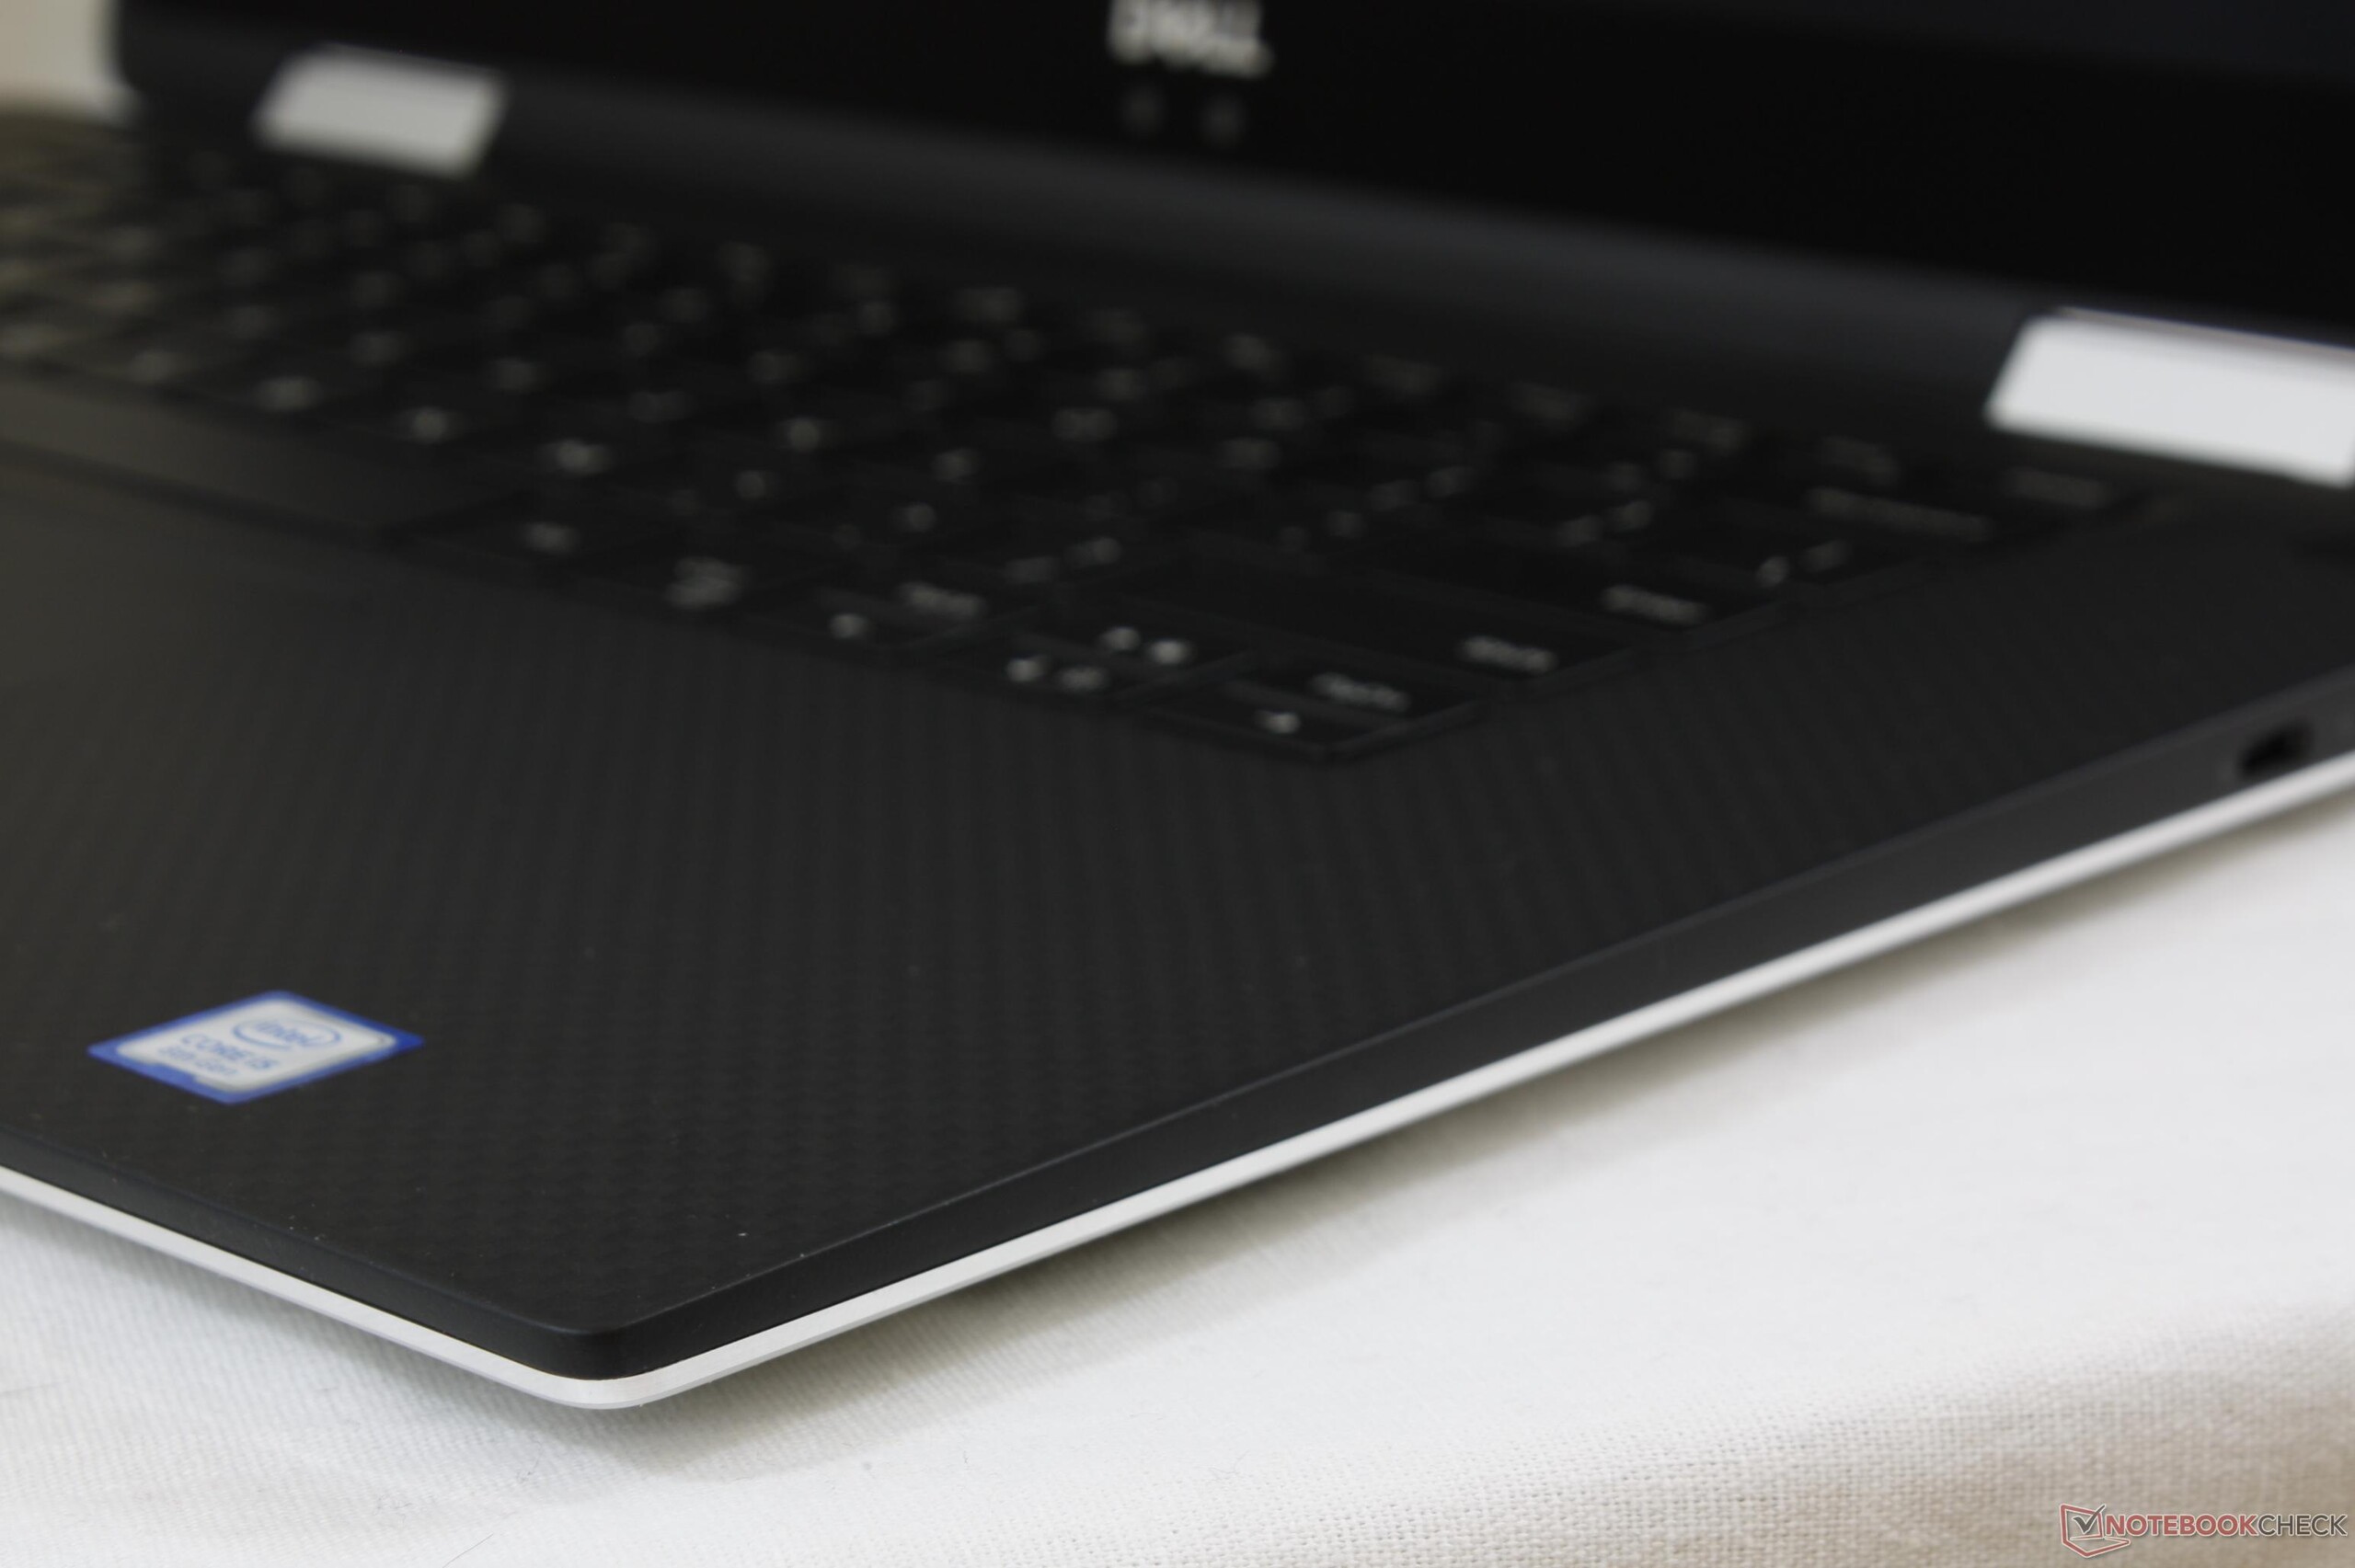
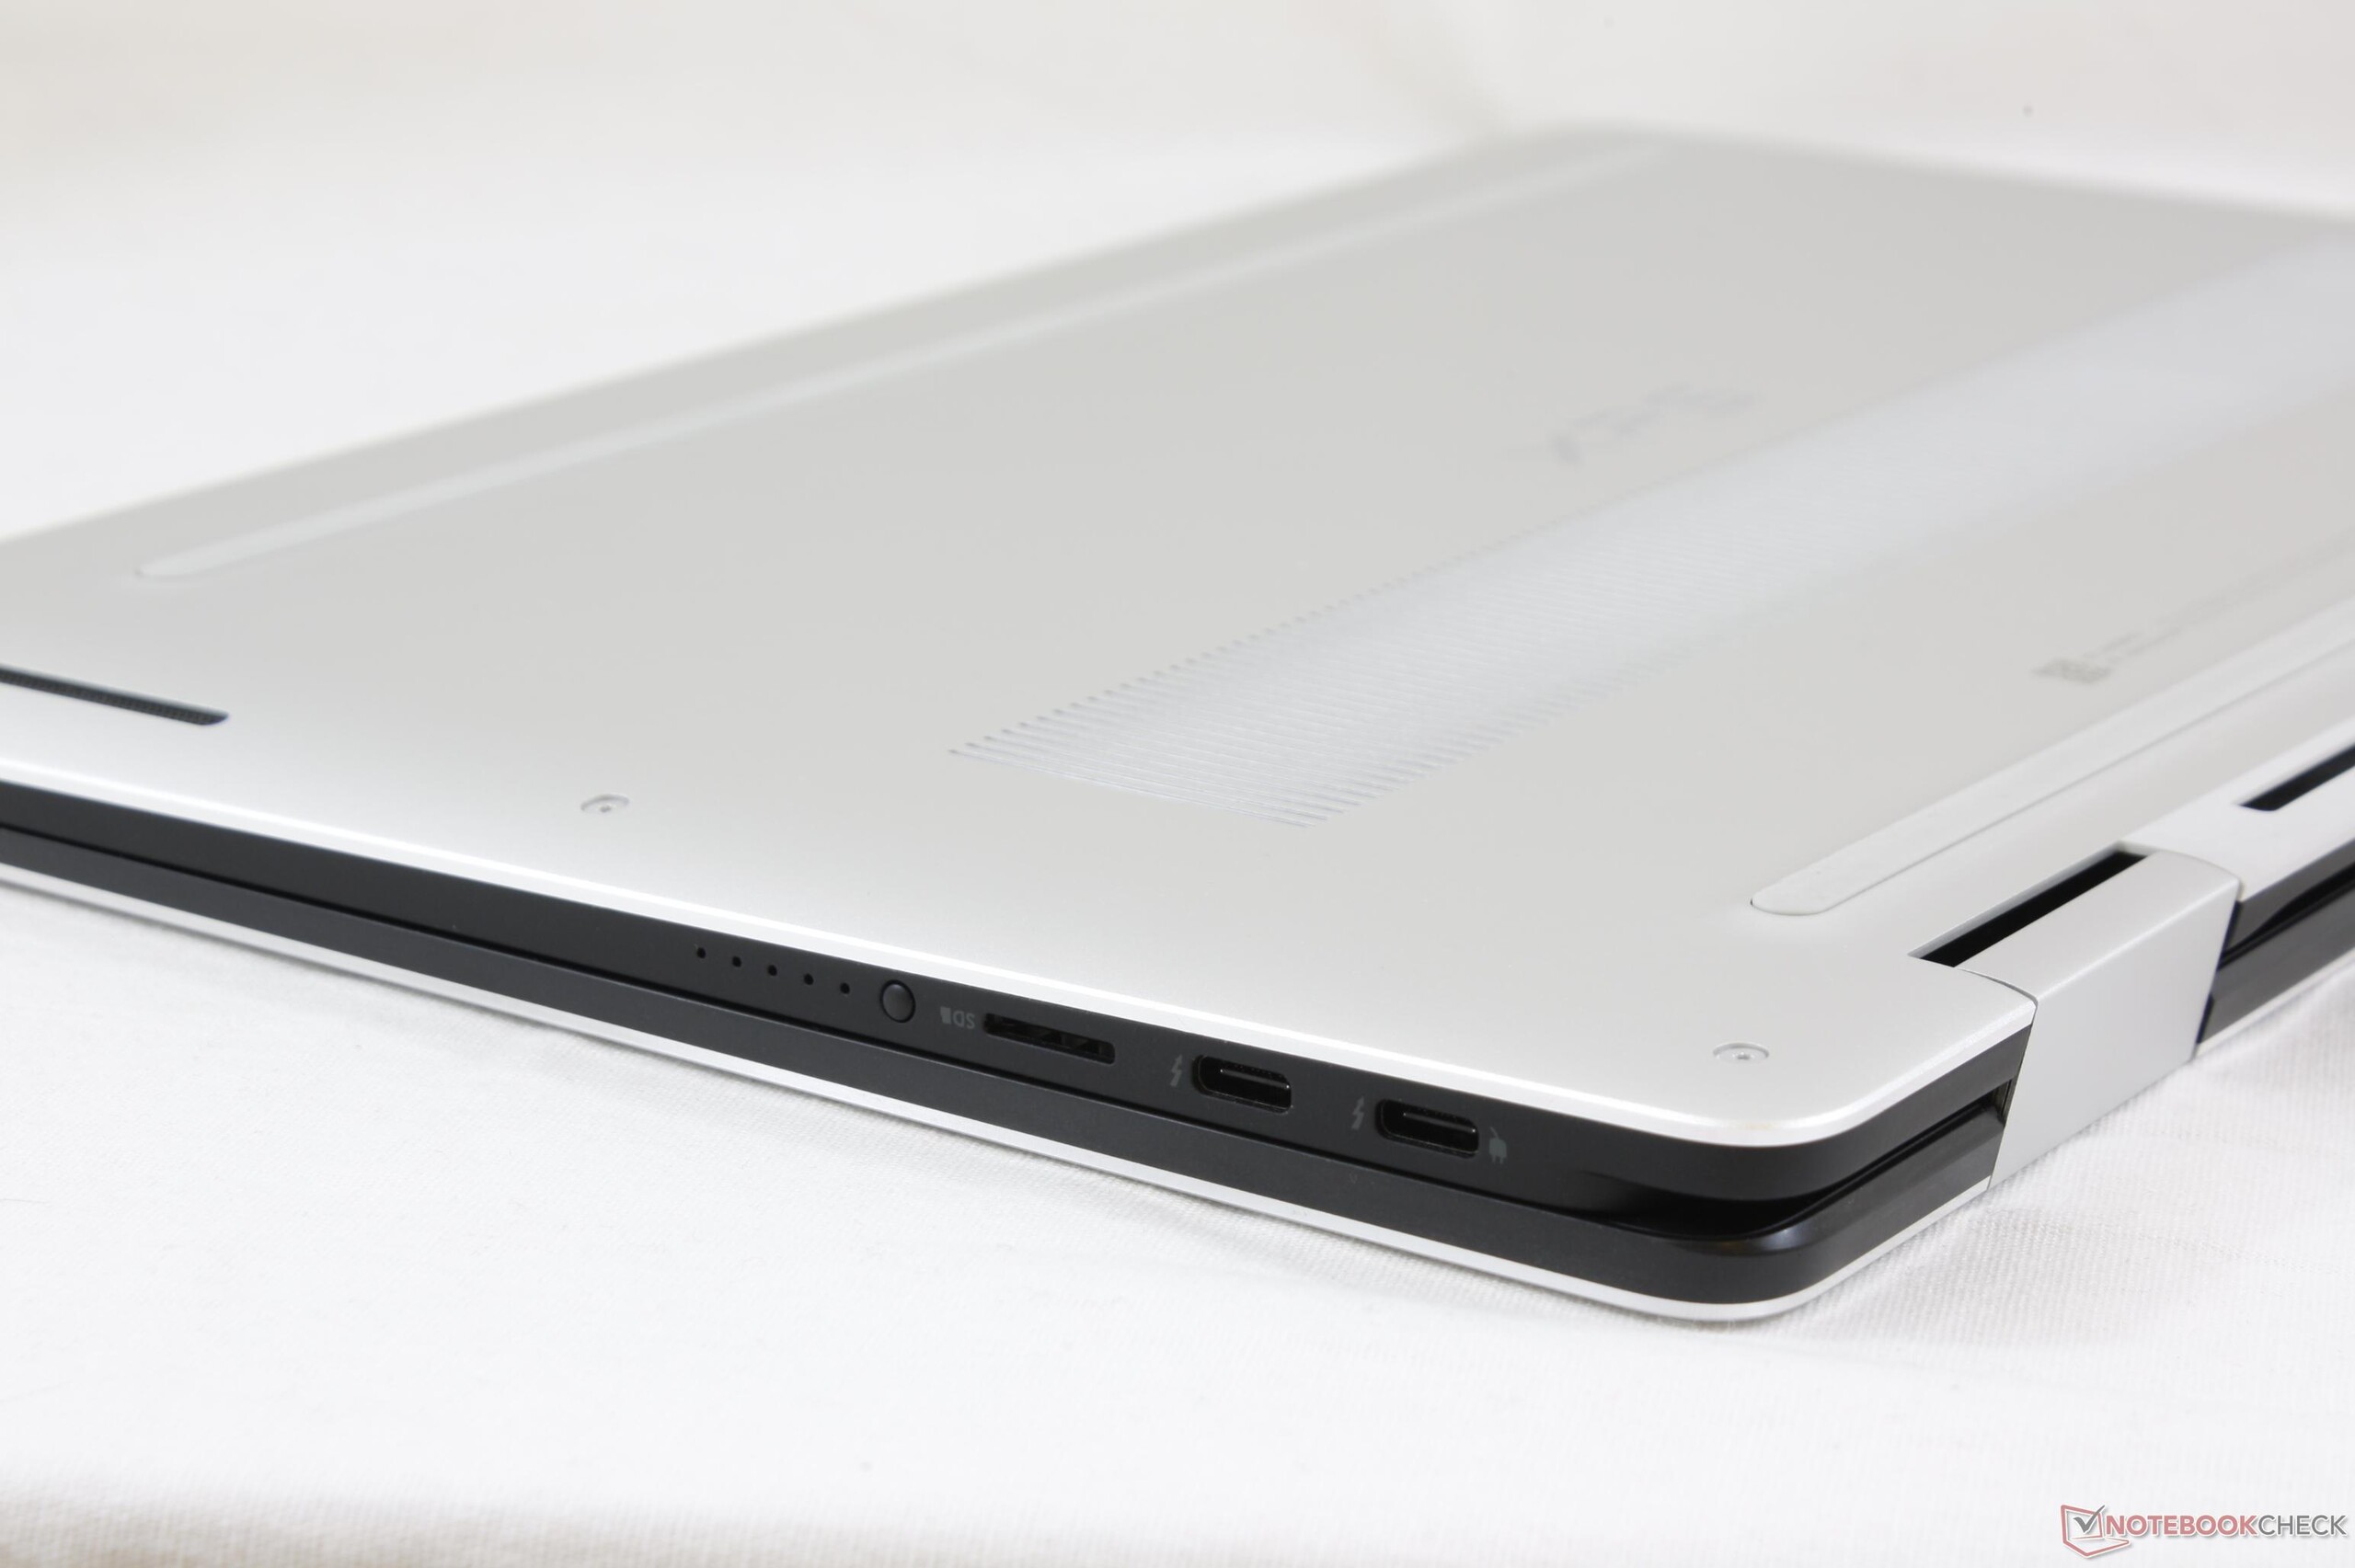
O XPS 15 9575 deve traduzir o padrão XPS 15 9560 em um conversível formidável, sem sacrificar o que torna o original tão popular. Nessa perspectiva, o novo XPS é um sucesso, pois certamente se sente com um XPS 15 clássico em termos de qualidade e rigidez, mas com a versatilidade adicional de um fator de forma 2 em 1. É bom ver que o chassi permanece tão forte como sempre na transição para um design mais fino. Se você ama o XPS 15 9560, então o XPS 15 9575 vai se sentir muito familiar.
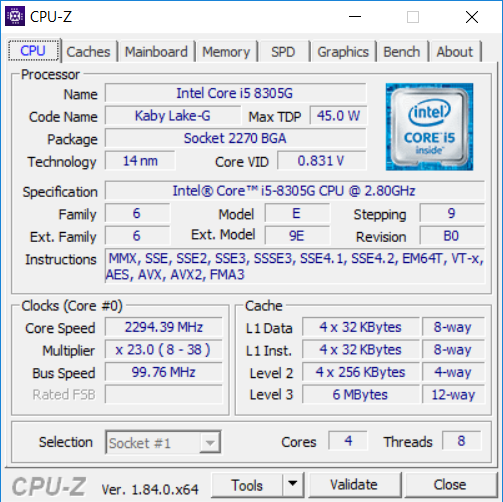
Em termos de desempenho, a CPU Core i5-8305G e a GPU Radeon RX Vega M GL são comparáveis ao Core i7-7700HQ e GTX 1050, respectivamente, muitas vezes apenas por pontos percentuais de um único dígito nos benchmarks. A Dell está absolutamente ciente disso, dado que a atual configuração XPS 15 9560 com a CPU i7-7700HQ e a GPU GTX 1050 se vende exatamente pelo mesmo preço de $1.500 como nossa configuração XPS 15 9575, mas com o dobro da RAM (8 GB vs. 16 GB ) e duas vezes o armazenamento (256 GB vs. 512 GB). Assim, não há dúvida de que os usuários estão pagando uma taxa premium pelo fator de forma conversível, pela tela táctil e pelo exclusivo SoC Kaby Lake-G do XPS 15 9575. Consultamos a Dell várias vezes sobre uma potencial versão Kaby Lake-R ou GeForce do conversível XPS, mas o foco no momento é apenas fornecer a melhor experiência possível com o Kaby Lake-G e o 9575 certamente atendeu às nossas expectativas nesse quesito.
As diferenças de preço e especificações são óbvias, mas e quanto a temperaturas, ruído e duração da bateria? Para nossa surpresa, o XPS 15 9575 funciona de forma mais fria, mais silenciosa e às vezes durante mais tempo que o XPS 15 9560 durante a navegação, processamento texto ou jogos. É uma conquista que vale a pena elogiar, pois o conversível XPS está no mesmo nível do XPS 15 em termos de potência de CPU e GPU, ao mesmo tempo em que é mais fino e possui uma bateria menor.
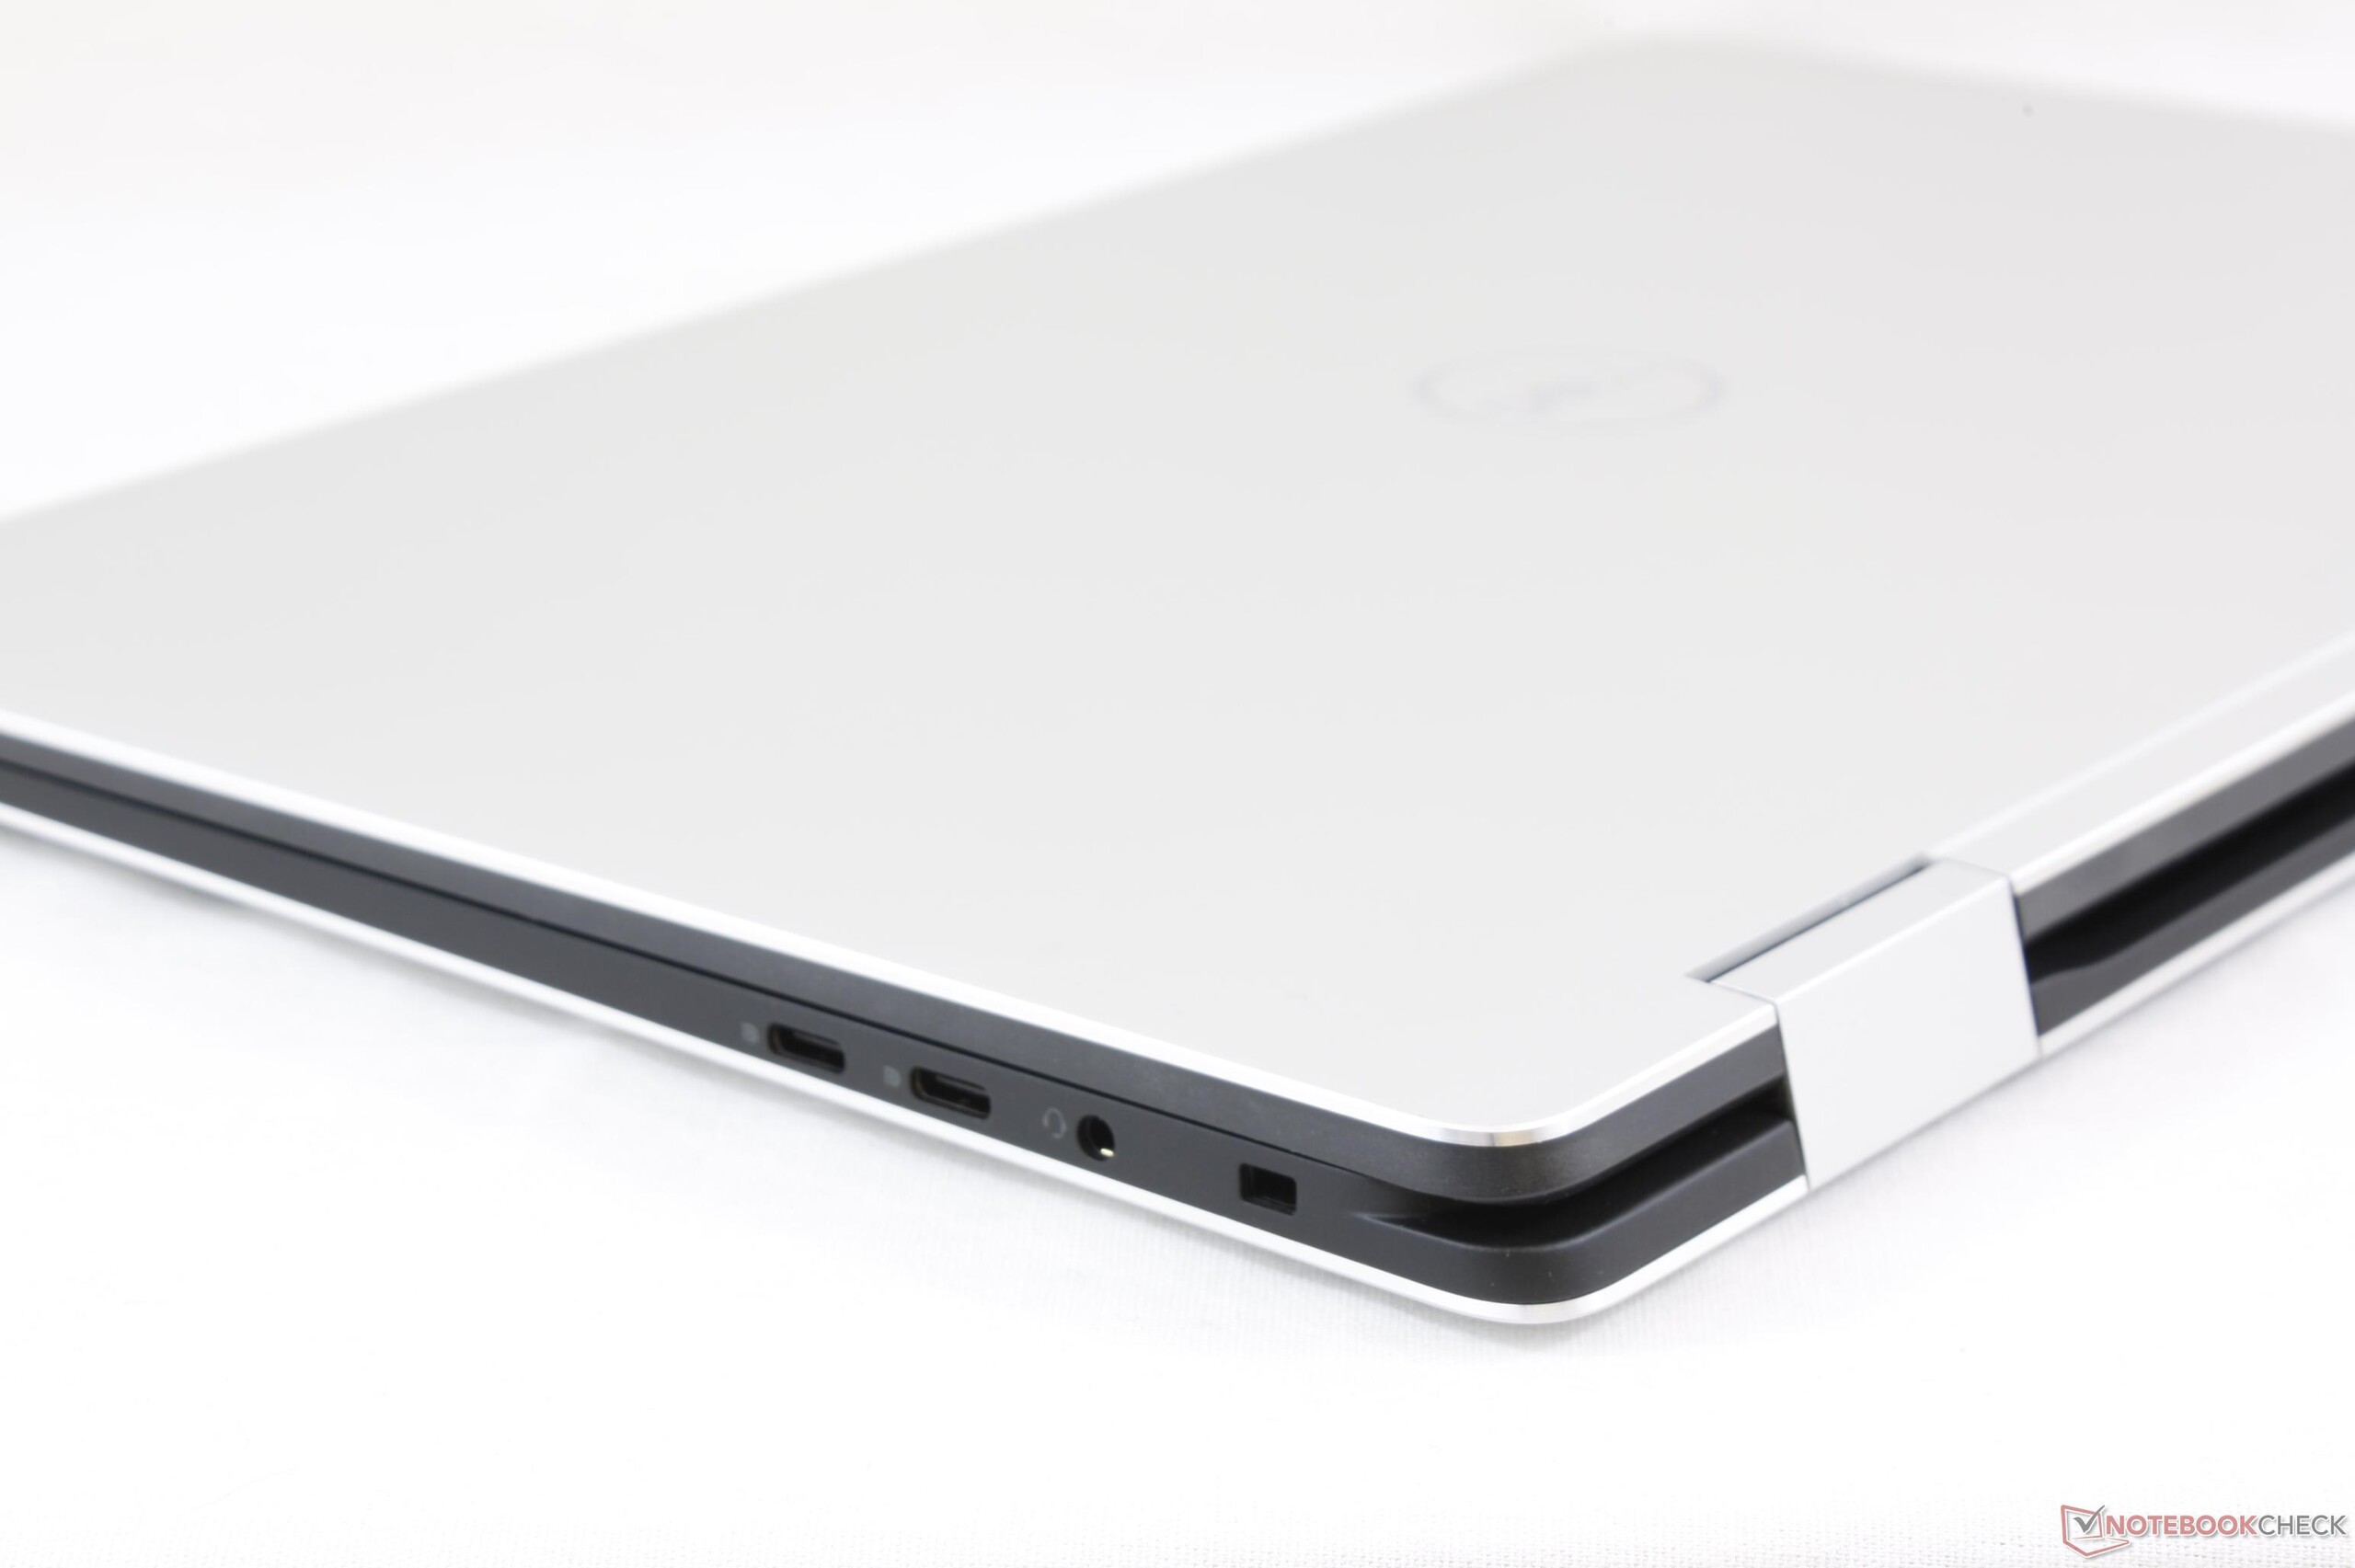
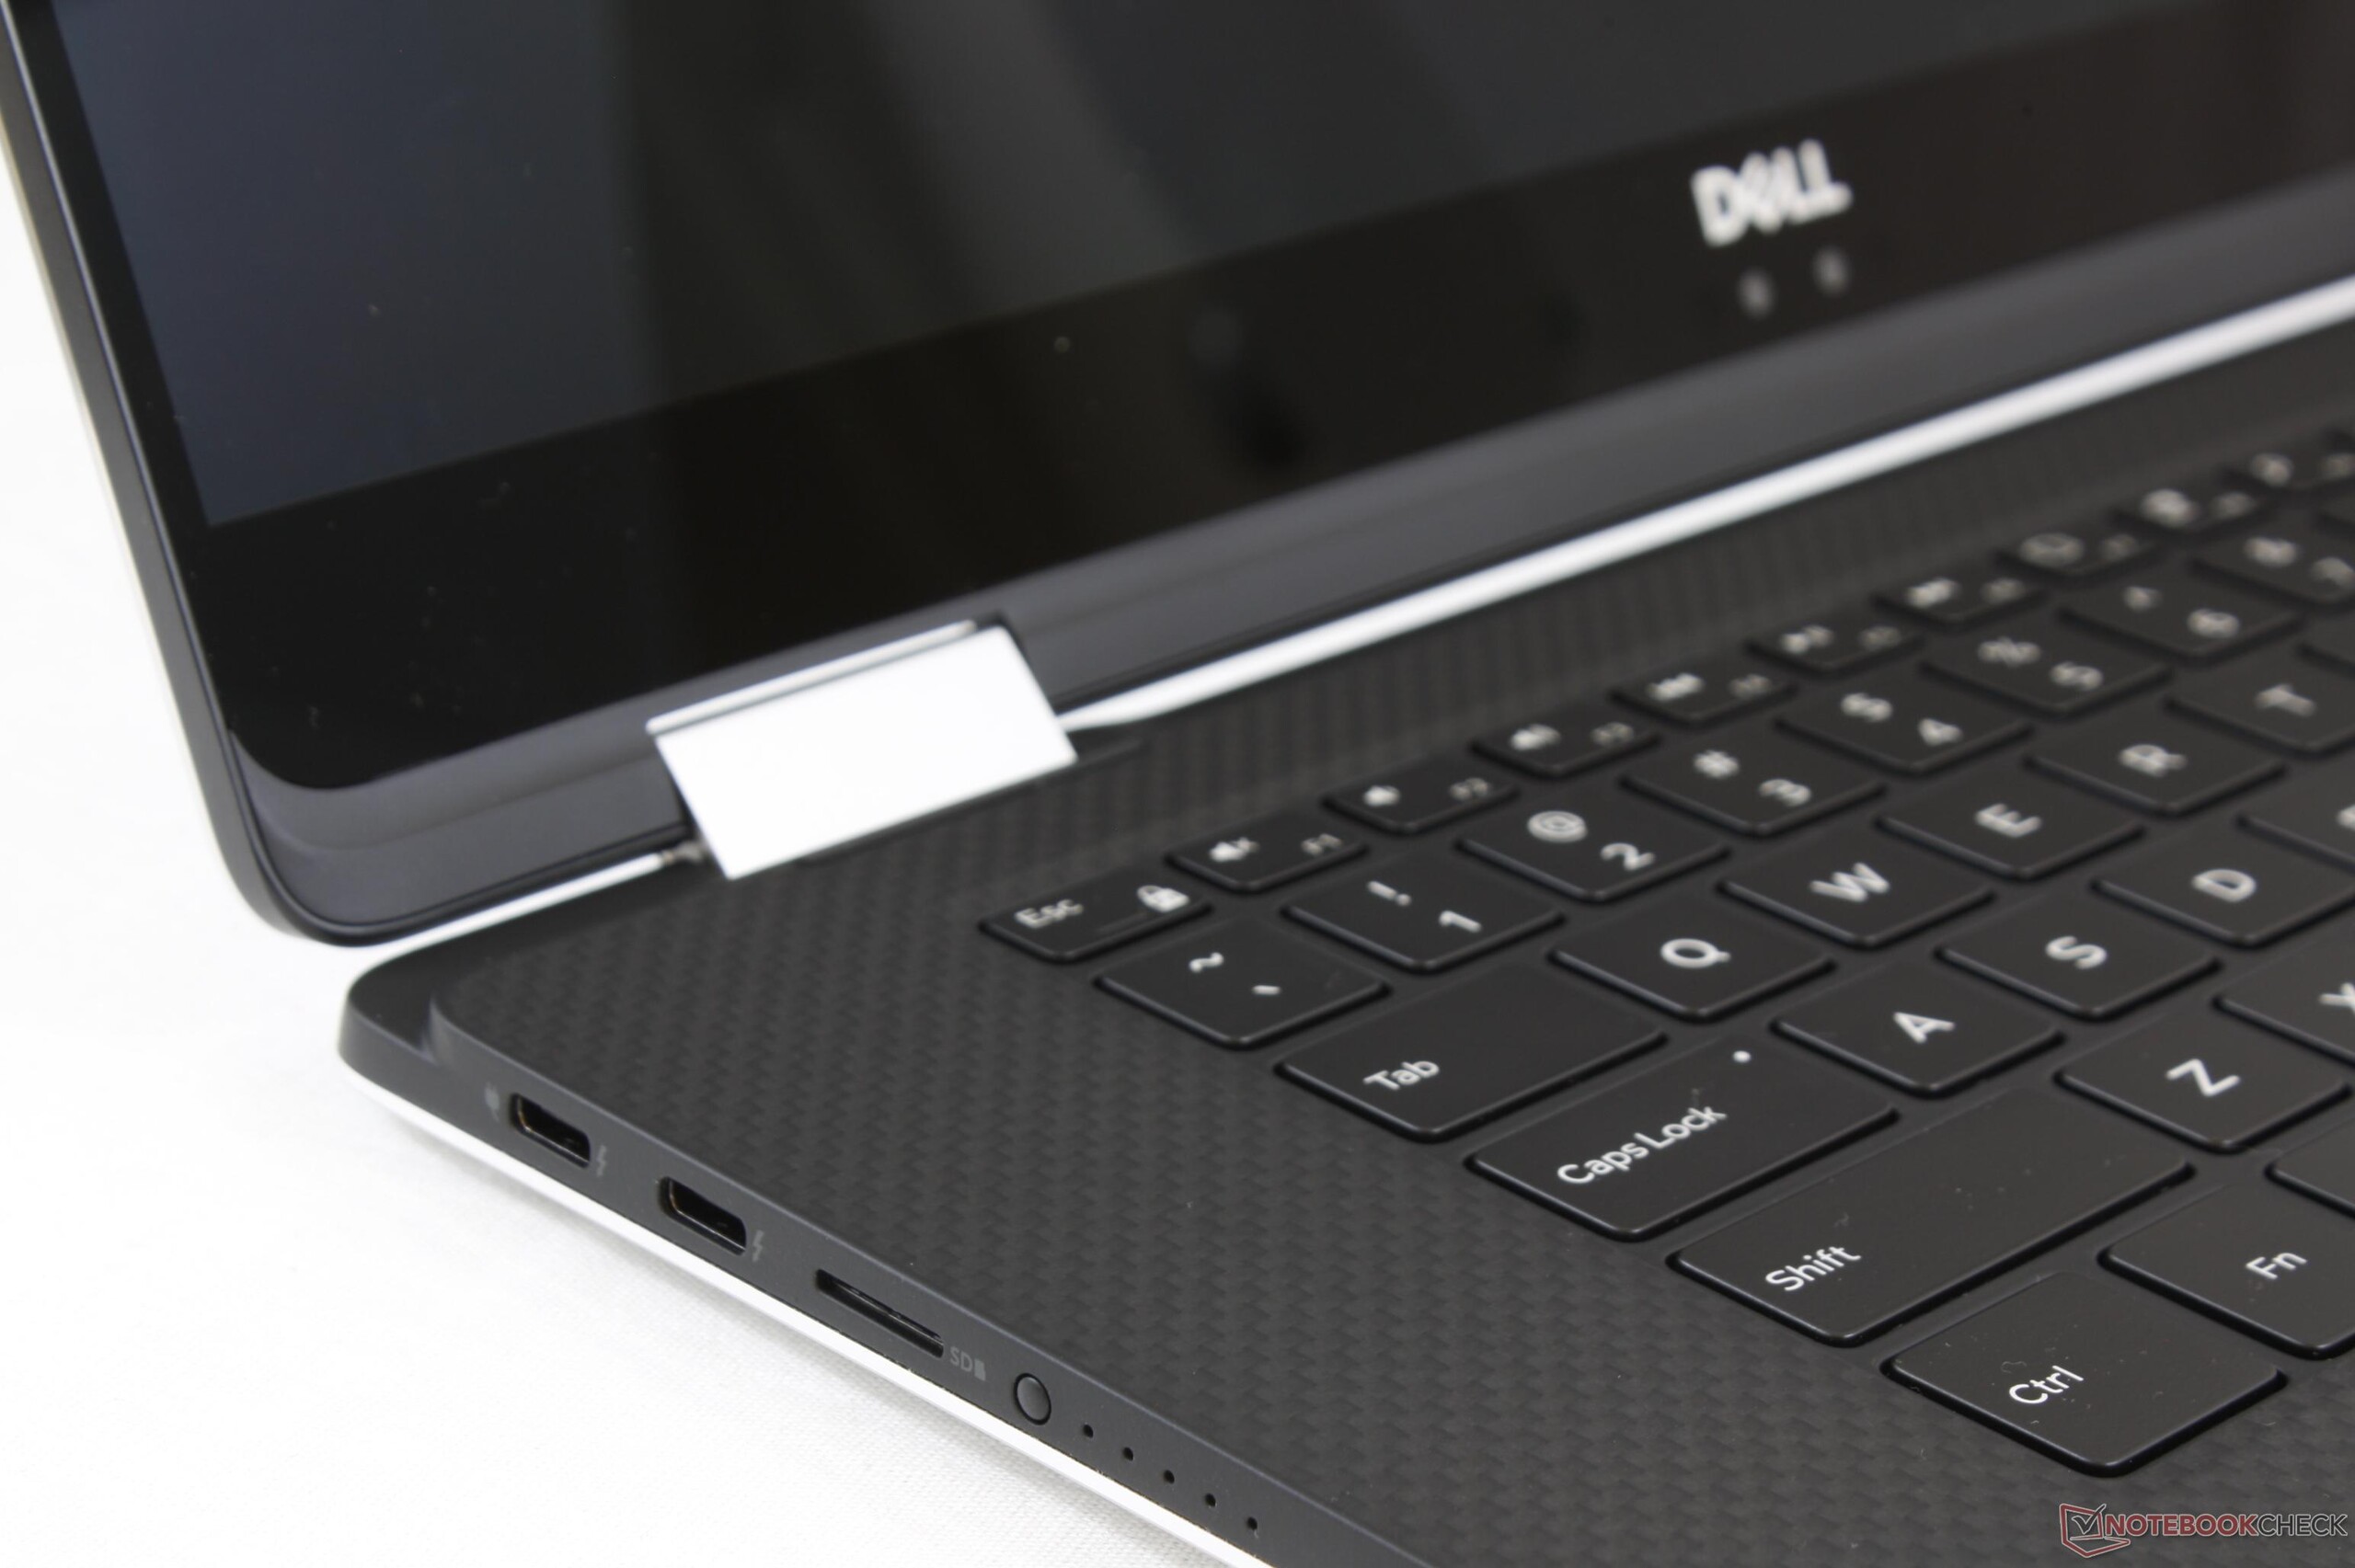
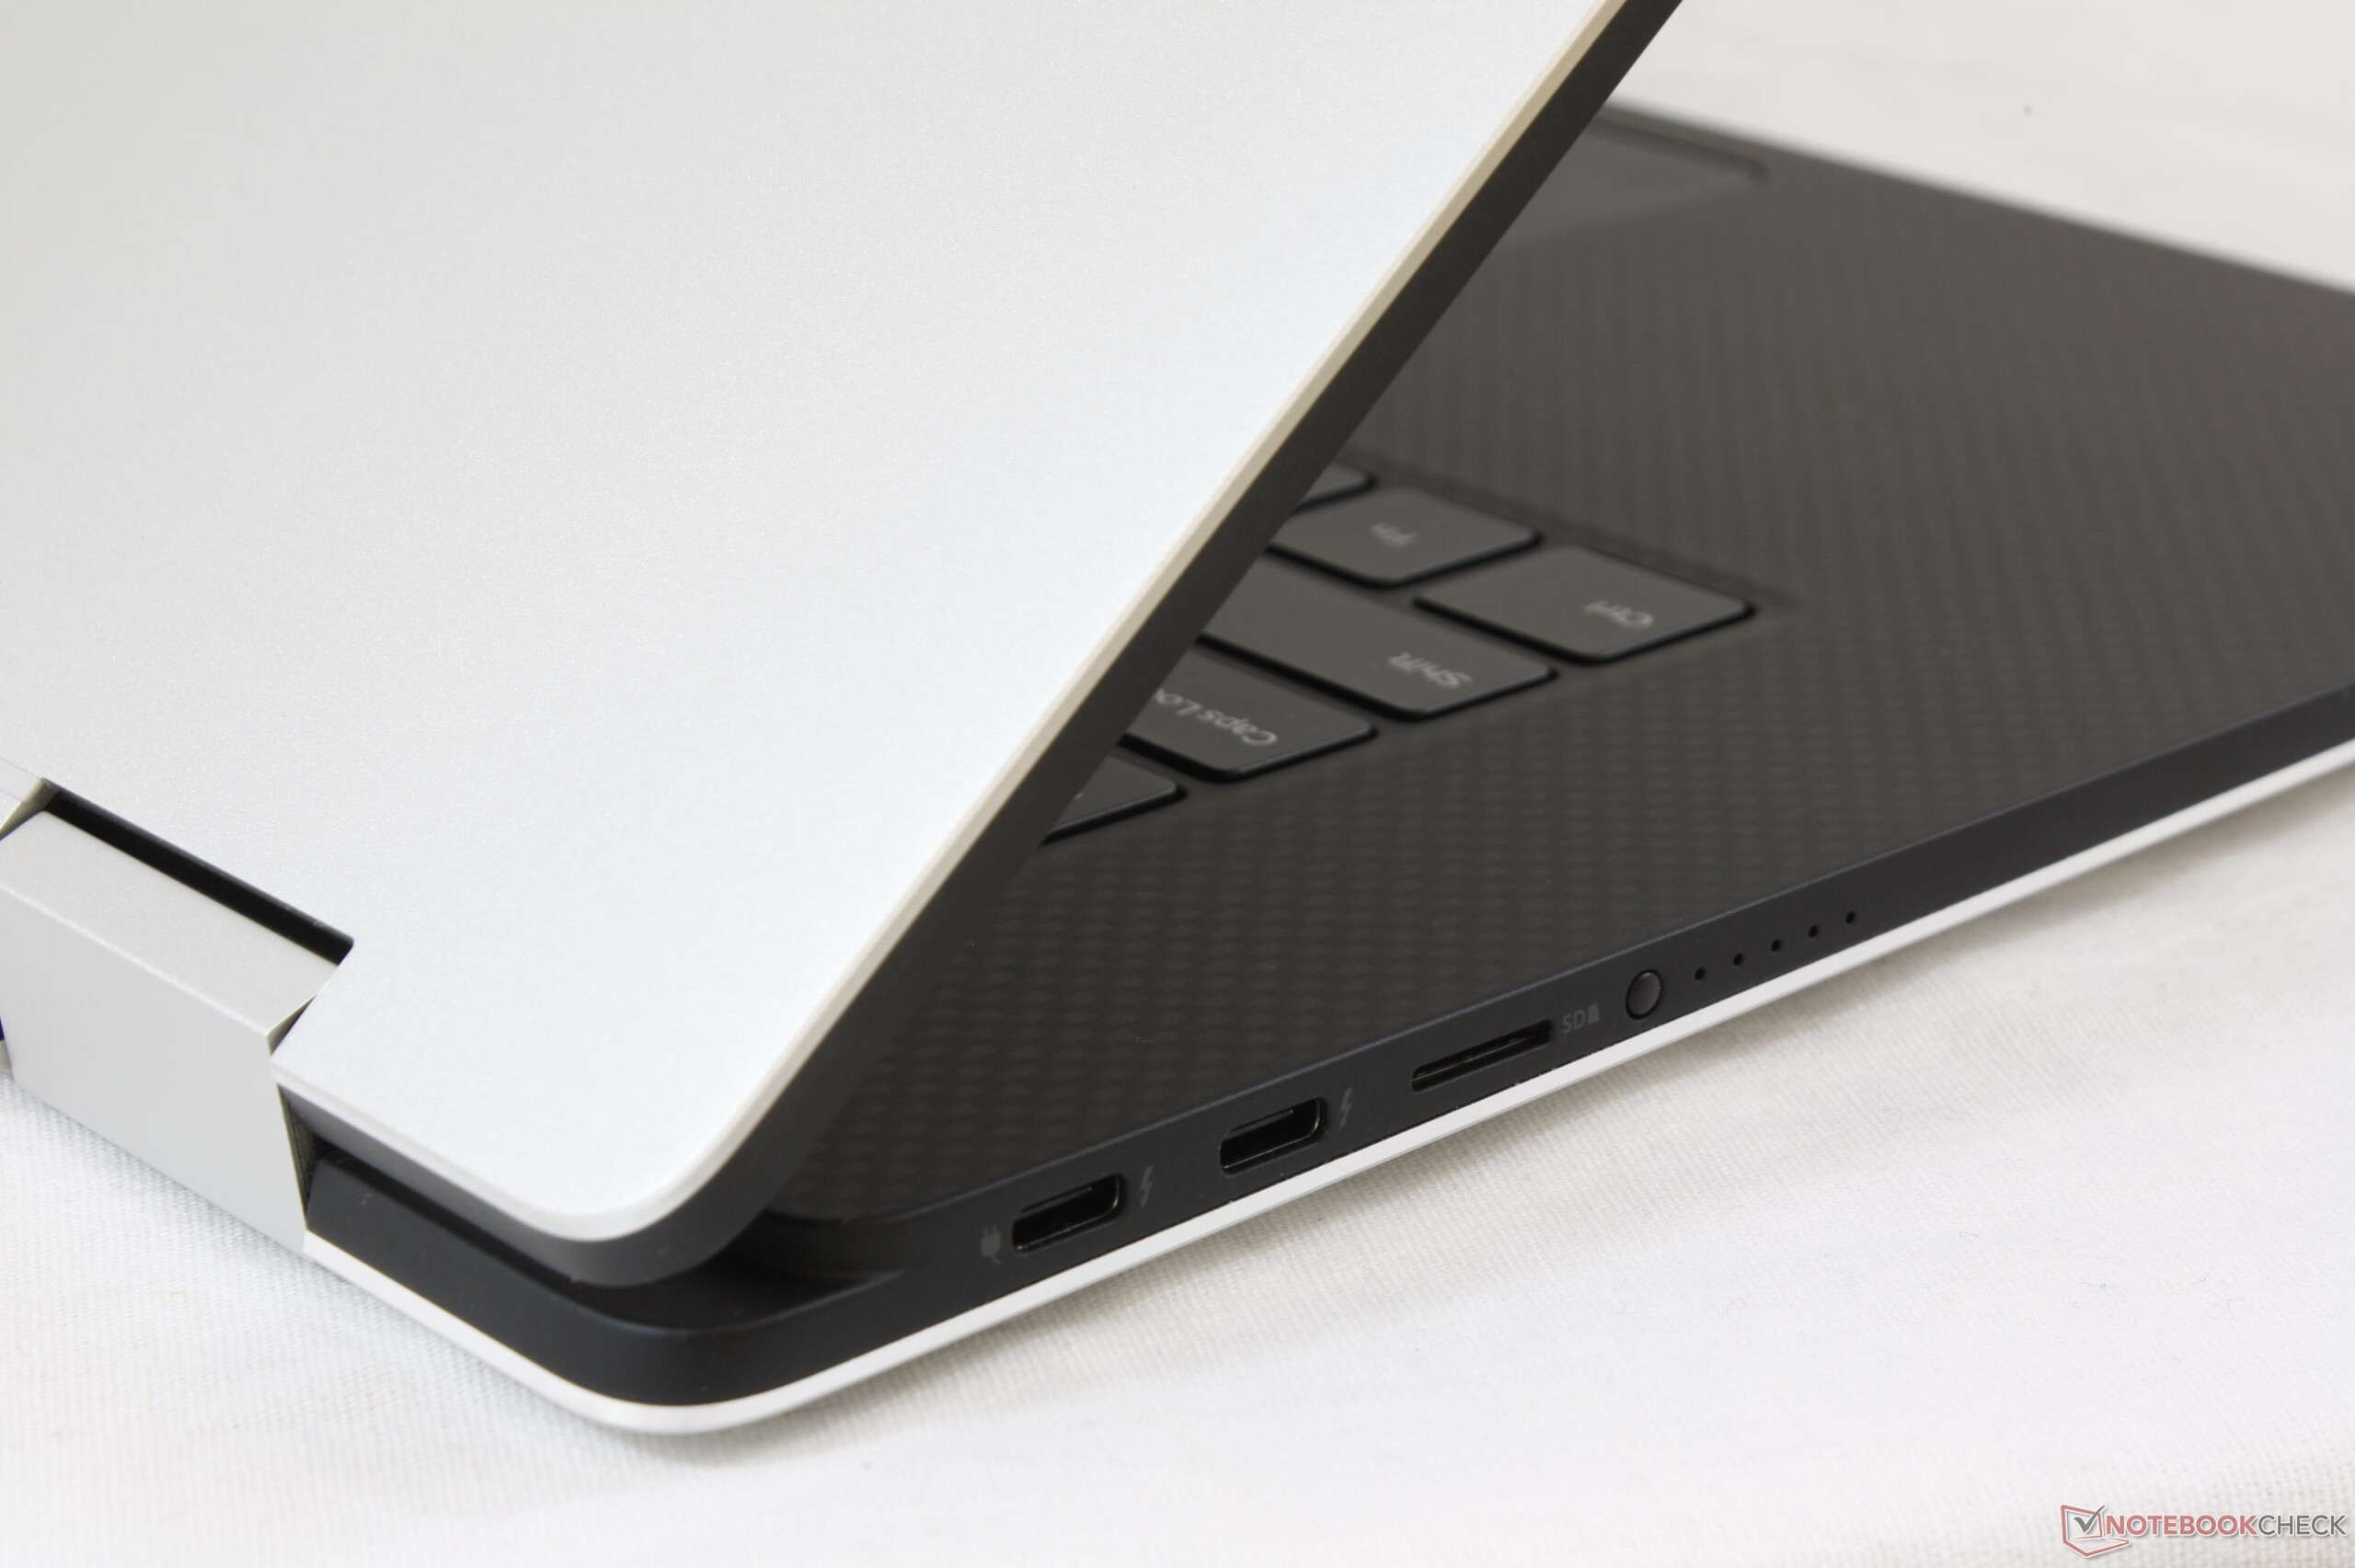
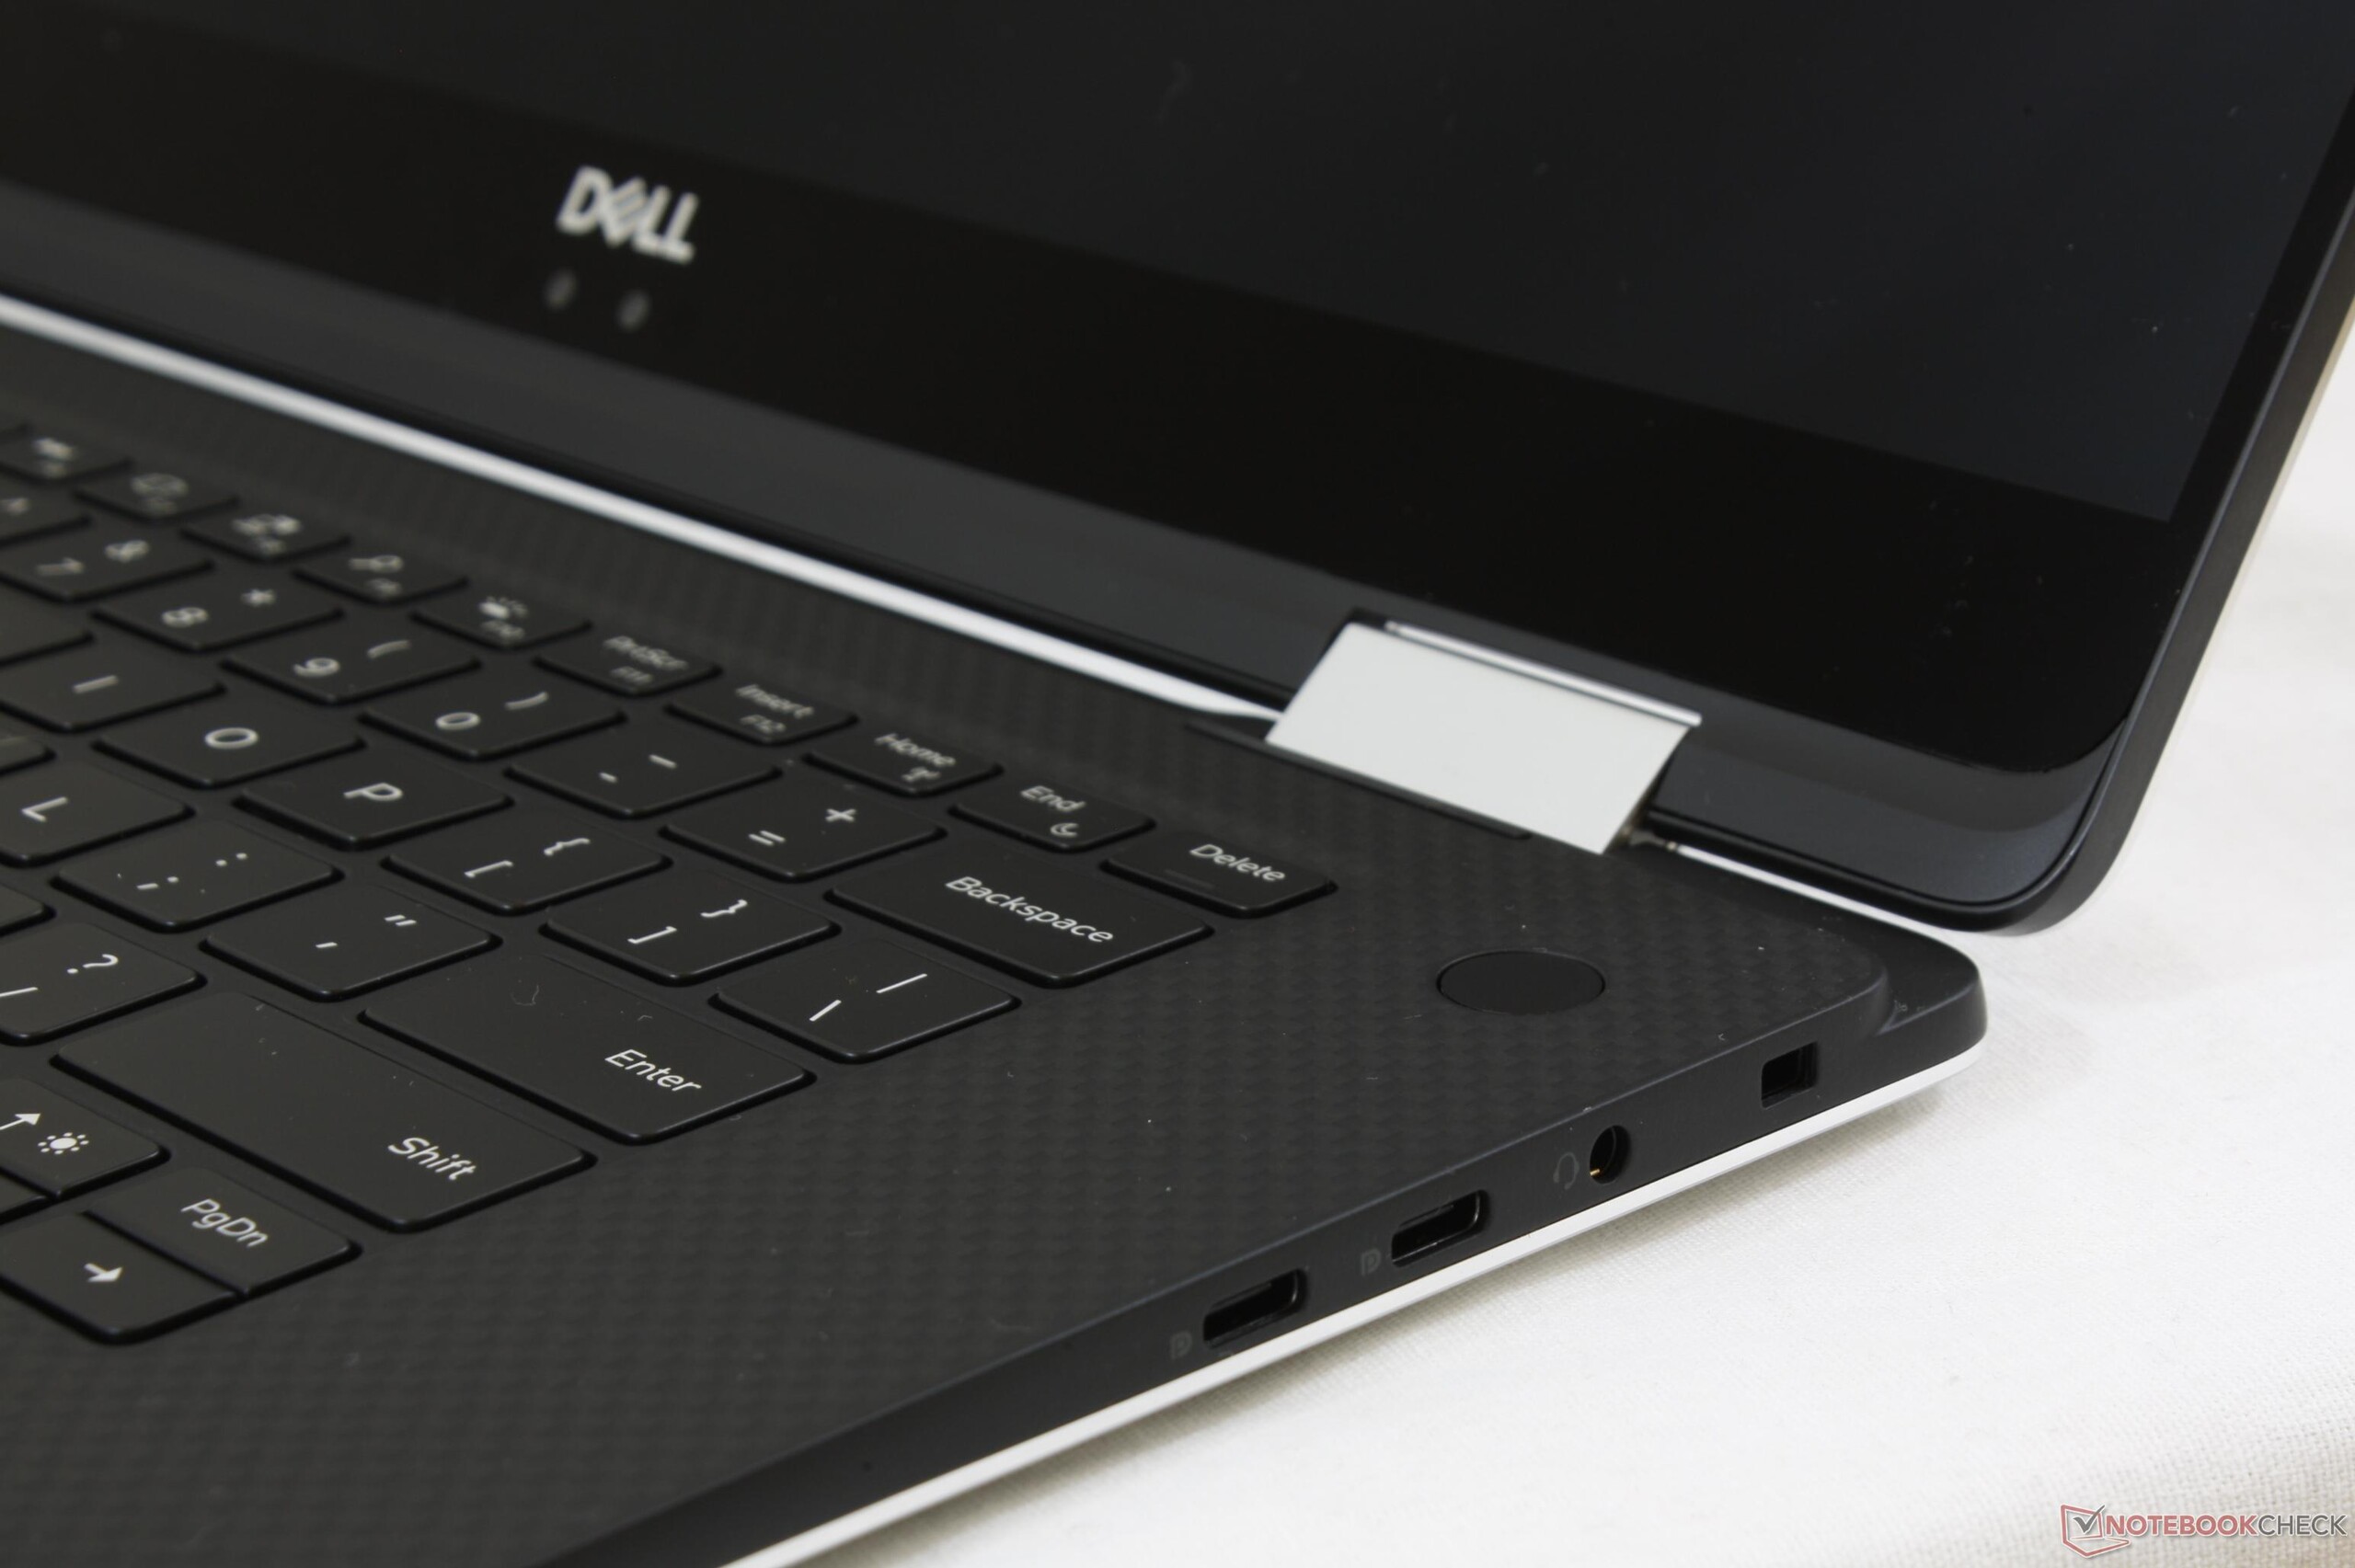
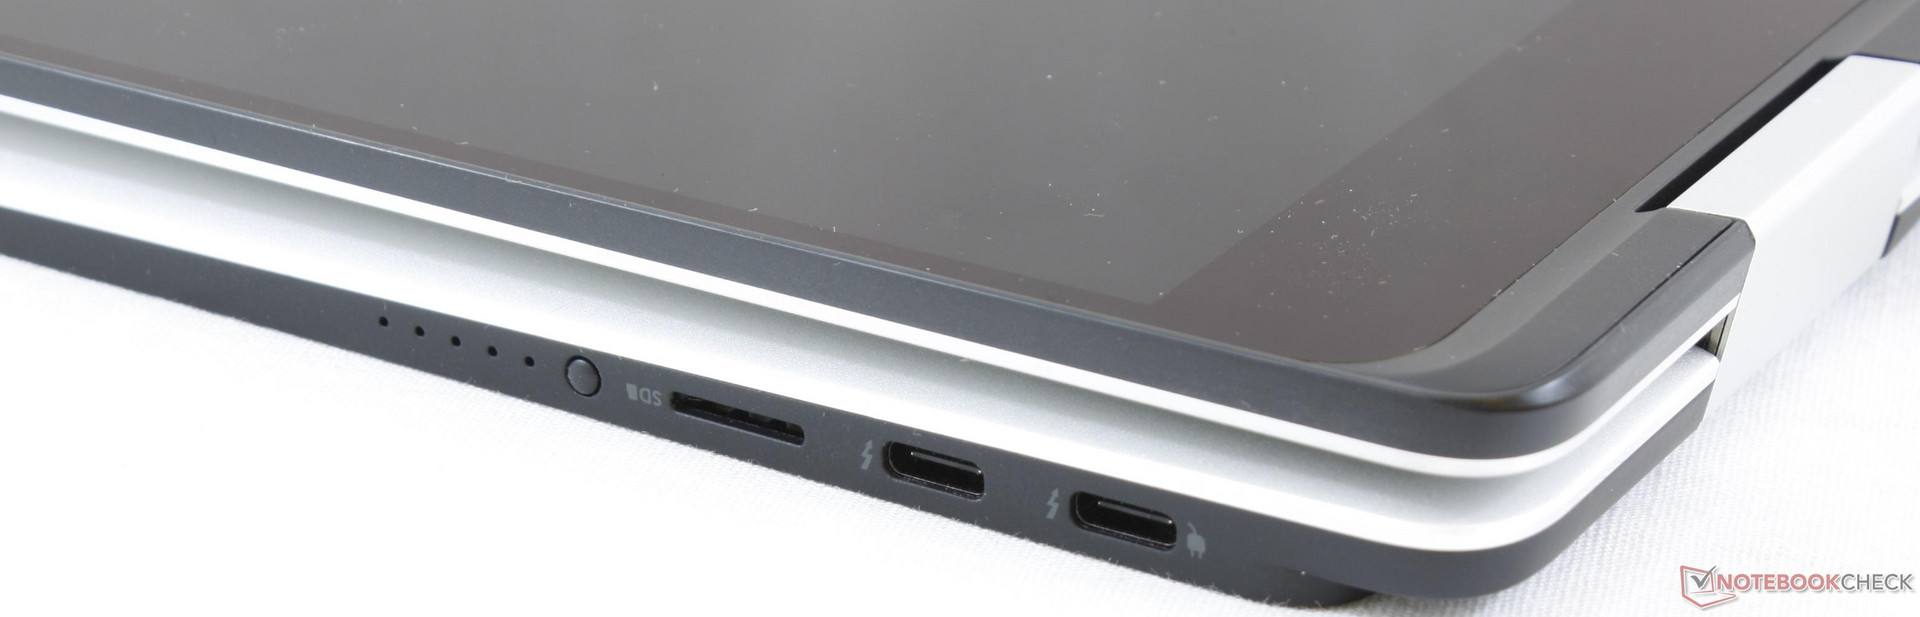
O teclado Maglev forçado é imprevisível. É uma mudança significativa em relação ao XPS 15 9560 e não funciona tão bem para as teclas de seta menores de tamanho médio ou teclas de função em comparação com as principais teclas QWERTY. Acreditamos que um teclado numérico integrado, como no 2018 Spectre x360 15 teria sido mauito mais útil para a produtividade. O "ghosting" moderado-pesado, confiança total no USB Type-C, presença de modulação por largura de pulso, peso pesado, trackpad esponjoso, RAM fixa, superfícies propensas a digitais e opções de armazenamento mais limitadas, completam a lista de desvantagens notáveis. Os recursos de jogos são bons, mas estão muito atrás da GTX 1050 em alguns títulos em que é necessária uma otimização adicional.
O mais recente conversível XPS da Dell é o lar de muitas novidades e quase todas são home runs. A Kaby Lake-G é comparável à GeForce GTX 1050 e ao Core i7-7700HQ, sendo mais frio e silencioso que o XPS 15 9560. Por outro lado, as teclas Maglev são um saco misto e o SSD NVMe Toshiba é geralmente mais lento que um Samsung PM961 equivalente. Esteja preparado para carregar adaptadores USB Type-C onde quer que você vá, e um pano de limpeza para manter essas teclas escuras livres de gordura.
Dell XPS 15 9575 i5-8305G
- 04/22/2018 v6 (old)
Allen Ngo
Price comparison
