Breve Análise do Portátil Acer TravelMate P2410 (i7-8550U, MX130)
| SD Card Reader | |
| average JPG Copy Test (av. of 3 runs) | |
| HP Spectre x360 15-ch011nr (Toshiba Exceria Pro SDXC 64 GB UHS-II) | |
| Dell XPS 13 i7-8550U | |
| Lenovo ThinkPad T480-20L6S01V00 (Toshiba Exceria Pro SDXC 64 GB UHS-II) | |
| Média da turma Office (19.8 - 198.5, n=22, últimos 2 anos) | |
| Asus VivoBook 15 F510UF-ES71 (Toshiba Exceria Pro SDXC 64 GB UHS-II) | |
| Acer TravelMate P2510-M-51ZQ (Toshiba Exceria Pro SDXC 64 GB UHS-II) | |
| Acer TravelMate 2410-G2-MG-82E6 (Toshiba Exceria Pro SDXC 64 GB UHS-II) | |
| maximum AS SSD Seq Read Test (1GB) | |
| HP Spectre x360 15-ch011nr (Toshiba Exceria Pro SDXC 64 GB UHS-II) | |
| Dell XPS 13 i7-8550U | |
| Lenovo ThinkPad T480-20L6S01V00 (Toshiba Exceria Pro SDXC 64 GB UHS-II) | |
| Média da turma Office (27.4 - 249, n=21, últimos 2 anos) | |
| Asus VivoBook 15 F510UF-ES71 (Toshiba Exceria Pro SDXC 64 GB UHS-II) | |
| Acer TravelMate P2510-M-51ZQ (Toshiba Exceria Pro SDXC 64 GB UHS-II) | |
| Acer TravelMate 2410-G2-MG-82E6 (Toshiba Exceria Pro SDXC 64 GB UHS-II) | |
| |||||||||||||||||||||||||
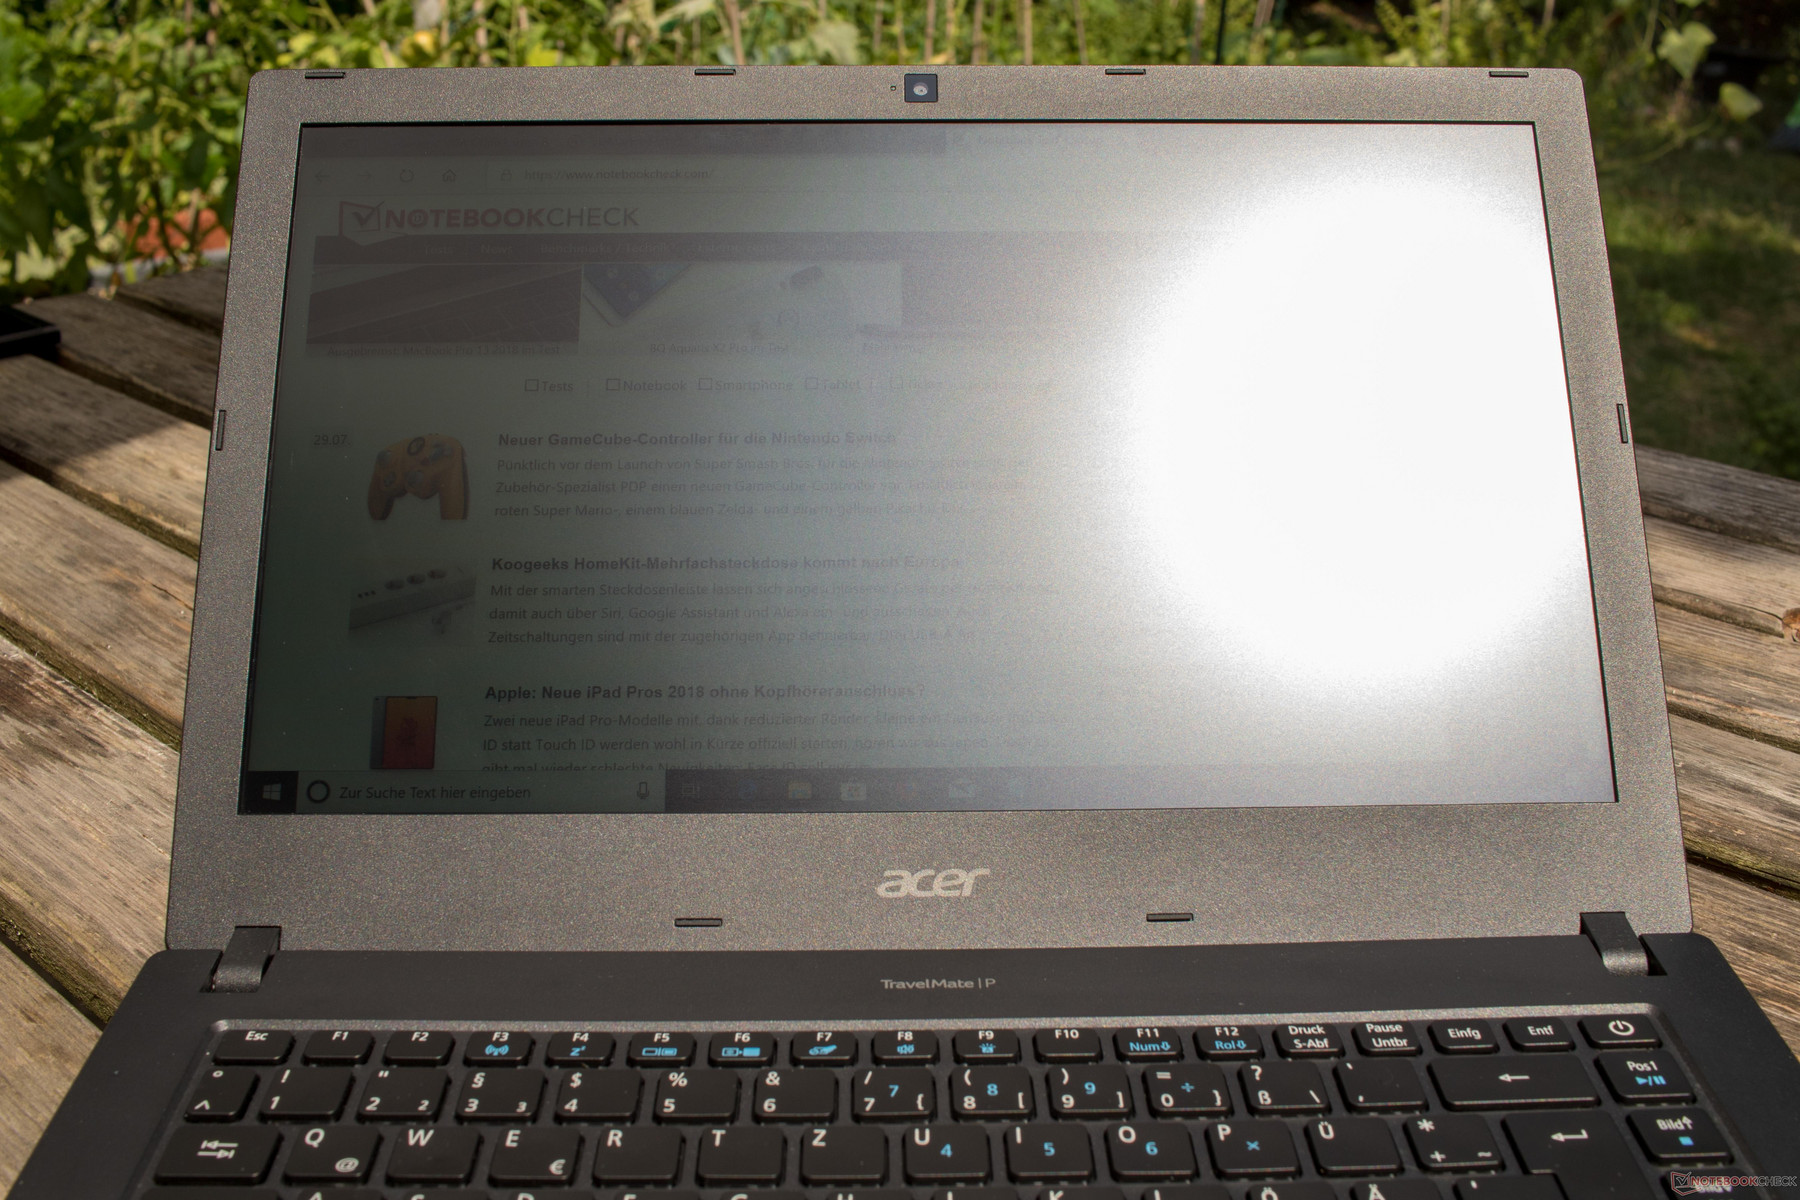
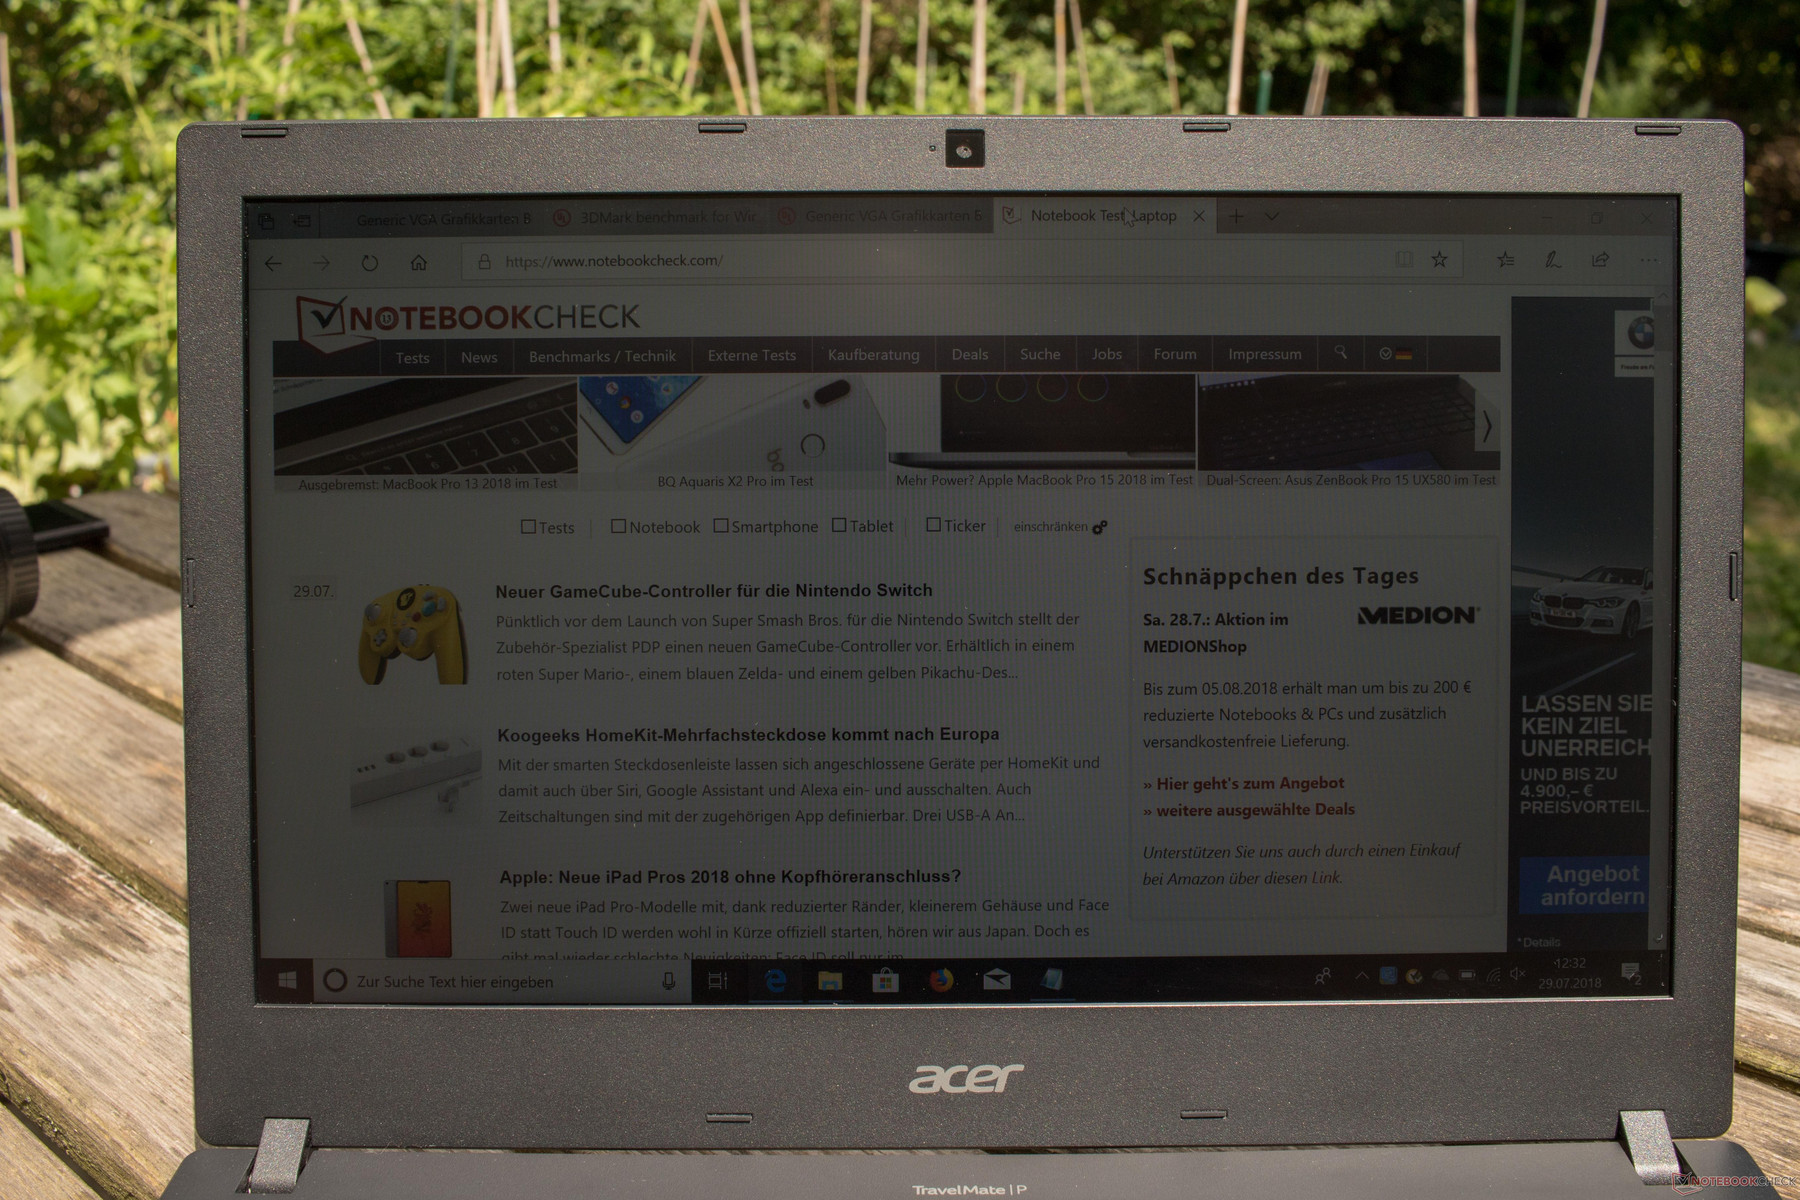
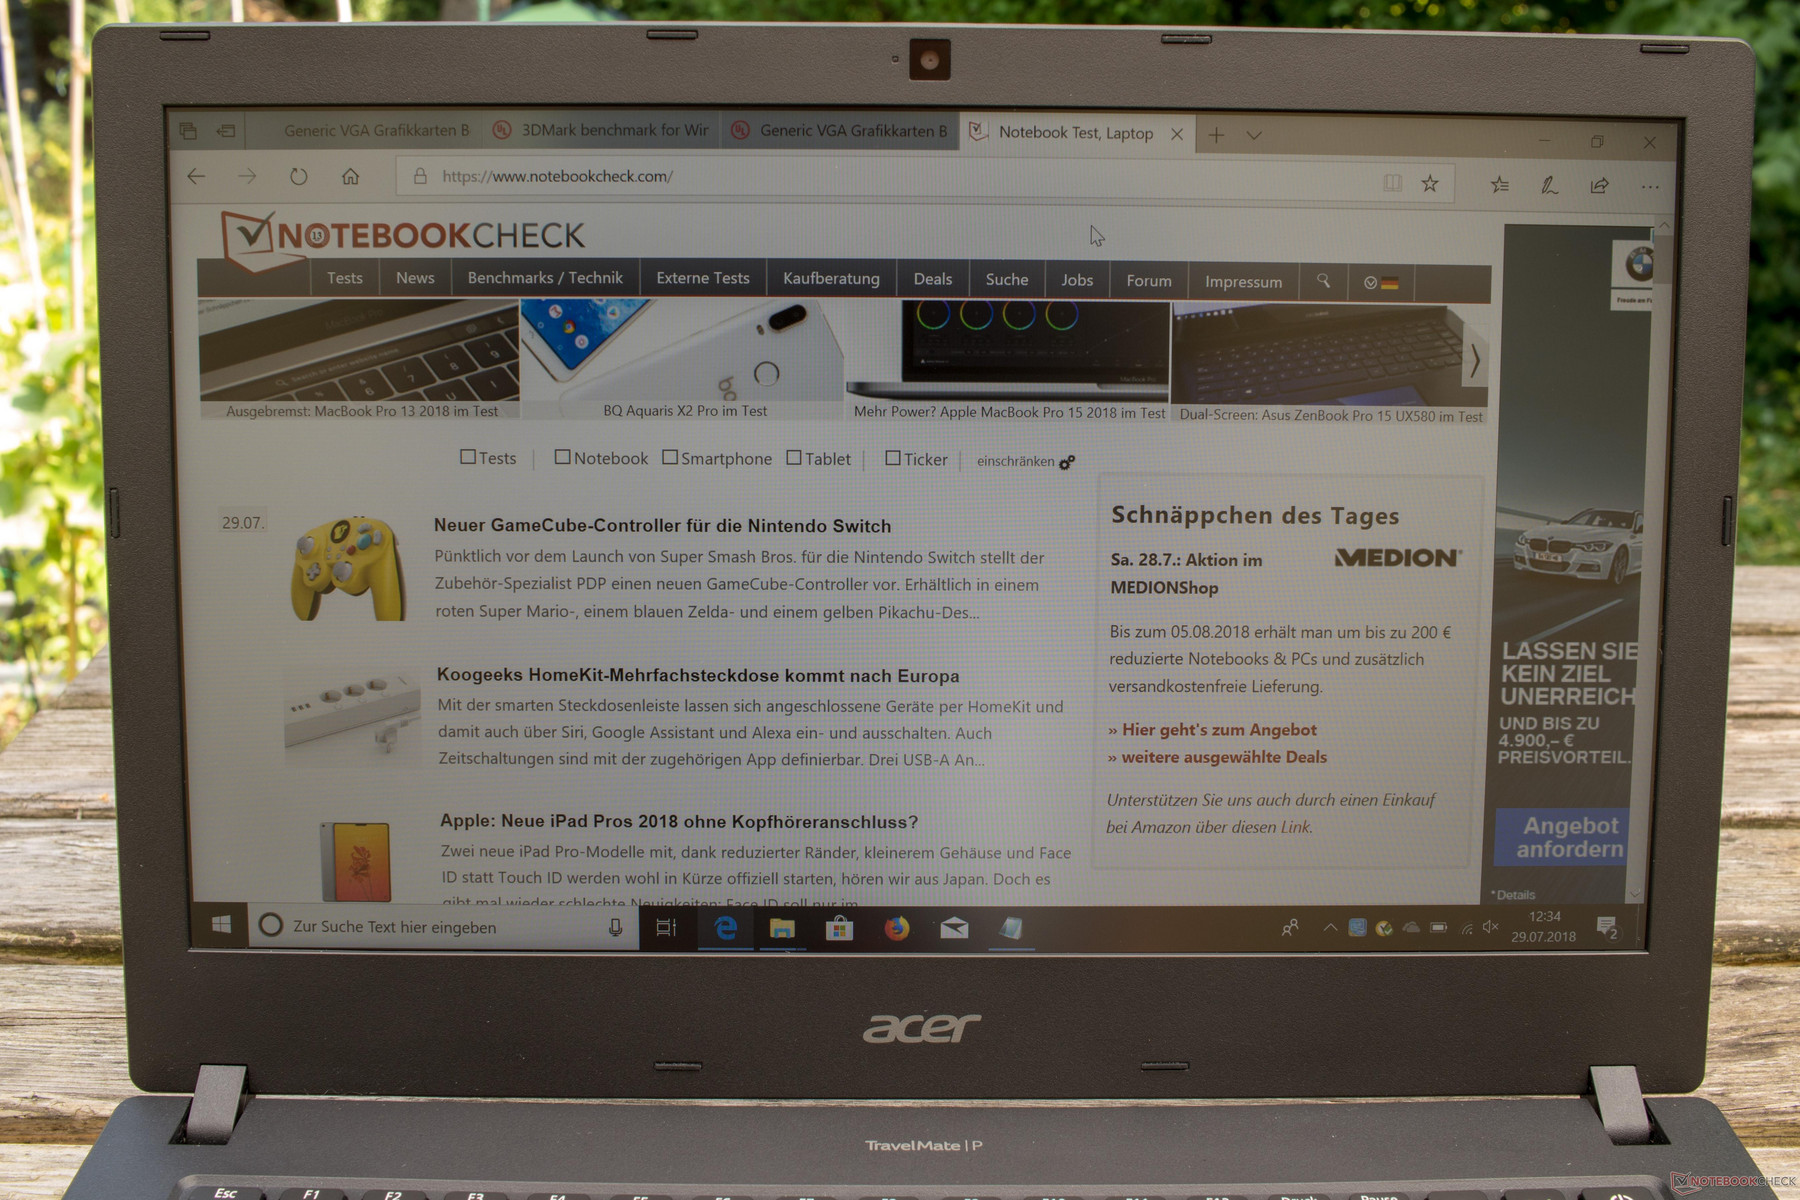
iluminação: 85 %
iluminação com acumulador: 265 cd/m²
Contraste: 716:1 (Preto: 0.37 cd/m²)
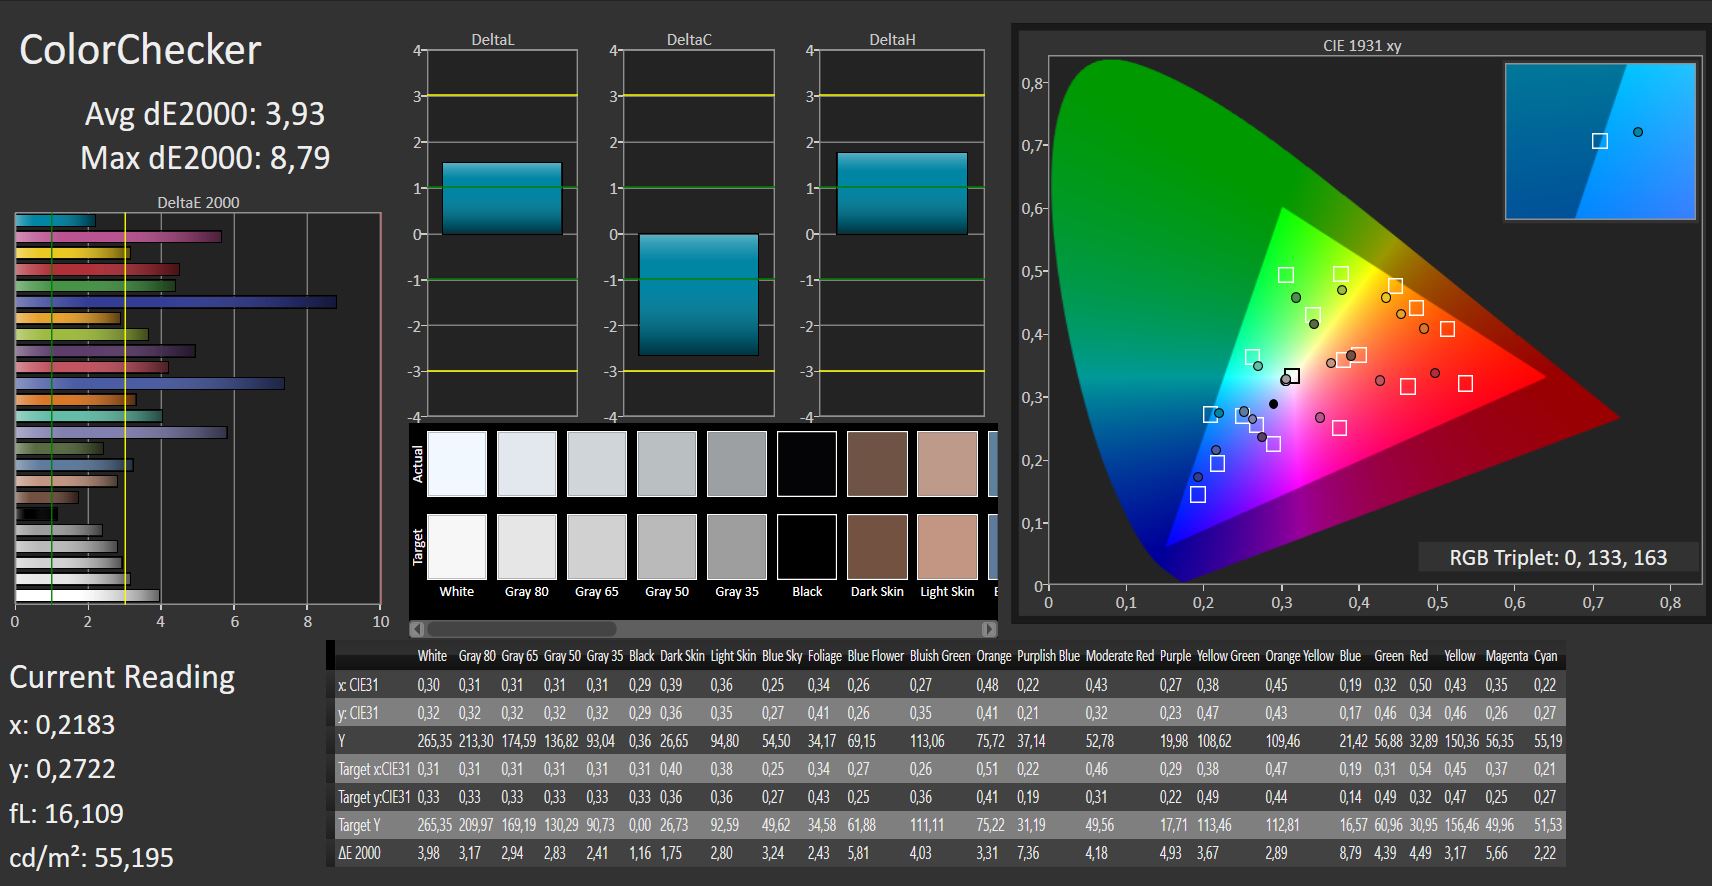
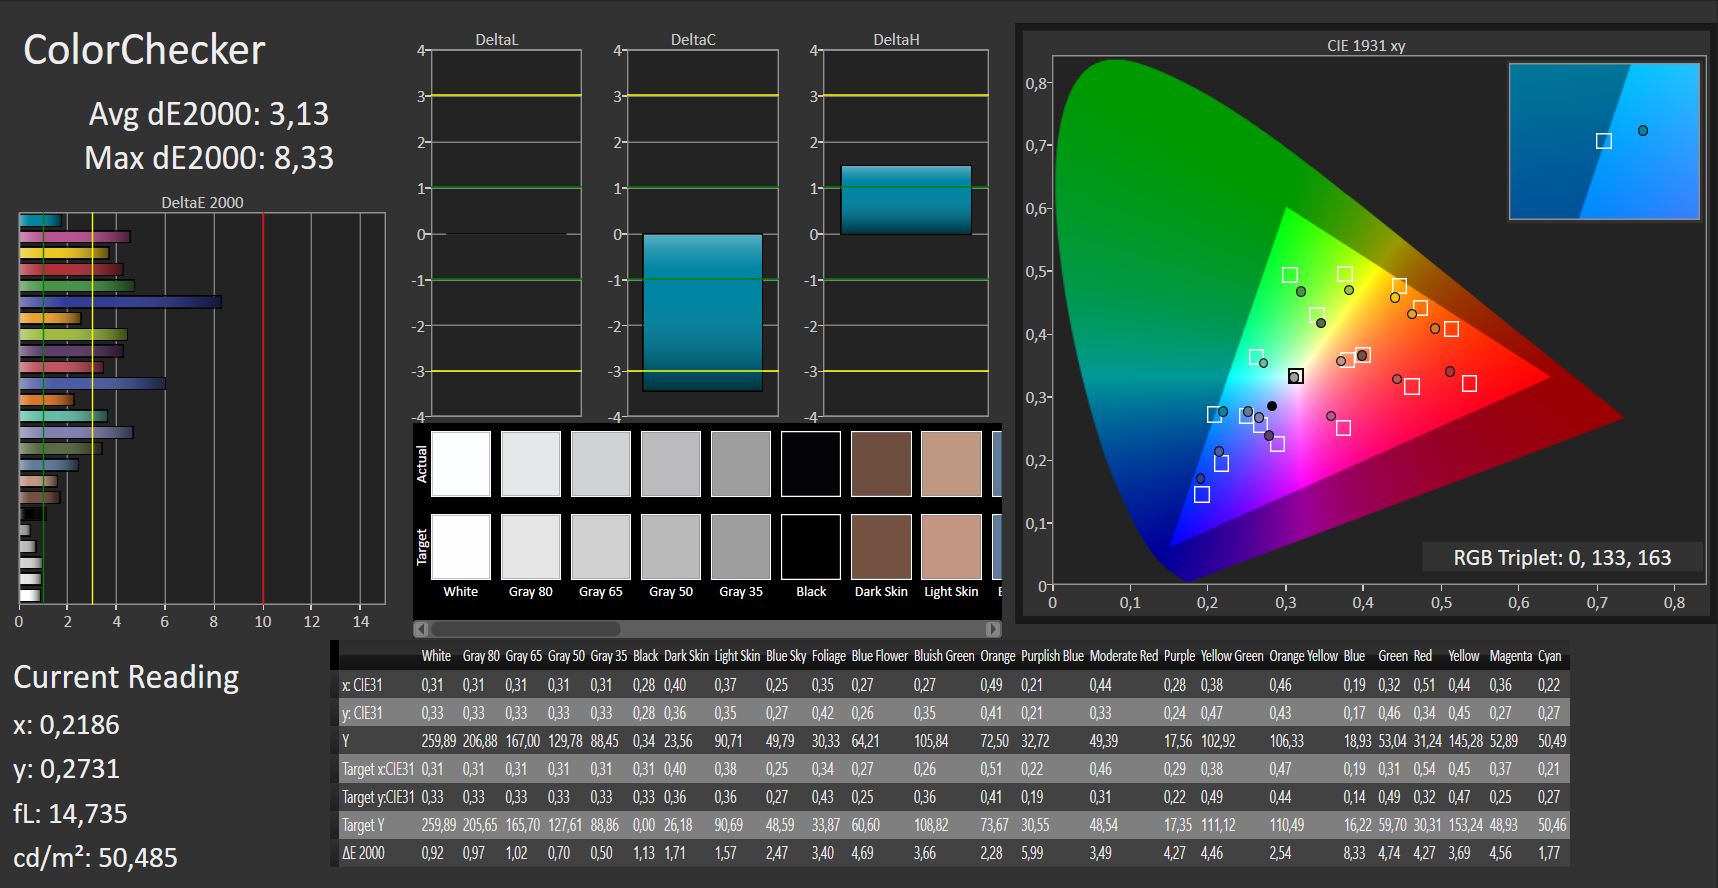
ΔE ColorChecker Calman: 3.93 | ∀{0.5-29.43 Ø4.71}
calibrated: 3.13
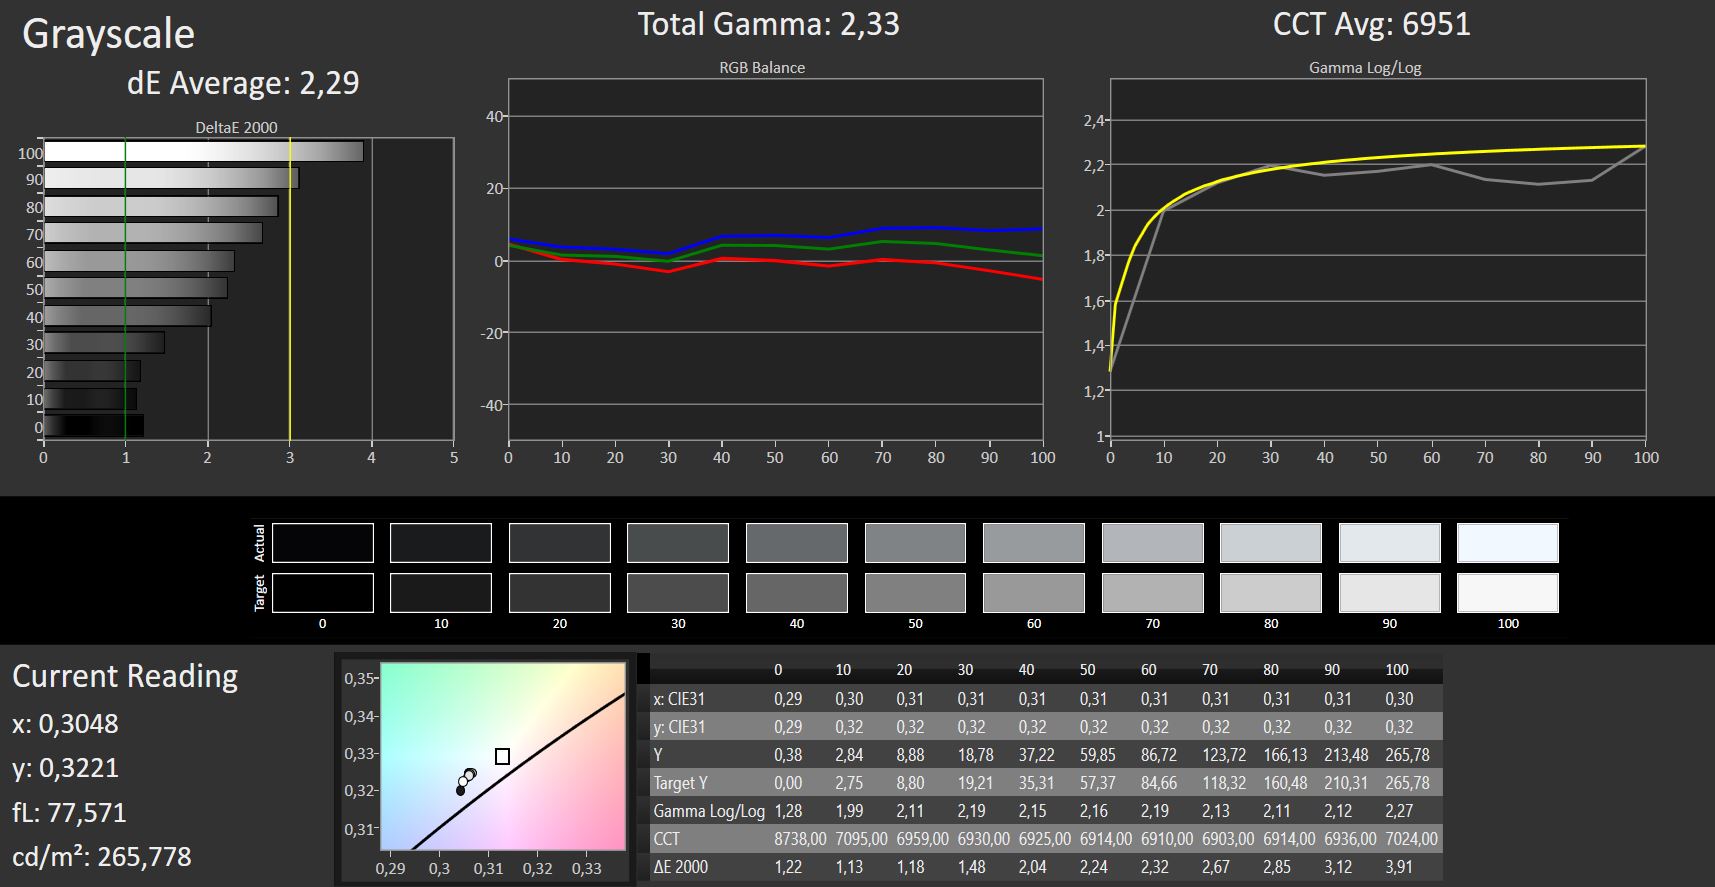
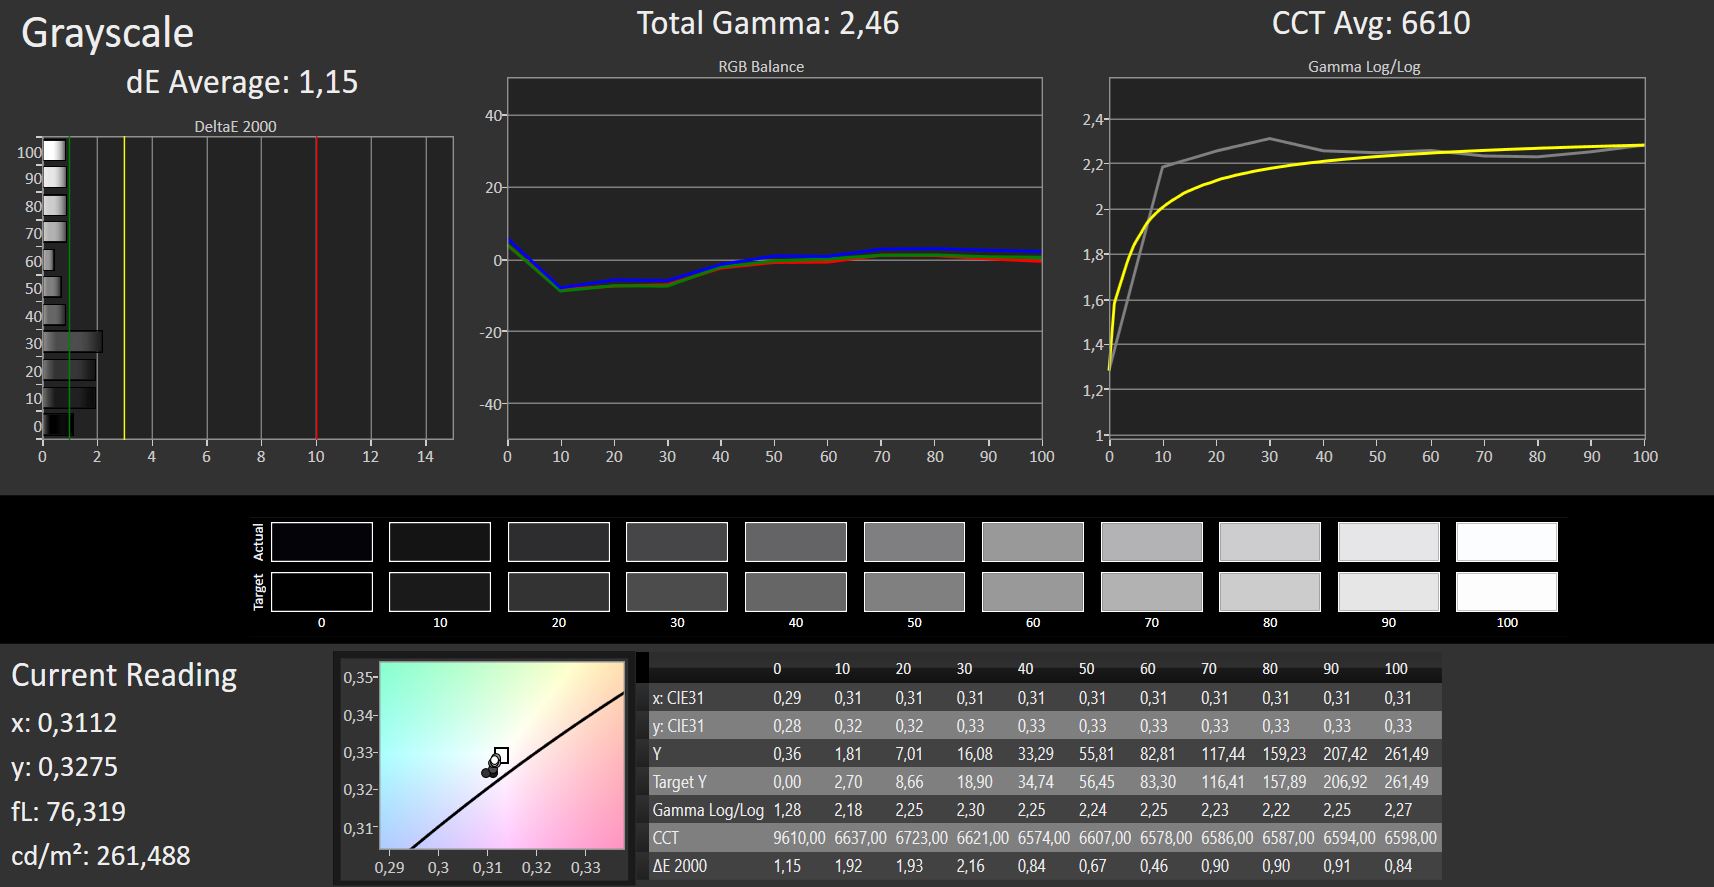
ΔE Greyscale Calman: 2.29 | ∀{0.09-98 Ø4.96}
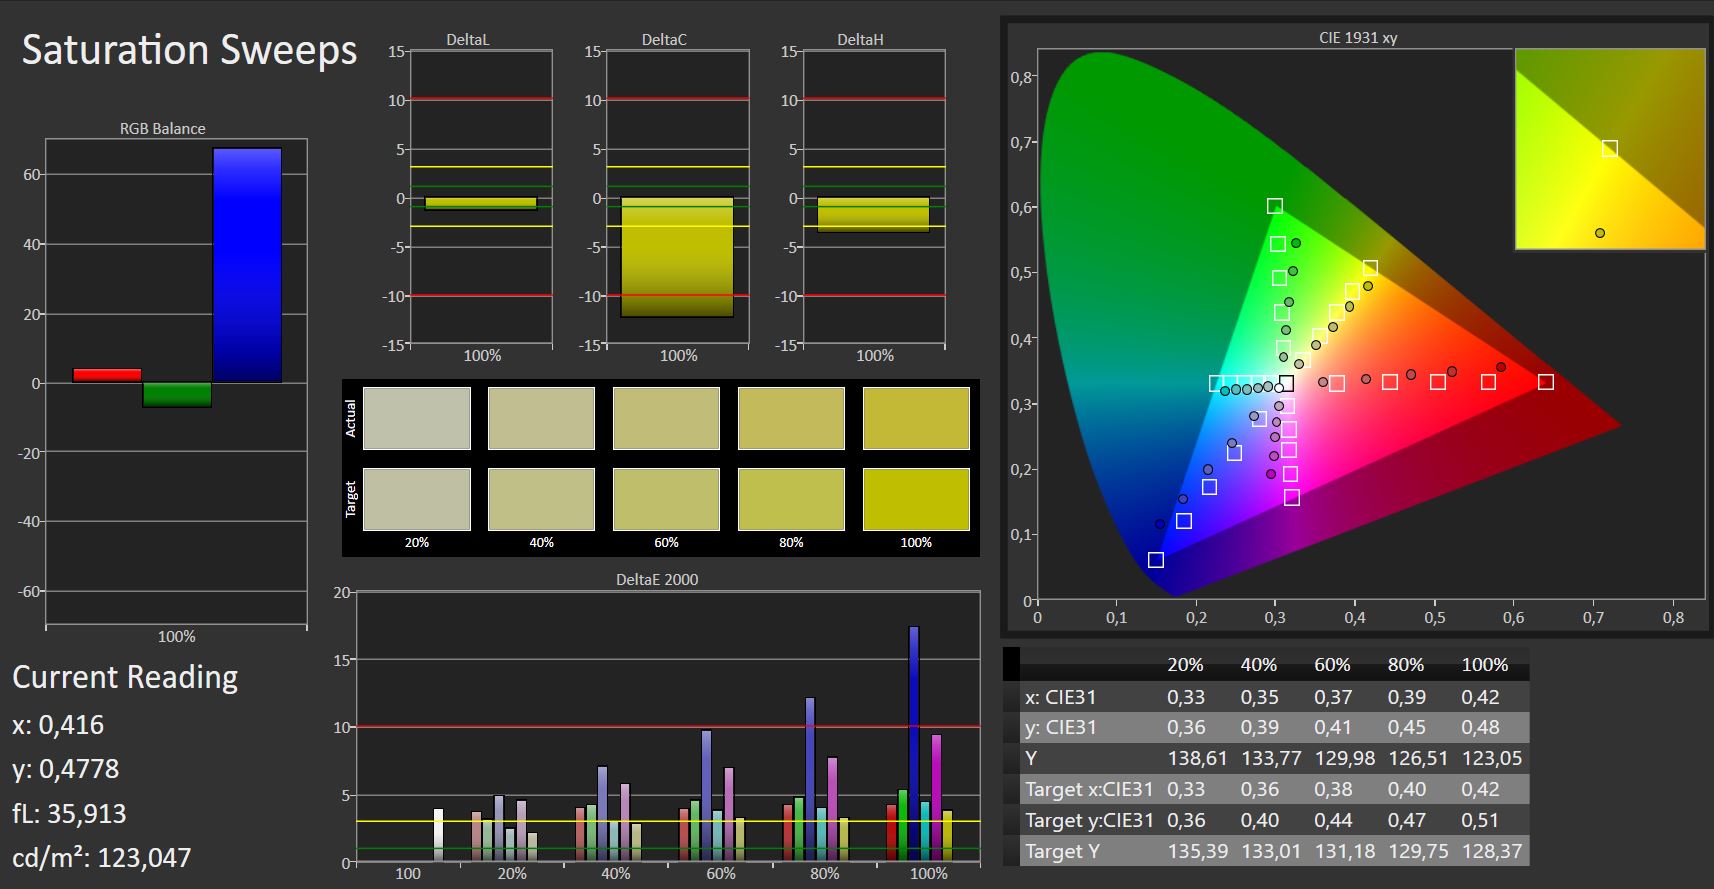
60% sRGB (Argyll 1.6.3 3D)
38% AdobeRGB 1998 (Argyll 1.6.3 3D)
41.65% AdobeRGB 1998 (Argyll 3D)
60.4% sRGB (Argyll 3D)
40.28% Display P3 (Argyll 3D)
Gamma: 2.33
CCT: 6951 K
| Acer TravelMate 2410-G2-MG-82E6 CMN N140HCA-EAB, , 1920x1080, 14" | Acer TravelMate P2510-M-51ZQ Chi Mei CMN15D3 / N156HCE-EAA, , 1920x1080, 15.6" | Lenovo IdeaPad 530s-14IKB AUO B140QAN02.3, , 2560x1440, 14" | Asus VivoBook 15 F510UF-ES71 LG Philips LP156WF9-SPK2, , 1920x1080, 15.6" | Lenovo ThinkPad T480-20L6S01V00 Lenovo LP140WF6-SPB7, , 1920x1080, 14" | HP Spectre x360 15-ch011nr BOE0730, , 3840x2160, 15.6" | |
|---|---|---|---|---|---|---|
| Display | 5% | 60% | -2% | -3% | 60% | |
| Display P3 Coverage (%) | 40.28 | 42.44 5% | 65.5 63% | 39.35 -2% | 39.24 -3% | 68.5 70% |
| sRGB Coverage (%) | 60.4 | 63.2 5% | 96.2 59% | 59.2 -2% | 58.8 -3% | 90.7 50% |
| AdobeRGB 1998 Coverage (%) | 41.65 | 43.94 5% | 66.1 59% | 40.65 -2% | 40.56 -3% | 66.3 59% |
| Response Times | -33% | -51% | 9% | -4% | -14% | |
| Response Time Grey 50% / Grey 80% * (ms) | 34 ? | 45 ? -32% | 58.4 ? -72% | 27.2 ? 20% | 35.6 ? -5% | 38 ? -12% |
| Response Time Black / White * (ms) | 24 ? | 32 ? -33% | 31.2 ? -30% | 24.8 ? -3% | 24.8 ? -3% | 27.6 ? -15% |
| PWM Frequency (Hz) | 25000 ? | 25000 ? | 943 ? | |||
| Screen | -17% | 1% | -18% | -14% | -8% | |
| Brightness middle (cd/m²) | 265 | 215 -19% | 311 17% | 257 -3% | 307 16% | 329.3 24% |
| Brightness (cd/m²) | 239 | 198 -17% | 293 23% | 246 3% | 295 23% | 316 32% |
| Brightness Distribution (%) | 85 | 78 -8% | 85 0% | 89 5% | 90 6% | 84 -1% |
| Black Level * (cd/m²) | 0.37 | 0.32 14% | 0.2 46% | 0.34 8% | 0.25 32% | 0.31 16% |
| Contrast (:1) | 716 | 672 -6% | 1555 117% | 756 6% | 1228 72% | 1062 48% |
| Colorchecker dE 2000 * | 3.93 | 5.15 -31% | 6 -53% | 4.54 -16% | 5.7 -45% | 4.78 -22% |
| Colorchecker dE 2000 max. * | 8.79 | 10.89 -24% | 11.6 -32% | 16 -82% | 21.3 -142% | 11.75 -34% |
| Colorchecker dE 2000 calibrated * | 3.13 | 1.6 49% | 3.61 -15% | 4.7 -50% | 3.51 -12% | |
| Greyscale dE 2000 * | 2.29 | 4.25 -86% | 8.7 -280% | 4.6 -101% | 3.7 -62% | 7.9 -245% |
| Gamma | 2.33 94% | 2.61 84% | 2.19 100% | 2.44 90% | 2.11 104% | 2.24 98% |
| CCT | 6951 94% | 6603 98% | 8426 77% | 7096 92% | 7353 88% | 8323 78% |
| Color Space (Percent of AdobeRGB 1998) (%) | 38 | 40 5% | 60.9 60% | 37.5 -1% | 37.4 -2% | 58.8 55% |
| Color Space (Percent of sRGB) (%) | 60 | 63 5% | 96 60% | 59.2 -1% | 58.7 -2% | 90.4 51% |
| Média Total (Programa/Configurações) | -15% /
-14% | 3% /
5% | -4% /
-12% | -7% /
-11% | 13% /
4% |
* ... menor é melhor
Exibir tempos de resposta
| ↔ Tempo de resposta preto para branco | ||
|---|---|---|
| 24 ms ... ascensão ↗ e queda ↘ combinadas | ↗ 13 ms ascensão | 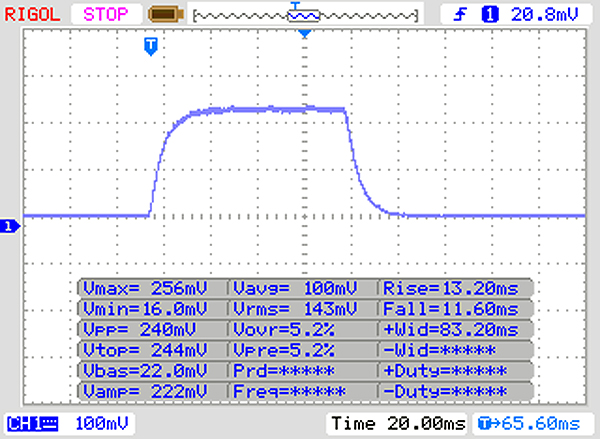 |
| ↘ 11 ms queda | ||
| A tela mostra boas taxas de resposta em nossos testes, mas pode ser muito lenta para jogadores competitivos. Em comparação, todos os dispositivos testados variam de 0.1 (mínimo) a 240 (máximo) ms. » 54 % de todos os dispositivos são melhores. Isso significa que o tempo de resposta medido é pior que a média de todos os dispositivos testados (19.8 ms). | ||
| ↔ Tempo de resposta 50% cinza a 80% cinza | ||
| 34 ms ... ascensão ↗ e queda ↘ combinadas | ↗ 16 ms ascensão | 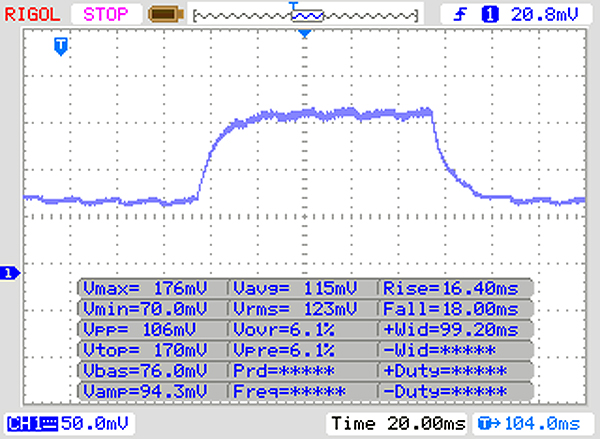 |
| ↘ 18 ms queda | ||
| A tela mostra taxas de resposta lentas em nossos testes e será insatisfatória para os jogadores. Em comparação, todos os dispositivos testados variam de 0.165 (mínimo) a 636 (máximo) ms. » 47 % de todos os dispositivos são melhores. Isso significa que o tempo de resposta medido é pior que a média de todos os dispositivos testados (30.9 ms). | ||
Cintilação da tela / PWM (modulação por largura de pulso)
| Tela tremeluzindo/PWM detectado | 25000 Hz | ≤ 10 % configuração de brilho | 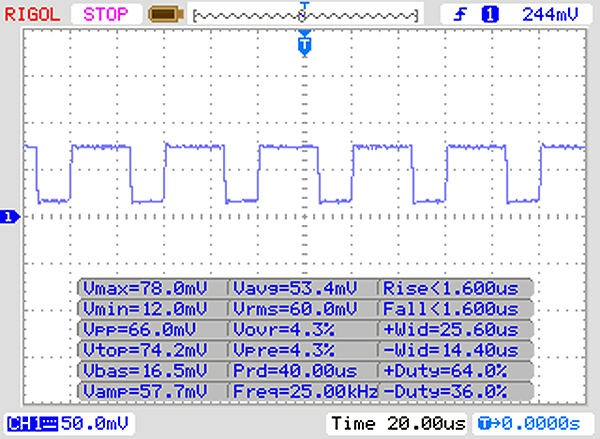 |
A luz de fundo da tela pisca em 25000 Hz (pior caso, por exemplo, utilizando PWM) Cintilação detectada em uma configuração de brilho de 10 % e abaixo. Não deve haver cintilação ou PWM acima desta configuração de brilho. A frequência de 25000 Hz é bastante alta, então a maioria dos usuários sensíveis ao PWM não deve notar nenhuma oscilação. [pwm_comparison] Em comparação: 52 % de todos os dispositivos testados não usam PWM para escurecer a tela. Se PWM foi detectado, uma média de 7744 (mínimo: 5 - máximo: 343500) Hz foi medida. | |||
| PCMark 8 Home Score Accelerated v2 | 3663 pontos | |
| PCMark 8 Work Score Accelerated v2 | 4811 pontos | |
Ajuda | ||
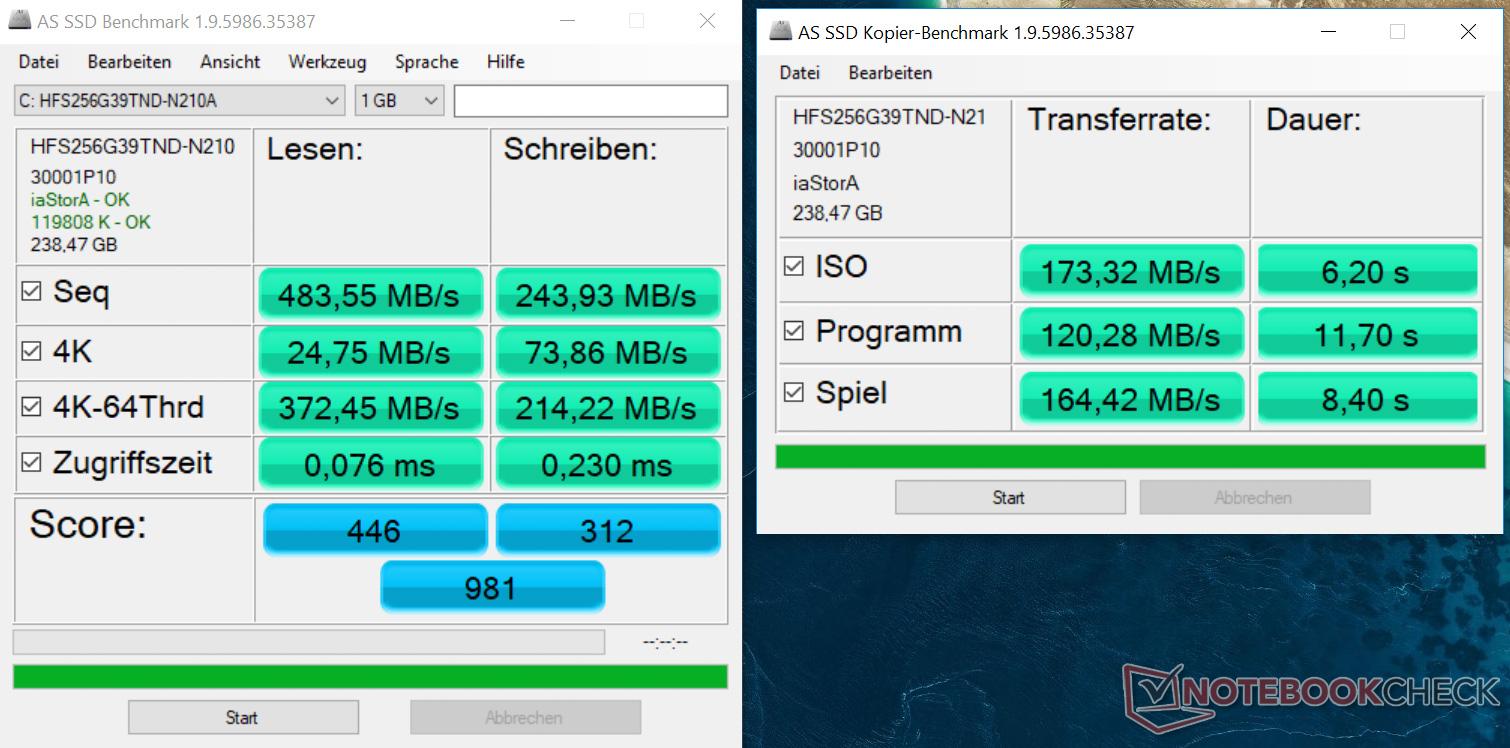
| Acer TravelMate 2410-G2-MG-82E6 SK Hynix HFS256G39TND-N210A | Acer TravelMate P2510-M-51ZQ SK Hynix HFS256G39TND-N210A | Lenovo IdeaPad 530s-14IKB SK Hynix PC401 512GB M.2 (HFS512GD9TNG) | Lenovo ThinkPad T480-20L6S01V00 Samsung SSD PM981 MZVLB512HAJQ | Média SK Hynix HFS256G39TND-N210A | |
|---|---|---|---|---|---|
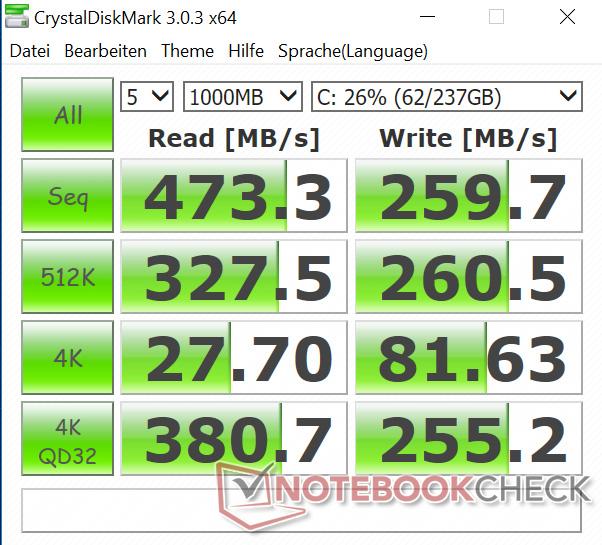
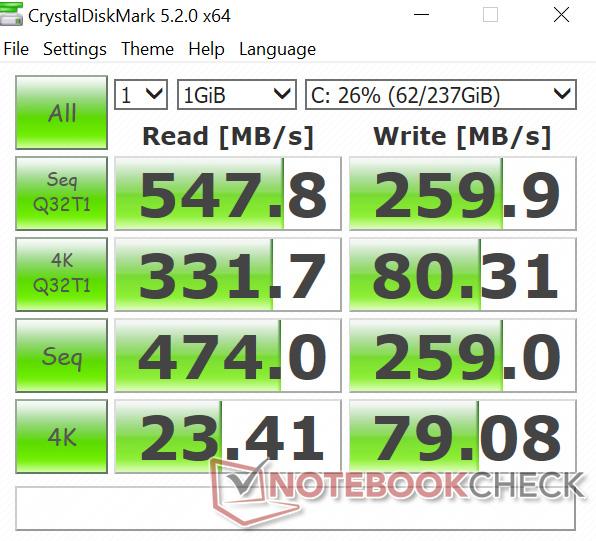
| CrystalDiskMark 3.0 | 3% | 88% | 89% | -6% | |
| Read Seq (MB/s) | 473.3 | 498.1 5% | 1360 187% | 922 95% | 482 ? 2% |
| Write Seq (MB/s) | 259.7 | 260.1 0% | 733 182% | 928 257% | 246 ? -5% |
| Read 512 (MB/s) | 327.5 | 328.5 0% | 769 135% | 561 71% | 328 ? 0% |
| Write 512 (MB/s) | 260.5 | 260.9 0% | 642 146% | 567 118% | 243 ? -7% |
| Read 4k (MB/s) | 27.7 | 32.59 18% | 39.83 44% | 64.4 132% | 28 ? 1% |
| Write 4k (MB/s) | 81.6 | 84.2 3% | 100 23% | 108 32% | 74.8 ? -8% |
| Read 4k QD32 (MB/s) | 380.7 | 359.7 -6% | 330.3 -13% | 383.4 1% | 323 ? -15% |
| Write 4k QD32 (MB/s) | 255.2 | 262 3% | 260.2 2% | 271.4 6% | 220 ? -14% |

| 3DMark 06 Standard Score | 17997 pontos | |
| 3DMark 11 Performance | 3096 pontos | |
| 3DMark Cloud Gate Standard Score | 11141 pontos | |
| 3DMark Fire Strike Score | 2203 pontos | |
Ajuda | ||
| Far Cry 5 | |
| 1280x720 Low Preset AA:T | |
| Média da turma Office (38 - 99, n=13, últimos 2 anos) | |
| Asus Zenbook UX3430UN-GV174T | |
| Lenovo IdeaPad 530s-14IKB | |
| Acer TravelMate 2410-G2-MG-82E6 | |
| Média NVIDIA GeForce MX130 (21 - 32, n=2) | |
| Asus VivoBook 15 X542UF-DM143T | |
| HP 14-ma0312ng | |
| 1920x1080 Medium Preset AA:T | |
| Média da turma Office (21 - 59, n=13, últimos 2 anos) | |
| Lenovo IdeaPad 530s-14IKB | |
| Asus Zenbook UX3430UN-GV174T | |
| Asus VivoBook 15 X542UF-DM143T | |
| Acer TravelMate 2410-G2-MG-82E6 | |
| Média NVIDIA GeForce MX130 (14 - 14, n=2) | |
| 1920x1080 High Preset AA:T | |
| Média da turma Office (19 - 54, n=13, últimos 2 anos) | |
| Lenovo IdeaPad 530s-14IKB | |
| Asus VivoBook 15 X542UF-DM143T | |
| Acer TravelMate 2410-G2-MG-82E6 | |
| Média NVIDIA GeForce MX130 (13 - 13, n=2) | |
| 1920x1080 Ultra Preset AA:T | |
| Média da turma Office (18 - 52, n=13, últimos 2 anos) | |
| Lenovo IdeaPad 530s-14IKB | |
| Asus VivoBook 15 X542UF-DM143T | |
| Acer TravelMate 2410-G2-MG-82E6 | |
| Média NVIDIA GeForce MX130 (12 - 12, n=2) | |
| Final Fantasy XV Benchmark | |
| 1280x720 Lite Quality | |
| Média da turma Office (16.5 - 171.2, n=73, últimos 2 anos) | |
| Acer TravelMate 2410-G2-MG-82E6 | |
| Média NVIDIA GeForce MX130 (22.5 - 25.8, n=4) | |
| Acer Aspire 5 A515-51G-509A | |
| HP Spectre 13-af033ng | |
| Lenovo V110-15IKB 80TH001WGE | |
| Dell Latitude 7390 | |
| 1920x1080 Standard Quality | |
| Média da turma Office (7.86 - 105.7, n=73, últimos 2 anos) | |
| Acer TravelMate 2410-G2-MG-82E6 | |
| Média NVIDIA GeForce MX130 (12.1 - 12.6, n=3) | |
| HP Spectre x360 13-ae048ng | |
| HP Spectre 13-af033ng | |
| 1920x1080 High Quality | |
| Média da turma Office (8.09 - 79.5, n=71, últimos 2 anos) | |
| Média NVIDIA GeForce MX130 (6.7 - 7.74, n=3) | |
| Acer TravelMate 2410-G2-MG-82E6 | |
| HP Spectre x360 13-ae048ng | |
| baixo | média | alto | ultra | |
|---|---|---|---|---|
| Rise of the Tomb Raider (2016) | 48.1 | 28.6 | 15.6 | |
| Final Fantasy XV Benchmark (2018) | 25.8 | 12.6 | 7 | |
| Far Cry 5 (2018) | 32 | 14 | 13 | 12 |
Barulho
| Ocioso |
| 30.8 / 30.8 / 30.8 dB |
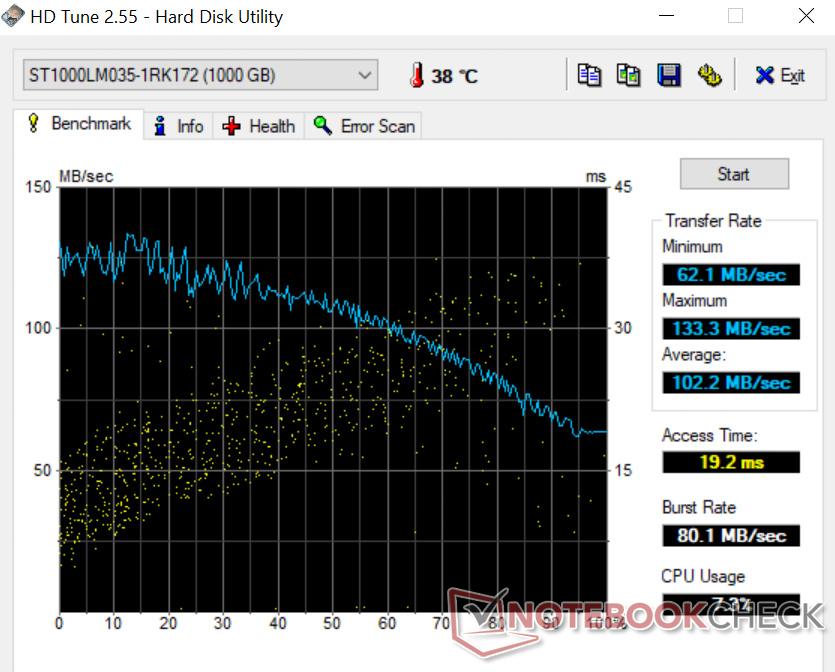
| HDD |
| 31.7 dB |
| Carga |
| 42.7 / 39.7 dB |
 | ||
30 dB silencioso 40 dB(A) audível 50 dB(A) ruidosamente alto |
||
min: | ||
(-) A temperatura máxima no lado superior é 47.3 °C / 117 F, em comparação com a média de 34.3 °C / 94 F , variando de 21.2 a 62.5 °C para a classe Office.
(-) A parte inferior aquece até um máximo de 47.8 °C / 118 F, em comparação com a média de 36.8 °C / 98 F
(+) Em uso inativo, a temperatura média para o lado superior é 25.7 °C / 78 F, em comparação com a média do dispositivo de 29.5 °C / ### class_avg_f### F.
(+) Os apoios para as mãos e o touchpad são mais frios que a temperatura da pele, com um máximo de 27.4 °C / 81.3 F e, portanto, são frios ao toque.
(±) A temperatura média da área do apoio para as mãos de dispositivos semelhantes foi 27.6 °C / 81.7 F (+0.2 °C / 0.4 F).
Acer TravelMate 2410-G2-MG-82E6 análise de áudio
(-) | alto-falantes não muito altos (###valor### dB)
Graves 100 - 315Hz
(-) | quase nenhum baixo - em média 29.2% menor que a mediana
(±) | a linearidade dos graves é média (9.3% delta para a frequência anterior)
Médios 400 - 2.000 Hz
(±) | médios reduzidos - em média 5.3% menor que a mediana
(+) | médios são lineares (5.9% delta para frequência anterior)
Altos 2 - 16 kHz
(+) | agudos equilibrados - apenas 3.2% longe da mediana
(+) | os máximos são lineares (3.4% delta da frequência anterior)
Geral 100 - 16.000 Hz
(±) | a linearidade do som geral é média (24.4% diferença em relação à mediana)
Comparado com a mesma classe
» 71% de todos os dispositivos testados nesta classe foram melhores, 7% semelhantes, 21% piores
» O melhor teve um delta de 7%, a média foi 21%, o pior foi 53%
Comparado com todos os dispositivos testados
» 74% de todos os dispositivos testados foram melhores, 6% semelhantes, 20% piores
» O melhor teve um delta de 4%, a média foi 23%, o pior foi 134%
Asus VivoBook 15 F510UF-ES71 análise de áudio
(-) | alto-falantes não muito altos (###valor### dB)
Graves 100 - 315Hz
(±) | graves reduzidos - em média 13.2% menor que a mediana
(±) | a linearidade dos graves é média (11.5% delta para a frequência anterior)
Médios 400 - 2.000 Hz
(+) | médios equilibrados - apenas 2.7% longe da mediana
(±) | a linearidade dos médios é média (7% delta para frequência anterior)
Altos 2 - 16 kHz
(+) | agudos equilibrados - apenas 4.5% longe da mediana
(+) | os máximos são lineares (6% delta da frequência anterior)
Geral 100 - 16.000 Hz
(±) | a linearidade do som geral é média (22% diferença em relação à mediana)
Comparado com a mesma classe
» 78% de todos os dispositivos testados nesta classe foram melhores, 4% semelhantes, 17% piores
» O melhor teve um delta de 5%, a média foi 17%, o pior foi 45%
Comparado com todos os dispositivos testados
» 64% de todos os dispositivos testados foram melhores, 6% semelhantes, 30% piores
» O melhor teve um delta de 4%, a média foi 23%, o pior foi 134%
Lenovo IdeaPad 530s-14IKB análise de áudio
(±) | o volume do alto-falante é médio, mas bom (###valor### dB)
Graves 100 - 315Hz
(-) | quase nenhum baixo - em média 17.2% menor que a mediana
(±) | a linearidade dos graves é média (14.5% delta para a frequência anterior)
Médios 400 - 2.000 Hz
(+) | médios equilibrados - apenas 2.4% longe da mediana
(+) | médios são lineares (6.4% delta para frequência anterior)
Altos 2 - 16 kHz
(+) | agudos equilibrados - apenas 3.6% longe da mediana
(±) | a linearidade dos máximos é média (8.3% delta para frequência anterior)
Geral 100 - 16.000 Hz
(±) | a linearidade do som geral é média (16.8% diferença em relação à mediana)
Comparado com a mesma classe
» 43% de todos os dispositivos testados nesta classe foram melhores, 8% semelhantes, 49% piores
» O melhor teve um delta de 5%, a média foi 18%, o pior foi 53%
Comparado com todos os dispositivos testados
» 30% de todos os dispositivos testados foram melhores, 7% semelhantes, 63% piores
» O melhor teve um delta de 4%, a média foi 23%, o pior foi 134%
| desligado | |
| Ocioso | |
| Carga |
|
Key:
min: | |
| Acer TravelMate 2410-G2-MG-82E6 i5-8550U, GeForce MX130, SK Hynix HFS256G39TND-N210A, IPS, 1920x1080, 14" | Acer TravelMate P2510-M-51ZQ i5-7200U, HD Graphics 620, SK Hynix HFS256G39TND-N210A, IPS, 1920x1080, 15.6" | Lenovo ThinkPad T480-20L6S01V00 i5-8550U, GeForce MX150, Samsung SSD PM981 MZVLB512HAJQ, IPS, 1920x1080, 14" | Lenovo IdeaPad 530s-14IKB i5-8550U, GeForce MX150, SK Hynix PC401 512GB M.2 (HFS512GD9TNG), IPS, 2560x1440, 14" | HP Spectre x360 15-ch011nr i5-8550U, GeForce MX150, SK hynix PC401 NVMe 500 GB, IPS, 3840x2160, 15.6" | Dell XPS 13 i7-8550U i5-8550U, UHD Graphics 620, Toshiba XG5 KXG50ZNV256G, IGZO IPS, 3200x1800, 13.3" | Média NVIDIA GeForce MX130 | Média da turma Office | |
|---|---|---|---|---|---|---|---|---|
| Power Consumption | 17% | -13% | 0% | -47% | 13% | -14% | -7% | |
| Idle Minimum * (Watt) | 3.5 | 3.4 3% | 3.6 -3% | 3.9 -11% | 5.3 -51% | 4.1 -17% | 4.54 ? -30% | 4.25 ? -21% |
| Idle Average * (Watt) | 5.9 | 5.8 2% | 7.1 -20% | 5.76 2% | 9.8 -66% | 5.8 2% | 6.98 ? -18% | 7.3 ? -24% |
| Idle Maximum * (Watt) | 8.2 | 8 2% | 9.5 -16% | 7.14 13% | 12.6 -54% | 6 27% | 9.08 ? -11% | 8.57 ? -5% |
| Load Average * (Watt) | 57.3 | 38 34% | 63.9 -12% | 50.8 11% | 73 -27% | 42.5 26% | 54.1 ? 6% | 43.8 ? 24% |
| Load Maximum * (Watt) | 57.9 | 32 45% | 67.3 -16% | 65.8 -14% | 80 -38% | 41.4 28% | 66.4 ? -15% | 64.5 ? -11% |
| Witcher 3 ultra * (Watt) | 53.9 | 67.6 |
* ... menor é melhor
| Acer TravelMate 2410-G2-MG-82E6 i5-8550U, GeForce MX130, 48 Wh | Acer TravelMate P2510-M-51ZQ i5-7200U, HD Graphics 620, 48 Wh | Asus VivoBook 15 F510UF-ES71 i5-8550U, GeForce MX130, 42 Wh | Lenovo IdeaPad 530s-14IKB i5-8550U, GeForce MX150, 45 Wh | Lenovo ThinkPad T480-20L6S01V00 i5-8550U, GeForce MX150, 72 Wh | HP Spectre x360 15-ch011nr i5-8550U, GeForce MX150, 84 Wh | Dell XPS 13 i7-8550U i5-8550U, UHD Graphics 620, 60 Wh | Média da turma Office | |
|---|---|---|---|---|---|---|---|---|
| Duração da bateria | 10% | -47% | -9% | 46% | 31% | 29% | 49% | |
| H.264 (h) | 8.9 | 7.1 -20% | 10.6 19% | 15.4 ? 73% | ||||
| WiFi v1.3 (h) | 7.4 | 8.8 19% | 3.9 -47% | 8.7 18% | 13.2 78% | 10.4 41% | 9.8 32% | 13.2 ? 78% |
| Load (h) | 1.9 | 1.9 0% | 1.4 -26% | 2.7 42% | 2.3 21% | 2.4 26% | 1.808 ? -5% | |
| Reader / Idle (h) | 15.2 | 14.7 | 27.9 | 15.5 | 18.5 | 22.2 ? |
Pro
Contra
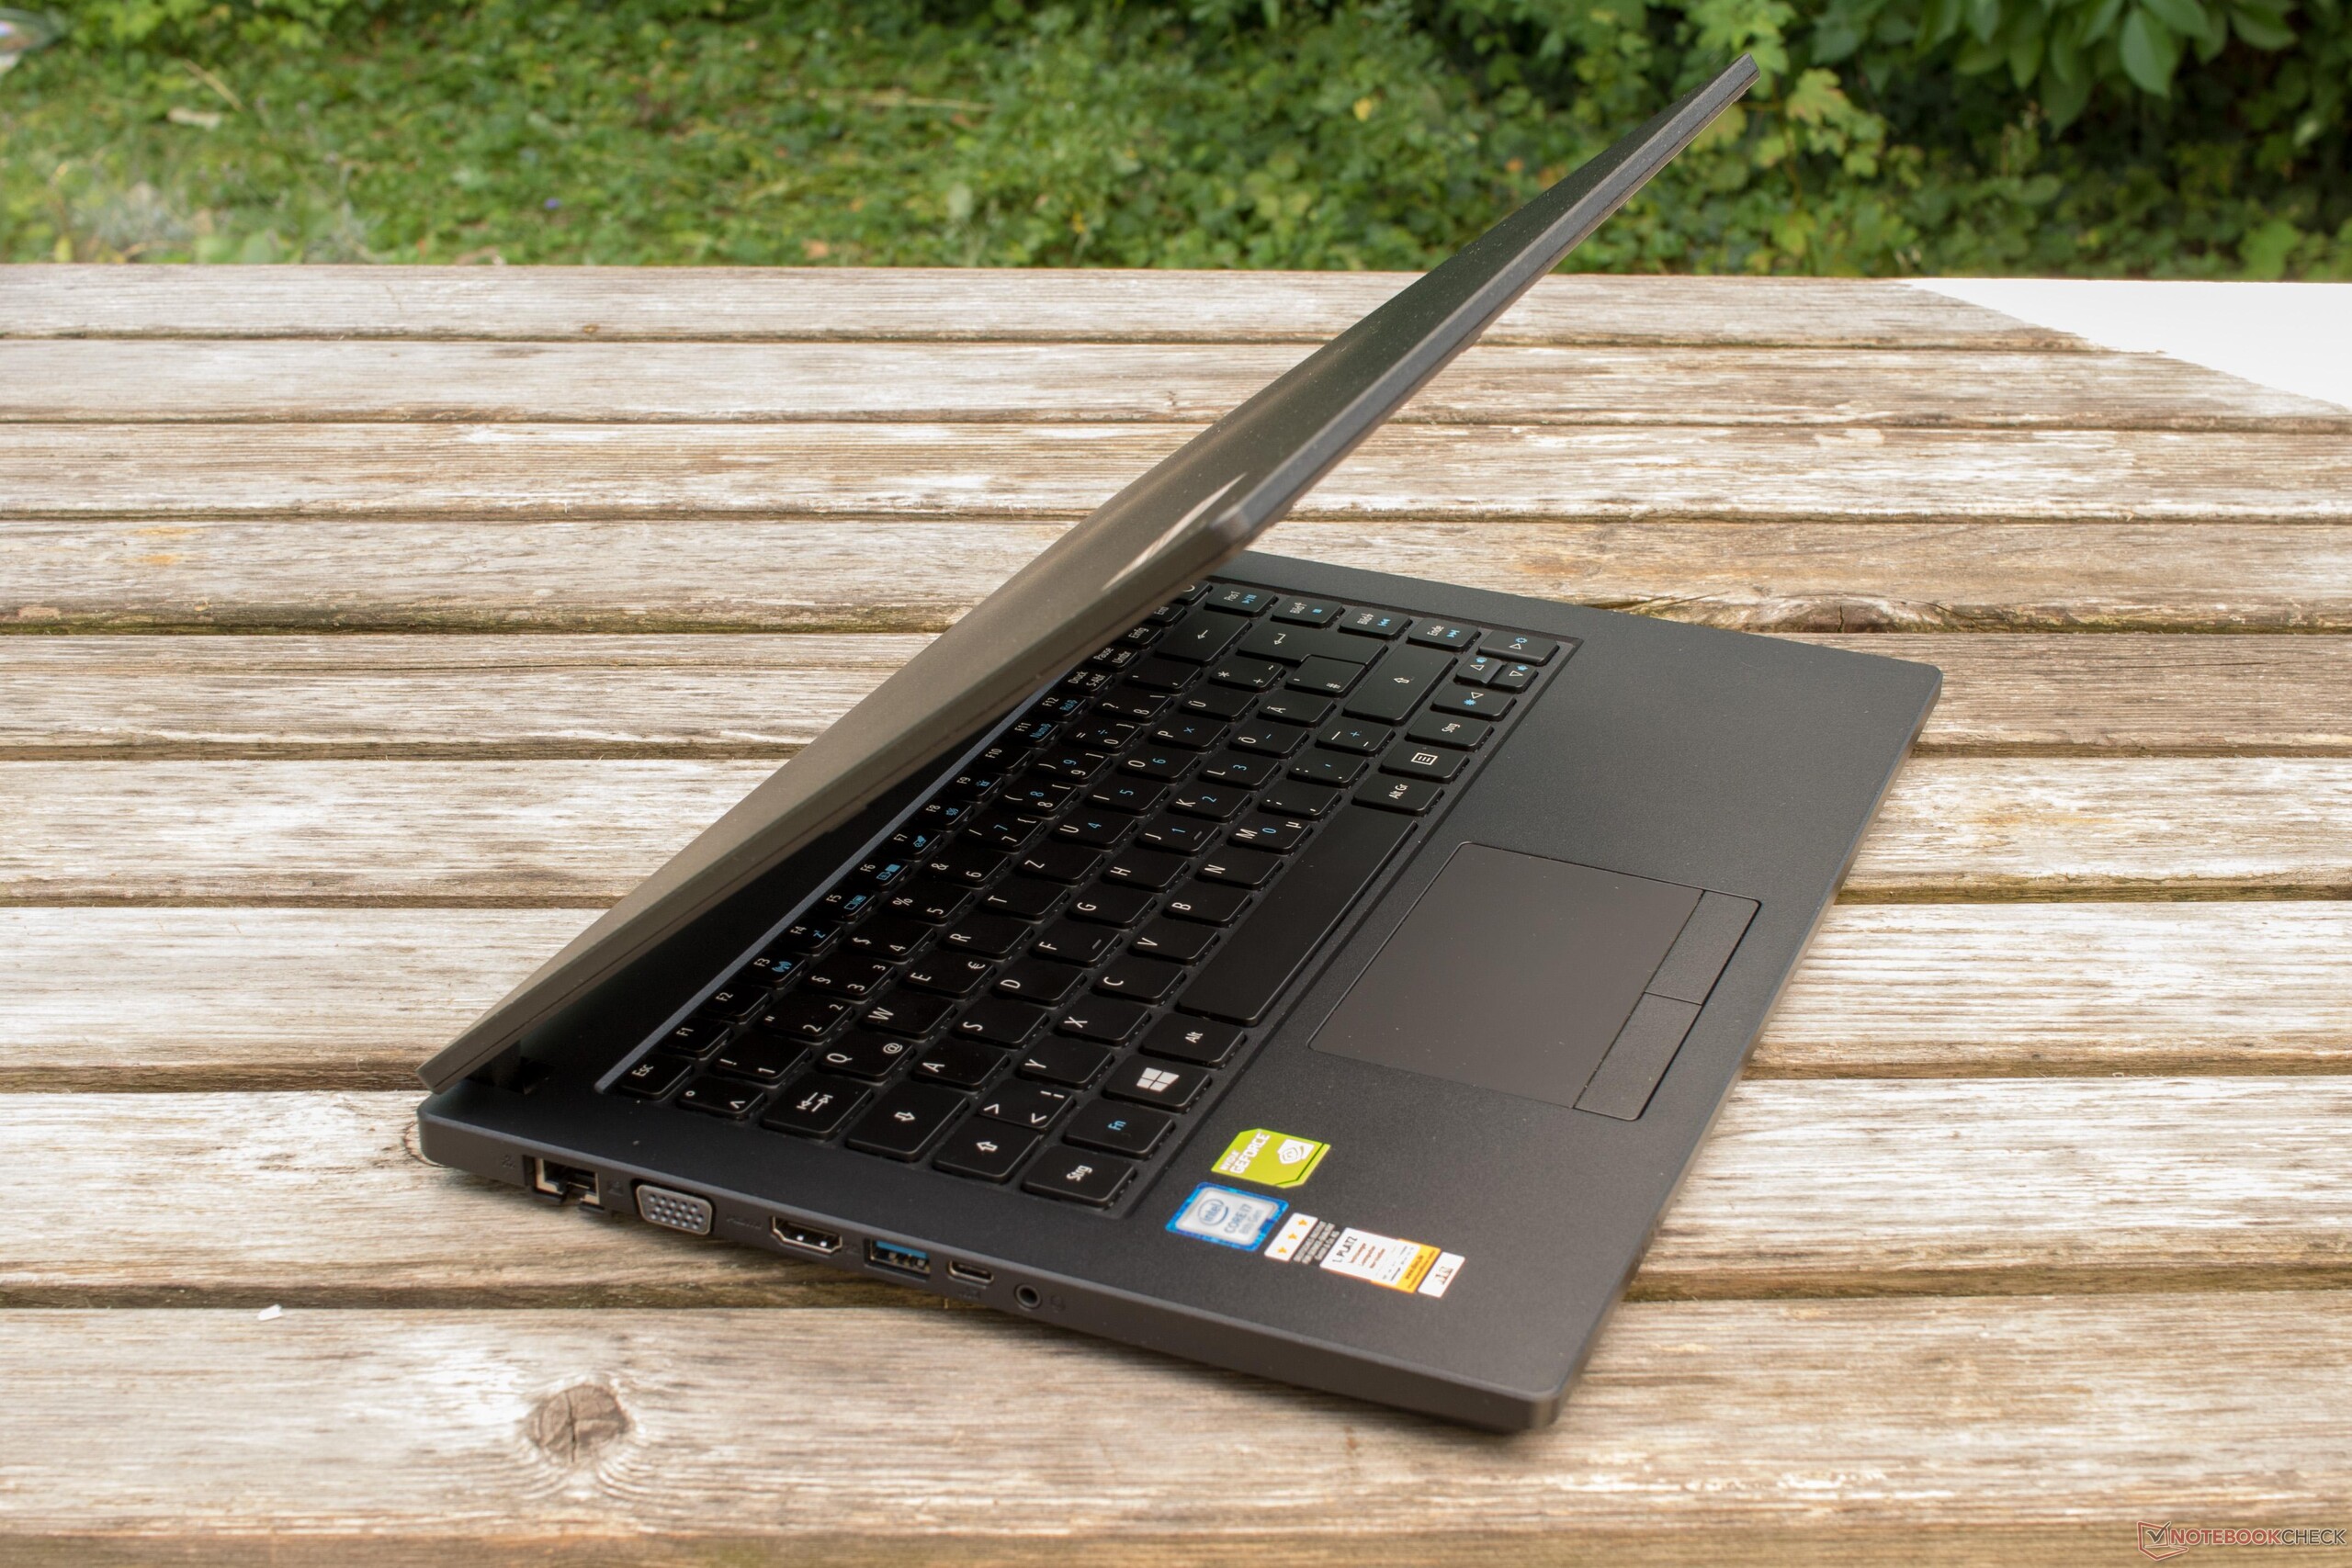
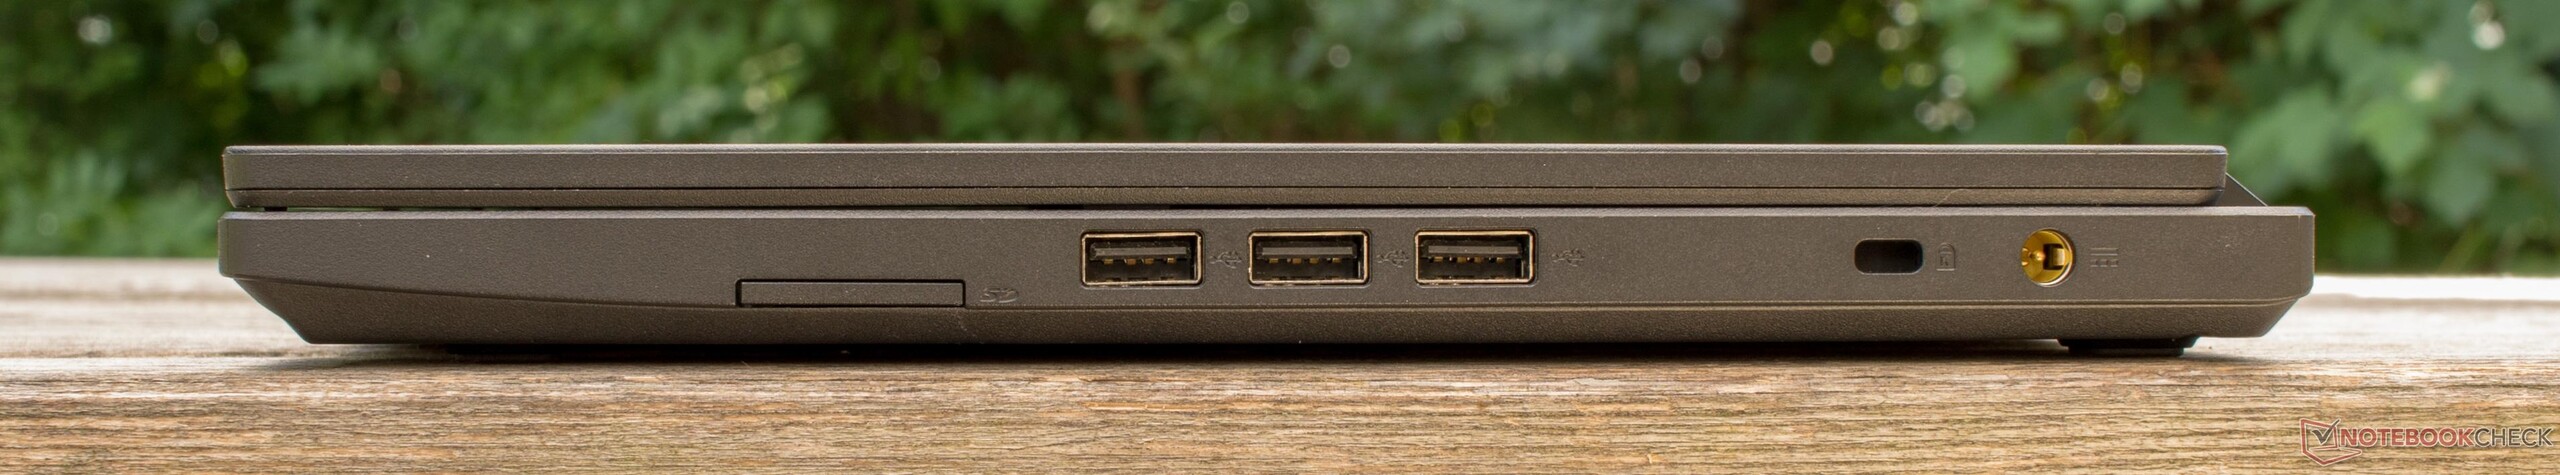
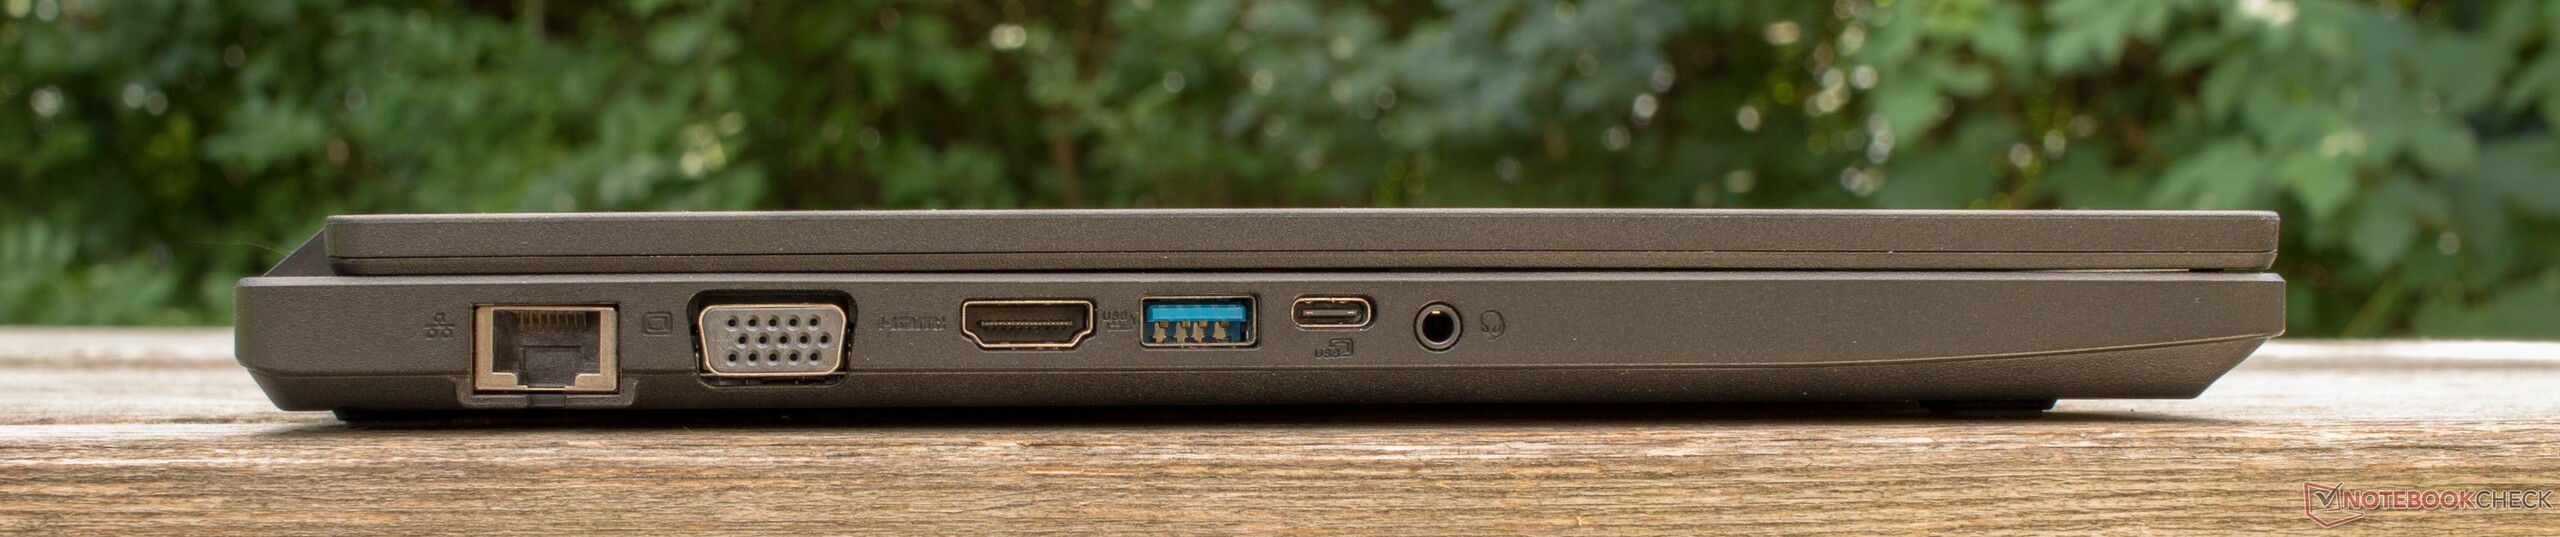
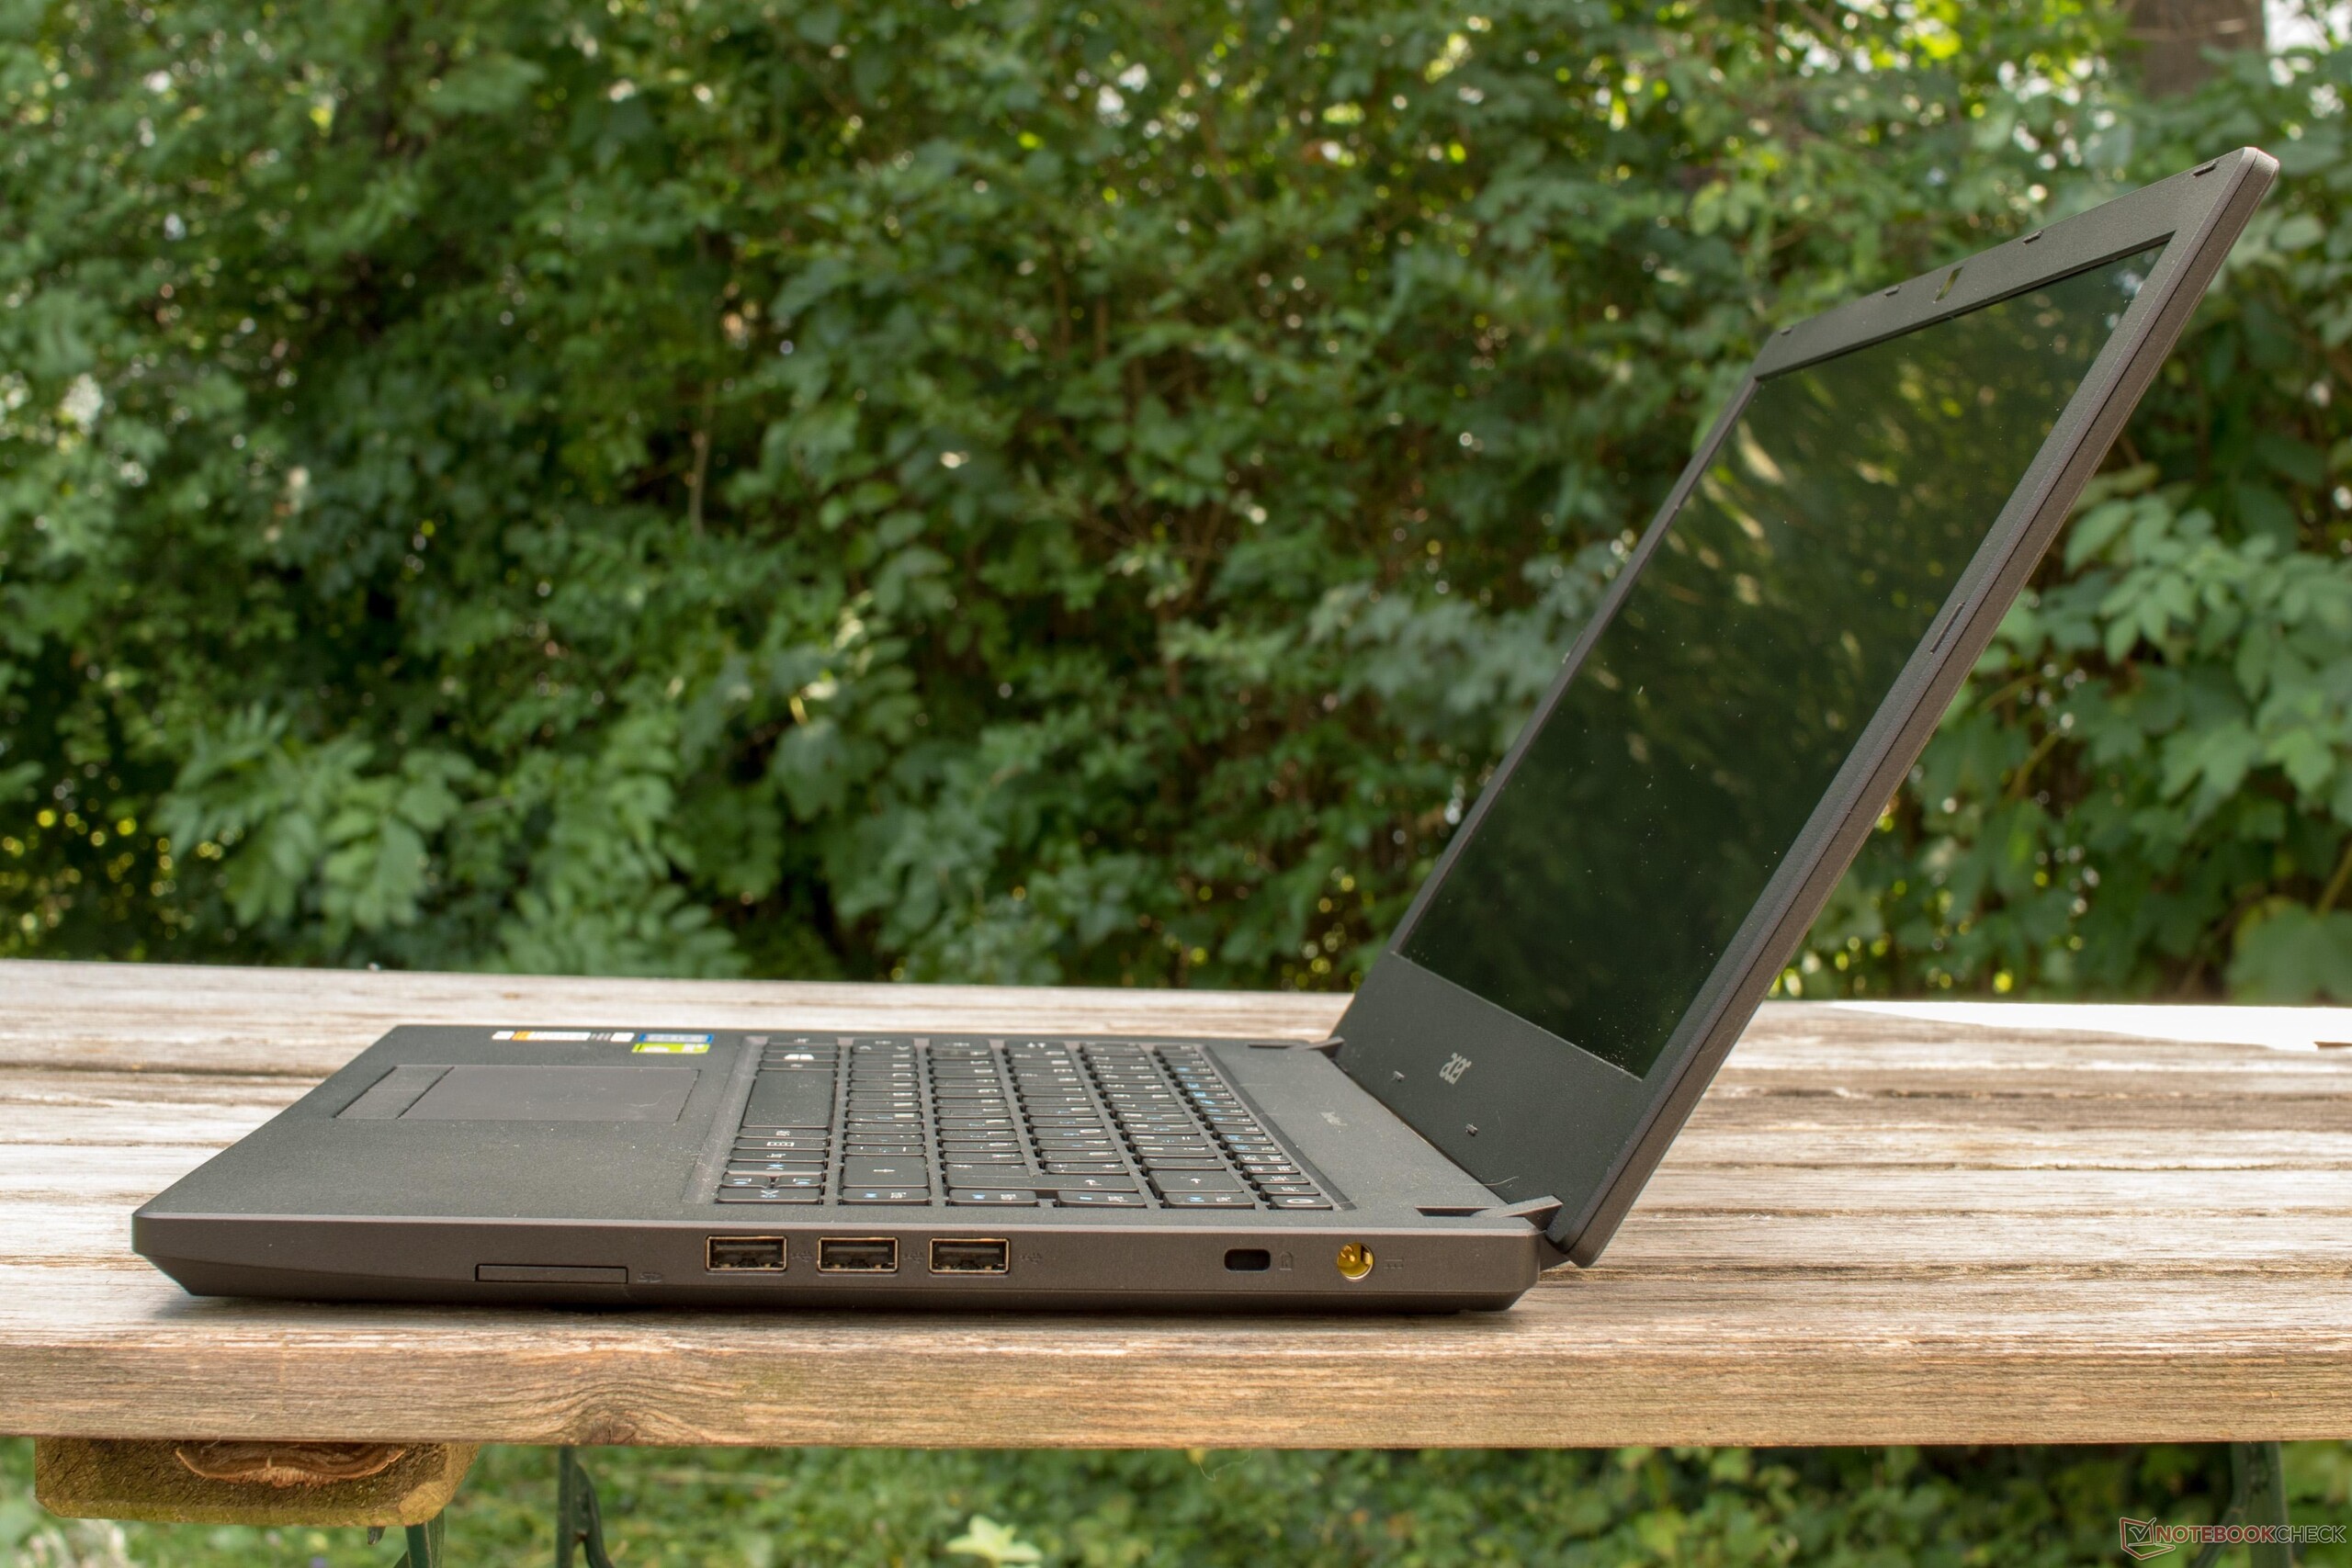
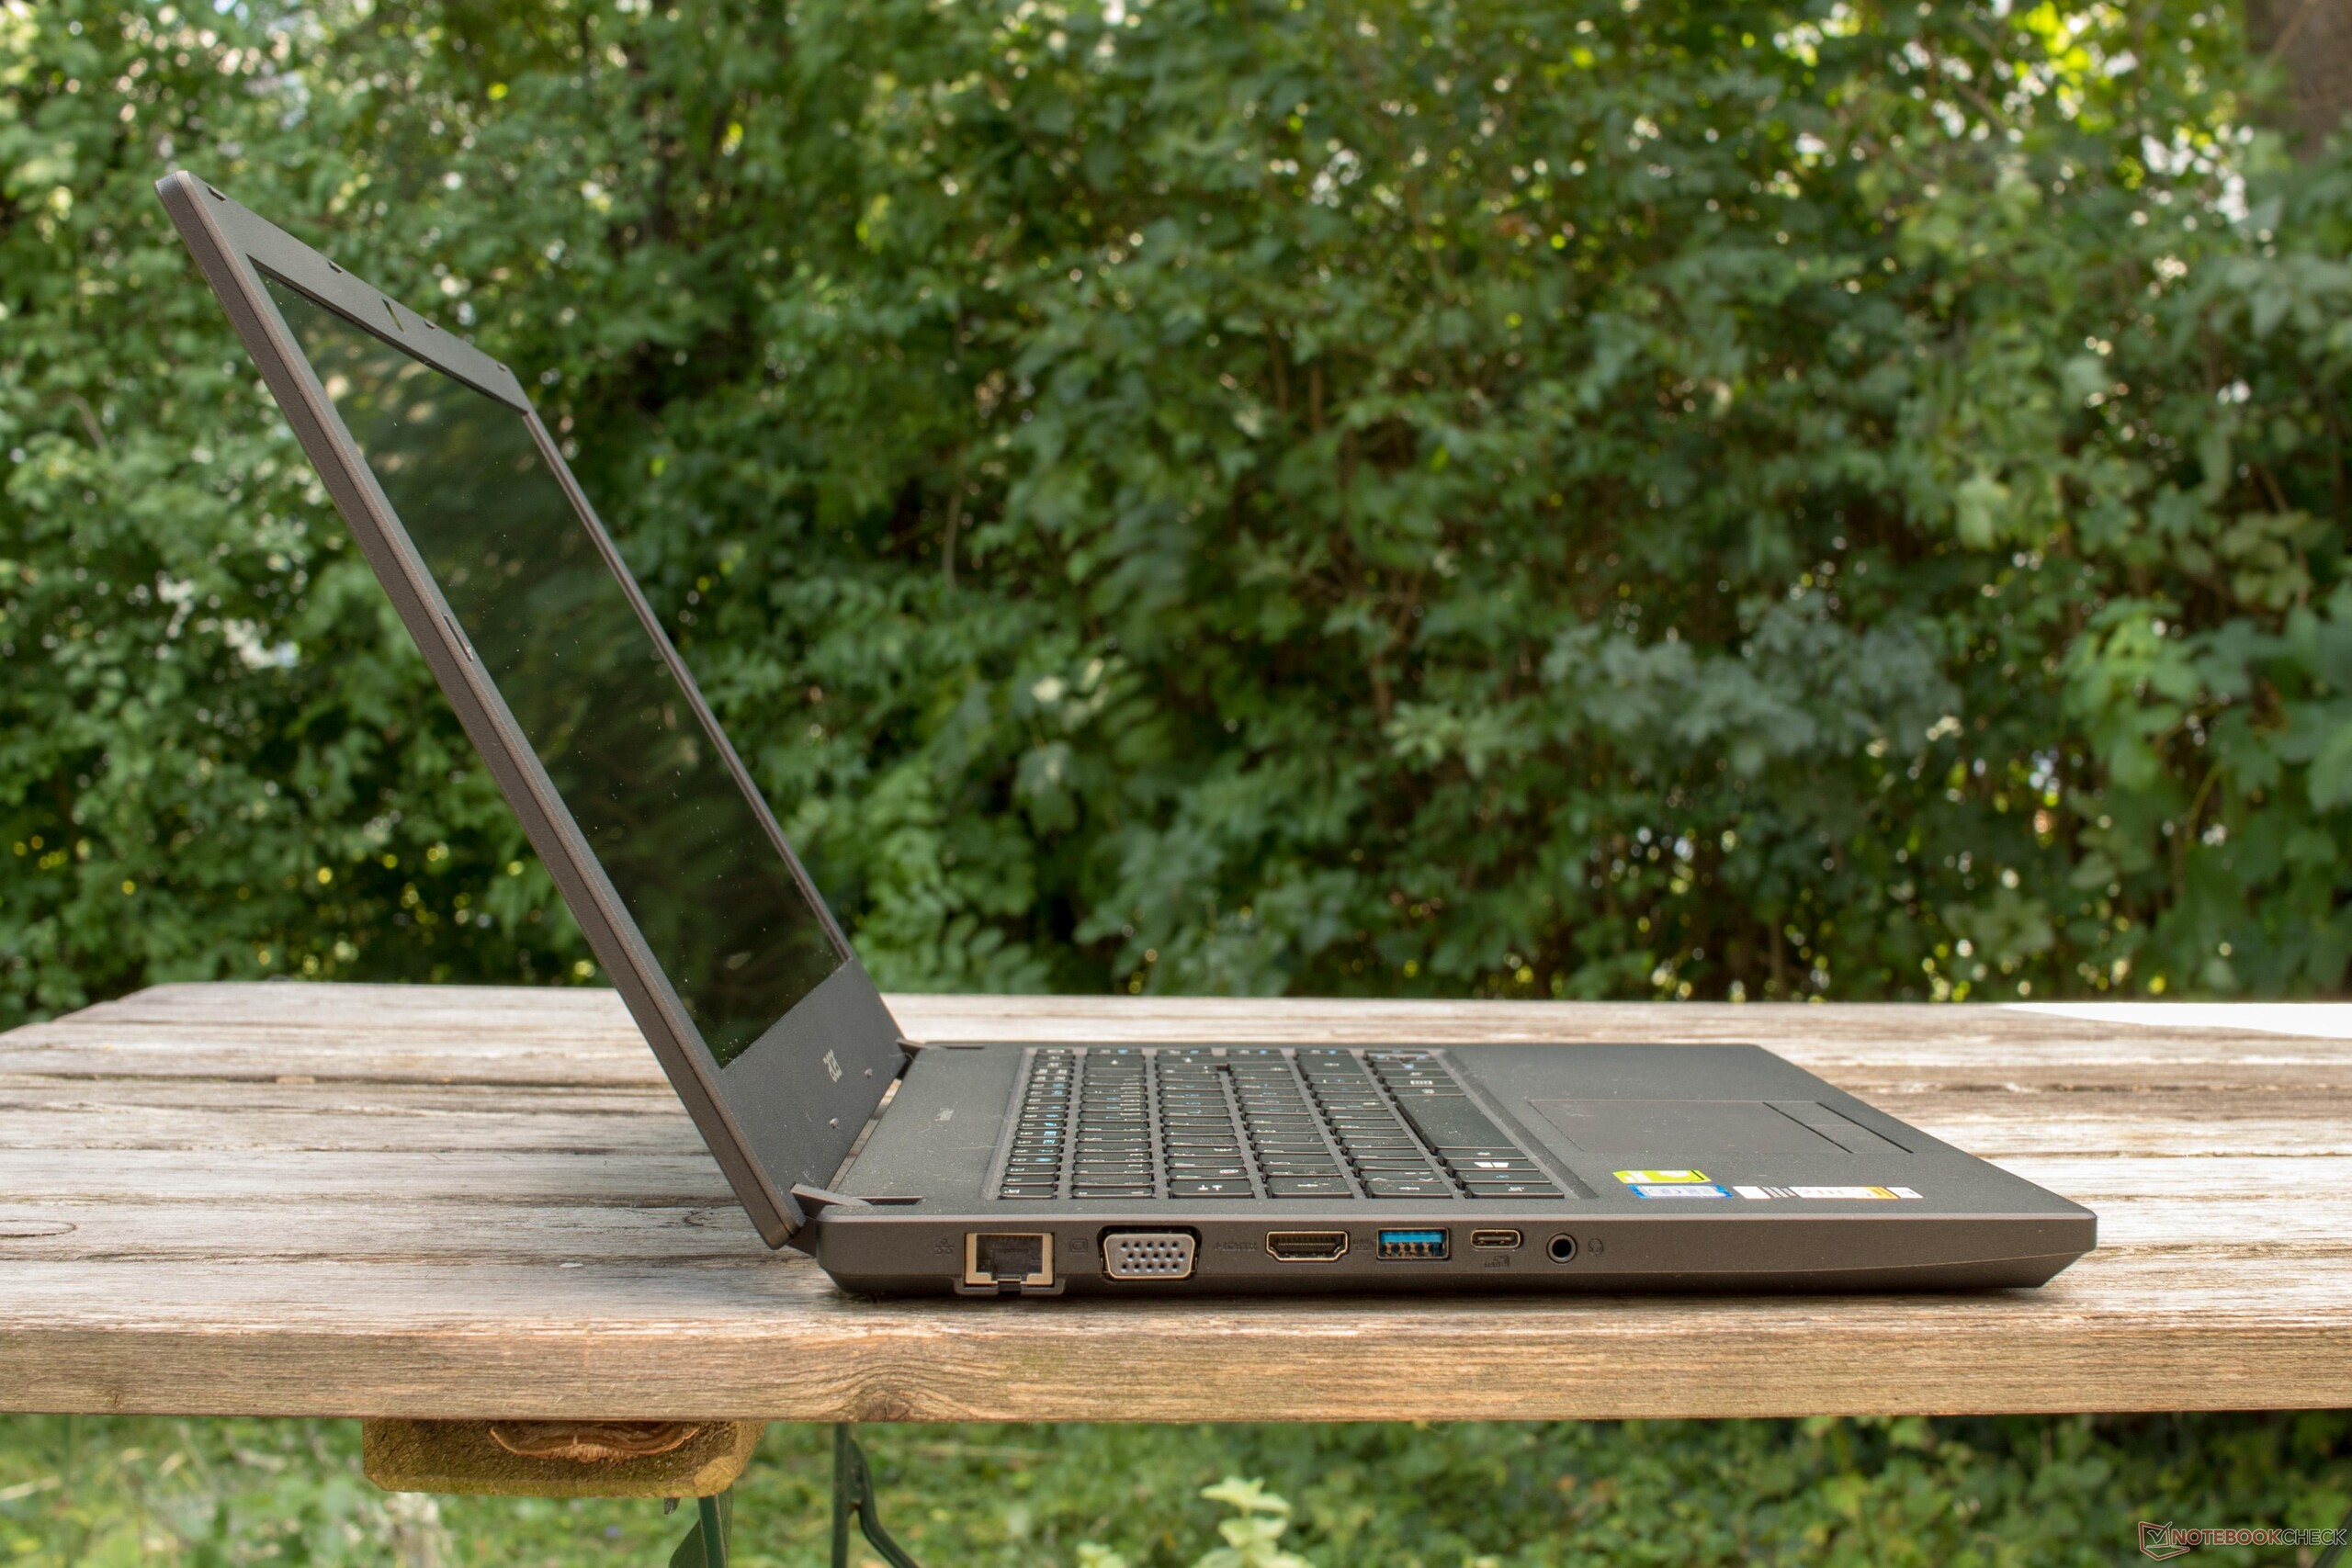
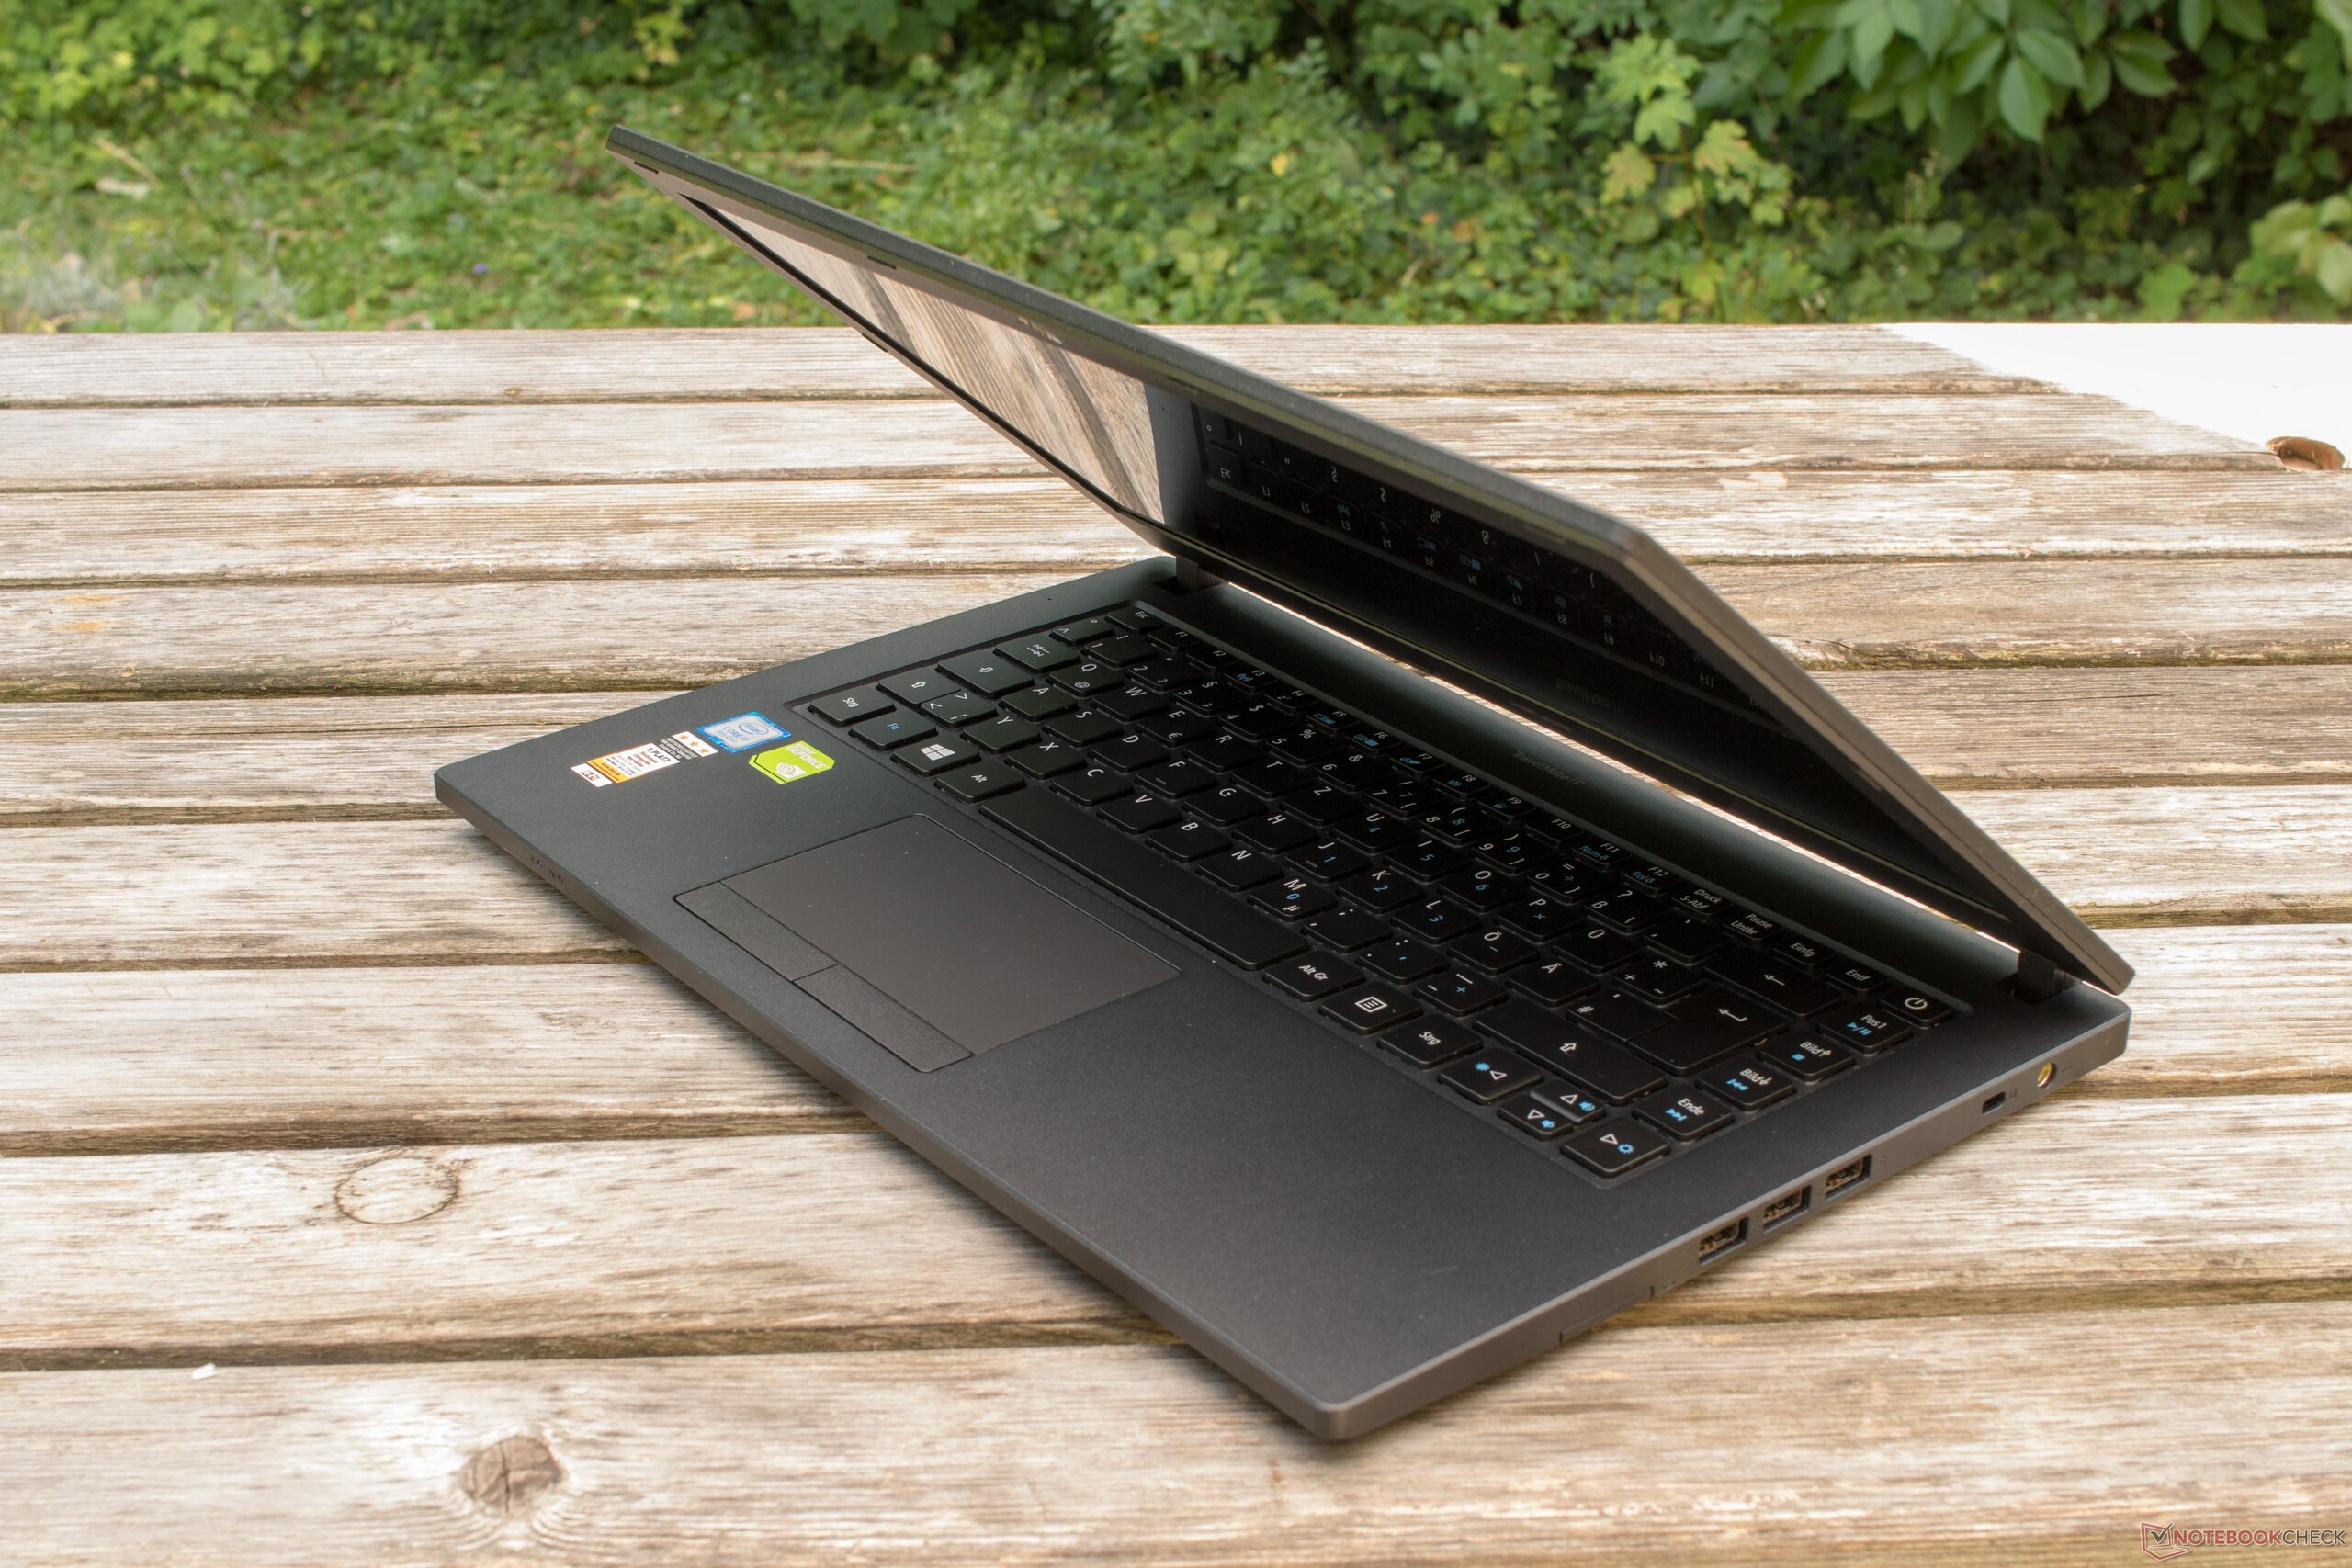
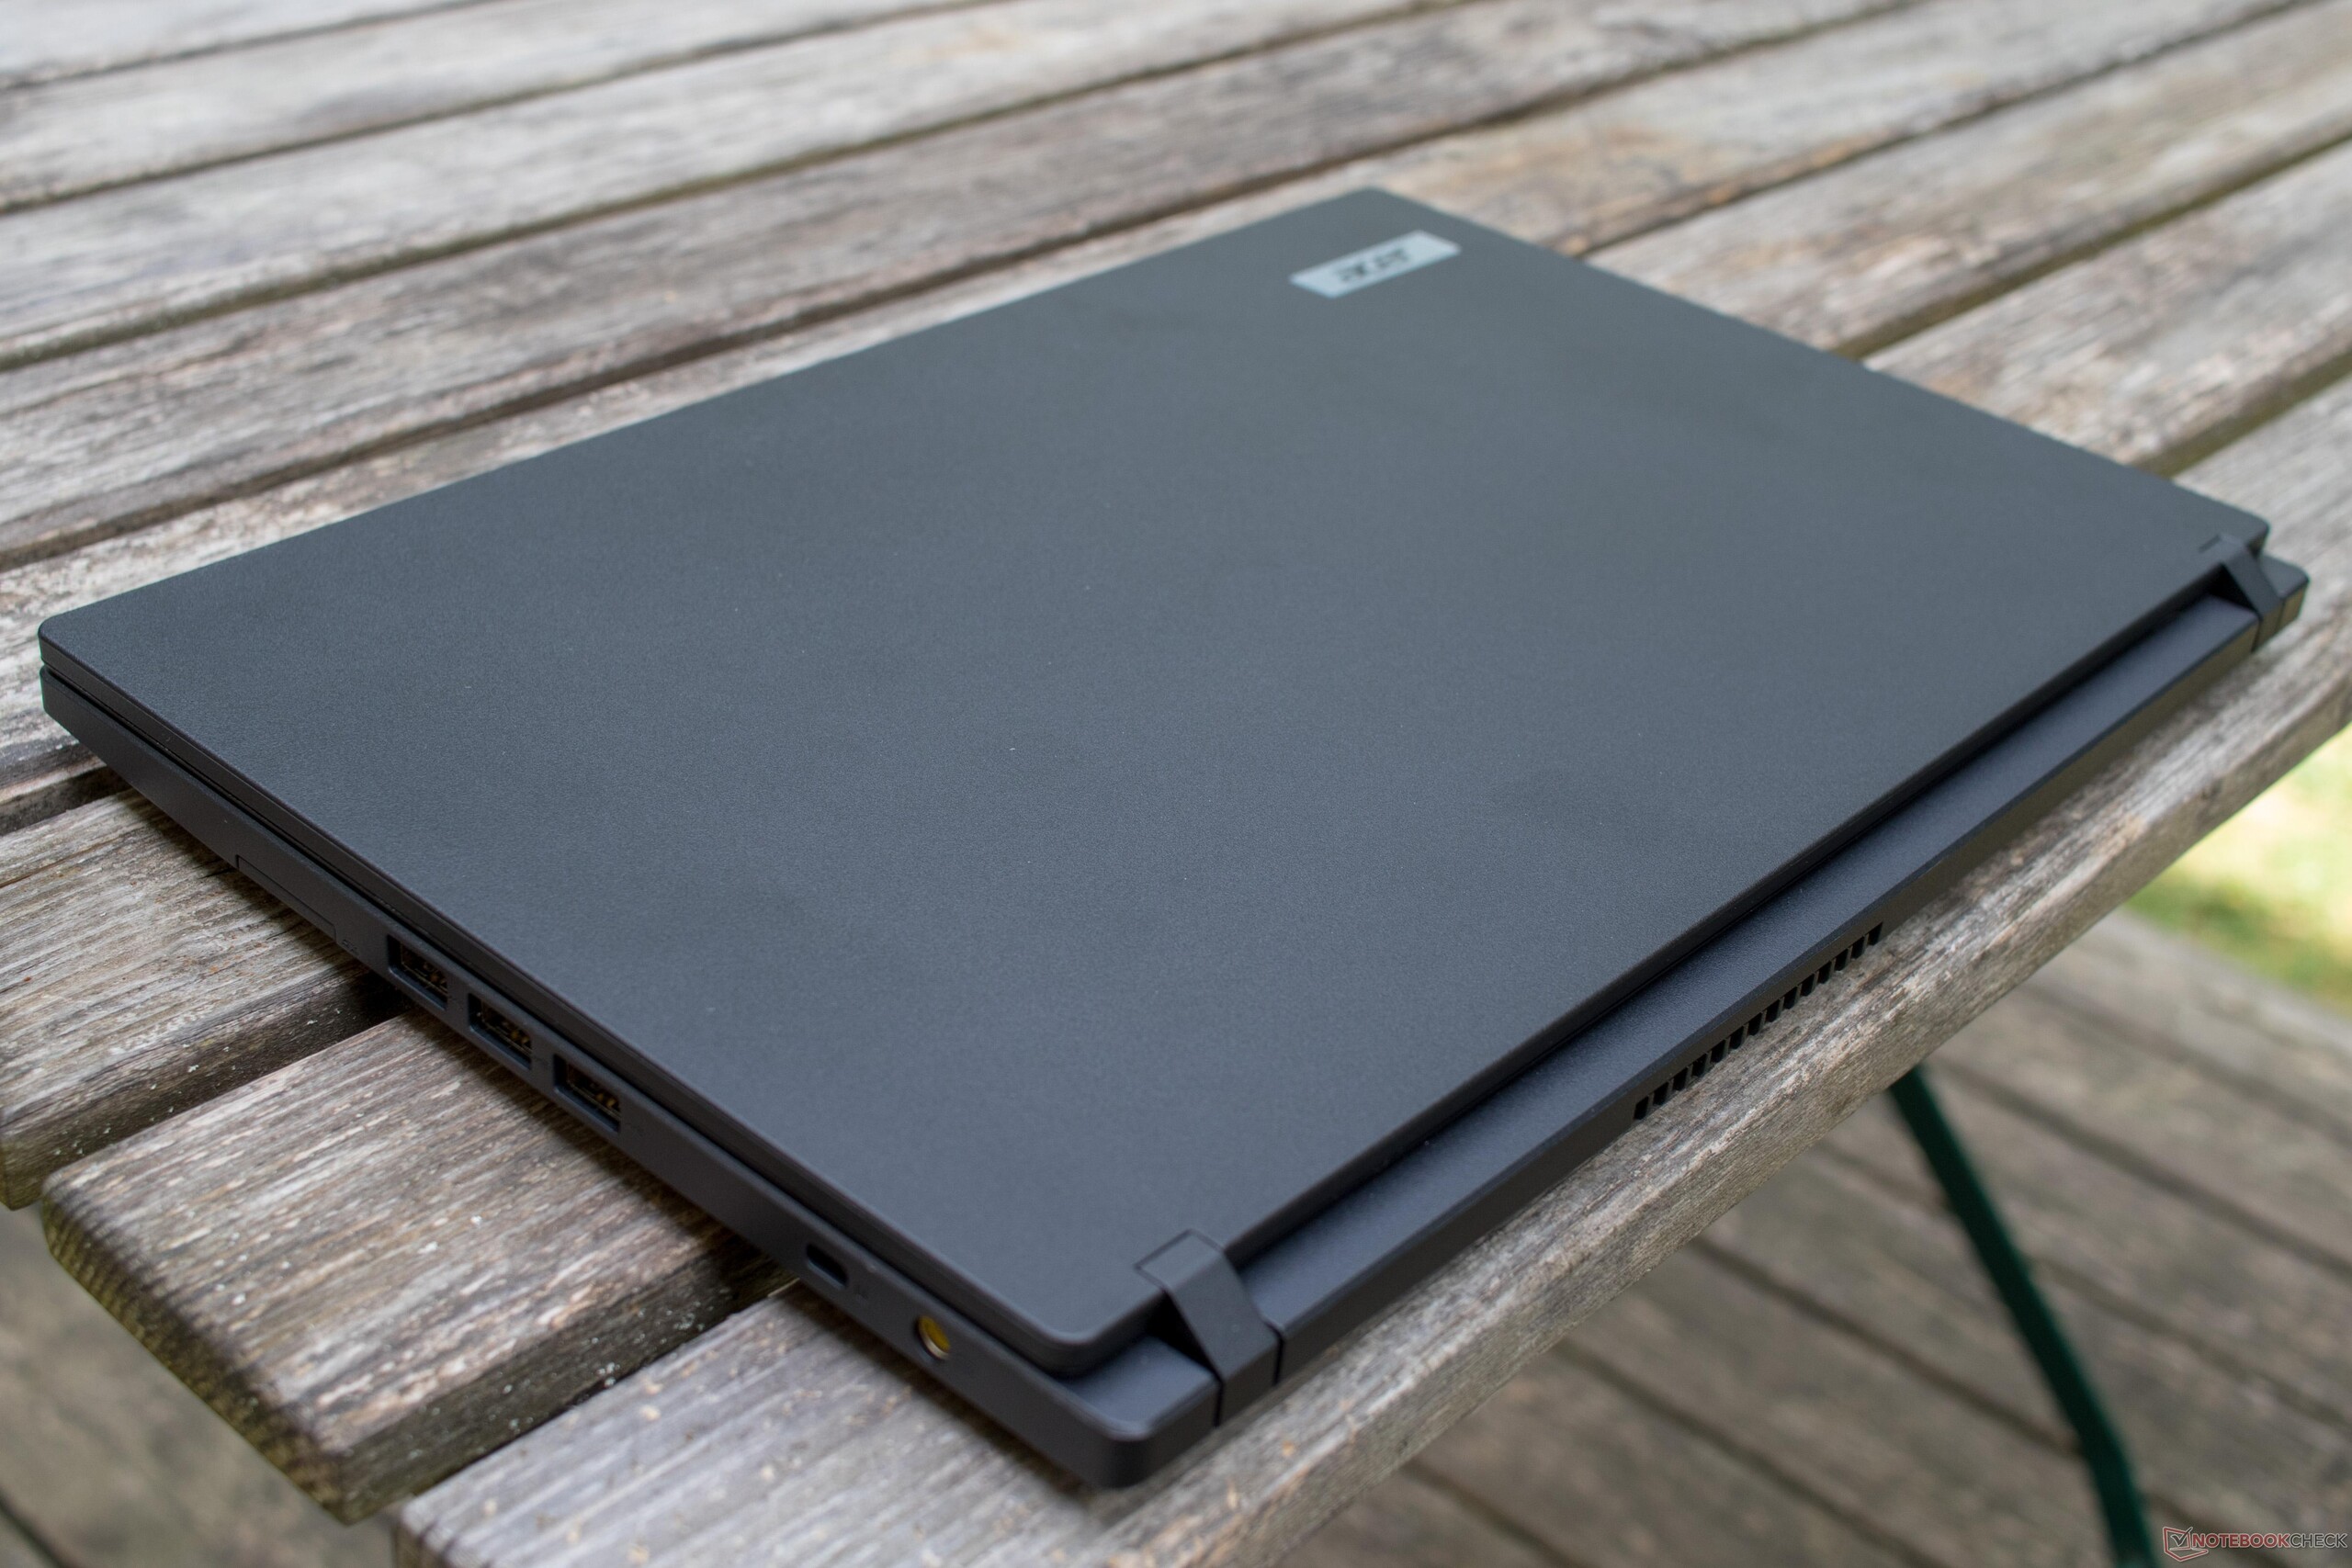
Antes de escrever esta análise, esperávamos que o Acer TravelMate P2410 fosse uma ferramenta de trabalho estável, portátil, versátil, mas não muito chamativa. Exatamente essas expectativas foram atendidas, porque a variedade de conexões (mesmo com apenas uma USB Type-A 3.0 esteja disponível), o uso em exteriores da tela, um HD adicional com 1 TB e a duração satisfatória da bateria de 48 Wh, por um preço de pouco mais de 1.000 Euros (~$1.162) no momento em que o dispositivo foi testado, indicam uma boa relação preço-desempenho. Além disso, você pode aproveitar a Nvidia GeForce MX130 dedicada, mas não espere muito para jogos graficamente exigentes. No entanto, é suficiente para jogos ocasionais.
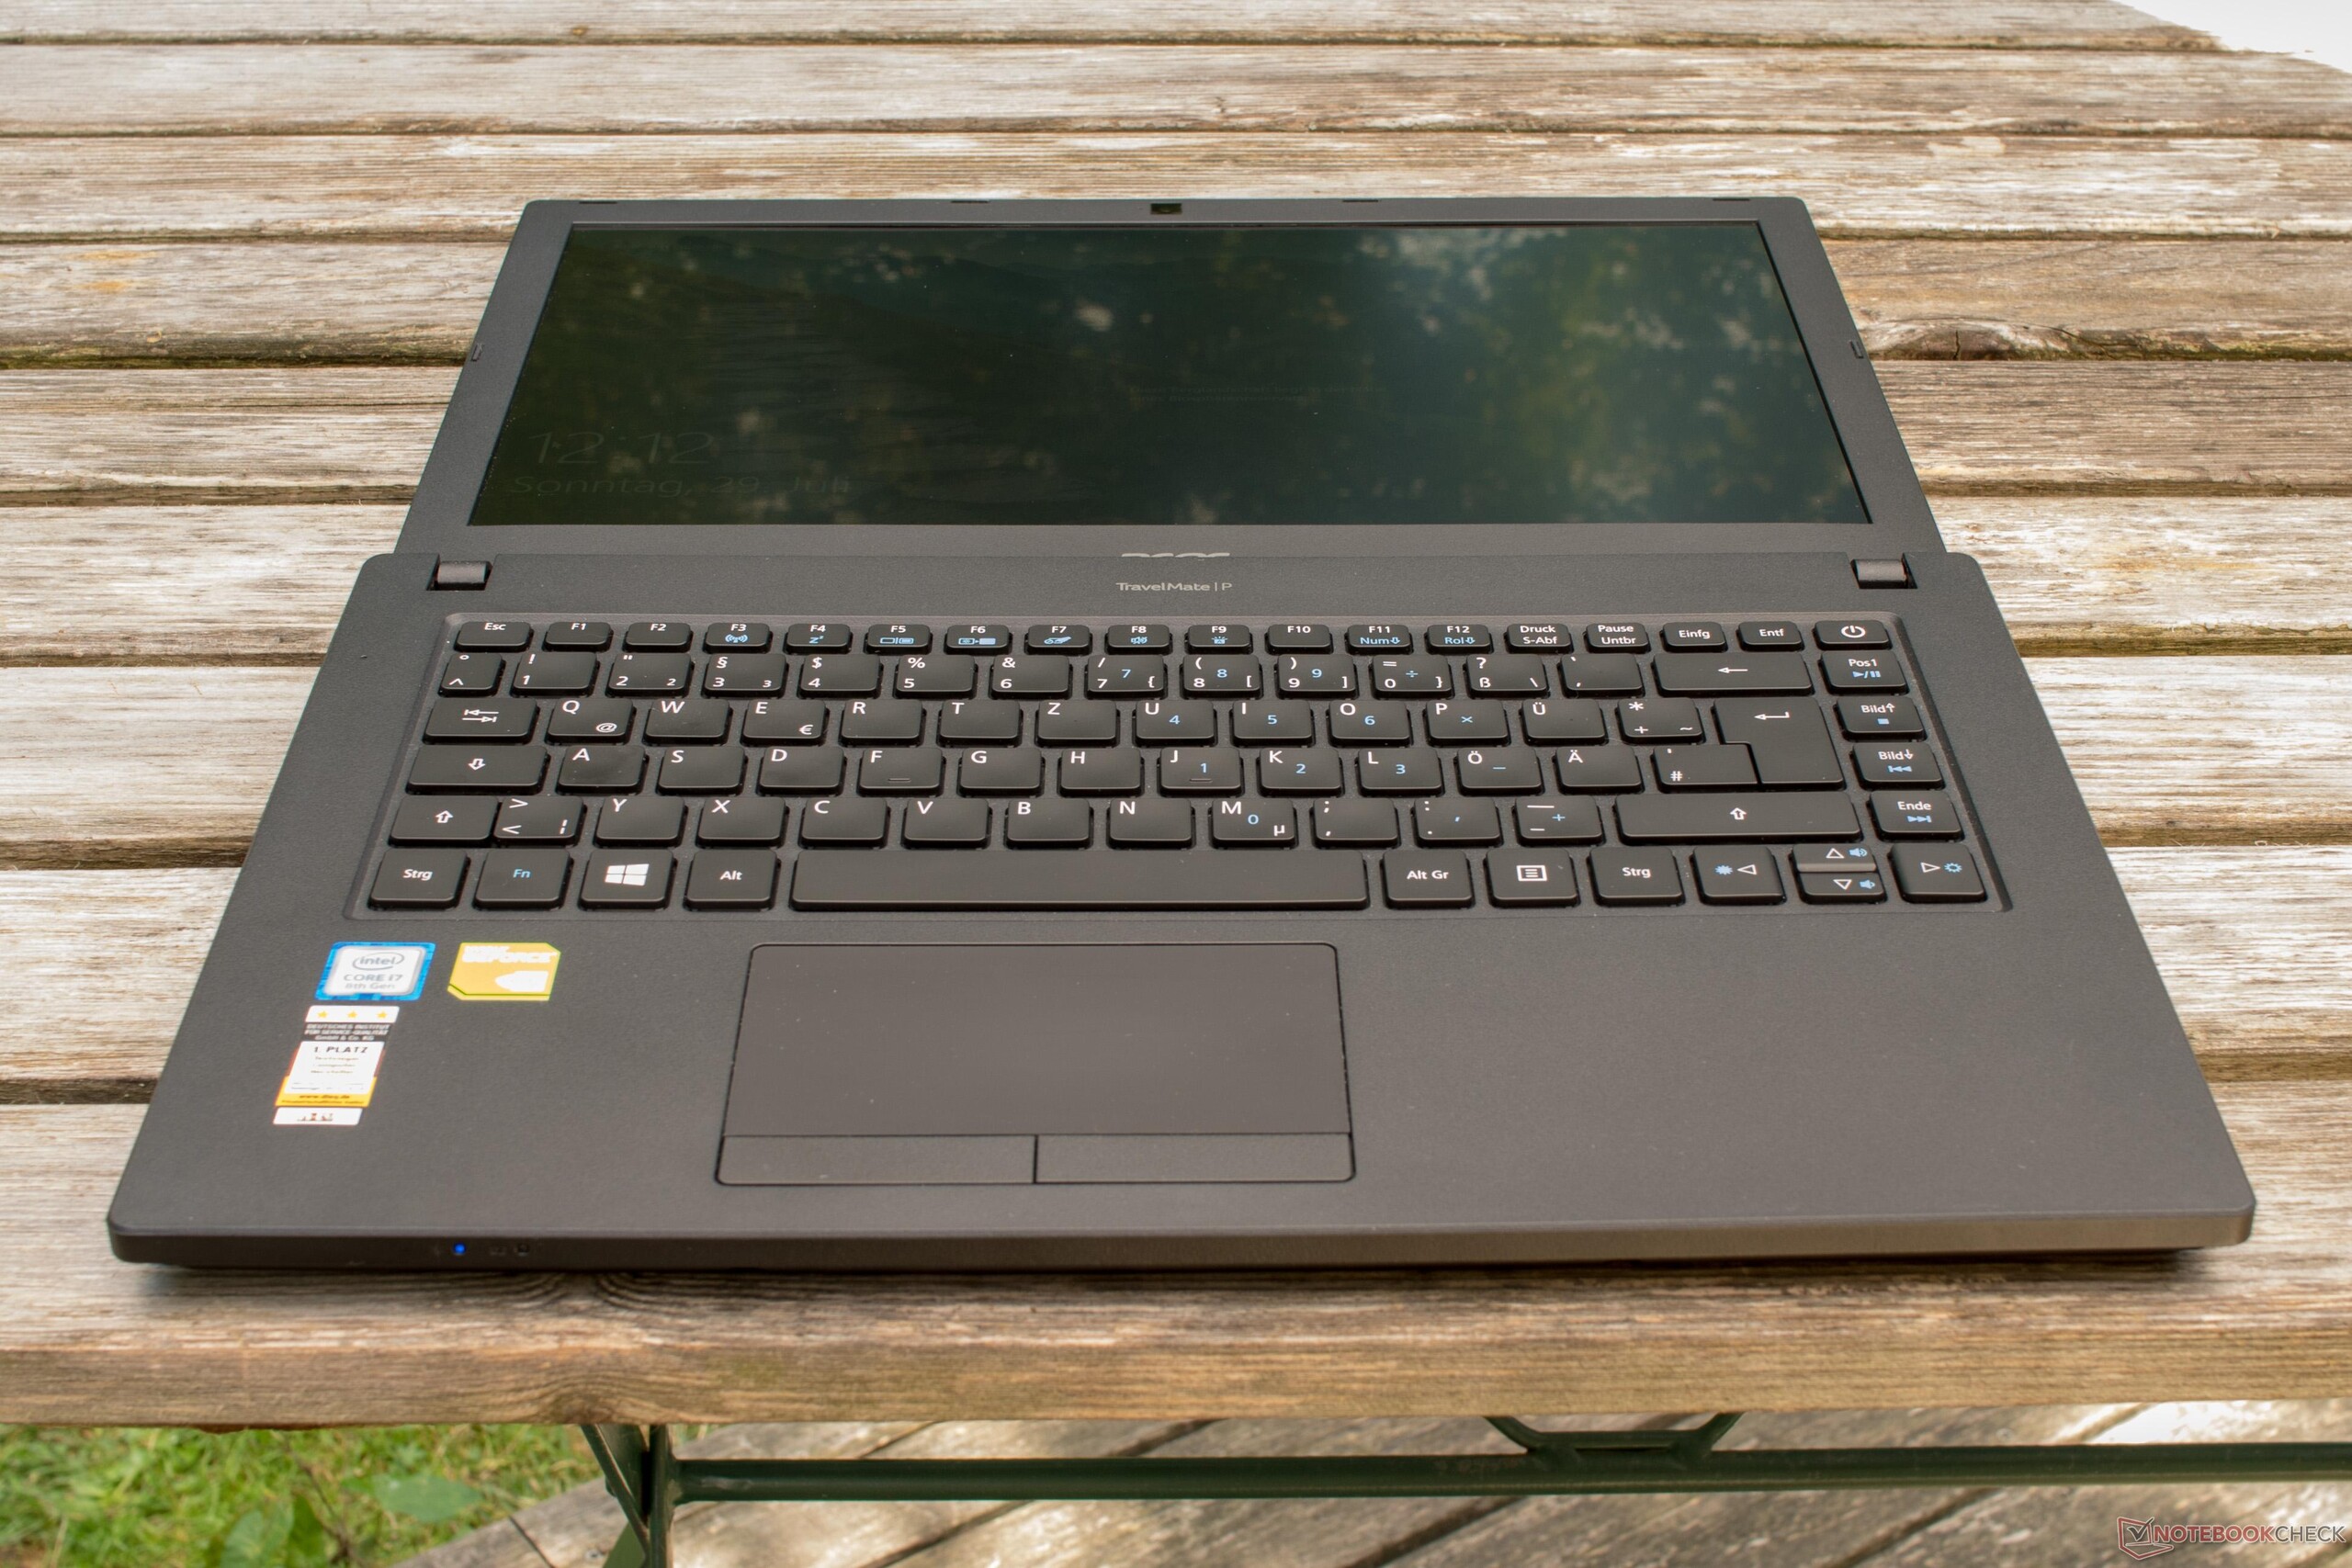
Há, é claro, alguns pontos que a Acer poderia ter resolvido de forma diferente, como a ventoinha que funciona continuamente ou a luz de fundo do teclado, que não pode ser configurada.
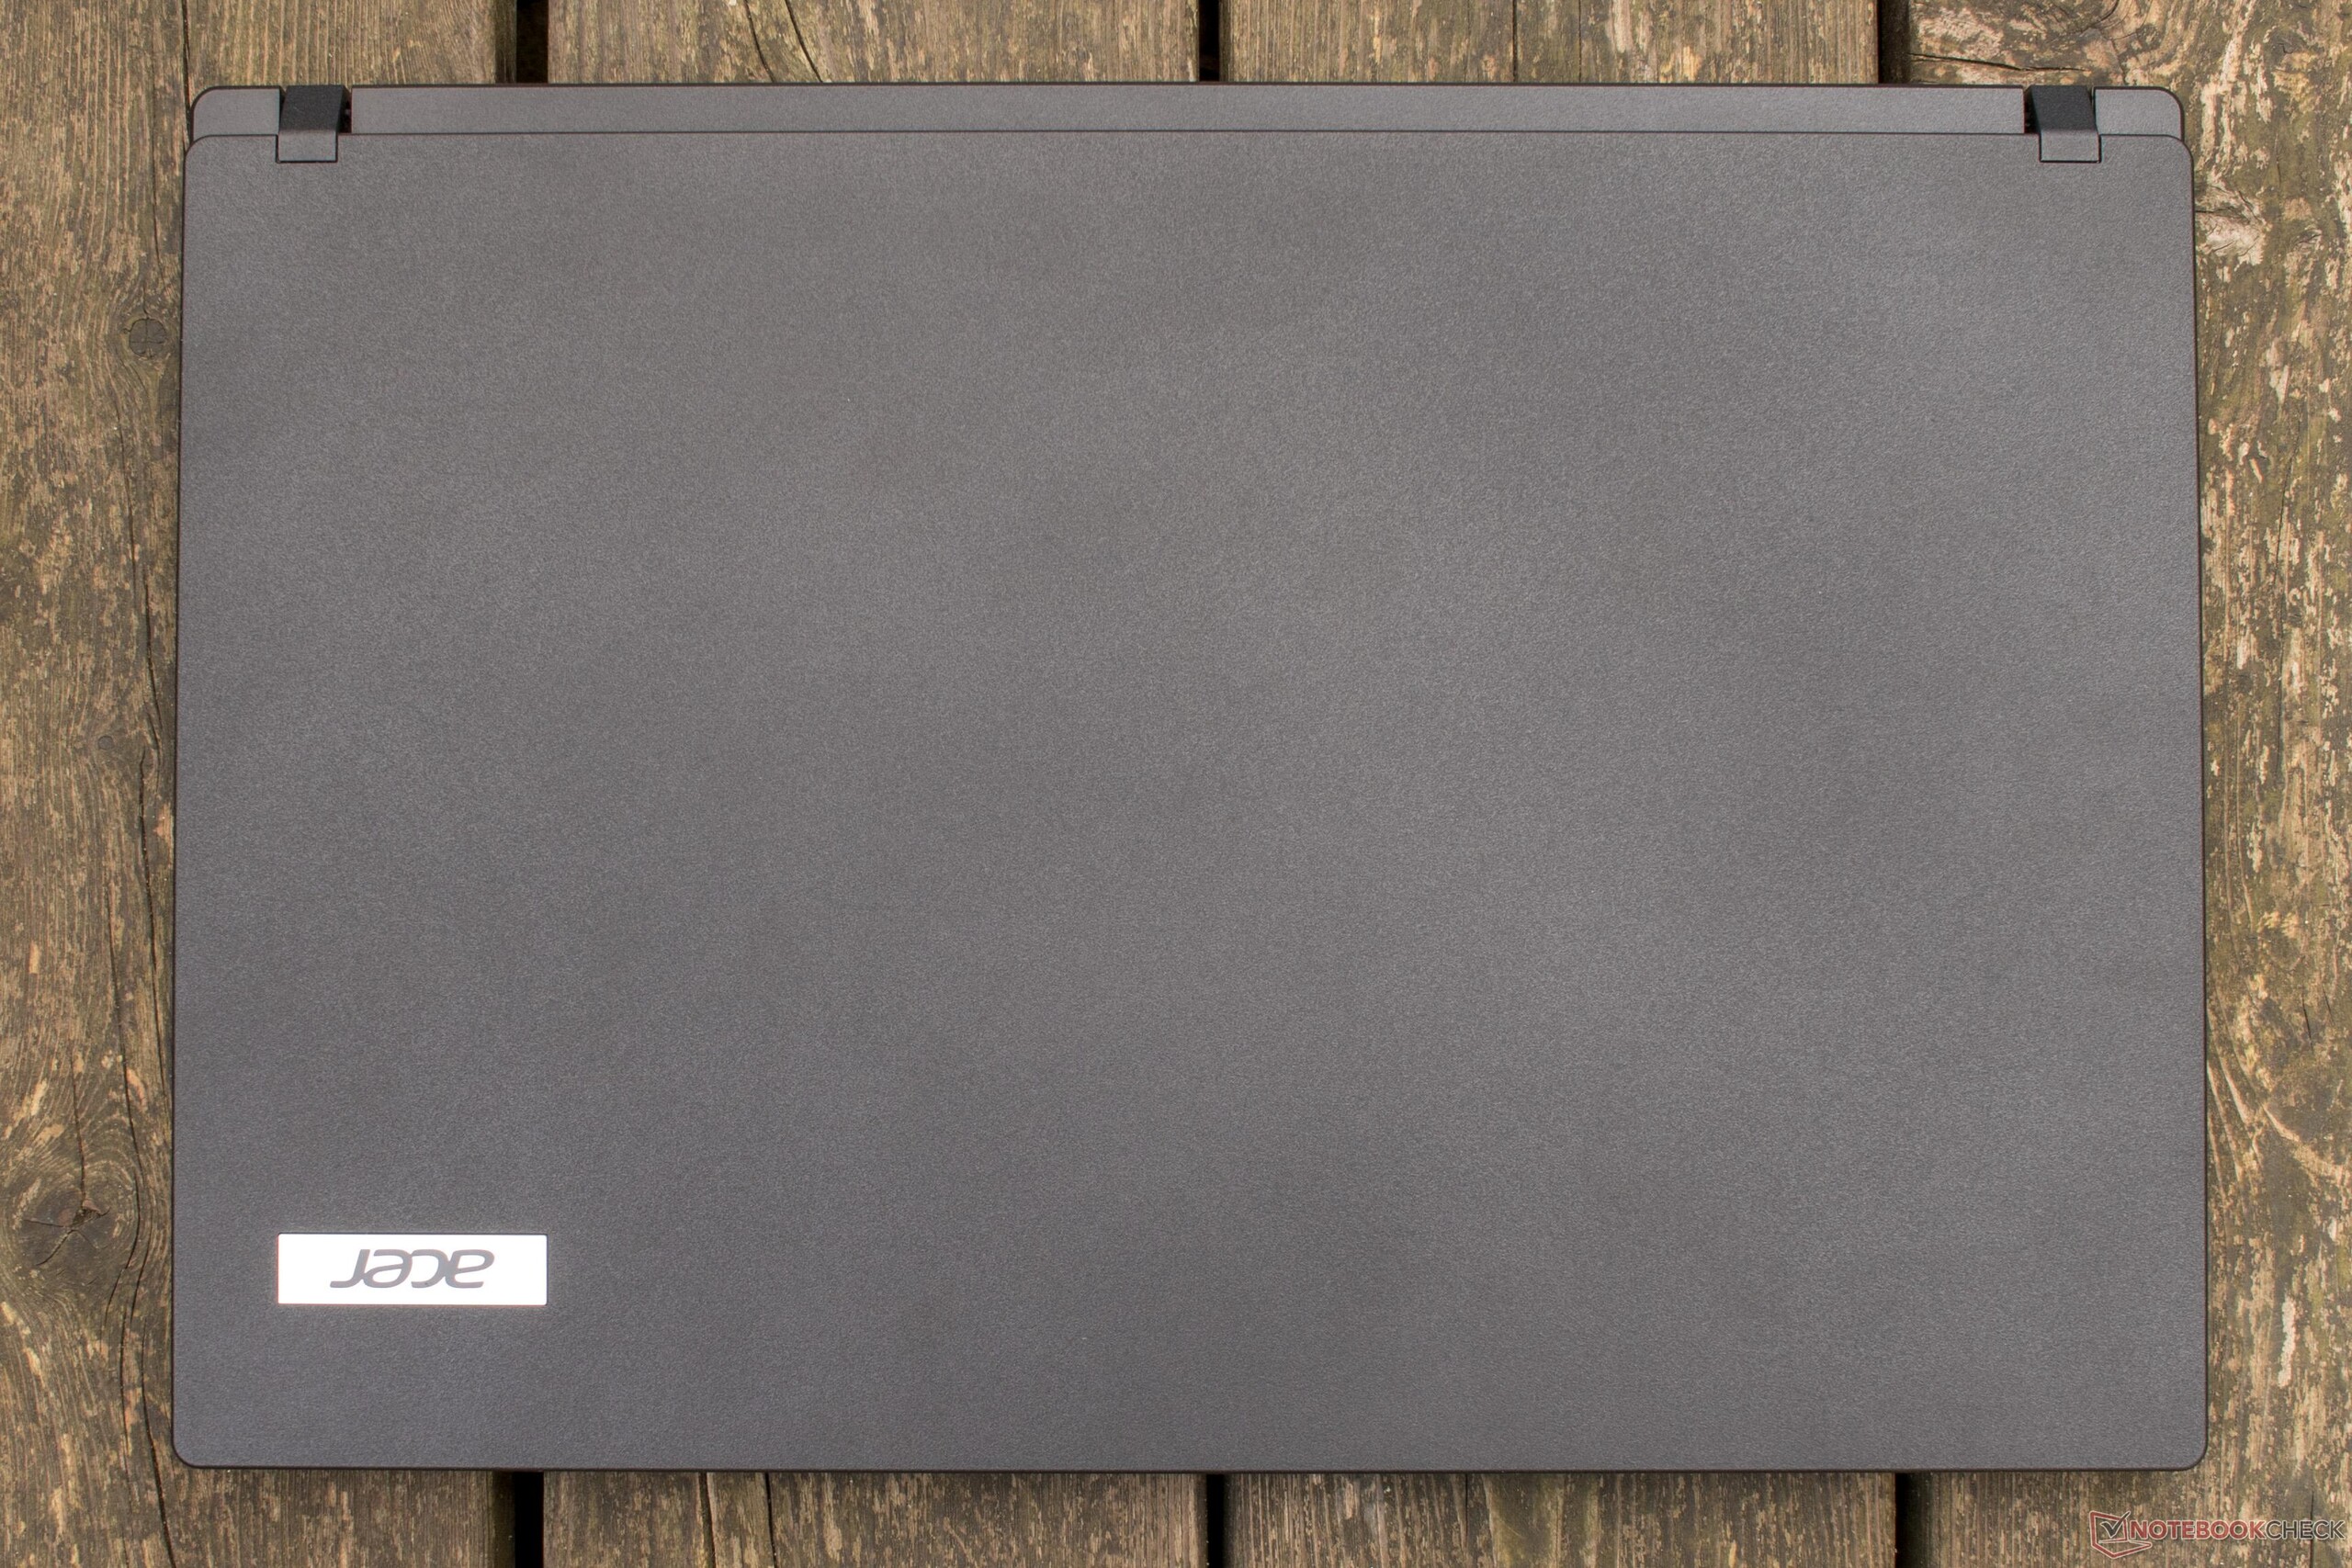
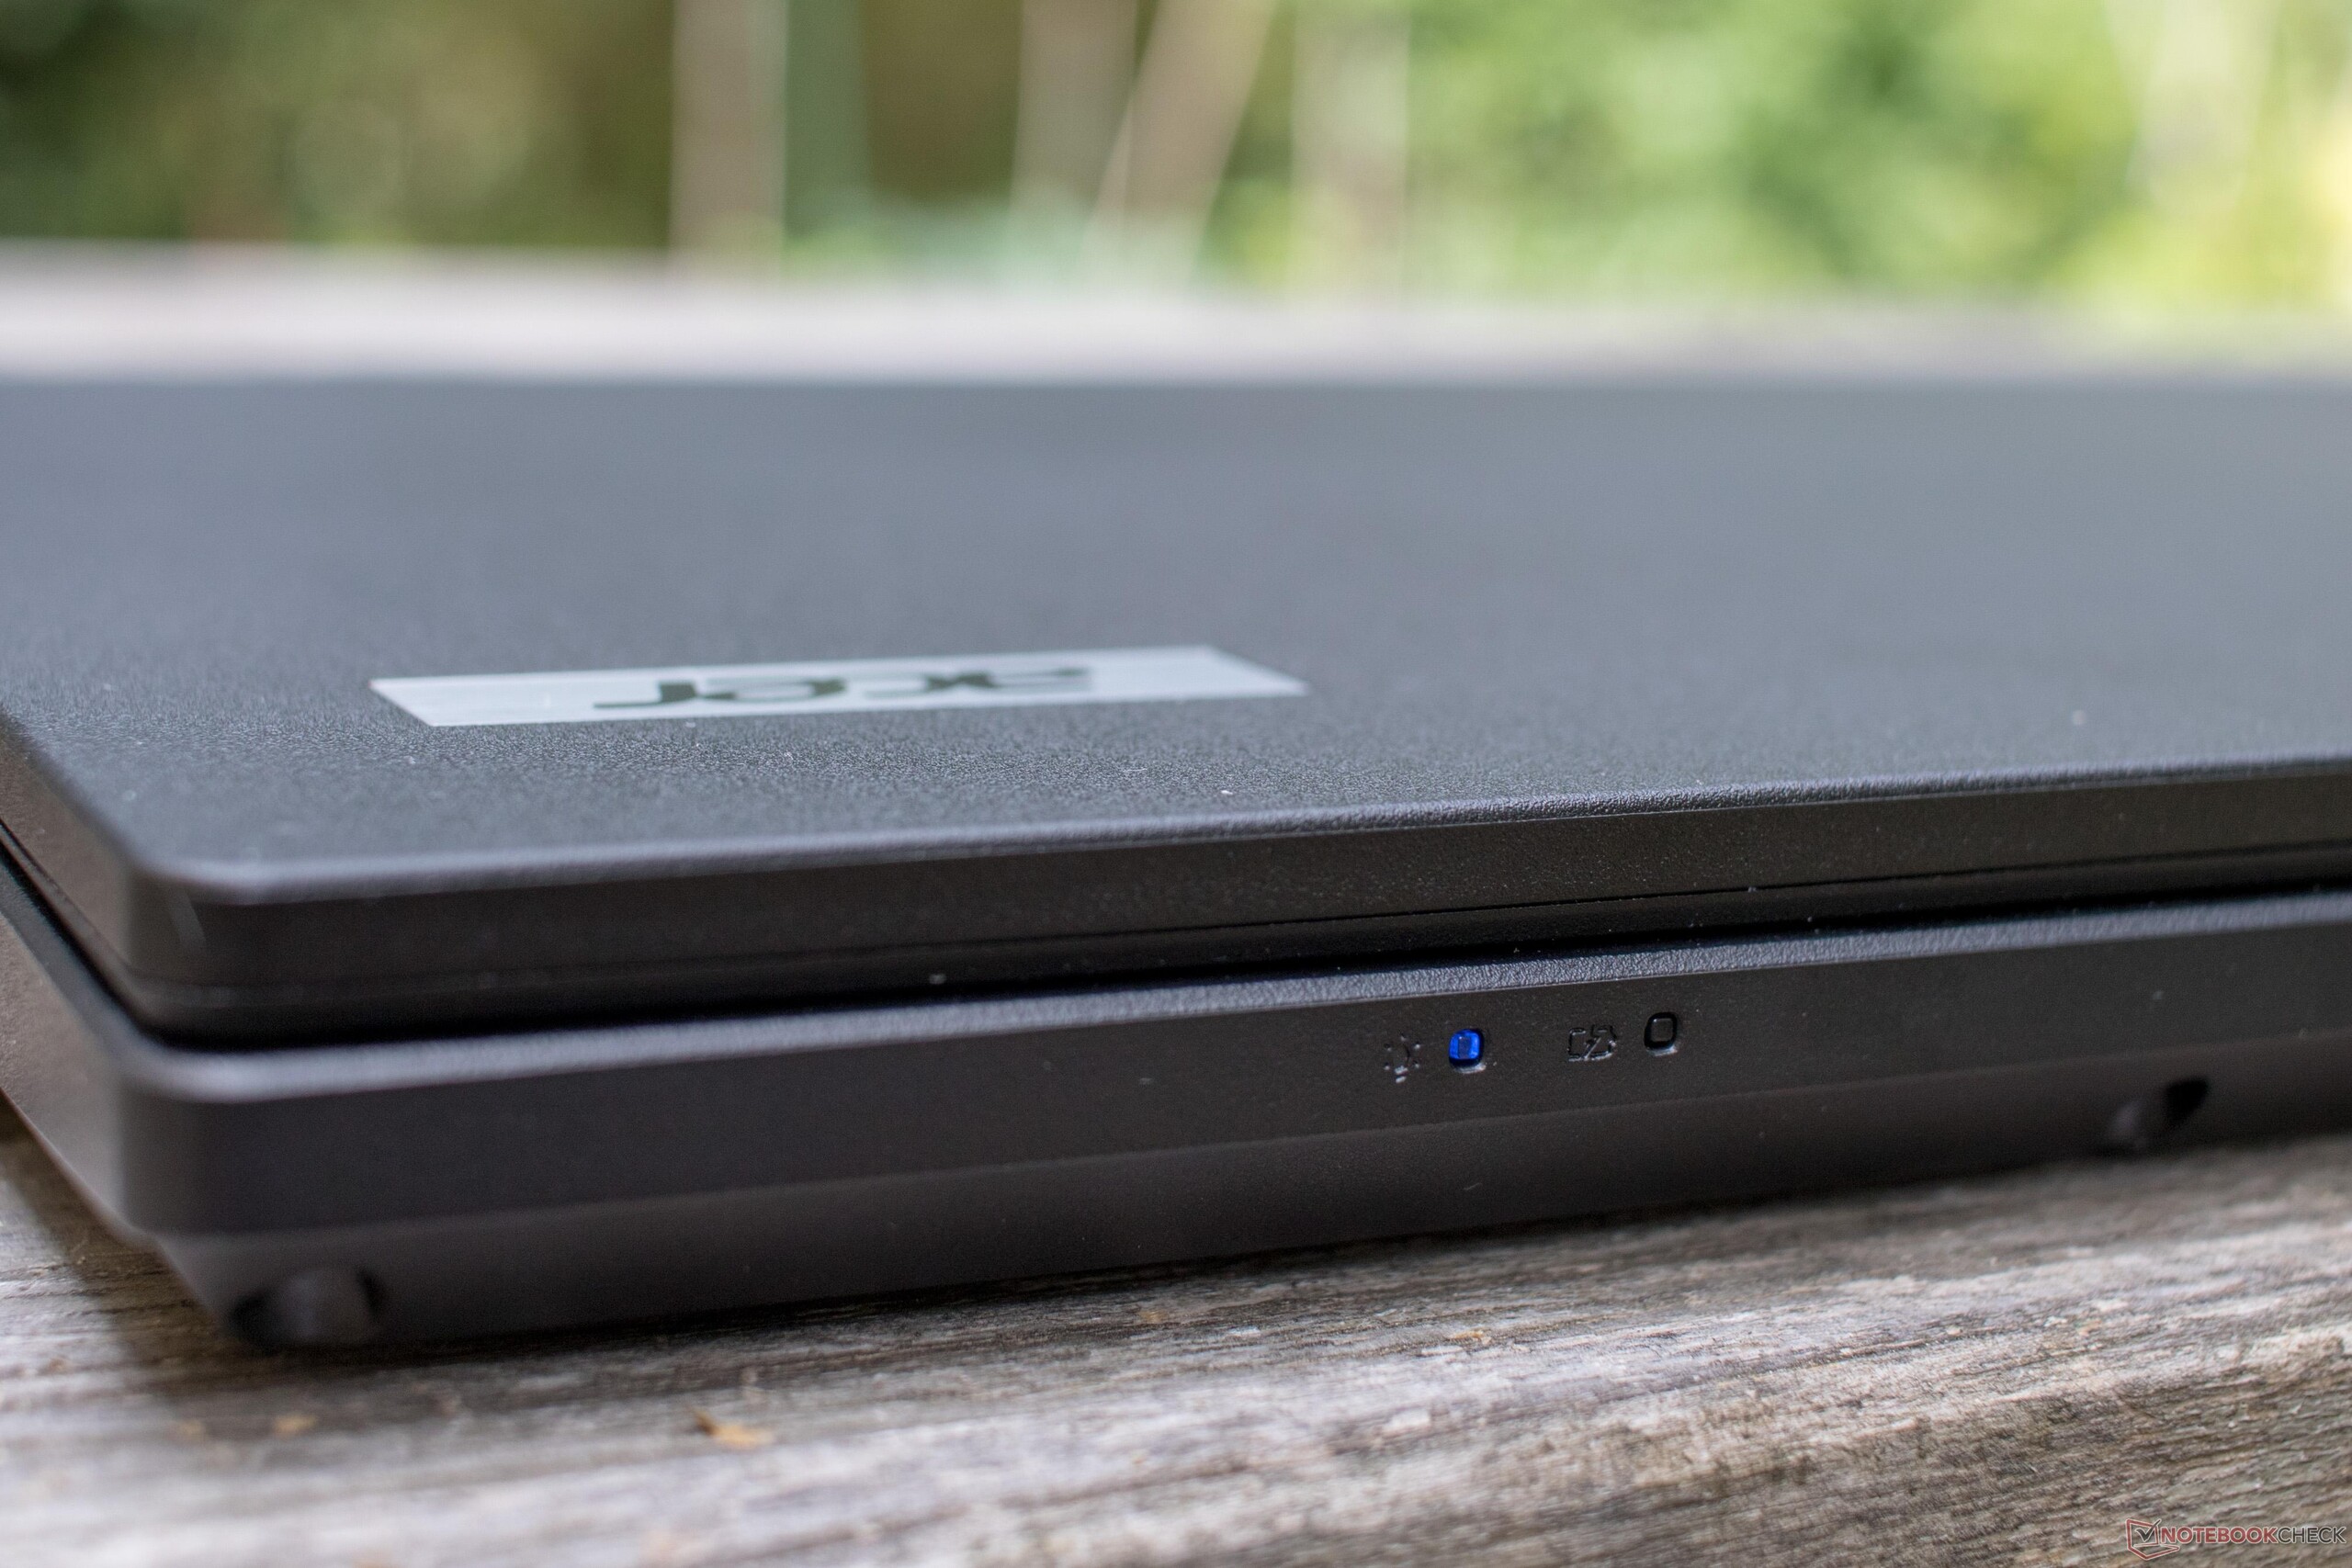
Também teria sido melhor usar um material de maior qualidade, especialmente na área da dobradiça ou na superfície da base, ou apenas para apimentar o preto simples com um ou outro elemento de design. No entanto, isso é tudo uma questão de gosto e é secundário para um usuário que precisa de um sistema suficientemente rápido para o trabalho de escritório e várias opções de conexão. No entanto, aqueles que consideram que o plástico é inaceitável na decisão de compra e que valorizam o design, sensação e materiais mais nobres, terá que escolher outro dispositivo. O TravelMate P648 tem aproximadamente o mesmo preço, mas está equipado com um Intel Core i7-7500U e HD Graphics 620 e vem com elementos de alumínio, plástico reforçado com fibra de carbono e dobradiças de metal.
Acer TravelMate 2410-G2-MG-82E6
- 08/22/2018 v6 (old)
Daniel Puschina