Breve Análise do Portátil Dell Latitude 7300: subportátil de negócios aquém dos seus objetivos de desempenho

| SD Card Reader | |
| average JPG Copy Test (av. of 3 runs) | |
| Dell Latitude 7300-P99G (Toshiba Exceria Pro M501 microSDXC 64GB) | |
| Dell Latitude 7390 (Toshiba Exceria Pro M501 UHS-II) | |
| Lenovo ThinkPad X390-20Q1S02M00 (Toshiba Exceria Pro M501) | |
| Média da turma Subnotebook (23.7 - 188, n=9, últimos 2 anos) | |
| maximum AS SSD Seq Read Test (1GB) | |
| Dell Latitude 7390 (Toshiba Exceria Pro M501 UHS-II) | |
| Dell Latitude 7300-P99G (Toshiba Exceria Pro M501 microSDXC 64GB) | |
| Média da turma Subnotebook (24.9 - 195, n=8, últimos 2 anos) | |
| Lenovo ThinkPad X390-20Q1S02M00 (Toshiba Exceria Pro M501) | |
| Networking | |
| iperf3 transmit AX12 | |
| Lenovo ThinkPad X390-20Q1S02M00 | |
| Dell Latitude 7300-P99G | |
| Dell XPS 13 9380 2019 | |
| HP EliteBook 830 G5-3JX74EA | |
| iperf3 receive AX12 | |
| Lenovo ThinkPad X390-20Q1S02M00 | |
| HP EliteBook 830 G5-3JX74EA | |
| Dell Latitude 7300-P99G | |
| Dell XPS 13 9380 2019 | |
| |||||||||||||||||||||||||
iluminação: 79 %
iluminação com acumulador: 341 cd/m²
Contraste: 1100:1 (Preto: 0.31 cd/m²)
ΔE ColorChecker Calman: 6.43 | ∀{0.5-29.43 Ø4.72}
calibrated: 2.36
ΔE Greyscale Calman: 6.9 | ∀{0.09-98 Ø4.97}
91% sRGB (Argyll 1.6.3 3D)
59% AdobeRGB 1998 (Argyll 1.6.3 3D)
65.5% AdobeRGB 1998 (Argyll 3D)
91.5% sRGB (Argyll 3D)
64.6% Display P3 (Argyll 3D)
Gamma: 2.23
CCT: 8338 K
| Dell Latitude 7300-P99G B133HAK, , 1920x1080, 13.3" | Dell Latitude 7390 LGD059B, , 1920x1080, 13.3" | Lenovo ThinkPad X390-20Q1S02M00 LP133WF7-SPB1, , 1920x1080, 13.3" | HP EliteBook 830 G5-3JX74EA IVO M133NVF3-R0, , 1920x1080, 13.3" | Dell XPS 13 9380 2019 FHD AUO5B2D B133HAN Dell P/N: 06VG6 , , 1920x1080, 13.3" | |
|---|---|---|---|---|---|
| Display | 4% | 3% | -1% | 9% | |
| Display P3 Coverage (%) | 64.6 | 67.8 5% | 65.3 1% | 64.2 -1% | 69.7 8% |
| sRGB Coverage (%) | 91.5 | 95.1 4% | 95.9 5% | 89.2 -3% | 99.4 9% |
| AdobeRGB 1998 Coverage (%) | 65.5 | 67.8 4% | 66.6 2% | 65.2 0% | 71.1 9% |
| Response Times | -4% | -37% | 8% | -30% | |
| Response Time Grey 50% / Grey 80% * (ms) | 39 ? | 36.8 ? 6% | 57.6 ? -48% | 36 ? 8% | 54 ? -38% |
| Response Time Black / White * (ms) | 27 ? | 30.4 ? -13% | 34 ? -26% | 24.8 ? 8% | 33 ? -22% |
| PWM Frequency (Hz) | 1020 ? | ||||
| Screen | 15% | 33% | 10% | 41% | |
| Brightness middle (cd/m²) | 341 | 303.8 -11% | 356 4% | 316 -7% | 428 26% |
| Brightness (cd/m²) | 306 | 289 -6% | 336 10% | 326 7% | 408 33% |
| Brightness Distribution (%) | 79 | 86 9% | 88 11% | 85 8% | 84 6% |
| Black Level * (cd/m²) | 0.31 | 0.31 -0% | 0.16 48% | 0.19 39% | 0.26 16% |
| Contrast (:1) | 1100 | 980 -11% | 2225 102% | 1663 51% | 1646 50% |
| Colorchecker dE 2000 * | 6.43 | 2.9 55% | 3.6 44% | 4.5 30% | 1.16 82% |
| Colorchecker dE 2000 max. * | 10.33 | 5.79 44% | 5.5 47% | 12.1 -17% | 2.19 79% |
| Colorchecker dE 2000 calibrated * | 2.36 | 1.72 27% | 1.1 53% | 2.9 -23% | 0.9 62% |
| Greyscale dE 2000 * | 6.9 | 3.7 46% | 4.7 32% | 5 28% | 1.23 82% |
| Gamma | 2.23 99% | 2.118 104% | 2.48 89% | 2.22 99% | 2.46 89% |
| CCT | 8338 78% | 6323 103% | 6374 102% | 6018 108% | 6648 98% |
| Color Space (Percent of AdobeRGB 1998) (%) | 59 | 63 7% | 61.3 4% | 57.9 -2% | 65 10% |
| Color Space (Percent of sRGB) (%) | 91 | 95 4% | 95.7 5% | 87.3 -4% | 99 9% |
| Média Total (Programa/Configurações) | 5% /
11% | -0% /
18% | 6% /
8% | 7% /
26% |
* ... menor é melhor
Exibir tempos de resposta
| ↔ Tempo de resposta preto para branco | ||
|---|---|---|
| 27 ms ... ascensão ↗ e queda ↘ combinadas | ↗ 14 ms ascensão | 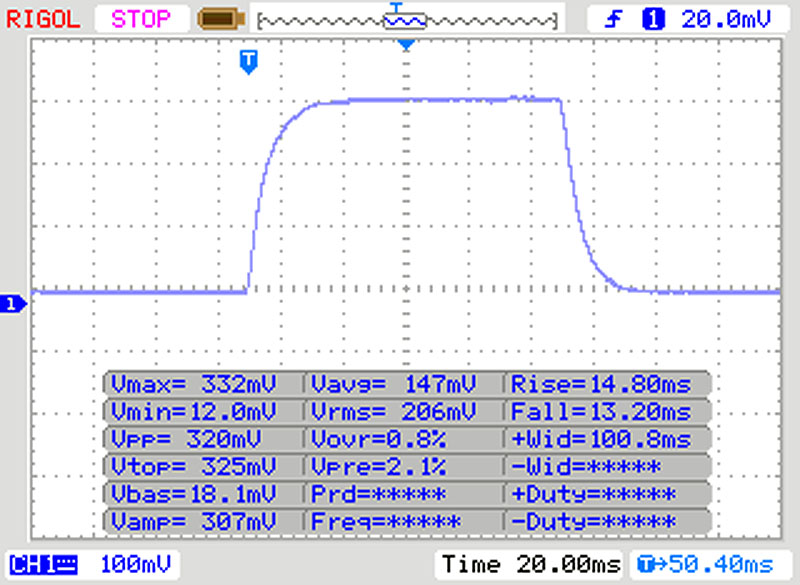 |
| ↘ 13 ms queda | ||
| A tela mostra taxas de resposta relativamente lentas em nossos testes e pode ser muito lenta para os jogadores. Em comparação, todos os dispositivos testados variam de 0.1 (mínimo) a 240 (máximo) ms. » 67 % de todos os dispositivos são melhores. Isso significa que o tempo de resposta medido é pior que a média de todos os dispositivos testados (19.8 ms). | ||
| ↔ Tempo de resposta 50% cinza a 80% cinza | ||
| 39 ms ... ascensão ↗ e queda ↘ combinadas | ↗ 18 ms ascensão | 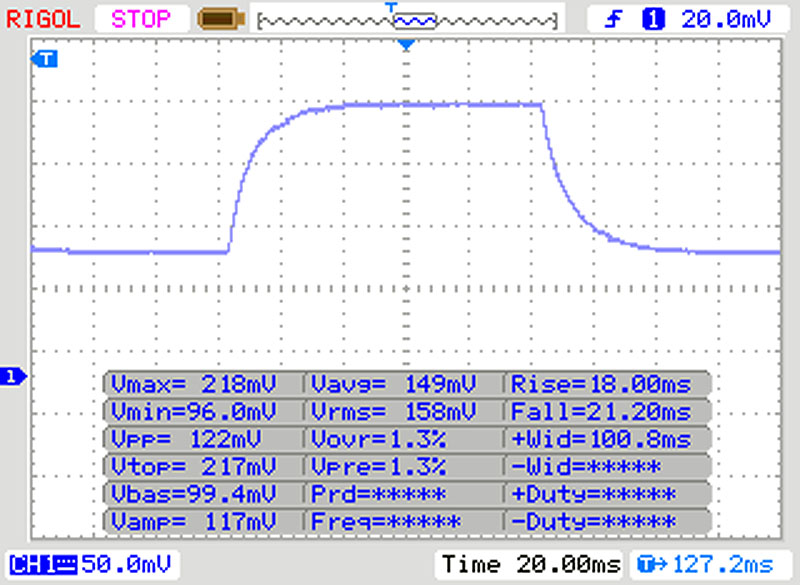 |
| ↘ 21 ms queda | ||
| A tela mostra taxas de resposta lentas em nossos testes e será insatisfatória para os jogadores. Em comparação, todos os dispositivos testados variam de 0.165 (mínimo) a 636 (máximo) ms. » 59 % de todos os dispositivos são melhores. Isso significa que o tempo de resposta medido é pior que a média de todos os dispositivos testados (31 ms). | ||
Cintilação da tela / PWM (modulação por largura de pulso)
| Tela tremeluzindo / PWM não detectado |  | ||
[pwm_comparison] Em comparação: 52 % de todos os dispositivos testados não usam PWM para escurecer a tela. Se PWM foi detectado, uma média de 7775 (mínimo: 5 - máximo: 343500) Hz foi medida. | |||
| PCMark 8 Home Score Accelerated v2 | 4211 pontos | |
| PCMark 8 Creative Score Accelerated v2 | 5417 pontos | |
| PCMark 8 Work Score Accelerated v2 | 5093 pontos | |
| PCMark 10 Score | 4208 pontos | |
Ajuda | ||
| Dell Latitude 7300-P99G Samsung SSD PM981 MZVLB512HAJQ | Dell Latitude 7390 Samsung PM961 MZVLW256HEHP | Lenovo ThinkPad X390-20Q1S02M00 Intel SSD Pro 7600p SSDPEKKF512G8L | HP EliteBook 830 G5-3JX74EA Samsung SSD PM961 1TB M.2 PCIe 3.0 x4 NVMe (MZVLW1T0) | Média Samsung SSD PM981 MZVLB512HAJQ | |
|---|---|---|---|---|---|
| CrystalDiskMark 5.2 / 6 | -16% | -16% | -24% | -15% | |
| Write 4K (MB/s) | 141.1 | 139.4 -1% | 120.7 -14% | 108.5 -23% | 126.7 ? -10% |
| Read 4K (MB/s) | 46.37 | 43.18 -7% | 58.5 26% | 40.53 -13% | 44 ? -5% |
| Write Seq (MB/s) | 1994 | 1075 -46% | 1491 -25% | 1026 -49% | 1617 ? -19% |
| Read Seq (MB/s) | 2275 | 1639 -28% | 2760 21% | 2080 -9% | 1716 ? -25% |
| Write 4K Q32T1 (MB/s) | 493.3 | 662 34% | 237.5 -52% | 451 -9% | 413 ? -16% |
| Read 4K Q32T1 (MB/s) | 429 | 413.9 -4% | 336.1 -22% | 269.7 -37% | 420 ? -2% |
| Write Seq Q32T1 (MB/s) | 2992 | 1195 -60% | 1512 -49% | 1770 -41% | 2076 ? -31% |
| Read Seq Q32T1 (MB/s) | 3562 | 3116 -13% | 3154 -11% | 3214 -10% | 3130 ? -12% |

| 3DMark 11 Performance | 2046 pontos | |
| 3DMark Cloud Gate Standard Score | 8916 pontos | |
| 3DMark Fire Strike Score | 1183 pontos | |
Ajuda | ||
| baixo | média | alto | ultra | |
|---|---|---|---|---|
| BioShock Infinite (2013) | 77.2 | 41.5 | 34.6 | 10.9 |
| The Witcher 3 (2015) | 17.8 | |||
| Rise of the Tomb Raider (2016) | 23.5 |
Barulho
| Ocioso |
| 30 / 30 / 30 dB |
| Carga |
| 35 / 35 dB |
 | ||
30 dB silencioso 40 dB(A) audível 50 dB(A) ruidosamente alto |
||
min: | ||
(-) A temperatura máxima no lado superior é 48 °C / 118 F, em comparação com a média de 35.9 °C / 97 F , variando de 21.4 a 59 °C para a classe Subnotebook.
(-) A parte inferior aquece até um máximo de 54 °C / 129 F, em comparação com a média de 39.2 °C / 103 F
(+) Em uso inativo, a temperatura média para o lado superior é 27.2 °C / 81 F, em comparação com a média do dispositivo de 30.8 °C / ### class_avg_f### F.
(+) Os apoios para as mãos e o touchpad estão atingindo a temperatura máxima da pele (33 °C / 91.4 F) e, portanto, não estão quentes.
(-) A temperatura média da área do apoio para as mãos de dispositivos semelhantes foi 28.2 °C / 82.8 F (-4.8 °C / -8.6 F).
Dell Latitude 7300-P99G análise de áudio
(±) | o volume do alto-falante é médio, mas bom (###valor### dB)
Graves 100 - 315Hz
(-) | quase nenhum baixo - em média 19.5% menor que a mediana
(±) | a linearidade dos graves é média (7.3% delta para a frequência anterior)
Médios 400 - 2.000 Hz
(+) | médios equilibrados - apenas 3.3% longe da mediana
(+) | médios são lineares (6.7% delta para frequência anterior)
Altos 2 - 16 kHz
(+) | agudos equilibrados - apenas 4.8% longe da mediana
(±) | a linearidade dos máximos é média (7.4% delta para frequência anterior)
Geral 100 - 16.000 Hz
(±) | a linearidade do som geral é média (17.9% diferença em relação à mediana)
Comparado com a mesma classe
» 51% de todos os dispositivos testados nesta classe foram melhores, 7% semelhantes, 42% piores
» O melhor teve um delta de 5%, a média foi 18%, o pior foi 53%
Comparado com todos os dispositivos testados
» 37% de todos os dispositivos testados foram melhores, 8% semelhantes, 55% piores
» O melhor teve um delta de 4%, a média foi 24%, o pior foi 134%
HP EliteBook 830 G5-3JX74EA análise de áudio
(+) | os alto-falantes podem tocar relativamente alto (###valor### dB)
Graves 100 - 315Hz
(-) | quase nenhum baixo - em média 19.9% menor que a mediana
(±) | a linearidade dos graves é média (11.3% delta para a frequência anterior)
Médios 400 - 2.000 Hz
(+) | médios equilibrados - apenas 2.3% longe da mediana
(+) | médios são lineares (4.8% delta para frequência anterior)
Altos 2 - 16 kHz
(+) | agudos equilibrados - apenas 4% longe da mediana
(+) | os máximos são lineares (5.6% delta da frequência anterior)
Geral 100 - 16.000 Hz
(±) | a linearidade do som geral é média (17% diferença em relação à mediana)
Comparado com a mesma classe
» 43% de todos os dispositivos testados nesta classe foram melhores, 8% semelhantes, 49% piores
» O melhor teve um delta de 5%, a média foi 18%, o pior foi 53%
Comparado com todos os dispositivos testados
» 30% de todos os dispositivos testados foram melhores, 8% semelhantes, 62% piores
» O melhor teve um delta de 4%, a média foi 24%, o pior foi 134%
| desligado | |
| Ocioso | |
| Carga |
|
Key:
min: | |
| Dell Latitude 7300-P99G i7-8665U, UHD Graphics 620, Samsung SSD PM981 MZVLB512HAJQ, IPS LED, 1920x1080, 13.3" | Dell Latitude 7390 i7-8650U, UHD Graphics 620, Samsung PM961 MZVLW256HEHP, IPS, 1920x1080, 13.3" | Lenovo ThinkPad X390-20Q1S02M00 i5-8265U, UHD Graphics 620, Intel SSD Pro 7600p SSDPEKKF512G8L, IPS LED, 1920x1080, 13.3" | HP EliteBook 830 G5-3JX74EA i5-8550U, UHD Graphics 620, Samsung SSD PM961 1TB M.2 PCIe 3.0 x4 NVMe (MZVLW1T0), IPS LED, 1920x1080, 13.3" | Dell XPS 13 9380 2019 FHD i7-8565U, UHD Graphics 620, SK hynix PC401 HFS256GD9TNG, , 1920x1080, 13.3" | Média Intel UHD Graphics 620 | Média da turma Subnotebook | |
|---|---|---|---|---|---|---|---|
| Power Consumption | 4% | -8% | -16% | -2% | -5% | -12% | |
| Idle Minimum * (Watt) | 2.5 | 3.3 -32% | 3.4 -36% | 4.5 -80% | 3.6 -44% | 3.81 ? -52% | 3.86 ? -54% |
| Idle Average * (Watt) | 6.6 | 5.9 11% | 5.6 15% | 6.4 3% | 5.7 14% | 6.94 ? -5% | 6.61 ? -0% |
| Idle Maximum * (Watt) | 8.7 | 6.2 29% | 8.7 -0% | 9.2 -6% | 7.4 15% | 8.75 ? -1% | 8 ? 8% |
| Load Average * (Watt) | 35.4 | 43.2 -22% | 43.6 -23% | 35.7 -1% | 44 -24% | 35 ? 1% | 42.2 ? -19% |
| Load Maximum * (Watt) | 68.1 | 45.2 34% | 65 5% | 65.4 4% | 48.1 29% | 47.5 ? 30% | 64.5 ? 5% |
* ... menor é melhor
| Dell Latitude 7300-P99G i7-8665U, UHD Graphics 620, 60 Wh | Dell Latitude 7390 i7-8650U, UHD Graphics 620, 60 Wh | Lenovo ThinkPad X390-20Q1S02M00 i5-8265U, UHD Graphics 620, 48 Wh | HP EliteBook 830 G5-3JX74EA i5-8550U, UHD Graphics 620, 49 Wh | Dell XPS 13 9380 2019 FHD i7-8565U, UHD Graphics 620, 52 Wh | Média da turma Subnotebook | |
|---|---|---|---|---|---|---|
| Duração da bateria | 3% | -8% | -14% | 19% | 24% | |
| H.264 (h) | 11.1 | 12.7 14% | 8 -28% | 15.4 ? 39% | ||
| WiFi v1.3 (h) | 10.8 | 11.1 3% | 8.3 -23% | 7.1 -34% | 13.2 22% | 14 ? 30% |
| Load (h) | 1.9 | 1.6 -16% | 2.3 21% | 2.2 16% | 1.969 ? 4% | |
| Reader / Idle (h) | 12.8 | 31.9 | 28.6 ? |
Pro
Contra
A Dell redesenhou seu Latitude de 13,3 polegadas sem mudar muito. Pelo menos no mais escuro dos dois modelos, com sua carcaça de fibra de carbono que tivemos em análise. O SKU de alumínio parece muito diferente do seu antecessor.
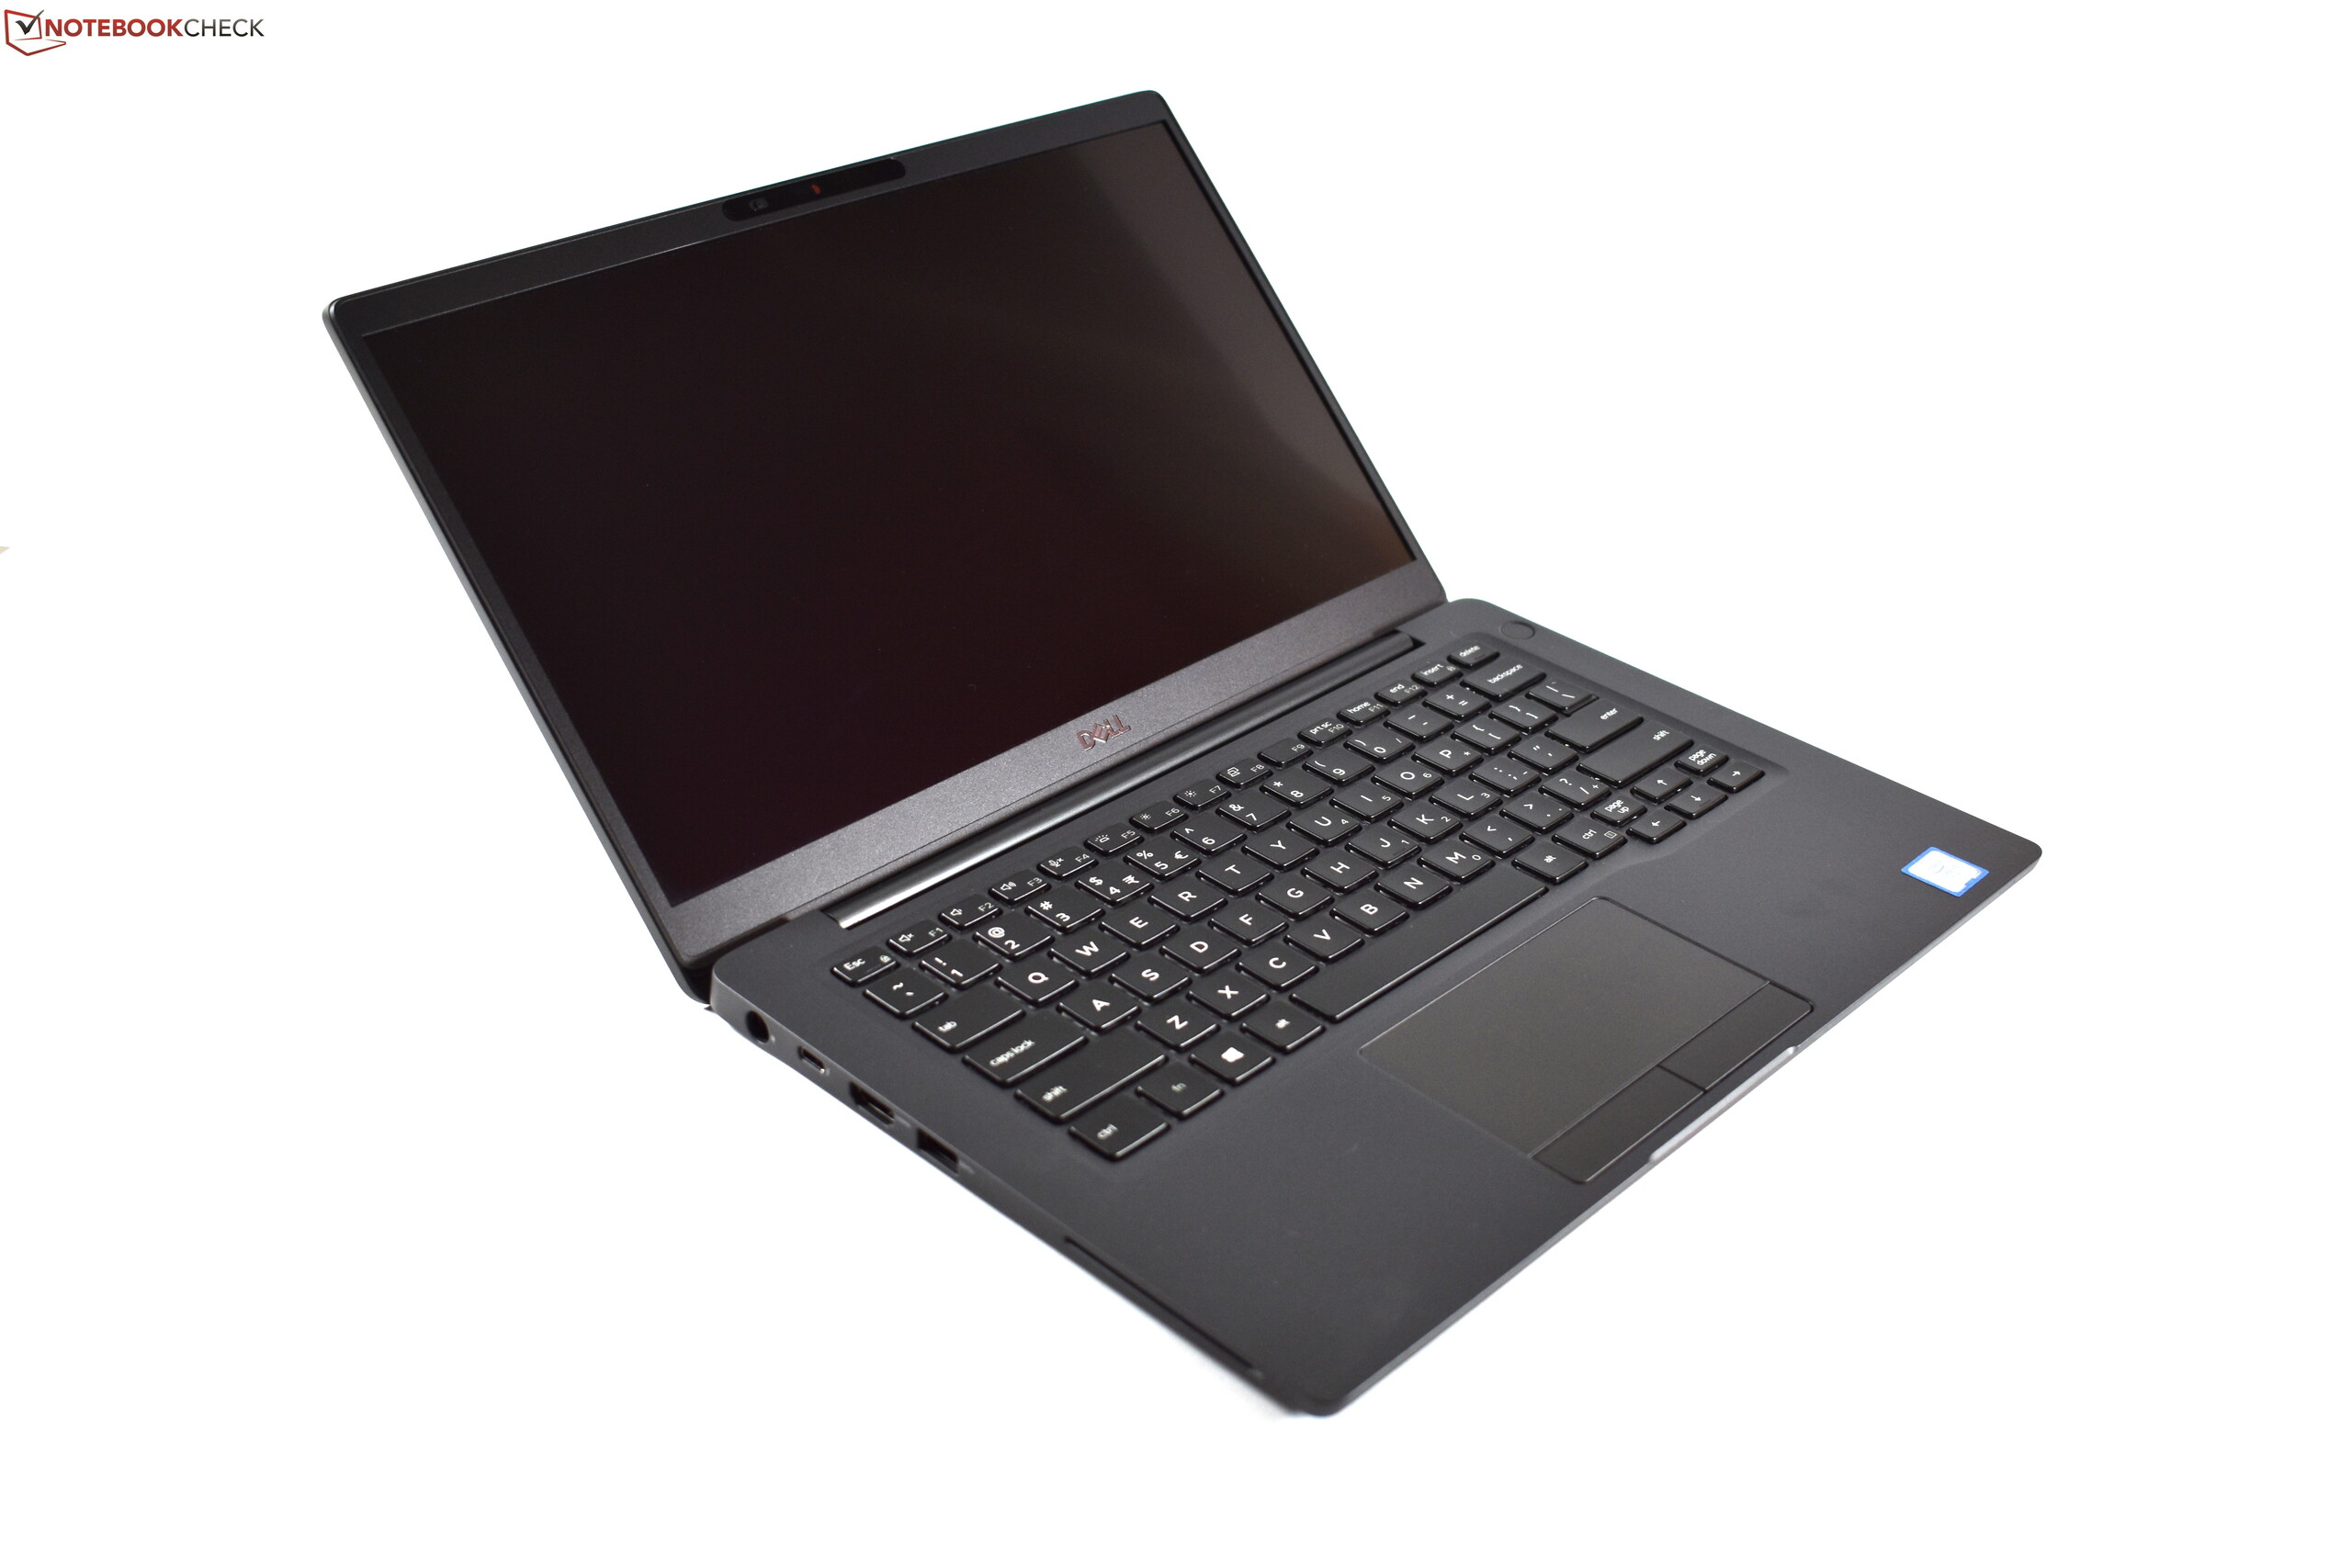
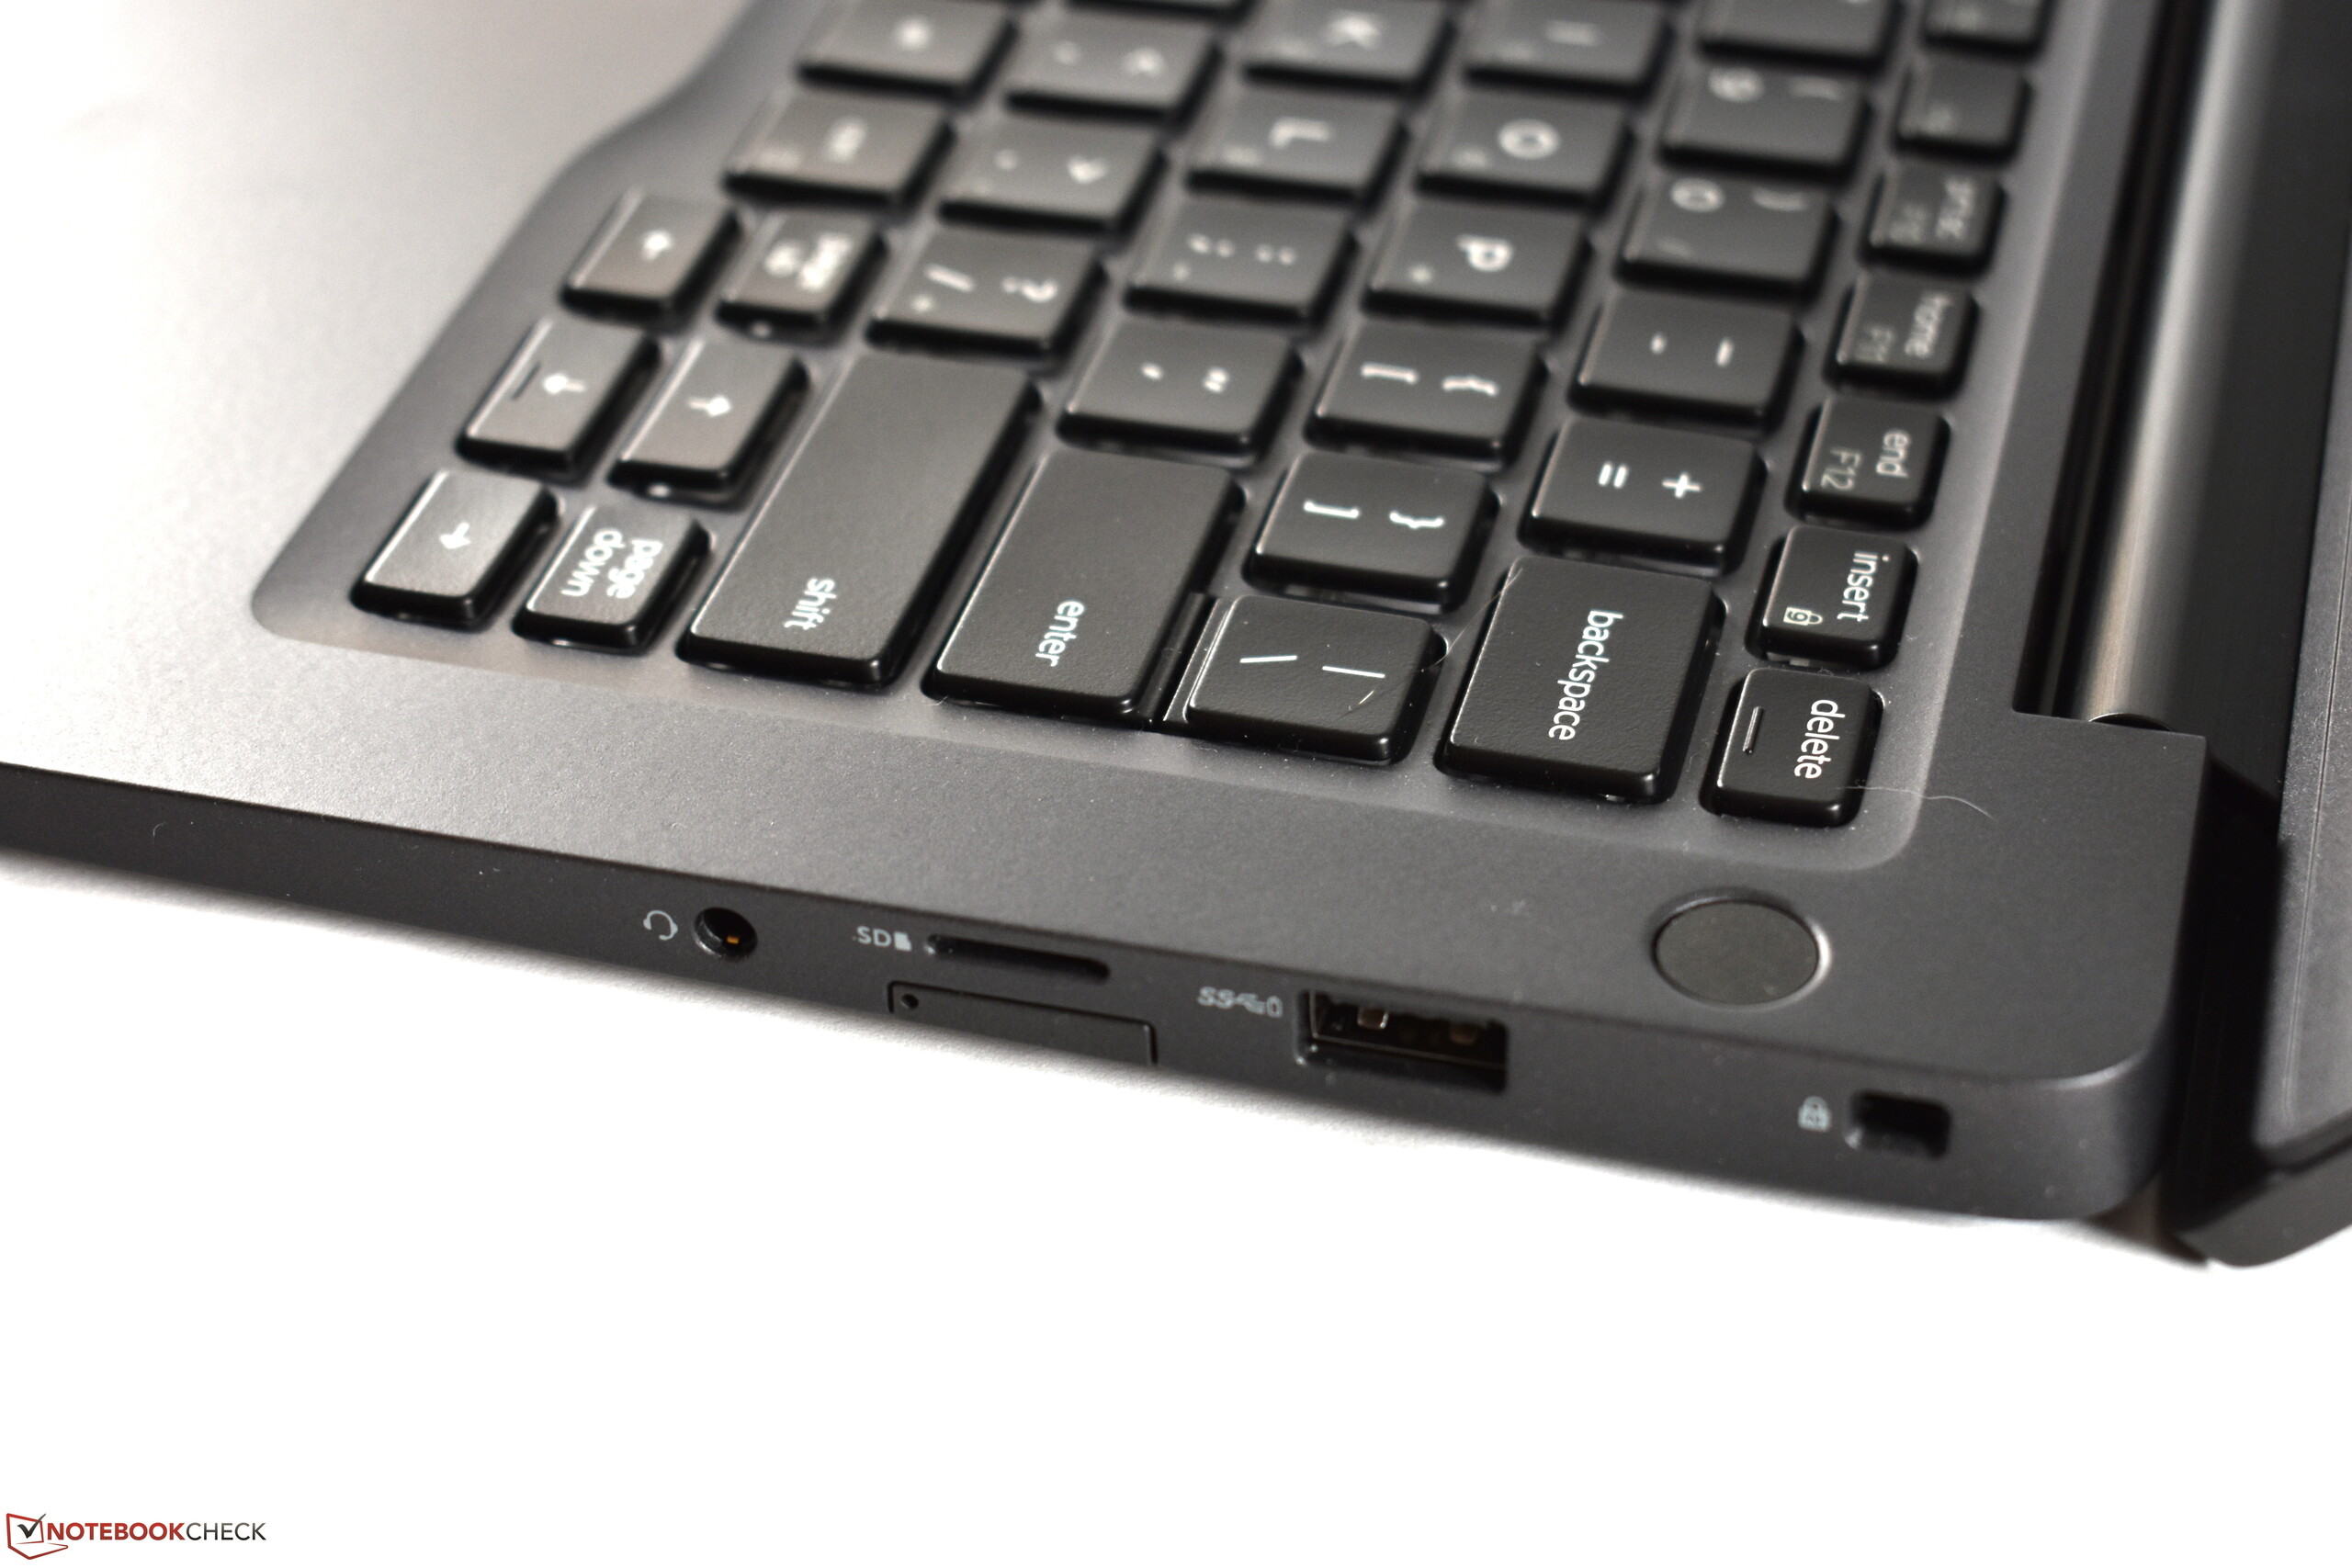
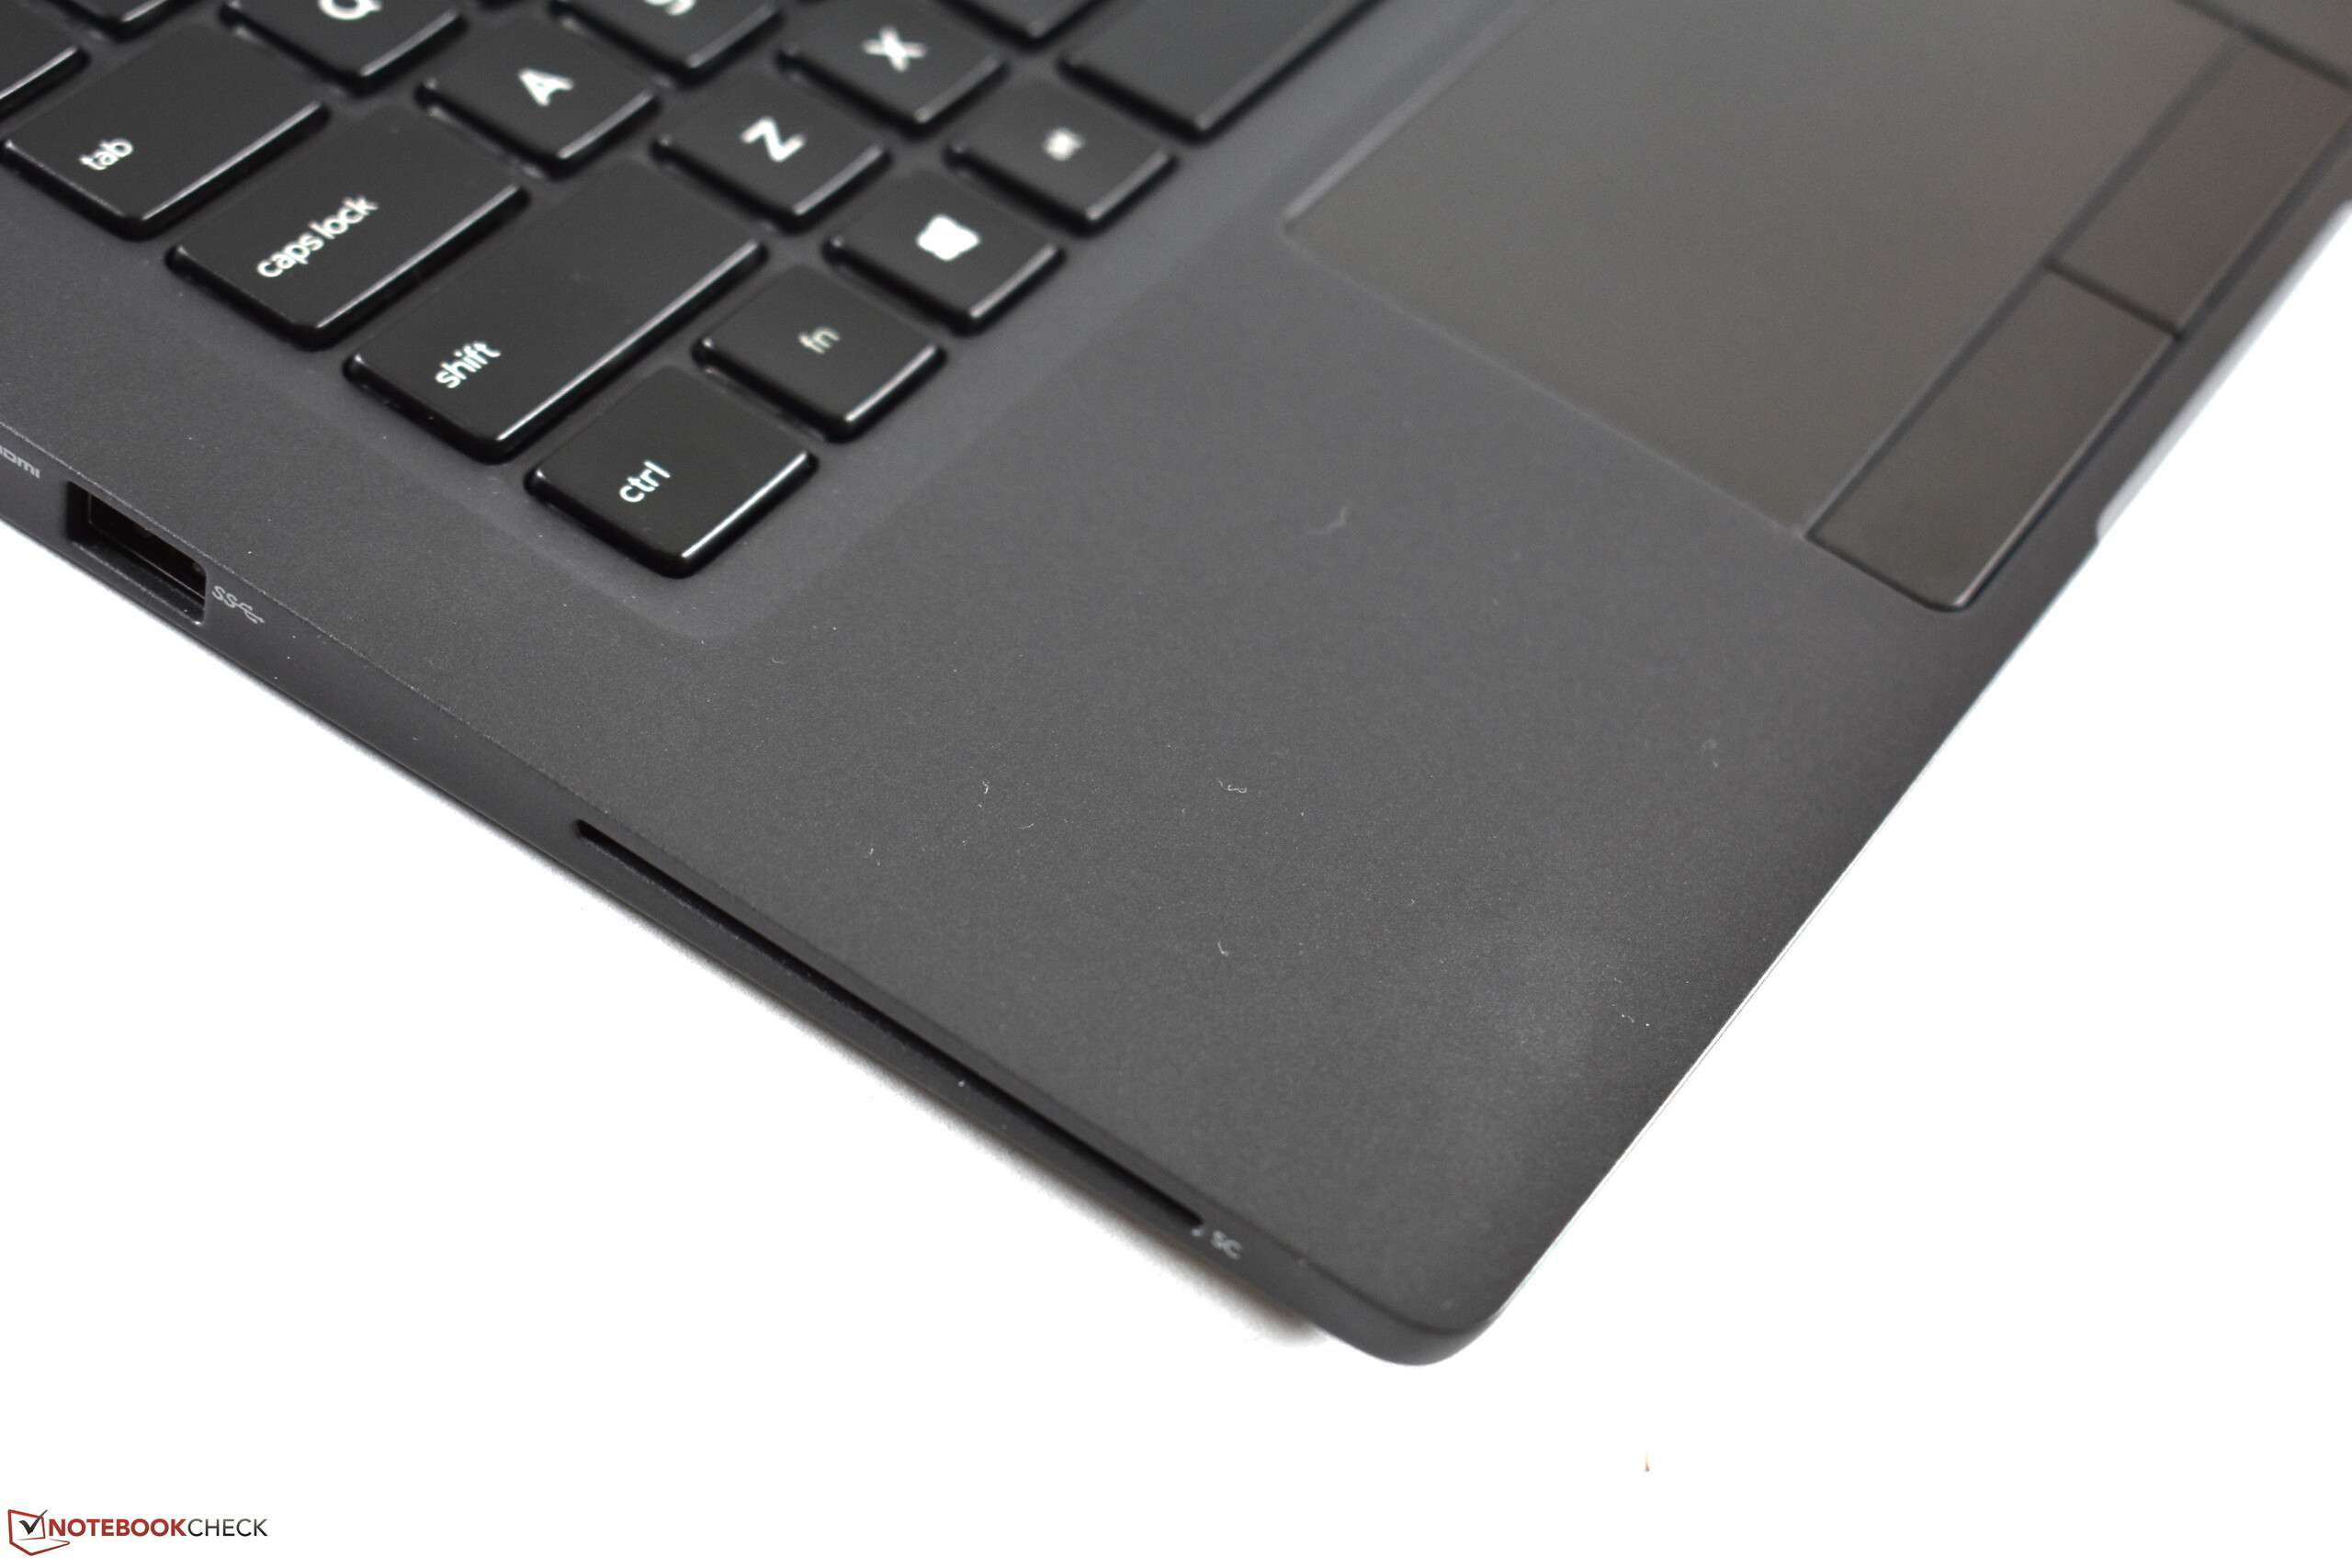
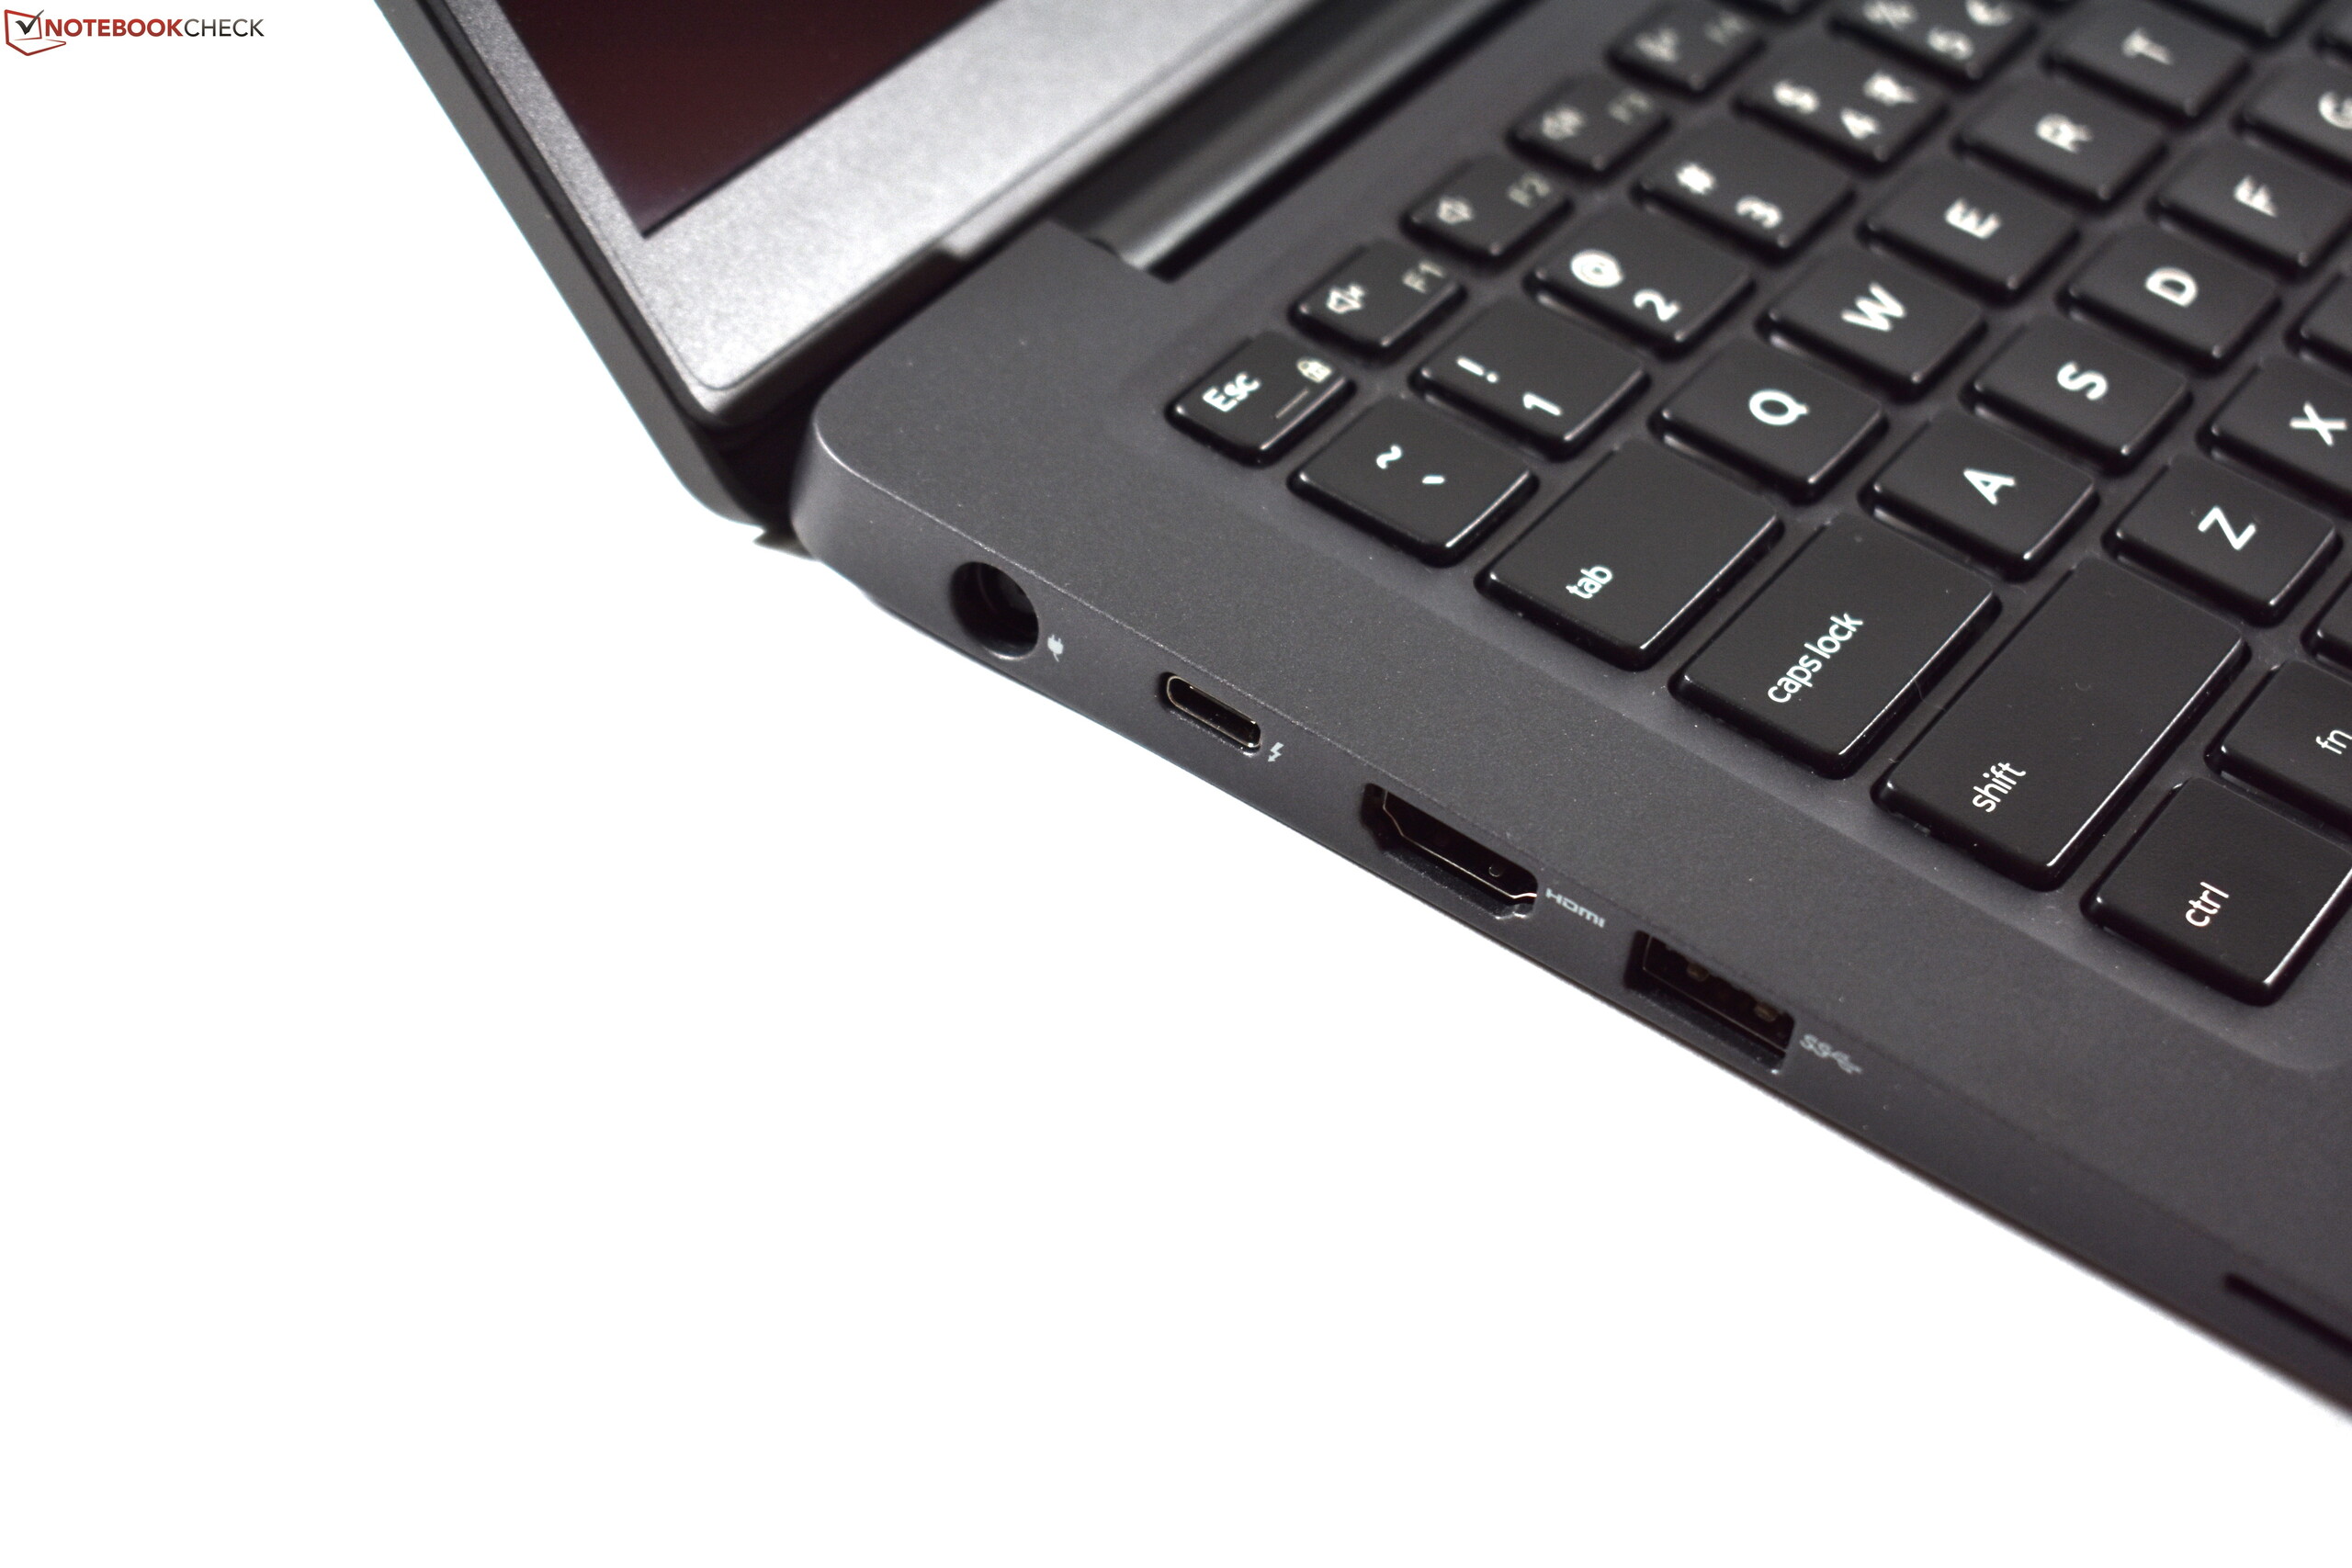
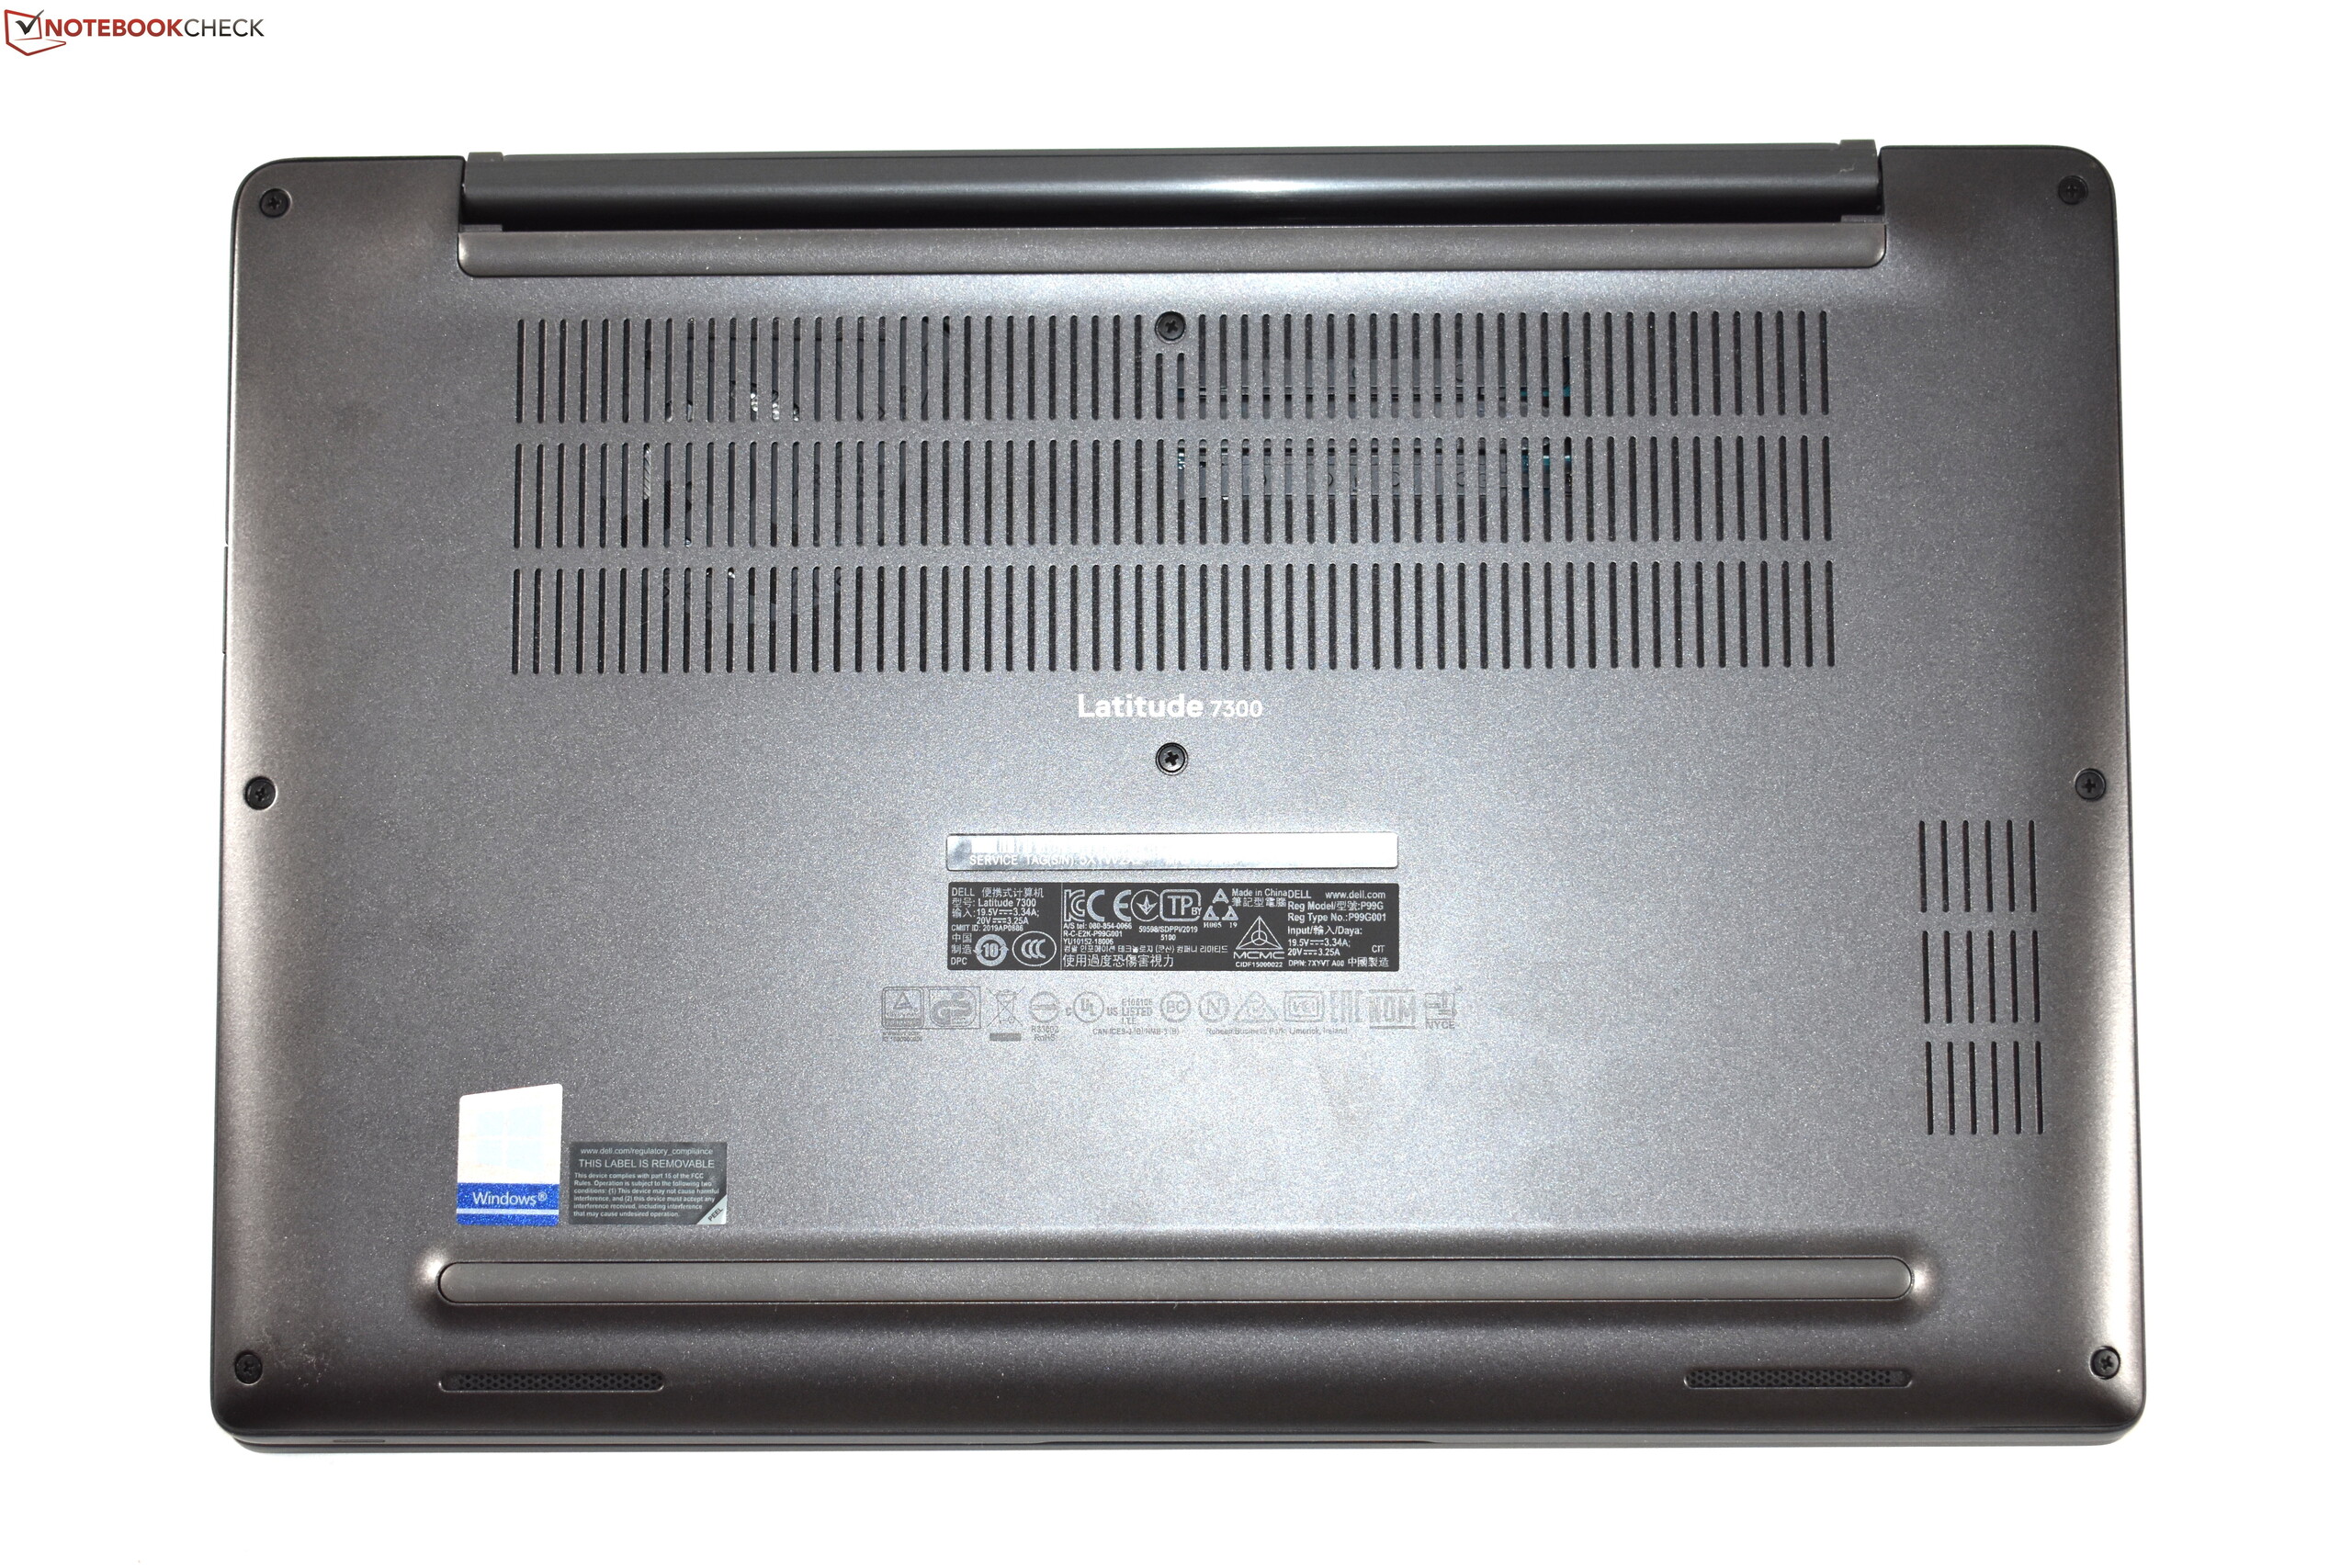
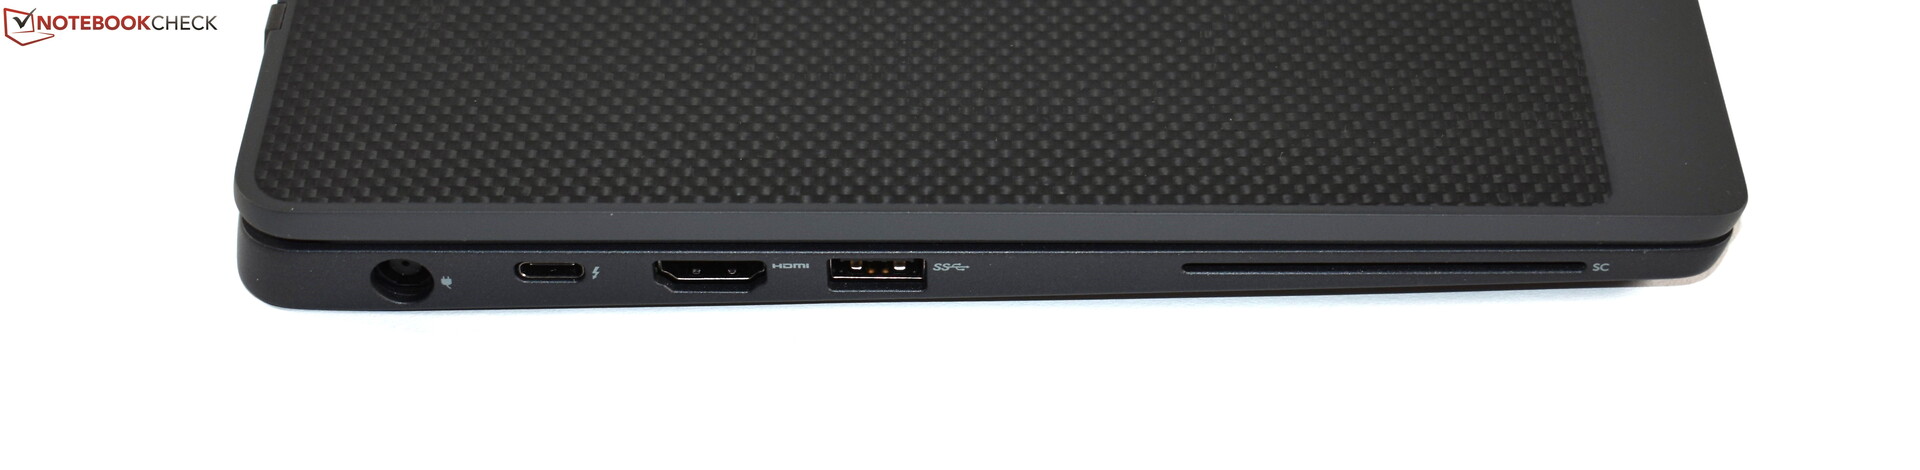
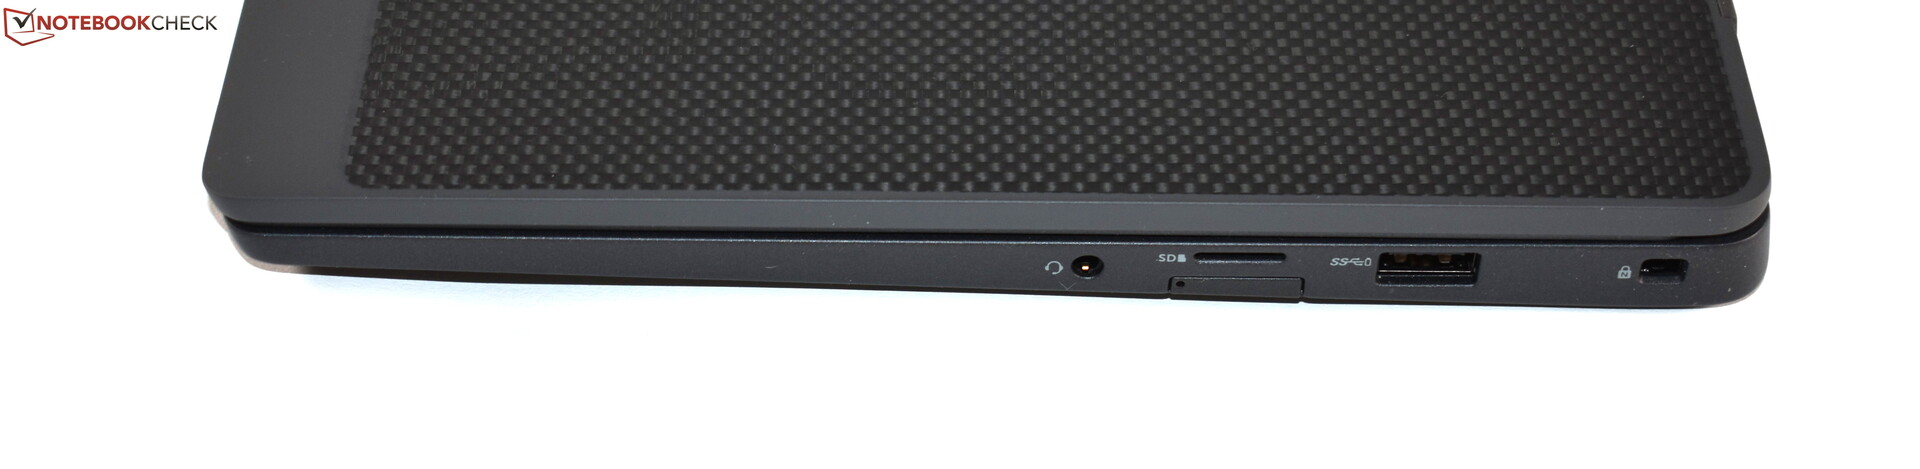
A carcaça compacta de alta qualidade é um dos destaques do Latitude, assim como o teclado confortável. A tela está equipada com uma camada de toque que permite entradas adicionais. O leitor de cartões microSD é facilmente acessível e incrivelmente rápido. Além disso, o Latitude possui várias portas e recursos de segurança. Também é facilmente atualizável graças a dois slots de RAM, um slot WWAN livre e um modem Wi-Fi com soquete. Ele vem com 3 anos de garantia no local/em casa e funcionou por quase 11 horas com bateria em nosso teste de Wi-Fi.
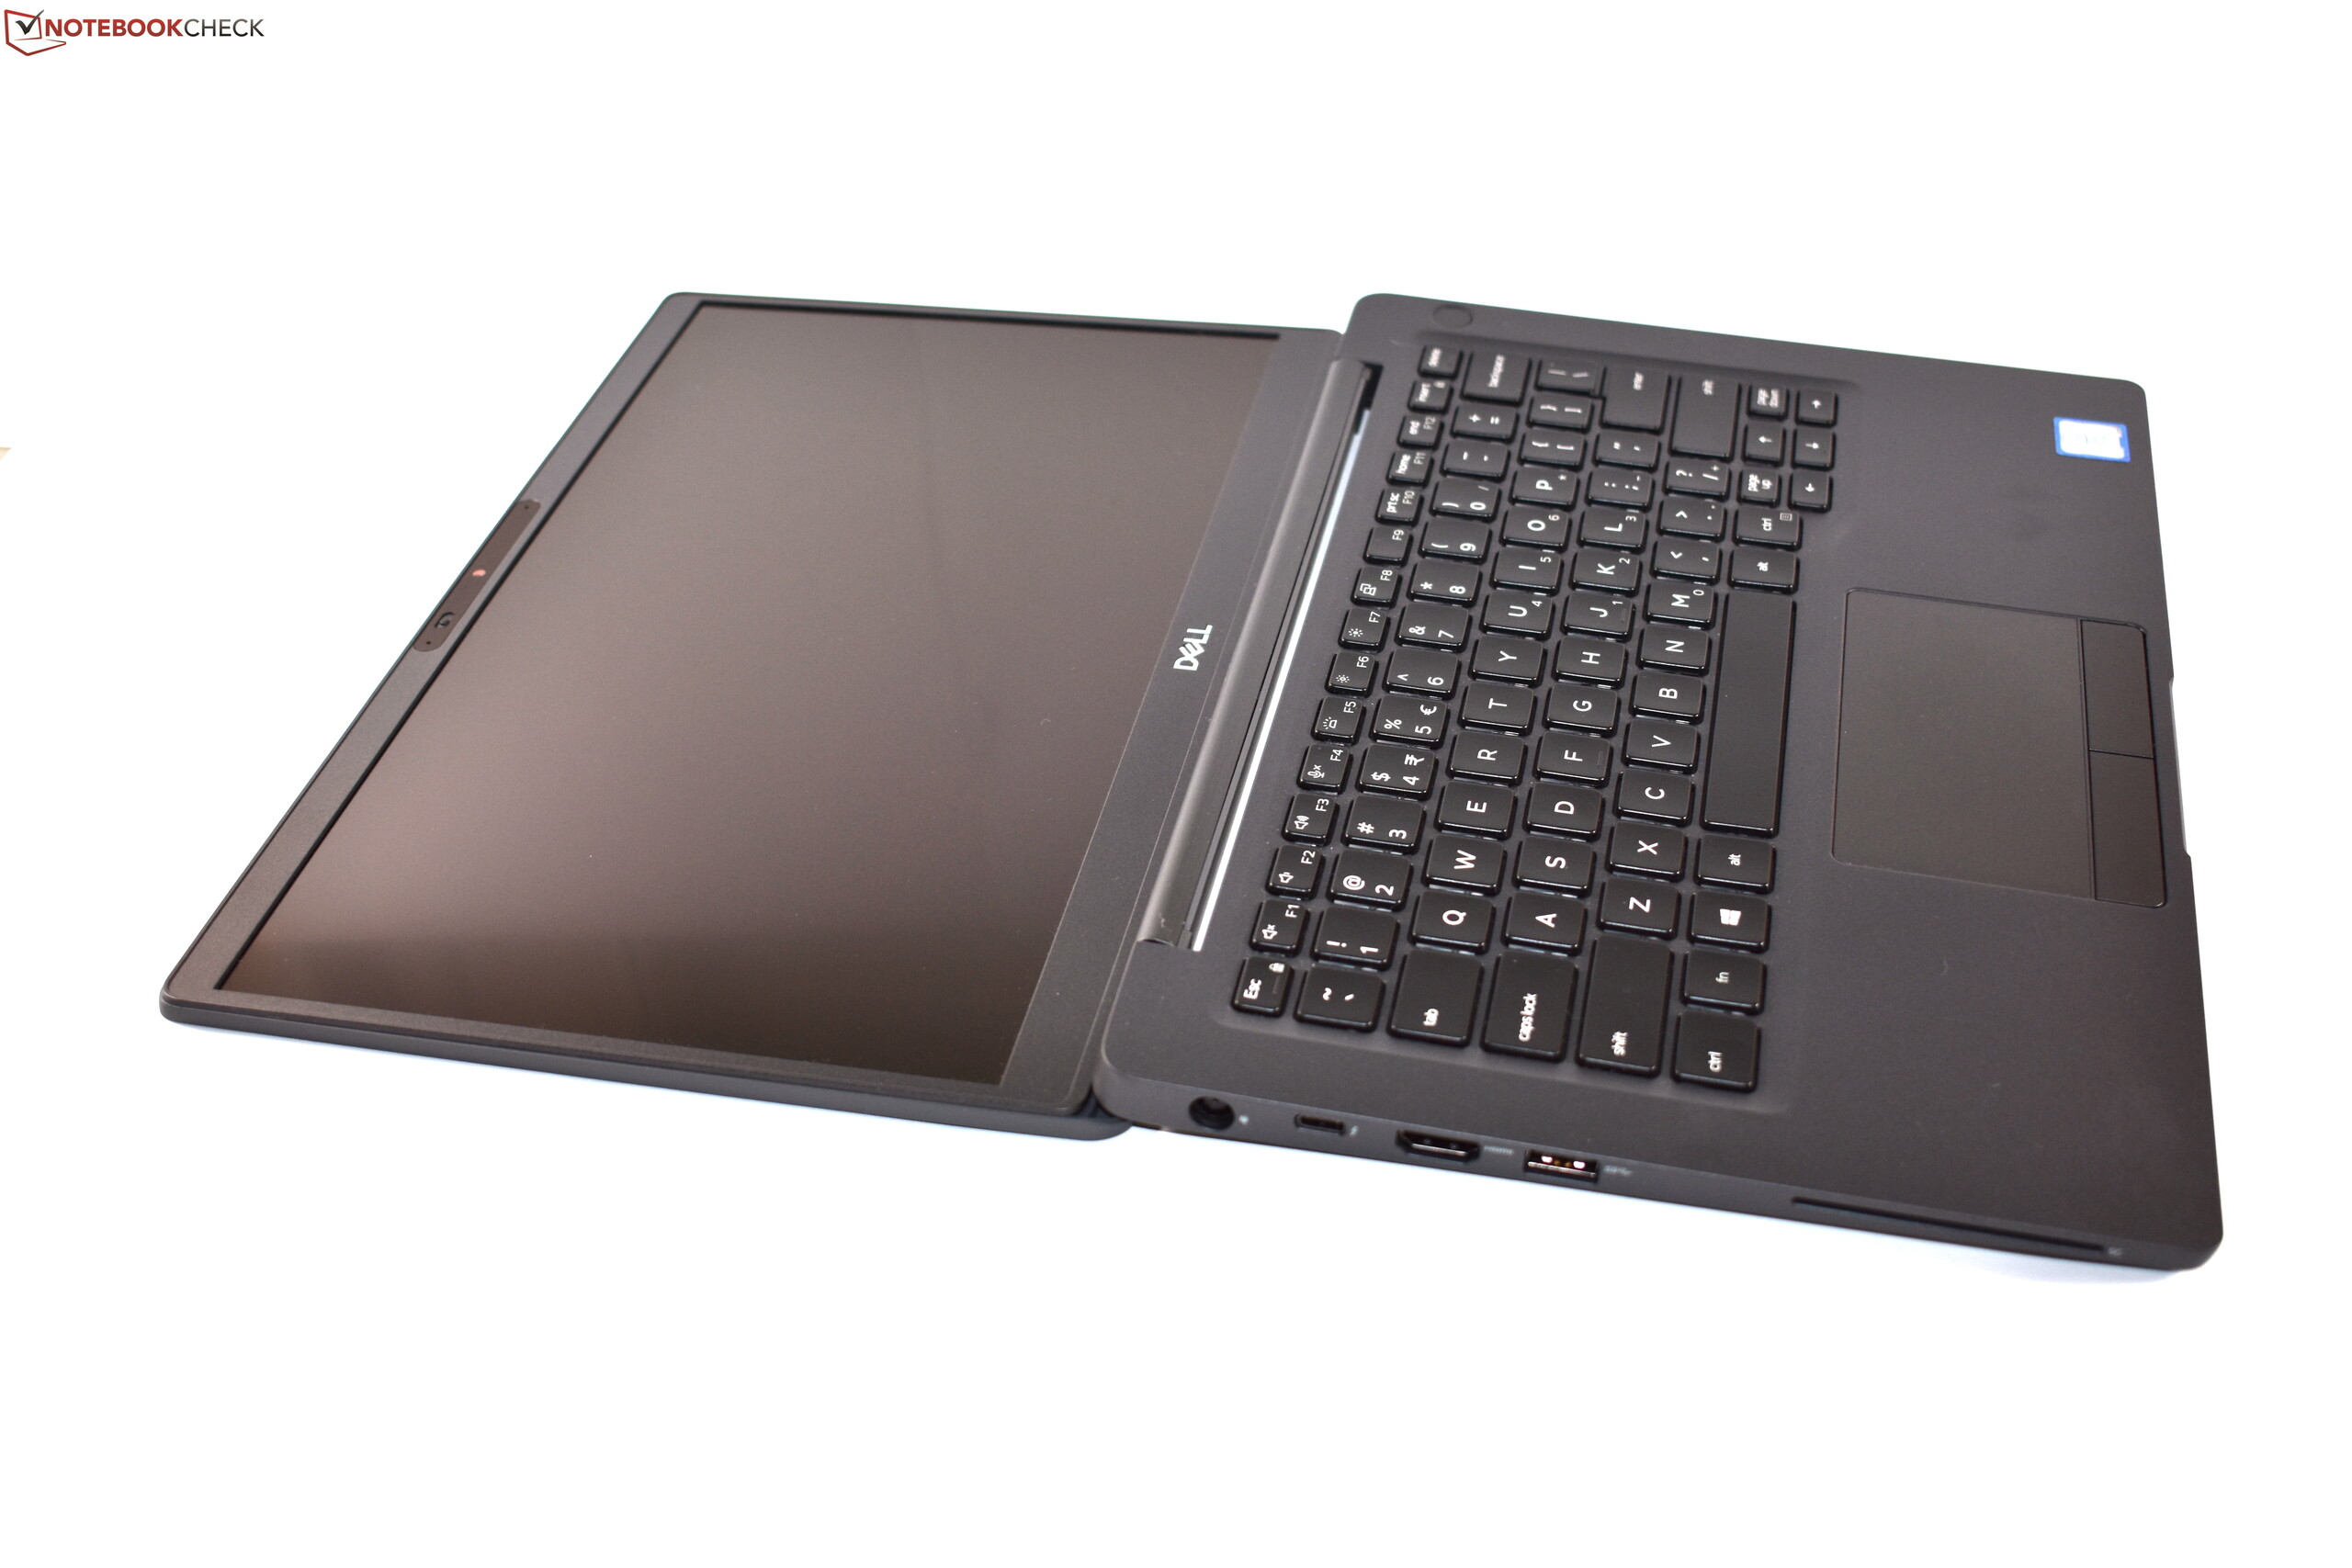
Uma de suas principais ressalvas é o touchpad. Se sente barato e não gostamos ou desfrutamos de sua superfície plástica áspera. Dado que o Latitude não possui um TrackPoint, os usuários serão forçados a recorrer a mouses externos. Também não gostamos muito da porta de carregamento proprietária e teríamos preferido uma segunda porta USB-C ou Thunderbolt 3 com fornecimento de energia. A Ethernet está ausente, e a tela supostamente mate acabou sendo sendo semi refletiva. Esperávamos que a Dell fosse mais precisa em suas especificações em relação a esses detalhes.
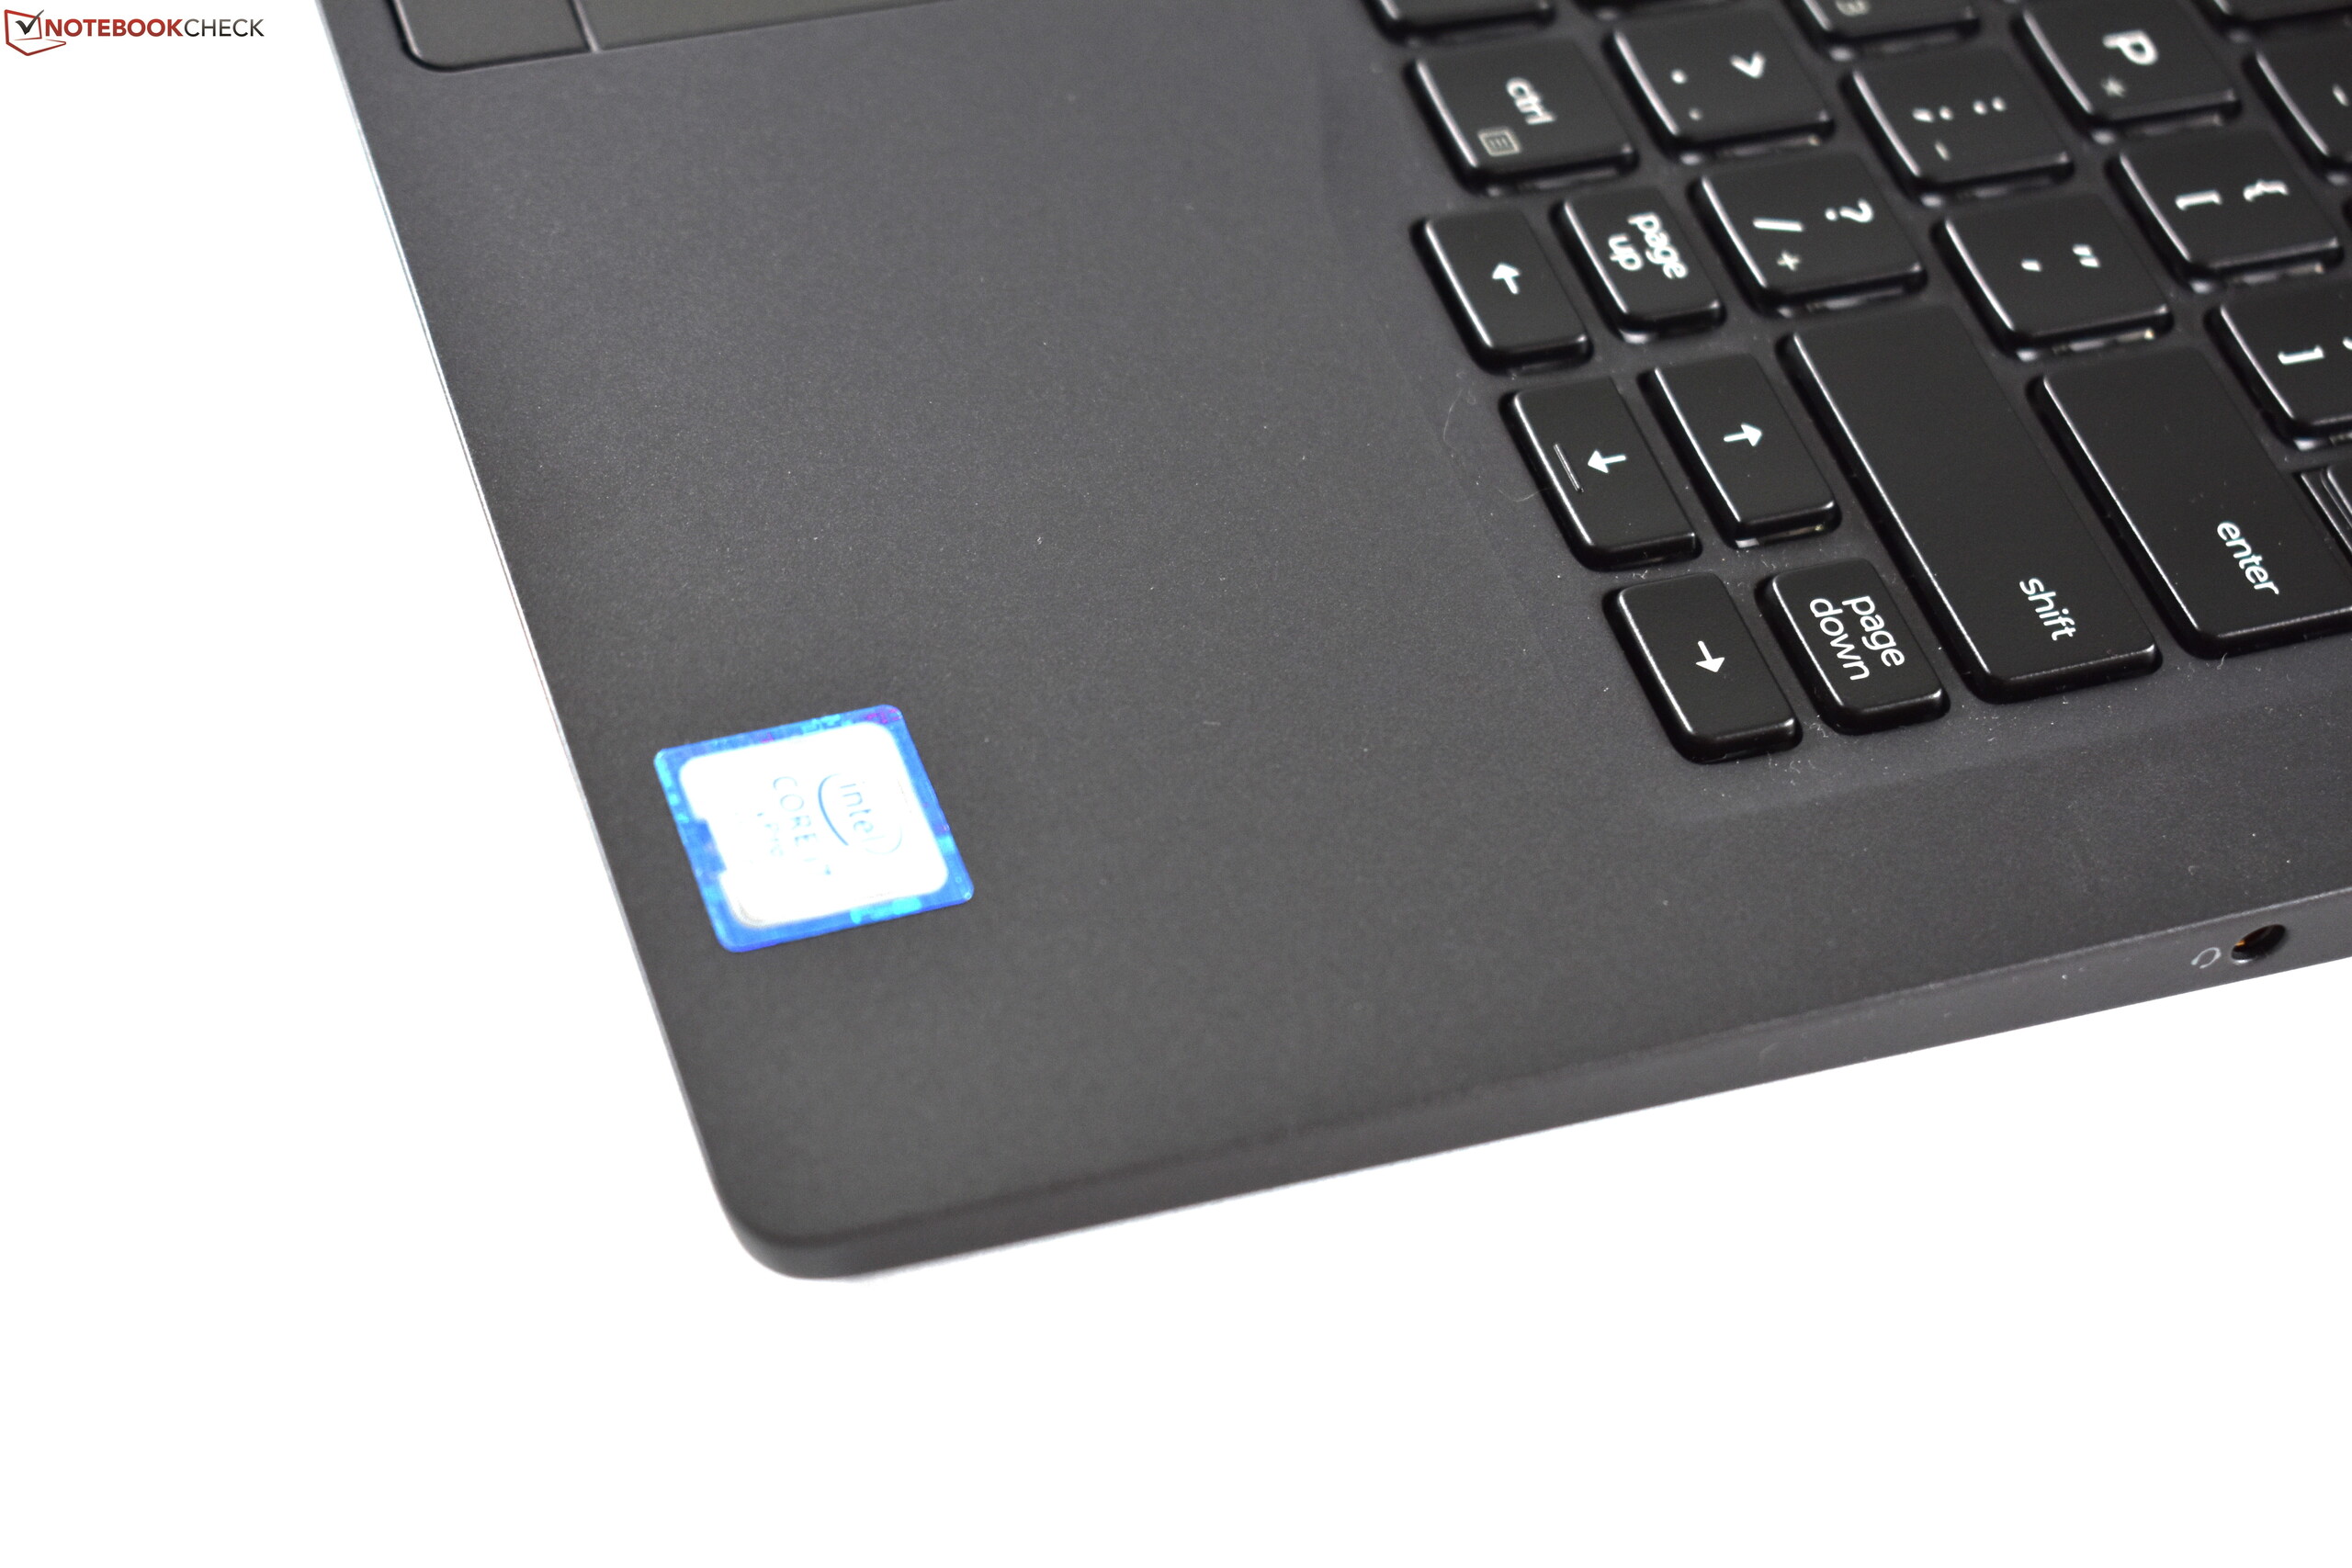
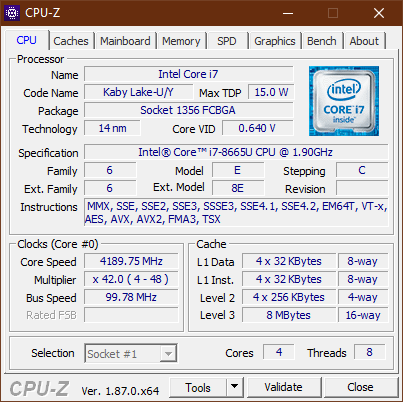
O desempenho da CPU foi bastante ruim e pior do que no próprio antecessor do Latitude 7300. Aqueles com a CPU i7 não estão obtendo o desempenho esperado. Um problema inaceitável para um portátil desse preço.
O ruído agudo do ventilador foi outra desvantagem, embora o ventilador não tenha sido particularmente alto em geral. E por último, mas não menos importante, teria sido bom ter uma opção de tela mais brilhante disponível.
Um desempenho geral sólido com um ponto crucial: A CPU Whiskey Lake acabou sendo mais lenta que o processador do antecessor.
Se você deve considerar isso como um obstáculo para a compra, depende de você. No lado positivo, o portátil empresarial Dell Latitude 7300 oferece uma excelente duração da bateria e excelente capacidade de atualização.
Dell Latitude 7300-P99G
- 09/09/2019 v7 (old)
Benjamin Herzig
Price comparison
