Breve Análise do Portátil Asus VivoBook 15 F510UF (i7-8550U, GeForce MX130)
| SD Card Reader | |
| average JPG Copy Test (av. of 3 runs) | |
| Lenovo IdeaPad 720-15IKB (Toshiba Exceria Pro SDXC 64 GB UHS-II) | |
| HP Envy x360 15-bq102ng (Toshiba Exceria Pro SDXC 64 GB UHS-II) | |
| Acer Swift 3 SF315-41-R4W1 | |
| Dell Inspiron 15 5575-98MH4 (Toshiba Exceria Pro SDXC 64 GB UHS-II) | |
| Asus VivoBook 15 F510UF-ES71 (Toshiba Exceria Pro SDXC 64 GB UHS-II) | |
| maximum AS SSD Seq Read Test (1GB) | |
| Lenovo IdeaPad 720-15IKB (Toshiba Exceria Pro SDXC 64 GB UHS-II) | |
| HP Envy x360 15-bq102ng (Toshiba Exceria Pro SDXC 64 GB UHS-II) | |
| Dell Inspiron 15 5575-98MH4 (Toshiba Exceria Pro SDXC 64 GB UHS-II) | |
| Asus VivoBook 15 F510UF-ES71 (Toshiba Exceria Pro SDXC 64 GB UHS-II) | |
| Acer Swift 3 SF315-41-R4W1 | |
| Networking | |
| iperf3 transmit AX12 | |
| HP Envy x360 15-bq102ng | |
| Asus VivoBook 15 F510UF-ES71 | |
| Dell Inspiron 15 5575-98MH4 | |
| Asus VivoBook 15 X542UF-DM143T | |
| Lenovo IdeaPad 720-15IKB | |
| iperf3 receive AX12 | |
| Asus VivoBook 15 F510UF-ES71 | |
| HP Envy x360 15-bq102ng | |
| Dell Inspiron 15 5575-98MH4 | |
| Asus VivoBook 15 X542UF-DM143T | |
| Lenovo IdeaPad 720-15IKB | |
| |||||||||||||||||||||||||
iluminação: 89 %
iluminação com acumulador: 257 cd/m²
Contraste: 756:1 (Preto: 0.34 cd/m²)
ΔE ColorChecker Calman: 4.54 | ∀{0.5-29.43 Ø4.71}
calibrated: 3.61
ΔE Greyscale Calman: 4.6 | ∀{0.09-98 Ø4.96}
59.2% sRGB (Argyll 1.6.3 3D)
37.5% AdobeRGB 1998 (Argyll 1.6.3 3D)
40.65% AdobeRGB 1998 (Argyll 3D)
59.2% sRGB (Argyll 3D)
39.35% Display P3 (Argyll 3D)
Gamma: 2.44
CCT: 7096 K
| Asus VivoBook 15 F510UF-ES71 LG Philips LP156WF9-SPK2, IPS, 15.6", 1920x1080 | Asus Vivobook S15 S510UQ-BQ189T AU Optronics B156W02 / AUO B156HAN02.1, IPS, 15.6", 1920x1080 | Dell Inspiron 15 5575-98MH4 Innolux JMC9X 156BGA, TN LED, 15.6", 1366x768 | HP Envy x360 15-bq102ng Chi Mei CM15E9, IPS, 15.6", 1920x1080 | Lenovo IdeaPad 720-15IKB LG Philips LGD0573 LP156WF9-SPK2, IPS, 15.6", 1920x1080 | Acer Swift 3 SF315-41-R4W1 BOE CQ NV156FHM-N48, IPS, 15.6", 1920x1080 | |
|---|---|---|---|---|---|---|
| Display | -1% | 2% | 5% | -2% | 0% | |
| Display P3 Coverage (%) | 39.35 | 38.94 -1% | 40.02 2% | 41.36 5% | 38.62 -2% | 39.59 1% |
| sRGB Coverage (%) | 59.2 | 58.5 -1% | 59.8 1% | 62.2 5% | 58.1 -2% | 58.5 -1% |
| AdobeRGB 1998 Coverage (%) | 40.65 | 40.23 -1% | 41.37 2% | 42.74 5% | 39.91 -2% | 40.9 1% |
| Response Times | -43% | -41% | -26% | -30% | -57% | |
| Response Time Grey 50% / Grey 80% * (ms) | 27.2 ? | 47 ? -73% | 50 ? -84% | 40 ? -47% | 42 ? -54% | 46 ? -69% |
| Response Time Black / White * (ms) | 24.8 ? | 28 ? -13% | 24 ? 3% | 26 ? -5% | 26 ? -5% | 36 ? -45% |
| PWM Frequency (Hz) | 250 ? | 25000 ? | 21000 ? | |||
| Screen | 22% | -39% | 29% | 9% | 15% | |
| Brightness middle (cd/m²) | 257 | 293 14% | 197 -23% | 221 -14% | 270 5% | 237 -8% |
| Brightness (cd/m²) | 246 | 275 12% | 195 -21% | 207 -16% | 250 2% | 229 -7% |
| Brightness Distribution (%) | 89 | 86 -3% | 78 -12% | 87 -2% | 87 -2% | 88 -1% |
| Black Level * (cd/m²) | 0.34 | 0.25 26% | 0.43 -26% | 0.15 56% | 0.25 26% | 0.19 44% |
| Contrast (:1) | 756 | 1172 55% | 458 -39% | 1473 95% | 1080 43% | 1247 65% |
| Colorchecker dE 2000 * | 4.54 | 3.81 16% | 10.35 -128% | 4.35 4% | 4.79 -6% | 4.85 -7% |
| Colorchecker dE 2000 max. * | 16 | 6.64 58% | 16.02 -0% | 8.98 44% | 8.83 45% | 8.34 48% |
| Colorchecker dE 2000 calibrated * | 3.61 | |||||
| Greyscale dE 2000 * | 4.6 | 2.66 42% | 11.25 -145% | 3.09 33% | 5.66 -23% | 3.84 17% |
| Gamma | 2.44 90% | 2.54 87% | 2.08 106% | 2.23 99% | 2.64 83% | 2.42 91% |
| CCT | 7096 92% | 6541 99% | 11592 56% | 6068 107% | 7179 91% | 6790 96% |
| Color Space (Percent of AdobeRGB 1998) (%) | 37.5 | 37 -1% | 38 1% | 56 49% | 37 -1% | 37 -1% |
| Color Space (Percent of sRGB) (%) | 59.2 | 58 -2% | 60 1% | 86 45% | 59 0% | 58 -2% |
| Média Total (Programa/Configurações) | -7% /
9% | -26% /
-31% | 3% /
17% | -8% /
2% | -14% /
2% |
* ... menor é melhor
Exibir tempos de resposta
| ↔ Tempo de resposta preto para branco | ||
|---|---|---|
| 24.8 ms ... ascensão ↗ e queda ↘ combinadas | ↗ 14 ms ascensão | 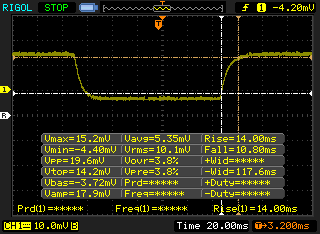 |
| ↘ 10.8 ms queda | ||
| A tela mostra boas taxas de resposta em nossos testes, mas pode ser muito lenta para jogadores competitivos. Em comparação, todos os dispositivos testados variam de 0.1 (mínimo) a 240 (máximo) ms. » 58 % de todos os dispositivos são melhores. Isso significa que o tempo de resposta medido é pior que a média de todos os dispositivos testados (19.8 ms). | ||
| ↔ Tempo de resposta 50% cinza a 80% cinza | ||
| 27.2 ms ... ascensão ↗ e queda ↘ combinadas | ↗ 13.2 ms ascensão | 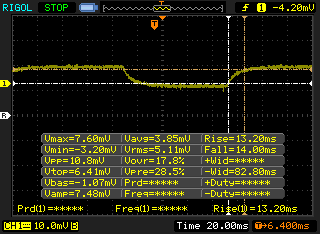 |
| ↘ 14 ms queda | ||
| A tela mostra taxas de resposta relativamente lentas em nossos testes e pode ser muito lenta para os jogadores. Em comparação, todos os dispositivos testados variam de 0.165 (mínimo) a 636 (máximo) ms. » 37 % de todos os dispositivos são melhores. Isso significa que o tempo de resposta medido é melhor que a média de todos os dispositivos testados (31 ms). | ||
Cintilação da tela / PWM (modulação por largura de pulso)
| Tela tremeluzindo / PWM não detectado | 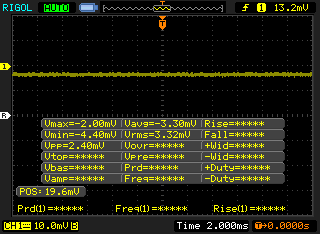 | ||
[pwm_comparison] Em comparação: 52 % de todos os dispositivos testados não usam PWM para escurecer a tela. Se PWM foi detectado, uma média de 7754 (mínimo: 5 - máximo: 343500) Hz foi medida. | |||
| Cinebench R15 | |
| CPU Single 64Bit | |
| Asus VivoBook 15 F510UF-ES71 | |
| Média Intel Core i7-8550U (108 - 172, n=76) | |
| Dell XPS 15 9575 i5-8305G | |
| Lenovo ThinkPad 25 | |
| Asus VivoBook 15 X542UF-DM143T | |
| HP Envy x360 15-bq102ng | |
| Acer Swift 3 SF315-41-R6J9 | |
| Xiaomi Mi Gaming Laptop 7300HQ 1060 | |
| Asus Vivobook S15 S510UQ-BQ189T | |
| Lenovo IdeaPad 720-15IKB | |
| Dell Inspiron 15 5575-98MH4 | |
| Asus VivoBook 17 X705UA-BX022T | |
| CPU Multi 64Bit | |
| Asus VivoBook 15 X542UF-DM143T | |
| Dell XPS 15 9575 i5-8305G | |
| Asus VivoBook 15 F510UF-ES71 | |
| HP Envy x360 15-bq102ng | |
| Média Intel Core i7-8550U (301 - 761, n=78) | |
| Acer Swift 3 SF315-41-R6J9 | |
| Xiaomi Mi Gaming Laptop 7300HQ 1060 | |
| Lenovo ThinkPad 25 | |
| Asus Vivobook S15 S510UQ-BQ189T | |
| Lenovo IdeaPad 720-15IKB | |
| Dell Inspiron 15 5575-98MH4 | |
| Asus VivoBook 17 X705UA-BX022T | |
| PCMark 8 - Home Score Accelerated v2 | |
| Lenovo IdeaPad 720-15IKB | |
| Asus VivoBook 15 F510UF-ES71 | |
| Asus VivoBook 15 X542UF-DM143T | |
| Asus Vivobook S15 S510UQ-BQ189T | |
| HP Envy x360 15-bq102ng | |
| Acer Swift 3 SF315-41-R4W1 | |
| Dell Inspiron 15 5575-98MH4 | |
| PCMark 10 - Score | |
| Asus VivoBook 15 X542UF-DM143T | |
| HP Envy x360 15-bq102ng | |
| Asus VivoBook 15 F510UF-ES71 | |
| Dell Inspiron 15 5575-98MH4 | |
| Acer Swift 3 SF315-41-R4W1 | |
| PCMark 8 Home Score Accelerated v2 | 3704 pontos | |
| PCMark 10 Score | 2801 pontos | |
Ajuda | ||
| Asus VivoBook 15 F510UF-ES71 Seagate Mobile HDD 1TB ST1000LM035 | Dell Inspiron 15 5575-98MH4 Seagate Mobile HDD 1TB ST1000LM035 | Asus VivoBook 15 X542UF-DM143T Micron 1100 MTFDDAV256TBN | Acer Swift 3 SF315-41-R4W1 Intel SSD 600p SSDPEKKW256G7 | Asus FX504GD Seagate Mobile HDD 1TB ST1000LX015-1U7172 | Média Seagate Mobile HDD 1TB ST1000LM035 | |
|---|---|---|---|---|---|---|
| CrystalDiskMark 5.2 / 6 | 37% | 5966% | 6335% | -25% | -17% | |
| Write 4K (MB/s) | 1.283 | 3.776 194% | 94.9 7297% | 98.7 7593% | 0.27 -79% | 1.254 ? -2% |
| Read 4K (MB/s) | 0.493 | 0.439 -11% | 27.3 5438% | 29.07 5797% | 0.586 19% | 0.3733 ? -24% |
| Write Seq (MB/s) | 79.3 | 74.9 -6% | 410.4 418% | 606 664% | 86.8 9% | 84 ? 6% |
| Read Seq (MB/s) | 136.7 | 136.3 0% | 464 239% | 1118 718% | 113.2 -17% | 108.7 ? -20% |
| Write 4K Q32T1 (MB/s) | 2.266 | 4.585 102% | 246.5 10778% | 175.2 7632% | 0.242 -89% | 1.574 ? -31% |
| Read 4K Q32T1 (MB/s) | 1.068 | 1.135 6% | 246.4 22971% | 287.8 26848% | 0.963 -10% | 0.87 ? -19% |
| Write Seq Q32T1 (MB/s) | 108.7 | 114.5 5% | 451.4 315% | 599 451% | 98.4 -9% | 91.1 ? -16% |
| Read Seq Q32T1 (MB/s) | 143.7 | 146 2% | 532 270% | 1551 979% | 110.2 -23% | 104.4 ? -27% |

| 3DMark 11 Performance | 3077 pontos | |
| 3DMark Ice Storm Standard Score | 45310 pontos | |
| 3DMark Cloud Gate Standard Score | 10515 pontos | |
| 3DMark Fire Strike Score | 2184 pontos | |
Ajuda | ||
| baixo | média | alto | ultra | |
|---|---|---|---|---|
| StarCraft II: Heart of the Swarm (2013) | 289 | 123.2 | 69.7 | 34.7 |
| BioShock Infinite (2013) | 119.5 | 69.9 | 60.5 | 22.8 |
| The Witcher 3 (2015) | 43.9 | 25.3 | 14 | 7.6 |
| Rise of the Tomb Raider (2016) | 37.3 | 29.2 | 15.8 | 12.8 |
| Overwatch (2016) | 111.3 | 75.2 | 35.6 |
Barulho
| Ocioso |
| 30.8 / 30.8 / 31 dB |
| Carga |
| 45.6 / 46.7 dB |
 | ||
30 dB silencioso 40 dB(A) audível 50 dB(A) ruidosamente alto |
||
min: | ||
| Asus VivoBook 15 F510UF-ES71 GeForce MX130, i5-8550U, Seagate Mobile HDD 1TB ST1000LM035 | Asus Vivobook S15 S510UQ-BQ189T GeForce 940MX, i5-7200U, Toshiba SG5 THNSNK128GVN8 | Dell Inspiron 15 5575-98MH4 Vega 3, R3 2200U, Seagate Mobile HDD 1TB ST1000LM035 | HP Envy x360 15-bq102ng Vega 8, R5 2500U, Samsung PM961 MZVLW256HEHP | Lenovo IdeaPad 720-15IKB Radeon RX 560 (Laptop), i5-7200U, Samsung PM961 MZVLW256HEHP | Acer Swift 3 SF315-41-R4W1 Vega 8, R5 2500U, Intel SSD 600p SSDPEKKW256G7 | |
|---|---|---|---|---|---|---|
| Noise | 0% | 5% | 6% | 6% | 5% | |
| desligado / ambiente * (dB) | 28.5 | 30.6 -7% | 30.4 -7% | 30.13 -6% | 30.3 -6% | 31.8 -12% |
| Idle Minimum * (dB) | 30.8 | 31.2 -1% | 31.4 -2% | 30.13 2% | 30.3 2% | 31.8 -3% |
| Idle Average * (dB) | 30.8 | 31.2 -1% | 31.4 -2% | 30.13 2% | 30.3 2% | 32.1 -4% |
| Idle Maximum * (dB) | 31 | 31.2 -1% | 31.6 -2% | 30.13 3% | 30.3 2% | 32.1 -4% |
| Load Average * (dB) | 45.6 | 43.3 5% | 31.9 30% | 38.8 15% | 39.2 14% | 33 28% |
| Witcher 3 ultra * (dB) | 45.6 | 41.6 9% | ||||
| Load Maximum * (dB) | 46.7 | 43.3 7% | 40.9 12% | 38.8 17% | 39.2 16% | 34.8 25% |
* ... menor é melhor
(+) A temperatura máxima no lado superior é 35.2 °C / 95 F, em comparação com a média de 36.8 °C / 98 F , variando de 21 a 71 °C para a classe Multimedia.
(-) A parte inferior aquece até um máximo de 52 °C / 126 F, em comparação com a média de 39.1 °C / 102 F
(+) Em uso inativo, a temperatura média para o lado superior é 27.1 °C / 81 F, em comparação com a média do dispositivo de 31.3 °C / ### class_avg_f### F.
(+) Os apoios para as mãos e o touchpad são mais frios que a temperatura da pele, com um máximo de 28.8 °C / 83.8 F e, portanto, são frios ao toque.
(±) A temperatura média da área do apoio para as mãos de dispositivos semelhantes foi 28.7 °C / 83.7 F (-0.1 °C / -0.1 F).
Asus VivoBook 15 F510UF-ES71 análise de áudio
(-) | alto-falantes não muito altos (###valor### dB)
Graves 100 - 315Hz
(±) | graves reduzidos - em média 13.2% menor que a mediana
(±) | a linearidade dos graves é média (11.5% delta para a frequência anterior)
Médios 400 - 2.000 Hz
(+) | médios equilibrados - apenas 2.7% longe da mediana
(±) | a linearidade dos médios é média (7% delta para frequência anterior)
Altos 2 - 16 kHz
(+) | agudos equilibrados - apenas 4.5% longe da mediana
(+) | os máximos são lineares (6% delta da frequência anterior)
Geral 100 - 16.000 Hz
(±) | a linearidade do som geral é média (22% diferença em relação à mediana)
Comparado com a mesma classe
» 78% de todos os dispositivos testados nesta classe foram melhores, 4% semelhantes, 17% piores
» O melhor teve um delta de 5%, a média foi 17%, o pior foi 45%
Comparado com todos os dispositivos testados
» 64% de todos os dispositivos testados foram melhores, 6% semelhantes, 30% piores
» O melhor teve um delta de 4%, a média foi 23%, o pior foi 134%
Apple MacBook 12 (Early 2016) 1.1 GHz análise de áudio
(+) | os alto-falantes podem tocar relativamente alto (###valor### dB)
Graves 100 - 315Hz
(±) | graves reduzidos - em média 11.3% menor que a mediana
(±) | a linearidade dos graves é média (14.2% delta para a frequência anterior)
Médios 400 - 2.000 Hz
(+) | médios equilibrados - apenas 2.4% longe da mediana
(+) | médios são lineares (5.5% delta para frequência anterior)
Altos 2 - 16 kHz
(+) | agudos equilibrados - apenas 2% longe da mediana
(+) | os máximos são lineares (4.5% delta da frequência anterior)
Geral 100 - 16.000 Hz
(+) | o som geral é linear (10.2% diferença em relação à mediana)
Comparado com a mesma classe
» 7% de todos os dispositivos testados nesta classe foram melhores, 2% semelhantes, 90% piores
» O melhor teve um delta de 5%, a média foi 18%, o pior foi 53%
Comparado com todos os dispositivos testados
» 5% de todos os dispositivos testados foram melhores, 1% semelhantes, 94% piores
» O melhor teve um delta de 4%, a média foi 23%, o pior foi 134%
| desligado | |
| Ocioso | |
| Carga |
|
Key:
min: | |
| Asus VivoBook 15 F510UF-ES71 i5-8550U, GeForce MX130, Seagate Mobile HDD 1TB ST1000LM035, IPS, 1920x1080, 15.6" | Asus Vivobook S15 S510UQ-BQ189T i5-7200U, GeForce 940MX, Toshiba SG5 THNSNK128GVN8, IPS, 1920x1080, 15.6" | Dell Inspiron 15 5575-98MH4 R3 2200U, Vega 3, Seagate Mobile HDD 1TB ST1000LM035, TN LED, 1366x768, 15.6" | Lenovo IdeaPad 720-15IKB i5-7200U, Radeon RX 560 (Laptop), Samsung PM961 MZVLW256HEHP, IPS, 1920x1080, 15.6" | Acer Swift 3 SF315-41-R4W1 R5 2500U, Vega 8, Intel SSD 600p SSDPEKKW256G7, IPS, 1920x1080, 15.6" | |
|---|---|---|---|---|---|
| Power Consumption | 7% | 10% | -44% | -13% | |
| Idle Minimum * (Watt) | 5.9 | 3.6 39% | 5 15% | 9.9 -68% | 7.3 -24% |
| Idle Average * (Watt) | 7 | 6.8 3% | 8.4 -20% | 9.5 -36% | 9.7 -39% |
| Idle Maximum * (Watt) | 8.5 | 9.5 -12% | 9.2 -8% | 10.7 -26% | 13 -53% |
| Load Average * (Watt) | 54.5 | 51.6 5% | 30 45% | 62 -14% | 40.4 26% |
| Witcher 3 ultra * (Watt) | 50.6 | 84 -66% | |||
| Load Maximum * (Watt) | 55.7 | 56 -1% | 44.7 20% | 86.7 -56% | 42.2 24% |
* ... menor é melhor
| Asus VivoBook 15 F510UF-ES71 i5-8550U, GeForce MX130, 42 Wh | Asus Vivobook S15 S510UQ-BQ189T i5-7200U, GeForce 940MX, 42 Wh | Dell Inspiron 15 5575-98MH4 R3 2200U, Vega 3, 42 Wh | Asus VivoBook 15 X542UF-DM143T i5-8250U, GeForce MX130, 38 Wh | Lenovo IdeaPad 720-15IKB i5-7200U, Radeon RX 560 (Laptop), 40 Wh | Acer Swift 3 SF315-41-R4W1 R5 2500U, Vega 8, 48 Wh | |
|---|---|---|---|---|---|---|
| Duração da bateria | 10% | 8% | 74% | 82% | 33% | |
| WiFi v1.3 (h) | 3.9 | 4.3 10% | 4.2 8% | 6.8 74% | 7.1 82% | 5.2 33% |
| Reader / Idle (h) | 7.1 | 9.5 | 16.1 | 12.2 | ||
| Load (h) | 1.2 | 1.3 | 0.8 | 1.4 |
Pro
Contra

Em um nível de desempenho, o Vivobook F510UF é impressionante para o preço. Ele oferece um grande salto em relação à última geração do i5-7200U ou i7-7500U sem afogamento significativo ou impacto na duração da bateria. Enquanto isso, a GPU MX130 é um obstáculo perceptível sobre a comum UHD Graphics 620 com a qual ficaram muitos Ultrabooks menores de 13 polegadas.
O sistema Asus começa a falhar quando olhamos além do seu desempenho. Seu chassi é mais flexível e nem de perto a qualidade de carros-chefes como o Spectre x360 15 ou XPS 15. Isso inclui as teclas do teclado que se sentem esponjosas e baratas, como se pertencessem a um netbook. Enquanto não esperamos o melhor ou mais rígido design de chassi, esperamos que o teclado e o trackpad sejam representativos da faixa de preços do sistema. Como tal, ainda há um forte motivo para comprar o SKU XPS 15 menos dispendioso e mais lento devido à sua carcaça muito mais forte.
Nossa última grande queixa é o ruído do ventilador. O ventilador do sistema é tão barulhento quanto alguns portáteis de jogos completos quando estão sob estresse, apesar do Vivobook ser mais lento por ordem de grandeza. A GPU MX130 certamente terá um custo se os usuários pretenderem tirar o máximo proveito dela.
Outras desvantagens do sistema são típicas de portáteis convencionais em sua faixa de preços, como o espaço de cores limitado, a duração média da bateria, a luz de fundo média da tela e o design simples. Esperamos que as revisões futuras melhorem o teclado, instalem uma solução de resfriamento mais potente e troquem a porta de CA proprietária pelo carregamento universal USB tipo-C.
A CPU, a GPU e o painel mate são os destaques do sistema e uma barganha decente pelo preço. Os usuários devem estar cientes das teclas do teclado baratas, do ventilador barulhento durante os jogos e do HD primário muito lento. Pode valer a pena considerar o pagamento de $100 a $200 a mais pelo mais forte SKU XPS 15 de nível de entrada.
Asus VivoBook 15 F510UF-ES71
- 06/17/2018 v6 (old)
Allen Ngo
Price comparison
