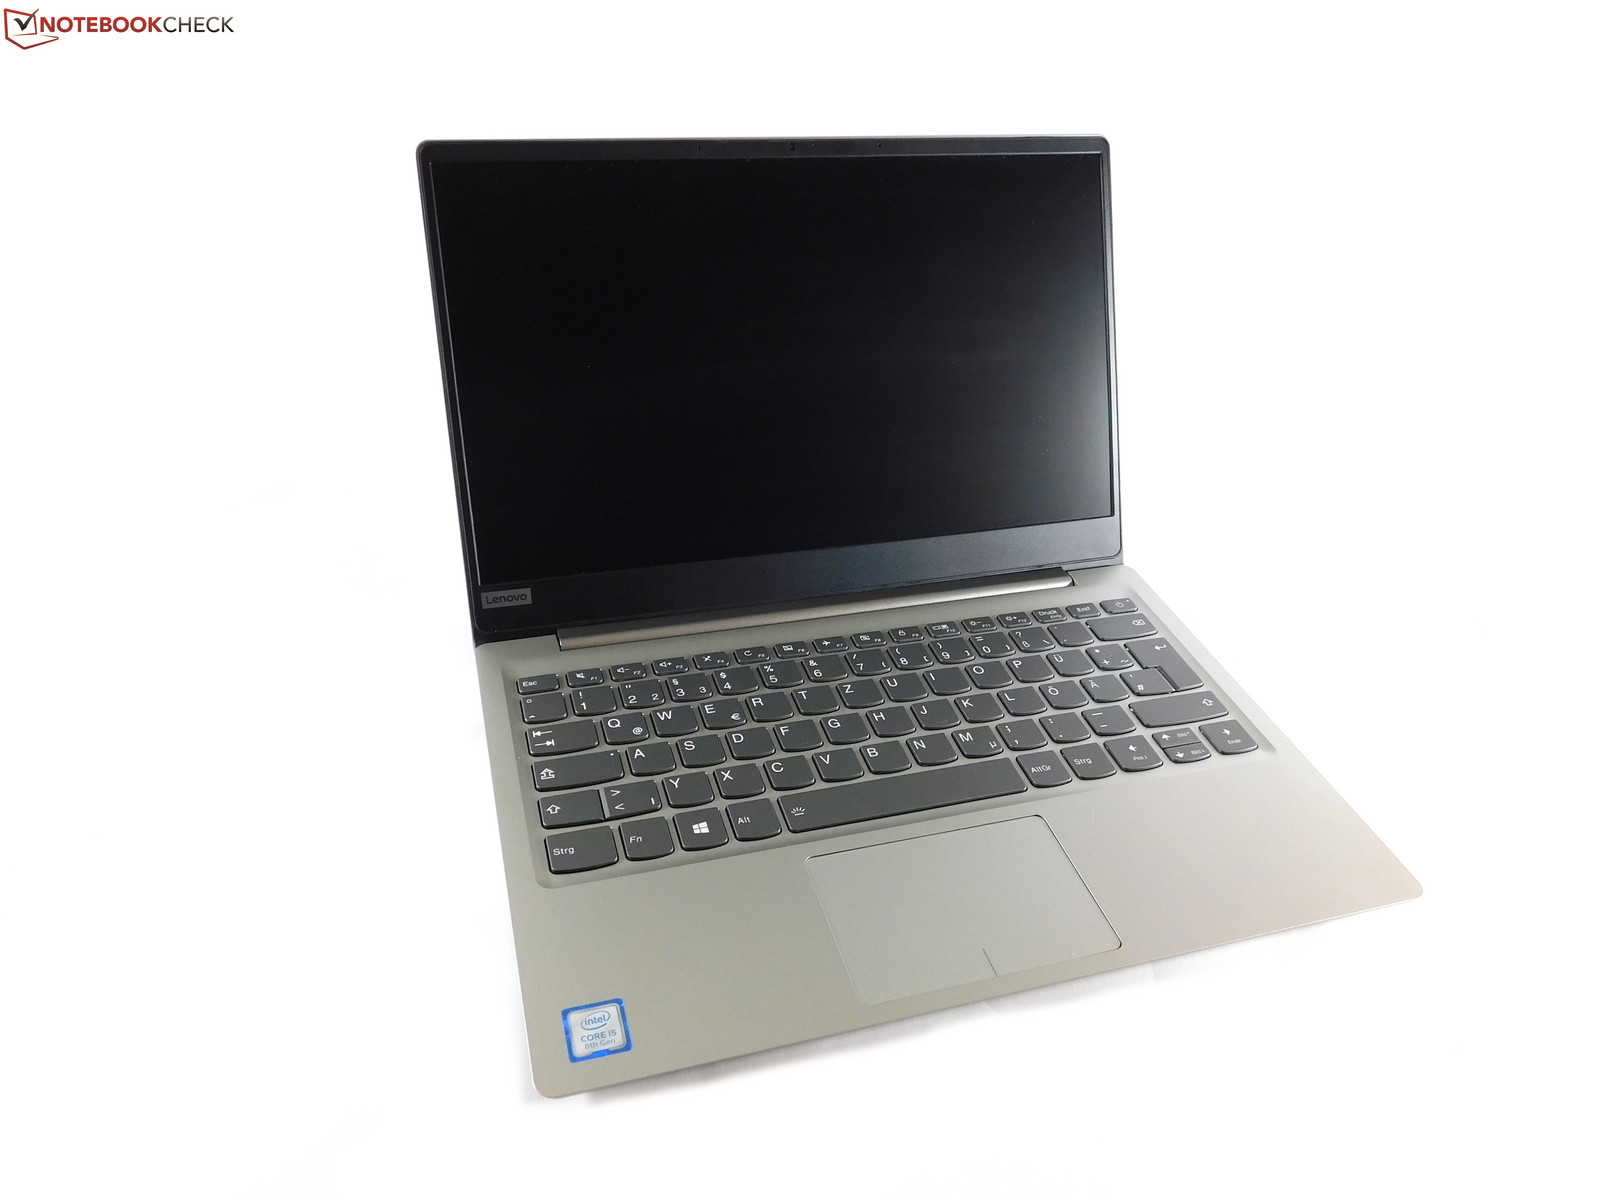
Breve Análise do Portátil Lenovo IdeaPad 320S-13IKBR (i5-8250U, MX150)

| SD Card Reader | |
| average JPG Copy Test (av. of 3 runs) | |
| Dell XPS 13 i5-8250U (Toshiba Exceria Pro SDXC 64 GB UHS-II) | |
| Lenovo IdeaPad 320S-13IKB (Toshiba Exceria Pro M501) | |
| HP Envy 13-ad006ng (Toshiba Exceria Pro SDXC 64 GB UHS-II) | |
| Dell Inspiron 13 7370 (Toshiba Exceria Pro SDXC 64 GB UHS-II) | |
| maximum AS SSD Seq Read Test (1GB) | |
| Dell XPS 13 i5-8250U (Toshiba Exceria Pro SDXC 64 GB UHS-II) | |
| Lenovo IdeaPad 320S-13IKB (Toshiba Exceria Pro M501) | |
| HP Envy 13-ad006ng (Toshiba Exceria Pro SDXC 64 GB UHS-II) | |
| Dell Inspiron 13 7370 (Toshiba Exceria Pro SDXC 64 GB UHS-II) | |
| Networking | |
| iperf3 transmit AX12 | |
| Dell Inspiron 13 7370 | |
| HP Envy 13-ad006ng | |
| Dell XPS 13 i5-8250U | |
| Lenovo IdeaPad 320S-13IKB | |
| iperf3 receive AX12 | |
| Dell XPS 13 i5-8250U | |
| HP Envy 13-ad006ng | |
| Dell Inspiron 13 7370 | |
| Lenovo IdeaPad 320S-13IKB | |
| |||||||||||||||||||||||||
iluminação: 88 %
iluminação com acumulador: 328 cd/m²
Contraste: 1320:1 (Preto: 0.25 cd/m²)
ΔE ColorChecker Calman: 1.8 | ∀{0.5-29.43 Ø4.71}
ΔE Greyscale Calman: 2.5 | ∀{0.09-98 Ø4.96}
97.3% sRGB (Argyll 1.6.3 3D)
61.8% AdobeRGB 1998 (Argyll 1.6.3 3D)
68.1% AdobeRGB 1998 (Argyll 3D)
97.4% sRGB (Argyll 3D)
66.3% Display P3 (Argyll 3D)
Gamma: 2.11
CCT: 6588 K
| Lenovo IdeaPad 320S-13IKB InfoVision M133NWF4R0, , 1920x1080, 13.3" | Dell XPS 13 i5-8250U ID: Sharp SHP144A, Name: LQ133Z1, , 3200x1800, 13.3" | Dell Inspiron 13 7370 BOE071A / NV13FHM / Dell G64PY, , 1920x1080, 13.3" | HP Envy 13-ad006ng BOE070E, , 1920x1080, 13.3" | Asus Zenbook UX310UA-FC347T iGP AU Optronics AUO272D, , 1920x1080, 13.3" | |
|---|---|---|---|---|---|
| Display | -5% | -6% | -6% | -13% | |
| Display P3 Coverage (%) | 66.3 | 63.9 -4% | 66.7 1% | 66.8 1% | 64.2 -3% |
| sRGB Coverage (%) | 97.4 | 91.7 -6% | 86.2 -11% | 86.3 -11% | 65.3 -33% |
| AdobeRGB 1998 Coverage (%) | 68.1 | 65.7 -4% | 63 -7% | 63.1 -7% | 65.3 -4% |
| Response Times | 27% | 8% | 7% | 30% | |
| Response Time Grey 50% / Grey 80% * (ms) | 56.8 ? | 29 ? 49% | 46 ? 19% | 48 ? 15% | 40 ? 30% |
| Response Time Black / White * (ms) | 31.6 ? | 30 ? 5% | 33 ? -4% | 32 ? -1% | 22 ? 30% |
| PWM Frequency (Hz) | 198.4 ? | 19500 ? | 201 ? | 1000 ? | 200 ? |
| Screen | -47% | -53% | -49% | -46% | |
| Brightness middle (cd/m²) | 330 | 361 9% | 301 -9% | 281 -15% | 358 8% |
| Brightness (cd/m²) | 304 | 303 0% | 291 -4% | 264 -13% | 347 14% |
| Brightness Distribution (%) | 88 | 72 -18% | 87 -1% | 83 -6% | 87 -1% |
| Black Level * (cd/m²) | 0.25 | 0.33 -32% | 0.33 -32% | 0.23 8% | 0.26 -4% |
| Contrast (:1) | 1320 | 1094 -17% | 912 -31% | 1222 -7% | 1377 4% |
| Colorchecker dE 2000 * | 1.8 | 5.26 -192% | 5.39 -199% | 4.83 -168% | 5.22 -190% |
| Colorchecker dE 2000 max. * | 4.3 | 7.79 -81% | 8.56 -99% | 8.89 -107% | 9.19 -114% |
| Greyscale dE 2000 * | 2.5 | 5.69 -128% | 5.93 -137% | 6.63 -165% | 6.69 -168% |
| Gamma | 2.11 104% | 1.63 135% | 2.6 85% | 1.85 119% | 2.35 94% |
| CCT | 6588 99% | 6499 100% | 6358 102% | 6794 96% | 6745 96% |
| Color Space (Percent of AdobeRGB 1998) (%) | 61.8 | 59 -5% | 56 -9% | 56 -9% | 59 -5% |
| Color Space (Percent of sRGB) (%) | 97.3 | 92 -5% | 86 -12% | 86 -12% | 91 -6% |
| Média Total (Programa/Configurações) | -8% /
-29% | -17% /
-36% | -16% /
-33% | -10% /
-29% |
* ... menor é melhor
Cintilação da tela / PWM (modulação por largura de pulso)
| Tela tremeluzindo/PWM detectado | 198.4 Hz | ≤ 99 % configuração de brilho | 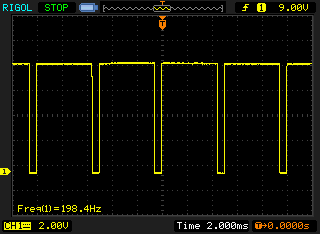 |
A luz de fundo da tela pisca em 198.4 Hz (pior caso, por exemplo, utilizando PWM) Cintilação detectada em uma configuração de brilho de 99 % e abaixo. Não deve haver cintilação ou PWM acima desta configuração de brilho. A frequência de 198.4 Hz é relativamente baixa, portanto, usuários sensíveis provavelmente notarão cintilação e sentirão fadiga ocular na configuração de brilho indicada e abaixo. [pwm_comparison] Em comparação: 52 % de todos os dispositivos testados não usam PWM para escurecer a tela. Se PWM foi detectado, uma média de 7754 (mínimo: 5 - máximo: 343500) Hz foi medida. | |||
Exibir tempos de resposta
| ↔ Tempo de resposta preto para branco | ||
|---|---|---|
| 31.6 ms ... ascensão ↗ e queda ↘ combinadas | ↗ 17.6 ms ascensão | 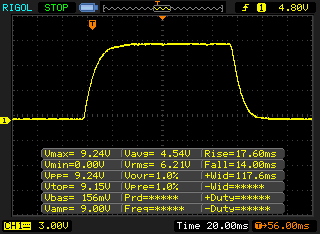 |
| ↘ 14 ms queda | ||
| A tela mostra taxas de resposta lentas em nossos testes e será insatisfatória para os jogadores. Em comparação, todos os dispositivos testados variam de 0.1 (mínimo) a 240 (máximo) ms. » 85 % de todos os dispositivos são melhores. Isso significa que o tempo de resposta medido é pior que a média de todos os dispositivos testados (19.8 ms). | ||
| ↔ Tempo de resposta 50% cinza a 80% cinza | ||
| 56.8 ms ... ascensão ↗ e queda ↘ combinadas | ↗ 27.6 ms ascensão | 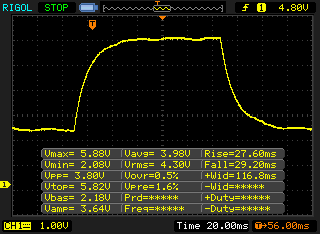 |
| ↘ 29.2 ms queda | ||
| A tela mostra taxas de resposta lentas em nossos testes e será insatisfatória para os jogadores. Em comparação, todos os dispositivos testados variam de 0.165 (mínimo) a 636 (máximo) ms. » 94 % de todos os dispositivos são melhores. Isso significa que o tempo de resposta medido é pior que a média de todos os dispositivos testados (31 ms). | ||
| PCMark 8 | |
| Home Score Accelerated v2 | |
| Asus Zenbook UX310UA-FC347T iGP | |
| Dell Inspiron 13 7370 | |
| Lenovo IdeaPad 320S-13IKB | |
| HP Envy 13-ad006ng | |
| Dell XPS 13 i5-8250U | |
| Work Score Accelerated v2 | |
| Asus Zenbook UX310UA-FC347T iGP | |
| HP Envy 13-ad006ng | |
| Lenovo IdeaPad 320S-13IKB | |
| Dell Inspiron 13 7370 | |
| Dell XPS 13 i5-8250U | |
| PCMark 10 | |
| Productivity | |
| Lenovo IdeaPad 320S-13IKB | |
| HP Envy 13-ad006ng | |
| Score | |
| HP Envy 13-ad006ng | |
| Lenovo IdeaPad 320S-13IKB | |
| PCMark 8 Home Score Accelerated v2 | 3796 pontos | |
| PCMark 8 Work Score Accelerated v2 | 4826 pontos | |
| PCMark 10 Score | 3191 pontos | |
Ajuda | ||
| Lenovo IdeaPad 320S-13IKB Samsung PM961 NVMe MZVLW512HMJP | Dell XPS 13 i5-8250U Toshiba XG5 KXG50ZNV256G | Dell Inspiron 13 7370 Micron 1100 MTFDDAV256TBN | HP Envy 13-ad006ng Toshiba NVMe THNSN5256GPUK | Asus Zenbook UX310UA-FC347T iGP Micron SSD 1100 (MTFDDAV256TBN) | |
|---|---|---|---|---|---|
| CrystalDiskMark 3.0 | -41% | -60% | -41% | -51% | |
| Write 4k QD32 (MB/s) | 475 | 345.8 -27% | 160.3 -66% | 161.3 -66% | 251.5 -47% |
| Read 4k QD32 (MB/s) | 537 | 365.5 -32% | 172.8 -68% | 494.6 -8% | 246.3 -54% |
| Write 4k (MB/s) | 142.6 | 115.6 -19% | 65.8 -54% | 109.4 -23% | 88.7 -38% |
| Read 4k (MB/s) | 56.8 | 26.67 -53% | 20.79 -63% | 34.5 -39% | 26.68 -53% |
| Write 512 (MB/s) | 636 | 265.7 -58% | 298.2 -53% | 172.3 -73% | 389.1 -39% |
| Read 512 (MB/s) | 821 | 443.9 -46% | 351 -57% | 735 -10% | 356.7 -57% |
| Write Seq (MB/s) | 1010 | 337.4 -67% | 458.3 -55% | 195.4 -81% | 431.6 -57% |
| Read Seq (MB/s) | 1372 | 1046 -24% | 476.8 -65% | 1019 -26% | 489.4 -64% |

| 3DMark 11 - 1280x720 Performance GPU | |
| HP Envy 13-ad006ng | |
| Lenovo ThinkPad 25 | |
| Lenovo IdeaPad 320S-13IKB | |
| Dell Inspiron 13 7370 | |
| Dell XPS 13 i5-8250U | |
| Asus Zenbook UX310UA-FC347T iGP | |
| 3DMark | |
| 1280x720 Cloud Gate Standard Graphics | |
| HP Envy 13-ad006ng | |
| Lenovo IdeaPad 320S-13IKB | |
| Lenovo ThinkPad 25 | |
| Dell Inspiron 13 7370 | |
| Asus Zenbook UX310UA-FC347T iGP | |
| Dell XPS 13 i5-8250U | |
| 1920x1080 Fire Strike Graphics | |
| HP Envy 13-ad006ng | |
| Lenovo ThinkPad 25 | |
| Lenovo IdeaPad 320S-13IKB | |
| Dell Inspiron 13 7370 | |
| Asus Zenbook UX310UA-FC347T iGP | |
| 3DMark 11 Performance | 3028 pontos | |
| 3DMark Cloud Gate Standard Score | 8464 pontos | |
| 3DMark Fire Strike Score | 2100 pontos | |
Ajuda | ||
| The Witcher 3 - 1366x768 Medium Graphics & Postprocessing | |
| Microsoft Surface Book 2 | |
| Acer Aspire F5-771G-50RD | |
| Xiaomi Mi Notebook Pro i5 | |
| HP Envy 13-ad006ng | |
| Lenovo ThinkPad 25 | |
| Lenovo IdeaPad 320S-13IKB | |
| Asus Zenbook UX310UA-FC347T iGP | |
| Rise of the Tomb Raider - 1366x768 Medium Preset AF:2x | |
| Microsoft Surface Book 2 | |
| Acer Aspire F5-771G-50RD | |
| Xiaomi Mi Notebook Pro i5 | |
| HP Envy 13-ad006ng | |
| Lenovo ThinkPad 25 | |
| Lenovo IdeaPad 320S-13IKB | |
| Dell XPS 13 i5-8250U | |
| baixo | média | alto | ultra | |
|---|---|---|---|---|
| Company of Heroes 2 (2013) | 45.92 | 35.16 | 20.32 | 7.87 |
| The Witcher 3 (2015) | 44.73 | 24.44 | 13.31 | 6.5 |
| Rise of the Tomb Raider (2016) | 47.33 | 28.15 | 14.83 |
Barulho
| Ocioso |
| 30 / 30 / 30 dB |
| Carga |
| 32.2 / 38.8 dB |
 | ||
30 dB silencioso 40 dB(A) audível 50 dB(A) ruidosamente alto |
||
min: | ||
(±) A temperatura máxima no lado superior é 45 °C / 113 F, em comparação com a média de 35.9 °C / 97 F , variando de 21.4 a 59 °C para a classe Subnotebook.
(-) A parte inferior aquece até um máximo de 47 °C / 117 F, em comparação com a média de 39.2 °C / 103 F
(+) Em uso inativo, a temperatura média para o lado superior é 23.5 °C / 74 F, em comparação com a média do dispositivo de 30.8 °C / ### class_avg_f### F.
(±) Jogando The Witcher 3, a temperatura média para o lado superior é 32.9 °C / 91 F, em comparação com a média do dispositivo de 30.8 °C / ## #class_avg_f### F.
(+) Os apoios para as mãos e o touchpad são mais frios que a temperatura da pele, com um máximo de 27.6 °C / 81.7 F e, portanto, são frios ao toque.
(±) A temperatura média da área do apoio para as mãos de dispositivos semelhantes foi 28.2 °C / 82.8 F (+0.6 °C / 1.1 F).
Lenovo IdeaPad 320S-13IKB análise de áudio
(±) | o volume do alto-falante é médio, mas bom (###valor### dB)
Graves 100 - 315Hz
(±) | graves reduzidos - em média 14.9% menor que a mediana
(±) | a linearidade dos graves é média (9.2% delta para a frequência anterior)
Médios 400 - 2.000 Hz
(±) | médios mais altos - em média 8.3% maior que a mediana
(±) | a linearidade dos médios é média (11.4% delta para frequência anterior)
Altos 2 - 16 kHz
(±) | máximos mais altos - em média 6.7% maior que a mediana
(±) | a linearidade dos máximos é média (7.9% delta para frequência anterior)
Geral 100 - 16.000 Hz
(±) | a linearidade do som geral é média (29.9% diferença em relação à mediana)
Comparado com a mesma classe
» 92% de todos os dispositivos testados nesta classe foram melhores, 1% semelhantes, 7% piores
» O melhor teve um delta de 5%, a média foi 18%, o pior foi 53%
Comparado com todos os dispositivos testados
» 88% de todos os dispositivos testados foram melhores, 3% semelhantes, 9% piores
» O melhor teve um delta de 4%, a média foi 23%, o pior foi 134%
HP Envy 13-ad006ng análise de áudio
(-) | alto-falantes não muito altos (###valor### dB)
Graves 100 - 315Hz
(-) | quase nenhum baixo - em média 27.6% menor que a mediana
(±) | a linearidade dos graves é média (9.8% delta para a frequência anterior)
Médios 400 - 2.000 Hz
(+) | médios equilibrados - apenas 2.2% longe da mediana
(+) | médios são lineares (6.1% delta para frequência anterior)
Altos 2 - 16 kHz
(+) | agudos equilibrados - apenas 2% longe da mediana
(+) | os máximos são lineares (3.7% delta da frequência anterior)
Geral 100 - 16.000 Hz
(±) | a linearidade do som geral é média (20.2% diferença em relação à mediana)
Comparado com a mesma classe
» 64% de todos os dispositivos testados nesta classe foram melhores, 9% semelhantes, 27% piores
» O melhor teve um delta de 5%, a média foi 18%, o pior foi 53%
Comparado com todos os dispositivos testados
» 53% de todos os dispositivos testados foram melhores, 8% semelhantes, 39% piores
» O melhor teve um delta de 4%, a média foi 23%, o pior foi 134%
| desligado | |
| Ocioso | |
| Carga |
|
Key:
min: | |
| Lenovo IdeaPad 320S-13IKB i5-8250U, GeForce MX150, Samsung PM961 NVMe MZVLW512HMJP, IPS LED, 1920x1080, 13.3" | Dell XPS 13 i5-8250U i5-8250U, UHD Graphics 620, Toshiba XG5 KXG50ZNV256G, IGZO IPS, 3200x1800, 13.3" | Dell Inspiron 13 7370 i5-8250U, UHD Graphics 620, Micron 1100 MTFDDAV256TBN, IPS, 1920x1080, 13.3" | HP Envy 13-ad006ng i7-7500U, GeForce MX150, Toshiba NVMe THNSN5256GPUK, IPS LED, 1920x1080, 13.3" | Asus Zenbook UX310UA-FC347T iGP i7-7500U, HD Graphics 620, Micron SSD 1100 (MTFDDAV256TBN), IPS, LED, 1920x1080, 13.3" | |
|---|---|---|---|---|---|
| Power Consumption | -3% | 5% | 7% | 9% | |
| Idle Minimum * (Watt) | 3.4 | 3.6 -6% | 3.6 -6% | 2.8 18% | 3.5 -3% |
| Idle Average * (Watt) | 6.1 | 7.9 -30% | 6.8 -11% | 5.8 5% | 6.6 -8% |
| Idle Maximum * (Watt) | 7.7 | 8.5 -10% | 8.9 -16% | 7.7 -0% | 7.5 3% |
| Load Average * (Watt) | 44.2 | 43 3% | 36 19% | 48 -9% | 34.7 21% |
| Witcher 3 ultra * (Watt) | 37.6 | 35 7% | |||
| Load Maximum * (Watt) | 60.3 | 43 29% | 36.5 39% | 48 20% | 39.6 34% |
* ... menor é melhor
| Lenovo IdeaPad 320S-13IKB i5-8250U, GeForce MX150, 36 Wh | Dell XPS 13 i5-8250U i5-8250U, UHD Graphics 620, 60 Wh | Dell Inspiron 13 7370 i5-8250U, UHD Graphics 620, 38 Wh | HP Envy 13-ad006ng i7-7500U, GeForce MX150, 51 Wh | Asus Zenbook UX310UA-FC347T iGP i7-7500U, HD Graphics 620, 48 Wh | |
|---|---|---|---|---|---|
| Duração da bateria | 83% | 5% | 48% | 44% | |
| Reader / Idle (h) | 12.3 | 18.2 48% | 12.9 5% | 20 63% | 16.1 31% |
| H.264 (h) | 5.8 | 7.9 36% | 6.9 19% | ||
| WiFi v1.3 (h) | 5.7 | 11.5 102% | 5.8 2% | 7.1 25% | 9.6 68% |
| Load (h) | 1.2 | 2.4 100% | 1.3 8% | 2 67% | 1.9 58% |
Pro
Contra
O IdeaPad 320s-13IKBR é uma oferta tentadora, mas a Lenovo fez alguns recortes significantes.
Com o Intel Core i5-8250U e a Nvidia GeForce MX150 em um parelho tão compacto é fácil anunciá-lo, especialmente porque atualmente é o portátil mais barato com essa combinação de componentes. O problema: Tanto o processador quanto o chip gráfico ficam muito aquém das expectativas. O Core i5-8250U está longe de ser o máximo e pode até cair para o nível de um processador dual-core de última geração enquanto estiver sob carga. É ainda pior com a GPU GeForce, que funciona completamente no nível do antecessor de desatualizado 940MX Maxwell. Além desta limitação de desempenho, a bateria excessivamente pequena é um problema, porque o que é bom é um portátil ultra-móvel se você não pode usá-lo por muito tempo quando estiver em movimento. O fabricante também anuncia o processador rápido e a GPU relativamente boa, mas eles não oferecem o desempenho esperado.
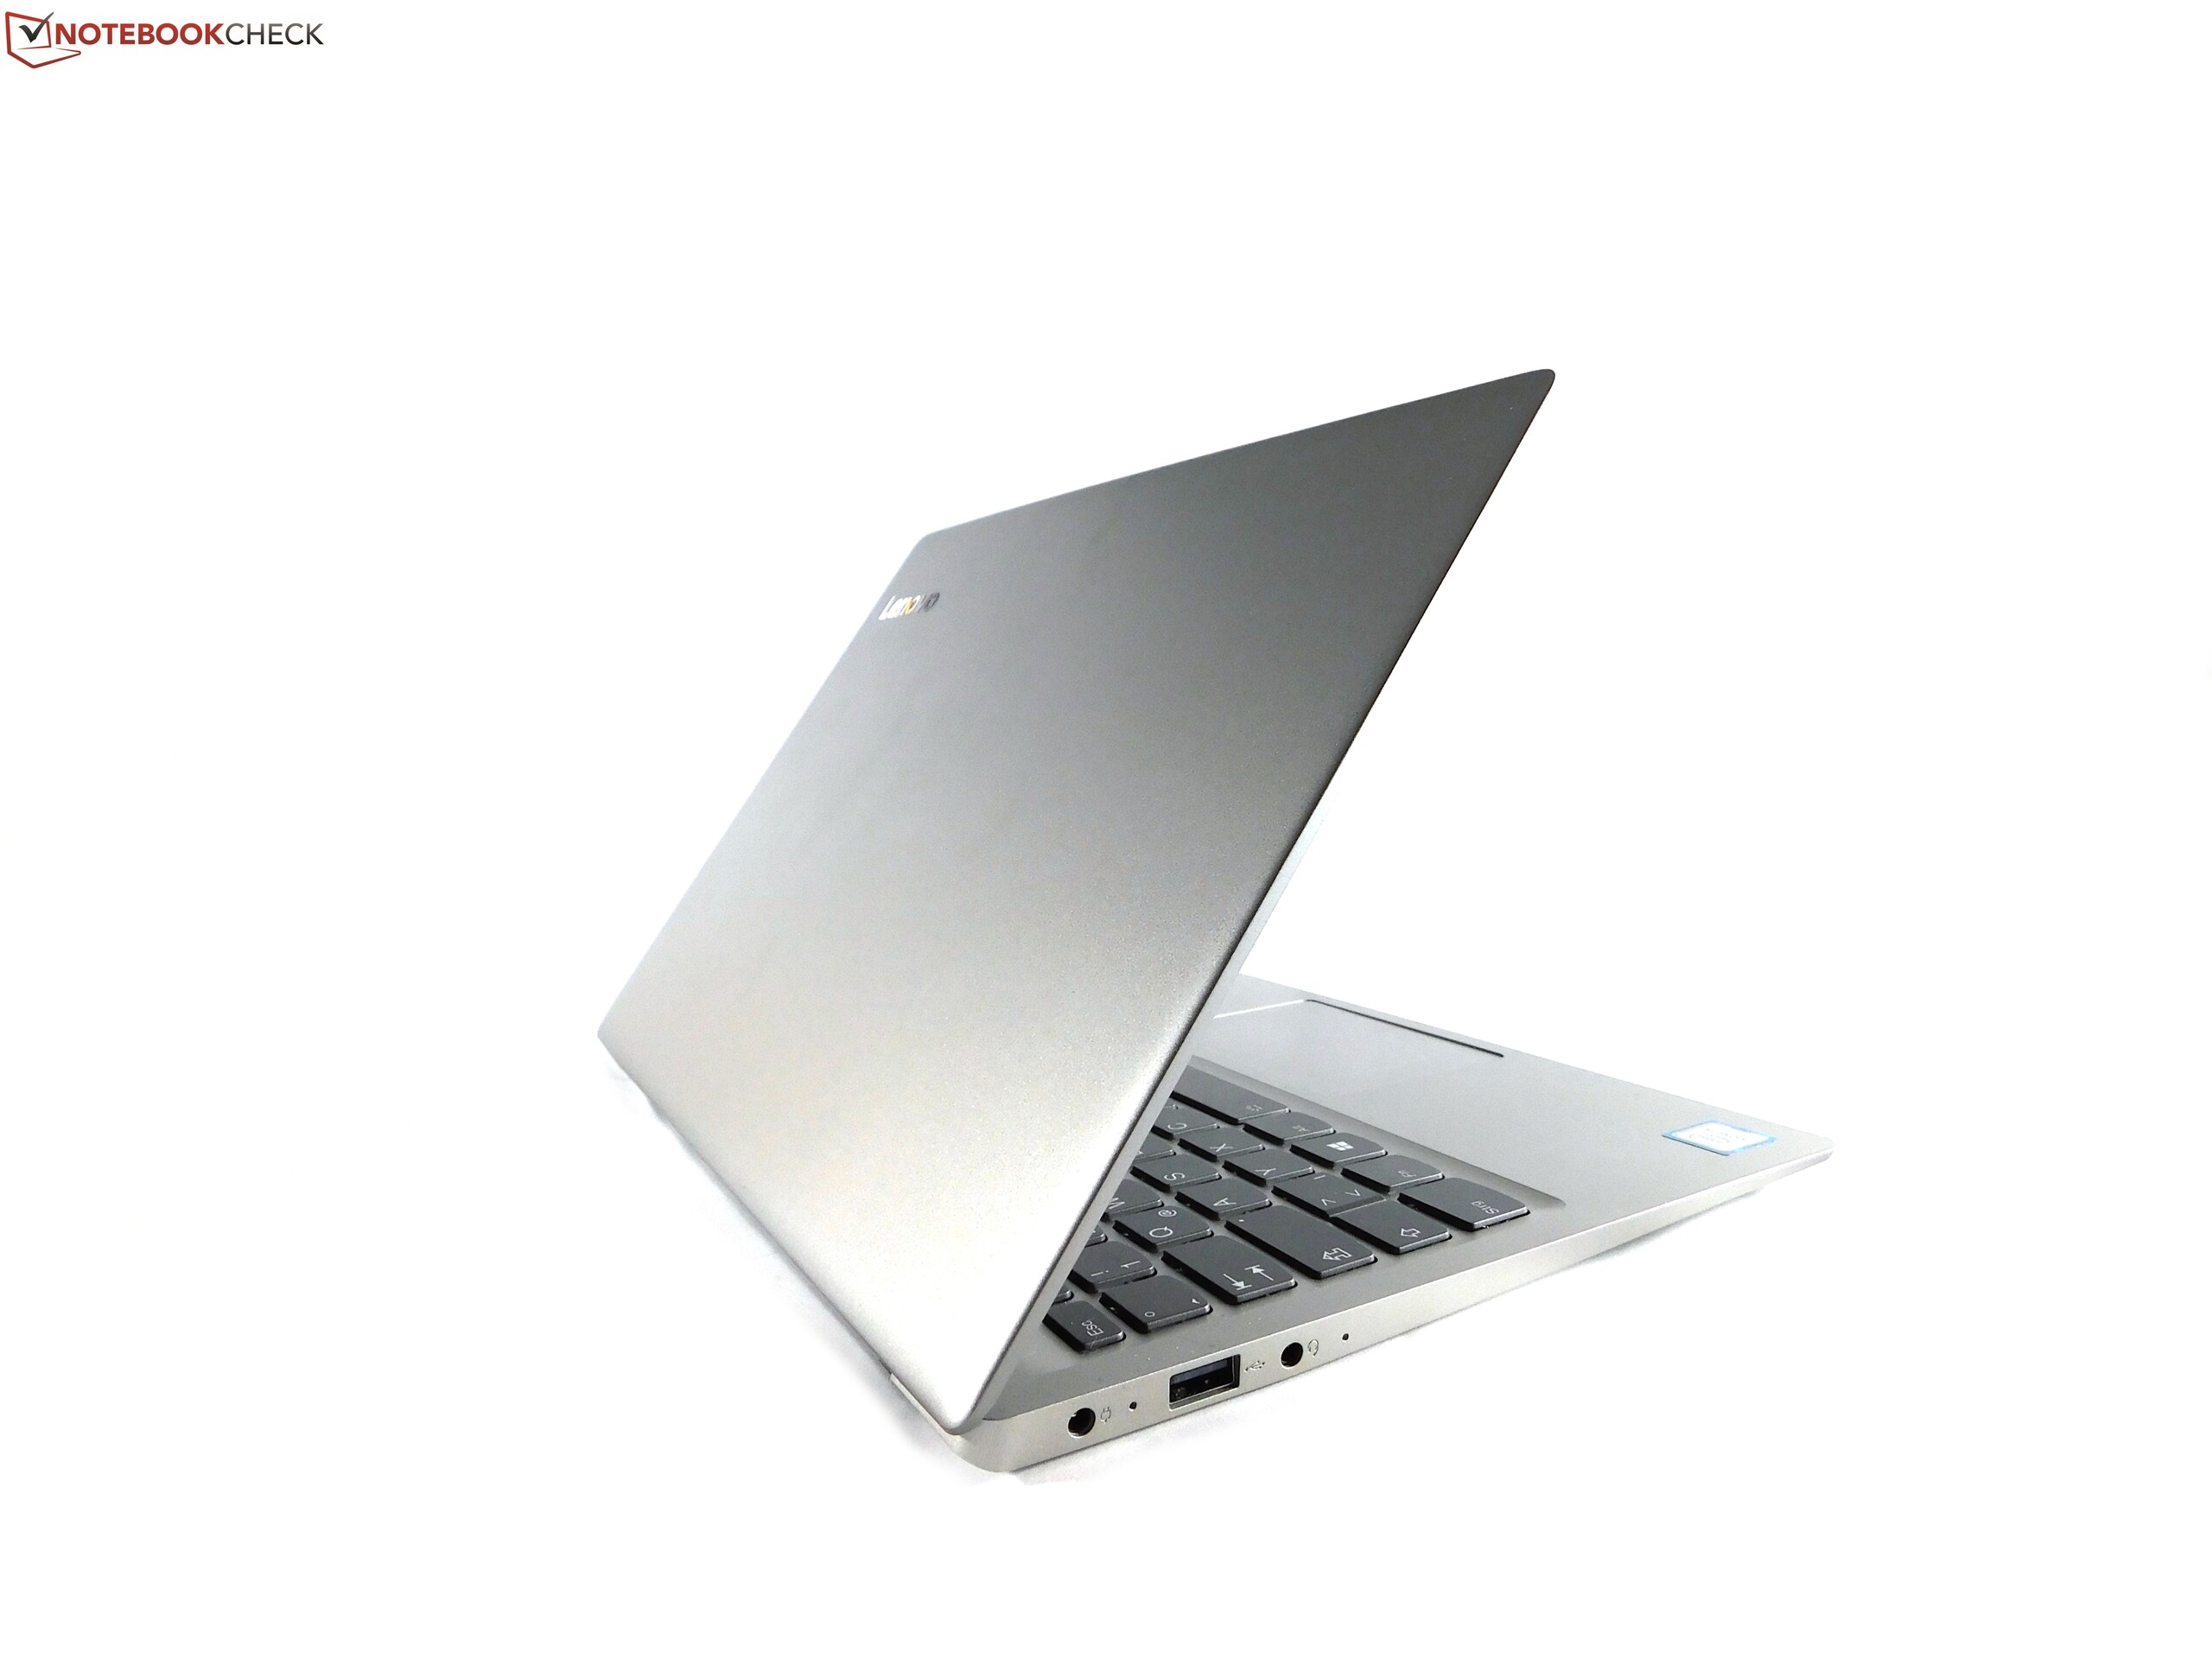
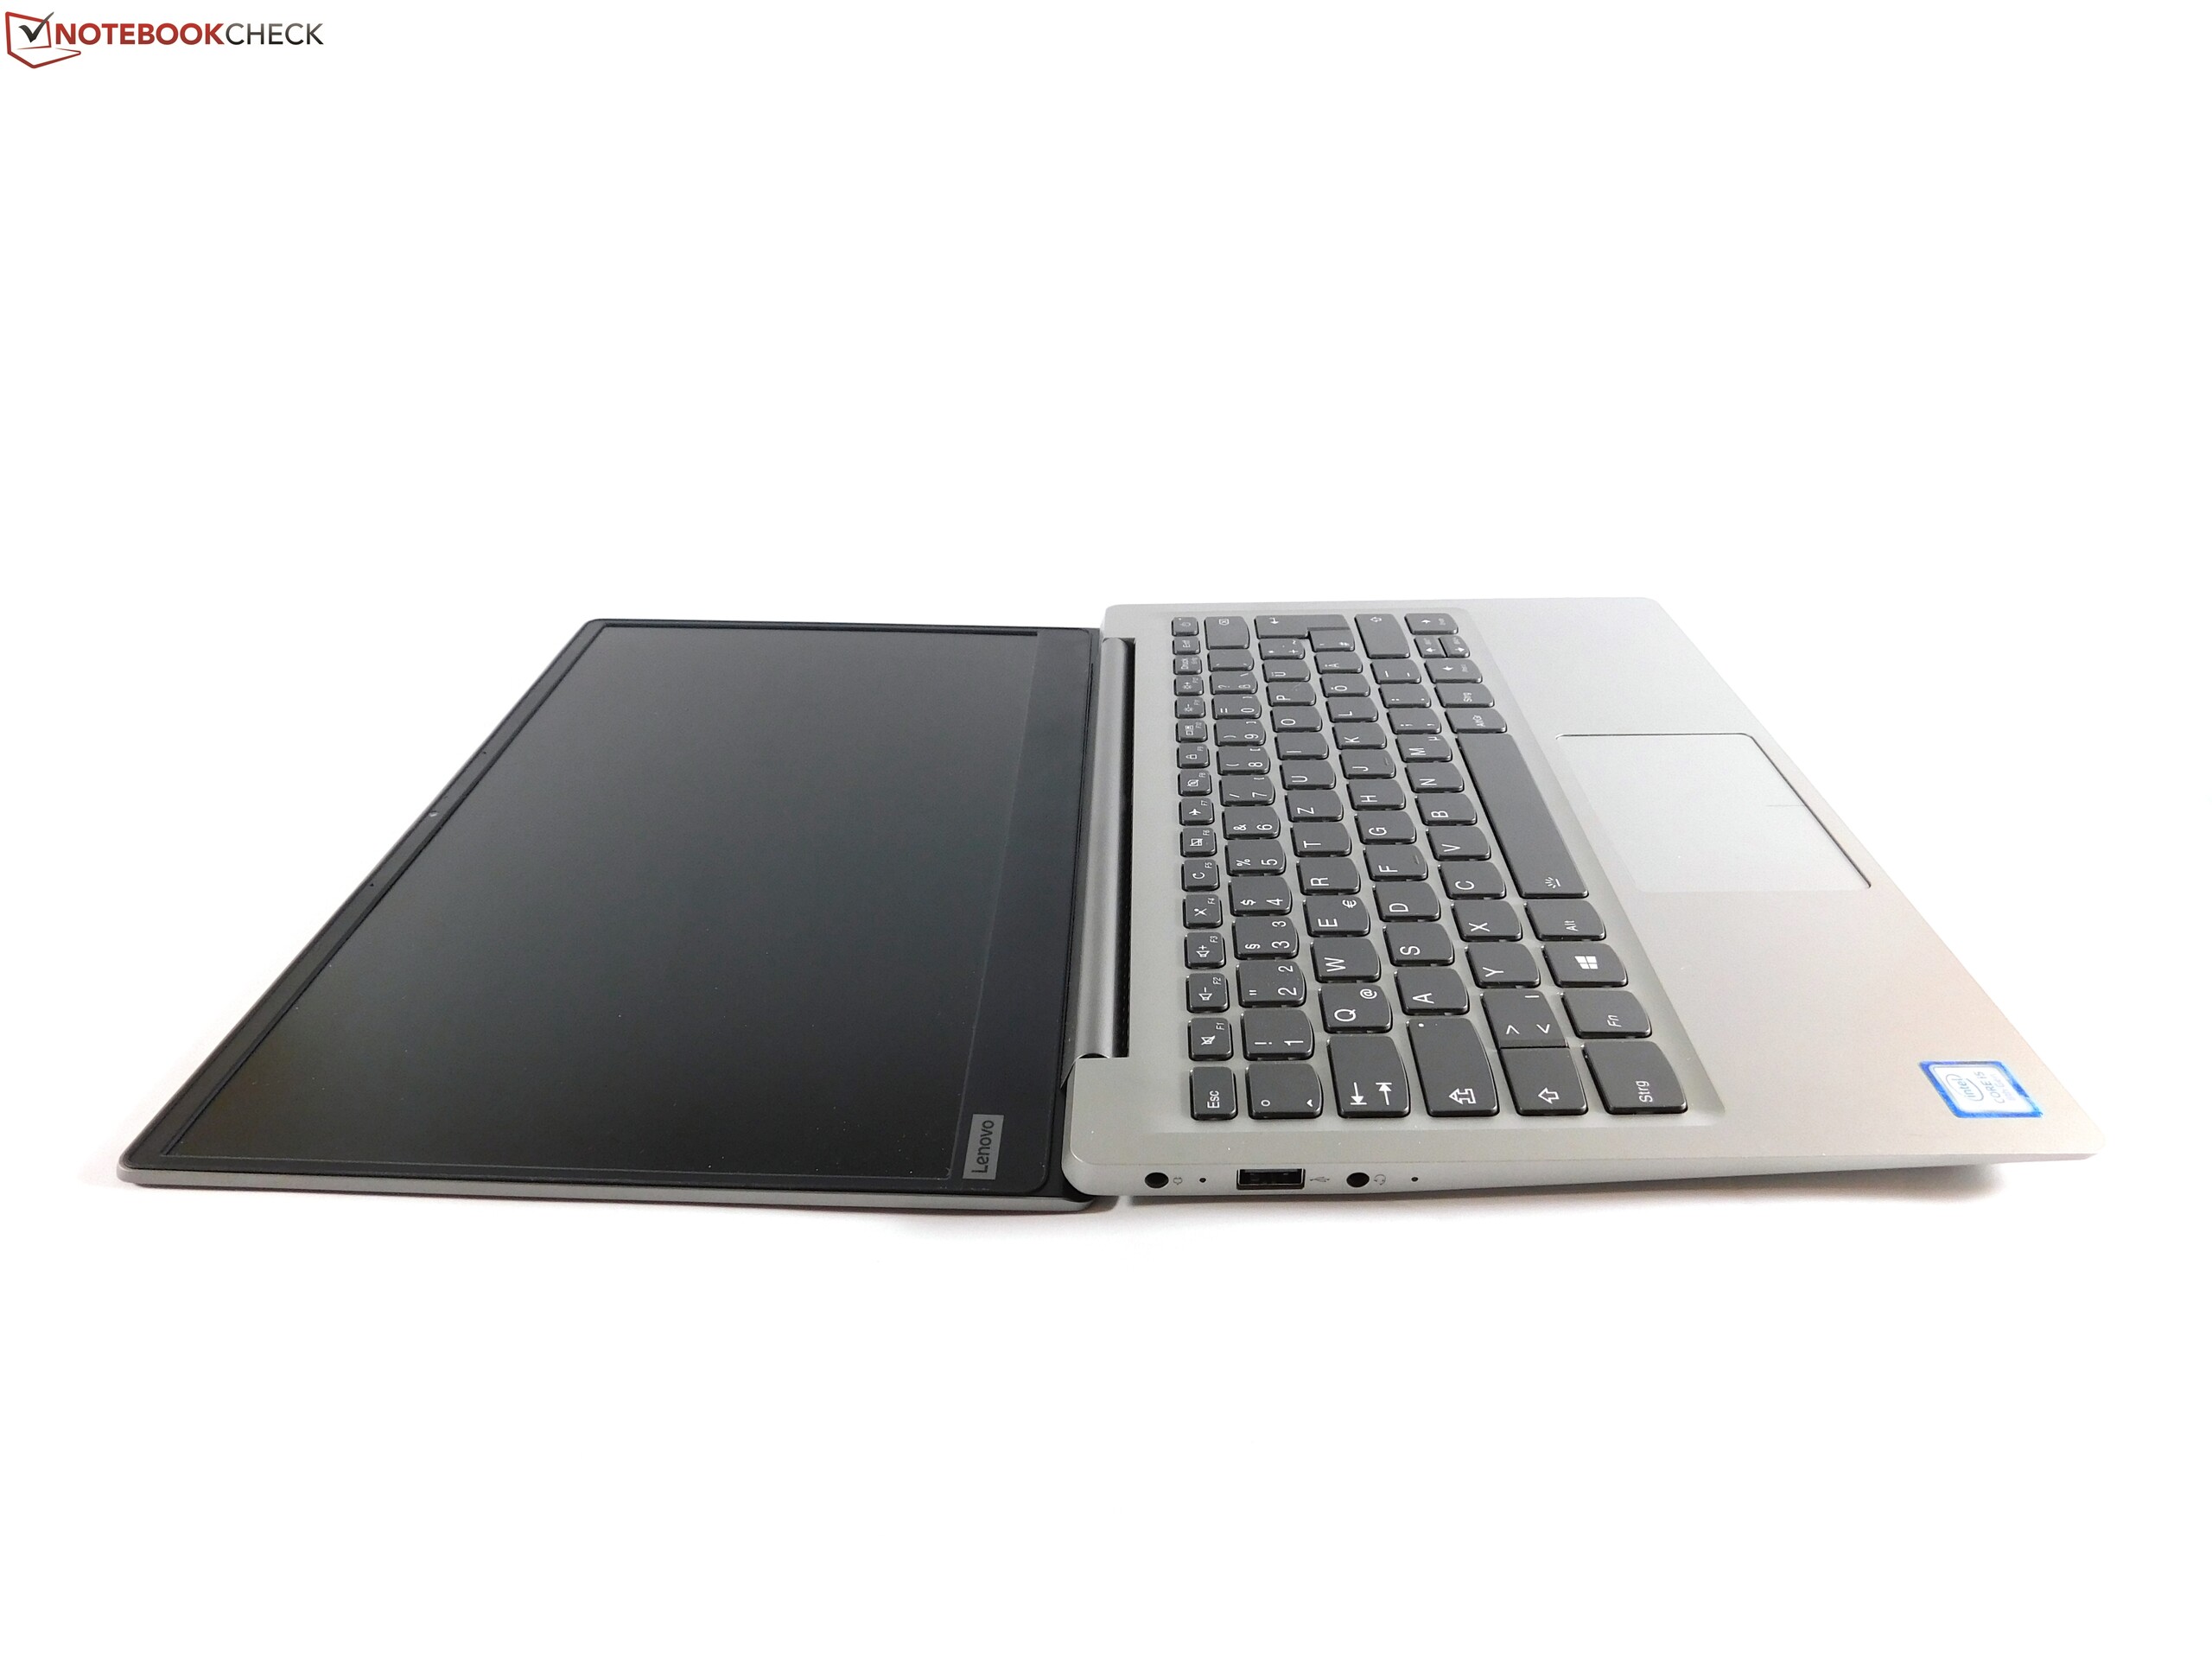
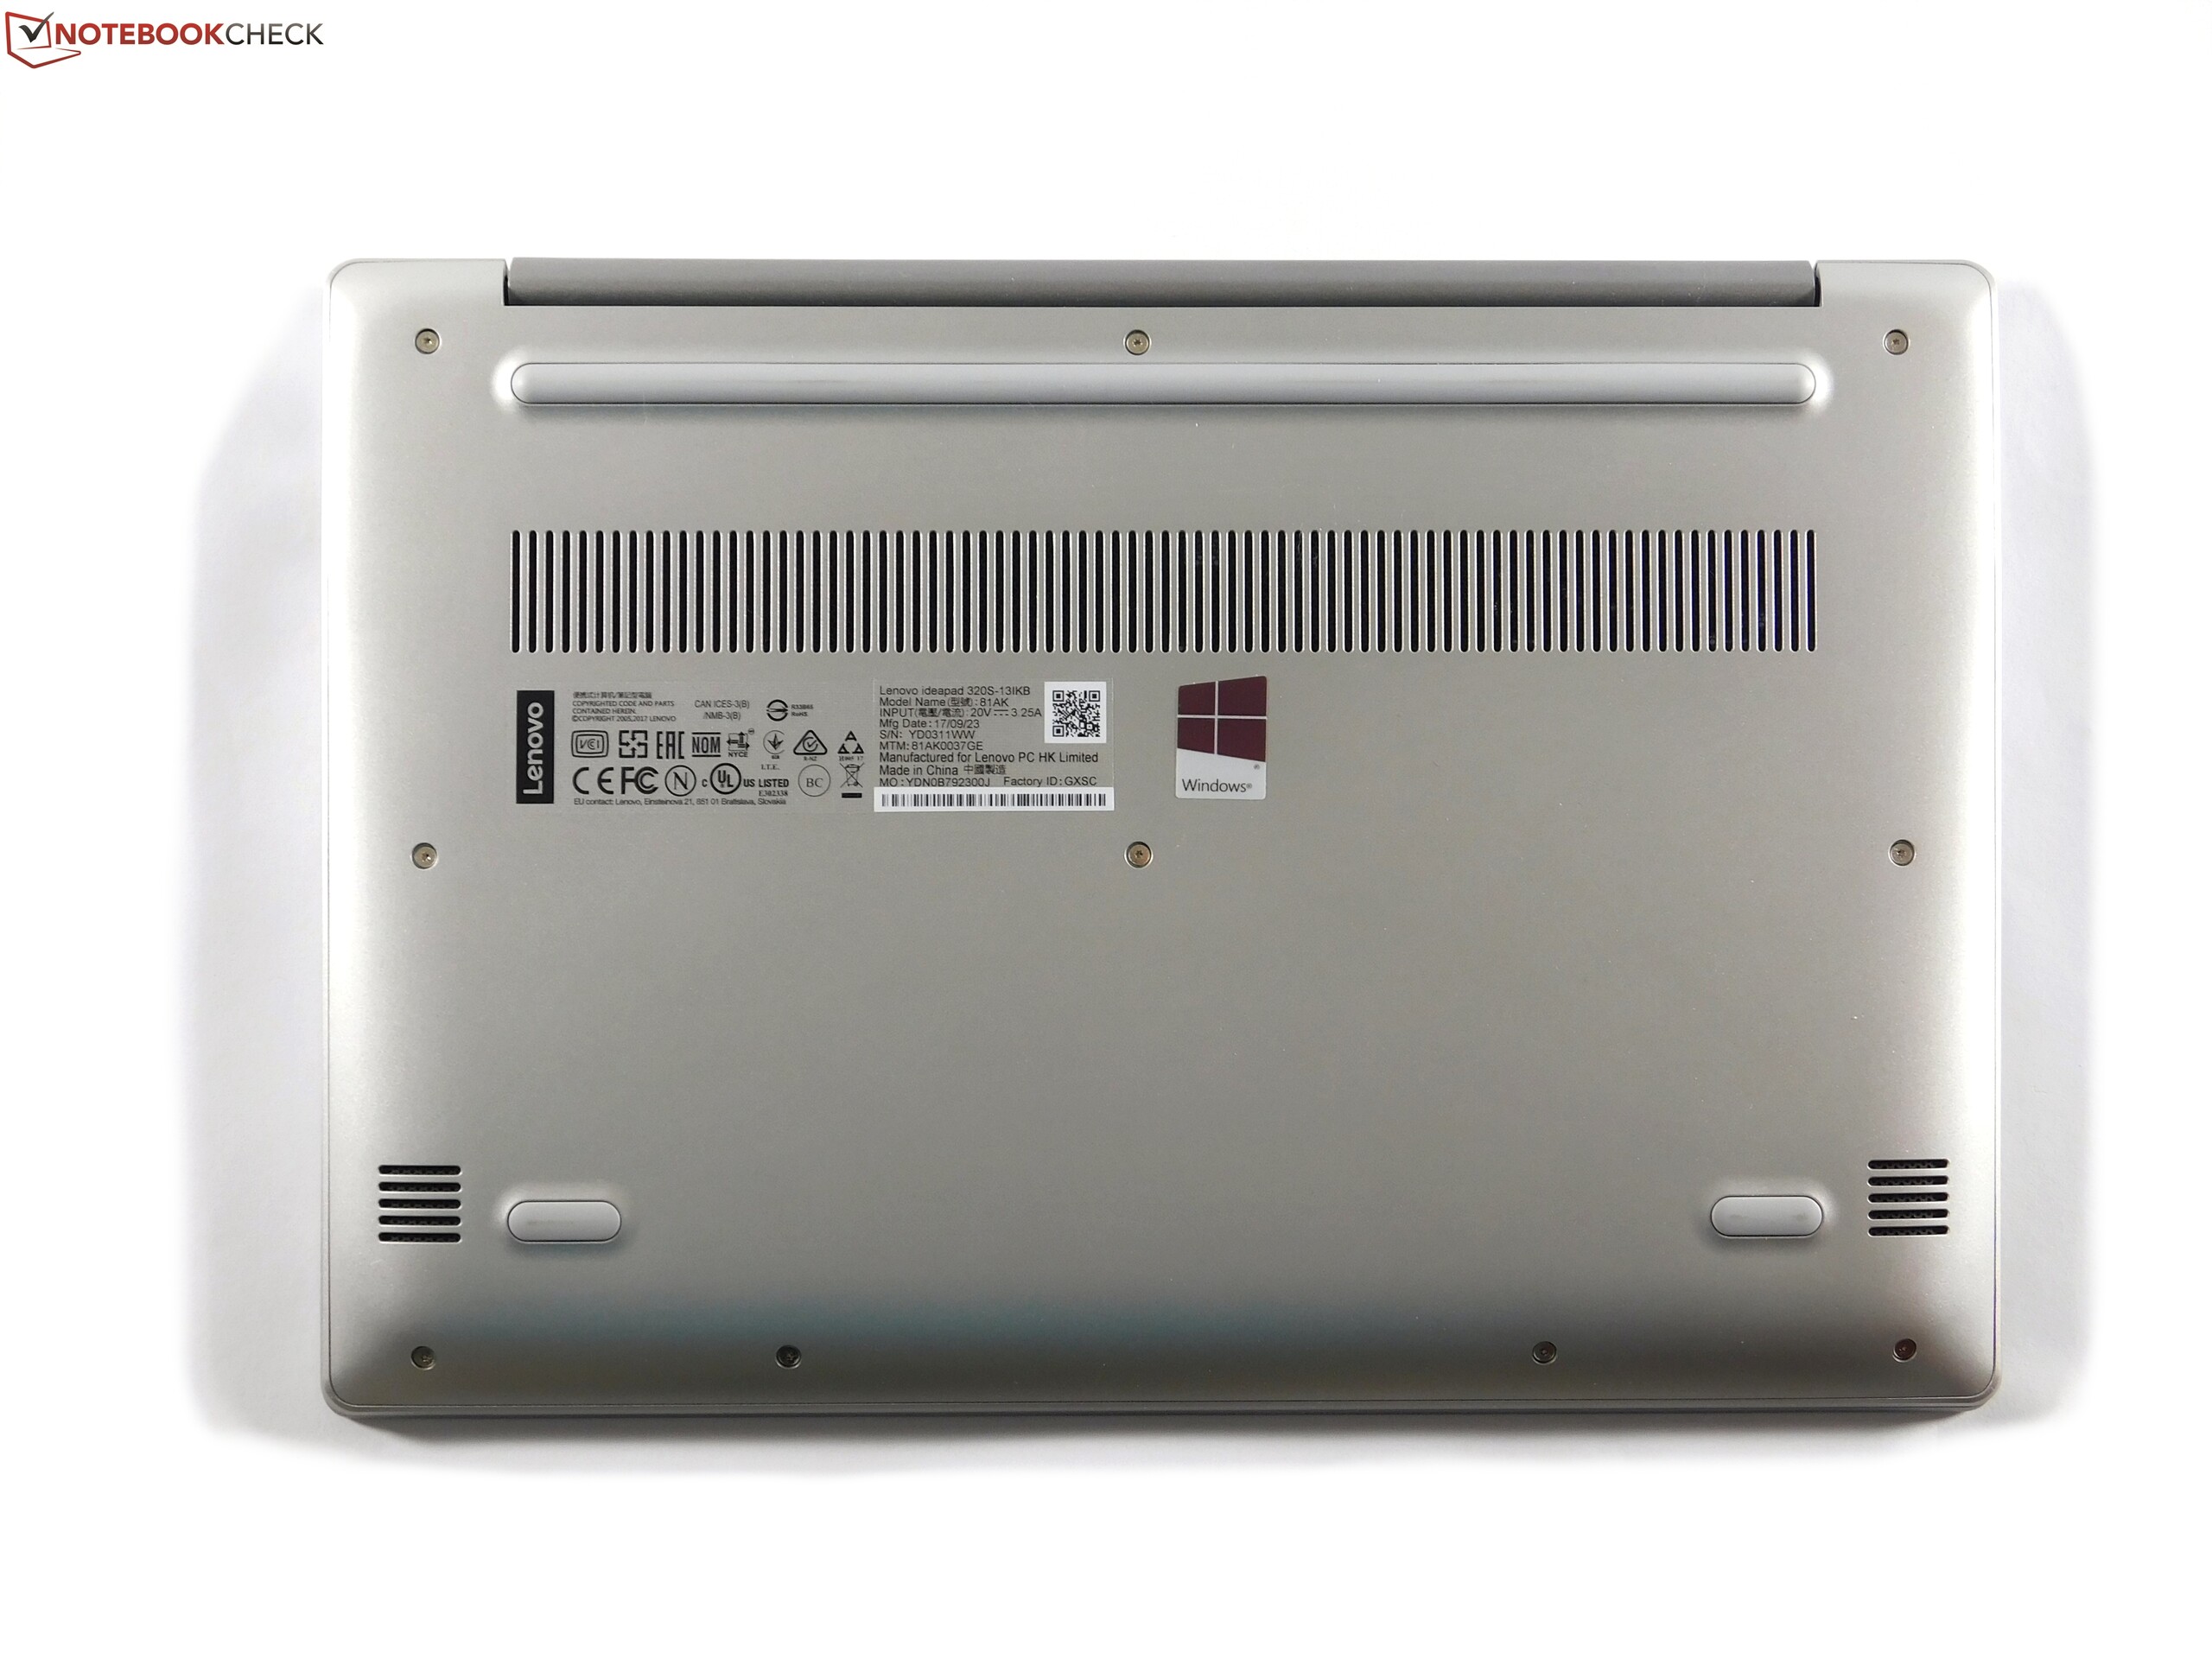
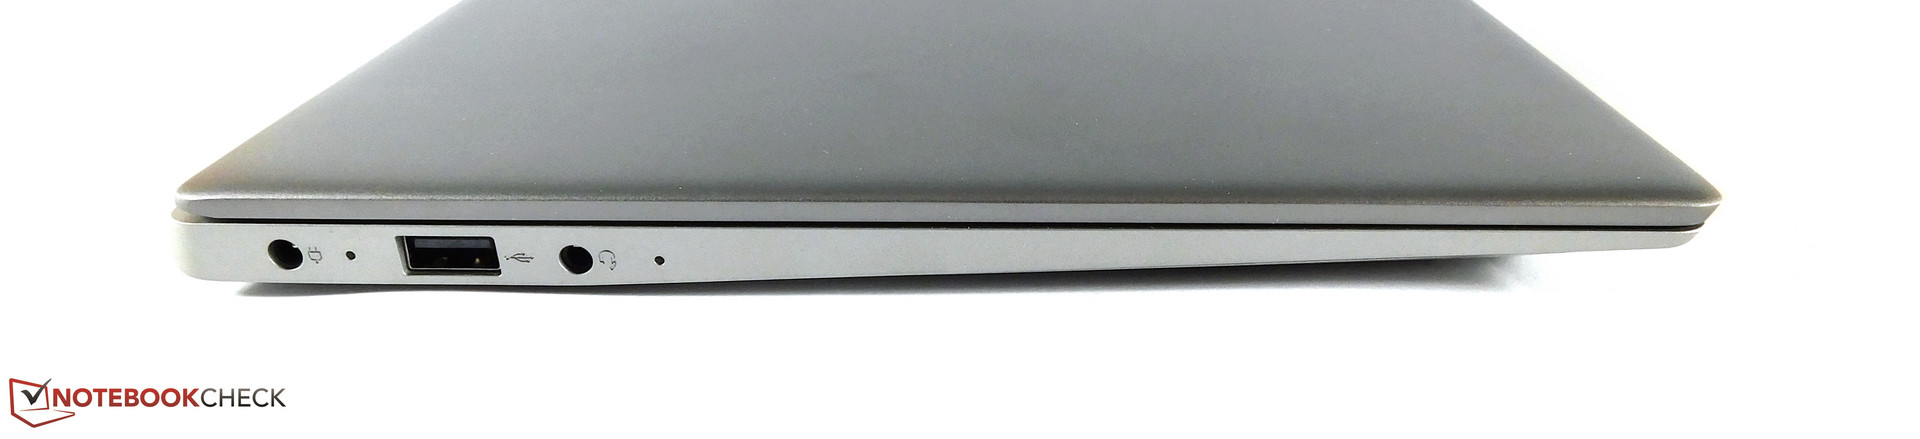
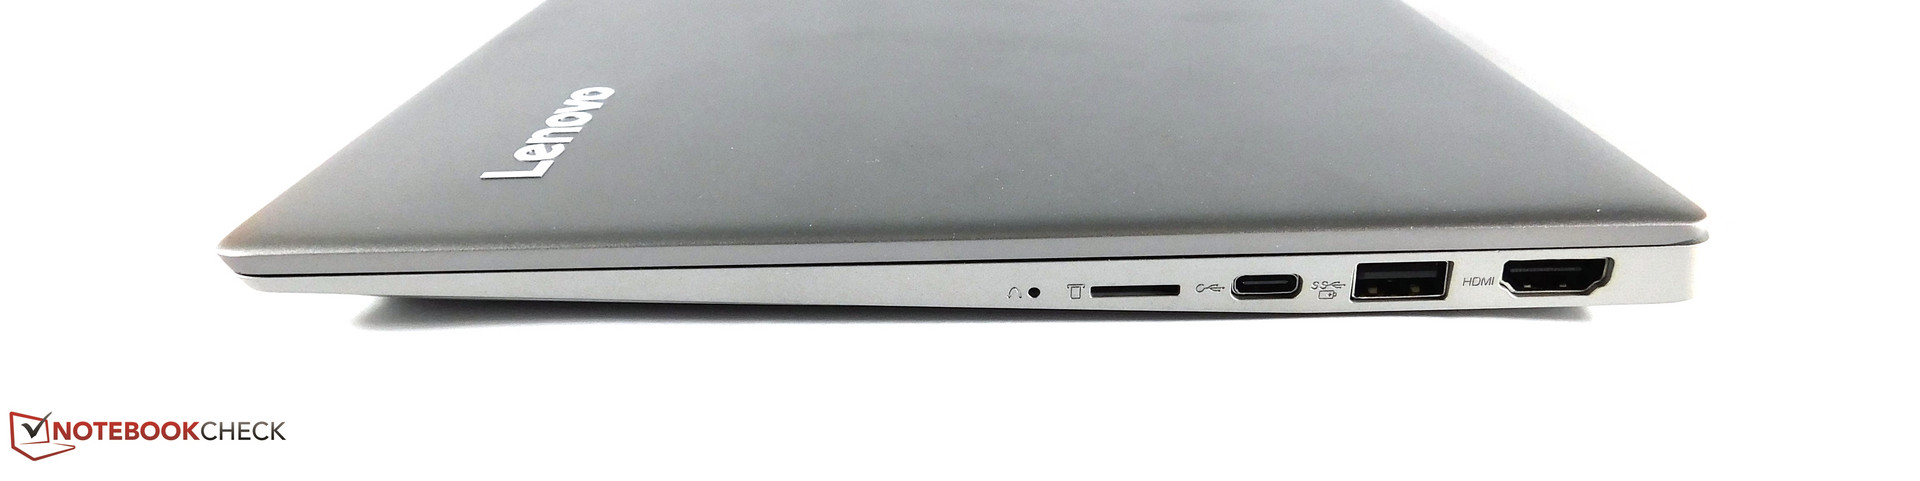
É uma pena, porque o IdeaPad 320s-13IKBR também tem seus aspectos positivos. Isso inclui, acima de tudo, a muito boa tela, que apresenta PWM, mas que fora isso também está bem: brilho de mais de 300 cd / m², bons valores de contraste e gama de cores de 97% do espaço de cores sRGB. Graças à sua superfície mate, a tela é fácil de enxergar em exteriores, bem como em interiores. Além da tela, também se deve se mencionar que o SSD rápido e o bom TouchPad, não apresentaram pontos fracos no teste. As dimensões compactas também são bonitas devido aos marcos mínimos da tela e ao ventilador silencioso. No entanto, menos bom é o fato do Lenovo ter apenas uma porta USB-C mal mutilada, e igual de incompreensível é a porta USB 2.0. Embora a placa 1x1 WLAN não seja lenta na vida cotidiana, limita consideravelmente as taxas de transferência.
Baixa duração da bateria e mau desempenho: O IdeaPad 320s-13IKBR possui muitos pontos fracos em áreas cruciais.
Lenovo IdeaPad 320S-13IKB
- 12/04/2017 v6 (old)
Benjamin Herzig