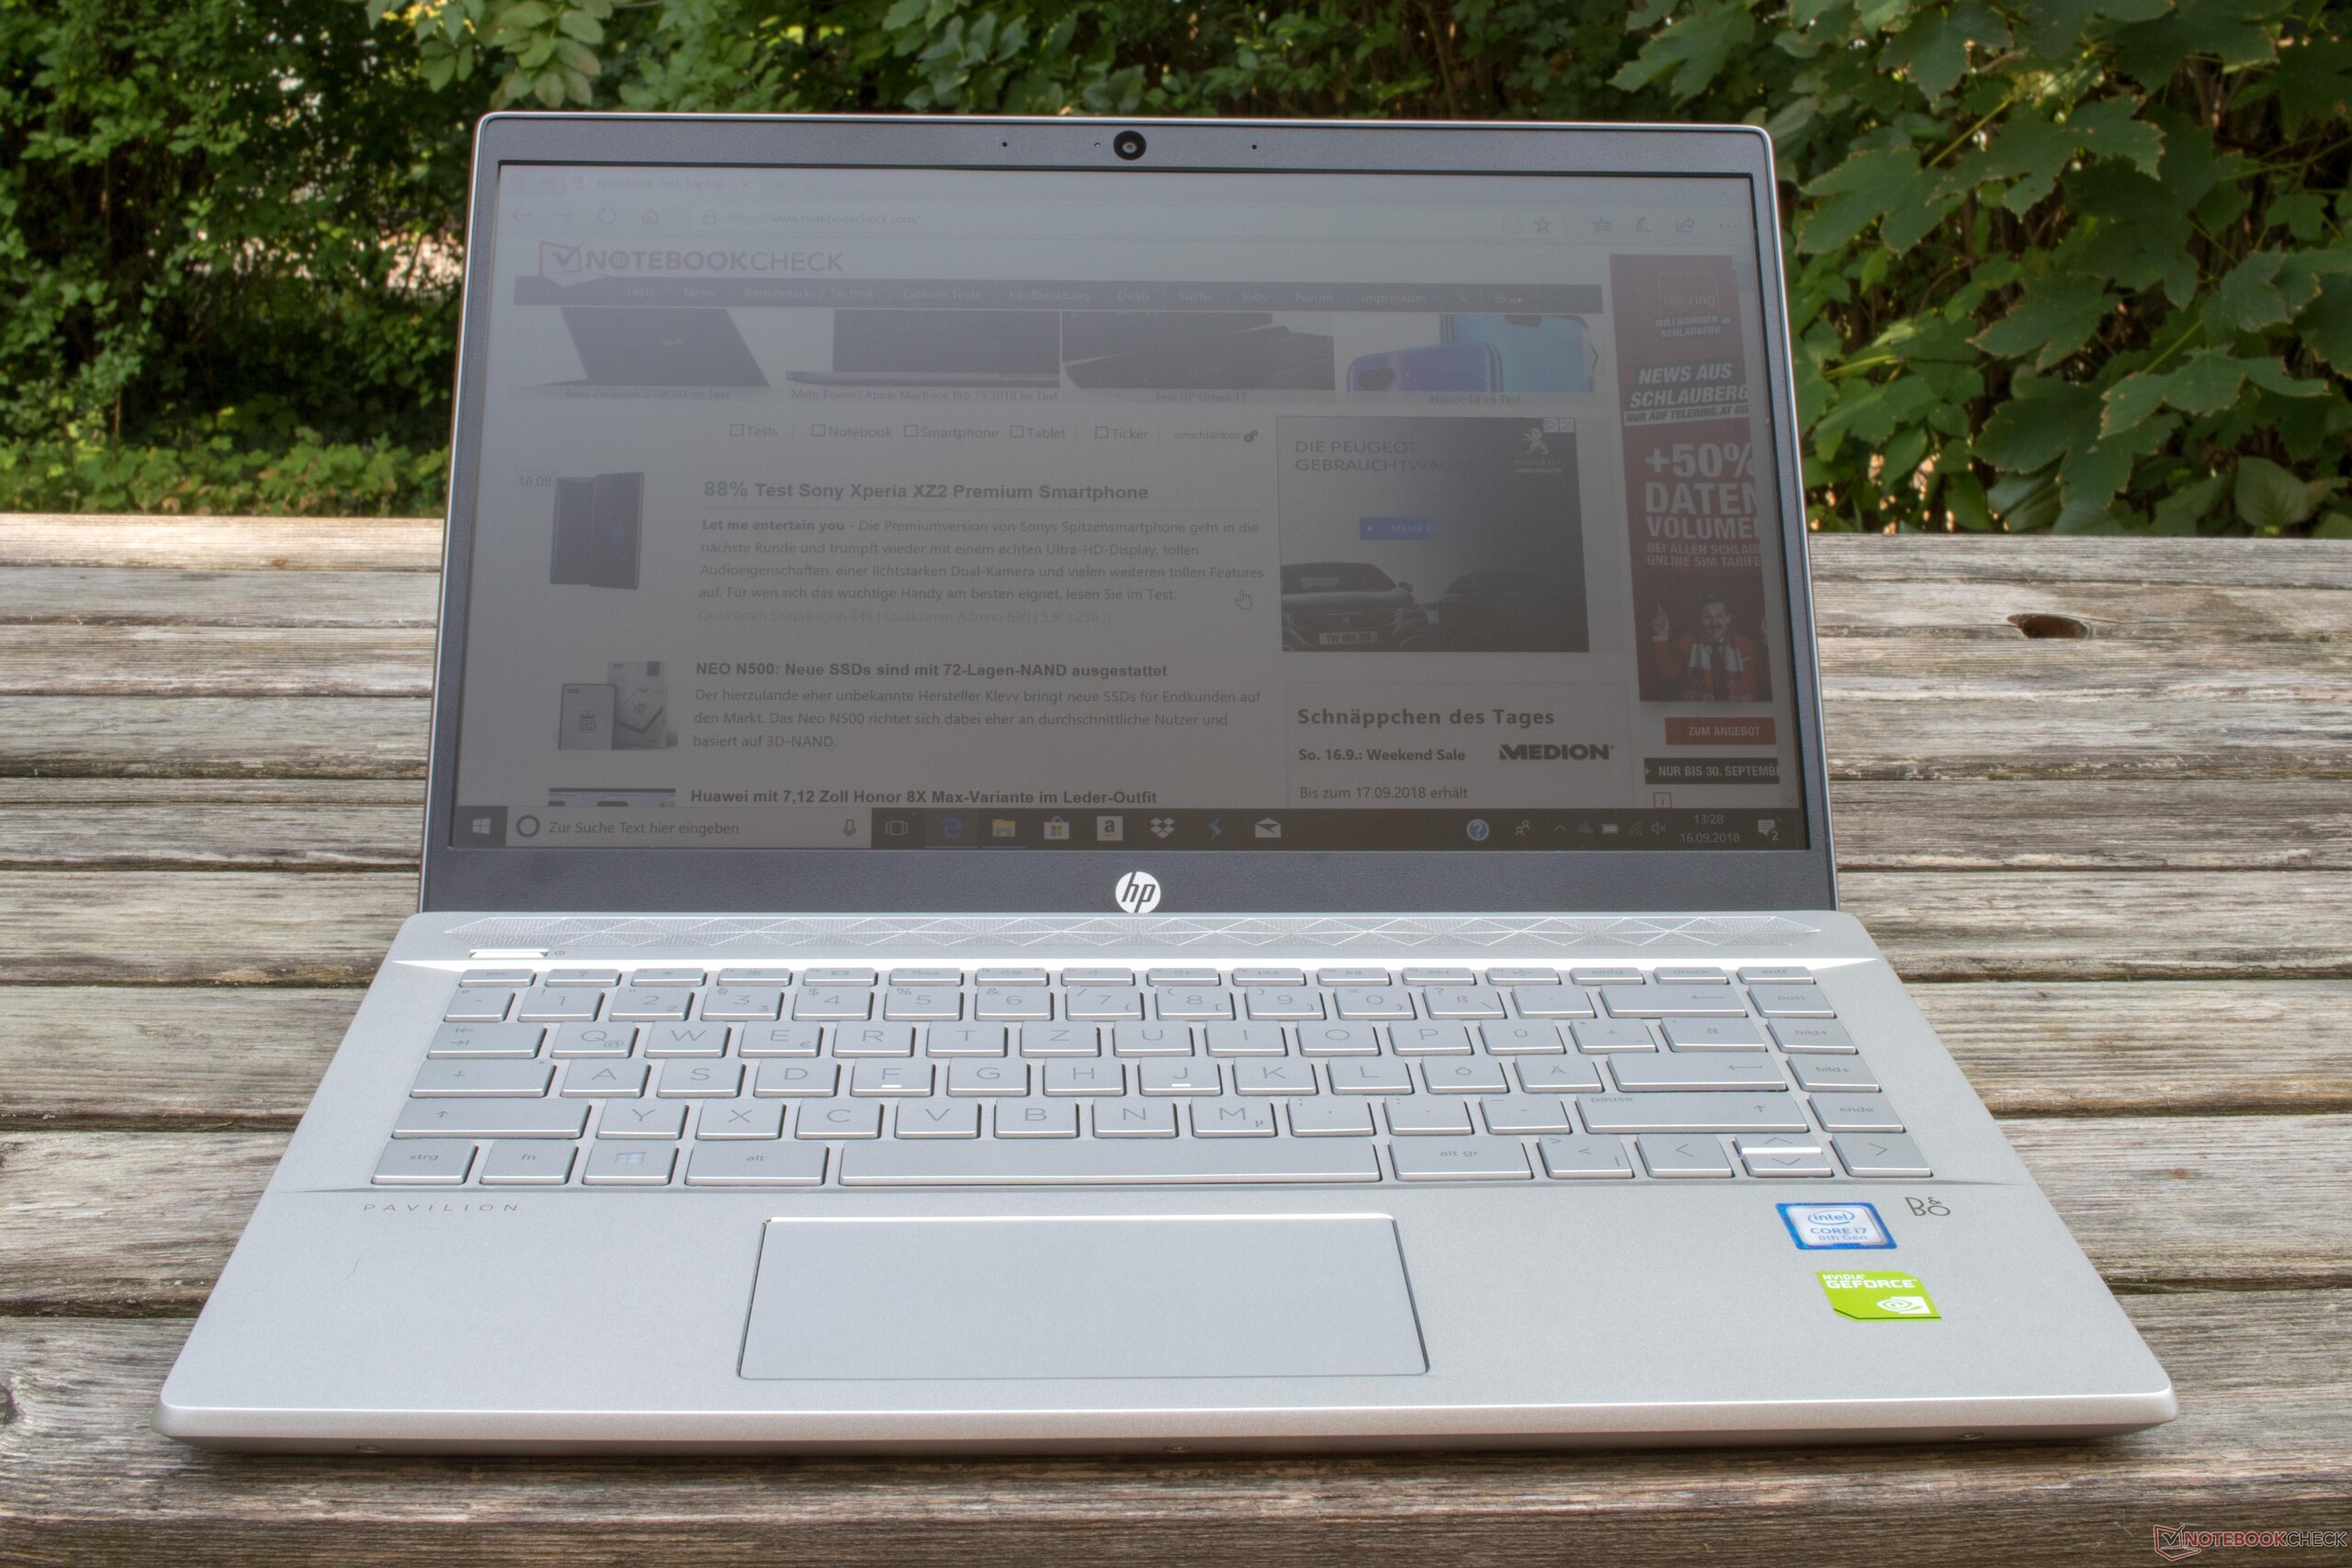
Breve Análise do Portátil HP Pavilion 14 (i7-8550U, MX150)
| SD Card Reader | |
| average JPG Copy Test (av. of 3 runs) | |
| HP Spectre x360 15-ch011nr (Toshiba Exceria Pro SDXC 64 GB UHS-II) | |
| Média da turma Multimedia (23 - 531, n=43, últimos 2 anos) | |
| Lenovo ThinkPad T480s-20L8S02E00 (Toshiba Exceria Pro SDXC 64 GB UHS-II) | |
| HP Pavilion 14-ce0002ng (Toshiba Exceria Pro SDXC 64 GB UHS-II) | |
| HP Pavilion 15-cw0003ng (Toshiba Exceria Pro SDXC 64 GB UHS-II) | |
| Asus Zenbook UX430UN (Toshiba Exceria Pro SDXC 64 GB UHS-II) | |
| Lenovo IdeaPad 530s-14IKB (Toshiba Exceria Pro SDXC 64 GB UHS-II) | |
| maximum AS SSD Seq Read Test (1GB) | |
| HP Spectre x360 15-ch011nr (Toshiba Exceria Pro SDXC 64 GB UHS-II) | |
| Média da turma Multimedia (27.9 - 1455, n=42, últimos 2 anos) | |
| Lenovo ThinkPad T480s-20L8S02E00 (Toshiba Exceria Pro SDXC 64 GB UHS-II) | |
| Asus Zenbook UX430UN (Toshiba Exceria Pro SDXC 64 GB UHS-II) | |
| HP Pavilion 14-ce0002ng (Toshiba Exceria Pro SDXC 64 GB UHS-II) | |
| HP Pavilion 15-cw0003ng (Toshiba Exceria Pro SDXC 64 GB UHS-II) | |
| Lenovo IdeaPad 530s-14IKB (Toshiba Exceria Pro SDXC 64 GB UHS-II) | |
| |||||||||||||||||||||||||
iluminação: 88 %
iluminação com acumulador: 205 cd/m²
Contraste: 885:1 (Preto: 0.27 cd/m²)
ΔE ColorChecker Calman: 5.3 | ∀{0.5-29.43 Ø4.72}
calibrated: 3.64
ΔE Greyscale Calman: 5.85 | ∀{0.09-98 Ø4.97}
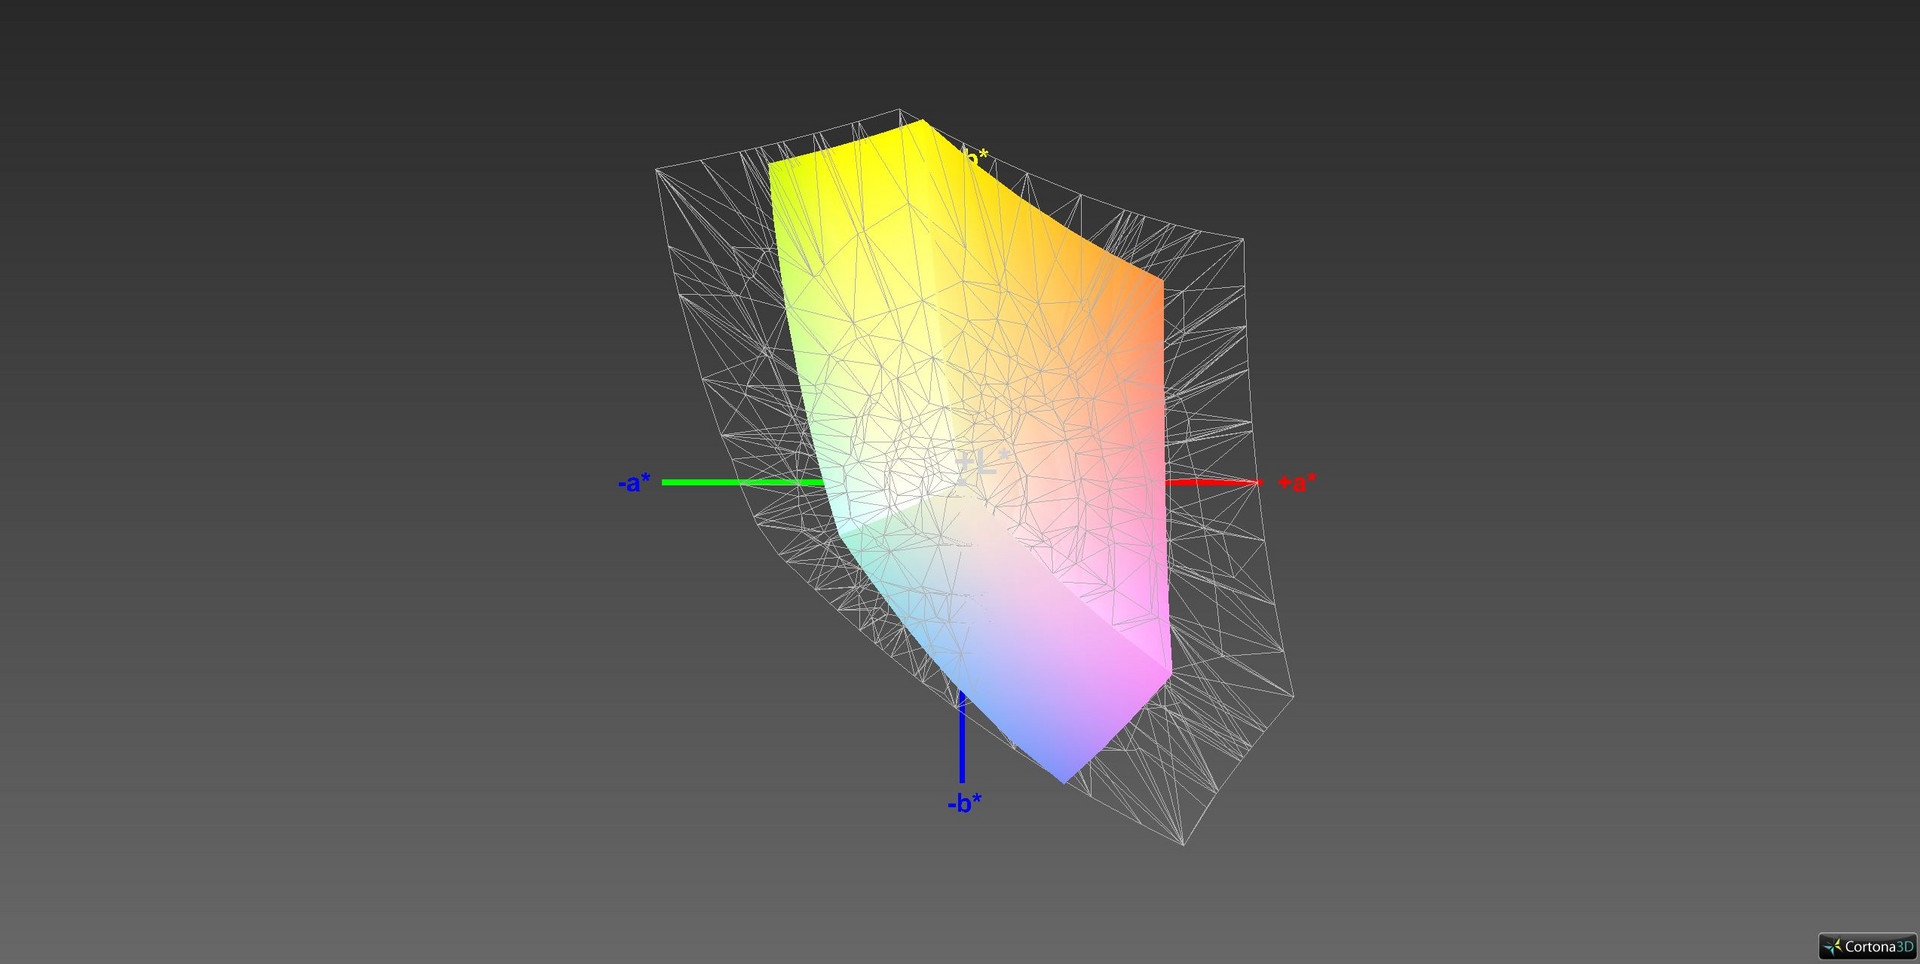
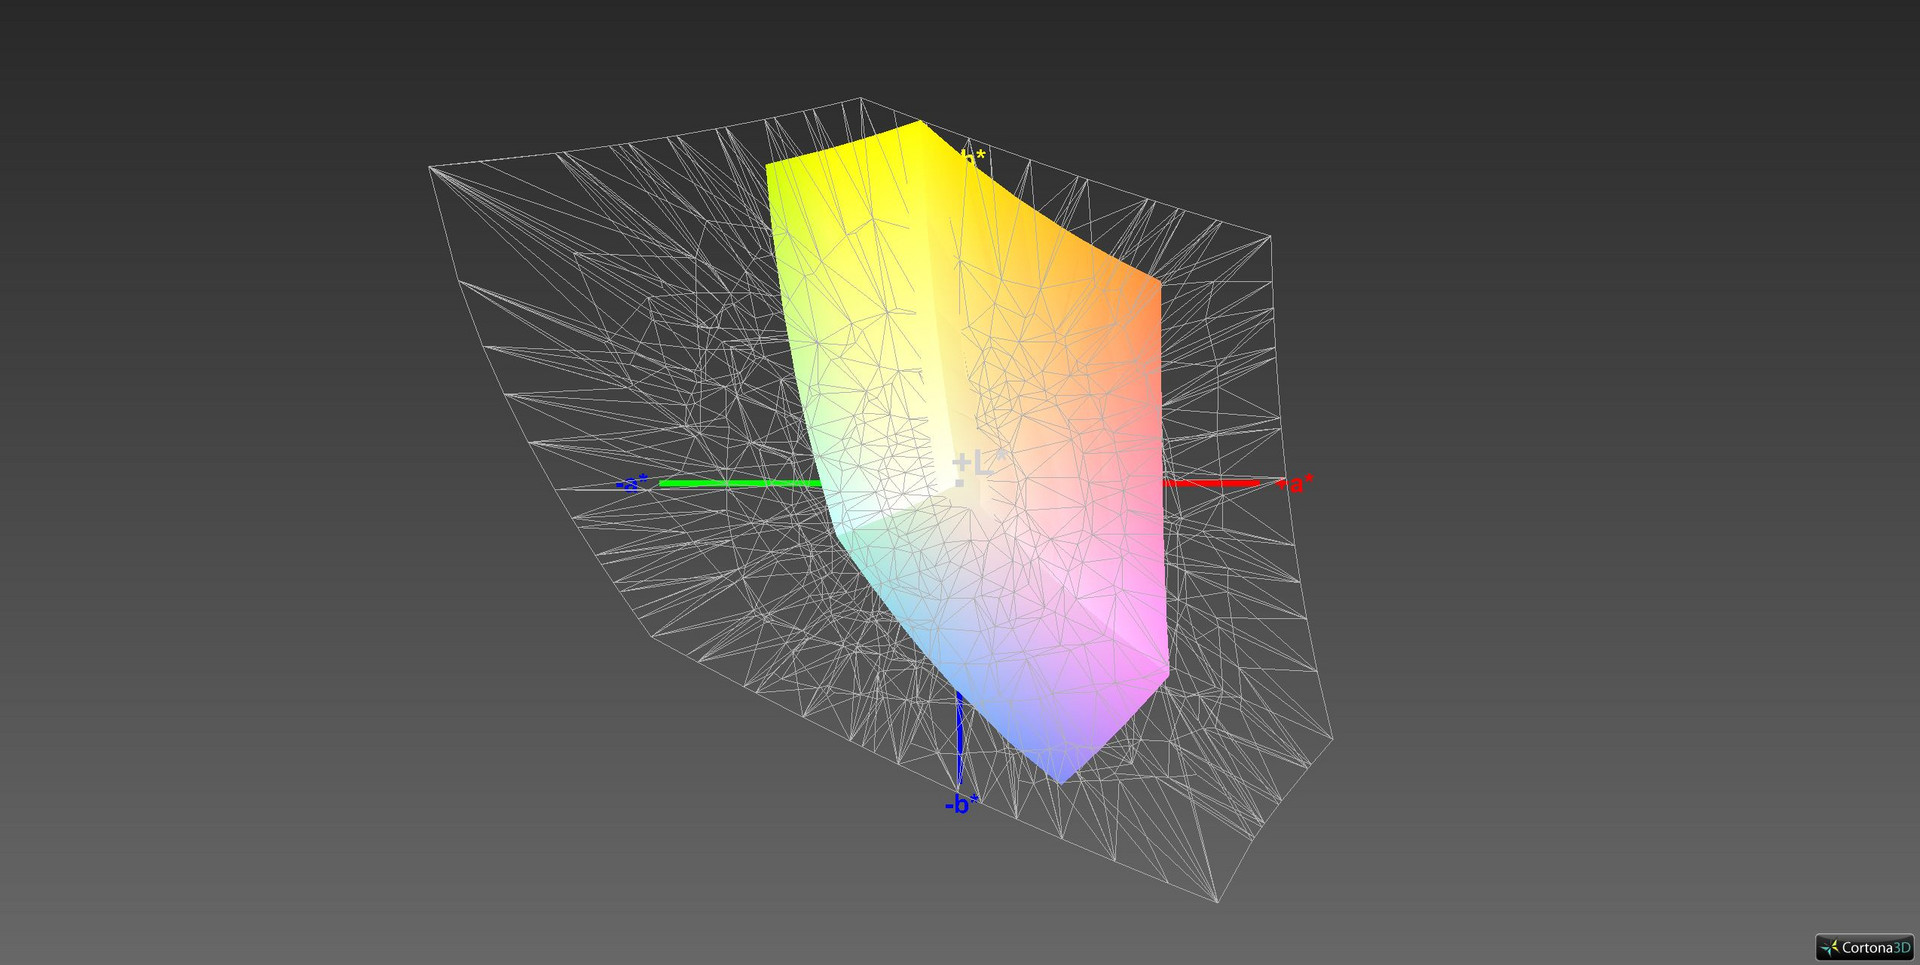
59% sRGB (Argyll 1.6.3 3D)
38% AdobeRGB 1998 (Argyll 1.6.3 3D)
40.96% AdobeRGB 1998 (Argyll 3D)
59.3% sRGB (Argyll 3D)
39.64% Display P3 (Argyll 3D)
Gamma: 2.45
CCT: 7169 K
| HP Pavilion 14-ce0002ng BOE072C, , 1920x1080, 14" | HP Pavilion 15-cw0003ng AU Optronics AUO23ED, , 1920x1080, 15.6" | Huawei MateBook X Pro, i7 JDI LPM139M422A, , 3000x2000, 13.9" | Lenovo IdeaPad 530s-14IKB AUO B140QAN02.3, , 2560x1440, 14" | Lenovo ThinkPad T480s-20L8S02E00 LP140QH2-SPB1, , 2560x1440, 14" | Asus Zenbook UX430UN NV140FHM-N62, BOE0718, , 1920x1080, 14" | HP Spectre x360 15-ch011nr BOE0730, , 3840x2160, 15.6" | |
|---|---|---|---|---|---|---|---|
| Display | -7% | 65% | 63% | 73% | 52% | 63% | |
| Display P3 Coverage (%) | 39.64 | 36.7 -7% | 65.8 66% | 65.5 65% | 71.4 80% | 64.6 63% | 68.5 73% |
| sRGB Coverage (%) | 59.3 | 55 -7% | 97.7 65% | 96.2 62% | 96.6 63% | 84.8 43% | 90.7 53% |
| AdobeRGB 1998 Coverage (%) | 40.96 | 37.91 -7% | 67.5 65% | 66.1 61% | 72.1 76% | 62 51% | 66.3 62% |
| Response Times | 8% | 7% | -24% | 10% | -18% | 8% | |
| Response Time Grey 50% / Grey 80% * (ms) | 40 ? | 40 ? -0% | 42 ? -5% | 58.4 ? -46% | 36 ? 10% | 43.6 ? -9% | 38 ? 5% |
| Response Time Black / White * (ms) | 31 ? | 26 ? 16% | 25 ? 19% | 31.2 ? -1% | 28 ? 10% | 39.2 ? -26% | 27.6 ? 11% |
| PWM Frequency (Hz) | 200 ? | 200 ? | 943 ? | ||||
| Screen | -3% | 64% | 24% | 31% | 21% | 14% | |
| Brightness middle (cd/m²) | 239 | 186 -22% | 550 130% | 311 30% | 311 30% | 310.4 30% | 329.3 38% |
| Brightness (cd/m²) | 223 | 180 -19% | 512 130% | 293 31% | 302 35% | 303 36% | 316 42% |
| Brightness Distribution (%) | 88 | 88 0% | 88 0% | 85 -3% | 91 3% | 89 1% | 84 -5% |
| Black Level * (cd/m²) | 0.27 | 0.15 44% | 0.32 -19% | 0.2 26% | 0.36 -33% | 0.31 -15% | 0.31 -15% |
| Contrast (:1) | 885 | 1240 40% | 1719 94% | 1555 76% | 864 -2% | 1001 13% | 1062 20% |
| Colorchecker dE 2000 * | 5.3 | 5.94 -12% | 2.28 57% | 6 -13% | 3 43% | 4.07 23% | 4.78 10% |
| Colorchecker dE 2000 max. * | 10.03 | 10.81 -8% | 4.36 57% | 11.6 -16% | 6.1 39% | 8.33 17% | 11.75 -17% |
| Colorchecker dE 2000 calibrated * | 3.64 | 6.07 -67% | 0.8 78% | 1.6 56% | 1.7 53% | 4.07 -12% | 3.51 4% |
| Greyscale dE 2000 * | 5.85 | 4.44 24% | 3.27 44% | 8.7 -49% | 4 32% | 2.8 52% | 7.9 -35% |
| Gamma | 2.45 90% | 2.81 78% | 2.35 94% | 2.19 100% | 2.17 101% | 2.217 99% | 2.24 98% |
| CCT | 7169 91% | 6272 104% | 6819 95% | 8426 77% | 6961 93% | 7033 92% | 8323 78% |
| Color Space (Percent of AdobeRGB 1998) (%) | 38 | 35 -8% | 62 63% | 60.9 60% | 66.7 76% | 55.3 46% | 58.8 55% |
| Color Space (Percent of sRGB) (%) | 59 | 55 -7% | 98 66% | 96 63% | 96.7 64% | 84.6 43% | 90.4 53% |
| Média Total (Programa/Configurações) | -1% /
-3% | 45% /
57% | 21% /
25% | 38% /
36% | 18% /
22% | 28% /
22% |
* ... menor é melhor
Exibir tempos de resposta
| ↔ Tempo de resposta preto para branco | ||
|---|---|---|
| 31 ms ... ascensão ↗ e queda ↘ combinadas | ↗ 18 ms ascensão | 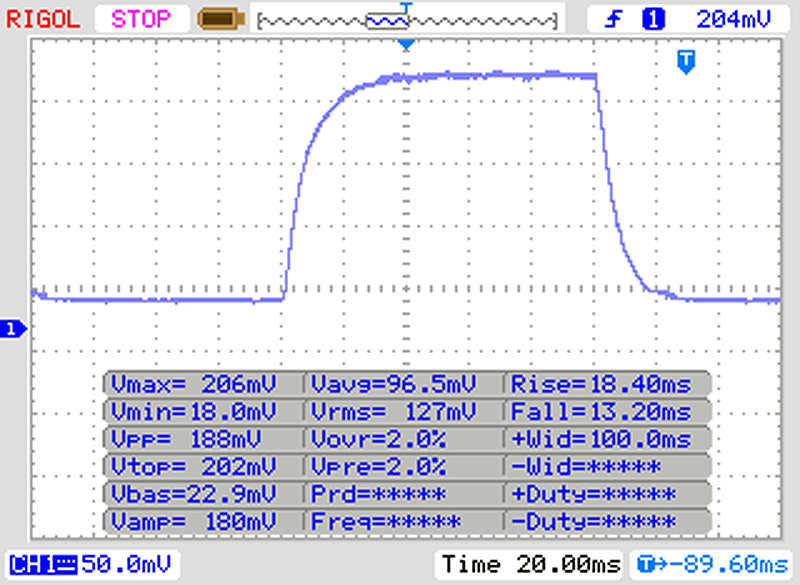 |
| ↘ 13 ms queda | ||
| A tela mostra taxas de resposta lentas em nossos testes e será insatisfatória para os jogadores. Em comparação, todos os dispositivos testados variam de 0.1 (mínimo) a 240 (máximo) ms. » 84 % de todos os dispositivos são melhores. Isso significa que o tempo de resposta medido é pior que a média de todos os dispositivos testados (19.8 ms). | ||
| ↔ Tempo de resposta 50% cinza a 80% cinza | ||
| 40 ms ... ascensão ↗ e queda ↘ combinadas | ↗ 21 ms ascensão | 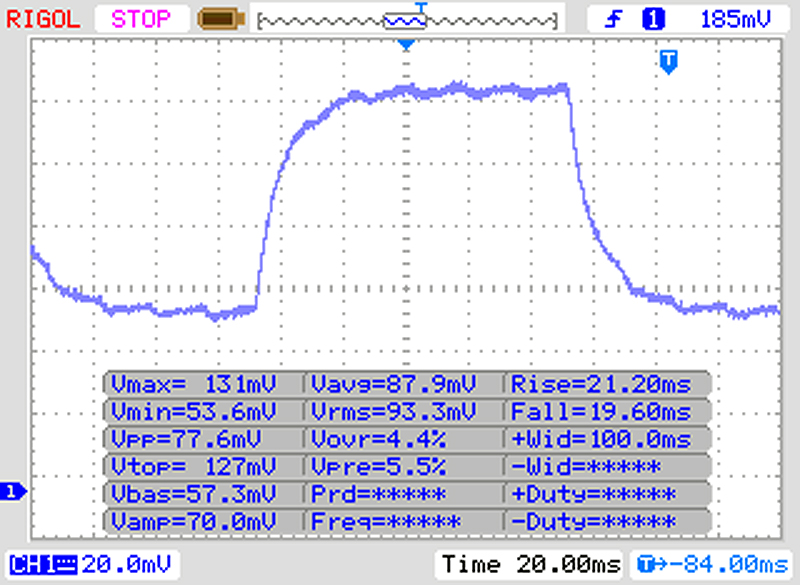 |
| ↘ 19 ms queda | ||
| A tela mostra taxas de resposta lentas em nossos testes e será insatisfatória para os jogadores. Em comparação, todos os dispositivos testados variam de 0.165 (mínimo) a 636 (máximo) ms. » 61 % de todos os dispositivos são melhores. Isso significa que o tempo de resposta medido é pior que a média de todos os dispositivos testados (31 ms). | ||
Cintilação da tela / PWM (modulação por largura de pulso)
| Tela tremeluzindo/PWM detectado | 200 Hz | ≤ 90 % configuração de brilho | 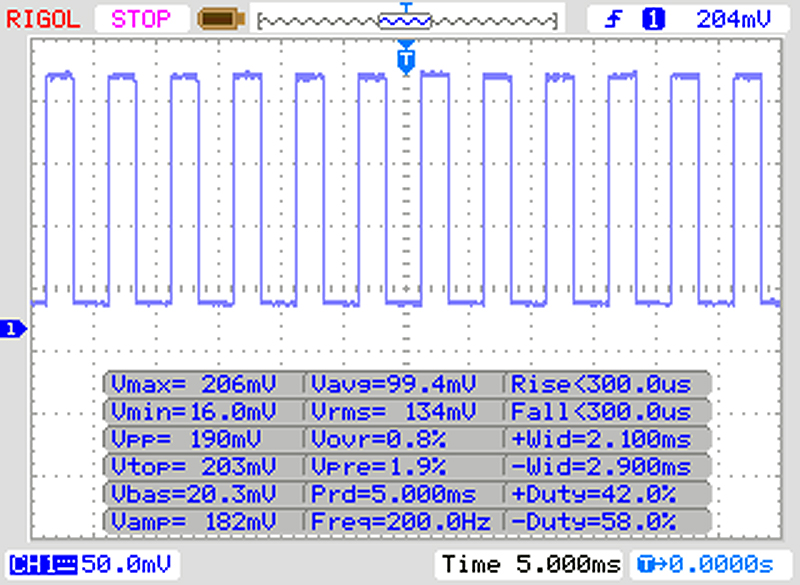 |
A luz de fundo da tela pisca em 200 Hz (pior caso, por exemplo, utilizando PWM) Cintilação detectada em uma configuração de brilho de 90 % e abaixo. Não deve haver cintilação ou PWM acima desta configuração de brilho. A frequência de 200 Hz é relativamente baixa, portanto, usuários sensíveis provavelmente notarão cintilação e sentirão fadiga ocular na configuração de brilho indicada e abaixo. [pwm_comparison] Em comparação: 52 % de todos os dispositivos testados não usam PWM para escurecer a tela. Se PWM foi detectado, uma média de 7763 (mínimo: 5 - máximo: 343500) Hz foi medida. | |||
| PCMark 8 Home Score Accelerated v2 | 3379 pontos | |
| PCMark 8 Work Score Accelerated v2 | 4456 pontos | |
Ajuda | ||
| HP Pavilion 14-ce0002ng SanDisk X600 SD9SN8W-128G | Huawei MateBook X Pro, i7 Toshiba XG5 KXG50ZNV512G | Lenovo IdeaPad 530s-14IKB SK Hynix PC401 512GB M.2 (HFS512GD9TNG) | Lenovo ThinkPad T480s-20L8S02E00 Samsung SSD PM981 MZVLB512HAJQ | |
|---|---|---|---|---|
| CrystalDiskMark 3.0 | 103% | 138% | 446% | |
| Read Seq (MB/s) | 508 | 1317 159% | 1360 168% | 2588 409% |
| Write Seq (MB/s) | 202.4 | 459.9 127% | 733 262% | 1858 818% |
| Read 512 (MB/s) | 309.6 | 628 103% | 769 148% | 1799 481% |
| Write 512 (MB/s) | 158.2 | 461.4 192% | 642 306% | 1863 1078% |
| Read 4k (MB/s) | 33.15 | 33.79 2% | 39.83 20% | 62.7 89% |
| Write 4k (MB/s) | 68.7 | 117.5 71% | 100 46% | 146.8 114% |
| Read 4k QD32 (MB/s) | 262.1 | 360 37% | 330.3 26% | 446.6 70% |
| Write 4k QD32 (MB/s) | 116.4 | 273.6 135% | 260.2 124% | 706 507% |

| 3DMark 11 Performance | 3130 pontos | |
| 3DMark Cloud Gate Standard Score | 12943 pontos | |
| 3DMark Fire Strike Score | 3215 pontos | |
Ajuda | ||
| Far Cry 5 | |
| 1280x720 Low Preset AA:T | |
| Média da turma Multimedia (37 - 182, n=21, últimos 2 anos) | |
| Média NVIDIA GeForce MX150 (31 - 46, n=7) | |
| Lenovo IdeaPad 530s-14IKB | |
| HP Pavilion 14-ce0002ng | |
| 1920x1080 Medium Preset AA:T | |
| Média da turma Multimedia (21 - 161, n=21, últimos 2 anos) | |
| Lenovo IdeaPad 530s-14IKB | |
| Média NVIDIA GeForce MX150 (12 - 21, n=7) | |
| HP Pavilion 14-ce0002ng | |
| 1920x1080 High Preset AA:T | |
| Média da turma Multimedia (19 - 150, n=21, últimos 2 anos) | |
| Lenovo IdeaPad 530s-14IKB | |
| Média NVIDIA GeForce MX150 (10 - 18, n=6) | |
| HP Pavilion 14-ce0002ng | |
| Shadow of the Tomb Raider | |
| 1280x720 Lowest Preset | |
| Média da turma Multimedia (66 - 204, n=7, últimos 2 anos) | |
| Média NVIDIA GeForce MX150 (30 - 50, n=5) | |
| HP Pavilion 14-ce0002ng | |
| 1920x1080 Medium Preset | |
| Média da turma Multimedia (28 - 167, n=8, últimos 2 anos) | |
| Média NVIDIA GeForce MX150 (11 - 18, n=5) | |
| HP Pavilion 14-ce0002ng | |
| 1920x1080 High Preset AA:SM | |
| Média da turma Multimedia (26 - 143, n=8, últimos 2 anos) | |
| Média NVIDIA GeForce MX150 (9 - 15, n=5) | |
| HP Pavilion 14-ce0002ng | |
| Final Fantasy XV Benchmark | |
| 1280x720 Lite Quality | |
| Média da turma Multimedia (21.4 - 232, n=63, últimos 2 anos) | |
| Média NVIDIA GeForce MX150 (23 - 36.9, n=7) | |
| Asus Zenbook UX430UN | |
| HP Pavilion 14-ce0002ng | |
| 1920x1080 Standard Quality | |
| Média da turma Multimedia (11.4 - 181.1, n=64, últimos 2 anos) | |
| Média NVIDIA GeForce MX150 (12 - 17.4, n=6) | |
| Asus Zenbook UX430UN | |
| HP Pavilion 14-ce0002ng | |
| 1920x1080 High Quality | |
| Média da turma Multimedia (7.61 - 144.4, n=64, últimos 2 anos) | |
| Média NVIDIA GeForce MX150 (7 - 10.9, n=5) | |
| Asus Zenbook UX430UN | |
| baixo | média | alto | ultra | |
|---|---|---|---|---|
| Final Fantasy XV Benchmark (2018) | 23 | 12 | ||
| Far Cry 5 (2018) | 31 | 12 | 10 | 9 |
| Shadow of the Tomb Raider (2018) | 33 | 13 | 11 |
Barulho
| Ocioso |
| 32.7 / 32.7 / 32.7 dB |
| HDD |
| 33.4 dB |
| Carga |
| 42.9 / 45 dB |
 | ||
30 dB silencioso 40 dB(A) audível 50 dB(A) ruidosamente alto |
||
min: | ||
(-) A temperatura máxima no lado superior é 49.2 °C / 121 F, em comparação com a média de 36.8 °C / 98 F , variando de 21 a 71 °C para a classe Multimedia.
(-) A parte inferior aquece até um máximo de 47 °C / 117 F, em comparação com a média de 39.1 °C / 102 F
(+) Em uso inativo, a temperatura média para o lado superior é 21.8 °C / 71 F, em comparação com a média do dispositivo de 31.3 °C / ### class_avg_f### F.
(+) Os apoios para as mãos e o touchpad são mais frios que a temperatura da pele, com um máximo de 31.3 °C / 88.3 F e, portanto, são frios ao toque.
(-) A temperatura média da área do apoio para as mãos de dispositivos semelhantes foi 28.7 °C / 83.7 F (-2.6 °C / -4.6 F).
HP Pavilion 14-ce0002ng análise de áudio
(-) | alto-falantes não muito altos (###valor### dB)
Graves 100 - 315Hz
(-) | quase nenhum baixo - em média 26.7% menor que a mediana
(±) | a linearidade dos graves é média (12.8% delta para a frequência anterior)
Médios 400 - 2.000 Hz
(+) | médios equilibrados - apenas 2.3% longe da mediana
(+) | médios são lineares (6.2% delta para frequência anterior)
Altos 2 - 16 kHz
(+) | agudos equilibrados - apenas 1.5% longe da mediana
(+) | os máximos são lineares (2.8% delta da frequência anterior)
Geral 100 - 16.000 Hz
(±) | a linearidade do som geral é média (20.6% diferença em relação à mediana)
Comparado com a mesma classe
» 70% de todos os dispositivos testados nesta classe foram melhores, 8% semelhantes, 22% piores
» O melhor teve um delta de 5%, a média foi 17%, o pior foi 45%
Comparado com todos os dispositivos testados
» 55% de todos os dispositivos testados foram melhores, 8% semelhantes, 37% piores
» O melhor teve um delta de 4%, a média foi 24%, o pior foi 134%
Huawei MateBook X Pro, i7 análise de áudio
(-) | alto-falantes não muito altos (###valor### dB)
Graves 100 - 315Hz
(±) | graves reduzidos - em média 12.1% menor que a mediana
(±) | a linearidade dos graves é média (13.5% delta para a frequência anterior)
Médios 400 - 2.000 Hz
(+) | médios equilibrados - apenas 4.1% longe da mediana
(+) | médios são lineares (6.1% delta para frequência anterior)
Altos 2 - 16 kHz
(+) | agudos equilibrados - apenas 2.3% longe da mediana
(+) | os máximos são lineares (4.3% delta da frequência anterior)
Geral 100 - 16.000 Hz
(±) | a linearidade do som geral é média (16.2% diferença em relação à mediana)
Comparado com a mesma classe
» 40% de todos os dispositivos testados nesta classe foram melhores, 4% semelhantes, 56% piores
» O melhor teve um delta de 5%, a média foi 18%, o pior foi 53%
Comparado com todos os dispositivos testados
» 26% de todos os dispositivos testados foram melhores, 6% semelhantes, 68% piores
» O melhor teve um delta de 4%, a média foi 24%, o pior foi 134%
Lenovo IdeaPad 530s-14IKB análise de áudio
(±) | o volume do alto-falante é médio, mas bom (###valor### dB)
Graves 100 - 315Hz
(-) | quase nenhum baixo - em média 17.2% menor que a mediana
(±) | a linearidade dos graves é média (14.5% delta para a frequência anterior)
Médios 400 - 2.000 Hz
(+) | médios equilibrados - apenas 2.4% longe da mediana
(+) | médios são lineares (6.4% delta para frequência anterior)
Altos 2 - 16 kHz
(+) | agudos equilibrados - apenas 3.6% longe da mediana
(±) | a linearidade dos máximos é média (8.3% delta para frequência anterior)
Geral 100 - 16.000 Hz
(±) | a linearidade do som geral é média (16.8% diferença em relação à mediana)
Comparado com a mesma classe
» 43% de todos os dispositivos testados nesta classe foram melhores, 7% semelhantes, 49% piores
» O melhor teve um delta de 5%, a média foi 18%, o pior foi 53%
Comparado com todos os dispositivos testados
» 29% de todos os dispositivos testados foram melhores, 8% semelhantes, 63% piores
» O melhor teve um delta de 4%, a média foi 24%, o pior foi 134%
Lenovo ThinkPad T480s-20L8S02E00 análise de áudio
(±) | o volume do alto-falante é médio, mas bom (###valor### dB)
Graves 100 - 315Hz
(-) | quase nenhum baixo - em média 19.4% menor que a mediana
(±) | a linearidade dos graves é média (12.1% delta para a frequência anterior)
Médios 400 - 2.000 Hz
(±) | médios mais altos - em média 6.5% maior que a mediana
(±) | a linearidade dos médios é média (9.6% delta para frequência anterior)
Altos 2 - 16 kHz
(+) | agudos equilibrados - apenas 3.5% longe da mediana
(±) | a linearidade dos máximos é média (7.6% delta para frequência anterior)
Geral 100 - 16.000 Hz
(±) | a linearidade do som geral é média (22.1% diferença em relação à mediana)
Comparado com a mesma classe
» 58% de todos os dispositivos testados nesta classe foram melhores, 8% semelhantes, 34% piores
» O melhor teve um delta de 7%, a média foi 21%, o pior foi 53%
Comparado com todos os dispositivos testados
» 64% de todos os dispositivos testados foram melhores, 6% semelhantes, 30% piores
» O melhor teve um delta de 4%, a média foi 24%, o pior foi 134%
| desligado | |
| Ocioso | |
| Carga |
|
Key:
min: | |
| HP Pavilion 14-ce0002ng i5-8550U, GeForce MX150, SanDisk X600 SD9SN8W-128G, IPS, 1920x1080, 14" | Huawei MateBook X Pro, i7 i5-8550U, GeForce MX150, Toshiba XG5 KXG50ZNV512G, LTPS, 3000x2000, 13.9" | Lenovo IdeaPad 530s-14IKB i5-8550U, GeForce MX150, SK Hynix PC401 512GB M.2 (HFS512GD9TNG), IPS, 2560x1440, 14" | Lenovo ThinkPad T480s-20L8S02E00 i5-8550U, GeForce MX150, Samsung SSD PM981 MZVLB512HAJQ, IPS LED, 2560x1440, 14" | Asus Zenbook UX430UN i5-8550U, GeForce MX150, SanDisk SD8SN8U512G1002, IPS, 1920x1080, 14" | HP Spectre x360 15-ch011nr i5-8550U, GeForce MX150, SK hynix PC401 NVMe 500 GB, IPS, 3840x2160, 15.6" | Média NVIDIA GeForce MX150 | Média da turma Multimedia | |
|---|---|---|---|---|---|---|---|---|
| Power Consumption | 19% | 23% | 10% | 29% | -14% | 10% | -22% | |
| Idle Minimum * (Watt) | 6.3 | 4.7 25% | 3.9 38% | 3.4 46% | 3 52% | 5.3 16% | 4.48 ? 29% | 5.65 ? 10% |
| Idle Average * (Watt) | 8.4 | 8.7 -4% | 5.76 31% | 7.5 11% | 5.8 31% | 9.8 -17% | 7.88 ? 6% | 10 ? -19% |
| Idle Maximum * (Watt) | 10.2 | 9.8 4% | 7.14 30% | 10.8 -6% | 6.2 39% | 12.6 -24% | 9.76 ? 4% | 12.3 ? -21% |
| Load Average * (Watt) | 59 | 39.4 33% | 50.8 14% | 55.4 6% | 54.1 8% | 73 -24% | 54.7 ? 7% | 65.1 ? -10% |
| Load Maximum * (Watt) | 66.3 | 40.4 39% | 65.8 1% | 70.3 -6% | 56.4 15% | 80 -21% | 63.5 ? 4% | 112.5 ? -70% |
| Witcher 3 ultra * (Watt) | 34 | 45.9 | 67.6 |
* ... menor é melhor
| HP Pavilion 14-ce0002ng i5-8550U, GeForce MX150, 41 Wh | Huawei MateBook X Pro, i7 i5-8550U, GeForce MX150, 57 Wh | Lenovo IdeaPad 530s-14IKB i5-8550U, GeForce MX150, 45 Wh | Lenovo ThinkPad T480s-20L8S02E00 i5-8550U, GeForce MX150, 57 Wh | Asus Zenbook UX430UN i5-8550U, GeForce MX150, 50 Wh | HP Spectre x360 15-ch011nr i5-8550U, GeForce MX150, 84 Wh | Média da turma Multimedia | |
|---|---|---|---|---|---|---|---|
| Duração da bateria | 25% | 4% | 28% | 11% | 21% | 78% | |
| Reader / Idle (h) | 13.3 | 19.3 45% | 14.7 11% | 22.8 71% | 17.3 30% | 15.5 17% | 25.2 ? 89% |
| H.264 (h) | 5.8 | 7.1 22% | 9.2 59% | 16.2 ? 179% | |||
| WiFi v1.3 (h) | 6.9 | 8.4 22% | 8.7 26% | 8.8 28% | 9.3 35% | 10.4 51% | 12 ? 74% |
| Load (h) | 2.4 | 2.6 8% | 1.4 -42% | 1.3 -46% | 1.6 -33% | 2.3 -4% | 1.669 ? -30% |
Pro
Contra
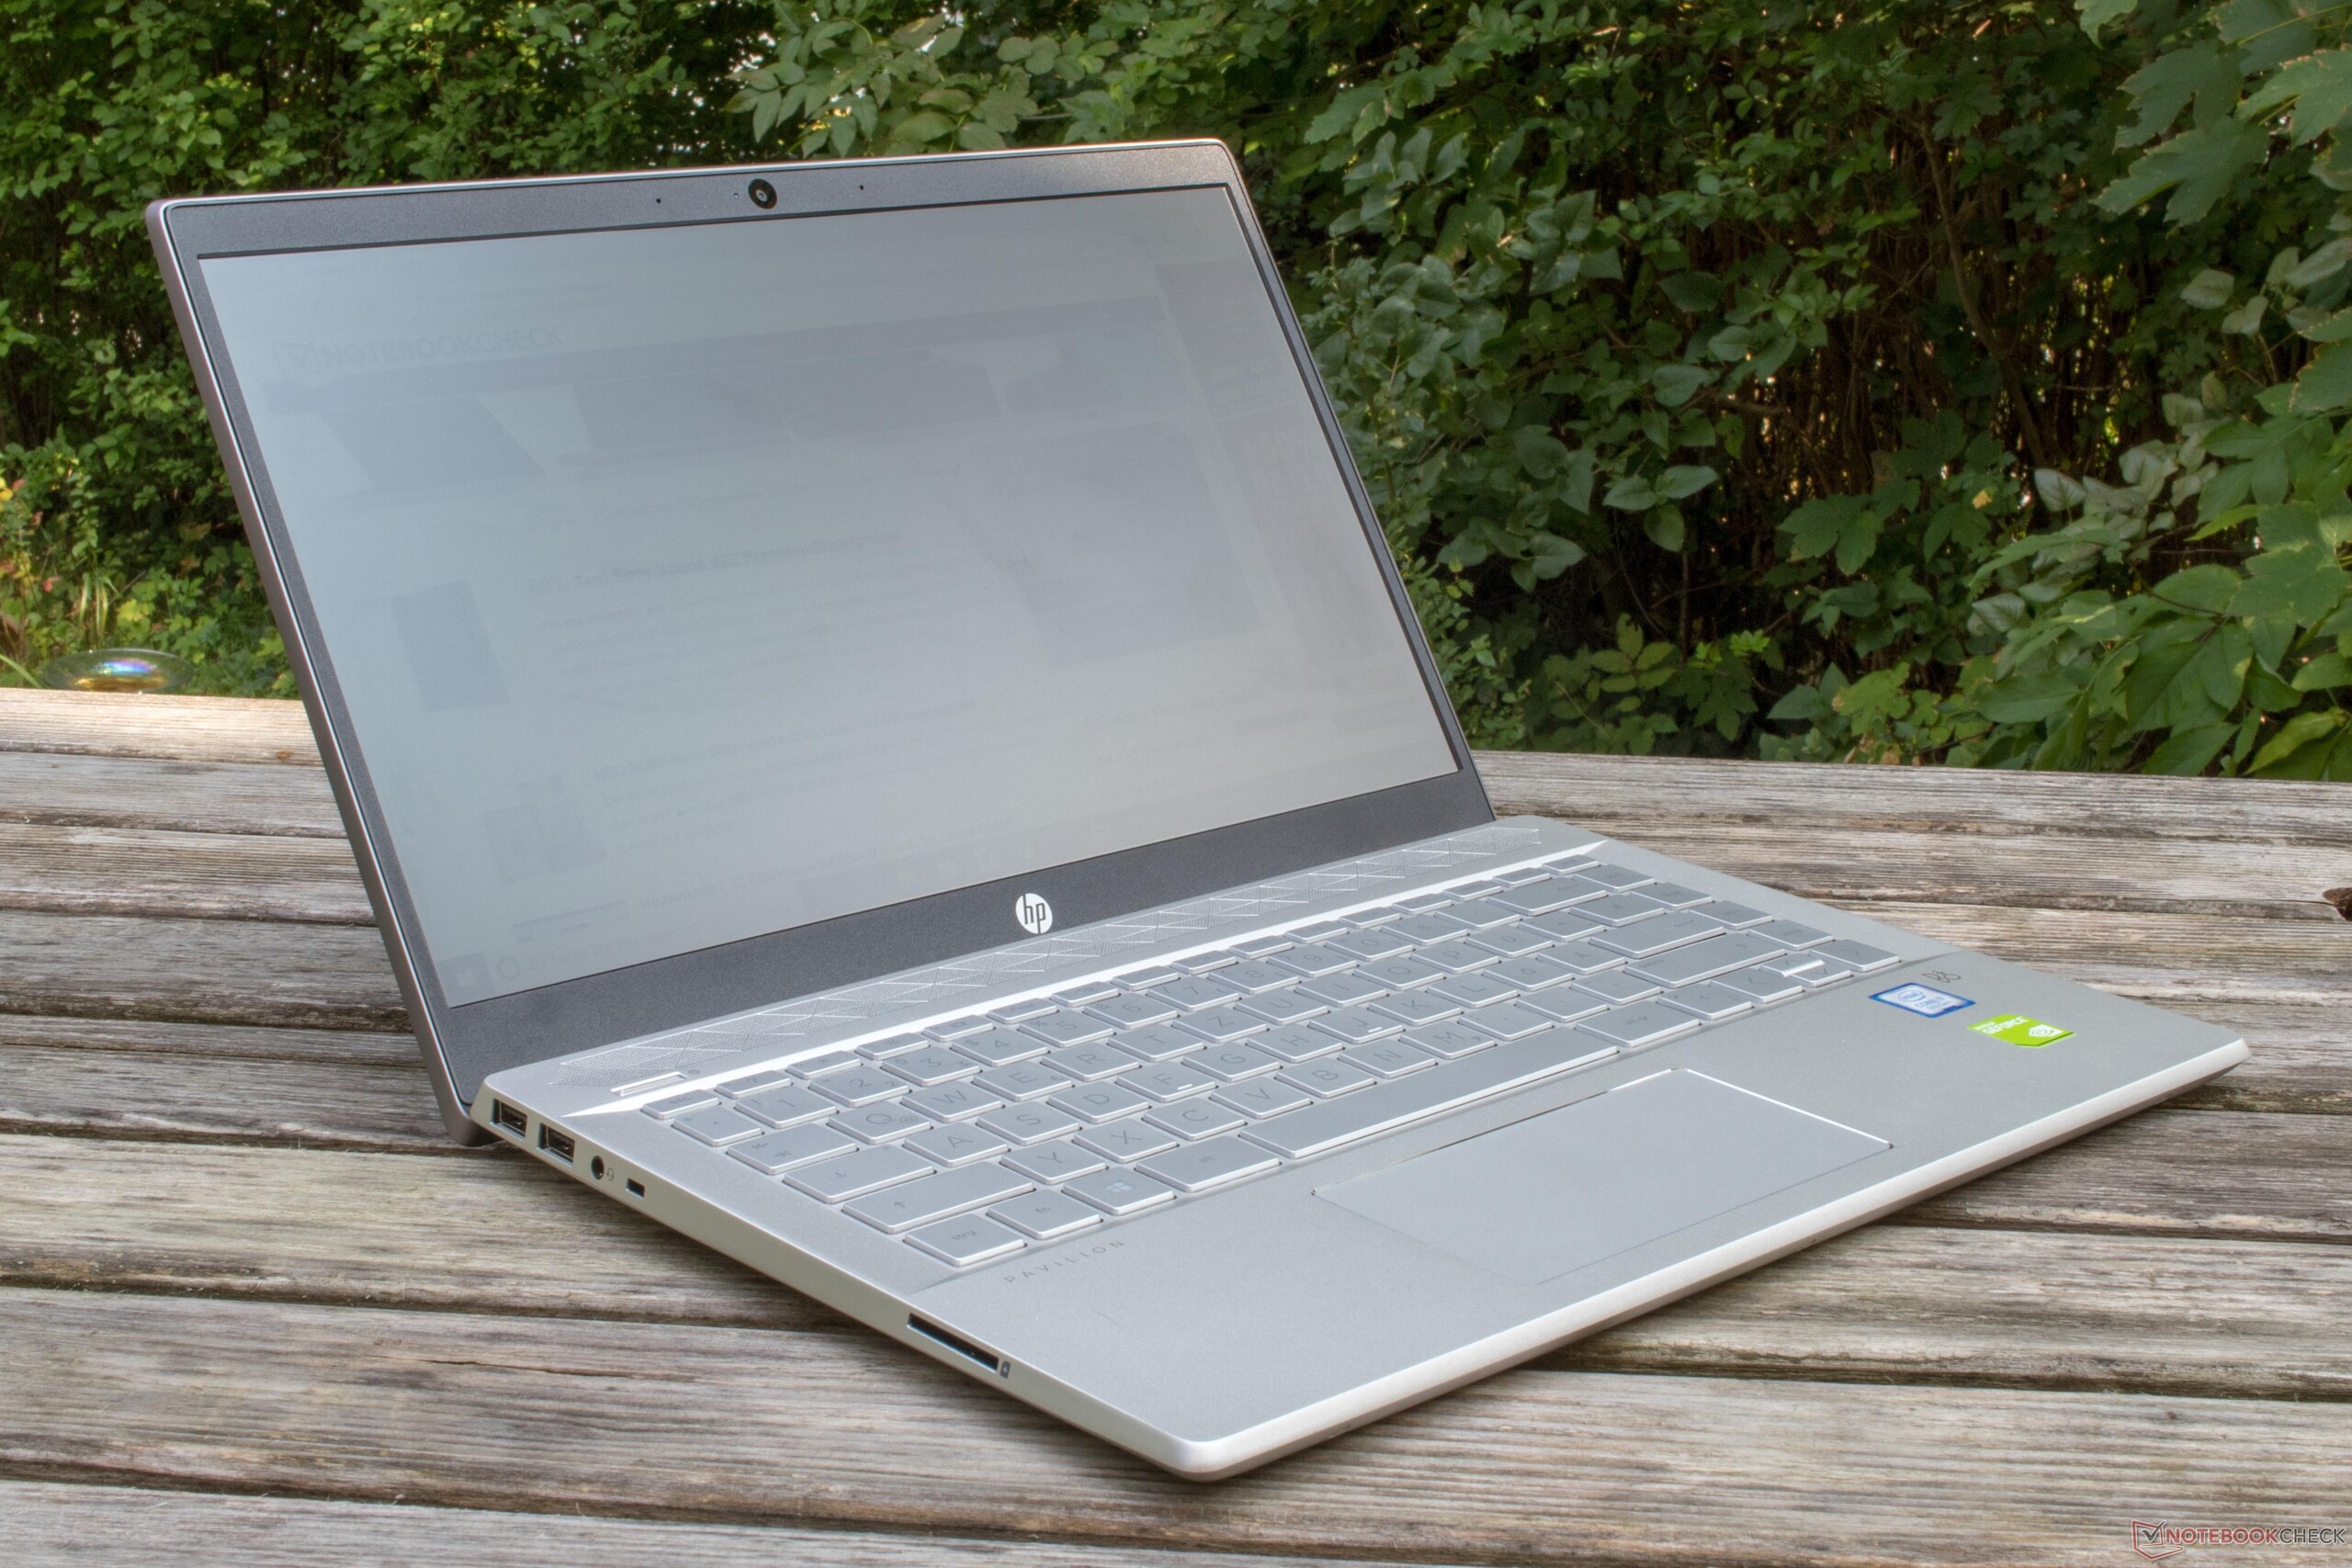
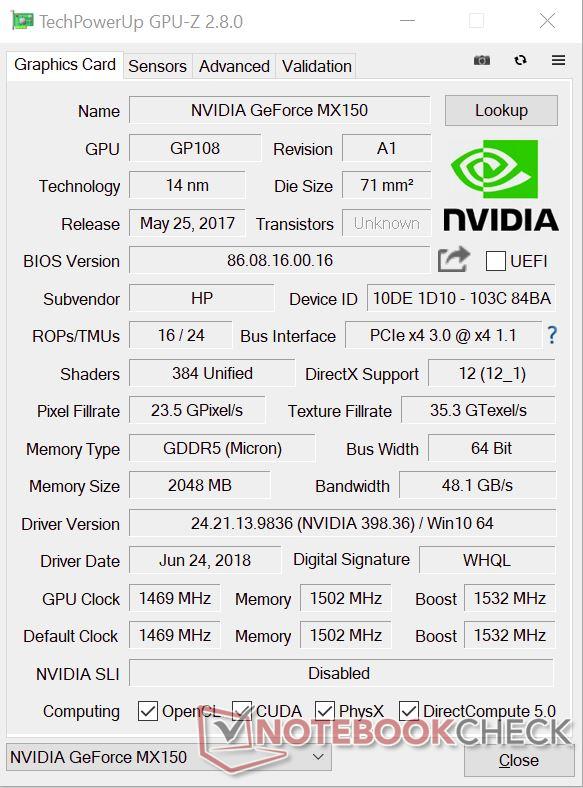
O novo HP Pavilion 14 é um dispositivo multimídia acessível, porém elegante, que é impulsionado por um processador Intel Core i7-8550U e uma GPU Nvidia GeForce MX150. Nosso dispositivo de teste tem desempenho de sistema aceitável, exceto pelo seu SSD lento da SanDisk. Positivamente, o dispositivo também não possui afogamento térmico. Apesar disso, o Pavilion 14 não pode competir com outros dispositivos equipados com GeForce MX150 no desempenho gráfico; o IdeaPad 530s alcançou taxas de quadros até 50% melhores em benchmarks de jogos, por exemplo.
Indiscutivelmente, nossa maior crítica ao novo HP Pavilion 14 é a sua tela. Uma combinação de um acabamento mate e uma luminosidade máxima de 239 cd/m² torna o dispositivo inutilizável em exteriores num dia de sol.
Além disso, nosso dispositivo de teste tem um gerenciamento térmico ruim. O Pavilion 14 esquenta muito para um portátil multimídia, especialmente devido ao seu modesto desempenho em jogos e gráficos. Da mesma forma, o ventilador fica incrivelmente alto, mas não consegue resfriar o suficiente o dispositivo. No geral, o sistema de resfriamento é inadequado para um Core i7-8550U e uma GeForce MX150.
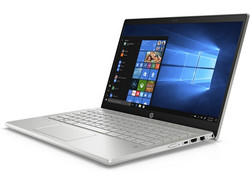
O Pavilion 14 é mais adequado para aplicativos do dia a dia e trabalho de escritório. O dispositivo terá desempenho suficiente para a maioria das tarefas e ficará esteticamente melhor do que muitos de seus concorrentes. Dito isso, recomendamos que você dê uma olhada no Pavilion 15 impulsionado por uma AMD Ryzen 5 2500U, que possui uma tela melhor e um resfriamento mais eficiente. Também custa 200 Euros (~$231) a menos, embora você deva renunciar a uma GPU dedicada e ajustar-se ao desempenho mais fraco do sistema.
HP Pavilion 14-ce0002ng
- 10/07/2018 v6 (old)
Daniel Puschina
Price comparison
