Breve Análise do Portátil Acer Nitro 5 (Ryzen 7 2700U, Radeon RX 560X, FHD)
| SD Card Reader | |
| average JPG Copy Test (av. of 3 runs) | |
| Média da turma Gaming (20.9 - 210, n=54, últimos 2 anos) | |
| Lenovo IdeaPad 720-15IKB (Toshiba Exceria Pro SDXC 64 GB UHS-II) | |
| Acer Aspire 5 A515-52G-53PU (Toshiba Exceria Pro SDXC 64 GB UHS-II) | |
| Acer Nitro 5 AN515-42-R6V0 (Toshiba Exceria Pro SDXC 64 GB UHS-II) | |
| Xiaomi Mi Notebook Pro i5 | |
| maximum AS SSD Seq Read Test (1GB) | |
| Média da turma Gaming (25.5 - 261, n=51, últimos 2 anos) | |
| Lenovo IdeaPad 720-15IKB (Toshiba Exceria Pro SDXC 64 GB UHS-II) | |
| Acer Nitro 5 AN515-42-R6V0 (Toshiba Exceria Pro SDXC 64 GB UHS-II) | |
| Acer Aspire 5 A515-52G-53PU (Toshiba Exceria Pro SDXC 64 GB UHS-II) | |
| Xiaomi Mi Notebook Pro i5 | |
| Networking | |
| iperf3 transmit AX12 | |
| Acer Aspire 5 A515-52G-53PU | |
| Acer Nitro 5 AN515-42-R6V0 | |
| Xiaomi Mi Notebook Pro i5 | |
| Lenovo IdeaPad 720-15IKB | |
| iperf3 receive AX12 | |
| Acer Nitro 5 AN515-42-R6V0 | |
| Acer Aspire 5 A515-52G-53PU | |
| Xiaomi Mi Notebook Pro i5 | |
| Lenovo IdeaPad 720-15IKB | |
| |||||||||||||||||||||||||
iluminação: 88 %
iluminação com acumulador: 299 cd/m²
Contraste: 1246:1 (Preto: 0.24 cd/m²)
ΔE ColorChecker Calman: 4.98 | ∀{0.5-29.43 Ø4.72}
calibrated: 3.7
ΔE Greyscale Calman: 4.58 | ∀{0.09-98 Ø4.97}
87% sRGB (Argyll 1.6.3 3D)
57% AdobeRGB 1998 (Argyll 1.6.3 3D)
64% AdobeRGB 1998 (Argyll 3D)
87.4% sRGB (Argyll 3D)
63.4% Display P3 (Argyll 3D)
Gamma: 2.55
CCT: 6397 K
| Acer Nitro 5 AN515-42-R6V0 AU Optronics B156HAN06.0 (AUO60ED), IPS, 1920x1080 | Lenovo IdeaPad 720-15IKB LG Philips LGD0573 LP156WF9-SPK2, IPS, 1920x1080 | Acer Aspire 5 A515-52G-53PU BOE CQ NV156FHM-N48, IPS, 1920x1080 | Xiaomi Mi Notebook Pro i5 BOE0747 NV156FHM-N61, IPS LED, 1920x1080 | |
|---|---|---|---|---|
| Display | -37% | -35% | 1% | |
| Display P3 Coverage (%) | 63.4 | 38.62 -39% | 39.85 -37% | 66.5 5% |
| sRGB Coverage (%) | 87.4 | 58.1 -34% | 58.7 -33% | 86.9 -1% |
| AdobeRGB 1998 Coverage (%) | 64 | 39.91 -38% | 41.17 -36% | 63.5 -1% |
| Response Times | 17% | 0% | -1% | |
| Response Time Grey 50% / Grey 80% * (ms) | 48.4 ? | 42 ? 13% | 45 ? 7% | 47.9 ? 1% |
| Response Time Black / White * (ms) | 32.8 ? | 26 ? 21% | 35 ? -7% | 33.7 ? -3% |
| PWM Frequency (Hz) | 20000 ? | 21800 ? | ||
| Screen | -14% | -5% | -2% | |
| Brightness middle (cd/m²) | 299 | 270 -10% | 296 -1% | 296 -1% |
| Brightness (cd/m²) | 284 | 250 -12% | 268 -6% | 288 1% |
| Brightness Distribution (%) | 88 | 87 -1% | 81 -8% | 89 1% |
| Black Level * (cd/m²) | 0.24 | 0.25 -4% | 0.3 -25% | 0.32 -33% |
| Contrast (:1) | 1246 | 1080 -13% | 987 -21% | 925 -26% |
| Colorchecker dE 2000 * | 4.98 | 4.79 4% | 4.01 19% | 4.3 14% |
| Colorchecker dE 2000 max. * | 7.67 | 8.83 -15% | 8.7 -13% | 8.7 -13% |
| Colorchecker dE 2000 calibrated * | 3.7 | 4 -8% | ||
| Greyscale dE 2000 * | 4.58 | 5.66 -24% | 0.98 79% | 3 34% |
| Gamma | 2.55 86% | 2.64 83% | 2.35 94% | 2.1 105% |
| CCT | 6397 102% | 7179 91% | 6408 101% | 7100 92% |
| Color Space (Percent of AdobeRGB 1998) (%) | 57 | 37 -35% | 38 -33% | 56.83 0% |
| Color Space (Percent of sRGB) (%) | 87 | 59 -32% | 58 -33% | 86.86 0% |
| Média Total (Programa/Configurações) | -11% /
-15% | -13% /
-10% | -1% /
-1% |
* ... menor é melhor
Exibir tempos de resposta
| ↔ Tempo de resposta preto para branco | ||
|---|---|---|
| 32.8 ms ... ascensão ↗ e queda ↘ combinadas | ↗ 18 ms ascensão | 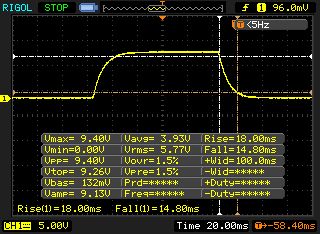 |
| ↘ 14.8 ms queda | ||
| A tela mostra taxas de resposta lentas em nossos testes e será insatisfatória para os jogadores. Em comparação, todos os dispositivos testados variam de 0.1 (mínimo) a 240 (máximo) ms. » 88 % de todos os dispositivos são melhores. Isso significa que o tempo de resposta medido é pior que a média de todos os dispositivos testados (19.9 ms). | ||
| ↔ Tempo de resposta 50% cinza a 80% cinza | ||
| 48.4 ms ... ascensão ↗ e queda ↘ combinadas | ↗ 24 ms ascensão | 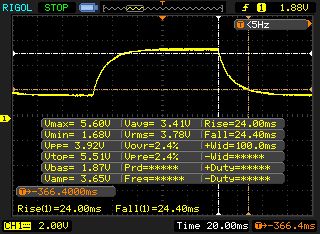 |
| ↘ 24.4 ms queda | ||
| A tela mostra taxas de resposta lentas em nossos testes e será insatisfatória para os jogadores. Em comparação, todos os dispositivos testados variam de 0.165 (mínimo) a 636 (máximo) ms. » 84 % de todos os dispositivos são melhores. Isso significa que o tempo de resposta medido é pior que a média de todos os dispositivos testados (31.1 ms). | ||
Cintilação da tela / PWM (modulação por largura de pulso)
| Tela tremeluzindo / PWM não detectado | 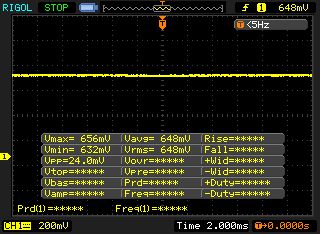 | ||
[pwm_comparison] Em comparação: 52 % de todos os dispositivos testados não usam PWM para escurecer a tela. Se PWM foi detectado, uma média de 7784 (mínimo: 5 - máximo: 343500) Hz foi medida. | |||
| Cinebench R15 | |
| CPU Single 64Bit | |
| Média da turma Gaming (188.8 - 343, n=109, últimos 2 anos) | |
| Acer Aspire 5 A515-52G-53PU | |
| Acer Nitro 5 AN515-42-R6V0 | |
| Xiaomi Mi Notebook Pro i5 | |
| Lenovo IdeaPad 720-15IKB | |
| CPU Multi 64Bit | |
| Média da turma Gaming (1578 - 6271, n=109, últimos 2 anos) | |
| Acer Nitro 5 AN515-42-R6V0 | |
| Xiaomi Mi Notebook Pro i5 | |
| Acer Aspire 5 A515-52G-53PU | |
| Lenovo IdeaPad 720-15IKB | |
| Cinebench R11.5 | |
| CPU Single 64Bit | |
| Média da turma Gaming (3.3 - 3.98, n=8, últimos 2 anos) | |
| Acer Aspire 5 A515-52G-53PU | |
| Acer Nitro 5 AN515-42-R6V0 | |
| CPU Multi 64Bit | |
| Média da turma Gaming (29.8 - 70.7, n=8, últimos 2 anos) | |
| Acer Nitro 5 AN515-42-R6V0 | |
| Acer Aspire 5 A515-52G-53PU | |
| PCMark 10 - Score | |
| Média da turma Gaming (5828 - 11574, n=94, últimos 2 anos) | |
| Acer Aspire 5 A515-52G-53PU | |
| Acer Nitro 5 AN515-42-R6V0 | |
| Xiaomi Mi Notebook Pro i5 | |
| PCMark 8 | |
| Home Score Accelerated v2 | |
| Média da turma Gaming (n=1últimos 2 anos) | |
| Lenovo IdeaPad 720-15IKB | |
| Acer Nitro 5 AN515-42-R6V0 | |
| Xiaomi Mi Notebook Pro i5 | |
| Acer Aspire 5 A515-52G-53PU | |
| Work Score Accelerated v2 | |
| Acer Aspire 5 A515-52G-53PU | |
| Lenovo IdeaPad 720-15IKB | |
| Acer Nitro 5 AN515-42-R6V0 | |
| Xiaomi Mi Notebook Pro i5 | |
| Média da turma Gaming (n=1últimos 2 anos) | |
| PCMark 8 Home Score Accelerated v2 | 3860 pontos | |
| PCMark 8 Work Score Accelerated v2 | 4810 pontos | |
| PCMark 10 Score | 3763 pontos | |
Ajuda | ||
| Acer Nitro 5 AN515-42-R6V0 SK Hynix HFS128G39TND | Lenovo IdeaPad 720-15IKB Samsung PM961 MZVLW256HEHP | Acer Aspire 5 A515-52G-53PU Micron 1100 MTFDDAV256TBN | Xiaomi Mi Notebook Pro i5 Samsung PM961 MZVLW256HEHP | |
|---|---|---|---|---|
| AS SSD | 386% | 57% | 353% | |
| Seq Read (MB/s) | 470.8 | 1806 284% | 490.6 4% | 1471 212% |
| Seq Write (MB/s) | 126.8 | 1226 867% | 390.2 208% | 1077 749% |
| 4K Read (MB/s) | 23.64 | 51.4 117% | 19.47 -18% | 49.82 111% |
| 4K Write (MB/s) | 54.5 | 113.9 109% | 72.2 32% | 144.8 166% |
| 4K-64 Read (MB/s) | 203.1 | 485.7 139% | 236.2 16% | 1312 546% |
| 4K-64 Write (MB/s) | 127.1 | 1652 1200% | 276.7 118% | 470.1 270% |
| Score Read (Points) | 274 | 1881 586% | 305 11% | 1509 451% |
| Score Write (Points) | 194 | 710 266% | 388 100% | 723 273% |
| Score Total (Points) | 600 | 35 -94% | 850 42% | 2991 399% |

| 3DMark - 1920x1080 Fire Strike Graphics | |
| Média da turma Gaming (12242 - 62849, n=118, últimos 2 anos) | |
| Acer Nitro 5 AN515-42-R6V0 | |
| Lenovo IdeaPad 720-15IKB | |
| Acer Aspire 5 A515-52G-53PU | |
| Xiaomi Mi Notebook Pro i5 | |
| 3DMark 11 - 1280x720 Performance GPU | |
| Média da turma Gaming (21841 - 80022, n=106, últimos 2 anos) | |
| Acer Nitro 5 AN515-42-R6V0 | |
| Lenovo IdeaPad 720-15IKB | |
| Acer Aspire 5 A515-52G-53PU | |
| Xiaomi Mi Notebook Pro i5 | |
| 3DMark 06 Standard Score | 22783 pontos | |
| 3DMark Vantage P Result | 19829 pontos | |
| 3DMark 11 Performance | 7640 pontos | |
| 3DMark Ice Storm Standard Score | 56030 pontos | |
| 3DMark Cloud Gate Standard Score | 13326 pontos | |
| 3DMark Fire Strike Score | 5316 pontos | |
Ajuda | ||
| The Witcher 3 | |
| 1920x1080 High Graphics & Postprocessing (Nvidia HairWorks Off) | |
| Média da turma Gaming (181 - 341, n=3, últimos 2 anos) | |
| Lenovo IdeaPad 720-15IKB | |
| Acer Nitro 5 AN515-42-R6V0 | |
| Xiaomi Mi Notebook Pro i5 | |
| Acer Aspire 5 A515-52G-53PU | |
| 1920x1080 Ultra Graphics & Postprocessing (HBAO+) | |
| Média da turma Gaming (95 - 240, n=8, últimos 2 anos) | |
| Acer Nitro 5 AN515-42-R6V0 | |
| Lenovo IdeaPad 720-15IKB | |
| Xiaomi Mi Notebook Pro i5 | |
| Acer Aspire 5 A515-52G-53PU | |
| baixo | média | alto | ultra | |
|---|---|---|---|---|
| The Witcher 3 (2015) | 97.2 | 68.4 | 33.2 | 20.6 |
| Rainbow Six Siege (2015) | 166 | 145 | 84.1 | 76.6 |
| The Division (2016) | 87.7 | 73.1 | 36.8 | 28.7 |
| Doom (2016) | 54.8 | 53.7 | 34.8 | 32.8 |
| Overwatch (2016) | 205 | 178 | 95 | 46.9 |
| Mirror's Edge Catalyst (2016) | 87.6 | 65 | 37.3 | 32.8 |
| Deus Ex Mankind Divided (2016) | 62.9 | 55.3 | 27.8 | 13.8 |
| Farming Simulator 17 (2016) | 133 | 107 | ||
| Dishonored 2 (2016) | 59.3 | 54.7 | 33.8 | 29.1 |
| Resident Evil 7 (2017) | 184 | 86.1 | 54.6 | 46.2 |
| For Honor (2017) | 122 | 47.4 | 45.3 | 34.9 |
| Ghost Recon Wildlands (2017) | 62.3 | 34.9 | 32.1 | 15.3 |
| Prey (2017) | 90.9 | 65.3 | 51.6 | 43.8 |
| Rocket League (2017) | 182 | 119 | 82.8 | |
| Dirt 4 (2017) | 157 | 83.2 | 50.9 | 28.6 |
| Playerunknown's Battlegrounds (PUBG) (2017) | 110 | 50.3 | 41.8 | 30 |
| Middle-earth: Shadow of War (2017) | 84 | 43 | 31 | 23 |
| The Evil Within 2 (2017) | 35.7 | 25.4 | 23.7 | 23 |
| ELEX (2017) | 49.4 | 41.9 | 34.2 | 25.7 |
| Call of Duty WWII (2017) | 87.3 | 76.7 | 50.1 | 40.9 |
| Need for Speed Payback (2017) | 71.5 | 52.5 | 43.6 | 40.8 |
| Fortnite (2018) | 77.1 | 66.4 | 43.9 | 33 |
| Final Fantasy XV Benchmark (2018) | 49.6 | 27.2 | 11.8 | |
| Kingdom Come: Deliverance (2018) | 64.6 | 35.3 | 29 | 20.7 |
| Far Cry 5 (2018) | 55 | 38 | 35 | 32 |
| The Crew 2 (2018) | 53 | 44.6 | 41.6 | 37.9 |
| Monster Hunter World (2018) | 61.2 | 32.5 | 28.5 | 22.4 |
| F1 2018 (2018) | 94 | 56 | 47 | 31 |
| Shadow of the Tomb Raider (2018) | 54 | 27 | 26 | 23 |
| FIFA 19 (2018) | 127 | 109 | 105 | 100 |
| Forza Horizon 4 (2018) | 90 | 52 | 49 | 38 |
| Assassin´s Creed Odyssey (2018) | 30 | 25 | 21 | 16 |
| Call of Duty Black Ops 4 (2018) | 87 | 49.1 | 42 | 20.3 |
| Hitman 2 (2018) | 40.1 | 35.2 | 32.2 | 31.4 |
| Fallout 76 (2018) | 59.4 | 38.8 | 34.1 | 29.9 |
| Battlefield V (2018) | 95.3 | 49.6 | 41.3 | 36.5 |
| Farming Simulator 19 (2018) | 86.4 | 69.3 | 47.4 | 27 |
Barulho
| Ocioso |
| 29 / 31 / 32 dB |
| HDD |
| 31 dB |
| Carga |
| 36 / 46 dB |
 | ||
30 dB silencioso 40 dB(A) audível 50 dB(A) ruidosamente alto |
||
min: | ||
| Acer Nitro 5 AN515-42-R6V0 R7 2700U, Radeon RX 560X (Laptop) | Lenovo IdeaPad 720-15IKB i5-7200U, Radeon RX 560 (Laptop) | Acer Aspire 5 A515-52G-53PU i5-8265U, GeForce MX150 | Xiaomi Mi Notebook Pro i5 i5-8250U, GeForce MX150 | Média da turma Gaming | |
|---|---|---|---|---|---|
| Noise | 1% | -2% | -3% | 2% | |
| desligado / ambiente * (dB) | 29 | 30.3 -4% | 30.5 -5% | 31 -7% | 24.1 ? 17% |
| Idle Minimum * (dB) | 29 | 30.3 -4% | 30.5 -5% | 31 -7% | 25.8 ? 11% |
| Idle Average * (dB) | 31 | 30.3 2% | 30.5 2% | 31 -0% | 27.4 ? 12% |
| Idle Maximum * (dB) | 32 | 30.3 5% | 30.9 3% | 32.6 -2% | 29.9 ? 7% |
| Load Average * (dB) | 36 | 39.2 -9% | 41.2 -14% | 41.6 -16% | 43 ? -19% |
| Witcher 3 ultra * (dB) | 44 | 41.6 5% | 41.6 5% | ||
| Load Maximum * (dB) | 46 | 39.2 15% | 41.9 9% | 44.7 3% | 54 ? -17% |
* ... menor é melhor
(-) A temperatura máxima no lado superior é 47 °C / 117 F, em comparação com a média de 40.4 °C / 105 F , variando de 21.2 a 68.8 °C para a classe Gaming.
(±) A parte inferior aquece até um máximo de 44 °C / 111 F, em comparação com a média de 43.2 °C / 110 F
(+) Em uso inativo, a temperatura média para o lado superior é 26.1 °C / 79 F, em comparação com a média do dispositivo de 33.9 °C / ### class_avg_f### F.
(±) Jogando The Witcher 3, a temperatura média para o lado superior é 37.7 °C / 100 F, em comparação com a média do dispositivo de 33.9 °C / ## #class_avg_f### F.
(+) Os apoios para as mãos e o touchpad são mais frios que a temperatura da pele, com um máximo de 29 °C / 84.2 F e, portanto, são frios ao toque.
(±) A temperatura média da área do apoio para as mãos de dispositivos semelhantes foi 28.8 °C / 83.8 F (-0.2 °C / -0.4 F).
| Acer Nitro 5 AN515-42-R6V0 R7 2700U, Radeon RX 560X (Laptop) | Lenovo IdeaPad 720-15IKB i5-7200U, Radeon RX 560 (Laptop) | Acer Aspire 5 A515-52G-53PU i5-8265U, GeForce MX150 | Xiaomi Mi Notebook Pro i5 i5-8250U, GeForce MX150 | Média da turma Gaming | |
|---|---|---|---|---|---|
| Heat | 18% | -8% | 6% | -8% | |
| Maximum Upper Side * (°C) | 47 | 41.2 12% | 52.9 -13% | 43.8 7% | 45.2 ? 4% |
| Maximum Bottom * (°C) | 44 | 36.4 17% | 51.5 -17% | 44.9 -2% | 47.9 ? -9% |
| Idle Upper Side * (°C) | 30 | 22 27% | 28.4 5% | 25.9 14% | 31.1 ? -4% |
| Idle Bottom * (°C) | 28 | 23.6 16% | 29.7 -6% | 26.3 6% | 34.2 ? -22% |
* ... menor é melhor
Acer Nitro 5 AN515-42-R6V0 análise de áudio
(±) | o volume do alto-falante é médio, mas bom (###valor### dB)
Graves 100 - 315Hz
(±) | graves reduzidos - em média 10.3% menor que a mediana
(±) | a linearidade dos graves é média (12.1% delta para a frequência anterior)
Médios 400 - 2.000 Hz
(±) | médios mais altos - em média 5.5% maior que a mediana
(+) | médios são lineares (3.3% delta para frequência anterior)
Altos 2 - 16 kHz
(+) | agudos equilibrados - apenas 1.6% longe da mediana
(+) | os máximos são lineares (5.8% delta da frequência anterior)
Geral 100 - 16.000 Hz
(±) | a linearidade do som geral é média (15% diferença em relação à mediana)
Comparado com a mesma classe
» 32% de todos os dispositivos testados nesta classe foram melhores, 6% semelhantes, 62% piores
» O melhor teve um delta de 6%, a média foi 18%, o pior foi 132%
Comparado com todos os dispositivos testados
» 21% de todos os dispositivos testados foram melhores, 4% semelhantes, 75% piores
» O melhor teve um delta de 4%, a média foi 24%, o pior foi 134%
Lenovo IdeaPad 720-15IKB análise de áudio
(-) | alto-falantes não muito altos (###valor### dB)
Graves 100 - 315Hz
(-) | quase nenhum baixo - em média 23% menor que a mediana
(±) | a linearidade dos graves é média (14.6% delta para a frequência anterior)
Médios 400 - 2.000 Hz
(+) | médios equilibrados - apenas 4% longe da mediana
(+) | médios são lineares (6% delta para frequência anterior)
Altos 2 - 16 kHz
(+) | agudos equilibrados - apenas 3.9% longe da mediana
(±) | a linearidade dos máximos é média (8.5% delta para frequência anterior)
Geral 100 - 16.000 Hz
(±) | a linearidade do som geral é média (23.3% diferença em relação à mediana)
Comparado com a mesma classe
» 82% de todos os dispositivos testados nesta classe foram melhores, 5% semelhantes, 13% piores
» O melhor teve um delta de 5%, a média foi 17%, o pior foi 45%
Comparado com todos os dispositivos testados
» 70% de todos os dispositivos testados foram melhores, 5% semelhantes, 25% piores
» O melhor teve um delta de 4%, a média foi 24%, o pior foi 134%
| desligado | |
| Ocioso | |
| Carga |
|
Key:
min: | |
| Acer Nitro 5 AN515-42-R6V0 R7 2700U, Radeon RX 560X (Laptop) | Lenovo IdeaPad 720-15IKB i5-7200U, Radeon RX 560 (Laptop) | Acer Aspire 5 A515-52G-53PU i5-8265U, GeForce MX150 | Xiaomi Mi Notebook Pro i5 i5-8250U, GeForce MX150 | Média da turma Gaming | |
|---|---|---|---|---|---|
| Power Consumption | 12% | 41% | 45% | -70% | |
| Idle Minimum * (Watt) | 7 | 9.9 -41% | 3.8 46% | 3.7 47% | 13.2 ? -89% |
| Idle Average * (Watt) | 10 | 9.5 5% | 6.3 37% | 7.5 25% | 18.9 ? -89% |
| Idle Maximum * (Watt) | 18 | 10.7 41% | 9.6 47% | 8 56% | 24.3 ? -35% |
| Load Average * (Watt) | 79 | 62 22% | 59.5 25% | 49 38% | 108.3 ? -37% |
| Witcher 3 ultra * (Watt) | 98 | 84 14% | 50.6 48% | ||
| Load Maximum * (Watt) | 128 | 86.7 32% | 64.4 50% | 55.2 57% | 254 ? -98% |
* ... menor é melhor
| Acer Nitro 5 AN515-42-R6V0 R7 2700U, Radeon RX 560X (Laptop), 48 Wh | Lenovo IdeaPad 720-15IKB i5-7200U, Radeon RX 560 (Laptop), 40 Wh | Acer Aspire 5 A515-52G-53PU i5-8265U, GeForce MX150, 48 Wh | Xiaomi Mi Notebook Pro i5 i5-8250U, GeForce MX150, 60 Wh | Média da turma Gaming | |
|---|---|---|---|---|---|
| Duração da bateria | 25% | 32% | 75% | 24% | |
| WiFi v1.3 (h) | 5.7 | 7.1 25% | 7.5 32% | 10 75% | 7.04 ? 24% |
| Reader / Idle (h) | 16.1 | 14.1 | 8.71 ? | ||
| H.264 (h) | 9.2 | 6.7 | 10.5 | 8.26 ? | |
| Load (h) | 0.8 | 1.7 | 2 | 1.47 ? | |
| Witcher 3 ultra (h) | 1.4 |
Pro
Contra
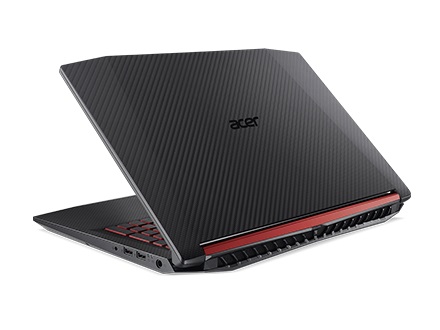
Os entusiastas da AMD que ansiavam por um portátil multimídia adequado com ambições de jogo estão no endereço certo com o Acer Nitro 5 AN515-42-R6V0.
Ok, você pode ver várias medidas de recorte de custos (bateria pequena, conexões escassas, SSD fraco durante a gravação, apenas 8 GB de RAM), mas pelo preço de apenas 900 Euros (~$1019), o portátil de 15 polegadas é um ótimo negócio.
A combinação da Ryzen 7 2700U e Radeon RX 560Xtraz energia suficiente para a maioria das aplicações, embora durante os jogos, suas expectativas sobre a qualidade dos gráficos e as taxas de quadros não sejam muito altas.
Em resumo, com a versão AMD do Nitro 5, a Acer oferece uma alternativa bonita e bem sucedida aos portáteis estabelecidos baseados na Intel/Nvidia. Infelizmente, algo assim não acontece com muita frequência. Afinal, a concorrência é boa para os negócios.
Acer Nitro 5 AN515-42-R6V0
- 05/14/2020 v7 (old)
Florian Glaser
Price comparison