Breve Análise do Portátil HP Pavilion Power 15t-cb2000 (i7-7700HQ, Radeon RX 550)


| SD Card Reader | |
| average JPG Copy Test (av. of 3 runs) | |
| HP Pavilion 15 Power 1GK62AV | |
| HP Omen 17-w206ng | |
| HP Omen 15-ax213ng | |
| Samsung Notebook 9 NP900X5N-X01US | |
| HP Pavilion Power 15t-cb2000 | |
| maximum AS SSD Seq Read Test (1GB) | |
| HP Pavilion Power 15t-cb2000 | |
| HP Omen 15-ax213ng | |
| HP Omen 17-w206ng | |
| Samsung Notebook 9 NP900X5N-X01US | |
| HP Pavilion 15 Power 1GK62AV | |
| |||||||||||||||||||||||||
iluminação: 88 %
iluminação com acumulador: 256 cd/m²
Contraste: 1219:1 (Preto: 0.21 cd/m²)
ΔE ColorChecker Calman: 5.2 | ∀{0.5-29.43 Ø4.71}
ΔE Greyscale Calman: 3.5 | ∀{0.09-98 Ø4.96}
59% sRGB (Argyll 1.6.3 3D)
37% AdobeRGB 1998 (Argyll 1.6.3 3D)
40.59% AdobeRGB 1998 (Argyll 3D)
58.9% sRGB (Argyll 3D)
39.28% Display P3 (Argyll 3D)
Gamma: 2.35
CCT: 6576 K
| HP Pavilion Power 15t-cb2000 AUO41ED , IPS, 15.6", 1920x1080 | HP Pavilion 15 Power 1GK62AV ID: AU Optronics AUO41ED, IPS, 15.6", 1920x1080 | HP Omen 15-ax213ng AU Optronics AUO41ED, IPS, 15.6", 1920x1080 | HP Omen 17-w206ng Chi Mei CMN1738, IPS, 17.3", 1920x1080 | Samsung Notebook 9 NP900X5N-X01US ID: BOE06E8, Name: BOE HF NV150FHB-N31, IPS, 15", 1920x1080 | |
|---|---|---|---|---|---|
| Display | -1% | -2% | 65% | 66% | |
| Display P3 Coverage (%) | 39.28 | 38.81 -1% | 38.59 -2% | 67.2 71% | 65.2 66% |
| sRGB Coverage (%) | 58.9 | 57.9 -2% | 58 -2% | 93.1 58% | 97.7 66% |
| AdobeRGB 1998 Coverage (%) | 40.59 | 40.03 -1% | 39.87 -2% | 67.4 66% | 67.2 66% |
| Response Times | 15% | 12% | 19% | 5% | |
| Response Time Grey 50% / Grey 80% * (ms) | 51.6 ? | 38.8 ? 25% | 42 ? 19% | 38 ? 26% | 40.8 ? 21% |
| Response Time Black / White * (ms) | 29.2 ? | 28 ? 4% | 28 ? 4% | 26 ? 11% | 32.4 ? -11% |
| PWM Frequency (Hz) | 200 ? | 208.3 ? | |||
| Screen | 3% | 7% | 17% | 40% | |
| Brightness middle (cd/m²) | 256 | 256.6 0% | 230 -10% | 318 24% | 565.6 121% |
| Brightness (cd/m²) | 241 | 243 1% | 228 -5% | 295 22% | 524 117% |
| Brightness Distribution (%) | 88 | 81 -8% | 88 0% | 79 -10% | 88 0% |
| Black Level * (cd/m²) | 0.21 | 0.19 10% | 0.21 -0% | 0.25 -19% | 0.49 -133% |
| Contrast (:1) | 1219 | 1351 11% | 1095 -10% | 1272 4% | 1154 -5% |
| Colorchecker dE 2000 * | 5.2 | 5 4% | 4.01 23% | 4.7 10% | 2 62% |
| Colorchecker dE 2000 max. * | 19.3 | 20.1 -4% | 7.26 62% | 8.8 54% | 5 74% |
| Greyscale dE 2000 * | 3.5 | 2.7 23% | 3.18 9% | 5 -43% | 2.5 29% |
| Gamma | 2.35 94% | 2.32 95% | 2.52 87% | 2.28 96% | 2.21 100% |
| CCT | 6576 99% | 6599 98% | 6814 95% | 7374 88% | 6896 94% |
| Color Space (Percent of AdobeRGB 1998) (%) | 37 | 36.7 -1% | 37 0% | 61 65% | 61.2 65% |
| Color Space (Percent of sRGB) (%) | 59 | 57.7 -2% | 58 -2% | 93 58% | 97.5 65% |
| Média Total (Programa/Configurações) | 6% /
4% | 6% /
6% | 34% /
26% | 37% /
40% |
* ... menor é melhor
Exibir tempos de resposta
| ↔ Tempo de resposta preto para branco | ||
|---|---|---|
| 29.2 ms ... ascensão ↗ e queda ↘ combinadas | ↗ 16.8 ms ascensão | 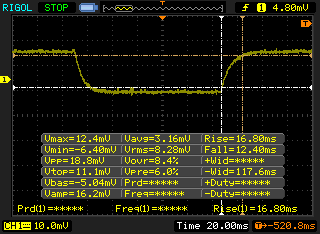 |
| ↘ 12.4 ms queda | ||
| A tela mostra taxas de resposta relativamente lentas em nossos testes e pode ser muito lenta para os jogadores. Em comparação, todos os dispositivos testados variam de 0.1 (mínimo) a 240 (máximo) ms. » 78 % de todos os dispositivos são melhores. Isso significa que o tempo de resposta medido é pior que a média de todos os dispositivos testados (19.8 ms). | ||
| ↔ Tempo de resposta 50% cinza a 80% cinza | ||
| 51.6 ms ... ascensão ↗ e queda ↘ combinadas | ↗ 26.4 ms ascensão | 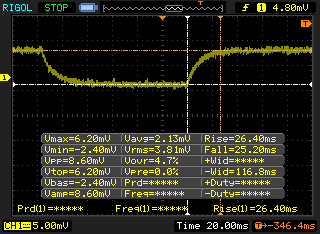 |
| ↘ 25.2 ms queda | ||
| A tela mostra taxas de resposta lentas em nossos testes e será insatisfatória para os jogadores. Em comparação, todos os dispositivos testados variam de 0.165 (mínimo) a 636 (máximo) ms. » 88 % de todos os dispositivos são melhores. Isso significa que o tempo de resposta medido é pior que a média de todos os dispositivos testados (30.9 ms). | ||
Cintilação da tela / PWM (modulação por largura de pulso)
| Tela tremeluzindo / PWM não detectado | 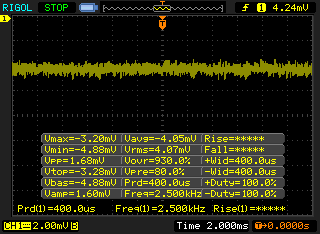 | ||
[pwm_comparison] Em comparação: 52 % de todos os dispositivos testados não usam PWM para escurecer a tela. Se PWM foi detectado, uma média de 7744 (mínimo: 5 - máximo: 343500) Hz foi medida. | |||
| wPrime 2.10 - 1024m | |
| Samsung Notebook 9 NP900X5N-X01US | |
| HP Pavilion Power 15t-cb2000 | |
| HP Pavilion 15 Power 1GK62AV | |
* ... menor é melhor
| PCMark 8 | |
| Home Score Accelerated v2 | |
| HP Pavilion Power 15t-cb2000 | |
| HP Omen 17-w206ng | |
| HP Omen 15-ax213ng | |
| HP Pavilion 15 Power 1GK62AV | |
| Samsung Notebook 9 NP900X5N-X01US | |
| Work Score Accelerated v2 | |
| HP Pavilion 15 Power 1GK62AV | |
| Samsung Notebook 9 NP900X5N-X01US | |
| HP Pavilion Power 15t-cb2000 | |
| HP Omen 15-ax213ng | |
| Creative Score Accelerated v2 | |
| HP Omen 15-ax213ng | |
| HP Pavilion 15 Power 1GK62AV | |
| HP Pavilion Power 15t-cb2000 | |
| Samsung Notebook 9 NP900X5N-X01US | |
| PCMark 8 Home Score Accelerated v2 | 4499 pontos | |
| PCMark 8 Creative Score Accelerated v2 | 5151 pontos | |
| PCMark 8 Work Score Accelerated v2 | 4627 pontos | |
| PCMark 10 Score | 3802 pontos | |
Ajuda | ||
| HP Pavilion Power 15t-cb2000 HGST Travelstar 7K1000 HTS721010A9E630 | HP Pavilion 15 Power 1GK62AV SK Hynix HFS256G39TND-N210A | HP Omen 15-ax213ng Samsung PM961 MZVLW256HEHP | HP Omen 17-w206ng Samsung PM961 MZVLW256HEHP | Samsung Notebook 9 NP900X5N-X01US Samsung PM961 MZVLW256HEHP | |
|---|---|---|---|---|---|
| CrystalDiskMark 3.0 | 8924% | 24609% | 22337% | 19660% | |
| Read Seq (MB/s) | 105.9 | 491.6 364% | 1657 1465% | 1606 1417% | 1447 1266% |
| Write Seq (MB/s) | 104.7 | 141.7 35% | 1208 1054% | 1176 1023% | 1281 1123% |
| Read 512 (MB/s) | 36.71 | 345.6 841% | 806 2096% | 846 2205% | 651 1673% |
| Write 512 (MB/s) | 49.86 | 142.6 186% | 807 1519% | 805 1515% | 765 1434% |
| Read 4k (MB/s) | 0.473 | 18.83 3881% | 62.6 13135% | 59.9 12564% | 58.3 12226% |
| Write 4k (MB/s) | 0.547 | 76.3 13849% | 176.9 32240% | 155.6 28346% | 131.9 24013% |
| Read 4k QD32 (MB/s) | 0.903 | 348.5 38494% | 650 71882% | 588 65016% | 545 60254% |
| Write 4k QD32 (MB/s) | 0.757 | 104.8 13744% | 557 73480% | 505 66611% | 419.3 55290% |

| 3DMark 06 Standard Score | 23308 pontos | |
| 3DMark 11 Performance | 5704 pontos | |
| 3DMark Ice Storm Standard Score | 92226 pontos | |
| 3DMark Cloud Gate Standard Score | 15004 pontos | |
| 3DMark Fire Strike Score | 3738 pontos | |
| 3DMark Fire Strike Extreme Score | 1775 pontos | |
| 3DMark Time Spy Score | 1302 pontos | |
Ajuda | ||
| Metro: Last Light | |
| 1920x1080 Very High (DX11) AF:16x (classificar por valor) | |
| HP Pavilion Power 15t-cb2000 | |
| HP Pavilion 15 Power 1GK62AV | |
| 1366x768 High (DX11) AF:16x (classificar por valor) | |
| HP Pavilion Power 15t-cb2000 | |
| HP Pavilion 15 Power 1GK62AV | |
| HP 15-bw077ax | |
| 1366x768 Medium (DX10) AF:4x (classificar por valor) | |
| HP Pavilion Power 15t-cb2000 | |
| HP 15-bw077ax | |
| 1024x768 Low (DX10) AF:4x (classificar por valor) | |
| HP Pavilion Power 15t-cb2000 | |
| HP 15-bw077ax | |
| Thief | |
| 1920x1080 Very High Preset AA:FXAA & High SS AF:8x (classificar por valor) | |
| HP Pavilion Power 15t-cb2000 | |
| HP Pavilion 15 Power 1GK62AV | |
| 1366x768 High Preset AA:FXAA & Low SS AF:4x (classificar por valor) | |
| HP Pavilion Power 15t-cb2000 | |
| HP Pavilion 15 Power 1GK62AV | |
| 1366x768 Normal Preset AA:FX (classificar por valor) | |
| HP Pavilion Power 15t-cb2000 | |
| 1024x768 Very Low Preset (classificar por valor) | |
| HP Pavilion Power 15t-cb2000 | |
| The Witcher 3 | |
| 1920x1080 Ultra Graphics & Postprocessing (HBAO+) (classificar por valor) | |
| HP Pavilion Power 15t-cb2000 | |
| HP Pavilion 15 Power 1GK62AV | |
| HP Omen 15-ax213ng | |
| HP Omen 17-w206ng | |
| 1920x1080 High Graphics & Postprocessing (Nvidia HairWorks Off) (classificar por valor) | |
| HP Pavilion 15 Power 1GK62AV | |
| HP Omen 15-ax213ng | |
| HP Omen 17-w206ng | |
| 1366x768 Medium Graphics & Postprocessing (classificar por valor) | |
| HP Pavilion 15 Power 1GK62AV | |
| HP Omen 15-ax213ng | |
| HP Omen 17-w206ng | |
| 1024x768 Low Graphics & Postprocessing (classificar por valor) | |
| HP Omen 15-ax213ng | |
| HP Omen 17-w206ng | |
| Samsung Notebook 9 NP900X5N-X01US | |
| HP 15-bw077ax | |
| HP Pavilion 17z 1EX13AV | |
| Rise of the Tomb Raider | |
| 1920x1080 Very High Preset AA:FX AF:16x (classificar por valor) | |
| HP Pavilion Power 15t-cb2000 | |
| HP Pavilion 15 Power 1GK62AV | |
| HP Omen 15-ax213ng | |
| 1920x1080 High Preset AA:FX AF:4x (classificar por valor) | |
| HP Pavilion Power 15t-cb2000 | |
| HP Pavilion 15 Power 1GK62AV | |
| HP Omen 15-ax213ng | |
| Samsung Notebook 9 NP900X5N-X01US | |
| 1366x768 Medium Preset AF:2x (classificar por valor) | |
| HP Pavilion Power 15t-cb2000 | |
| HP Omen 15-ax213ng | |
| Samsung Notebook 9 NP900X5N-X01US | |
| HP 15-bw077ax | |
| HP Pavilion 17z 1EX13AV | |
| 1024x768 Lowest Preset (classificar por valor) | |
| HP Pavilion Power 15t-cb2000 | |
| HP Omen 15-ax213ng | |
| Samsung Notebook 9 NP900X5N-X01US | |
| HP 15-bw077ax | |
| HP Pavilion 17z 1EX13AV | |
| Asus X555DA-BB11 | |
| Batman: Arkham Knight | |
| 1920x1080 High / On AA:SM AF:16x (classificar por valor) | |
| HP Pavilion Power 15t-cb2000 | |
| HP Pavilion 15 Power 1GK62AV | |
| 1920x1080 High / On (Interactive Smoke & Paper Debris Off) AA:SM AF:8x (classificar por valor) | |
| HP Pavilion Power 15t-cb2000 | |
| 1366x768 Normal / Off AF:4x (classificar por valor) | |
| HP Pavilion Power 15t-cb2000 | |
| HP Pavilion 15 Power 1GK62AV | |
| HP 15-bw077ax | |
| 1280x720 Low / Off AF:Trilinear (classificar por valor) | |
| HP Pavilion Power 15t-cb2000 | |
| HP Pavilion 15 Power 1GK62AV | |
| HP 15-bw077ax | |
| HP Pavilion 17z 1EX13AV | |
| Ashes of the Singularity | |
| 1280x768 low (classificar por valor) | |
| HP Pavilion Power 15t-cb2000 | |
| HP Pavilion 15 Power 1GK62AV | |
| HP 15-bw077ax | |
| 1920x1080 Standard (classificar por valor) | |
| HP Pavilion Power 15t-cb2000 | |
| HP Pavilion 15 Power 1GK62AV | |
| 1920x1080 high (classificar por valor) | |
| HP Pavilion Power 15t-cb2000 | |
| HP Pavilion 15 Power 1GK62AV | |
| Doom | |
| 1920x1080 Ultra Preset AA:SM (classificar por valor) | |
| HP Pavilion Power 15t-cb2000 | |
| HP Pavilion 15 Power 1GK62AV | |
| 1920x1080 High Preset AA:FX (classificar por valor) | |
| HP Pavilion Power 15t-cb2000 | |
| HP Pavilion 15 Power 1GK62AV | |
| 1366x768 Medium Preset (classificar por valor) | |
| HP Pavilion Power 15t-cb2000 | |
| HP Pavilion 15 Power 1GK62AV | |
| 1280x720 Low Preset (classificar por valor) | |
| HP Pavilion Power 15t-cb2000 | |
| HP Pavilion 15 Power 1GK62AV | |
| HP Pavilion 17z 1EX13AV | |
| baixo | média | alto | ultra | |
|---|---|---|---|---|
| Tomb Raider (2013) | 289.8 | 149.5 | 114.9 | 51.2 |
| BioShock Infinite (2013) | 183 | 133 | 117 | 67 |
| Metro: Last Light (2013) | 90 | 85.4 | 59.5 | 28.4 |
| Thief (2014) | 65.2 | 58.3 | 55.1 | 29 |
| The Witcher 3 (2015) | 24 | |||
| Batman: Arkham Knight (2015) | 82 | 71 | 39 | 27 |
| Rise of the Tomb Raider (2016) | 91 | 54 | 27 | 21 |
| Ashes of the Singularity (2016) | 41.9 | 25.4 | 22 | |
| Doom (2016) | 56 | 37 | 22 | 21 |
Barulho
| Ocioso |
| 30.8 / 30.9 / 31.1 dB |
| Carga |
| 50.2 / 50.2 dB |
 | ||
30 dB silencioso 40 dB(A) audível 50 dB(A) ruidosamente alto |
||
min: | ||
| HP Pavilion Power 15t-cb2000 Radeon RX 550 (Laptop), i7-7700HQ, HGST Travelstar 7K1000 HTS721010A9E630 | HP Pavilion 15 Power 1GK62AV GeForce GTX 1050 Mobile, i7-7700HQ, SK Hynix HFS256G39TND-N210A | HP Omen 15-ax213ng GeForce GTX 1050 Ti Mobile, i7-7700HQ, Samsung PM961 MZVLW256HEHP | HP Omen 17-w206ng GeForce GTX 1050 Ti Mobile, i7-7700HQ, Samsung PM961 MZVLW256HEHP | Samsung Notebook 9 NP900X5N-X01US GeForce 940MX, i7-7500U, Samsung PM961 MZVLW256HEHP | |
|---|---|---|---|---|---|
| Noise | 2% | -5% | -6% | 12% | |
| desligado / ambiente * (dB) | 28.4 | 27.8 2% | 30 -6% | 30 -6% | 28.3 -0% |
| Idle Minimum * (dB) | 30.8 | 32.1 -4% | 32 -4% | 34 -10% | 28.3 8% |
| Idle Average * (dB) | 30.9 | 32.2 -4% | 34 -10% | 35 -13% | 28.3 8% |
| Idle Maximum * (dB) | 31.1 | 32.2 -4% | 36 -16% | 36 -16% | 28.3 9% |
| Load Average * (dB) | 50.2 | 43.3 14% | 48 4% | 47 6% | 38.3 24% |
| Witcher 3 ultra * (dB) | 50.2 | 45 10% | 49 2% | 48 4% | |
| Load Maximum * (dB) | 50.2 | 49.6 1% | 51 -2% | 52 -4% | 38.3 24% |
* ... menor é melhor
(±) A temperatura máxima no lado superior é 43.4 °C / 110 F, em comparação com a média de 36.8 °C / 98 F , variando de 21 a 71 °C para a classe Multimedia.
(-) A parte inferior aquece até um máximo de 54 °C / 129 F, em comparação com a média de 39.1 °C / 102 F
(+) Em uso inativo, a temperatura média para o lado superior é 31.5 °C / 89 F, em comparação com a média do dispositivo de 31.3 °C / ### class_avg_f### F.
(±) Jogando The Witcher 3, a temperatura média para o lado superior é 32.2 °C / 90 F, em comparação com a média do dispositivo de 31.3 °C / ## #class_avg_f### F.
(±) Os apoios para as mãos e o touchpad podem ficar muito quentes ao toque, com um máximo de 37.8 °C / 100 F.
(-) A temperatura média da área do apoio para as mãos de dispositivos semelhantes foi 28.7 °C / 83.7 F (-9.1 °C / -16.3 F).
HP Pavilion Power 15t-cb2000 análise de áudio
(±) | o volume do alto-falante é médio, mas bom (###valor### dB)
Graves 100 - 315Hz
(-) | quase nenhum baixo - em média 16.2% menor que a mediana
(±) | a linearidade dos graves é média (13.8% delta para a frequência anterior)
Médios 400 - 2.000 Hz
(+) | médios equilibrados - apenas 4.3% longe da mediana
(+) | médios são lineares (6.8% delta para frequência anterior)
Altos 2 - 16 kHz
(+) | agudos equilibrados - apenas 3.1% longe da mediana
(±) | a linearidade dos máximos é média (8.3% delta para frequência anterior)
Geral 100 - 16.000 Hz
(±) | a linearidade do som geral é média (25.4% diferença em relação à mediana)
Comparado com a mesma classe
» 90% de todos os dispositivos testados nesta classe foram melhores, 2% semelhantes, 8% piores
» O melhor teve um delta de 5%, a média foi 17%, o pior foi 45%
Comparado com todos os dispositivos testados
» 78% de todos os dispositivos testados foram melhores, 5% semelhantes, 17% piores
» O melhor teve um delta de 4%, a média foi 23%, o pior foi 134%
Apple MacBook 12 (Early 2016) 1.1 GHz análise de áudio
(+) | os alto-falantes podem tocar relativamente alto (###valor### dB)
Graves 100 - 315Hz
(±) | graves reduzidos - em média 11.3% menor que a mediana
(±) | a linearidade dos graves é média (14.2% delta para a frequência anterior)
Médios 400 - 2.000 Hz
(+) | médios equilibrados - apenas 2.4% longe da mediana
(+) | médios são lineares (5.5% delta para frequência anterior)
Altos 2 - 16 kHz
(+) | agudos equilibrados - apenas 2% longe da mediana
(+) | os máximos são lineares (4.5% delta da frequência anterior)
Geral 100 - 16.000 Hz
(+) | o som geral é linear (10.2% diferença em relação à mediana)
Comparado com a mesma classe
» 7% de todos os dispositivos testados nesta classe foram melhores, 2% semelhantes, 90% piores
» O melhor teve um delta de 5%, a média foi 18%, o pior foi 53%
Comparado com todos os dispositivos testados
» 5% de todos os dispositivos testados foram melhores, 1% semelhantes, 94% piores
» O melhor teve um delta de 4%, a média foi 23%, o pior foi 134%
| desligado | |
| Ocioso | |
| Carga |
|
Key:
min: | |
| HP Pavilion Power 15t-cb2000 i7-7700HQ, Radeon RX 550 (Laptop), HGST Travelstar 7K1000 HTS721010A9E630, IPS, 1920x1080, 15.6" | HP Pavilion 15 Power 1GK62AV i7-7700HQ, GeForce GTX 1050 Mobile, SK Hynix HFS256G39TND-N210A, IPS, 1920x1080, 15.6" | HP Omen 15-ax213ng i7-7700HQ, GeForce GTX 1050 Ti Mobile, Samsung PM961 MZVLW256HEHP, IPS, 1920x1080, 15.6" | HP Omen 17-w206ng i7-7700HQ, GeForce GTX 1050 Ti Mobile, Samsung PM961 MZVLW256HEHP, IPS, 1920x1080, 17.3" | Samsung Notebook 9 NP900X5N-X01US i7-7500U, GeForce 940MX, Samsung PM961 MZVLW256HEHP, IPS, 1920x1080, 15" | |
|---|---|---|---|---|---|
| Power Consumption | 10% | 0% | -18% | 41% | |
| Idle Minimum * (Watt) | 18.7 | 9.4 50% | 6 68% | 11 41% | 5 73% |
| Idle Average * (Watt) | 19.6 | 9.7 51% | 11 44% | 18 8% | 11.6 41% |
| Idle Maximum * (Watt) | 21.7 | 16.8 23% | 18 17% | 24 -11% | 12.2 44% |
| Load Average * (Watt) | 60.1 | 76.5 -27% | 81 -35% | 84 -40% | 47.8 20% |
| Witcher 3 ultra * (Watt) | 80.5 | 86.5 -7% | 90 -12% | 101 -25% | 51.9 36% |
| Load Maximum * (Watt) | 80.6 | 105.6 -31% | 146 -81% | 146 -81% | 55.7 31% |
* ... menor é melhor
| HP Pavilion Power 15t-cb2000 i7-7700HQ, Radeon RX 550 (Laptop), 70 Wh | HP Pavilion 15 Power 1GK62AV i7-7700HQ, GeForce GTX 1050 Mobile, 70 Wh | HP Omen 15-ax213ng i7-7700HQ, GeForce GTX 1050 Ti Mobile, 63.3 Wh | HP Omen 17-w206ng i7-7700HQ, GeForce GTX 1050 Ti Mobile, 62 Wh | Samsung Notebook 9 NP900X5N-X01US i7-7500U, GeForce 940MX, 66 Wh | |
|---|---|---|---|---|---|
| Duração da bateria | 30% | 10% | 7% | 79% | |
| Reader / Idle (h) | 10.5 | 16.2 54% | 12.8 22% | 13.3 27% | 27.4 161% |
| WiFi v1.3 (h) | 5.7 | 8 40% | 7.1 25% | 6.3 11% | 10.1 77% |
| Load (h) | 1.9 | 1.8 -5% | 1.6 -16% | 1.6 -16% | 1.9 0% |
Pro
Contra


A apenas $880, a configuração atual do Pavilion Power 15 é certamente de gama média em quase todos os sentidos. Além do popular Core i7-7700HQ, a máquina inclui 8 GB de RAM e placa de vídeo dedicada acessível, bem como uma decente tela FHD anti-refletiva. Ele também apresenta uma construção bastante robusta e uma seleção saudável de portas (embora falte o Thunderbolt 3). Funciona bem o suficiente nas circunstâncias como uma máquina de jogos de nível de entrada, desde que o usuário não tenha a impressão de que os jogos no futuro próximo permanecerão tão jogáveis quanto os de hoje.
O Pavilion Power 15t com gráficos AMD RX 550 funciona suficientemente bem como uma máquina de jogos de nível de entrada, mas ainda é bastante difícil de recomendar perante a configuração NVIDIA GTX 1050 (completo com armazenamento SSD) que analisamos semanas atrás—uma opção que custa apenas $120 a mais.
No entanto, embora seja atualizável, o armazenamento — uma unidade de 1 TB a 7200 RPM—é um gargalo na operação geral, e o adaptador gráfico RX 550 realmente não pode competir (seja em termos de desempenho ou de eficiência energética) com GPUs NVIDIA Pascal como a GTX 1050. O pior de tudo é que não podemos dizer definitivamente o quão bem a máquina deve se desempenhar em circunstâncias ideais, graças ao que parece ser um problema com o sistema de resfriamento da nossa unidade de teste. O desempenho da CPU do nosso sistema foi afetado de forma verificável pelas restrições térmicas impostas por esta falha, com temperaturas bem próximas aos 90 °C registradas durante nossos testes de estresse e valores de benchmarks desde 5% para - em circunstâncias extremas - 57% mais baixas.
Assumindo que os últimos problemas sejam específicos da nossa unidade de teste, a configuração do RX 550 ainda é bastante difícil de recomendar perante a configuração NVIDIA GTX 1050 (completo com armazenamento SSD) que analisamos semanas atrás—uma opção que custa apenas $120 a mais. Consultaremos com o distribuidor e atualizaremos nossa análise se tivermos chance de revisar esta configuração com funcionalidade adequada.
HP Pavilion Power 15t-cb2000
- 07/14/2017 v6 (old)
Steve Schardein
Price comparison
