Breve Análise do Portátil Lenovo ThinkPad A275 (A12-9800B, 256GB)
| SD Card Reader | |
| average JPG Copy Test (av. of 3 runs) | |
| HP EliteBook 820 G3 (Toshiba Exceria Pro SDXC 64 GB UHS-II) | |
| Lenovo ThinkPad X260-20F6007RGE (Toshiba Exceria Pro SDXC 64 GB UHS-II) | |
| Lenovo ThinkPad X270-20HMS00T00 (Toshiba Exceria Pro SDXC 64 GB UHS-II) | |
| Lenovo ThinkPad A275 (Toshiba Exceria Pro SDXC 64 GB UHS-II) | |
| HP EliteBook 725 G4 (Toshiba Exceria Pro SDXC 64 GB UHS-II) | |
| Lenovo Thinkpad 13-20J1001BUS (Toshiba Exceria Pro SDXC 64 GB UHS-II) | |
| maximum AS SSD Seq Read Test (1GB) | |
| Lenovo ThinkPad X270-20HMS00T00 (Toshiba Exceria Pro SDXC 64 GB UHS-II) | |
| HP EliteBook 820 G3 (Toshiba Exceria Pro SDXC 64 GB UHS-II) | |
| Lenovo ThinkPad X260-20F6007RGE (Toshiba Exceria Pro SDXC 64 GB UHS-II) | |
| Lenovo ThinkPad A275 (Toshiba Exceria Pro SDXC 64 GB UHS-II) | |
| HP EliteBook 725 G4 (Toshiba Exceria Pro SDXC 64 GB UHS-II) | |
| Lenovo Thinkpad 13-20J1001BUS (Toshiba Exceria Pro SDXC 64 GB UHS-II) | |
| |||||||||||||||||||||||||
iluminação: 87 %
iluminação com acumulador: 130 cd/m²
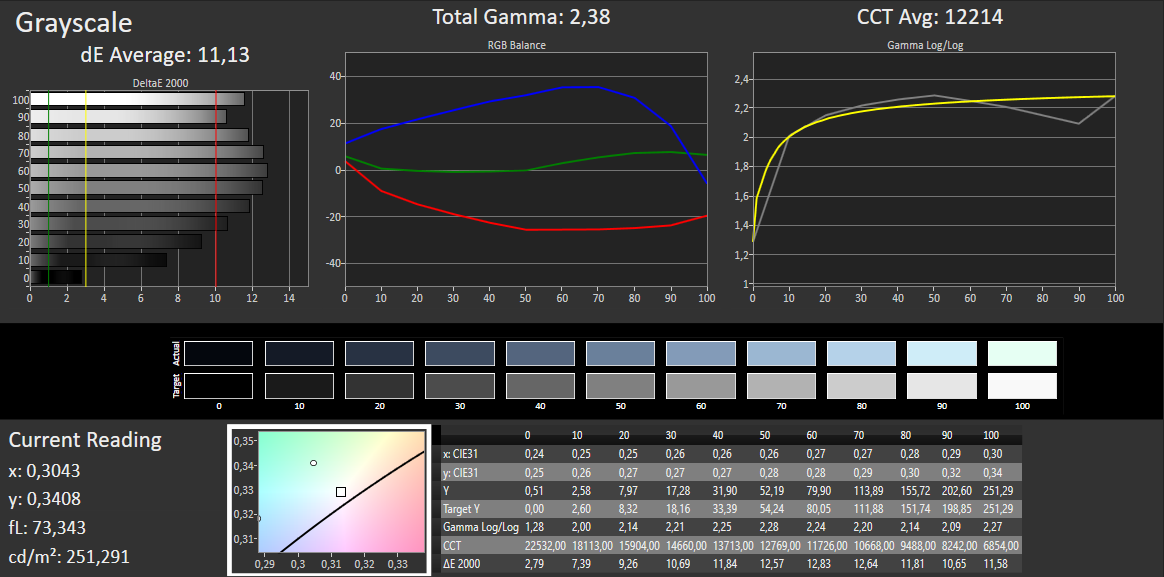
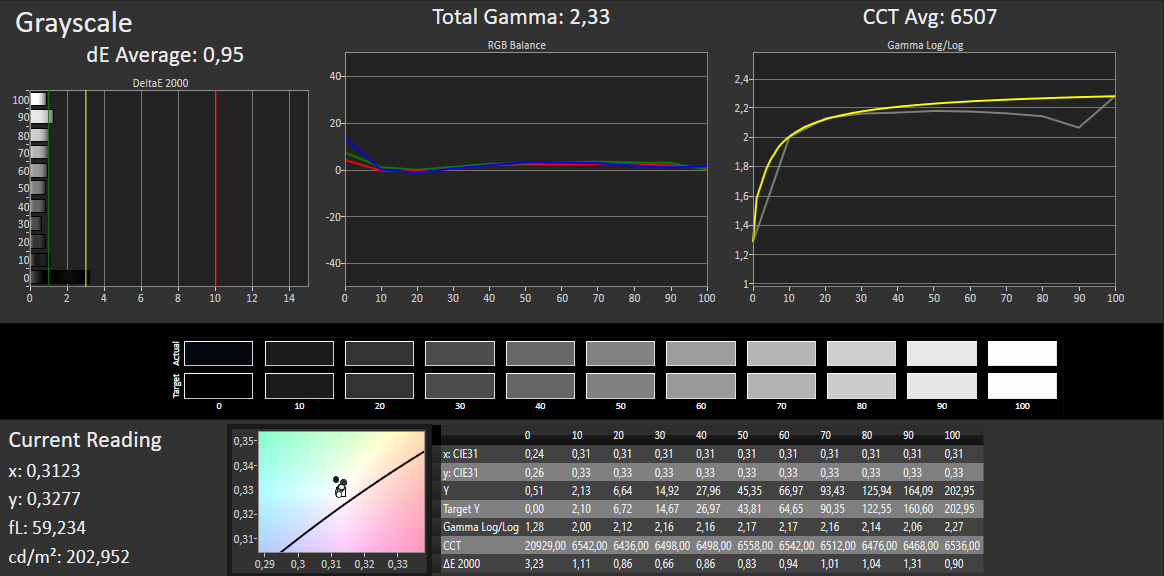
Contraste: 490:1 (Preto: 0.52 cd/m²)
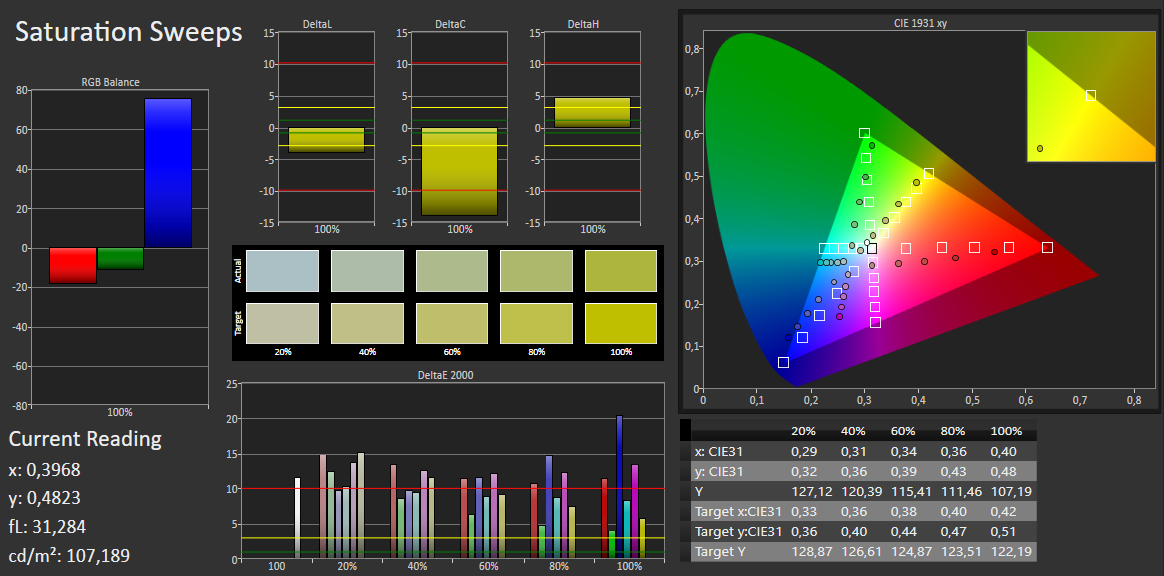
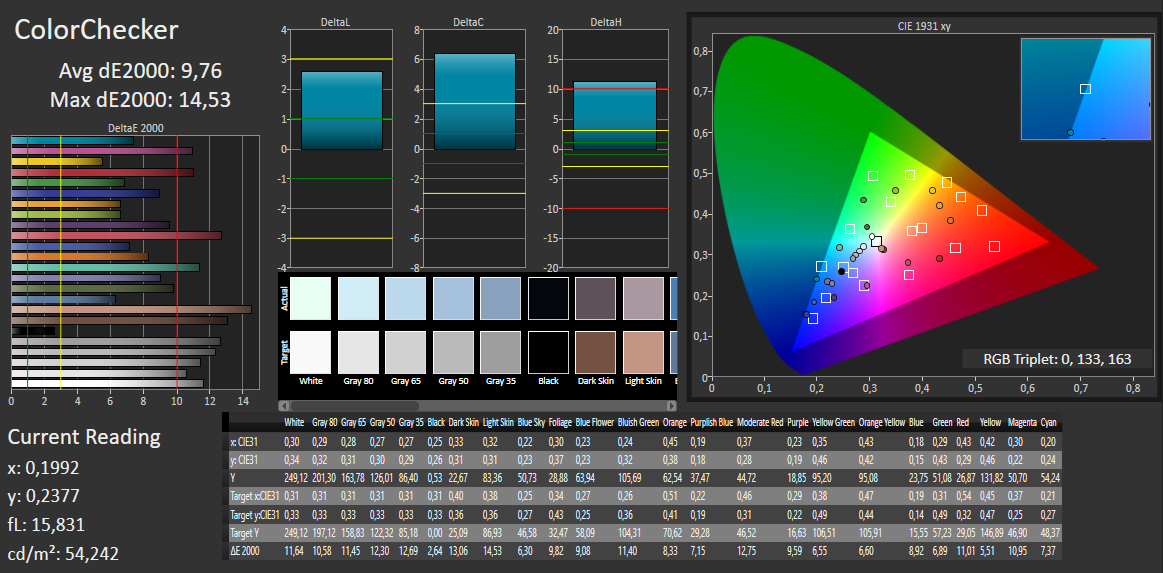
ΔE ColorChecker Calman: 9.76 | ∀{0.5-29.43 Ø4.72}
ΔE Greyscale Calman: 11.13 | ∀{0.09-98 Ø4.97}
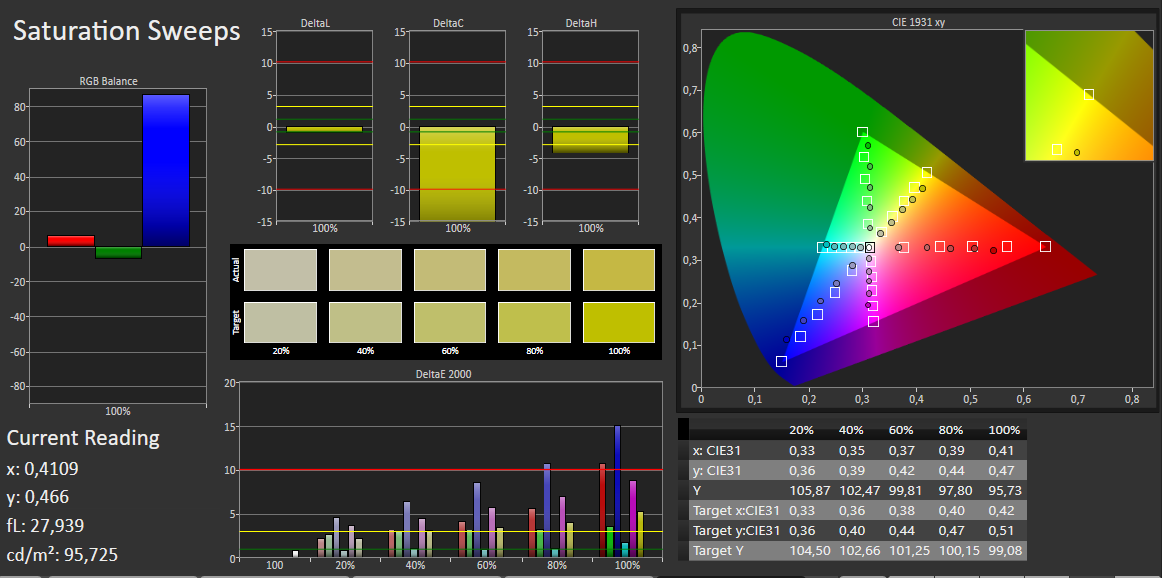
63% sRGB (Argyll 1.6.3 3D)
40% AdobeRGB 1998 (Argyll 1.6.3 3D)
43.48% AdobeRGB 1998 (Argyll 3D)
62.8% sRGB (Argyll 3D)
42.05% Display P3 (Argyll 3D)
Gamma: 2.38
CCT: 12214 K
| Lenovo ThinkPad A275 Len40E0, , 1366x768, 12.5" | HP EliteBook 820 G3 LG Philips LGD0498, , 1366x768, 12.5" | Lenovo ThinkPad X260-20F6007RGE Lenovo N125HCE-GN1, , 1920x1080, 12.5" | Lenovo Thinkpad 13-20J1001BUS Lenovo LEN4094, , 1920x1080, 13.3" | HP EliteBook 725 G4 AU Optronics, , 1920x1080, 12.5" | Lenovo ThinkPad X270-20HMS00T00 Innolux N125HCE-GN1, , 1920x1080, 12.5" | |
|---|---|---|---|---|---|---|
| Display | -7% | 6% | -4% | 16% | 6% | |
| Display P3 Coverage (%) | 42.05 | 38.9 -7% | 44.71 6% | 40.57 -4% | 49.16 17% | 44.6 6% 44.6 6% |
| sRGB Coverage (%) | 62.8 | 58.5 -7% | 66.1 5% | 60.7 -3% | 72.3 15% | 65.9 5% 65.9 5% |
| AdobeRGB 1998 Coverage (%) | 43.48 | 40.2 -8% | 46.23 6% | 41.92 -4% | 50.8 17% | 46.11 6% 46.11 6% |
| Response Times | -34% | 1% | -15% | -10% | -16% | |
| Response Time Grey 50% / Grey 80% * (ms) | 41 ? | 58 ? -41% | 32.8 ? 20% | 32.8 ? 20% | 47 ? -15% | 40.8 ? -0% |
| Response Time Black / White * (ms) | 23 ? | 29.2 ? -27% | 27.2 ? -18% | 34.4 ? -50% | 24 ? -4% | 30.4 ? -32% |
| PWM Frequency (Hz) | 800 ? | 26040 ? | ||||
| Screen | -4% | 32% | 18% | 61% | 30% | |
| Brightness middle (cd/m²) | 255 | 244 -4% | 337 32% | 266.4 4% | 329 29% | 283 11% |
| Brightness (cd/m²) | 244 | 240 -2% | 322 32% | 250 2% | 310 27% | 281 15% |
| Brightness Distribution (%) | 87 | 84 -3% | 91 5% | 88 1% | 88 1% | 94 8% |
| Black Level * (cd/m²) | 0.52 | 0.6 -15% | 0.32 38% | 0.31 40% | 0.19 63% | 0.25 52% |
| Contrast (:1) | 490 | 407 -17% | 1053 115% | 859 75% | 1732 253% | 1132 131% |
| Colorchecker dE 2000 * | 9.76 | 9 8% | 5.71 41% | 5.3 46% | 2.69 72% | 6.1 37% |
| Colorchecker dE 2000 max. * | 14.53 | 15.73 -8% | 15.39 -6% | 21 -45% | 4.47 69% | 15.4 -6% |
| Greyscale dE 2000 * | 11.13 | 9.48 15% | 5.15 54% | 3.3 70% | 4.23 62% | 6 46% |
| Gamma | 2.38 92% | 2.44 90% | 2.38 92% | 2.36 93% | 2.21 100% | 2.05 107% |
| CCT | 12214 53% | 11116 58% | 6881 94% | 6843 95% | 6011 108% | 6832 95% |
| Color Space (Percent of AdobeRGB 1998) (%) | 40 | 37.18 -7% | 42.38 6% | 38 -5% | 46 15% | 42.26 6% |
| Color Space (Percent of sRGB) (%) | 63 | 58.63 -7% | 65.62 4% | 60 -5% | 72 14% | 65.43 4% |
| Média Total (Programa/Configurações) | -15% /
-9% | 13% /
23% | -0% /
9% | 22% /
42% | 7% /
17% |
* ... menor é melhor

Exibir tempos de resposta
| ↔ Tempo de resposta preto para branco | ||
|---|---|---|
| 23 ms ... ascensão ↗ e queda ↘ combinadas | ↗ 19 ms ascensão | 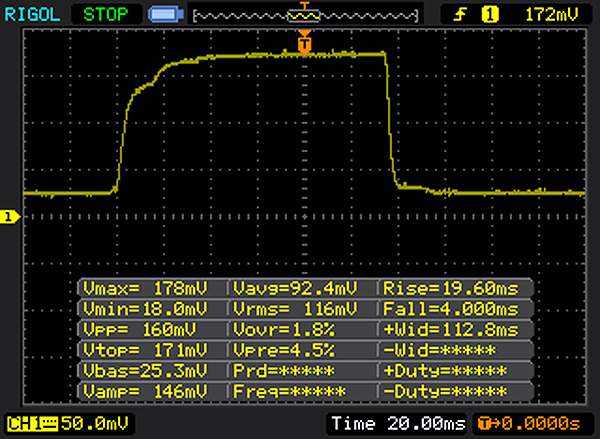 |
| ↘ 4 ms queda | ||
| A tela mostra boas taxas de resposta em nossos testes, mas pode ser muito lenta para jogadores competitivos. Em comparação, todos os dispositivos testados variam de 0.1 (mínimo) a 240 (máximo) ms. » 52 % de todos os dispositivos são melhores. Isso significa que o tempo de resposta medido é pior que a média de todos os dispositivos testados (19.8 ms). | ||
| ↔ Tempo de resposta 50% cinza a 80% cinza | ||
| 41 ms ... ascensão ↗ e queda ↘ combinadas | ↗ 22 ms ascensão | 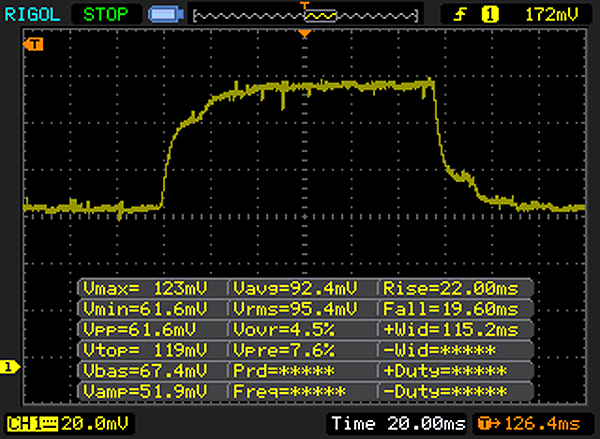 |
| ↘ 19 ms queda | ||
| A tela mostra taxas de resposta lentas em nossos testes e será insatisfatória para os jogadores. Em comparação, todos os dispositivos testados variam de 0.165 (mínimo) a 636 (máximo) ms. » 65 % de todos os dispositivos são melhores. Isso significa que o tempo de resposta medido é pior que a média de todos os dispositivos testados (31 ms). | ||
Cintilação da tela / PWM (modulação por largura de pulso)
| Tela tremeluzindo/PWM detectado | 800 Hz | ≤ 30 % configuração de brilho | 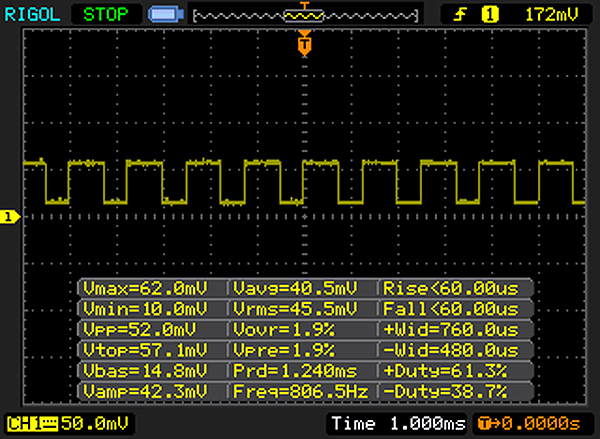 |
A luz de fundo da tela pisca em 800 Hz (pior caso, por exemplo, utilizando PWM) Cintilação detectada em uma configuração de brilho de 30 % e abaixo. Não deve haver cintilação ou PWM acima desta configuração de brilho. A frequência de 800 Hz é bastante alta, então a maioria dos usuários sensíveis ao PWM não deve notar nenhuma oscilação. [pwm_comparison] Em comparação: 52 % de todos os dispositivos testados não usam PWM para escurecer a tela. Se PWM foi detectado, uma média de 7763 (mínimo: 5 - máximo: 343500) Hz foi medida. | |||
| PCMark 8 Home Score Accelerated v2 | 2925 pontos | |
| PCMark 8 Work Score Accelerated v2 | 4156 pontos | |
| PCMark 10 Score | 2312 pontos | |
Ajuda | ||
| Lenovo ThinkPad A275 Samsung PM961 MZVLW256HEHP | HP EliteBook 820 G3 Samsung SM951 MZVPV256HDGL m.2 PCI-e | Lenovo ThinkPad X260-20F6007RGE Liteonit LCH-512V2S | Lenovo Thinkpad 13-20J1001BUS | HP EliteBook 725 G4 Samsung PM961 MZVLW256HEHP | |
|---|---|---|---|---|---|
| CrystalDiskMark 3.0 | 106% | 18% | -7% | 12% | |
| Read Seq (MB/s) | 1196 | 1255 5% | 499.6 -58% | 447.3 -63% | 1963 64% |
| Write Seq (MB/s) | 1133 | 1240 9% | 403 -64% | 331.3 -71% | 1409 24% |
| Read 512 (MB/s) | 943 | 1131 20% | 322.9 -66% | 315.7 -67% | 949 1% |
| Write 512 (MB/s) | 870 | 811 -7% | 372.4 -57% | 247.2 -72% | 890 2% |
| Read 4k (MB/s) | 33.82 | 51 51% | 27.22 -20% | 34.46 2% | 29.75 -12% |
| Write 4k (MB/s) | 46.63 | 134.1 188% | 83.6 79% | 76.1 63% | 47.35 2% |
| Read 4k QD32 (MB/s) | 131.5 | 549 317% | 316.5 141% | 235.3 79% | 139.7 6% |
| Write 4k QD32 (MB/s) | 94.9 | 343.9 262% | 273.1 188% | 162.2 71% | 100.2 6% |

| 3DMark - 1280x720 Cloud Gate Standard Graphics | |
| HP Envy x360 15m-bq121dx | |
| Lenovo IdeaPad 320S-13IKB | |
| Lenovo ThinkPad X260-20F6007RGE | |
| HP EliteBook 820 G3 | |
| Lenovo Thinkpad 13-20J1001BUS | |
| Lenovo ThinkPad A275 | |
| HP EliteBook 725 G4 | |
| 3DMark Cloud Gate Standard Score | 3942 pontos | |
Ajuda | ||
| BioShock Infinite - 1280x720 Very Low Preset | |
| HP Envy x360 15m-bq121dx | |
| Lenovo ThinkPad A275 | |
| Rise of the Tomb Raider - 1024x768 Lowest Preset | |
| HP Envy x360 15m-bq121dx | |
| Lenovo IdeaPad 320S-13IKB | |
| Lenovo ThinkPad A275 | |
| Battlefield 4 - 1024x768 Low Preset | |
| Lenovo ThinkPad A275 | |
| baixo | média | alto | ultra | |
|---|---|---|---|---|
| BioShock Infinite (2013) | 45.4 | 26.9 | 23 | |
| Battlefield 4 (2013) | 29 | 20.1 | 12.6 | |
| Rise of the Tomb Raider (2016) | 21.6 | 13.2 | 7 |
Barulho
| Ocioso |
| 30.15 / 30.4 / 32.4 dB |
| Carga |
| 32.4 / 32.4 dB |
 | ||
30 dB silencioso 40 dB(A) audível 50 dB(A) ruidosamente alto |
||
min: | ||
(+) A temperatura máxima no lado superior é 38.7 °C / 102 F, em comparação com a média de 35.9 °C / 97 F , variando de 21.4 a 59 °C para a classe Subnotebook.
(-) A parte inferior aquece até um máximo de 47 °C / 117 F, em comparação com a média de 39.2 °C / 103 F
(+) Em uso inativo, a temperatura média para o lado superior é 26.5 °C / 80 F, em comparação com a média do dispositivo de 30.8 °C / ### class_avg_f### F.
(+) Os apoios para as mãos e o touchpad são mais frios que a temperatura da pele, com um máximo de 29.3 °C / 84.7 F e, portanto, são frios ao toque.
(±) A temperatura média da área do apoio para as mãos de dispositivos semelhantes foi 28.2 °C / 82.8 F (-1.1 °C / -1.9 F).
Lenovo ThinkPad A275 análise de áudio
(-) | alto-falantes não muito altos (###valor### dB)
Graves 100 - 315Hz
(-) | quase nenhum baixo - em média 20% menor que a mediana
(±) | a linearidade dos graves é média (13.8% delta para a frequência anterior)
Médios 400 - 2.000 Hz
(+) | médios equilibrados - apenas 4% longe da mediana
(±) | a linearidade dos médios é média (13% delta para frequência anterior)
Altos 2 - 16 kHz
(+) | agudos equilibrados - apenas 2.5% longe da mediana
(±) | a linearidade dos máximos é média (9.7% delta para frequência anterior)
Geral 100 - 16.000 Hz
(±) | a linearidade do som geral é média (22.8% diferença em relação à mediana)
Comparado com a mesma classe
» 78% de todos os dispositivos testados nesta classe foram melhores, 4% semelhantes, 18% piores
» O melhor teve um delta de 5%, a média foi 18%, o pior foi 53%
Comparado com todos os dispositivos testados
» 67% de todos os dispositivos testados foram melhores, 6% semelhantes, 27% piores
» O melhor teve um delta de 4%, a média foi 24%, o pior foi 134%
HP EliteBook 820 G3 análise de áudio
(±) | o volume do alto-falante é médio, mas bom (###valor### dB)
Graves 100 - 315Hz
(-) | quase nenhum baixo - em média 20.2% menor que a mediana
(±) | a linearidade dos graves é média (14.7% delta para a frequência anterior)
Médios 400 - 2.000 Hz
(+) | médios equilibrados - apenas 2% longe da mediana
(+) | médios são lineares (5% delta para frequência anterior)
Altos 2 - 16 kHz
(±) | máximos mais altos - em média 6.7% maior que a mediana
(+) | os máximos são lineares (6.9% delta da frequência anterior)
Geral 100 - 16.000 Hz
(±) | a linearidade do som geral é média (22.1% diferença em relação à mediana)
Comparado com a mesma classe
» 75% de todos os dispositivos testados nesta classe foram melhores, 6% semelhantes, 19% piores
» O melhor teve um delta de 5%, a média foi 18%, o pior foi 53%
Comparado com todos os dispositivos testados
» 64% de todos os dispositivos testados foram melhores, 6% semelhantes, 30% piores
» O melhor teve um delta de 4%, a média foi 24%, o pior foi 134%
Lenovo Thinkpad 13-20J1001BUS análise de áudio
(±) | o volume do alto-falante é médio, mas bom (###valor### dB)
Graves 100 - 315Hz
(-) | quase nenhum baixo - em média 16.8% menor que a mediana
(±) | a linearidade dos graves é média (14.7% delta para a frequência anterior)
Médios 400 - 2.000 Hz
(+) | médios equilibrados - apenas 2.1% longe da mediana
(+) | médios são lineares (6.3% delta para frequência anterior)
Altos 2 - 16 kHz
(+) | agudos equilibrados - apenas 2.5% longe da mediana
(±) | a linearidade dos máximos é média (8.4% delta para frequência anterior)
Geral 100 - 16.000 Hz
(±) | a linearidade do som geral é média (18.4% diferença em relação à mediana)
Comparado com a mesma classe
» 33% de todos os dispositivos testados nesta classe foram melhores, 7% semelhantes, 60% piores
» O melhor teve um delta de 7%, a média foi 21%, o pior foi 53%
Comparado com todos os dispositivos testados
» 41% de todos os dispositivos testados foram melhores, 8% semelhantes, 52% piores
» O melhor teve um delta de 4%, a média foi 24%, o pior foi 134%
| desligado | |
| Ocioso | |
| Carga |
|
Key:
min: | |
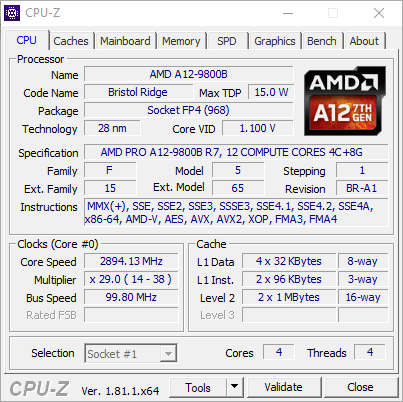
| Lenovo ThinkPad A275 PRO A12-9800B, Radeon R7 (Bristol Ridge), Samsung PM961 MZVLW256HEHP, TN, 1366x768, 12.5" | HP EliteBook 820 G3 6300U, HD Graphics 520, Samsung SM951 MZVPV256HDGL m.2 PCI-e, TN LED, 1366x768, 12.5" | Lenovo ThinkPad X260-20F6007RGE 6500U, HD Graphics 520, Liteonit LCH-512V2S, IPS, 1920x1080, 12.5" | Lenovo Thinkpad 13-20J1001BUS i3-7100U, HD Graphics 620, , IPS, 1920x1080, 13.3" | HP EliteBook 725 G4 PRO A12-9800B, Radeon R7 (Bristol Ridge), Samsung PM961 MZVLW256HEHP, IPS, 1920x1080, 12.5" | |
|---|---|---|---|---|---|
| Power Consumption | 21% | 17% | 28% | 12% | |
| Idle Minimum * (Watt) | 4.2 | 3.5 17% | 3.5 17% | 3.5 17% | 4.5 -7% |
| Idle Average * (Watt) | 8.2 | 5.4 34% | 5.5 33% | 5.7 30% | 6.3 23% |
| Idle Maximum * (Watt) | 10 | 6.2 38% | 6.7 33% | 6.2 38% | 8.3 17% |
| Load Average * (Watt) | 34.5 | 27.3 21% | 28.9 16% | 24.1 30% | 27.6 20% |
| Load Maximum * (Watt) | 37 | 39.5 -7% | 42.1 -14% | 28.5 23% | 34.5 7% |
* ... menor é melhor
| Lenovo ThinkPad A275 PRO A12-9800B, Radeon R7 (Bristol Ridge), 71 Wh | HP EliteBook 820 G3 6300U, HD Graphics 520, 44 Wh | Lenovo ThinkPad X260-20F6007RGE 6500U, HD Graphics 520, 46 Wh | Lenovo Thinkpad 13-20J1001BUS i3-7100U, HD Graphics 620, 42 Wh | HP EliteBook 725 G4 PRO A12-9800B, Radeon R7 (Bristol Ridge), 49 Wh | |
|---|---|---|---|---|---|
| Duração da bateria | -29% | -24% | -14% | -35% | |
| Reader / Idle (h) | 16 | 13.8 -14% | 15.9 -1% | 16.5 3% | 11.7 -27% |
| WiFi v1.3 (h) | 9 | 6.2 -31% | 8.4 -7% | 9.7 8% | 6.3 -30% |
| Load (h) | 4.1 | 2.4 -41% | 1.5 -63% | 1.9 -54% | 2.1 -49% |
| H.264 (h) | 8.3 | 7.8 | 5.7 |
Pro
Contra
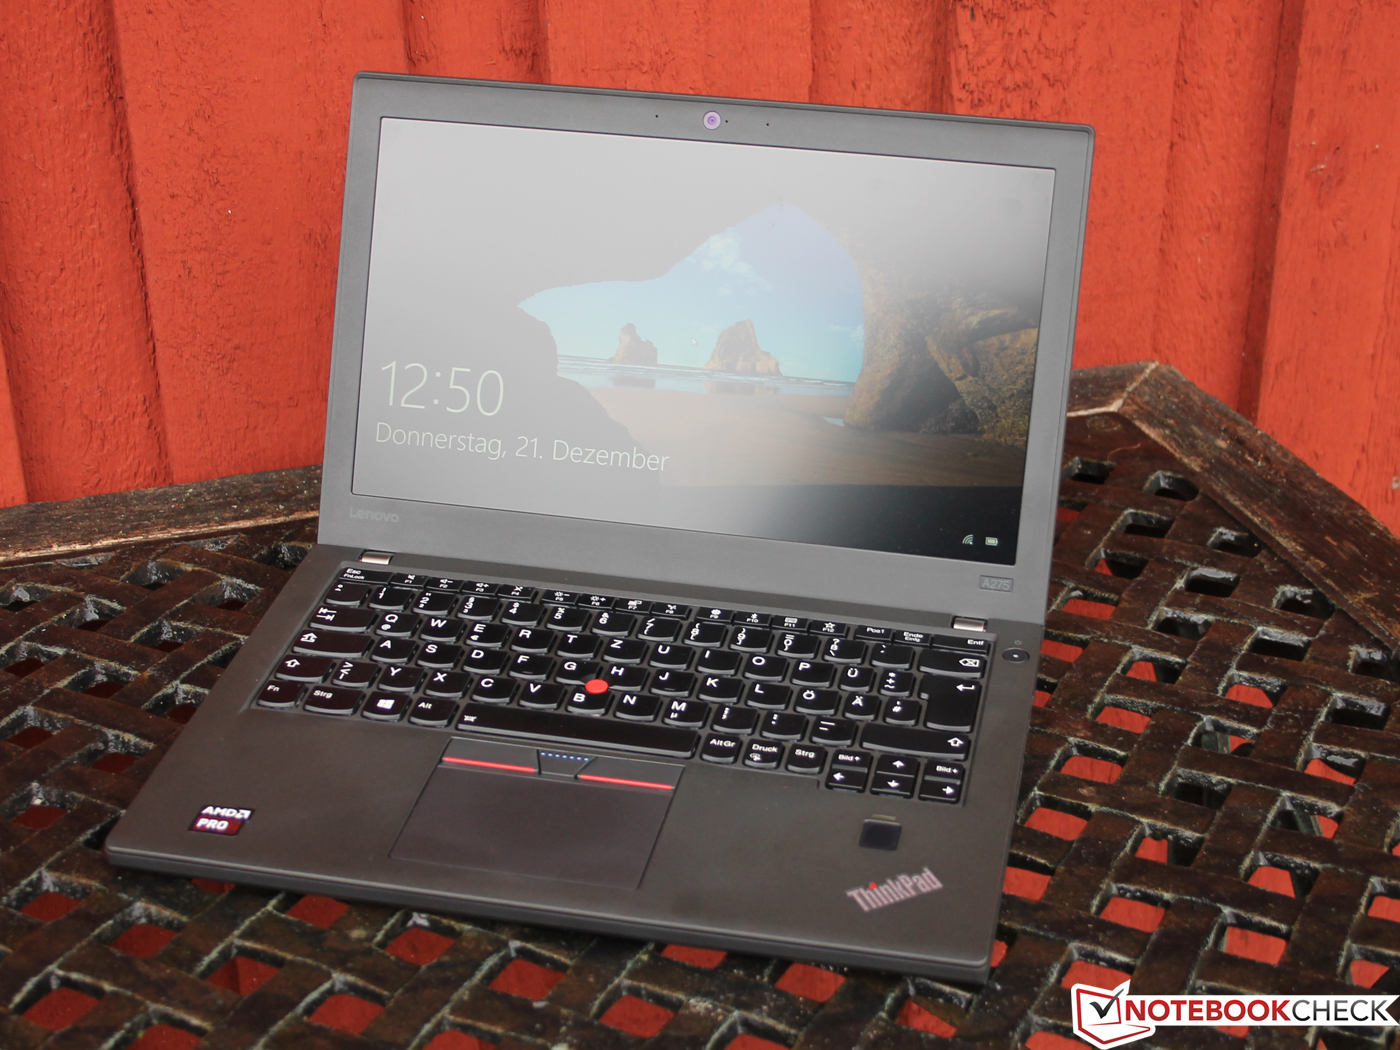
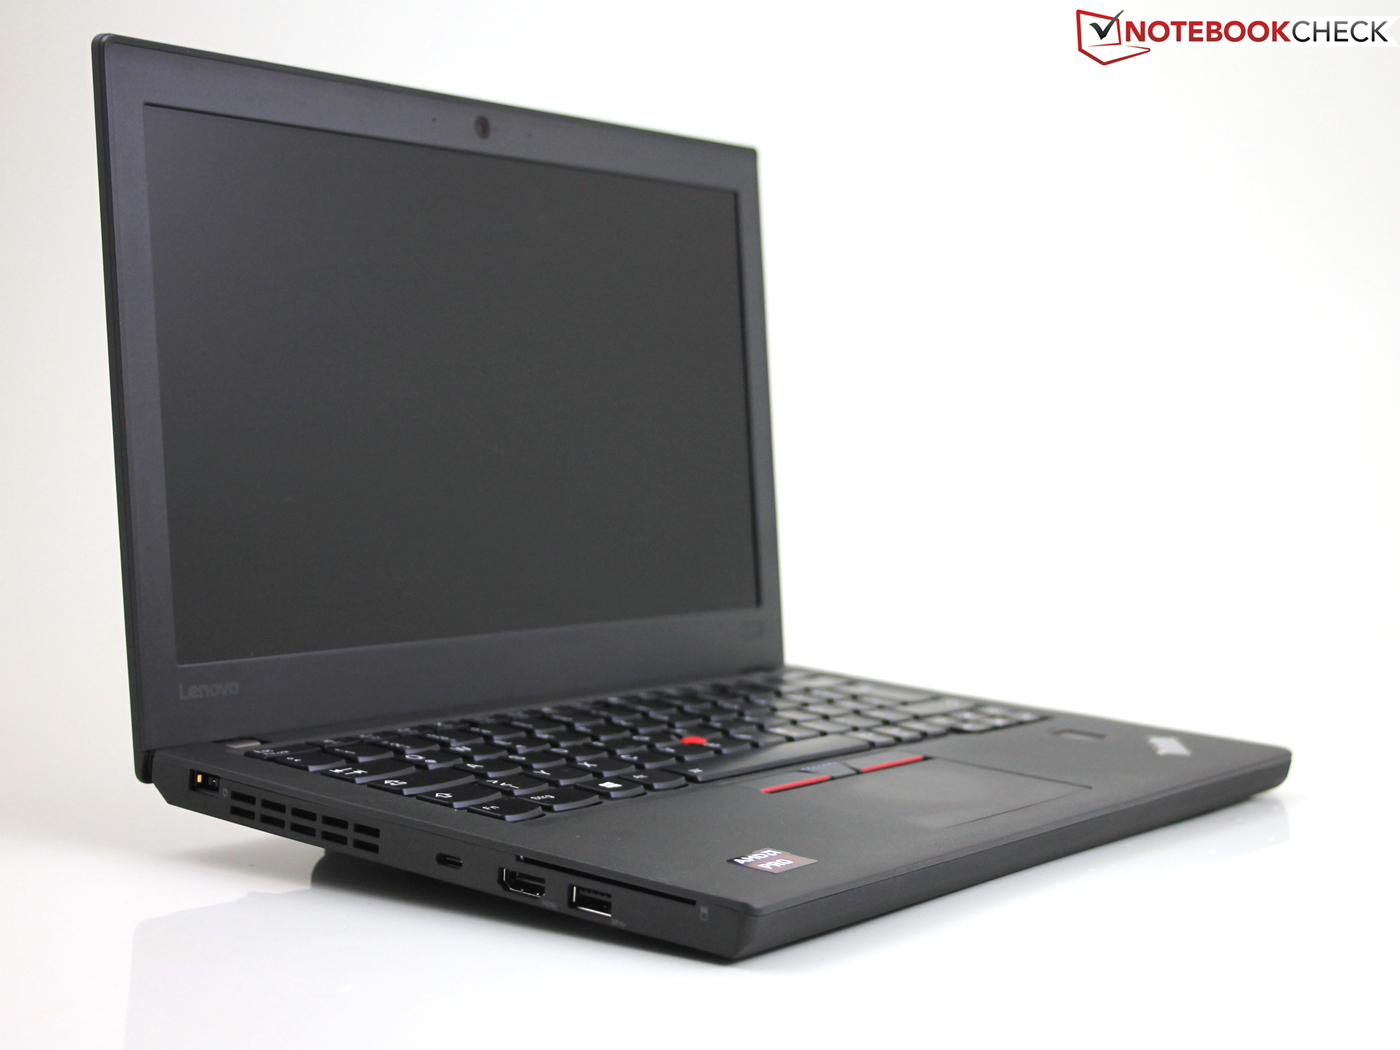
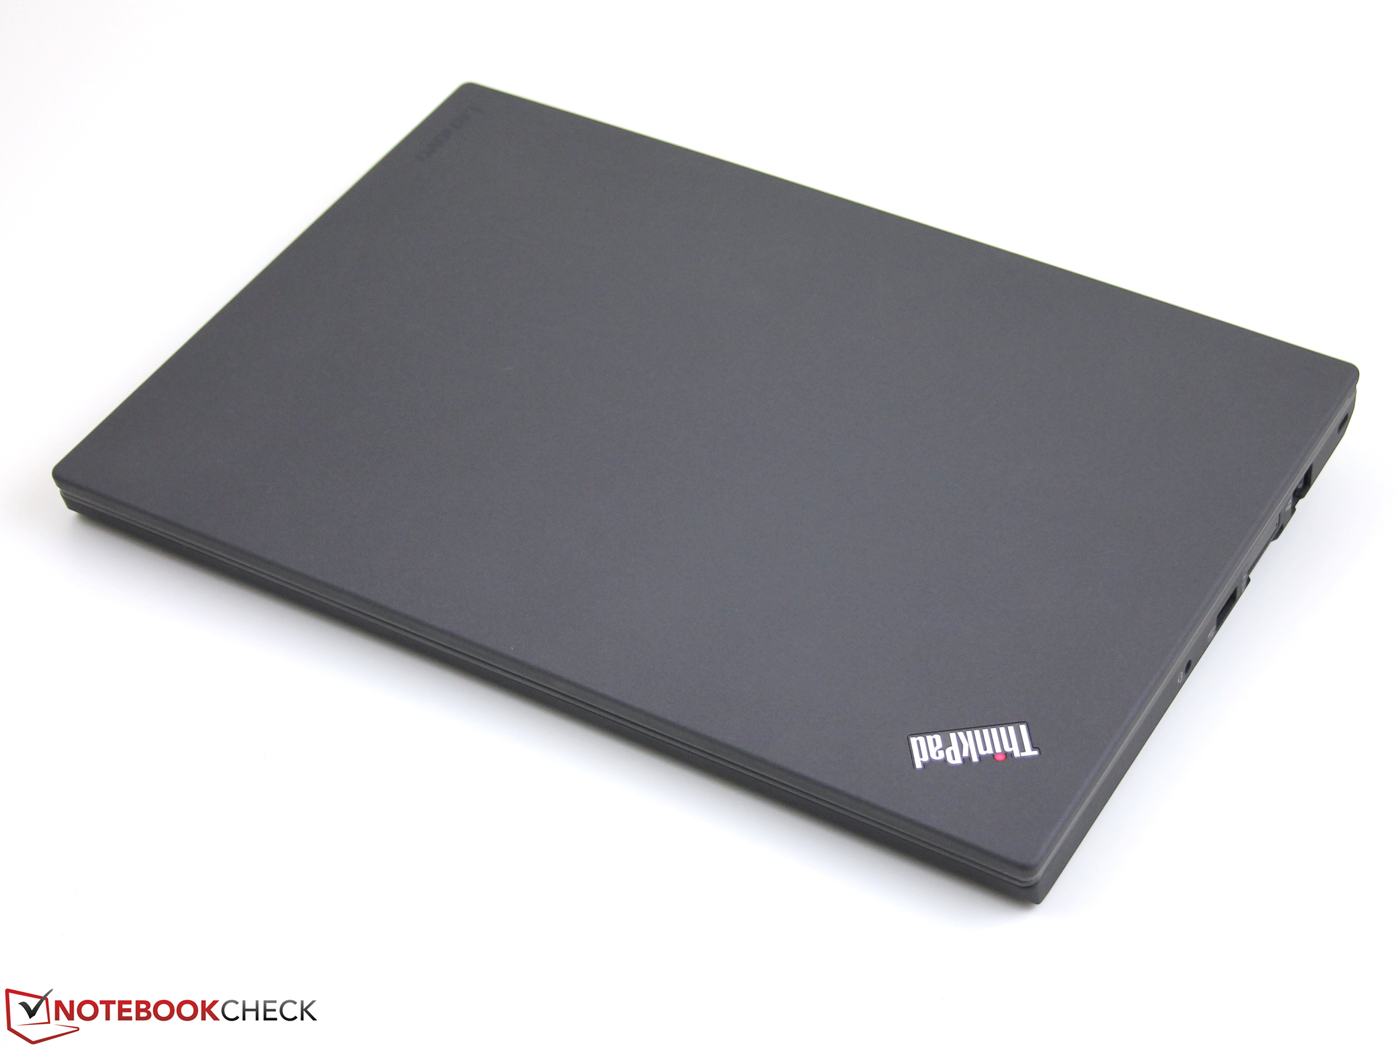
O A275 certamente não é um sucessor da série ThinkPad Edge. Embora a qualidade da construção seja um pouco reminiscente da série Edge Edge descontinuada e ficamos muito decepcionados com a falta de rigidez da base, as outras qualidades do A275 foram bastante impressionantes. Isso é, assumindo que você opte pelo painel FHD, caso em que o A275 esteja no mesmo nível de outros subportáteis de gama média, como o ThinkPad 13 ou o X260 .
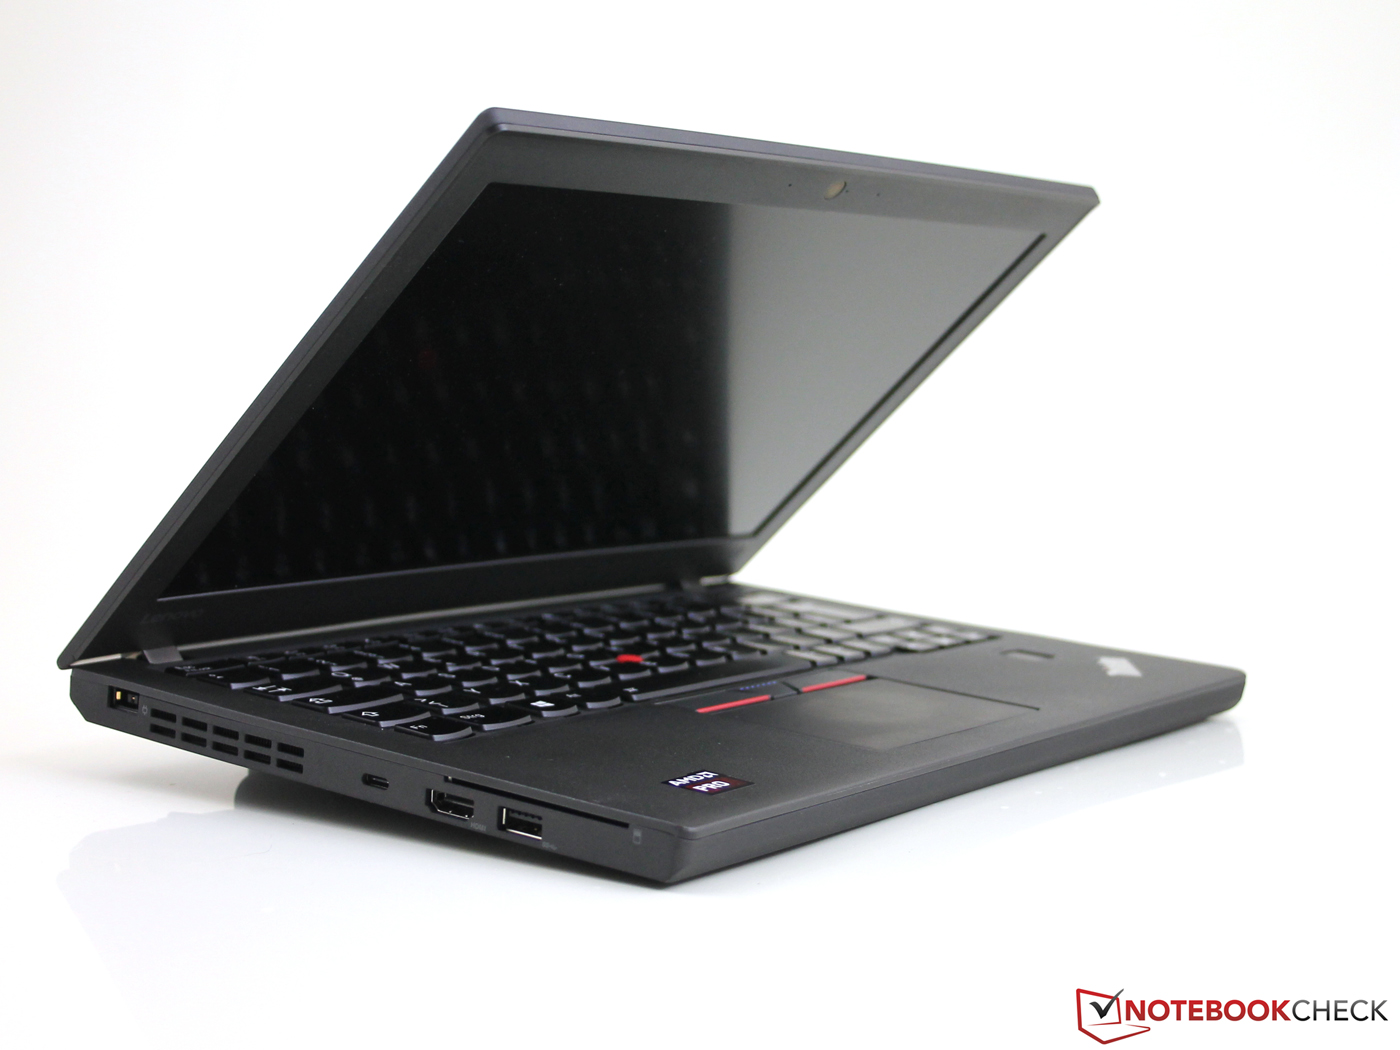
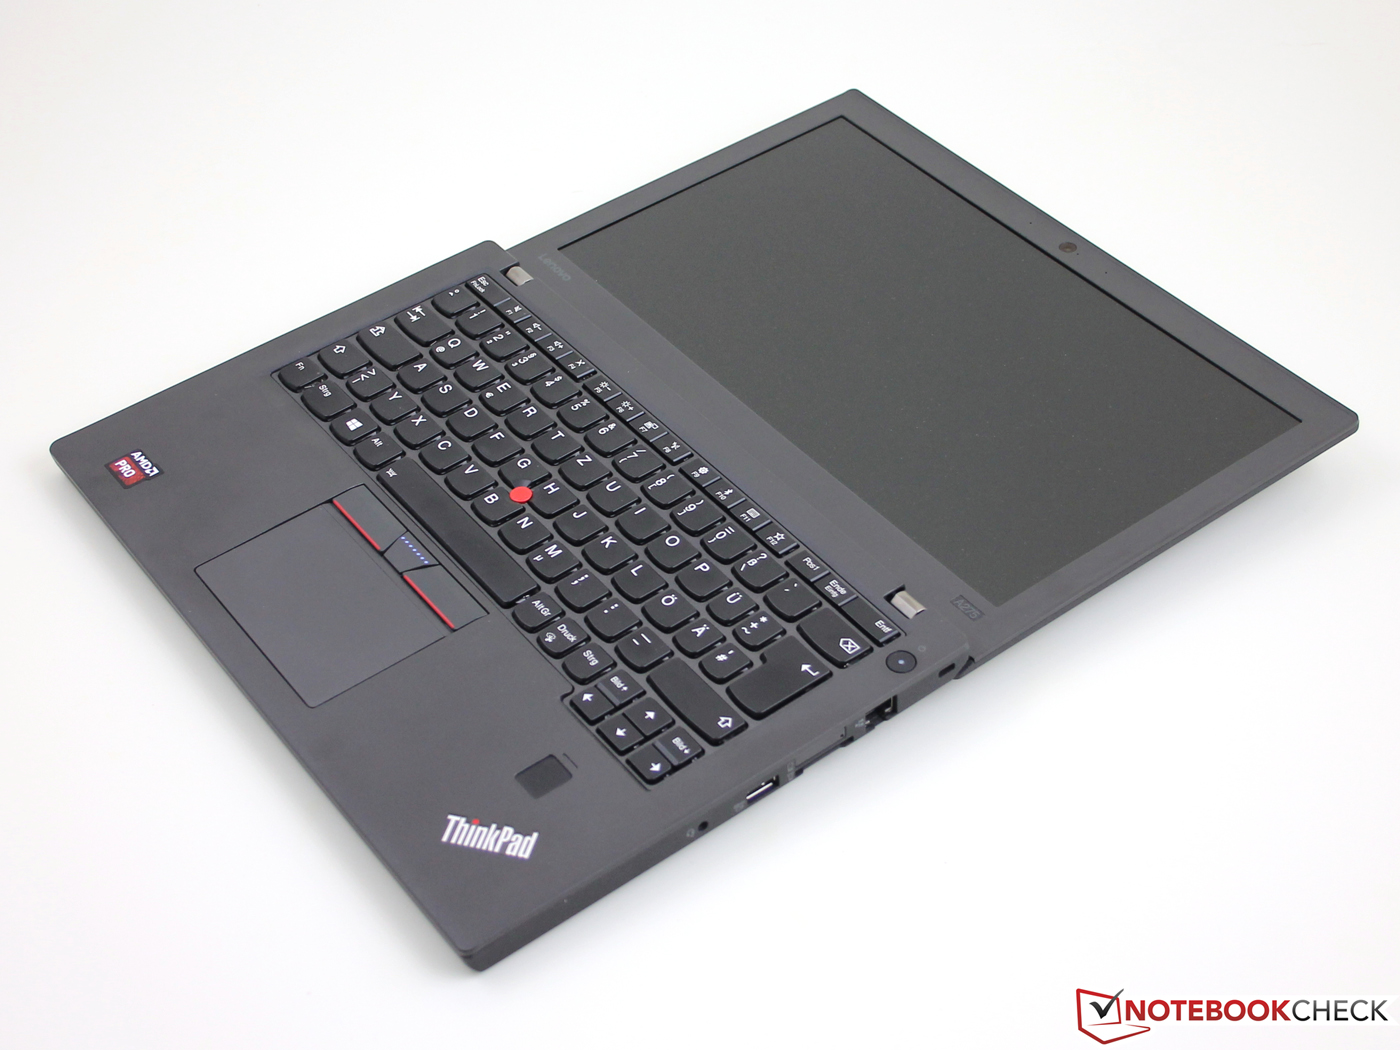
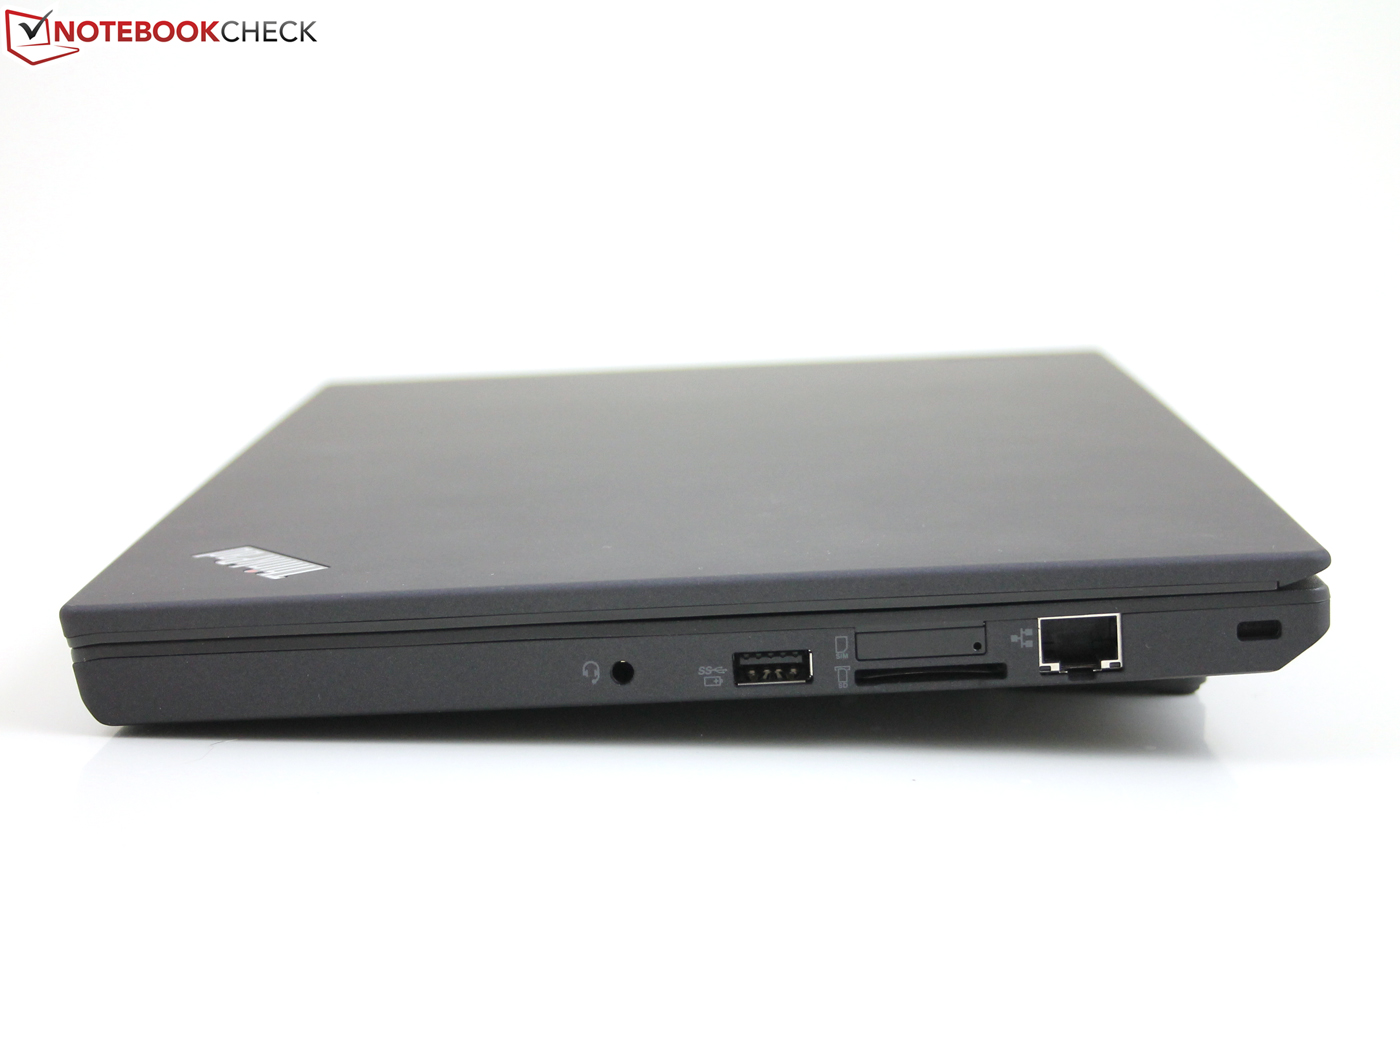
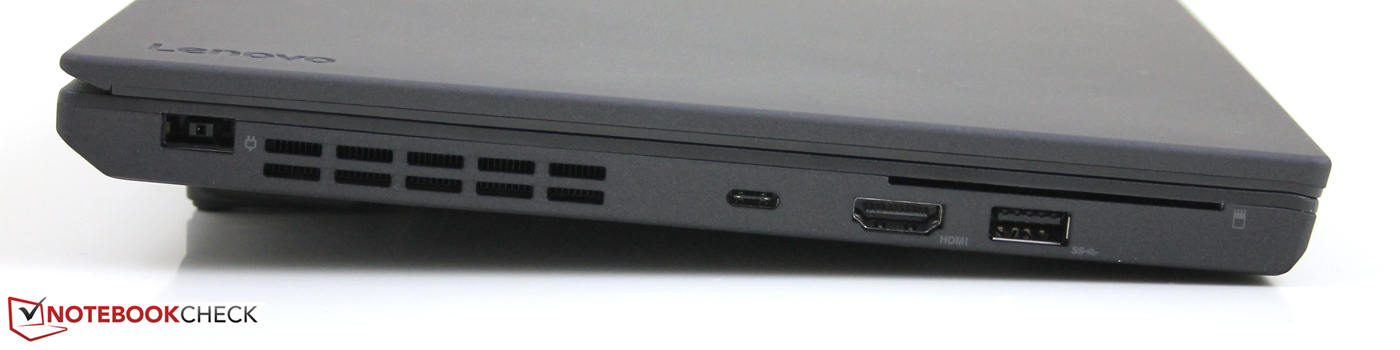
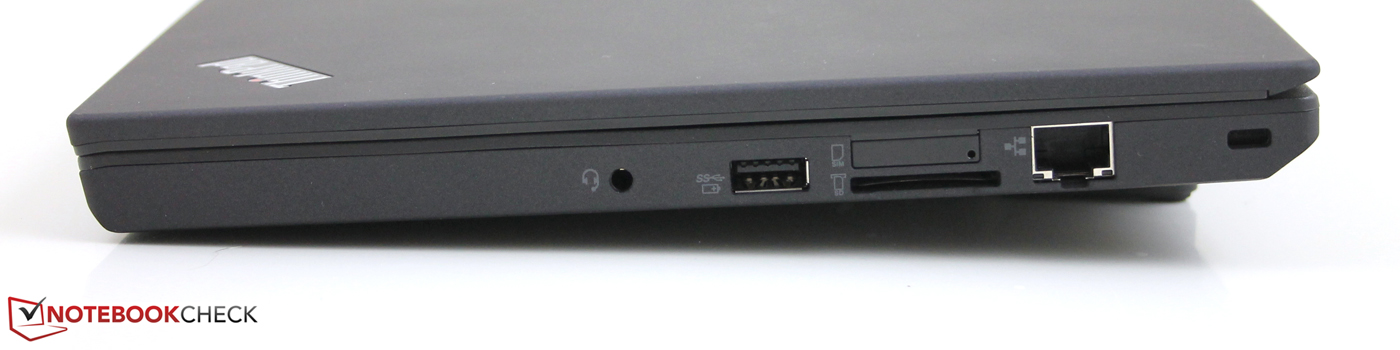
O que mais nos impressionou são os dispositivos de entrada de classe alta que são 95% semelhantes ao ThinkPad 13 em termos de feedback e layout. A seleção das portas também é excelente, com Ethernet, 3 USB 3.0 Gen. 1, e DisplayPort, além do suporte para a porta USB Type-C. Os recursos de segurança incluem um leitor de digitais, rápido e confiável, um leitor de cartões inteligentes e um chip TPM 2.0.
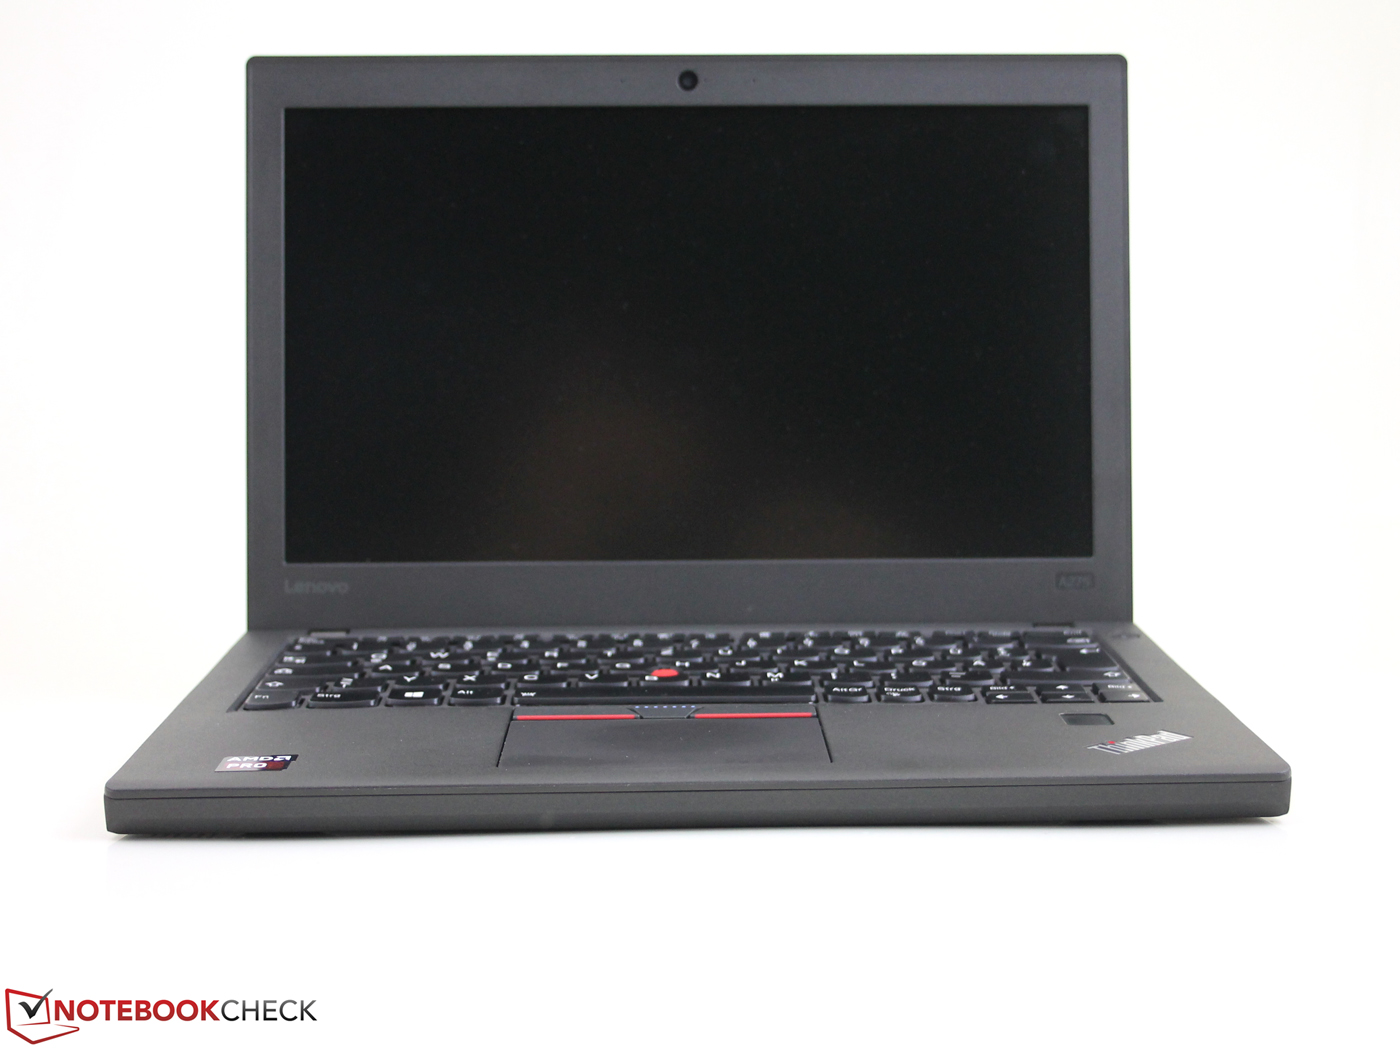
A maior desvantagem foi, de longe, a tela HD baseada em painel TN. Recomendamos insistentemente que, em vez disso, você opte pelo painel FHD - ele se adequa muito melhor ao preço do que o painel HD.
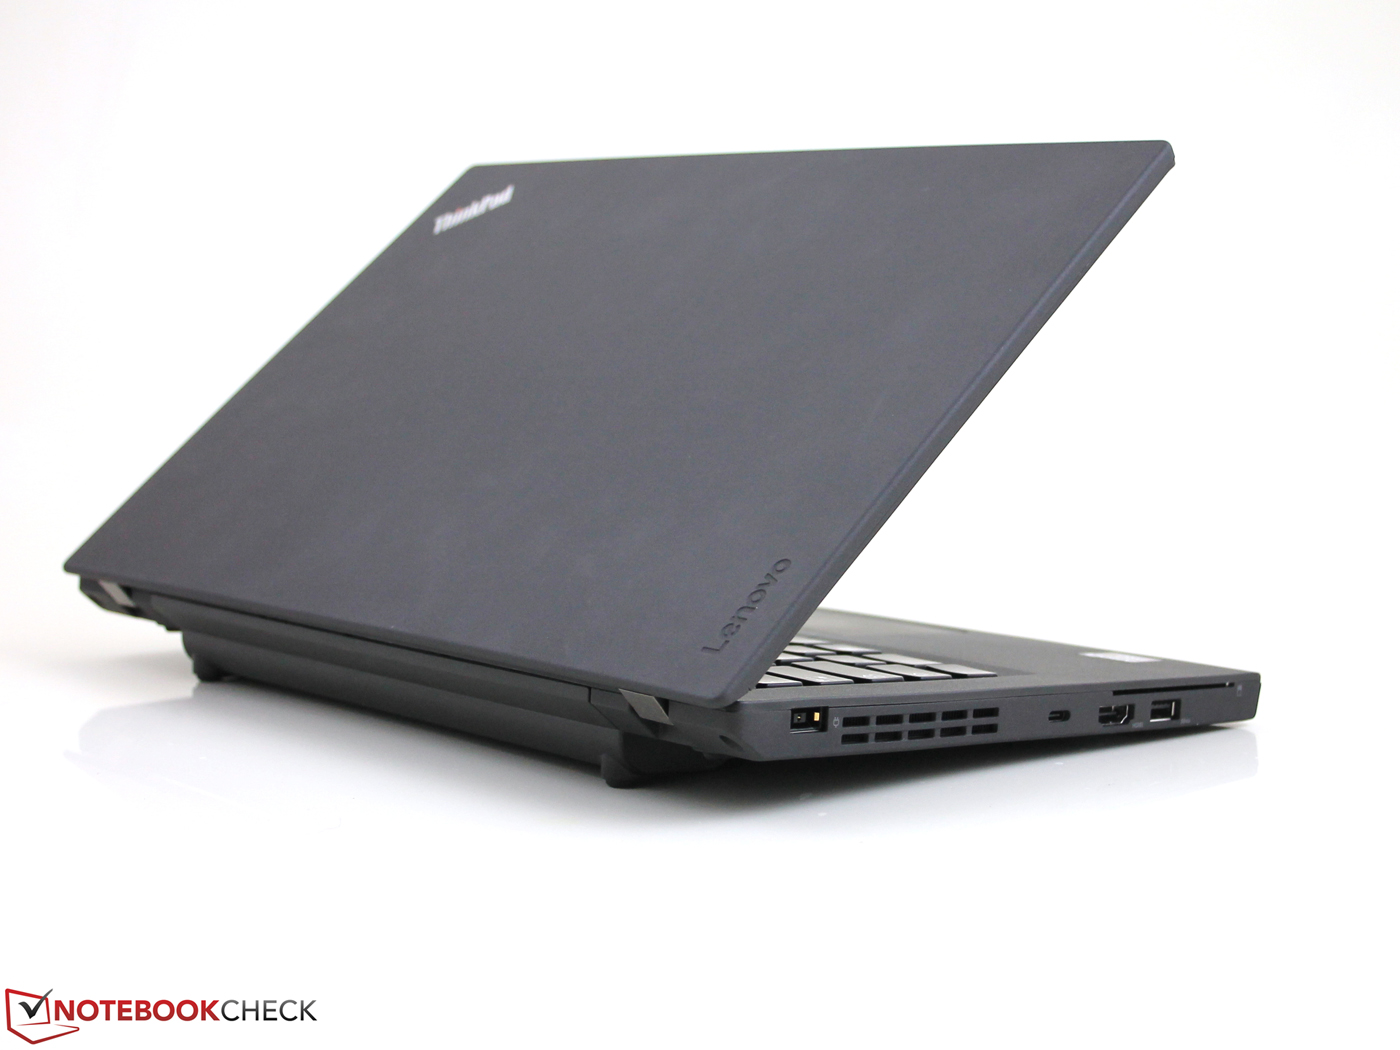
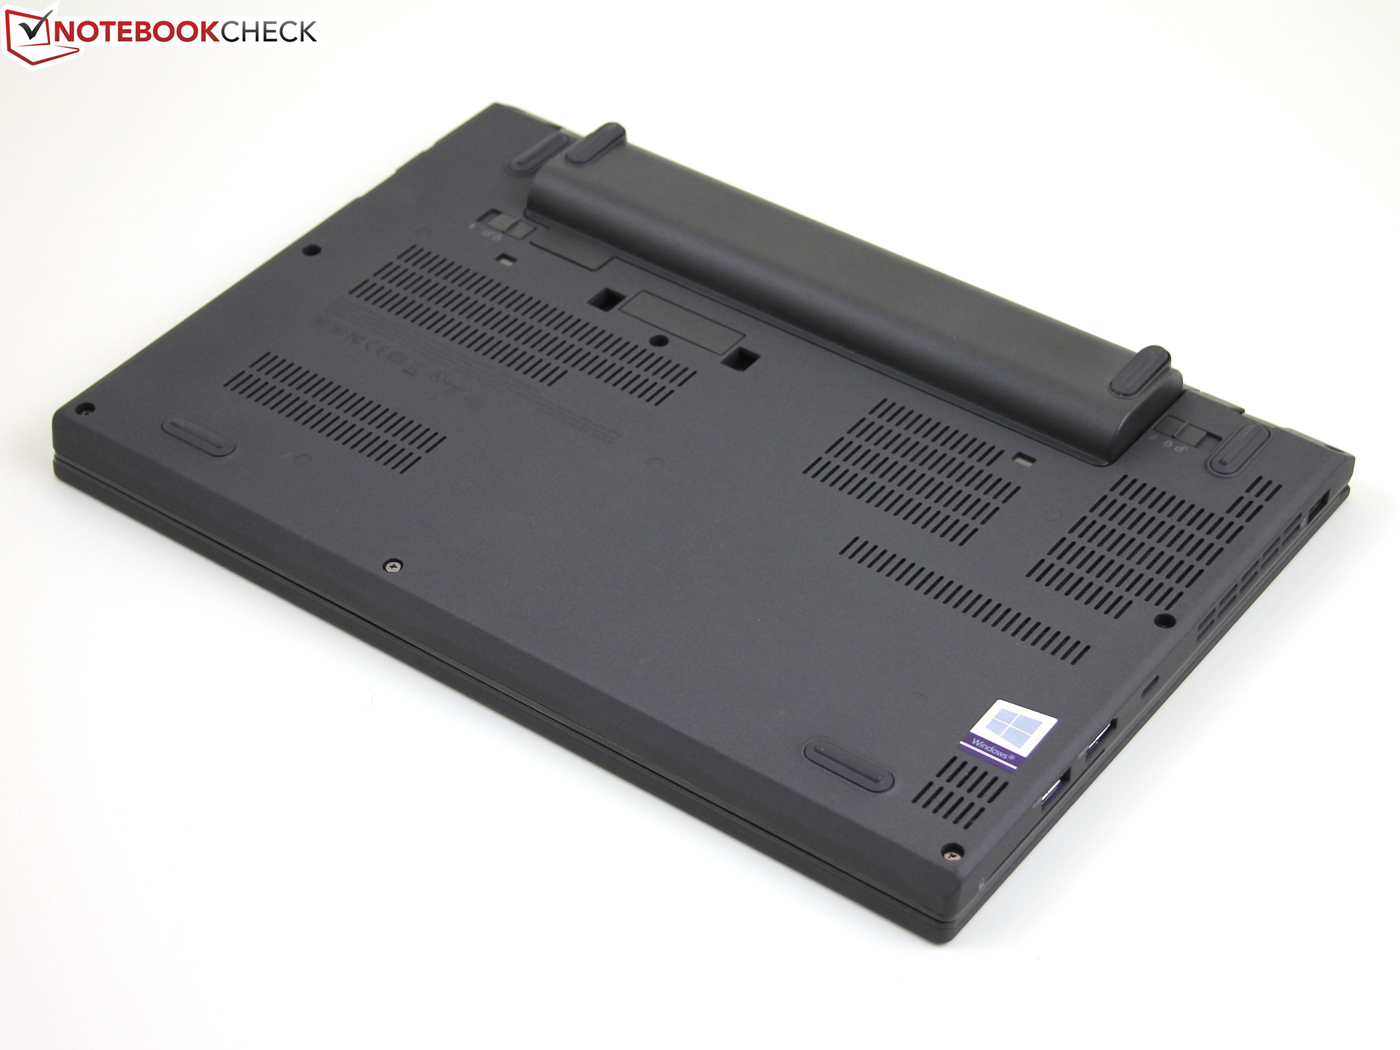
A manutenção também é um pouco confusa. Enquanto a bateria externa pode ser trocada a quente graças à bateria primária não substituível integrada 23-Wh, o A275 não possui uma escotilha de manutenção dedicada. Toda a carcaça superior deve ser removida para acessar o SSD (M.2), o ventilador ou o único slot de RAM.
Em tudo, o A275 é certamente um cavalo de trabalho decente com qualidades incontestáveis, como a duração da bateria de 9 horas no nosso teste Wi-Fi, seus excelentes dispositivos de entrada, sua infinidade de portas e seus recursos de segurança. No entanto, em mais de $1.000, achamos é um pouco caro, considerando o lento e, neste ponto também desatualizado, SoC AMD Bristol Ridge.
O HP EliteBook 820 G3 equipado com um processador i5-6200U Skylake pode ser adquirido por menos de $1.000, e também o ThinkPad 13 G2 equipado com i5-7200U.
Estamos tendo sérios problemas para encontrar motivos convincentes para comprar este portátil, além do fato de que o EliteBook 725 G4 baseado em Bristol Ridge custa quase o mesmo. No entanto, consideramos que o portátil também é muito caro. Um preço de menos de $1.000 seria mais razoável para superar o desempenho significativamente mais lento.
Lenovo ThinkPad A275
- 12/21/2017 v6 (old)
Sebastian Jentsch
Price comparison
