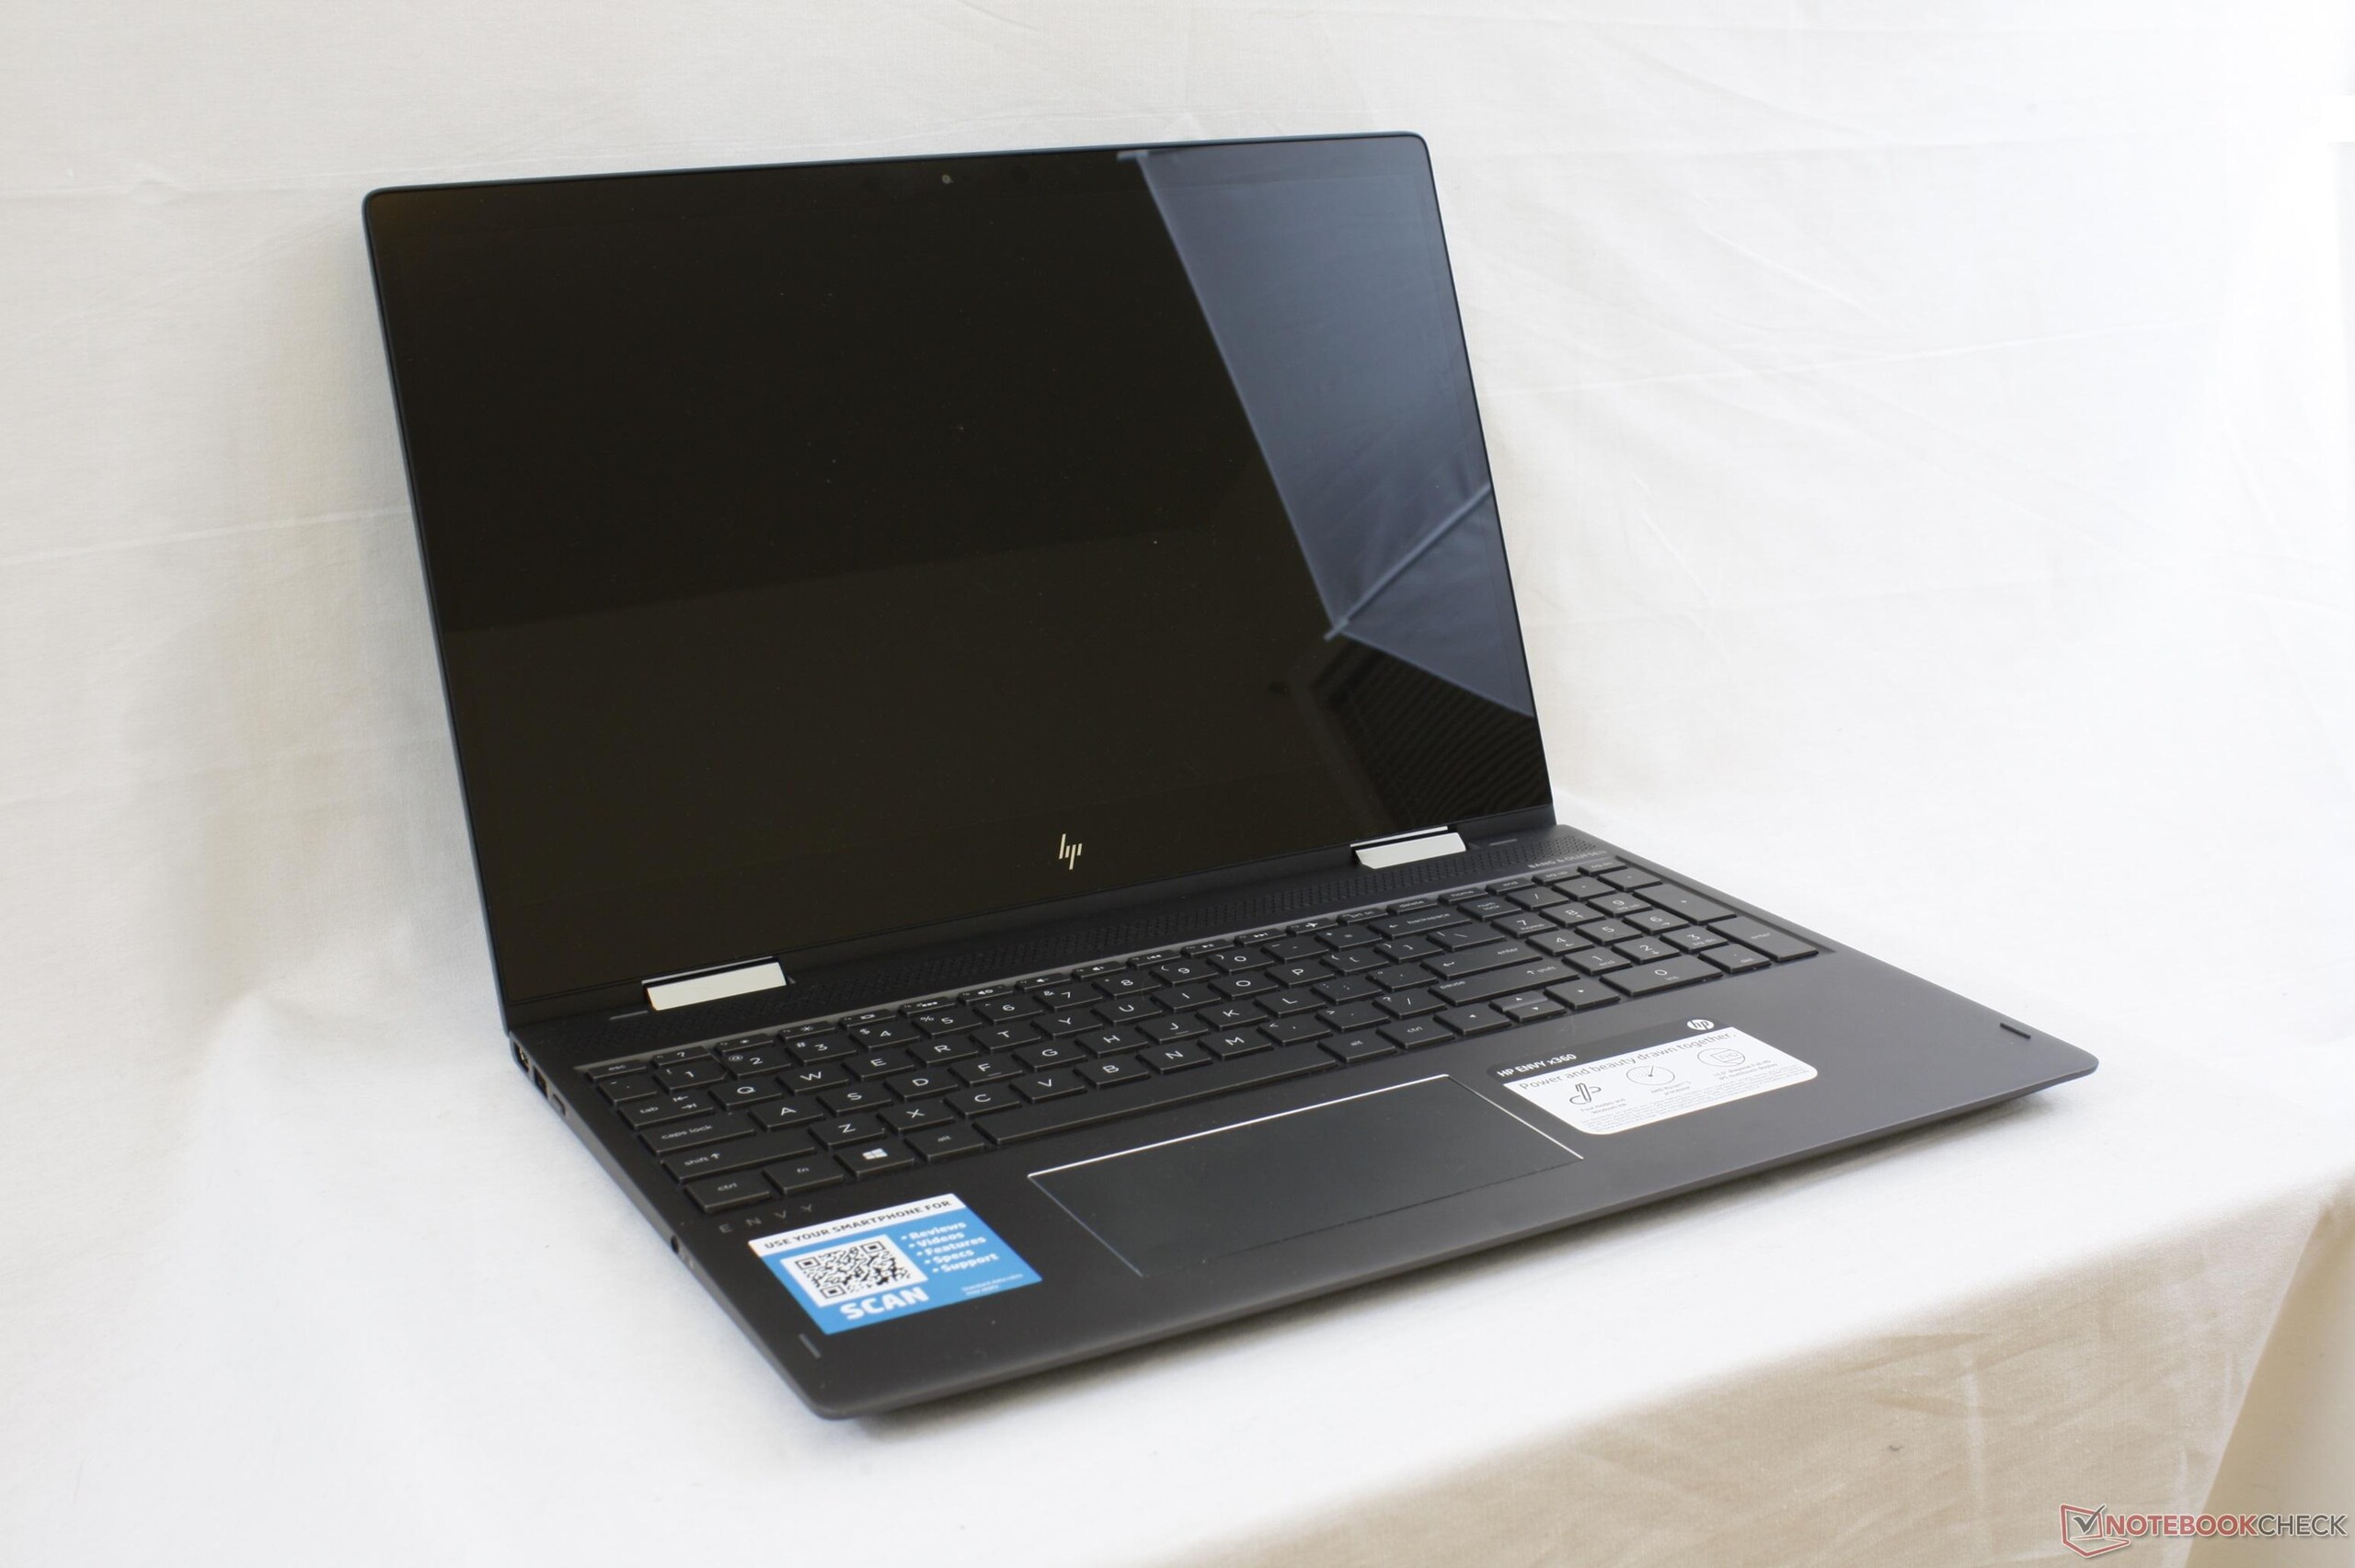
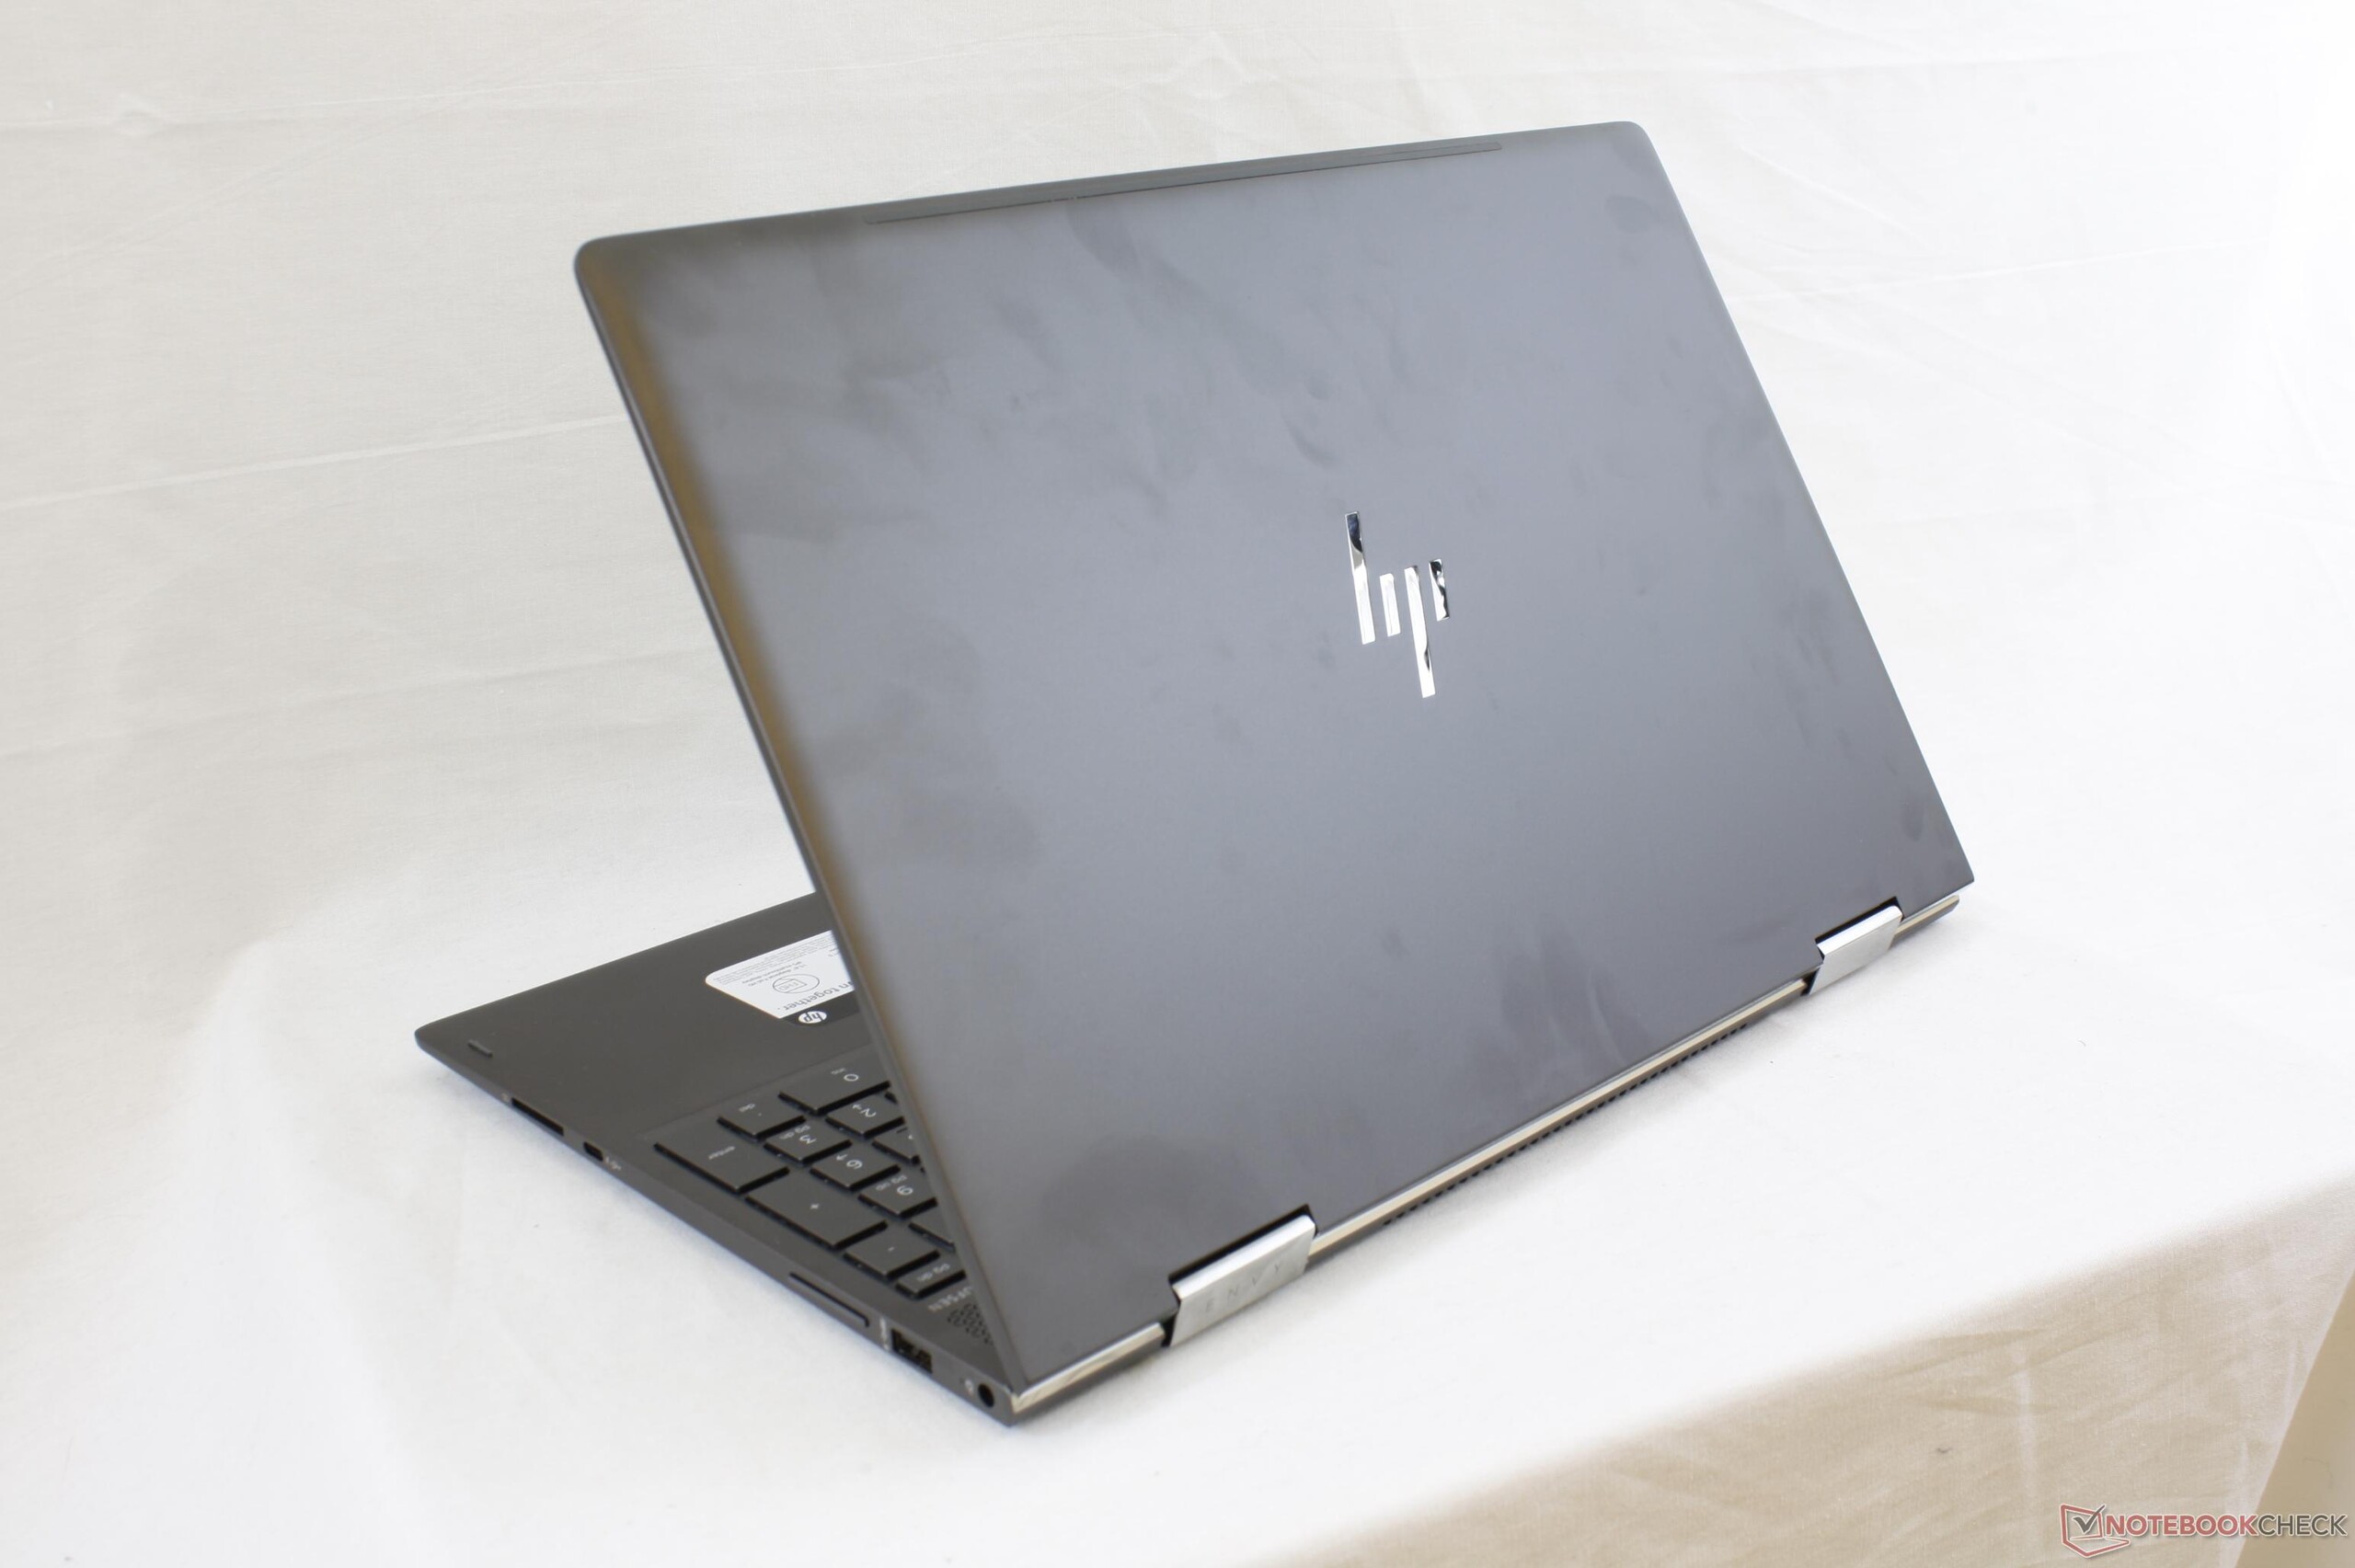
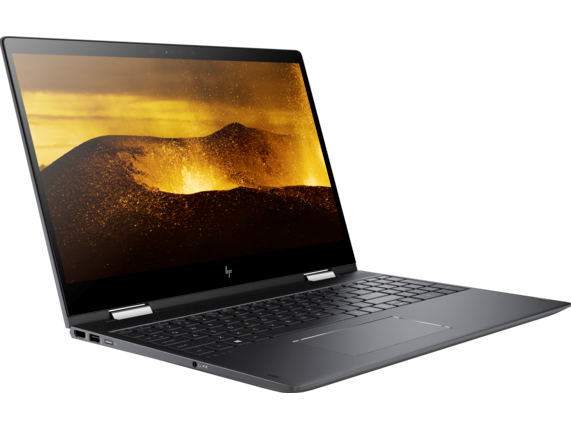
Breve Análise do Portátil HP Envy x360 15 (Ryzen 5 2500U, Radeon Vega 8)

| SD Card Reader | |
| average JPG Copy Test (av. of 3 runs) | |
| HP Spectre x360 15-bl002xx | |
| Dell XPS 15 9560 (i7-7700HQ, UHD) | |
| HP Envy x360 15m-bq121dx | |
| MSI GS63VR 7RF-228US | |
| maximum AS SSD Seq Read Test (1GB) | |
| Dell XPS 15 9560 (i7-7700HQ, UHD) | |
| HP Spectre x360 15-bl002xx | |
| HP Envy x360 15m-bq121dx | |
| MSI GS63VR 7RF-228US | |
| |||||||||||||||||||||||||
iluminação: 88 %
iluminação com acumulador: 230.2 cd/m²
Contraste: 1151:1 (Preto: 0.2 cd/m²)
ΔE ColorChecker Calman: 5.7 | ∀{0.5-29.43 Ø4.71}
ΔE Greyscale Calman: 2.6 | ∀{0.09-98 Ø4.96}
57.9% sRGB (Argyll 1.6.3 3D)
37.5% AdobeRGB 1998 (Argyll 1.6.3 3D)
41.29% AdobeRGB 1998 (Argyll 3D)
58.3% sRGB (Argyll 3D)
39.97% Display P3 (Argyll 3D)
Gamma: 2.2
CCT: 6109 K
| HP Envy x360 15m-bq121dx ID: BOE06F9, IPS, 15.6", 1920x1080 | HP Spectre x360 15-bl002xx UHD UWVA eDP BrightView WLED-backlit , IPS, 15.6", 3840x2160 | HP Envy x360 15t-w200 BOE0679 , IPS, 15.6", 1920x1080 | Dell XPS 15 9560 (i7-7700HQ, UHD) IGZO IPS, 15.6", 3840x2160 | Lenovo Yoga 720-15IKB-80X7 Chi Mei CMN N156HCE-EN1, IPS, 15.6", 1920x1080 | |
|---|---|---|---|---|---|
| Display | 59% | 9% | 113% | 59% | |
| Display P3 Coverage (%) | 39.97 | 67.9 70% | 43.31 8% | 89.7 124% | 65 63% |
| sRGB Coverage (%) | 58.3 | 88.2 51% | 65 11% | 100 72% | 90.8 56% |
| AdobeRGB 1998 Coverage (%) | 41.29 | 64.4 56% | 44.75 8% | 100 142% | 65.8 59% |
| Response Times | -29% | -34% | -52% | 13% | |
| Response Time Grey 50% / Grey 80% * (ms) | 30.8 ? | 44 ? -43% | 56 ? -82% | 57.2 ? -86% | 29.6 ? 4% |
| Response Time Black / White * (ms) | 33.6 ? | 38.8 ? -15% | 28.8 ? 14% | 39.2 ? -17% | 26.4 ? 21% |
| PWM Frequency (Hz) | 201.6 ? | 1000 ? | 201.6 | 962 | 25510 ? |
| Screen | 36% | 0% | 21% | 6% | |
| Brightness middle (cd/m²) | 230.2 | 351.5 53% | 204.9 -11% | 370.1 61% | 300.9 31% |
| Brightness (cd/m²) | 222 | 336 51% | 190 -14% | 356 60% | 285 28% |
| Brightness Distribution (%) | 88 | 83 -6% | 82 -7% | 87 -1% | 92 5% |
| Black Level * (cd/m²) | 0.2 | 0.24 -20% | 0.203 -1% | 0.37 -85% | 0.24 -20% |
| Contrast (:1) | 1151 | 1465 27% | 1009 -12% | 1000 -13% | 1254 9% |
| Colorchecker dE 2000 * | 5.7 | 3.3 42% | 4.7 18% | 5.3 7% | 5 12% |
| Colorchecker dE 2000 max. * | 20.8 | 7.3 65% | 9.03 57% | 9.9 52% | 10.2 51% |
| Greyscale dE 2000 * | 2.6 | 1.9 27% | 3.86 -48% | 4.6 -77% | 7 -169% |
| Gamma | 2.2 100% | 2.09 105% | 2.36 93% | 2.31 95% | 2.34 94% |
| CCT | 6109 106% | 6784 96% | 6834 95% | 6284 103% | 6578 99% |
| Color Space (Percent of AdobeRGB 1998) (%) | 37.5 | 64.4 72% | 41 9% | 88.3 135% | 59 57% |
| Color Space (Percent of sRGB) (%) | 57.9 | 88.2 52% | 64 11% | 100 73% | 90 55% |
| Média Total (Programa/Configurações) | 22% /
32% | -8% /
-3% | 27% /
30% | 26% /
17% |
* ... menor é melhor
Exibir tempos de resposta
| ↔ Tempo de resposta preto para branco | ||
|---|---|---|
| 33.6 ms ... ascensão ↗ e queda ↘ combinadas | ↗ 18 ms ascensão | 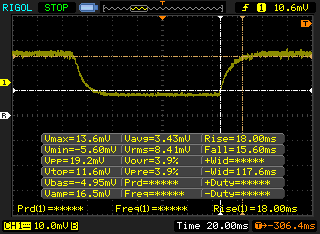 |
| ↘ 15.6 ms queda | ||
| A tela mostra taxas de resposta lentas em nossos testes e será insatisfatória para os jogadores. Em comparação, todos os dispositivos testados variam de 0.1 (mínimo) a 240 (máximo) ms. » 90 % de todos os dispositivos são melhores. Isso significa que o tempo de resposta medido é pior que a média de todos os dispositivos testados (19.8 ms). | ||
| ↔ Tempo de resposta 50% cinza a 80% cinza | ||
| 30.8 ms ... ascensão ↗ e queda ↘ combinadas | ↗ 14 ms ascensão | 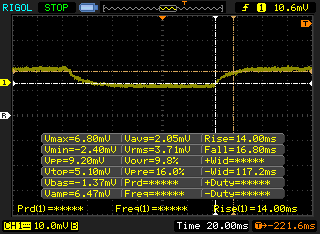 |
| ↘ 16.8 ms queda | ||
| A tela mostra taxas de resposta lentas em nossos testes e será insatisfatória para os jogadores. Em comparação, todos os dispositivos testados variam de 0.165 (mínimo) a 636 (máximo) ms. » 41 % de todos os dispositivos são melhores. Isso significa que o tempo de resposta medido é semelhante à média de todos os dispositivos testados (31 ms). | ||
Cintilação da tela / PWM (modulação por largura de pulso)
| Tela tremeluzindo/PWM detectado | 201.6 Hz | ≤ 99 % configuração de brilho | 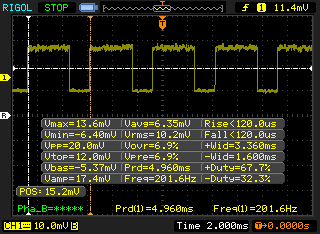 |
A luz de fundo da tela pisca em 201.6 Hz (pior caso, por exemplo, utilizando PWM) Cintilação detectada em uma configuração de brilho de 99 % e abaixo. Não deve haver cintilação ou PWM acima desta configuração de brilho. A frequência de 201.6 Hz é relativamente baixa, portanto, usuários sensíveis provavelmente notarão cintilação e sentirão fadiga ocular na configuração de brilho indicada e abaixo. [pwm_comparison] Em comparação: 52 % de todos os dispositivos testados não usam PWM para escurecer a tela. Se PWM foi detectado, uma média de 7757 (mínimo: 5 - máximo: 343500) Hz foi medida. | |||
| Cinebench R15 | |
| CPU Single 64Bit | |
| Microsoft Surface Laptop i7 | |
| HP Spectre x360 15t-bl100 | |
| 1300X Nvidia GeForce GTX 1080 Ti FE Asus Prime B350-PLUS | |
| Lenovo ThinkPad 25 | |
| Xiaomi Mi Notebook Pro i5 | |
| MSI GF62VR 7RF-877 | |
| Apple MacBook Pro 13 2017 Touchbar i5 | |
| HP Envy x360 15m-bq121dx | |
| Dell Inspiron 15 7000 7577 | |
| Asus FX550IU-WSFX | |
| CPU Multi 64Bit | |
| MSI GF62VR 7RF-877 | |
| Xiaomi Mi Notebook Pro i5 | |
| HP Envy x360 15m-bq121dx | |
| 1300X Nvidia GeForce GTX 1080 Ti FE Asus Prime B350-PLUS | |
| HP Spectre x360 15t-bl100 | |
| Dell Inspiron 15 7000 7577 | |
| Microsoft Surface Laptop i7 | |
| Apple MacBook Pro 13 2017 Touchbar i5 | |
| Lenovo ThinkPad 25 | |
| Asus FX550IU-WSFX | |
| Cinebench R11.5 | |
| CPU Single 64Bit | |
| Microsoft Surface Laptop i7 | |
| HP Spectre x360 15t-bl100 | |
| MSI GF62VR 7RF-877 | |
| 1300X Nvidia GeForce GTX 1080 Ti FE Asus Prime B350-PLUS | |
| Lenovo ThinkPad 25 | |
| Apple MacBook Pro 13 2017 Touchbar i5 | |
| HP Envy x360 15m-bq121dx | |
| Dell Inspiron 15 7000 7577 | |
| Asus FX550IU-WSFX | |
| CPU Multi 64Bit | |
| MSI GF62VR 7RF-877 | |
| HP Envy x360 15m-bq121dx | |
| 1300X Nvidia GeForce GTX 1080 Ti FE Asus Prime B350-PLUS | |
| Dell Inspiron 15 7000 7577 | |
| HP Spectre x360 15t-bl100 | |
| Microsoft Surface Laptop i7 | |
| Apple MacBook Pro 13 2017 Touchbar i5 | |
| Asus FX550IU-WSFX | |
| Lenovo ThinkPad 25 | |
| Cinebench R10 | |
| Rendering Multiple CPUs 32Bit | |
| MSI GF62VR 7RF-877 | |
| Dell Inspiron 15 7000 7577 | |
| HP Spectre x360 15t-bl100 | |
| 1300X Nvidia GeForce GTX 1080 Ti FE Asus Prime B350-PLUS | |
| HP Envy x360 15m-bq121dx | |
| Microsoft Surface Laptop i7 | |
| Lenovo ThinkPad 25 | |
| Apple MacBook Pro 13 2017 Touchbar i5 | |
| Asus FX550IU-WSFX | |
| Rendering Single 32Bit | |
| HP Spectre x360 15t-bl100 | |
| Microsoft Surface Laptop i7 | |
| Lenovo ThinkPad 25 | |
| MSI GF62VR 7RF-877 | |
| Dell Inspiron 15 7000 7577 | |
| Apple MacBook Pro 13 2017 Touchbar i5 | |
| 1300X Nvidia GeForce GTX 1080 Ti FE Asus Prime B350-PLUS | |
| HP Envy x360 15m-bq121dx | |
| Asus FX550IU-WSFX | |
| wPrime 2.10 - 1024m | |
| Apple MacBook Pro 13 2017 Touchbar i5 | |
| Lenovo ThinkPad 25 | |
| Microsoft Surface Laptop i7 | |
| HP Spectre x360 15t-bl100 | |
| 1300X Nvidia GeForce GTX 1080 Ti FE Asus Prime B350-PLUS | |
| Dell Inspiron 15 7000 7577 | |
| Asus FX550IU-WSFX | |
| HP Envy x360 15m-bq121dx | |
| MSI GF62VR 7RF-877 | |
* ... menor é melhor
| PCMark 8 Home Score Accelerated v2 | 3385 pontos | |
| PCMark 10 Score | 2814 pontos | |
Ajuda | ||
| HP Envy x360 15m-bq121dx HGST Travelstar 7K1000 HTS721010A9E630 | HP Omen 15-ce002ng Samsung PM961 MZVLW256HEHP | Xiaomi Mi Notebook Pro i5 Samsung PM961 MZVLW256HEHP | HP Pavilion 17z 1EX13AV Avolusion MD1TBLSSHD | HP Pavilion 15z-bw000 Avolusion MD1TBLSSHD | |
|---|---|---|---|---|---|
| CrystalDiskMark 5.2 / 6 | 14649% | 11981% | -5% | -8% | |
| Write 4K (MB/s) | 1.168 | 156 13256% | 150 12742% | 1.322 13% | 1.171 0% |
| Read 4K (MB/s) | 0.536 | 47.14 8695% | 36 6616% | 0.545 2% | 0.422 -21% |
| Write Seq (MB/s) | 114.1 | 1266 1010% | 1057 826% | 89.1 -22% | 108.6 -5% |
| Read Seq (MB/s) | 114.9 | 1419 1135% | 1074 835% | 91.4 -20% | 106.3 -7% |
| Write 4K Q32T1 (MB/s) | 1.212 | 486 39999% | 429 35296% | 1.239 2% | 1.145 -6% |
| Read 4K Q32T1 (MB/s) | 1.189 | 586 49185% | 441 36990% | 1.548 30% | 1.104 -7% |
| Write Seq Q32T1 (MB/s) | 113.2 | 1246 1001% | 1283 1033% | 90.3 -20% | 107.4 -5% |
| Read Seq Q32T1 (MB/s) | 114.1 | 3431 2907% | 1838 1511% | 88.3 -23% | 104.1 -9% |

| 3DMark | |
| 1280x720 Cloud Gate Standard Graphics | |
| Asus FX550IU-WSFX | |
| Asus Zenbook UX510UW-CN044T | |
| Acer Aspire E5-575G-549D | |
| HP Envy 13-ad006ng | |
| HP Envy x360 15m-bq121dx | |
| Intel Skull Canyon NUC6i7KYK | |
| Lenovo ThinkPad 25 | |
| Apple MacBook Pro 13 2017 Touchbar i5 | |
| Microsoft Surface Laptop i7 | |
| Acer Switch 5 SW512-52-5819 | |
| HP 17-bs103ng | |
| HP 15-bw075ax | |
| 1920x1080 Fire Strike Graphics | |
| Asus FX550IU-WSFX | |
| Asus Zenbook UX510UW-CN044T | |
| Acer Aspire E5-575G-549D | |
| HP Envy 13-ad006ng | |
| HP Envy x360 15m-bq121dx | |
| Lenovo ThinkPad 25 | |
| Intel Skull Canyon NUC6i7KYK | |
| Apple MacBook Pro 13 2017 Touchbar i5 | |
| HP 17-bs103ng | |
| Microsoft Surface Laptop i7 | |
| Acer Switch 5 SW512-52-5819 | |
| HP 15-bw075ax | |
| 3DMark 11 | |
| 1280x720 Performance GPU | |
| Asus FX550IU-WSFX | |
| Asus Zenbook UX510UW-CN044T | |
| Acer Aspire E5-575G-549D | |
| HP Envy x360 15m-bq121dx | |
| HP Envy 13-ad006ng | |
| Intel Skull Canyon NUC6i7KYK | |
| Lenovo ThinkPad 25 | |
| Apple MacBook Pro 13 2017 Touchbar i5 | |
| Microsoft Surface Laptop i7 | |
| Microsoft Surface Laptop i7 | |
| HP 17-bs103ng | |
| Acer Switch 5 SW512-52-5819 | |
| 1280x720 Performance Combined | |
| Asus Zenbook UX510UW-CN044T | |
| Acer Aspire E5-575G-549D | |
| HP Envy 13-ad006ng | |
| Lenovo ThinkPad 25 | |
| HP Envy x360 15m-bq121dx | |
| Intel Skull Canyon NUC6i7KYK | |
| Asus FX550IU-WSFX | |
| Apple MacBook Pro 13 2017 Touchbar i5 | |
| Microsoft Surface Laptop i7 | |
| Microsoft Surface Laptop i7 | |
| HP 17-bs103ng | |
| Acer Switch 5 SW512-52-5819 | |
| 3DMark 11 Performance | 3759 pontos | |
| 3DMark Cloud Gate Standard Score | 10601 pontos | |
| 3DMark Fire Strike Score | 2262 pontos | |
| 3DMark Fire Strike Extreme Score | 1091 pontos | |
Ajuda | ||
| BioShock Infinite - 1920x1080 Ultra Preset, DX11 (DDOF) | |
| Acer Aspire E5-575G-549D | |
| HP Spectre x360 15t-bl100 | |
| Lenovo ThinkPad 25 | |
| HP Envy x360 15m-bq121dx | |
| Intel Skull Canyon NUC6i7KYK | |
| Apple MacBook Pro 13 2017 | |
| HP Pavilion 17z 1EX13AV | |
| Dell XPS 13 i7-8550U | |
| Samsung Notebook 9 NP900X3N-K01US | |
| Rise of the Tomb Raider - 1920x1080 High Preset AA:FX AF:4x | |
| HP Spectre x360 15t-bl100 | |
| Acer Aspire E5-575G-549D | |
| Lenovo ThinkPad 25 | |
| HP Envy x360 15m-bq121dx | |
| Intel Skull Canyon NUC6i7KYK | |
| Dell XPS 13 i7-8550U | |
| baixo | média | alto | ultra | |
|---|---|---|---|---|
| Guild Wars 2 (2012) | 72.3 | 12.9 | ||
| BioShock Infinite (2013) | 114.4 | 20 | ||
| Metro: Last Light (2013) | 60 | 14.2 | ||
| Thief (2014) | 45.9 | 14 | ||
| The Witcher 3 (2015) | 42.3 | 14 | ||
| Batman: Arkham Knight (2015) | 42 | 16 | ||
| Metal Gear Solid V (2015) | 60 | 31 | 20 | |
| Fallout 4 (2015) | 43.9 | 14.9 | ||
| Rise of the Tomb Raider (2016) | 49.3 | 15.4 | ||
| Ashes of the Singularity (2016) | 12.9 | |||
| Overwatch (2016) | 94.2 | 40 | ||
| Mafia 3 (2016) | 13 | |||
| Prey (2017) | 63.2 | 21.7 | ||
| Dirt 4 (2017) | 90.4 | 35.6 | 20.9 | |
| F1 2017 (2017) | 60 | 27 | 22 |
Barulho
| Ocioso |
| 32.3 / 32.4 / 34.2 dB |
| Carga |
| 36.2 / 45.3 dB |
 | ||
30 dB silencioso 40 dB(A) audível 50 dB(A) ruidosamente alto |
||
min: | ||
| HP Envy x360 15m-bq121dx Vega 8, R5 2500U, HGST Travelstar 7K1000 HTS721010A9E630 | HP Omen 15-ce002ng GeForce GTX 1060 Max-Q, i7-7700HQ, Samsung PM961 MZVLW256HEHP | Lenovo Yoga 720-15IKB-80X7 GeForce GTX 1050 Mobile, i7-7700HQ, Samsung PM961 MZVLW256HEHP | HP Spectre x360 15-bl002xx GeForce 940MX, i7-7500U, Toshiba XG4 NVMe (THNSN5512GPUK) | HP Envy x360 15t-w200 GeForce 930MX, i7-7500U, WDC Slim WD10SPCX-24HWST1 | Asus Zenbook UX510UW-CN044T GeForce GTX 960M, 6500U, SanDisk SD8SNAT256G1002 | |
|---|---|---|---|---|---|---|
| Noise | -4% | 6% | 1% | -2% | -3% | |
| desligado / ambiente * (dB) | 28.5 | 30 -5% | 28.2 1% | 28.5 -0% | 30.2 -6% | 31.6 -11% |
| Idle Minimum * (dB) | 32.3 | 30 7% | 28.2 13% | 28.5 12% | 33.8 -5% | 31.6 2% |
| Idle Average * (dB) | 32.4 | 33 -2% | 28.2 13% | 28.5 12% | 33.9 -5% | 31.6 2% |
| Idle Maximum * (dB) | 34.2 | 37 -8% | 28.2 18% | 36.3 -6% | 34.2 -0% | 33.4 2% |
| Load Average * (dB) | 36.2 | 41 -13% | 39 -8% | 42.7 -18% | 36 1% | 41.7 -15% |
| Witcher 3 ultra * (dB) | 42.8 | 42 2% | ||||
| Load Maximum * (dB) | 45.3 | 50 -10% | 46.3 -2% | 42.7 6% | 44 3% | 44.8 1% |
* ... menor é melhor
(±) A temperatura máxima no lado superior é 40 °C / 104 F, em comparação com a média de 35.4 °C / 96 F , variando de 19.6 a 60 °C para a classe Convertible.
(±) A parte inferior aquece até um máximo de 44 °C / 111 F, em comparação com a média de 36.9 °C / 98 F
(+) Em uso inativo, a temperatura média para o lado superior é 22.4 °C / 72 F, em comparação com a média do dispositivo de 30.3 °C / ### class_avg_f### F.
(+) Jogando The Witcher 3, a temperatura média para o lado superior é 31.9 °C / 89 F, em comparação com a média do dispositivo de 30.3 °C / ## #class_avg_f### F.
(+) Os apoios para as mãos e o touchpad são mais frios que a temperatura da pele, com um máximo de 30.2 °C / 86.4 F e, portanto, são frios ao toque.
(-) A temperatura média da área do apoio para as mãos de dispositivos semelhantes foi 28 °C / 82.4 F (-2.2 °C / -4 F).
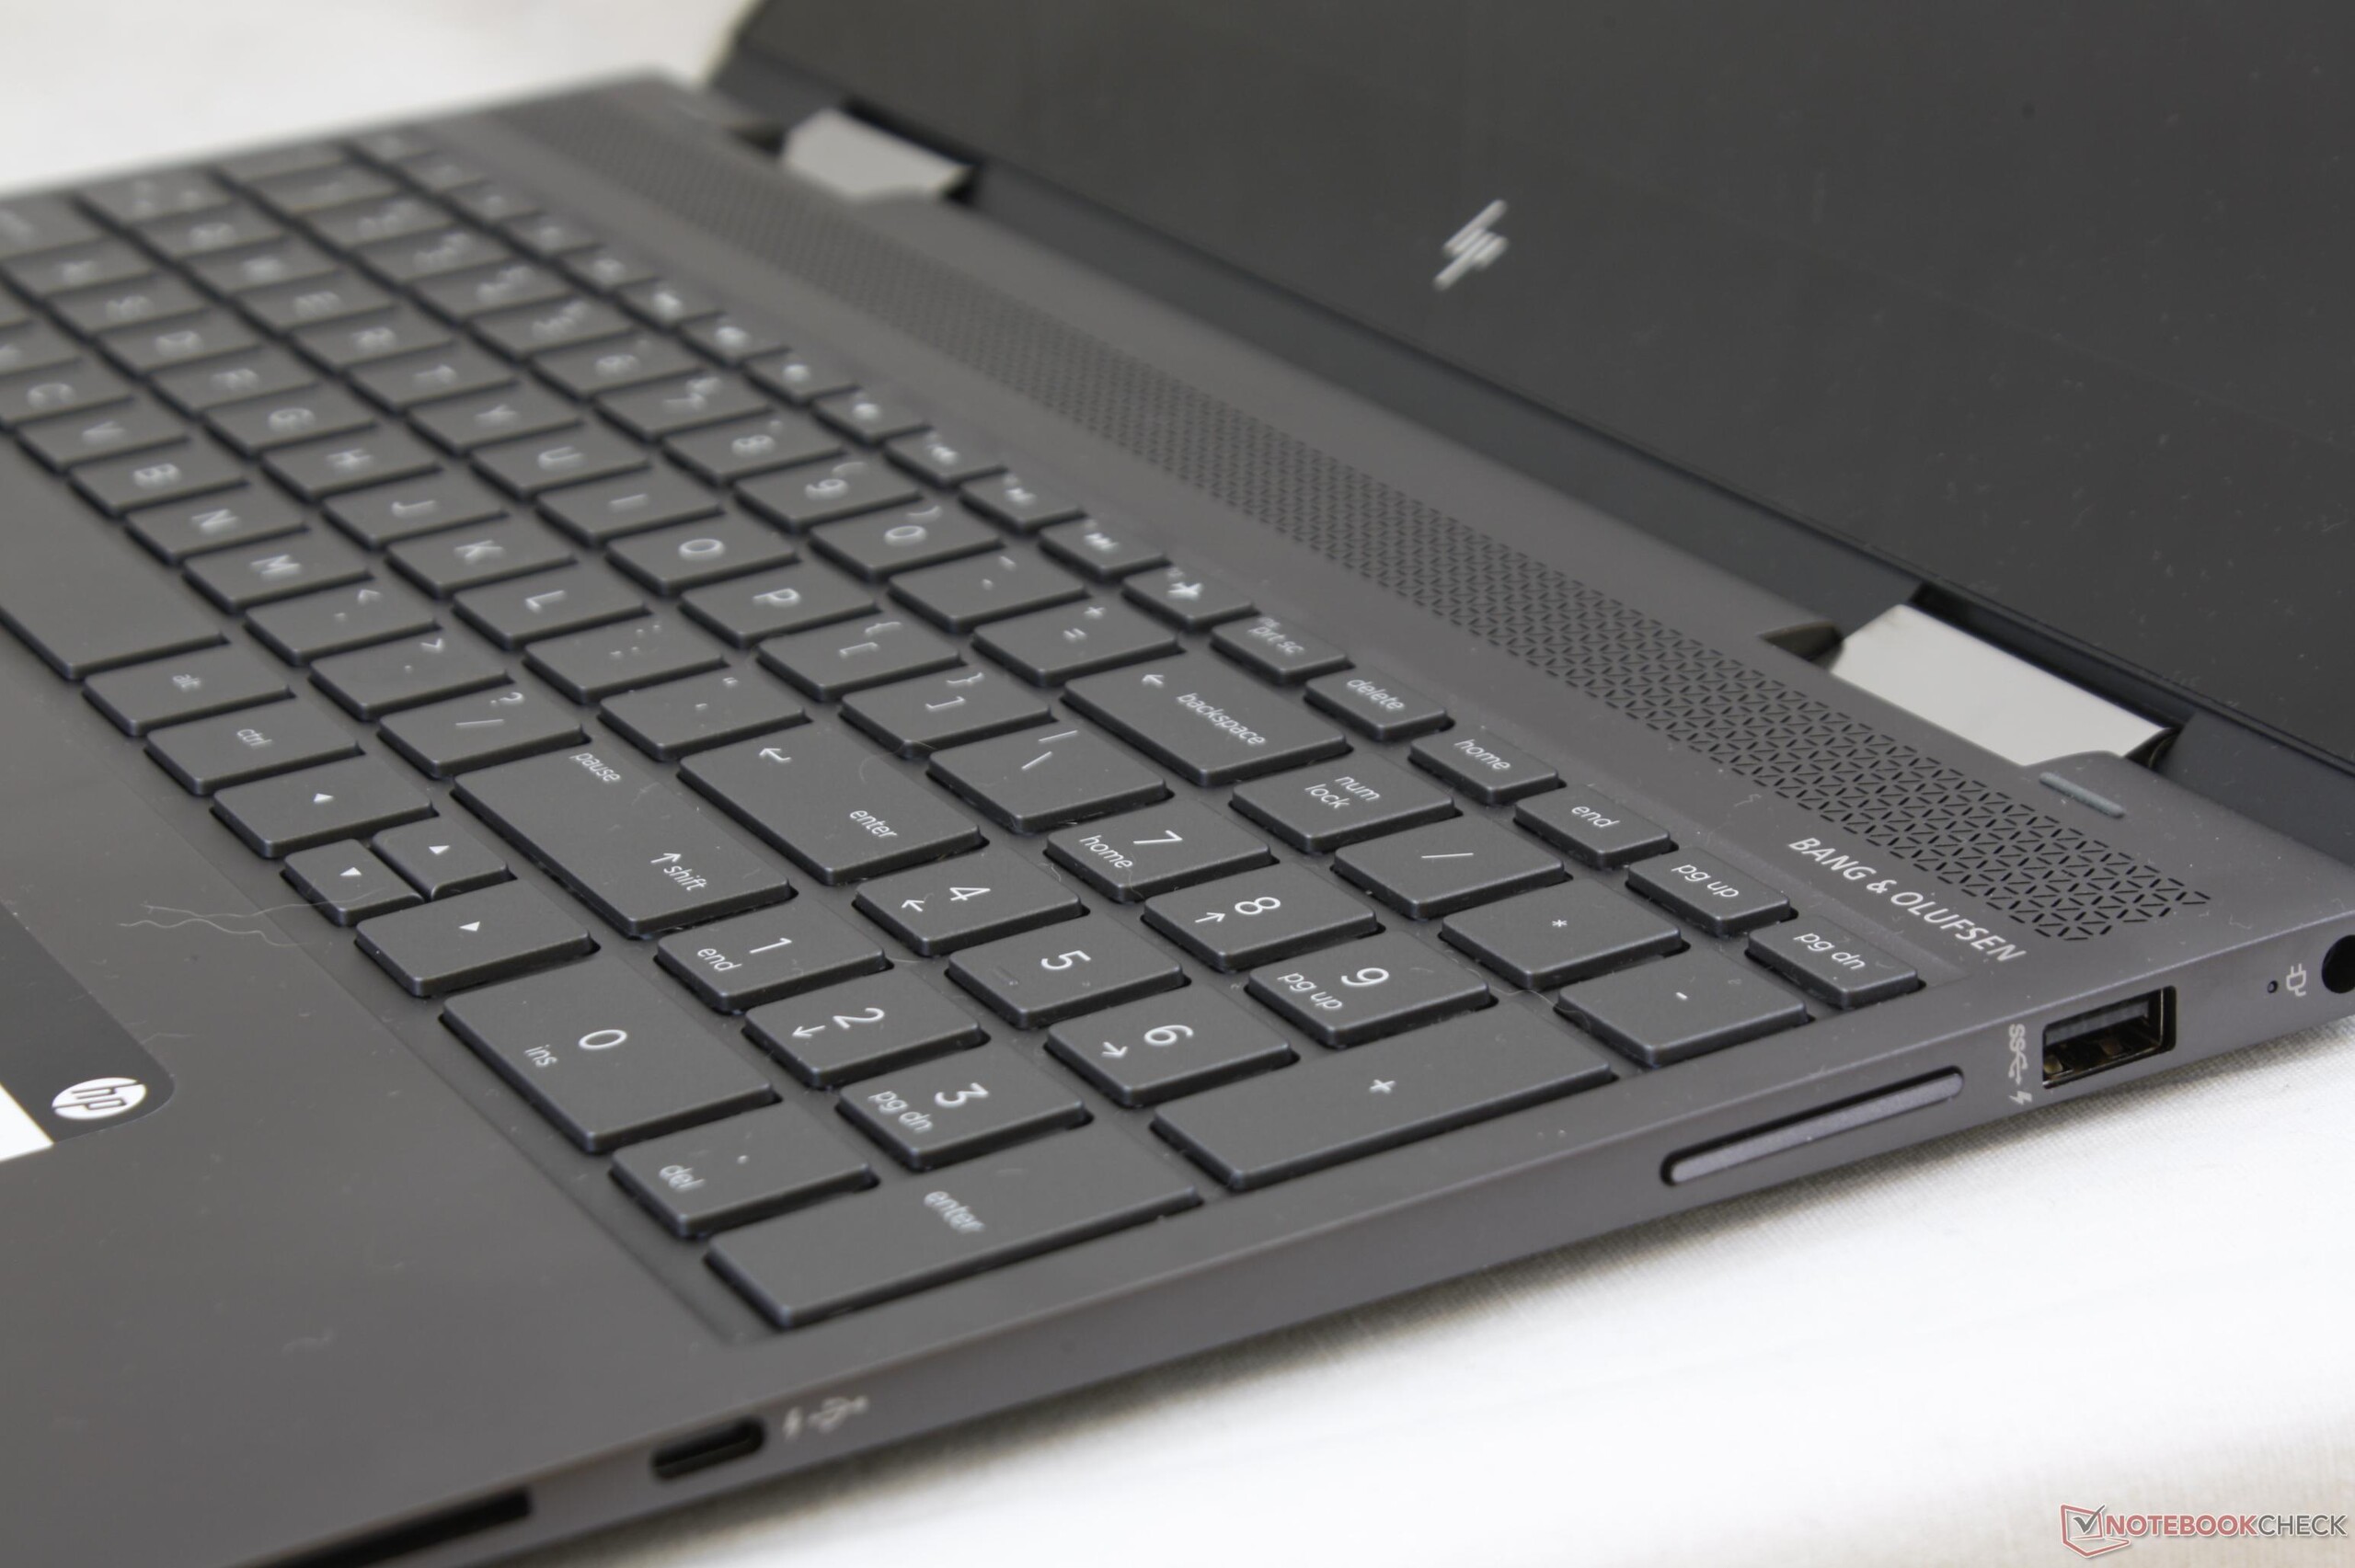
HP Envy x360 15m-bq121dx análise de áudio
(-) | alto-falantes não muito altos (###valor### dB)
Graves 100 - 315Hz
(-) | quase nenhum baixo - em média 15.1% menor que a mediana
(-) | graves não são lineares (15.3% delta para frequência anterior)
Médios 400 - 2.000 Hz
(+) | médios equilibrados - apenas 4.8% longe da mediana
(±) | a linearidade dos médios é média (7.4% delta para frequência anterior)
Altos 2 - 16 kHz
(+) | agudos equilibrados - apenas 2.3% longe da mediana
(±) | a linearidade dos máximos é média (7.8% delta para frequência anterior)
Geral 100 - 16.000 Hz
(±) | a linearidade do som geral é média (26.3% diferença em relação à mediana)
Comparado com a mesma classe
» 82% de todos os dispositivos testados nesta classe foram melhores, 3% semelhantes, 15% piores
» O melhor teve um delta de 6%, a média foi 20%, o pior foi 57%
Comparado com todos os dispositivos testados
» 81% de todos os dispositivos testados foram melhores, 4% semelhantes, 15% piores
» O melhor teve um delta de 4%, a média foi 23%, o pior foi 134%
Apple MacBook 12 (Early 2016) 1.1 GHz análise de áudio
(+) | os alto-falantes podem tocar relativamente alto (###valor### dB)
Graves 100 - 315Hz
(±) | graves reduzidos - em média 11.3% menor que a mediana
(±) | a linearidade dos graves é média (14.2% delta para a frequência anterior)
Médios 400 - 2.000 Hz
(+) | médios equilibrados - apenas 2.4% longe da mediana
(+) | médios são lineares (5.5% delta para frequência anterior)
Altos 2 - 16 kHz
(+) | agudos equilibrados - apenas 2% longe da mediana
(+) | os máximos são lineares (4.5% delta da frequência anterior)
Geral 100 - 16.000 Hz
(+) | o som geral é linear (10.2% diferença em relação à mediana)
Comparado com a mesma classe
» 7% de todos os dispositivos testados nesta classe foram melhores, 2% semelhantes, 90% piores
» O melhor teve um delta de 5%, a média foi 18%, o pior foi 53%
Comparado com todos os dispositivos testados
» 5% de todos os dispositivos testados foram melhores, 1% semelhantes, 94% piores
» O melhor teve um delta de 4%, a média foi 23%, o pior foi 134%
| desligado | |
| Ocioso | |
| Carga |
|
Key:
min: | |
| HP Envy x360 15m-bq121dx R5 2500U, Vega 8, HGST Travelstar 7K1000 HTS721010A9E630, IPS, 1920x1080, 15.6" | Xiaomi Mi Notebook Pro i5 i5-8250U, GeForce MX150, Samsung PM961 MZVLW256HEHP, IPS LED, 1920x1080, 15.6" | HP Spectre x360 15-bl002xx i7-7500U, GeForce 940MX, Toshiba XG4 NVMe (THNSN5512GPUK), IPS, 3840x2160, 15.6" | HP Envy x360 15t-w200 i7-7500U, GeForce 930MX, WDC Slim WD10SPCX-24HWST1, IPS, 1920x1080, 15.6" | HP Spectre x360 15t-bl100 i5-8550U, GeForce MX150, Samsung PM961 NVMe MZVLW512HMJP, IPS, 3840x2160, 15.6" | Lenovo Yoga 720-15IKB-80X7 i7-7700HQ, GeForce GTX 1050 Mobile, Samsung PM961 MZVLW256HEHP, IPS, 1920x1080, 15.6" | |
|---|---|---|---|---|---|---|
| Power Consumption | 8% | -26% | 16% | -54% | -59% | |
| Idle Minimum * (Watt) | 5.9 | 3.7 37% | 8.14 -38% | 5 15% | 11.6 -97% | 8.3 -41% |
| Idle Average * (Watt) | 8.7 | 7.5 14% | 10.91 -25% | 8.3 5% | 13.8 -59% | 10.2 -17% |
| Idle Maximum * (Watt) | 10.5 | 8 24% | 12.26 -17% | 7.8 26% | 14.2 -35% | 10.4 1% |
| Load Average * (Watt) | 45.7 | 49 -7% | 45.67 -0% | 28.8 37% | 67.9 -49% | 67.5 -48% |
| Witcher 3 ultra * (Watt) | 45.8 | 50.6 -10% | 59 -29% | 96.5 -111% | ||
| Load Maximum * (Watt) | 49.4 | 55.2 -12% | 74.94 -52% | 49.7 -1% | 76.9 -56% | 117.2 -137% |
* ... menor é melhor
| HP Envy x360 15m-bq121dx R5 2500U, Vega 8, 55.8 Wh | Lenovo Yoga 720-15IKB-80X7 i7-7700HQ, GeForce GTX 1050 Mobile, 72 Wh | HP Spectre x360 15-bl002xx i7-7500U, GeForce 940MX, 79.2 Wh | HP Envy x360 15t-w200 i7-7500U, GeForce 930MX, 48 Wh | HP Spectre x360 15t-bl100 i5-8550U, GeForce MX150, 79.2 Wh | Dell XPS 15 9560 (i7-7700HQ, UHD) i7-7700HQ, GeForce GTX 1050 Mobile, 97 Wh | |
|---|---|---|---|---|---|---|
| Duração da bateria | 36% | 53% | -3% | 50% | 23% | |
| Reader / Idle (h) | 10.9 | 17.8 63% | 14.4 32% | 10.6 -3% | 15.6 43% | 13.9 28% |
| WiFi v1.3 (h) | 6.6 | 8.1 23% | 8.9 35% | 5.3 -20% | 8.5 29% | 7.2 9% |
| Load (h) | 1.3 | 1.6 23% | 2.5 92% | 1.5 15% | 2.3 77% | 1.7 31% |
Pro
Contra
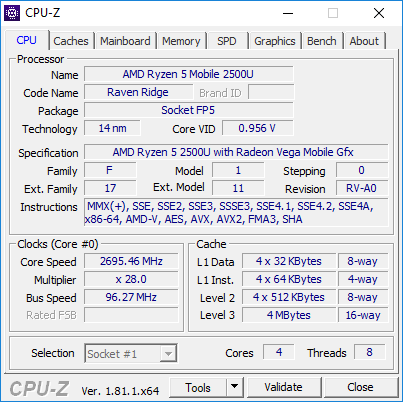
Since this is the first commercially available notebook equipped with Raven Ridge, our verdict can be split into two parts. The first part relates to the AMD hardware itself. On paper, the 25 W cTDP Ryzen 5 2500U APU and RX Vega 8 GPU are able to stand neck-to-neck with current 15 W Kaby Lake-R options (i5-8250, i7-8550U) while outperforming even the Iris Pro Graphics 580 in synthetic benchmarks. Combine this with the generally lower price tag and there is seemingly no reason to choose Intel over AMD with all else being equal.
Dado que este é o primeiro portátil comercialmente disponível equipado com Raven Ridge, nosso veredicto pode ser dividido em duas partes. A primeira parte diz respeito ao próprio hardware da AMD. No papel, a APU cTDP Ryzen 5 2500U de 25 W e a GPU RX Vega 8 podem competir lado a lado com as opções atuais Kaby Lake-R de 15 W (i5-8250, i7-8550U), superando mesmo o Iris Pro Graphics 580 em benchmarks sintéticas. Combine isso com o preço geralmente menor e, aparentemente, não há motivo para escolher a Intel sobre a AMD, com todo o resto sendo igual.
Infelizmente para a AMD, todo o resto não é igual o Raven Ridge simplesmente não está pronto para o horário nobre. Nossa unidade de teste é extraordinariamente lenta e sofre de erros aleatórios. Em particular, o sistema falharia com mais frequência ao estressar a GPU ou rodar jogos semelhantes à geração anterior de portáteis AMD Dual Graphics, como no Asus FX550IU. Os benchmarks sintéticos podem revelar o Vega 8 para ser mais rápido do que o antigo GeForce 940MX, mas o contrário é verdadeiro ao rodar a maioria dos jogos modernos. Este é o AMD clássico para o melhor ou o pior - excelente desempenho por dólar que, em última instância, é estragado por controladores e suporte para desenvolvedores inferiores.
Os potenciais compradores que são atraídos pelo impressionante desempenho do processador encontrarão o preço mais baixo atrativo sobre um equivalente Intel Kaby Lake-R. Por outro lado, os jogadores só encontrarão decepção no RX Vega 8 até que seus controladores sejam atualizados. Pode ser mais do dobro de poderoso do que o UHD Graphics 620 em testes sintéticos, mas o MX150 ainda é o melhor investimento para jogos em 1080p.
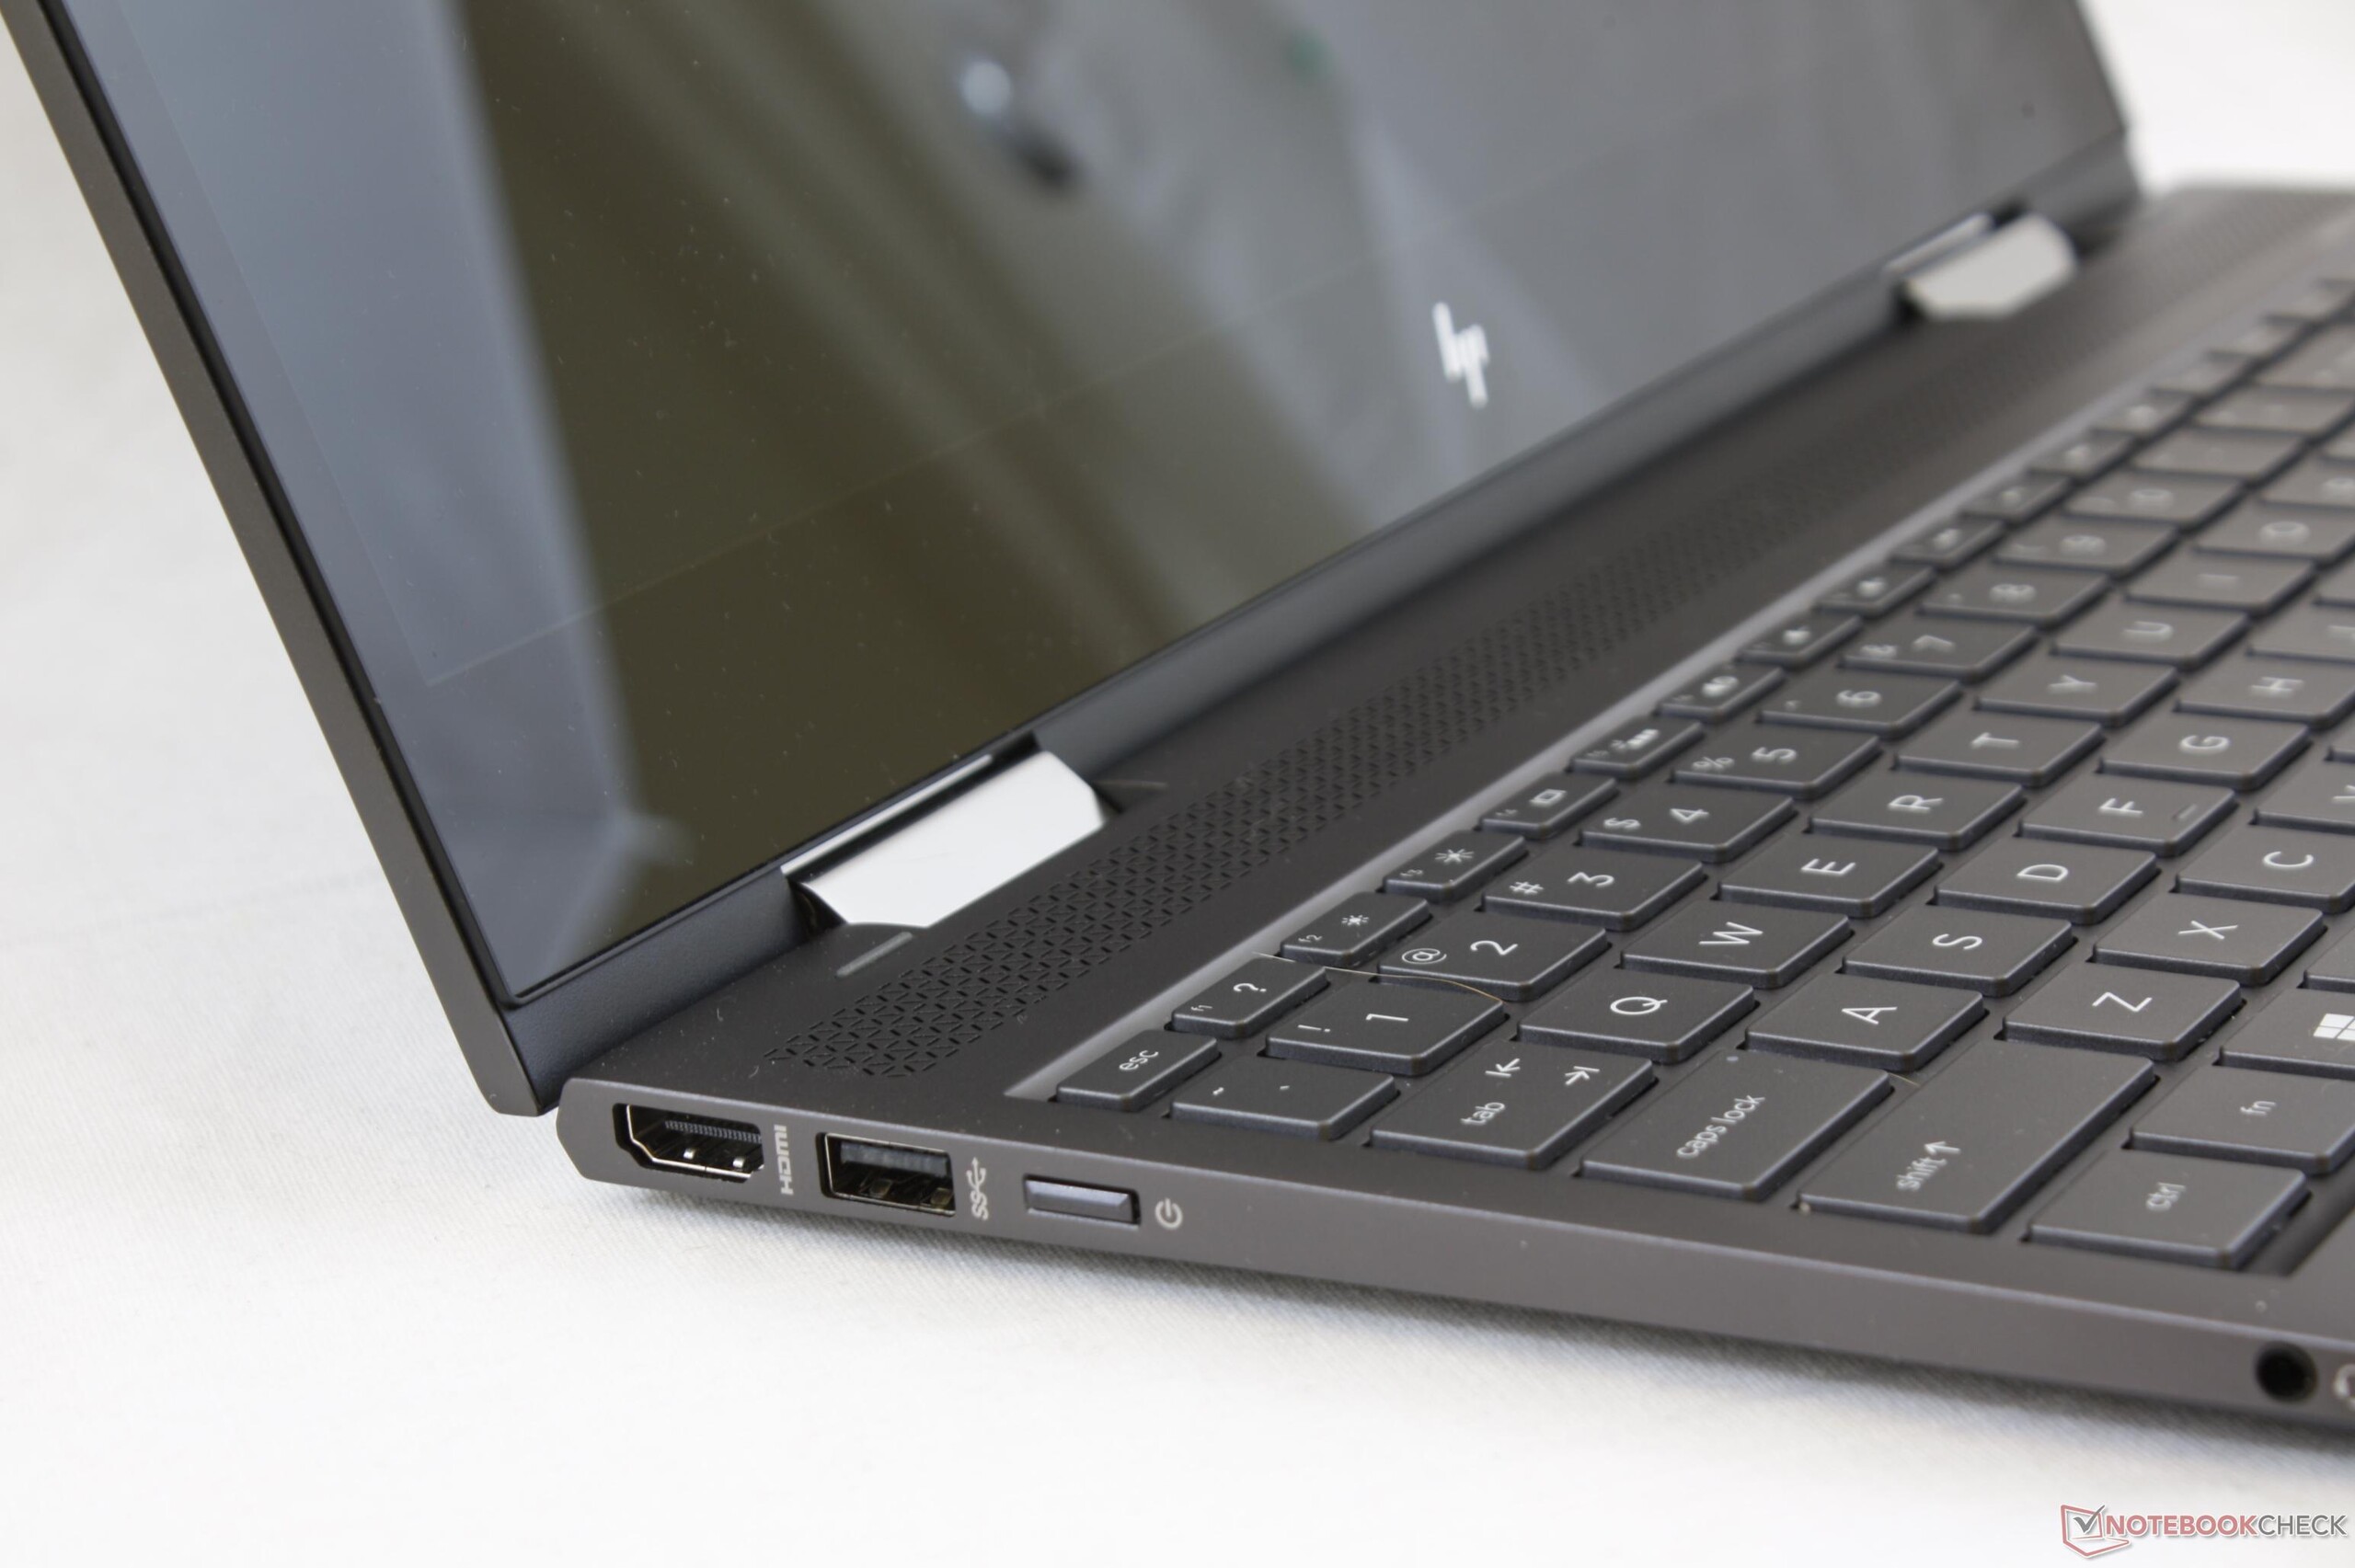
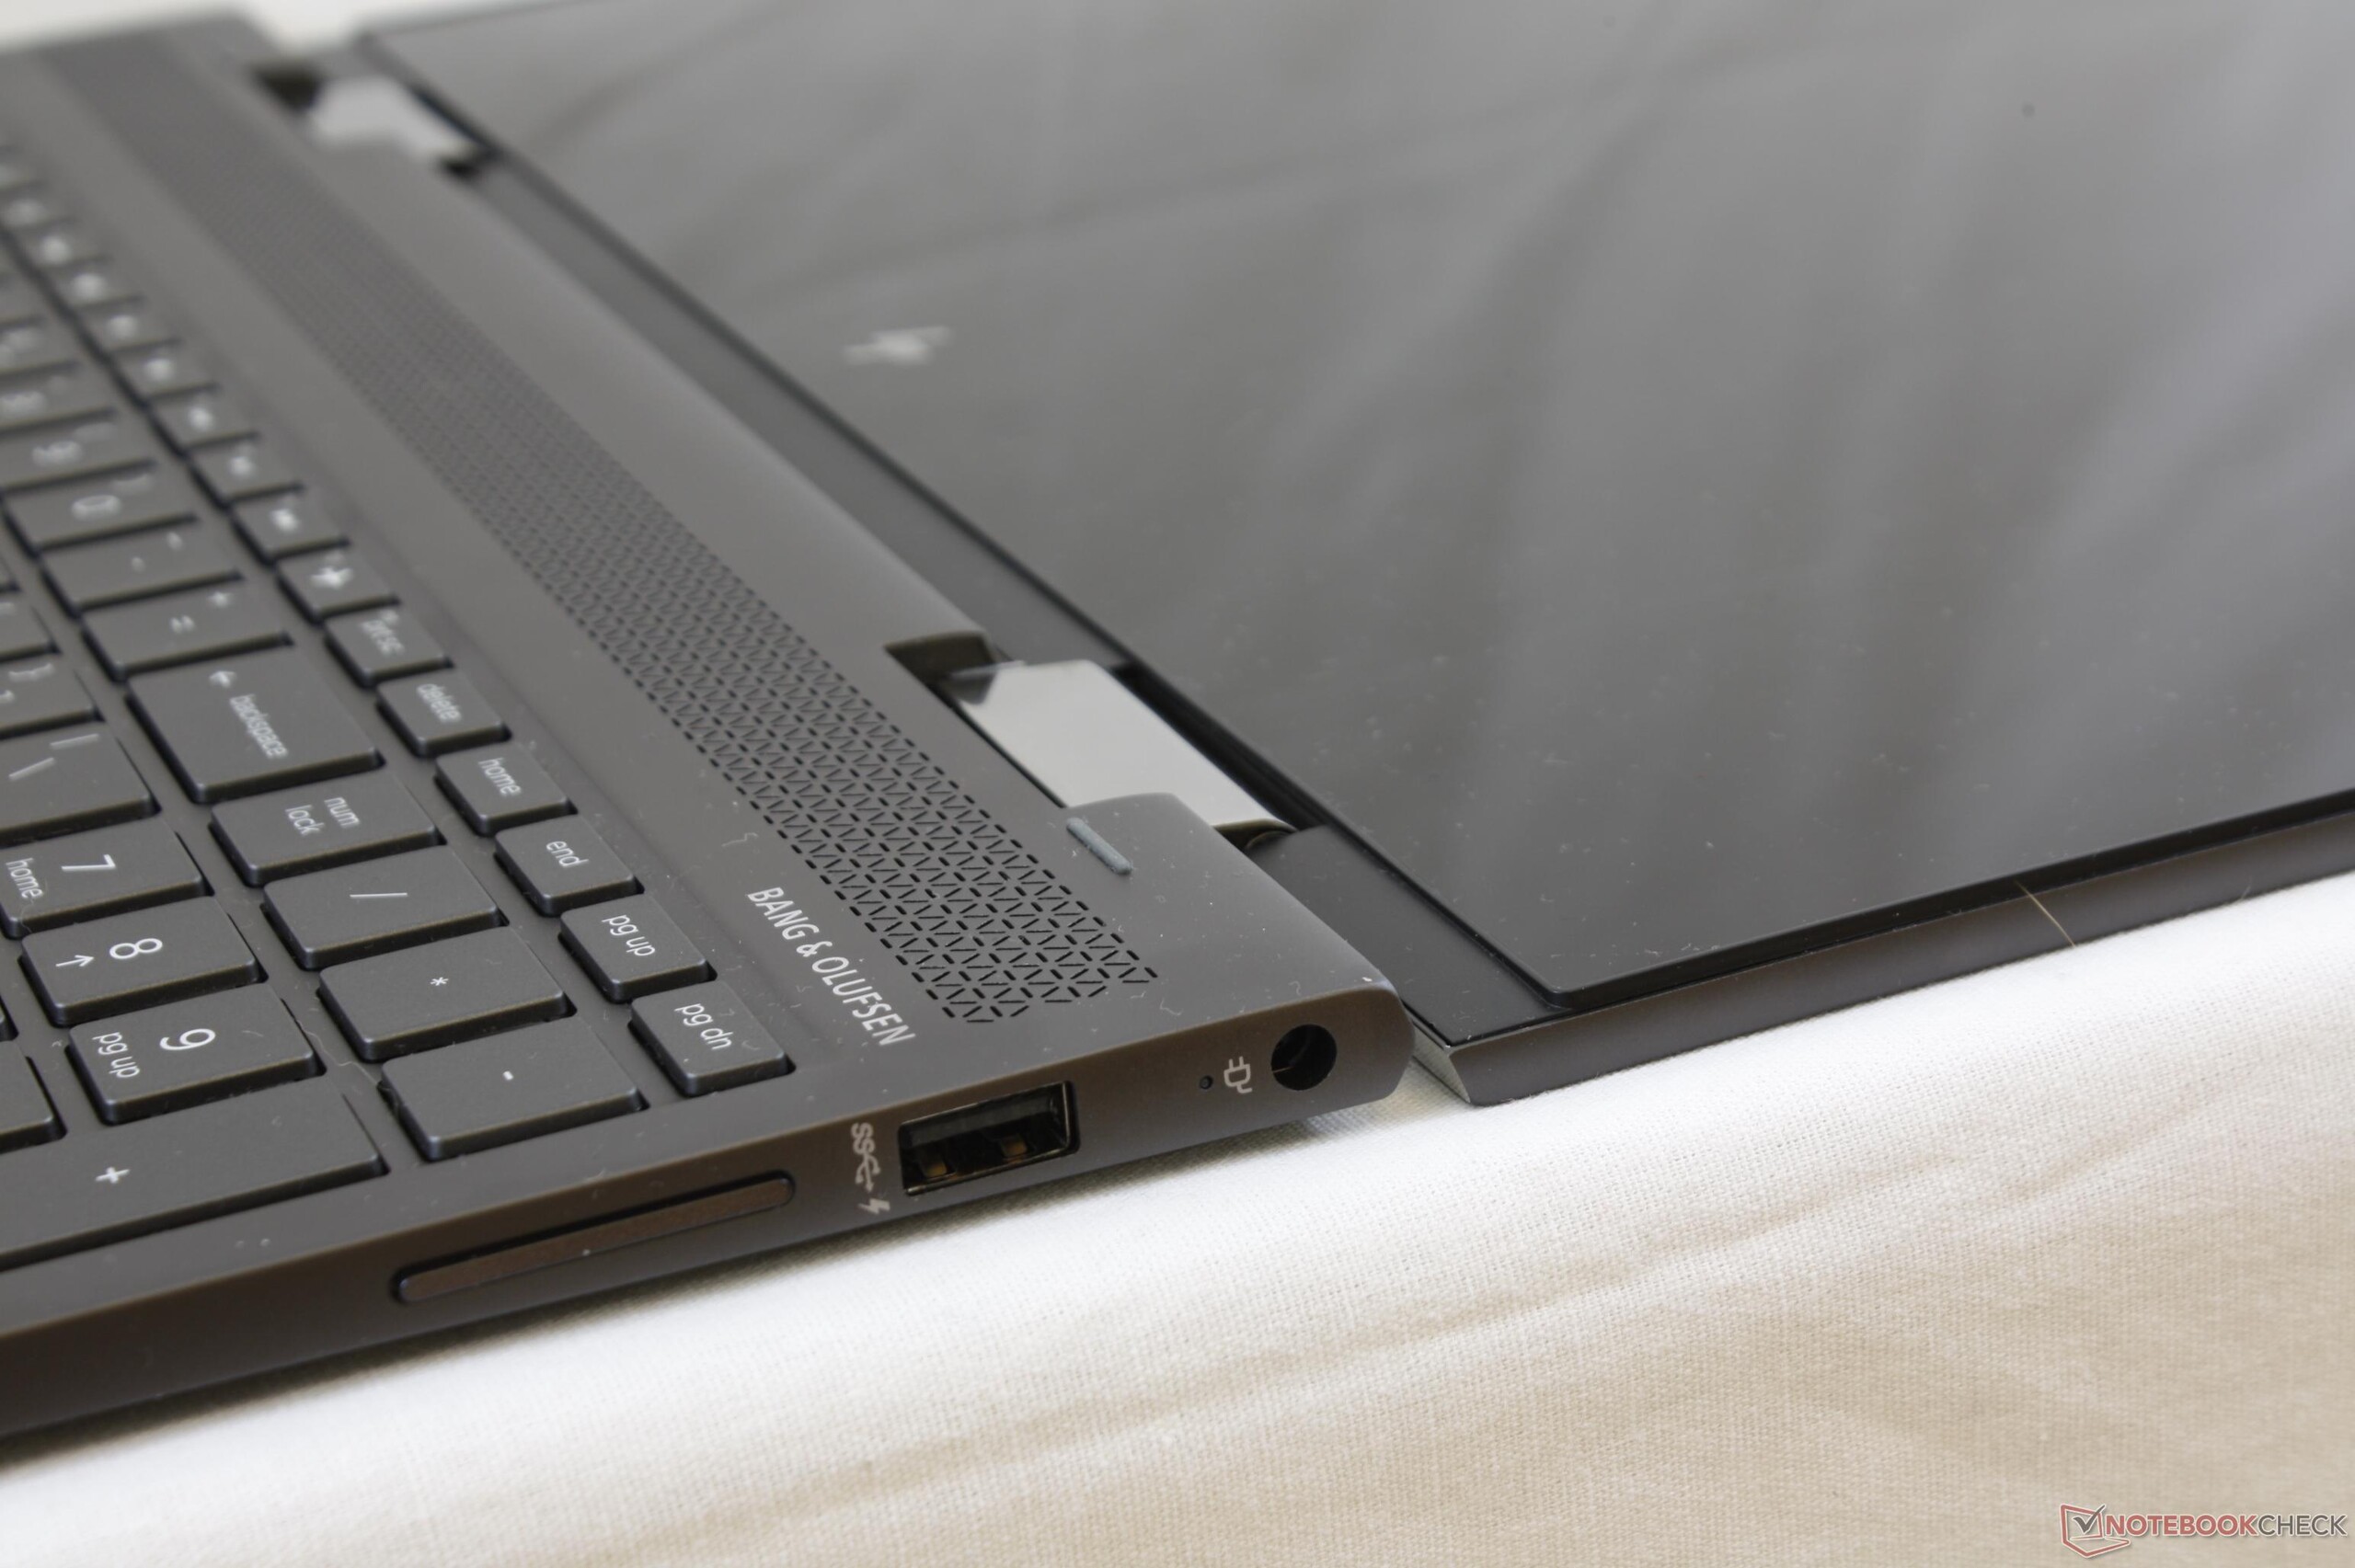
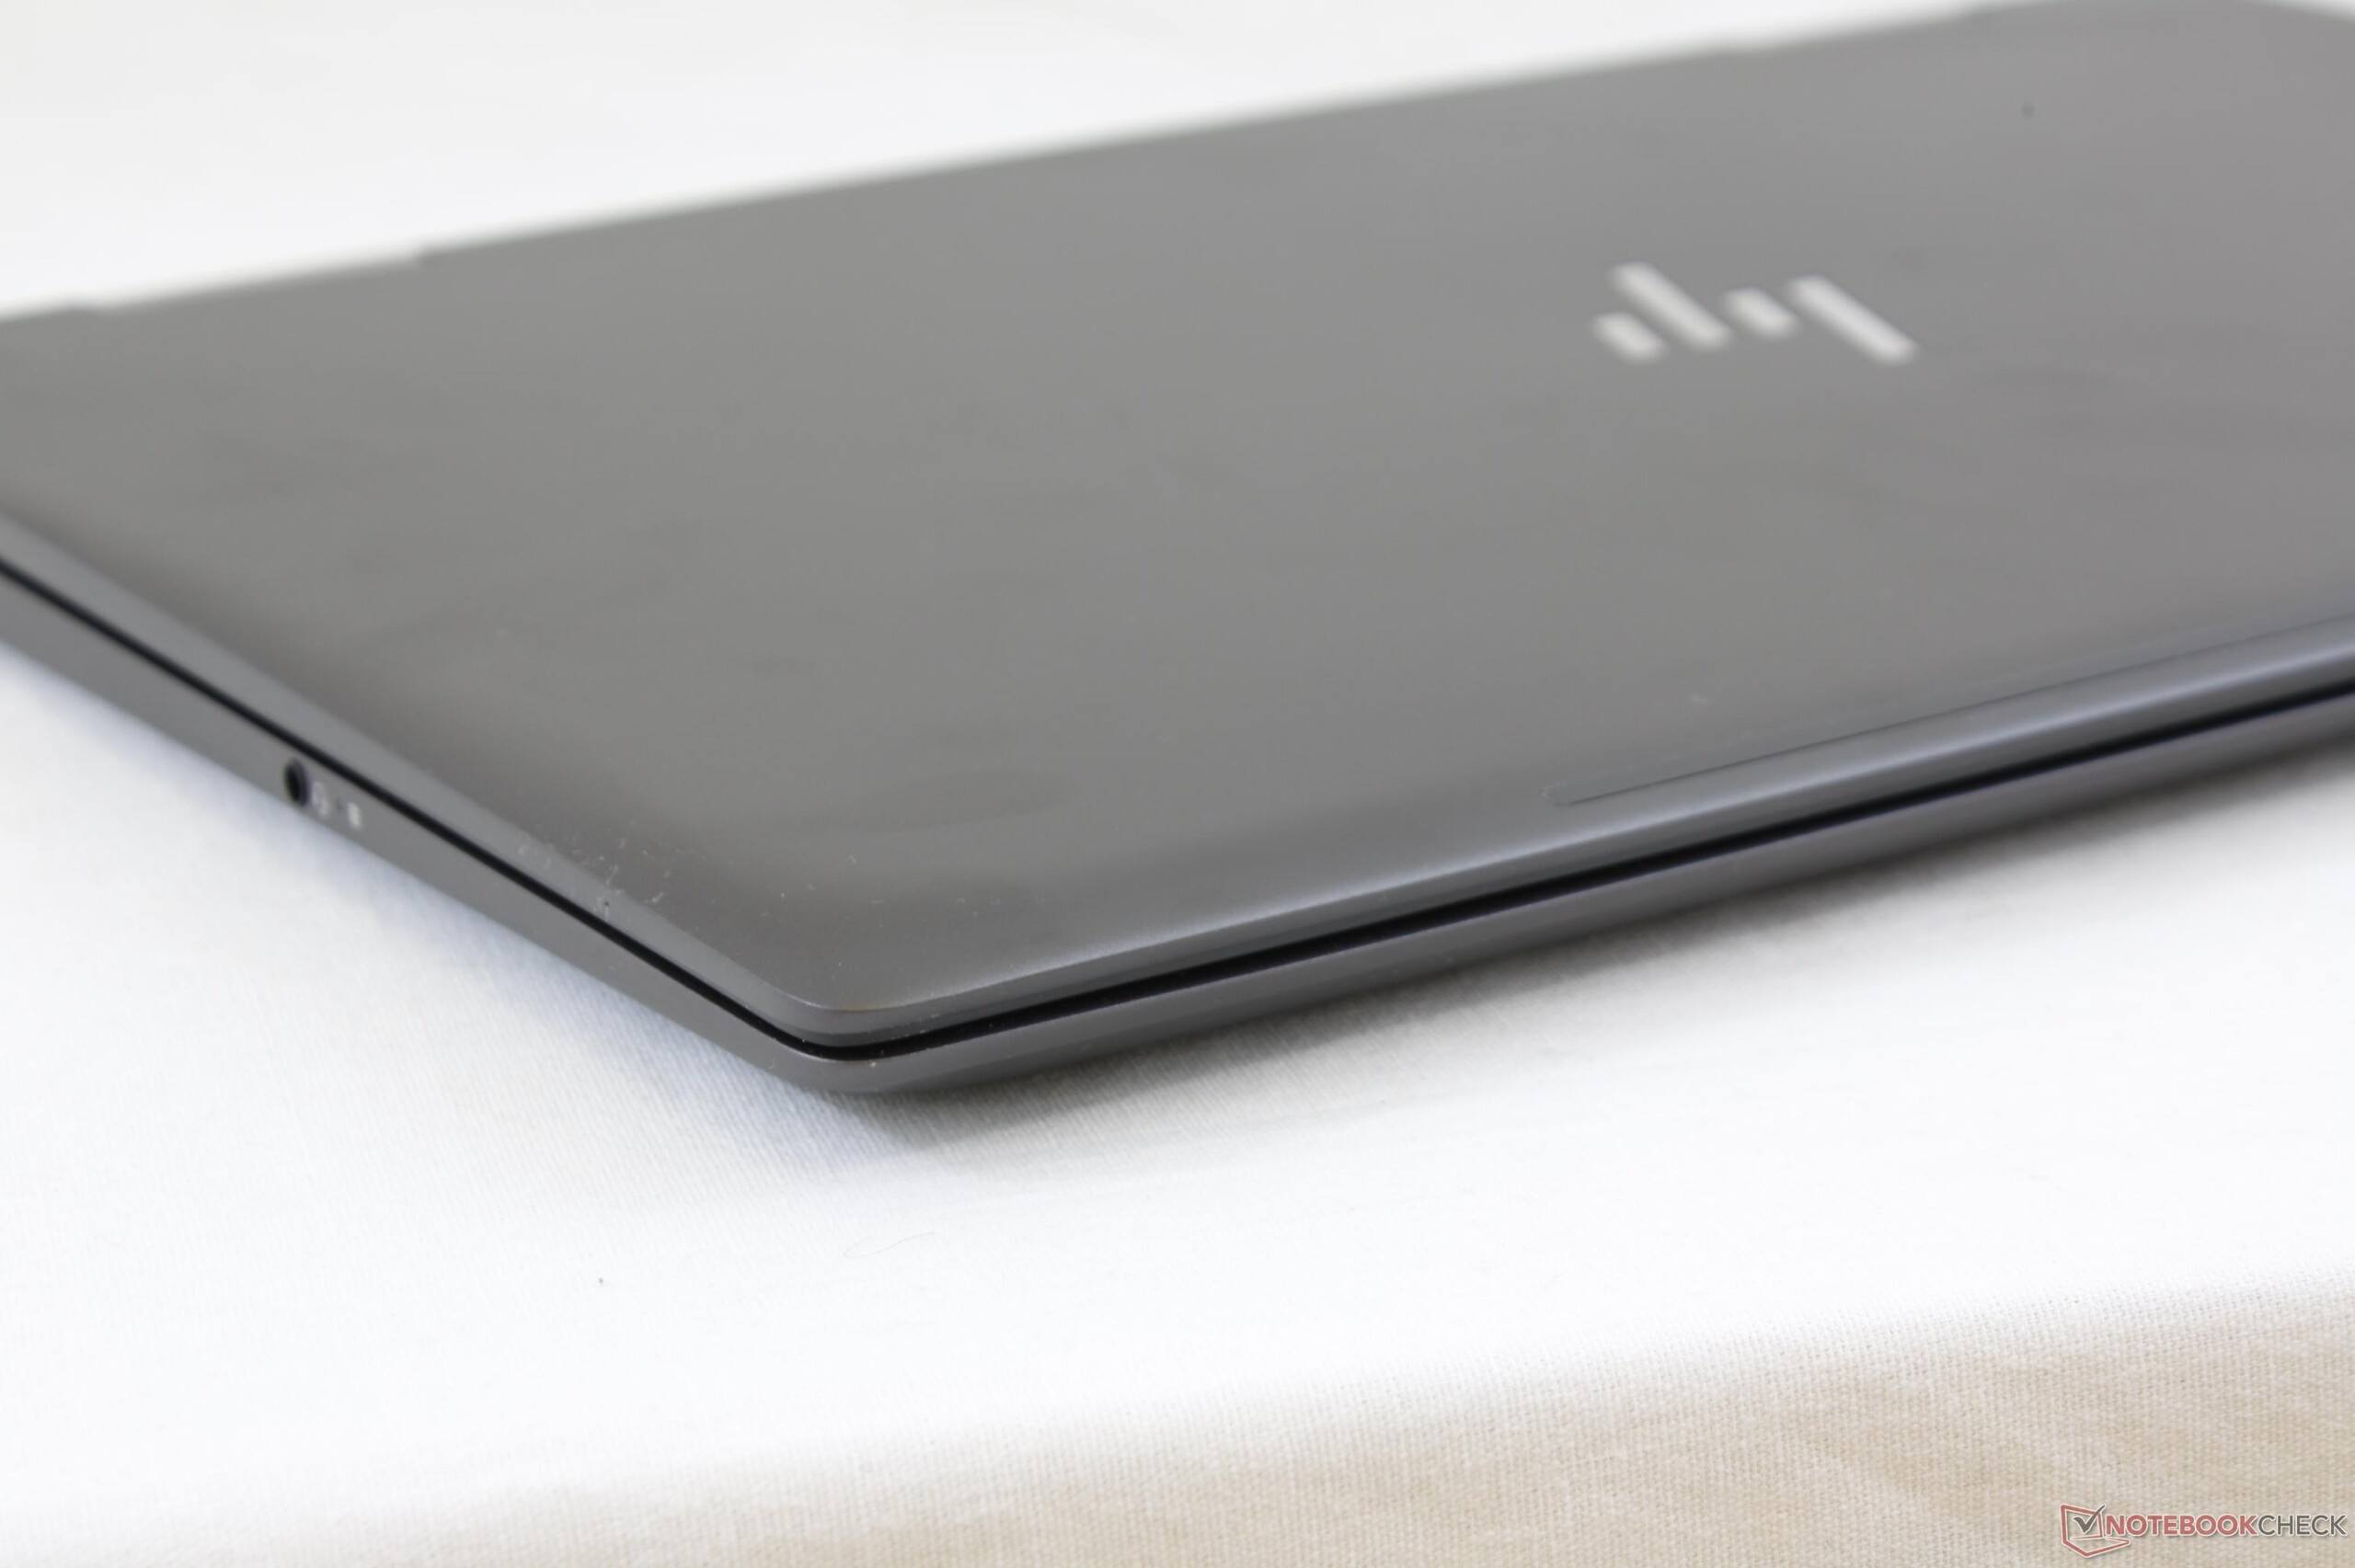
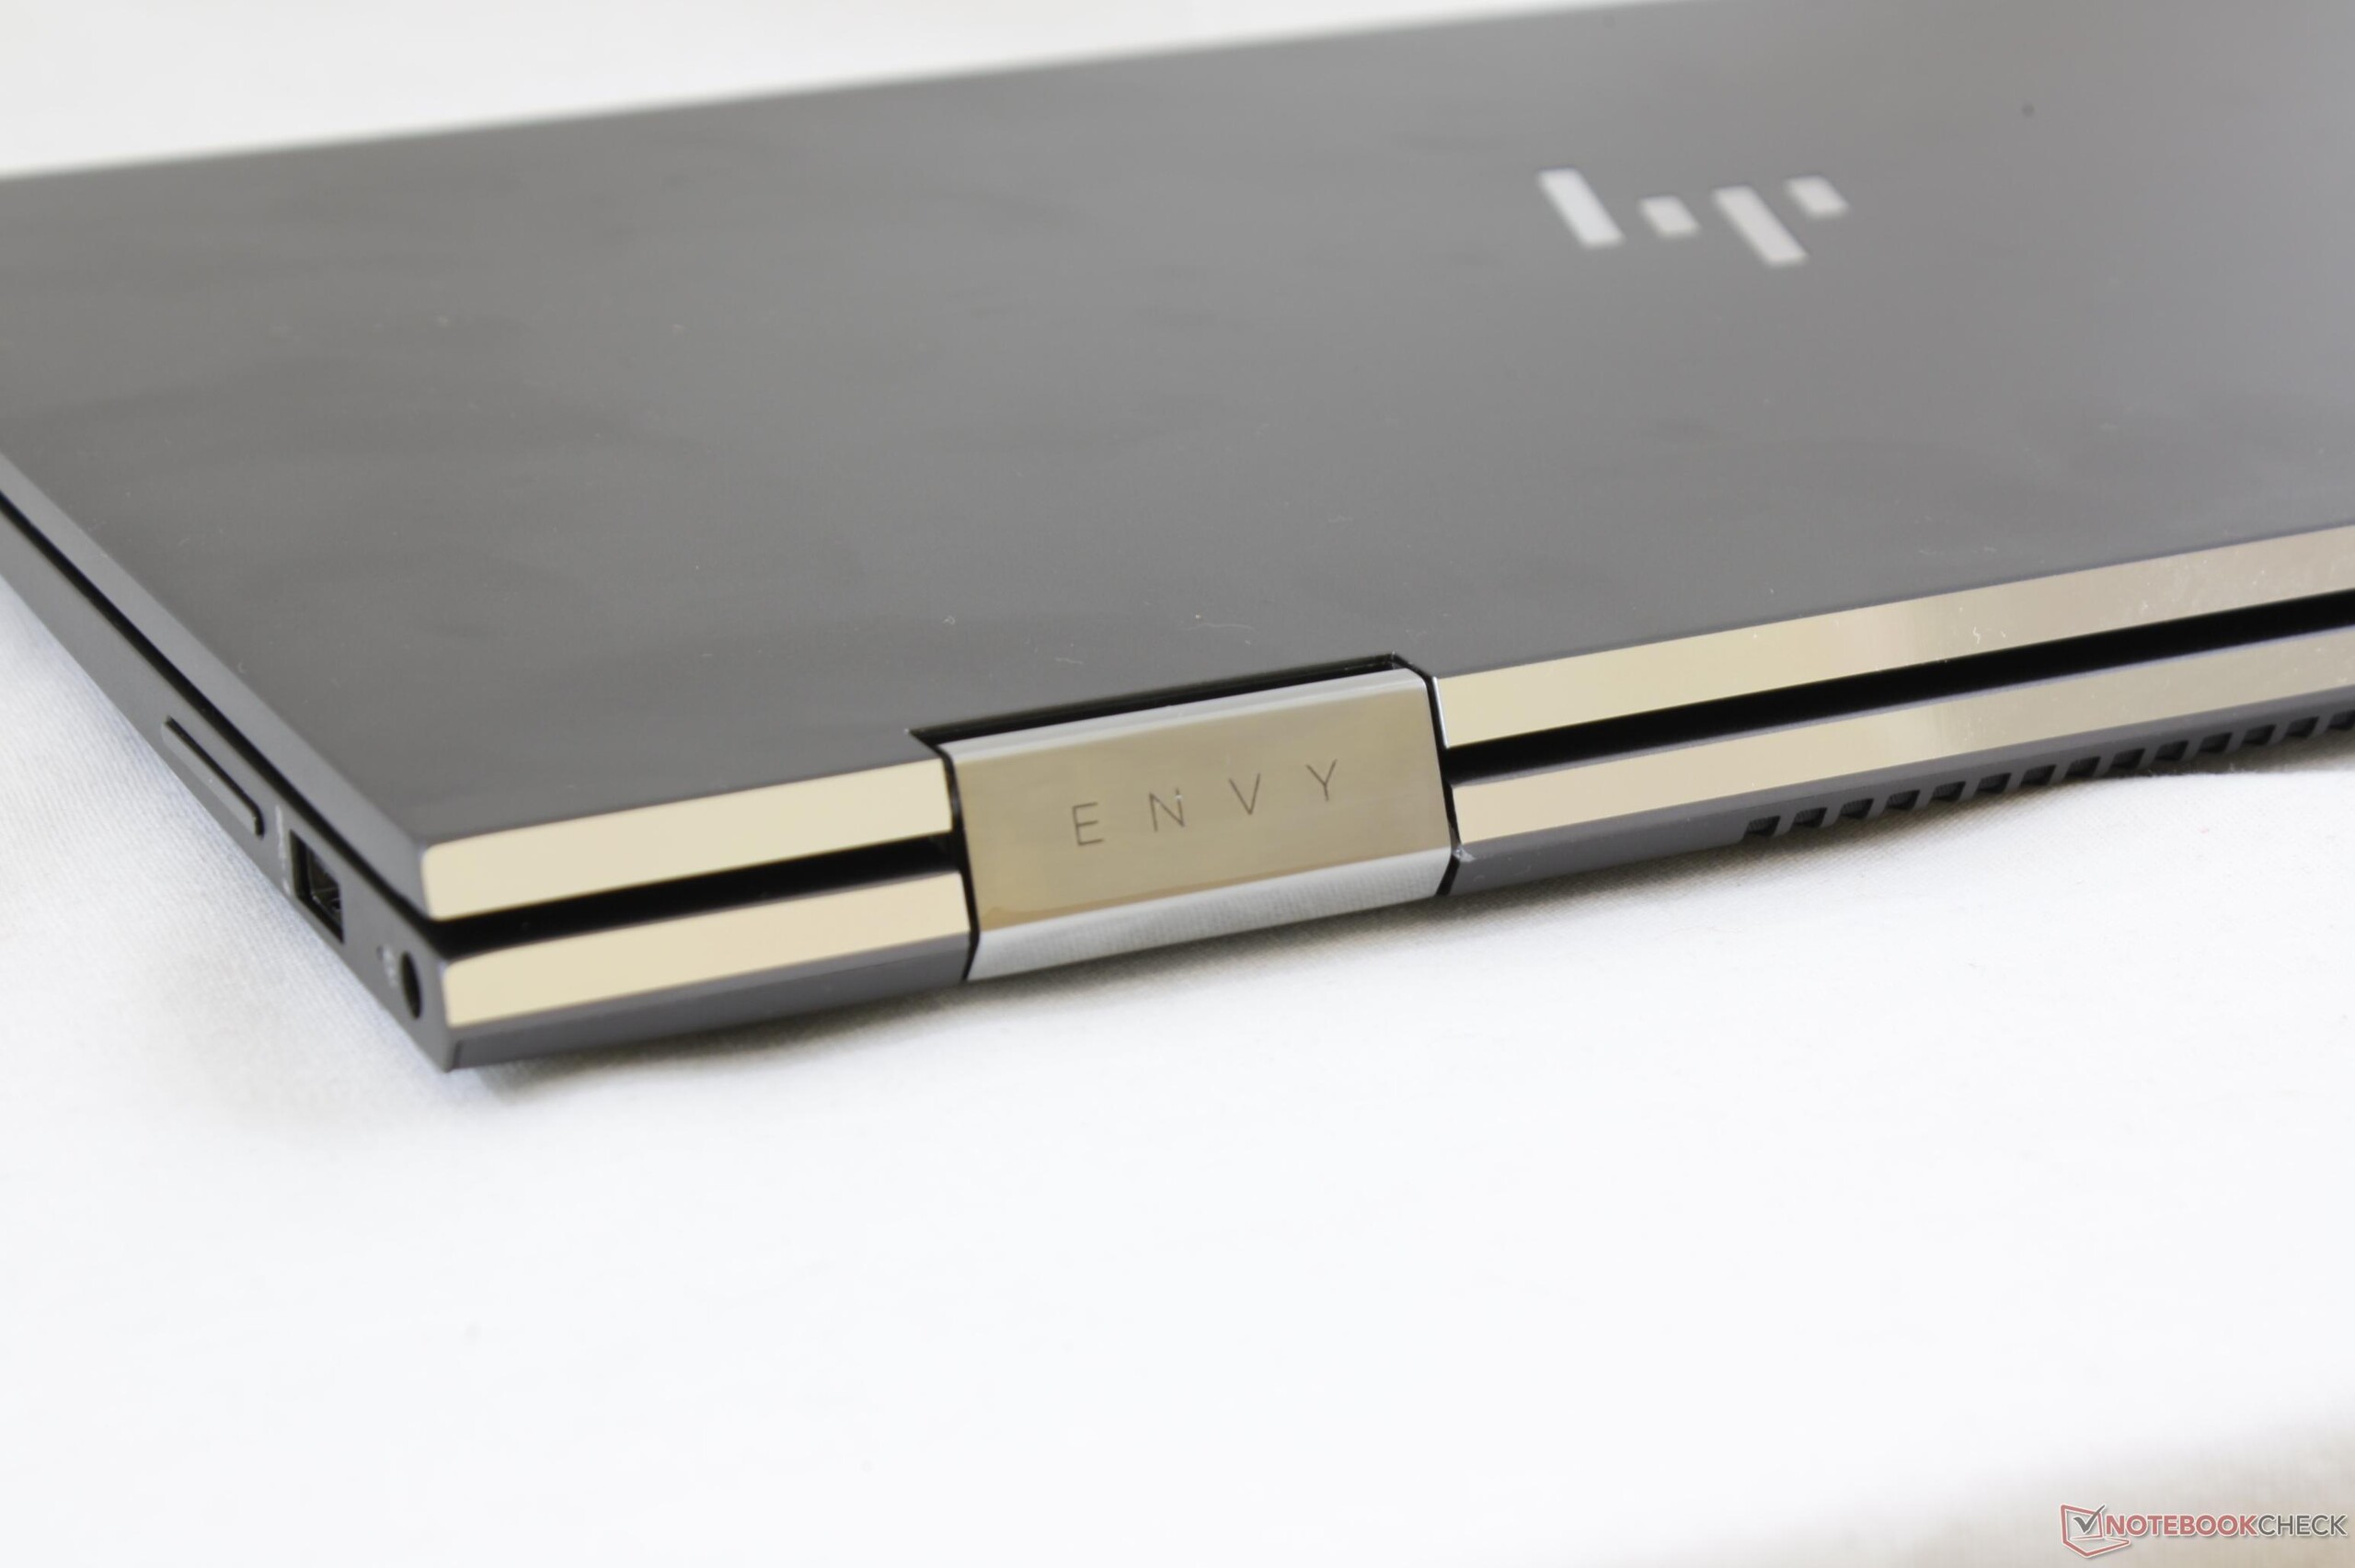
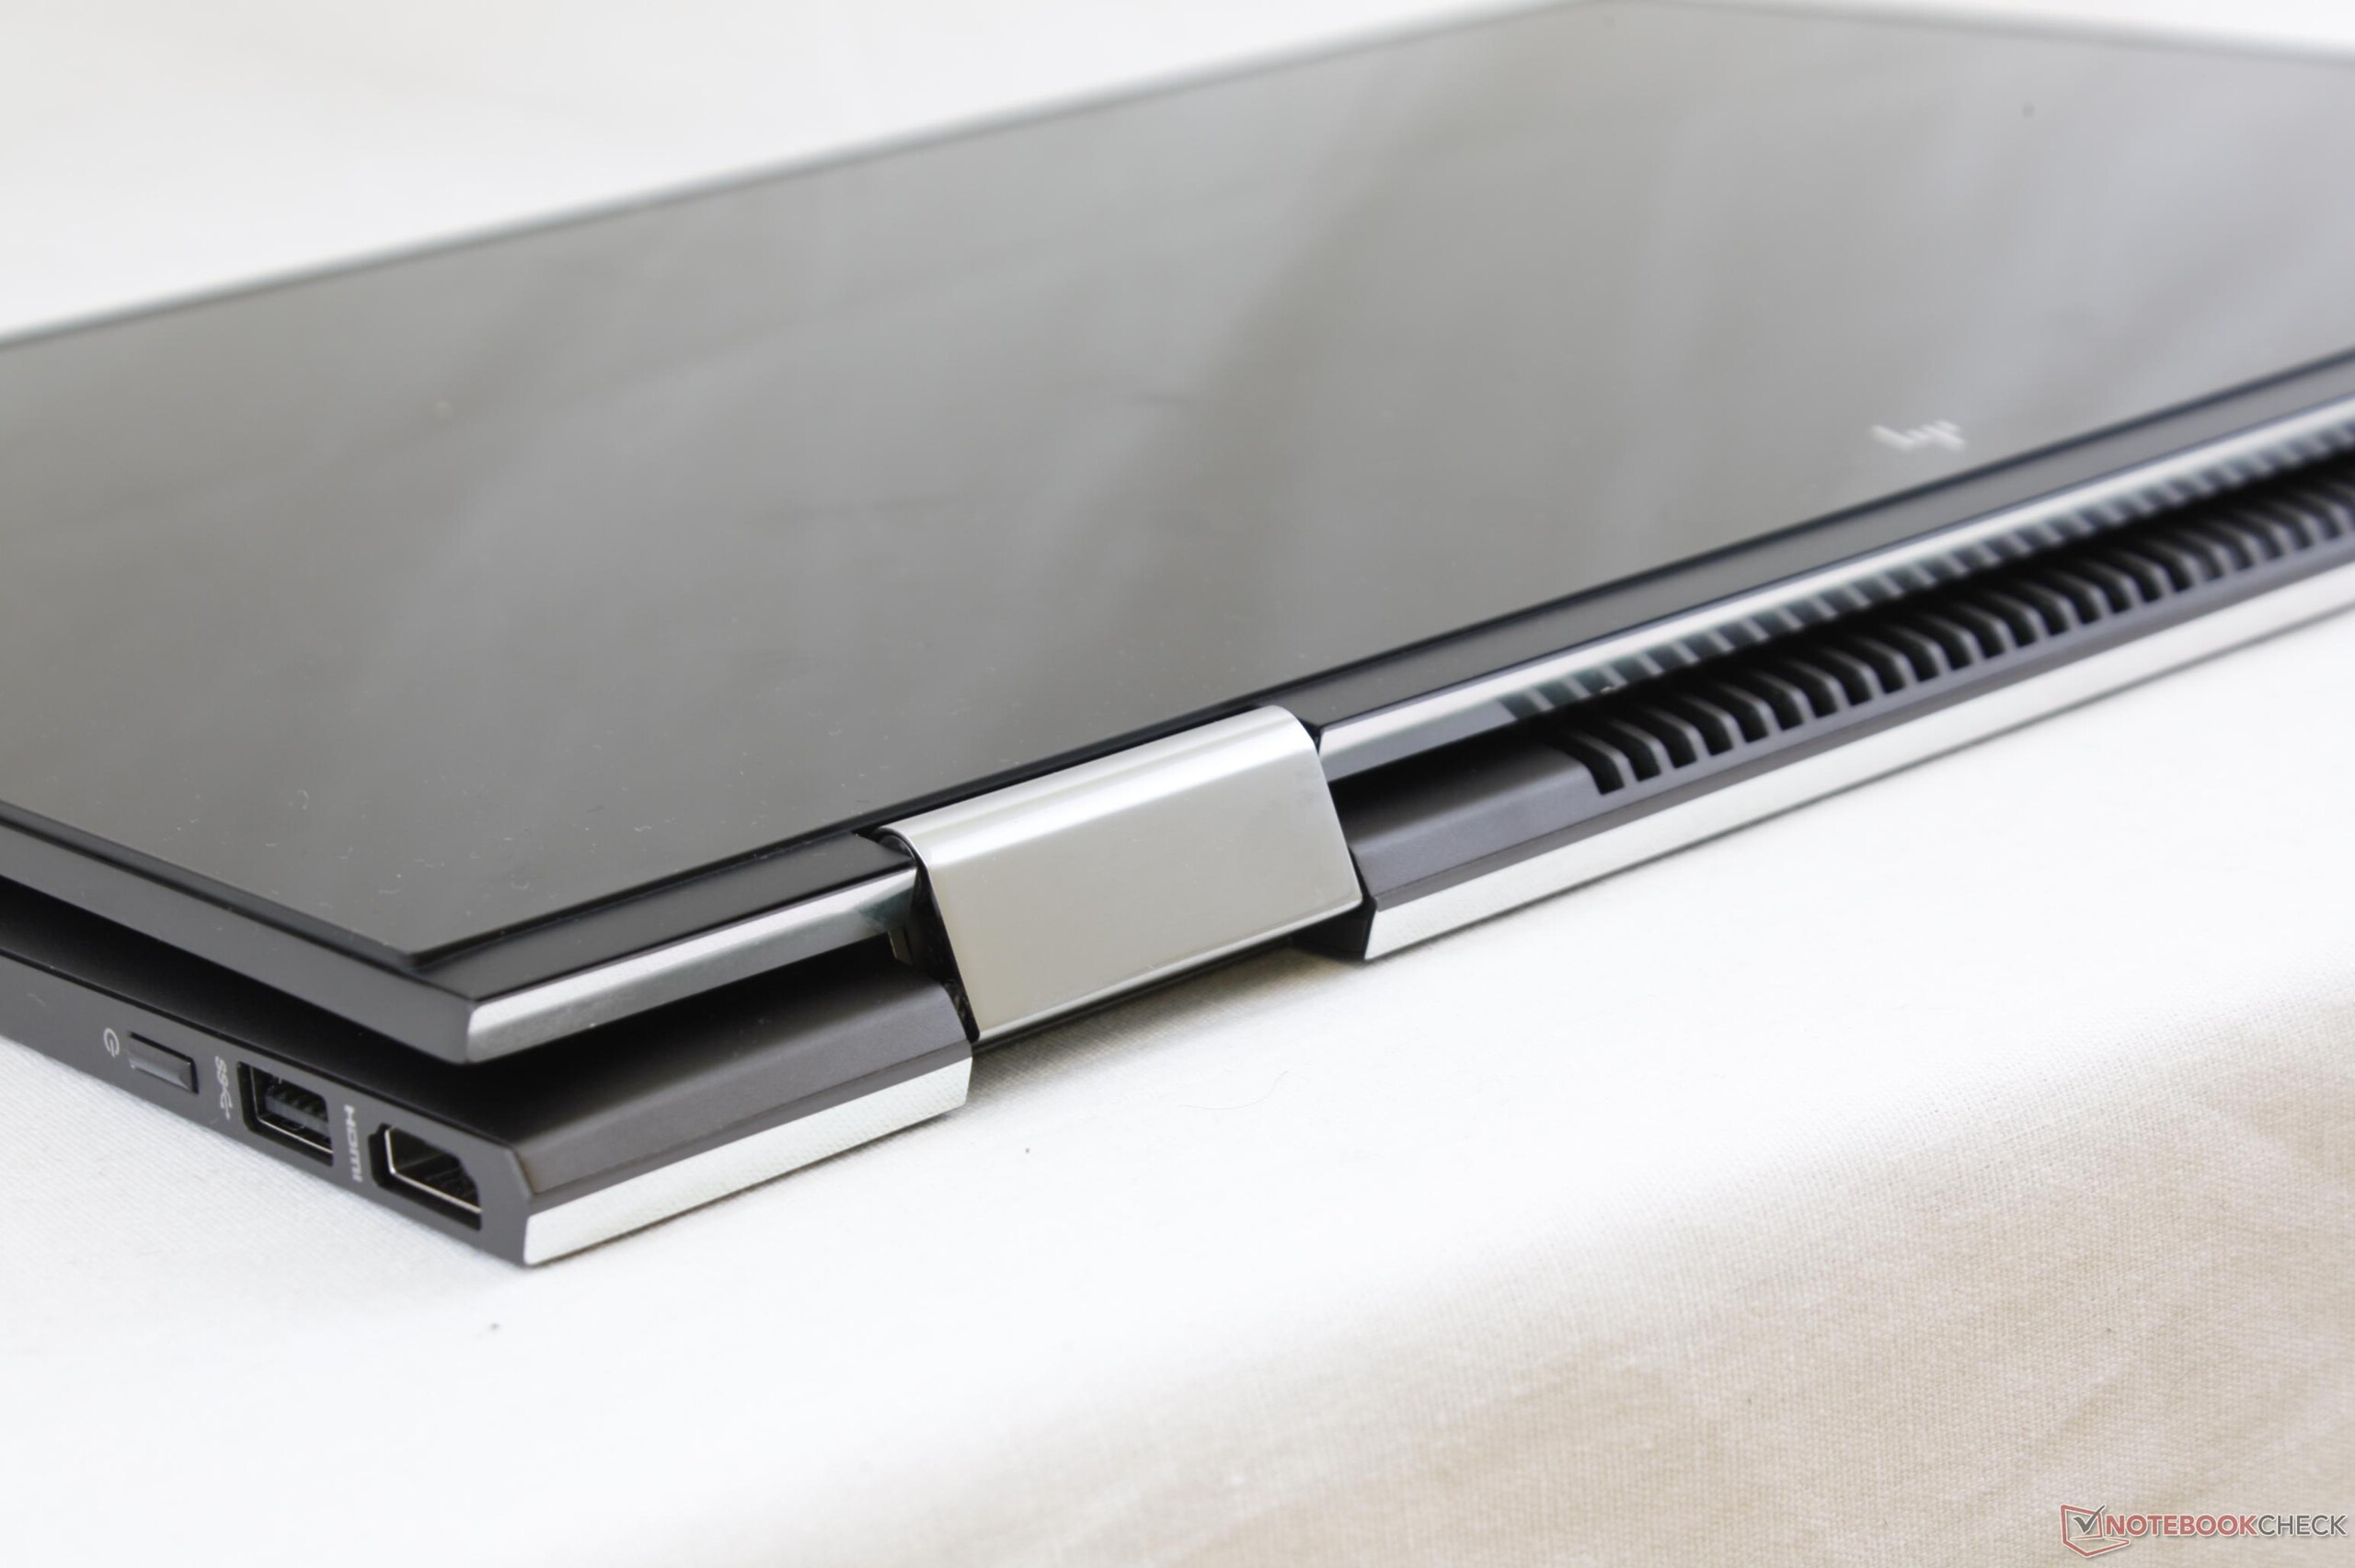
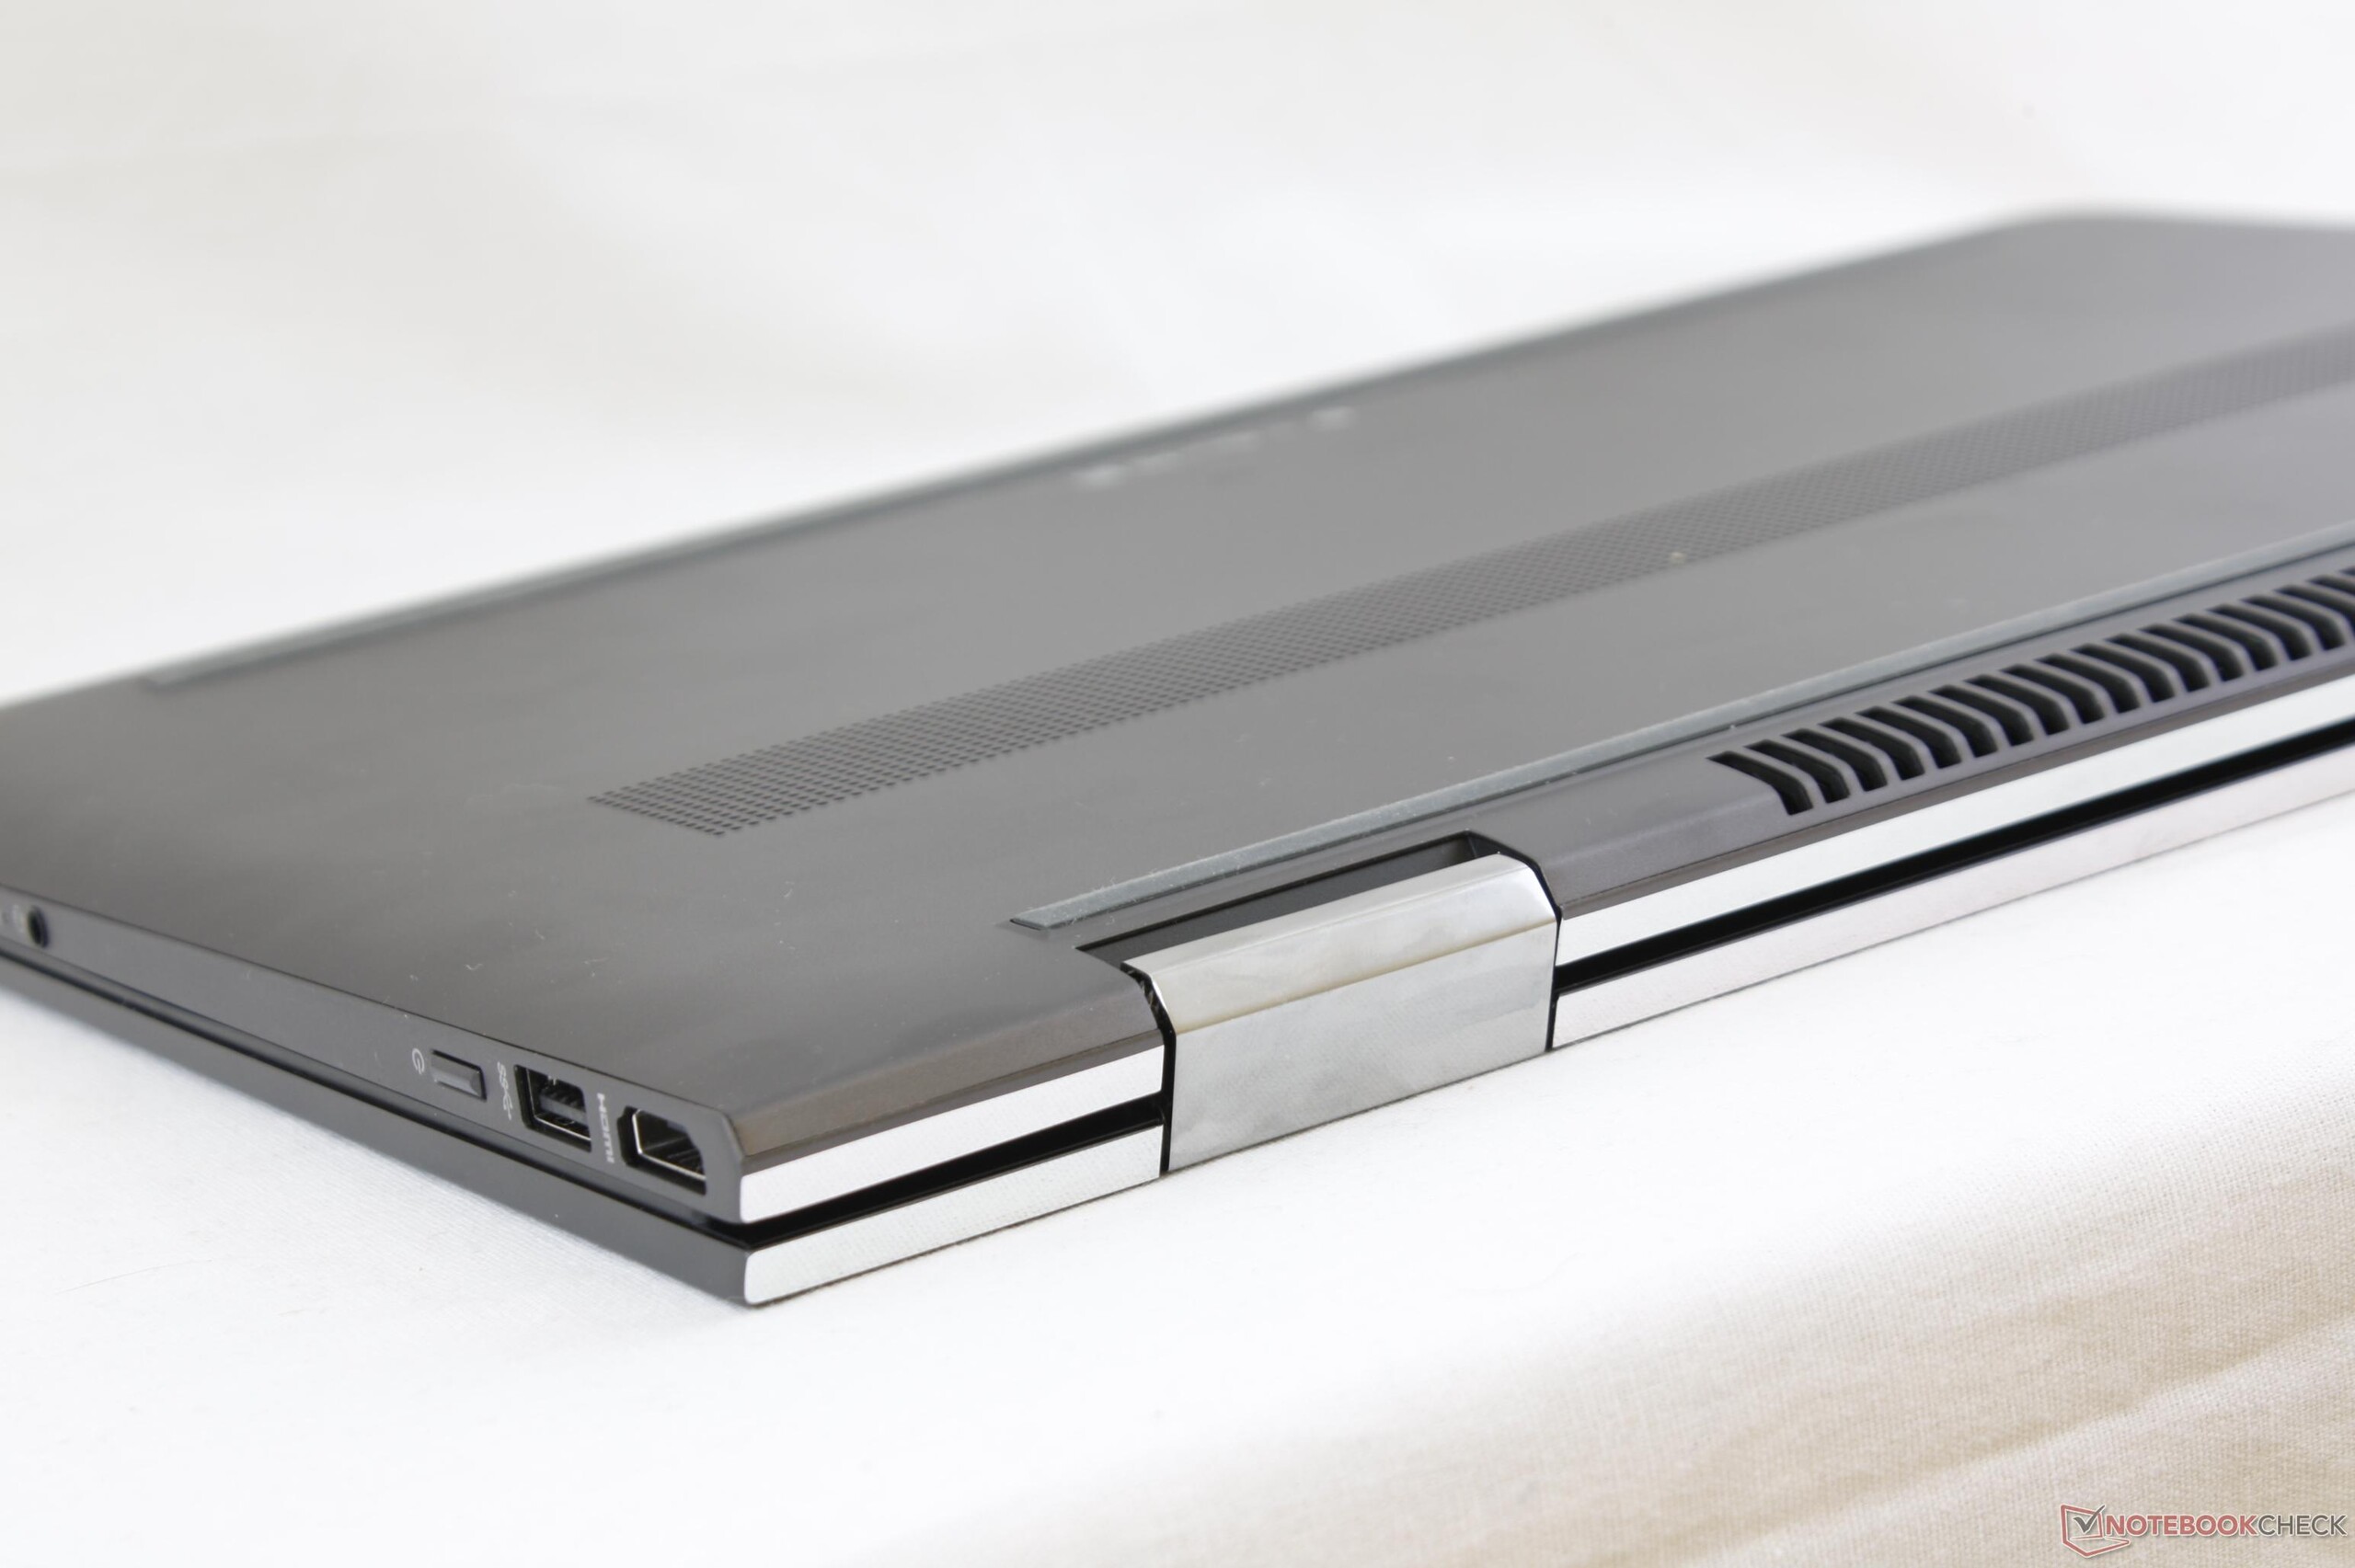
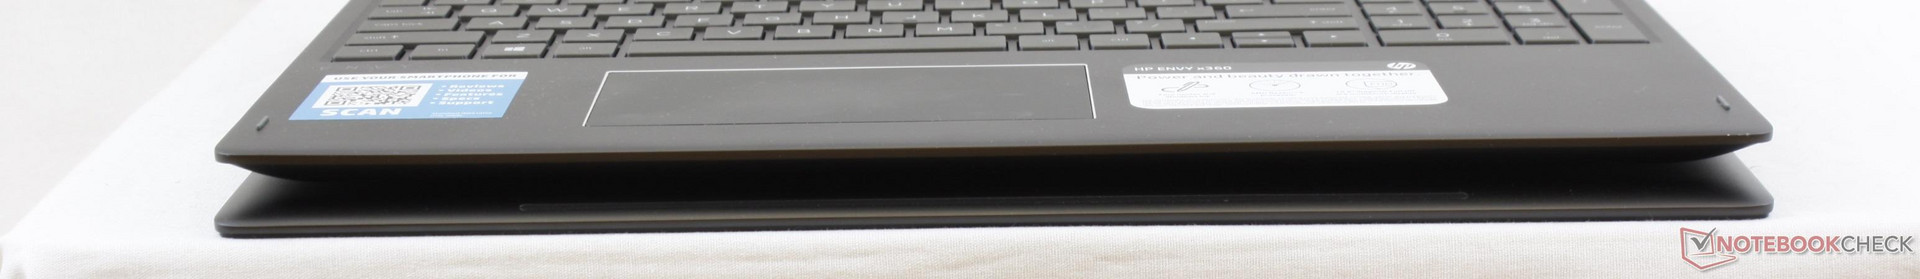
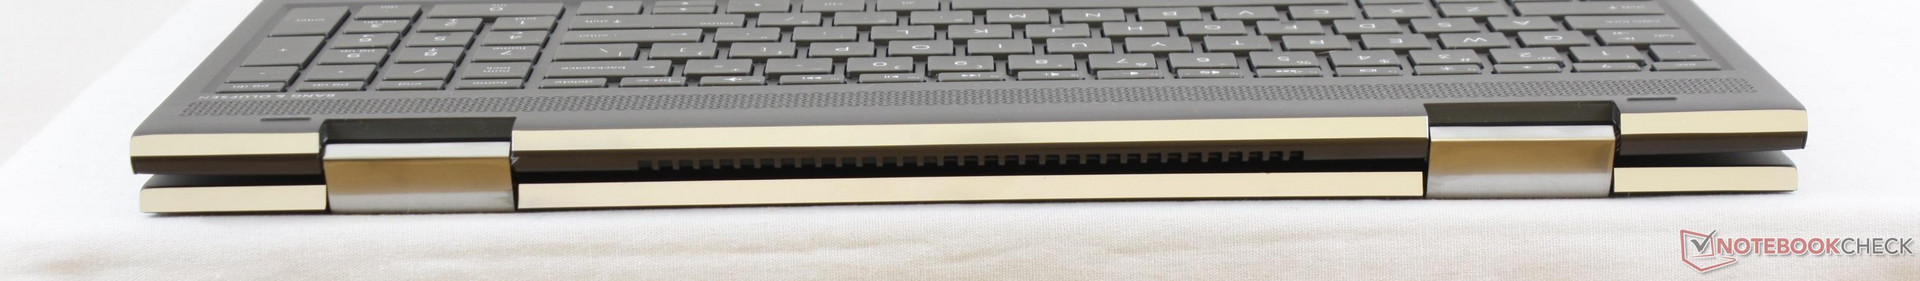
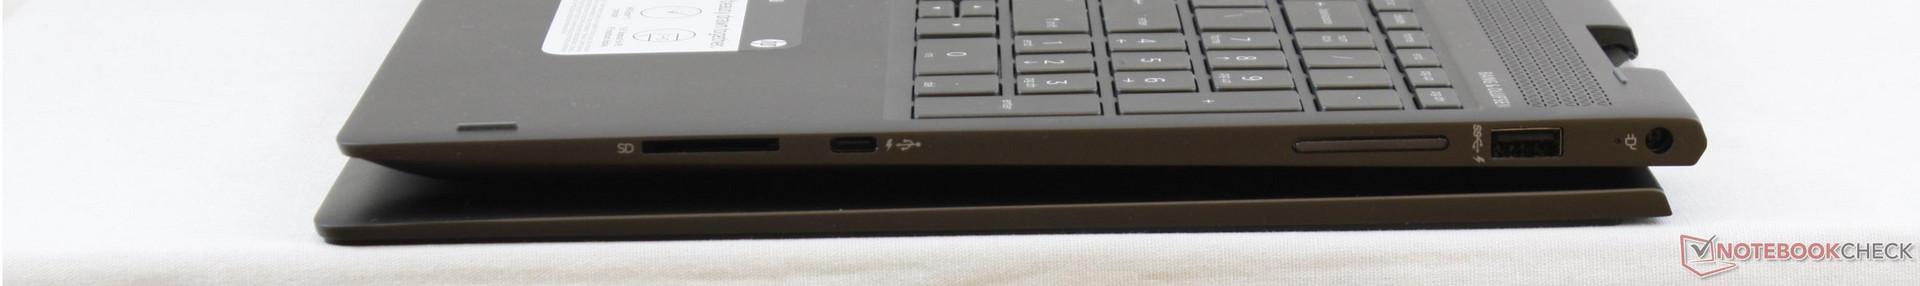
A segunda parte do nosso veredicto é sobre o portátil HP como um todo. O fabricante incorporou com sucesso os marcos estreitos da classe Spectre em sua linha Envy que é mais elegante e tão dura quanto a geração de saída. Além do redesenho do chassi, no entanto, não muito melhorou. Essa era a chance da HP de aprimorar todos os aspectos da série Envy x360 15, mas, em vez disso, temos a mesma tela táctil escura de 1080p, espaço de cores limitado e características PWM como modelo do ano passado. Os alto-falantes, o leitor SD, o teclado, o trackpad, as dobradiças, o peso total e o ruído do ventilador pulsante também não foram melhorados tangivelmente sobre o modelo 2016. A maior aposta, então, é o aspecto mais fino e talvez a duração da bateria ligeiramente mais longa e o USB Type-C Gen. 1 porta neste redesenho recente.
A nova plataforma Raven Ridge da AMD é uma conquista louvável, mas é uma pena que sofra dos mesmos problemas de software e de controladores que ocorrem há muitos anos neste fabricante de chips. Não podemos recomendar este sistema HP AMD baseado em HD, pelo menos até que as falhas da GPU tenham sido corrigidas.
HP Envy x360 15m-bq121dx
- 11/30/2017 v6 (old)
Allen Ngo
Price comparison
