Breve Análise do Portátil MSI GS75 8SG Stealth (i7-8750H, RTX 2080 Max-Q)
| Networking | |
| iperf3 transmit AX12 | |
| MSI GE75 8SF | |
| Schenker XMG Neo 17 | |
| MSI GS75 8SG Stealth | |
| Asus Zephyrus S GX701GX | |
| Lenovo Legion Y740-17ICH | |
| iperf3 receive AX12 | |
| MSI GS75 8SG Stealth | |
| Asus Zephyrus S GX701GX | |
| Schenker XMG Neo 17 | |
| MSI GE75 8SF | |
| Lenovo Legion Y740-17ICH | |
| |||||||||||||||||||||||||
iluminação: 85 %
iluminação com acumulador: 355 cd/m²
Contraste: 1365:1 (Preto: 0.26 cd/m²)
ΔE ColorChecker Calman: 1.54 | ∀{0.5-29.43 Ø4.71}
calibrated: 0.77
ΔE Greyscale Calman: 2.19 | ∀{0.09-98 Ø4.96}
95% sRGB (Argyll 1.6.3 3D)
61% AdobeRGB 1998 (Argyll 1.6.3 3D)
65.5% AdobeRGB 1998 (Argyll 3D)
95.4% sRGB (Argyll 3D)
63.6% Display P3 (Argyll 3D)
Gamma: 2.42
CCT: 6893 K
| MSI GS75 8SG Stealth N173HCE-G33 (CMN175C), IPS, 1920x1080 | Asus Zephyrus S GX701GX B173HAN04.0 (AUO409D), IPS, 1920x1080 | Lenovo Legion Y740-17ICH AU Optronics B173HAN03.2, IPS, 1920x1080 | Schenker XMG Neo 17 BOEhydis NV173FHM-N44 (BOE07B6), IPS, 1920x1080 | MSI GE75 8SF Chi Mei N173HCE-G33, IPS, 1920x1080 | |
|---|---|---|---|---|---|
| Display | -4% | -2% | 1% | -1% | |
| Display P3 Coverage (%) | 63.6 | 62.9 -1% | 64 1% | 65.2 3% | 63.1 -1% |
| sRGB Coverage (%) | 95.4 | 87.8 -8% | 90.4 -5% | 92.2 -3% | 94.4 -1% |
| AdobeRGB 1998 Coverage (%) | 65.5 | 63.9 -2% | 64.8 -1% | 66.5 2% | 65.2 0% |
| Response Times | 3% | -69% | -86% | -17% | |
| Response Time Grey 50% / Grey 80% * (ms) | 7.6 ? | 7.2 ? 5% | 15.6 ? -105% | 18.8 ? -147% | 9.6 ? -26% |
| Response Time Black / White * (ms) | 9.6 ? | 9.6 ? -0% | 12.8 ? -33% | 12 ? -25% | 10.4 ? -8% |
| PWM Frequency (Hz) | 25510 ? | 971 ? | 25770 ? | ||
| Screen | -29% | -99% | -31% | -1% | |
| Brightness middle (cd/m²) | 355 | 288 -19% | 299.1 -16% | 304 -14% | 370.4 4% |
| Brightness (cd/m²) | 327 | 287 -12% | 273 -17% | 289 -12% | 348 6% |
| Brightness Distribution (%) | 85 | 91 7% | 81 -5% | 90 6% | 89 5% |
| Black Level * (cd/m²) | 0.26 | 0.2 23% | 0.27 -4% | 0.26 -0% | 0.29 -12% |
| Contrast (:1) | 1365 | 1440 5% | 1108 -19% | 1169 -14% | 1277 -6% |
| Colorchecker dE 2000 * | 1.54 | 2.33 -51% | 5.07 -229% | 2.65 -72% | 1.26 18% |
| Colorchecker dE 2000 max. * | 3 | 5.34 -78% | 10.55 -252% | 6.11 -104% | 3.02 -1% |
| Colorchecker dE 2000 calibrated * | 0.77 | 2.47 -221% | 3.31 -330% | 1.5 -95% | 1.21 -57% |
| Greyscale dE 2000 * | 2.19 | 1.19 46% | 6.8 -211% | 2.75 -26% | 1.4 36% |
| Gamma | 2.42 91% | 2.41 91% | 2.46 89% | 2.46 89% | 2.2 100% |
| CCT | 6893 94% | 6710 97% | 7805 83% | 6763 96% | 6747 96% |
| Color Space (Percent of AdobeRGB 1998) (%) | 61 | 57 -7% | 58.5 -4% | 60 -2% | 59.7 -2% |
| Color Space (Percent of sRGB) (%) | 95 | 88 -7% | 89.9 -5% | 92 -3% | 94.4 -1% |
| Média Total (Programa/Configurações) | -10% /
-20% | -57% /
-77% | -39% /
-32% | -6% /
-3% |
* ... menor é melhor
Exibir tempos de resposta
| ↔ Tempo de resposta preto para branco | ||
|---|---|---|
| 9.6 ms ... ascensão ↗ e queda ↘ combinadas | ↗ 5.2 ms ascensão | 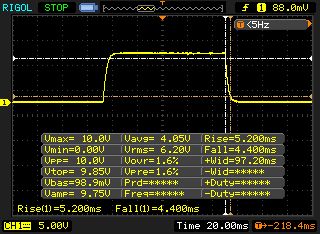 |
| ↘ 4.4 ms queda | ||
| A tela mostra taxas de resposta rápidas em nossos testes e deve ser adequada para jogos. Em comparação, todos os dispositivos testados variam de 0.1 (mínimo) a 240 (máximo) ms. » 26 % de todos os dispositivos são melhores. Isso significa que o tempo de resposta medido é melhor que a média de todos os dispositivos testados (19.8 ms). | ||
| ↔ Tempo de resposta 50% cinza a 80% cinza | ||
| 7.6 ms ... ascensão ↗ e queda ↘ combinadas | ↗ 3.8 ms ascensão | 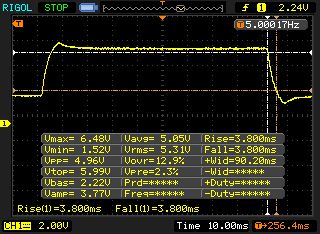 |
| ↘ 3.8 ms queda | ||
| A tela mostra taxas de resposta muito rápidas em nossos testes e deve ser muito adequada para jogos em ritmo acelerado. Em comparação, todos os dispositivos testados variam de 0.165 (mínimo) a 636 (máximo) ms. » 21 % de todos os dispositivos são melhores. Isso significa que o tempo de resposta medido é melhor que a média de todos os dispositivos testados (30.9 ms). | ||
Cintilação da tela / PWM (modulação por largura de pulso)
| Tela tremeluzindo/PWM detectado | 25510 Hz | ≤ 17 % configuração de brilho | 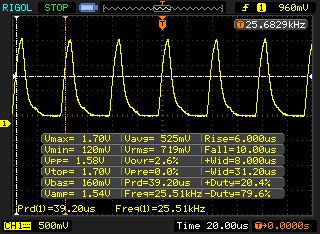 |
A luz de fundo da tela pisca em 25510 Hz (pior caso, por exemplo, utilizando PWM) Cintilação detectada em uma configuração de brilho de 17 % e abaixo. Não deve haver cintilação ou PWM acima desta configuração de brilho. A frequência de 25510 Hz é bastante alta, então a maioria dos usuários sensíveis ao PWM não deve notar nenhuma oscilação. [pwm_comparison] Em comparação: 52 % de todos os dispositivos testados não usam PWM para escurecer a tela. Se PWM foi detectado, uma média de 7748 (mínimo: 5 - máximo: 343500) Hz foi medida. | |||
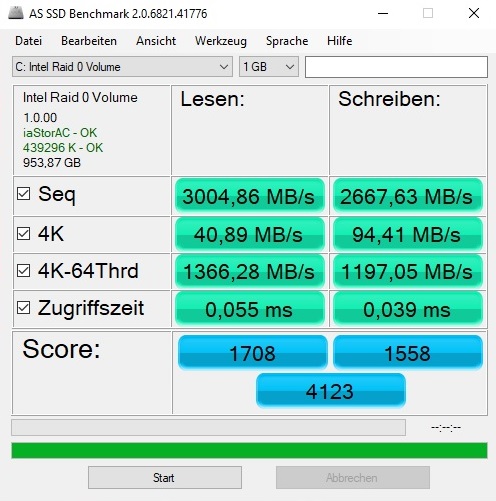
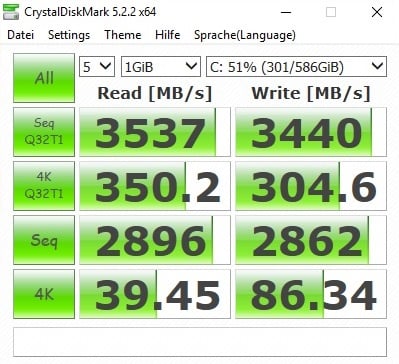
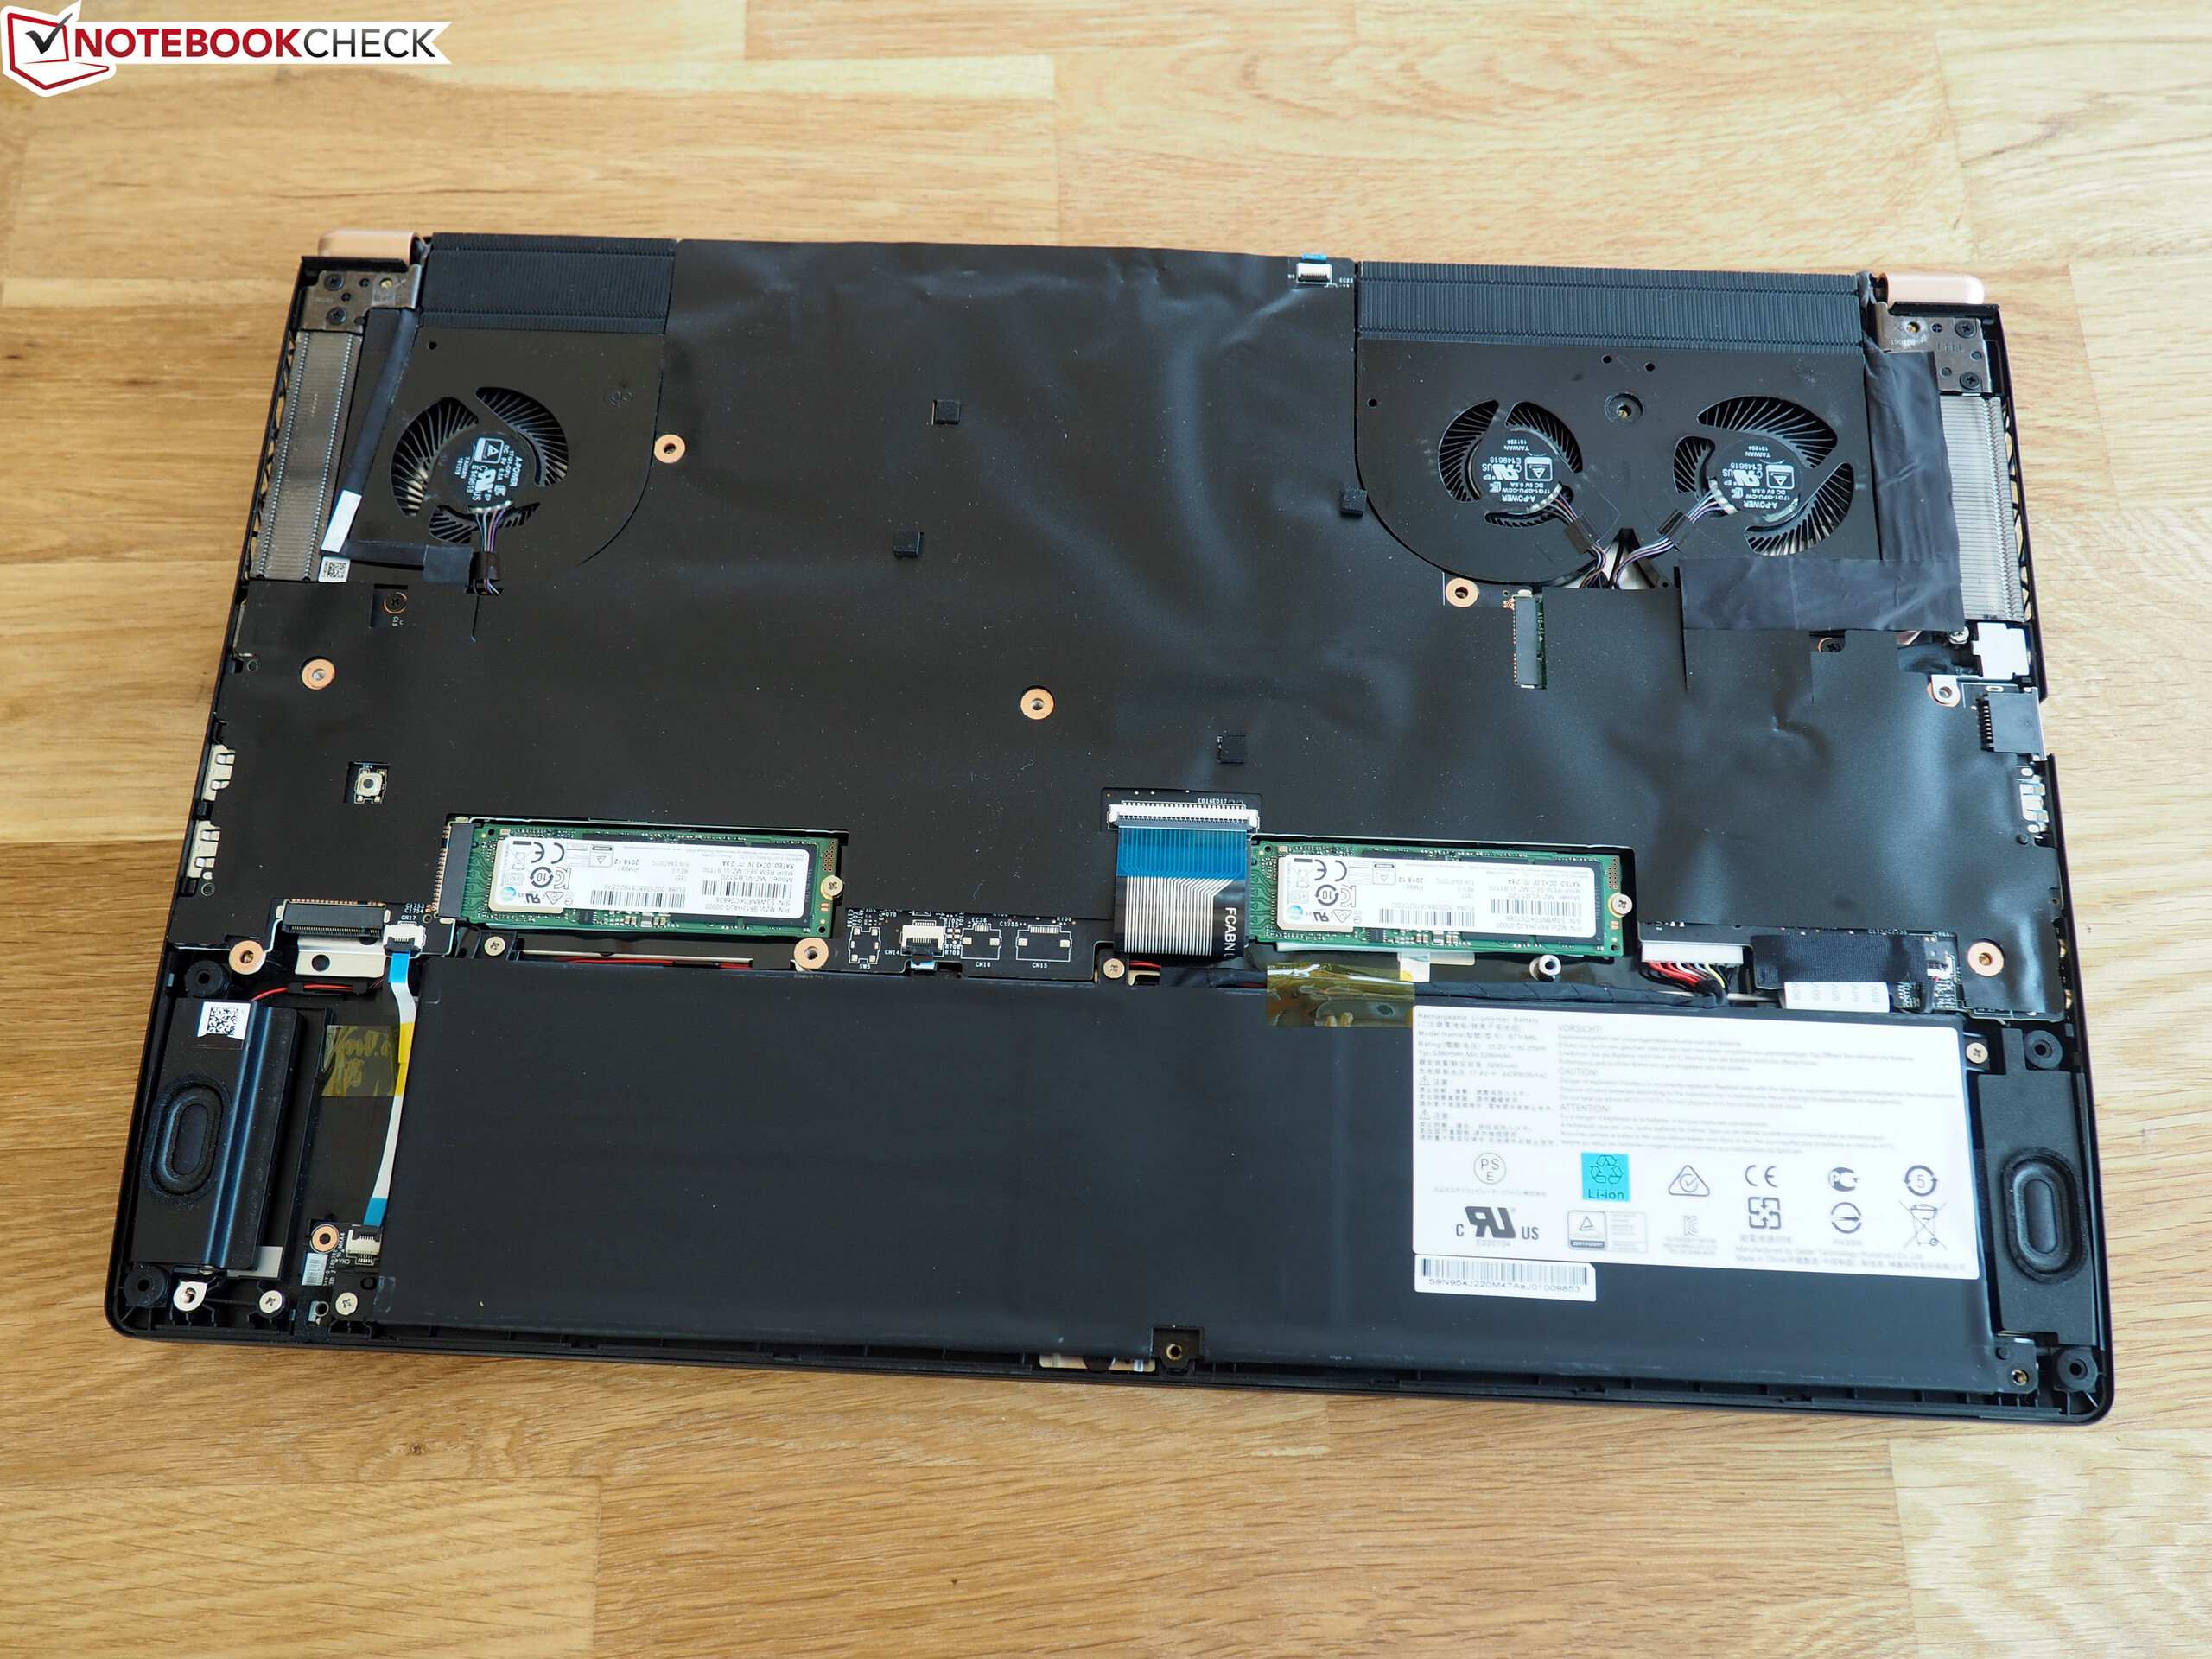
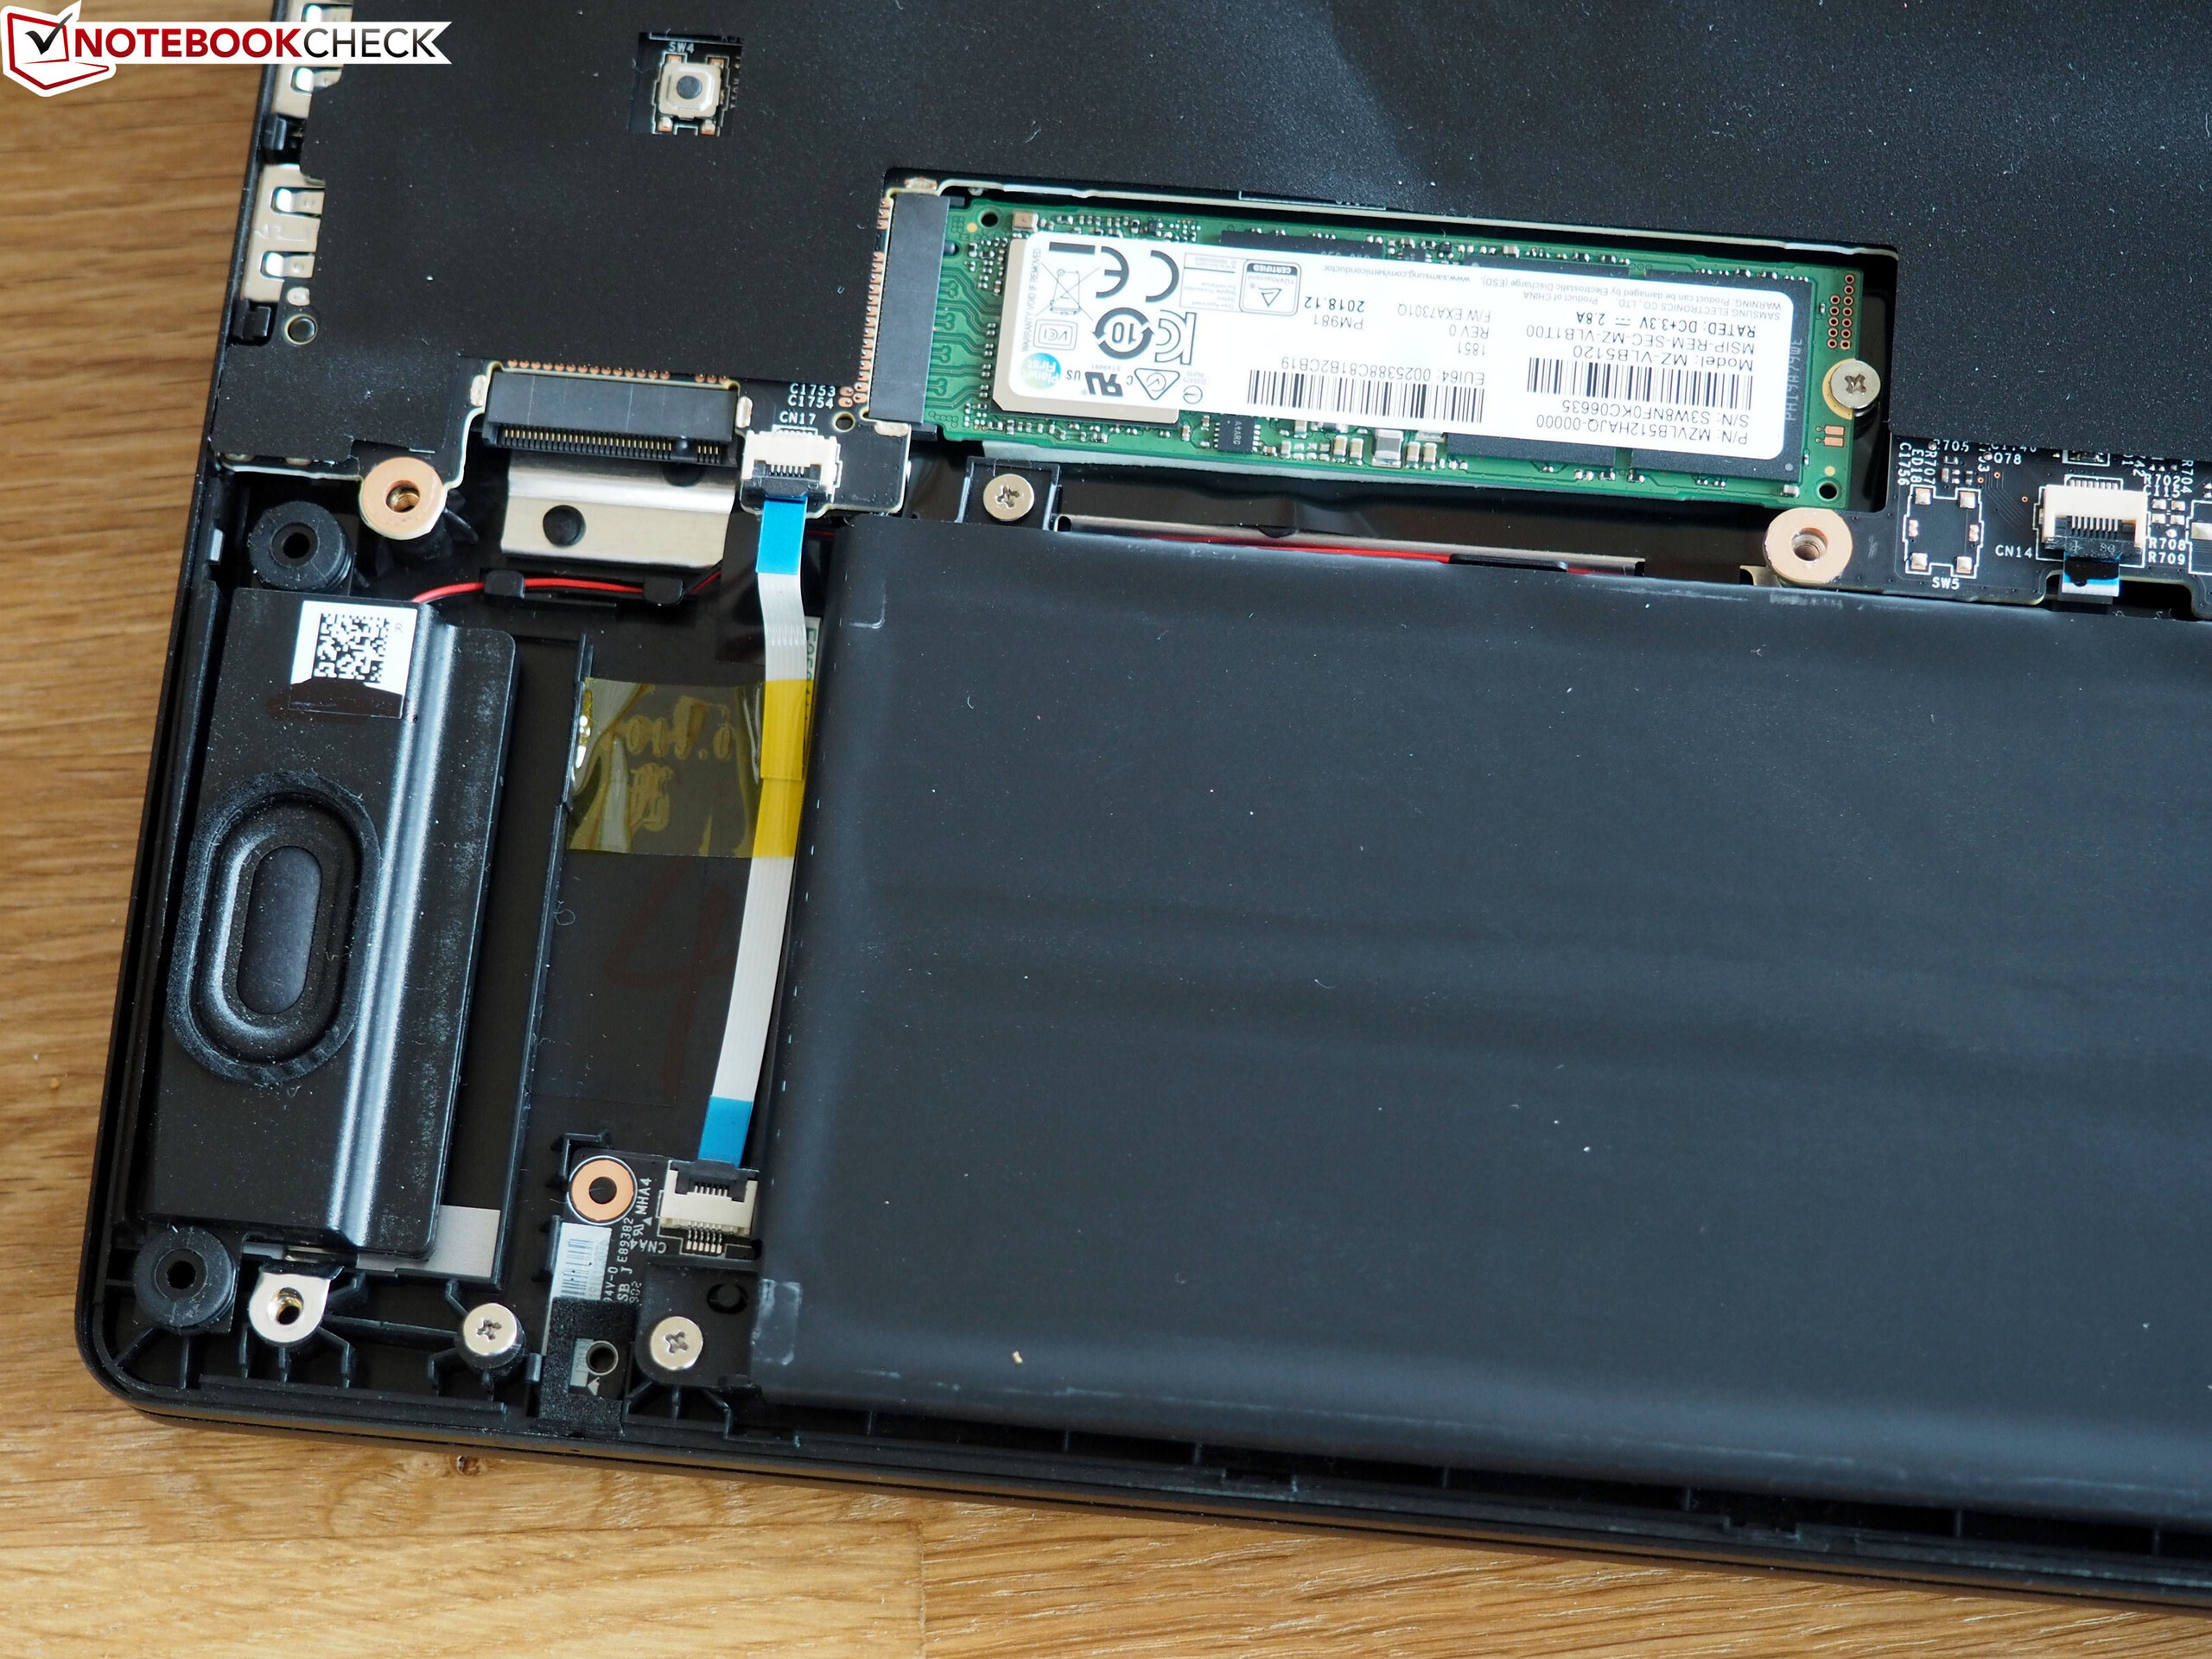
| MSI GS75 8SG Stealth 2x Samsung SSD PM981 MZVLB512HAJQ (RAID 0) | Asus Zephyrus S GX701GX Samsung SSD PM981 MZVLB1T0HALR | Lenovo Legion Y740-17ICH Samsung SSD PM981 MZVLB256HAHQ | Schenker XMG Neo 17 Samsung SSD 970 EVO Plus 1TB | MSI GE75 8SF Kingston RBUSNS8154P3256GJ1 | |
|---|---|---|---|---|---|
| AS SSD | 10% | -29% | 23% | -49% | |
| Seq Read (MB/s) | 3005 | 911 -70% | 1153 -62% | 2359 -21% | 949 -68% |
| Seq Write (MB/s) | 2668 | 2347 -12% | 1328 -50% | 2469 -7% | 823 -69% |
| 4K Read (MB/s) | 40.89 | 53 30% | 35.05 -14% | 53.5 31% | 25.36 -38% |
| 4K Write (MB/s) | 94.4 | 122.5 30% | 96 2% | 117.6 25% | 67.1 -29% |
| 4K-64 Read (MB/s) | 1366 | 1577 15% | 727 -47% | 1579 16% | 748 -45% |
| 4K-64 Write (MB/s) | 1197 | 1734 45% | 1212 1% | 2048 71% | 650 -46% |
| Score Read (Points) | 1708 | 1721 1% | 878 -49% | 1869 9% | 869 -49% |
| Score Write (Points) | 1558 | 2091 34% | 1441 -8% | 2413 55% | 799 -49% |
| Score Total (Points) | 4123 | 4771 16% | 2784 -32% | 5248 27% | 2109 -49% |

| 3DMark 11 - 1280x720 Performance GPU | |
| Média da turma Gaming (21841 - 80022, n=103, últimos 2 anos) | |
| Asus Zephyrus S GX701GX | |
| MSI GS75 8SG Stealth | |
| MSI GE75 8SF | |
| Lenovo Legion Y740-17ICH | |
| Schenker XMG Neo 17 | |
| 3DMark 11 Performance | 19735 pontos | |
| 3DMark Fire Strike Score | 15962 pontos | |
| 3DMark Time Spy Score | 7180 pontos | |
Ajuda | ||
| The Witcher 3 | |
| 1920x1080 Ultra Graphics & Postprocessing (HBAO+) | |
| Média da turma Gaming (104.7 - 240, n=7, últimos 2 anos) | |
| Asus Zephyrus S GX701GX | |
| MSI GS75 8SG Stealth | |
| Lenovo Legion Y740-17ICH | |
| Schenker XMG Neo 17 | |
| MSI GE75 8SF | |
| 3840x2160 High Graphics & Postprocessing (Nvidia HairWorks Off) | |
| Média da turma Gaming (114 - 170.9, n=4, últimos 2 anos) | |
| Asus Zephyrus S GX701GX | |
| MSI GS75 8SG Stealth | |
| Schenker XMG Neo 17 | |
| baixo | média | alto | ultra | QHD | 4K | |
|---|---|---|---|---|---|---|
| The Witcher 3 (2015) | 75.4 | 50.6 | ||||
| Shadow of the Tomb Raider (2018) | 75 | 58 | 33 | |||
| Battlefield V (2018) | 112 | 91.2 | 52.4 | |||
| Apex Legends (2019) | 130 | 128 | ||||
| Far Cry New Dawn (2019) | 92 | 82 | ||||
| Metro Exodus (2019) | 66.4 | 54 | ||||
| Anthem (2019) | 86.1 | 78.9 | ||||
| Dirt Rally 2.0 (2019) | 143 | 85.1 | ||||
| The Division 2 (2019) | 93 | 77 |
Barulho
| Ocioso |
| 31 / 32 / 41 dB |
| Carga |
| 47 / 48 dB |
 | ||
30 dB silencioso 40 dB(A) audível 50 dB(A) ruidosamente alto |
||
min: | ||
| MSI GS75 8SG Stealth GeForce RTX 2080 Max-Q, i7-8750H | Asus Zephyrus S GX701GX GeForce RTX 2080 Max-Q, i7-8750H | Lenovo Legion Y740-17ICH GeForce RTX 2080 Max-Q, i7-8750H | Schenker XMG Neo 17 GeForce RTX 2070 Mobile, i7-8750H | MSI GE75 8SF GeForce RTX 2070 Mobile, i7-8750H | Média da turma Gaming | |
|---|---|---|---|---|---|---|
| Noise | 3% | 10% | 5% | 0% | 12% | |
| desligado / ambiente * (dB) | 30 | 29 3% | 28.3 6% | 29 3% | 28.3 6% | 24.1 ? 20% |
| Idle Minimum * (dB) | 31 | 29 6% | 31.5 -2% | 29 6% | 33.5 -8% | 25.9 ? 16% |
| Idle Average * (dB) | 32 | 32 -0% | 31.6 1% | 32 -0% | 33.6 -5% | 27.4 ? 14% |
| Idle Maximum * (dB) | 41 | 33 20% | 31.6 23% | 33 20% | 35 15% | 30.1 ? 27% |
| Load Average * (dB) | 47 | 47 -0% | 32.3 31% | 42 11% | 38 19% | 43.7 ? 7% |
| Witcher 3 ultra * (dB) | 47 | 49 -4% | 43 9% | 49 -4% | 50 -6% | |
| Load Maximum * (dB) | 48 | 51 -6% | 45.5 5% | 49 -2% | 56.9 -19% | 54.3 ? -13% |
* ... menor é melhor
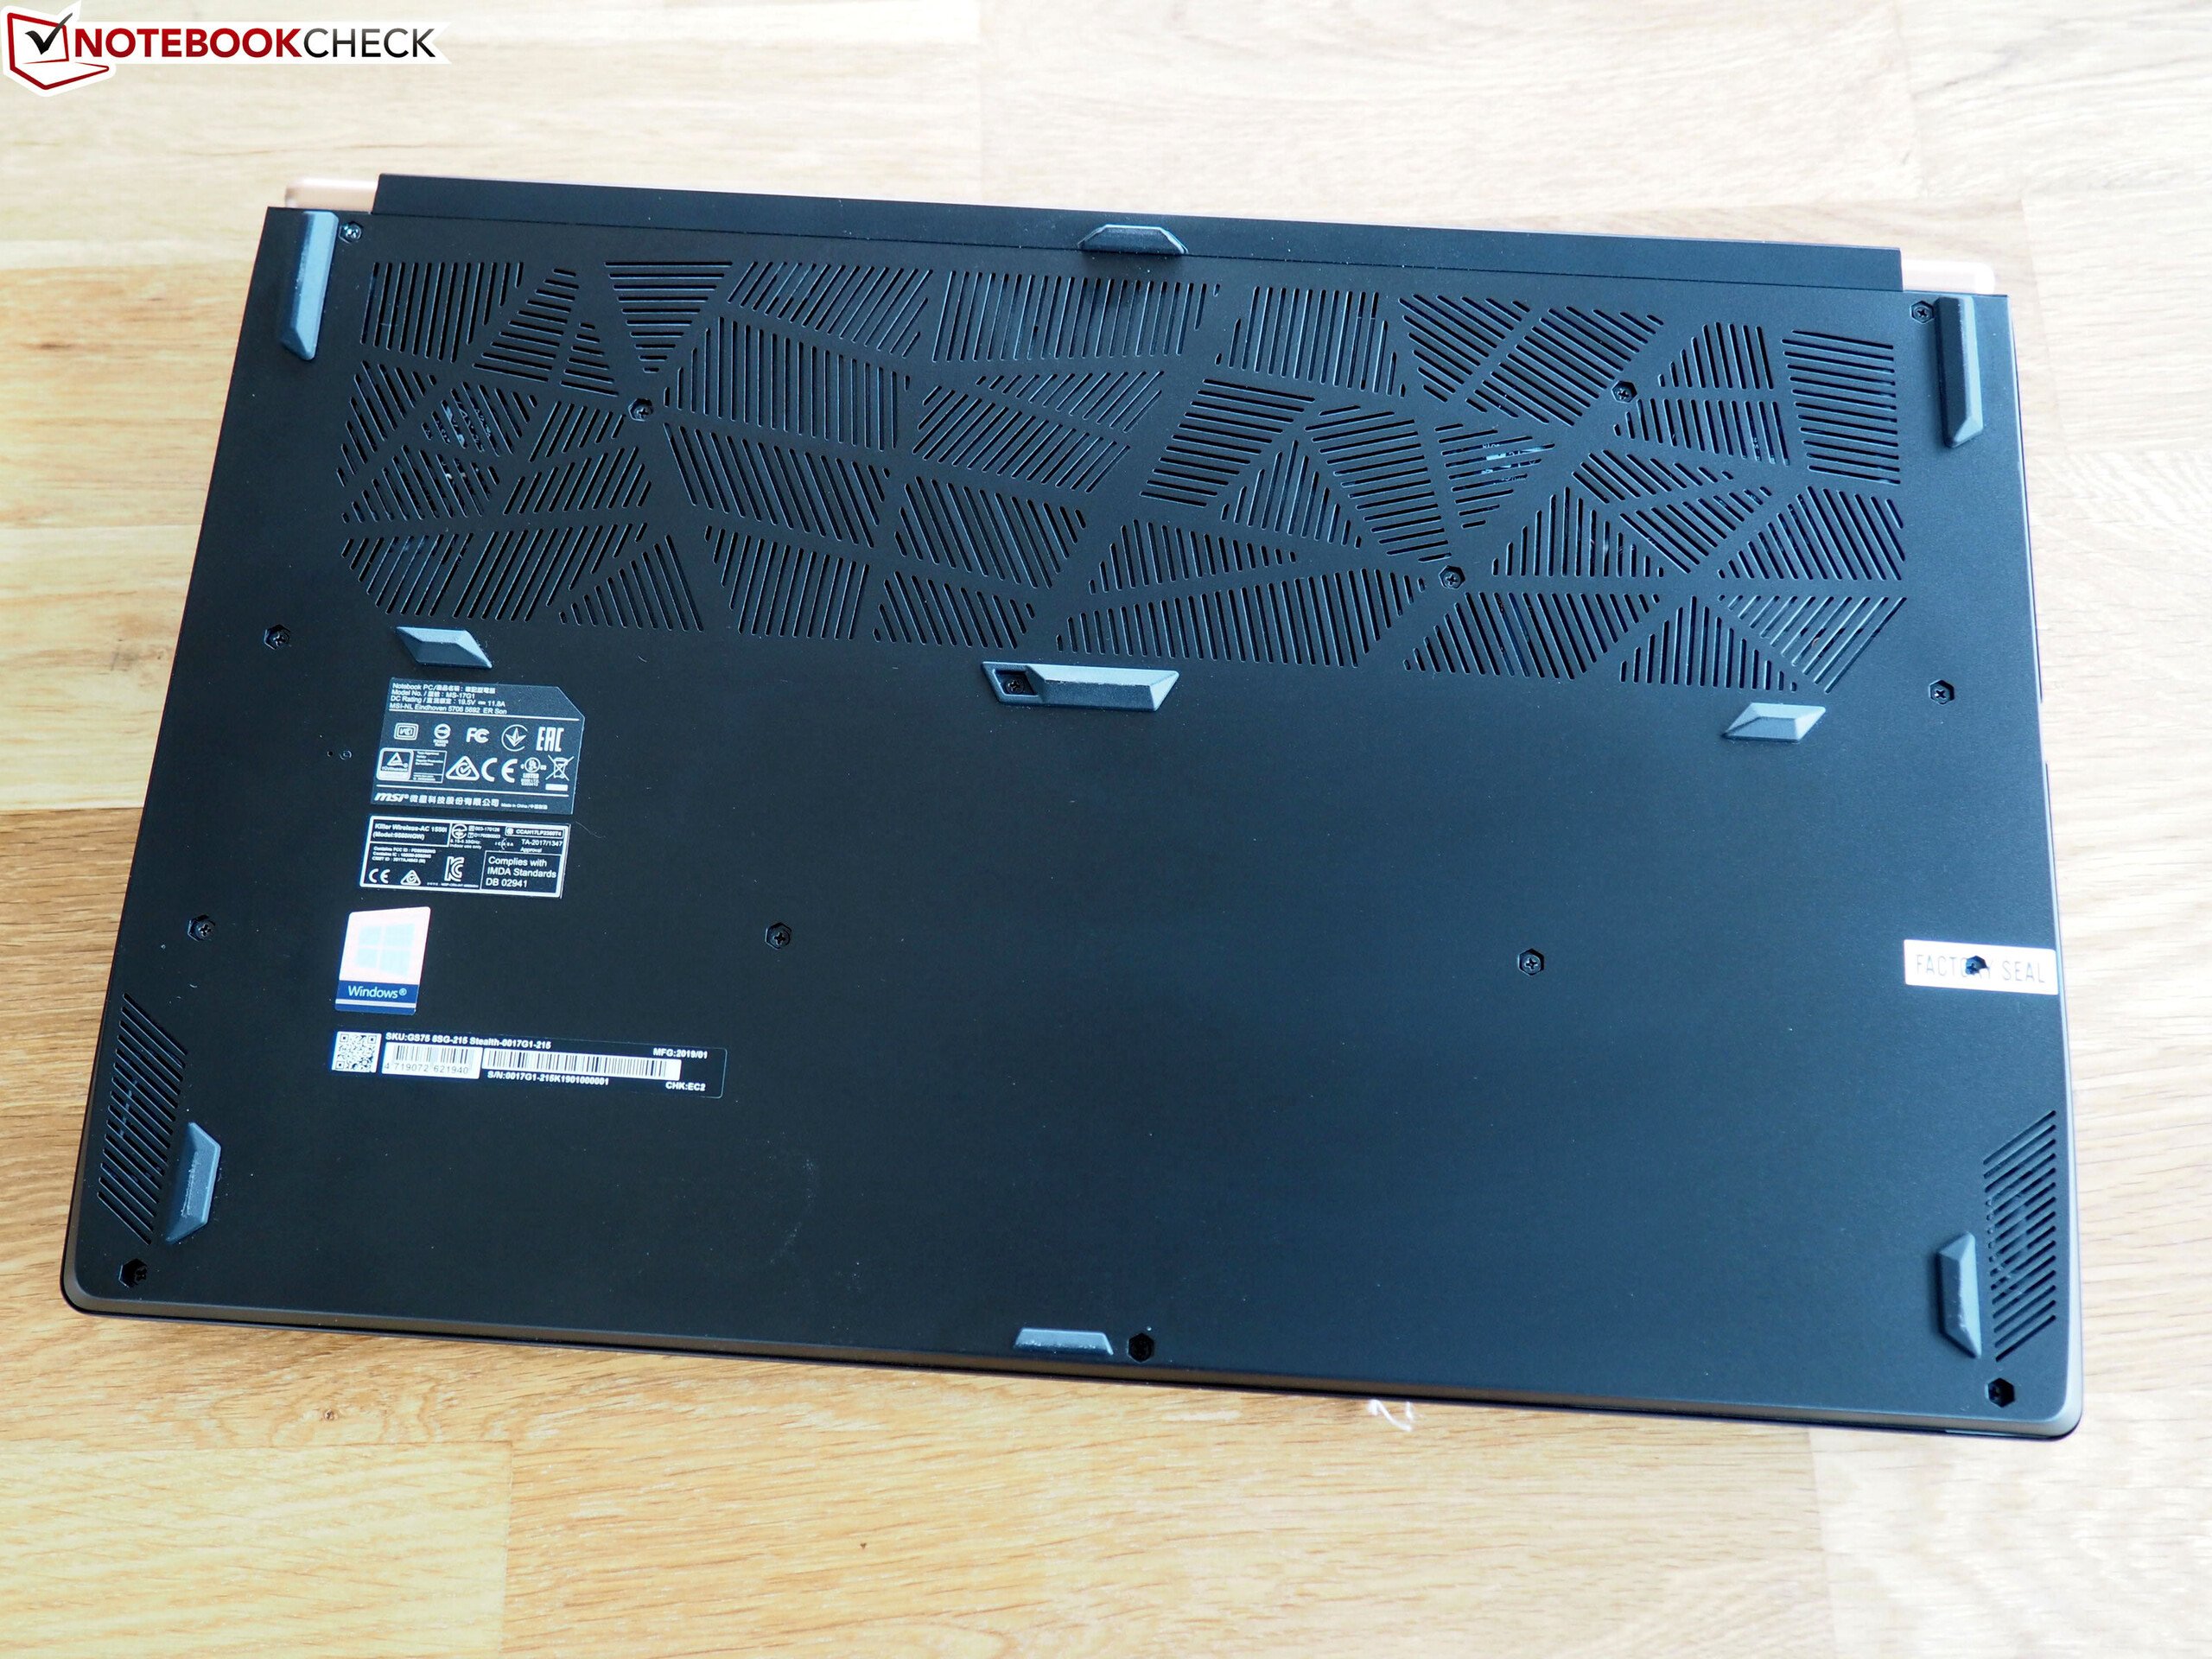
(-) A temperatura máxima no lado superior é 48 °C / 118 F, em comparação com a média de 40.4 °C / 105 F , variando de 21.2 a 68.8 °C para a classe Gaming.
(-) A parte inferior aquece até um máximo de 58 °C / 136 F, em comparação com a média de 43.2 °C / 110 F
(+) Em uso inativo, a temperatura média para o lado superior é 25.4 °C / 78 F, em comparação com a média do dispositivo de 33.9 °C / ### class_avg_f### F.
(-) Jogando The Witcher 3, a temperatura média para o lado superior é 42.1 °C / 108 F, em comparação com a média do dispositivo de 33.9 °C / ## #class_avg_f### F.
(-) Os apoios para as mãos e o touchpad podem ficar muito quentes ao toque, com um máximo de 40 °C / 104 F.
(-) A temperatura média da área do apoio para as mãos de dispositivos semelhantes foi 28.8 °C / 83.8 F (-11.2 °C / -20.2 F).
| MSI GS75 8SG Stealth GeForce RTX 2080 Max-Q, i7-8750H | Asus Zephyrus S GX701GX GeForce RTX 2080 Max-Q, i7-8750H | Lenovo Legion Y740-17ICH GeForce RTX 2080 Max-Q, i7-8750H | Schenker XMG Neo 17 GeForce RTX 2070 Mobile, i7-8750H | MSI GE75 8SF GeForce RTX 2070 Mobile, i7-8750H | Média da turma Gaming | |
|---|---|---|---|---|---|---|
| Heat | 1% | 4% | 0% | 9% | -2% | |
| Maximum Upper Side * (°C) | 48 | 53 -10% | 38.6 20% | 47 2% | 41.2 14% | 45.1 ? 6% |
| Maximum Bottom * (°C) | 58 | 50 14% | 43.6 25% | 56 3% | 46 21% | 48.1 ? 17% |
| Idle Upper Side * (°C) | 29 | 27 7% | 30.2 -4% | 28 3% | 26.2 10% | 31 ? -7% |
| Idle Bottom * (°C) | 28 | 30 -7% | 35 -25% | 30 -7% | 30.2 -8% | 34.2 ? -22% |
* ... menor é melhor
MSI GS75 8SG Stealth análise de áudio
(±) | o volume do alto-falante é médio, mas bom (###valor### dB)
Graves 100 - 315Hz
(-) | quase nenhum baixo - em média 23.2% menor que a mediana
(±) | a linearidade dos graves é média (7% delta para a frequência anterior)
Médios 400 - 2.000 Hz
(±) | médios mais altos - em média 8.8% maior que a mediana
(±) | a linearidade dos médios é média (8.5% delta para frequência anterior)
Altos 2 - 16 kHz
(+) | agudos equilibrados - apenas 2.9% longe da mediana
(+) | os máximos são lineares (6% delta da frequência anterior)
Geral 100 - 16.000 Hz
(±) | a linearidade do som geral é média (27.3% diferença em relação à mediana)
Comparado com a mesma classe
» 93% de todos os dispositivos testados nesta classe foram melhores, 1% semelhantes, 5% piores
» O melhor teve um delta de 6%, a média foi 18%, o pior foi 132%
Comparado com todos os dispositivos testados
» 83% de todos os dispositivos testados foram melhores, 4% semelhantes, 13% piores
» O melhor teve um delta de 4%, a média foi 23%, o pior foi 134%
MSI GS65 8RF-019DE Stealth Thin análise de áudio
(±) | o volume do alto-falante é médio, mas bom (###valor### dB)
Graves 100 - 315Hz
(-) | quase nenhum baixo - em média 16.4% menor que a mediana
(±) | a linearidade dos graves é média (9.7% delta para a frequência anterior)
Médios 400 - 2.000 Hz
(+) | médios equilibrados - apenas 4.9% longe da mediana
(+) | médios são lineares (5.6% delta para frequência anterior)
Altos 2 - 16 kHz
(+) | agudos equilibrados - apenas 2.5% longe da mediana
(±) | a linearidade dos máximos é média (7.1% delta para frequência anterior)
Geral 100 - 16.000 Hz
(±) | a linearidade do som geral é média (18.5% diferença em relação à mediana)
Comparado com a mesma classe
» 60% de todos os dispositivos testados nesta classe foram melhores, 8% semelhantes, 32% piores
» O melhor teve um delta de 6%, a média foi 18%, o pior foi 132%
Comparado com todos os dispositivos testados
» 42% de todos os dispositivos testados foram melhores, 8% semelhantes, 51% piores
» O melhor teve um delta de 4%, a média foi 23%, o pior foi 134%
| desligado | |
| Ocioso | |
| Carga |
|
Key:
min: | |
| MSI GS75 8SG Stealth GeForce RTX 2080 Max-Q, i7-8750H | Asus Zephyrus S GX701GX GeForce RTX 2080 Max-Q, i7-8750H | Lenovo Legion Y740-17ICH GeForce RTX 2080 Max-Q, i7-8750H | Schenker XMG Neo 17 GeForce RTX 2070 Mobile, i7-8750H | MSI GE75 8SF GeForce RTX 2070 Mobile, i7-8750H | Média da turma Gaming | |
|---|---|---|---|---|---|---|
| Power Consumption | -22% | -20% | 0% | -18% | -13% | |
| Idle Minimum * (Watt) | 13 | 19 -46% | 20.2 -55% | 13 -0% | 16.4 -26% | 13.1 ? -1% |
| Idle Average * (Watt) | 17 | 22 -29% | 27.2 -60% | 16 6% | 21.9 -29% | 19 ? -12% |
| Idle Maximum * (Watt) | 23 | 30 -30% | 28.7 -25% | 21 9% | 25.4 -10% | 24.6 ? -7% |
| Load Average * (Watt) | 90 | 104 -16% | 90.8 -1% | 96 -7% | 90.7 -1% | 111.3 ? -24% |
| Witcher 3 ultra * (Watt) | 147 | 167 -14% | 152.1 -3% | 172 -17% | 203.3 -38% | |
| Load Maximum * (Watt) | 215 | 203 6% | 165.4 23% | 191 11% | 222.9 -4% | 260 ? -21% |
* ... menor é melhor
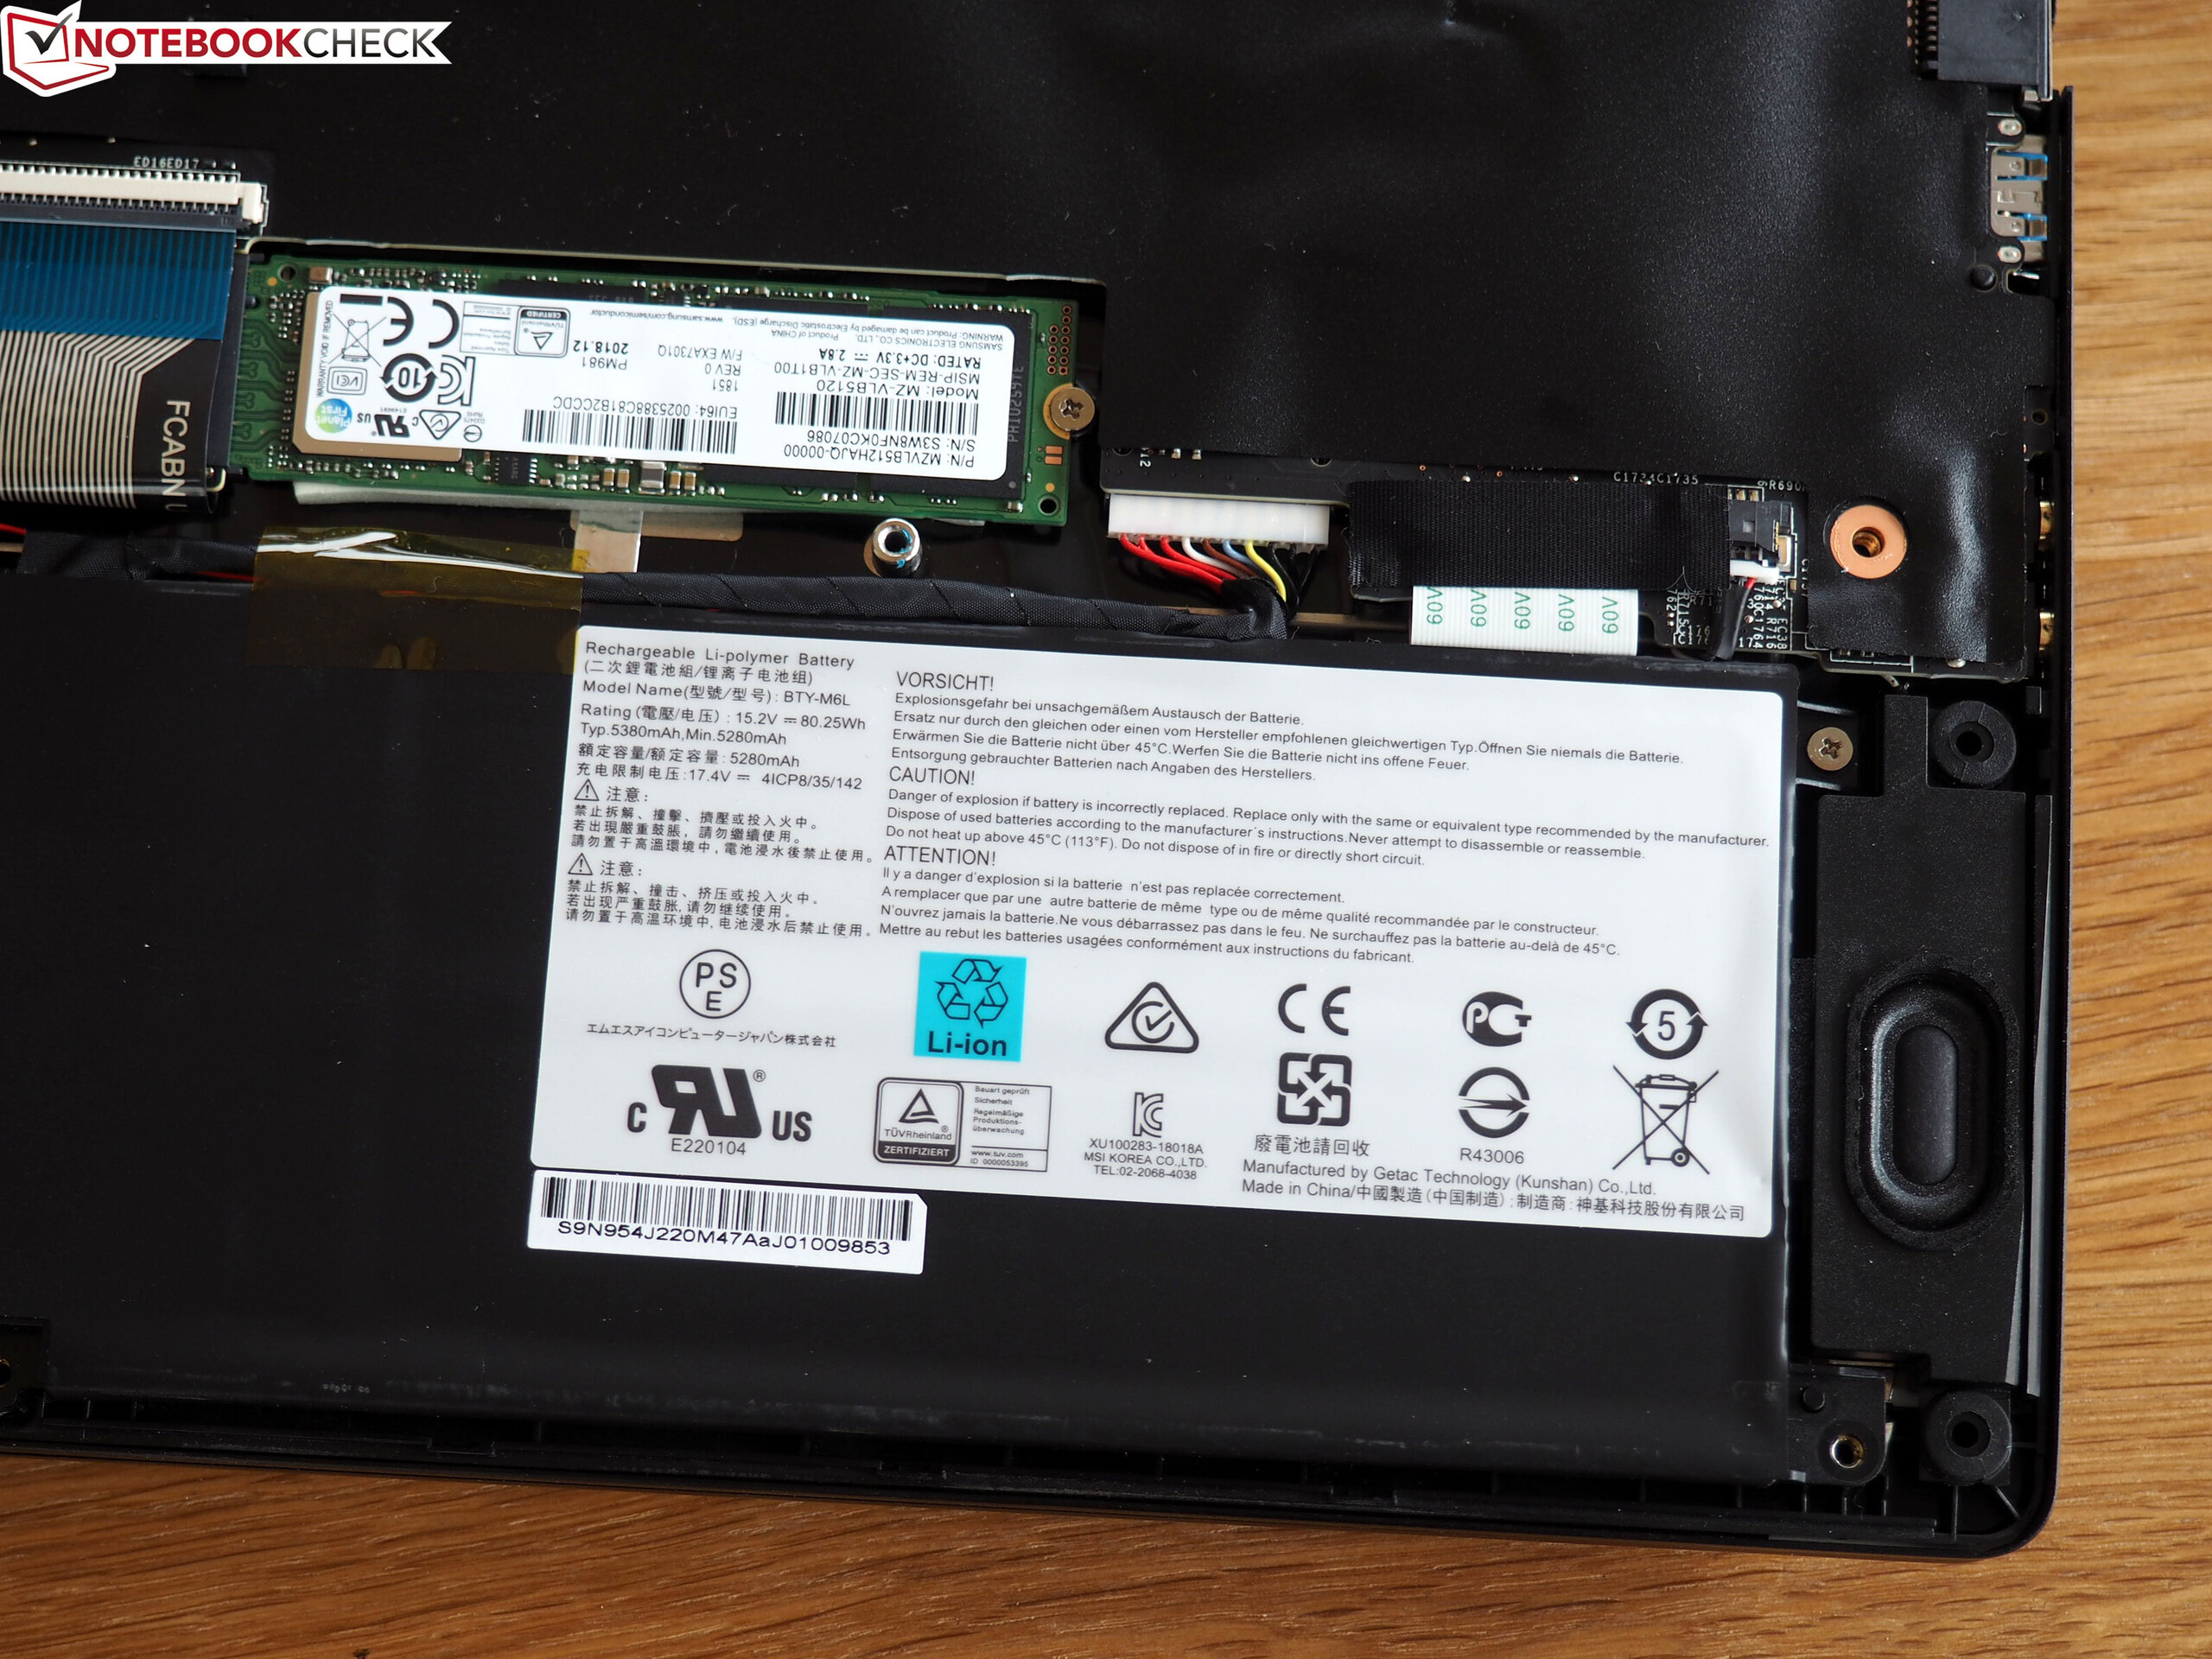
| MSI GS75 8SG Stealth GeForce RTX 2080 Max-Q, i7-8750H, 80.25 Wh | Asus Zephyrus S GX701GX GeForce RTX 2080 Max-Q, i7-8750H, 76 Wh | Lenovo Legion Y740-17ICH GeForce RTX 2080 Max-Q, i7-8750H, 76 Wh | Schenker XMG Neo 17 GeForce RTX 2070 Mobile, i7-8750H, 46.74 Wh | MSI GE75 8SF GeForce RTX 2070 Mobile, i7-8750H, 65 Wh | Média da turma Gaming | |
|---|---|---|---|---|---|---|
| Duração da bateria | -21% | -40% | -20% | -34% | 34% | |
| Reader / Idle (h) | 7.7 | 5 -35% | 5.3 -31% | 7.84 ? 2% | ||
| WiFi v1.3 (h) | 5.3 | 3.8 -28% | 3.2 -40% | 3.7 -30% | 3.5 -34% | 7.08 ? 34% |
| Load (h) | 0.9 | 0.9 0% | 0.9 0% | 1.496 ? 66% |
Pro
Contra
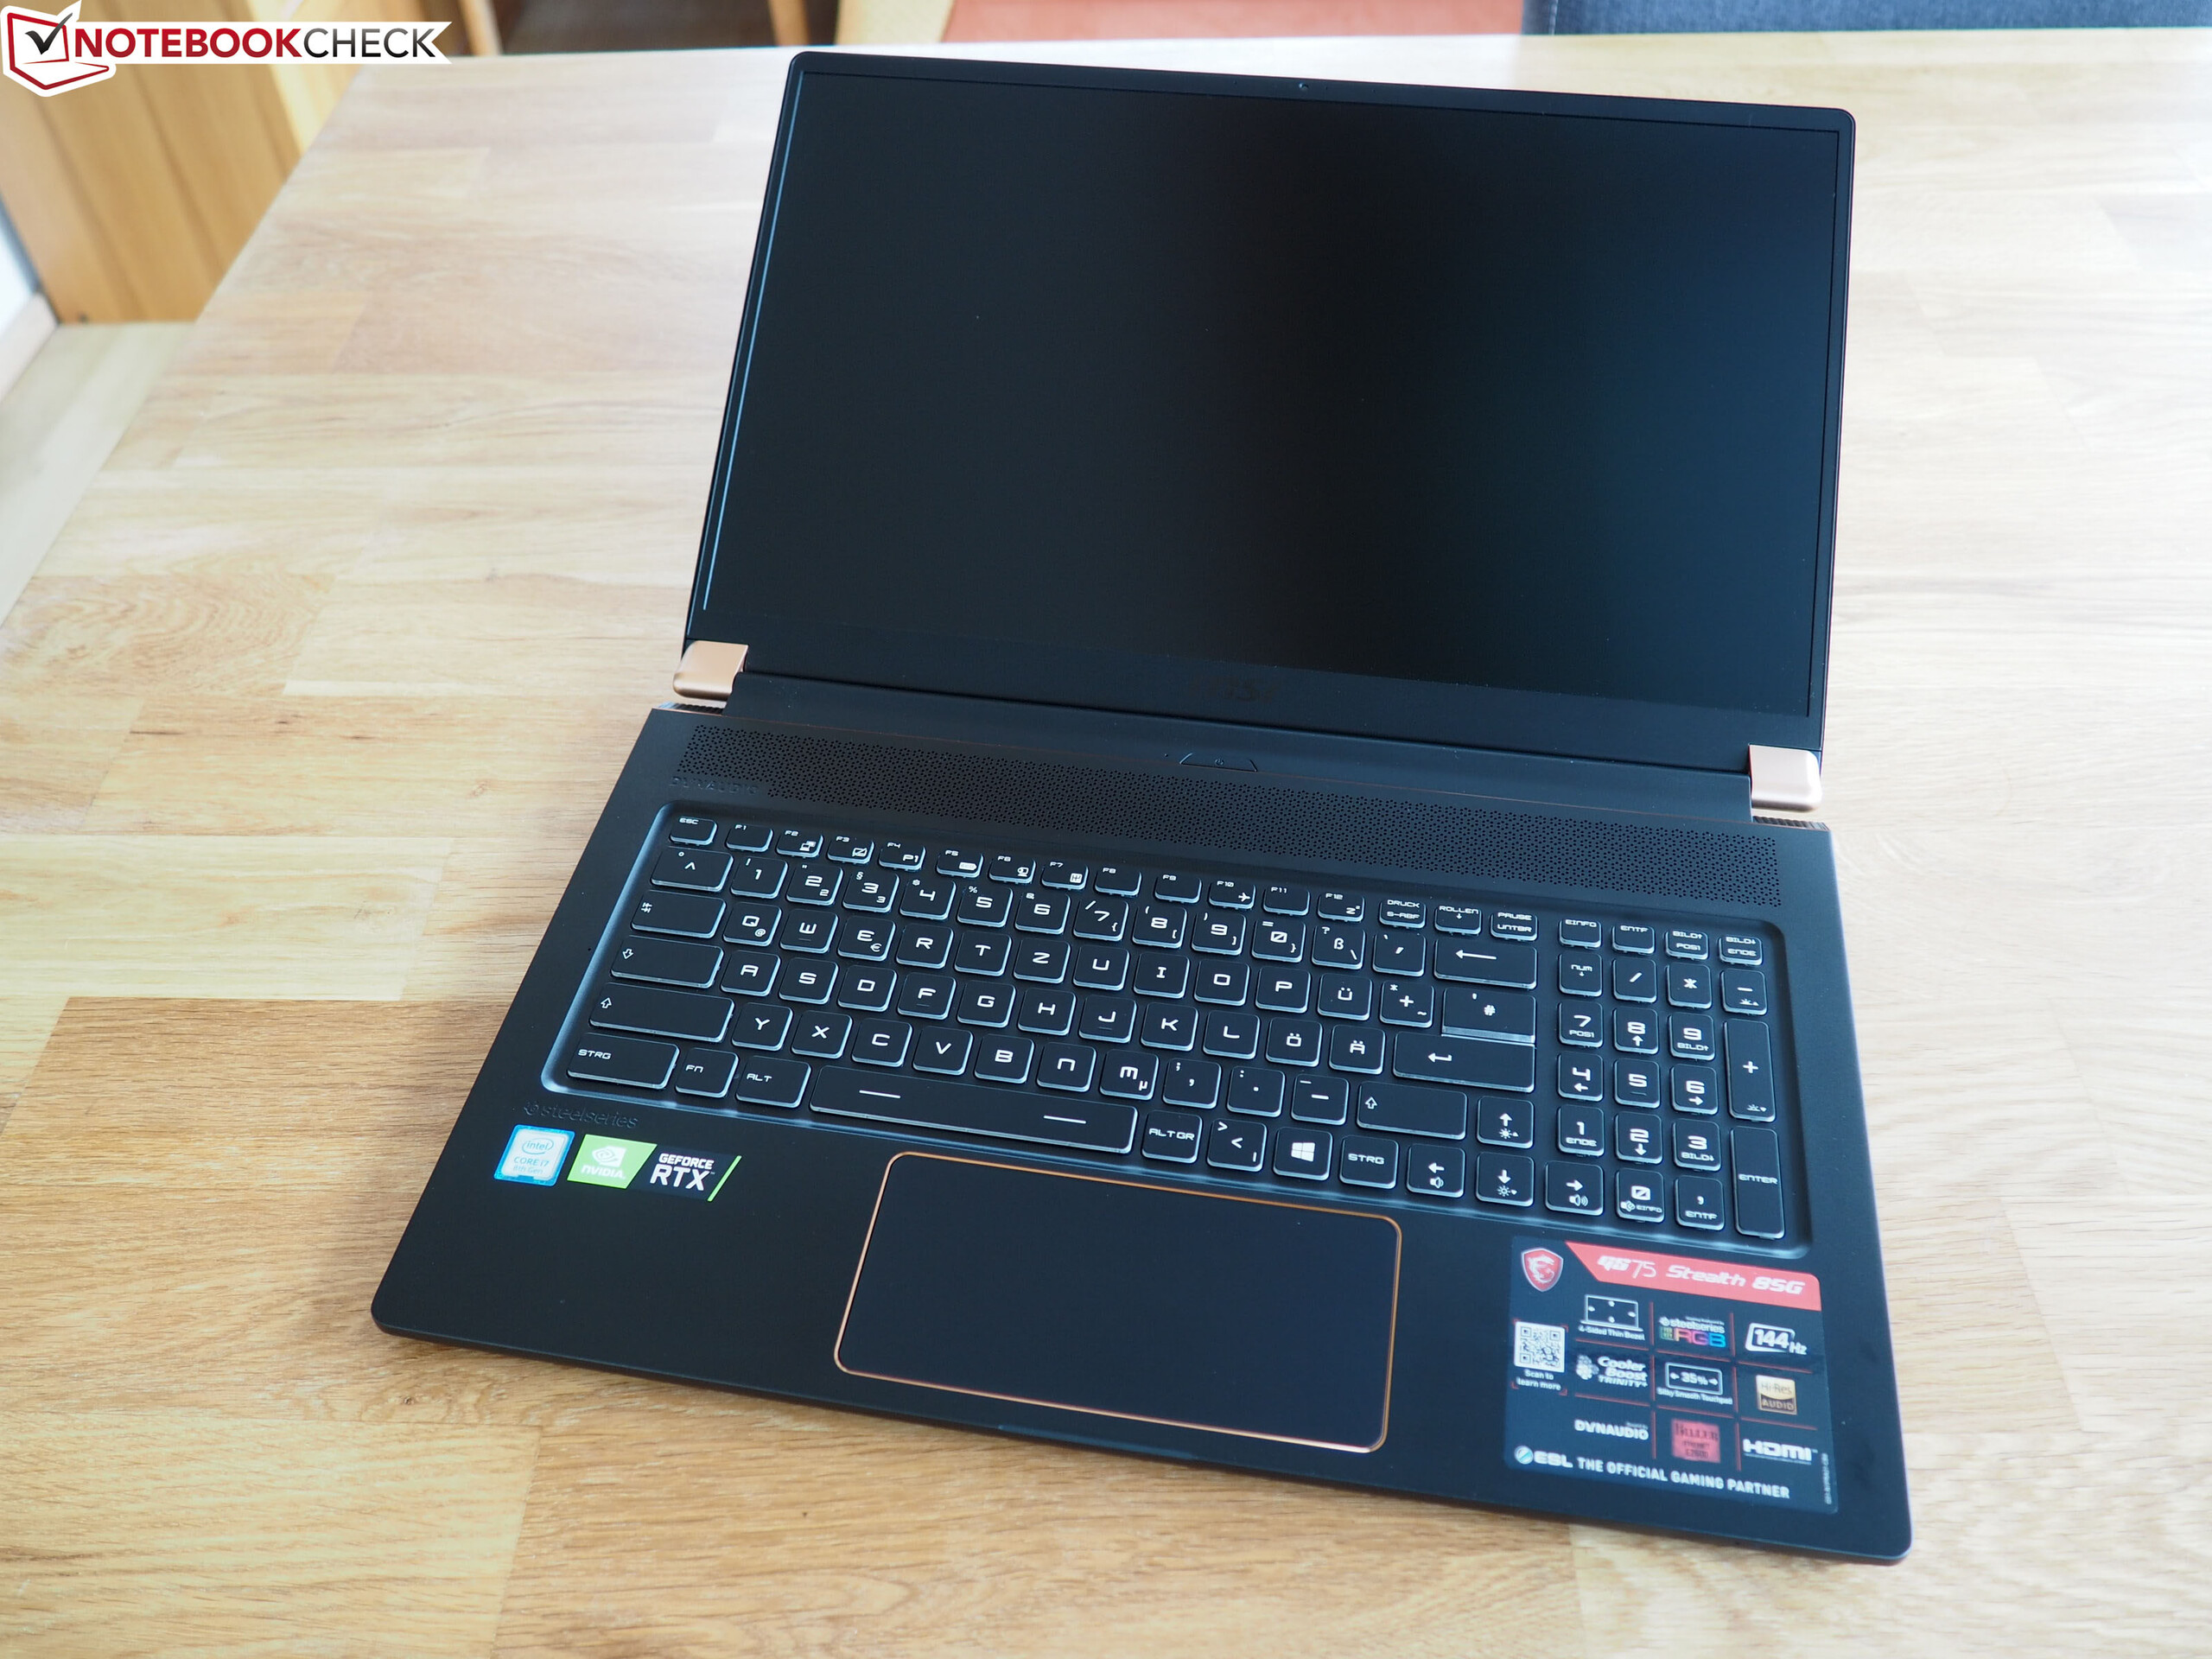
Com o GS75 8SG Stealth, a MSI lançou um portátil para jogos de grande sucesso com marcos finos.
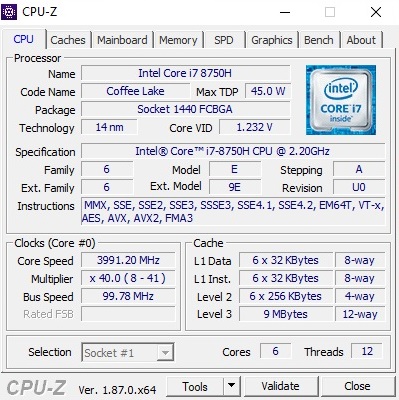
A combinação de um Core i7-8750H e GeForce RTX 2080 Max-Q lida sem esforço com todos os jogos atuais - pelo menos na resolução nativa Full HD. O conteúdo 3D rodou muito bem na tela de 144 Hz de rápida reação e rica em contraste, apesar da falta da tecnologia G-Sync da Nvidia.
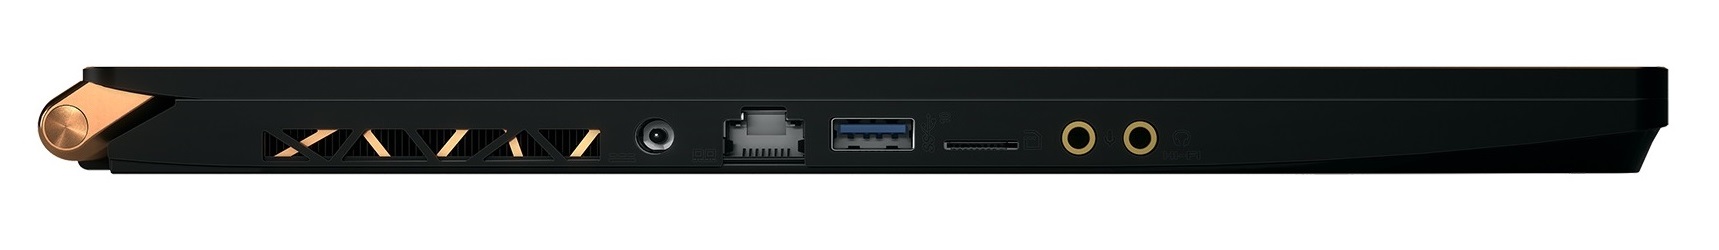
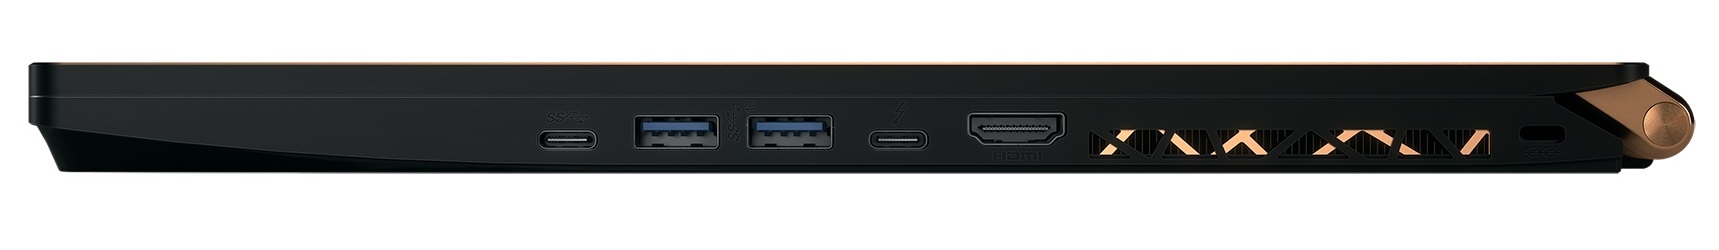
Outra fortaleza do aparelho de 17 polegadas é sua boa mobilidade. Juntamente com o peso e a altura, a duração da bateria também consegue impressionar. As portas modernas, que incluem Thunderbolt 3, também são louváveis.
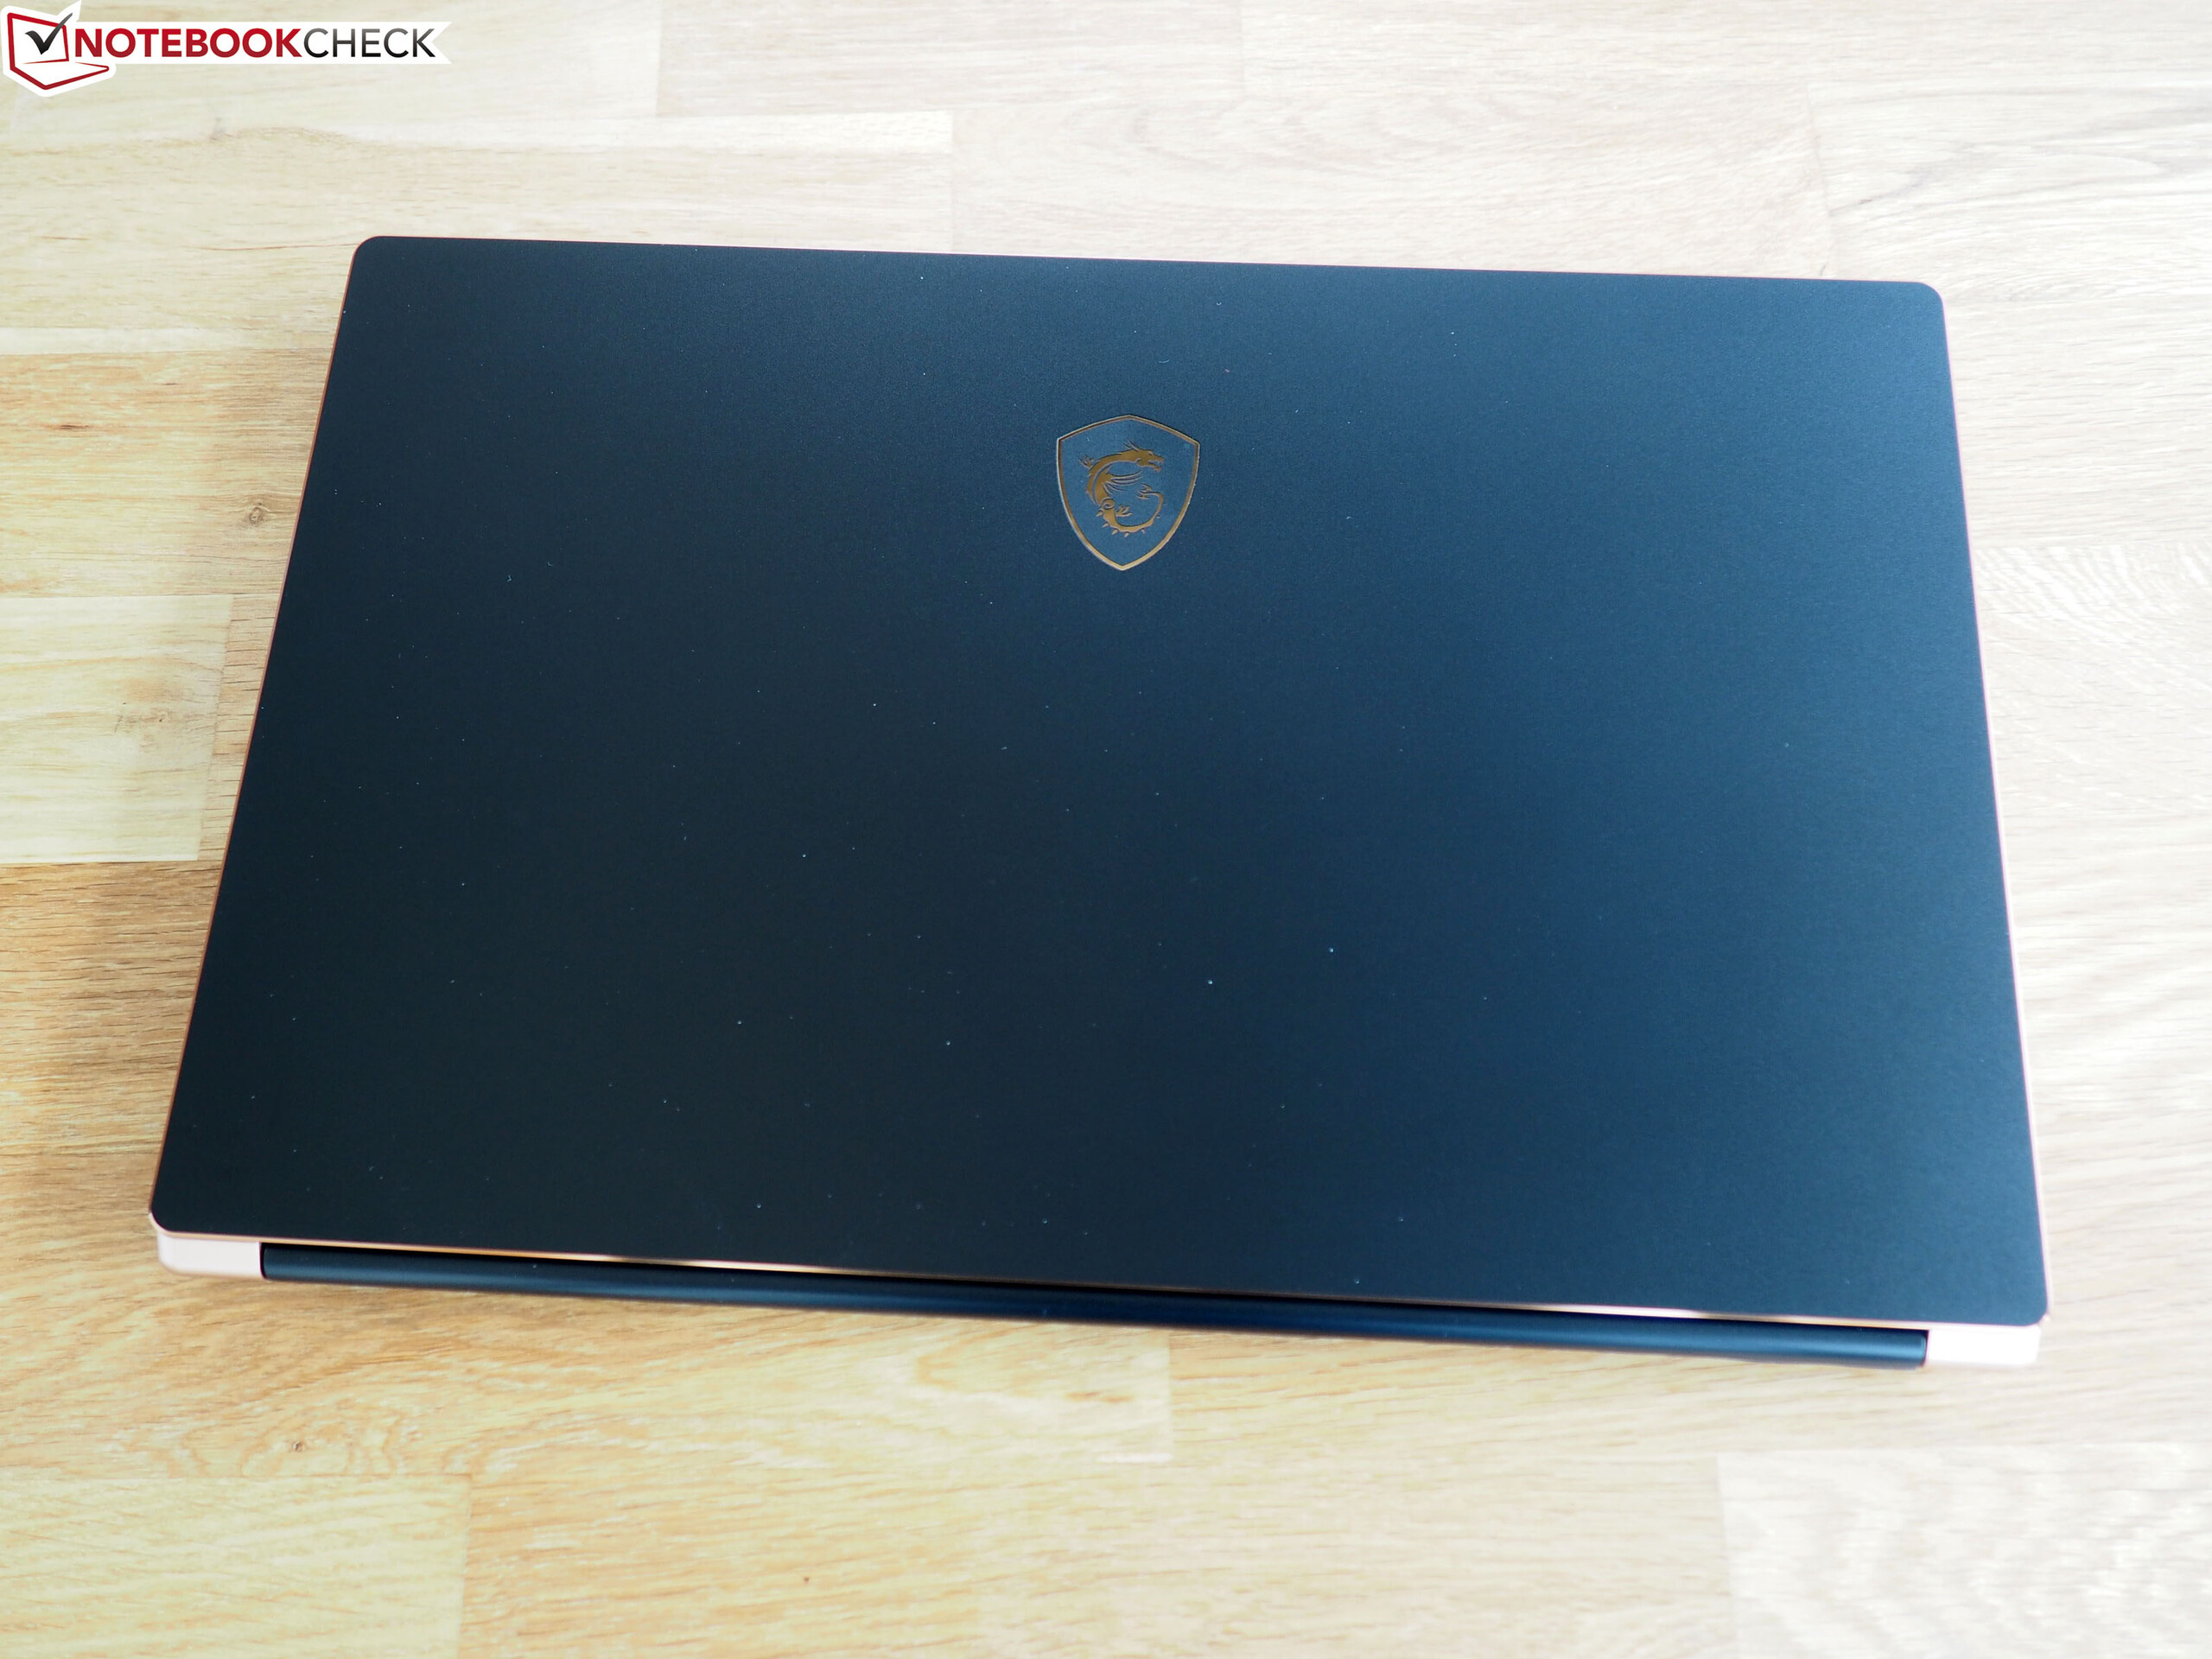
Não ficamos completamente satisfeitos com a carcaça. Embora a qualidade e o dos materiais sejam de alto nível, a estabilidade deixa algo a desejar. Para obter uma pontuação geral "muito boa", o fabricante também precisaria melhorar a qualidade do som e o controle do ventilador.
O preço exorbitante (~3.800 Euros (~$4.267) pelo modelo topo de linha) prejudicará a compra de alguns consumidores interessados. Na maioria das vezes, portáteis comparativamente rápidos com uma GPU RTX 2070 têm preços significativamente mais baixos.
MSI GS75 8SG Stealth
- 03/27/2019 v6 (old)
Florian Glaser
Price comparison