Breve Análise do Portátil Schenker XMG Neo 15 (i7-8750H, RTX 2070 Max-Q) Tongfang GK5CQ7Z
| SD Card Reader | |
| average JPG Copy Test (av. of 3 runs) | |
| Gigabyte Aero 15-X9 (Toshiba Exceria Pro SDXC 64 GB UHS-II) | |
| Média da turma Gaming (20.9 - 210, n=54, últimos 2 anos) | |
| Schenker XMG Neo 15 Turing (Toshiba Exceria Pro SDXC 64 GB UHS-II) | |
| Schenker XMG Neo 15 (Toshiba Exceria Pro SDXC 64 GB UHS-II) | |
| maximum AS SSD Seq Read Test (1GB) | |
| Gigabyte Aero 15-X9 (Toshiba Exceria Pro SDXC 64 GB UHS-II) | |
| Média da turma Gaming (25.5 - 261, n=51, últimos 2 anos) | |
| Schenker XMG Neo 15 Turing (Toshiba Exceria Pro SDXC 64 GB UHS-II) | |
| Schenker XMG Neo 15 (Toshiba Exceria Pro SDXC 64 GB UHS-II) | |
| |||||||||||||||||||||||||
iluminação: 84 %
iluminação com acumulador: 268 cd/m²
Contraste: 1117:1 (Preto: 0.24 cd/m²)
ΔE ColorChecker Calman: 4.51 | ∀{0.5-29.43 Ø4.71}
calibrated: 1.57
ΔE Greyscale Calman: 5.36 | ∀{0.09-98 Ø4.96}
92% sRGB (Argyll 1.6.3 3D)
59% AdobeRGB 1998 (Argyll 1.6.3 3D)
65% AdobeRGB 1998 (Argyll 3D)
92.3% sRGB (Argyll 3D)
63.5% Display P3 (Argyll 3D)
Gamma: 2.51
CCT: 7826 K
| Schenker XMG Neo 15 Turing BOEhydis NV156FHM-N4G (BOE07AF), IPS, 1920x1080 | Schenker XMG Neo 15 LGD05C0, IPS, 1920x1080 | Gigabyte Aero 15-X9 LGD05C0, IPS, 1920x1080 | Razer Blade 15 RTX 2070 Max-Q LG Philips LGD05C0, IPS, 1920x1080 | Acer Predator Triton 500 AU Optronics B156HAN08.2 (AUO82ED), IPS, 1920x1080 | MSI GS65 8RF-019DE Stealth Thin AU Optronics B156HAN08.0 (AUO80ED), IPS, 1920x1080 | Asus Zephyrus S GX531GS AU Optronics B156HAN08.2 (AUO82ED), IPS, 1920x1080 | |
|---|---|---|---|---|---|---|---|
| Display | 1% | 0% | 3% | 1% | 2% | 2% | |
| Display P3 Coverage (%) | 63.5 | 64.3 1% | 63.5 0% | 65.3 3% | 64.2 1% | 66.2 4% | 66.7 5% |
| sRGB Coverage (%) | 92.3 | 94.1 2% | 93.1 1% | 94.9 3% | 92.6 0% | 92.1 0% | 91.2 -1% |
| AdobeRGB 1998 Coverage (%) | 65 | 65.3 0% | 64.5 -1% | 66.3 2% | 65.7 1% | 67.2 3% | 66.7 3% |
| Response Times | -39% | -61% | -54% | -2% | -64% | 8% | |
| Response Time Grey 50% / Grey 80% * (ms) | 8.8 ? | 16 ? -82% | 16.4 ? -86% | 16.8 ? -91% | 8 ? 9% | 17.6 ? -100% | 7.4 ? 16% |
| Response Time Black / White * (ms) | 10 ? | 9.6 ? 4% | 13.6 ? -36% | 11.6 ? -16% | 11.2 ? -12% | 12.8 ? -28% | 10 ? -0% |
| PWM Frequency (Hz) | 1000 ? | ||||||
| Screen | 14% | 16% | 7% | 0% | 15% | 12% | |
| Brightness middle (cd/m²) | 268 | 325 21% | 250 -7% | 314.7 17% | 304 13% | 254 -5% | 294 10% |
| Brightness (cd/m²) | 270 | 303 12% | 235 -13% | 312 16% | 299 11% | 262 -3% | 275 2% |
| Brightness Distribution (%) | 84 | 90 7% | 85 1% | 90 7% | 89 6% | 89 6% | 84 0% |
| Black Level * (cd/m²) | 0.24 | 0.33 -38% | 0.29 -21% | 0.38 -58% | 0.27 -13% | 0.22 8% | 0.24 -0% |
| Contrast (:1) | 1117 | 985 -12% | 862 -23% | 828 -26% | 1126 1% | 1155 3% | 1225 10% |
| Colorchecker dE 2000 * | 4.51 | 2.69 40% | 1.46 68% | 2.56 43% | 4.66 -3% | 2.37 47% | 2.57 43% |
| Colorchecker dE 2000 max. * | 9.58 | 4.91 49% | 2.47 74% | 4.89 49% | 9.65 -1% | 4.71 51% | 4.88 49% |
| Colorchecker dE 2000 calibrated * | 1.57 | 1.27 19% | 1.71 -9% | 1.72 -10% | 1.84 -17% | 2.14 -36% | |
| Greyscale dE 2000 * | 5.36 | 2.34 56% | 1.27 76% | 3.4 37% | 5.53 -3% | 1.58 71% | 2.41 55% |
| Gamma | 2.51 88% | 2.38 92% | 2.4 92% | 2.3 96% | 2.5 88% | 2.48 89% | 2.5 88% |
| CCT | 7826 83% | 6872 95% | 6749 96% | 6435 101% | 8028 81% | 6785 96% | 6370 102% |
| Color Space (Percent of AdobeRGB 1998) (%) | 59 | 60 2% | 60 2% | 60.7 3% | 60 2% | 60 2% | 59 0% |
| Color Space (Percent of sRGB) (%) | 92 | 94 2% | 93 1% | 94.6 3% | 93 1% | 92 0% | 91 -1% |
| Média Total (Programa/Configurações) | -8% /
5% | -15% /
2% | -15% /
-1% | -0% /
0% | -16% /
3% | 7% /
10% |
* ... menor é melhor
Exibir tempos de resposta
| ↔ Tempo de resposta preto para branco | ||
|---|---|---|
| 10 ms ... ascensão ↗ e queda ↘ combinadas | ↗ 6 ms ascensão | 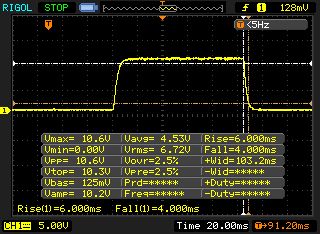 |
| ↘ 4 ms queda | ||
| A tela mostra boas taxas de resposta em nossos testes, mas pode ser muito lenta para jogadores competitivos. Em comparação, todos os dispositivos testados variam de 0.1 (mínimo) a 240 (máximo) ms. » 27 % de todos os dispositivos são melhores. Isso significa que o tempo de resposta medido é melhor que a média de todos os dispositivos testados (19.8 ms). | ||
| ↔ Tempo de resposta 50% cinza a 80% cinza | ||
| 8.8 ms ... ascensão ↗ e queda ↘ combinadas | ↗ 4.4 ms ascensão | 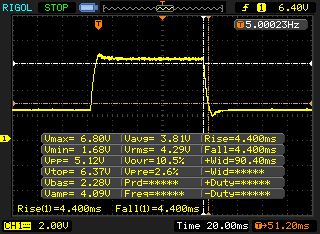 |
| ↘ 4.4 ms queda | ||
| A tela mostra taxas de resposta rápidas em nossos testes e deve ser adequada para jogos. Em comparação, todos os dispositivos testados variam de 0.165 (mínimo) a 636 (máximo) ms. » 22 % de todos os dispositivos são melhores. Isso significa que o tempo de resposta medido é melhor que a média de todos os dispositivos testados (31 ms). | ||
Cintilação da tela / PWM (modulação por largura de pulso)
| Tela tremeluzindo/PWM detectado | 1000 Hz | ≤ 99 % configuração de brilho | 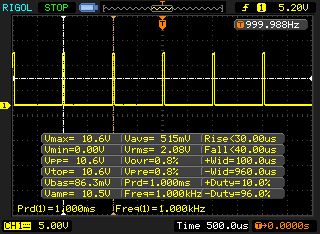 |
A luz de fundo da tela pisca em 1000 Hz (pior caso, por exemplo, utilizando PWM) Cintilação detectada em uma configuração de brilho de 99 % e abaixo. Não deve haver cintilação ou PWM acima desta configuração de brilho. A frequência de 1000 Hz é bastante alta, então a maioria dos usuários sensíveis ao PWM não deve notar nenhuma oscilação. [pwm_comparison] Em comparação: 52 % de todos os dispositivos testados não usam PWM para escurecer a tela. Se PWM foi detectado, uma média de 7757 (mínimo: 5 - máximo: 343500) Hz foi medida. | |||
| Cinebench R15 | |
| CPU Single 64Bit | |
| Média da turma Gaming (188.8 - 350, n=106, últimos 2 anos) | |
| Acer Predator Triton 500 | |
| MSI GS65 8RF-019DE Stealth Thin | |
| Razer Blade 15 RTX 2070 Max-Q | |
| Schenker XMG Neo 15 Turing | |
| Schenker XMG Neo 15 Turing (Lüfter-Turbo) | |
| Schenker XMG Neo 15 | |
| Asus Zephyrus S GX531GS | |
| Gigabyte Aero 15-X9 | |
| CPU Multi 64Bit | |
| Média da turma Gaming (1578 - 6330, n=105, últimos 2 anos) | |
| Schenker XMG Neo 15 Turing (Lüfter-Turbo) | |
| Gigabyte Aero 15-X9 | |
| Schenker XMG Neo 15 | |
| Asus Zephyrus S GX531GS | |
| Schenker XMG Neo 15 Turing | |
| MSI GS65 8RF-019DE Stealth Thin | |
| Acer Predator Triton 500 | |
| Razer Blade 15 RTX 2070 Max-Q | |
| Cinebench R10 | |
| Rendering Single 32Bit | |
| Média da turma Gaming (7457 - 12575, n=9, últimos 2 anos) | |
| Schenker XMG Neo 15 Turing | |
| Gigabyte Aero 15-X9 | |
| Rendering Multiple CPUs 32Bit | |
| Média da turma Gaming (42932 - 102066, n=9, últimos 2 anos) | |
| Gigabyte Aero 15-X9 | |
| Schenker XMG Neo 15 Turing | |
| Cinebench R20 | |
| CPU (Single Core) | |
| Média da turma Gaming (442 - 913, n=106, últimos 2 anos) | |
| Schenker XMG Neo 15 Turing | |
| CPU (Multi Core) | |
| Média da turma Gaming (4029 - 16433, n=106, últimos 2 anos) | |
| Schenker XMG Neo 15 Turing | |
| Geekbench 3 | |
| 32 Bit Multi-Core Score | |
| Schenker XMG Neo 15 Turing | |
| Gigabyte Aero 15-X9 | |
| 32 Bit Single-Core Score | |
| Schenker XMG Neo 15 Turing | |
| Gigabyte Aero 15-X9 | |
| Geekbench 4.4 | |
| 64 Bit Multi-Core Score | |
| Média da turma Gaming (89200 - 101054, n=3, últimos 2 anos) | |
| Schenker XMG Neo 15 Turing | |
| Gigabyte Aero 15-X9 | |
| 64 Bit Single-Core Score | |
| Média da turma Gaming (9335 - 9775, n=3, últimos 2 anos) | |
| Schenker XMG Neo 15 Turing | |
| Gigabyte Aero 15-X9 | |
| Mozilla Kraken 1.1 - Total | |
| Gigabyte Aero 15-X9 (Edge 44) | |
| Razer Blade 15 RTX 2070 Max-Q (Edge 44.17763.1.0) | |
| Schenker XMG Neo 15 Turing (Edge 44) | |
| Média da turma Gaming (391 - 590, n=100, últimos 2 anos) | |
| Octane V2 - Total Score | |
| Média da turma Gaming (93292 - 139447, n=27, últimos 2 anos) | |
| Schenker XMG Neo 15 Turing (Edge 44) | |
| Gigabyte Aero 15-X9 (Edge 44) | |
| Razer Blade 15 RTX 2070 Max-Q (Edge 44.17763.1.0) | |
| JetStream 1.1 - 1.1 Total | |
| Média da turma Gaming (549 - 647, n=3, últimos 2 anos) | |
| Razer Blade 15 RTX 2070 Max-Q (Edge 44.17763.1.0) | |
| Schenker XMG Neo 15 Turing (Edge 44) | |
| Gigabyte Aero 15-X9 (Edge 44) | |
* ... menor é melhor
| PCMark 7 Score | 6802 pontos | |
| PCMark 8 Home Score Accelerated v2 | 4582 pontos | |
| PCMark 8 Creative Score Accelerated v2 | 5288 pontos | |
| PCMark 8 Work Score Accelerated v2 | 5679 pontos | |
| PCMark 10 Score | 5651 pontos | |
Ajuda | ||

| Schenker XMG Neo 15 Turing Samsung SSD 970 EVO Plus 1TB | Gigabyte Aero 15-X9 Intel SSD 760p SSDPEKKW010T8 | Razer Blade 15 RTX 2070 Max-Q Samsung SSD PM981 MZVLB512HAJQ | Acer Predator Triton 500 2x WDC PC SN720 SDAPNTW-256G-1014 (RAID 0) | MSI GS65 8RF-019DE Stealth Thin Samsung SSD PM981 MZVLB512HAJQ | Asus Zephyrus S GX531GS WDC PC SN520 SDAPNUW-512G | Schenker XMG Neo 15 Samsung SSD 970 Pro 1TB | |
|---|---|---|---|---|---|---|---|
| CrystalDiskMark 5.2 / 6 | 9% | 4% | 25% | 4% | -11% | 8% | |
| Write 4K (MB/s) | 92.5 | 97.1 5% | 93.9 2% | 93.6 1% | 95.3 3% | 98.2 6% | 100.5 9% |
| Read 4K (MB/s) | 40.45 | 53.7 33% | 40.56 0% | 38.82 -4% | 40.13 -1% | 39.43 -3% | 48.64 20% |
| Write Seq (MB/s) | 1197 | 1526 27% | 1468 23% | 2455 105% | 1883 57% | 1386 16% | 1456 22% |
| Read Seq (MB/s) | 1018 | 2020 98% | 1540 51% | 2107 107% | 1322 30% | 1100 8% | 1278 26% |
| Write 4K Q32T1 (MB/s) | 288.6 | 285.6 -1% | 293.5 2% | 298.7 3% | 309.9 7% | 270.3 -6% | 298.1 3% |
| Read 4K Q32T1 (MB/s) | 332 | 321.8 -3% | 346 4% | 338.7 2% | 353.7 7% | 340.3 3% | 348.7 5% |
| Write Seq Q32T1 (MB/s) | 3317 | 1533 -54% | 1941 -41% | 2902 -13% | 1919 -42% | 1454 -56% | 2742 -17% |
| Read Seq Q32T1 (MB/s) | 3515 | 2351 -33% | 3266 -7% | 3536 1% | 2466 -30% | 1681 -52% | 3389 -4% |
| 3DMark 06 Standard Score | 35375 pontos | |
| 3DMark 11 Performance | 17617 pontos | |
| 3DMark Ice Storm Standard Score | 110428 pontos | |
| 3DMark Cloud Gate Standard Score | 35086 pontos | |
| 3DMark Fire Strike Score | 15180 pontos | |
| 3DMark Time Spy Score | 6338 pontos | |
Ajuda | ||
| 3DMark | |
| 1920x1080 Fire Strike Graphics | |
| Média da turma Gaming (12242 - 62849, n=115, últimos 2 anos) | |
| Razer Blade 15 RTX 2070 Max-Q | |
| Gigabyte Aero 15-X9 | |
| Schenker XMG Neo 15 Turing (Lüfter-Turbo) | |
| Schenker XMG Neo 15 Turing | |
| MSI GS65 8RF-019DE Stealth Thin | |
| Schenker XMG Neo 15 | |
| 2560x1440 Time Spy Graphics | |
| Média da turma Gaming (5012 - 26212, n=115, últimos 2 anos) | |
| Razer Blade 15 RTX 2070 Max-Q | |
| Gigabyte Aero 15-X9 | |
| Schenker XMG Neo 15 Turing (Lüfter-Turbo) | |
| Schenker XMG Neo 15 Turing | |
| 3DMark 11 - 1280x720 Performance GPU | |
| Média da turma Gaming (21841 - 80022, n=104, últimos 2 anos) | |
| Acer Predator Triton 500 | |
| Razer Blade 15 RTX 2070 Max-Q | |
| Gigabyte Aero 15-X9 | |
| Schenker XMG Neo 15 Turing (Lüfter-Turbo) | |
| Schenker XMG Neo 15 Turing | |
| MSI GS65 8RF-019DE Stealth Thin | |
| Asus Zephyrus S GX531GS | |
| Schenker XMG Neo 15 | |
| The Witcher 3 - 1920x1080 Ultra Graphics & Postprocessing (HBAO+) | |
| Média da turma Gaming (104.7 - 240, n=7, últimos 2 anos) | |
| Acer Predator Triton 500 | |
| Razer Blade 15 RTX 2070 Max-Q | |
| Schenker XMG Neo 15 Turing | |
| Gigabyte Aero 15-X9 | |
| MSI GS65 8RF-019DE Stealth Thin | |
| Asus Zephyrus S GX531GS | |
| Schenker XMG Neo 15 | |
| BioShock Infinite - 1920x1080 Ultra Preset, DX11 (DDOF) | |
| Razer Blade 15 RTX 2070 Max-Q | |
| Schenker XMG Neo 15 Turing | |
| Gigabyte Aero 15-X9 | |
| baixo | média | alto | ultra | |
|---|---|---|---|---|
| BioShock Infinite (2013) | 299.4 | 248.7 | 248 | 148.5 |
| The Witcher 3 (2015) | 269.2 | 200.6 | 121.7 | 63.8 |
| X-Plane 11.11 (2018) | 97.2 | 84.6 | 72.7 | |
| Apex Legends (2019) | 143.7 | 143 | 115.9 | 115.8 |
| Far Cry New Dawn (2019) | 108 | 92 | 88 | 79 |
| Metro Exodus (2019) | 123.2 | 77.2 | 57.3 | 46.6 |
| Anthem (2019) | 100.8 | 87.8 | 77.9 | 73.6 |
| Dirt Rally 2.0 (2019) | 221.2 | 150.8 | 126.7 | 72.3 |
| The Division 2 (2019) | 146 | 107 | 88 | 70 |
Barulho
| Ocioso |
| 30 / 32 / 35 dB |
| Carga |
| 47 / 55 dB |
 | ||
30 dB silencioso 40 dB(A) audível 50 dB(A) ruidosamente alto |
||
min: | ||
| Schenker XMG Neo 15 Turing GeForce RTX 2070 Max-Q, i7-8750H | Gigabyte Aero 15-X9 GeForce RTX 2070 Max-Q, i7-8750H | Razer Blade 15 RTX 2070 Max-Q GeForce RTX 2070 Max-Q, i7-8750H | Acer Predator Triton 500 GeForce RTX 2080 Max-Q, i7-8750H | MSI GS65 8RF-019DE Stealth Thin GeForce GTX 1070 Max-Q, i7-8750H | Asus Zephyrus S GX531GS GeForce GTX 1070 Max-Q, i7-8750H | Schenker XMG Neo 15 GeForce GTX 1060 Mobile, i7-8750H | |
|---|---|---|---|---|---|---|---|
| Noise | 4% | 14% | 6% | 8% | -3% | -4% | |
| desligado / ambiente * (dB) | 30 | 30 -0% | 28.8 4% | 29 3% | 30 -0% | 29 3% | 29 3% |
| Idle Minimum * (dB) | 30 | 32 -7% | 28.8 4% | 30 -0% | 30 -0% | 33 -10% | 29 3% |
| Idle Average * (dB) | 32 | 34 -6% | 28.8 10% | 32 -0% | 31 3% | 34 -6% | 35 -9% |
| Idle Maximum * (dB) | 35 | 36 -3% | 29.4 16% | 34 3% | 34 3% | 40 -14% | 40 -14% |
| Load Average * (dB) | 47 | 42 11% | 35.7 24% | 44 6% | 43 9% | 47 -0% | 50 -6% |
| Witcher 3 ultra * (dB) | 53 | 44 17% | 42.5 20% | 46 13% | 42 21% | 51 4% | 53 -0% |
| Load Maximum * (dB) | 55 | 48 13% | 45 18% | 47 15% | 44 20% | 53 4% | 58 -5% |
* ... menor é melhor
(-) A temperatura máxima no lado superior é 58 °C / 136 F, em comparação com a média de 40.4 °C / 105 F , variando de 21.2 a 68.8 °C para a classe Gaming.
(-) A parte inferior aquece até um máximo de 68 °C / 154 F, em comparação com a média de 43.2 °C / 110 F
(+) Em uso inativo, a temperatura média para o lado superior é 27.7 °C / 82 F, em comparação com a média do dispositivo de 33.9 °C / ### class_avg_f### F.
(-) Jogando The Witcher 3, a temperatura média para o lado superior é 43.8 °C / 111 F, em comparação com a média do dispositivo de 33.9 °C / ## #class_avg_f### F.
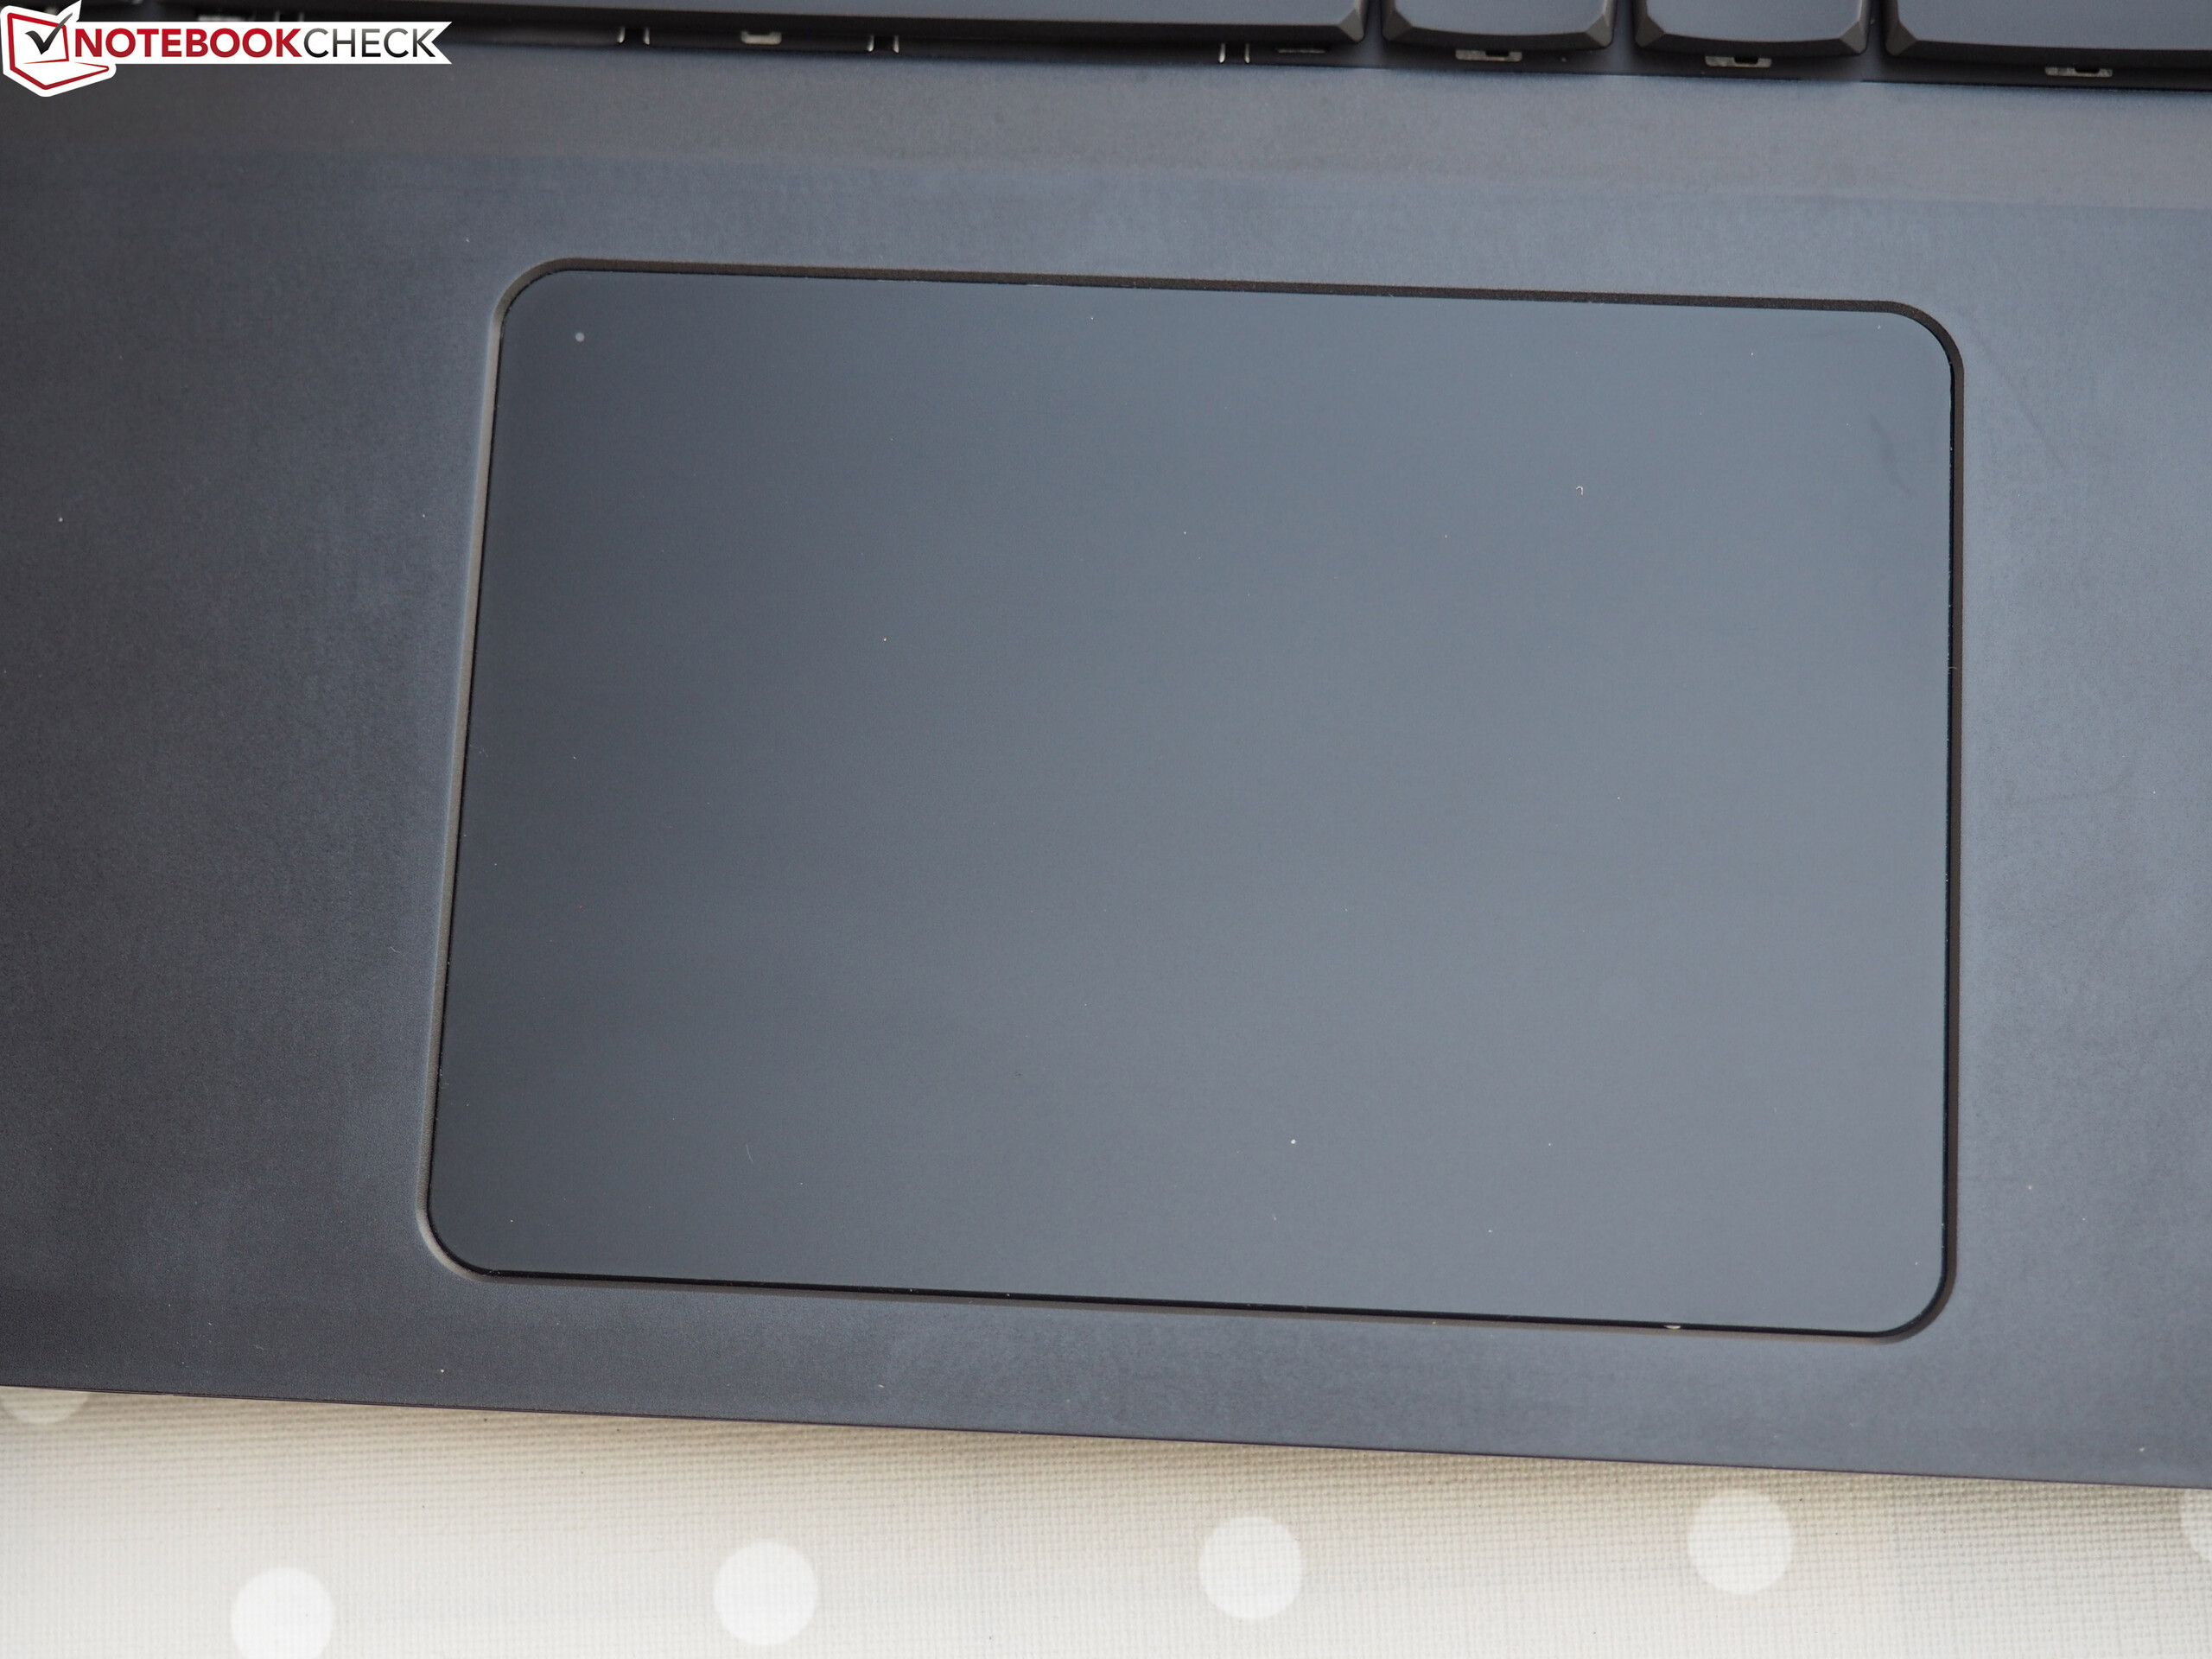
(-) Os apoios para as mãos e o touchpad podem ficar muito quentes ao toque, com um máximo de 42 °C / 107.6 F.
(-) A temperatura média da área do apoio para as mãos de dispositivos semelhantes foi 28.8 °C / 83.8 F (-13.2 °C / -23.8 F).
| Schenker XMG Neo 15 Turing GeForce RTX 2070 Max-Q, i7-8750H | Gigabyte Aero 15-X9 GeForce RTX 2070 Max-Q, i7-8750H | Razer Blade 15 RTX 2070 Max-Q GeForce RTX 2070 Max-Q, i7-8750H | Acer Predator Triton 500 GeForce RTX 2080 Max-Q, i7-8750H | MSI GS65 8RF-019DE Stealth Thin GeForce GTX 1070 Max-Q, i7-8750H | Asus Zephyrus S GX531GS GeForce GTX 1070 Max-Q, i7-8750H | Schenker XMG Neo 15 GeForce GTX 1060 Mobile, i7-8750H | |
|---|---|---|---|---|---|---|---|
| Heat | 7% | 18% | 4% | 16% | 6% | 4% | |
| Maximum Upper Side * (°C) | 58 | 56 3% | 49 16% | 49 16% | 49 16% | 54 7% | 56 3% |
| Maximum Bottom * (°C) | 68 | 66 3% | 49 28% | 58 15% | 63 7% | 60 12% | 68 -0% |
| Idle Upper Side * (°C) | 30 | 27 10% | 25.4 15% | 33 -10% | 24 20% | 30 -0% | 28 7% |
| Idle Bottom * (°C) | 31 | 27 13% | 27.2 12% | 33 -6% | 25 19% | 30 3% | 29 6% |
* ... menor é melhor
Schenker XMG Neo 15 Turing análise de áudio
(±) | o volume do alto-falante é médio, mas bom (###valor### dB)
Graves 100 - 315Hz
(-) | quase nenhum baixo - em média 19.6% menor que a mediana
(-) | graves não são lineares (16% delta para frequência anterior)
Médios 400 - 2.000 Hz
(±) | médios mais altos - em média 6.2% maior que a mediana
(+) | médios são lineares (3.8% delta para frequência anterior)
Altos 2 - 16 kHz
(+) | agudos equilibrados - apenas 1.8% longe da mediana
(±) | a linearidade dos máximos é média (7.6% delta para frequência anterior)
Geral 100 - 16.000 Hz
(±) | a linearidade do som geral é média (22.3% diferença em relação à mediana)
Comparado com a mesma classe
» 80% de todos os dispositivos testados nesta classe foram melhores, 6% semelhantes, 14% piores
» O melhor teve um delta de 6%, a média foi 18%, o pior foi 132%
Comparado com todos os dispositivos testados
» 65% de todos os dispositivos testados foram melhores, 6% semelhantes, 29% piores
» O melhor teve um delta de 4%, a média foi 23%, o pior foi 134%
Gigabyte Aero 15-X9 análise de áudio
(±) | o volume do alto-falante é médio, mas bom (###valor### dB)
Graves 100 - 315Hz
(±) | graves reduzidos - em média 14% menor que a mediana
(±) | a linearidade dos graves é média (13.7% delta para a frequência anterior)
Médios 400 - 2.000 Hz
(±) | médios mais altos - em média 6.2% maior que a mediana
(±) | a linearidade dos médios é média (7.9% delta para frequência anterior)
Altos 2 - 16 kHz
(+) | agudos equilibrados - apenas 4.4% longe da mediana
(±) | a linearidade dos máximos é média (9.7% delta para frequência anterior)
Geral 100 - 16.000 Hz
(±) | a linearidade do som geral é média (17.5% diferença em relação à mediana)
Comparado com a mesma classe
» 49% de todos os dispositivos testados nesta classe foram melhores, 12% semelhantes, 39% piores
» O melhor teve um delta de 6%, a média foi 18%, o pior foi 132%
Comparado com todos os dispositivos testados
» 34% de todos os dispositivos testados foram melhores, 8% semelhantes, 58% piores
» O melhor teve um delta de 4%, a média foi 23%, o pior foi 134%
| desligado | |
| Ocioso | |
| Carga |
|
Key:
min: | |
| Schenker XMG Neo 15 Turing GeForce RTX 2070 Max-Q, i7-8750H | Gigabyte Aero 15-X9 GeForce RTX 2070 Max-Q, i7-8750H | Razer Blade 15 RTX 2070 Max-Q GeForce RTX 2070 Max-Q, i7-8750H | Acer Predator Triton 500 GeForce RTX 2080 Max-Q, i7-8750H | MSI GS65 8RF-019DE Stealth Thin GeForce GTX 1070 Max-Q, i7-8750H | Asus Zephyrus S GX531GS GeForce GTX 1070 Max-Q, i7-8750H | Schenker XMG Neo 15 GeForce GTX 1060 Mobile, i7-8750H | |
|---|---|---|---|---|---|---|---|
| Power Consumption | -5% | 5% | -21% | 11% | -26% | 10% | |
| Idle Minimum * (Watt) | 13 | 16 -23% | 10.4 20% | 16 -23% | 7 46% | 17 -31% | 10 23% |
| Idle Average * (Watt) | 16 | 18 -13% | 14.6 9% | 22 -38% | 11 31% | 20 -25% | 13 19% |
| Idle Maximum * (Watt) | 21 | 23 -10% | 16.3 22% | 32 -52% | 20 5% | 29 -38% | 18 14% |
| Load Average * (Watt) | 84 | 88 -5% | 88.5 -5% | 89 -6% | 98 -17% | 112 -33% | 95 -13% |
| Witcher 3 ultra * (Watt) | 135 | 120 11% | 155.4 -15% | 147 -9% | 132 2% | 152 -13% | 114 16% |
| Load Maximum * (Watt) | 183 | 167 9% | 182.4 -0% | 173 5% | 182 1% | 211 -15% | 179 2% |
* ... menor é melhor
| Schenker XMG Neo 15 Turing GeForce RTX 2070 Max-Q, i7-8750H, 62.3 Wh | Gigabyte Aero 15-X9 GeForce RTX 2070 Max-Q, i7-8750H, 94.24 Wh | Razer Blade 15 RTX 2070 Max-Q GeForce RTX 2070 Max-Q, i7-8750H, 80 Wh | Acer Predator Triton 500 GeForce RTX 2080 Max-Q, i7-8750H, 82 Wh | MSI GS65 8RF-019DE Stealth Thin GeForce GTX 1070 Max-Q, i7-8750H, 82 Wh | Asus Zephyrus S GX531GS GeForce GTX 1070 Max-Q, i7-8750H, 50 Wh | Schenker XMG Neo 15 GeForce GTX 1060 Mobile, i7-8750H, 46.7 Wh | |
|---|---|---|---|---|---|---|---|
| Duração da bateria | 41% | 29% | -23% | 12% | -51% | 0% | |
| Reader / Idle (h) | 6.9 | 9.2 33% | 11.4 65% | 5.6 -19% | 8.5 23% | 3.6 -48% | 6.7 -3% |
| H.264 (h) | 4.9 | 6.1 24% | 5.9 20% | 4.8 -2% | |||
| WiFi v1.3 (h) | 5.1 | 6.4 25% | 6.5 27% | 3.2 -37% | 6 18% | 2.6 -49% | 4.4 -14% |
| Load (h) | 1.6 | 2.9 81% | 1.5 -6% | 1.4 -13% | 1.4 -13% | 0.7 -56% | 1.9 19% |
Pro
Contra
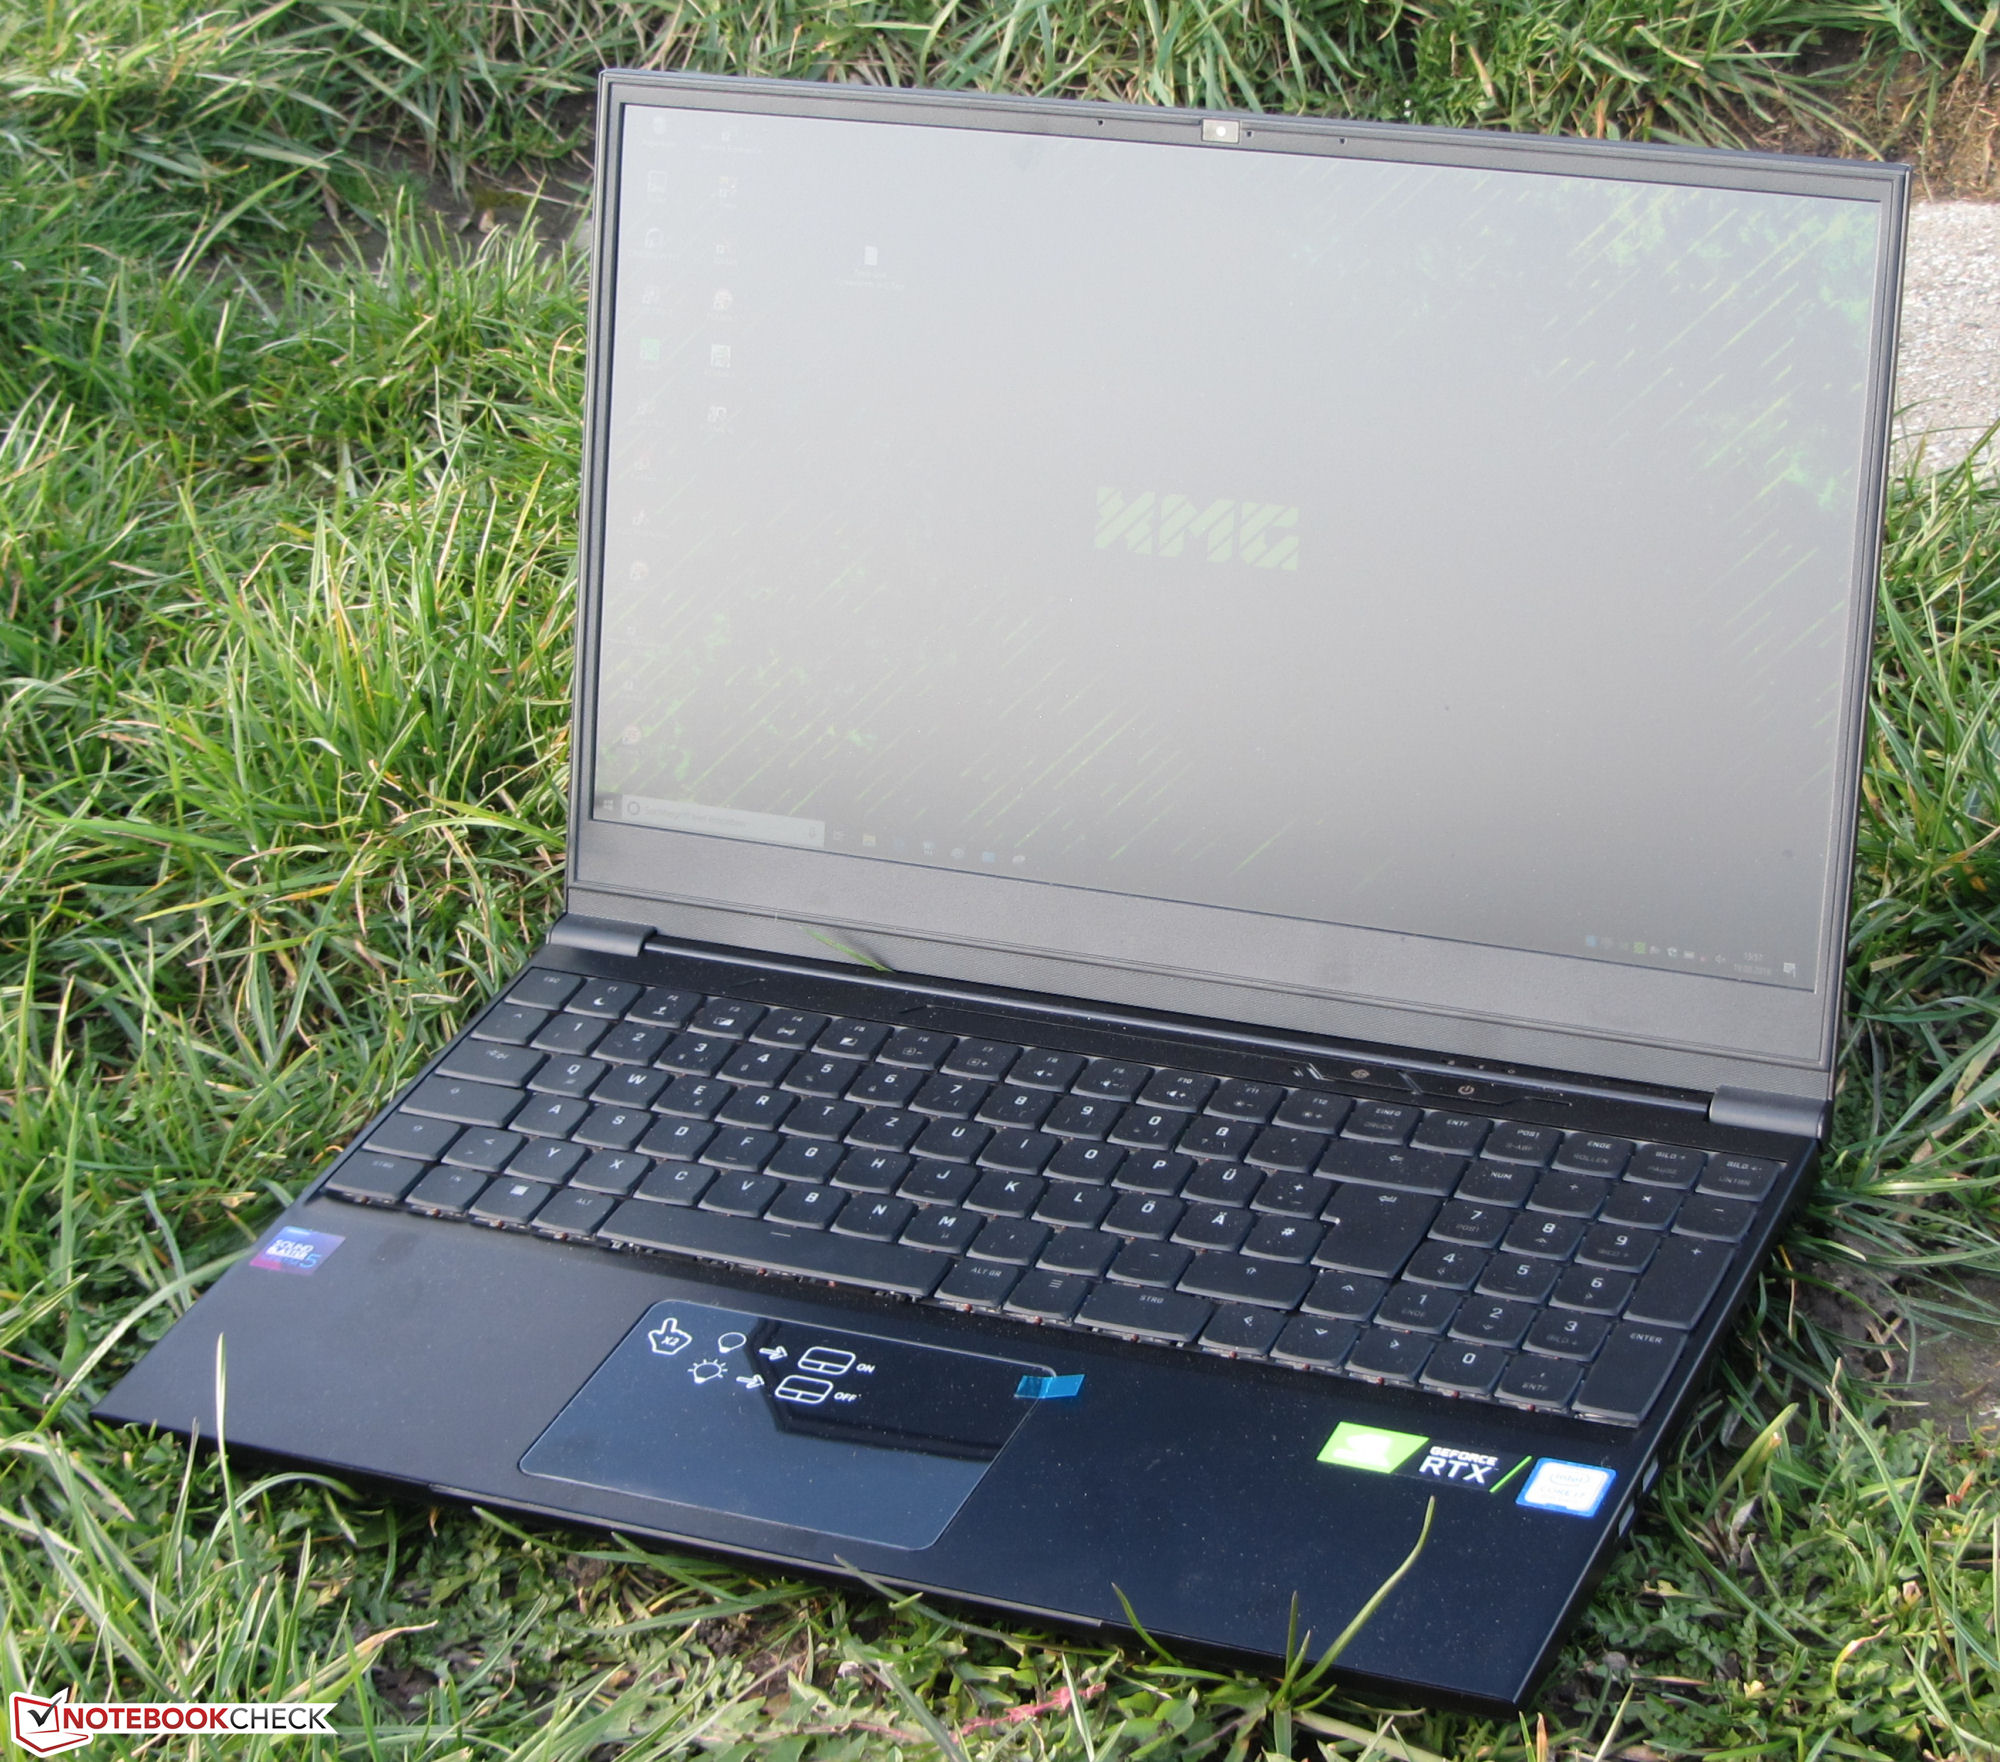
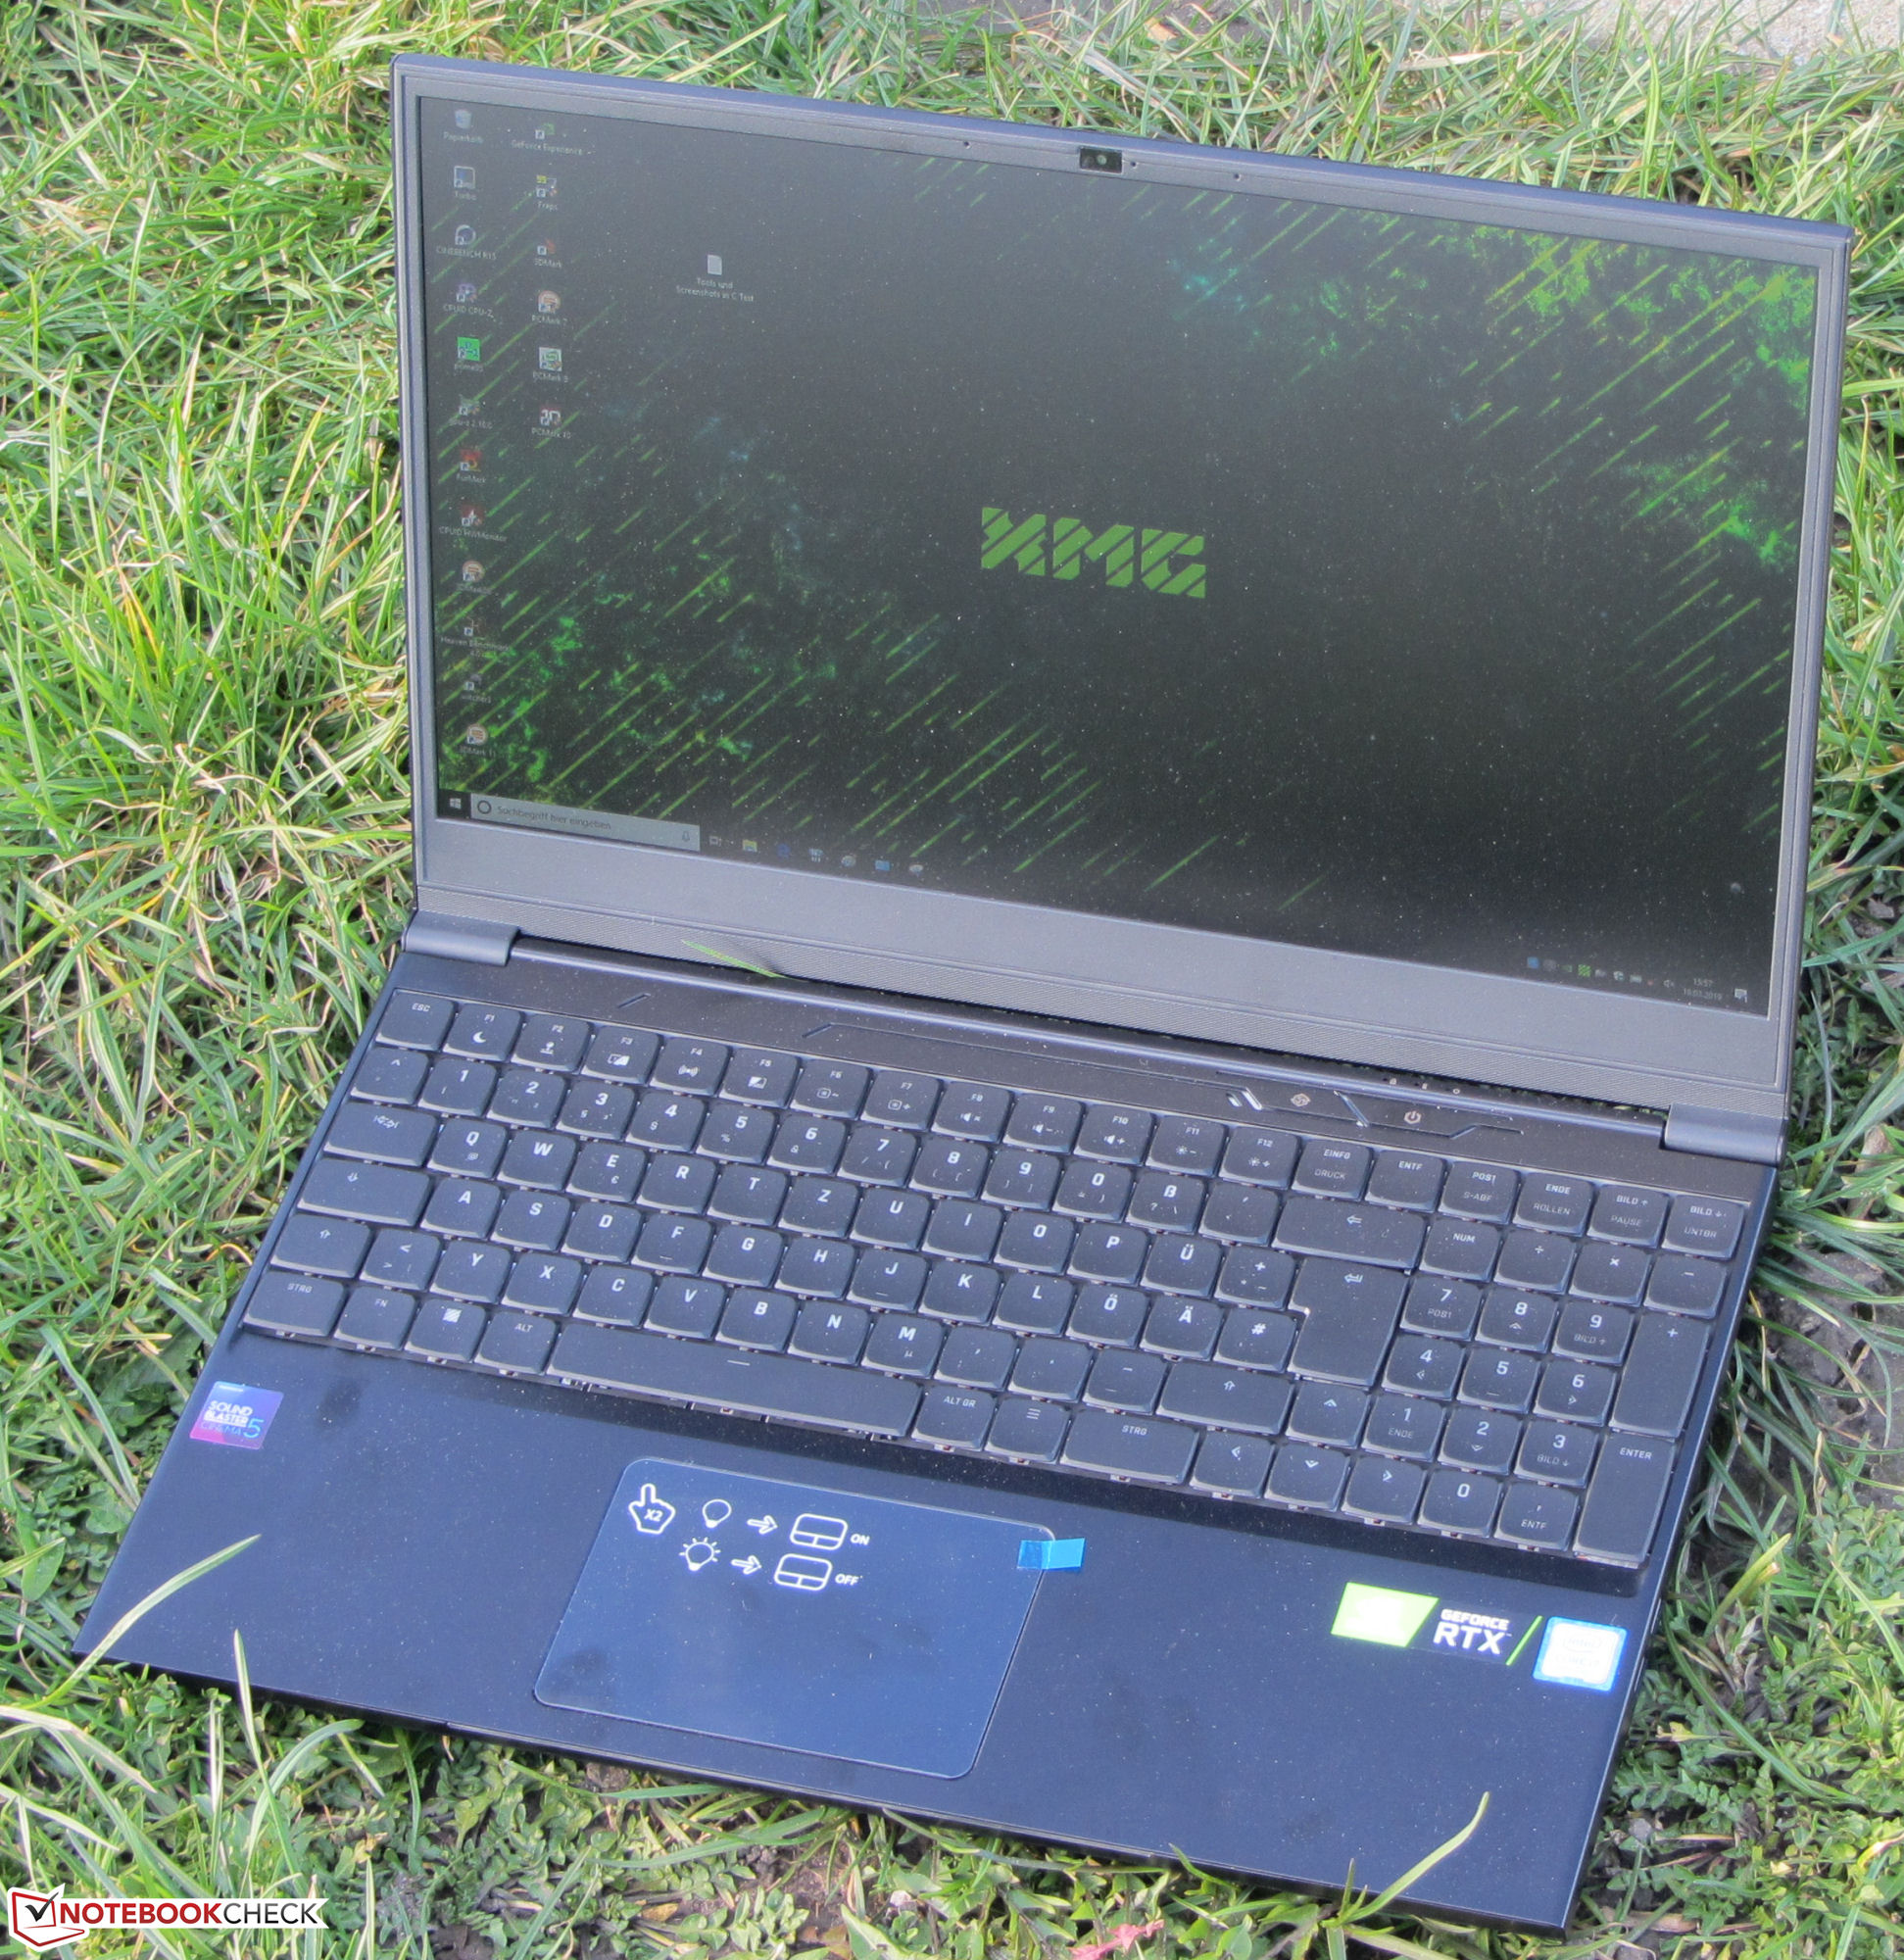
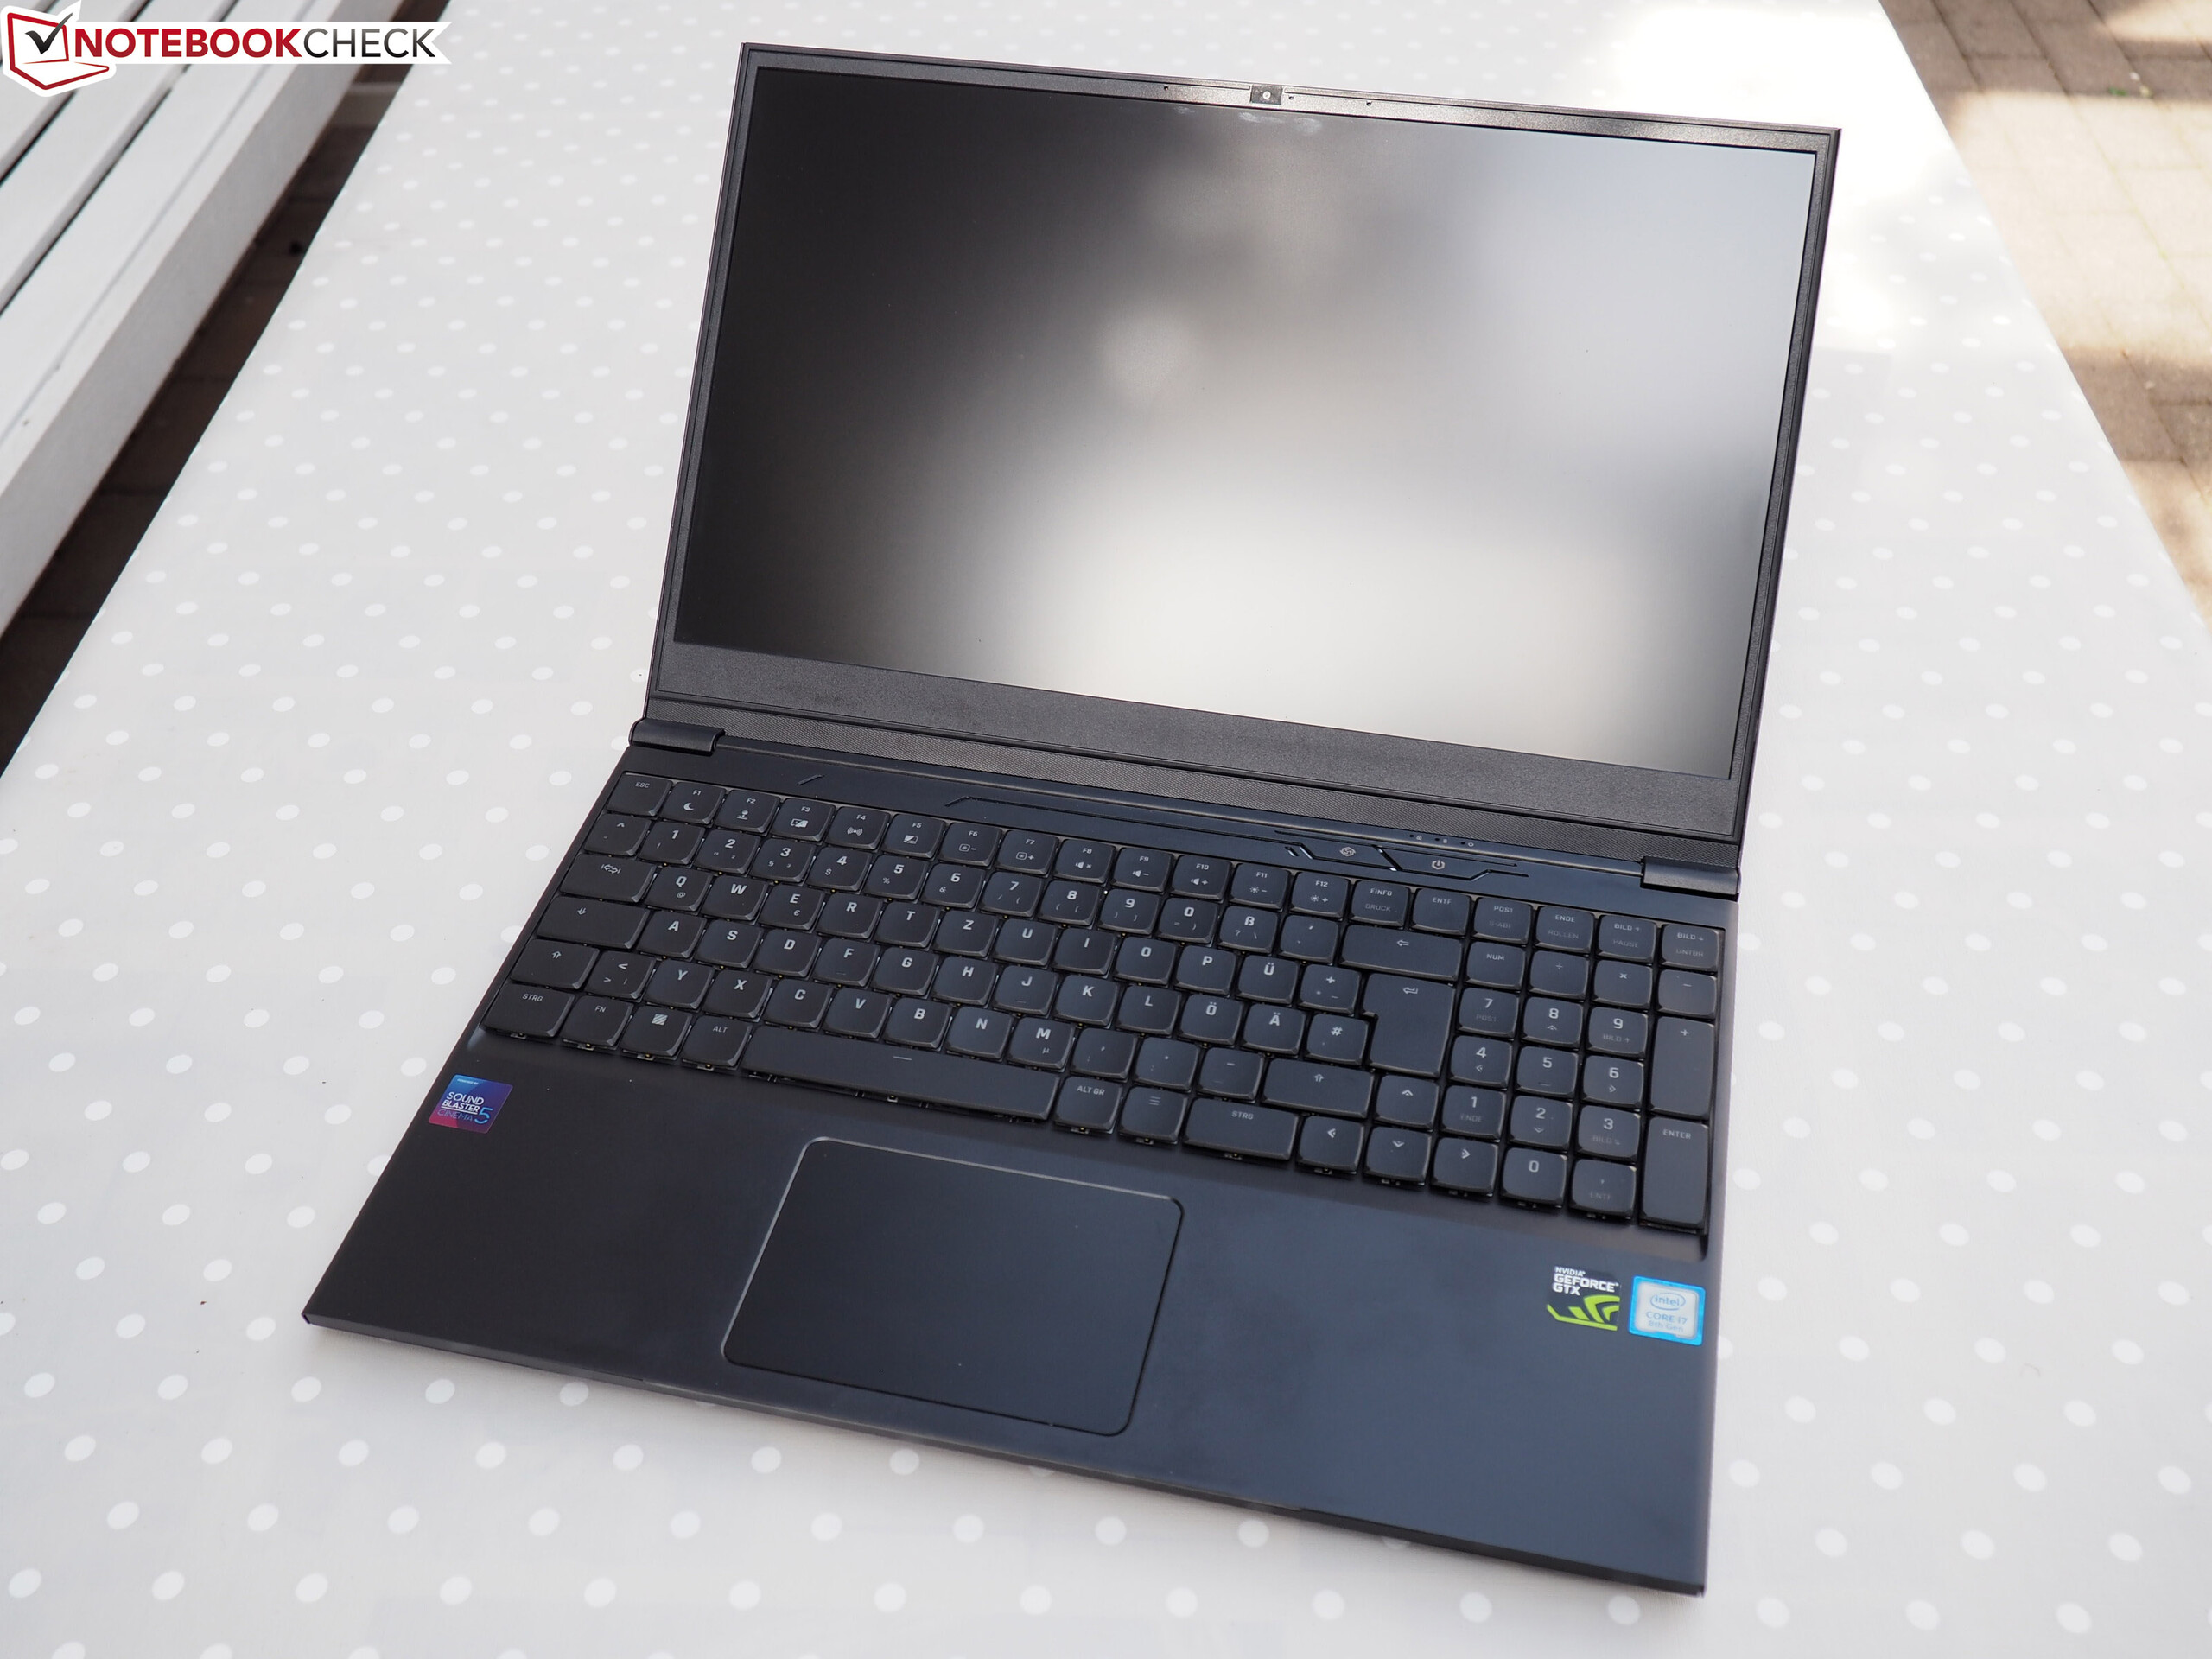
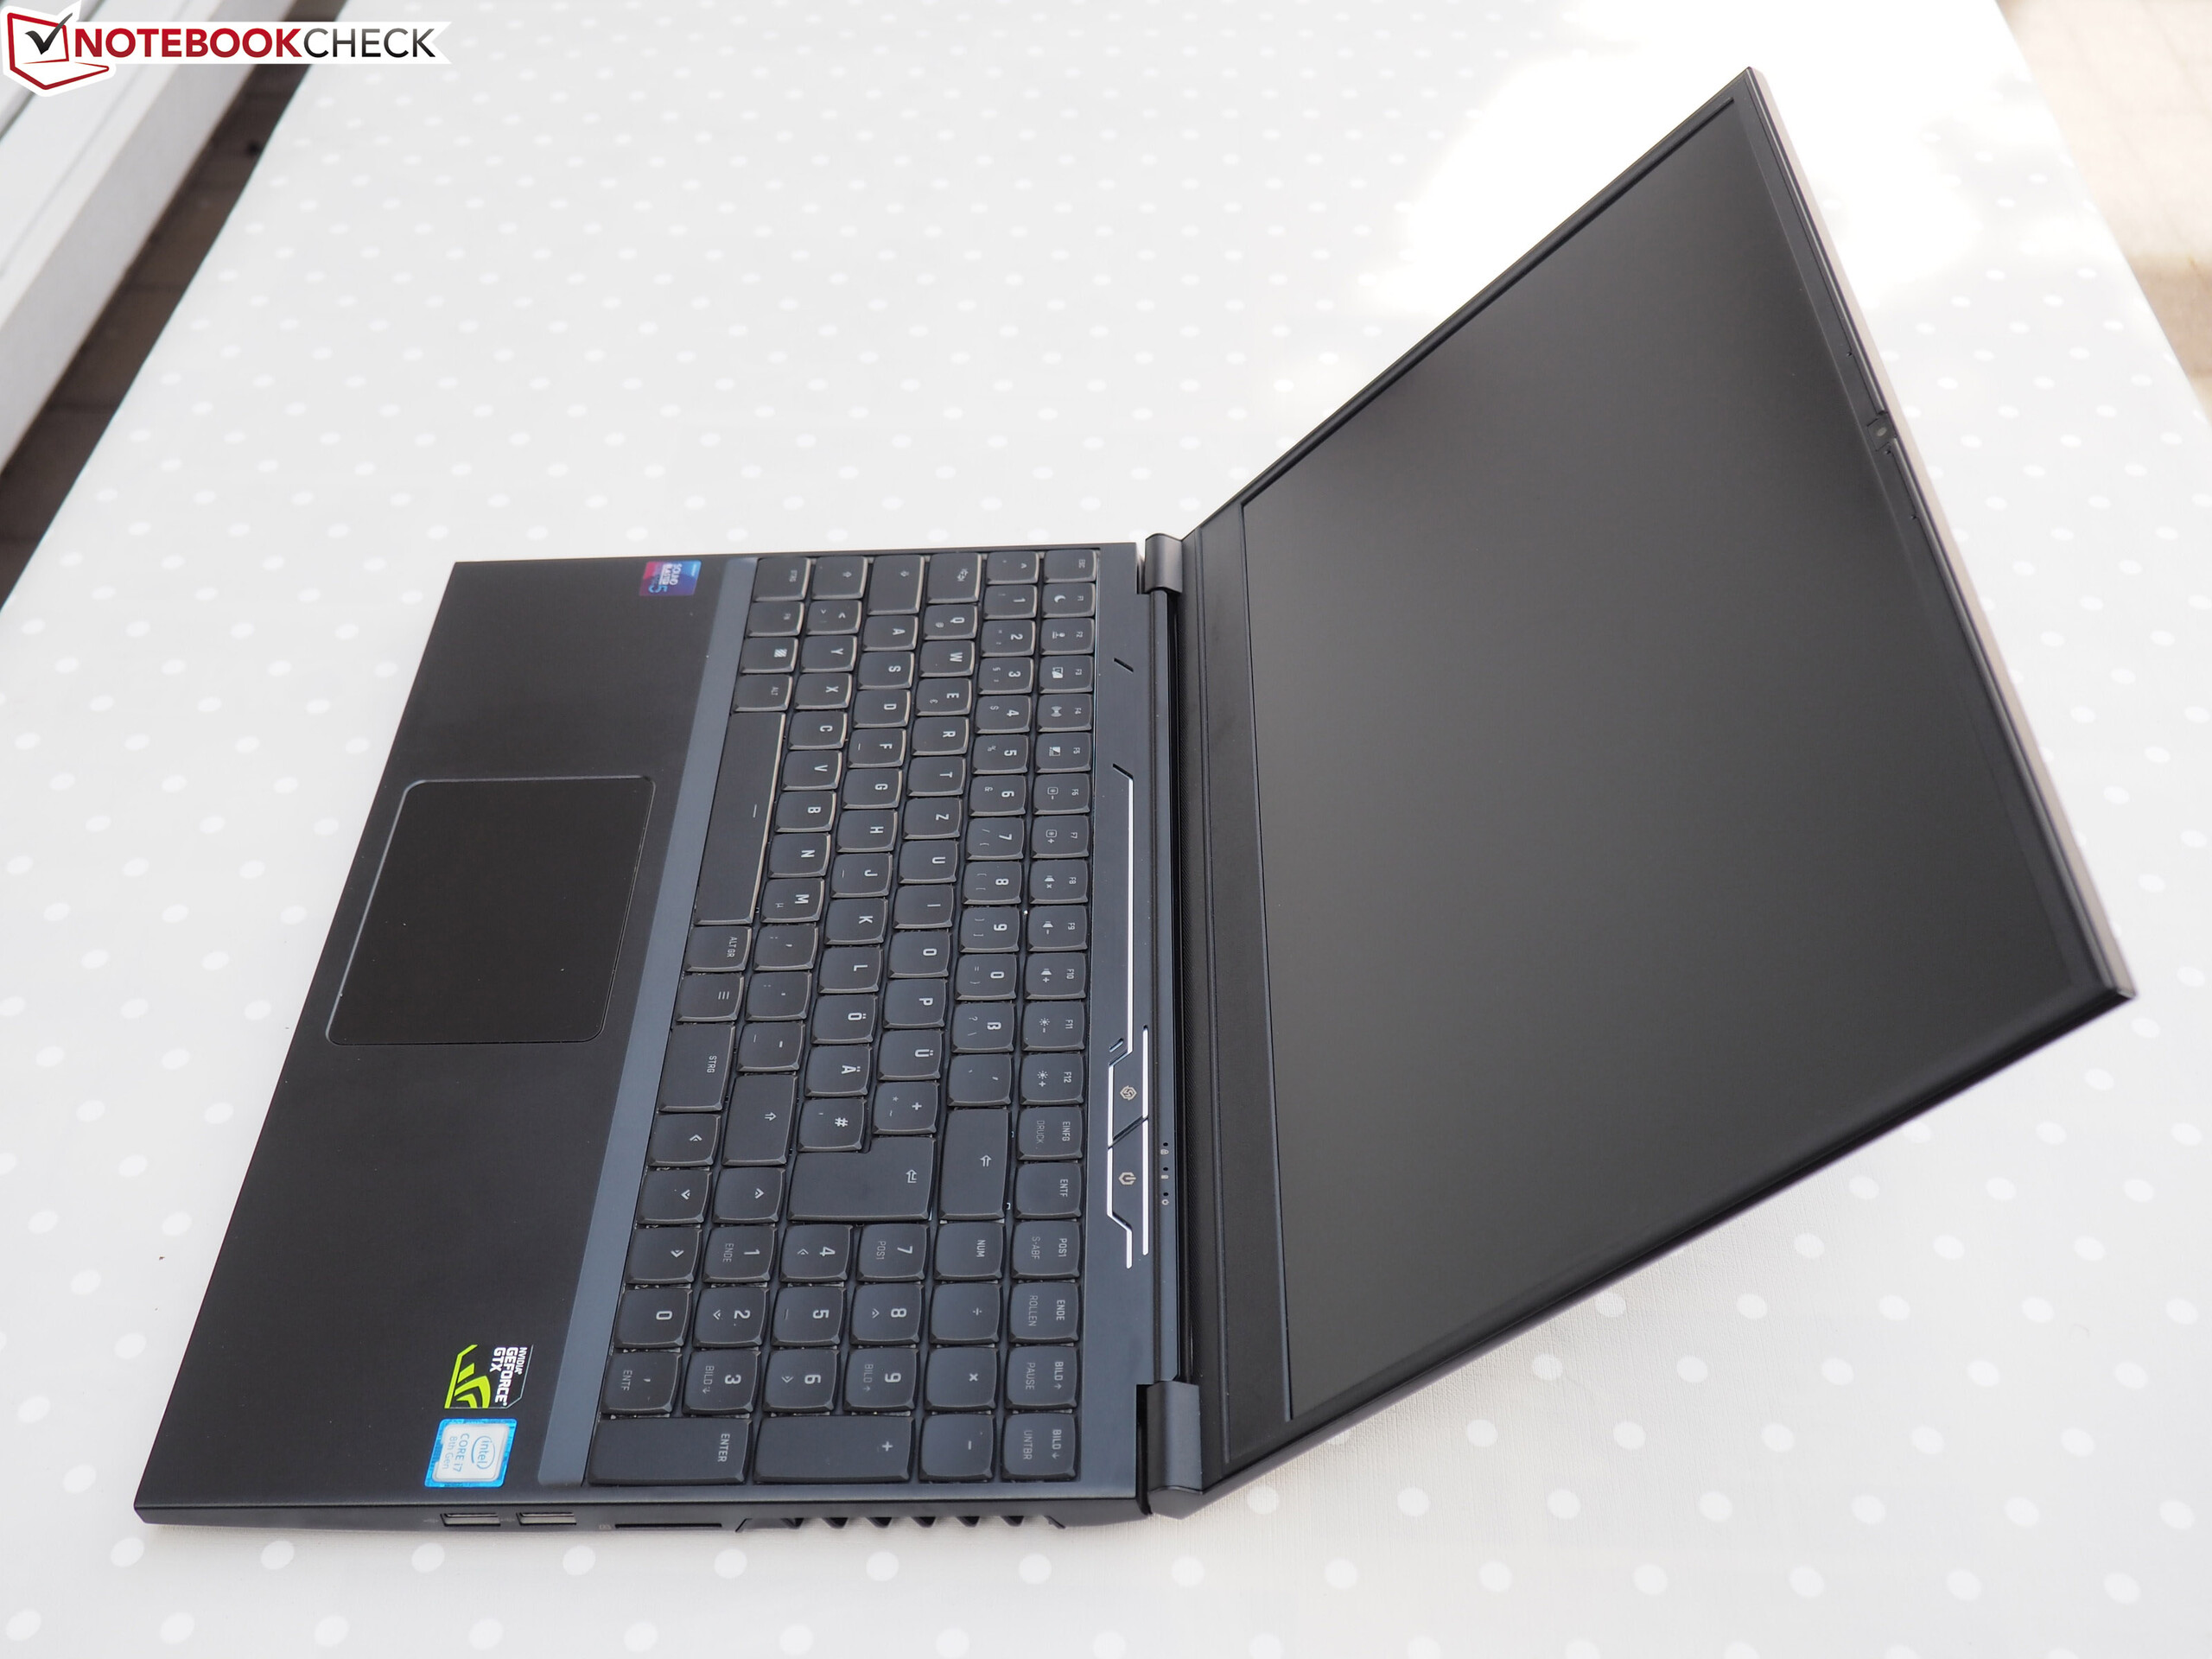
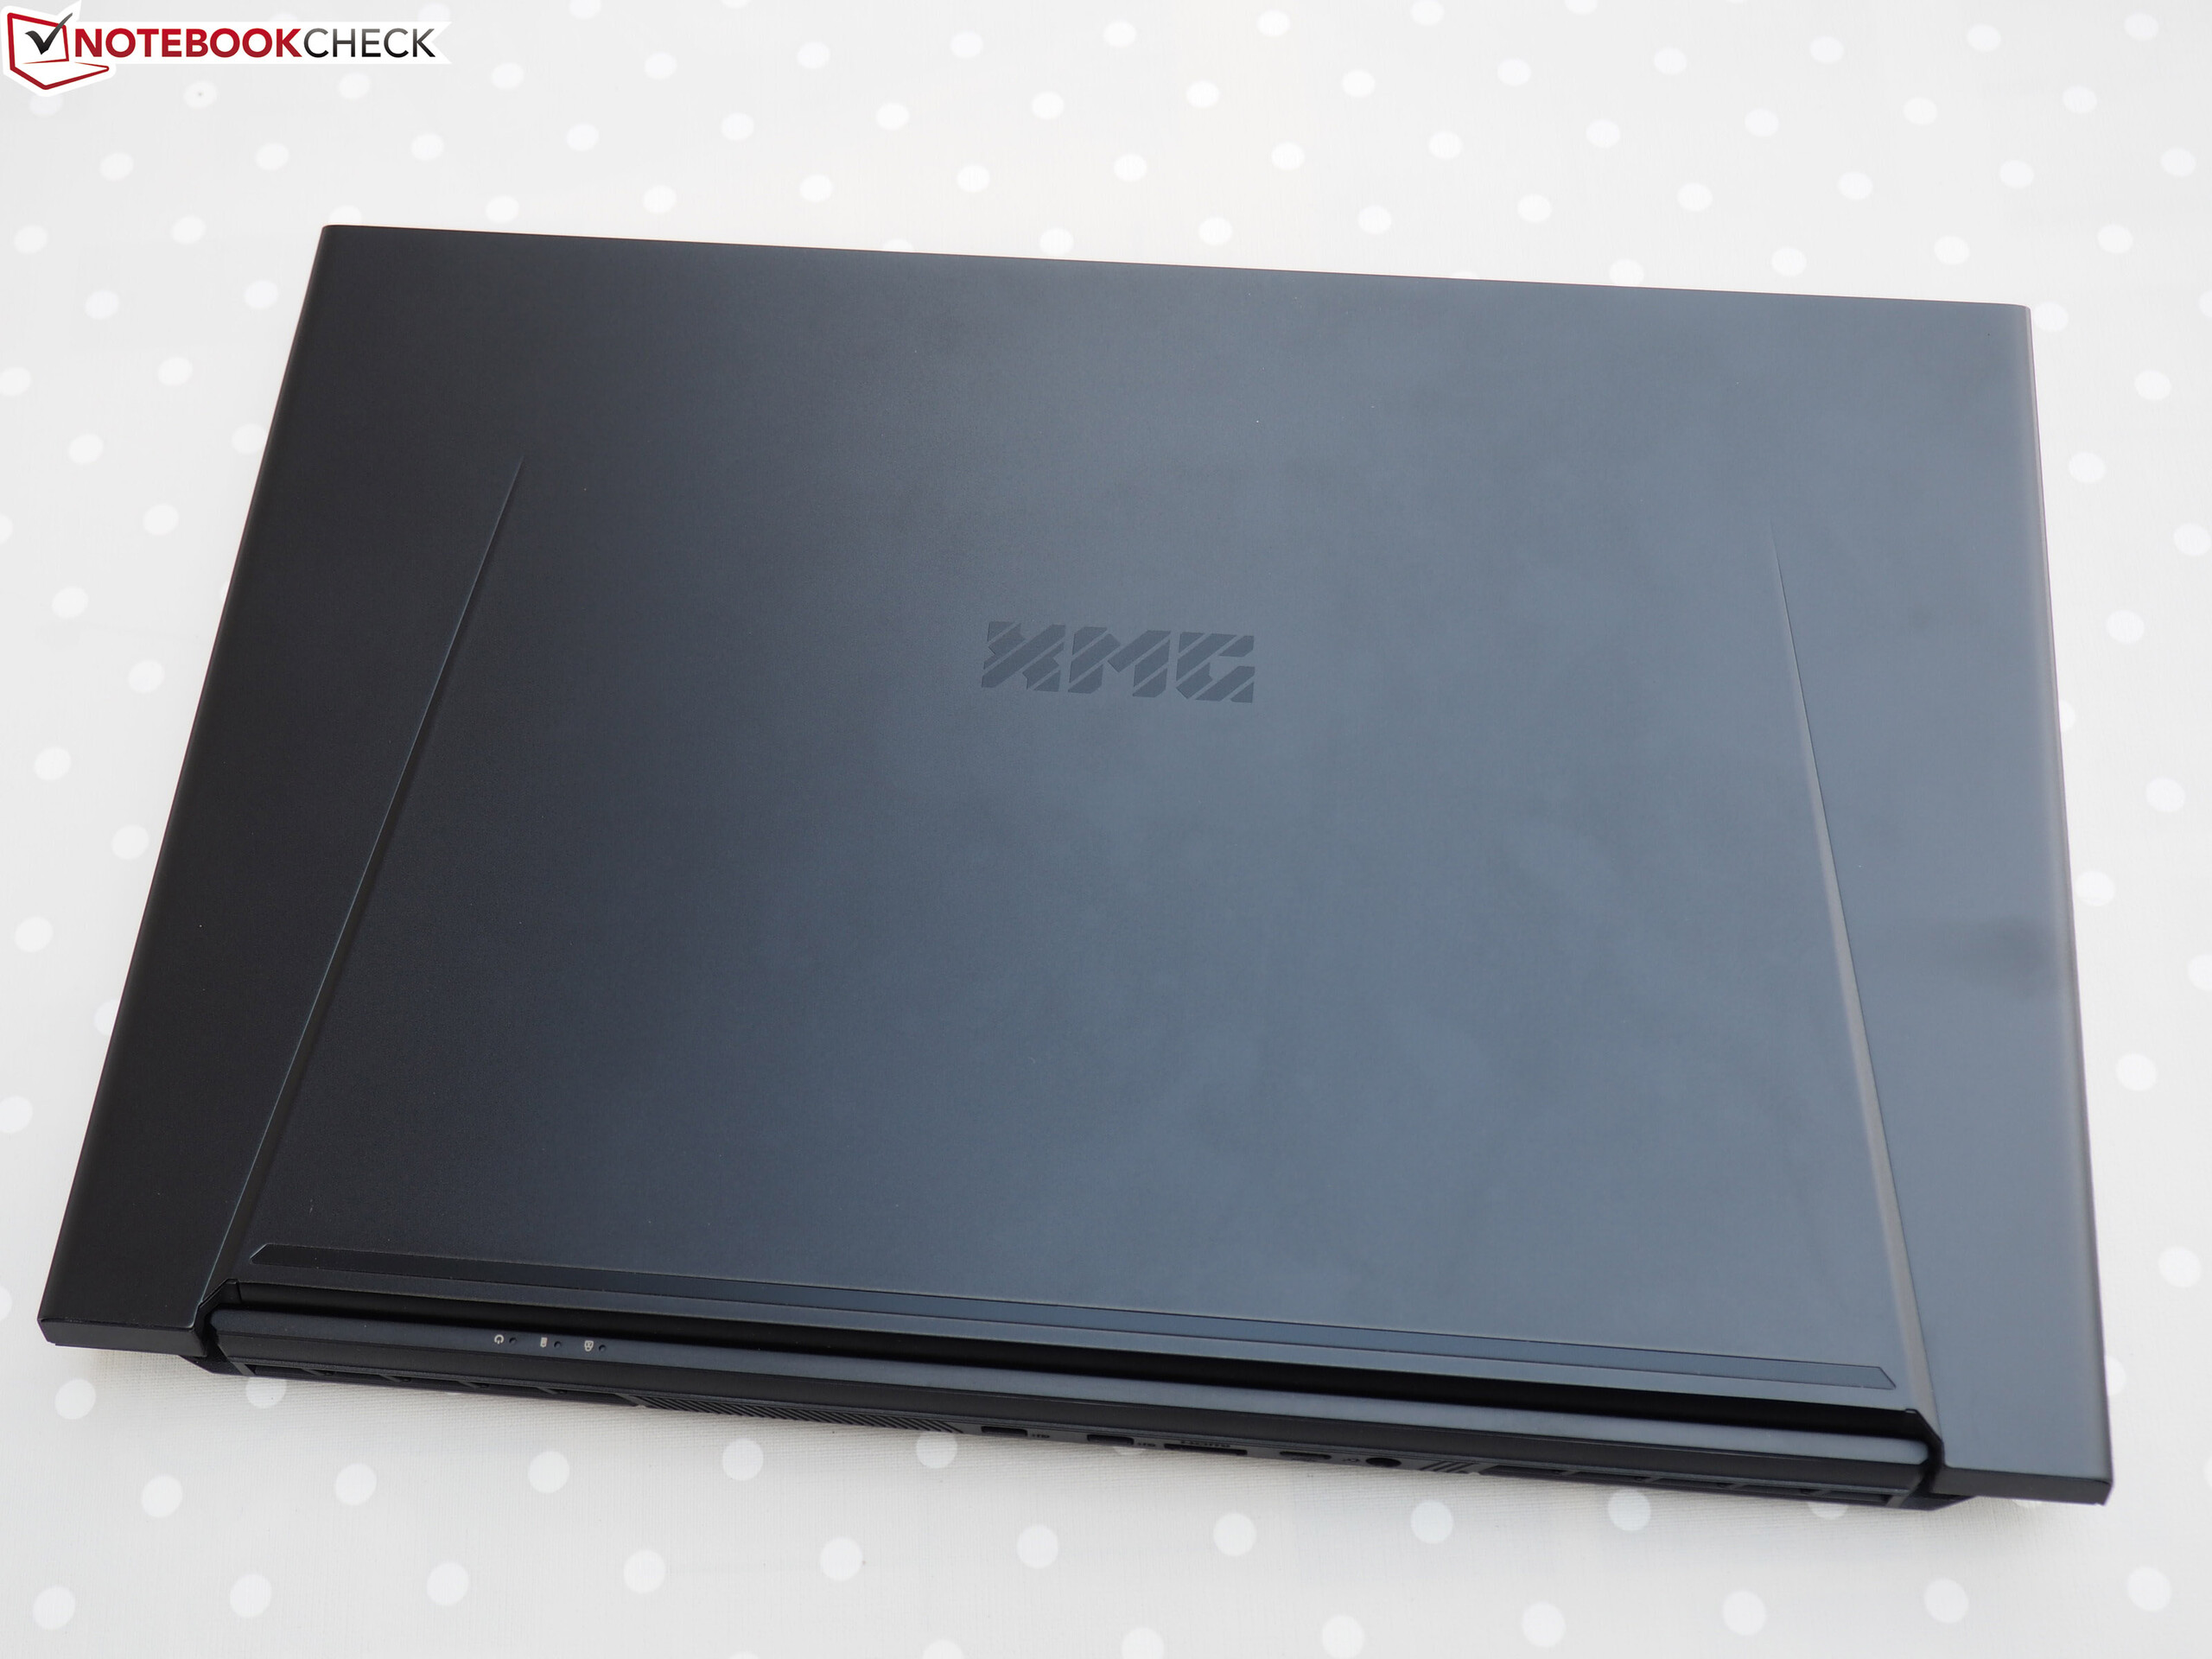
O Schenker XMG Neo 15 continua sendo um portátil para jogos de 15,6 polegadas relativamente compacto e, portanto, é um concorrente direto do Gigabyte Aero 15-X9 e o Razer Blade 15. Ele preenche todos os requisitos para um portátil para jogos. Todos os jogos atuais podem ser apreciados fluentemente em sua tela FHD mate com detalhes altos ou até máximos.
O XMG Neo 15 da Schenker é um portátil para jogos fino, bem feito. No entanto, ele não consegue acompanhar seus concorrentes diretos, o Aero 15-X9 e o Blade 15.
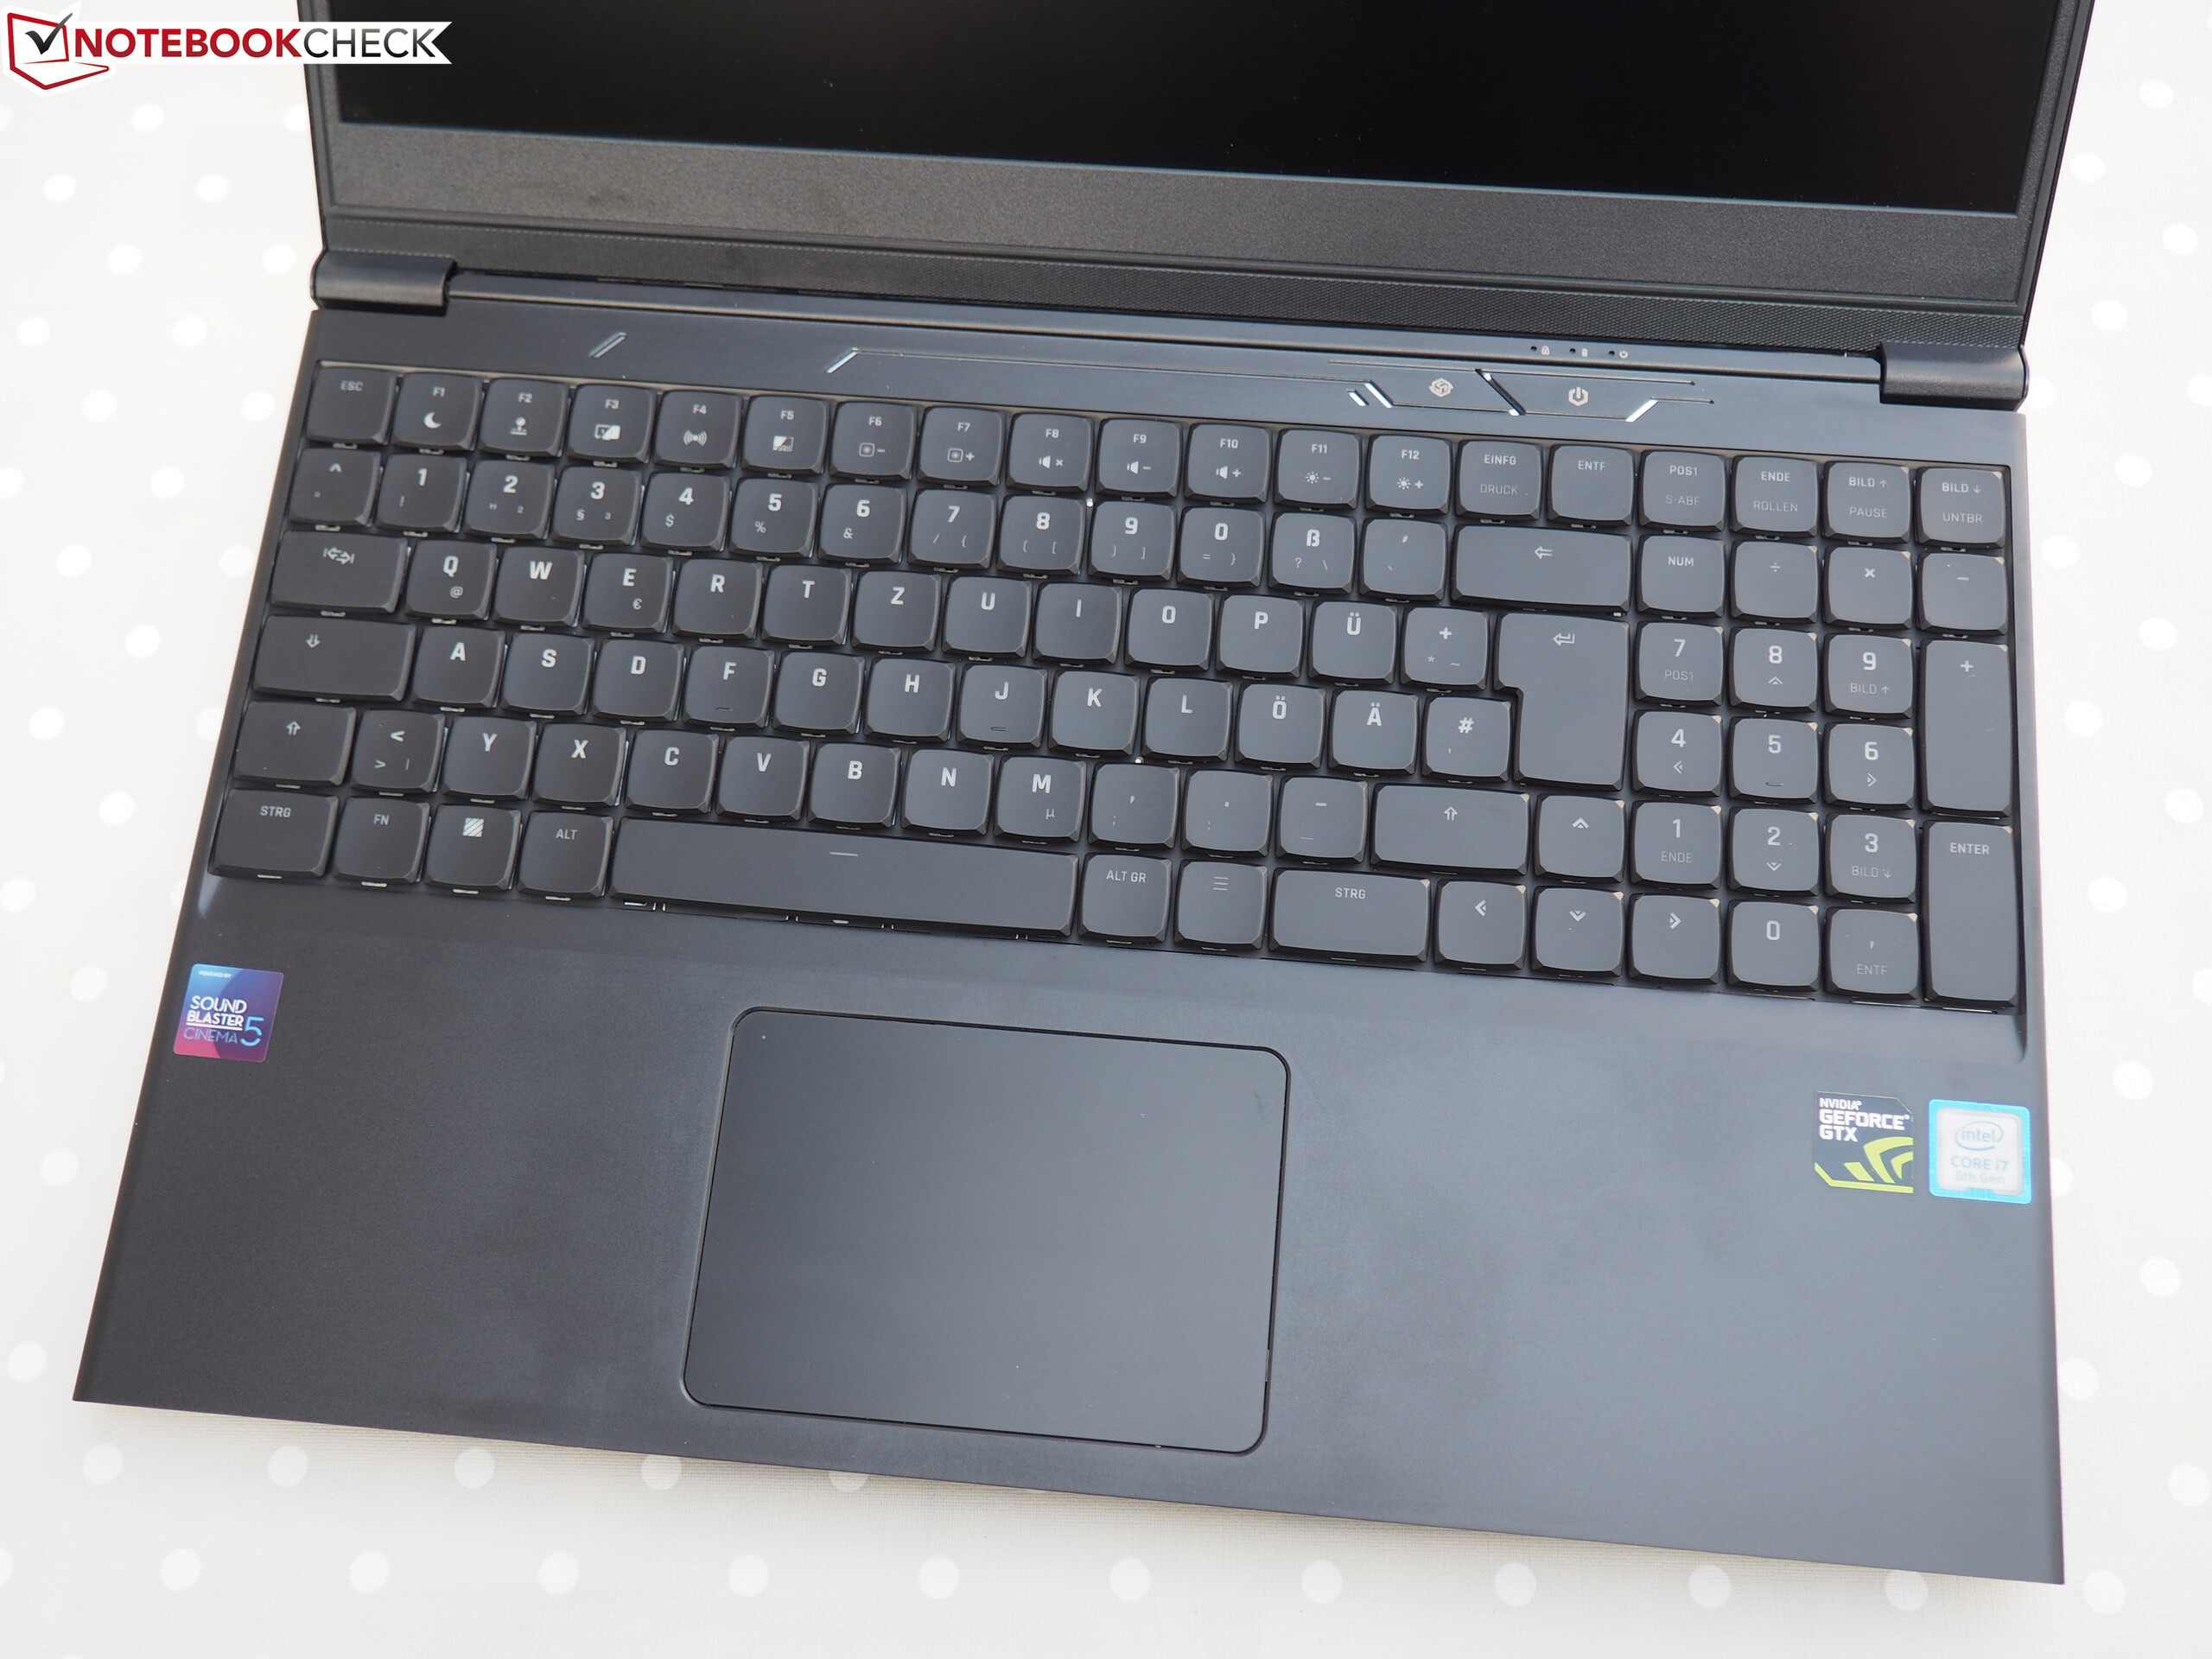
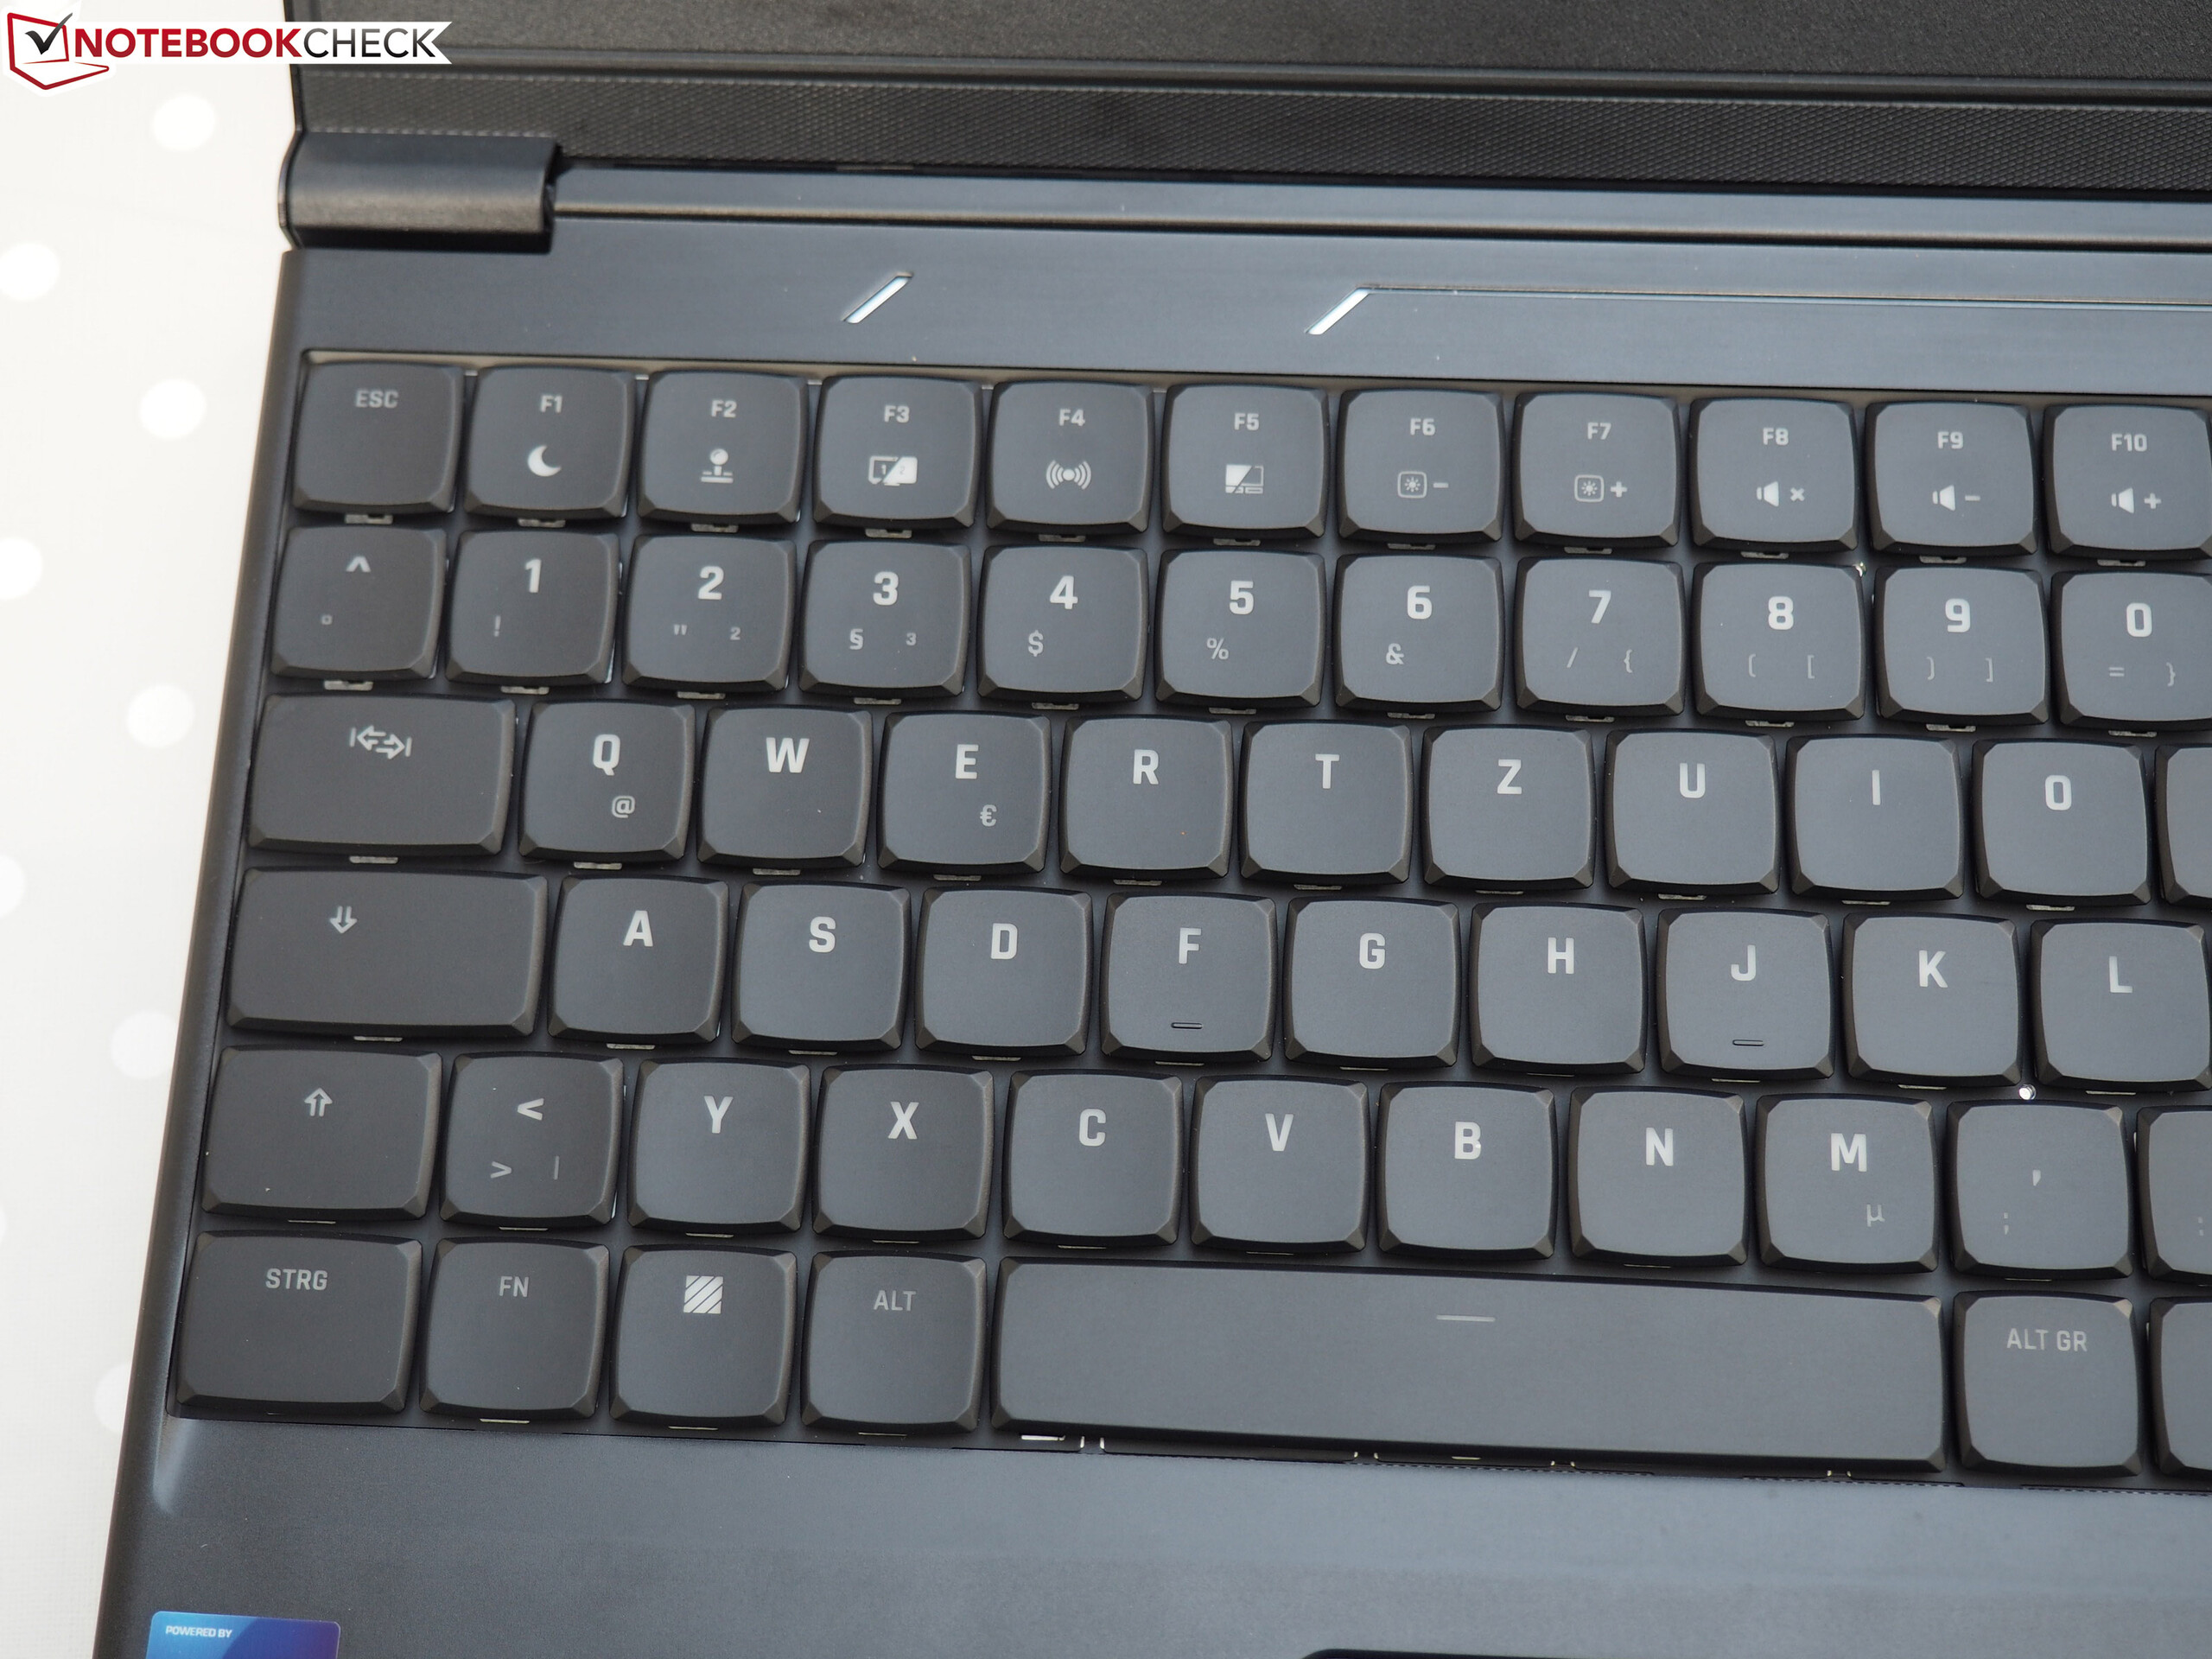
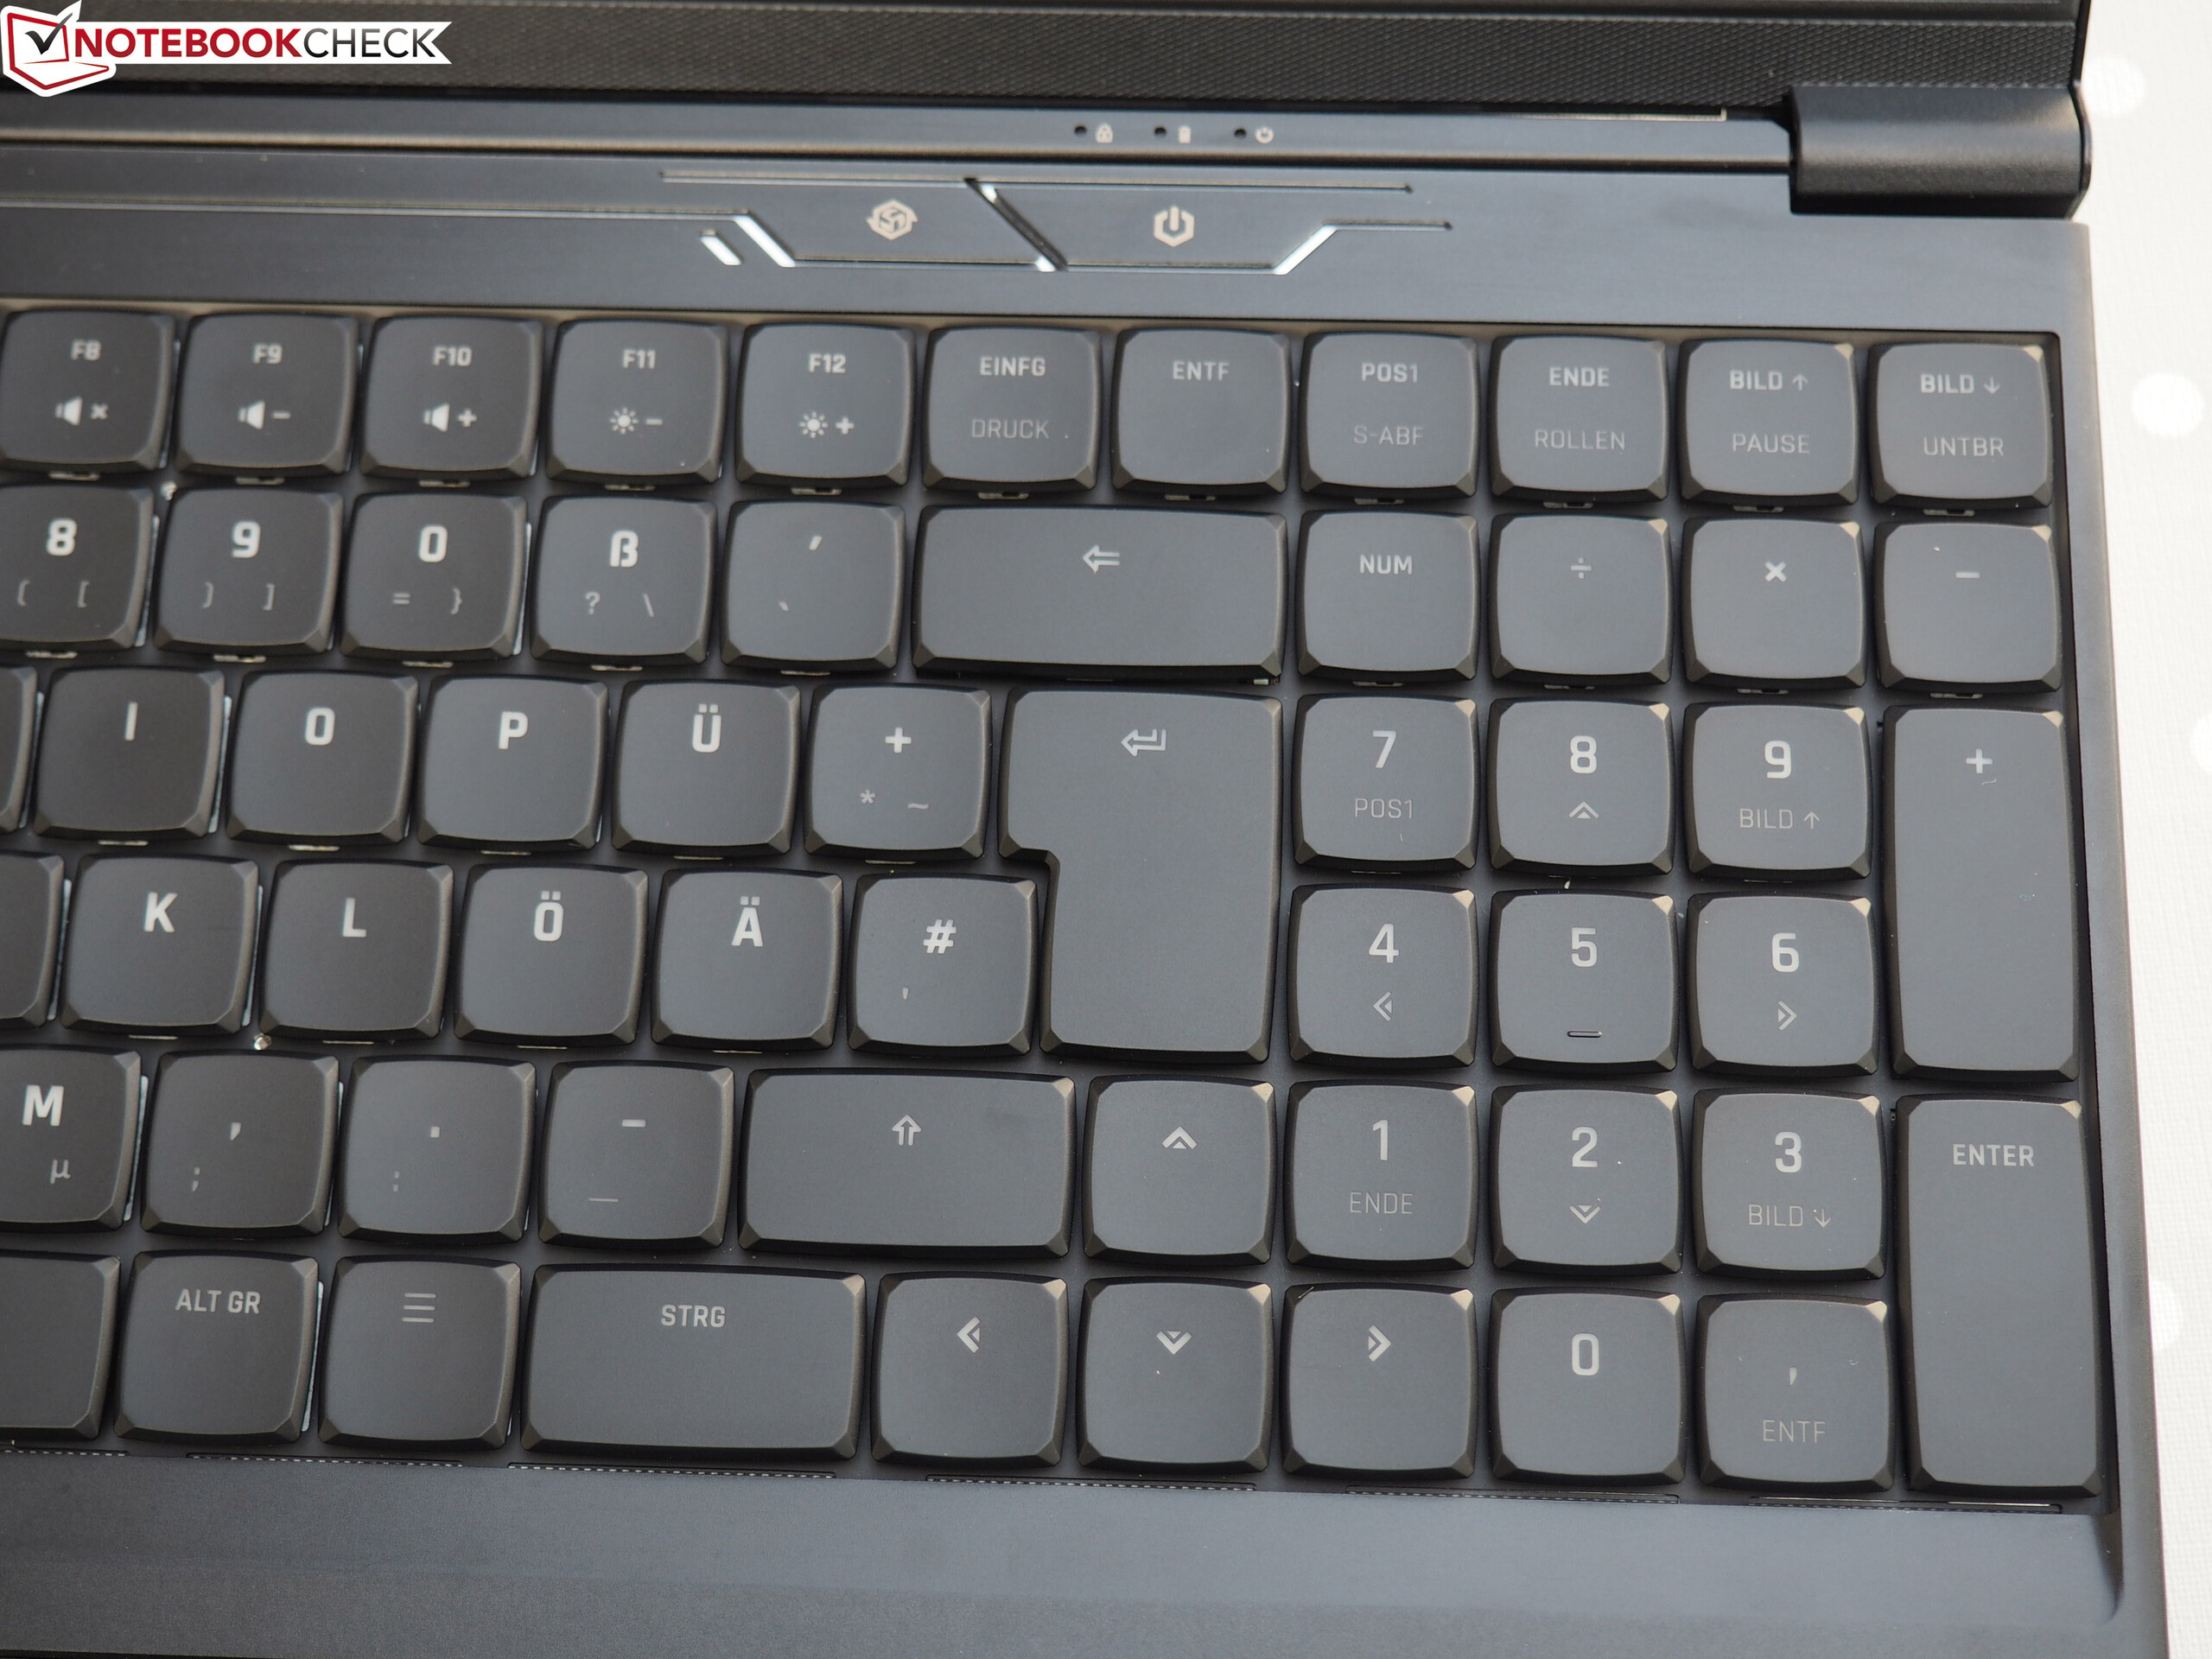
Ele também possui um teclado mecânico com luz de fundo RGB, bem como um painel IPS de 144 Hz com amplos ângulos de visão, tempos de resposta curtos, uma alta taxa de contraste e uma precisão de cores decente. Dito isso, o brilho da tela deve ser maior, especialmente considerando o preço do Neo.
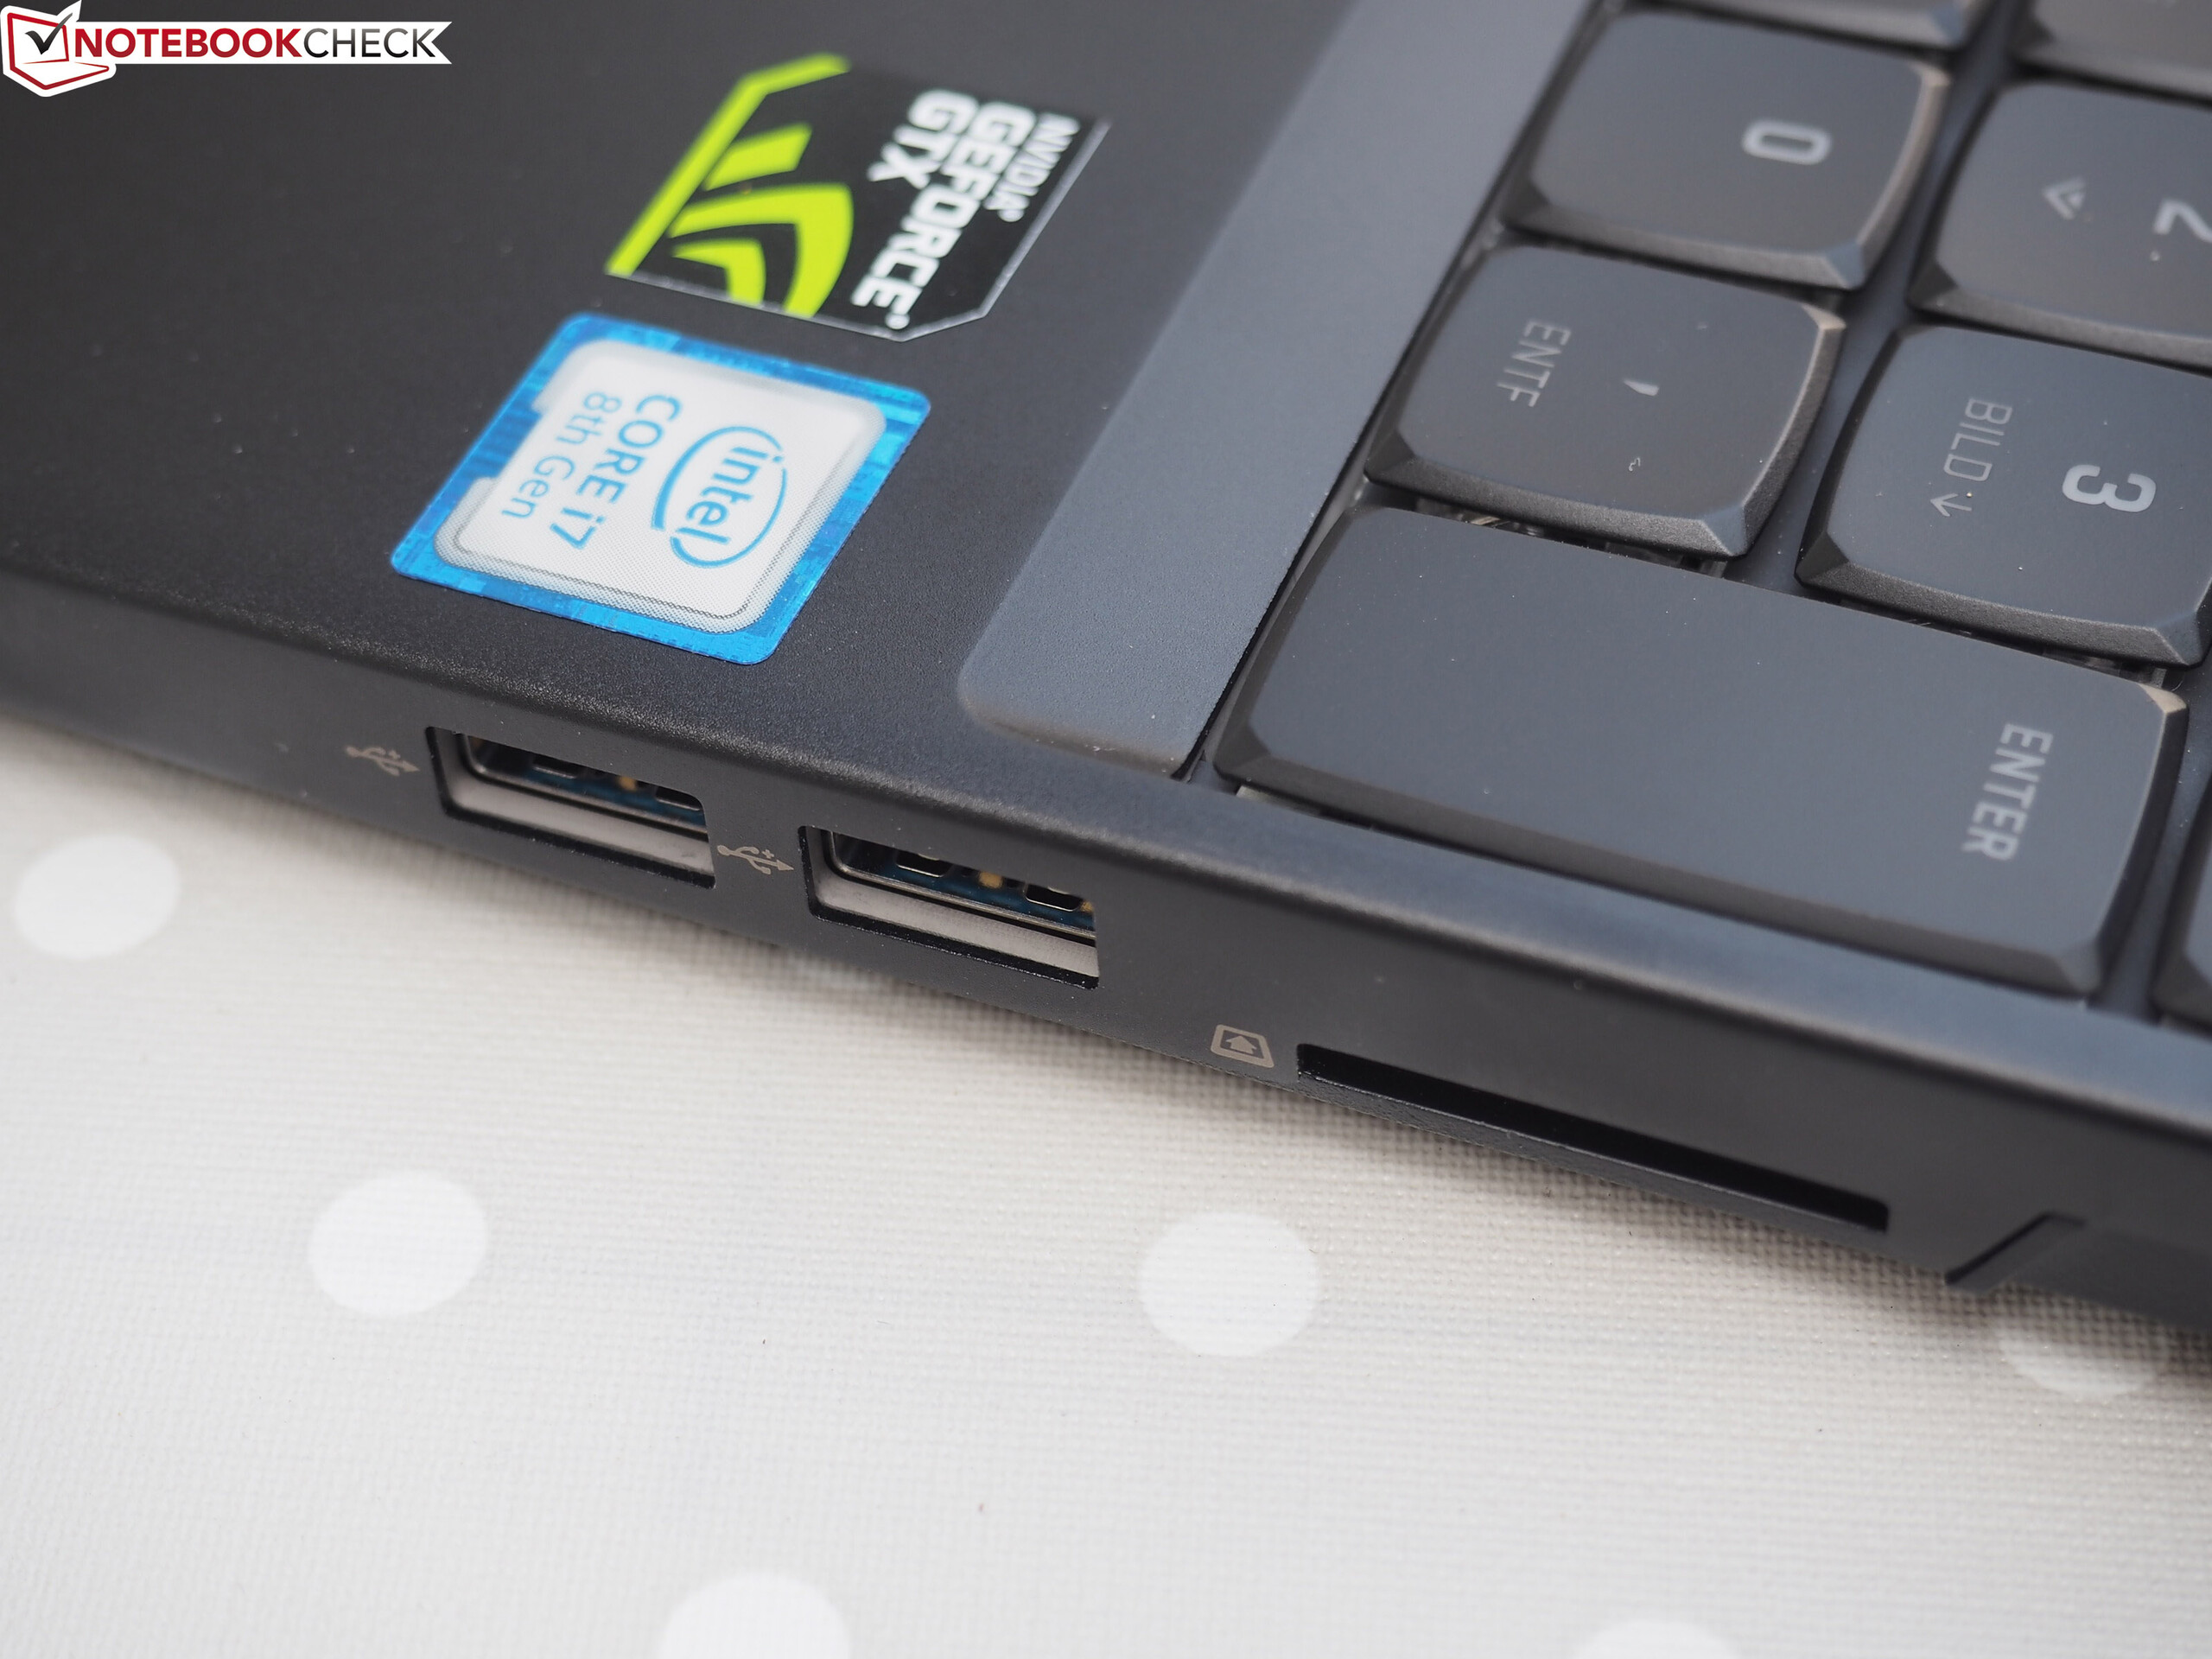
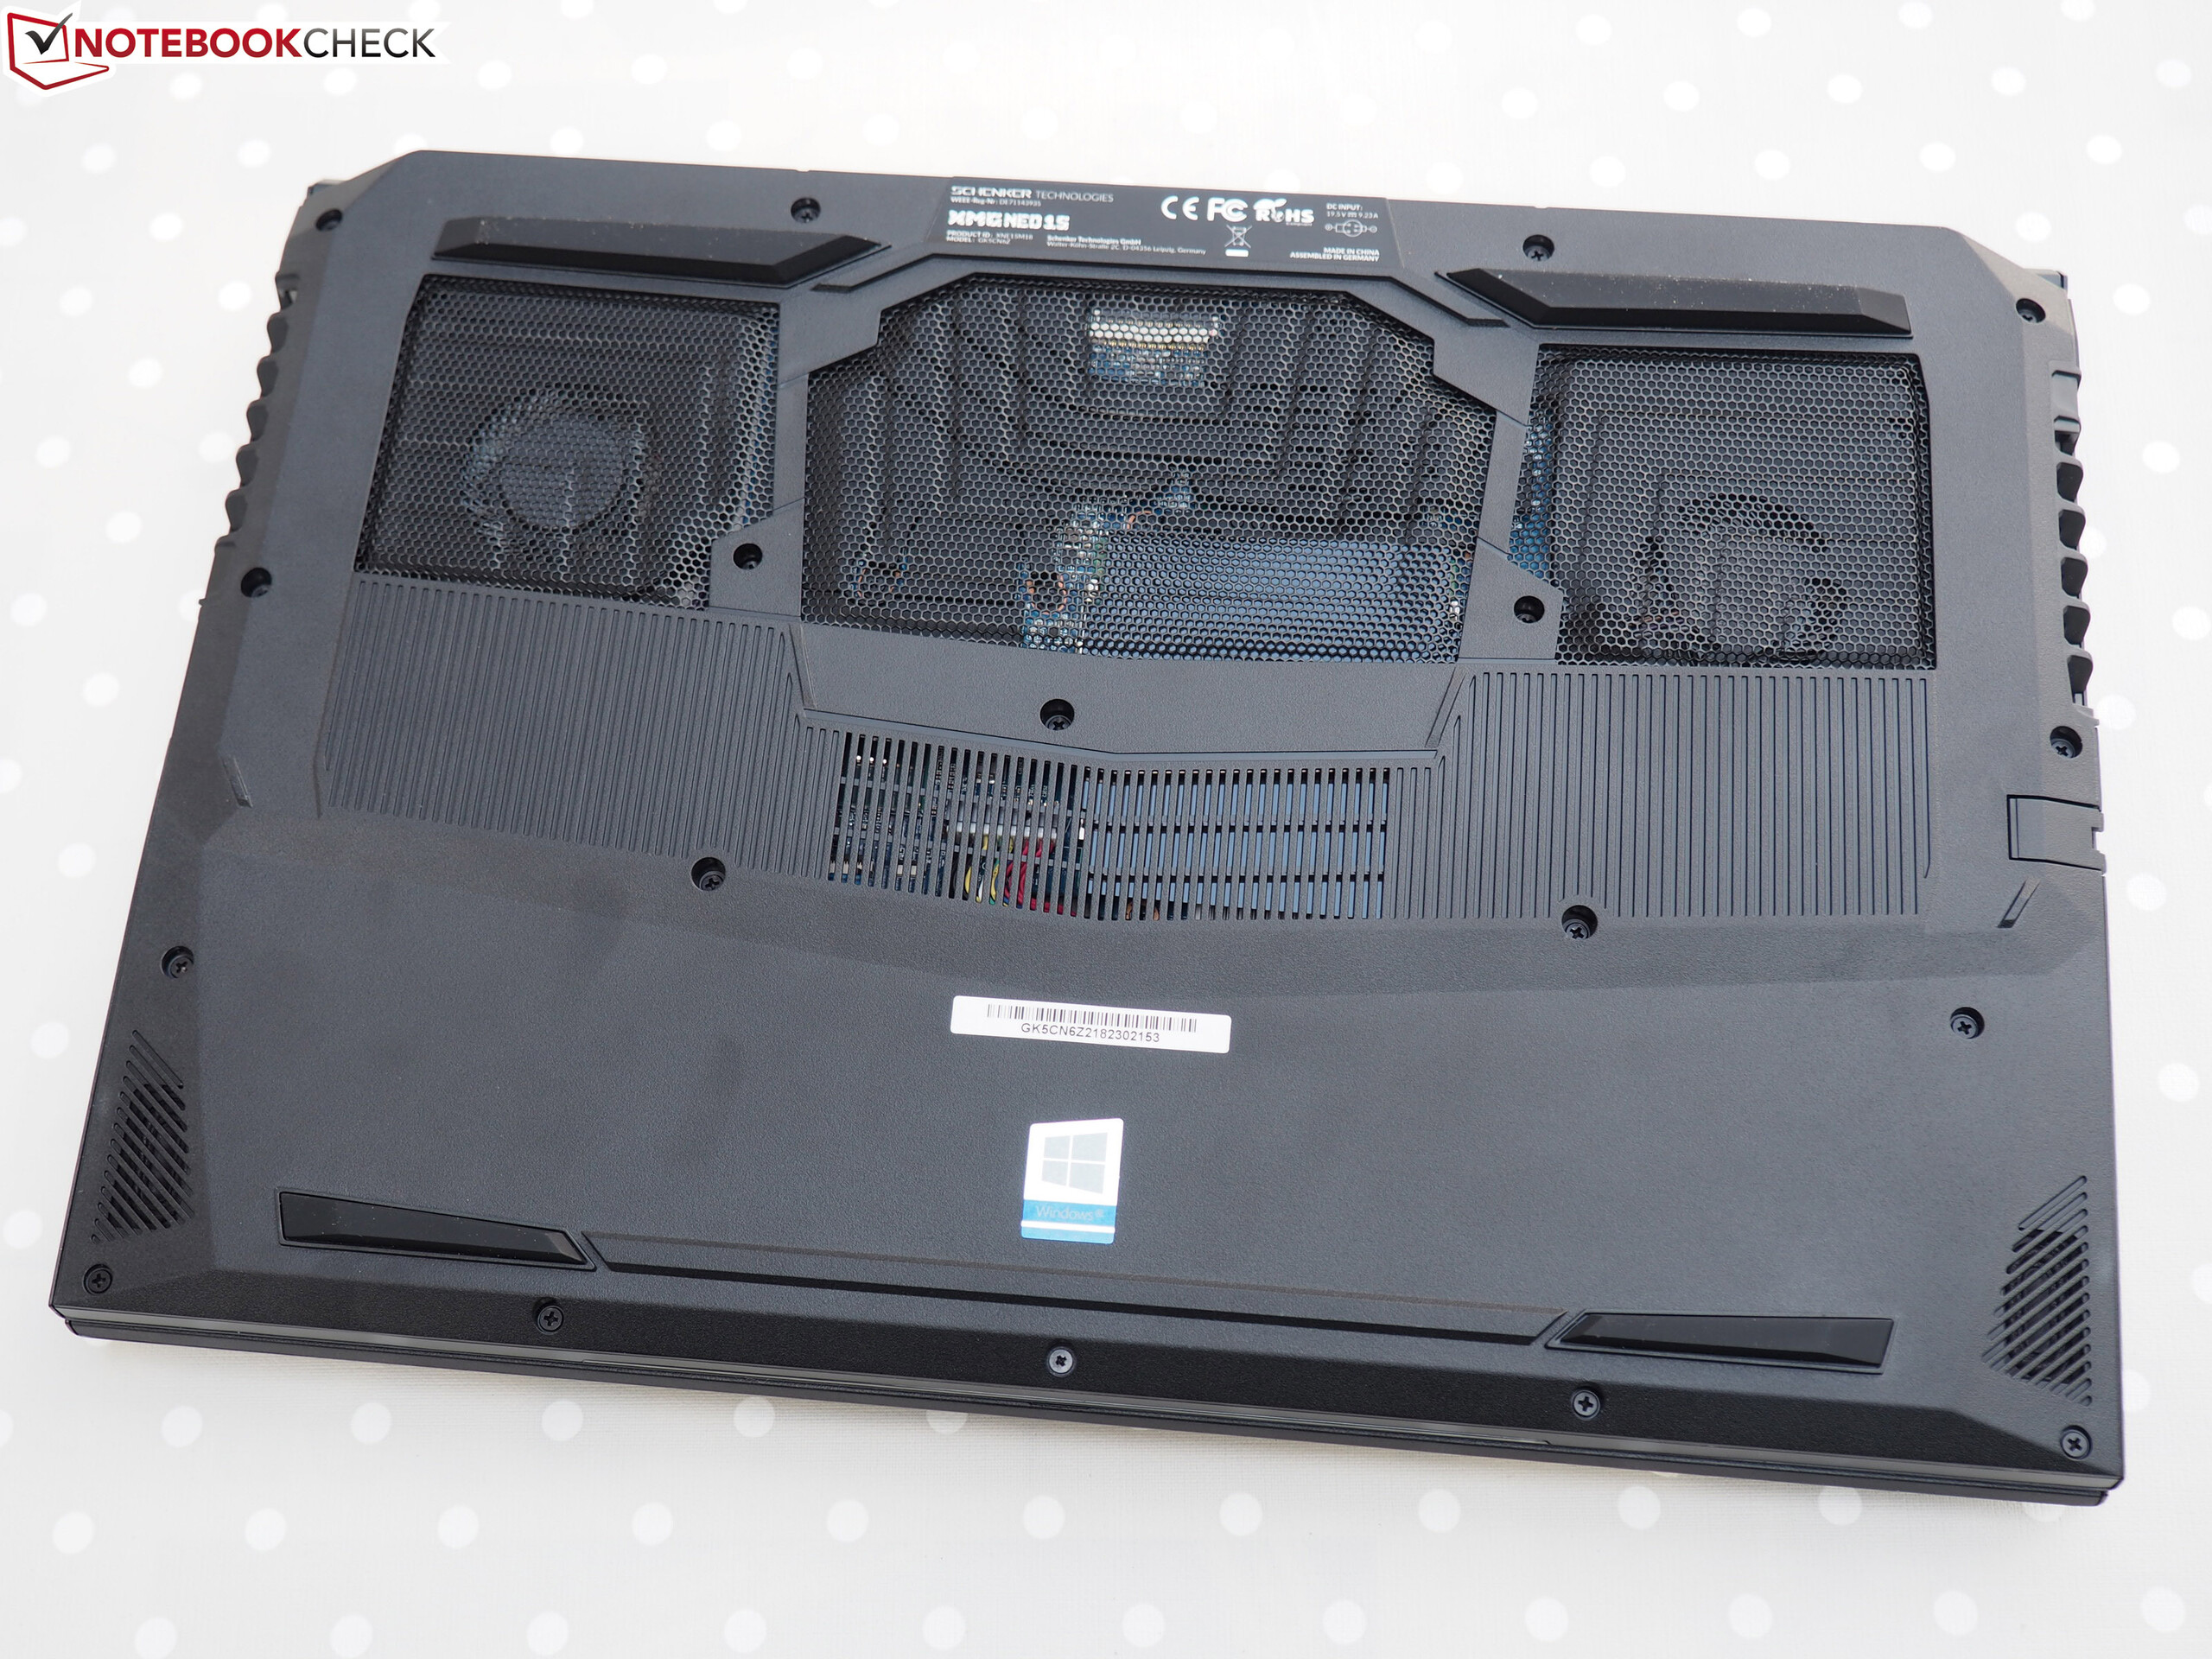
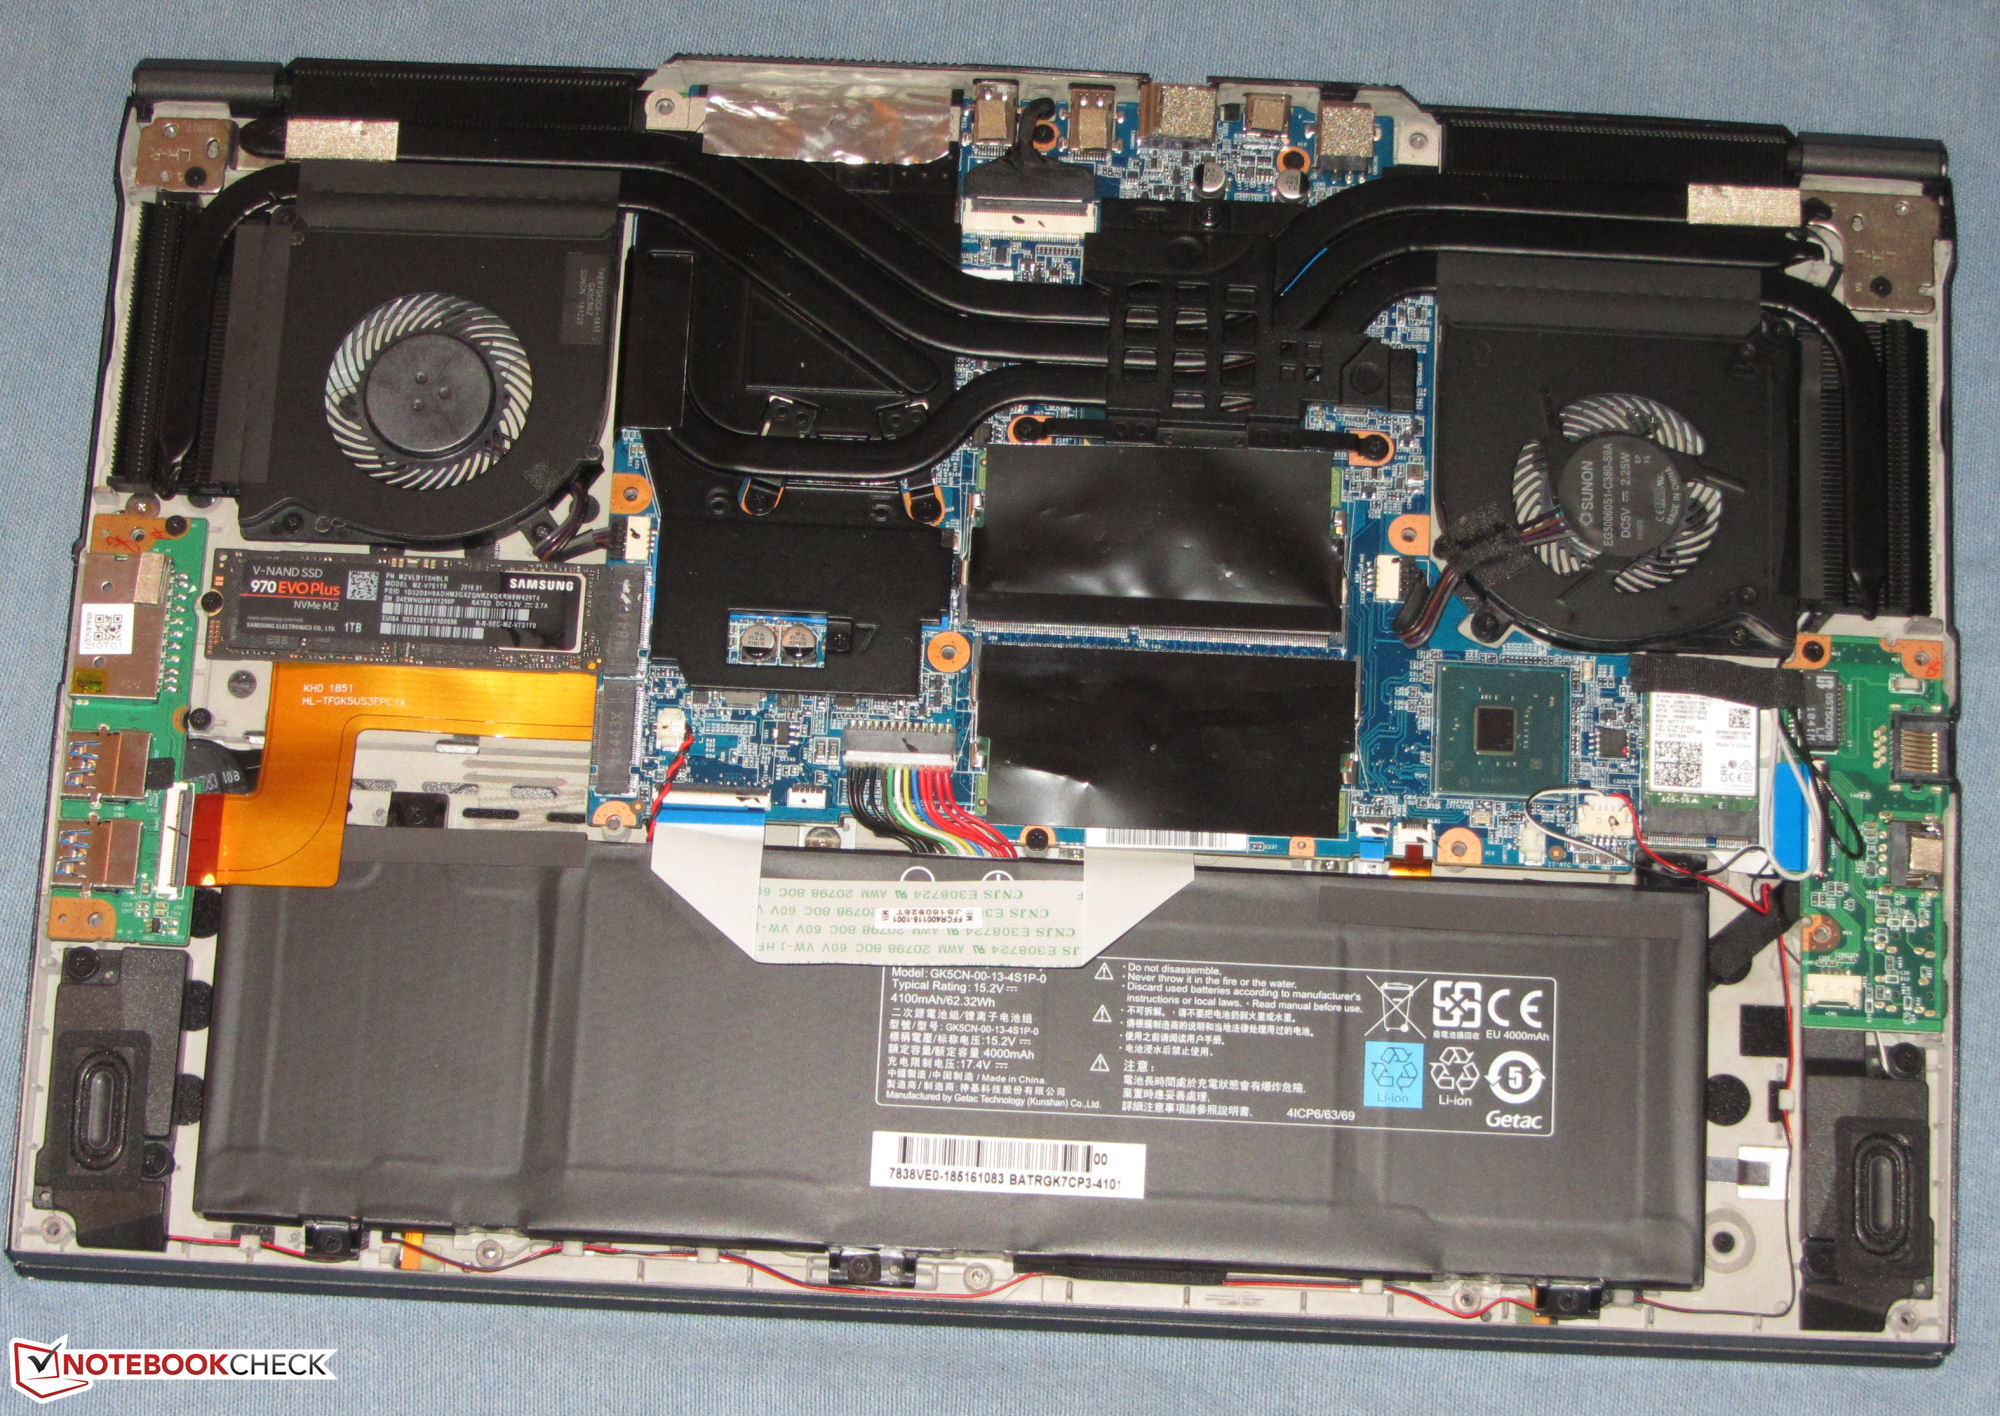
O sistema funcionou muito fluente e rapidamente graças ao seu incrivelmente rápido SSD NVMe. O SSD pode ser trocado, se necessário. Um slot M.2-2280 secundário está disponível, no entanto, o slot de HD de 2,5 polegadas está ausente devido à maior bateria interna. Em troca, a duração da bateria é ligeiramente maior do que antes. A duração da bateria foi boa para um portátil de jogos.
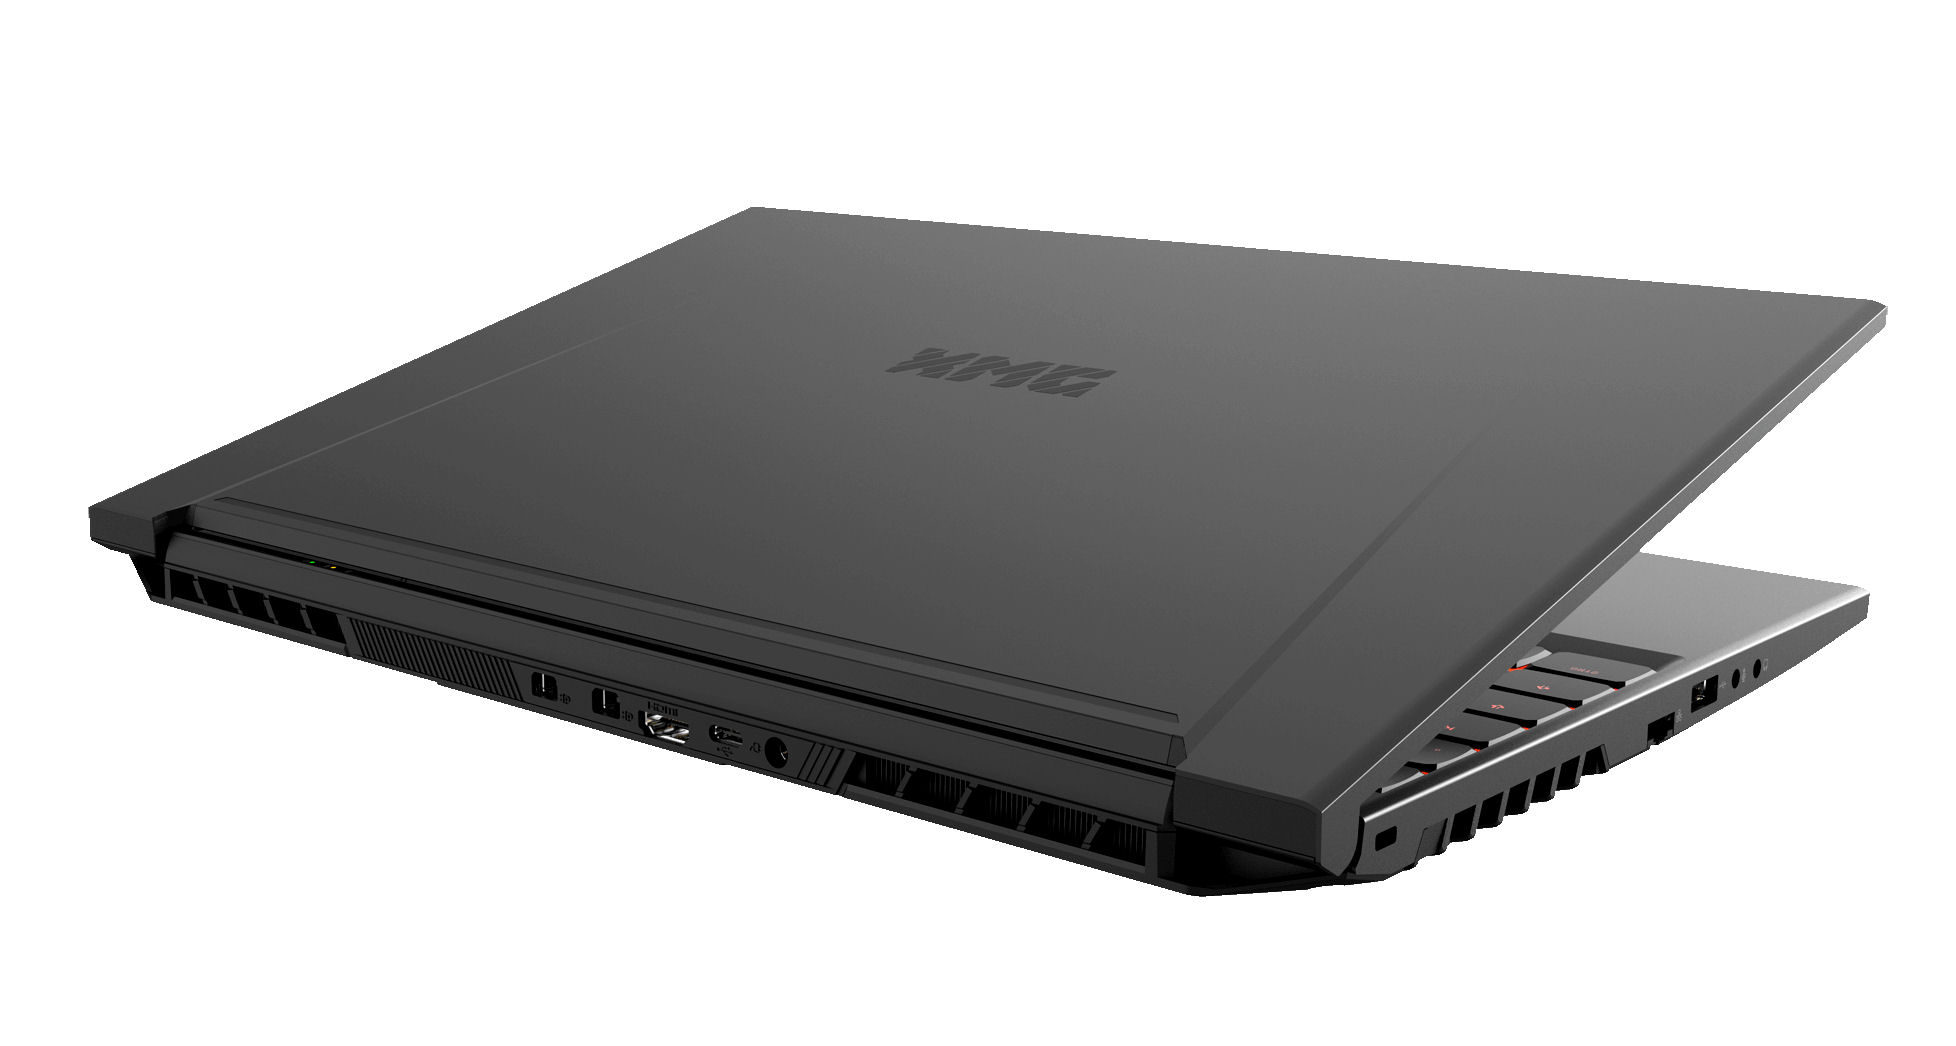
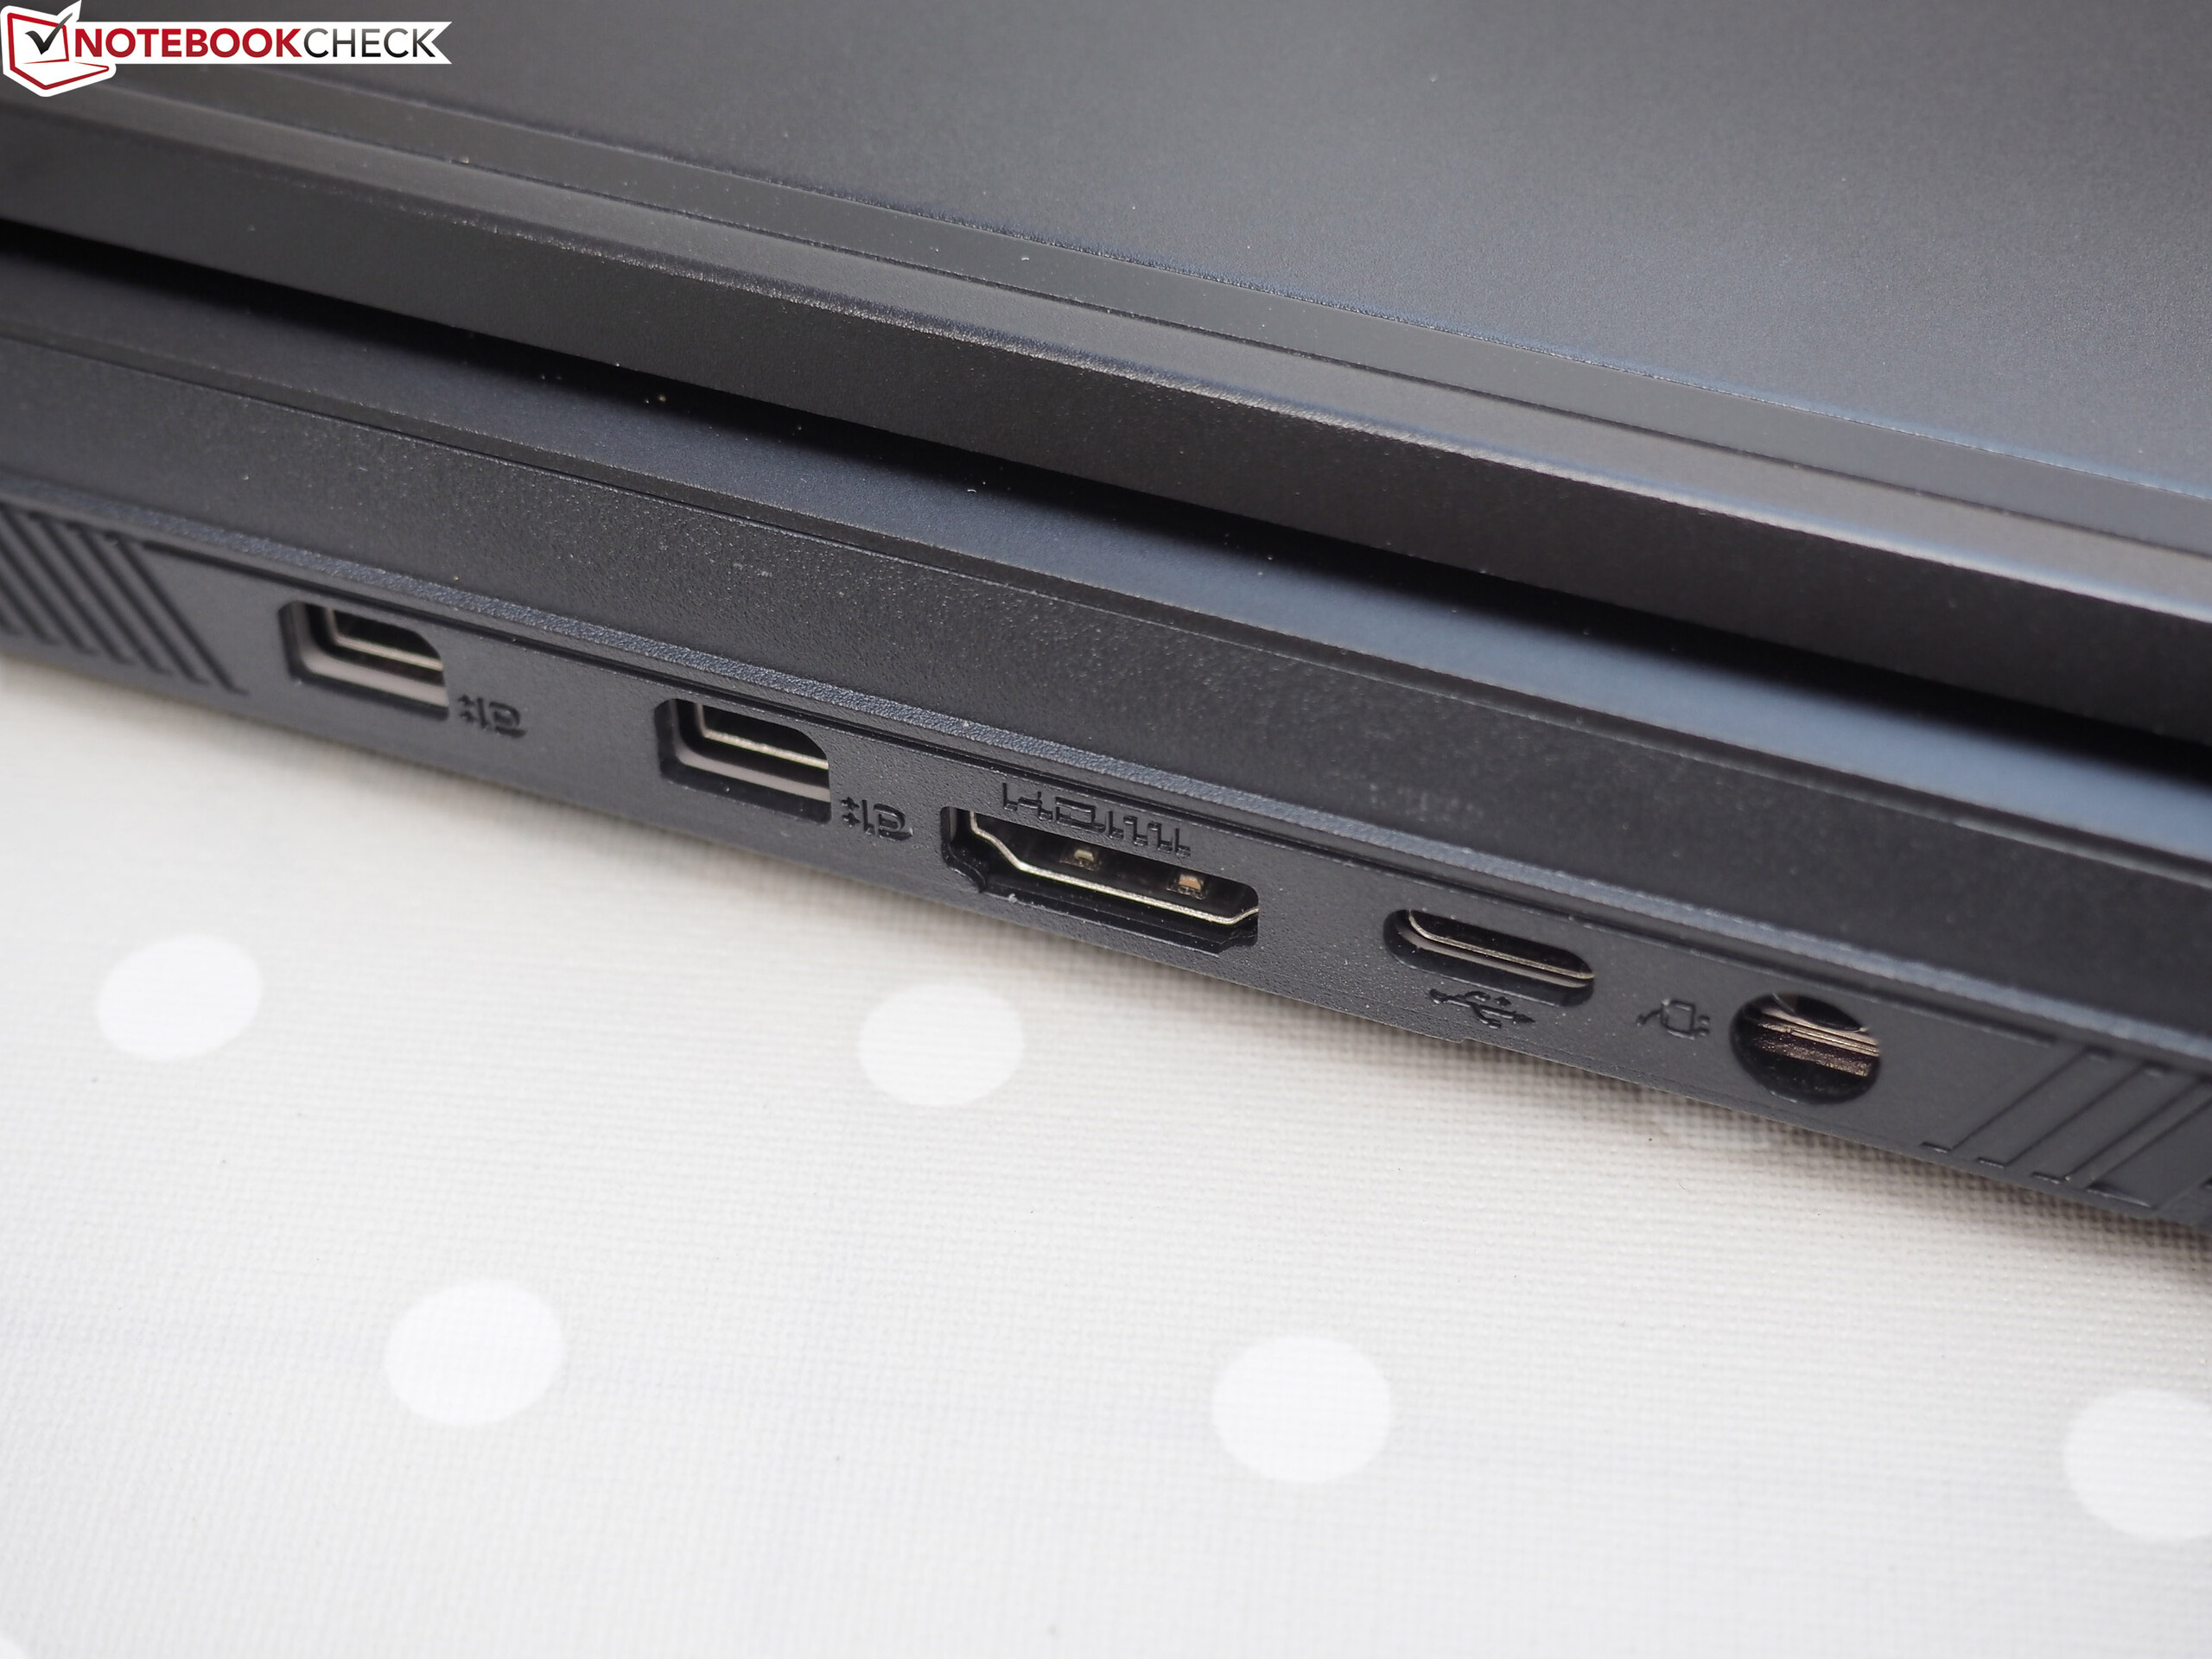
No entanto, existem algumas falhas que vale a pena mencionar. Por exemplo, suas temperaturas muito altas e o ruído sob uso intenso. Dito isto, seus concorrentes não são necessariamente muito melhores nesses aspectos. O desempenho do Wi-Fi foi abaixo do ideal, e o portátil não tinha recursos de conectividade modernos, como o Thunderbolt 3.
Schenker XMG Neo 15 Turing
- 04/09/2019 v6 (old)
Sascha Mölck
Price comparison
