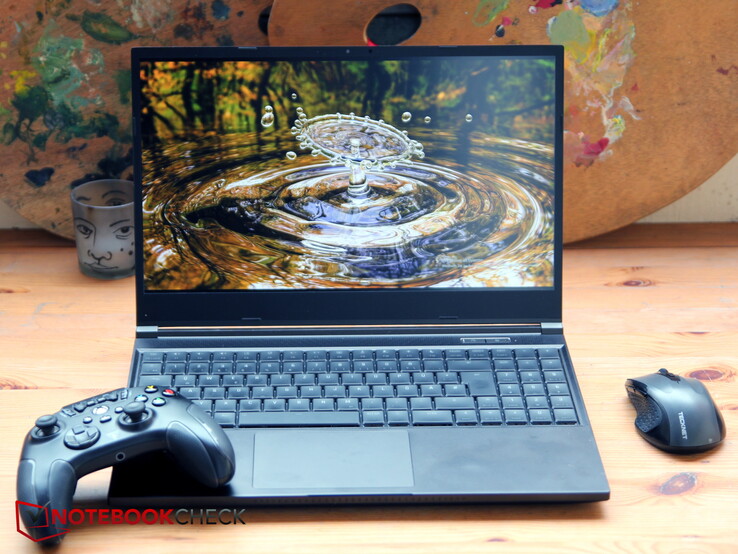
Revisão do Schenker XMG Neo 15 para portáteis de jogos: Ryzen 6000 com portas de resfriamento líquido
O Neo 15, baseado na Intel, que revisamos em julhofoi um laptop incomum que apresenta uma conexão para o sistema opcional de refrigeração OASIS (vendido separadamente por cerca de 199 euros, ou US$198), que também testamos ao mesmo tempo.
XMG lançou agora um novo modelo Neo 15 equipado com o mais recente processador AMD Ryzen. A mudança para uma CPU AMD também trouxe algumas outras mudanças na seleção de portas e outras coisas do gênero.
Então, qual é o desempenho do Neo baseado em AMD em comparação com o modelo baseado em Intel? Nesta revisão, vamos testar uma variante com o RTX 3070 Ti ligeiramente mais acessível (que ainda custa 2.850 Euros, ou US$ 2.826) e dar uma olhada no que as mudanças de hardware significam para o desempenho e emissões do laptop.
Além de apenas comparar os Neo 15s baseados em AMD e Intel, estaremos comparando o modelo de revisão com outros laptops de jogos com um RTX 3070 Ti, tais como o MSI Raider GE67, Asus ROG Strix Scar 15, Acer Nitro 5 e MSI Stealth GS66.
Possíveis concorrentes em comparação
Avaliação | Data | Modelo | Peso | Altura | Size | Resolução | Preço |
|---|---|---|---|---|---|---|---|
| 88 % v7 (old) | 11/2022 | Schenker XMG Neo 15 (Ryzen 9 6900HX, RTX 3070 Ti) R9 6900HX, GeForce RTX 3070 Ti Laptop GPU | 2.3 kg | 26.6 mm | 15.60" | 2560x1440 | |
| 88.4 % v7 (old) | 07/2022 | Schenker XMG Neo 15 (i7-12700H, RTX 3080 Ti) i7-12700H, GeForce RTX 3080 Ti Laptop GPU | 2.3 kg | 26.6 mm | 15.60" | 2560x1440 | |
| 87.7 % v7 (old) | 07/2022 | MSI GE67 HX 12UGS i7-12800HX, GeForce RTX 3070 Ti Laptop GPU | 2.5 kg | 23.4 mm | 15.60" | 1920x1080 | |
| 86.3 % v7 (old) | 06/2022 | Asus ROG Strix Scar 15 G533ZW-LN106WS i9-12900H, GeForce RTX 3070 Ti Laptop GPU | 2.3 kg | 27.2 mm | 15.60" | 2560x1440 | |
| 84 % v7 (old) | 06/2022 | Acer Nitro 5 AN515-58-72QR i7-12700H, GeForce RTX 3070 Ti Laptop GPU | 2.5 kg | 26.8 mm | 15.60" | 2560x1440 | |
| 84.5 % v7 (old) | 02/2022 | MSI Stealth GS66 12UGS i7-12700H, GeForce RTX 3070 Ti Laptop GPU | 2.2 kg | 19.8 mm | 15.60" | 2560x1440 |
Estojo - plataforma de teclado robusta, (excessivamente) caixa inferior macia
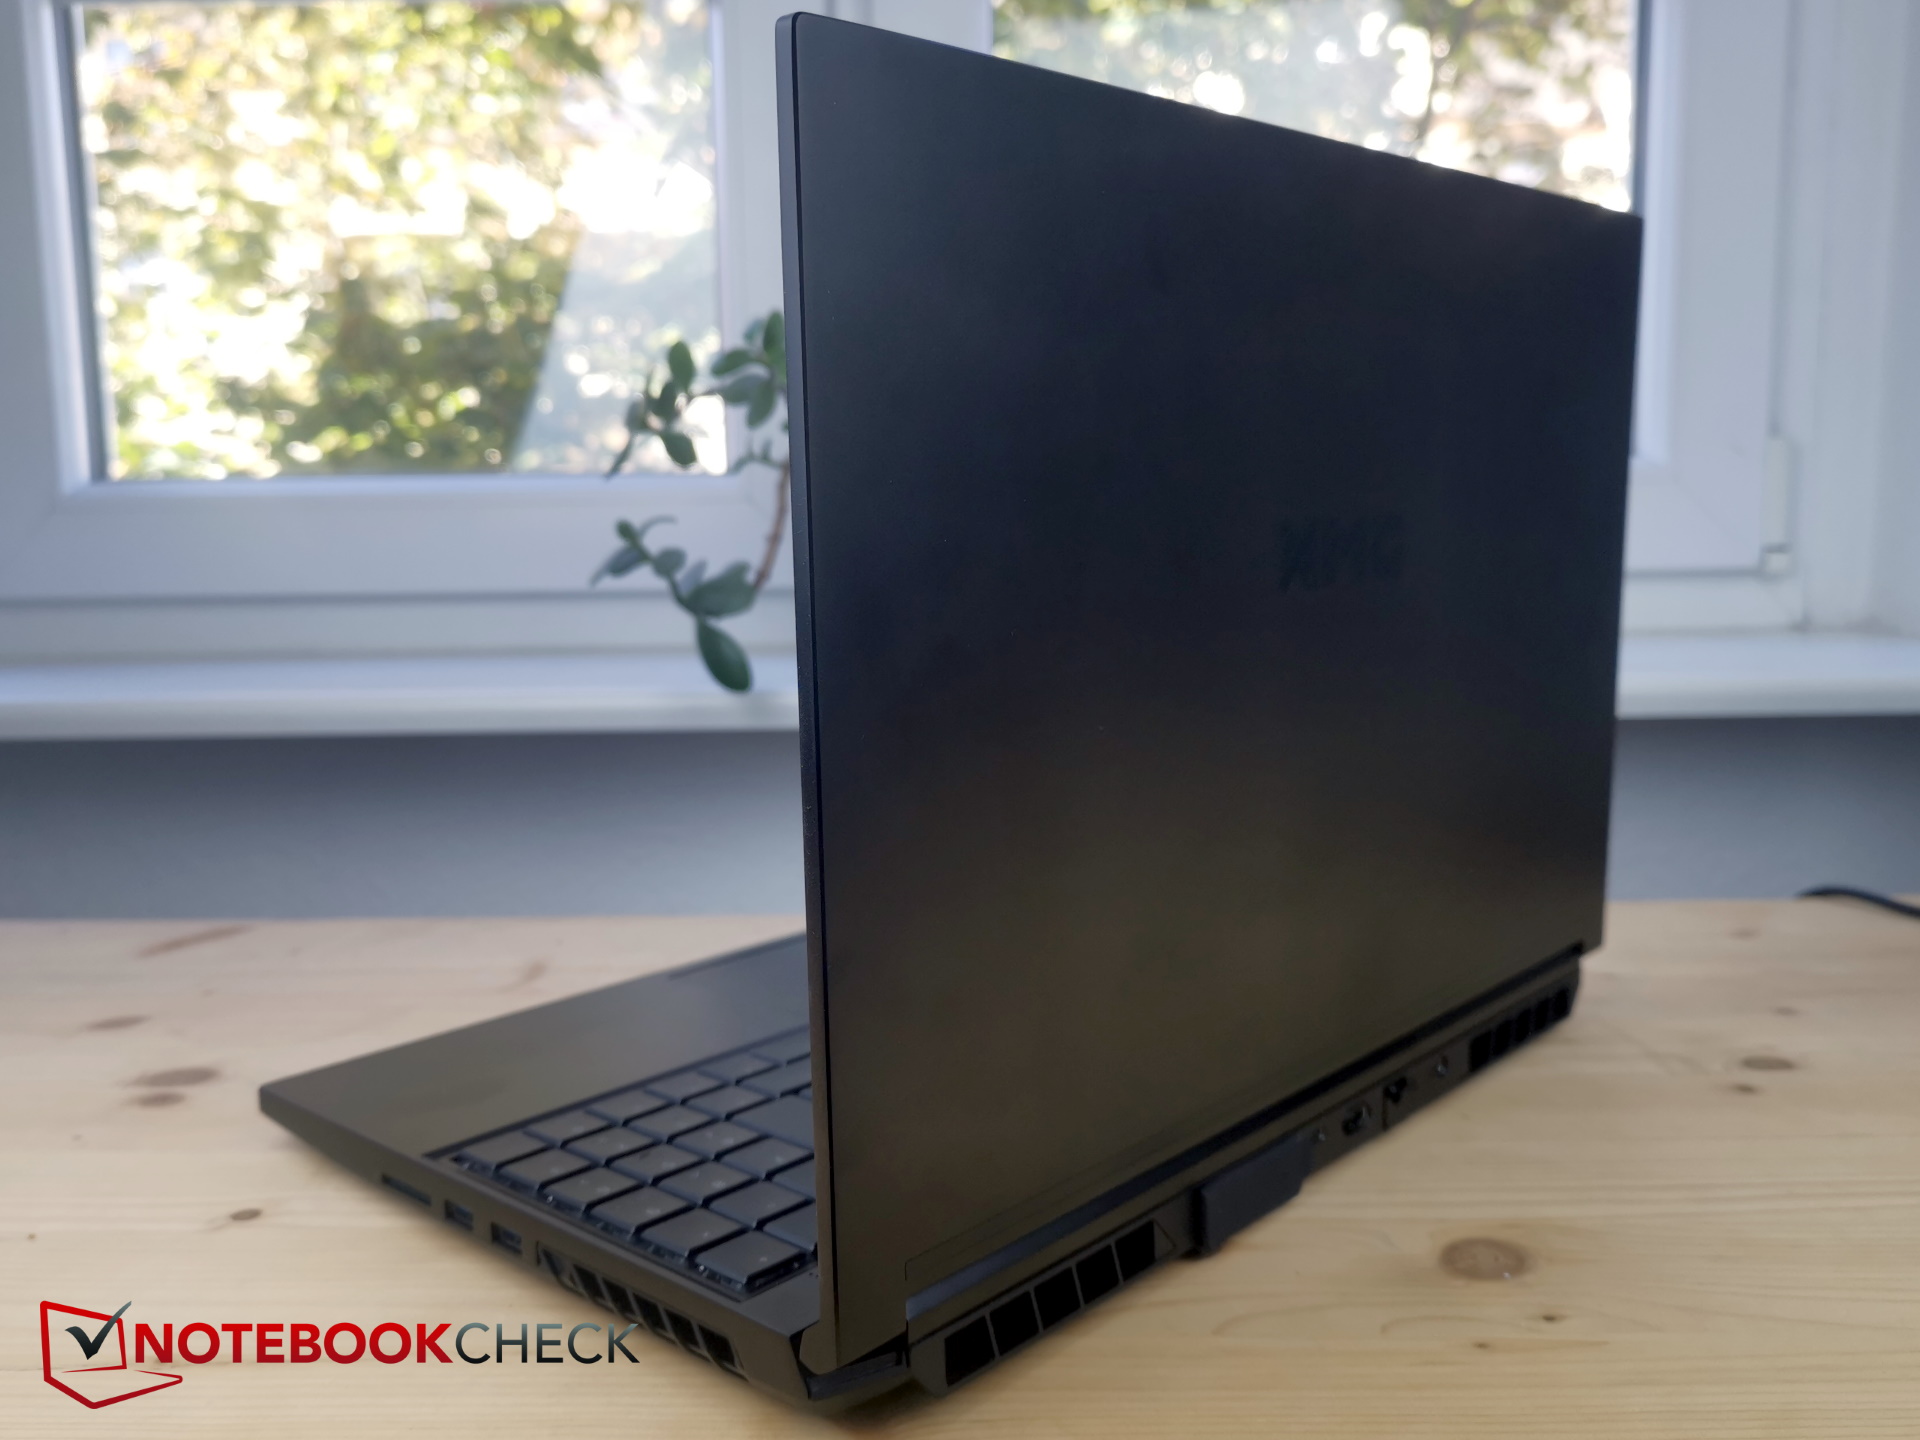
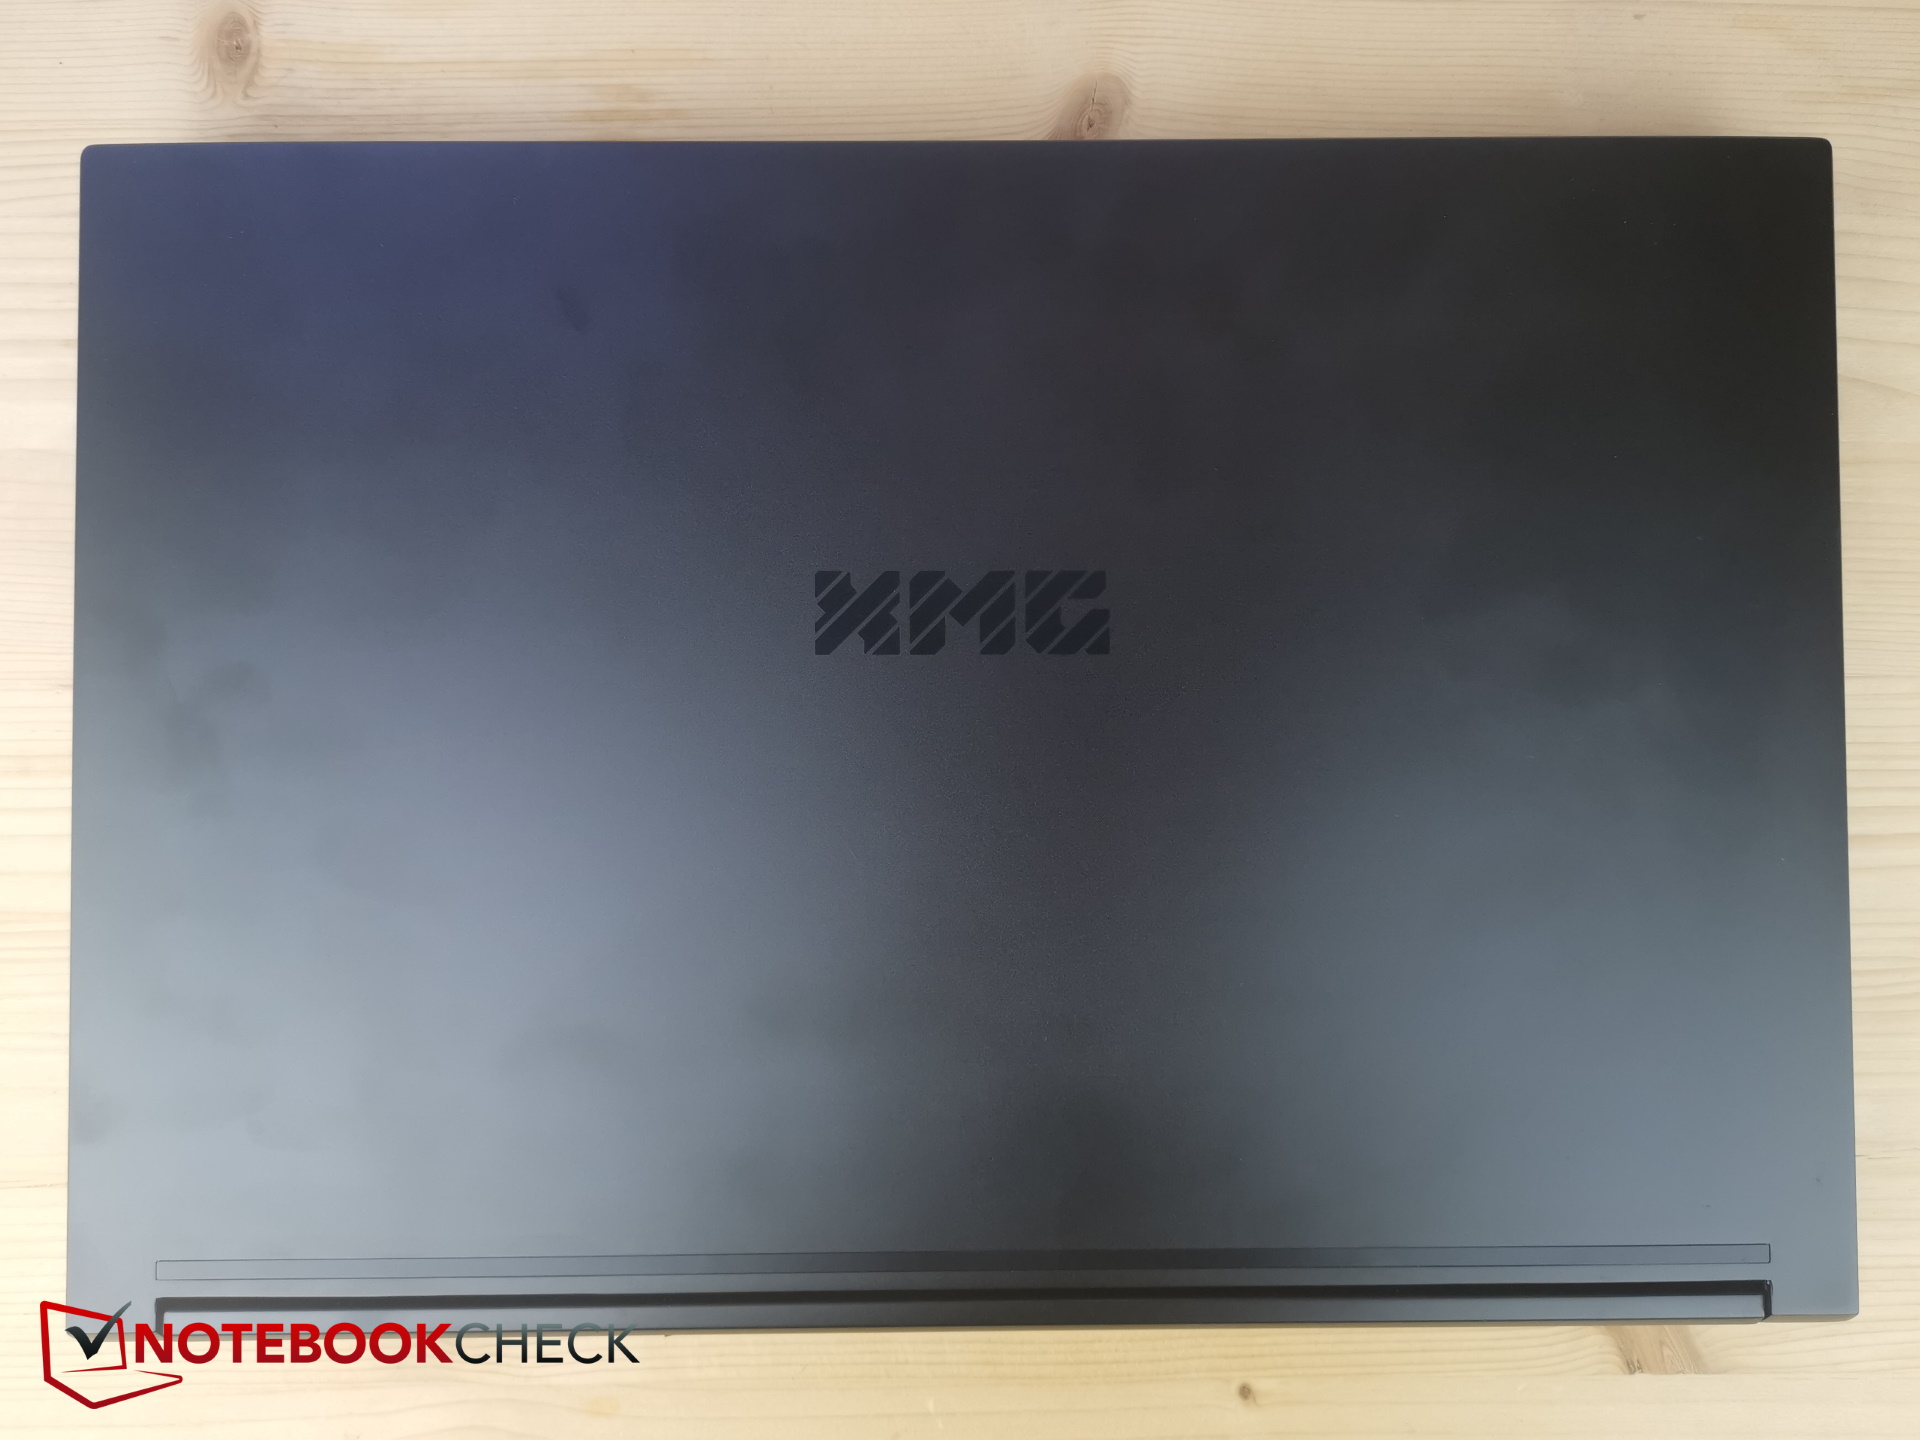
Para um laptop para jogos, o Neo 15 não tem um design muito chamativo. Na maioria das vezes, seu esquema de cores varia de um cinza escuro liso a preto. A tampa da tela e a seção da base são feitas de metal, enquanto o fundo e a luneta são feitos de plástico macio. Há um logotipo XMG no centro da tampa. A barra LED pontilhada na frente polvilha o dispositivo com uma certa estética de jogo.
Graças ao uso do metal, o Neo 15 parece muito sólido, especialmente na seção de base. O laptop quase não apresenta nenhuma flexão e não faz nenhum ruído de ranger quando torcido ou dobrado. Naturalmente, a tampa vai ficar um pouco menos rígida. Dito isto, a tela pode suportar algumas torções sem ser afetada. Uma desvantagem, entretanto, é que as impressões digitais podem se acumular na superfície fosca.
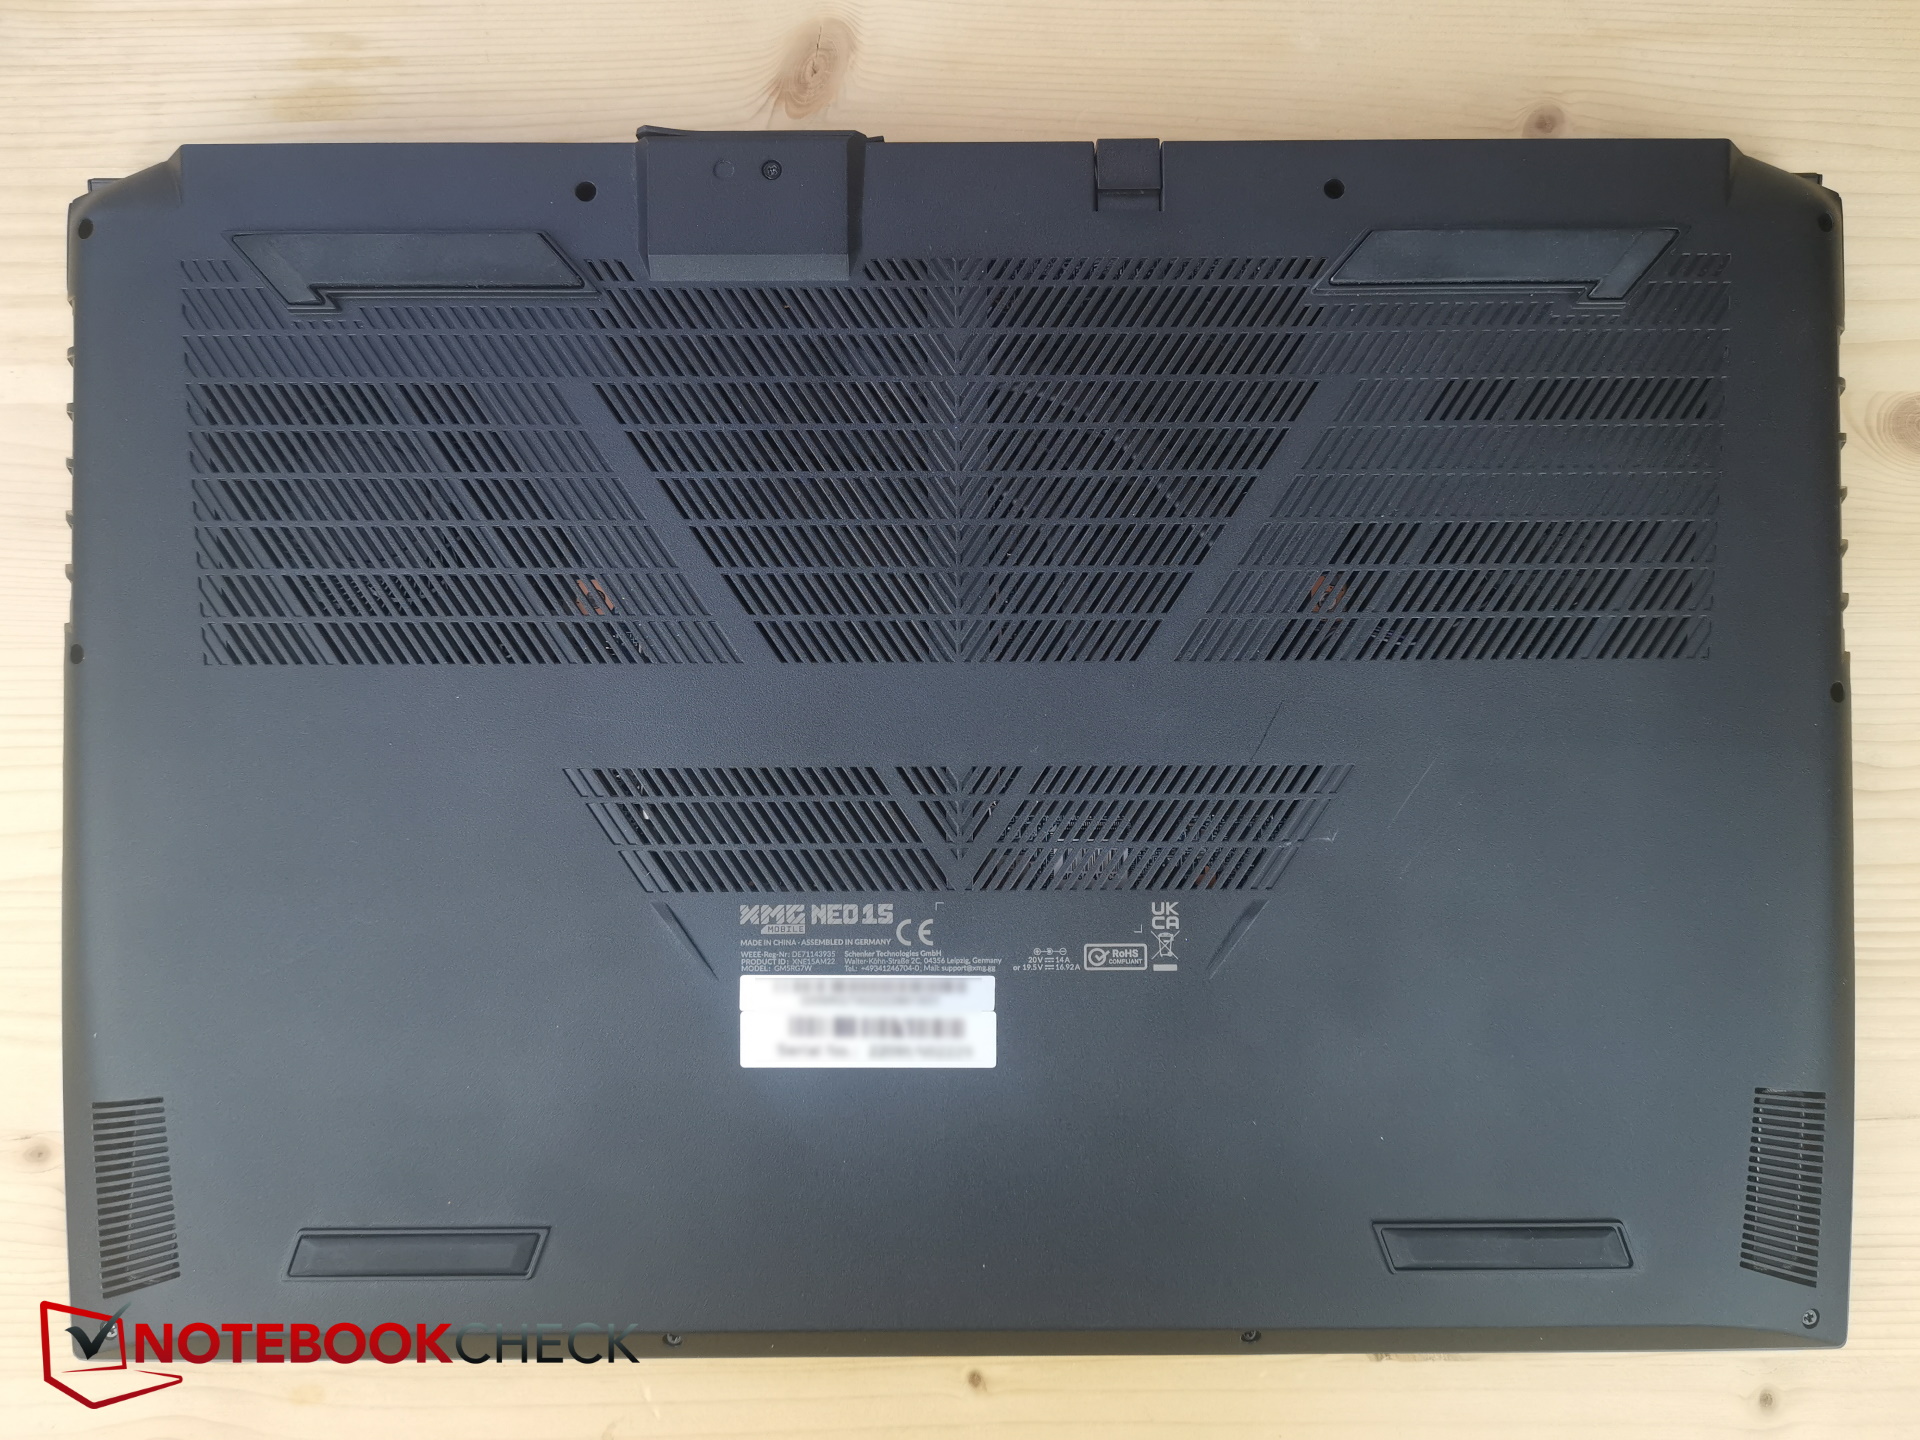
Infelizmente, a caixa inferior de plástico é tão macia que isto pode acontecer: se você segurar o dispositivo no lugar "errado" (ou seja, a área ao redor da abertura de ar na parte inferior direita) usando apenas uma mão, este ponto pode ser empurrado para dentro de tal forma que toque os ventiladores giratórios.
Fora isso, o Neo 15 tem excelente ajuste e acabamento, parece muito compacto e robusto e está equipado com dobradiças que são firmes o suficiente, mas não muito rígidas.
Com 26,6 mm (1,05") de espessura, o Neo não está tentando competir com o magro Lâmina Razer 15. Mas parece um pouco mais fino do que realmente é, graças ao seu design compacto. A maioria dos concorrentes tem aproximadamente a mesma espessura; apenas o MSI Stealth é consideravelmente mais fino.
A compacidade do laptop também se reflete em suas dimensões - nenhum dos outros laptops ocupam tão pouca profundidade quanto o Neo 15. Em termos de peso, o Neo está diretamente no meio do grupo de comparação. Apenas o Stealth é cerca de 100 g (0,22 lb) mais leve, enquanto ambos o Nitro e o MSI GE67 pesam cerca de 200 g (0,44 lb) a mais.
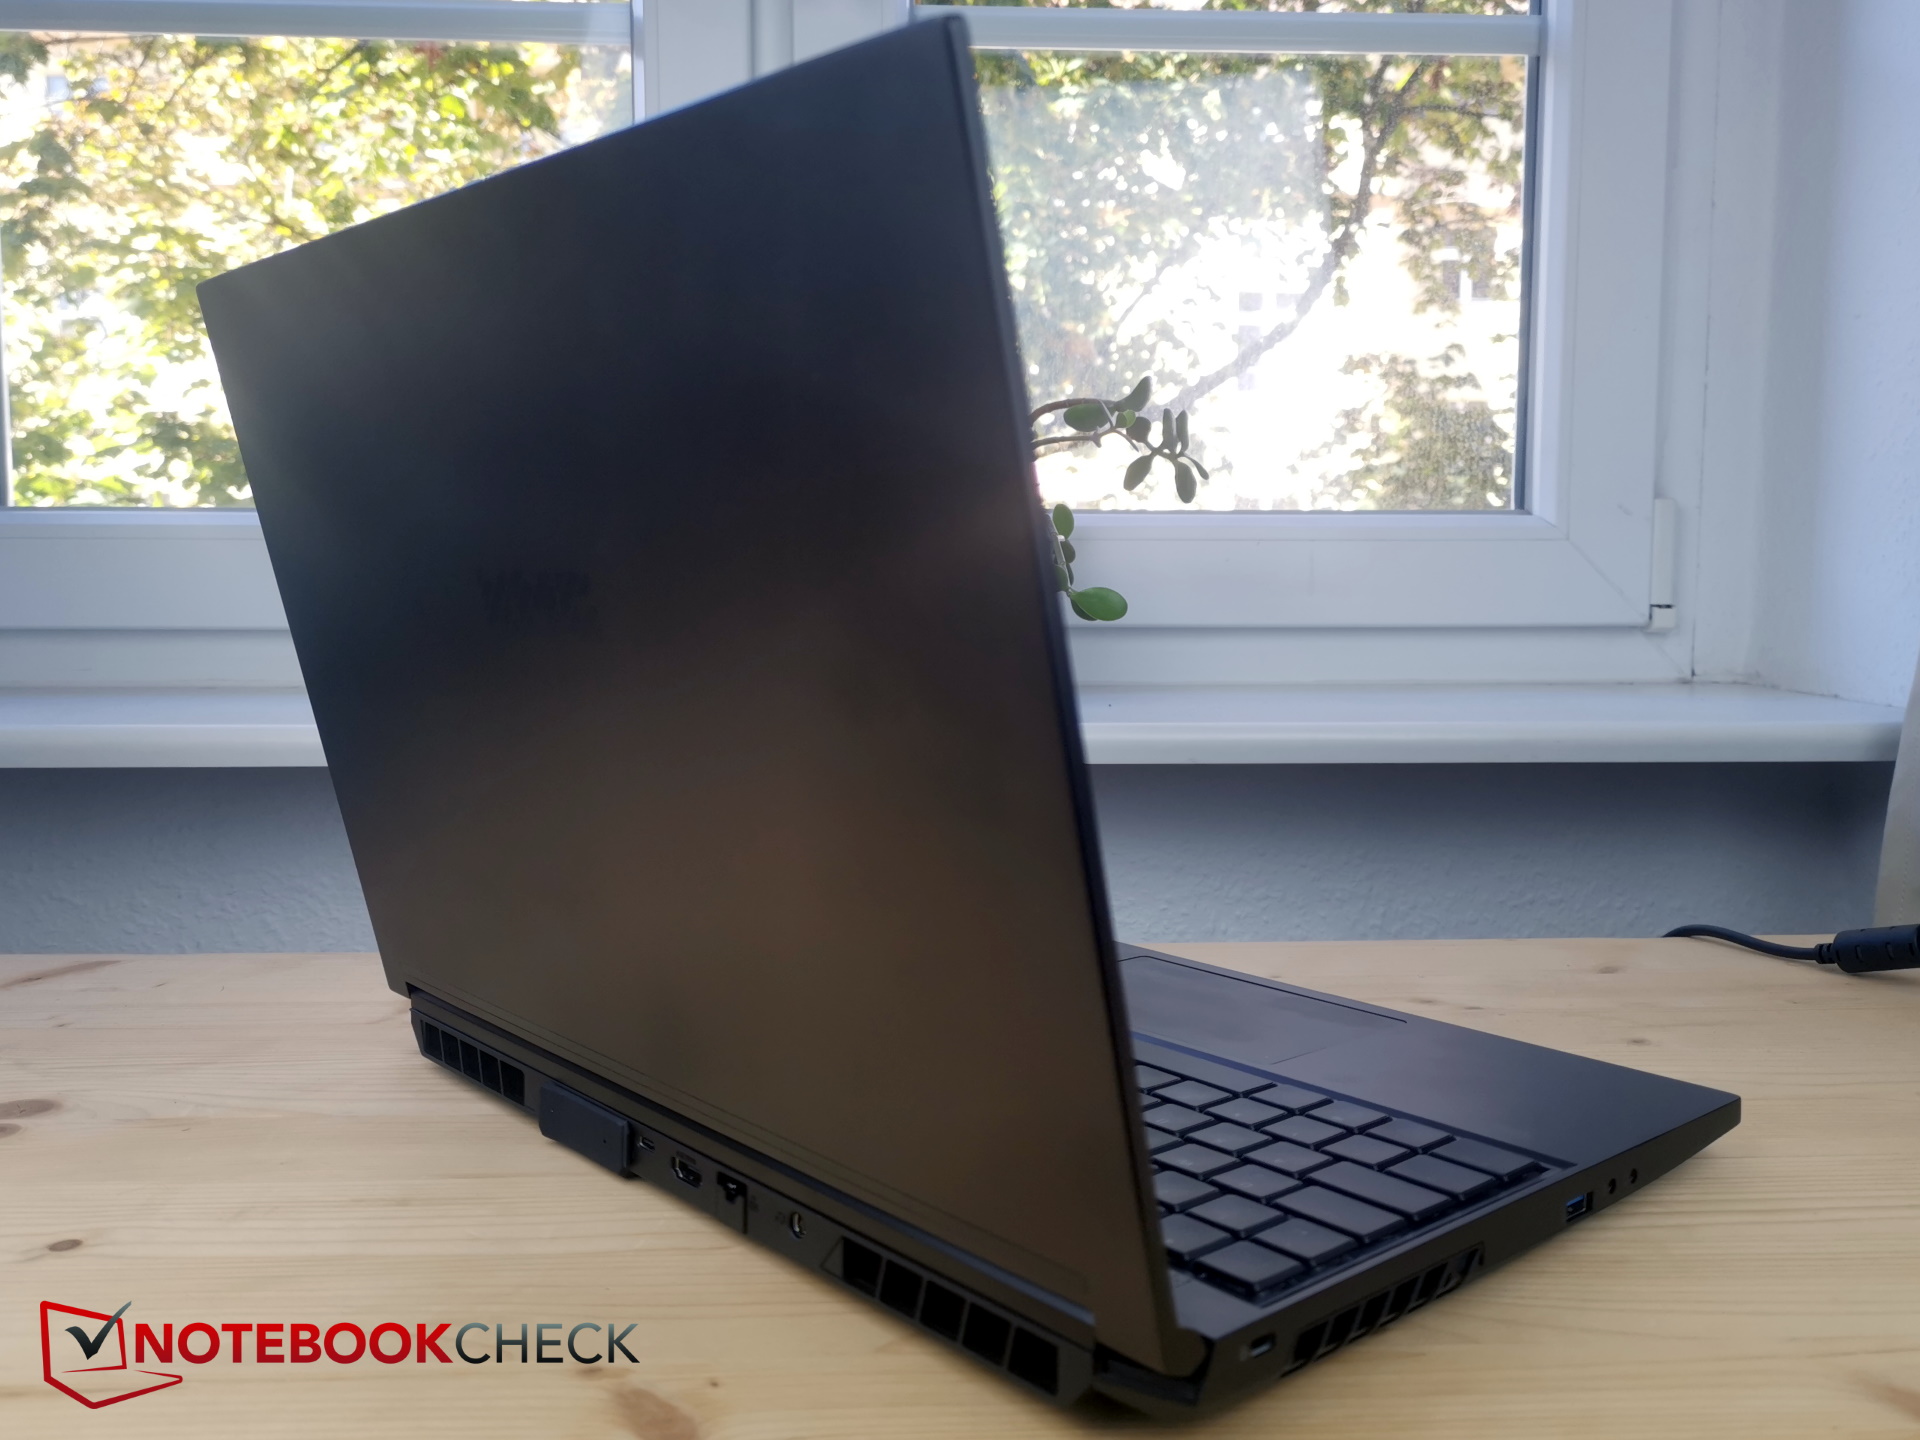
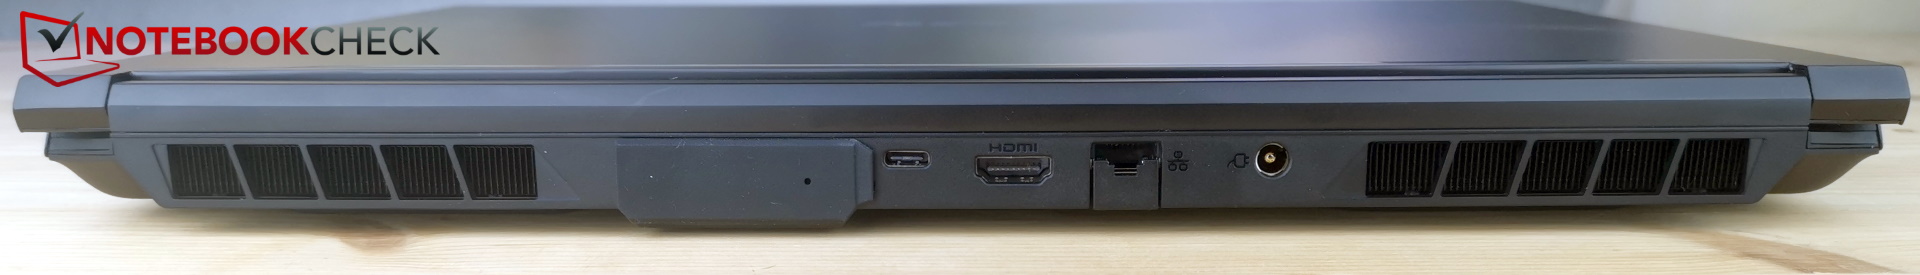
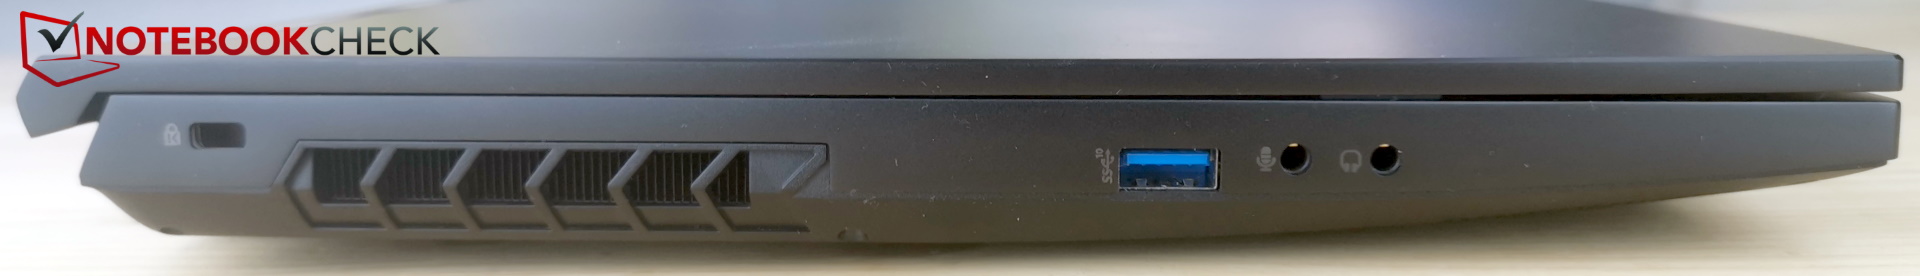
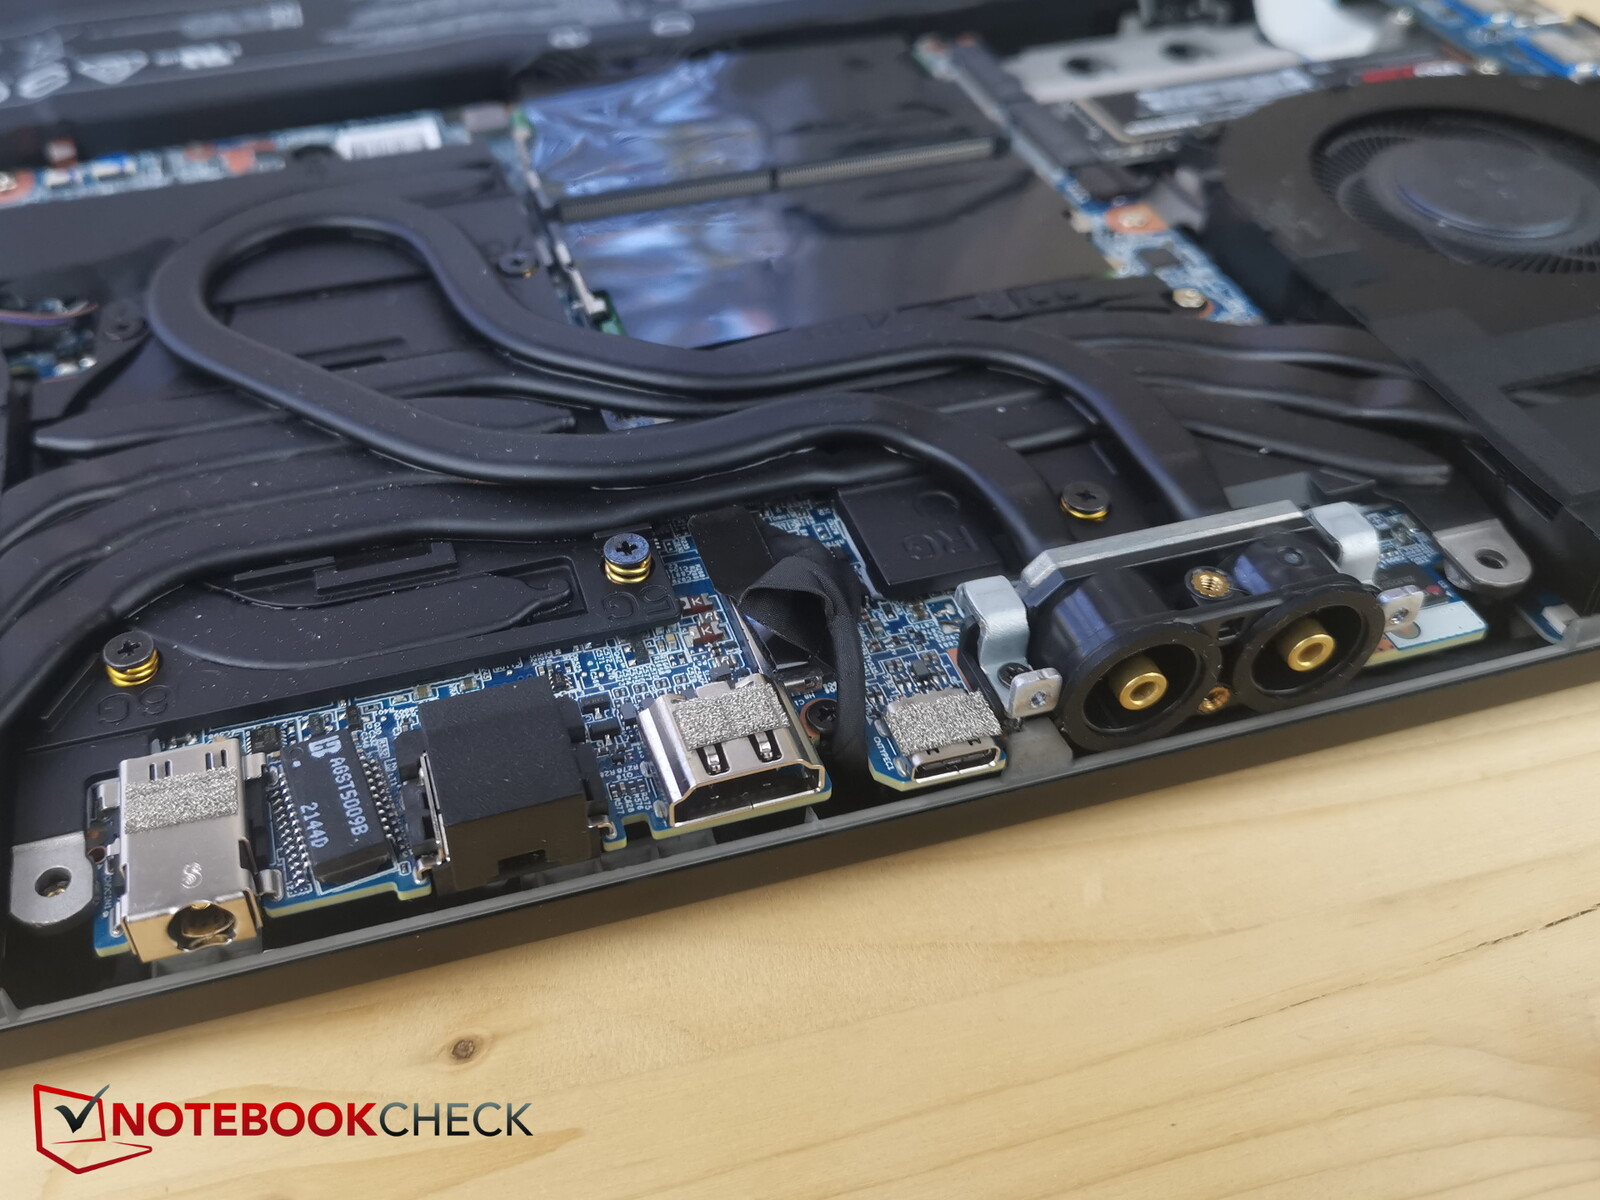
Especificações - Sem Thunderbolt, porta USB-C lenta
Infelizmente, a porta USB-C no Neo 15 baseado na AMD é diferente da do modelo Intel. Na versão AMD, não só você não está recebendo Thunderbolt, mas a porta USB-C é apenas do tipo 3.2 Gen2x1 em vez de Gen2x2. O fornecimento de energia também não é suportado.
Em uma nota positiva, o laptop possui dois conectores de áudio separados (microfone + fones de ouvido), e as portas estão bem dispostas à esquerda, à direita e atrás. A conexão de água para XMG OASIS também está localizado na parte de trás.
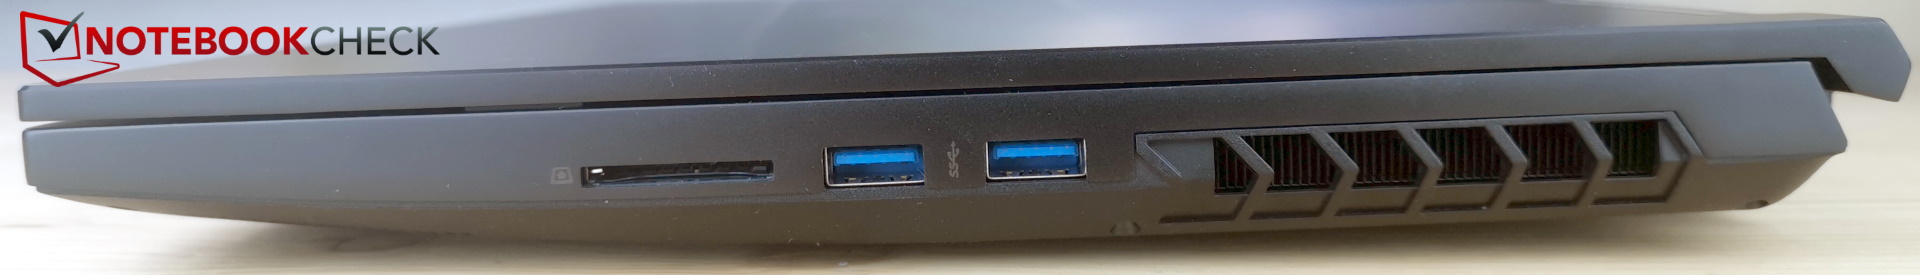
Leitor de cartões SD
O leitor de cartões aceita cartões SD normais. Quando você insere um cartão SD, cerca da metade do cartão sairá do slot porque não tem um mecanismo de travamento.
As velocidades de transferência do leitor de cartão estão mais ou menos na parte inferior do espectro.
| SD Card Reader | |
| average JPG Copy Test (av. of 3 runs) | |
| Média da turma Gaming (20.9 - 210, n=54, últimos 2 anos) | |
| Schenker XMG Neo 15 (i7-12700H, RTX 3080 Ti) | |
| MSI GE67 HX 12UGS (Toshiba Exceria Pro SDXC 64 GB UHS-II) | |
| Schenker XMG Neo 15 (Ryzen 9 6900HX, RTX 3070 Ti) | |
| maximum AS SSD Seq Read Test (1GB) | |
| Média da turma Gaming (25.5 - 261, n=51, últimos 2 anos) | |
| Schenker XMG Neo 15 (Ryzen 9 6900HX, RTX 3070 Ti) | |
| Schenker XMG Neo 15 (i7-12700H, RTX 3080 Ti) | |
| MSI GE67 HX 12UGS (Toshiba Exceria Pro SDXC 64 GB UHS-II) | |
Conectividade
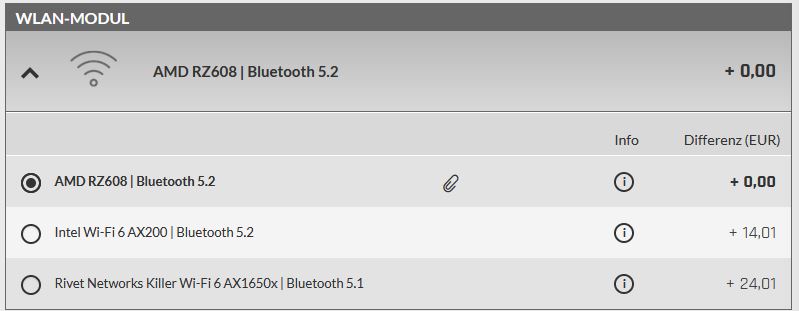
O Neo vem com um módulo sem fio Intel AX200. Embora esta placa sem fio suporte Wi-Fi 6, ela ainda não funciona com a banda de freqüência de 6 GHz. Ela fornece taxas de transferência boas e estáveis, mas os outros módulos Wi-Fi na comparação são marginalmente mais rápidos.
Webcam
O bom: o Neo 15 está equipado com uma webcam Full HD. O não tão bom: a qualidade de imagem é pior do que o que alguns modelos de 720p são capazes (veja foto abaixo).


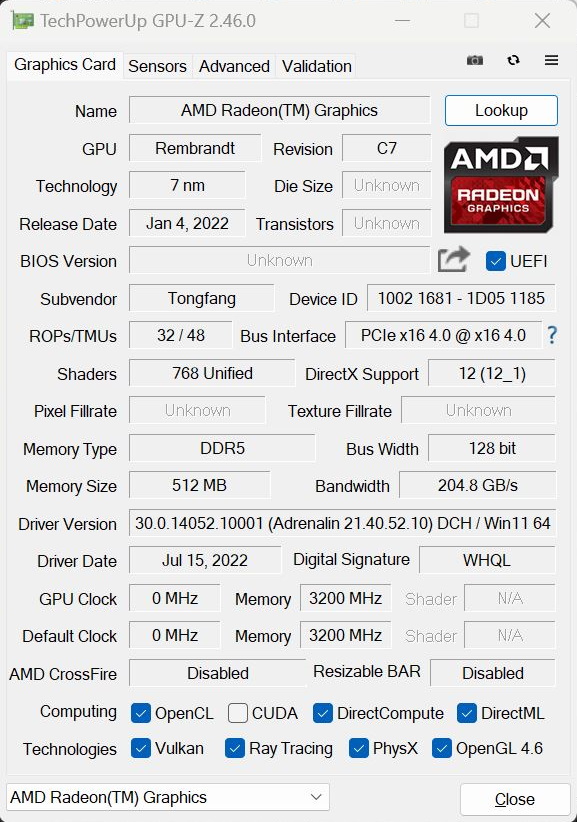
 GeForce RTX 3070 Ti Laptop GPU, R9 6900HX, Samsung SSD 980 Pro 1TB MZ-V8P1T0BW")
 GeForce RTX 3070 Ti Laptop GPU, R9 6900HX, Samsung SSD 980 Pro 1TB MZ-V8P1T0BW")
Segurança
Não há sensor de impressão digital no Neo 15, mas o TPM 2.0 e um slot Kensington estão a bordo.
Acessórios e garantia
Ao contrário de muitos outros fabricantes, a Schenker é conhecida por não se preocupar com acessórios. Por exemplo, um mousepad grande e um pen drive USB contendo drivers estão incluídos na caixa.
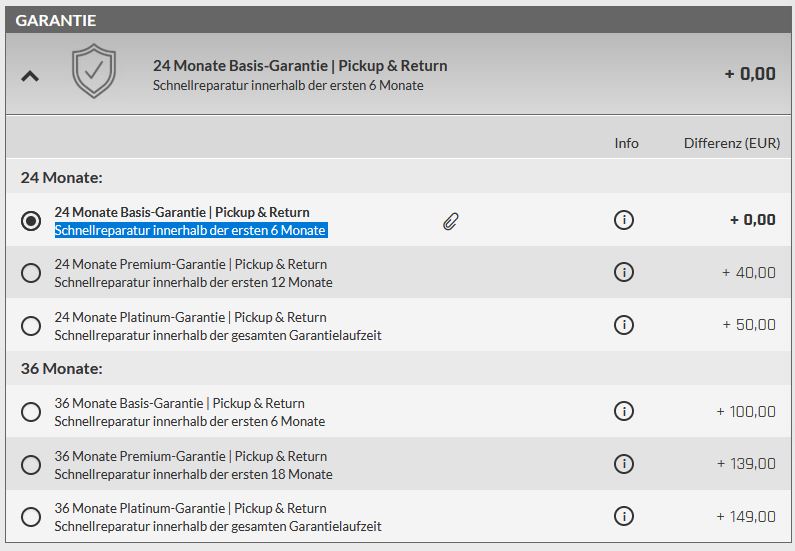
A empresa fornece uma garantia de 24 meses que inclui serviço de coleta e devolução, bem como reparos rápidos dentro dos primeiros seis meses da compra.
Manutenção
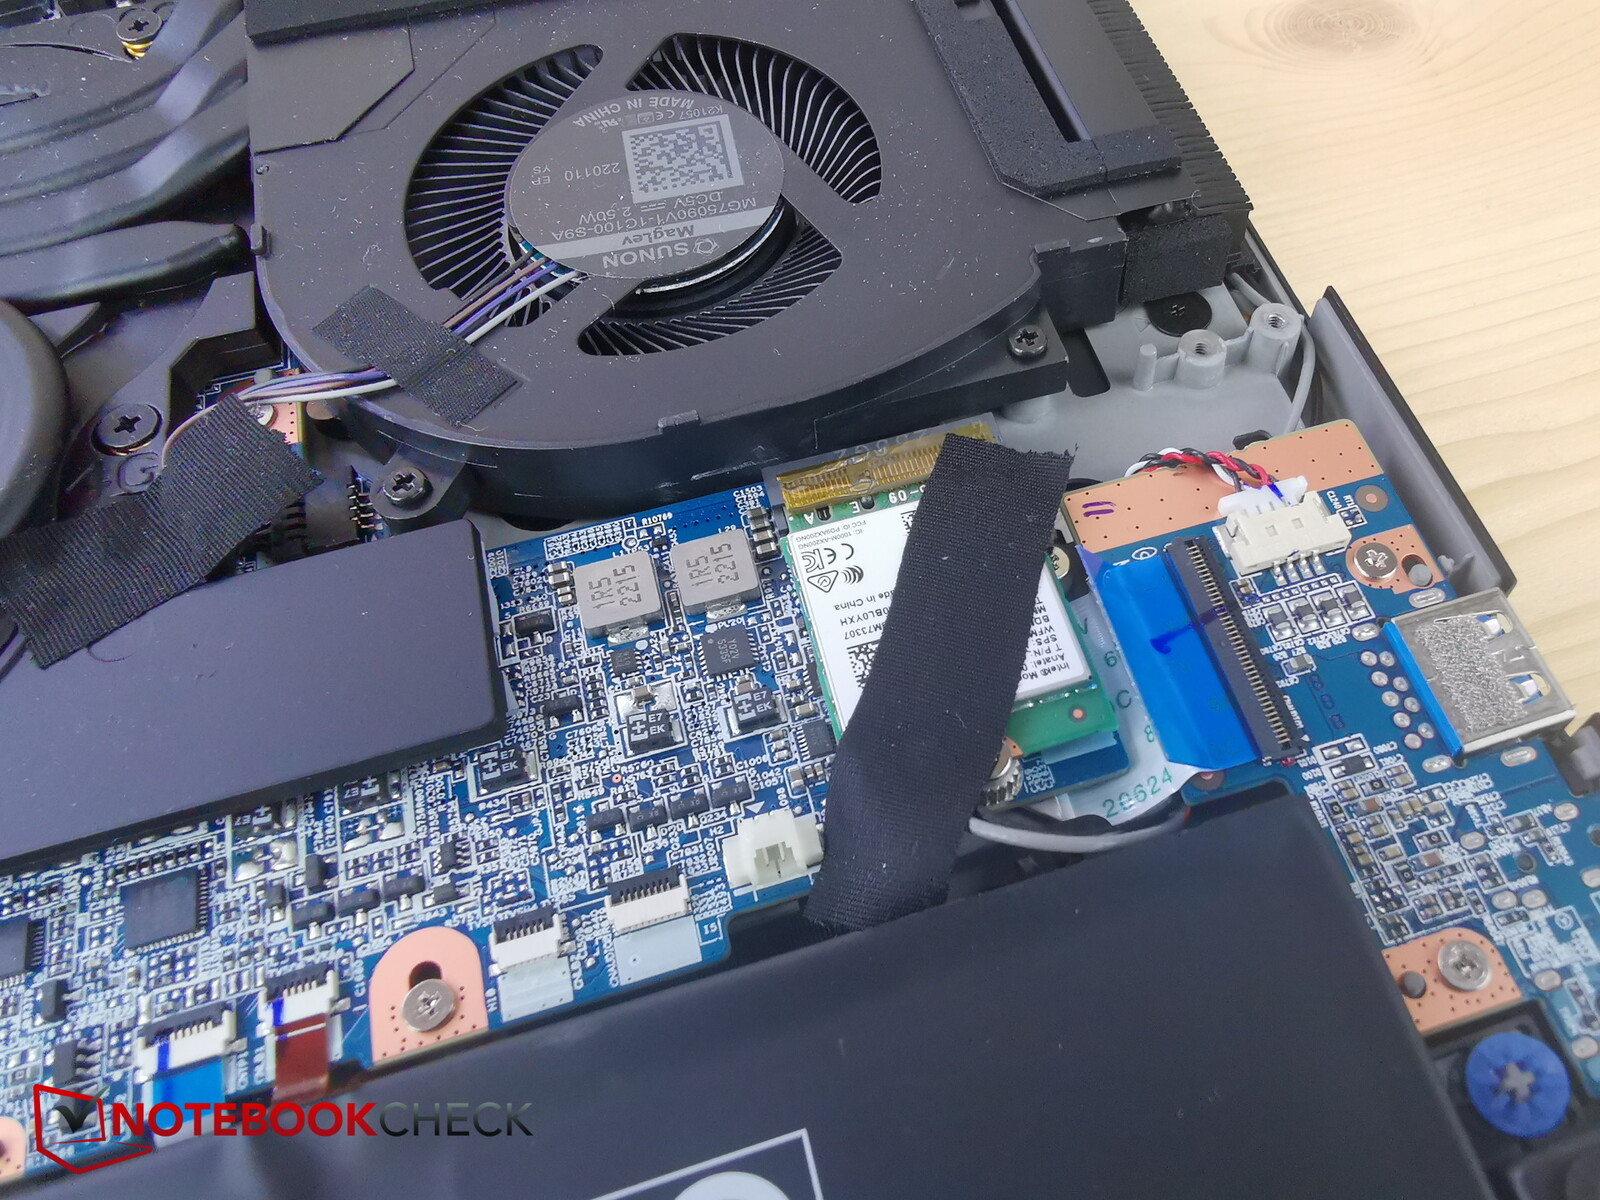
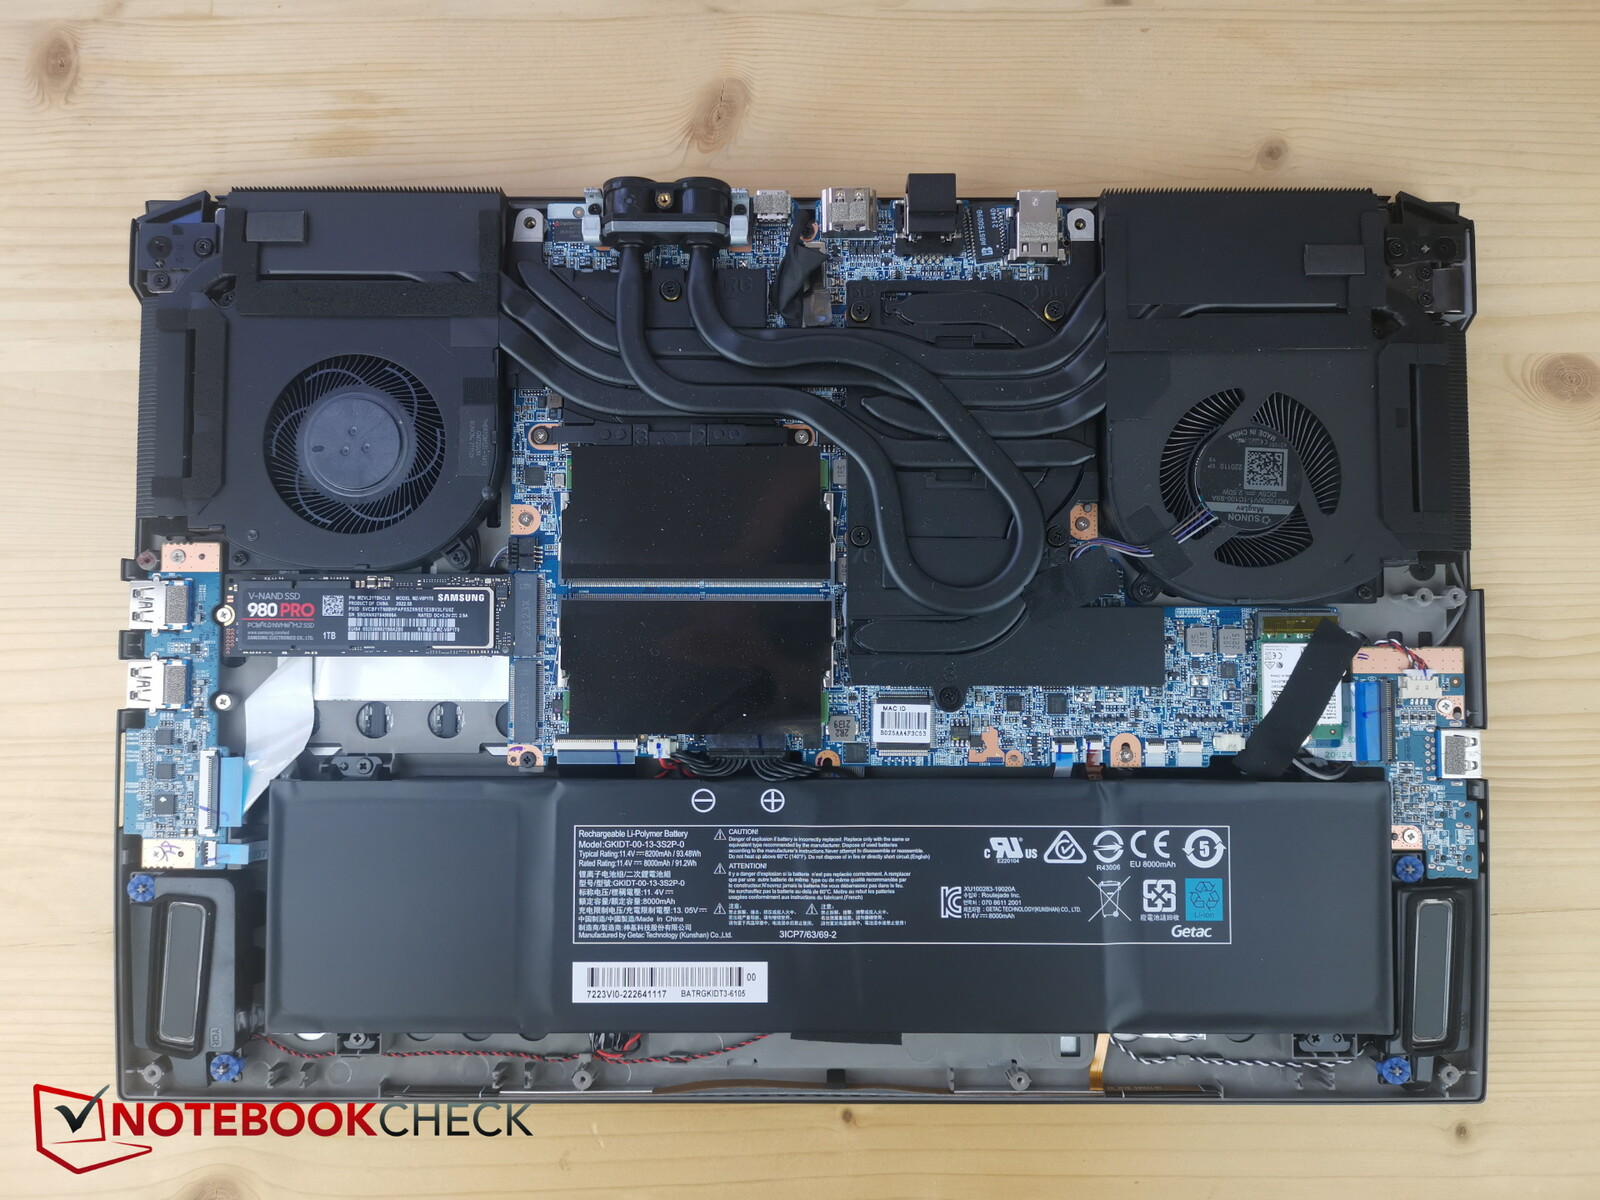
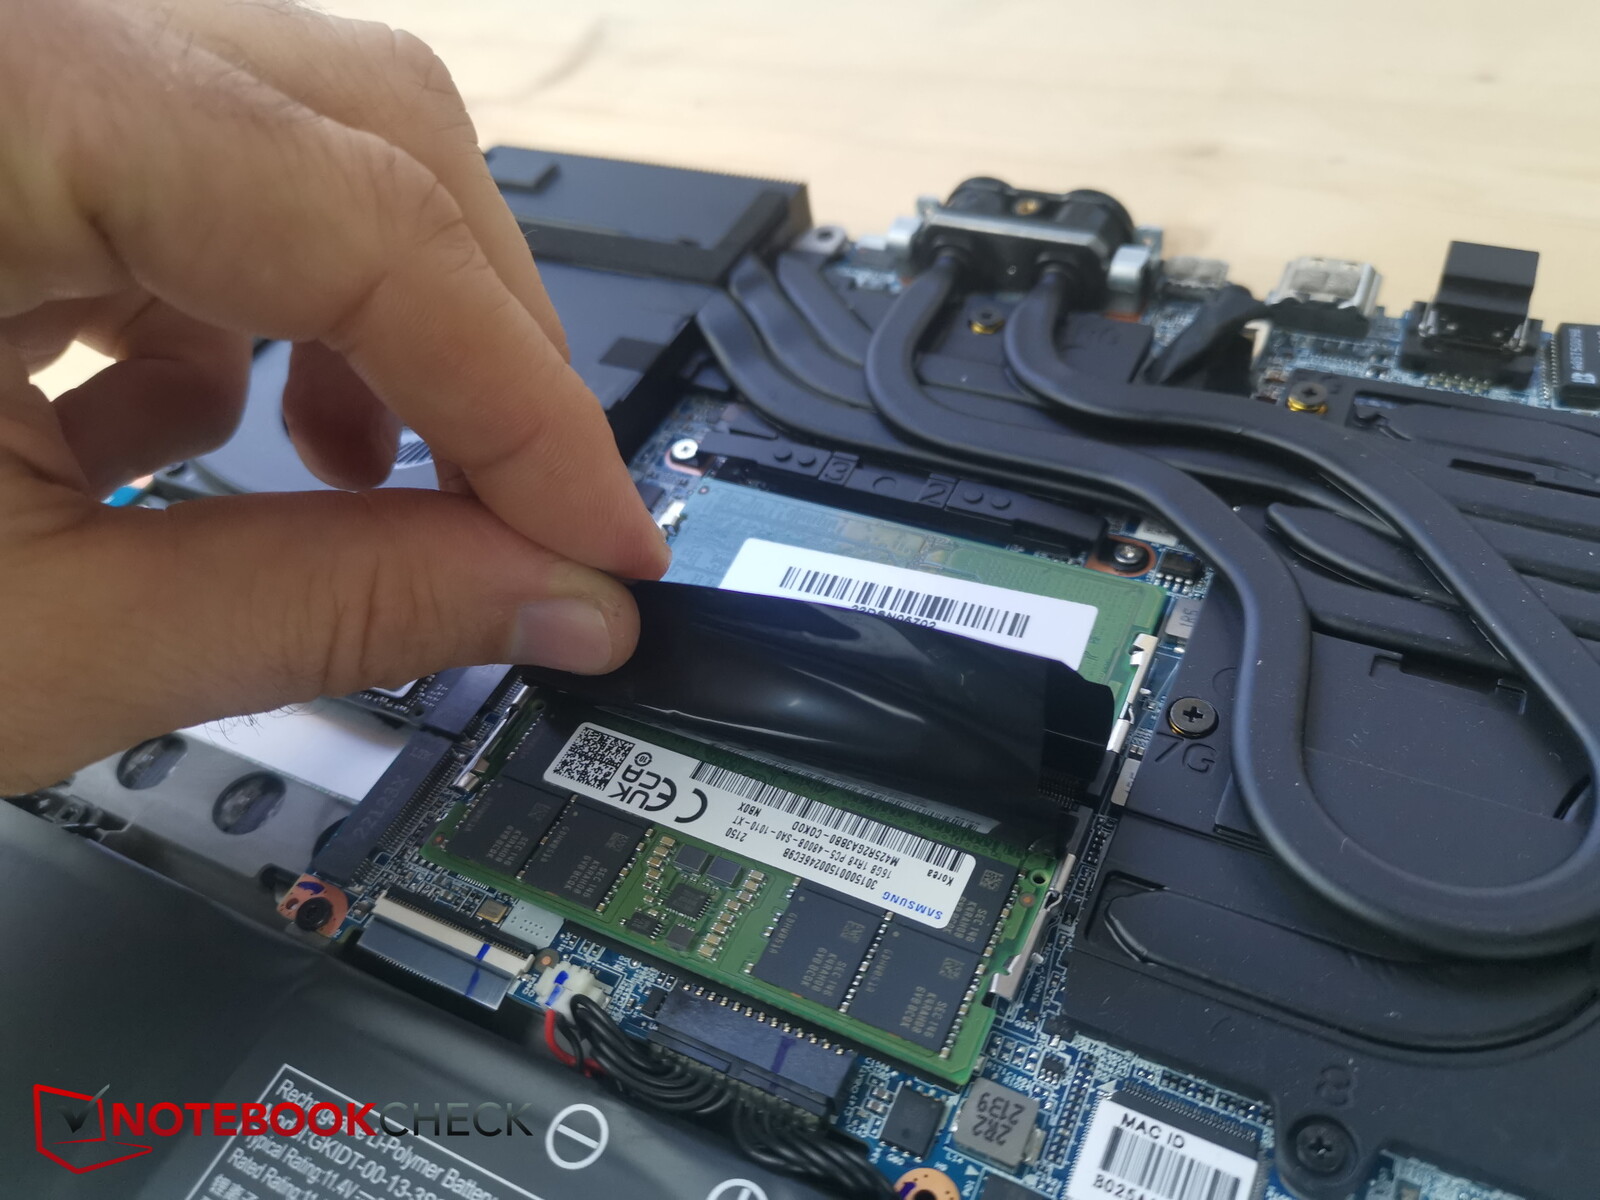
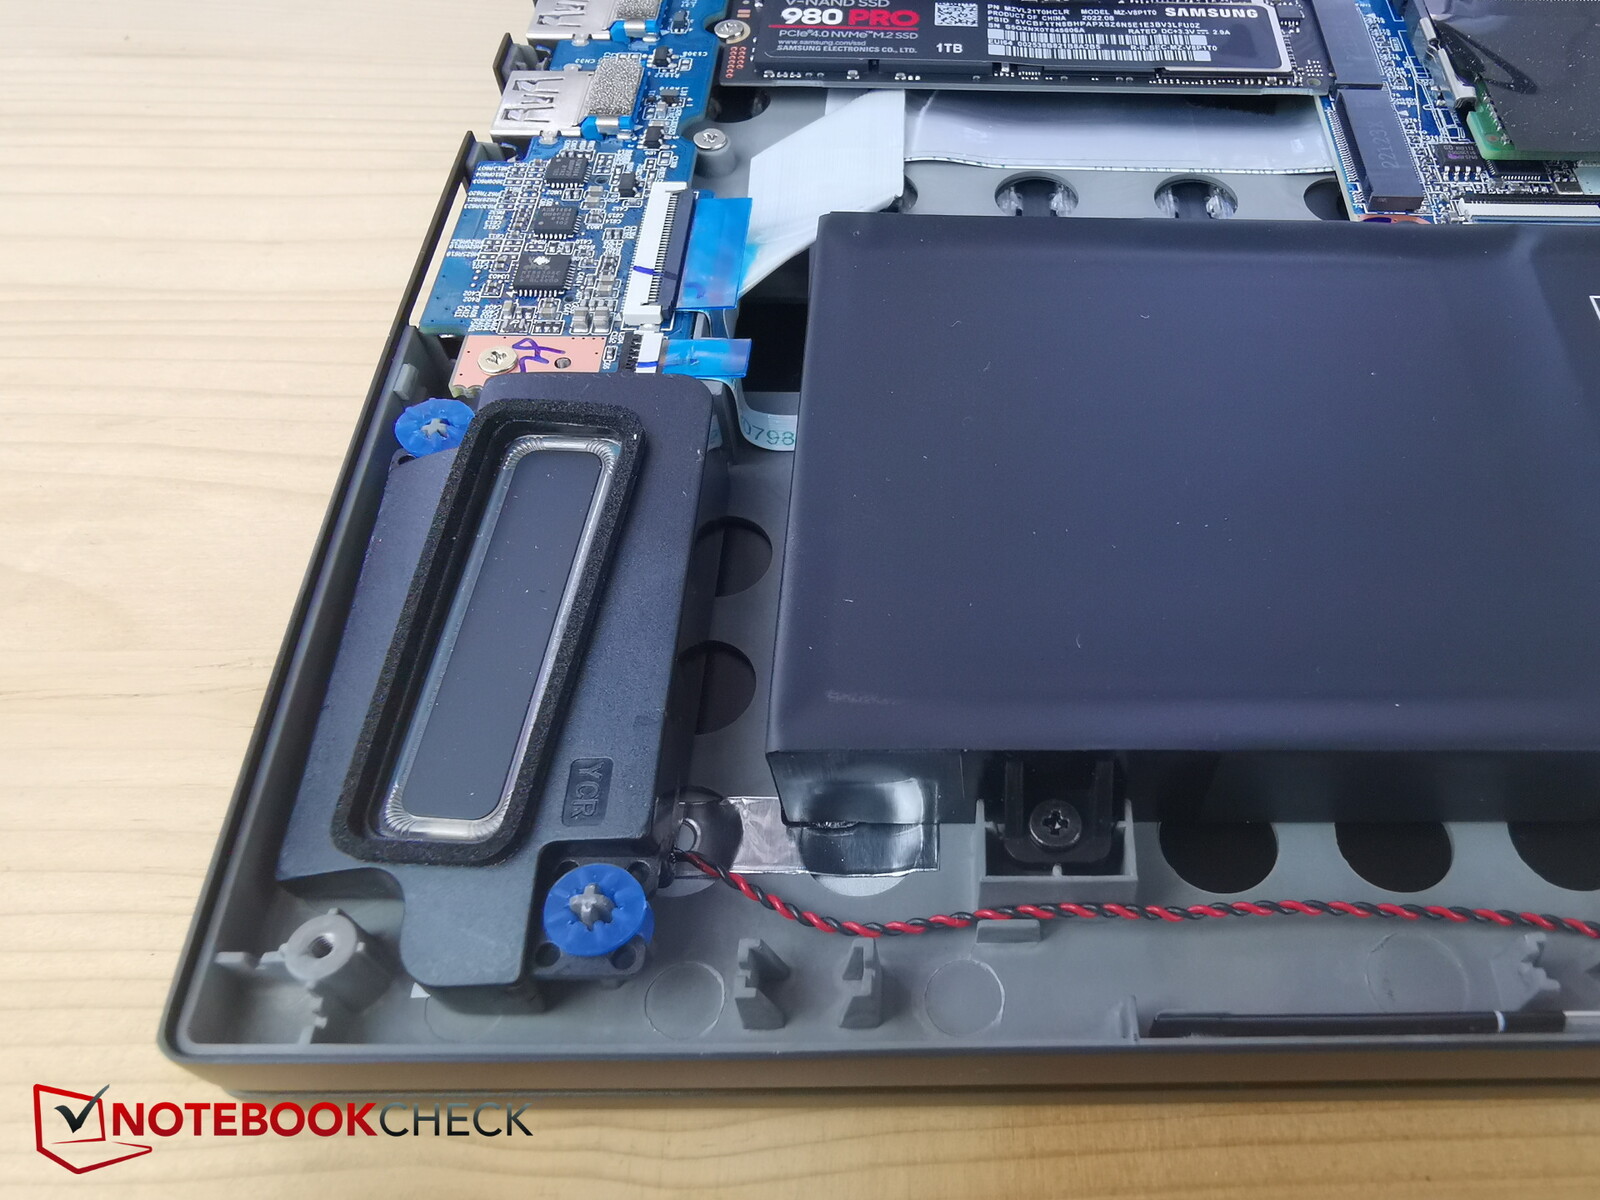
O fundo de plástico é fixado no lugar por um total de 14 parafusos Phillips-head, quatro dos quais estão nas portas de resfriamento líquido. É muito fácil levantar o painel inferior quando se começa pela parte de trás. Uma vez aberto o chassi do laptop, você terá acesso aos dois slots M.2 SSD, os ventiladores, a bateria, o módulo Wi-Fi e os dois slots de RAM.
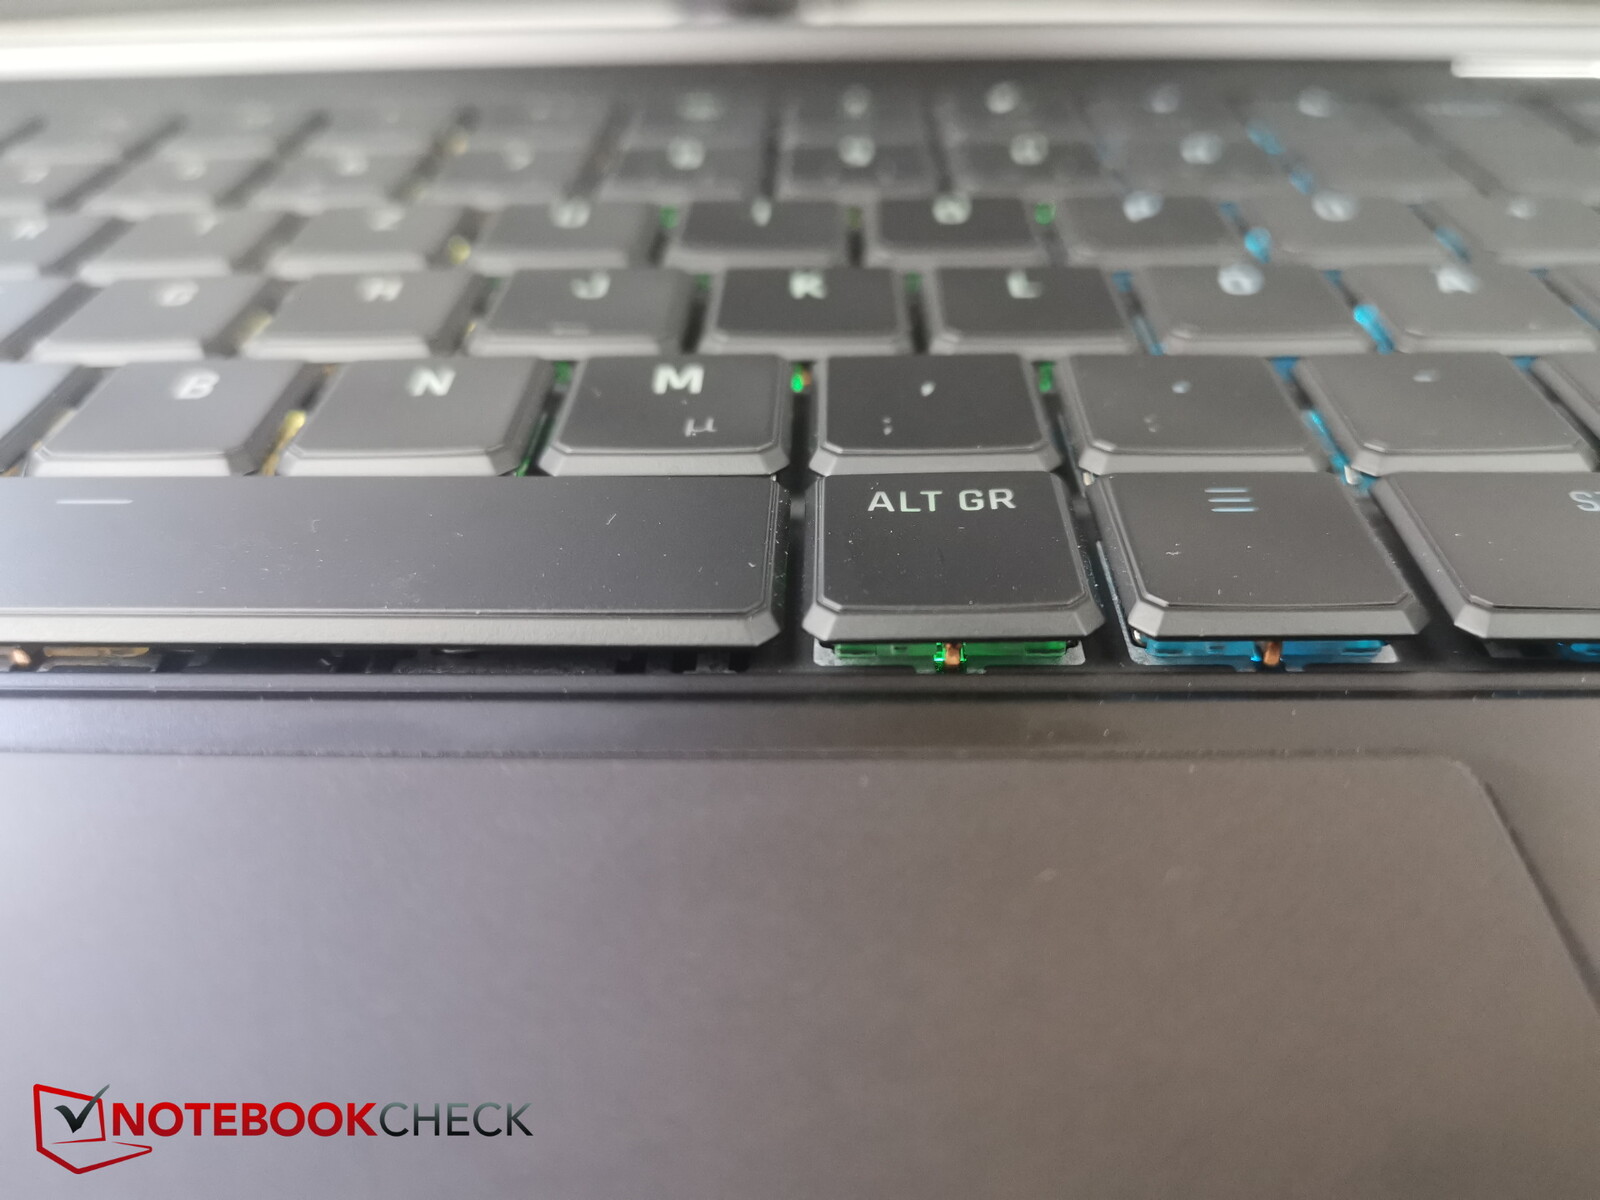
Dispositivos de entrada - Interruptores opto-mecânicos
Teclado
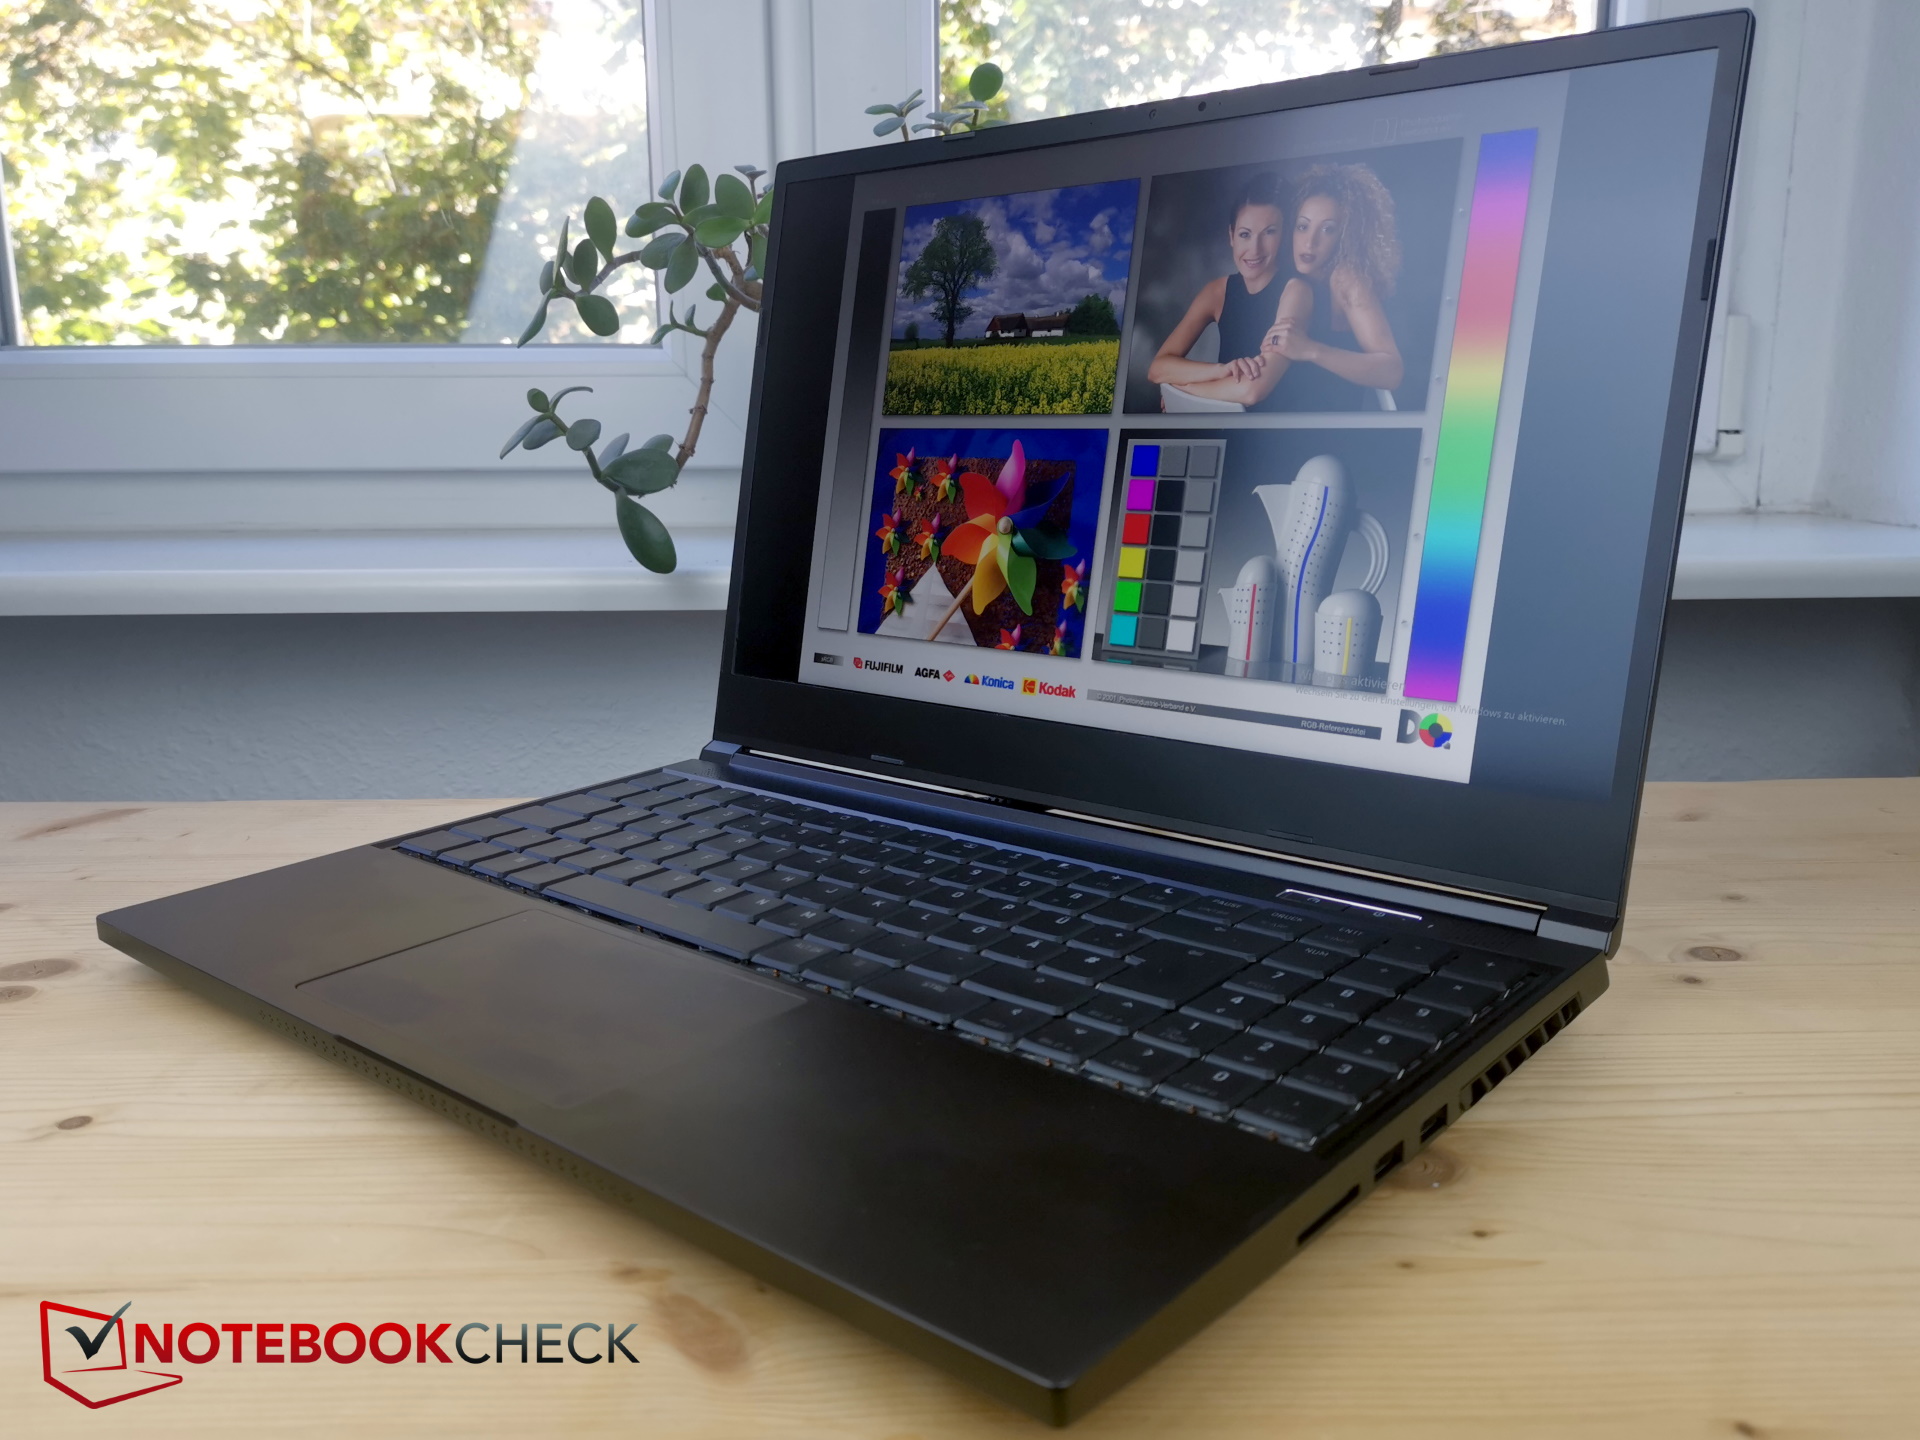
O teclado opto-mecânico ocupa quase toda a largura do laptop de 15 polegadas. Este é suficientemente grande para acomodar teclas de tamanho completo e até mesmo um teclado numérico do mesmo tamanho ao lado delas. Não há muito espaço entre as teclas, mas isto não é um problema considerando o tamanho delas.
O teclado tem uma disposição muito arrumada - tudo cabe dentro de um retângulo sem nenhum entalhe ou similar. Por um lado, isto significa que nenhuma das teclas se destaca ou está isolada de outras teclas, e o usuário só precisa confiar nas lendas e em sua própria experiência para navegar no teclado. Por outro lado, tudo está exatamente onde ele pertence.
O teclado no Neo também é bastante confortável de digitar devido ao seu deslocamento moderado das teclas e ao feedback claro, permitindo assim uma digitação rápida. O som datilografar é um pouco "clattery", mas não é muito ruim. O laptop também possui iluminação RGB por tecla para uso em ambientes escuros.
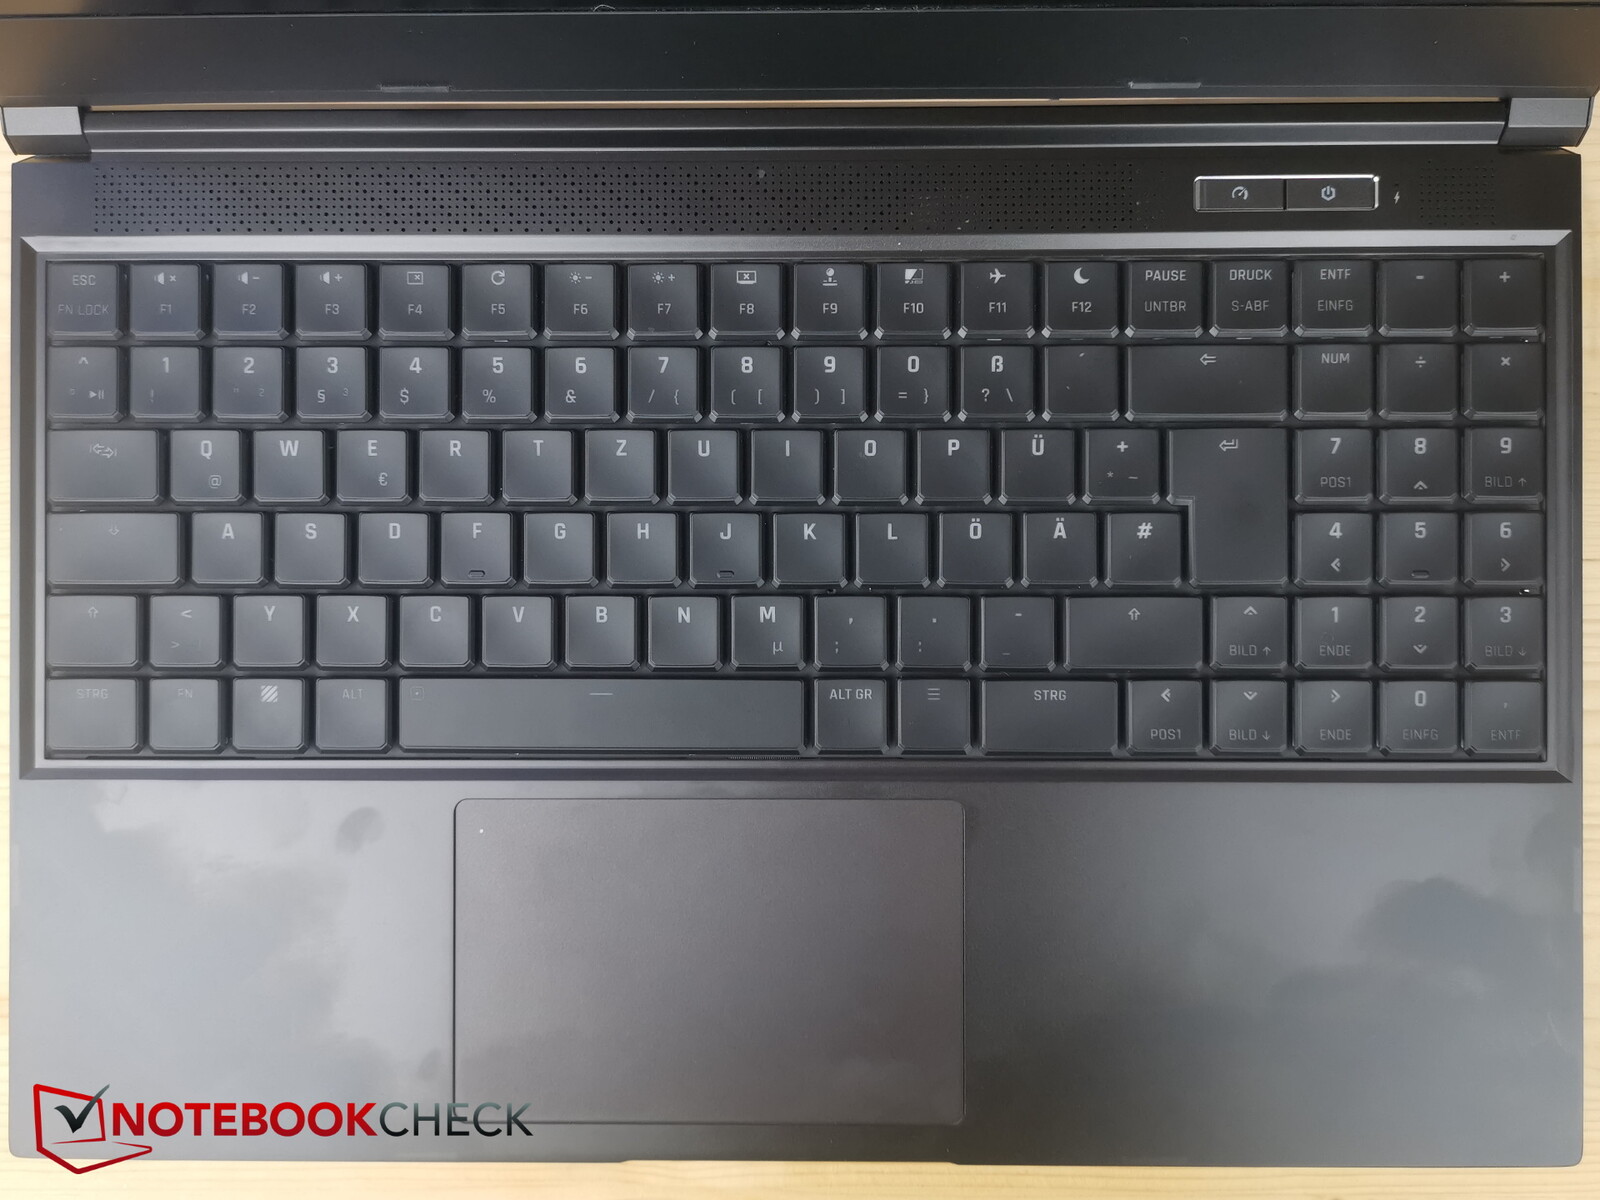
Touchpad
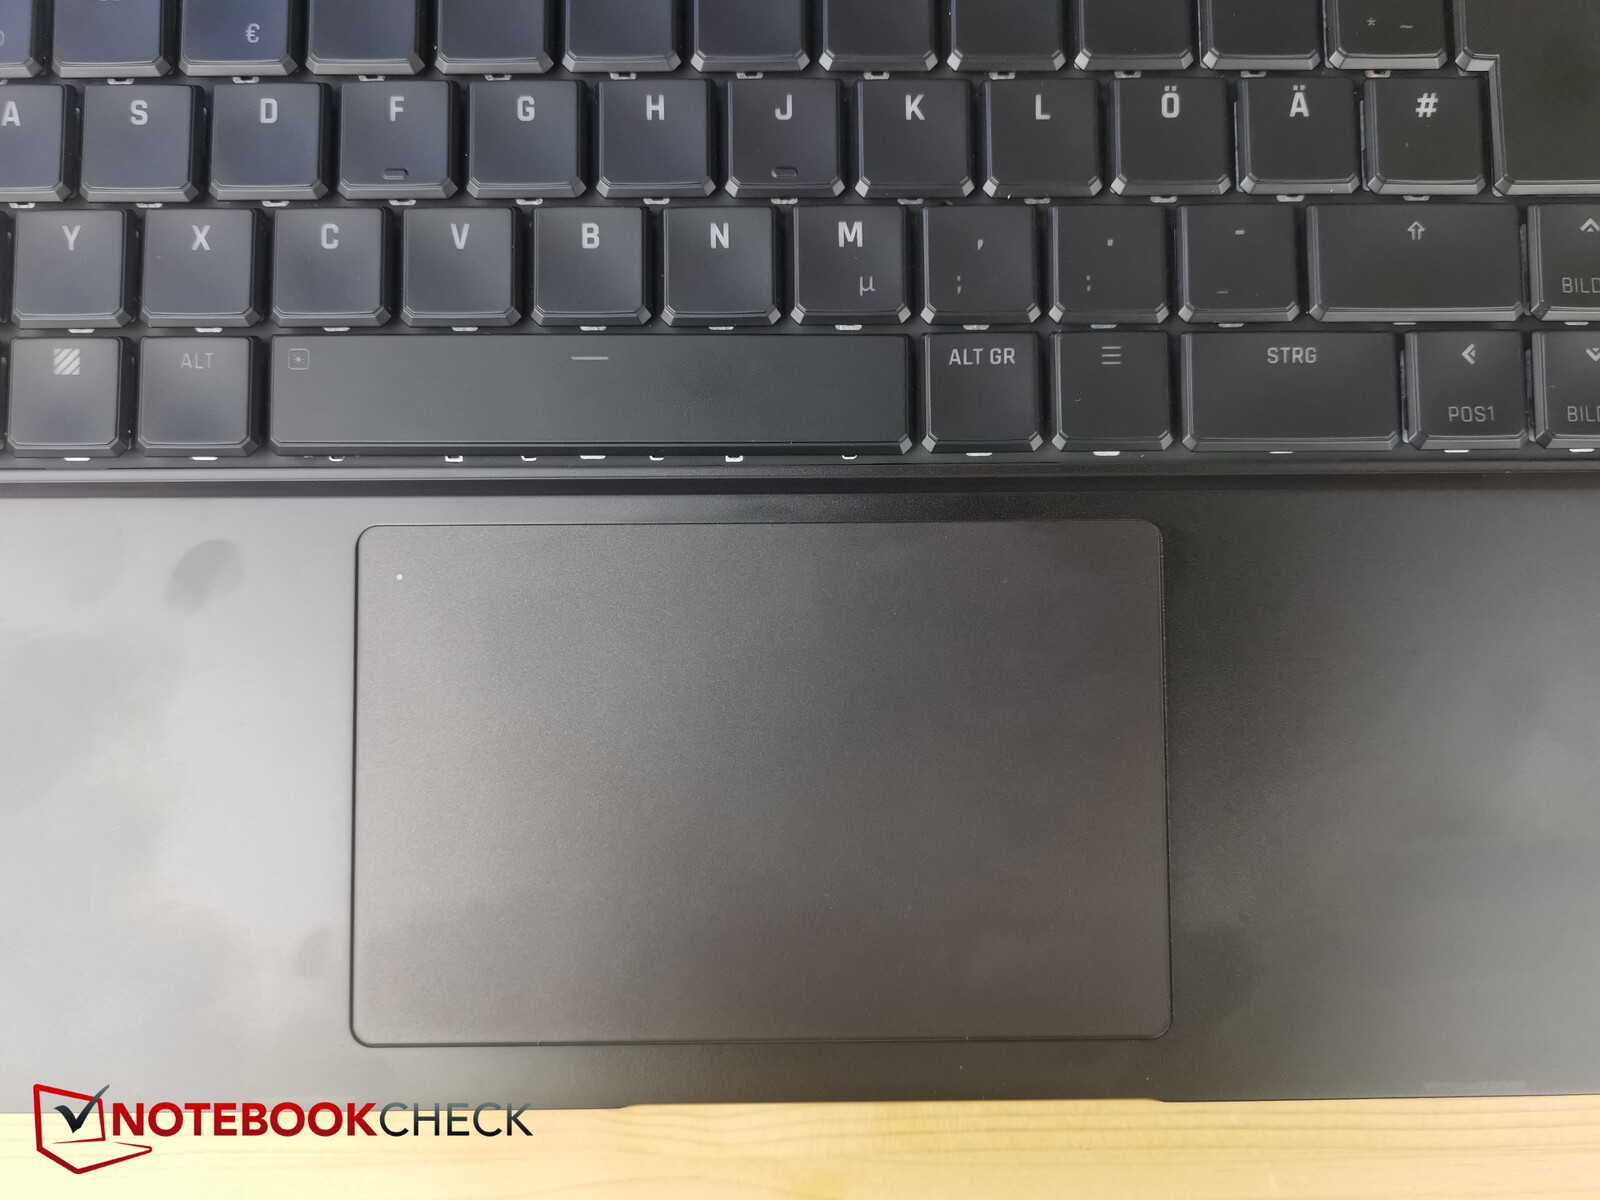
O touchpad é de um bom tamanho (aprox. 11,6 x 7,4 cm, ou 4,6 x 2,9") e tem uma superfície lisa, o que significa que você não experimentará gagueira mesmo quando deslizar o dedo lentamente através do touchpad. Há um pequeno LED no canto superior esquerdo que indica se o touchpad está ativado ou não.
Os botões de clique integrados são ligeiramente mais rígidos do que o que acharíamos confortável, mas fornecem um feedback distinto e um som nítido de clique.
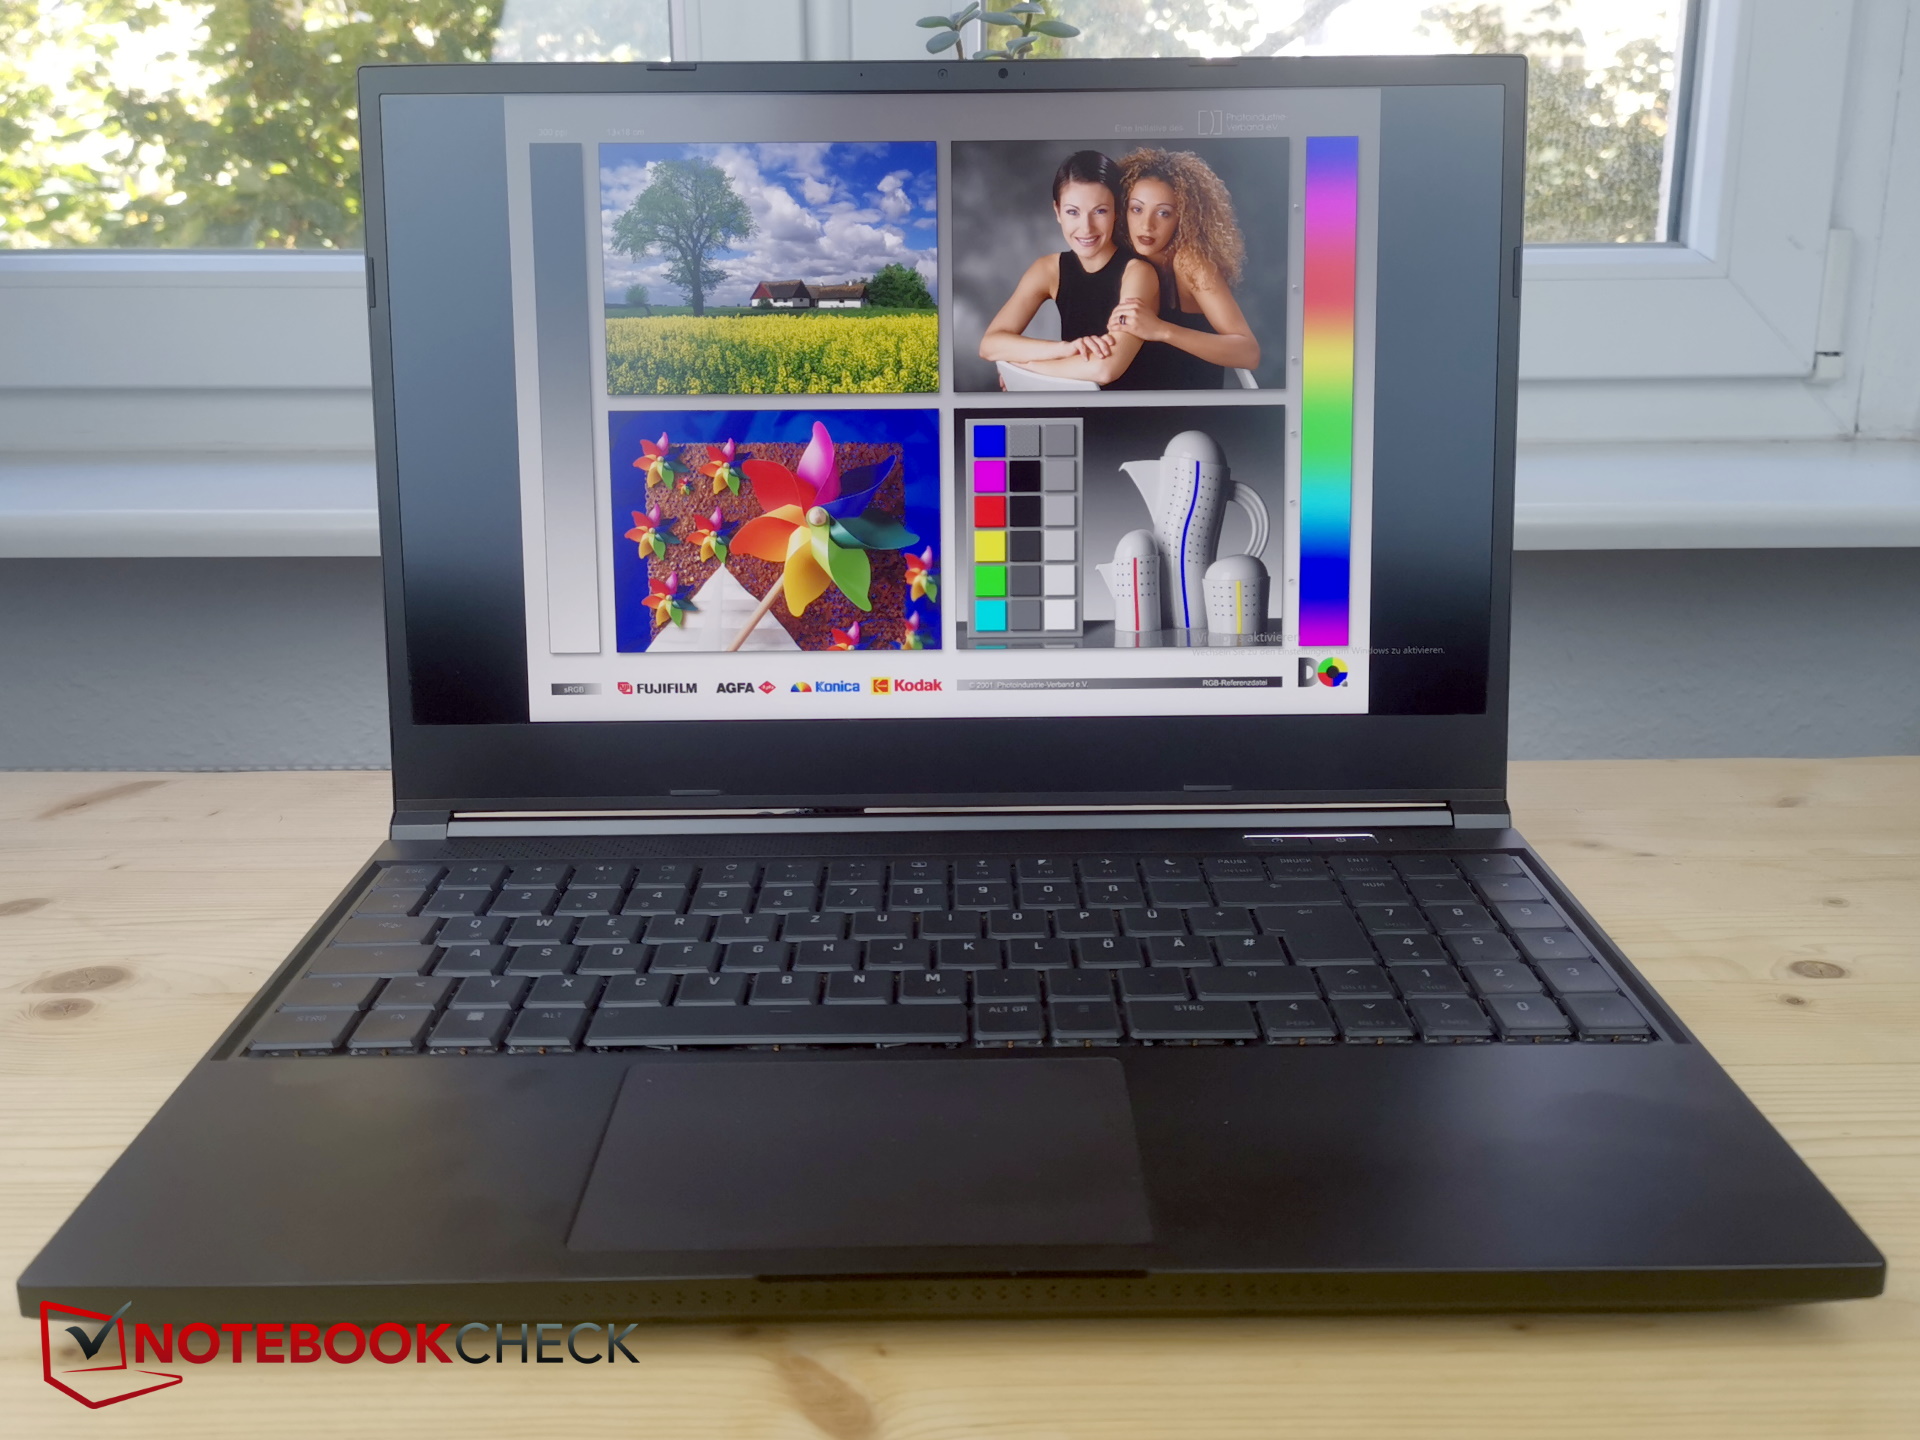
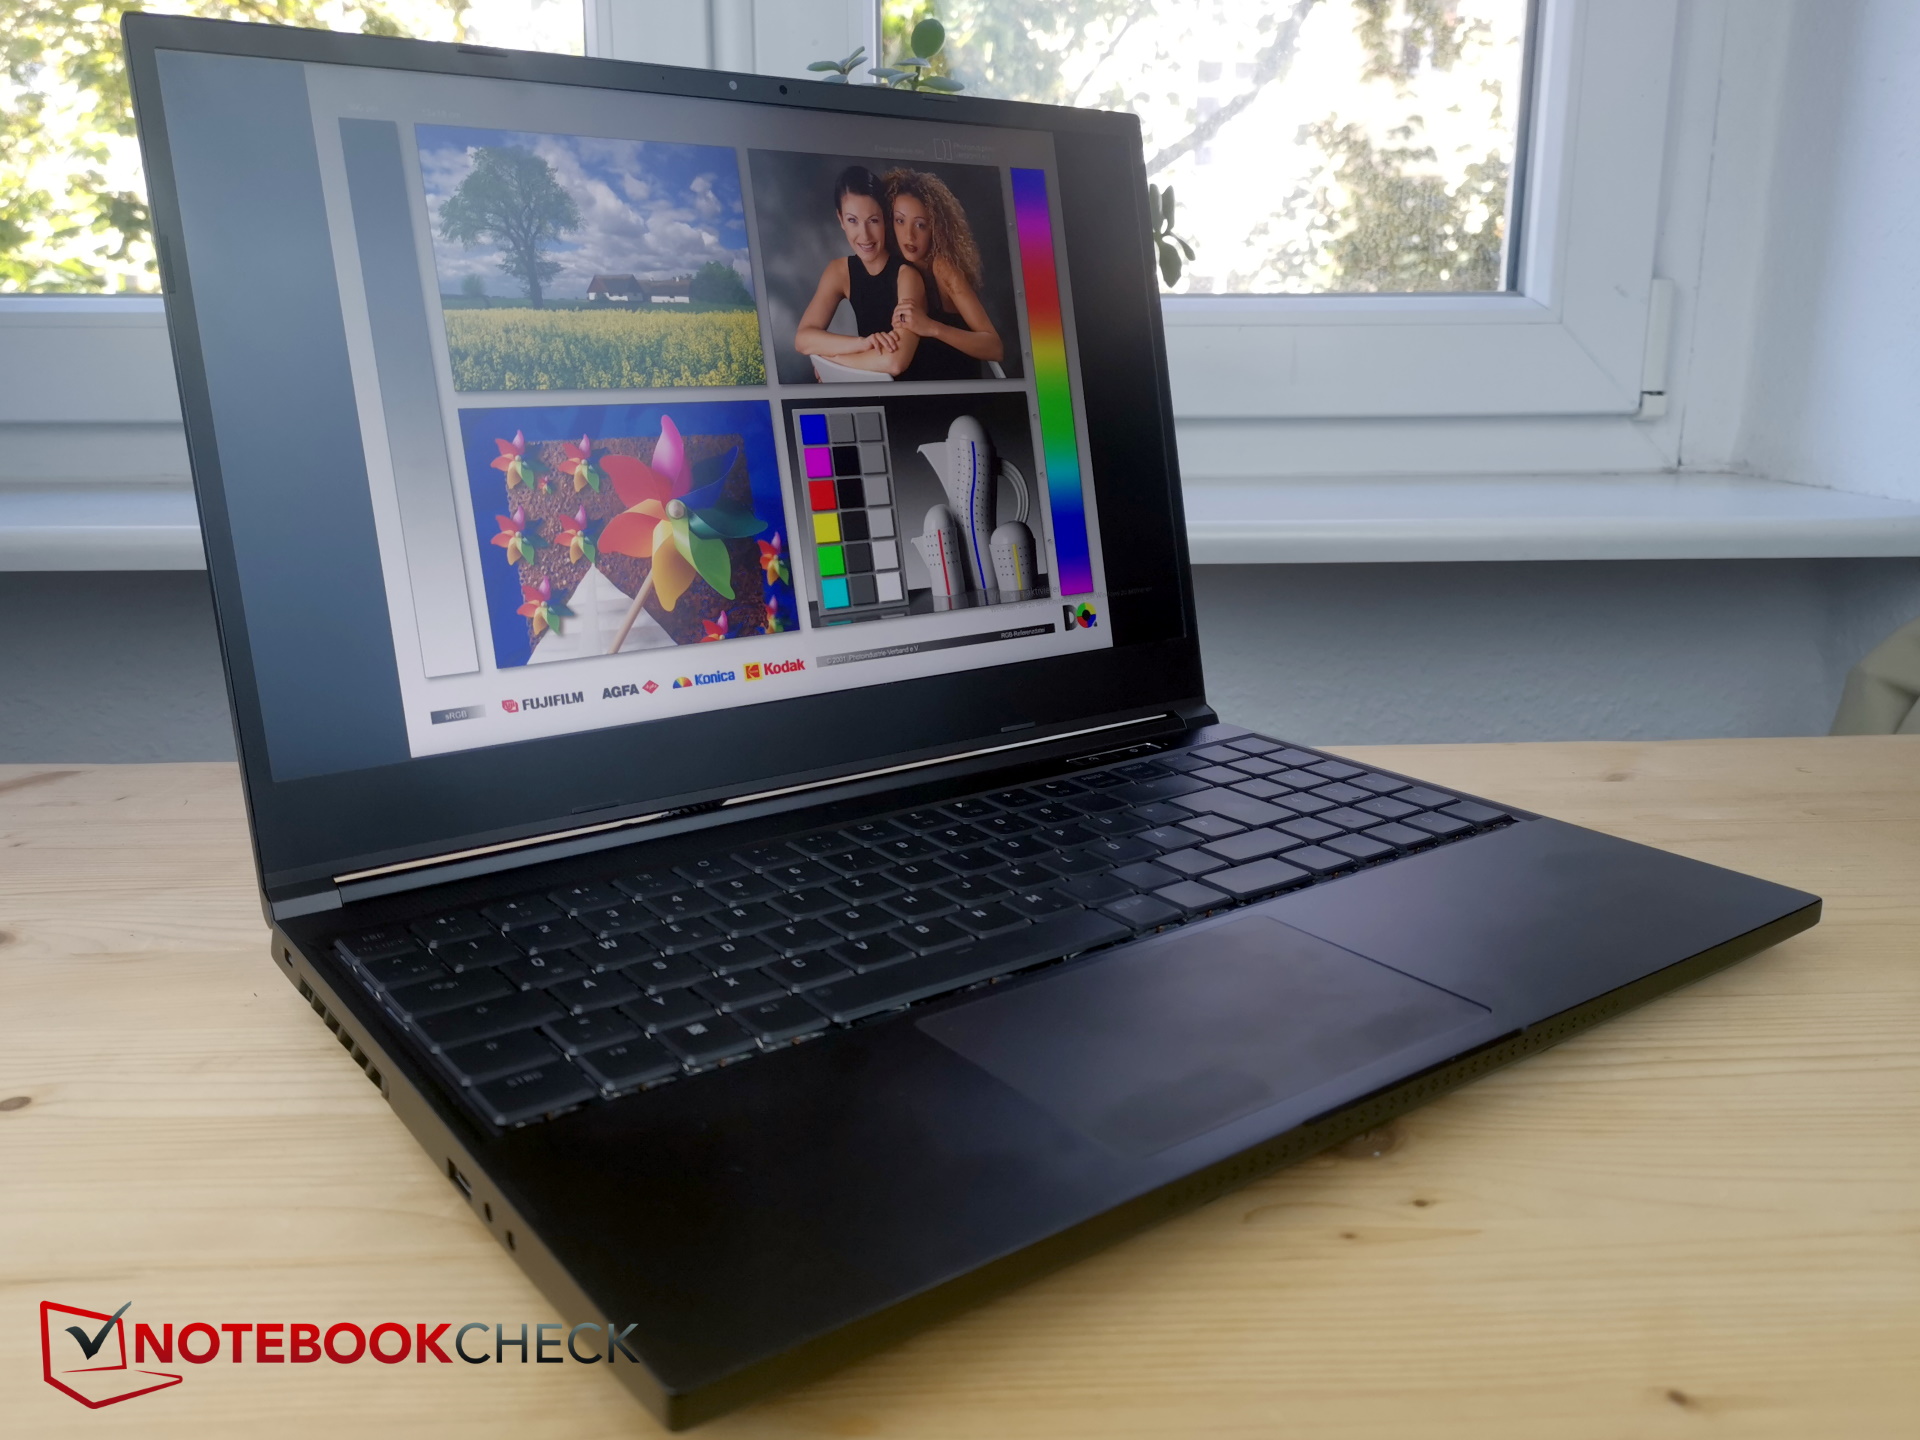
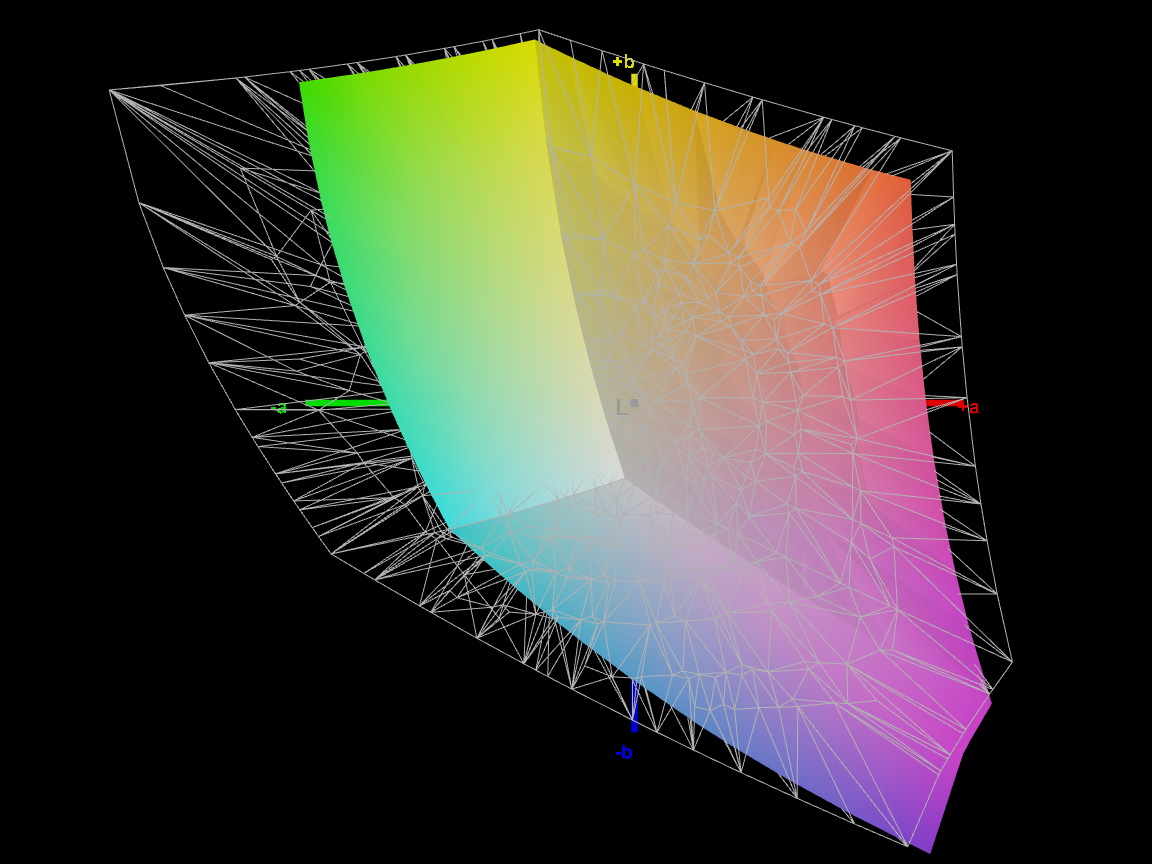
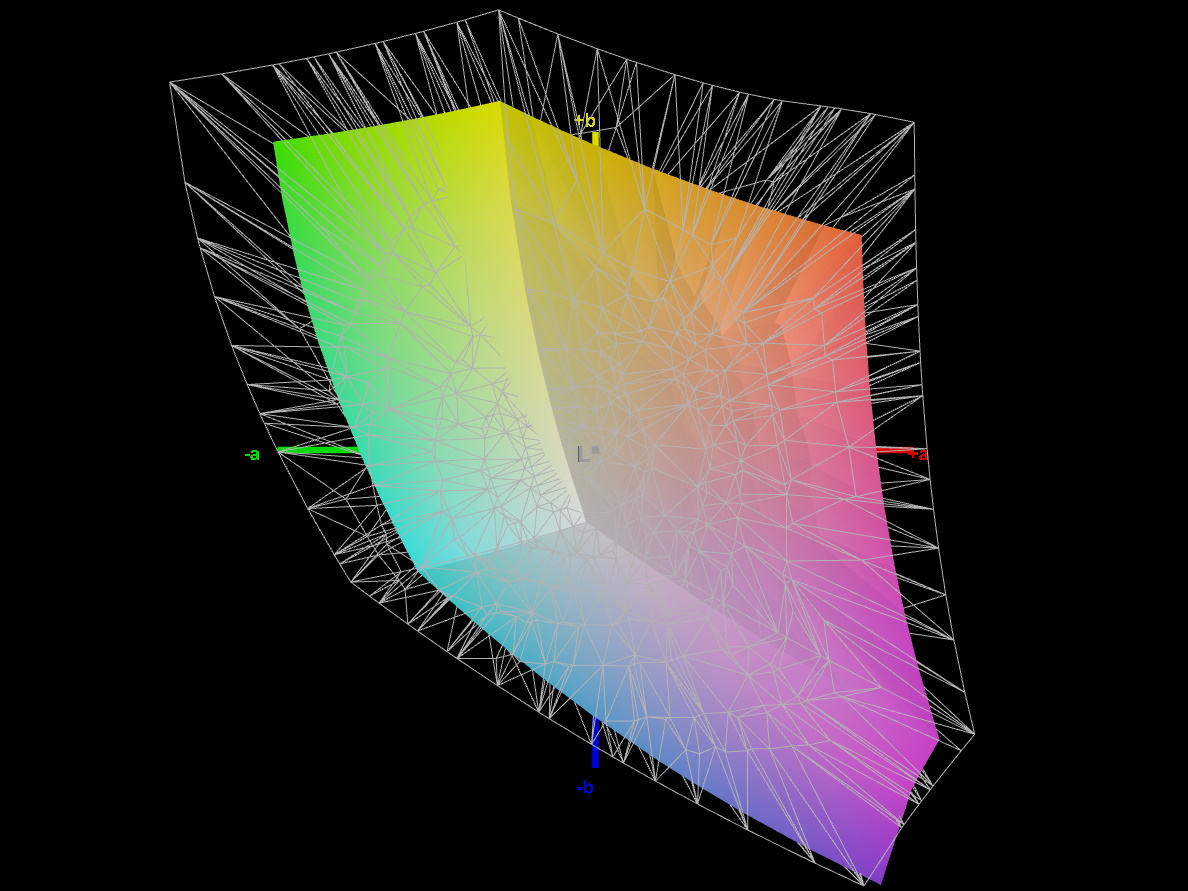
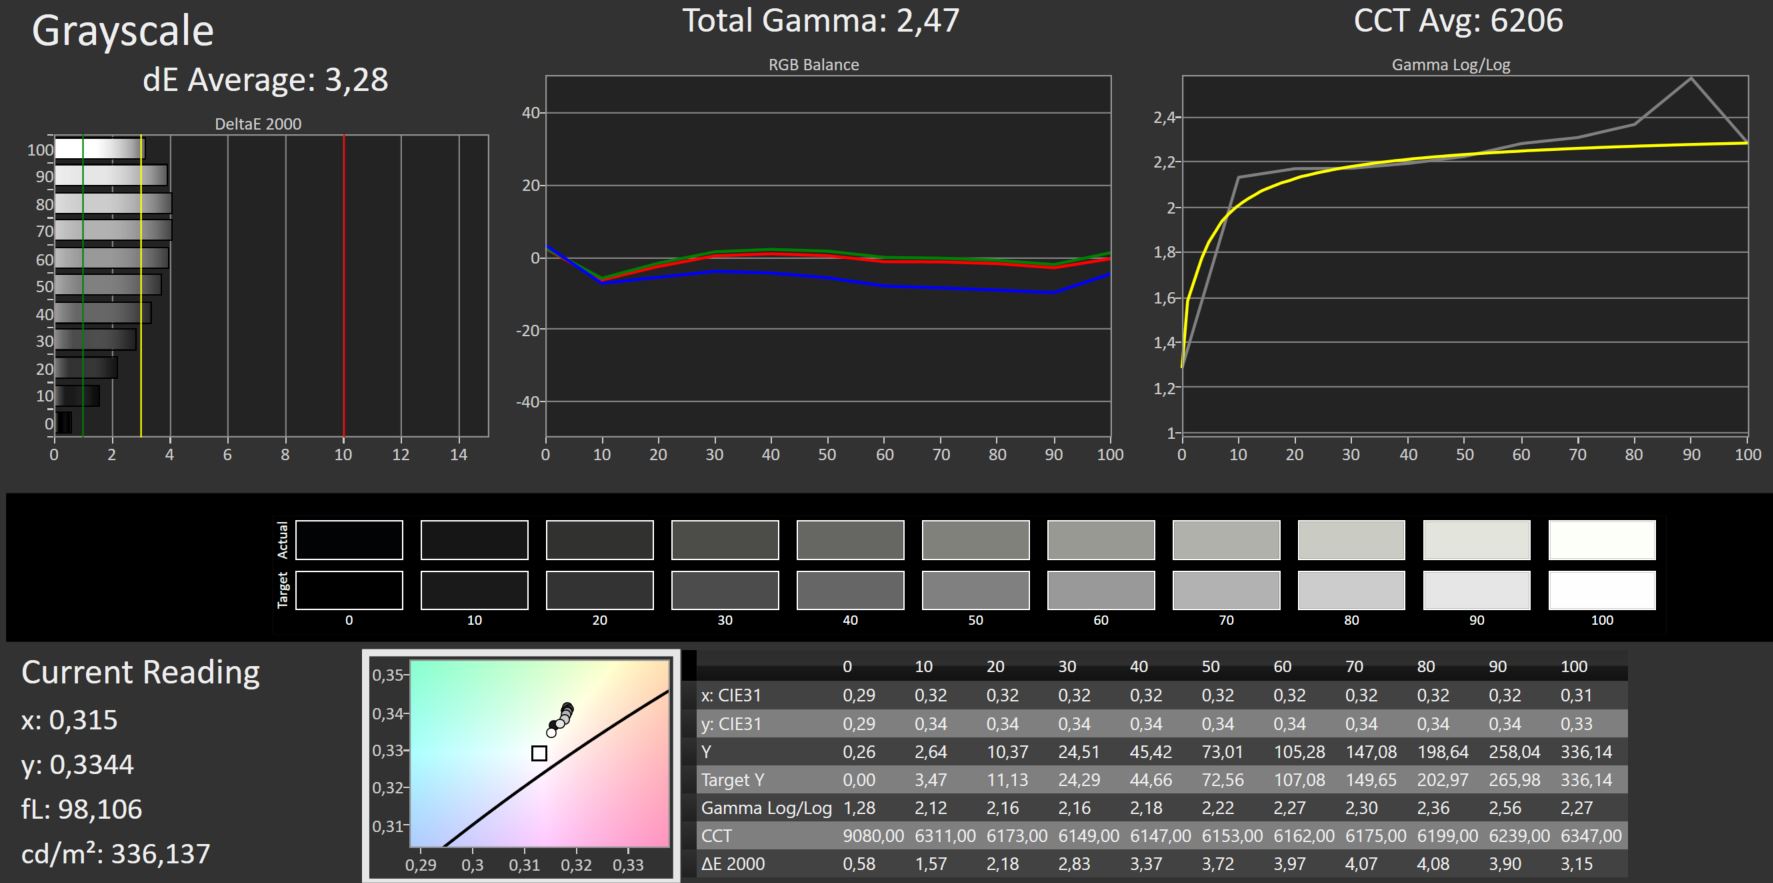
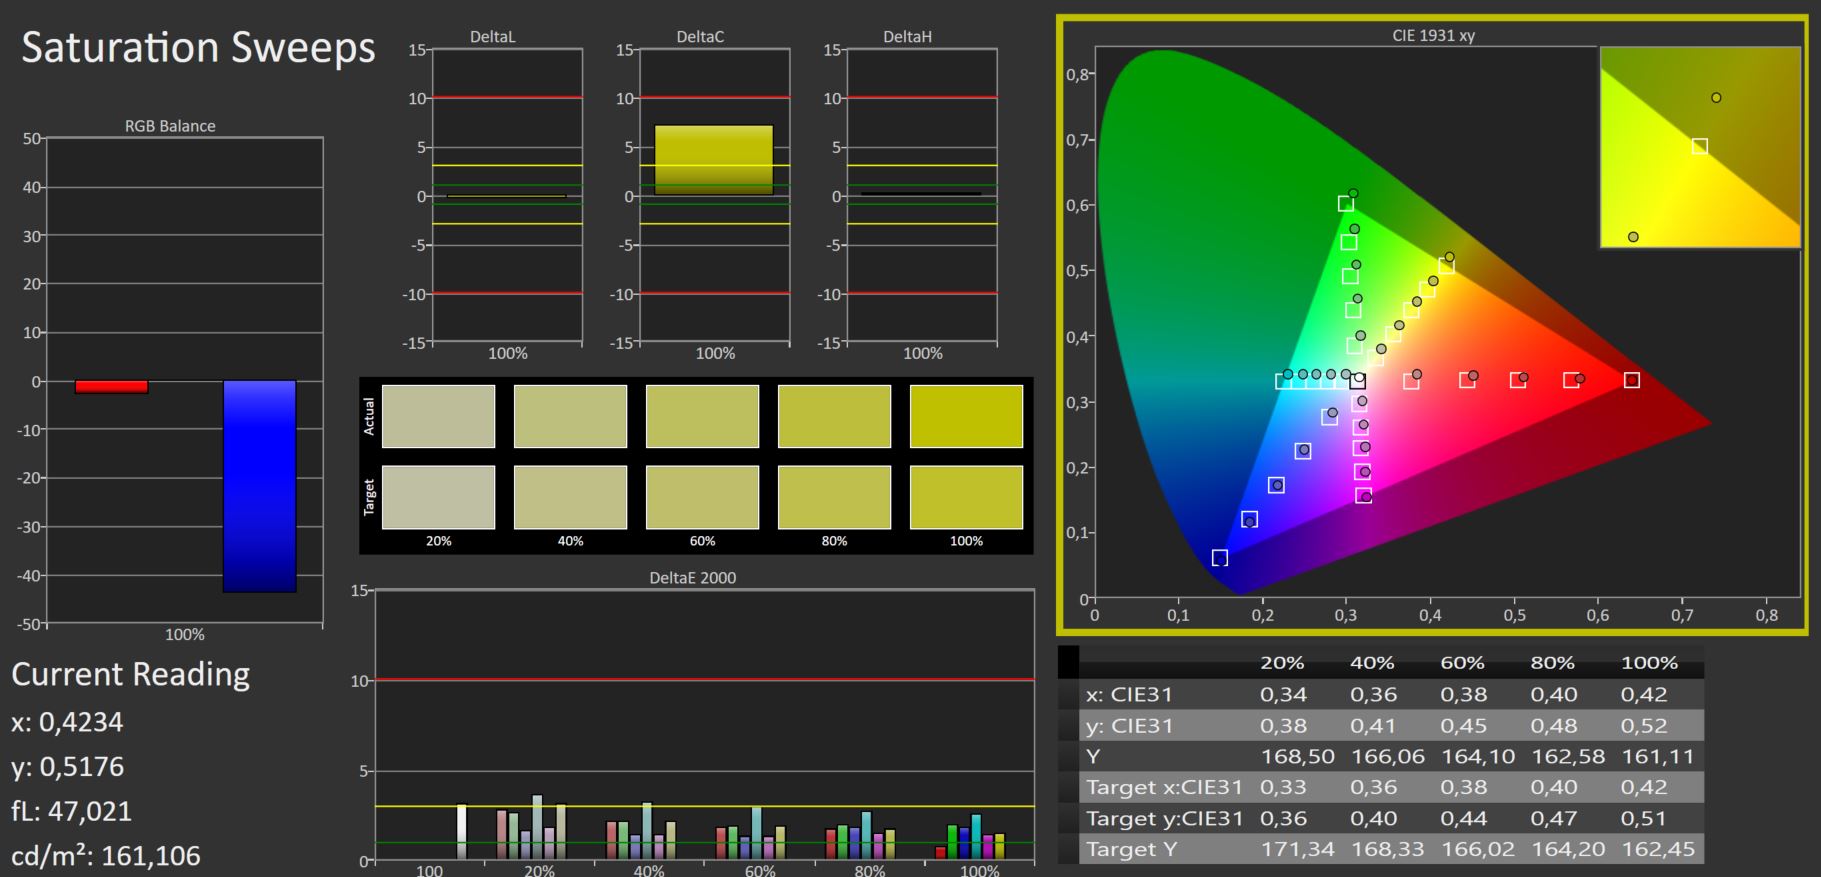
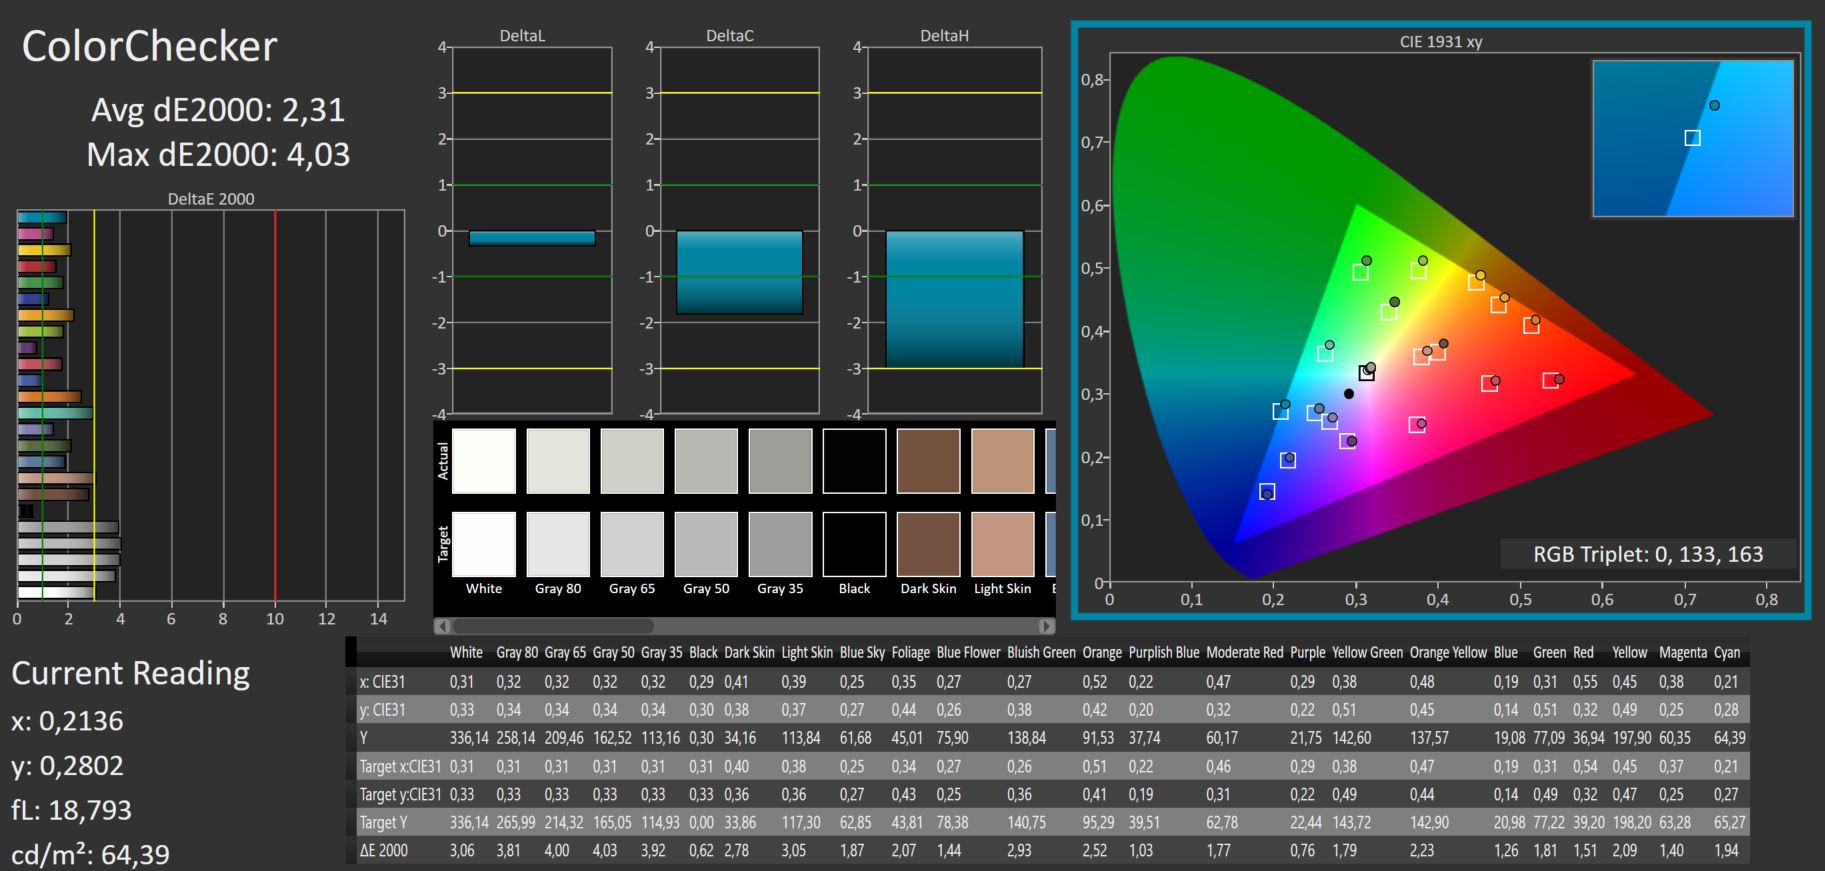
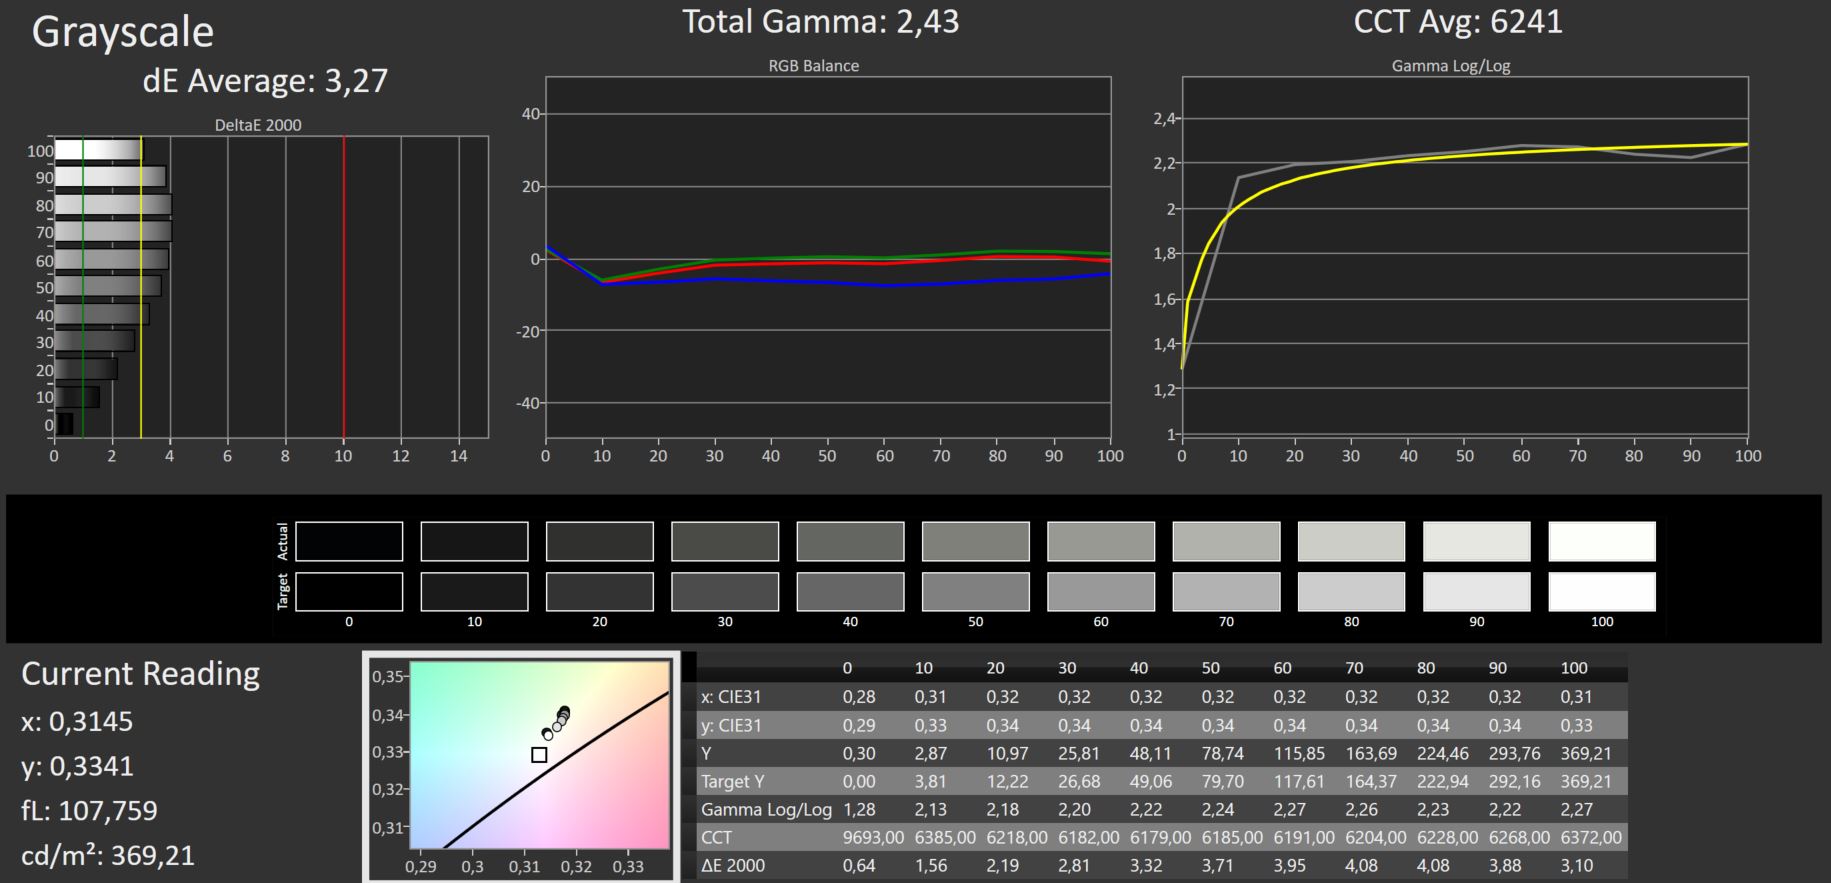
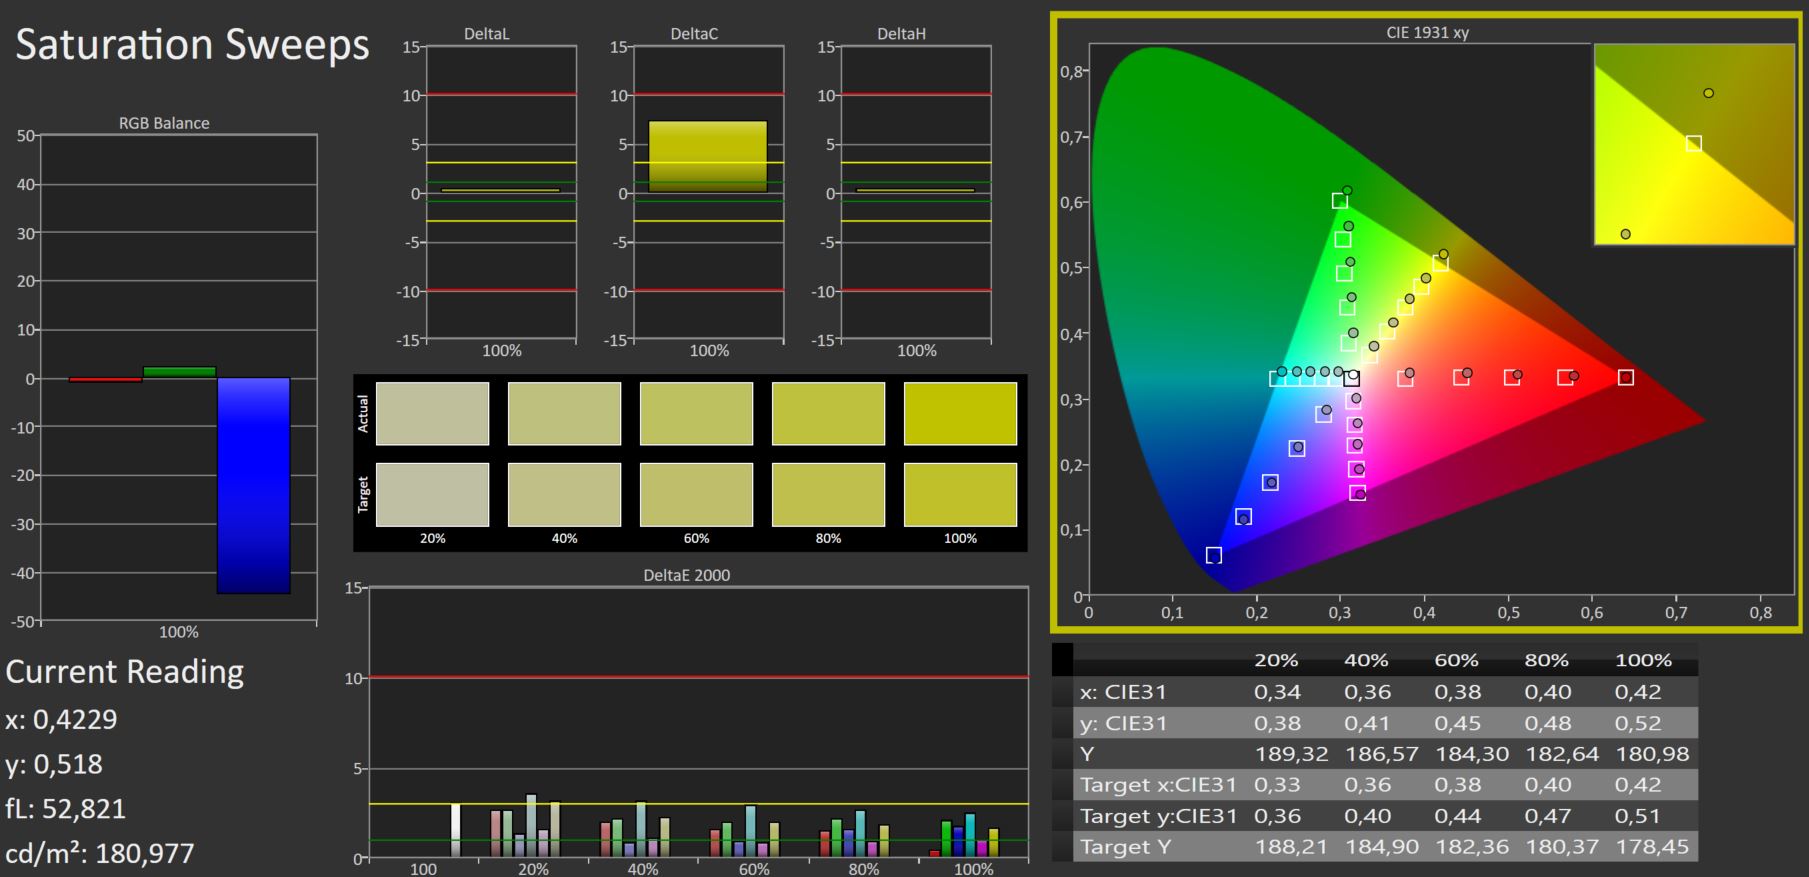
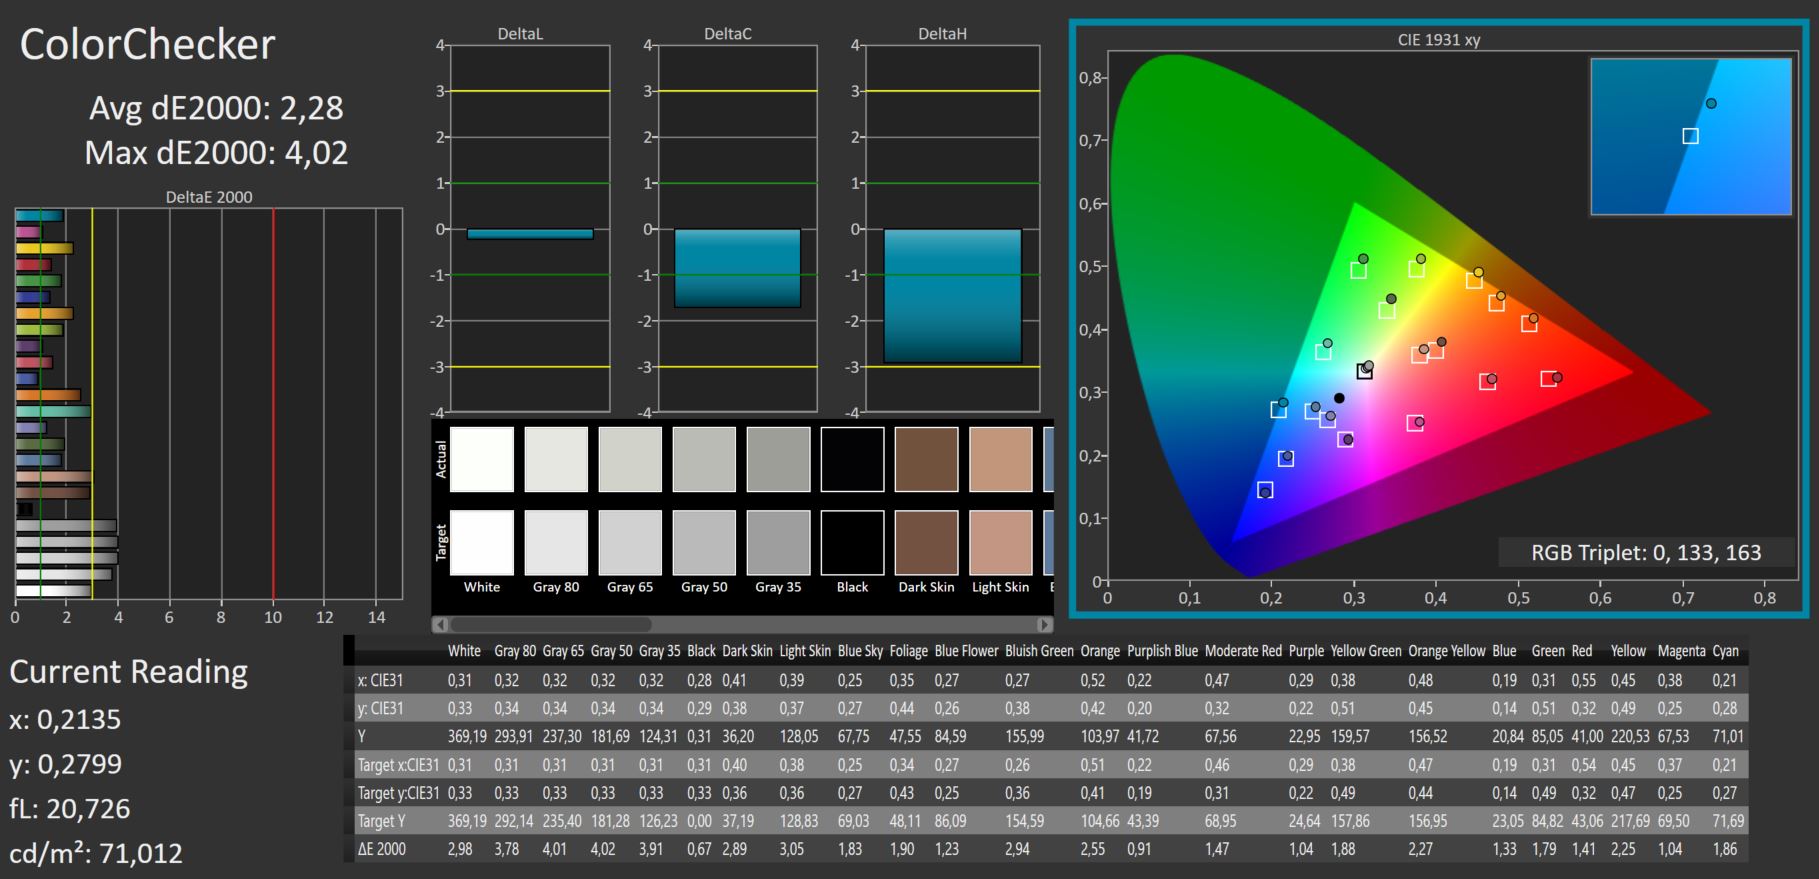
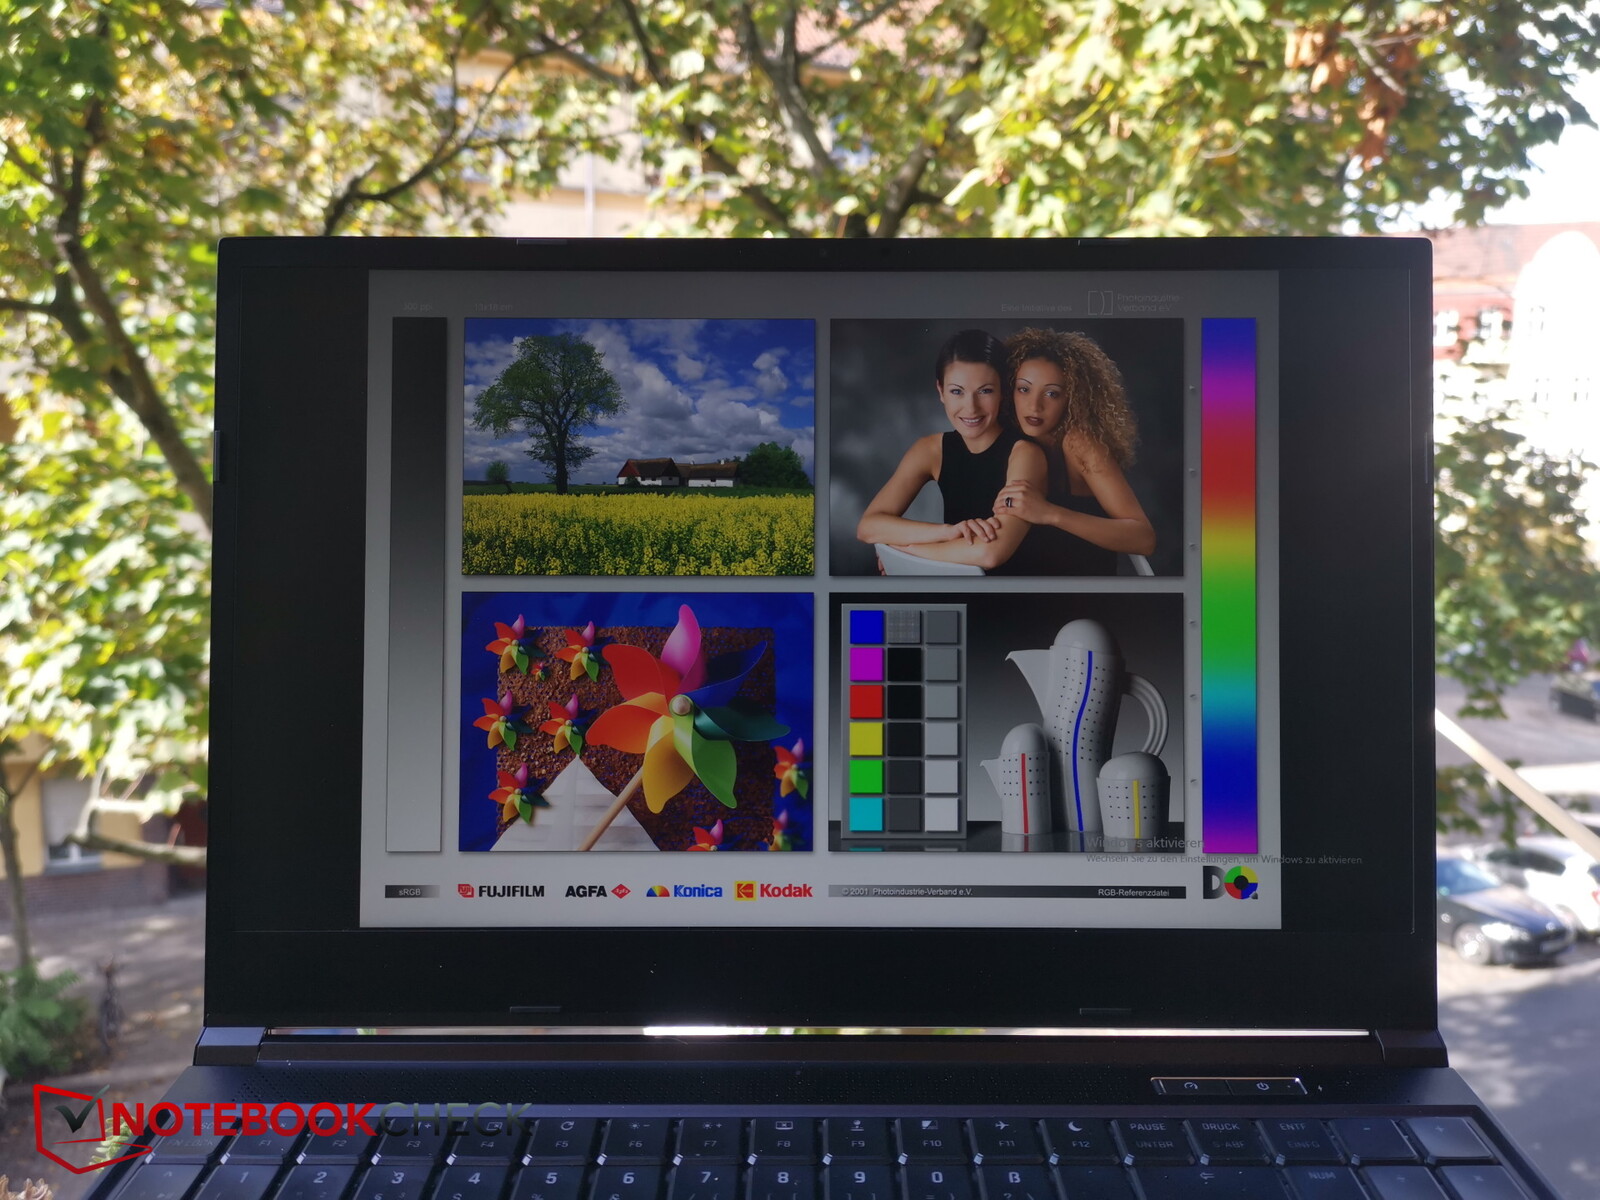
Tela - Tela QHD 240Hz com cobertura total sRGB
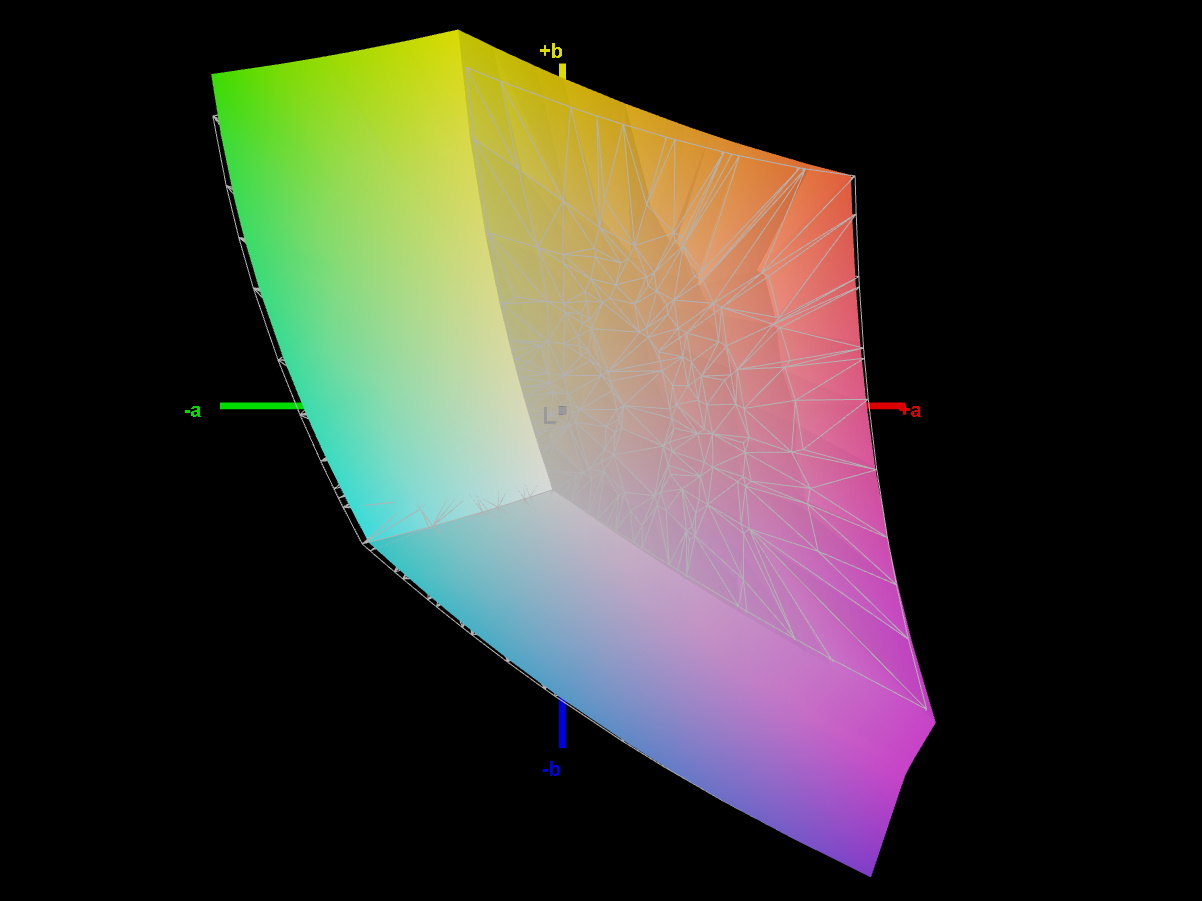
Schenker utiliza o mesmo painel IPS 16:9 QHD com uma resolução de 2.560 x 1.440 em todos os modelos. A tela tem um brilho máximo de 350 lêndeas, o que é um nível relativamente bom que coloca o Neo 15 à frente tanto do MSI Stealth quanto do Acer Nitro.
Entretanto, sua distribuição de brilho de apenas 82% está um pouco abaixo da média. Em particular, a luminosidade da tela é significativamente menor ao longo da parte inferior da tela.
O nível de preto e o contraste são ambos ótimos para um laptop desta classe. A tela também tem um bom tempo de resposta e não usa PWM.
| |||||||||||||||||||||||||
iluminação: 82 %
iluminação com acumulador: 367 cd/m²
Contraste: 1321:1 (Preto: 0.28 cd/m²)
ΔE ColorChecker Calman: 2.31 | ∀{0.5-29.43 Ø4.71}
ΔE Greyscale Calman: 3.28 | ∀{0.09-98 Ø4.96}
70.4% AdobeRGB 1998 (Argyll 3D)
97.7% sRGB (Argyll 3D)
68.9% Display P3 (Argyll 3D)
Gamma: 2.47
CCT: 6206 K
| Schenker XMG Neo 15 (Ryzen 9 6900HX, RTX 3070 Ti) BOE0A67, IPS, 2560x1440, 15.6" | Schenker XMG Neo 15 (i7-12700H, RTX 3080 Ti) BOE0A67, IPS, 2560x1440, 15.6" | MSI GE67 HX 12UGS Samsung ATNA562P02-0, OLED, 1920x1080, 15.6" | Asus ROG Strix Scar 15 G533ZW-LN106WS BOE CQ NE156QHM-NZ2, IPS-level, 2560x1440, 15.6" | Acer Nitro 5 AN515-58-72QR Chi Mei N156KME-GNA, IPS, 2560x1440, 15.6" | MSI Stealth GS66 12UGS Sharp LQ156T1JW04 (SHP153C), IPS-Level, 2560x1440, 15.6" | |
|---|---|---|---|---|---|---|
| Display | -1% | 1% | 21% | 21% | 21% | |
| Display P3 Coverage (%) | 68.9 | 68.2 -1% | 71.7 4% | 96.2 40% | 95.6 39% | 96.4 40% |
| sRGB Coverage (%) | 97.7 | 97.2 -1% | 89.7 -8% | 99.9 2% | 99.8 2% | 99.7 2% |
| AdobeRGB 1998 Coverage (%) | 70.4 | 69.4 -1% | 75.2 7% | 84.5 20% | 85.2 21% | 85.6 22% |
| Response Times | 0% | 97% | 39% | -22% | 29% | |
| Response Time Grey 50% / Grey 80% * (ms) | 12.4 ? | 12.4 ? -0% | 0.25 ? 98% | 7.86 ? 37% 4.21 ? 66% | 15.7 ? -27% | 6 ? 52% |
| Response Time Black / White * (ms) | 8.8 ? | 8.8 ? -0% | 0.4 ? 95% | 7.5 ? 15% | 10.2 ? -16% | 8.4 ? 5% |
| PWM Frequency (Hz) | 480.4 ? | |||||
| Screen | 15% | -30% | -35% | -30% | -43% | |
| Brightness middle (cd/m²) | 370 | 365 -1% | 356.1 -4% | 346 -6% | 332 -10% | 272 -26% |
| Brightness (cd/m²) | 343 | 335 -2% | 358 4% | 329 -4% | 303 -12% | 253 -26% |
| Brightness Distribution (%) | 82 | 81 -1% | 99 21% | 91 11% | 86 5% | 87 6% |
| Black Level * (cd/m²) | 0.28 | 0.32 -14% | 0.59 -111% | 0.29 -4% | 0.25 11% | |
| Contrast (:1) | 1321 | 1141 -14% | 586 -56% | 1145 -13% | 1088 -18% | |
| Colorchecker dE 2000 * | 2.31 | 1.38 40% | 4.83 -109% | 3.06 -32% | 3.61 -56% | 3.73 -61% |
| Colorchecker dE 2000 max. * | 4.03 | 2.01 50% | 7.94 -97% | 5.81 -44% | 7.71 -91% | 9.43 -134% |
| Greyscale dE 2000 * | 3.28 | 1.36 59% | 3.1 5% | 5.2 -59% | 6.5 -98% | |
| Gamma | 2.47 89% | 2.48 89% | 2.2 100% | 2.12 104% | 2.155 102% | 2.172 101% |
| CCT | 6206 105% | 6412 101% | 5938 109% | 7021 93% | 6724 97% | 6485 100% |
| Colorchecker dE 2000 calibrated * | 1.22 | 2.57 | 0.59 | 0.98 | ||
| Média Total (Programa/Configurações) | 5% /
9% | 23% /
1% | 8% /
-5% | -10% /
-17% | 2% /
-17% |
* ... menor é melhor
A tela não é realmente adequada para edição profissional de fotos e vídeos. Embora a tela tenha cobertura total sRGB, ela conseguiu cobrir apenas cerca de 70% do espaço colorido AdobeRGB e DisplayP3.
O display já está bastante bem calibrado, logo de saída da caixa. Apesar dos valores do Delta E não serem especialmente baixos, não houve nenhuma melhoria mesmo depois que nós mesmos calibramos a tela manualmente.
Exibir tempos de resposta
| ↔ Tempo de resposta preto para branco | ||
|---|---|---|
| 8.8 ms ... ascensão ↗ e queda ↘ combinadas | ↗ 4.6 ms ascensão | 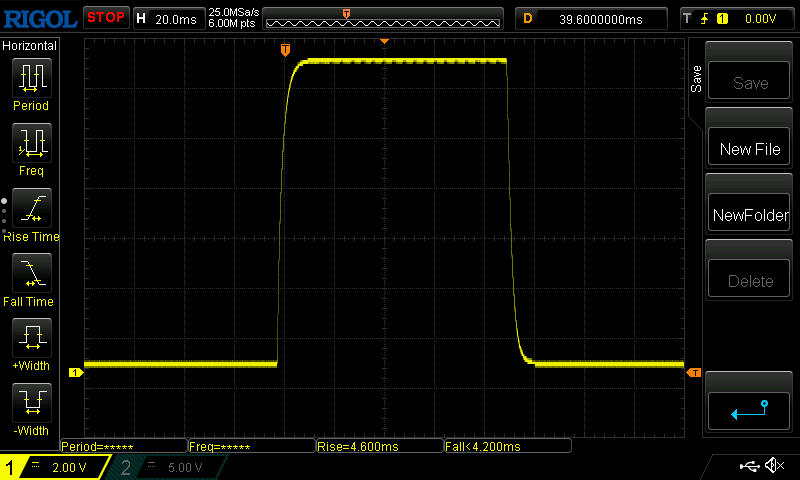 |
| ↘ 4.2 ms queda | ||
| A tela mostra taxas de resposta rápidas em nossos testes e deve ser adequada para jogos. Em comparação, todos os dispositivos testados variam de 0.1 (mínimo) a 240 (máximo) ms. » 25 % de todos os dispositivos são melhores. Isso significa que o tempo de resposta medido é melhor que a média de todos os dispositivos testados (19.8 ms). | ||
| ↔ Tempo de resposta 50% cinza a 80% cinza | ||
| 12.4 ms ... ascensão ↗ e queda ↘ combinadas | ↗ 5.8 ms ascensão | 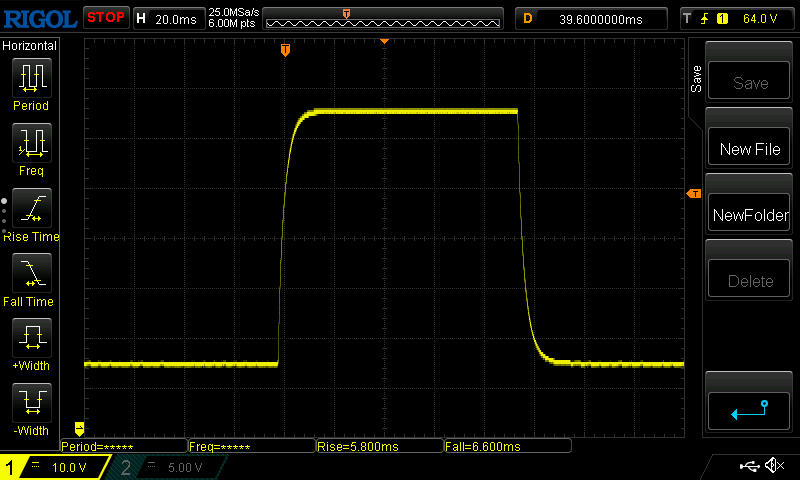 |
| ↘ 6.6 ms queda | ||
| A tela mostra boas taxas de resposta em nossos testes, mas pode ser muito lenta para jogadores competitivos. Em comparação, todos os dispositivos testados variam de 0.165 (mínimo) a 636 (máximo) ms. » 26 % de todos os dispositivos são melhores. Isso significa que o tempo de resposta medido é melhor que a média de todos os dispositivos testados (30.9 ms). | ||
Cintilação da tela / PWM (modulação por largura de pulso)
| Tela tremeluzindo / PWM não detectado | 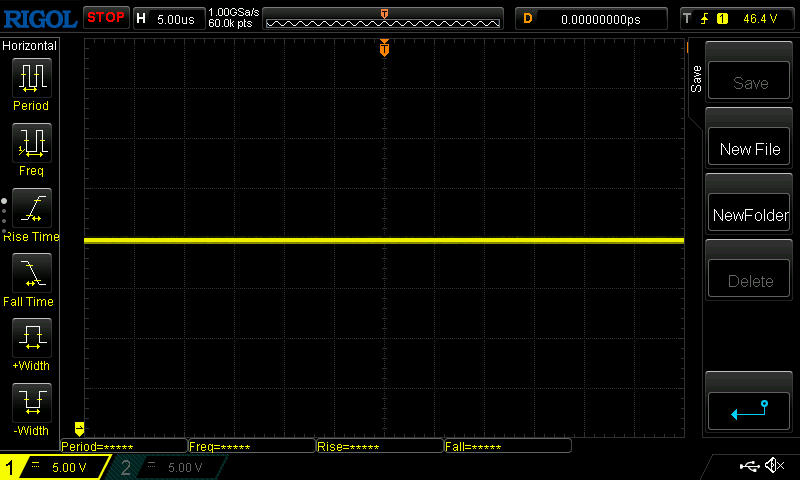 | ||
[pwm_comparison] Em comparação: 52 % de todos os dispositivos testados não usam PWM para escurecer a tela. Se PWM foi detectado, uma média de 7744 (mínimo: 5 - máximo: 343500) Hz foi medida. | |||
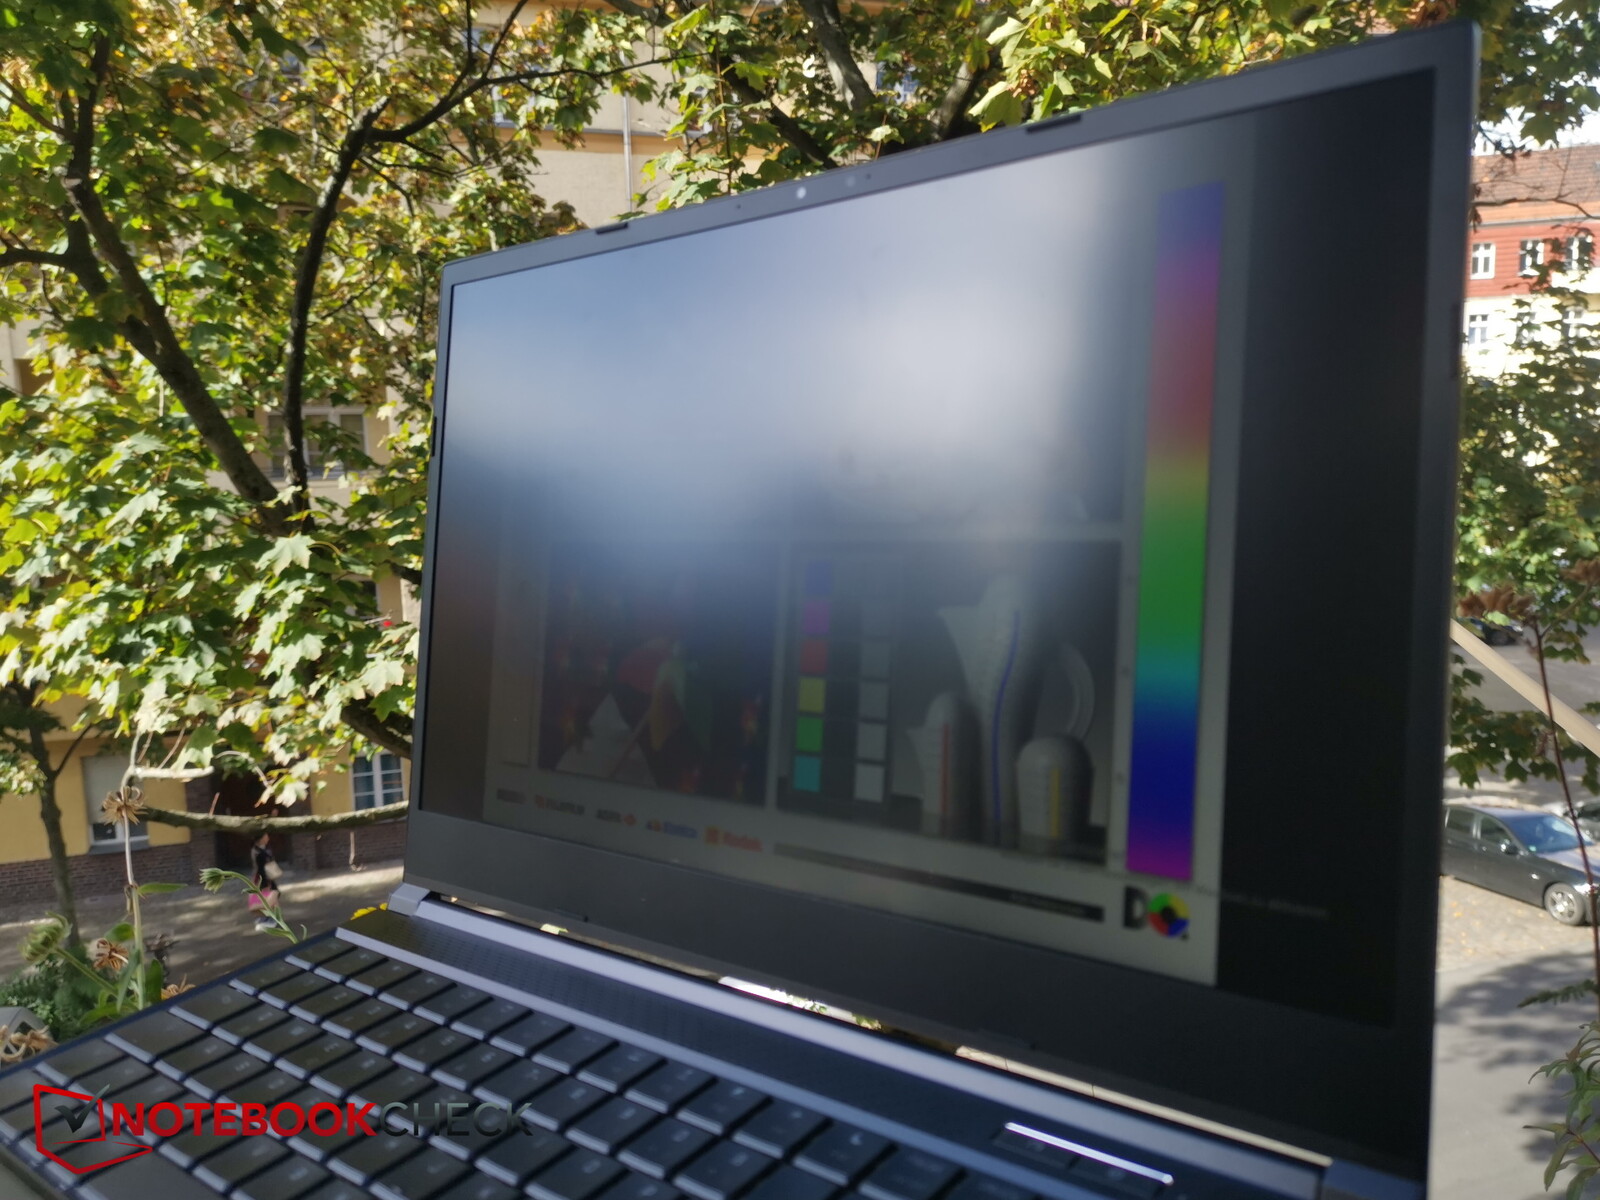
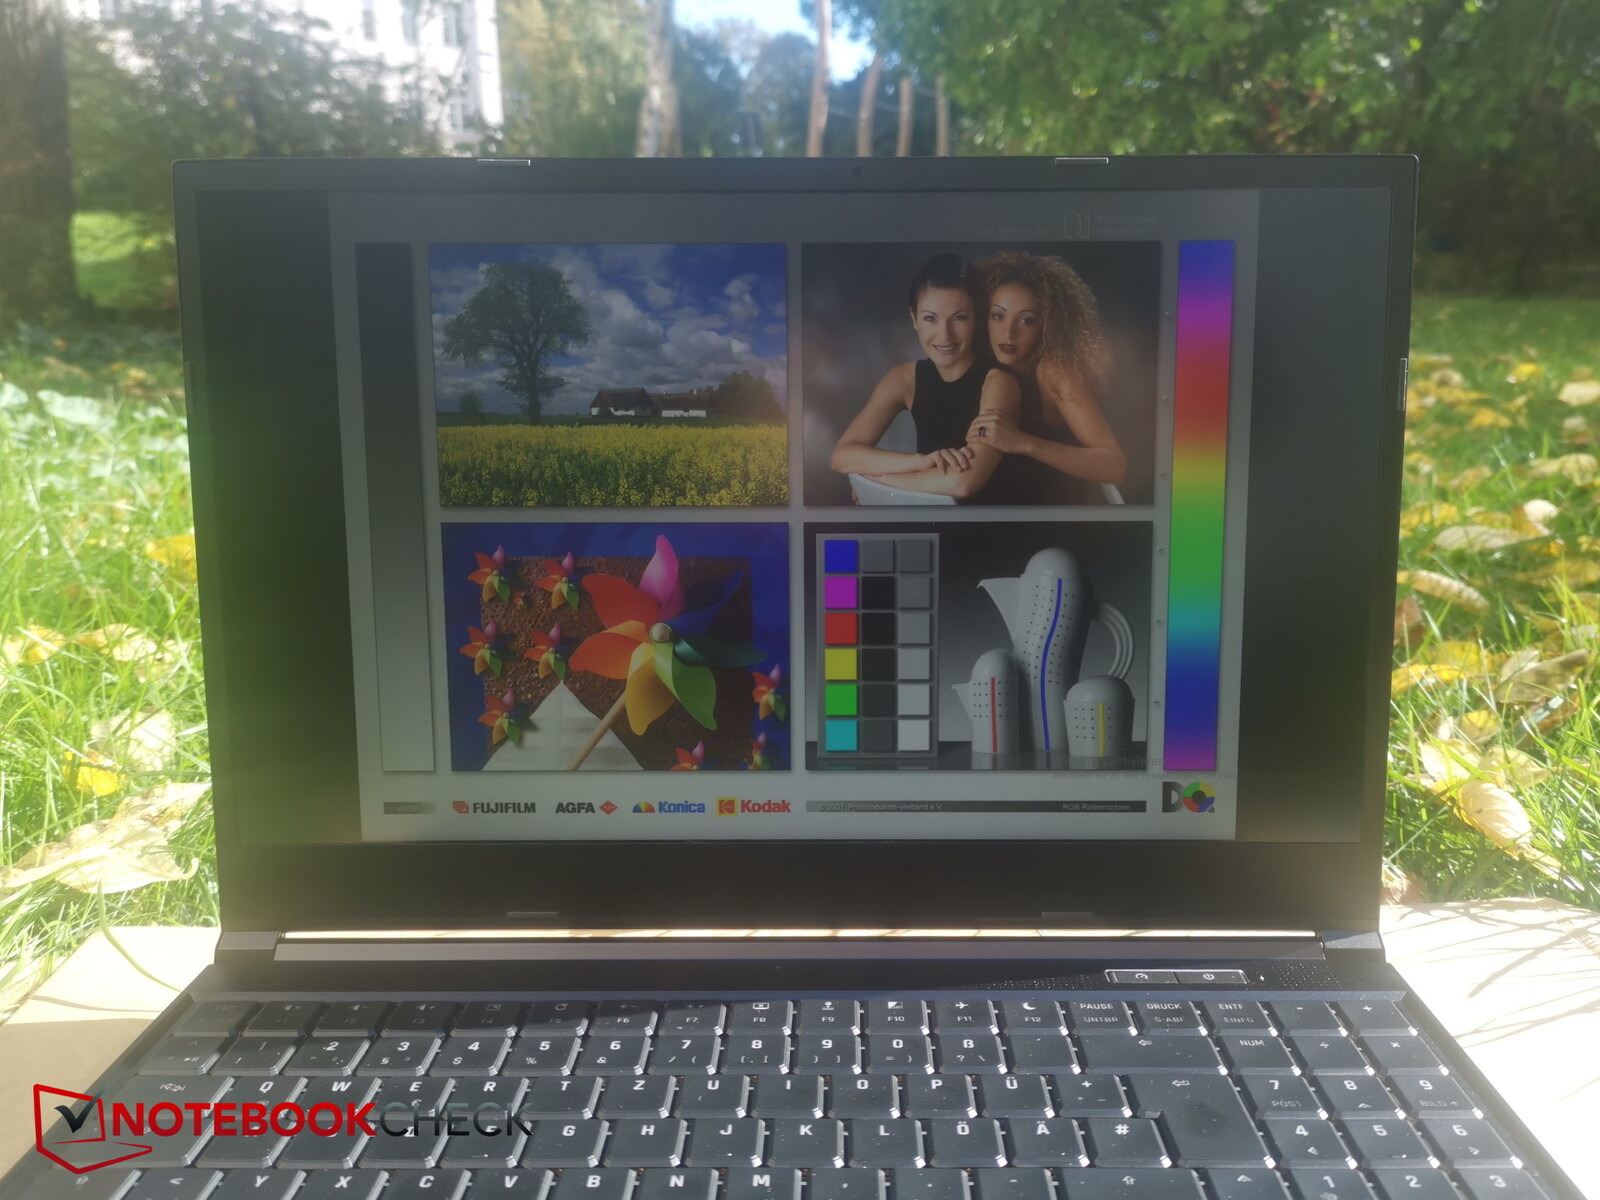
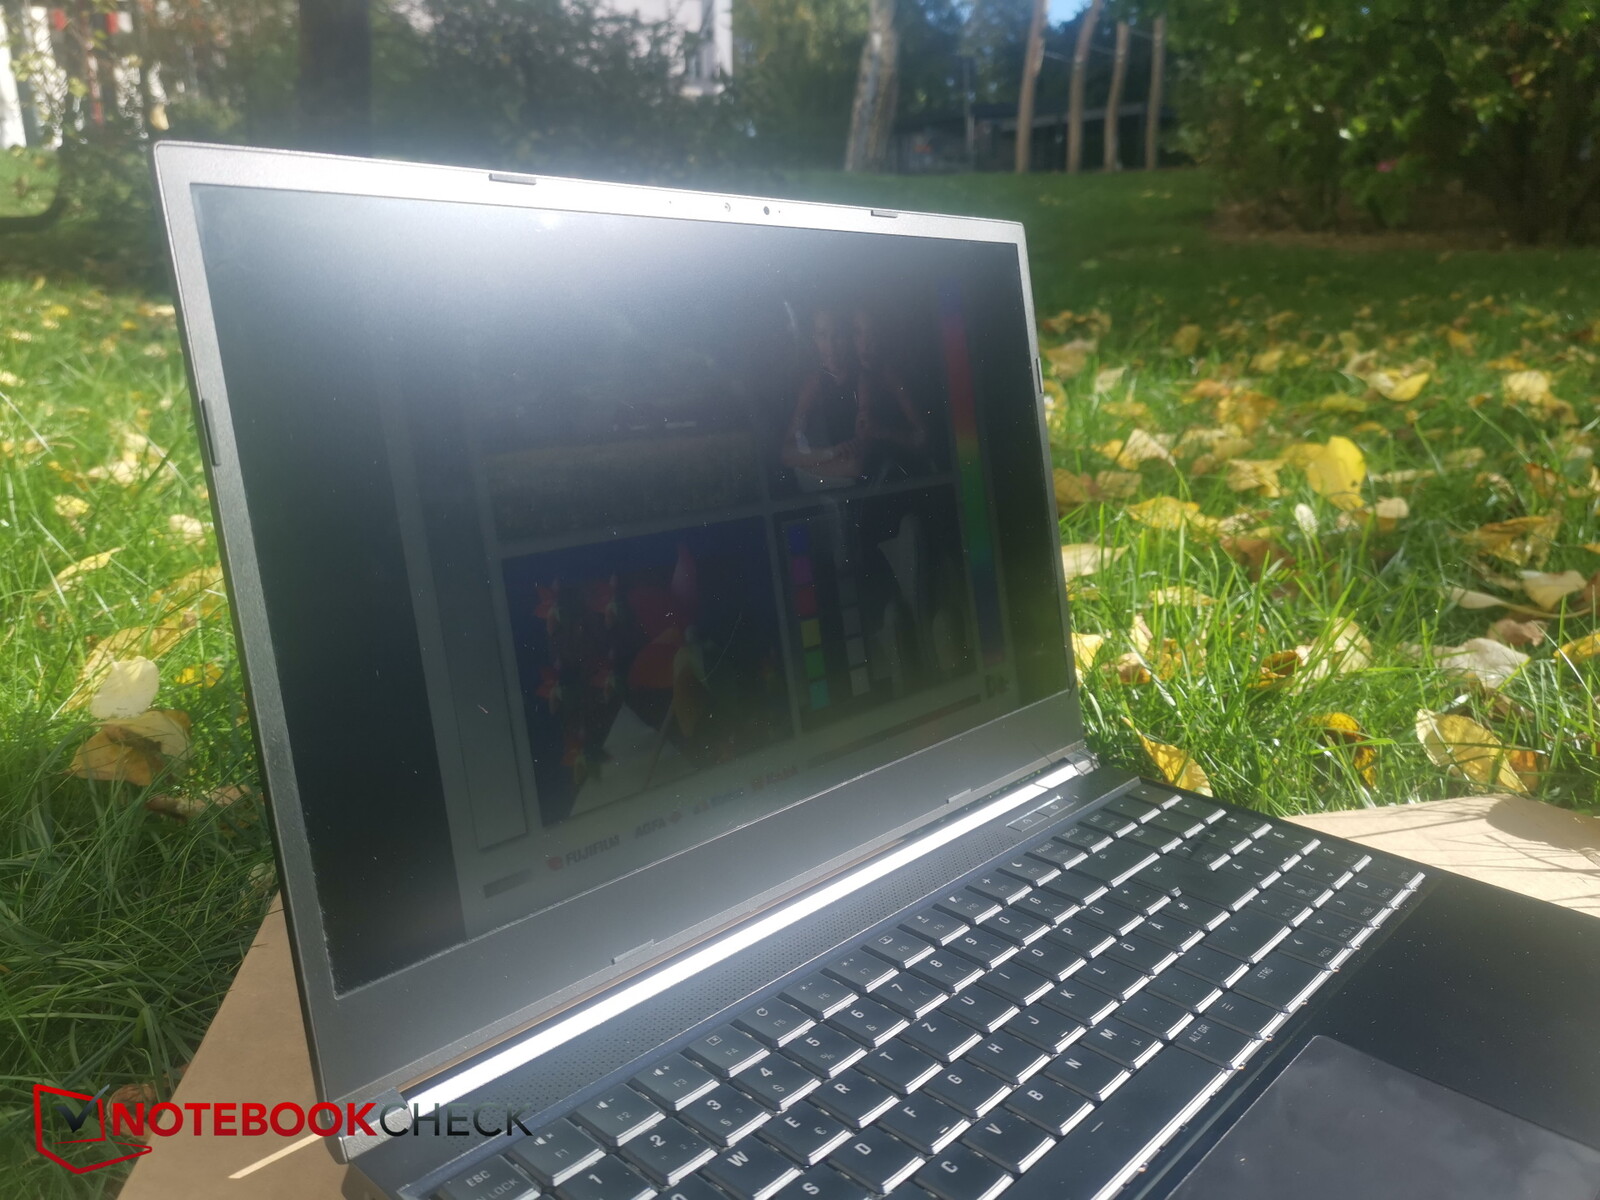
Ao utilizar o dispositivo ao ar livre, você deve procurar um ponto sombreado e certificar-se de que está vendo o visor diretamente sobre ele. Isto porque o conteúdo da tela é muito difícil de ler quando visto em um ângulo ou sob luz solar direta.

Desempenho - AMD e Intel quase no mesmo nível um do outro

Você encontrará muitas maneiras diferentes de configurar o Neo 15 M22 no site do bestware. Mas ele sempre vem com o mesmo painel e processador AMD. Aqueles que querem uma CPU Intel, ao invés disso, podem olhar para o Neo 15 E22.
O é a versão mais recente RTX 3070 Ti em nossa unidade de revisão adiciona cerca de 497 euros (US$494) ao preço de compra em comparação com a opção de GPU mais baixa (RTX 3060). Isto lhe dará um retorno de 1.376 euros (US$1.368) para passar de um RTX 3060 para RTX 3080 Ti.
Muitos outros componentes, como o SSD, DDR5 RAM e módulo Wi-Fi, também são atualizáveis.
Condições de teste
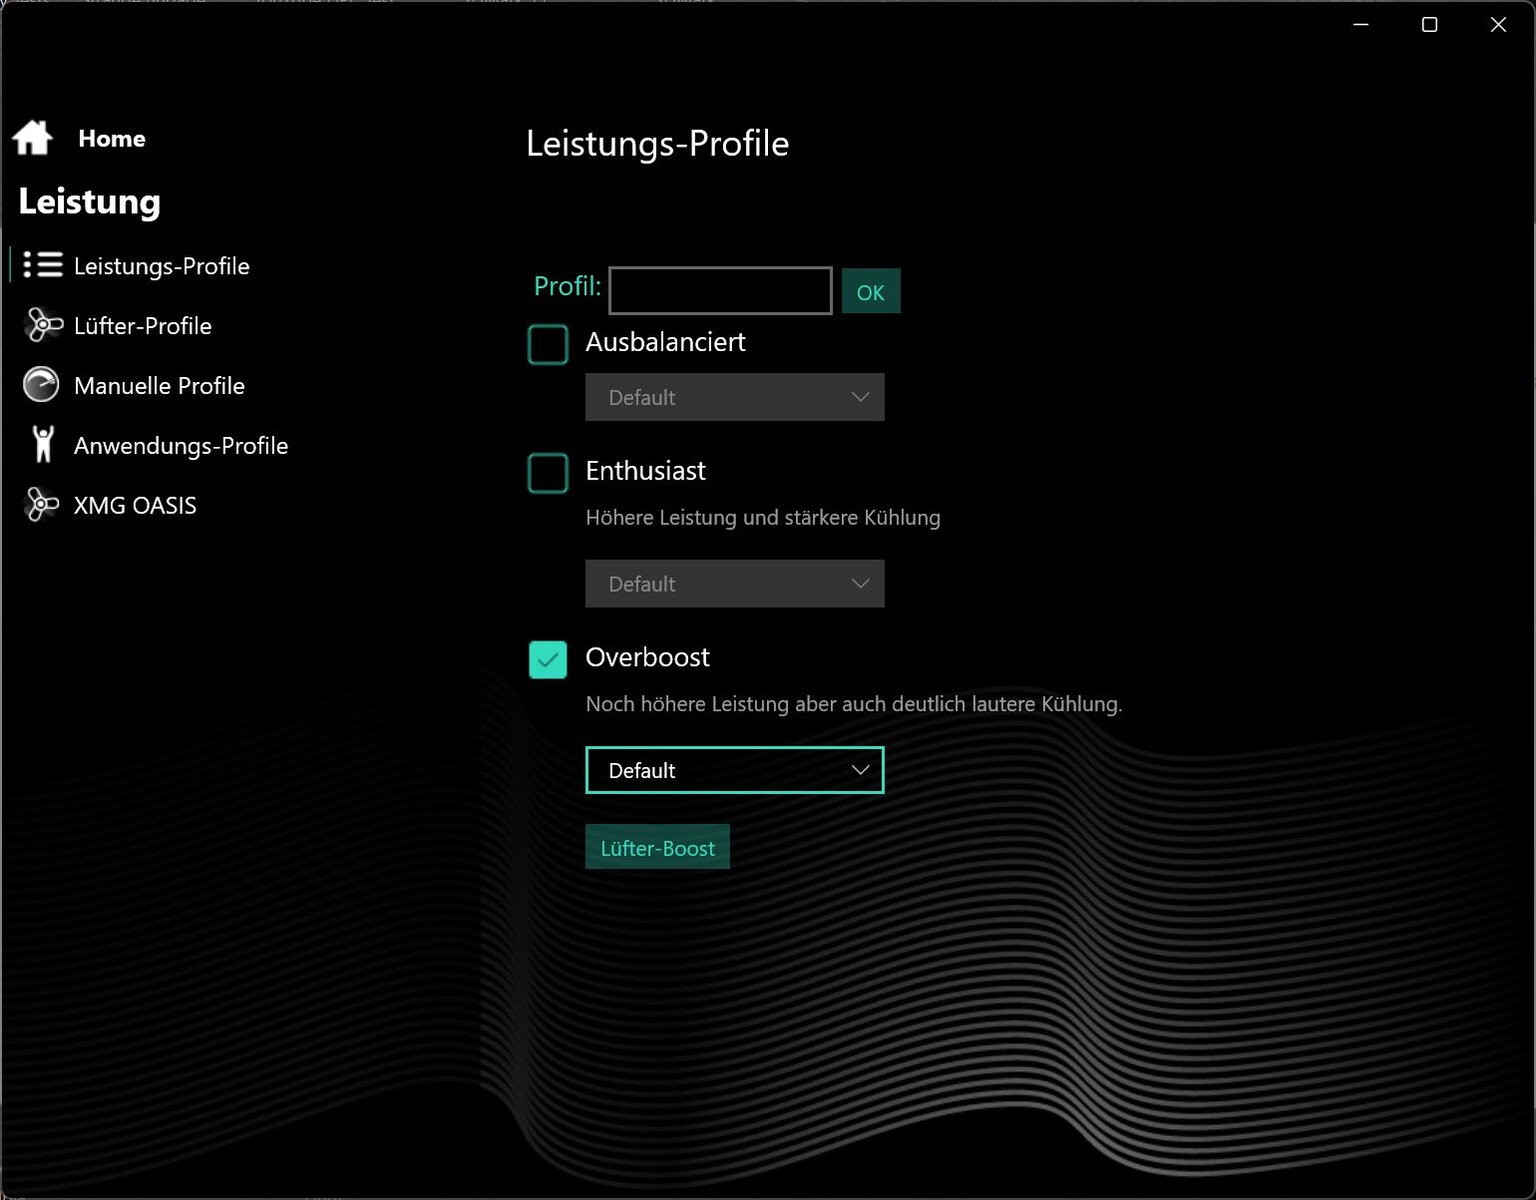
O software do Centro de Controle oferece alguns perfis de desempenho (Balanced, Enthusiast e Overboost). Selecionamos o modo mais potente (Overboost) para nos dar os melhores resultados de referência, apesar de a Schenker recomendar a opção do meio, que foi projetada para ser o melhor compromisso entre desempenho e níveis de ruído.
Além disso, o software permite aos usuários ajustar manualmente vários parâmetros (por exemplo, Dynamic Boost), bem como valores de offset. Gostaríamos, no entanto, de ver um modo silencioso adicionado às opções.

Processador
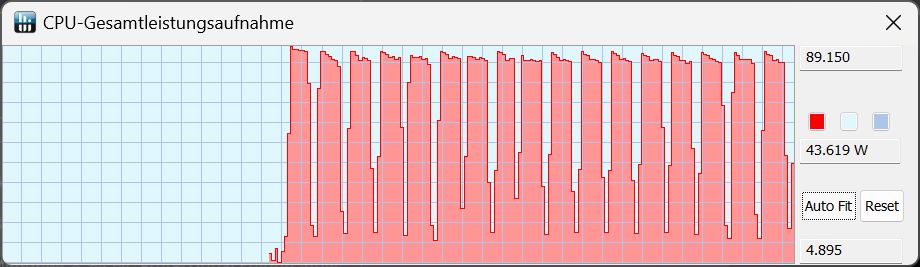

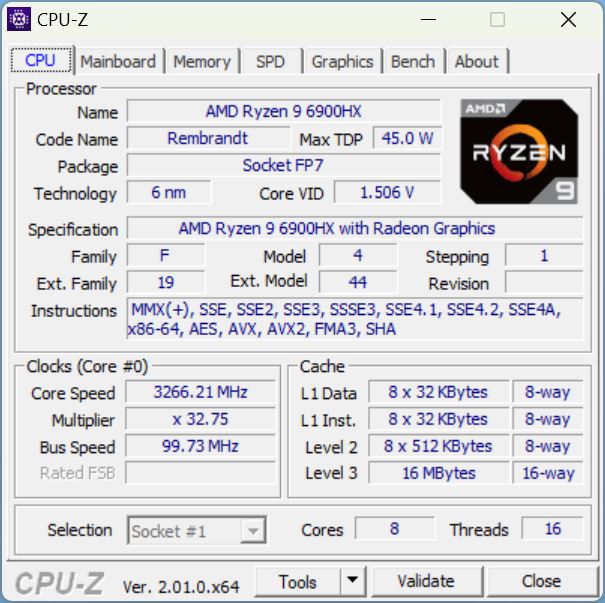
Ao contrário do Neo 15 E22, que apresenta um Núcleo i7-12700Ho Neo M22 é alimentado por um AMD Ryzen 9 6900HX. A CPU Zen 3+ tem oito núcleos que podem operar em até 4,9 GHz e rodar 16 fios ao mesmo tempo. O processador também abriga um Radeon 680M gPU integrado.
Ao executar o Cinebench continuamente em um loop, a CPU Ryzen forneceu seu desempenho consistente habitual sem quaisquer quedas após as primeiras corridas. Entretanto, o Core i7-12700H no Neo 15 baseado em Intel é ligeiramente mais rápido. E isto também é naturalmente verdade para o Núcleo i9-12900H no ROG Strix ou mesmo no Núcleo i7-12800HX no MSI GE67.
O TDP sempre permaneceu abaixo de 90 watts. No modo Enthusiast, o consumo de energia diminuiu ligeiramente para cerca de 85 watts.
Em contraste, houve uma queda no desempenho quando o laptop estava em bateria, com o TDP a reduzir para "apenas" 50 watts.
Cinebench R15 Multi Sustained Load
Cinebench R23: Multi Core | Single Core
Cinebench R20: CPU (Multi Core) | CPU (Single Core)
Cinebench R15: CPU Multi 64Bit | CPU Single 64Bit
Blender: v2.79 BMW27 CPU
7-Zip 18.03: 7z b 4 | 7z b 4 -mmt1
Geekbench 5.5: Multi-Core | Single-Core
HWBOT x265 Benchmark v2.2: 4k Preset
LibreOffice : 20 Documents To PDF
R Benchmark 2.5: Overall mean
| CPU Performance rating | |
| Média da turma Gaming | |
| MSI GE67 HX 12UGS | |
| Asus ROG Strix Scar 15 G533ZW-LN106WS | |
| Schenker XMG Neo 15 (i7-12700H, RTX 3080 Ti) | |
| MSI Stealth GS66 12UGS | |
| Acer Nitro 5 AN515-58-72QR | |
| Schenker XMG Neo 15 (Ryzen 9 6900HX, RTX 3070 Ti) | |
| Média AMD Ryzen 9 6900HX | |
| Cinebench R23 / Multi Core | |
| Média da turma Gaming (10488 - 42661, n=104, últimos 2 anos) | |
| MSI GE67 HX 12UGS | |
| Asus ROG Strix Scar 15 G533ZW-LN106WS | |
| MSI Stealth GS66 12UGS | |
| Schenker XMG Neo 15 (i7-12700H, RTX 3080 Ti) | |
| Acer Nitro 5 AN515-58-72QR | |
| Schenker XMG Neo 15 (Ryzen 9 6900HX, RTX 3070 Ti) | |
| Média AMD Ryzen 9 6900HX (9709 - 15100, n=19) | |
| Cinebench R23 / Single Core | |
| Média da turma Gaming (1601 - 2415, n=104, últimos 2 anos) | |
| Asus ROG Strix Scar 15 G533ZW-LN106WS | |
| Acer Nitro 5 AN515-58-72QR | |
| MSI GE67 HX 12UGS | |
| Schenker XMG Neo 15 (i7-12700H, RTX 3080 Ti) | |
| MSI Stealth GS66 12UGS | |
| Schenker XMG Neo 15 (Ryzen 9 6900HX, RTX 3070 Ti) | |
| Média AMD Ryzen 9 6900HX (1516 - 1616, n=19) | |
| Cinebench R20 / CPU (Multi Core) | |
| Média da turma Gaming (4029 - 16433, n=103, últimos 2 anos) | |
| MSI GE67 HX 12UGS | |
| Asus ROG Strix Scar 15 G533ZW-LN106WS | |
| Schenker XMG Neo 15 (i7-12700H, RTX 3080 Ti) | |
| MSI Stealth GS66 12UGS | |
| Acer Nitro 5 AN515-58-72QR | |
| Schenker XMG Neo 15 (Ryzen 9 6900HX, RTX 3070 Ti) | |
| Média AMD Ryzen 9 6900HX (3742 - 5813, n=19) | |
| Cinebench R20 / CPU (Single Core) | |
| Média da turma Gaming (622 - 913, n=103, últimos 2 anos) | |
| Asus ROG Strix Scar 15 G533ZW-LN106WS | |
| Acer Nitro 5 AN515-58-72QR | |
| MSI Stealth GS66 12UGS | |
| Schenker XMG Neo 15 (i7-12700H, RTX 3080 Ti) | |
| MSI GE67 HX 12UGS | |
| Schenker XMG Neo 15 (Ryzen 9 6900HX, RTX 3070 Ti) | |
| Média AMD Ryzen 9 6900HX (595 - 631, n=19) | |
| Cinebench R15 / CPU Multi 64Bit | |
| Média da turma Gaming (1578 - 6330, n=102, últimos 2 anos) | |
| MSI GE67 HX 12UGS | |
| Asus ROG Strix Scar 15 G533ZW-LN106WS | |
| MSI Stealth GS66 12UGS | |
| Acer Nitro 5 AN515-58-72QR | |
| Schenker XMG Neo 15 (i7-12700H, RTX 3080 Ti) | |
| Schenker XMG Neo 15 (Ryzen 9 6900HX, RTX 3070 Ti) | |
| Média AMD Ryzen 9 6900HX (1588 - 2411, n=19) | |
| Cinebench R15 / CPU Single 64Bit | |
| Média da turma Gaming (188.8 - 350, n=103, últimos 2 anos) | |
| Asus ROG Strix Scar 15 G533ZW-LN106WS | |
| Acer Nitro 5 AN515-58-72QR | |
| Schenker XMG Neo 15 (i7-12700H, RTX 3080 Ti) | |
| MSI Stealth GS66 12UGS | |
| MSI GE67 HX 12UGS | |
| Schenker XMG Neo 15 (Ryzen 9 6900HX, RTX 3070 Ti) | |
| Média AMD Ryzen 9 6900HX (241 - 261, n=19) | |
| Blender / v2.79 BMW27 CPU | |
| Média AMD Ryzen 9 6900HX (212 - 357, n=21) | |
| Schenker XMG Neo 15 (Ryzen 9 6900HX, RTX 3070 Ti) | |
| Acer Nitro 5 AN515-58-72QR | |
| MSI Stealth GS66 12UGS | |
| Schenker XMG Neo 15 (i7-12700H, RTX 3080 Ti) | |
| Asus ROG Strix Scar 15 G533ZW-LN106WS | |
| MSI GE67 HX 12UGS | |
| Média da turma Gaming (79 - 330, n=101, últimos 2 anos) | |
| 7-Zip 18.03 / 7z b 4 | |
| Média da turma Gaming (33491 - 148086, n=102, últimos 2 anos) | |
| MSI GE67 HX 12UGS | |
| Schenker XMG Neo 15 (i7-12700H, RTX 3080 Ti) | |
| MSI Stealth GS66 12UGS | |
| Asus ROG Strix Scar 15 G533ZW-LN106WS | |
| Schenker XMG Neo 15 (Ryzen 9 6900HX, RTX 3070 Ti) | |
| Média AMD Ryzen 9 6900HX (49526 - 65336, n=20) | |
| Acer Nitro 5 AN515-58-72QR | |
| 7-Zip 18.03 / 7z b 4 -mmt1 | |
| Média da turma Gaming (4824 - 7436, n=102, últimos 2 anos) | |
| Asus ROG Strix Scar 15 G533ZW-LN106WS | |
| Schenker XMG Neo 15 (i7-12700H, RTX 3080 Ti) | |
| Schenker XMG Neo 15 (Ryzen 9 6900HX, RTX 3070 Ti) | |
| Acer Nitro 5 AN515-58-72QR | |
| MSI Stealth GS66 12UGS | |
| Média AMD Ryzen 9 6900HX (5090 - 6070, n=20) | |
| MSI GE67 HX 12UGS | |
| Geekbench 5.5 / Multi-Core | |
| Média da turma Gaming (6460 - 28263, n=102, últimos 2 anos) | |
| MSI GE67 HX 12UGS | |
| Asus ROG Strix Scar 15 G533ZW-LN106WS | |
| Schenker XMG Neo 15 (i7-12700H, RTX 3080 Ti) | |
| MSI Stealth GS66 12UGS | |
| Schenker XMG Neo 15 (Ryzen 9 6900HX, RTX 3070 Ti) | |
| Acer Nitro 5 AN515-58-72QR | |
| Média AMD Ryzen 9 6900HX (8313 - 10490, n=21) | |
| Geekbench 5.5 / Single-Core | |
| Média da turma Gaming (1403 - 2474, n=102, últimos 2 anos) | |
| Asus ROG Strix Scar 15 G533ZW-LN106WS | |
| Acer Nitro 5 AN515-58-72QR | |
| MSI GE67 HX 12UGS | |
| Schenker XMG Neo 15 (i7-12700H, RTX 3080 Ti) | |
| MSI Stealth GS66 12UGS | |
| Schenker XMG Neo 15 (Ryzen 9 6900HX, RTX 3070 Ti) | |
| Média AMD Ryzen 9 6900HX (1523 - 1652, n=21) | |
| HWBOT x265 Benchmark v2.2 / 4k Preset | |
| Média da turma Gaming (11.5 - 44.4, n=102, últimos 2 anos) | |
| MSI GE67 HX 12UGS | |
| Asus ROG Strix Scar 15 G533ZW-LN106WS | |
| Schenker XMG Neo 15 (i7-12700H, RTX 3080 Ti) | |
| MSI Stealth GS66 12UGS | |
| Acer Nitro 5 AN515-58-72QR | |
| Schenker XMG Neo 15 (Ryzen 9 6900HX, RTX 3070 Ti) | |
| Média AMD Ryzen 9 6900HX (12.6 - 18.7, n=20) | |
| LibreOffice / 20 Documents To PDF | |
| Schenker XMG Neo 15 (Ryzen 9 6900HX, RTX 3070 Ti) | |
| Média AMD Ryzen 9 6900HX (44.8 - 81.7, n=20) | |
| Média da turma Gaming (33.2 - 88.8, n=102, últimos 2 anos) | |
| Schenker XMG Neo 15 (i7-12700H, RTX 3080 Ti) | |
| MSI GE67 HX 12UGS | |
| Acer Nitro 5 AN515-58-72QR | |
| MSI Stealth GS66 12UGS | |
| Asus ROG Strix Scar 15 G533ZW-LN106WS | |
| R Benchmark 2.5 / Overall mean | |
| Schenker XMG Neo 15 (Ryzen 9 6900HX, RTX 3070 Ti) | |
| Média AMD Ryzen 9 6900HX (0.4627 - 0.4974, n=20) | |
| MSI GE67 HX 12UGS | |
| Schenker XMG Neo 15 (i7-12700H, RTX 3080 Ti) | |
| Acer Nitro 5 AN515-58-72QR | |
| MSI Stealth GS66 12UGS | |
| Asus ROG Strix Scar 15 G533ZW-LN106WS | |
| Média da turma Gaming (0.3439 - 0.59, n=102, últimos 2 anos) | |
* ... menor é melhor
AIDA64: FP32 Ray-Trace | FPU Julia | CPU SHA3 | CPU Queen | FPU SinJulia | FPU Mandel | CPU AES | CPU ZLib | FP64 Ray-Trace | CPU PhotoWorxx
| Performance rating | |
| Média da turma Gaming | |
| Média AMD Ryzen 9 6900HX | |
| Schenker XMG Neo 15 (Ryzen 9 6900HX, RTX 3070 Ti) | |
| MSI GE67 HX 12UGS | |
| Asus ROG Strix Scar 15 G533ZW-LN106WS | |
| MSI Stealth GS66 12UGS | |
| Schenker XMG Neo 15 (i7-12700H, RTX 3080 Ti) | |
| Acer Nitro 5 AN515-58-72QR | |
| AIDA64 / FP32 Ray-Trace | |
| Média da turma Gaming (10227 - 85542, n=102, últimos 2 anos) | |
| Schenker XMG Neo 15 (Ryzen 9 6900HX, RTX 3070 Ti) | |
| Média AMD Ryzen 9 6900HX (10950 - 17963, n=20) | |
| MSI GE67 HX 12UGS | |
| Asus ROG Strix Scar 15 G533ZW-LN106WS | |
| Schenker XMG Neo 15 (i7-12700H, RTX 3080 Ti) | |
| MSI Stealth GS66 12UGS | |
| Acer Nitro 5 AN515-58-72QR | |
| AIDA64 / FPU Julia | |
| Média da turma Gaming (51376 - 372155, n=102, últimos 2 anos) | |
| Schenker XMG Neo 15 (Ryzen 9 6900HX, RTX 3070 Ti) | |
| Média AMD Ryzen 9 6900HX (71414 - 110797, n=20) | |
| MSI GE67 HX 12UGS | |
| Asus ROG Strix Scar 15 G533ZW-LN106WS | |
| Schenker XMG Neo 15 (i7-12700H, RTX 3080 Ti) | |
| MSI Stealth GS66 12UGS | |
| Acer Nitro 5 AN515-58-72QR | |
| AIDA64 / CPU SHA3 | |
| Média da turma Gaming (2180 - 10115, n=102, últimos 2 anos) | |
| MSI GE67 HX 12UGS | |
| Schenker XMG Neo 15 (Ryzen 9 6900HX, RTX 3070 Ti) | |
| Asus ROG Strix Scar 15 G533ZW-LN106WS | |
| Média AMD Ryzen 9 6900HX (2471 - 3804, n=20) | |
| Schenker XMG Neo 15 (i7-12700H, RTX 3080 Ti) | |
| MSI Stealth GS66 12UGS | |
| Acer Nitro 5 AN515-58-72QR | |
| AIDA64 / CPU Queen | |
| Média da turma Gaming (49785 - 173351, n=86, últimos 2 anos) | |
| Schenker XMG Neo 15 (Ryzen 9 6900HX, RTX 3070 Ti) | |
| Asus ROG Strix Scar 15 G533ZW-LN106WS | |
| Média AMD Ryzen 9 6900HX (84185 - 107544, n=20) | |
| Acer Nitro 5 AN515-58-72QR | |
| Schenker XMG Neo 15 (i7-12700H, RTX 3080 Ti) | |
| MSI Stealth GS66 12UGS | |
| MSI GE67 HX 12UGS | |
| AIDA64 / FPU SinJulia | |
| Média da turma Gaming (4424 - 33636, n=102, últimos 2 anos) | |
| Schenker XMG Neo 15 (Ryzen 9 6900HX, RTX 3070 Ti) | |
| Média AMD Ryzen 9 6900HX (10970 - 13205, n=20) | |
| MSI GE67 HX 12UGS | |
| Asus ROG Strix Scar 15 G533ZW-LN106WS | |
| Schenker XMG Neo 15 (i7-12700H, RTX 3080 Ti) | |
| Acer Nitro 5 AN515-58-72QR | |
| MSI Stealth GS66 12UGS | |
| AIDA64 / FPU Mandel | |
| Média da turma Gaming (25115 - 196829, n=102, últimos 2 anos) | |
| Schenker XMG Neo 15 (Ryzen 9 6900HX, RTX 3070 Ti) | |
| Média AMD Ryzen 9 6900HX (39164 - 61370, n=20) | |
| MSI GE67 HX 12UGS | |
| Asus ROG Strix Scar 15 G533ZW-LN106WS | |
| Schenker XMG Neo 15 (i7-12700H, RTX 3080 Ti) | |
| MSI Stealth GS66 12UGS | |
| Acer Nitro 5 AN515-58-72QR | |
| AIDA64 / CPU AES | |
| MSI GE67 HX 12UGS | |
| Média AMD Ryzen 9 6900HX (54613 - 142360, n=20) | |
| Média da turma Gaming (39258 - 247074, n=102, últimos 2 anos) | |
| Asus ROG Strix Scar 15 G533ZW-LN106WS | |
| MSI Stealth GS66 12UGS | |
| Schenker XMG Neo 15 (Ryzen 9 6900HX, RTX 3070 Ti) | |
| Schenker XMG Neo 15 (i7-12700H, RTX 3080 Ti) | |
| Acer Nitro 5 AN515-58-72QR | |
| AIDA64 / CPU ZLib | |
| Média da turma Gaming (574 - 2531, n=102, últimos 2 anos) | |
| MSI GE67 HX 12UGS | |
| Asus ROG Strix Scar 15 G533ZW-LN106WS | |
| Schenker XMG Neo 15 (i7-12700H, RTX 3080 Ti) | |
| Acer Nitro 5 AN515-58-72QR | |
| MSI Stealth GS66 12UGS | |
| Média AMD Ryzen 9 6900HX (578 - 911, n=20) | |
| Schenker XMG Neo 15 (Ryzen 9 6900HX, RTX 3070 Ti) | |
| AIDA64 / FP64 Ray-Trace | |
| Média da turma Gaming (5509 - 45446, n=102, últimos 2 anos) | |
| Schenker XMG Neo 15 (Ryzen 9 6900HX, RTX 3070 Ti) | |
| Média AMD Ryzen 9 6900HX (5798 - 9540, n=20) | |
| MSI GE67 HX 12UGS | |
| Asus ROG Strix Scar 15 G533ZW-LN106WS | |
| Schenker XMG Neo 15 (i7-12700H, RTX 3080 Ti) | |
| MSI Stealth GS66 12UGS | |
| Acer Nitro 5 AN515-58-72QR | |
| AIDA64 / CPU PhotoWorxx | |
| Média da turma Gaming (12271 - 89891, n=102, últimos 2 anos) | |
| Schenker XMG Neo 15 (i7-12700H, RTX 3080 Ti) | |
| MSI Stealth GS66 12UGS | |
| Asus ROG Strix Scar 15 G533ZW-LN106WS | |
| MSI GE67 HX 12UGS | |
| Schenker XMG Neo 15 (Ryzen 9 6900HX, RTX 3070 Ti) | |
| Média AMD Ryzen 9 6900HX (26873 - 30604, n=20) | |
| Acer Nitro 5 AN515-58-72QR | |
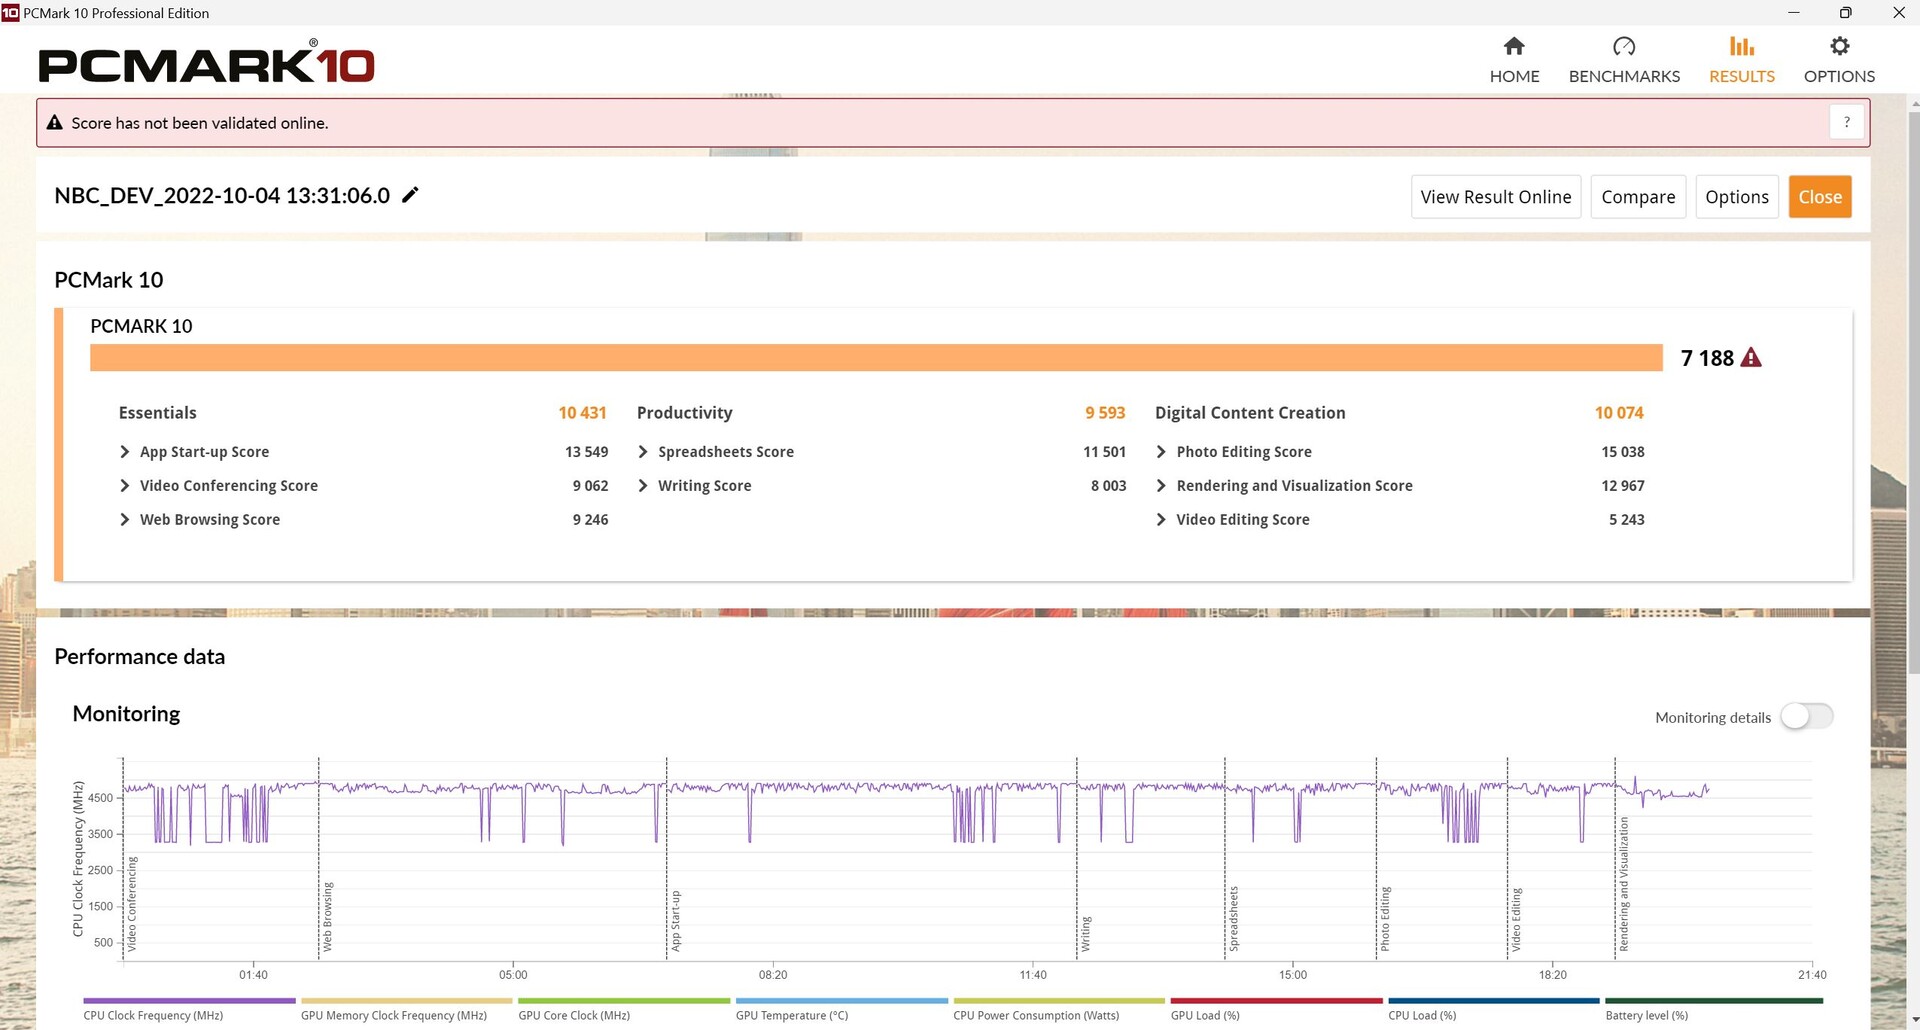
Desempenho do sistema
No PCMark 10, o Neo 15 apresentou resultados que estão mais ou menos de acordo com nossas expectativas. Entretanto, além do vacilante Acer Nitro 5, todos os outros concorrentes foram mais rápidos, especialmente o MSI Raider GE67 e Asus ROG Strix.
CrossMark: Overall | Productivity | Creativity | Responsiveness
| PCMark 10 / Score | |
| Média da turma Gaming (5828 - 12414, n=93, últimos 2 anos) | |
| MSI GE67 HX 12UGS | |
| Asus ROG Strix Scar 15 G533ZW-LN106WS | |
| MSI Stealth GS66 12UGS | |
| Schenker XMG Neo 15 (i7-12700H, RTX 3080 Ti) | |
| Média AMD Ryzen 9 6900HX, NVIDIA GeForce RTX 3070 Ti Laptop GPU (7161 - 7332, n=3) | |
| Schenker XMG Neo 15 (Ryzen 9 6900HX, RTX 3070 Ti) | |
| Acer Nitro 5 AN515-58-72QR | |
| PCMark 10 / Essentials | |
| MSI GE67 HX 12UGS | |
| MSI Stealth GS66 12UGS | |
| Asus ROG Strix Scar 15 G533ZW-LN106WS | |
| Média AMD Ryzen 9 6900HX, NVIDIA GeForce RTX 3070 Ti Laptop GPU (10431 - 10934, n=3) | |
| Média da turma Gaming (8810 - 11935, n=97, últimos 2 anos) | |
| Schenker XMG Neo 15 (i7-12700H, RTX 3080 Ti) | |
| Schenker XMG Neo 15 (Ryzen 9 6900HX, RTX 3070 Ti) | |
| Acer Nitro 5 AN515-58-72QR | |
| PCMark 10 / Productivity | |
| Média da turma Gaming (6845 - 25323, n=95, últimos 2 anos) | |
| Asus ROG Strix Scar 15 G533ZW-LN106WS | |
| MSI GE67 HX 12UGS | |
| Schenker XMG Neo 15 (Ryzen 9 6900HX, RTX 3070 Ti) | |
| Média AMD Ryzen 9 6900HX, NVIDIA GeForce RTX 3070 Ti Laptop GPU (9043 - 9960, n=3) | |
| MSI Stealth GS66 12UGS | |
| Schenker XMG Neo 15 (i7-12700H, RTX 3080 Ti) | |
| Acer Nitro 5 AN515-58-72QR | |
| PCMark 10 / Digital Content Creation | |
| Média da turma Gaming (7602 - 19954, n=95, últimos 2 anos) | |
| MSI GE67 HX 12UGS | |
| Schenker XMG Neo 15 (i7-12700H, RTX 3080 Ti) | |
| Asus ROG Strix Scar 15 G533ZW-LN106WS | |
| MSI Stealth GS66 12UGS | |
| Acer Nitro 5 AN515-58-72QR | |
| Média AMD Ryzen 9 6900HX, NVIDIA GeForce RTX 3070 Ti Laptop GPU (9351 - 10817, n=3) | |
| Schenker XMG Neo 15 (Ryzen 9 6900HX, RTX 3070 Ti) | |
| CrossMark / Overall | |
| Asus ROG Strix Scar 15 G533ZW-LN106WS | |
| Média da turma Gaming (1366 - 2409, n=94, últimos 2 anos) | |
| MSI GE67 HX 12UGS | |
| Schenker XMG Neo 15 (i7-12700H, RTX 3080 Ti) | |
| Acer Nitro 5 AN515-58-72QR | |
| Média AMD Ryzen 9 6900HX, NVIDIA GeForce RTX 3070 Ti Laptop GPU (1624 - 1743, n=2) | |
| Schenker XMG Neo 15 (Ryzen 9 6900HX, RTX 3070 Ti) | |
| CrossMark / Productivity | |
| Asus ROG Strix Scar 15 G533ZW-LN106WS | |
| MSI GE67 HX 12UGS | |
| Média da turma Gaming (1386 - 2254, n=94, últimos 2 anos) | |
| Acer Nitro 5 AN515-58-72QR | |
| Schenker XMG Neo 15 (i7-12700H, RTX 3080 Ti) | |
| Média AMD Ryzen 9 6900HX, NVIDIA GeForce RTX 3070 Ti Laptop GPU (1591 - 1722, n=2) | |
| Schenker XMG Neo 15 (Ryzen 9 6900HX, RTX 3070 Ti) | |
| CrossMark / Creativity | |
| Média da turma Gaming (1343 - 2786, n=94, últimos 2 anos) | |
| Asus ROG Strix Scar 15 G533ZW-LN106WS | |
| MSI GE67 HX 12UGS | |
| Schenker XMG Neo 15 (i7-12700H, RTX 3080 Ti) | |
| Acer Nitro 5 AN515-58-72QR | |
| Média AMD Ryzen 9 6900HX, NVIDIA GeForce RTX 3070 Ti Laptop GPU (1749 - 1809, n=2) | |
| Schenker XMG Neo 15 (Ryzen 9 6900HX, RTX 3070 Ti) | |
| CrossMark / Responsiveness | |
| Asus ROG Strix Scar 15 G533ZW-LN106WS | |
| MSI GE67 HX 12UGS | |
| Média da turma Gaming (1226 - 2334, n=94, últimos 2 anos) | |
| Acer Nitro 5 AN515-58-72QR | |
| Schenker XMG Neo 15 (i7-12700H, RTX 3080 Ti) | |
| Média AMD Ryzen 9 6900HX, NVIDIA GeForce RTX 3070 Ti Laptop GPU (1382 - 1615, n=2) | |
| Schenker XMG Neo 15 (Ryzen 9 6900HX, RTX 3070 Ti) | |
| PCMark 10 Score | 7188 pontos | |
Ajuda | ||
| AIDA64 / Memory Copy | |
| Média da turma Gaming (21750 - 129946, n=102, últimos 2 anos) | |
| Schenker XMG Neo 15 (i7-12700H, RTX 3080 Ti) | |
| MSI Stealth GS66 12UGS | |
| Asus ROG Strix Scar 15 G533ZW-LN106WS | |
| Média AMD Ryzen 9 6900HX (47938 - 53345, n=20) | |
| Schenker XMG Neo 15 (Ryzen 9 6900HX, RTX 3070 Ti) | |
| MSI GE67 HX 12UGS | |
| Acer Nitro 5 AN515-58-72QR | |
| AIDA64 / Memory Read | |
| Média da turma Gaming (22956 - 118858, n=102, últimos 2 anos) | |
| Schenker XMG Neo 15 (i7-12700H, RTX 3080 Ti) | |
| MSI Stealth GS66 12UGS | |
| Asus ROG Strix Scar 15 G533ZW-LN106WS | |
| MSI GE67 HX 12UGS | |
| Schenker XMG Neo 15 (Ryzen 9 6900HX, RTX 3070 Ti) | |
| Média AMD Ryzen 9 6900HX (43892 - 53321, n=20) | |
| Acer Nitro 5 AN515-58-72QR | |
| AIDA64 / Memory Write | |
| Média da turma Gaming (22297 - 135096, n=102, últimos 2 anos) | |
| MSI Stealth GS66 12UGS | |
| Schenker XMG Neo 15 (i7-12700H, RTX 3080 Ti) | |
| Asus ROG Strix Scar 15 G533ZW-LN106WS | |
| MSI GE67 HX 12UGS | |
| Schenker XMG Neo 15 (Ryzen 9 6900HX, RTX 3070 Ti) | |
| Média AMD Ryzen 9 6900HX (51085 - 57202, n=20) | |
| Acer Nitro 5 AN515-58-72QR | |
| AIDA64 / Memory Latency | |
| Média da turma Gaming (75.3 - 165.4, n=102, últimos 2 anos) | |
| Asus ROG Strix Scar 15 G533ZW-LN106WS | |
| MSI GE67 HX 12UGS | |
| MSI Stealth GS66 12UGS | |
| Schenker XMG Neo 15 (Ryzen 9 6900HX, RTX 3070 Ti) | |
| Média AMD Ryzen 9 6900HX (80.7 - 120.6, n=20) | |
| Acer Nitro 5 AN515-58-72QR | |
| Acer Nitro 5 AN515-58-72QR | |
* ... menor é melhor
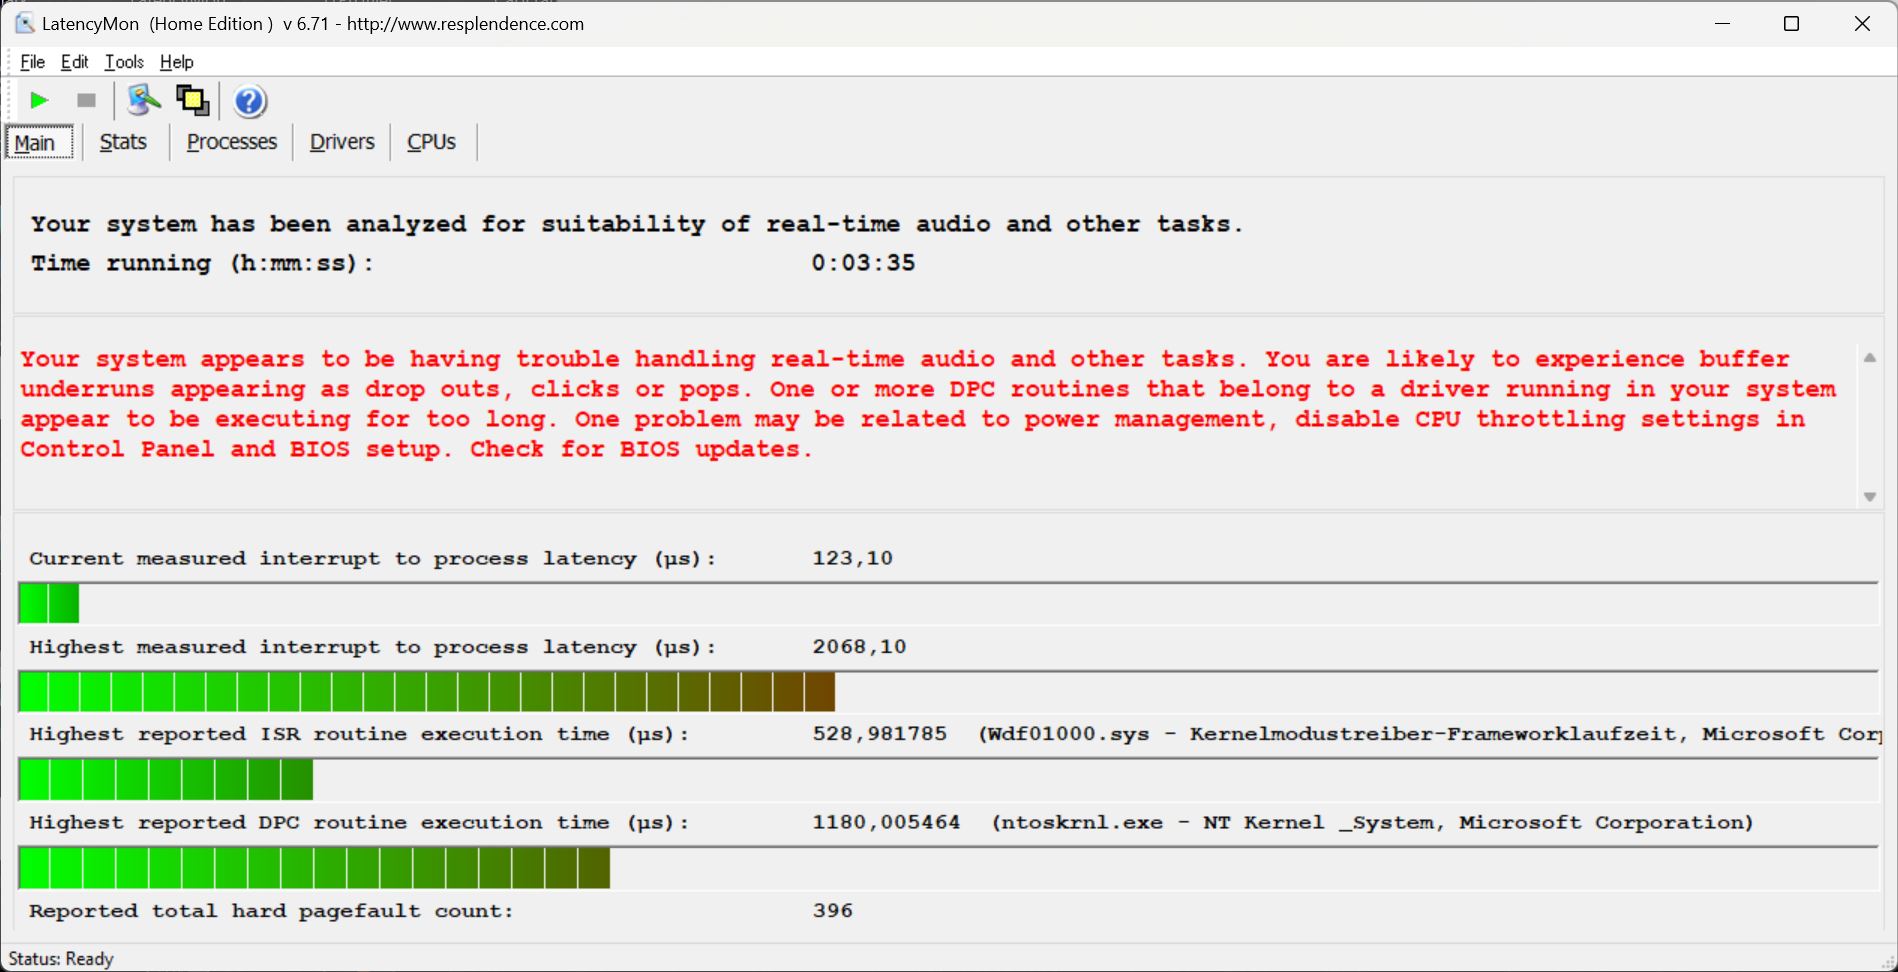
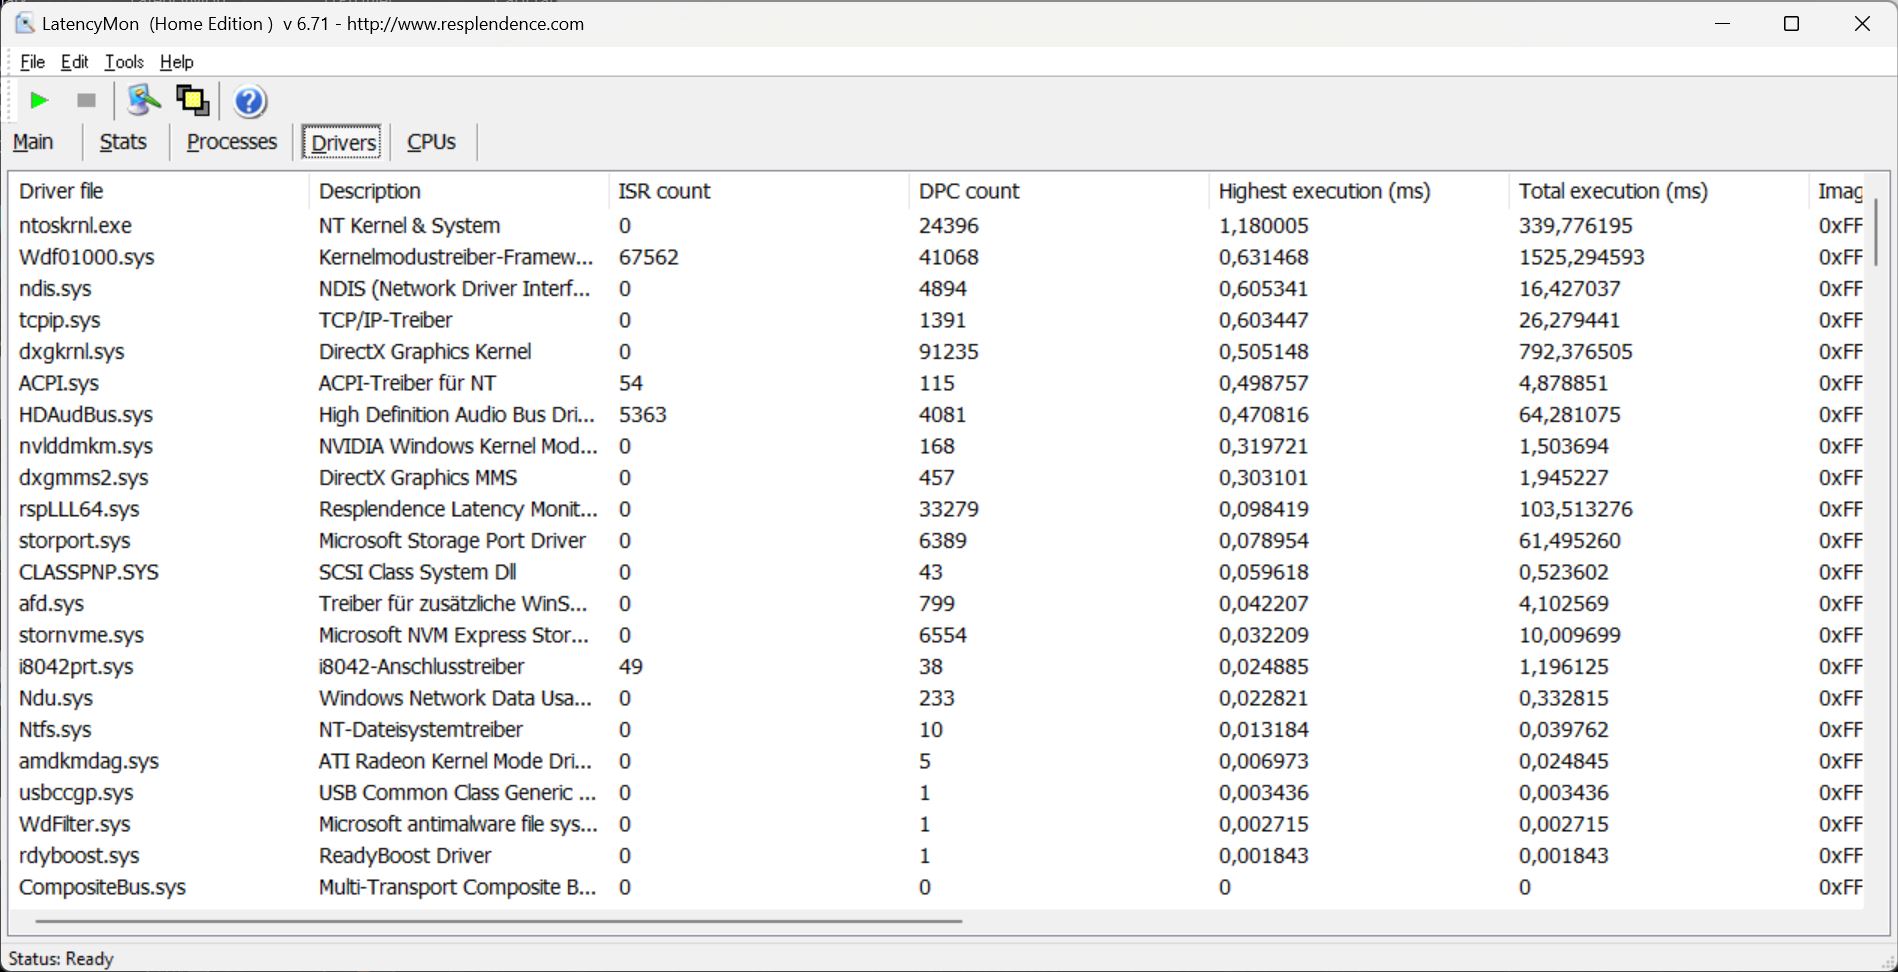
Latência do DPC
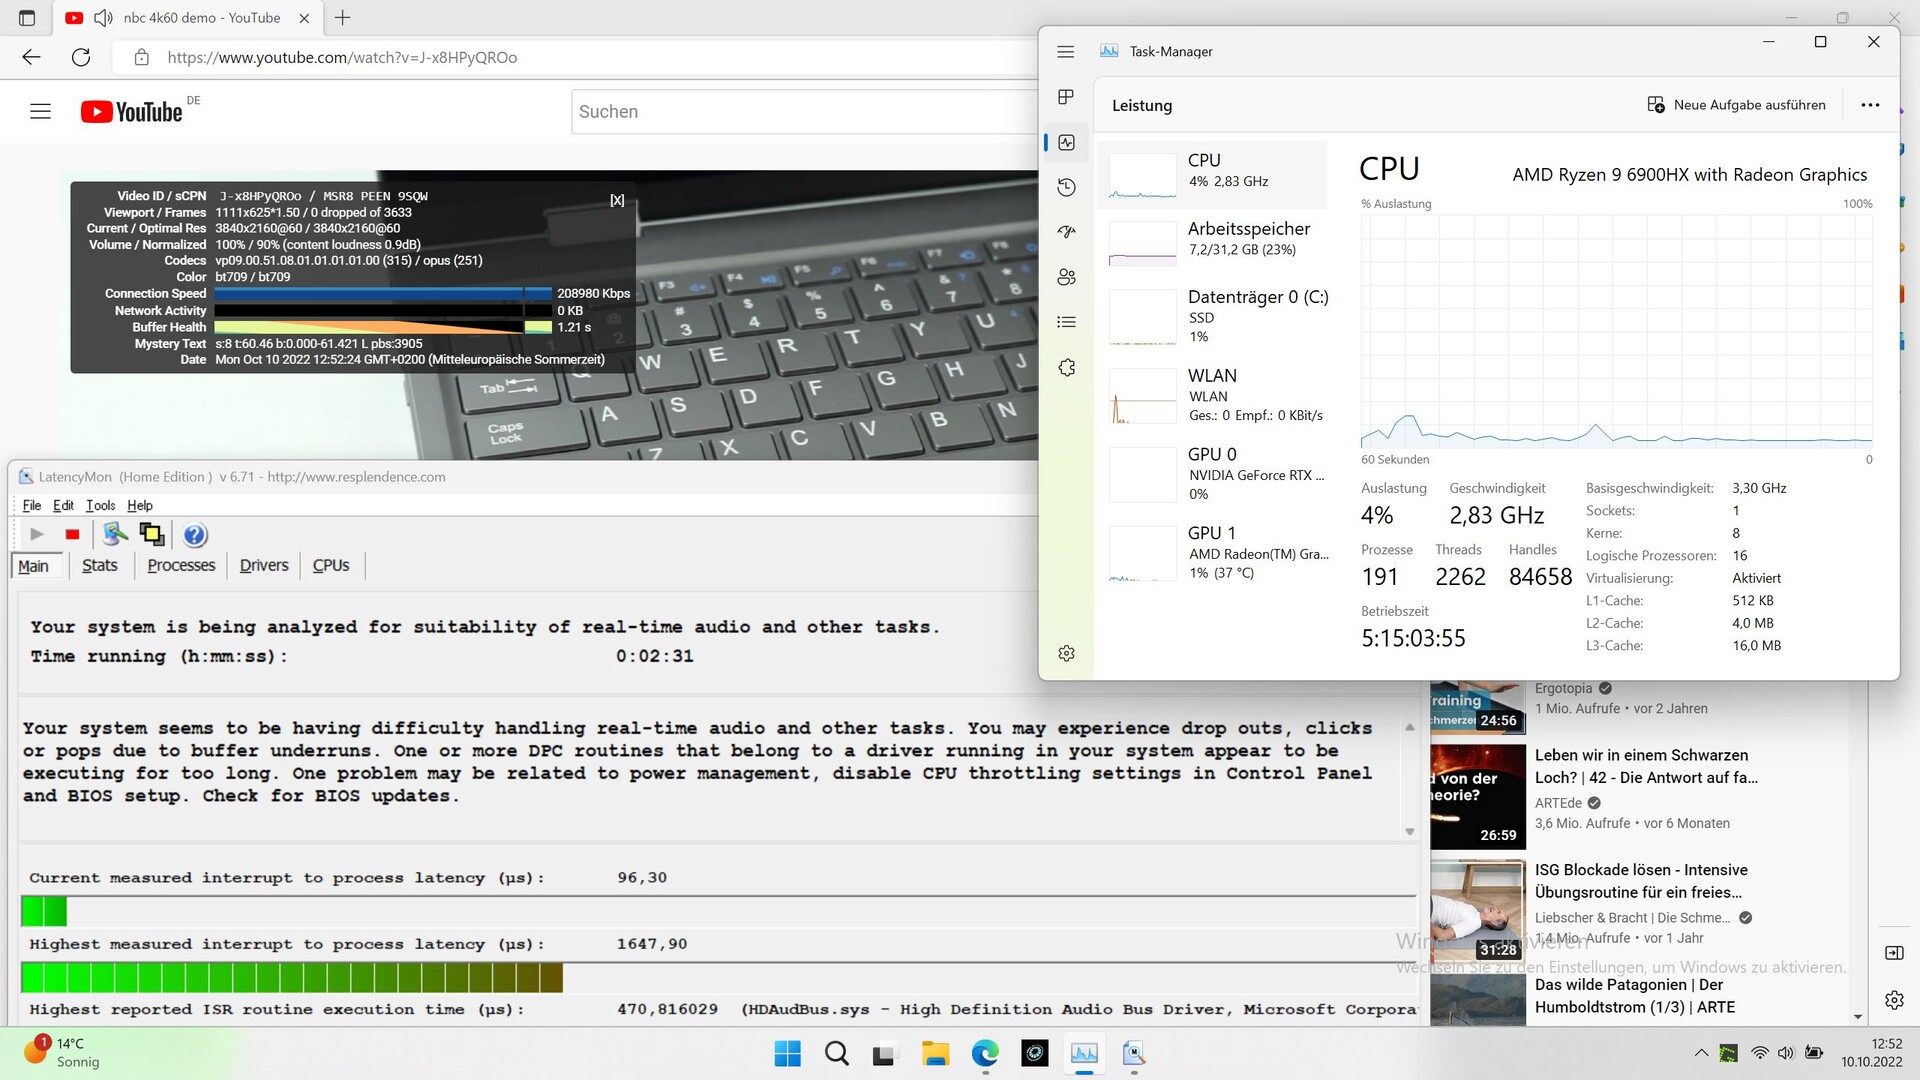
Encontramos os primeiros problemas de DPC após abrir várias abas do navegador em nossa página inicial. A latência aumentou durante a reprodução de nossos vídeos 4K no YouTube a 60 FPS. Suspeita-se que os drivers do Kernel sejam a principal causa deste problema.
Mas pelo menos não houve queda de quadros e o uso da CPU/GPU é muito baixo durante a reprodução do vídeo de teste.
| DPC Latencies / LatencyMon - interrupt to process latency (max), Web, Youtube, Prime95 | |
| Schenker XMG Neo 15 (i7-12700H, RTX 3080 Ti) | |
| MSI Stealth GS66 12UGS | |
| Schenker XMG Neo 15 (Ryzen 9 6900HX, RTX 3070 Ti) | |
| MSI GE67 HX 12UGS | |
| Asus ROG Strix Scar 15 G533ZW-LN106WS | |
| Acer Nitro 5 AN515-58-72QR | |
* ... menor é melhor
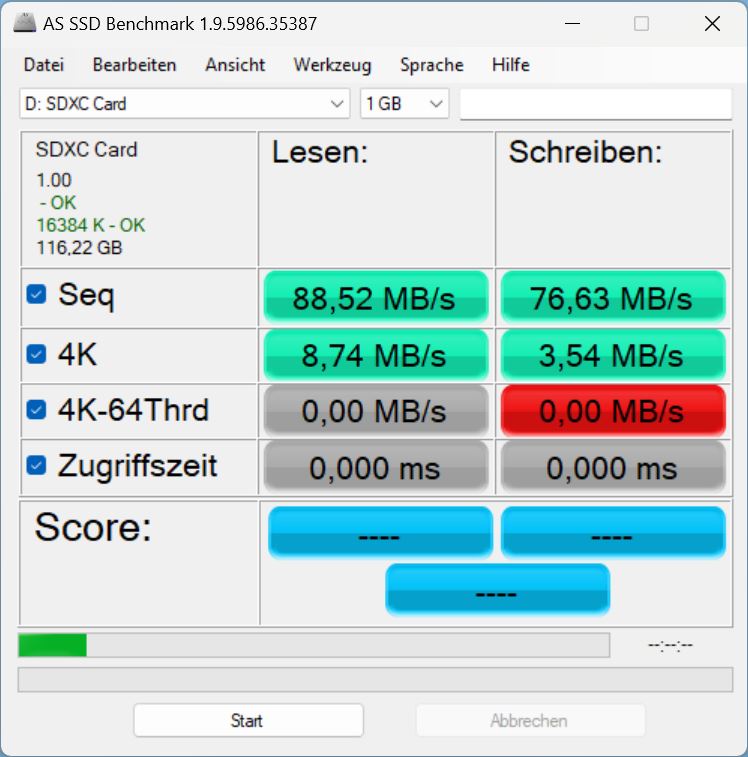
Armazenamento em massa
O Neo 15 pode ser configurado com incontáveis opções de SSD. Nossa unidade de análise apresenta um Samsung 980 Pro SSD de 1 TB, que está atualmente em 12º lugar em nossa lista de referência SSD/HDD. O acionamento é capaz de manter seu grande desempenho mesmo durante um período prolongado.

* ... menor é melhor
Sustained Load Read: DiskSpd Read Loop, Queue Depth 8
Placa gráfica
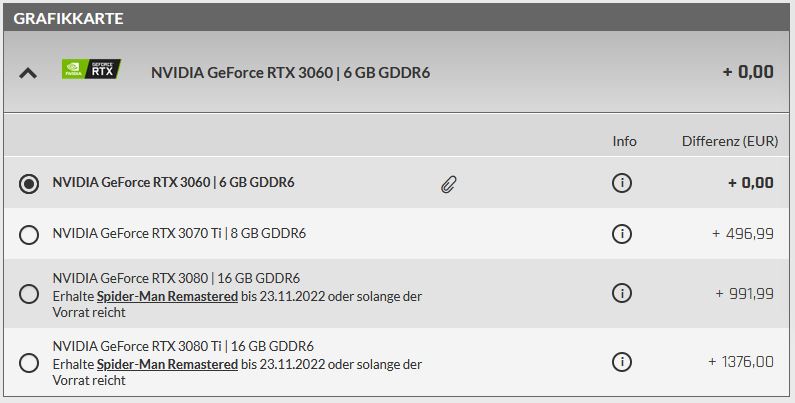
Nossa unidade de revisão tem um GeForce RTX 3070 Ti com uma meta TGP de 150 watts, incluindo o Dynamic Boost. Estes valores podem ser ajustados manualmente no Centro de Controle. Alternativamente, você pode obter o Neo 15 com vários GPUs que vão desde um RTX 3060 para RTX 3080 Ti.
Assim como esperávamos, a GPU na unidade de revisão teve uma pontuação 5 a 10% melhor do que uma média RTX 3070 Ti. O MSI GE67 é o único dispositivo na comparação que é significativamente mais rápido. Embora o Strix Scar muitas vezes com pontuação melhor que o Neo, os diferenciais de desempenho são na maioria das vezes insignificantes, em cerca de 2%.
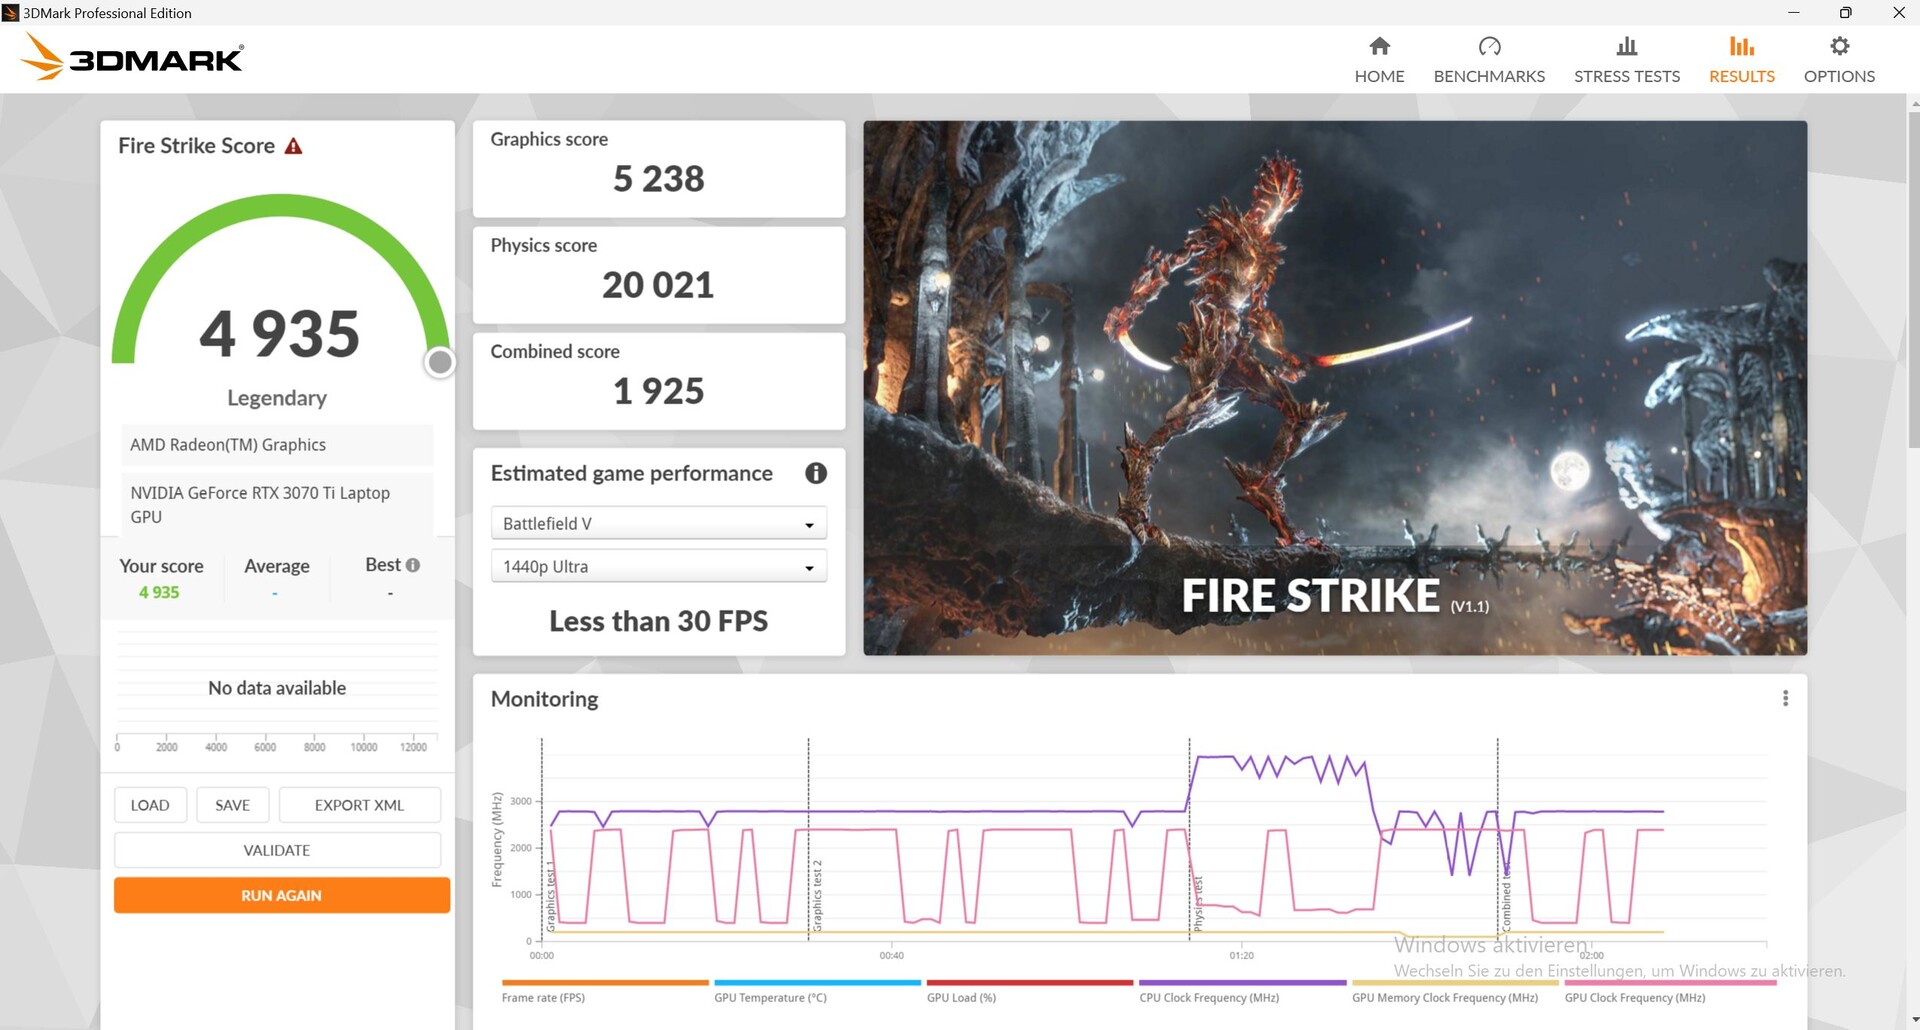
O Neo 15 perde uma enorme quantidade de desempenho 3D quando funciona com bateria. Por exemplo, quando desligamos o laptop e rodamos Fire Strike novamente, a pontuação física e gráfica era de apenas 20.021 e 5.238 respectivamente, ao invés dos 26.338 e 28.105 obtidos quando o Neo foi conectado à rede elétrica.
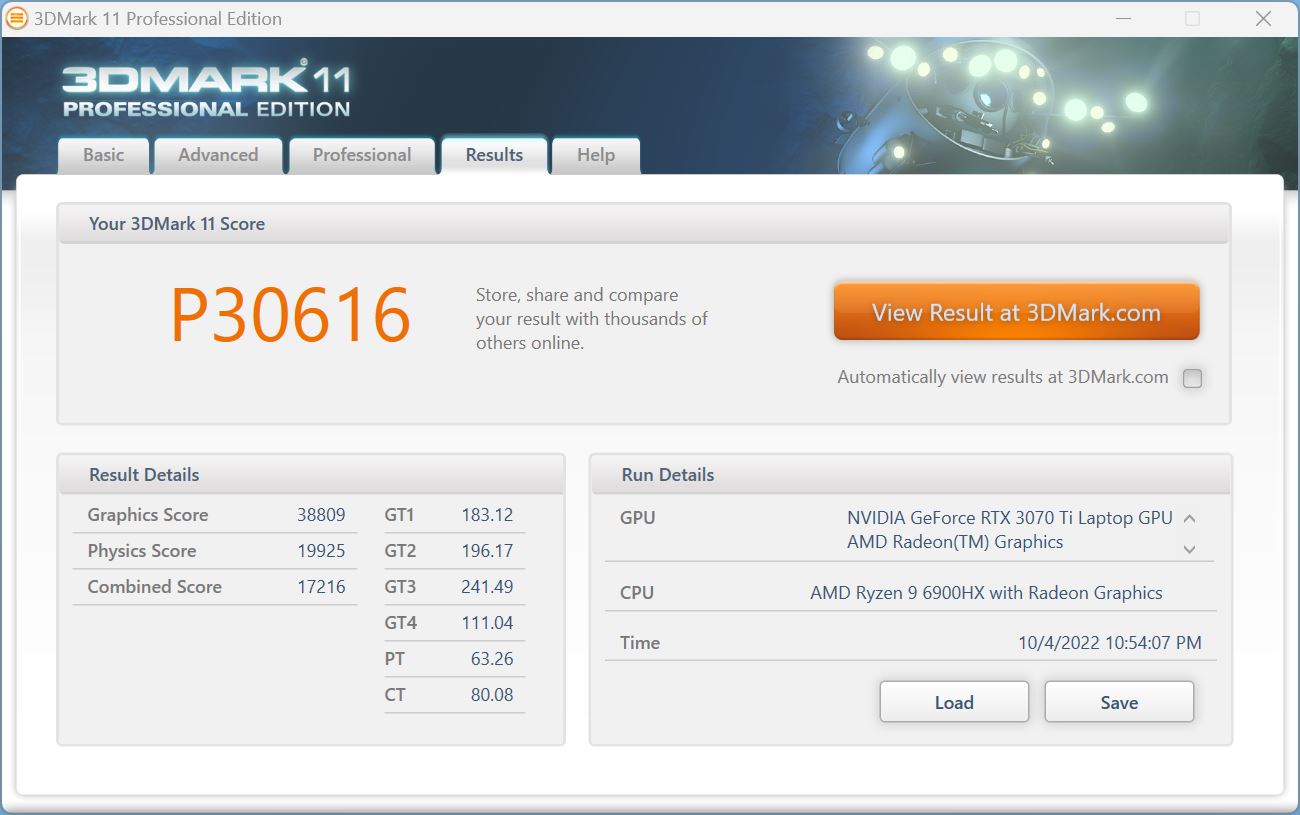

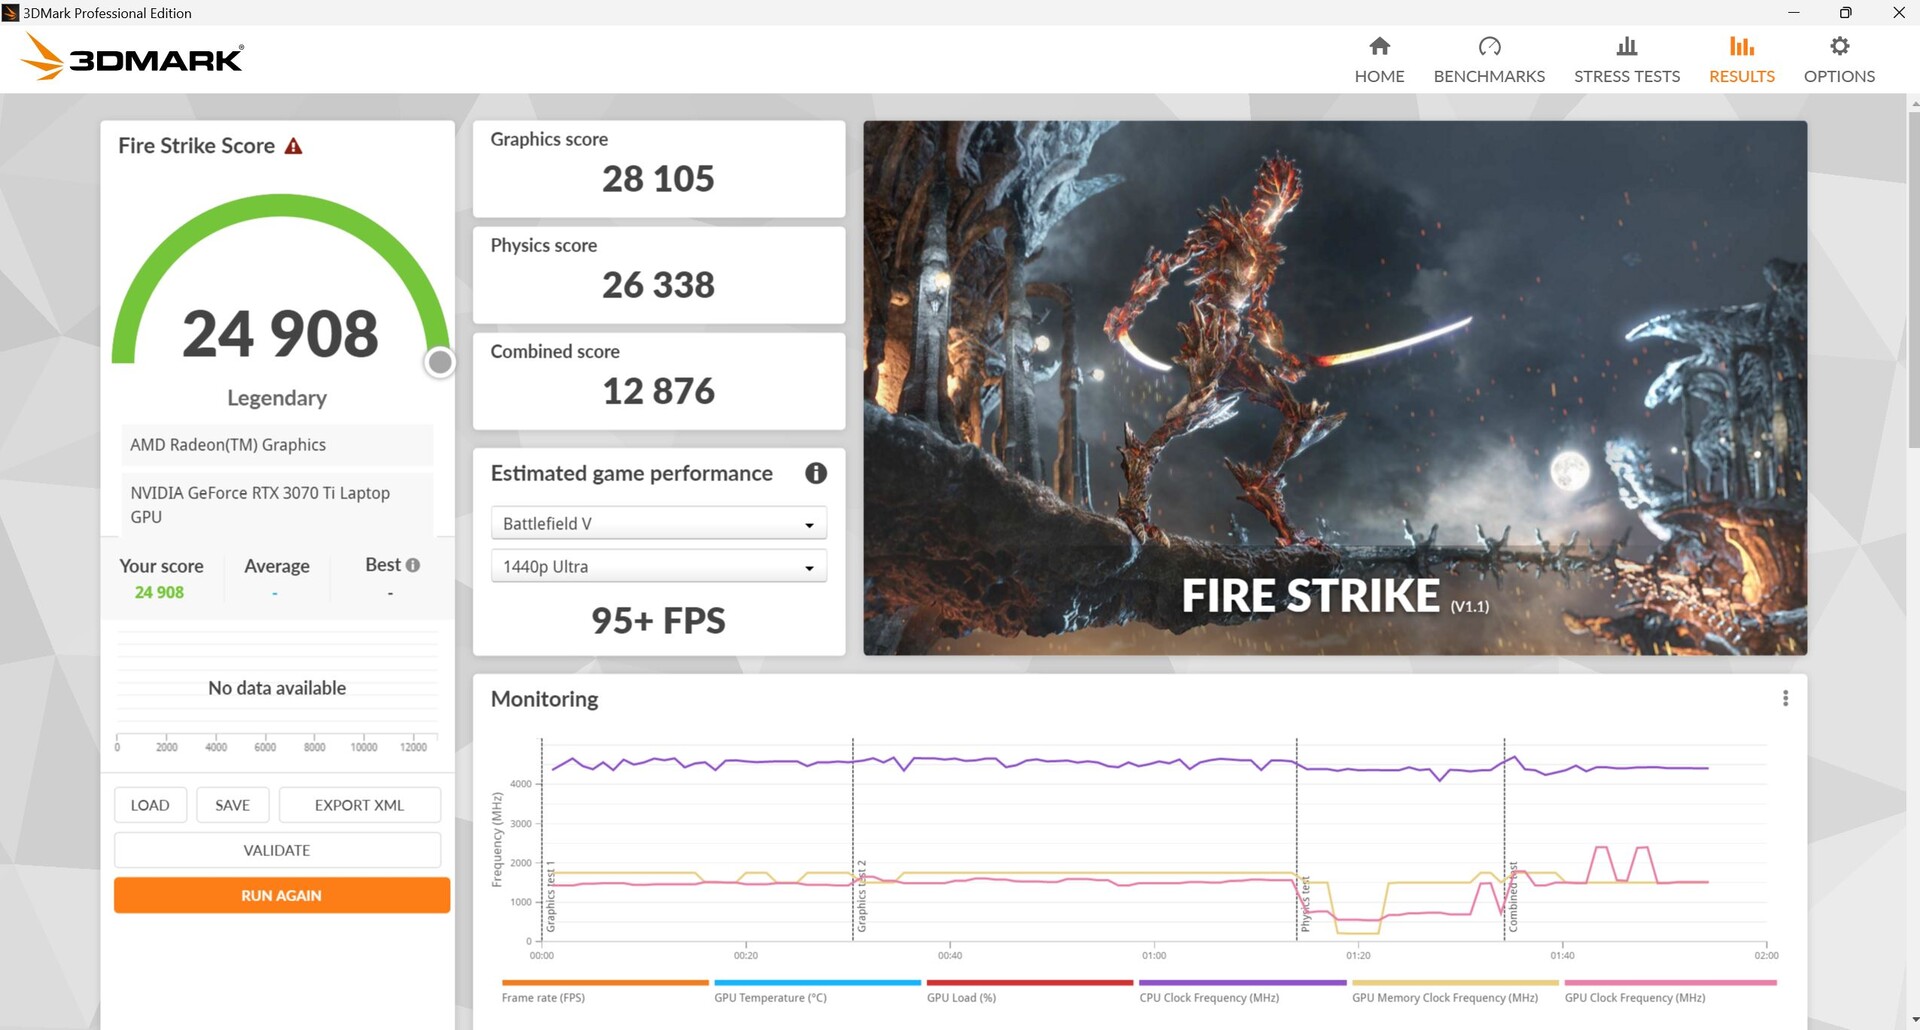
| 3DMark 11 Performance | 30616 pontos | |
| 3DMark Cloud Gate Standard Score | 57616 pontos | |
| 3DMark Fire Strike Score | 24908 pontos | |
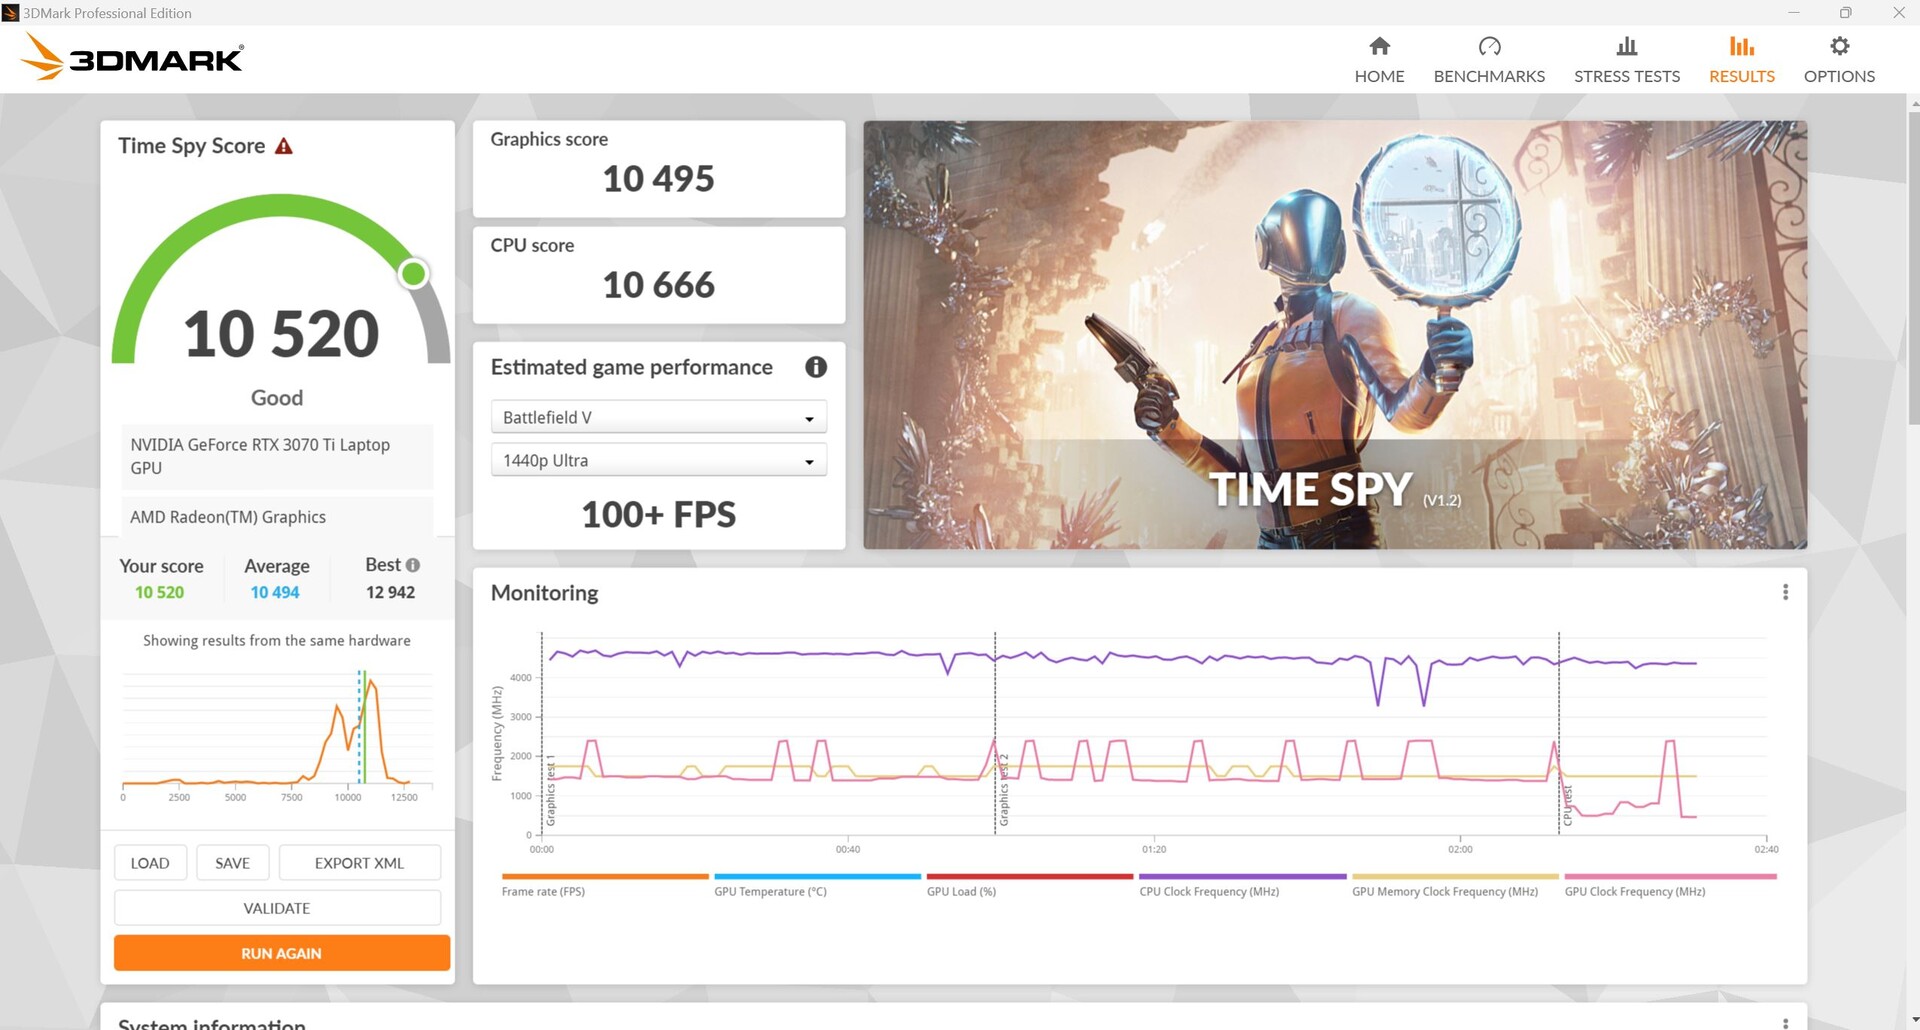
| 3DMark Time Spy Score | 10520 pontos | |
Ajuda | ||
* ... menor é melhor
Desempenho do jogo
O Neo 15 é essencialmente capaz de executar todos os jogos testados sem problemas, mesmo com resolução QHD e ajustes máximos. O laptop só começa a ter alguns problemas quando as configurações de traçado de raio estão definidas para alto em jogos como o Dying Light 2 (35 FPS).
Na comparação, os resultados dos testes de jogo pintam um quadro semelhante aos do 3DMark: A GPU no Neo teve um desempenho em grande parte (mas nem sempre) melhor do que uma média RTX 3070 Ti. Dito isto, o Asus ROG Strix Scar e particularmente o MSI GE67 foram mais rápidos do que o Neo.
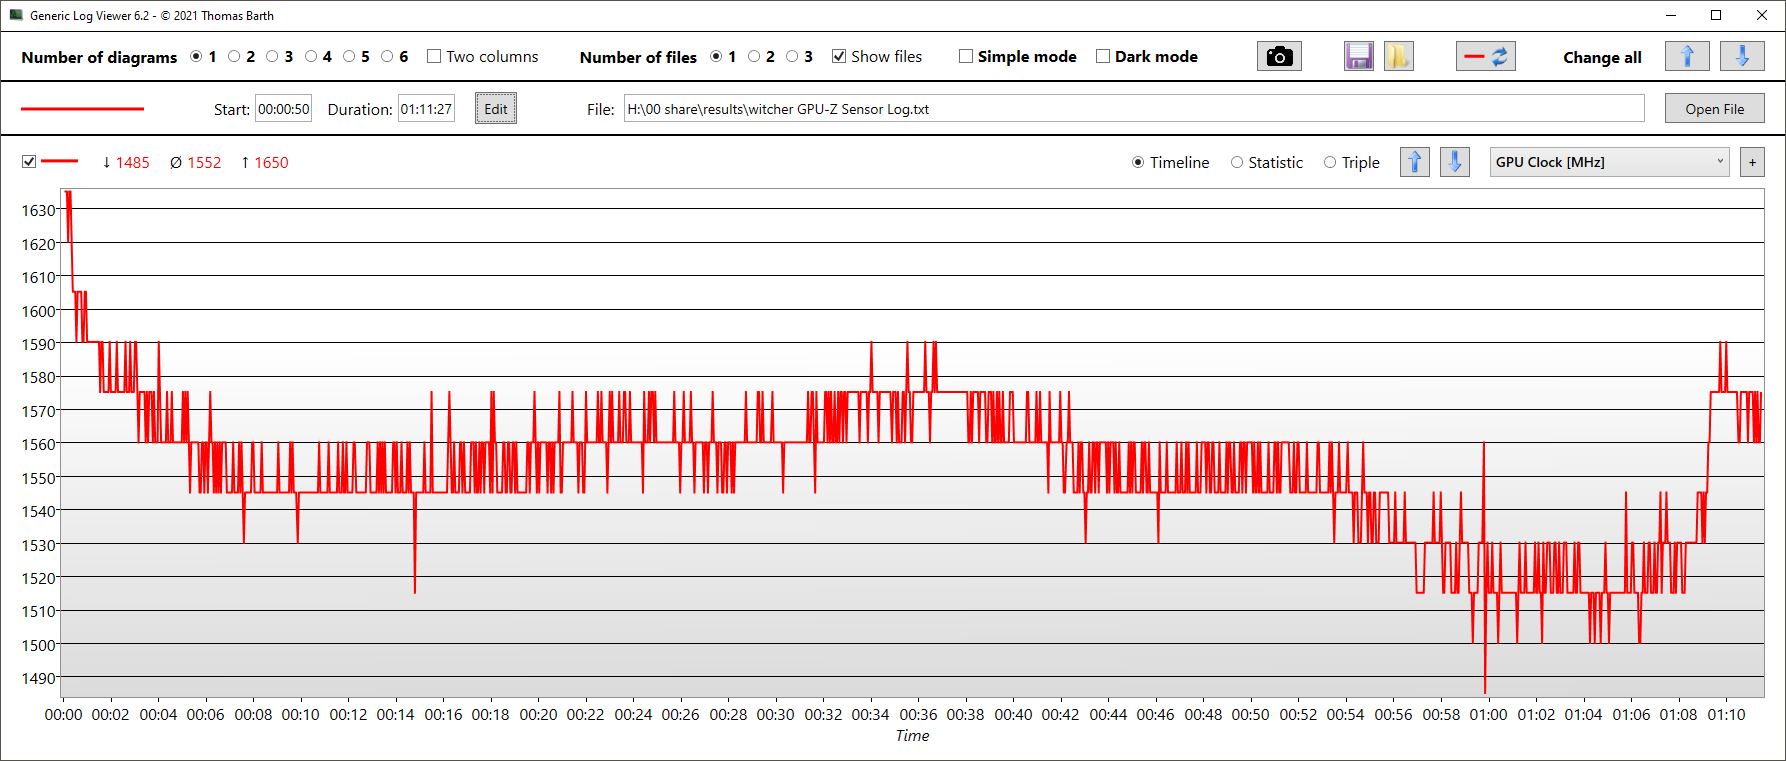
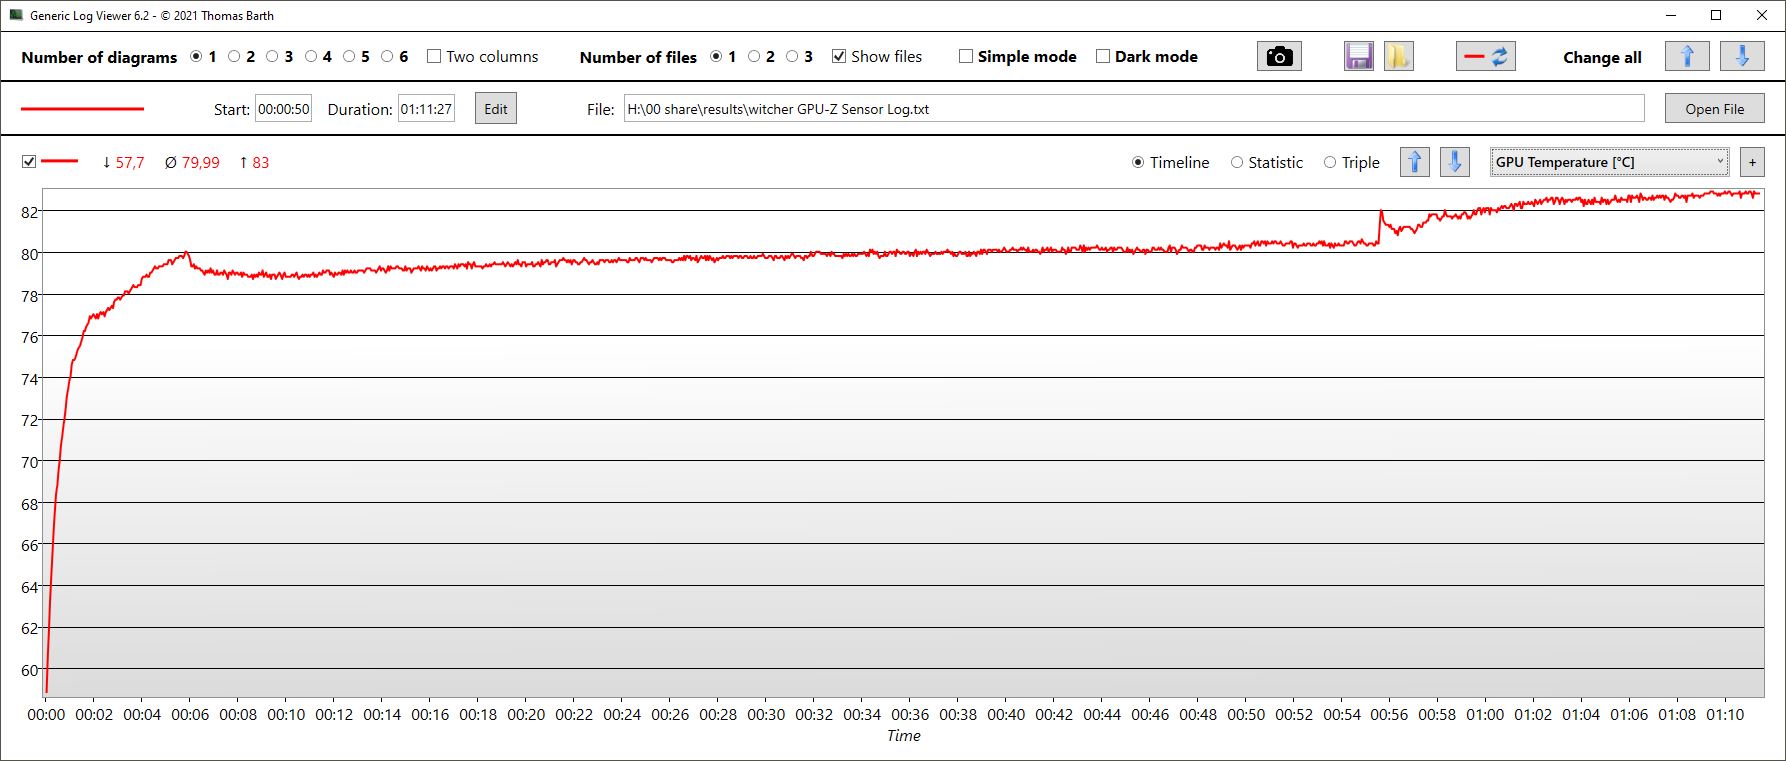
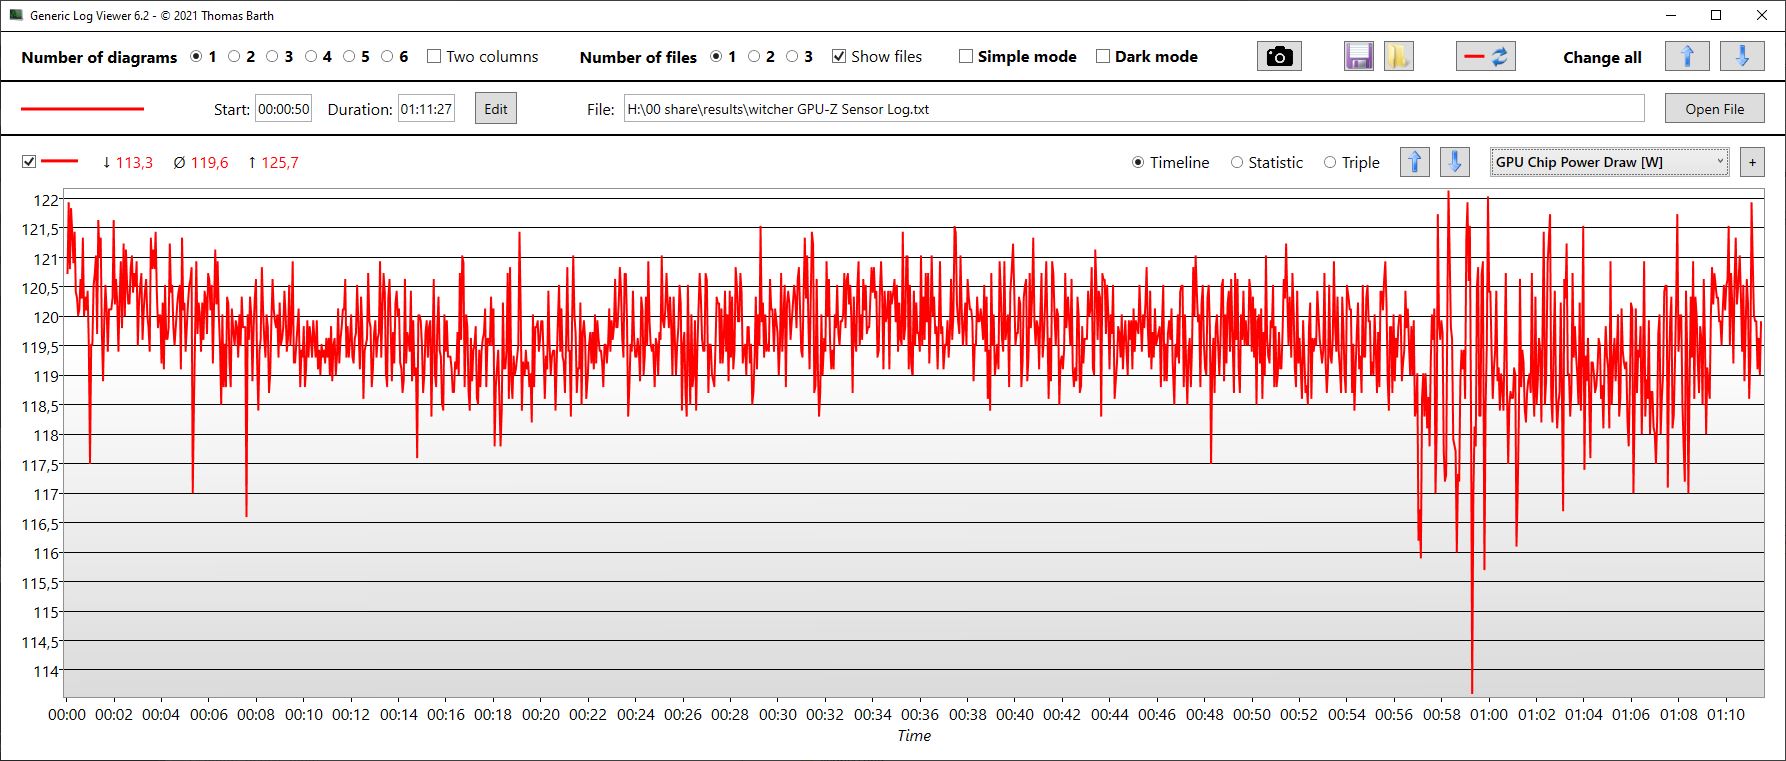
No site Witcher 3, as taxas de moldura eram, em sua maioria, estáveis. Mas notamos que a temperatura da GPU (registrada em paralelo) continuou a aumentar ao longo da duração do teste e não se estabilizou realmente. Isto indica que a GPU pode começar a sofrer estrangulamento térmico depois de correr jogos exigentes por muito tempo, embora isto não tenha acontecido durante o teste de uma hora. O consumo de energia da GPU foi de 120 watts em média.
Na comparação, mesmo o Neo baseado em Intel com um RTX 3080 Ti não foi substancialmente mais rápido com as mesmas configurações. De modo geral, a GPU extremamente cara do Neo baseado em Intel dificilmente justifica seu alto preço com os ganhos de performance que proporciona. Dependendo do jogo e das configurações, tinha apenas uma vantagem de cerca de 1 a 25%.
Witcher 3 FPS chart
| baixo | média | alto | ultra | QHD | |
|---|---|---|---|---|---|
| GTA V (2015) | 176.6 | 170.3 | 156.2 | 97.6 | 93 |
| The Witcher 3 (2015) | 195 | 110 | |||
| Dota 2 Reborn (2015) | 135.9 | 123.1 | 116.3 | 114.1 | |
| X-Plane 11.11 (2018) | 109.5 | 94.9 | 77.6 | ||
| Far Cry 5 (2018) | 119 | 110 | 102 | ||
| Strange Brigade (2018) | 305 | 224 | 206 | 189 | 143 |
| Dying Light 2 (2022) | 82.5 | 59 |
Emissões - Mais frio do que o Intel Neo em inatividade
Emissões sonoras
Embora o laptop não tenha um modo silencioso, os ventiladores internos muitas vezes não estão girando em modo ocioso. É interessante que, apesar de ter uma GPU mais fraca, o Neo baseado em AMD não fica tão silencioso sob carga quanto seu homólogo baseado em Intel. Entre os concorrentes, apenas o Acer Nitro 5 é um pouco mais silencioso. Mas também é menos performante do que o Neo.
Quando os ventiladores estão inativos, há um ruído sonoro suave, mas de grande intensidade, vindo do chassi. Embora este ruído não seja audível quando os ventiladores estão funcionando, ele ainda é irritante em um ambiente silencioso.
Barulho
| Ocioso |
| 23 / 25.82 / 27.3 dB |
| Carga |
| 42.7 / 56 dB |
 | ||
30 dB silencioso 40 dB(A) audível 50 dB(A) ruidosamente alto |
||
min: | ||
| Schenker XMG Neo 15 (Ryzen 9 6900HX, RTX 3070 Ti) GeForce RTX 3070 Ti Laptop GPU, R9 6900HX, Samsung SSD 980 Pro 1TB MZ-V8P1T0BW | Schenker XMG Neo 15 (i7-12700H, RTX 3080 Ti) GeForce RTX 3080 Ti Laptop GPU, i7-12700H, Samsung SSD 980 Pro 1TB MZ-V8P1T0BW | MSI GE67 HX 12UGS GeForce RTX 3070 Ti Laptop GPU, i7-12800HX, Samsung PM9A1 MZVL21T0HCLR | Asus ROG Strix Scar 15 G533ZW-LN106WS GeForce RTX 3070 Ti Laptop GPU, i9-12900H, Samsung PM9A1 MZVL22T0HBLB | Acer Nitro 5 AN515-58-72QR GeForce RTX 3070 Ti Laptop GPU, i7-12700H, Samsung PM9A1 MZVL21T0HCLR | MSI Stealth GS66 12UGS GeForce RTX 3070 Ti Laptop GPU, i7-12700H, WDC PC SN810 1TB | |
|---|---|---|---|---|---|---|
| Noise | -1% | 3% | -30% | -8% | -9% | |
| desligado / ambiente * (dB) | 23 | 23 -0% | 22.7 1% | 26.86 -17% | 26 -13% | 24 -4% |
| Idle Minimum * (dB) | 23 | 23 -0% | 22.9 -0% | 39.07 -70% | 26 -13% | 31 -35% |
| Idle Average * (dB) | 25.82 | 26.39 -2% | 22.9 11% | 39.07 -51% | 29 -12% | 32 -24% |
| Idle Maximum * (dB) | 27.3 | 26.39 3% | 22.9 16% | 39.07 -43% | 33 -21% | 35 -28% |
| Load Average * (dB) | 42.7 | 45.52 -7% | 44.4 -4% | 53.34 -25% | 47 -10% | 48 -12% |
| Witcher 3 ultra * (dB) | 56 | 55.89 -0% | 55.7 1% | 56.6 -1% | 53 5% | 43 23% |
| Load Maximum * (dB) | 56 | 55.89 -0% | 57.4 -2% | 56.6 -1% | 53 5% | 48 14% |
* ... menor é melhor
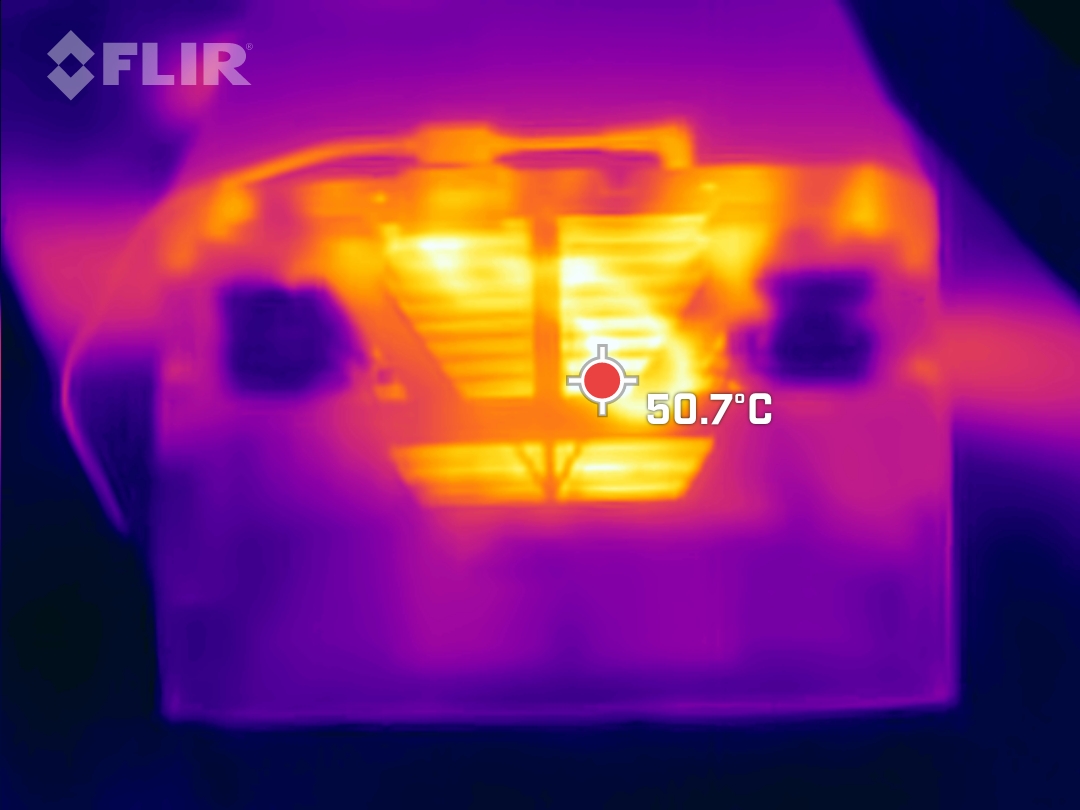
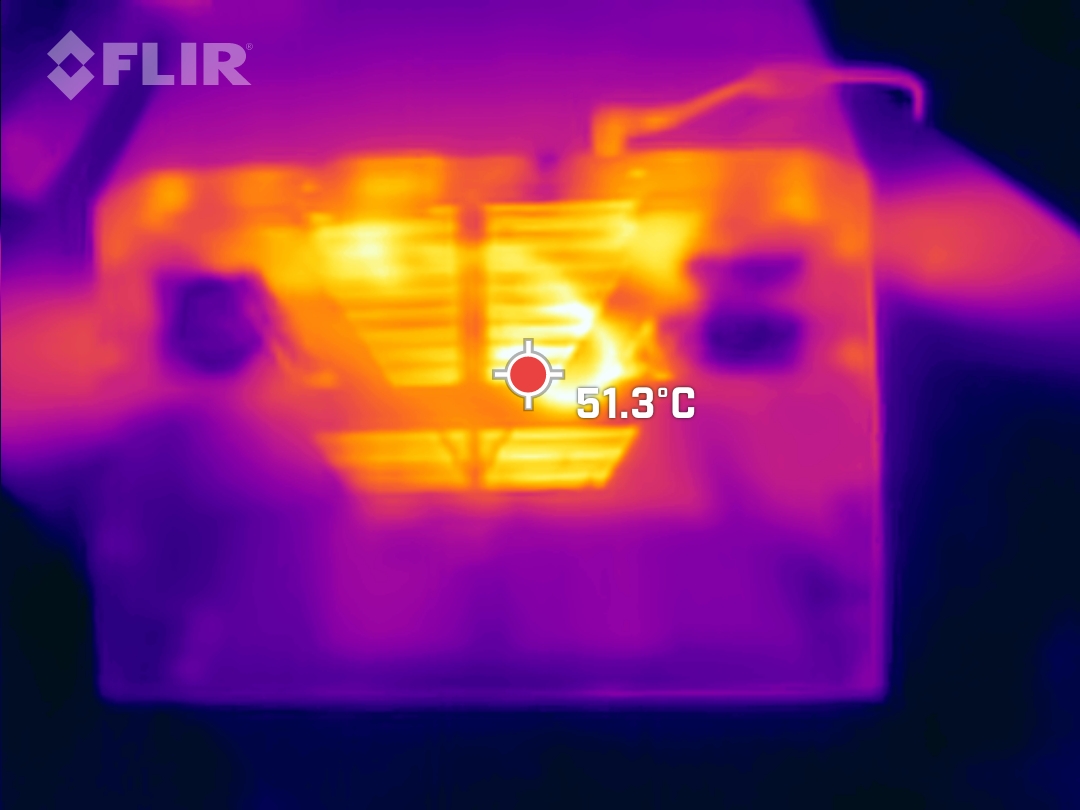
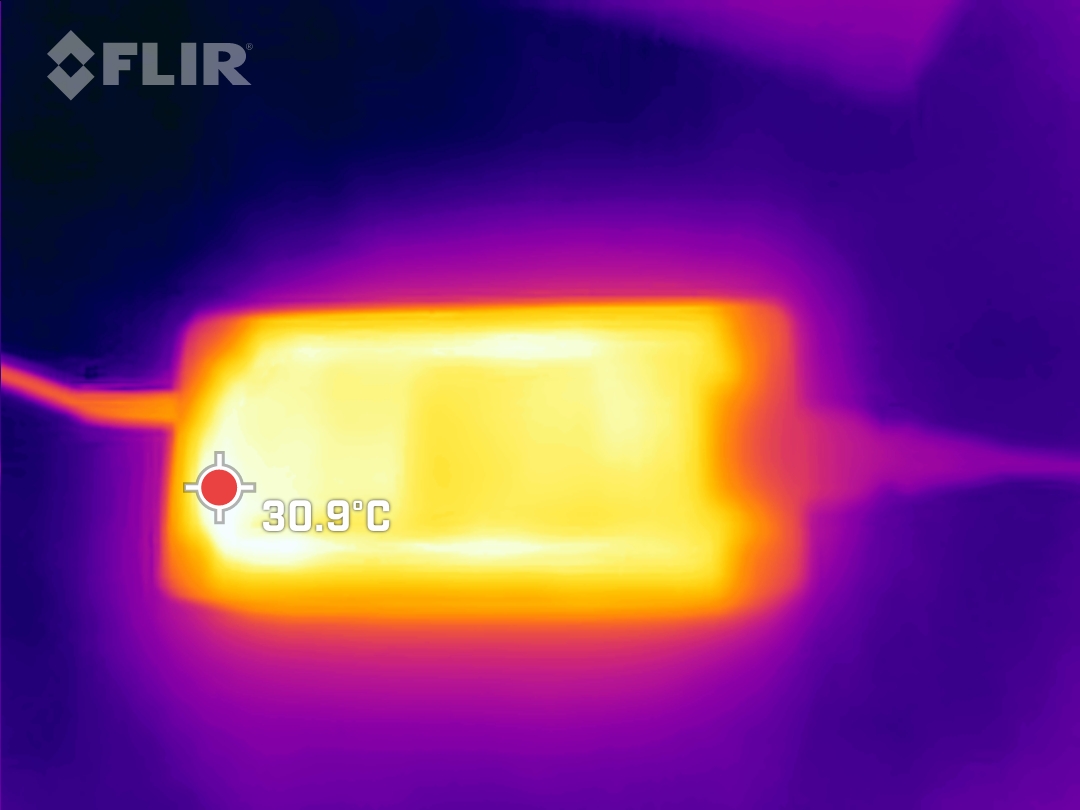
Temperatura
Em modo ocioso, as temperaturas da caixa permanecem mais confortáveis do que no Neo com RTX 3080 Ti baseado em Intel. No entanto, esta vantagem desaparece praticamente sob carga. Os outros dispositivos do grupo de comparação podem ficar tão quentes quanto o Neo. Mas de todas as coisas, é o MSI GE67 de alto desempenho, mas ligeiramente mais volumoso, que funciona mais frio do que os outros laptops de jogos.
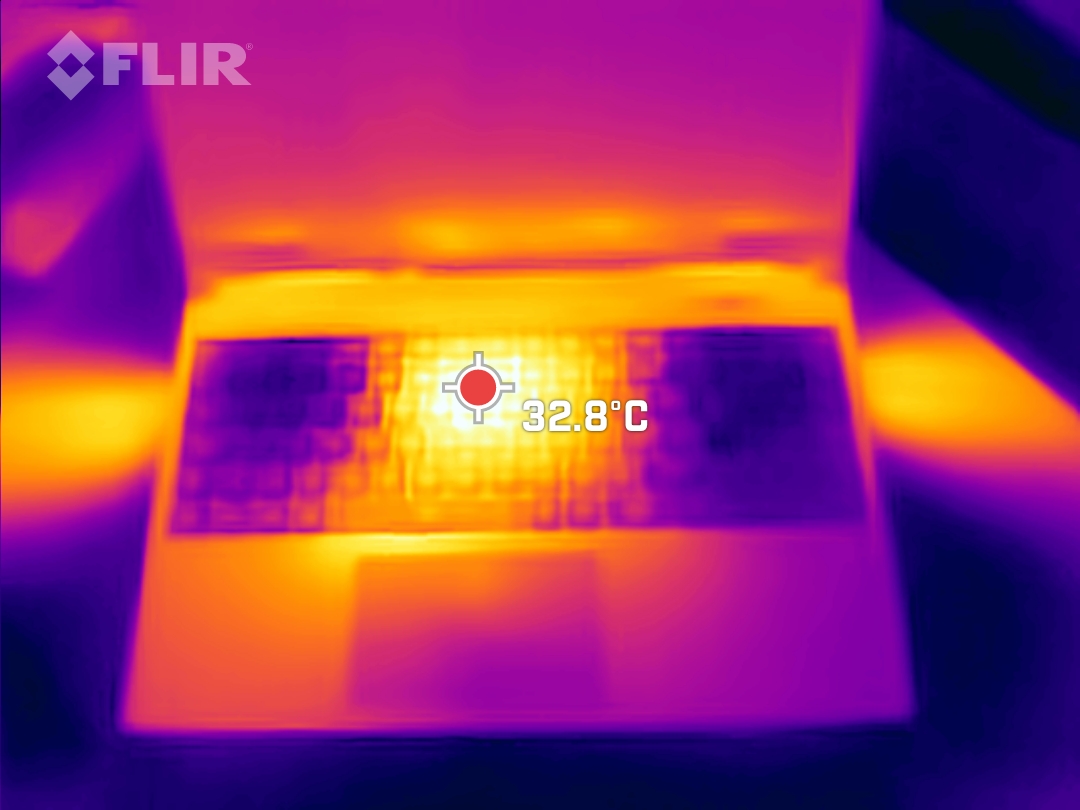
Os descansos da palma da mão nunca se tornam desagradavelmente quentes, e o mesmo vale para as chaves WASD. O calor é concentrado principalmente no meio e na área próxima à tela. O fino painel inferior de plástico tem muitas aberturas de ar, fazendo com que seja consideravelmente mais quente do que o deck do teclado.
(±) A temperatura máxima no lado superior é 41 °C / 106 F, em comparação com a média de 40.4 °C / 105 F , variando de 21.2 a 68.8 °C para a classe Gaming.
(-) A parte inferior aquece até um máximo de 57 °C / 135 F, em comparação com a média de 43.2 °C / 110 F
(+) Em uso inativo, a temperatura média para o lado superior é 27.1 °C / 81 F, em comparação com a média do dispositivo de 33.9 °C / ### class_avg_f### F.
(±) Jogando The Witcher 3, a temperatura média para o lado superior é 33.3 °C / 92 F, em comparação com a média do dispositivo de 33.9 °C / ## #class_avg_f### F.
(+) Os apoios para as mãos e o touchpad são mais frios que a temperatura da pele, com um máximo de 31 °C / 87.8 F e, portanto, são frios ao toque.
(-) A temperatura média da área do apoio para as mãos de dispositivos semelhantes foi 28.8 °C / 83.8 F (-2.2 °C / -4 F).
| Schenker XMG Neo 15 (Ryzen 9 6900HX, RTX 3070 Ti) AMD Ryzen 9 6900HX, NVIDIA GeForce RTX 3070 Ti Laptop GPU | Schenker XMG Neo 15 (i7-12700H, RTX 3080 Ti) Intel Core i7-12700H, NVIDIA GeForce RTX 3080 Ti Laptop GPU | MSI GE67 HX 12UGS Intel Core i7-12800HX, NVIDIA GeForce RTX 3070 Ti Laptop GPU | Asus ROG Strix Scar 15 G533ZW-LN106WS Intel Core i9-12900H, NVIDIA GeForce RTX 3070 Ti Laptop GPU | Acer Nitro 5 AN515-58-72QR Intel Core i7-12700H, NVIDIA GeForce RTX 3070 Ti Laptop GPU | MSI Stealth GS66 12UGS Intel Core i7-12700H, NVIDIA GeForce RTX 3070 Ti Laptop GPU | |
|---|---|---|---|---|---|---|
| Heat | -20% | 11% | -14% | -9% | -5% | |
| Maximum Upper Side * (°C) | 41 | 44 -7% | 34.4 16% | 42.6 -4% | 48 -17% | 54 -32% |
| Maximum Bottom * (°C) | 57 | 56 2% | 42 26% | 50.2 12% | 51 11% | 59 -4% |
| Idle Upper Side * (°C) | 28 | 38 -36% | 24 14% | 36.2 -29% | 34 -21% | 26 7% |
| Idle Bottom * (°C) | 30 | 41 -37% | 33.2 -11% | 40.2 -34% | 33 -10% | 27 10% |
* ... menor é melhor
Teste de estresse
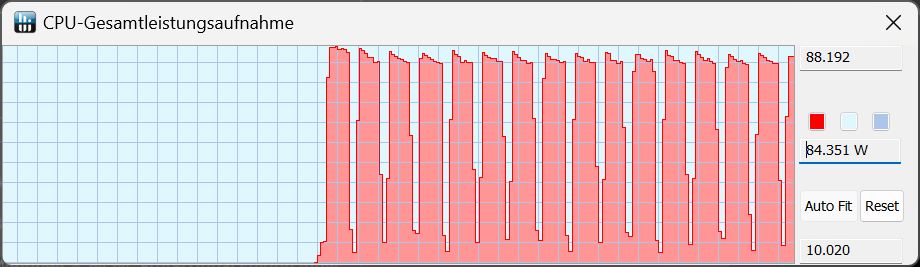
Ao contrário de muitos sistemas baseados na Intel, a velocidade do relógio da CPU do Neo conseguiu manter-se bastante estável durante nosso teste de estresse de uma hora. Os núcleos começaram o teste em 4,1 GHz e não foram abaixo de 3,9 GHz. Eles também conseguiram aproximar-se ocasionalmente do valor inicial. As temperaturas dos núcleos permaneceram constantes a 95°C (203°F), e o consumo de energia foi em média de 64 watts.
Os valores da GPU flutuaram mais por comparação. Após funcionar inicialmente a 1,7 GHz, a GPU às vezes baixou para 1 GHz antes de retornar à velocidade inicial do relógio. A velocidade da VRAM foi constante durante o teste. As temperaturas da GPU estabilizaram em torno de 78°C (172°F), enquanto o consumo de energia raramente atingia o alvo de 150 watts de potência, com uma média de aproximadamente 114 watts.
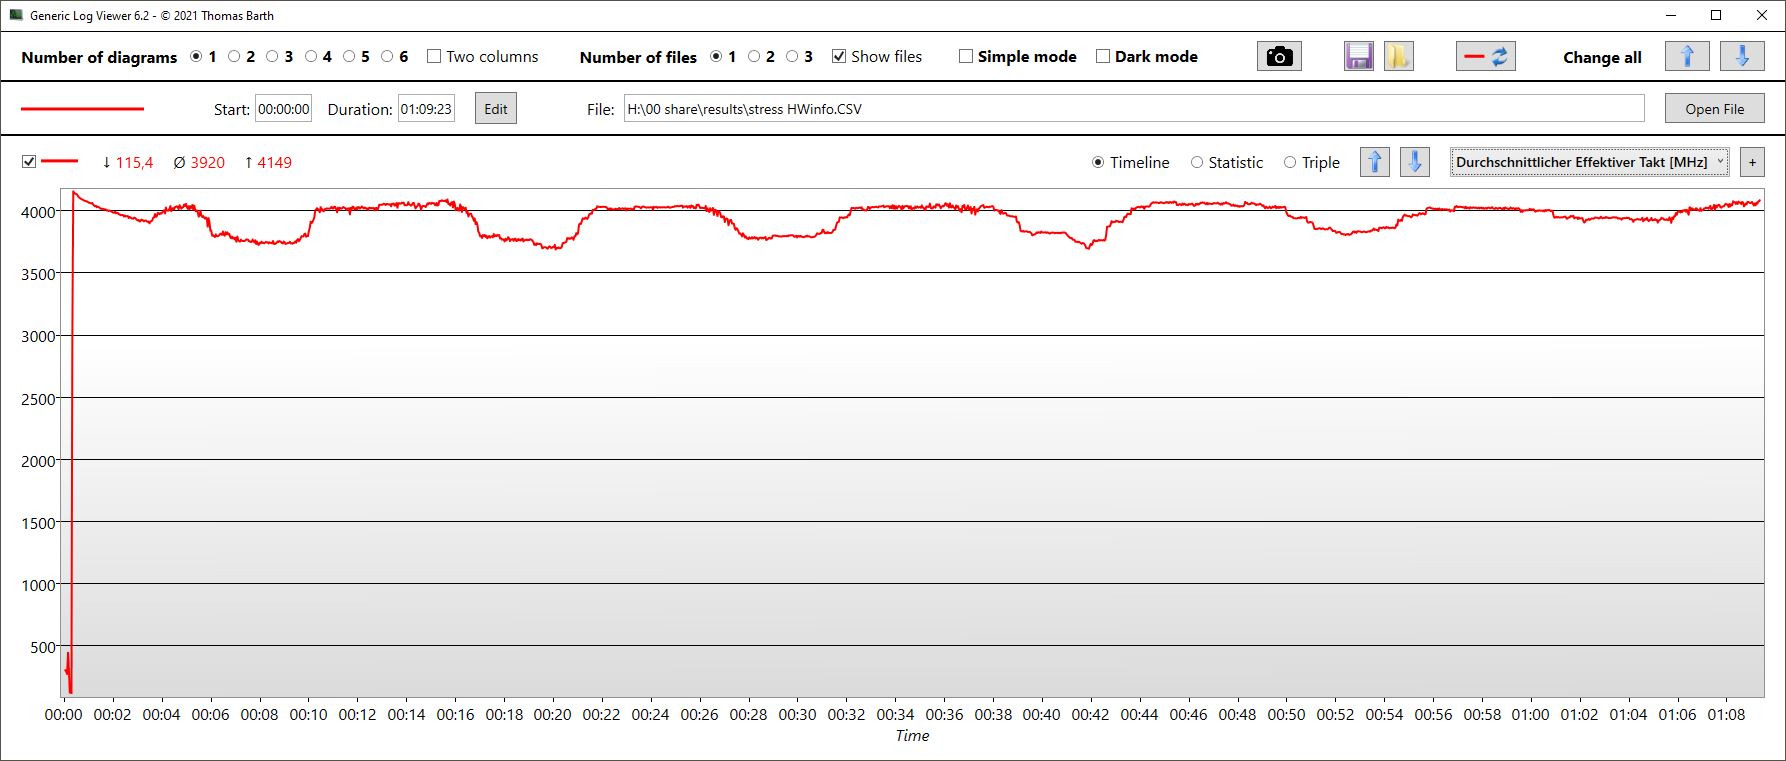
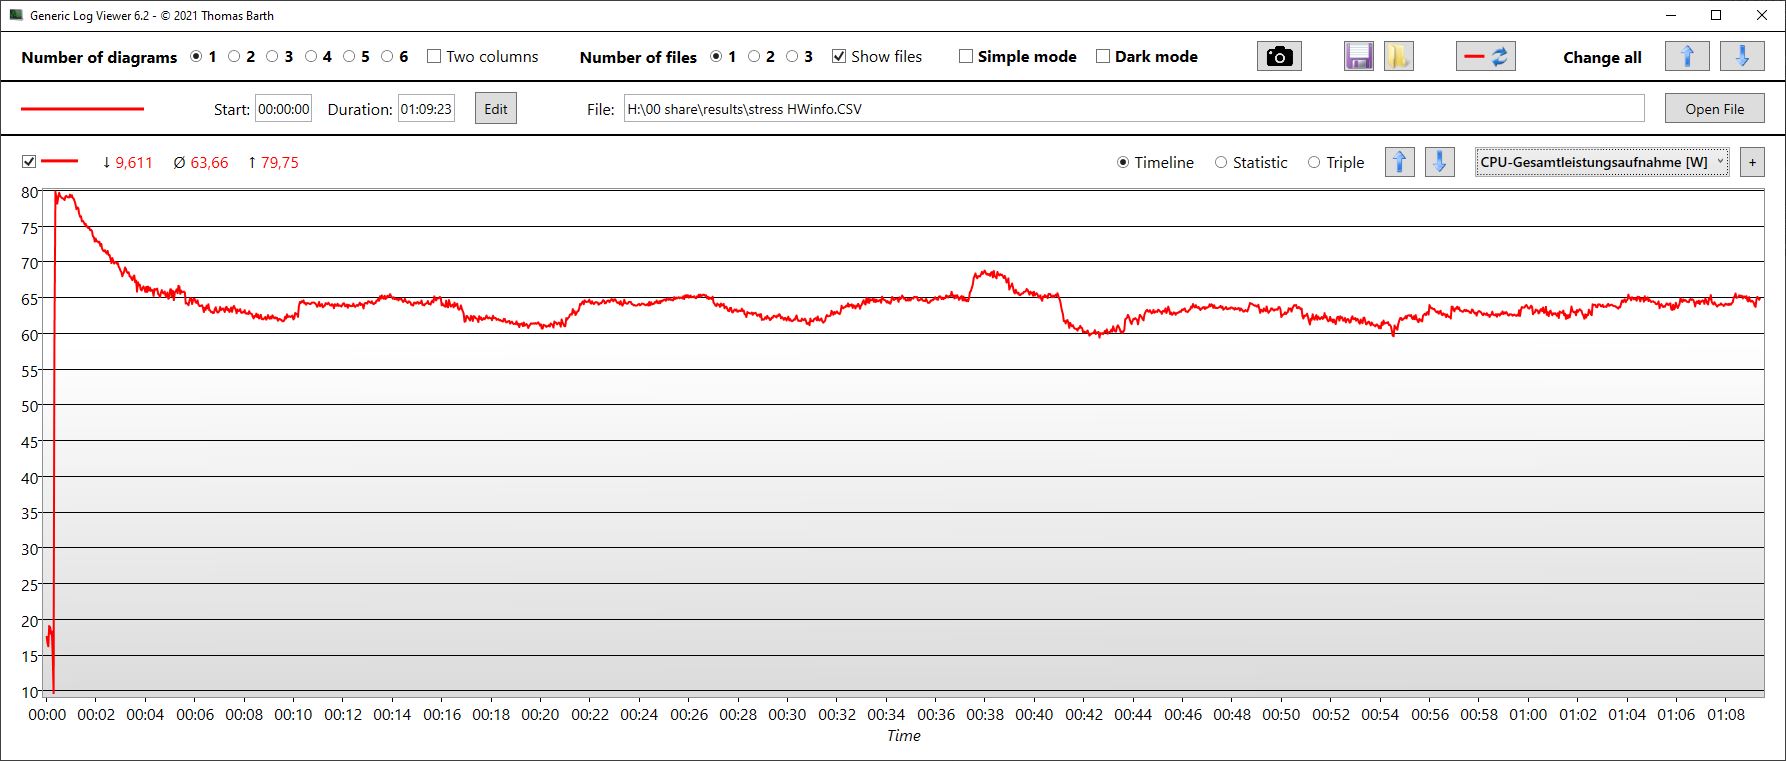
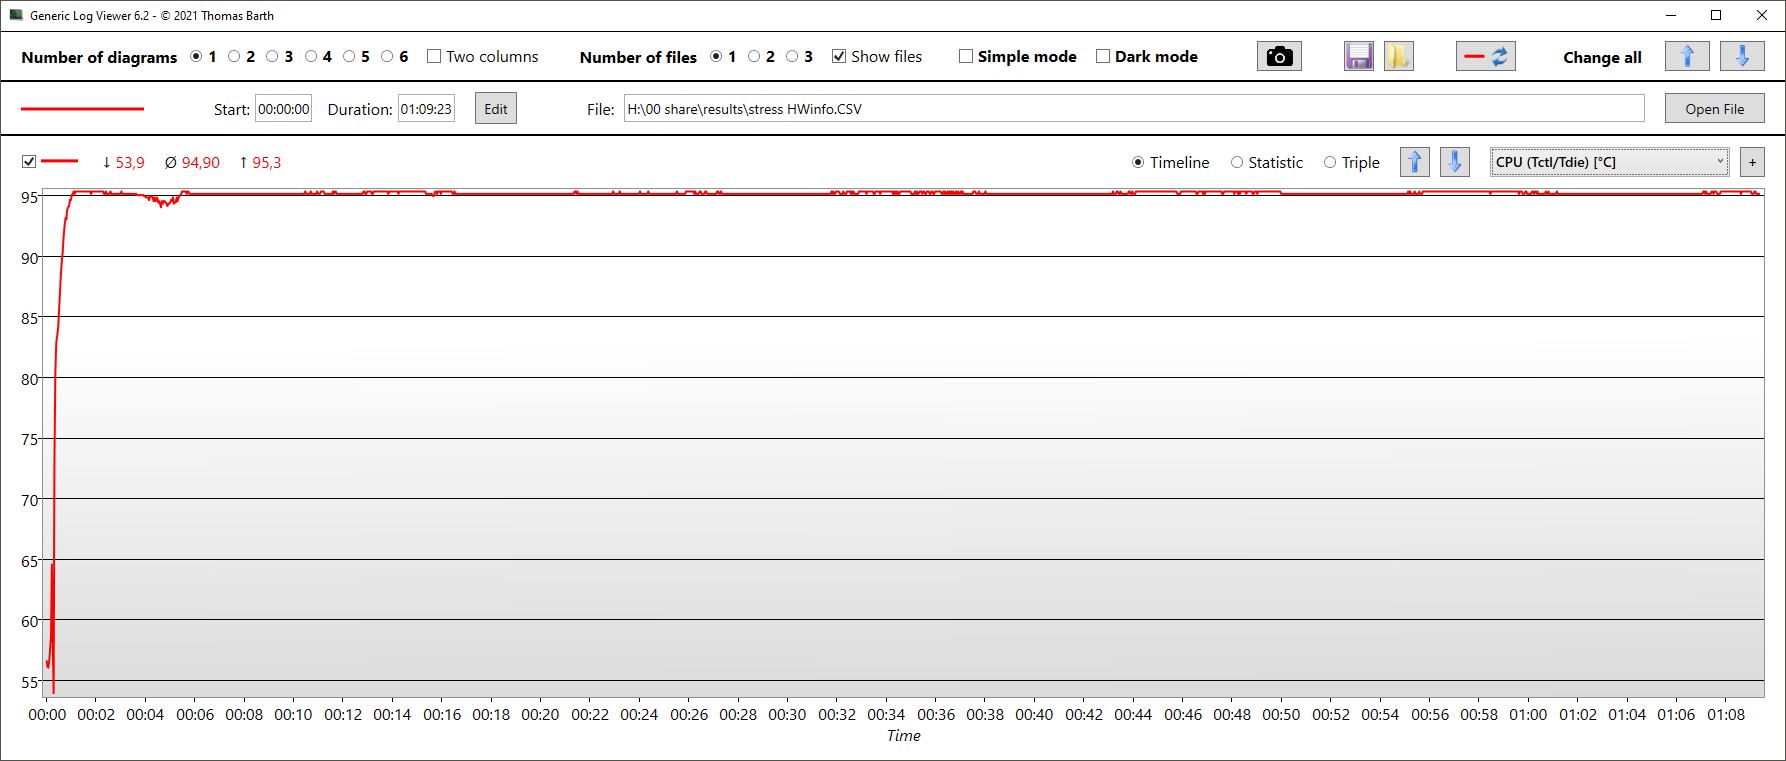
| Relógio CPU (GHz) | Relógio GPU (MHz) | Temperatura média da CPU (°C) | Temperatura média da GPU (°C) | |
| System Idle | -- | -- | 55 | 44 |
| Prime95 + FurMark Stress | 3.9 | 1.522 | 95 | 77 |
| Witcher 3 Stress | 3.1 | 1.550 | 67 | 83 |
Oradores
Schenker XMG Neo 15 (Ryzen 9 6900HX, RTX 3070 Ti) análise de áudio
(±) | o volume do alto-falante é médio, mas bom (###valor### dB)
Graves 100 - 315Hz
(-) | quase nenhum baixo - em média 19.2% menor que a mediana
(±) | a linearidade dos graves é média (8.2% delta para a frequência anterior)
Médios 400 - 2.000 Hz
(±) | médios mais altos - em média 6.6% maior que a mediana
(±) | a linearidade dos médios é média (9.9% delta para frequência anterior)
Altos 2 - 16 kHz
(+) | agudos equilibrados - apenas 2.8% longe da mediana
(+) | os máximos são lineares (6% delta da frequência anterior)
Geral 100 - 16.000 Hz
(±) | a linearidade do som geral é média (19.1% diferença em relação à mediana)
Comparado com a mesma classe
» 64% de todos os dispositivos testados nesta classe foram melhores, 7% semelhantes, 28% piores
» O melhor teve um delta de 6%, a média foi 18%, o pior foi 132%
Comparado com todos os dispositivos testados
» 46% de todos os dispositivos testados foram melhores, 7% semelhantes, 47% piores
» O melhor teve um delta de 4%, a média foi 23%, o pior foi 134%
Asus ROG Strix Scar 15 G533ZW-LN106WS análise de áudio
(±) | o volume do alto-falante é médio, mas bom (###valor### dB)
Graves 100 - 315Hz
(+) | bons graves - apenas 3.7% longe da mediana
(+) | o baixo é linear (5.5% delta para a frequência anterior)
Médios 400 - 2.000 Hz
(±) | médios mais altos - em média 7.1% maior que a mediana
(+) | médios são lineares (3.1% delta para frequência anterior)
Altos 2 - 16 kHz
(+) | agudos equilibrados - apenas 3.3% longe da mediana
(+) | os máximos são lineares (5.9% delta da frequência anterior)
Geral 100 - 16.000 Hz
(+) | o som geral é linear (12.2% diferença em relação à mediana)
Comparado com a mesma classe
» 13% de todos os dispositivos testados nesta classe foram melhores, 4% semelhantes, 83% piores
» O melhor teve um delta de 6%, a média foi 18%, o pior foi 132%
Comparado com todos os dispositivos testados
» 10% de todos os dispositivos testados foram melhores, 2% semelhantes, 88% piores
» O melhor teve um delta de 4%, a média foi 23%, o pior foi 134%
Gerenciamento de energia - XMG Neo 15 tem uma grande vida útil da bateria
Consumo de energia
O laptop usa entre 13 e 20 watts de potência em modo inativo, dependendo do perfil de desempenho selecionado e da luminosidade da tela. Este é, na melhor das hipóteses, um resultado médio em nossa comparação.
Ao rodar o Witcher 3, o sistema consumiu cerca de 200 watts de potência - uma fração a mais do que o Asus ROG Strix ligeiramente mais rápido
.
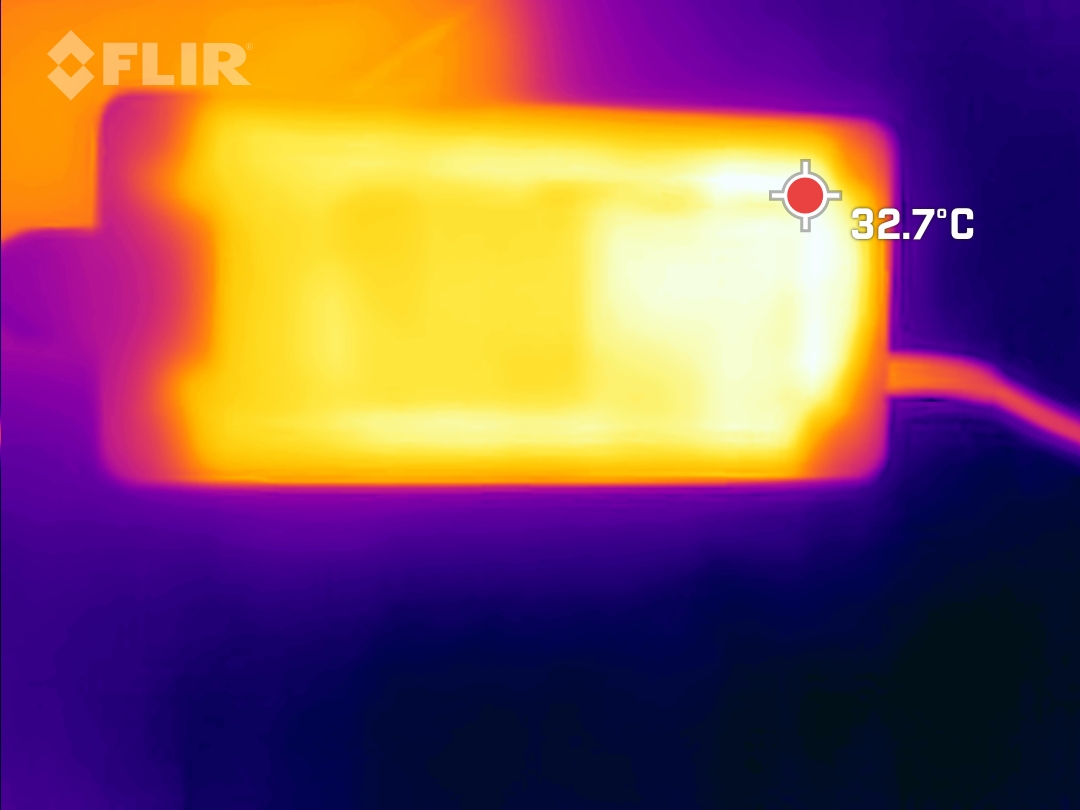
Durante o teste de estresse, medimos um pico de consumo temporário de 260 watts. O carregador volumoso de 280 watts pode facilmente lidar com os requisitos de energia do laptop, especialmente considerando o consumo de energia estabilizado em 210 watts durante o teste de estresse.
| desligado | |
| Ocioso | |
| Carga |
|
Key:
min: | |
| Schenker XMG Neo 15 (Ryzen 9 6900HX, RTX 3070 Ti) R9 6900HX, GeForce RTX 3070 Ti Laptop GPU, Samsung SSD 980 Pro 1TB MZ-V8P1T0BW, IPS, 2560x1440, 15.6" | Schenker XMG Neo 15 (i7-12700H, RTX 3080 Ti) i7-12700H, GeForce RTX 3080 Ti Laptop GPU, Samsung SSD 980 Pro 1TB MZ-V8P1T0BW, IPS, 2560x1440, 15.6" | MSI GE67 HX 12UGS i7-12800HX, GeForce RTX 3070 Ti Laptop GPU, Samsung PM9A1 MZVL21T0HCLR, OLED, 1920x1080, 15.6" | Asus ROG Strix Scar 15 G533ZW-LN106WS i9-12900H, GeForce RTX 3070 Ti Laptop GPU, Samsung PM9A1 MZVL22T0HBLB, IPS-level, 2560x1440, 15.6" | Acer Nitro 5 AN515-58-72QR i7-12700H, GeForce RTX 3070 Ti Laptop GPU, Samsung PM9A1 MZVL21T0HCLR, IPS, 2560x1440, 15.6" | MSI Stealth GS66 12UGS i7-12700H, GeForce RTX 3070 Ti Laptop GPU, WDC PC SN810 1TB, IPS-Level, 2560x1440, 15.6" | Média NVIDIA GeForce RTX 3070 Ti Laptop GPU | Média da turma Gaming | |
|---|---|---|---|---|---|---|---|---|
| Power Consumption | -14% | -20% | 5% | 3% | 3% | -19% | -12% | |
| Idle Minimum * (Watt) | 13 | 15 -15% | 16.1 -24% | 7.56 42% | 7 46% | 11 15% | 14.2 ? -9% | 13.1 ? -1% |
| Idle Average * (Watt) | 17 | 18 -6% | 17.1 -1% | 13.5 21% | 15 12% | 16 6% | 19.9 ? -17% | 19 ? -12% |
| Idle Maximum * (Watt) | 20 | 18 10% | 26.6 -33% | 16.87 16% | 24 -20% | 23 -15% | 26.2 ? -31% | 24.6 ? -23% |
| Load Average * (Watt) | 89 | 123 -38% | 116.3 -31% | 128.9 -45% | 124 -39% | 110 -24% | 125.8 ? -41% | 111.3 ? -25% |
| Witcher 3 ultra * (Watt) | 200 | 234 -17% | 237 -19% | 196.2 2% | 195.1 2% | 151 24% | ||
| Load Maximum * (Watt) | 260 | 301 -16% | 291.1 -12% | 274.86 -6% | 220 15% | 230 12% | 248 ? 5% | 260 ? -0% |
* ... menor é melhor
Power Consumption Witcher 3 / Stress test
Power Consumption with External Monitor
Duração da bateria
A Schenker deu ao laptop uma bateria de 96Wh. Além do Acer Nitro, todos os dispositivos na comparação têm baterias igualmente grandes.
O XMG Neo 15 oferece uma excelente vida útil da bateria em relação à concorrência. Parece que Schenker fez um bom trabalho afinando os modos de potência.
Em qualquer caso, com o brilho da tela desligado, o laptop nos forneceu quase 11 horas de navegação na web e reprodução de vídeo. Mesmo com a luminosidade máxima da tela, ainda conseguimos navegar na Internet por 8,5 horas via Wi-Fi.
| Schenker XMG Neo 15 (Ryzen 9 6900HX, RTX 3070 Ti) R9 6900HX, GeForce RTX 3070 Ti Laptop GPU, 93 Wh | Schenker XMG Neo 15 (i7-12700H, RTX 3080 Ti) i7-12700H, GeForce RTX 3080 Ti Laptop GPU, 93 Wh | MSI GE67 HX 12UGS i7-12800HX, GeForce RTX 3070 Ti Laptop GPU, 99.9 Wh | Asus ROG Strix Scar 15 G533ZW-LN106WS i9-12900H, GeForce RTX 3070 Ti Laptop GPU, 90 Wh | Acer Nitro 5 AN515-58-72QR i7-12700H, GeForce RTX 3070 Ti Laptop GPU, 57.5 Wh | MSI Stealth GS66 12UGS i7-12700H, GeForce RTX 3070 Ti Laptop GPU, 99.9 Wh | Média da turma Gaming | |
|---|---|---|---|---|---|---|---|
| Duração da bateria | -23% | -9% | -29% | -48% | -25% | -21% | |
| H.264 (h) | 10.7 | 7.1 -34% | 8.5 -21% | 4.7 -56% | 8.27 ? -23% | ||
| WiFi v1.3 (h) | 10.9 | 7.7 -29% | 5.6 -49% | 8.4 -23% | 3.9 -64% | 5.4 -50% | 7.08 ? -35% |
| Load (h) | 1.6 | 1.5 -6% | 2.1 31% | 0.9 -44% | 1.2 -25% | 1.6 0% | 1.496 ? -6% |
| Reader / Idle (h) | 8.4 | 5.7 | 7.8 | 7.84 ? | |||
| Witcher 3 ultra (h) | 1.2 |
Pro
Contra
Veredicto - Intel ou AMD? É uma questão de preferência.
O Neo 15 é um ótimo laptop para jogos, mesmo com um processador AMD. Em modo inativo, o Neo, baseado na AMD, funciona muito mais frio e tem uma vida útil de bateria mais longa do que sua contraparte baseada na Intel. No lado oposto, ele tem desempenho marginalmente mais baixo da CPU e não tem suporte a Thunderbolt. Os consumidores precisam decidir o que é mais importante para eles
O desempenho de jogo do laptop está no nível médio superior, mas pode ser melhorado ainda mais usando a ampla gama de configurações manuais disponíveis.
Estamos impressionados com a soberba duração da bateria, mas estamos ligeiramente rasgados em alguns aspectos. Gostamos dos materiais robustos de metal usados no display e no teclado, mas a caixa inferior é muito macia para nosso gosto. O dispositivo tem uma webcam Full HD, mas oferece uma qualidade de imagem tão ruim que muitos modelos de 720p são simplesmente capazes de fazer melhor. Ainda há um pouco de espaço para melhorias aqui. Dito isto, esta é uma crítica relativamente menor.
O XMG Neo 15 com AMD Ryzen é um laptop para jogos sem grandes desvantagens que tem uma conexão para resfriamento externo de água opcional. No entanto, algumas das muitas grandes idéias no laptop ainda podem usar algum refinamento.
Se você estiver procurando por alternativas, recomendamos particularmente o MSI GE6 HX 12UGSa empresa está à frente em quase todos os testes de desempenho e, no entanto, não é muito pior em termos de emissões. Você também pode verificar o Asus ROG Strix Scarum laptop que é pescoço e pescoço com o Neo 15.
Preço e disponibilidade
O Neo 15 pode ser configurado de muitas maneiras na própria loja on-line do XMG (bestware.com). Nosso modelo de revisão custa 2.877 Euros (US$2.850) do site. Você pode economizar quase 500 euros (US$ 495) optando por um RTX 3060 em vez de RTX 3070 Ti! Se você olhar ao redor dos sites de comparação, você poderá, em algum momento, achar que o laptop vai por um pouco menos.
Schenker XMG Neo 15 (Ryzen 9 6900HX, RTX 3070 Ti)
- 10/26/2022 v7 (old)
Christian Hintze
Price comparison

