Breve Análise do Samsung Galaxy Tab S7 Plus - Finalmente um excelente tablet Android
Avaliação | Data | Modelo | Peso | Altura | Size | Resolução | Preço |
|---|---|---|---|---|---|---|---|
| 88.1 % v7 (old) | 10/2020 | Samsung Galaxy Tab S7 Plus SD 865+ (Plus), Adreno 650 | 575 g | 5.7 mm | 12.40" | 2800x1752 | |
| 89.3 % v7 (old) | 05/2020 | Apple iPad Pro 12.9 2020 A12Z Bionic, A12Z Bionic GPU | 641 g | 5.9 mm | 12.90" | 2732x2048 | |
| 88.4 % v7 (old) | 08/2020 | Huawei MatePad Pro 10.8 Kirin 990, Mali-G76 MP16 | 460 g | 7.2 mm | 10.80" | 2560x1600 | |
| 87.8 % v7 (old) | 10/2019 | Samsung Galaxy Tab S6 SM-T860 SD 855, Adreno 640 | 420 g | 5.7 mm | 10.50" | 2560x1600 |
| Networking | |
| iperf3 transmit AX12 | |
| Huawei MatePad Pro 10.8 | |
| Apple iPad Pro 12.9 2020 | |
| Samsung Galaxy Tab S7 Plus | |
| Samsung Galaxy Tab S6 SM-T860 | |
| iperf3 receive AX12 | |
| Huawei MatePad Pro 10.8 | |
| Samsung Galaxy Tab S6 SM-T860 | |
| Samsung Galaxy Tab S7 Plus | |
| Apple iPad Pro 12.9 2020 | |
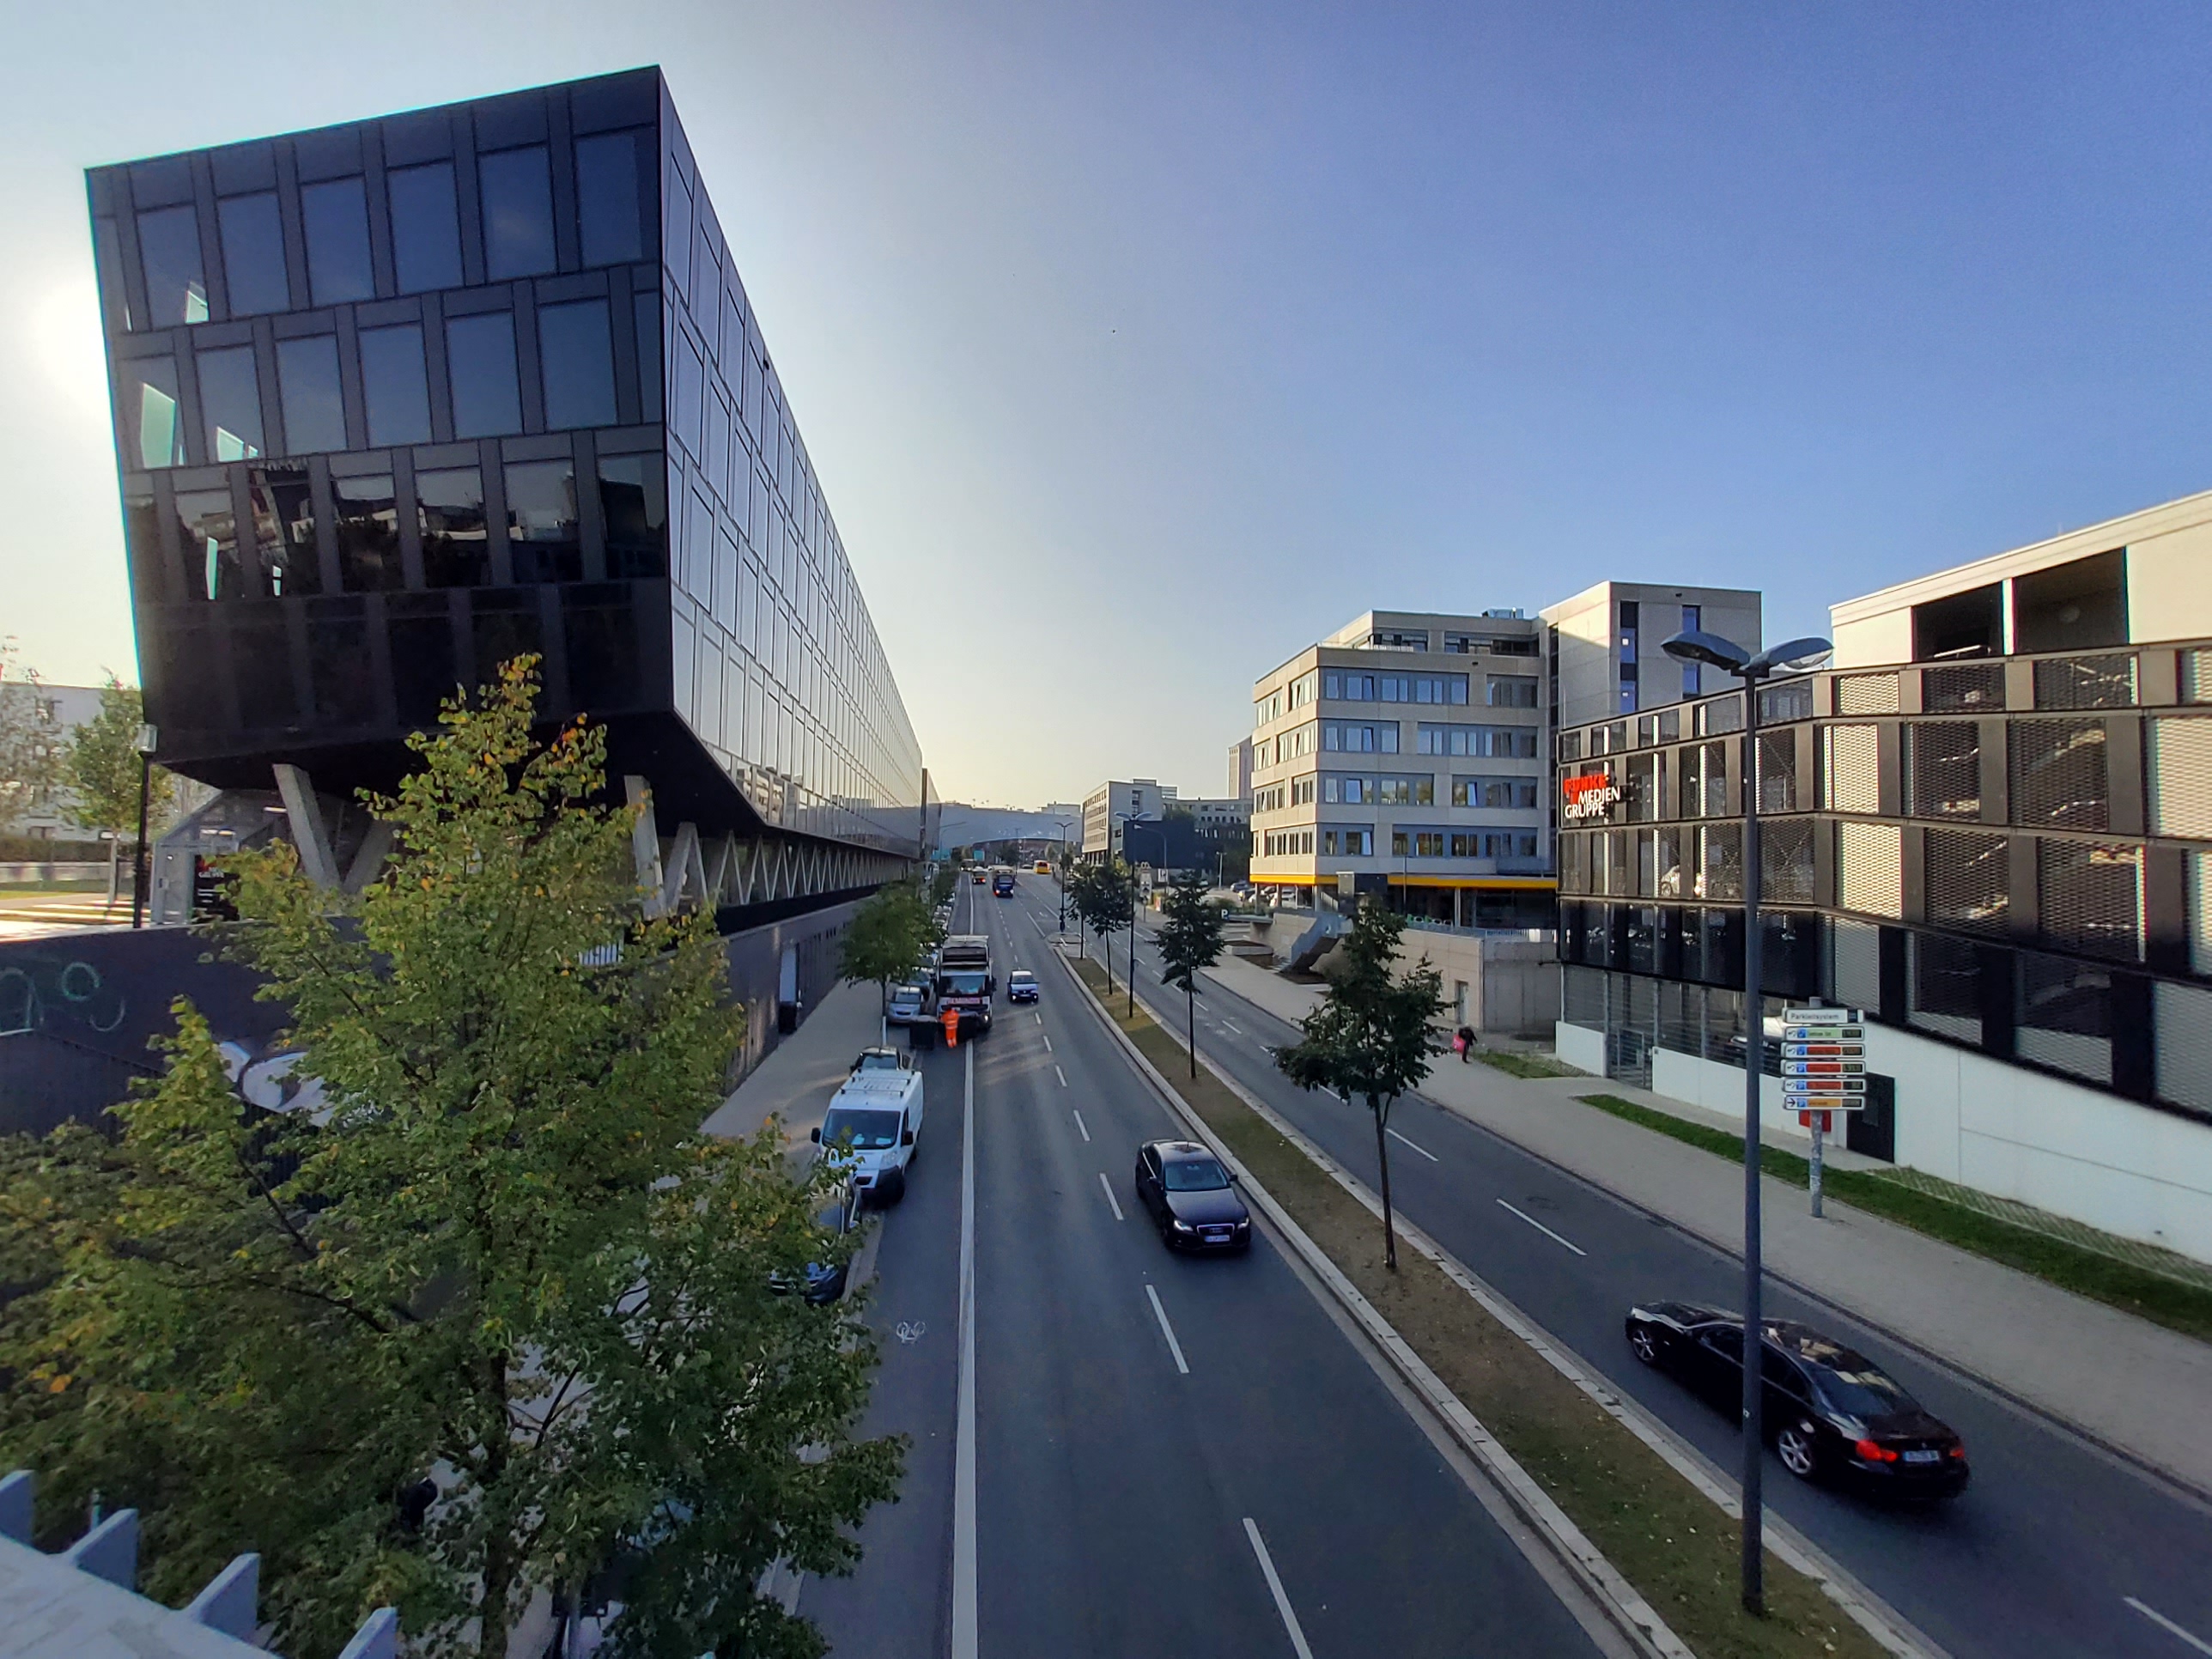
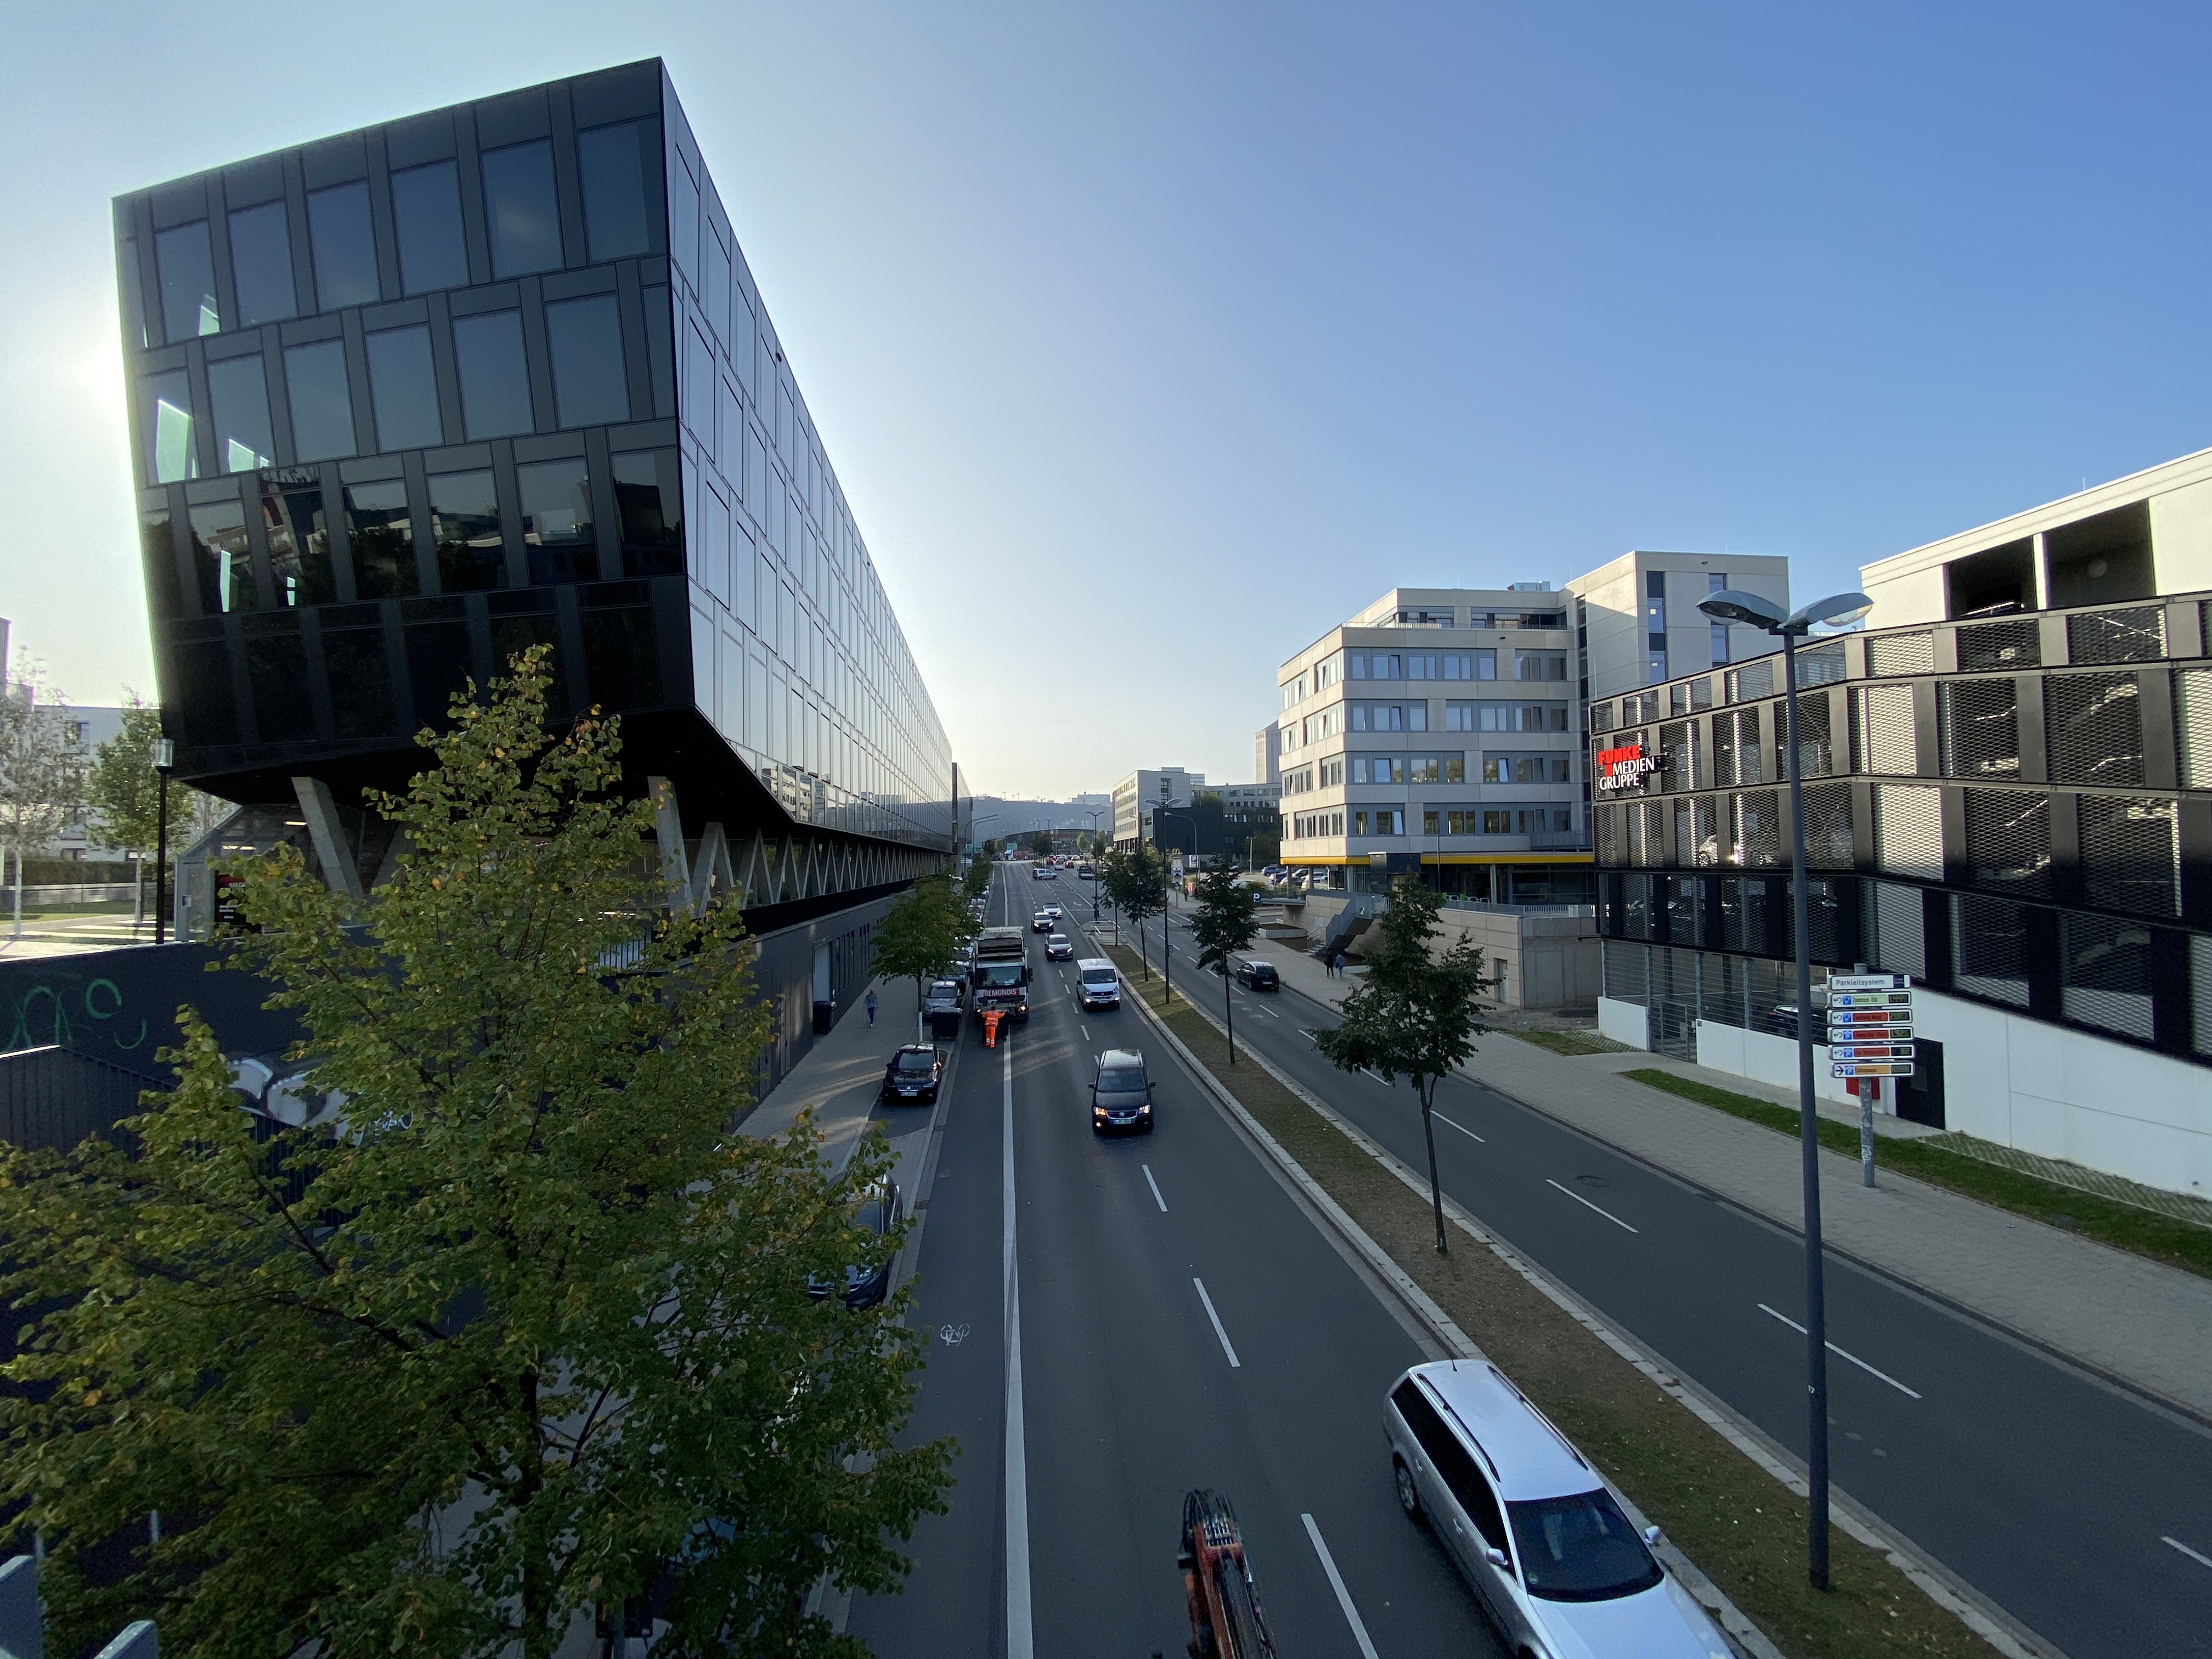
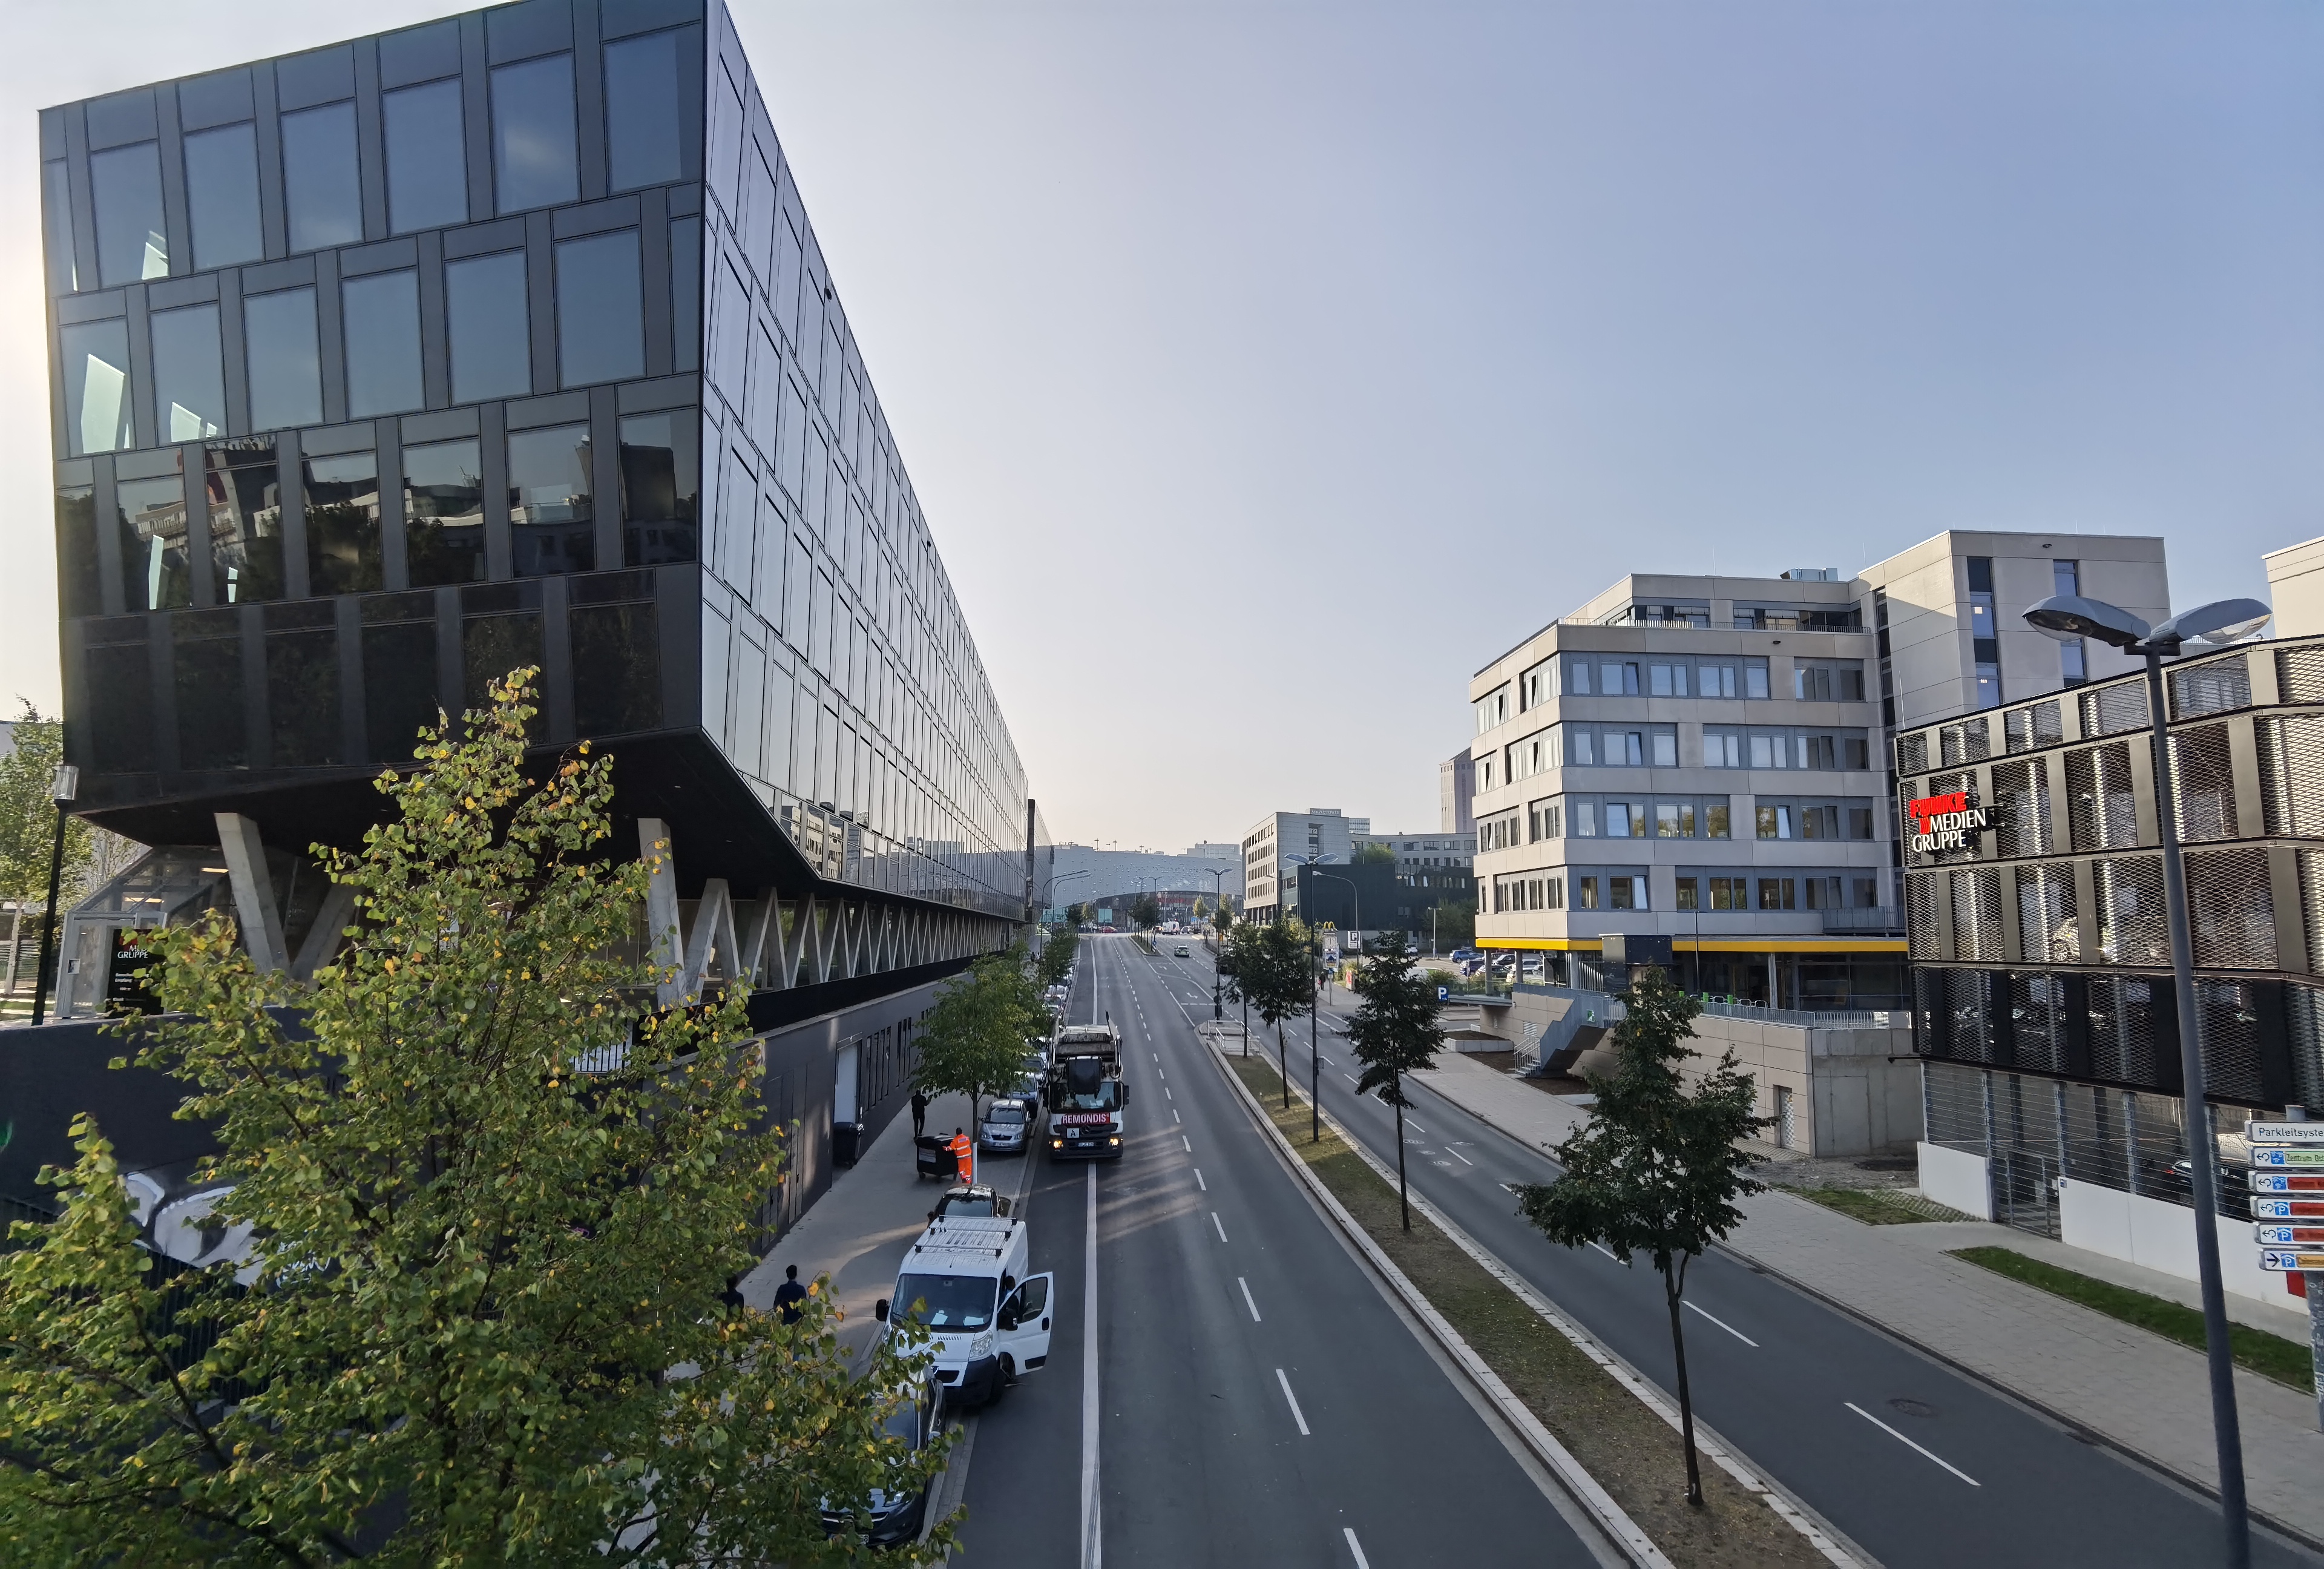
Comparação de imagens
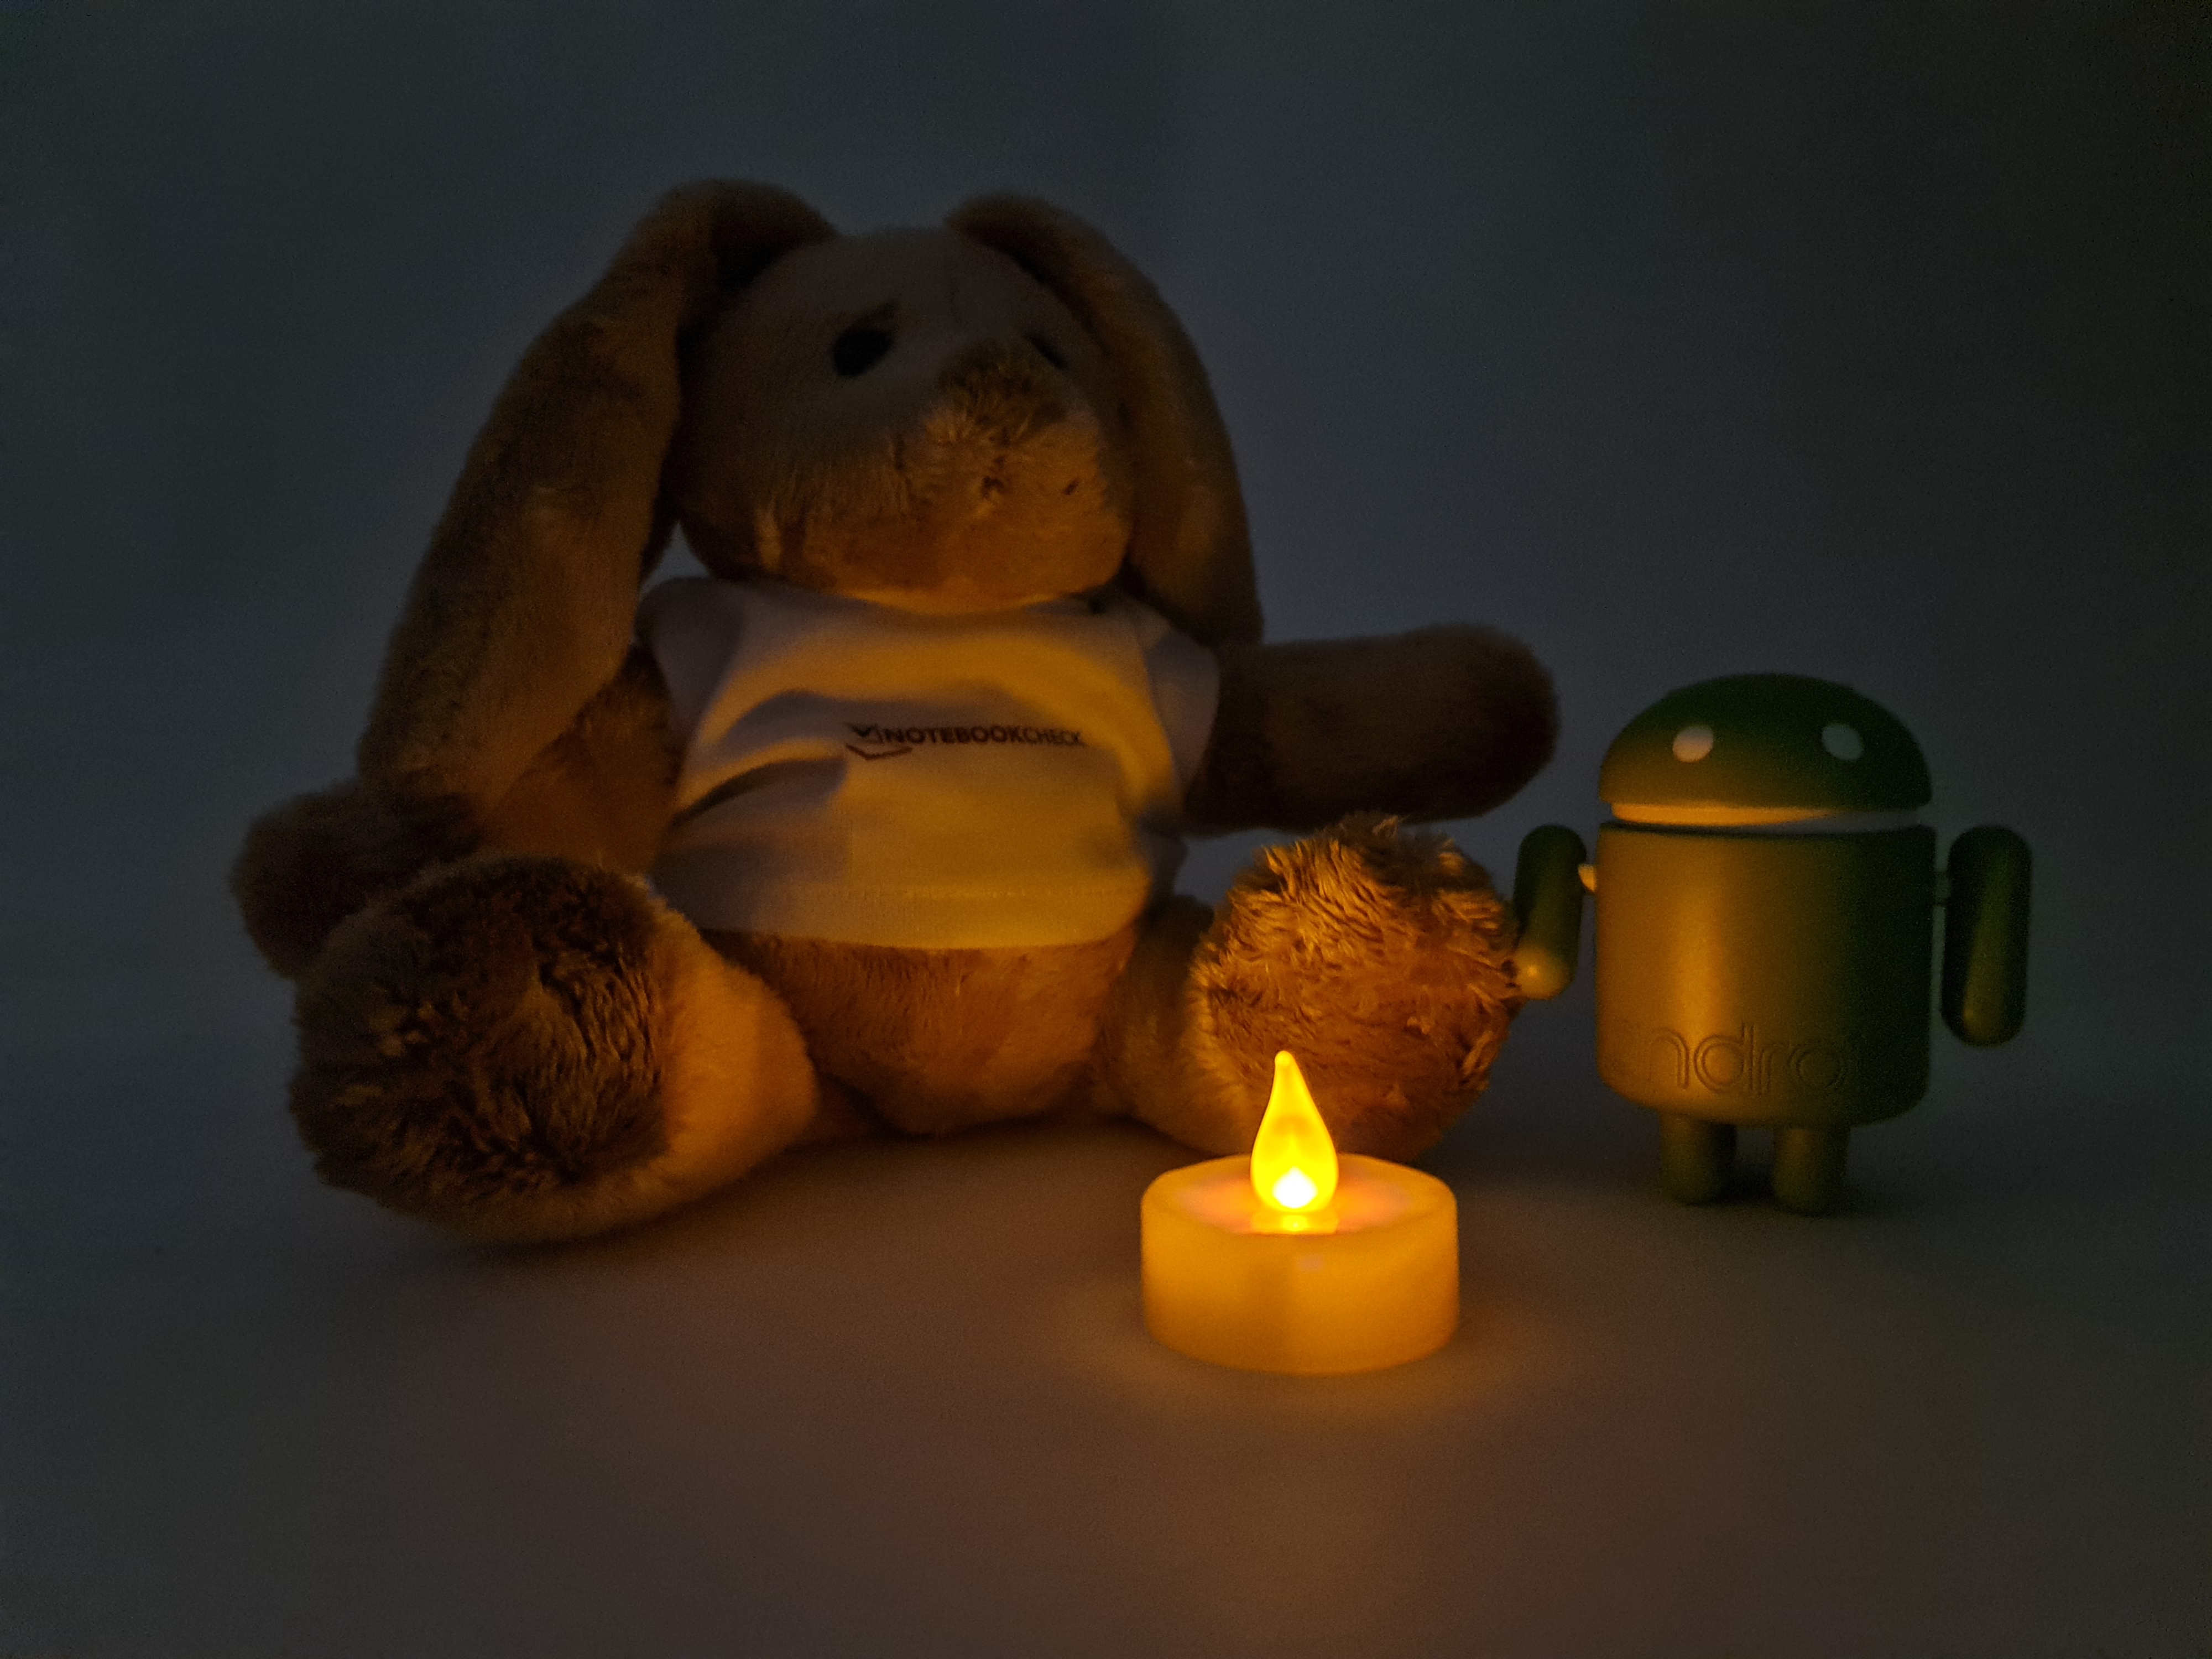
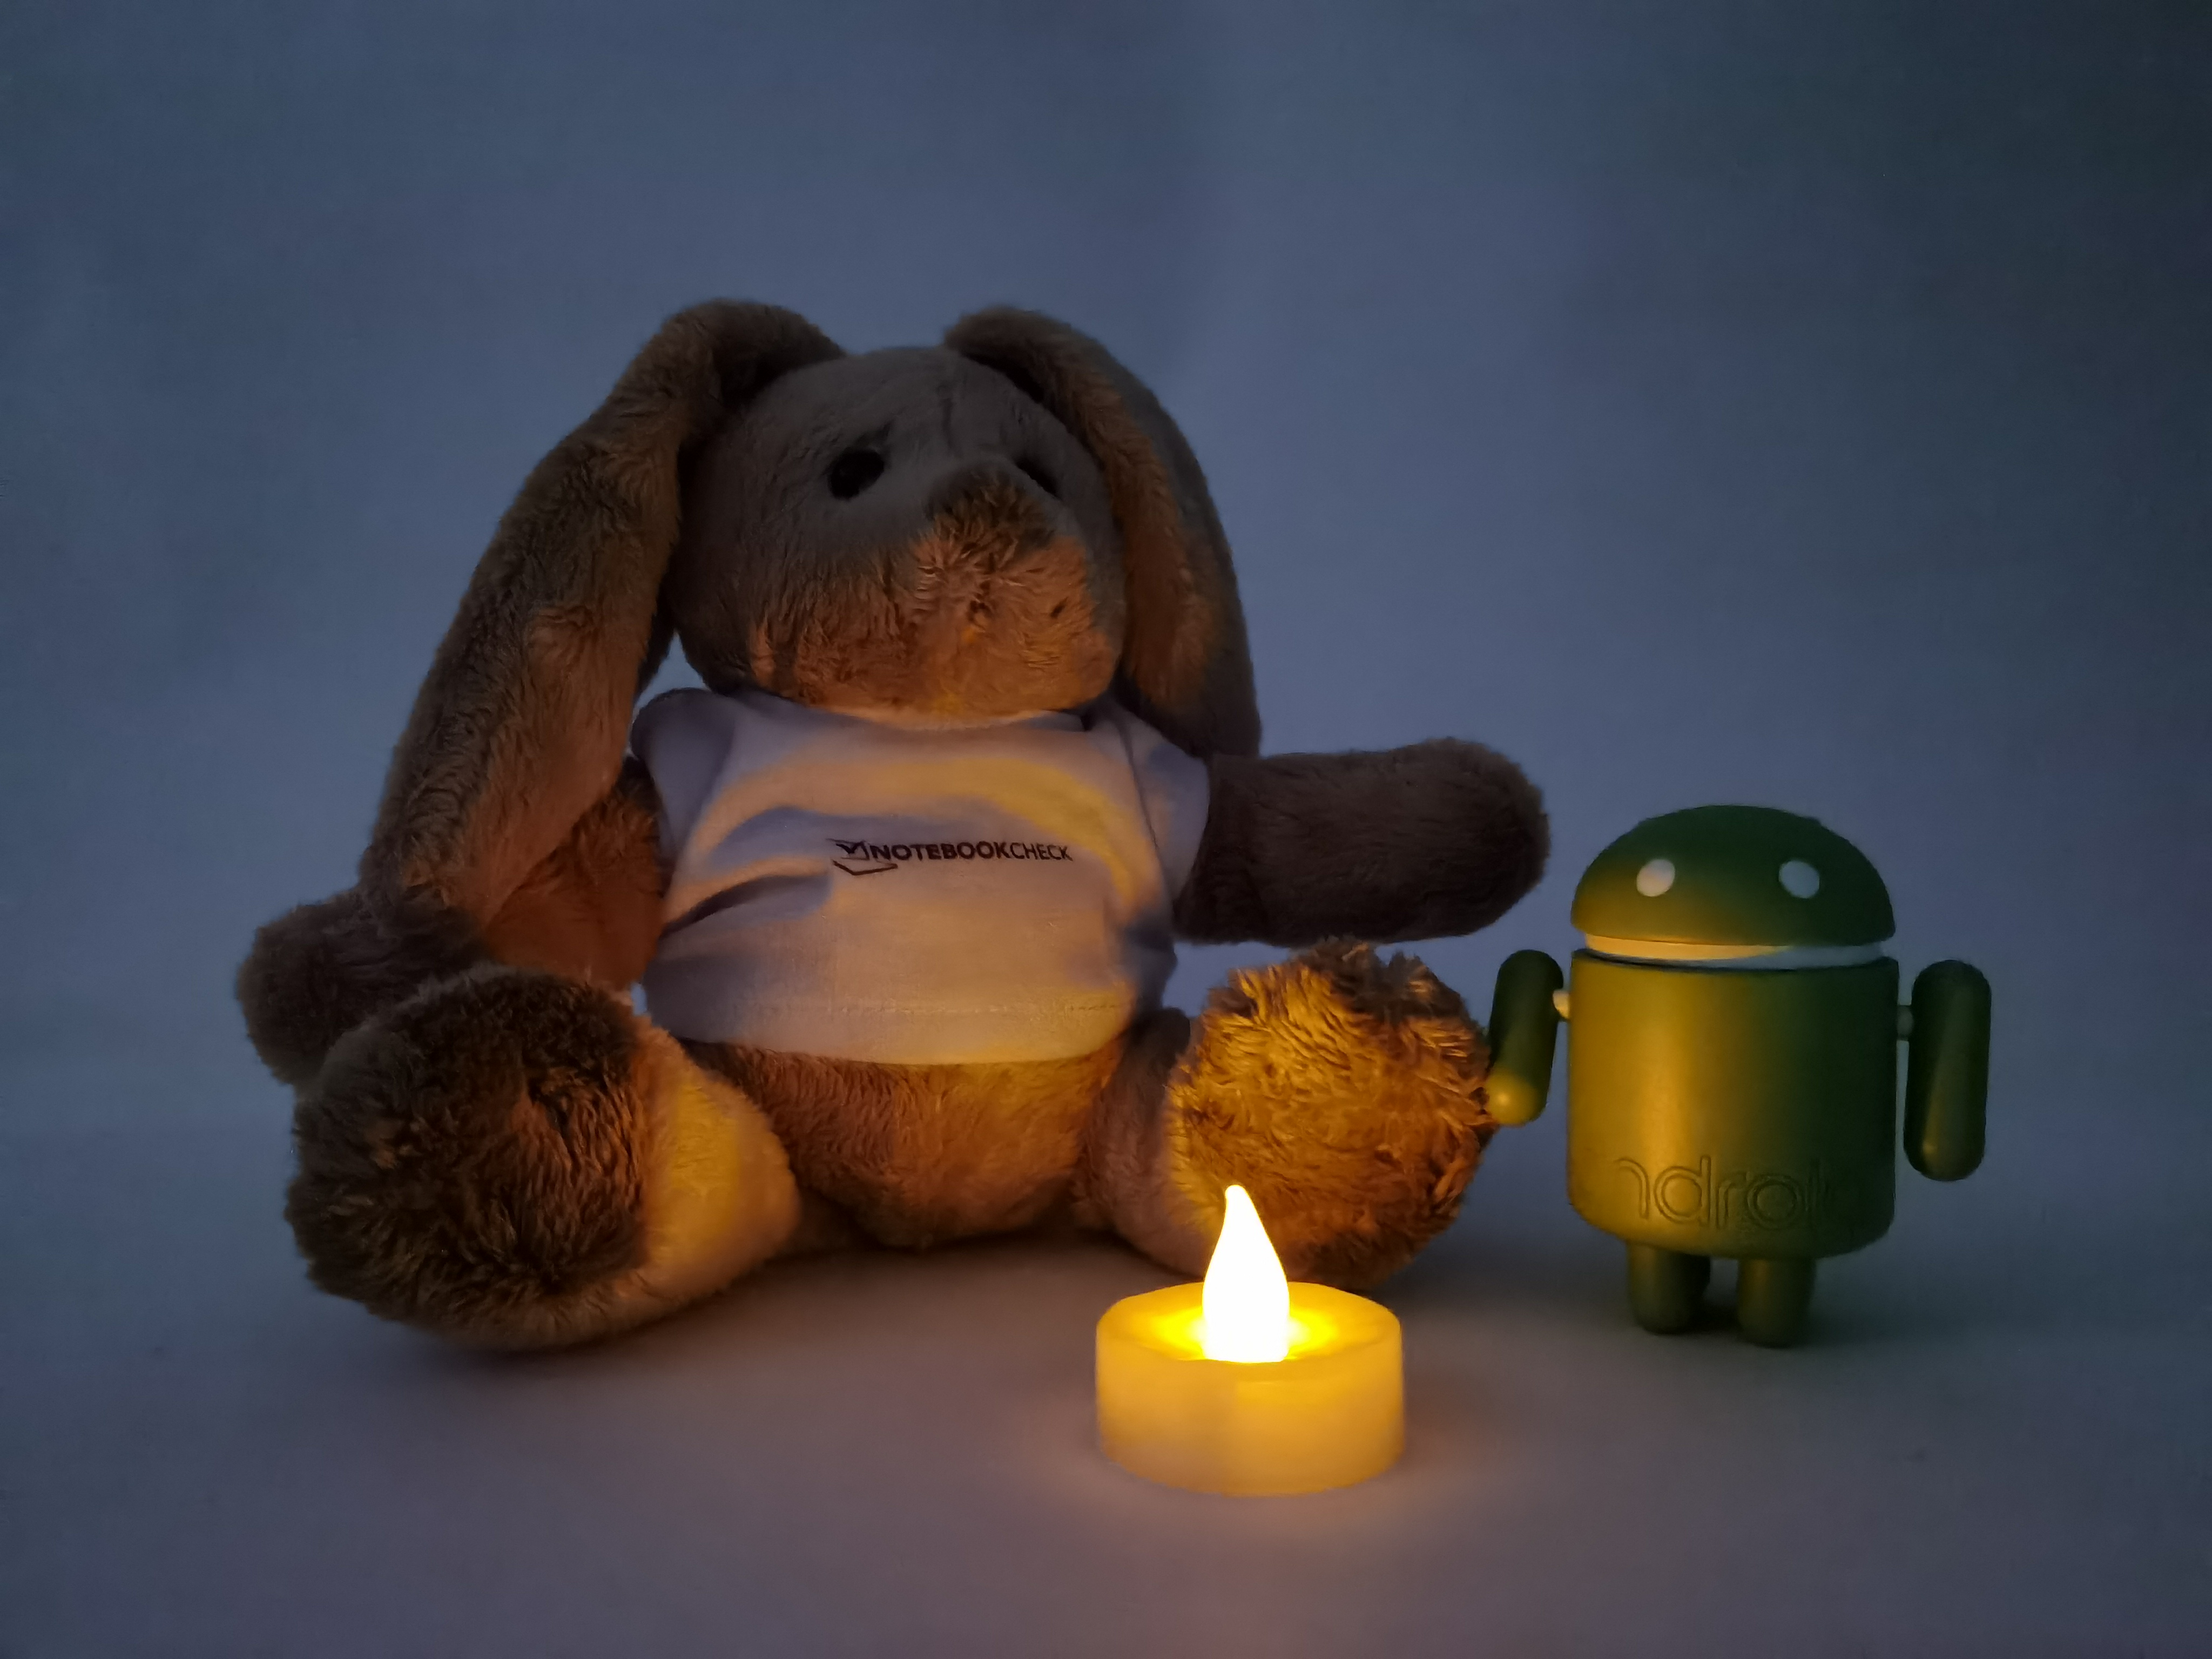
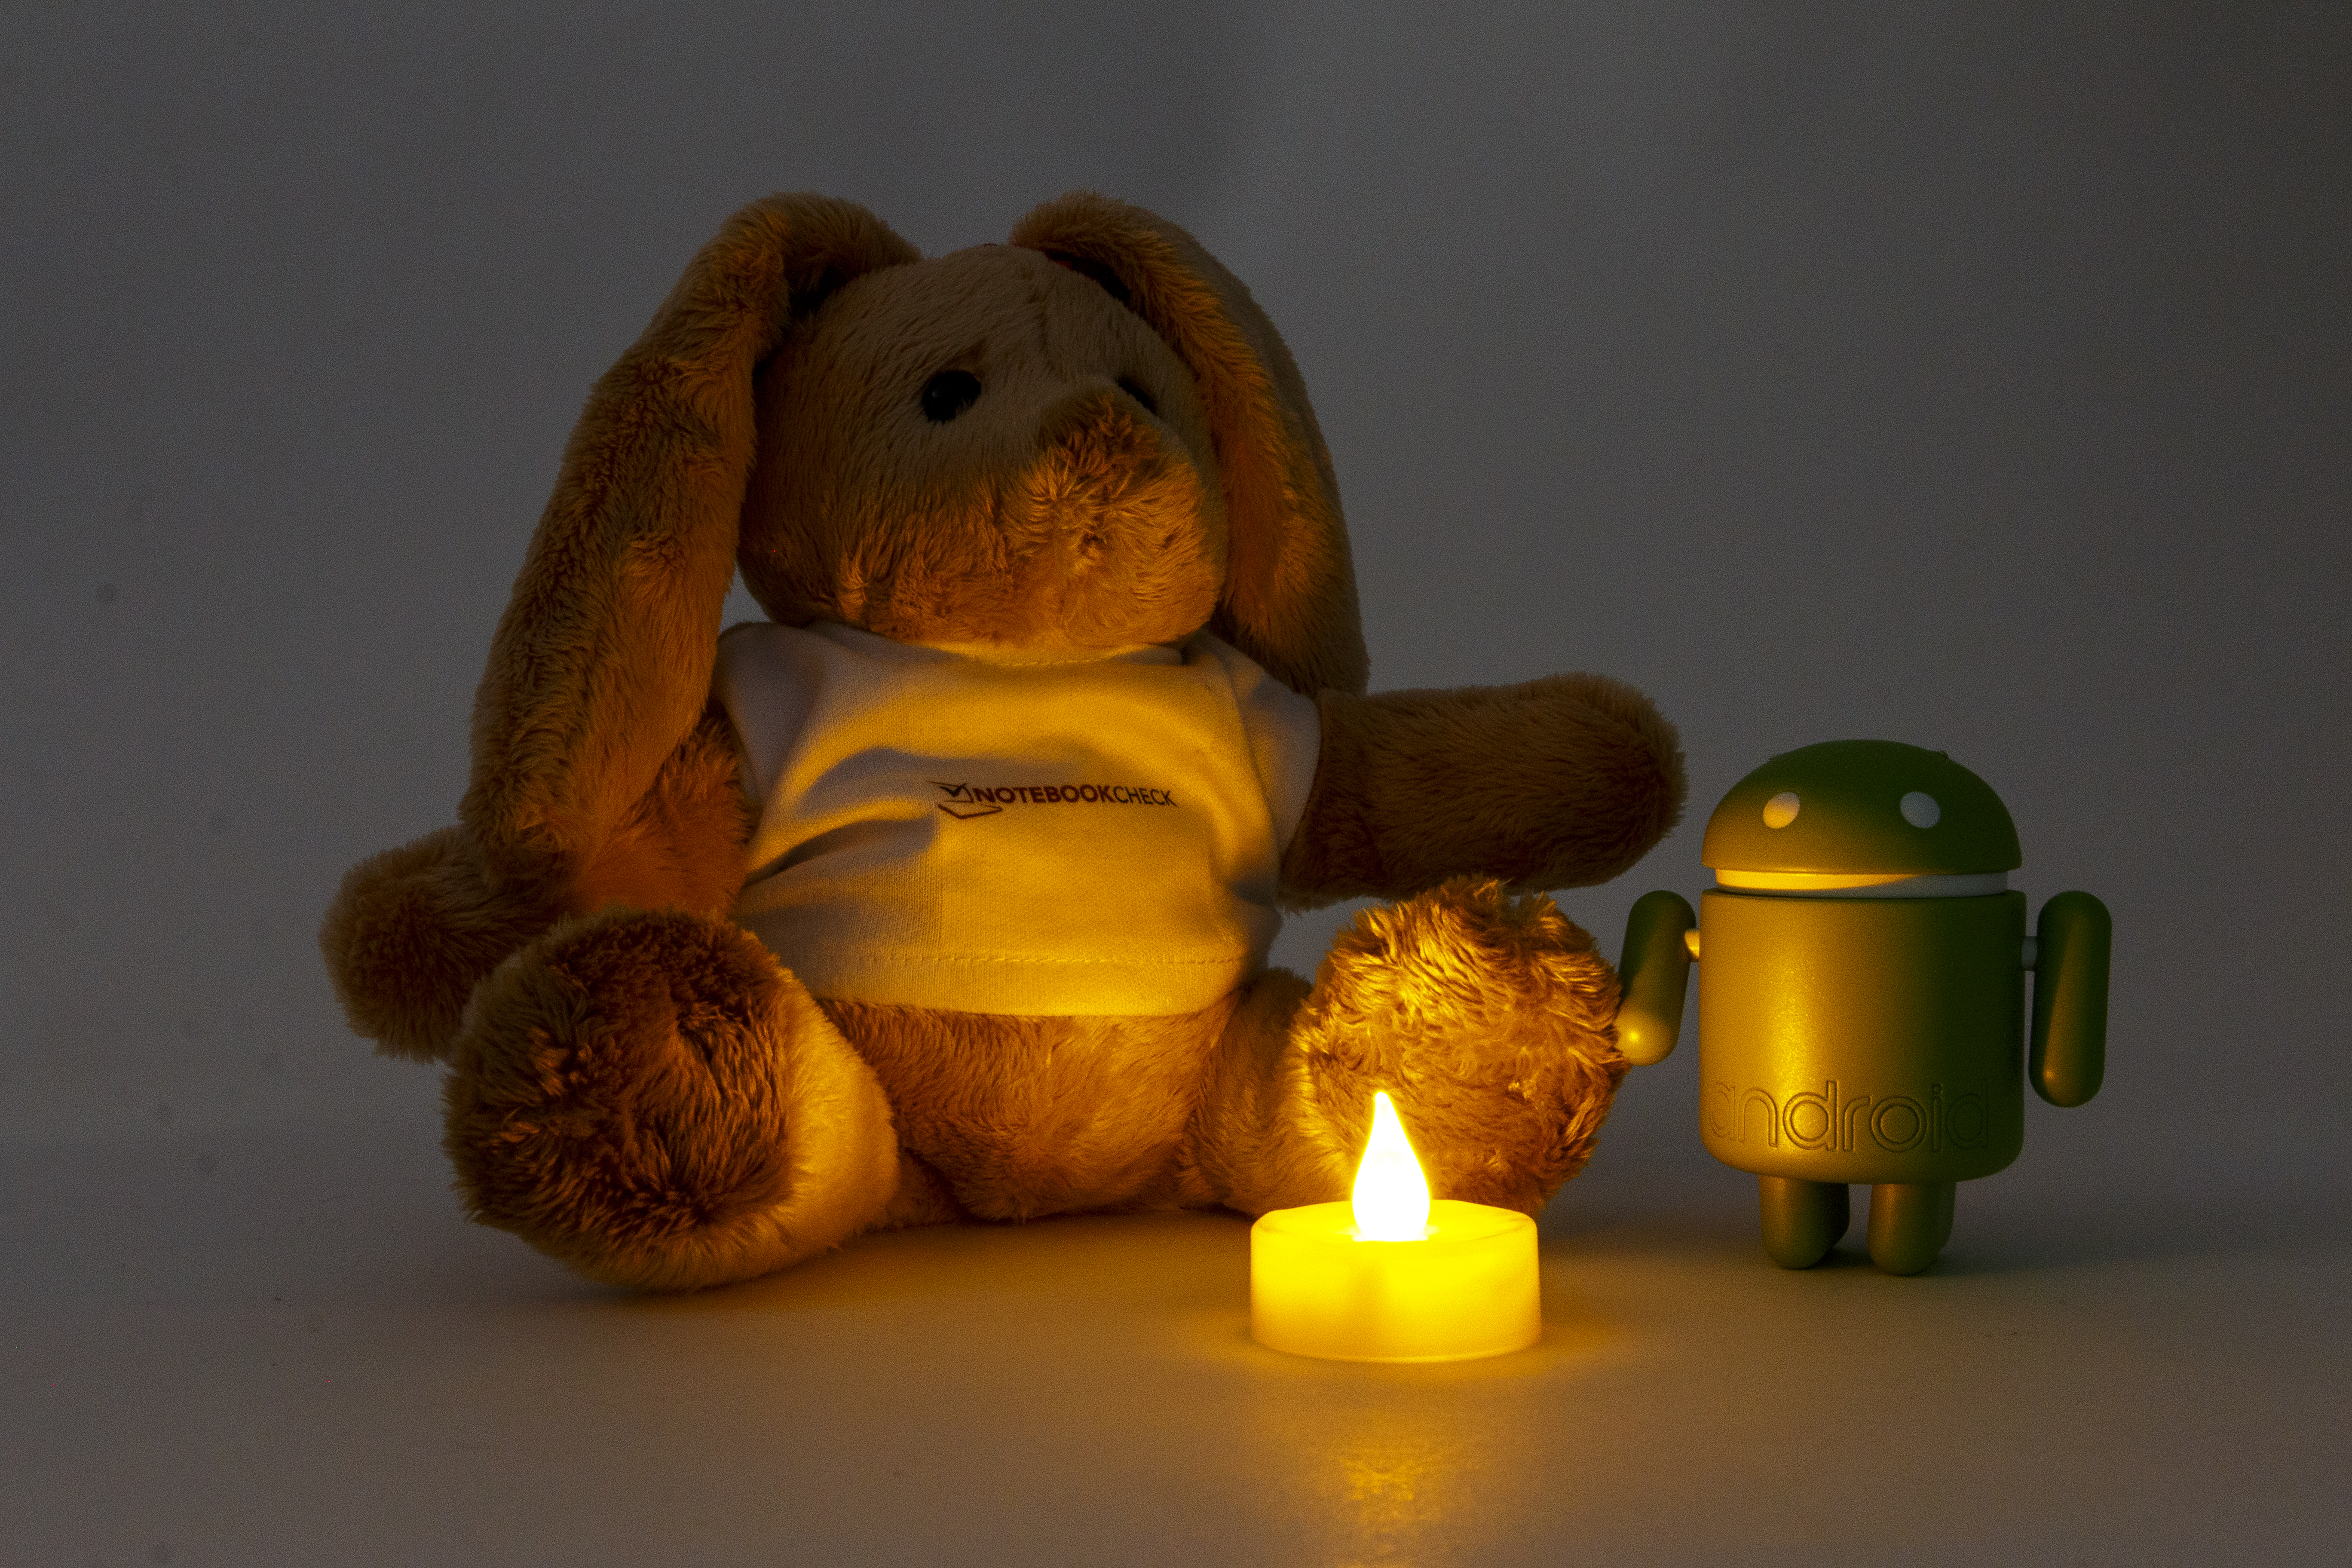
Escolha uma cena e navegue pela primeira imagem. Um clique muda a posição nas telas sensíveis ao toque. Um clique na imagem ampliada abre o original em uma nova janela. A primeira imagem mostra a fotografia em escala do dispositivo de teste.
Wide-angleWide-angleUltra Wide-angle5X zoomLow-light photography


, 256 GB UFS 3.1 Flash")
, 256 GB UFS 3.1 Flash")
, 256 GB UFS 3.1 Flash")
, 256 GB UFS 3.1 Flash")
| |||||||||||||||||||||||||
iluminação: 98 %
iluminação com acumulador: 441 cd/m²
Contraste: ∞:1 (Preto: 0 cd/m²)
ΔE ColorChecker Calman: 2.4 | ∀{0.5-29.43 Ø4.71}
ΔE Greyscale Calman: 2.9 | ∀{0.09-98 Ø4.96}
99.8% sRGB (Calman 2D)
Gamma: 2.01
CCT: 6469 K
| Samsung Galaxy Tab S7 Plus Super AMOLED, 2800x1752, 12.4" | Apple iPad Pro 12.9 2020 IPS, 2732x2048, 12.9" | Huawei MatePad Pro 10.8 IPS, 2560x1600, 10.8" | Samsung Galaxy Tab S6 SM-T860 Super AMOLED, 2560x1600, 10.5" | |
|---|---|---|---|---|
| Screen | 31% | -10% | -5% | |
| Brightness middle (cd/m²) | 441 | 625 42% | 606 37% | 446 1% |
| Brightness (cd/m²) | 447 | 599 34% | 579 30% | 445 0% |
| Brightness Distribution (%) | 98 | 87 -11% | 89 -9% | 86 -12% |
| Black Level * (cd/m²) | 0.47 | 0.32 | ||
| Colorchecker dE 2000 * | 2.4 | 1.3 46% | 2.9 -21% | 2.7 -13% |
| Colorchecker dE 2000 max. * | 4.1 | 2.7 34% | 6 -46% | 5.4 -32% |
| Greyscale dE 2000 * | 2.9 | 1.8 38% | 4.3 -48% | 2.1 28% |
| Gamma | 2.01 109% | 2.23 99% | 2.22 99% | 2.05 107% |
| CCT | 6469 100% | 6765 96% | 7272 89% | 6468 100% |
| Contrast (:1) | 1330 | 1894 |
* ... menor é melhor
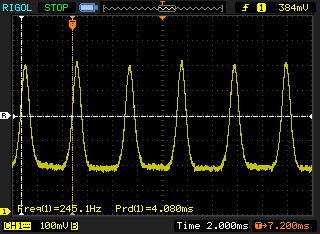
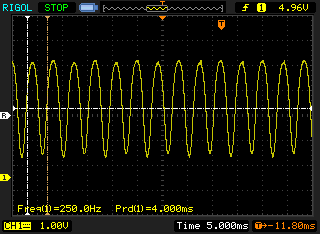
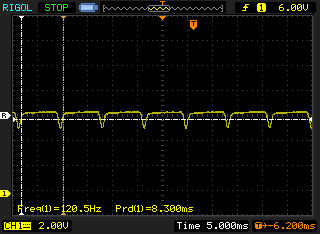
Cintilação da tela / PWM (modulação por largura de pulso)
| Tela tremeluzindo/PWM detectado | 245.1 Hz | ≤ 1 % configuração de brilho | |
| ≤ 1.73 brilho cd/m² | |||
A luz de fundo da tela pisca em 245.1 Hz (pior caso, por exemplo, utilizando PWM) Cintilação detectada em uma configuração de brilho de 1 % (1.73 cd/m²) e abaixo. Não deve haver cintilação ou PWM acima desta configuração de brilho. A frequência de 245.1 Hz é relativamente baixa, portanto, usuários sensíveis provavelmente notarão cintilação e sentirão fadiga ocular na configuração de brilho indicada e abaixo. Como a oscilação ocorre apenas em configurações de brilho muito baixo, não deve ser um problema em ambientes típicos de escritório. No entanto, o uso em condições de pouca luz pode ser cansativo para os olhos. [pwm_comparison] Em comparação: 52 % de todos os dispositivos testados não usam PWM para escurecer a tela. Se PWM foi detectado, uma média de 7754 (mínimo: 5 - máximo: 343500) Hz foi medida. | |||
Exibir tempos de resposta
| ↔ Tempo de resposta preto para branco | ||
|---|---|---|
| 2.4 ms ... ascensão ↗ e queda ↘ combinadas | ↗ 1.2 ms ascensão | 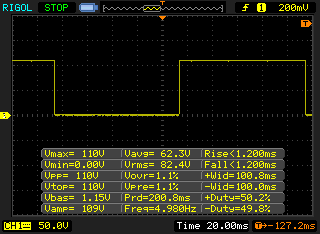 |
| ↘ 1.2 ms queda | ||
| A tela mostra taxas de resposta muito rápidas em nossos testes e deve ser muito adequada para jogos em ritmo acelerado. Em comparação, todos os dispositivos testados variam de 0.1 (mínimo) a 240 (máximo) ms. » 13 % de todos os dispositivos são melhores. Isso significa que o tempo de resposta medido é melhor que a média de todos os dispositivos testados (19.8 ms). | ||
| ↔ Tempo de resposta 50% cinza a 80% cinza | ||
| 3.2 ms ... ascensão ↗ e queda ↘ combinadas | ↗ 2 ms ascensão | 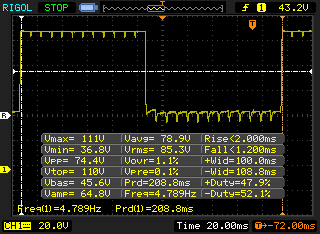 |
| ↘ 1.2 ms queda | ||
| A tela mostra taxas de resposta muito rápidas em nossos testes e deve ser muito adequada para jogos em ritmo acelerado. Em comparação, todos os dispositivos testados variam de 0.165 (mínimo) a 636 (máximo) ms. » 13 % de todos os dispositivos são melhores. Isso significa que o tempo de resposta medido é melhor que a média de todos os dispositivos testados (31 ms). | ||
| Geekbench 4.4 | |
| 64 Bit Single-Core Score | |
| Média da turma Tablet (4231 - 9867, n=8, últimos 2 anos) | |
| Média Qualcomm Snapdragon 865+ (Plus) (n=1) | |
| Huawei MatePad Pro 10.8 | |
| 64 Bit Multi-Core Score | |
| Média da turma Tablet (11144 - 28034, n=8, últimos 2 anos) | |
| Média Qualcomm Snapdragon 865+ (Plus) (n=1) | |
| Huawei MatePad Pro 10.8 | |
| Compute RenderScript Score | |
| Média da turma Tablet (8856 - 22243, n=5, últimos 2 anos) | |
| Média Qualcomm Snapdragon 865+ (Plus) (n=1) | |
| Huawei MatePad Pro 10.8 | |
| PCMark for Android | |
| Work performance score | |
| Média Qualcomm Snapdragon 865+ (Plus) (13629 - 19824, n=5) | |
| Samsung Galaxy Tab S7 Plus | |
| Samsung Galaxy Tab S6 SM-T860 | |
| Huawei MatePad Pro 10.8 | |
| Work 2.0 performance score | |
| Média Qualcomm Snapdragon 865+ (Plus) (12355 - 14979, n=6) | |
| Samsung Galaxy Tab S7 Plus | |
| Samsung Galaxy Tab S6 SM-T860 | |
| Huawei MatePad Pro 10.8 | |
| GFXBench 3.0 | |
| on screen Manhattan Onscreen OGL | |
| Média Qualcomm Snapdragon 865+ (Plus) (60 - 117, n=5) | |
| Samsung Galaxy Tab S7 Plus | |
| Média da turma Tablet (14 - 165, n=57, últimos 2 anos) | |
| Samsung Galaxy Tab S6 SM-T860 | |
| Huawei MatePad Pro 10.8 | |
| 1920x1080 1080p Manhattan Offscreen | |
| Média da turma Tablet (15 - 532, n=57, últimos 2 anos) | |
| Média Qualcomm Snapdragon 865+ (Plus) (110 - 134, n=5) | |
| Samsung Galaxy Tab S7 Plus | |
| Samsung Galaxy Tab S6 SM-T860 | |
| Huawei MatePad Pro 10.8 | |
| GFXBench 3.1 | |
| on screen Manhattan ES 3.1 Onscreen | |
| Média Qualcomm Snapdragon 865+ (Plus) (41 - 82, n=5) | |
| Média da turma Tablet (9.2 - 160, n=57, últimos 2 anos) | |
| Samsung Galaxy Tab S7 Plus | |
| Samsung Galaxy Tab S6 SM-T860 | |
| Huawei MatePad Pro 10.8 | |
| 1920x1080 Manhattan ES 3.1 Offscreen | |
| Média da turma Tablet (9.8 - 361, n=57, últimos 2 anos) | |
| Média Qualcomm Snapdragon 865+ (Plus) (75 - 93, n=5) | |
| Samsung Galaxy Tab S7 Plus | |
| Samsung Galaxy Tab S6 SM-T860 | |
| Huawei MatePad Pro 10.8 | |
| AnTuTu v8 - Total Score | |
| Apple iPad Pro 12.9 2020 | |
| Média Qualcomm Snapdragon 865+ (Plus) (490260 - 622888, n=4) | |
| Samsung Galaxy Tab S7 Plus | |
| Huawei MatePad Pro 10.8 | |
| Jetstream 2 - 2.0 Total | |
| Média da turma Tablet (35.8 - 420, n=55, últimos 2 anos) | |
| Apple iPad Pro 12.9 2020 (Safari 13) | |
| Samsung Galaxy Tab S7 Plus (Samsung Browser 12.1) | |
| Média Qualcomm Snapdragon 865+ (Plus) (69.8 - 75.5, n=4) | |
| Samsung Galaxy Tab S6 SM-T860 (Chrome 77.0.3865.116) | |
| Huawei MatePad Pro 10.8 (Huawei Browser V10.1.2) | |
| JetStream 1.1 - 1.1 Total | |
| Apple iPad Pro 12.9 2020 (Safari 13) | |
| Samsung Galaxy Tab S7 Plus (Samsung Browser 12.1) | |
| Média Qualcomm Snapdragon 865+ (Plus) (121.7 - 131.5, n=4) | |
| Samsung Galaxy Tab S6 SM-T860 (Chrome 77.0.3865.116) | |
| Huawei MatePad Pro 10.8 (Huawei Browser V10.1.2) | |
| WebXPRT 3 - Overall | |
| Média da turma Tablet (168 - 520, n=10, últimos 2 anos) | |
| Apple iPad Pro 12.9 2020 (Safari 13) | |
| Samsung Galaxy Tab S7 Plus (Samsung Browser 12.1) | |
| Média Qualcomm Snapdragon 865+ (Plus) (114 - 126, n=4) | |
| Samsung Galaxy Tab S6 SM-T860 (Chrome 77.0.3865.116) | |
| Huawei MatePad Pro 10.8 (Huawei Browser V10.1.2) | |
| Speedometer 2.0 - Result 2.0 | |
| Média da turma Tablet (6.8 - 790, n=33, últimos 2 anos) | |
| Apple iPad Pro 12.9 2020 (Safari 13) | |
| Samsung Galaxy Tab S7 Plus (Samsung Browser 12.1) | |
| Samsung Galaxy Tab S6 SM-T860 (Chrome 77.0.3865.116) | |
| Média Qualcomm Snapdragon 865+ (Plus) (41.2 - 73.3, n=4) | |
| Huawei MatePad Pro 10.8 (Huawei Browser V10.1.2) | |
| Octane V2 - Total Score | |
| Média da turma Tablet (1633 - 138481, n=71, últimos 2 anos) | |
| Apple iPad Pro 12.9 2020 (Safari 13) | |
| Samsung Galaxy Tab S7 Plus (Samsung Browser 12.1) | |
| Média Qualcomm Snapdragon 865+ (Plus) (25953 - 27360, n=4) | |
| Samsung Galaxy Tab S6 SM-T860 (Chrome 77.0.3865.116) | |
| Huawei MatePad Pro 10.8 (Huawei Browser V10.1.2) | |
| Mozilla Kraken 1.1 - Total | |
| Huawei MatePad Pro 10.8 (Huawei Browser V10.1.2) | |
| Samsung Galaxy Tab S6 SM-T860 (Chrome 77.0.3865.116) | |
| Samsung Galaxy Tab S7 Plus (Samsung Browser 12.1) | |
| Média Qualcomm Snapdragon 865+ (Plus) (1854 - 1947, n=4) | |
| Média da turma Tablet (243 - 16233, n=65, últimos 2 anos) | |
| Apple iPad Pro 12.9 2020 (Safari 13) | |
* ... menor é melhor
| Samsung Galaxy Tab S7 Plus | Huawei MatePad Pro 10.8 | Samsung Galaxy Tab S6 SM-T860 | Média 256 GB UFS 3.1 Flash | Média da turma Tablet | |
|---|---|---|---|---|---|
| AndroBench 3-5 | -2% | -20% | 22% | 58% | |
| Sequential Read 256KB (MB/s) | 1675 | 1789 7% | 1416 -15% | 1771 ? 6% | 2073 ? 24% |
| Sequential Write 256KB (MB/s) | 732 | 399 -45% | 522 -29% | 1233 ? 68% | 1667 ? 128% |
| Random Read 4KB (MB/s) | 230.1 | 224.6 -2% | 191.6 -17% | 289 ? 26% | 275 ? 20% |
| Random Write 4KB (MB/s) | 205 | 262.4 28% | 170.2 -17% | 321 ? 57% | 324 ? 58% |
| Sequential Read 256KB SDCard (MB/s) | 85.8 ? | 82.4 ? -4% | 70.5 ? -18% | 75.9 ? -12% | |
| Sequential Write 256KB SDCard (MB/s) | 69.3 ? | 71.7 ? 3% | 54.5 ? -21% | 61.9 ? -11% |
PUBG Compare
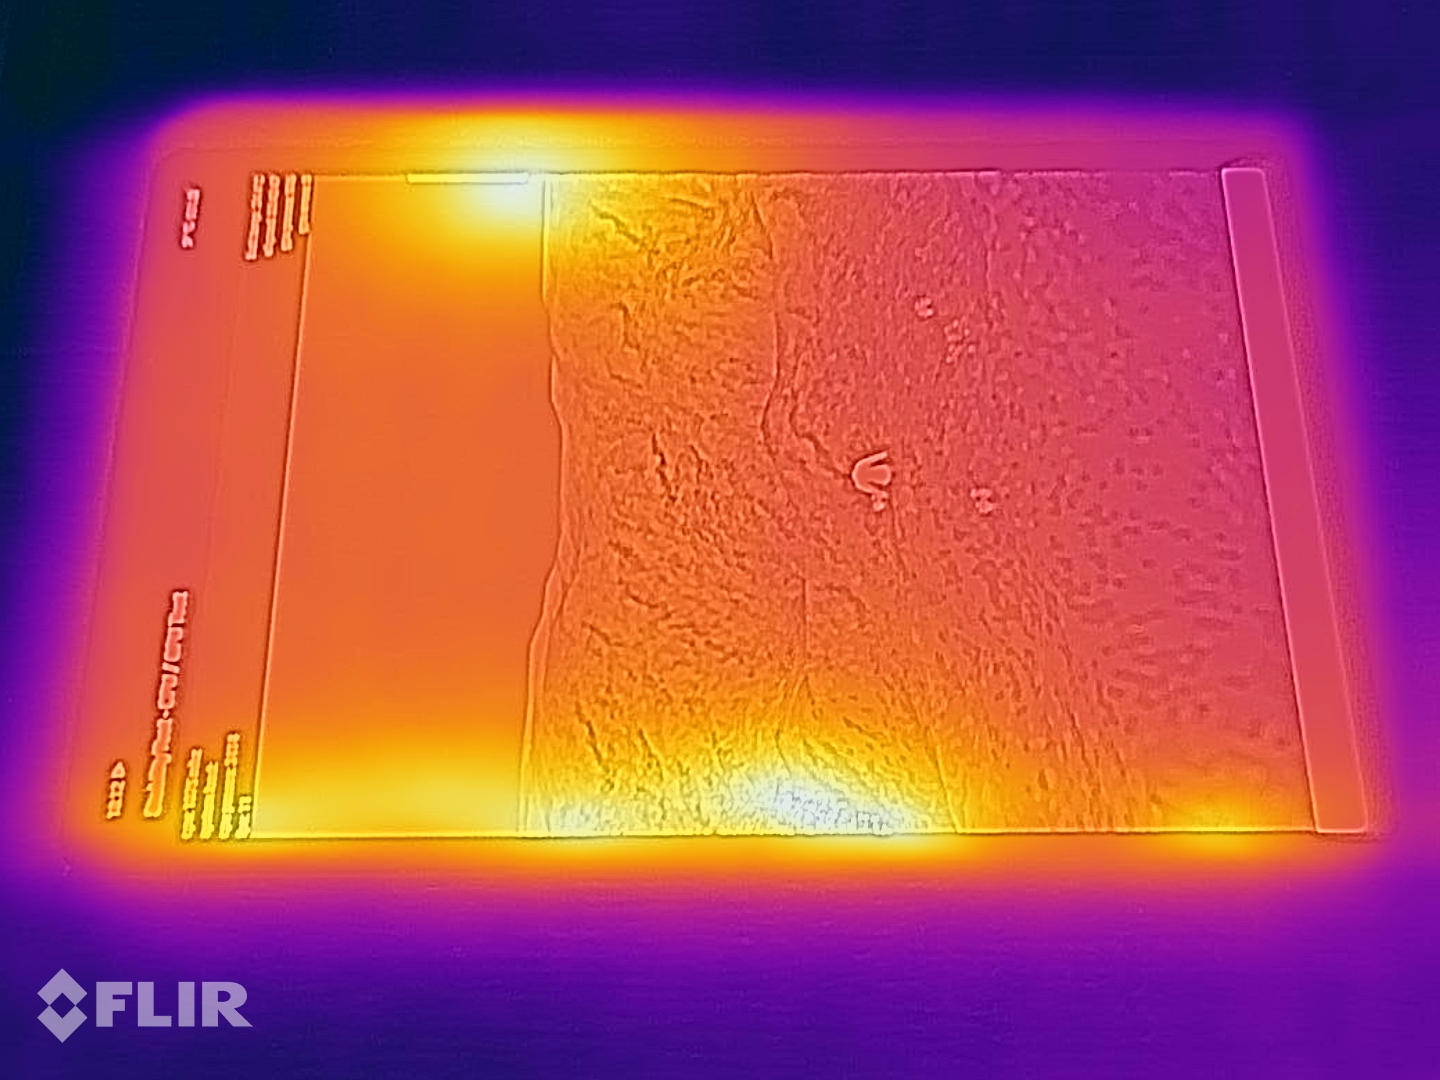
(+) A temperatura máxima no lado superior é 32.3 °C / 90 F, em comparação com a média de 33.7 °C / 93 F , variando de 20.7 a 53.2 °C para a classe Tablet.
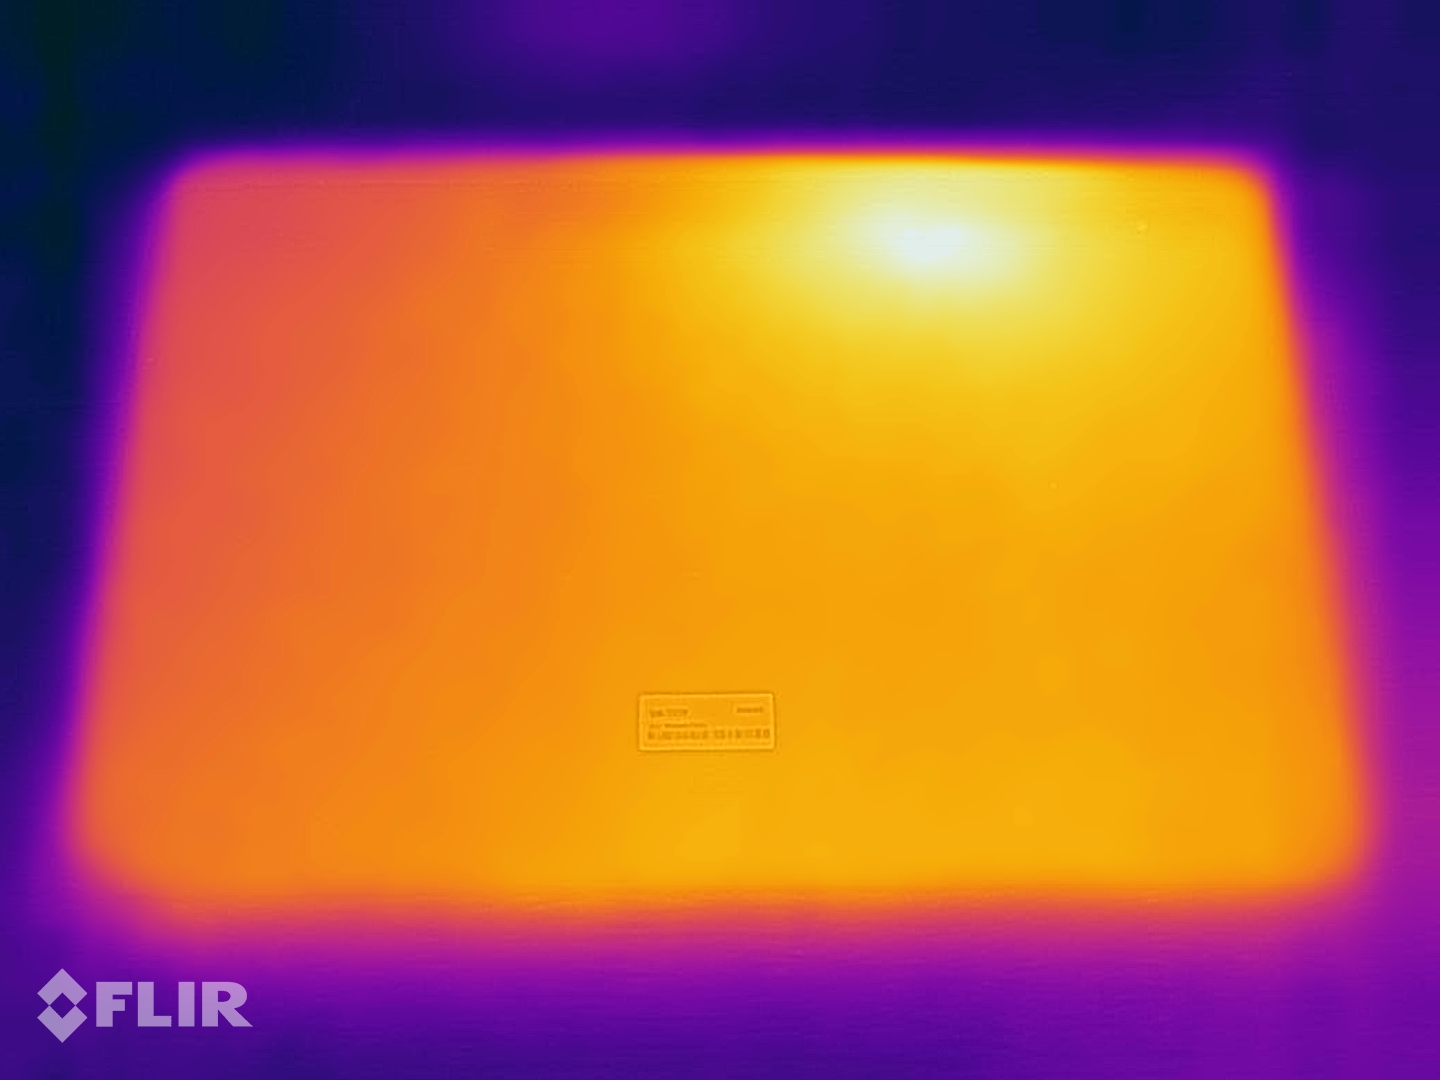
(+) A parte inferior aquece até um máximo de 28 °C / 82 F, em comparação com a média de 33.2 °C / 92 F
(+) Em uso inativo, a temperatura média para o lado superior é 24 °C / 75 F, em comparação com a média do dispositivo de 30 °C / ### class_avg_f### F.
Samsung Galaxy Tab S7 Plus análise de áudio
(+) | os alto-falantes podem tocar relativamente alto (###valor### dB)
Graves 100 - 315Hz
(±) | graves reduzidos - em média 12.9% menor que a mediana
(±) | a linearidade dos graves é média (10.3% delta para a frequência anterior)
Médios 400 - 2.000 Hz
(+) | médios equilibrados - apenas 3.8% longe da mediana
(+) | médios são lineares (2.7% delta para frequência anterior)
Altos 2 - 16 kHz
(+) | agudos equilibrados - apenas 2.9% longe da mediana
(+) | os máximos são lineares (5.5% delta da frequência anterior)
Geral 100 - 16.000 Hz
(+) | o som geral é linear (10.9% diferença em relação à mediana)
Comparado com a mesma classe
» 11% de todos os dispositivos testados nesta classe foram melhores, 3% semelhantes, 87% piores
» O melhor teve um delta de 7%, a média foi 20%, o pior foi 129%
Comparado com todos os dispositivos testados
» 6% de todos os dispositivos testados foram melhores, 2% semelhantes, 92% piores
» O melhor teve um delta de 4%, a média foi 23%, o pior foi 134%
Apple iPad Pro 12.9 2020 análise de áudio
(±) | o volume do alto-falante é médio, mas bom (###valor### dB)
Graves 100 - 315Hz
(±) | graves reduzidos - em média 6.6% menor que a mediana
(±) | a linearidade dos graves é média (10.6% delta para a frequência anterior)
Médios 400 - 2.000 Hz
(+) | médios equilibrados - apenas 4.2% longe da mediana
(+) | médios são lineares (4.6% delta para frequência anterior)
Altos 2 - 16 kHz
(+) | agudos equilibrados - apenas 4.1% longe da mediana
(+) | os máximos são lineares (5.5% delta da frequência anterior)
Geral 100 - 16.000 Hz
(+) | o som geral é linear (11.2% diferença em relação à mediana)
Comparado com a mesma classe
» 11% de todos os dispositivos testados nesta classe foram melhores, 4% semelhantes, 85% piores
» O melhor teve um delta de 7%, a média foi 20%, o pior foi 129%
Comparado com todos os dispositivos testados
» 7% de todos os dispositivos testados foram melhores, 2% semelhantes, 91% piores
» O melhor teve um delta de 4%, a média foi 23%, o pior foi 134%
| desligado | |
| Ocioso | |
| Carga |
|
Key:
min: | |
| Samsung Galaxy Tab S7 Plus 10090 mAh | Apple iPad Pro 12.9 2020 9720 mAh | Huawei MatePad Pro 10.8 7250 mAh | Samsung Galaxy Tab S6 SM-T860 7040 mAh | |
|---|---|---|---|---|
| Power Consumption | -77% | -17% | 12% | |
| Idle Minimum * (Watt) | 2.41 | 1.22 49% | 1.98 18% | 1.96 19% |
| Idle Average * (Watt) | 3.4 | 8.68 -155% | 5.66 -66% | 2.8 18% |
| Idle Maximum * (Watt) | 3.43 | 8.75 -155% | 5.69 -66% | 2.82 18% |
| Load Average * (Watt) | 6.63 | 11.72 -77% | 6.96 -5% | 5.31 20% |
| Load Maximum * (Watt) | 10.29 | 15.25 -48% | 6.98 32% | 11.91 -16% |
* ... menor é melhor
| Samsung Galaxy Tab S7 Plus 10090 mAh | Apple iPad Pro 12.9 2020 9720 mAh | Huawei MatePad Pro 10.8 7250 mAh | Samsung Galaxy Tab S6 SM-T860 7040 mAh | |
|---|---|---|---|---|
| Duração da bateria | 46% | 58% | 28% | |
| Reader / Idle (h) | 15 | 30.5 103% | 31.3 109% | 21.3 42% |
| H.264 (h) | 10.3 | 12.3 19% | 15.2 48% | 14.5 41% |
| WiFi v1.3 (h) | 7.1 | 15.1 113% | 14.9 110% | 9.3 31% |
| Load (h) | 5.9 | 2.8 -53% | 3.9 -34% | 5.7 -3% |
Pro
Contra
Veredicto - Tablet poderoso, mas não o top

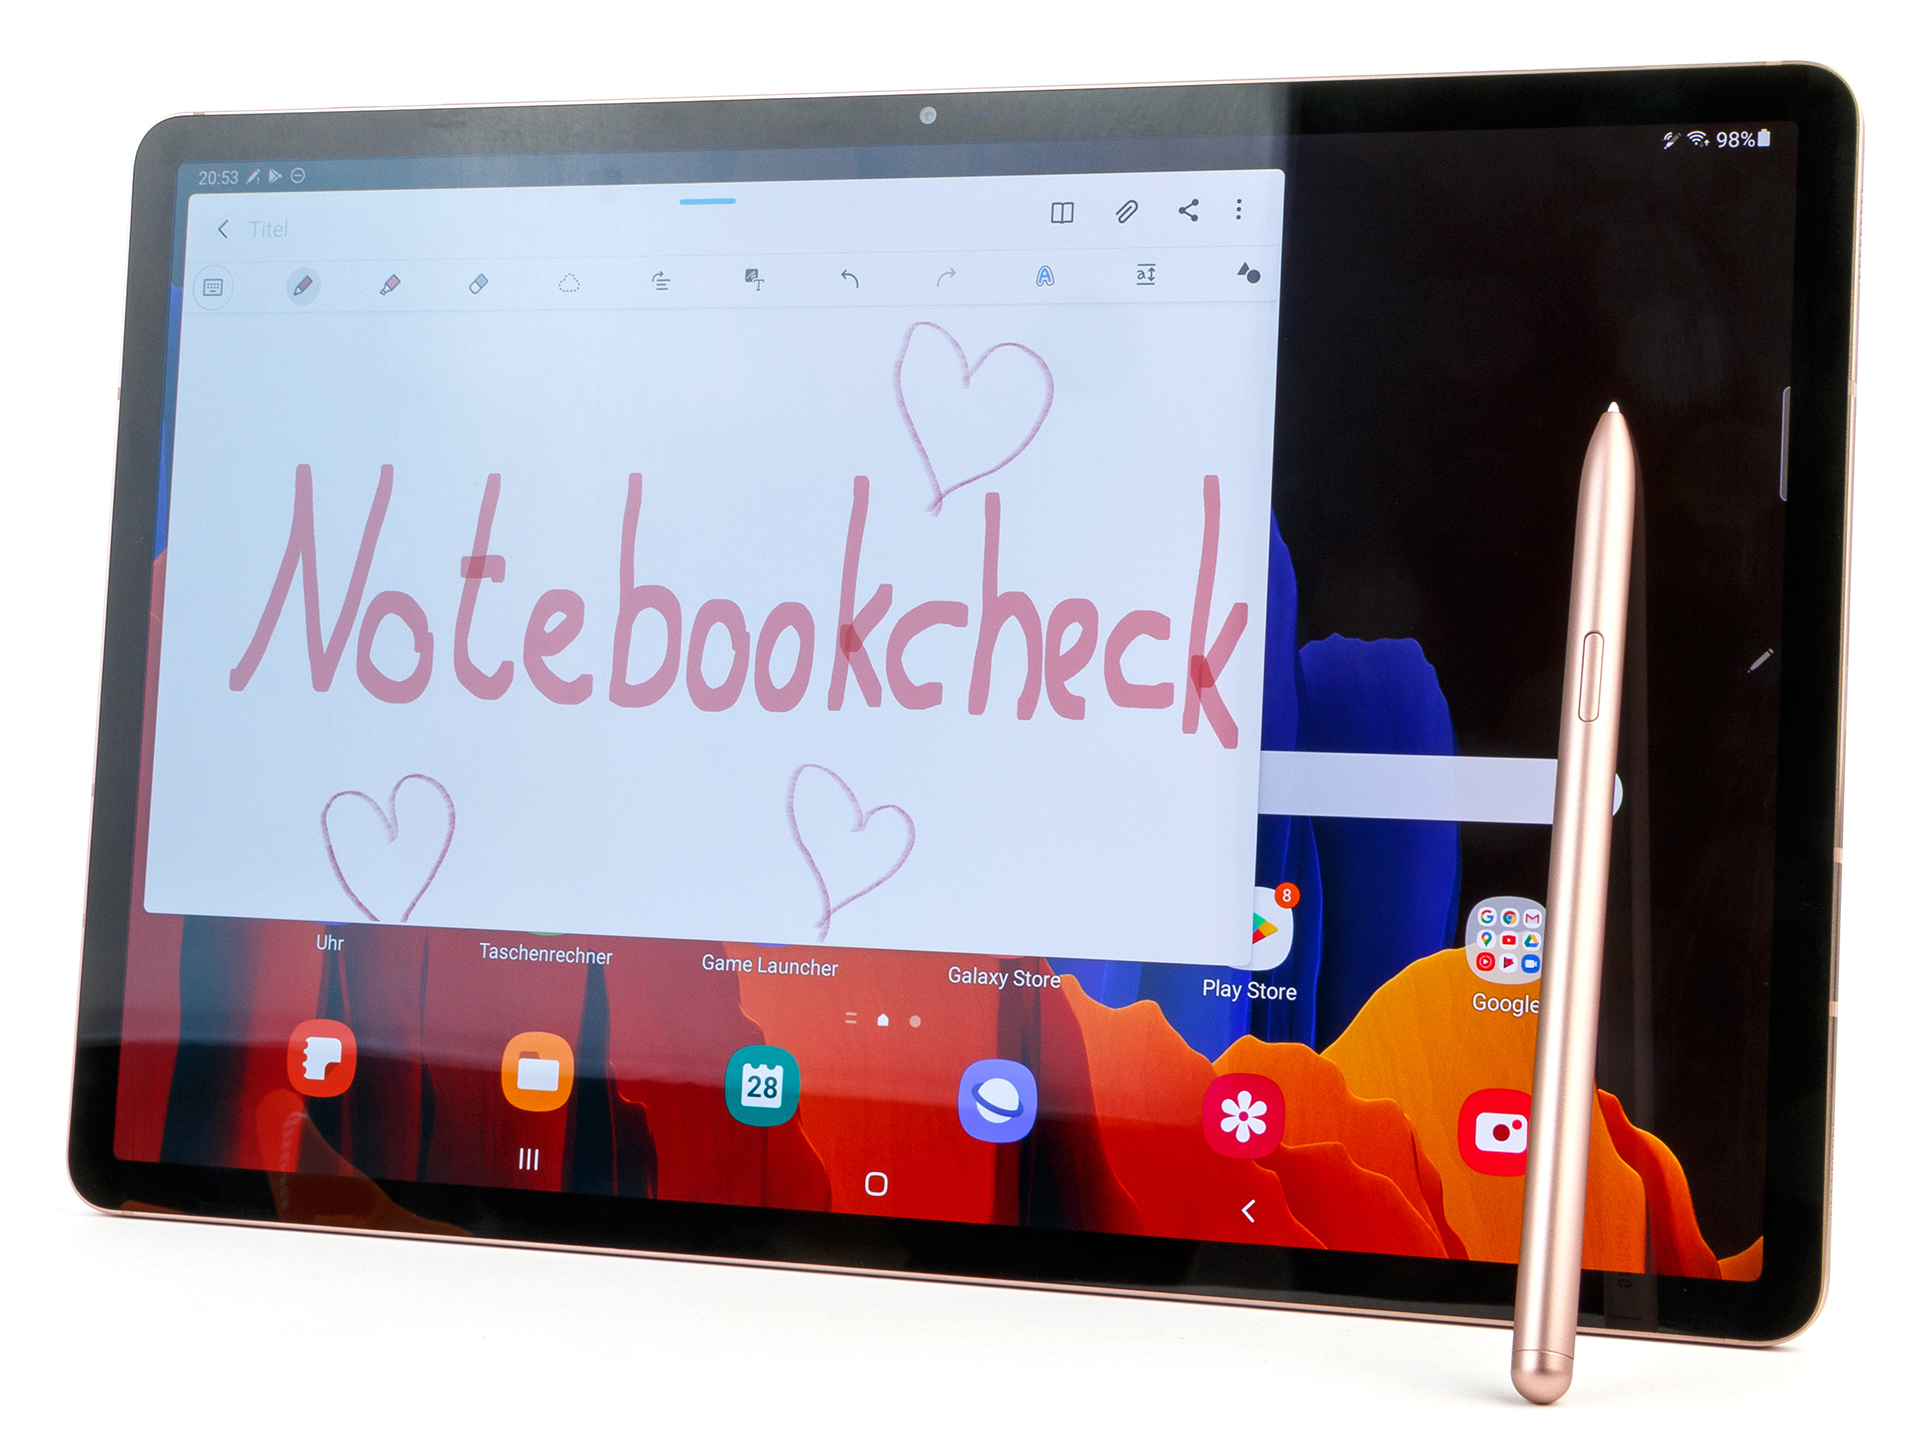
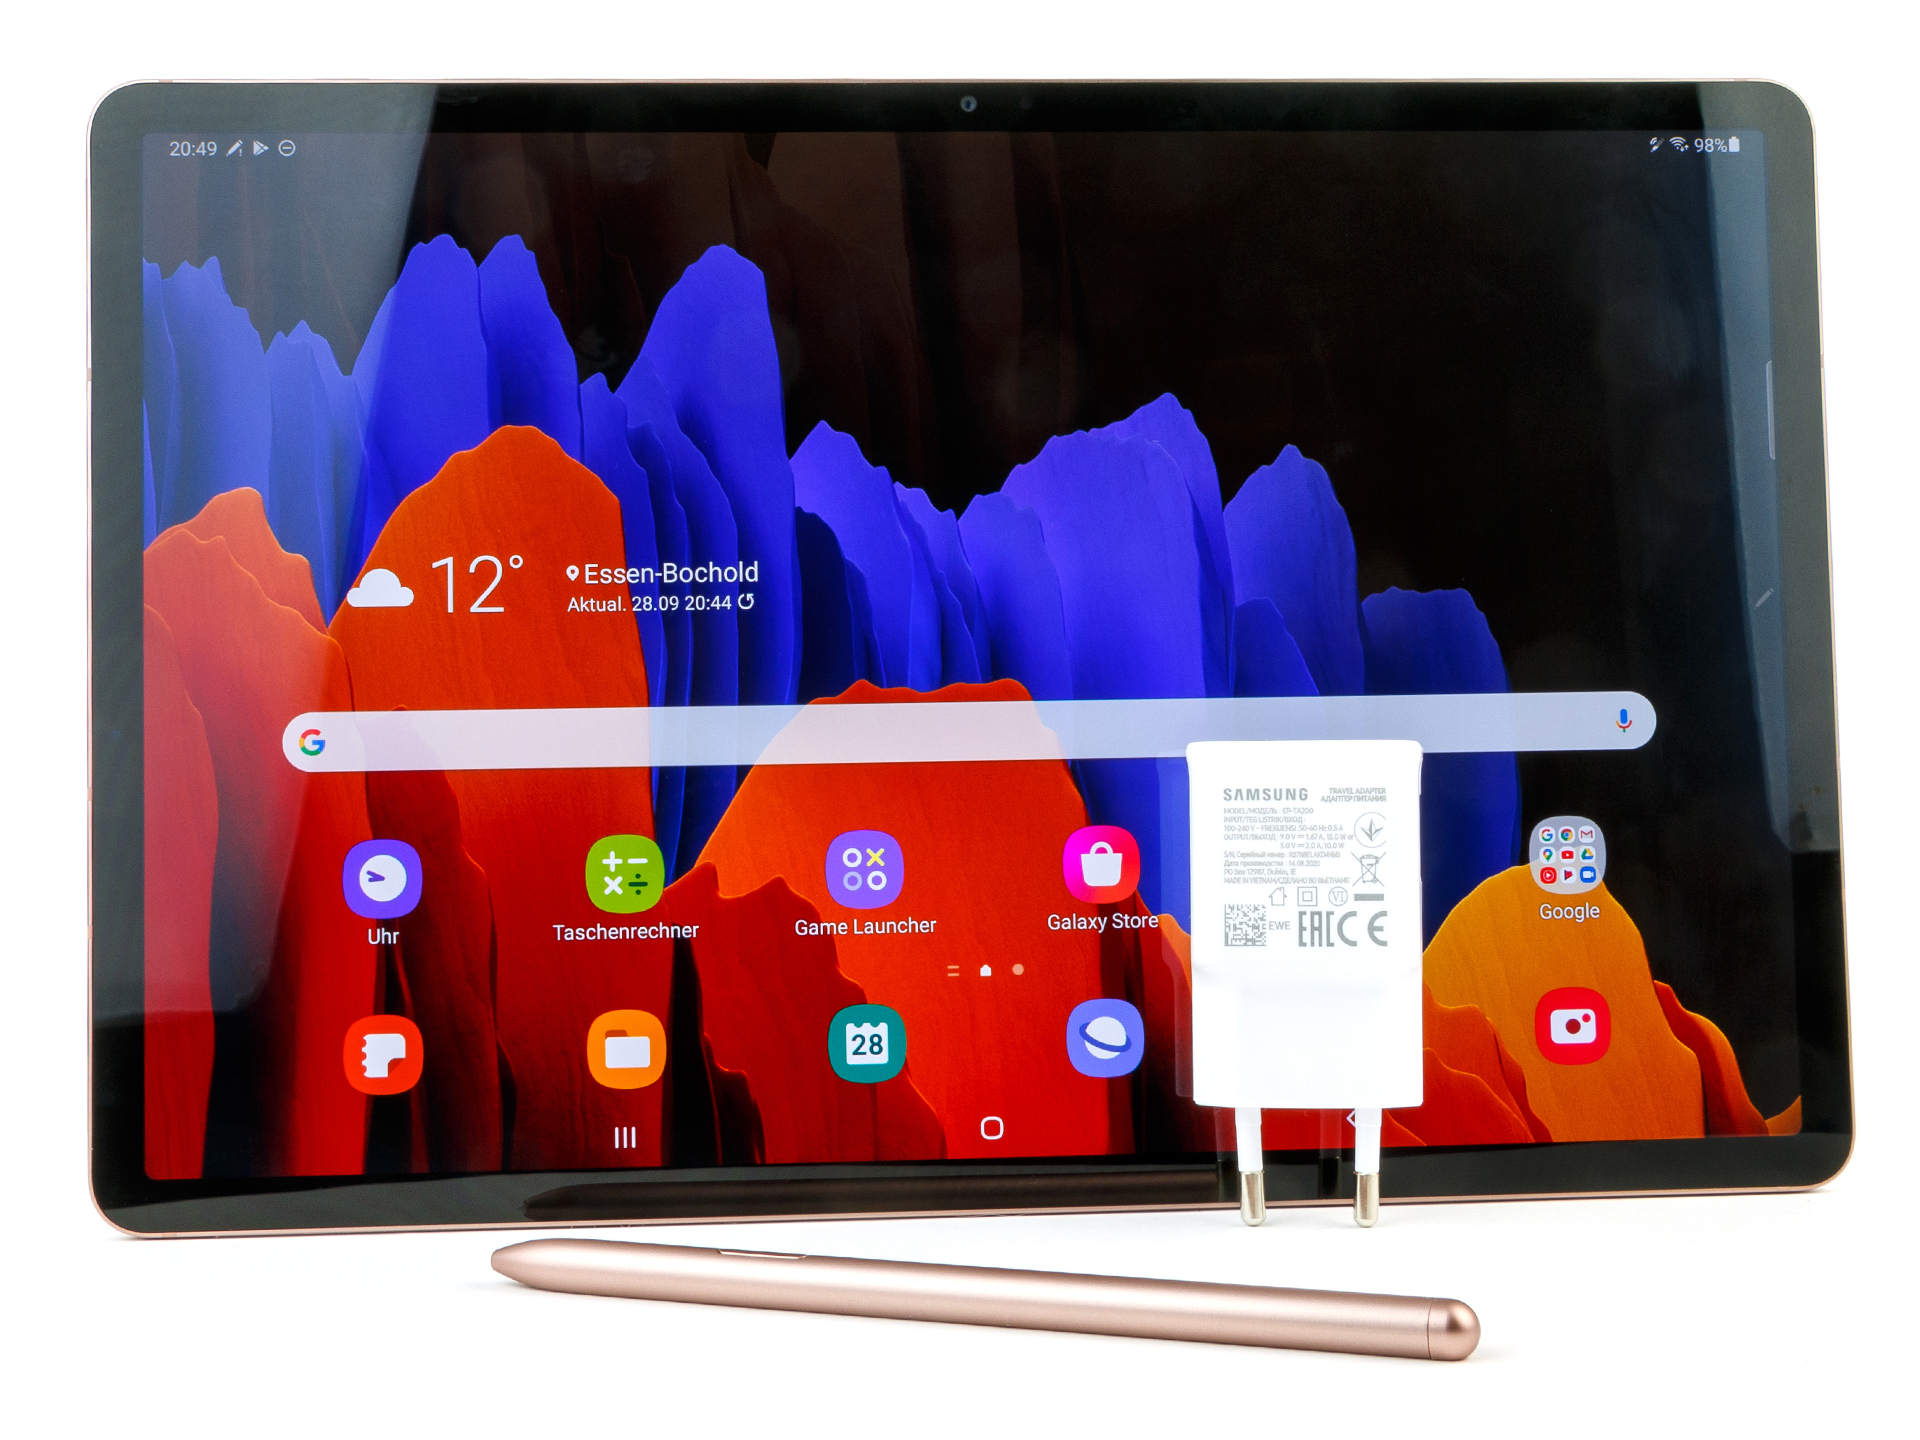
O Samsung Galaxy Tab S7+ é atualmente o maior tablet premium no espaço Android. A tela Super AMOLED de 12,4 polegadas oferece uma excelente reprodução de cores. No entanto, não é suficientemente brilhante para ser utilizada em exteriores. É uma pena que a Samsung não tenha conseguido implementar aqui a sua tecnologia Dynamic AMOLED.
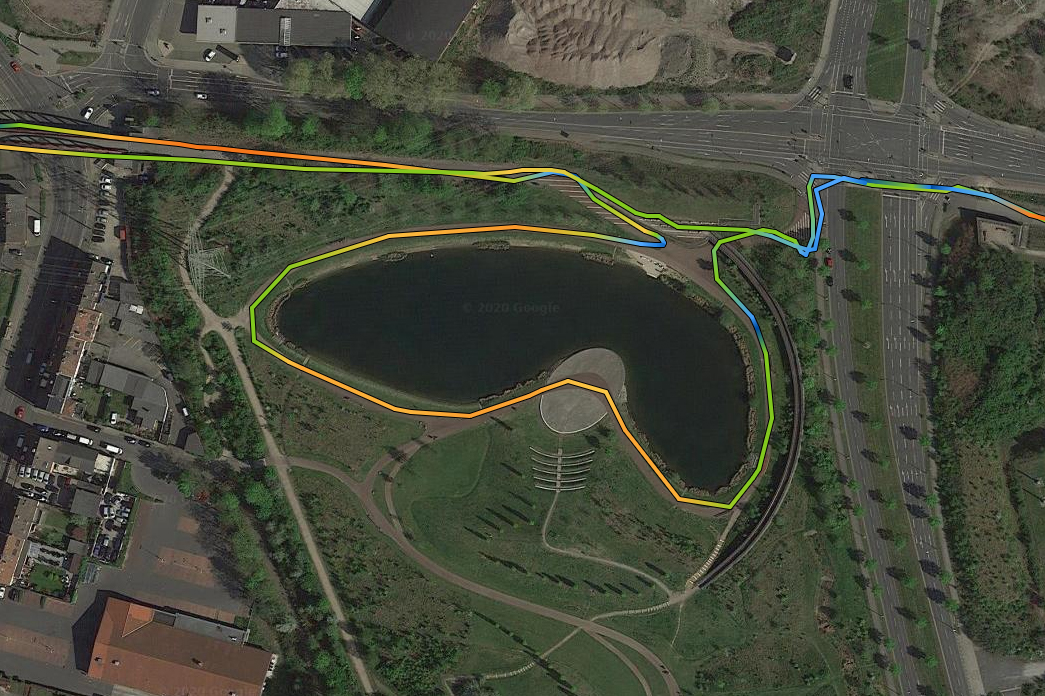
O desempenho do Wi-Fi é muito instável. No entanto, no uso diário, o desempenho nunca cai abaixo de um limite crítico. No entanto, a Samsung deve fazer algumas melhorias aqui. Isto também se aplica às durações da bateria, que são bastante fracas mesmo com brilho mínimo, quando os módulos de comunicação estão habilitados.
O Samsung Galaxy Tab S7+ é um tablet premium poderoso, adequado para consumo de mídia e uso profissional.
Em seu núcleo, o Tab S7+ é bom. Aqui a Samsung tem feito muito certo. O Tab S7+ possui um SoC muito rápido e sua tela de 120 Hz melhora a experiência do usuário não apenas durante os jogos. A S Pen, incluída na caixa, é uma ferramenta poderosa para fazer anotações, desenhar e fazer apresentações. Além disso, o tablet Android também vem com um modem 5G opcional, o que deve tornar o Tab S7+ apto para o futuro se a Samsung cumprir suas promessas em relação às atualizações de software.
Samsung Galaxy Tab S7 Plus
- 08/31/2022 v7 (old)
Daniel Schmidt