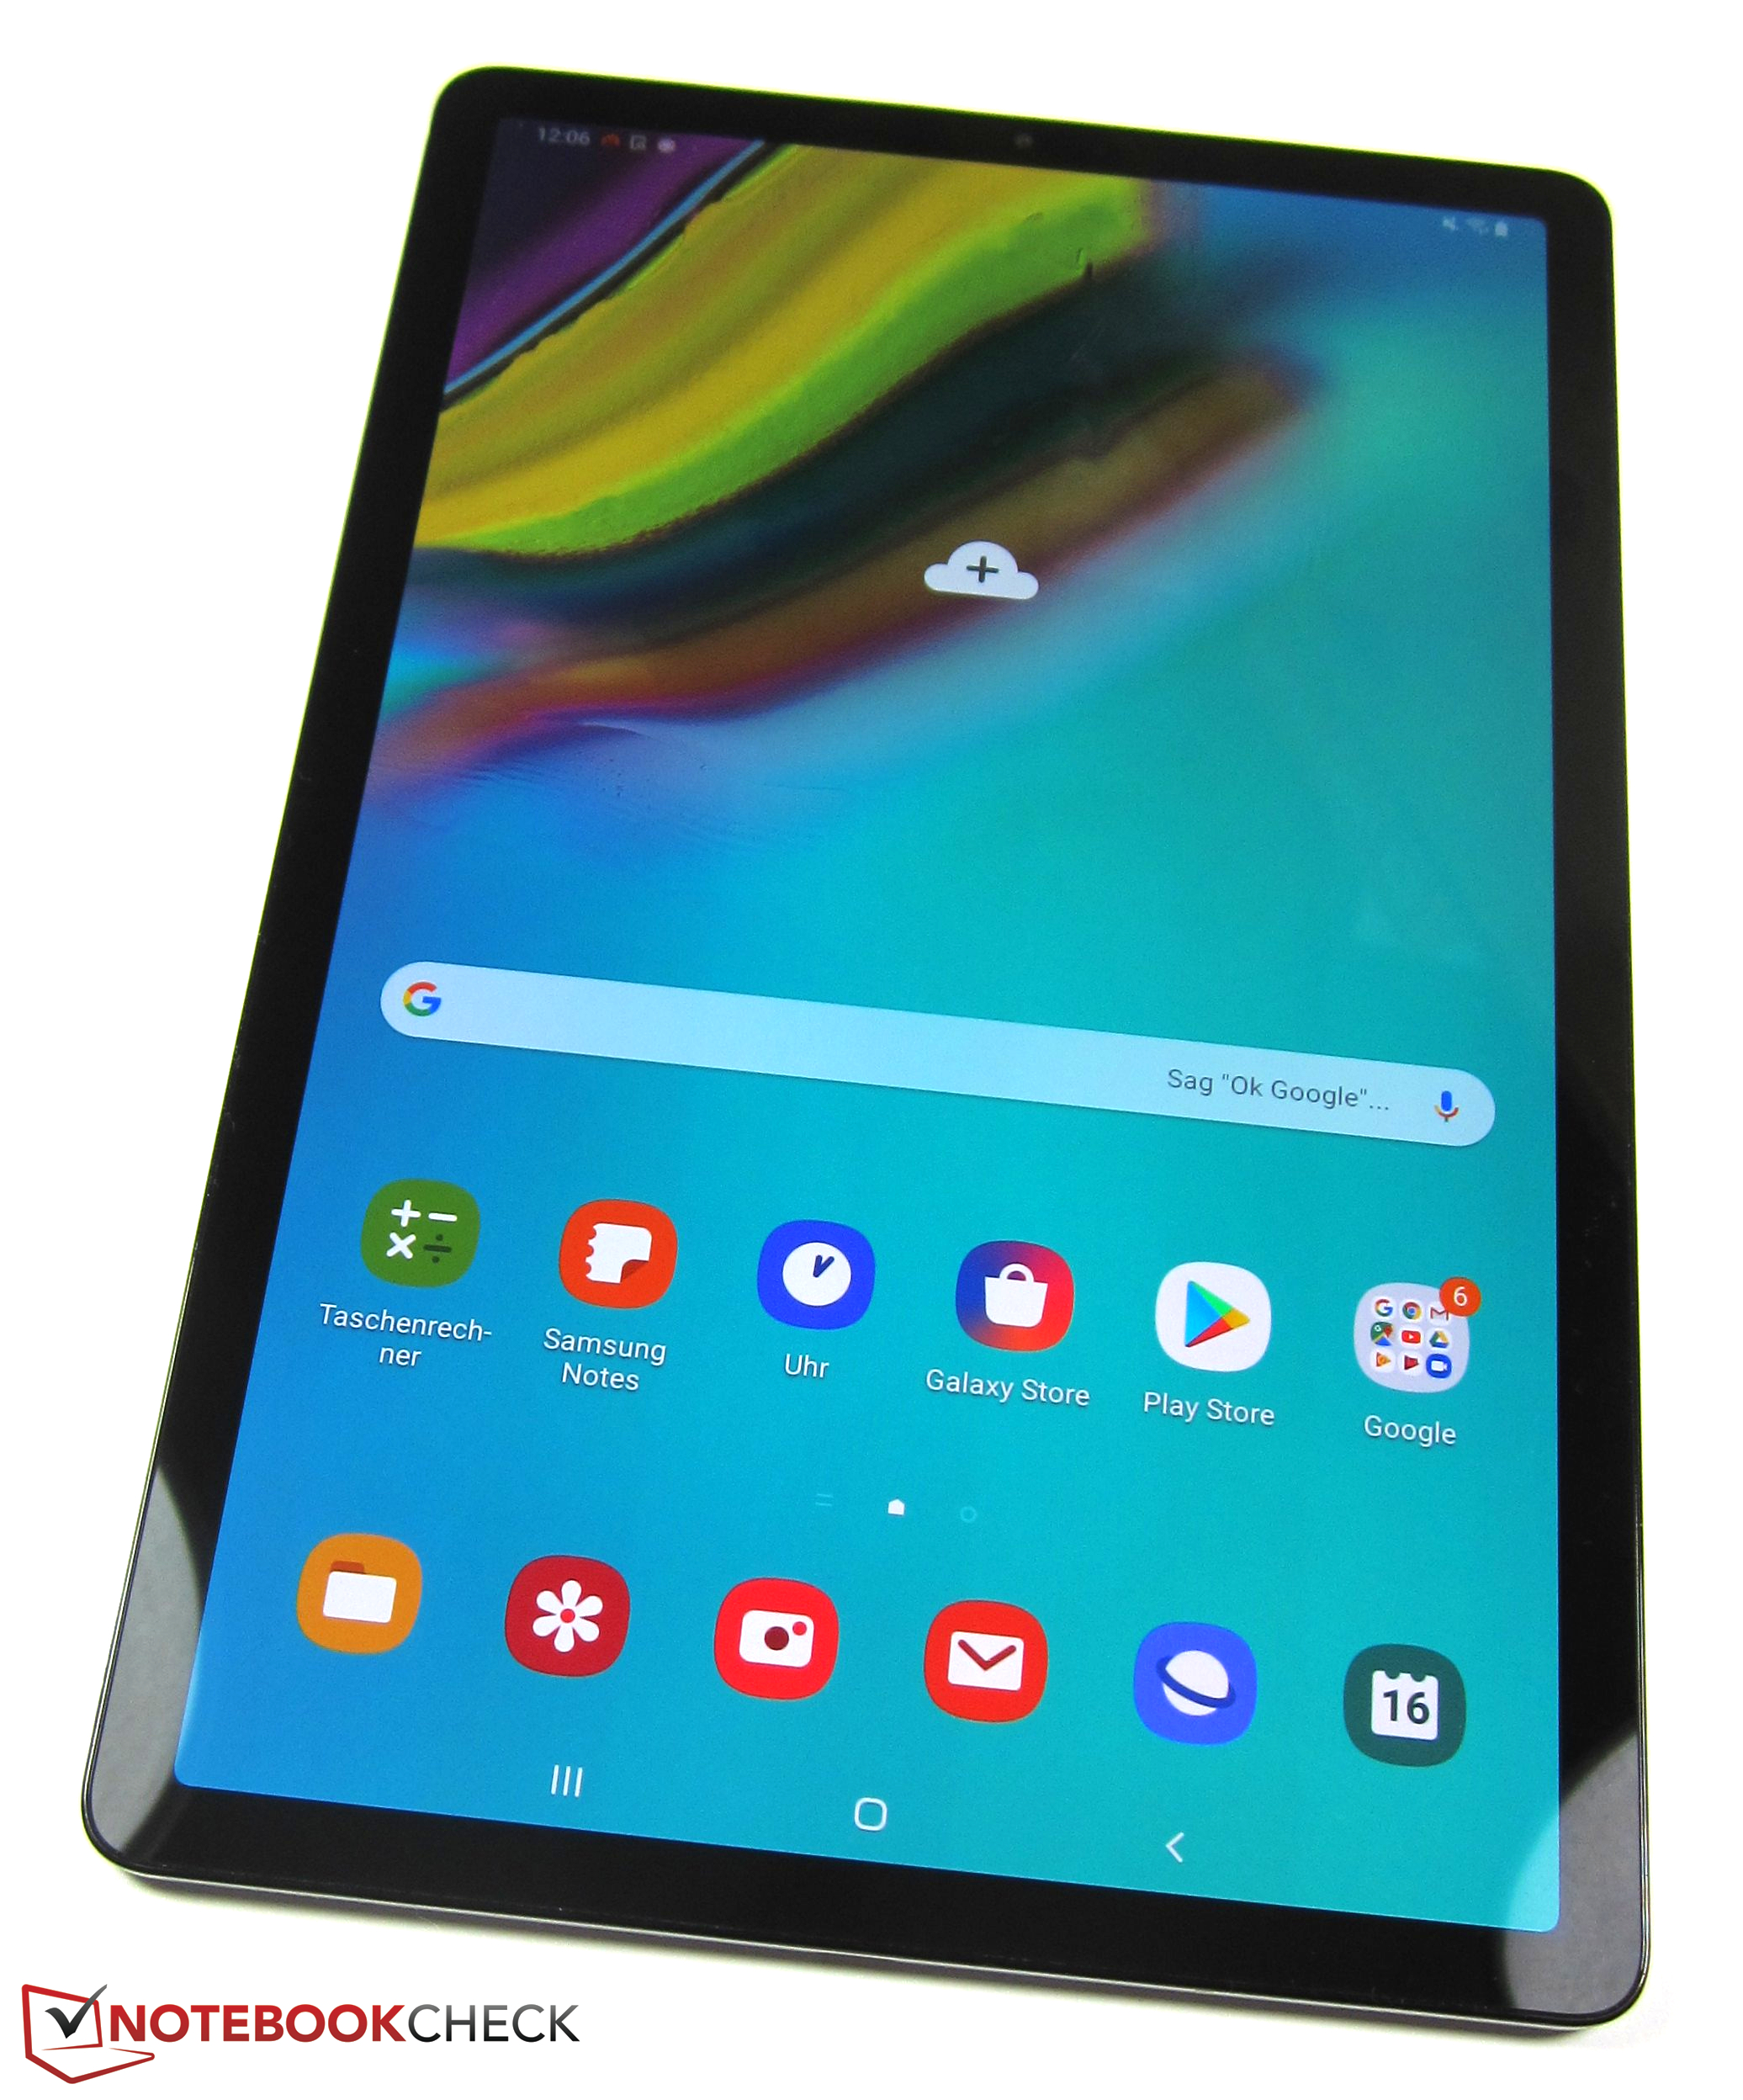
Breve Análise do Tablet Samsung Galaxy Tab S5e (Wi-Fi)


| |||||||||||||||||||||||||
iluminação: 90 %
iluminação com acumulador: 452 cd/m²
Contraste: ∞:1 (Preto: 0 cd/m²)
ΔE ColorChecker Calman: 1.7 | ∀{0.5-29.43 Ø4.72}
ΔE Greyscale Calman: 2.4 | ∀{0.09-98 Ø4.97}
97.5% sRGB (Calman 2D)
Gamma: 2.07
CCT: 6337 K
| Samsung Galaxy Tab S5e SM-T720 Super AMOLED, 2560x1600, 10.5" | Amazon Fire HD 10 2017 IPS, 1920x1200, 10.1" | Apple iPad Air 3 2019 IPS, 2224x1668, 10.5" | Huawei MediaPad M5 10.8 IPS, 2560x1600, 10.8" | Lenovo Tab P10 IPS, 1920x1200, 10.1" | Samsung Galaxy Tab S4 Super AMOLED, 2560x1600, 10.5" | |
|---|---|---|---|---|---|---|
| Screen | -69% | -2% | -34% | -131% | -14% | |
| Brightness middle (cd/m²) | 452 | 426 -6% | 515 14% | 382 -15% | 522 15% | 474 5% |
| Brightness (cd/m²) | 453 | 399 -12% | 483 7% | 378 -17% | 495 9% | 477 5% |
| Brightness Distribution (%) | 90 | 91 1% | 90 0% | 92 2% | 84 -7% | 91 1% |
| Black Level * (cd/m²) | 0.38 | 0.41 | 0.24 | 0.41 | ||
| Colorchecker dE 2000 * | 1.7 | 4.5 -165% | 1.6 6% | 2.8 -65% | 6.7 -294% | 2.5 -47% |
| Colorchecker dE 2000 max. * | 3.7 | 7.9 -114% | 4.4 -19% | 6 -62% | 12.2 -230% | 5.8 -57% |
| Greyscale dE 2000 * | 2.4 | 5.2 -117% | 2.8 -17% | 3.5 -46% | 9.1 -279% | 2.1 12% |
| Gamma | 2.07 106% | 2.23 99% | 2.21 100% | 2.33 94% | 2.14 103% | 2.08 106% |
| CCT | 6337 103% | 6875 95% | 6944 94% | 6903 94% | 9417 69% | 6281 103% |
| Contrast (:1) | 1121 | 1256 | 1592 | 1273 |
* ... menor é melhor
Cintilação da tela / PWM (modulação por largura de pulso)
| Tela tremeluzindo/PWM detectado | 245.1 Hz | ≤ 99 % configuração de brilho | 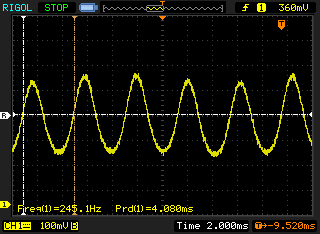 |
A luz de fundo da tela pisca em 245.1 Hz (pior caso, por exemplo, utilizando PWM) Cintilação detectada em uma configuração de brilho de 99 % e abaixo. Não deve haver cintilação ou PWM acima desta configuração de brilho. A frequência de 245.1 Hz é relativamente baixa, portanto, usuários sensíveis provavelmente notarão cintilação e sentirão fadiga ocular na configuração de brilho indicada e abaixo. [pwm_comparison] Em comparação: 52 % de todos os dispositivos testados não usam PWM para escurecer a tela. Se PWM foi detectado, uma média de 7753 (mínimo: 5 - máximo: 343500) Hz foi medida. | |||
Exibir tempos de resposta
| ↔ Tempo de resposta preto para branco | ||
|---|---|---|
| 4 ms ... ascensão ↗ e queda ↘ combinadas | ↗ 2 ms ascensão | 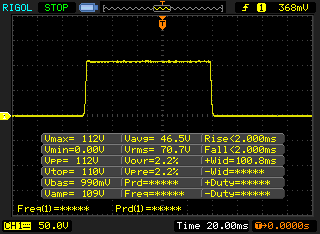 |
| ↘ 2 ms queda | ||
| A tela mostra taxas de resposta muito rápidas em nossos testes e deve ser muito adequada para jogos em ritmo acelerado. Em comparação, todos os dispositivos testados variam de 0.1 (mínimo) a 240 (máximo) ms. » 16 % de todos os dispositivos são melhores. Isso significa que o tempo de resposta medido é melhor que a média de todos os dispositivos testados (19.8 ms). | ||
| ↔ Tempo de resposta 50% cinza a 80% cinza | ||
| 5.6 ms ... ascensão ↗ e queda ↘ combinadas | ↗ 2.8 ms ascensão | 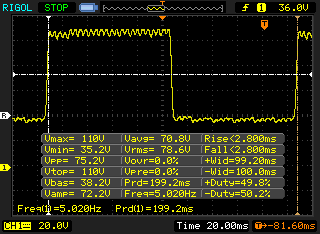 |
| ↘ 2.8 ms queda | ||
| A tela mostra taxas de resposta muito rápidas em nossos testes e deve ser muito adequada para jogos em ritmo acelerado. Em comparação, todos os dispositivos testados variam de 0.165 (mínimo) a 636 (máximo) ms. » 18 % de todos os dispositivos são melhores. Isso significa que o tempo de resposta medido é melhor que a média de todos os dispositivos testados (31 ms). | ||
| Basemark GPU 1.1 | |
| 1920x1080 Vulkan Medium Offscreen | |
| Samsung Galaxy Tab S4 | |
| Média Qualcomm Snapdragon 670 (12 - 12.5, n=2) | |
| Samsung Galaxy Tab S5e SM-T720 | |
| Vulkan Medium Native | |
| Samsung Galaxy Tab S4 | |
| Média Qualcomm Snapdragon 670 (7.67 - 11.6, n=2) | |
| Samsung Galaxy Tab S5e SM-T720 | |
| 1920x1080 OpenGL Medium Offscreen | |
| Samsung Galaxy Tab S4 | |
| Média Qualcomm Snapdragon 670 (13.1 - 13.8, n=2) | |
| Samsung Galaxy Tab S5e SM-T720 | |
| VRMark - Amber Room | |
| Samsung Galaxy Tab S4 | |
| Média Qualcomm Snapdragon 670 (1423 - 1473, n=2) | |
| Samsung Galaxy Tab S5e SM-T720 | |
| Basemark ES 3.1 / Metal - offscreen Overall Score | |
| Média da turma Tablet (255 - 5784, n=6, últimos 2 anos) | |
| Apple iPad Air 3 2019 | |
| Média Qualcomm Snapdragon 670 (444 - 447, n=2) | |
| Samsung Galaxy Tab S5e SM-T720 | |
| Jetstream 2 - 2.0 Total | |
| Média da turma Tablet (35.8 - 420, n=55, últimos 2 anos) | |
| Apple iPad Air 3 2019 (Safari Mobile 12) | |
| Samsung Galaxy Tab S5e SM-T720 (Chrome 74.0.3729.136) | |
| Média Qualcomm Snapdragon 670 (32.1 - 33.6, n=4) | |
| WebXPRT 3 - Overall | |
| Média da turma Tablet (168 - 520, n=10, últimos 2 anos) | |
| Apple iPad Air 3 2019 (Safari Mobile 12) | |
| Samsung Galaxy Tab S4 (Samsung Browser 8.0) | |
| Samsung Galaxy Tab S5e SM-T720 (Chrome 74.0.3729.136) | |
| Média Qualcomm Snapdragon 670 (53 - 66, n=3) | |
| Speedometer 2.0 - Result 2.0 | |
| Média da turma Tablet (6.8 - 790, n=33, últimos 2 anos) | |
| Apple iPad Air 3 2019 (Safari Mobile 12) | |
| Samsung Galaxy Tab S5e SM-T720 (Chrome 74.0.3729.136) | |
| Média Qualcomm Snapdragon 670 (29.6 - 33.7, n=3) | |
| Octane V2 - Total Score | |
| Média da turma Tablet (1633 - 138481, n=69, últimos 2 anos) | |
| Apple iPad Air 3 2019 (Safari Mobile 12) | |
| Samsung Galaxy Tab S4 (Samsung Browser 8.0) | |
| Samsung Galaxy Tab S5e SM-T720 (Chrome 74.0.3729.136) | |
| Média Qualcomm Snapdragon 670 (10245 - 11312, n=4) | |
| Amazon Fire HD 10 2017 (Amazon Silk 61.2) | |
| Huawei MediaPad M5 10.8 (Chrome 65) | |
| Lenovo Tab P10 (Chrome 71) | |
| Mozilla Kraken 1.1 - Total | |
| Lenovo Tab P10 (Chrome 71) | |
| Huawei MediaPad M5 10.8 (Chrome 65) | |
| Amazon Fire HD 10 2017 (Amazon Silk 61.2) | |
| Média Qualcomm Snapdragon 670 (3361 - 3655, n=4) | |
| Samsung Galaxy Tab S5e SM-T720 (Chrome 74.0.3729.136) | |
| Samsung Galaxy Tab S4 (Samsung Browser 8.0) | |
| Média da turma Tablet (243 - 16233, n=63, últimos 2 anos) | |
| Apple iPad Air 3 2019 (Safari Mobile 12) | |
* ... menor é melhor
| Samsung Galaxy Tab S5e SM-T720 | Amazon Fire HD 10 2017 | Huawei MediaPad M5 10.8 | Lenovo Tab P10 | Samsung Galaxy Tab S4 | Média 64 GB eMMC Flash | Média da turma Tablet | |
|---|---|---|---|---|---|---|---|
| AndroBench 3-5 | -38% | 29% | -7% | 44% | 7% | 794% | |
| Sequential Read 256KB (MB/s) | 294.4 | 262.2 -11% | 247.8 -16% | 276.7 -6% | 741 152% | 278 ? -6% | 2049 ? 596% |
| Sequential Write 256KB (MB/s) | 197.1 | 147.7 -25% | 126.8 -36% | 205.7 4% | 195.8 -1% | 178.6 ? -9% | 1639 ? 732% |
| Random Read 4KB (MB/s) | 79.2 | 27.72 -65% | 54.7 -31% | 53.9 -32% | 142 79% | 60.9 ? -23% | 273 ? 245% |
| Random Write 4KB (MB/s) | 18.79 | 9.37 -50% | 60.8 224% | 15.75 -16% | 24.43 30% | 34.2 ? 82% | 320 ? 1603% |
| Sequential Read 256KB SDCard (MB/s) | 76.1 ? | 55.5 ? -27% | 85.1 ? 12% | 84.3 ? 11% | 80.1 ? 5% | 77.4 ? 2% | |
| Sequential Write 256KB SDCard (MB/s) | 60.8 ? | 30.14 ? -50% | 73.8 ? 21% | 61 ? 0% | 59.1 ? -3% | 58.3 ? -4% |
PUBG Mobile
Dead Trigger 2
Shadow Fight 3
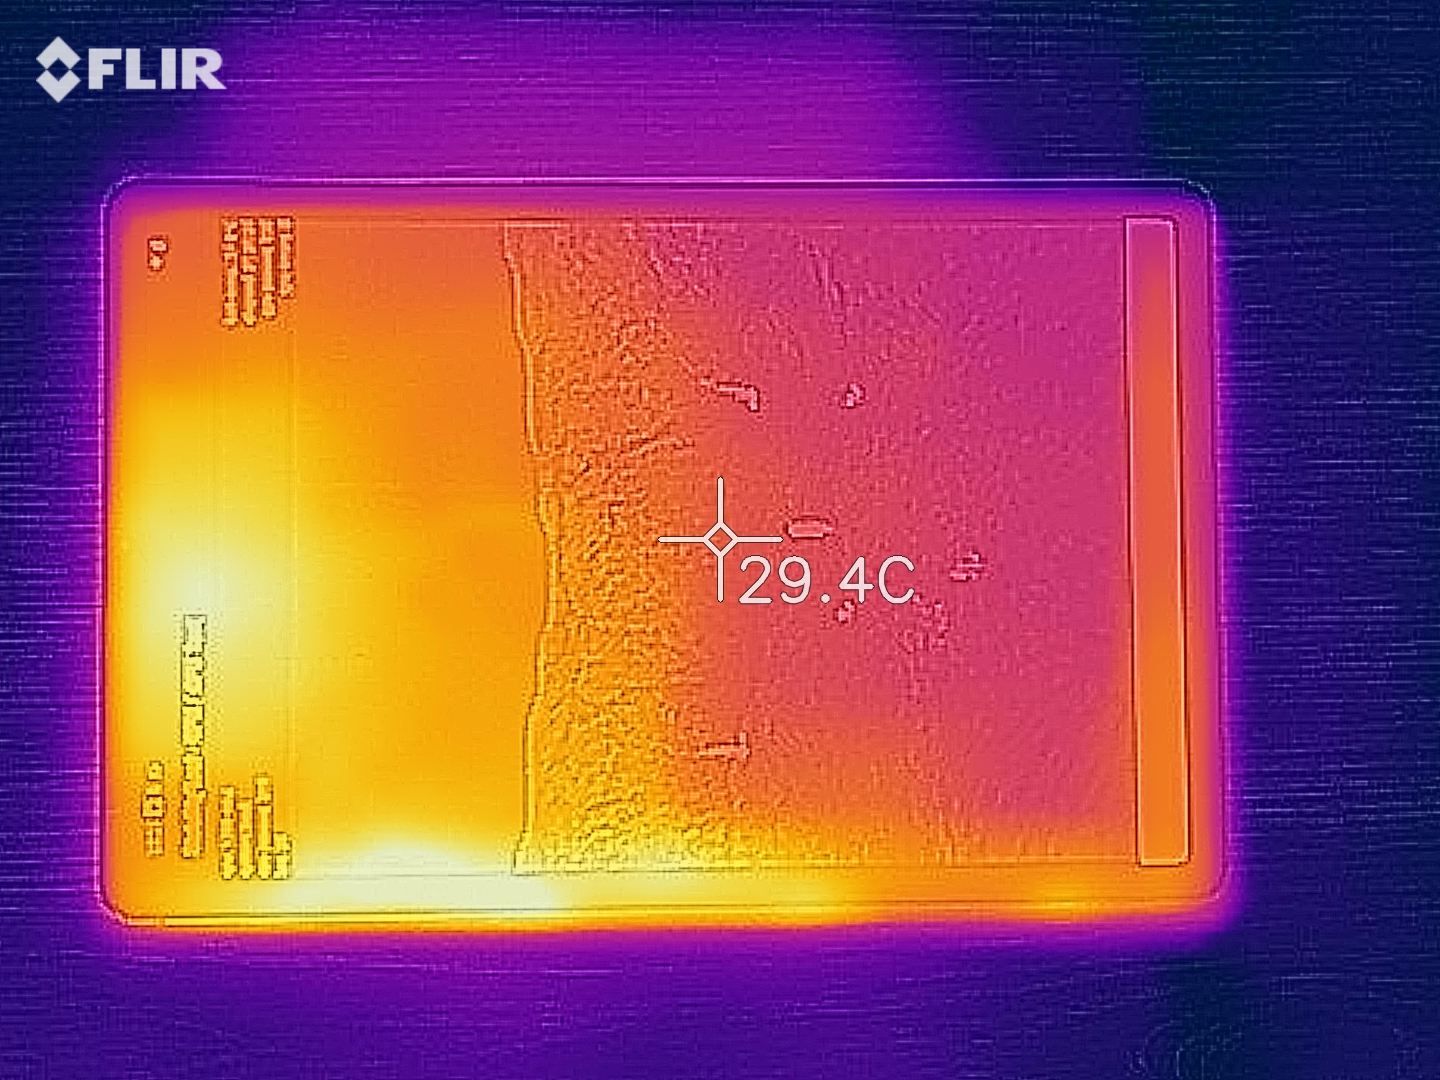
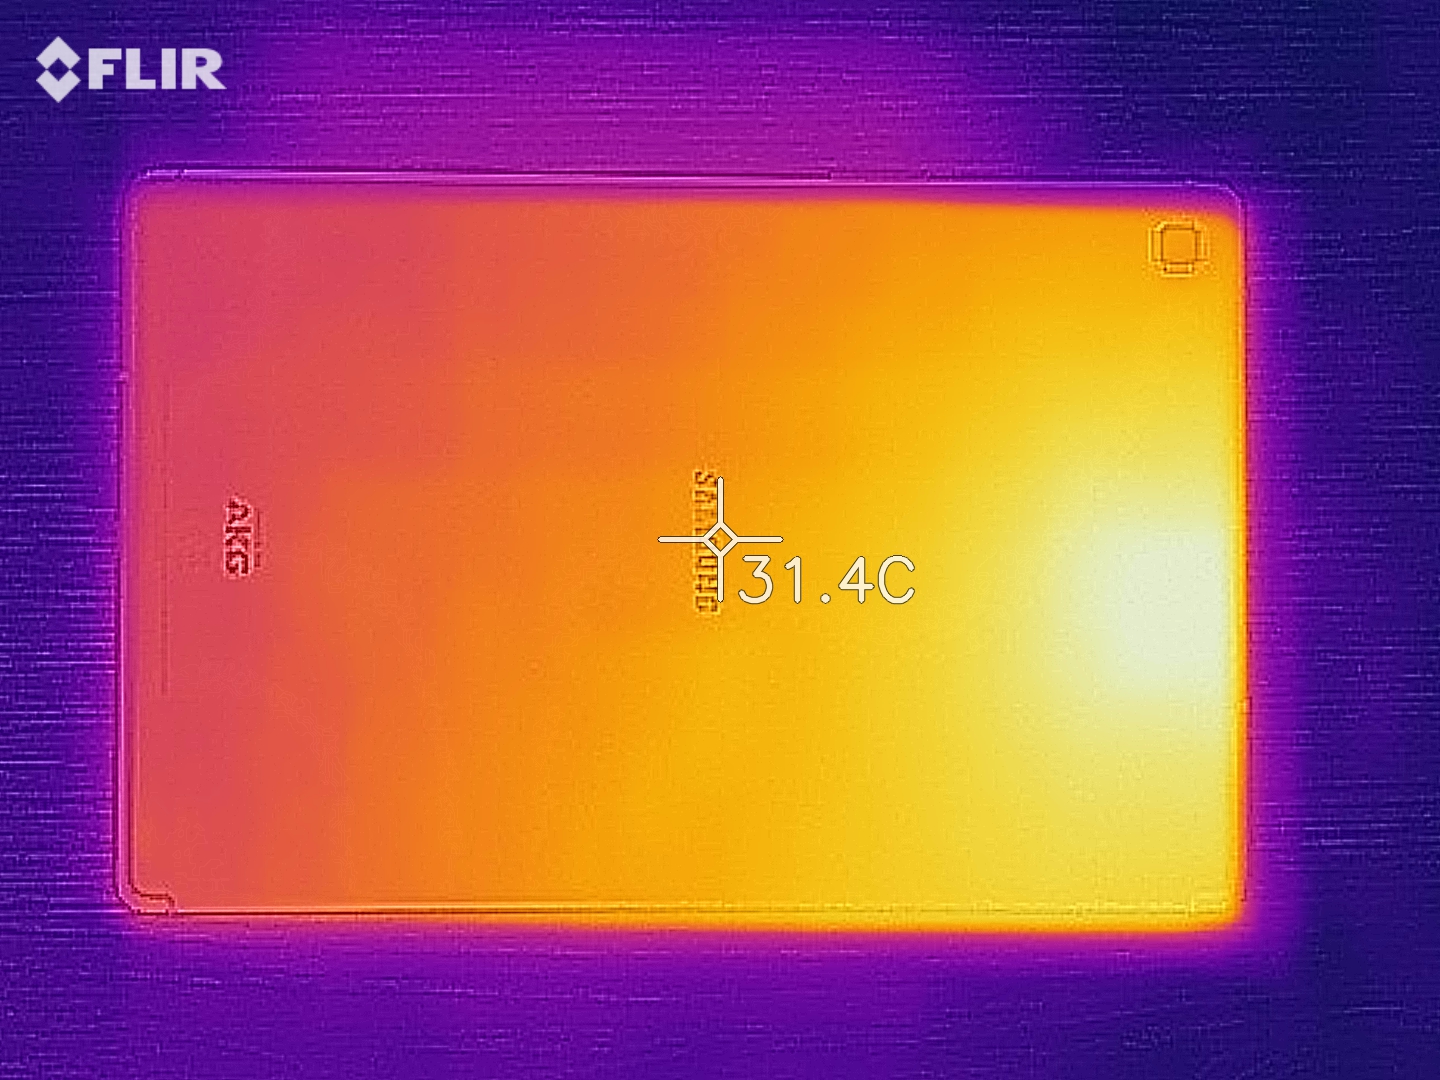
(+) A temperatura máxima no lado superior é 33.1 °C / 92 F, em comparação com a média de 33.7 °C / 93 F , variando de 20.7 a 53.2 °C para a classe Tablet.
(+) A parte inferior aquece até um máximo de 31.2 °C / 88 F, em comparação com a média de 33.2 °C / 92 F
(+) Em uso inativo, a temperatura média para o lado superior é 28.8 °C / 84 F, em comparação com a média do dispositivo de 30 °C / ### class_avg_f### F.
Samsung Galaxy Tab S5e SM-T720 análise de áudio
(+) | os alto-falantes podem tocar relativamente alto (###valor### dB)
Graves 100 - 315Hz
(±) | graves reduzidos - em média 14.3% menor que a mediana
(±) | a linearidade dos graves é média (10.4% delta para a frequência anterior)
Médios 400 - 2.000 Hz
(+) | médios equilibrados - apenas 2.8% longe da mediana
(+) | médios são lineares (2.8% delta para frequência anterior)
Altos 2 - 16 kHz
(+) | agudos equilibrados - apenas 1.9% longe da mediana
(+) | os máximos são lineares (3.8% delta da frequência anterior)
Geral 100 - 16.000 Hz
(+) | o som geral é linear (12% diferença em relação à mediana)
Comparado com a mesma classe
» 15% de todos os dispositivos testados nesta classe foram melhores, 5% semelhantes, 80% piores
» O melhor teve um delta de 7%, a média foi 20%, o pior foi 129%
Comparado com todos os dispositivos testados
» 9% de todos os dispositivos testados foram melhores, 2% semelhantes, 88% piores
» O melhor teve um delta de 4%, a média foi 23%, o pior foi 134%
Huawei MediaPad M5 10.8 análise de áudio
(±) | o volume do alto-falante é médio, mas bom (###valor### dB)
Graves 100 - 315Hz
(±) | graves reduzidos - em média 11.9% menor que a mediana
(-) | graves não são lineares (16.4% delta para frequência anterior)
Médios 400 - 2.000 Hz
(+) | médios equilibrados - apenas 3.2% longe da mediana
(+) | médios são lineares (5.7% delta para frequência anterior)
Altos 2 - 16 kHz
(+) | agudos equilibrados - apenas 4.6% longe da mediana
(+) | os máximos são lineares (6.9% delta da frequência anterior)
Geral 100 - 16.000 Hz
(±) | a linearidade do som geral é média (15.9% diferença em relação à mediana)
Comparado com a mesma classe
» 36% de todos os dispositivos testados nesta classe foram melhores, 6% semelhantes, 59% piores
» O melhor teve um delta de 7%, a média foi 20%, o pior foi 129%
Comparado com todos os dispositivos testados
» 25% de todos os dispositivos testados foram melhores, 5% semelhantes, 70% piores
» O melhor teve um delta de 4%, a média foi 23%, o pior foi 134%
| desligado | |
| Ocioso | |
| Carga |
|
Key:
min: | |
| Samsung Galaxy Tab S5e SM-T720 7040 mAh | Amazon Fire HD 10 2017 6300 mAh | Apple iPad Air 3 2019 8134 mAh | Huawei MediaPad M5 10.8 7500 mAh | Lenovo Tab P10 7000 mAh | Samsung Galaxy Tab S4 7300 mAh | |
|---|---|---|---|---|---|---|
| Power Consumption | -26% | -60% | -56% | -3% | -8% | |
| Idle Minimum * (Watt) | 2.07 | 1.55 25% | 2.18 -5% | 2.01 3% | 1.01 51% | 1.76 15% |
| Idle Average * (Watt) | 3.94 | 4.17 -6% | 6.4 -62% | 5.4 -37% | 4.16 -6% | 4.22 -7% |
| Idle Maximum * (Watt) | 3.96 | 4.25 -7% | 6.43 -62% | 5.44 -37% | 4.17 -5% | 4.25 -7% |
| Load Average * (Watt) | 4.07 | 7.13 -75% | 7.48 -84% | 8.55 -110% | 5.45 -34% | 4.52 -11% |
| Load Maximum * (Watt) | 5.73 | 9.63 -68% | 10.65 -86% | 11.53 -101% | 6.9 -20% | 7.35 -28% |
* ... menor é melhor
| Samsung Galaxy Tab S5e SM-T720 7040 mAh | Amazon Fire HD 10 2017 6300 mAh | Apple iPad Air 3 2019 8134 mAh | Huawei MediaPad M5 10.8 7500 mAh | Lenovo Tab P10 7000 mAh | Samsung Galaxy Tab S4 7300 mAh | |
|---|---|---|---|---|---|---|
| Duração da bateria | -19% | -3% | -11% | 16% | -14% | |
| Reader / Idle (h) | 21.1 | 16 -24% | 25 18% | 22.4 6% | 21.9 4% | 20.5 -3% |
| H.264 (h) | 14.4 | 9.8 -32% | 11.4 -21% | 11.7 -19% | 15.2 6% | 12.3 -15% |
| WiFi v1.3 (h) | 10.4 | 9 -13% | 12.3 18% | 10.8 4% | 16.5 59% | 8.3 -20% |
| Load (h) | 5 | 4.6 -8% | 3.6 -28% | 3.3 -34% | 4.8 -4% | 4.1 -18% |
Pro
Contra
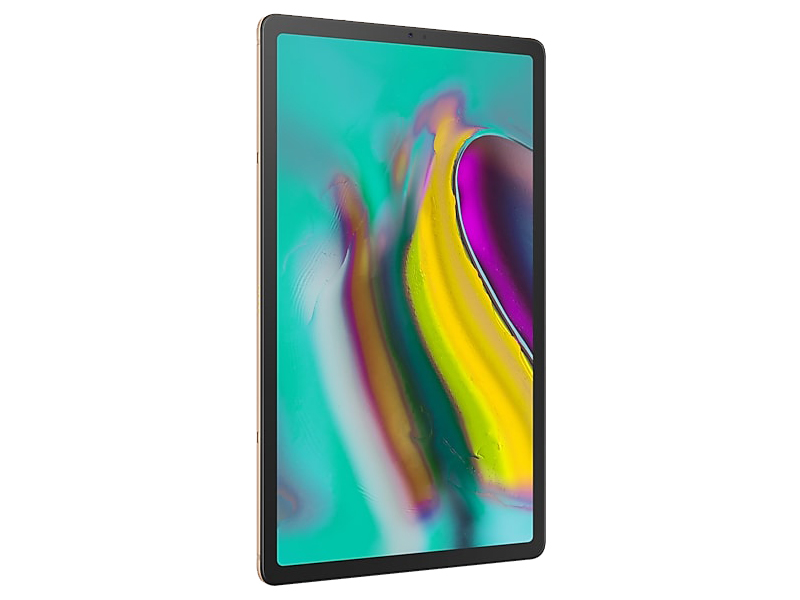
O Samsung Galaxy Tab S5e tem uma excelente relação qualidade/preço e é um tablet sólido e versátil. O dispositivo possui uma tela Super AMOLED de 10,5 polegadas, brilhante e rica em contraste, e um SoC capaz de suportar até os mais complexos jogos modernos. Da mesma forma, seus alto-falantes proporcionam uma experiência imersiva nos jogos, enquanto a duração da bateria não faltará durante longas sessões de jogos ou filmes.
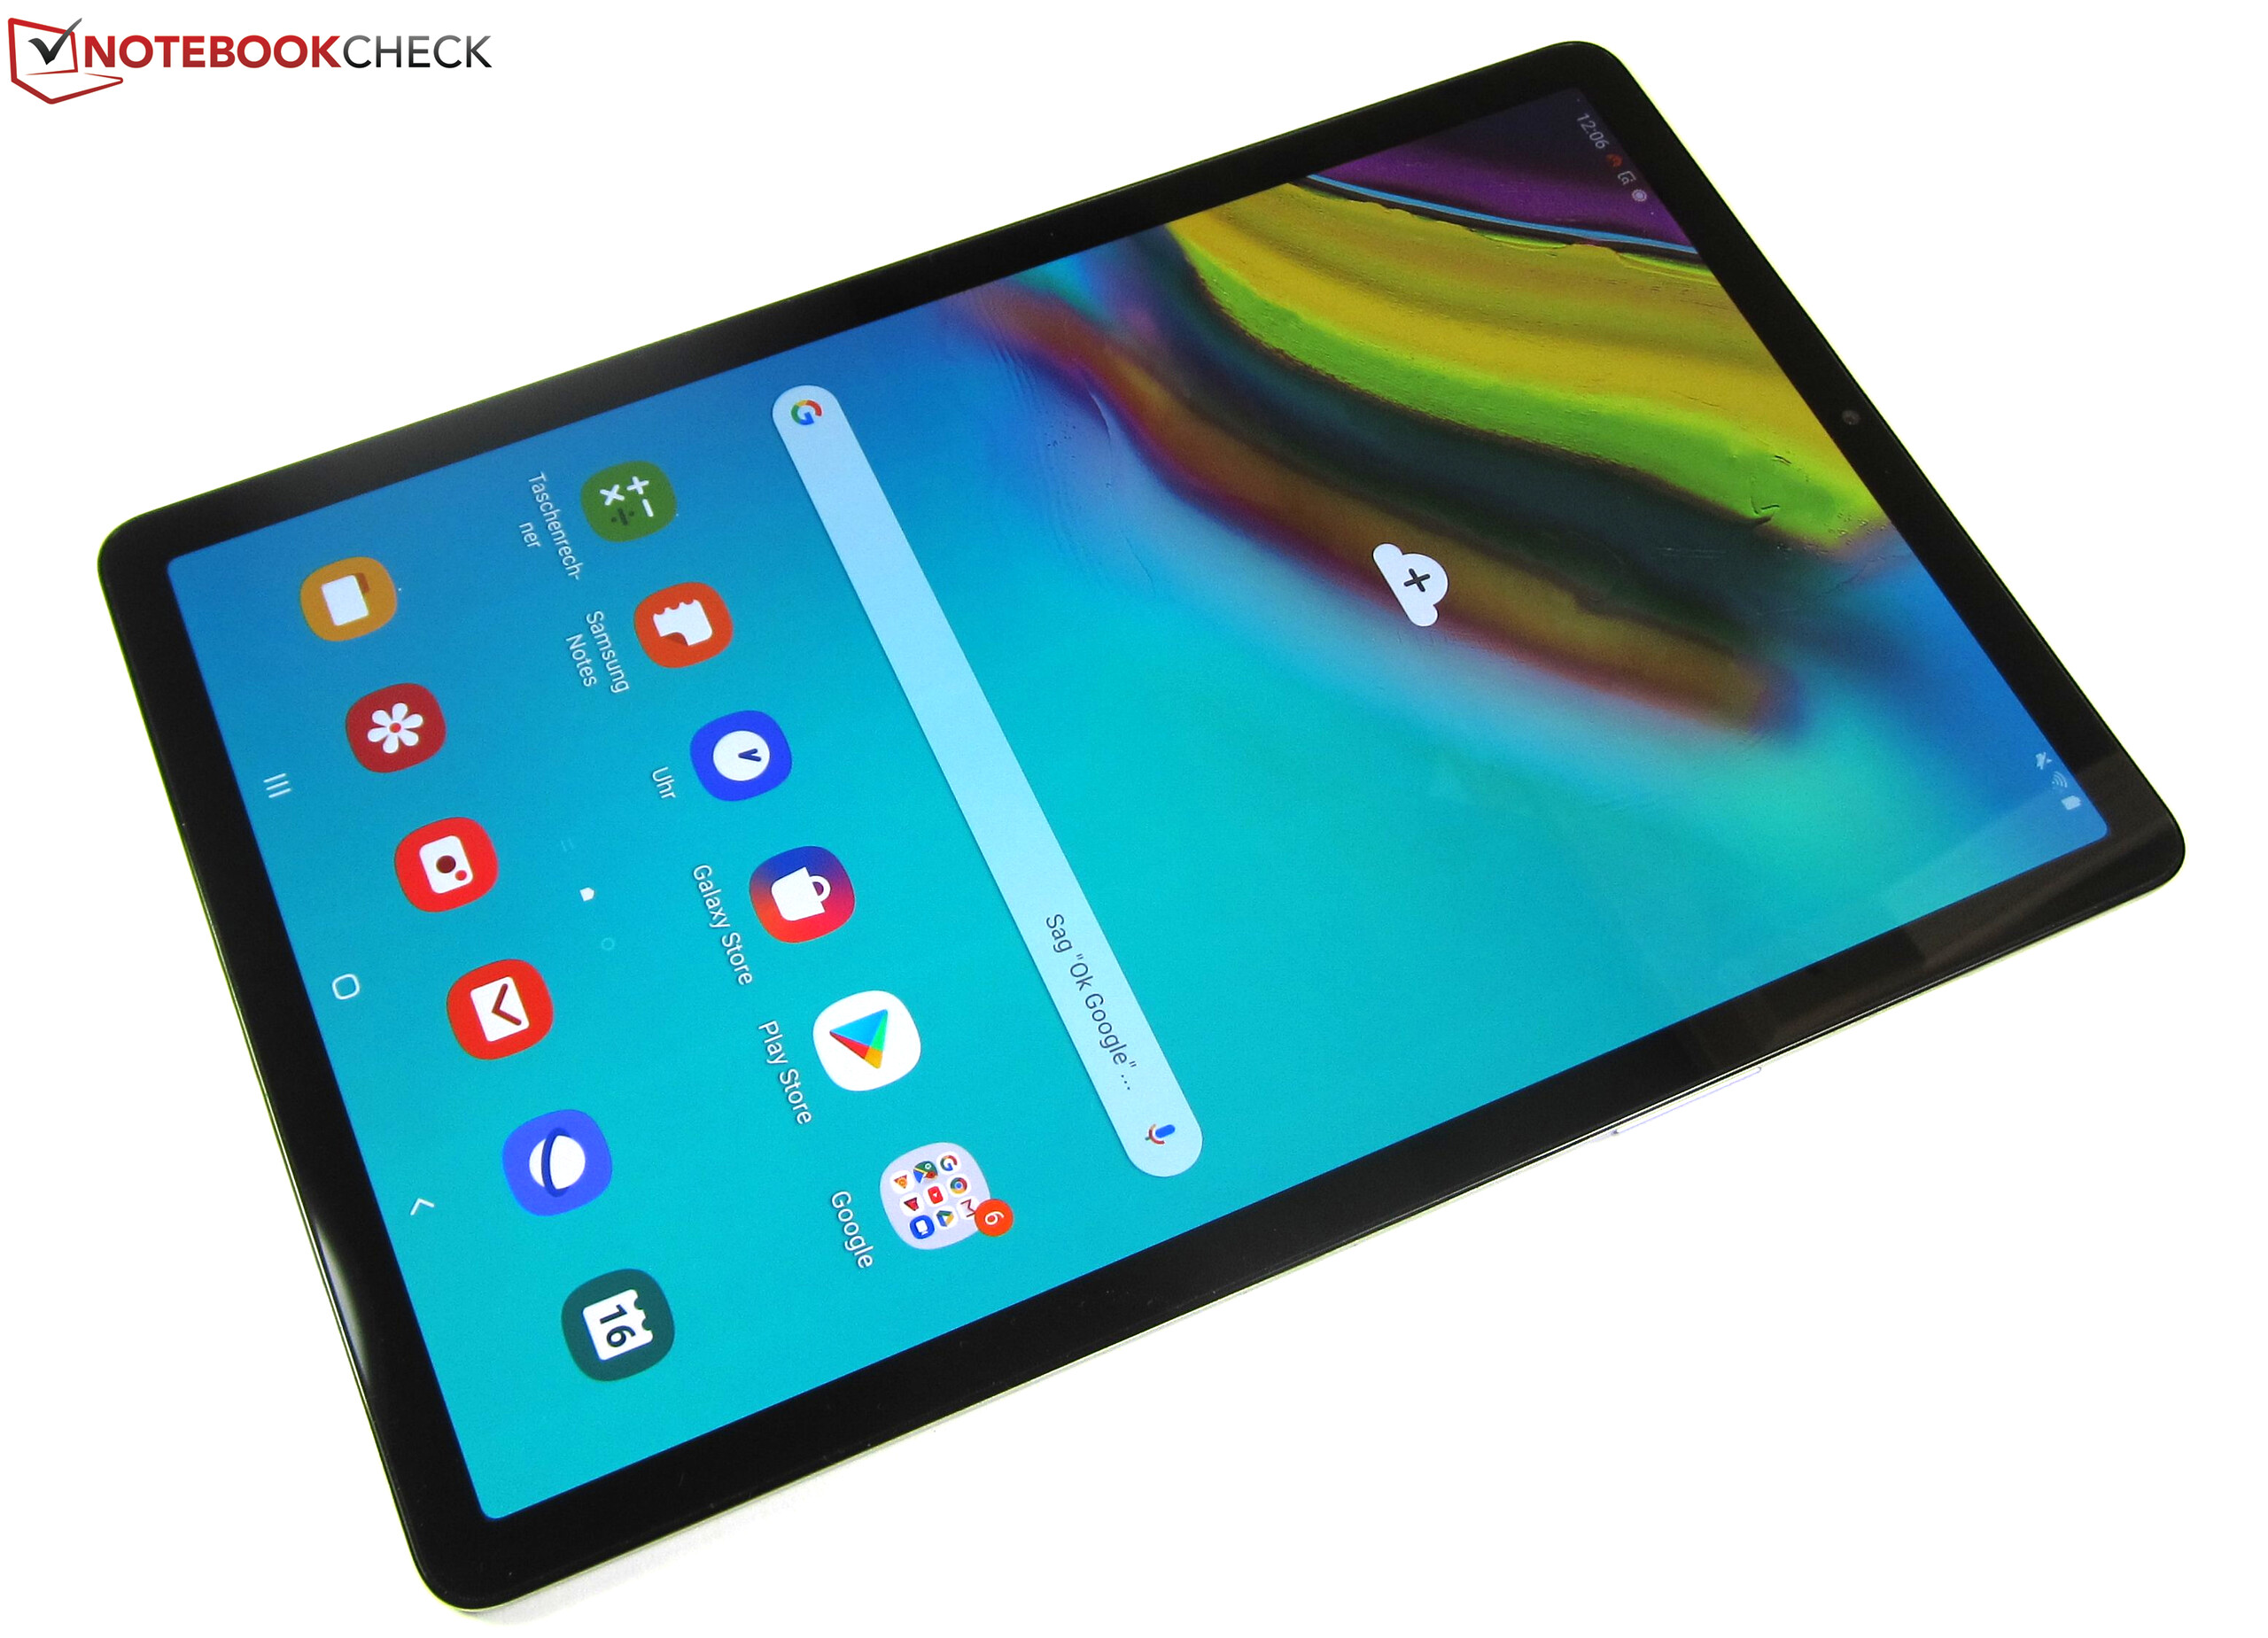
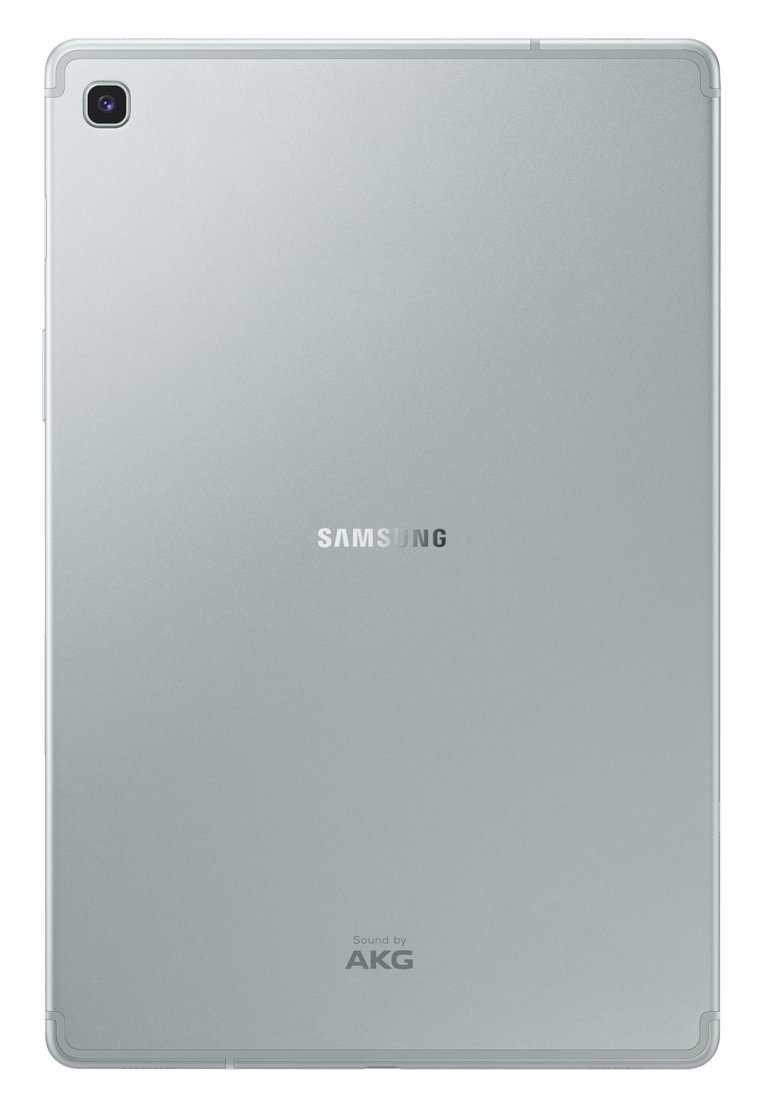
O tablet também é bem construído e leve, o que nem sempre é o caso dos tablets de tamanho médio. O design de metal e os marcos finos da tela fazem com que pareça mais caro do que é. Além disso, a inclusão do suporte ao DeX e a capa de teclado opcional tornam o Tab S5e mais do que apenas um tablet multimídia.
Existem alguns pontos fracos, mas estes são poucos e distantes entre si. A Samsung equipou o tablet com câmeras comuns, enquanto a omissão de um chip NFC é decepcionante. Também recomendamos experimentar o Tab S5e em pessoa, se você for sensível ao PWM, pois a tela pisca em uma frequência que pode causar cansaço visual e dores de cabeça durante o uso prolongado.
O Samsung Galaxy Tab S5e é uma alternativa valiosa para tablets mais caros, como o Tab S4 e iPad Air (2019). Ele oferece praticamente tudo o que a maioria das pessoas desejaria de um tablet, mas a um preço mais acessível e sem muitos compromissos.
No geral, o Tab S5e não é apenas um dos tablets de melhor valor que você pode comprar atualmente, mas também dá uma boa batalha aos tablets mais poderosos. O Tab S4, no geral, continua a ser um melhor tablet multimídia, por causa de seu SoC mais poderoso, RAM de alta capacidade e armazenamento interno mais rápido. A inclusão do suporte para a caneta também ajuda o Tab S4.
Samsung Galaxy Tab S5e SM-T720
- 08/31/2022 v7 (old)
Manuel Masiero
Price comparison
