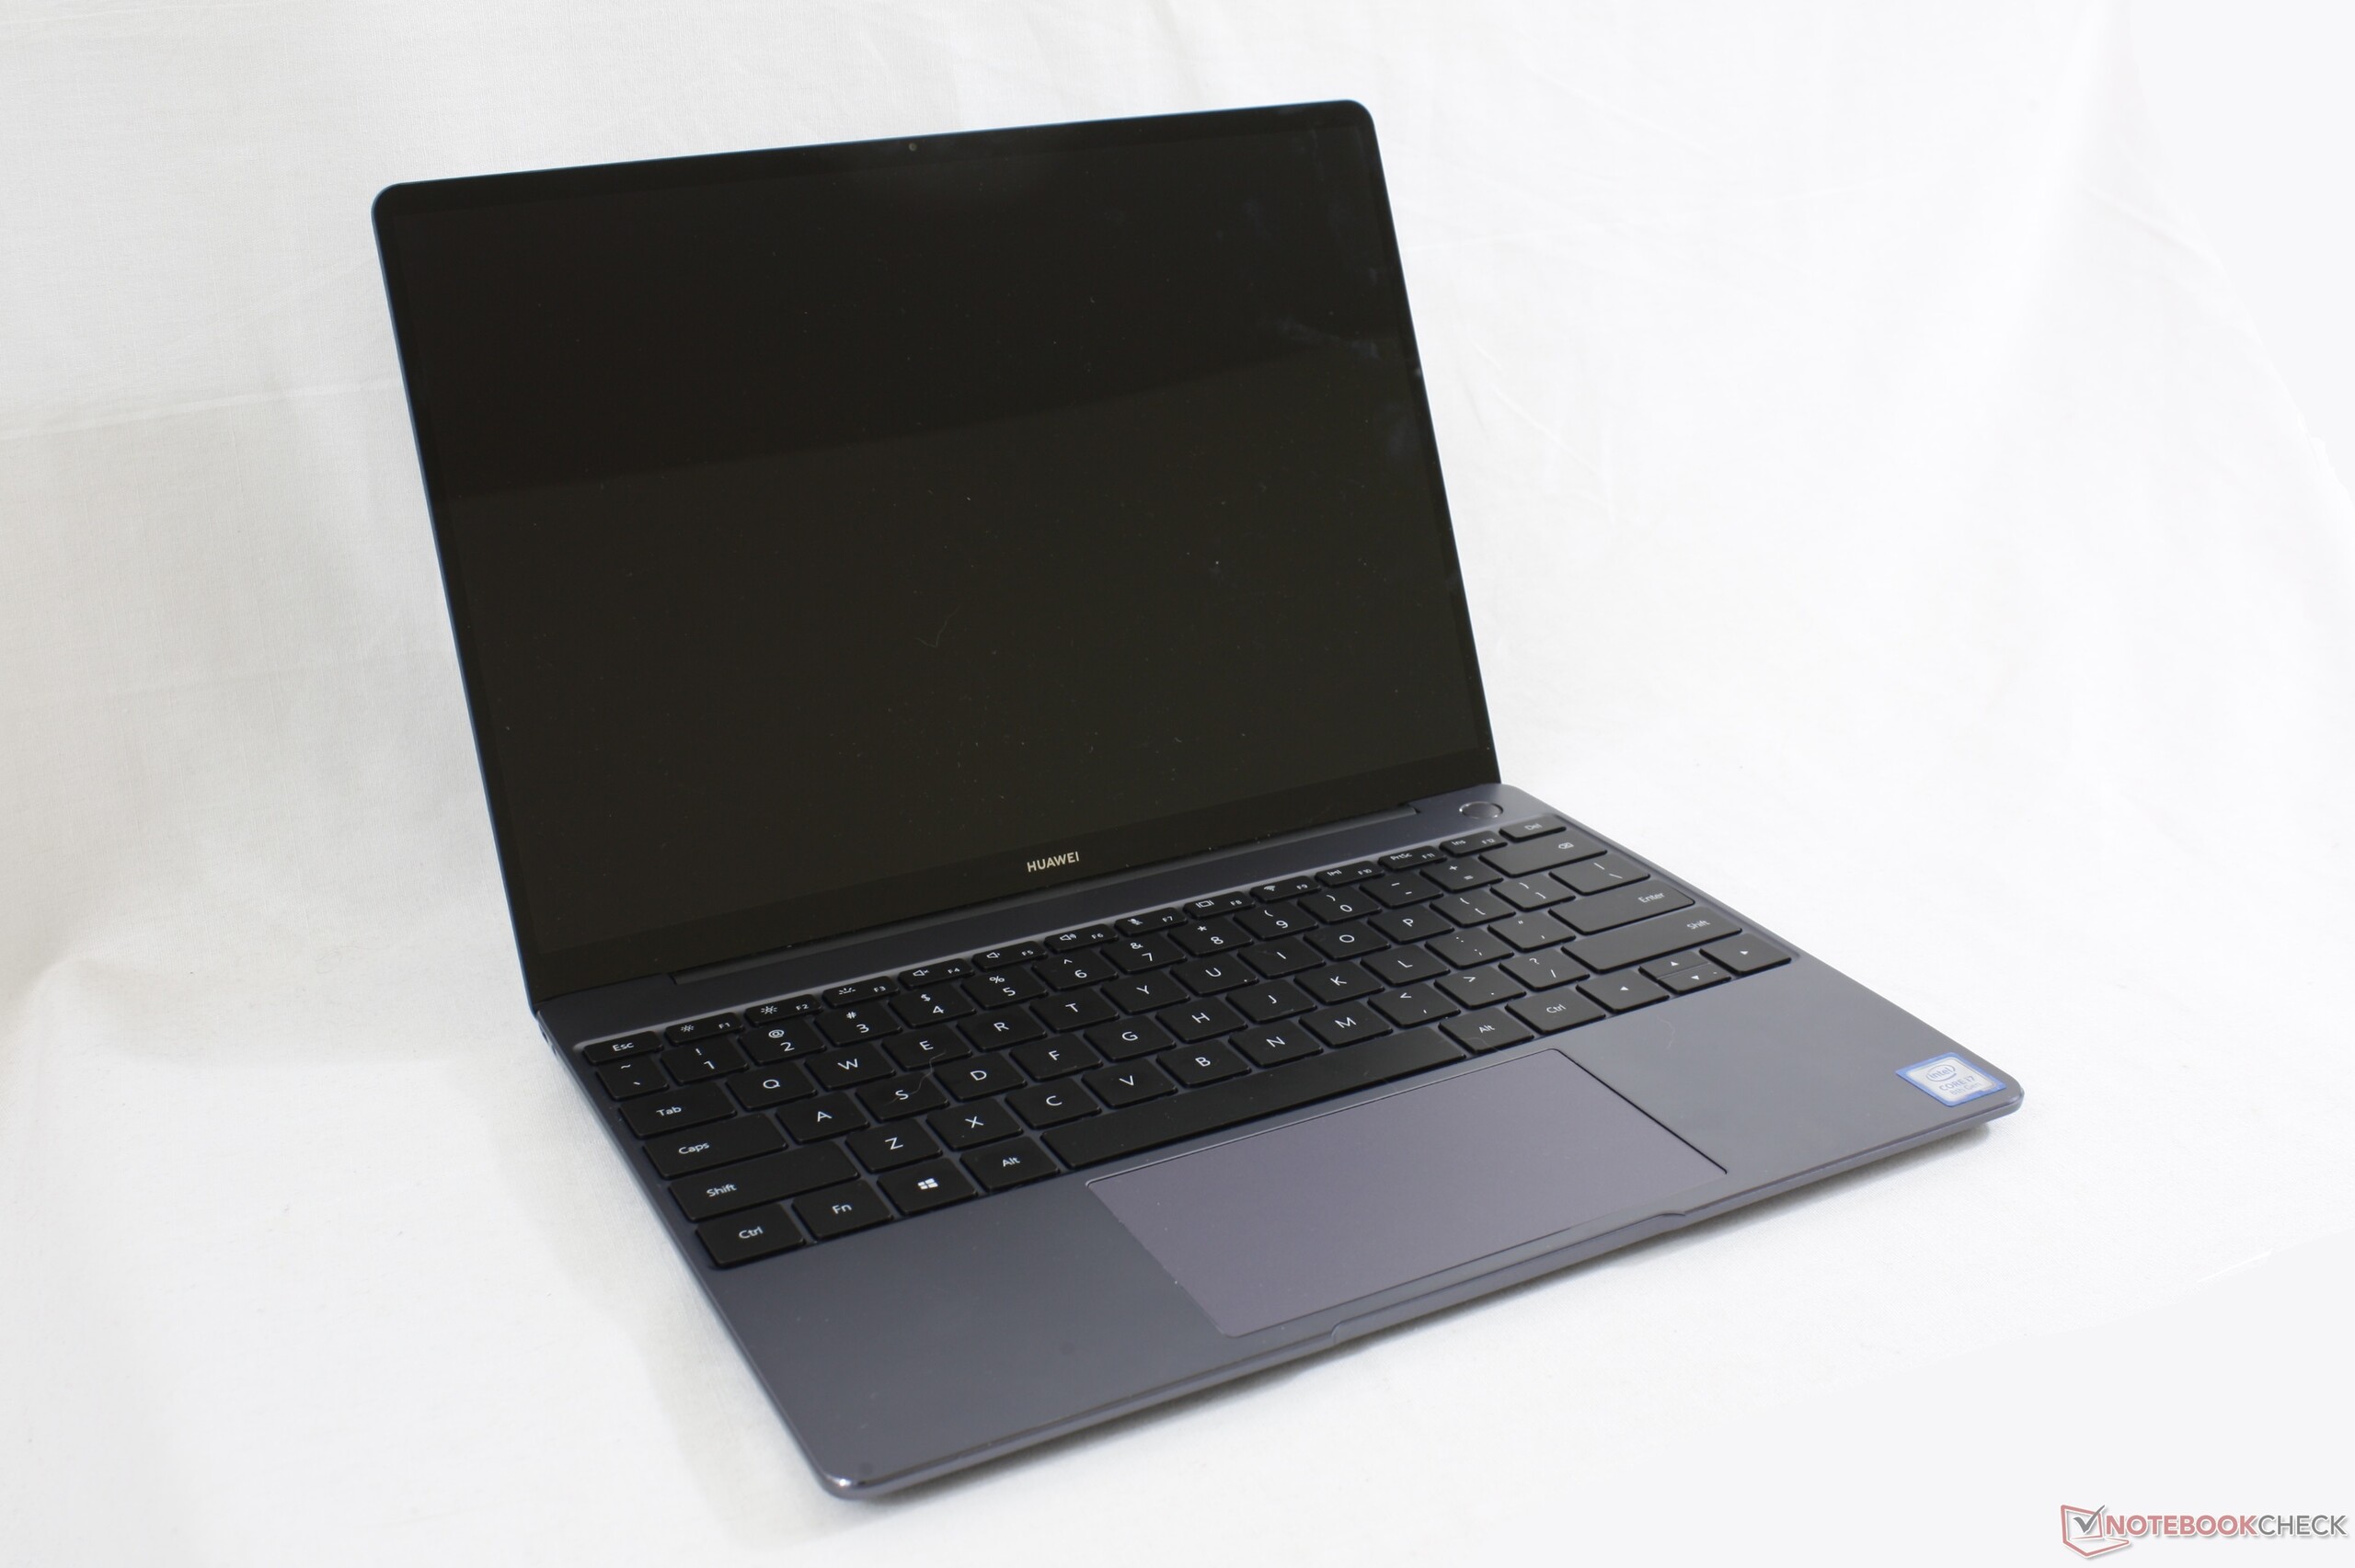
Breve Análise do Portátil Huawei MateBook 13 (i7-8565U, GeForce MX150)
| |||||||||||||||||||||||||
iluminação: 93 %
iluminação com acumulador: 366.7 cd/m²
Contraste: 940:1 (Preto: 0.39 cd/m²)
ΔE ColorChecker Calman: 2.76 | ∀{0.5-29.43 Ø4.71}
calibrated: 1.53
ΔE Greyscale Calman: 4.2 | ∀{0.09-98 Ø4.96}
97.6% sRGB (Argyll 1.6.3 3D)
63.2% AdobeRGB 1998 (Argyll 1.6.3 3D)
69.2% AdobeRGB 1998 (Argyll 3D)
97.7% sRGB (Argyll 3D)
68.1% Display P3 (Argyll 3D)
Gamma: 2.22
CCT: 6271 K
| Huawei MateBook 13 i7 Chi Mei CMN8201, IPS, 13", 2160x1440 | Dell XPS 13 9370 i7 UHD ID: Sharp SHP148B, Name: LQ133D1, Dell P/N: 8XDHY, IPS, 13.3", 3840x2160 | Apple MacBook Pro 13 2018 Touchbar i5 APPA03E, IPS, 13.3", 2560x1600 | HP Spectre x360 13t-ae000 LGD0588, IPS, 13.3", 3840x2160 | Lenovo Yoga C930-13IKB B139HAN03_0, IPS, 13.9", 1920x1080 | Huawei Matebook X Pro i5 Tianma XM, IPS, 13.9", 3000x2000 | |
|---|---|---|---|---|---|---|
| Display | 1% | 24% | 4% | -4% | -3% | |
| Display P3 Coverage (%) | 68.1 | 68.9 1% | 98.5 45% | 71.9 6% | 64.3 -6% | 65.9 -3% |
| sRGB Coverage (%) | 97.7 | 98.4 1% | 99.9 2% | 98.1 0% | 94.6 -3% | 95.2 -3% |
| AdobeRGB 1998 Coverage (%) | 69.2 | 69.5 0% | 87.3 26% | 73.1 6% | 66.2 -4% | 67.6 -2% |
| Response Times | -50% | -3% | -10% | 10% | 13% | |
| Response Time Grey 50% / Grey 80% * (ms) | 43.2 ? | 69.6 ? -61% | 46 ? -6% | 51.6 ? -19% | 40.8 ? 6% | 40.4 ? 6% |
| Response Time Black / White * (ms) | 32 ? | 44 ? -38% | 32 ? -0% | 32.4 ? -1% | 27.6 ? 14% | 25.6 ? 20% |
| PWM Frequency (Hz) | 3759 ? | 118000 ? | ||||
| Screen | 6% | 34% | 12% | -33% | -0% | |
| Brightness middle (cd/m²) | 366.6 | 478.5 31% | 519 42% | 329.8 -10% | 316 -14% | 442.7 21% |
| Brightness (cd/m²) | 360 | 466 29% | 504 40% | 318 -12% | 291 -19% | 428 19% |
| Brightness Distribution (%) | 93 | 86 -8% | 95 2% | 74 -20% | 83 -11% | 84 -10% |
| Black Level * (cd/m²) | 0.39 | 0.43 -10% | 0.33 15% | 0.25 36% | 0.36 8% | 0.31 21% |
| Contrast (:1) | 940 | 1113 18% | 1573 67% | 1319 40% | 878 -7% | 1428 52% |
| Colorchecker dE 2000 * | 2.76 | 3.09 -12% | 1.4 49% | 2.37 14% | 5.9 -114% | 2.24 19% |
| Colorchecker dE 2000 max. * | 6.19 | 5.94 4% | 2.8 55% | 4.08 34% | 12.9 -108% | 7.19 -16% |
| Colorchecker dE 2000 calibrated * | 1.53 | 2.06 -35% | 1.3 15% | 1.11 27% | ||
| Greyscale dE 2000 * | 4.2 | 2.4 43% | 2.2 48% | 2.8 33% | 8.6 -105% | 9.7 -131% |
| Gamma | 2.22 99% | 2.063 107% | 2.22 99% | 2.145 103% | 2.1 105% | 1.42 155% |
| CCT | 6271 104% | 6883 94% | 6908 94% | 6441 101% | 6854 95% | 6227 104% |
| Color Space (Percent of AdobeRGB 1998) (%) | 63.2 | 69.47 10% | 77.3 22% | 67 6% | 60.7 -4% | 61.6 -3% |
| Color Space (Percent of sRGB) (%) | 97.6 | 98.36 1% | 99.99 2% | 98 0% | 94.5 -3% | 95 -3% |
| Média Total (Programa/Configurações) | -14% /
-2% | 18% /
27% | 2% /
8% | -9% /
-22% | 3% /
1% |
* ... menor é melhor
Exibir tempos de resposta
| ↔ Tempo de resposta preto para branco | ||
|---|---|---|
| 32 ms ... ascensão ↗ e queda ↘ combinadas | ↗ 18 ms ascensão | 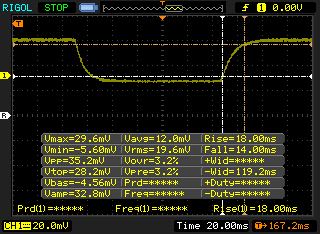 |
| ↘ 14 ms queda | ||
| A tela mostra taxas de resposta lentas em nossos testes e será insatisfatória para os jogadores. Em comparação, todos os dispositivos testados variam de 0.1 (mínimo) a 240 (máximo) ms. » 86 % de todos os dispositivos são melhores. Isso significa que o tempo de resposta medido é pior que a média de todos os dispositivos testados (19.8 ms). | ||
| ↔ Tempo de resposta 50% cinza a 80% cinza | ||
| 43.2 ms ... ascensão ↗ e queda ↘ combinadas | ↗ 22 ms ascensão | 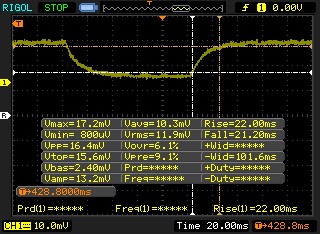 |
| ↘ 21.2 ms queda | ||
| A tela mostra taxas de resposta lentas em nossos testes e será insatisfatória para os jogadores. Em comparação, todos os dispositivos testados variam de 0.165 (mínimo) a 636 (máximo) ms. » 72 % de todos os dispositivos são melhores. Isso significa que o tempo de resposta medido é pior que a média de todos os dispositivos testados (31 ms). | ||
Cintilação da tela / PWM (modulação por largura de pulso)
| Tela tremeluzindo / PWM não detectado | 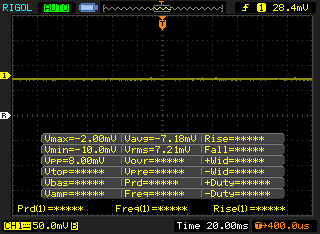 | ||
[pwm_comparison] Em comparação: 52 % de todos os dispositivos testados não usam PWM para escurecer a tela. Se PWM foi detectado, uma média de 7754 (mínimo: 5 - máximo: 343500) Hz foi medida. | |||
| PCMark 8 Home Score Accelerated v2 | 3616 pontos | |
| PCMark 8 Work Score Accelerated v2 | 4709 pontos | |
| PCMark 10 Score | 4344 pontos | |
Ajuda | ||
| Huawei MateBook 13 i7 Samsung SSD PM981 MZVLB512HAJQ | Dell XPS 13 9370 i7 UHD Toshiba XG5 KXG50ZNV512G | HP Spectre x360 13t-ae000 Lite-On CA1-8D256-HP | Lenovo Yoga C930-13IKB SK hynix PC401 HFS256GD9TNG | Huawei Matebook X Pro i5 Samsung PM961 MZVLW256HEHP | |
|---|---|---|---|---|---|
| AS SSD | -41% | -67% | -56% | -30% | |
| Seq Read (MB/s) | 1889 | 2205 17% | 2133 13% | 1850 -2% | 2416 28% |
| Seq Write (MB/s) | 1812 | 435.8 -76% | 945 -48% | 661 -64% | 1170 -35% |
| 4K Read (MB/s) | 55.5 | 29.36 -47% | 29.84 -46% | 38.04 -31% | 48.33 -13% |
| 4K Write (MB/s) | 118.4 | 107.4 -9% | 91.4 -23% | 95 -20% | 103.1 -13% |
| 4K-64 Read (MB/s) | 1257 | 678 -46% | 725 -42% | 434.3 -65% | 1039 -17% |
| 4K-64 Write (MB/s) | 1571 | 444.8 -72% | 404.1 -74% | 266.3 -83% | 399.6 -75% |
| Access Time Read * (ms) | 0.041 | 0.059 -44% | 0.121 -195% | 0.069 -68% | 0.058 -41% |
| Access Time Write * (ms) | 0.032 | 0.055 -72% | 0.13 -306% | 0.056 -75% | 0.036 -13% |
| Score Read (Points) | 1502 | 926 -38% | 968 -36% | 657 -56% | 1329 -12% |
| Score Write (Points) | 1871 | 596 -68% | 590 -68% | 427 -77% | 620 -67% |
| Score Total (Points) | 4147 | 1911 -54% | 1998 -52% | 1373 -67% | 2575 -38% |
| Copy ISO MB/s (MB/s) | 1800 | 585 -67% | 1492 -17% | 539 -70% | 739 -59% |
| Copy Program MB/s (MB/s) | 385.6 | 570 48% | 300.9 -22% | 209.7 -46% | 312.3 -19% |
| Copy Game MB/s (MB/s) | 982 | 503 -49% | 839 -15% | 340 -65% | 486.3 -50% |
* ... menor é melhor

| 3DMark 11 Performance | 4796 pontos | |
| 3DMark Cloud Gate Standard Score | 14722 pontos | |
| 3DMark Fire Strike Score | 3235 pontos | |
Ajuda | ||
| baixo | média | alto | ultra | |
|---|---|---|---|---|
| BioShock Infinite (2013) | 195 | 110.3 | 93.4 | 34.3 |
| The Witcher 3 (2015) | 70.5 | 39.7 | 22.1 | 11.9 |
| Rocket League (2017) | 156 | 76.1 | 47.4 |
| Huawei MateBook 13 i7 GeForce MX150, i7-8565U, Samsung SSD PM981 MZVLB512HAJQ | Huawei Matebook X Pro i5 GeForce MX150, i5-8250U, Samsung PM961 MZVLW256HEHP | Dell XPS 13 9370 i7 UHD UHD Graphics 620, i5-8550U, Toshiba XG5 KXG50ZNV512G | Apple MacBook Pro 13 2018 Touchbar i5 Iris Plus Graphics 655, i5-8259U | Razer Blade Stealth i7-8565U GeForce MX150, i7-8565U, Lite-On CA3-8D256-Q11 | |
|---|---|---|---|---|---|
| Noise | 0% | 4% | 1% | -2% | |
| desligado / ambiente * (dB) | 28.6 | 27.9 2% | 28 2% | 29.6 -3% | 28.4 1% |
| Idle Minimum * (dB) | 28.6 | 27.9 2% | 28 2% | 29.6 -3% | 28.5 -0% |
| Idle Average * (dB) | 28.6 | 27.9 2% | 28 2% | 29.6 -3% | 29 -1% |
| Idle Maximum * (dB) | 28.6 | 27.9 2% | 28 2% | 29.6 -3% | 29.1 -2% |
| Load Average * (dB) | 34.2 | 36.2 -6% | 32.5 5% | 36.7 -7% | 42.8 -25% |
| Witcher 3 ultra * (dB) | 43 | 45 -5% | 32.5 24% | 41.4 4% | |
| Load Maximum * (dB) | 47 | 45.2 4% | 42.2 10% | 46.7 1% | 41.6 11% |
* ... menor é melhor
Barulho
| Ocioso |
| 28.6 / 28.6 / 28.6 dB |
| Carga |
| 34.2 / 47 dB |
 | ||
30 dB silencioso 40 dB(A) audível 50 dB(A) ruidosamente alto |
||
min: | ||
(±) A temperatura máxima no lado superior é 44.2 °C / 112 F, em comparação com a média de 35.9 °C / 97 F , variando de 21.4 a 59 °C para a classe Subnotebook.
(-) A parte inferior aquece até um máximo de 48 °C / 118 F, em comparação com a média de 39.2 °C / 103 F
(+) Em uso inativo, a temperatura média para o lado superior é 24 °C / 75 F, em comparação com a média do dispositivo de 30.8 °C / ### class_avg_f### F.
(±) Jogando The Witcher 3, a temperatura média para o lado superior é 36 °C / 97 F, em comparação com a média do dispositivo de 30.8 °C / ## #class_avg_f### F.
(+) Os apoios para as mãos e o touchpad estão atingindo a temperatura máxima da pele (33.2 °C / 91.8 F) e, portanto, não estão quentes.
(-) A temperatura média da área do apoio para as mãos de dispositivos semelhantes foi 28.2 °C / 82.8 F (-5 °C / -9 F).
Huawei MateBook 13 i7 análise de áudio
(-) | alto-falantes não muito altos (###valor### dB)
Graves 100 - 315Hz
(-) | quase nenhum baixo - em média 16.3% menor que a mediana
(-) | graves não são lineares (15.7% delta para frequência anterior)
Médios 400 - 2.000 Hz
(+) | médios equilibrados - apenas 4.9% longe da mediana
(±) | a linearidade dos médios é média (7.3% delta para frequência anterior)
Altos 2 - 16 kHz
(+) | agudos equilibrados - apenas 3.5% longe da mediana
(±) | a linearidade dos máximos é média (7.5% delta para frequência anterior)
Geral 100 - 16.000 Hz
(±) | a linearidade do som geral é média (21.7% diferença em relação à mediana)
Comparado com a mesma classe
» 74% de todos os dispositivos testados nesta classe foram melhores, 6% semelhantes, 21% piores
» O melhor teve um delta de 5%, a média foi 18%, o pior foi 53%
Comparado com todos os dispositivos testados
» 62% de todos os dispositivos testados foram melhores, 7% semelhantes, 31% piores
» O melhor teve um delta de 4%, a média foi 23%, o pior foi 134%
Apple MacBook 12 (Early 2016) 1.1 GHz análise de áudio
(+) | os alto-falantes podem tocar relativamente alto (###valor### dB)
Graves 100 - 315Hz
(±) | graves reduzidos - em média 11.3% menor que a mediana
(±) | a linearidade dos graves é média (14.2% delta para a frequência anterior)
Médios 400 - 2.000 Hz
(+) | médios equilibrados - apenas 2.4% longe da mediana
(+) | médios são lineares (5.5% delta para frequência anterior)
Altos 2 - 16 kHz
(+) | agudos equilibrados - apenas 2% longe da mediana
(+) | os máximos são lineares (4.5% delta da frequência anterior)
Geral 100 - 16.000 Hz
(+) | o som geral é linear (10.2% diferença em relação à mediana)
Comparado com a mesma classe
» 7% de todos os dispositivos testados nesta classe foram melhores, 2% semelhantes, 90% piores
» O melhor teve um delta de 5%, a média foi 18%, o pior foi 53%
Comparado com todos os dispositivos testados
» 5% de todos os dispositivos testados foram melhores, 1% semelhantes, 94% piores
» O melhor teve um delta de 4%, a média foi 23%, o pior foi 134%
| desligado | |
| Ocioso | |
| Carga |
|
Key:
min: | |
| Huawei MateBook 13 i7 i7-8565U, GeForce MX150, Samsung SSD PM981 MZVLB512HAJQ, IPS, 2160x1440, 13" | Dell XPS 13 9370 i7 UHD i5-8550U, UHD Graphics 620, Toshiba XG5 KXG50ZNV512G, IPS, 3840x2160, 13.3" | Apple MacBook Pro 13 2018 Touchbar i5 i5-8259U, Iris Plus Graphics 655, , IPS, 2560x1600, 13.3" | HP Spectre x360 13t-ae000 i5-8550U, UHD Graphics 620, Lite-On CA1-8D256-HP, IPS, 3840x2160, 13.3" | Lenovo Yoga C930-13IKB i5-8250U, UHD Graphics 620, SK hynix PC401 HFS256GD9TNG, IPS, 1920x1080, 13.9" | Huawei Matebook X Pro i5 i5-8250U, GeForce MX150, Samsung PM961 MZVLW256HEHP, IPS, 3000x2000, 13.9" | |
|---|---|---|---|---|---|---|
| Power Consumption | 6% | 8% | 1% | 17% | 6% | |
| Idle Minimum * (Watt) | 3.5 | 5 -43% | 2.3 34% | 5.9 -69% | 3.3 6% | 3.5 -0% |
| Idle Average * (Watt) | 7.5 | 8.3 -11% | 8.7 -16% | 9.8 -31% | 6.8 9% | 8.9 -19% |
| Idle Maximum * (Watt) | 12.4 | 8.8 29% | 12.2 2% | 10.6 15% | 9.5 23% | 12.3 1% |
| Load Average * (Watt) | 64.2 | 46.4 28% | 53.3 17% | 36.6 43% | 40.8 36% | 54.2 16% |
| Witcher 3 ultra * (Watt) | 52.5 | 42.4 19% | ||||
| Load Maximum * (Watt) | 65.7 | 48.6 26% | 64 3% | 34.3 48% | 57 13% | 52.1 21% |
* ... menor é melhor
| Huawei MateBook 13 i7 i7-8565U, GeForce MX150, 41.7 Wh | Dell XPS 13 9370 i7 UHD i5-8550U, UHD Graphics 620, 52 Wh | Apple MacBook Pro 13 2018 Touchbar i5 i5-8259U, Iris Plus Graphics 655, 58 Wh | HP Spectre x360 13t-ae000 i5-8550U, UHD Graphics 620, 60 Wh | Lenovo Yoga C930-13IKB i5-8250U, UHD Graphics 620, 60 Wh | Huawei Matebook X Pro i5 i5-8250U, GeForce MX150, 57.4 Wh | |
|---|---|---|---|---|---|---|
| Duração da bateria | 31% | 28% | 58% | 70% | 67% | |
| Reader / Idle (h) | 15.4 | 13.7 -11% | 23.9 55% | 20.7 34% | ||
| WiFi v1.3 (h) | 7.6 | 7.8 3% | 9.7 28% | 7.1 -7% | 9.2 21% | 9.3 22% |
| Load (h) | 0.9 | 1.8 100% | 2 122% | 2.1 133% | 2.2 144% | |
| Witcher 3 ultra (h) | 1.6 |
Pro
Contra
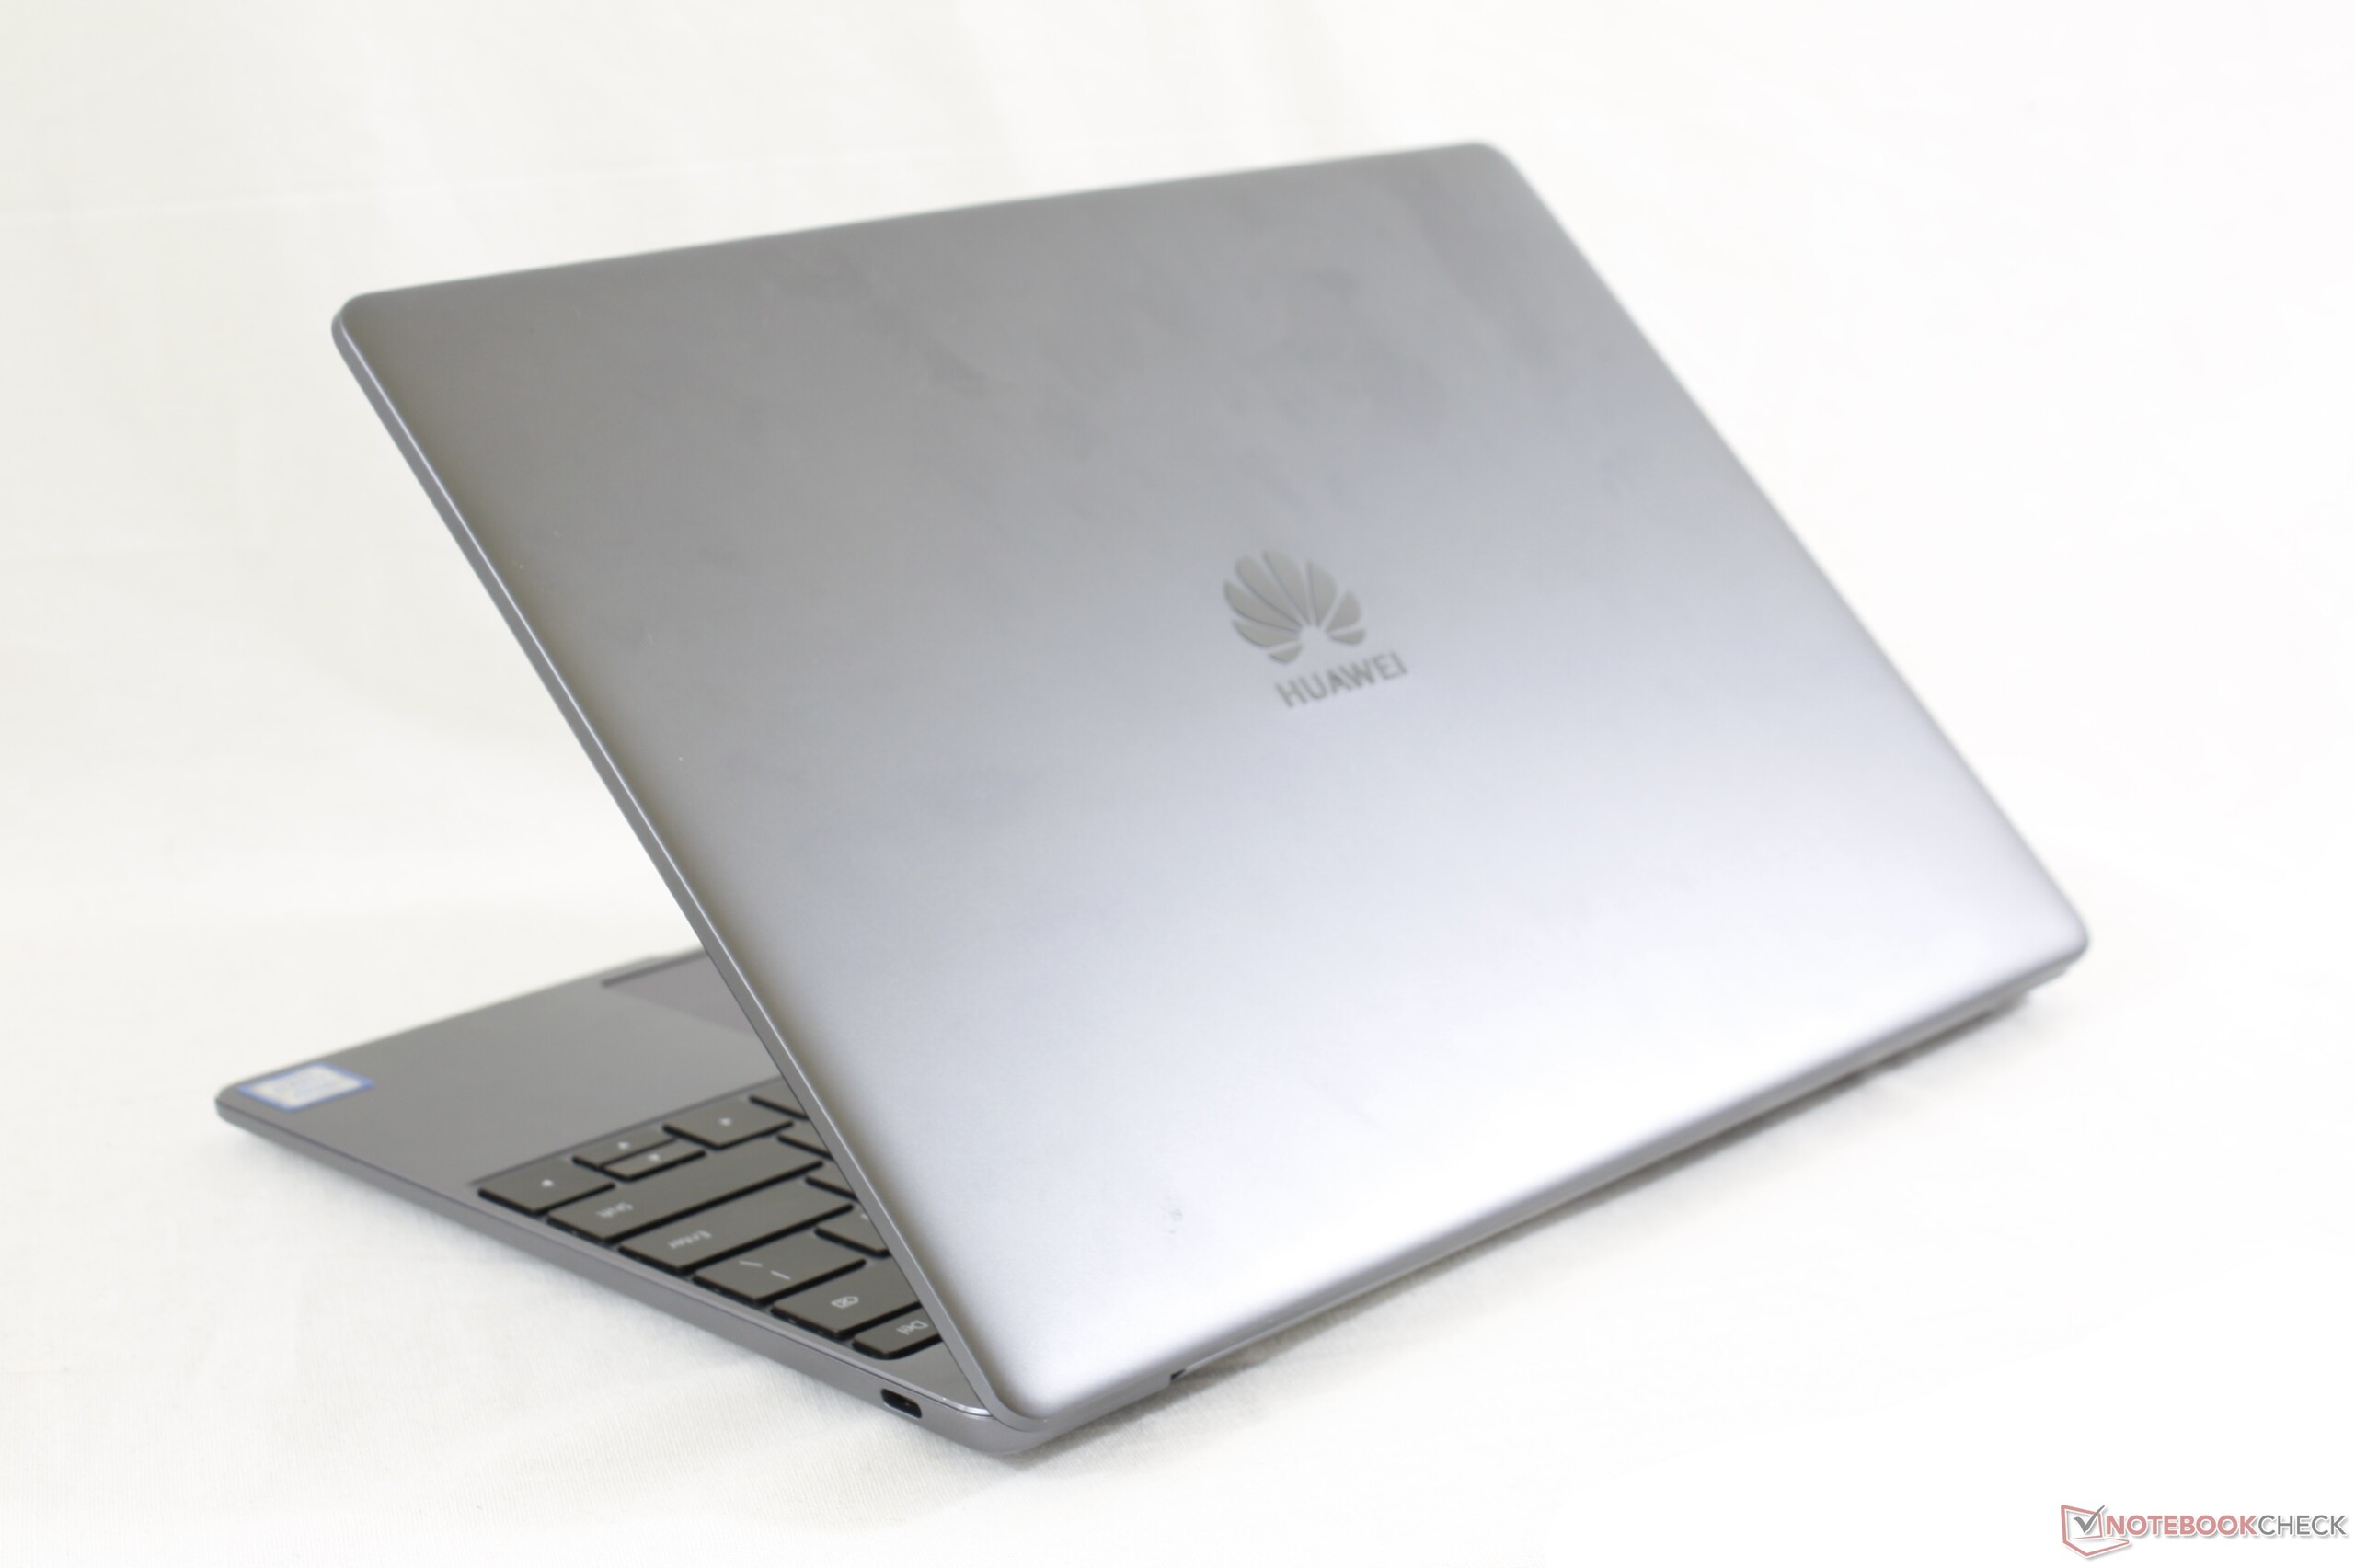
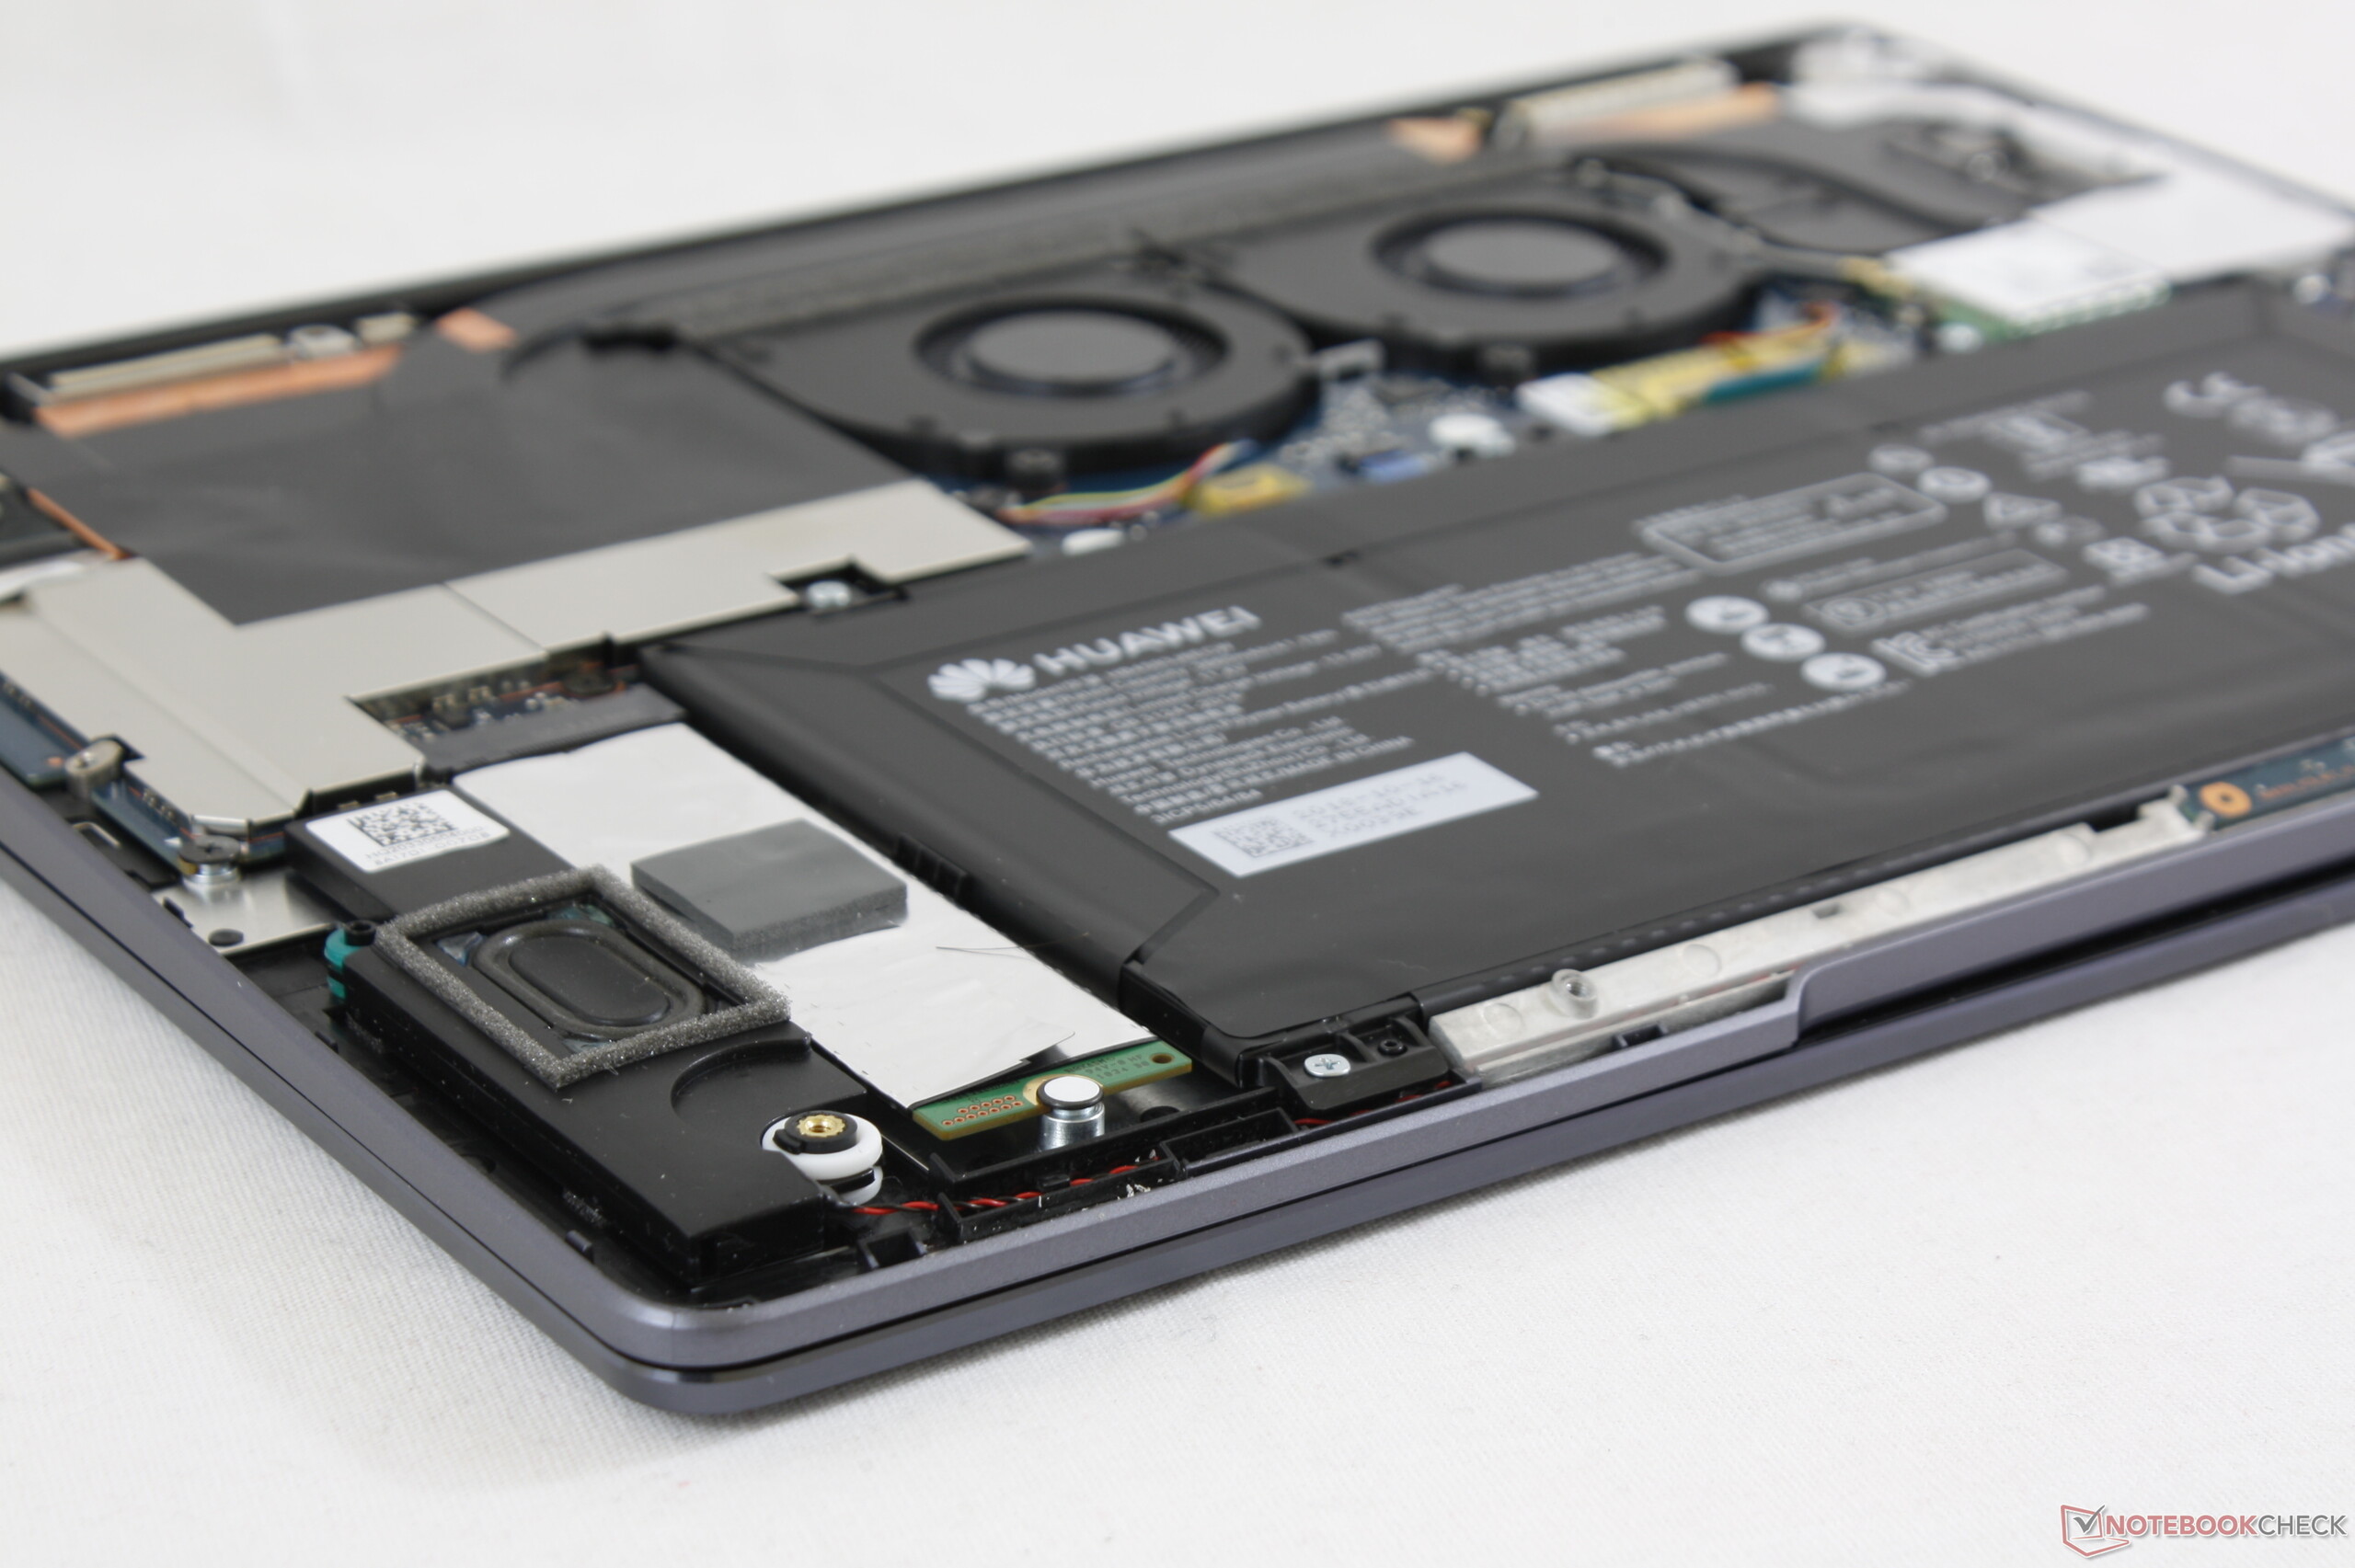
O MateBook 13 tem um preço ligeiramente inferior ao do carro chefe MateBook X Pro porque supostamente é uma opção de nível inferior. Na realidade, ele realmente supera o X Pro, mantendo o design do chassi super fino e atraente, intacto. Não estamos falando apenas de benefícios marginais, já que o MateBook 13 tem um controle de afogamento superior e uma GPU mais potente para um desempenho de 25 a 30 por cento mais rápido. Ele ainda tem WiFi mais rápido e uma webcam melhor para começar.
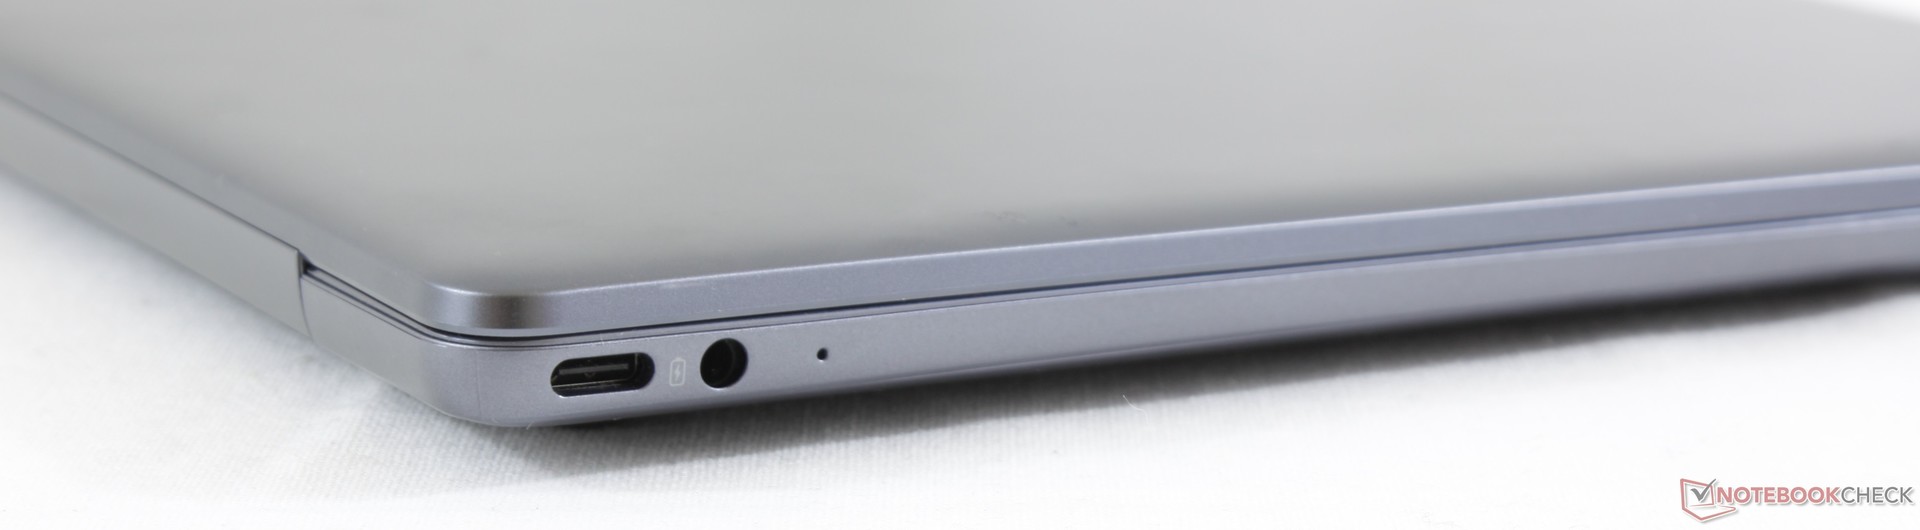
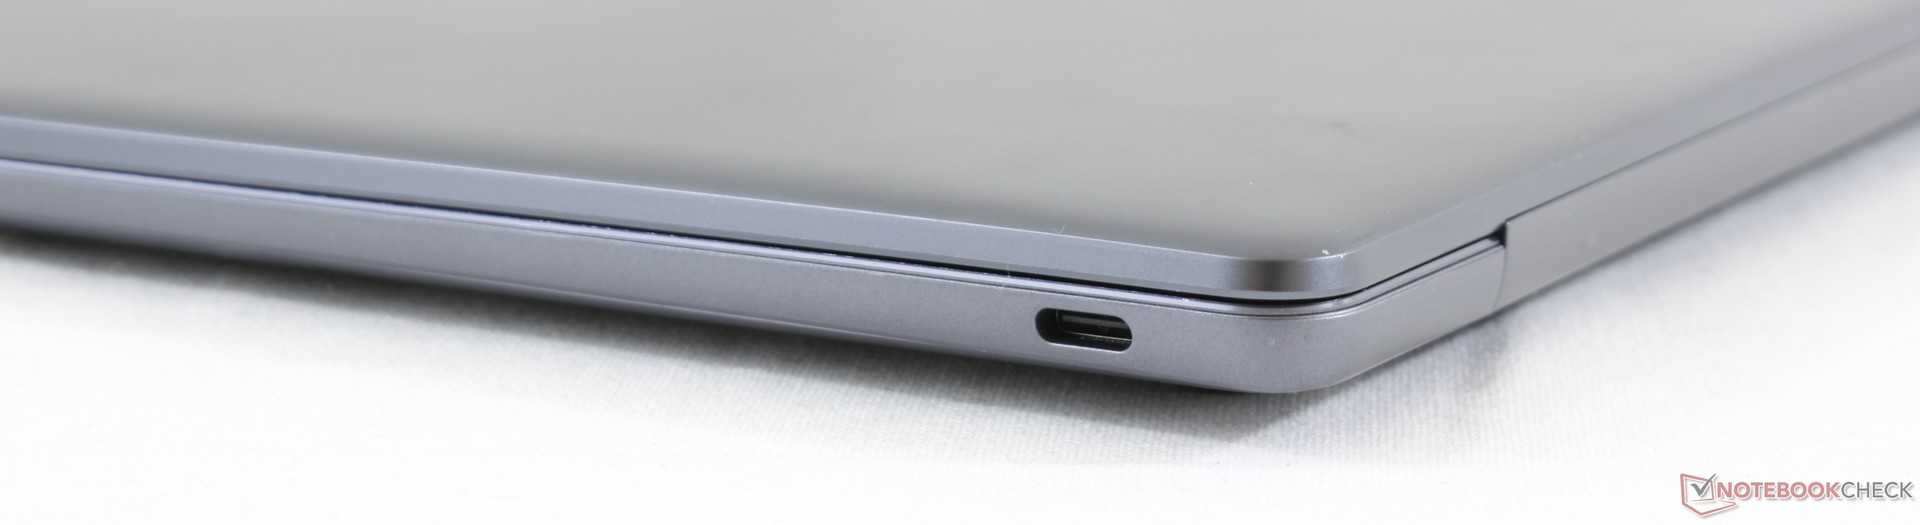
O principal aspecto que impede que o MateBook 13 seja totalmente melhor que o MateBook X Pro é sua tela. Embora ainda seja excelente e com cores precisas, é um pouco menor e mais escura, com menor contraste e resolução. A versão Pro ainda oferece a tela superior neste aspecto. Outras desvantagens do MateBook 13, quando comparado à sua alternativa mais cara, são sua bateria menor, a ausência do Thunderbolt 3 e a falta do USB tipo-A.
O MateBook 13 é uma opção sólida para usuários que ficam afastados pelo fraco potencial gráfico dos populares Ultrabooks de 13 polegadas, como o XPS 13, Spectre 13, Gram 13, ou ZenBook 13. Se a poderosa GPU não é atraente, os usuários estariam melhor com o XPS 13 ou o Spectre 13, pois esses modelos são mais rígidos com uma seleção mais ampla de portas e teclados possivelmente melhores.
O único Ultrabook até agora com uma tela de 13 polegadas 3:2 polegadas e uma GeForce MX150 de 25 W de potência total para desempenho em nível de jogos. O MateBook 13 possui um imenso poder para o seu tamanho, que tanto os jogadores casuais quanto os usuários tradicionais de Ultrabooks podem apreciar.
Huawei MateBook 13 i7
- 01/19/2019 v6 (old)
Allen Ngo
Price comparison
