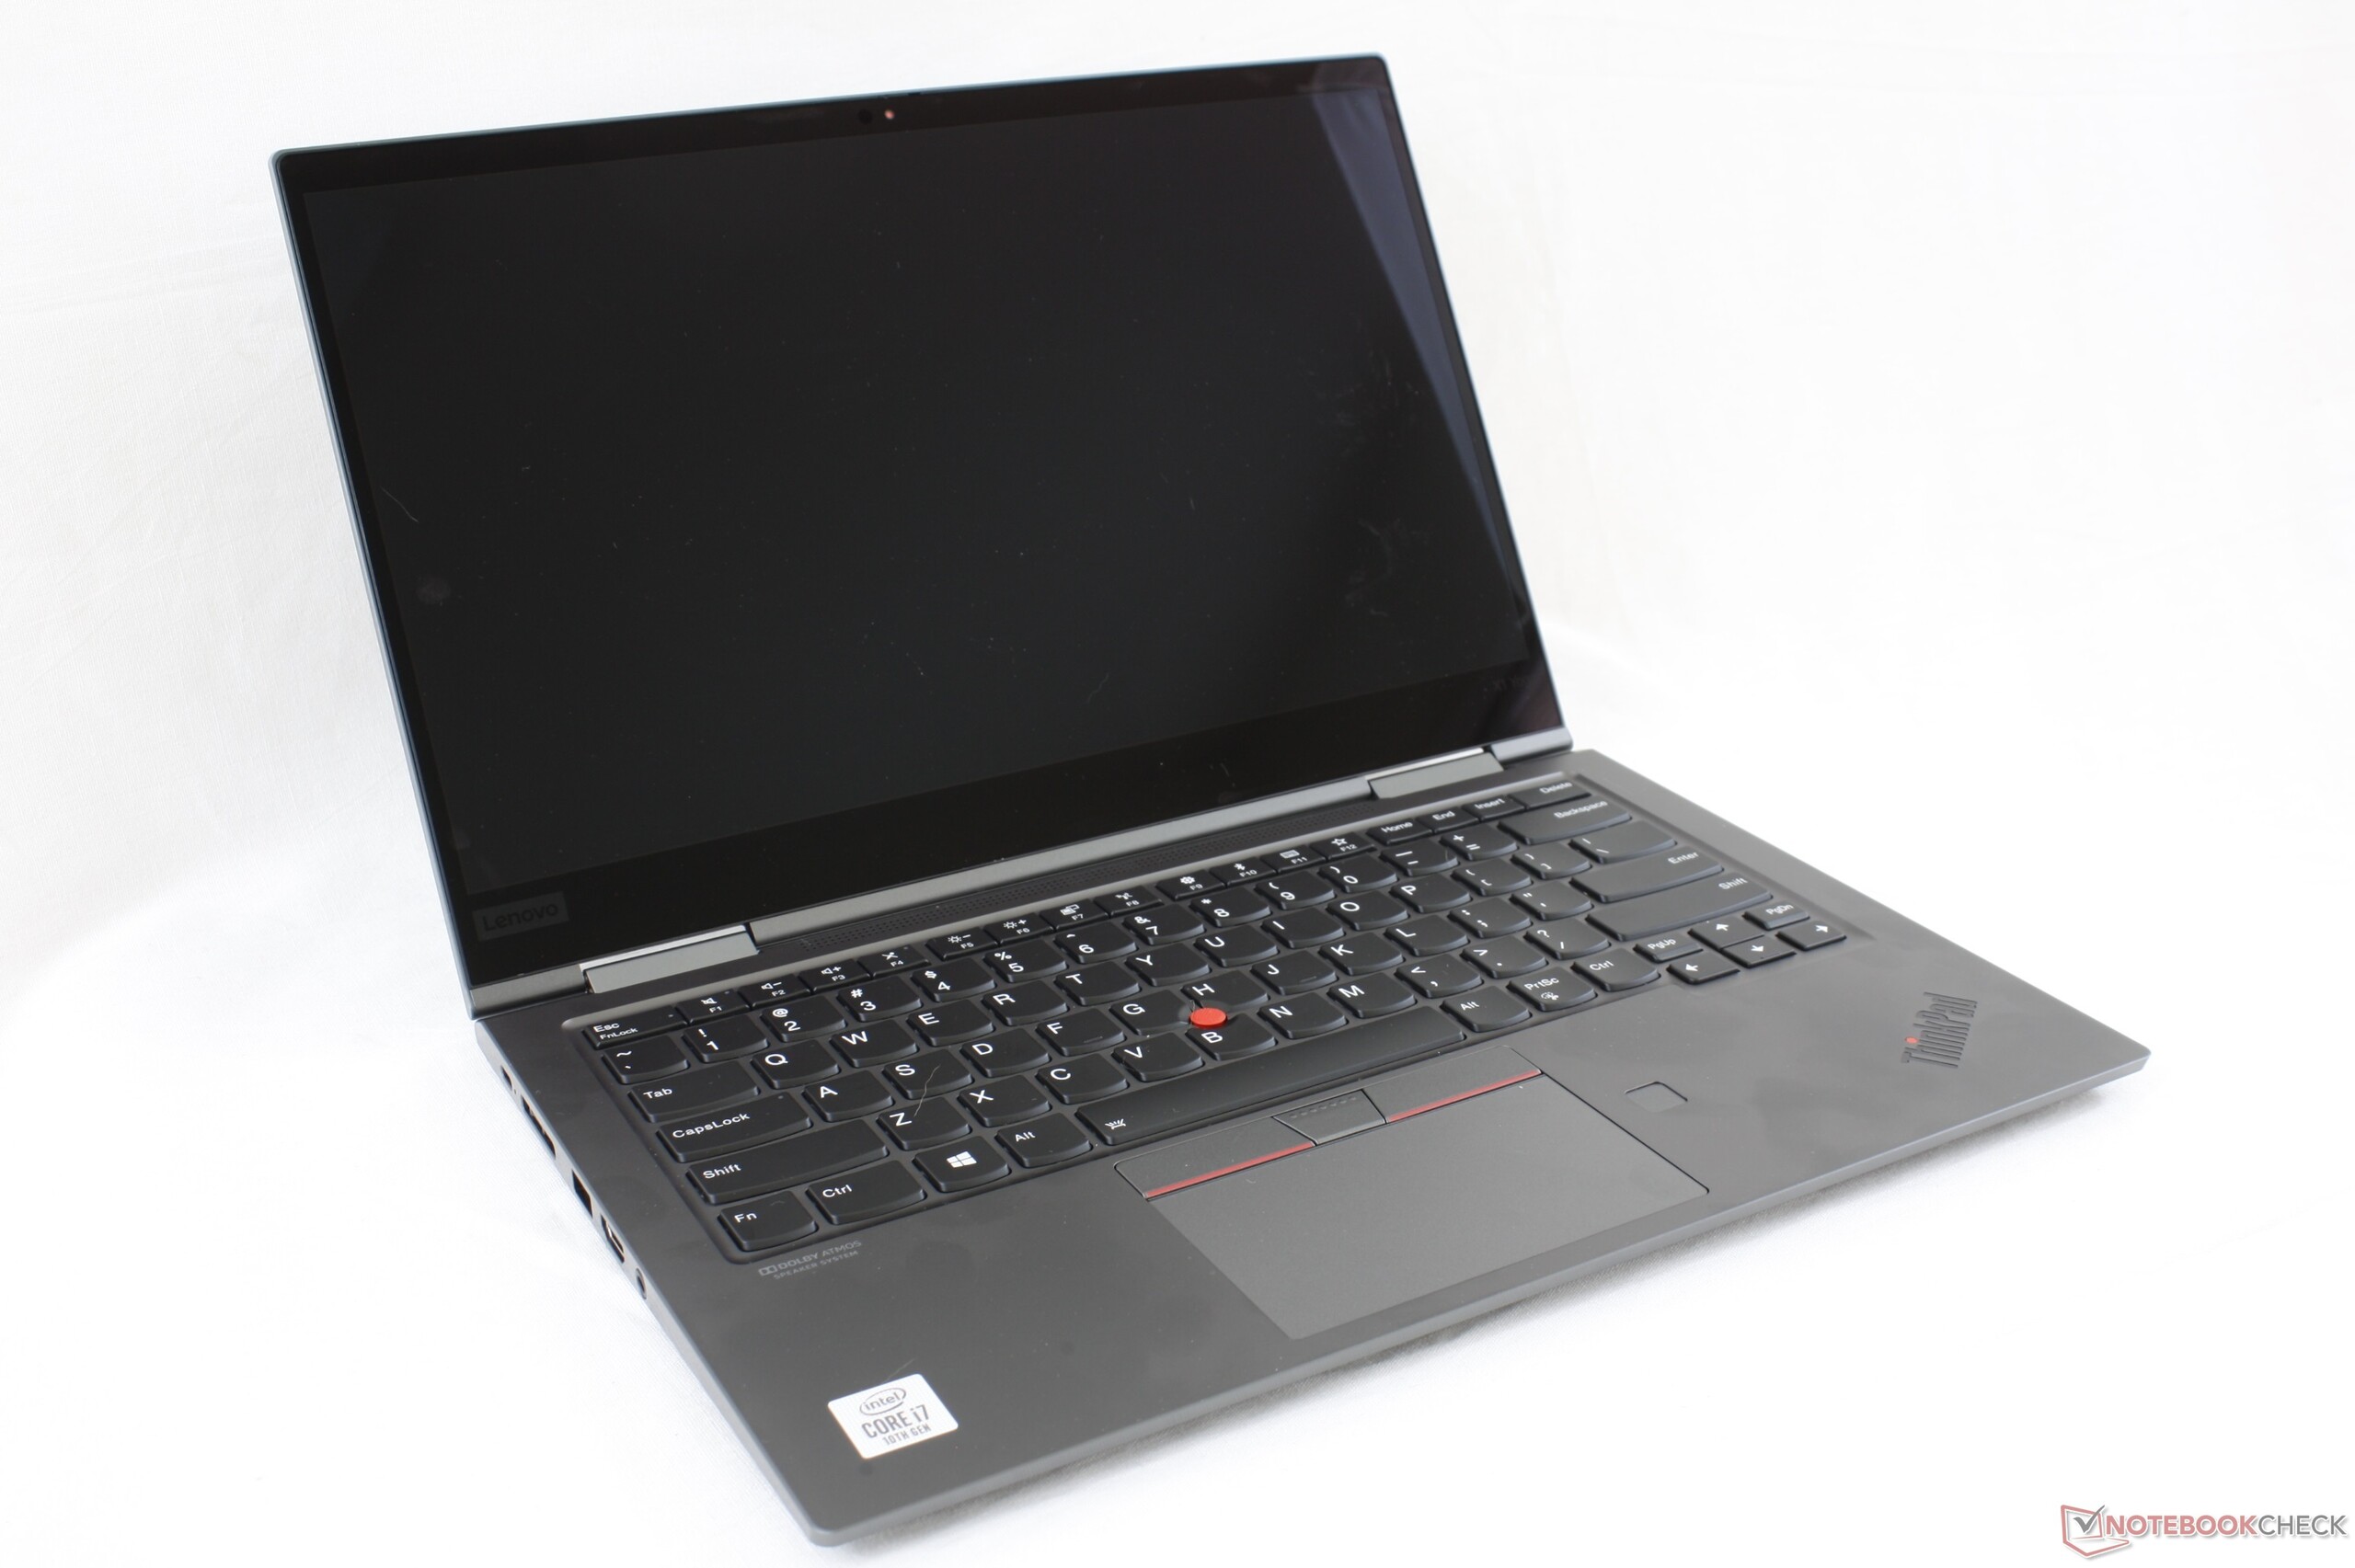
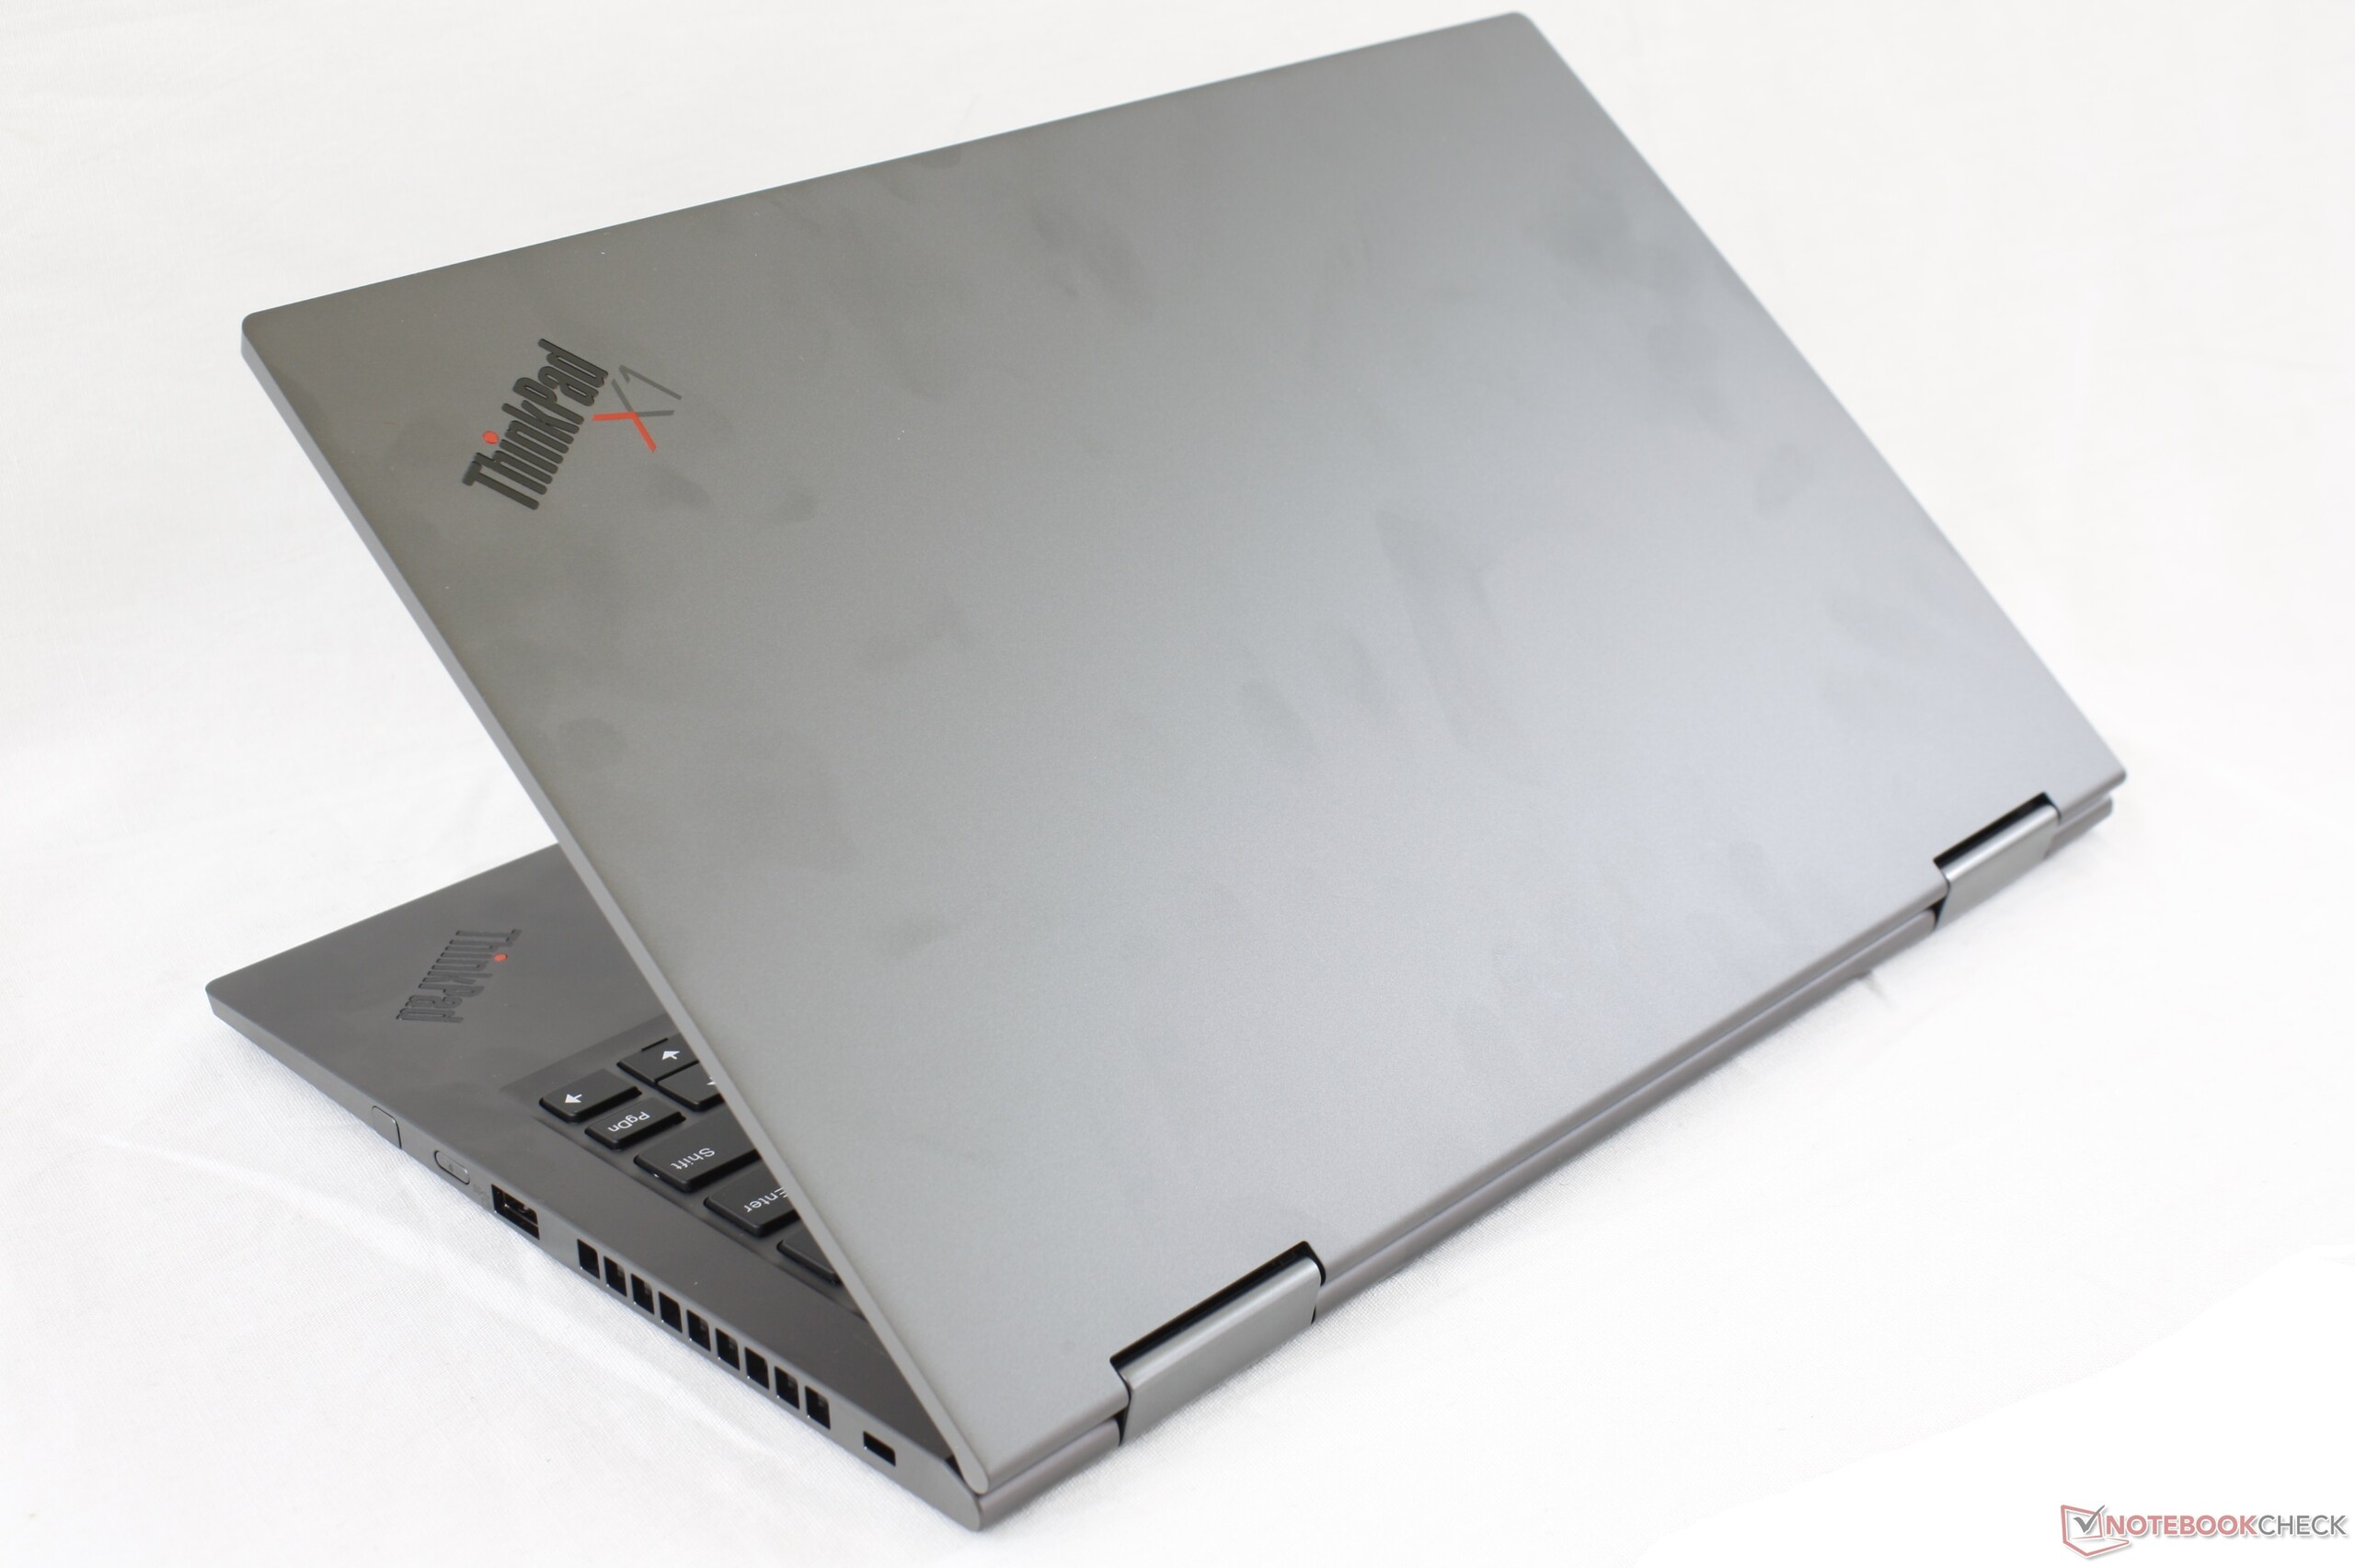
Breve Análise do Conversível Lenovo ThinkPad X1 Yoga 4th Gen Core i7: Um ThinkPad X1 Carbon disfarçado
Avaliação | Data | Modelo | Peso | Altura | Size | Resolução | Preço |
|---|---|---|---|---|---|---|---|
| 89.8 % v7 (old) | 04/2020 | Lenovo ThinkPad X1 Yoga 20SA000GUS i7-10510U, UHD Graphics 620 | 1.3 kg | 15.5 mm | 14.00" | 2560x1440 | |
| 90.5 % v7 (old) | 02/2019 | HP Elitebook x360 1040 G5 i7-8650U, UHD Graphics 620 | 1.4 kg | 16.9 mm | 14.00" | 1920x1080 | |
| 88.5 % v7 (old) | 03/2020 | Lenovo ThinkPad X1 Carbon G7 20R1-000YUS i7-10510U, UHD Graphics 620 | 1.2 kg | 15.4 mm | 14.00" | 3840x2160 | |
| 87.8 % v7 (old) | 06/2019 | Dell Latitude 7400 2-in-1 i7-8665U, UHD Graphics 620 | 1.5 kg | 15 mm | 14.00" | 1920x1080 | |
| 81.2 % v7 (old) | 03/2020 | Asus ZenBook Flip 14 UM462DA-AI023T R7 3700U, Vega 10 | 1.6 kg | 18.9 mm | 14.00" | 1920x1080 | |
| 88 % v6 (old) | 06/2017 | Lenovo ThinkPad X1 Yoga 2017 20JES03T00 i7-7600U, HD Graphics 620 | 1.4 kg | 17.4 mm | 14.00" | 2560x1440 |


| |||||||||||||||||||||||||
iluminação: 86 %
iluminação com acumulador: 284.6 cd/m²
Contraste: 1016:1 (Preto: 0.28 cd/m²)
ΔE ColorChecker Calman: 2.07 | ∀{0.5-29.43 Ø4.73}
calibrated: 2.05
ΔE Greyscale Calman: 1.7 | ∀{0.09-98 Ø4.97}
95.8% sRGB (Argyll 1.6.3 3D)
61.7% AdobeRGB 1998 (Argyll 1.6.3 3D)
67.5% AdobeRGB 1998 (Argyll 3D)
95.9% sRGB (Argyll 3D)
66.6% Display P3 (Argyll 3D)
Gamma: 2.17
CCT: 6627 K
| Lenovo ThinkPad X1 Yoga 20SA000GUS AU Optronics B140QAN02.2, IPS, 14", 2560x1440 | HP Elitebook x360 1040 G5 AU Optronics AUO533D, IPS, 14", 1920x1080 | Lenovo ThinkPad X1 Carbon G7 20R1-000YUS BOE NV140QUM-N53, IPS, 14", 3840x2160 | Dell Latitude 7400 2-in-1 SHP14A2, IPS, 14", 1920x1080 | Asus ZenBook Flip 14 UM462DA-AI023T IPS, 14", 1920x1080 | Lenovo ThinkPad X1 Yoga 2017 20JES03T00 LEN4140, OLED, 14", 2560x1440 | |
|---|---|---|---|---|---|---|
| Display | -3% | 17% | 4% | -7% | ||
| Display P3 Coverage (%) | 66.6 | 64.3 -3% | 83 25% | 68.6 3% | 65.5 -2% | |
| sRGB Coverage (%) | 95.9 | 94.1 -2% | 99.7 4% | 99.6 4% | 85.2 -11% | |
| AdobeRGB 1998 Coverage (%) | 67.5 | 65.5 -3% | 83.1 23% | 70 4% | 62.2 -8% | |
| Response Times | -84% | -45% | -68% | -38% | 88% | |
| Response Time Grey 50% / Grey 80% * (ms) | 32 ? | 70.8 ? -121% | 49.2 ? -54% | 56 ? -75% | 42 ? -31% | 3.6 ? 89% |
| Response Time Black / White * (ms) | 23.6 ? | 34.4 ? -46% | 32.2 ? -36% | 38 ? -61% | 34 ? -44% | 3.2 ? 86% |
| PWM Frequency (Hz) | 735 ? | 201.6 ? | 1667 ? | 240.4 ? | ||
| Screen | -1% | -75% | -4% | -62% | -48% | |
| Brightness middle (cd/m²) | 284.6 | 416.3 46% | 532 87% | 277.2 -3% | 306 8% | 243 -15% |
| Brightness (cd/m²) | 269 | 400 49% | 513 91% | 263 -2% | 294 9% | 240 -11% |
| Brightness Distribution (%) | 86 | 89 3% | 90 5% | 83 -3% | 81 -6% | 95 10% |
| Black Level * (cd/m²) | 0.28 | 0.29 -4% | 0.41 -46% | 0.2 29% | 0.39 -39% | |
| Contrast (:1) | 1016 | 1436 41% | 1298 28% | 1386 36% | 785 -23% | |
| Colorchecker dE 2000 * | 2.07 | 2.69 -30% | 6.88 -232% | 2.1 -1% | 5.16 -149% | 5.3 -156% |
| Colorchecker dE 2000 max. * | 3.75 | 4.95 -32% | 12.65 -237% | 5.91 -58% | 9.9 -164% | 8.9 -137% |
| Colorchecker dE 2000 calibrated * | 2.05 | 2.13 -4% | 2.52 -23% | 1.03 50% | 3.07 -50% | |
| Greyscale dE 2000 * | 1.7 | 2.9 -71% | 10.5 -518% | 3.4 -100% | 5.86 -245% | 3.7 -118% |
| Gamma | 2.17 101% | 2.4 92% | 1.98 111% | 2.241 98% | 2.31 95% | 1.78 124% |
| CCT | 6627 98% | 6623 98% | 7394 88% | 6030 108% | 6349 102% | 6202 105% |
| Color Space (Percent of AdobeRGB 1998) (%) | 61.7 | 60.1 -3% | 74.1 20% | 64 4% | 56 -9% | 84.8 37% |
| Color Space (Percent of sRGB) (%) | 95.8 | 94.5 -1% | 99.7 4% | 100 4% | 85 -11% | 100 4% |
| Média Total (Programa/Configurações) | -29% /
-11% | -34% /
-54% | -23% /
-11% | -36% /
-48% | 20% /
-21% |
* ... menor é melhor
Exibir tempos de resposta
| ↔ Tempo de resposta preto para branco | ||
|---|---|---|
| 23.6 ms ... ascensão ↗ e queda ↘ combinadas | ↗ 12.8 ms ascensão | 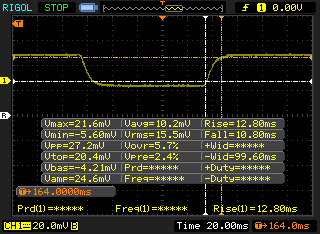 |
| ↘ 10.8 ms queda | ||
| A tela mostra boas taxas de resposta em nossos testes, mas pode ser muito lenta para jogadores competitivos. Em comparação, todos os dispositivos testados variam de 0.1 (mínimo) a 240 (máximo) ms. » 54 % de todos os dispositivos são melhores. Isso significa que o tempo de resposta medido é pior que a média de todos os dispositivos testados (19.9 ms). | ||
| ↔ Tempo de resposta 50% cinza a 80% cinza | ||
| 32 ms ... ascensão ↗ e queda ↘ combinadas | ↗ 16.4 ms ascensão | 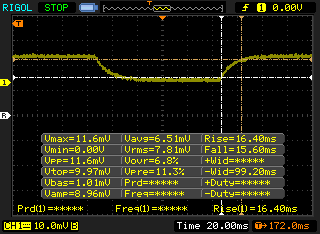 |
| ↘ 15.6 ms queda | ||
| A tela mostra taxas de resposta lentas em nossos testes e será insatisfatória para os jogadores. Em comparação, todos os dispositivos testados variam de 0.165 (mínimo) a 636 (máximo) ms. » 43 % de todos os dispositivos são melhores. Isso significa que o tempo de resposta medido é semelhante à média de todos os dispositivos testados (31.1 ms). | ||
Cintilação da tela / PWM (modulação por largura de pulso)
| Tela tremeluzindo / PWM não detectado | 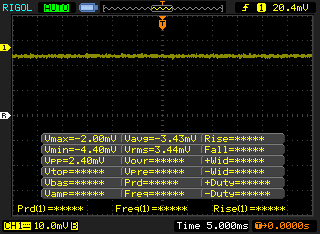 | ||
[pwm_comparison] Em comparação: 52 % de todos os dispositivos testados não usam PWM para escurecer a tela. Se PWM foi detectado, uma média de 7798 (mínimo: 5 - máximo: 343500) Hz foi medida. | |||
| Cinebench R20 | |
| CPU (Single Core) | |
| Dell XPS 13 7390 Core i7-10710U | |
| Lenovo Yoga C940-14IIL 81Q9 | |
| Lenovo ThinkPad X1 Yoga 20SA000GUS | |
| Lenovo ThinkPad T490-20N3S02L00 | |
| Microsoft Surface Laptop 3 13 Core i5-1035G7 | |
| Média Intel Core i7-10510U (362 - 497, n=37) | |
| Acer Aspire 5 A515-54G | |
| Dynabook Portege A30-E-174 | |
| Dell Latitude 14 5495 | |
| Dell Latitude 13 3390 | |
| Dell Inspiron 15 5000 5585 | |
| CPU (Multi Core) | |
| Dell XPS 13 7390 Core i7-10710U | |
| Microsoft Surface Laptop 3 13 Core i5-1035G7 | |
| Lenovo Yoga C940-14IIL 81Q9 | |
| Lenovo ThinkPad X1 Yoga 20SA000GUS | |
| Lenovo ThinkPad T490-20N3S02L00 | |
| Dell Inspiron 15 5000 5585 | |
| Média Intel Core i7-10510U (1015 - 1897, n=38) | |
| Dell Latitude 14 5495 | |
| Acer Aspire 5 A515-54G | |
| Dynabook Portege A30-E-174 | |
| Dell Latitude 13 3390 | |
| Cinebench R15 | |
| CPU Single 64Bit | |
| Lenovo ThinkPad X1 Yoga 20SA000GUS | |
| Lenovo Yoga C940-14IIL 81Q9 | |
| Lenovo ThinkPad T490-20N3S02L00 | |
| Dell XPS 13 7390 Core i7-10710U | |
| Média Intel Core i7-10510U (113 - 202, n=42) | |
| Lenovo ThinkPad X1 Yoga 2019-20QGS00A00 | |
| HP Elitebook x360 1040 G5 | |
| Microsoft Surface Laptop 3 13 Core i5-1035G7 | |
| Acer Aspire 5 A515-54G | |
| Dynabook Portege A30-E-174 | |
| Dell Latitude 14 5495 | |
| Lenovo ThinkPad 13 20J1005TPB | |
| Dell Latitude 13 3390 | |
| Dell Inspiron 15 5000 5585 | |
| CPU Multi 64Bit | |
| Dell XPS 13 7390 Core i7-10710U | |
| Lenovo ThinkPad X1 Yoga 20SA000GUS | |
| Lenovo Yoga C940-14IIL 81Q9 | |
| Microsoft Surface Laptop 3 13 Core i5-1035G7 | |
| Lenovo ThinkPad X1 Yoga 2019-20QGS00A00 | |
| Lenovo ThinkPad T490-20N3S02L00 | |
| Dell Inspiron 15 5000 5585 | |
| Dell Latitude 14 5495 | |
| Média Intel Core i7-10510U (482 - 856, n=45) | |
| Acer Aspire 5 A515-54G | |
| HP Elitebook x360 1040 G5 | |
| Dell Latitude 13 3390 | |
| Dynabook Portege A30-E-174 | |
| Lenovo ThinkPad 13 20J1005TPB | |
| Cinebench R10 | |
| Rendering Multiple CPUs 32Bit | |
| Dell XPS 13 7390 Core i7-10710U | |
| Microsoft Surface Laptop 3 13 Core i5-1035G7 | |
| Média Intel Core i7-10510U (6763 - 26265, n=3) | |
| Dynabook Portege A30-E-174 | |
| Rendering Single 32Bit | |
| Dell XPS 13 7390 Core i7-10710U | |
| Média Intel Core i7-10510U (5740 - 7748, n=3) | |
| Microsoft Surface Laptop 3 13 Core i5-1035G7 | |
| Dynabook Portege A30-E-174 | |
| wPrime 2.10 - 1024m | |
| Lenovo ThinkPad 13 20J1005TPB | |
| Microsoft Surface Laptop 3 13 Core i5-1035G7 | |
| Dell XPS 13 7390 Core i7-10710U | |
* ... menor é melhor
| PCMark 8 Home Score Accelerated v2 | 3674 pontos | |
| PCMark 8 Work Score Accelerated v2 | 5059 pontos | |
| PCMark 10 Score | 4611 pontos | |
Ajuda | ||
| DPC Latencies / LatencyMon - interrupt to process latency (max), Web, Youtube, Prime95 | |
| Lenovo ThinkPad X1 Yoga 20SA000GUS | |
* ... menor é melhor
| Lenovo ThinkPad X1 Yoga 20SA000GUS WDC PC SN730 SDBQNTY-512GB | HP Elitebook x360 1040 G5 Samsung SSD PM981 MZVLB512HAJQ | Lenovo ThinkPad X1 Carbon G7 20R1-000YUS WDC PC SN730 SDBPNTY-512G | Dell Latitude 7400 2-in-1 Toshiba XG6 KXG60ZNV512G | Lenovo ThinkPad X1 Yoga 2017 20JES03T00 Samsung SSD PM961 1TB M.2 PCIe 3.0 x4 NVMe (MZVLW1T0) | |
|---|---|---|---|---|---|
| AS SSD | 8% | -9% | -53% | 36% | |
| Seq Read (MB/s) | 1939 | 1816 -6% | 1786 -8% | 2289 18% | 2783 44% |
| Seq Write (MB/s) | 1380 | 1270 -8% | 1259 -9% | 1163 -16% | 1734 26% |
| 4K Read (MB/s) | 41.38 | 46.25 12% | 45.86 11% | 22.29 -46% | 56.4 36% |
| 4K Write (MB/s) | 154.9 | 104.1 -33% | 147.9 -5% | 28.92 -81% | 158.1 2% |
| 4K-64 Read (MB/s) | 970 | 1342 38% | 885 -9% | 415.6 -57% | 2140 121% |
| 4K-64 Write (MB/s) | 990 | 1209 22% | 950 -4% | 199.5 -80% | 1196 21% |
| Access Time Read * (ms) | 0.055 | 0.043 22% | 0.058 -5% | 0.122 -122% | 0.029 47% |
| Access Time Write * (ms) | 0.07 | 0.035 50% | 0.074 -6% | 0.143 -104% | 0.023 67% |
| Score Read (Points) | 1205 | 1569 30% | 1110 -8% | 667 -45% | 2475 105% |
| Score Write (Points) | 1283 | 1440 12% | 1224 -5% | 345 -73% | 1527 19% |
| Score Total (Points) | 3083 | 3790 23% | 2885 -6% | 1300 -58% | 5215 69% |
| Copy ISO MB/s (MB/s) | 2074 | 2034 -2% | 1384 -33% | 1767 -15% | 1807 -13% |
| Copy Program MB/s (MB/s) | 630 | 450.3 -29% | 525 -17% | 379.4 -40% | 444.3 -29% |
| Copy Game MB/s (MB/s) | 1326 | 1024 -23% | 1008 -24% | 1055 -20% | 1237 -7% |
| CrystalDiskMark 5.2 / 6 | -6% | 2% | -48% | ||
| Write 4K (MB/s) | 152 | 122.7 -19% | 151.5 0% | 35.06 -77% | |
| Read 4K (MB/s) | 45.96 | 46.57 1% | 45.83 0% | 23.64 -49% | |
| Write Seq (MB/s) | 2069 | 1725 -17% | 2060 0% | 1537 -26% | |
| Read Seq (MB/s) | 1708 | 2392 40% | 1973 16% | 1782 4% | |
| Write 4K Q32T1 (MB/s) | 465.4 | 470.6 1% | 489.8 5% | 100.3 -78% | |
| Read 4K Q32T1 (MB/s) | 410.1 | 313.2 -24% | 386.2 -6% | 62.7 -85% | |
| Write Seq Q32T1 (MB/s) | 2713 | 1869 -31% | 2703 0% | 2698 -1% | |
| Read Seq Q32T1 (MB/s) | 3399 | 3380 -1% | 3376 -1% | 1073 -68% | |
| Média Total (Programa/Configurações) | 1% /
3% | -4% /
-5% | -51% /
-51% | 36% /
36% |
* ... menor é melhor

| 3DMark 11 Performance | 2208 pontos | |
| 3DMark Ice Storm Standard Score | 70296 pontos | |
| 3DMark Cloud Gate Standard Score | 9942 pontos | |
| 3DMark Fire Strike Score | 1236 pontos | |
| 3DMark Time Spy Score | 495 pontos | |
Ajuda | ||
| baixo | média | alto | ultra | |
|---|---|---|---|---|
| The Witcher 3 (2015) | 16 | |||
| Dota 2 Reborn (2015) | 78.2 | 52.6 | 22.4 | 19.9 |
| X-Plane 11.11 (2018) | 12.2 | 10.6 | 9.46 |
| Lenovo ThinkPad X1 Yoga 20SA000GUS UHD Graphics 620, i7-10510U, WDC PC SN730 SDBQNTY-512GB | HP Elitebook x360 1040 G5 UHD Graphics 620, i7-8650U, Samsung SSD PM981 MZVLB512HAJQ | Lenovo ThinkPad X1 Carbon G7 20R1-000YUS UHD Graphics 620, i7-10510U, WDC PC SN730 SDBPNTY-512G | Dell Latitude 7400 2-in-1 UHD Graphics 620, i7-8665U, Toshiba XG6 KXG60ZNV512G | Asus ZenBook Flip 14 UM462DA-AI023T Vega 10, R7 3700U | Lenovo ThinkPad X1 Yoga 2017 20JES03T00 HD Graphics 620, i7-7600U, Samsung SSD PM961 1TB M.2 PCIe 3.0 x4 NVMe (MZVLW1T0) | |
|---|---|---|---|---|---|---|
| Noise | -1% | -2% | 6% | -6% | -8% | |
| desligado / ambiente * (dB) | 28.4 | 28.3 -0% | 28.2 1% | 28.2 1% | 30 -6% | 29.3 -3% |
| Idle Minimum * (dB) | 28.4 | 28.3 -0% | 28.2 1% | 28.2 1% | 30 -6% | 29.3 -3% |
| Idle Average * (dB) | 28.4 | 28.3 -0% | 28.2 1% | 28.2 1% | 30 -6% | 31.1 -10% |
| Idle Maximum * (dB) | 29.3 | 28.3 3% | 29.4 -0% | 28.3 3% | 30 -2% | 33.3 -14% |
| Load Average * (dB) | 29.3 | 32.6 -11% | 31.5 -8% | 28.2 4% | 34.2 -17% | 33.3 -14% |
| Load Maximum * (dB) | 38.2 | 36.6 4% | 41.2 -8% | 28.8 25% | 37.5 2% | 38.9 -2% |
* ... menor é melhor
Barulho
| Ocioso |
| 28.4 / 28.4 / 29.3 dB |
| Carga |
| 29.3 / 38.2 dB |
 | ||
30 dB silencioso 40 dB(A) audível 50 dB(A) ruidosamente alto |
||
min: | ||
(±) A temperatura máxima no lado superior é 42.4 °C / 108 F, em comparação com a média de 35.4 °C / 96 F , variando de 19.6 a 60 °C para a classe Convertible.
(-) A parte inferior aquece até um máximo de 49.4 °C / 121 F, em comparação com a média de 36.9 °C / 98 F
(+) Em uso inativo, a temperatura média para o lado superior é 23 °C / 73 F, em comparação com a média do dispositivo de 30.3 °C / ### class_avg_f### F.
(+) Os apoios para as mãos e o touchpad estão atingindo a temperatura máxima da pele (32.6 °C / 90.7 F) e, portanto, não estão quentes.
(-) A temperatura média da área do apoio para as mãos de dispositivos semelhantes foi 28 °C / 82.4 F (-4.6 °C / -8.3 F).
| desligado | |
| Ocioso | |
| Carga |
|
Key:
min: | |
| Lenovo ThinkPad X1 Yoga 20SA000GUS i7-10510U, UHD Graphics 620, WDC PC SN730 SDBQNTY-512GB, IPS, 2560x1440, 14" | HP Elitebook x360 1040 G5 i7-8650U, UHD Graphics 620, Samsung SSD PM981 MZVLB512HAJQ, IPS, 1920x1080, 14" | Lenovo ThinkPad X1 Carbon G7 20R1-000YUS i7-10510U, UHD Graphics 620, WDC PC SN730 SDBPNTY-512G, IPS, 3840x2160, 14" | Dell Latitude 7400 2-in-1 i7-8665U, UHD Graphics 620, Toshiba XG6 KXG60ZNV512G, IPS, 1920x1080, 14" | Asus ZenBook Flip 14 UM462DA-AI023T R7 3700U, Vega 10, , IPS, 1920x1080, 14" | Lenovo ThinkPad X1 Yoga 2017 20JES03T00 i7-7600U, HD Graphics 620, Samsung SSD PM961 1TB M.2 PCIe 3.0 x4 NVMe (MZVLW1T0), OLED, 2560x1440, 14" | |
|---|---|---|---|---|---|---|
| Power Consumption | -7% | -40% | 14% | -4% | -27% | |
| Idle Minimum * (Watt) | 3.5 | 2.7 23% | 3.5 -0% | 2.6 26% | 3.7 -6% | 4.9 -40% |
| Idle Average * (Watt) | 5.6 | 6.5 -16% | 10.8 -93% | 4.3 23% | 6.9 -23% | 7.6 -36% |
| Idle Maximum * (Watt) | 6.5 | 11.5 -77% | 12.5 -92% | 5.5 15% | 9.4 -45% | 13.8 -112% |
| Load Average * (Watt) | 42.7 | 38.7 9% | 47.2 -11% | 32 25% | 34 20% | 33.4 22% |
| Load Maximum * (Watt) | 66.5 | 50.5 24% | 68.8 -3% | 78.8 -18% | 44 34% | 46.5 30% |
* ... menor é melhor
| Lenovo ThinkPad X1 Yoga 20SA000GUS i7-10510U, UHD Graphics 620, 51 Wh | HP Elitebook x360 1040 G5 i7-8650U, UHD Graphics 620, 56 Wh | Lenovo ThinkPad X1 Carbon G7 20R1-000YUS i7-10510U, UHD Graphics 620, 51 Wh | Dell Latitude 7400 2-in-1 i7-8665U, UHD Graphics 620, 78 Wh | Asus ZenBook Flip 14 UM462DA-AI023T R7 3700U, Vega 10, 42 Wh | Lenovo ThinkPad X1 Yoga 2017 20JES03T00 i7-7600U, HD Graphics 620, 56 Wh | |
|---|---|---|---|---|---|---|
| Duração da bateria | 49% | 9% | 33% | -18% | -14% | |
| Reader / Idle (h) | 19.9 | 27.9 40% | 13.1 -34% | |||
| WiFi v1.3 (h) | 9.2 | 10.4 13% | 10 9% | 12.2 33% | 7.5 -18% | 6.1 -34% |
| Load (h) | 1.6 | 3.1 94% | 2 25% |
Pro
Contra

Se você já possui um Modelo 2019 Whiskey Lake-U, então, há poucas razões para pular para o modelo Comet Lake-U, pois é apenas uma pequena atualização de desempenho. Se você é proprietário de um portátil corporativo muito mais antigo, agora seria um ótimo momento para considerar o conversível ThinkPad. Sua ampla seleção de portas, bateria de longa duração, teclado confortável, caneta integrada, WAN opcional e baixo peso o tornam quase perfeito para processamento de texto e trabalho de escritório enquanto viaja.
Temos que dizer "quase perfeito" porque o sistema tem duas grandes desvantagens. O primeiro é o brilho da tela, já que o painel de 300 nit possui metade da luminosidade de outros carros-chefe da Dell, Apple, Samsung ou HP. Você enfrentará muitos reflexos se planeja usar o sistema ao ar livre. A Lenovo oferece uma opção mais brilhante de 500 nit, que custará mais. Em segundo lugar, o desempenho da GPU não é destacável. Embora não esperemos gráficos de primeira linha de um conversível comercial, a UHD Graphics 620 ficou desatualizada diante das alternativas AMD Ryzen e Ice Lake. Os editores de vídeo ou gráficos terão que abrir mão do formato 2 em 1 para um Breve Análise do Portátil Lenovo ThinkPad T490 (i7, MX250, Low Power FHD)Breve Análise do Portátil Lenovo TahinkPad T490s (i5, Low Power FHD)ThinkPad T490/T495 onde as opções GeForce e Radeon estão disponíveis.
Para modelos futuros, gostaríamos de ver o Wi-Fi 6, opções de paineis de 600 a 1000 nit, marcos mais estreitos, uma caneta mais grossa para uma pegada mais fácil, opções AMD Ryzen 4000U e até uma tela 16:10. Esses recursos tornariam o ThinkPad X1 Yoga uma recomendação mais fácil sobre os concorrentes nessa faixa de preço ~US$ 2000.
A diferença de desempenho entre os modelos Core i7-8565U e Core i7-10510U é mínima, o que significa que o modelo 2019 poupará centenas sem sacrificar tanta potência da CPU. Para aproveitar ao máximo o modelo mais recente, considere o Core i7-10710U de gama mais alta ou a opção UHD 4K de 500 nit mais brilhante.
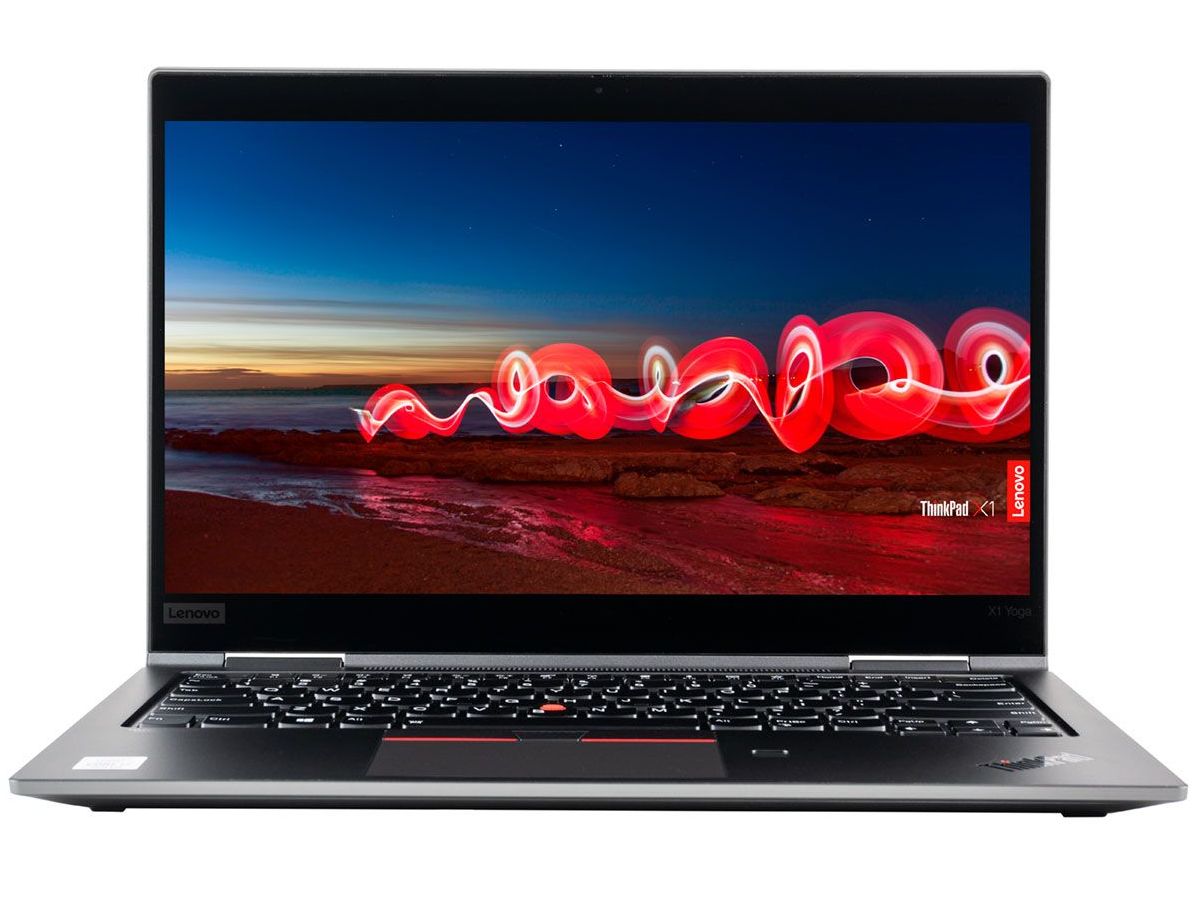
Lenovo ThinkPad X1 Yoga 20SA000GUS
- 04/13/2020 v7 (old)
Allen Ngo
Price comparison
