Breve Análise do Portátil Dell XPS 15 9575 (i7-8705G, Vega M GL, 4K UHD)
| SD Card Reader | |
| average JPG Copy Test (av. of 3 runs) | |
| Eurocom Sky X9C (Toshiba Exceria Pro SDXC 64 GB UHS-II) | |
| Dell XPS 15 9575 i7-8705G (Toshiba Exceria Pro M501 UHS-II) | |
| Dell XPS 15 9560 (i7-7700HQ, UHD) (Toshiba Exceria Pro SDXC 64 GB UHS-II) | |
| Gigabyte Aero 14-K8 (Toshiba Exceria Pro SDXC 64 GB UHS-II) | |
| maximum AS SSD Seq Read Test (1GB) | |
| Dell XPS 15 9560 (i7-7700HQ, UHD) (Toshiba Exceria Pro SDXC 64 GB UHS-II) | |
| Eurocom Sky X9C (Toshiba Exceria Pro SDXC 64 GB UHS-II) | |
| Dell XPS 15 9575 i7-8705G (Toshiba Exceria Pro M501 UHS-II) | |
| Gigabyte Aero 14-K8 (Toshiba Exceria Pro SDXC 64 GB UHS-II) | |
| |||||||||||||||||||||||||
iluminação: 81 %
iluminação com acumulador: 488 cd/m²
Contraste: 1627:1 (Preto: 0.3 cd/m²)
ΔE ColorChecker Calman: 3.16 | ∀{0.5-29.43 Ø4.73}
ΔE Greyscale Calman: 3.3 | ∀{0.09-98 Ø4.97}
97.9% sRGB (Argyll 1.6.3 3D)
71.7% AdobeRGB 1998 (Argyll 1.6.3 3D)
79.2% AdobeRGB 1998 (Argyll 3D)
97.9% sRGB (Argyll 3D)
78.7% Display P3 (Argyll 3D)
Gamma: 2.178
CCT: 6811 K
| Dell XPS 15 9575 i7-8705G Sharp SHP148D, IPS, 15.6", 3840x2160 | Dell XPS 15 9575 i5-8305G Sharp SHP148E, IPS, 15.6", 1920x1080 | Dell XPS 15 9560 (i7-7700HQ, UHD) IGZO IPS, 15.6", 3840x2160 | HP Spectre x360 15t-bl100 BOE06C3, IPS, 15.6", 3840x2160 | Dell Precision 5510 SHP143E, 7PHPT_LQ156D1, IGZO LED, 15.6", 3840x2160 | Lenovo ThinkPad P50 LQ156D1JW05, IPS, 15.6", 3840x2160 | |
|---|---|---|---|---|---|---|
| Display | -15% | 14% | -15% | 13% | 11% | |
| Display P3 Coverage (%) | 78.7 | 63.3 -20% | 89.7 14% | 66.6 -15% | 88.4 12% | 85.8 9% |
| sRGB Coverage (%) | 97.9 | 92.5 -6% | 100 2% | 86.9 -11% | 100 2% | 98.6 1% |
| AdobeRGB 1998 Coverage (%) | 79.2 | 63.9 -19% | 100 26% | 63.5 -20% | 99.5 26% | 98.2 24% |
| Response Times | -8% | -16% | 15% | -8% | 28% | |
| Response Time Grey 50% / Grey 80% * (ms) | 48.4 ? | 53.6 ? -11% | 57.2 ? -18% | 41.2 ? 15% | 56.4 ? -17% | 39.2 ? 19% |
| Response Time Black / White * (ms) | 34.8 ? | 36.4 ? -5% | 39.2 ? -13% | 29.6 ? 15% | 34 ? 2% | 22 ? 37% |
| PWM Frequency (Hz) | 1000 ? | 1000 ? | 962 | 1000 | 217 | |
| Screen | -14% | -19% | -21% | -16% | -29% | |
| Brightness middle (cd/m²) | 488 | 418.5 -14% | 370.1 -24% | 338.7 -31% | 391 -20% | 250 -49% |
| Brightness (cd/m²) | 440 | 391 -11% | 356 -19% | 325 -26% | 361 -18% | 250 -43% |
| Brightness Distribution (%) | 81 | 87 7% | 87 7% | 91 12% | 87 7% | 86 6% |
| Black Level * (cd/m²) | 0.3 | 0.35 -17% | 0.37 -23% | 0.28 7% | 0.4 -33% | 0.31 -3% |
| Contrast (:1) | 1627 | 1196 -26% | 1000 -39% | 1210 -26% | 978 -40% | 806 -50% |
| Colorchecker dE 2000 * | 3.16 | 3.5 -11% | 5.3 -68% | 4.9 -55% | 4.85 -53% | 4.5 -42% |
| Colorchecker dE 2000 max. * | 8.8 | 7.57 14% | 9.9 -13% | 8.7 1% | 9.3 -6% | |
| Greyscale dE 2000 * | 3.3 | 5.3 -61% | 4.6 -39% | 5.5 -67% | 4.01 -22% | 7.2 -118% |
| Gamma | 2.178 101% | 2.2 100% | 2.31 95% | 2.08 106% | 2.18 101% | 2.31 95% |
| CCT | 6811 95% | 7500 87% | 6284 103% | 7498 87% | 7340 89% | 6399 102% |
| Color Space (Percent of AdobeRGB 1998) (%) | 71.7 | 57.9 -19% | 88.3 23% | 63.5 -11% | 96 34% | 85 19% |
| Color Space (Percent of sRGB) (%) | 97.9 | 92.1 -6% | 100 2% | 86.92 -11% | 100 2% | 98.6 1% |
| Colorchecker dE 2000 calibrated * | 2.51 | |||||
| Média Total (Programa/Configurações) | -12% /
-14% | -7% /
-12% | -7% /
-15% | -4% /
-8% | 3% /
-13% |
* ... menor é melhor
Exibir tempos de resposta
| ↔ Tempo de resposta preto para branco | ||
|---|---|---|
| 34.8 ms ... ascensão ↗ e queda ↘ combinadas | ↗ 19.2 ms ascensão | 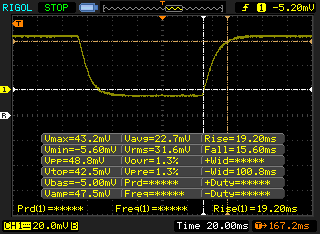 |
| ↘ 15.6 ms queda | ||
| A tela mostra taxas de resposta lentas em nossos testes e será insatisfatória para os jogadores. Em comparação, todos os dispositivos testados variam de 0.1 (mínimo) a 240 (máximo) ms. » 92 % de todos os dispositivos são melhores. Isso significa que o tempo de resposta medido é pior que a média de todos os dispositivos testados (19.9 ms). | ||
| ↔ Tempo de resposta 50% cinza a 80% cinza | ||
| 48.4 ms ... ascensão ↗ e queda ↘ combinadas | ↗ 23.2 ms ascensão | 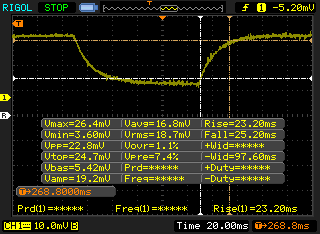 |
| ↘ 25.2 ms queda | ||
| A tela mostra taxas de resposta lentas em nossos testes e será insatisfatória para os jogadores. Em comparação, todos os dispositivos testados variam de 0.165 (mínimo) a 636 (máximo) ms. » 84 % de todos os dispositivos são melhores. Isso significa que o tempo de resposta medido é pior que a média de todos os dispositivos testados (31.1 ms). | ||
Cintilação da tela / PWM (modulação por largura de pulso)
| Tela tremeluzindo/PWM detectado | 1000 Hz | ≤ 25 % configuração de brilho | 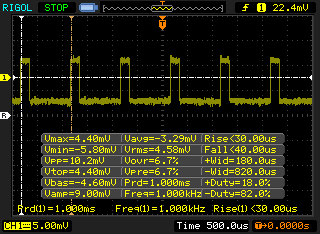 |
A luz de fundo da tela pisca em 1000 Hz (pior caso, por exemplo, utilizando PWM) Cintilação detectada em uma configuração de brilho de 25 % e abaixo. Não deve haver cintilação ou PWM acima desta configuração de brilho. A frequência de 1000 Hz é bastante alta, então a maioria dos usuários sensíveis ao PWM não deve notar nenhuma oscilação. [pwm_comparison] Em comparação: 52 % de todos os dispositivos testados não usam PWM para escurecer a tela. Se PWM foi detectado, uma média de 7798 (mínimo: 5 - máximo: 343500) Hz foi medida. | |||
| Cinebench R15 | |
| CPU Single 64Bit | |
| Eurocom Tornado F5 | |
| Intel Hades Canyon NUC8i7HVK | |
| Gigabyte Aero 14-K8 | |
| Dell XPS 15 9575 i7-8705G | |
| Dell XPS 13 9370 i7 UHD | |
| Dell Latitude 13 7380 | |
| Dell XPS 15 9560 (i7-7700HQ, UHD) | |
| Dell XPS 15 9575 i5-8305G | |
| Dell XPS 15 2017 9560 (7300HQ, Full-HD) | |
| Dell Latitude 5590 | |
| Acer Swift 3 SF315-41-R6J9 | |
| CPU Multi 64Bit | |
| Gigabyte Aero 14-K8 | |
| Eurocom Tornado F5 | |
| Intel Hades Canyon NUC8i7HVK | |
| Dell XPS 15 9575 i7-8705G | |
| Dell XPS 15 9560 (i7-7700HQ, UHD) | |
| Dell XPS 15 9575 i5-8305G | |
| Dell Latitude 5590 | |
| Dell XPS 13 9370 i7 UHD | |
| Acer Swift 3 SF315-41-R6J9 | |
| Dell XPS 15 2017 9560 (7300HQ, Full-HD) | |
| Dell Latitude 13 7380 | |
| Cinebench R11.5 | |
| CPU Single 64Bit | |
| Eurocom Tornado F5 | |
| Intel Hades Canyon NUC8i7HVK | |
| Dell XPS 15 9575 i7-8705G | |
| Gigabyte Aero 14-K8 | |
| Dell XPS 13 9370 i7 UHD | |
| Dell Latitude 13 7380 | |
| Dell XPS 15 9575 i5-8305G | |
| Dell XPS 15 9560 (i7-7700HQ, UHD) | |
| Dell Latitude 5590 | |
| Acer Swift 3 SF315-41-R6J9 | |
| CPU Multi 64Bit | |
| Gigabyte Aero 14-K8 | |
| Eurocom Tornado F5 | |
| Intel Hades Canyon NUC8i7HVK | |
| Dell XPS 15 9560 (i7-7700HQ, UHD) | |
| Dell Latitude 5590 | |
| Dell XPS 15 9575 i7-8705G | |
| Dell XPS 15 9575 i5-8305G | |
| Dell XPS 13 9370 i7 UHD | |
| Acer Swift 3 SF315-41-R6J9 | |
| Dell Latitude 13 7380 | |
| Cinebench R10 | |
| Rendering Multiple CPUs 32Bit | |
| Eurocom Tornado F5 | |
| Intel Hades Canyon NUC8i7HVK | |
| Dell XPS 15 9575 i7-8705G | |
| Dell Latitude 5590 | |
| Dell XPS 15 9575 i5-8305G | |
| Dell XPS 15 9560 (i7-7700HQ, UHD) | |
| Dell XPS 13 9370 i7 UHD | |
| Acer Swift 3 SF315-41-R6J9 | |
| Dell Latitude 13 7380 | |
| Rendering Single 32Bit | |
| Dell Latitude 5590 | |
| Eurocom Tornado F5 | |
| Intel Hades Canyon NUC8i7HVK | |
| Dell XPS 15 9575 i7-8705G | |
| Dell XPS 13 9370 i7 UHD | |
| Dell Latitude 13 7380 | |
| Dell XPS 15 9575 i5-8305G | |
| Dell XPS 15 9560 (i7-7700HQ, UHD) | |
| Acer Swift 3 SF315-41-R6J9 | |
| wPrime 2.10 - 1024m | |
| Dell Latitude 13 7380 | |
| Dell XPS 13 9370 i7 UHD | |
| Acer Swift 3 SF315-41-R6J9 | |
| Dell XPS 15 9575 i5-8305G | |
| Dell XPS 15 9560 (i7-7700HQ, UHD) | |
| Dell XPS 15 9575 i7-8705G | |
| Intel Hades Canyon NUC8i7HVK | |
| Eurocom Tornado F5 | |
* ... menor é melhor
| PCMark 10 - Score | |
| Intel Hades Canyon NUC8i7HVK | |
| Gigabyte Aero 15X v8 | |
| Dell XPS 15 9575 i7-8705G | |
| Dell XPS 15 9575 i5-8305G | |
| Asus Zenbook Pro UX550VE-DB71T | |
| Dell XPS 13 9370 i7 UHD | |
| Acer Swift 3 SF315-41-R6J9 | |
| Dell Latitude 5590 | |
| PCMark 8 | |
| Home Score Accelerated v2 | |
| Intel Hades Canyon NUC8i7HVK | |
| Dell XPS 15 9575 i5-8305G | |
| Gigabyte Aero 15X v8 | |
| Dell XPS 15 9575 i7-8705G | |
| Asus Zenbook Pro UX550VE-DB71T | |
| Dell Latitude 5590 | |
| Dell XPS 15 2017 9560 (7300HQ, Full-HD) | |
| Acer Swift 3 SF315-41-R6J9 | |
| Dell XPS 15 9560 (i7-7700HQ, UHD) | |
| Dell XPS 13 9370 i7 UHD | |
| Work Score Accelerated v2 | |
| Gigabyte Aero 15X v8 | |
| Intel Hades Canyon NUC8i7HVK | |
| Asus Zenbook Pro UX550VE-DB71T | |
| Dell XPS 15 9575 i5-8305G | |
| Dell XPS 15 2017 9560 (7300HQ, Full-HD) | |
| Acer Swift 3 SF315-41-R6J9 | |
| Dell Latitude 5590 | |
| Dell XPS 15 9575 i7-8705G | |
| Dell XPS 15 9560 (i7-7700HQ, UHD) | |
| Dell XPS 13 9370 i7 UHD | |
| Creative Score Accelerated v2 | |
| Intel Hades Canyon NUC8i7HVK | |
| Dell XPS 15 9575 i5-8305G | |
| Dell XPS 15 9575 i7-8705G | |
| Asus Zenbook Pro UX550VE-DB71T | |
| Dell XPS 15 9560 (i7-7700HQ, UHD) | |
| Dell Latitude 5590 | |
| Dell XPS 13 9370 i7 UHD | |
| Acer Swift 3 SF315-41-R6J9 | |
| PCMark 8 Home Score Accelerated v2 | 4235 pontos | |
| PCMark 8 Creative Score Accelerated v2 | 6297 pontos | |
| PCMark 8 Work Score Accelerated v2 | 4469 pontos | |
| PCMark 10 Score | 5001 pontos | |
Ajuda | ||
| Dell XPS 15 9575 i7-8705G SK hynix PC401 NVMe 500 GB | Dell XPS 15 9575 i5-8305G Toshiba XG5 KXG50ZNV256G | Asus ZenBook Flip 15 UX561UD Micron 1100 MTFDDAV256TBN | Asus Zenbook Pro UX550VE-DB71T Samsung PM961 NVMe MZVLW512HMJP | Asus G501VW-FY081T Samsung CM871 MZNLF128HCHP | |
|---|---|---|---|---|---|
| AS SSD | -58% | -59% | 31% | -122% | |
| Copy Game MB/s (MB/s) | 944 | 250.5 -73% | 282.3 -70% | 477.1 -49% | 141.5 -85% |
| Copy Program MB/s (MB/s) | 487.9 | 174.9 -64% | 196.8 -60% | 294.6 -40% | 99.9 -80% |
| Copy ISO MB/s (MB/s) | 1523 | 392.7 -74% | 291 -81% | 1269 -17% | 163 -89% |
| Score Total (Points) | 2132 | 1113 -48% | 844 -60% | 3721 75% | 269 -87% |
| Score Write (Points) | 807 | 307 -62% | 371 -54% | 1421 76% | 63 -92% |
| Score Read (Points) | 921 | 595 -35% | 310 -66% | 1541 67% | 152 -83% |
| Access Time Write * (ms) | 0.051 | 0.056 -10% | 0.056 -10% | 0.034 33% | 0.225 -341% |
| Access Time Read * (ms) | 0.044 | 0.146 -232% | 0.097 -120% | 0.054 -23% | 0.207 -370% |
| 4K-64 Write (MB/s) | 637 | 181.2 -72% | 248.5 -61% | 1160 82% | 19.4 -97% |
| 4K-64 Read (MB/s) | 649 | 337.1 -48% | 235.5 -64% | 1269 96% | 87.6 -87% |
| 4K Write (MB/s) | 94.3 | 92.7 -2% | 84.8 -10% | 112.8 20% | 30.66 -67% |
| 4K Read (MB/s) | 41.38 | 24.78 -40% | 25.79 -38% | 51 23% | 13.87 -66% |
| Seq Write (MB/s) | 752 | 334.3 -56% | 379.3 -50% | 1475 96% | 126.9 -83% |
| Seq Read (MB/s) | 2302 | 2335 1% | 488 -79% | 2208 -4% | 504 -78% |
* ... menor é melhor

| 3DMark | |
| 1920x1080 Fire Strike Graphics | |
| Asus FX503VM-EH73 | |
| Intel Hades Canyon NUC8i7HVK | |
| Dell Inspiron 15 7000 7577 4K | |
| Alienware 13 R3 (i5-7300HQ, GTX 1050 Ti) | |
| Gigabyte Aero 14-K8 | |
| Dell XPS 15 9575 i5-8305G | |
| Dell XPS 15 9575 i7-8705G | |
| Asus Strix GL502VT-DS74 | |
| Dell XPS 15 9560 (i7-7700HQ, UHD) | |
| Asus G501VW-FY081T | |
| Lenovo ThinkPad E580-20KS001RGE | |
| 1280x720 Cloud Gate Standard Graphics | |
| Asus FX503VM-EH73 | |
| Dell Inspiron 15 7000 7577 4K | |
| Intel Hades Canyon NUC8i7HVK | |
| Alienware 13 R3 (i5-7300HQ, GTX 1050 Ti) | |
| Gigabyte Aero 14-K8 | |
| Asus Strix GL502VT-DS74 | |
| Dell XPS 15 9575 i5-8305G | |
| Dell XPS 15 9575 i7-8705G | |
| Dell XPS 15 9560 (i7-7700HQ, UHD) | |
| Asus G501VW-FY081T | |
| Lenovo ThinkPad E580-20KS001RGE | |
| 3DMark 11 | |
| 1280x720 Performance GPU | |
| Asus FX503VM-EH73 | |
| Intel Hades Canyon NUC8i7HVK | |
| Dell Inspiron 15 7000 7577 4K | |
| Alienware 13 R3 (i5-7300HQ, GTX 1050 Ti) | |
| Dell XPS 15 9575 i7-8705G | |
| Dell XPS 15 9575 i5-8305G | |
| Asus Strix GL502VT-DS74 | |
| Gigabyte Aero 14-K8 | |
| Asus G501VW-FY081T | |
| Lenovo ThinkPad E580-20KS001RGE | |
| 1280x720 Performance Combined | |
| Intel Hades Canyon NUC8i7HVK | |
| Dell Inspiron 15 7000 7577 4K | |
| Gigabyte Aero 14-K8 | |
| Dell XPS 15 9575 i7-8705G | |
| Asus Strix GL502VT-DS74 | |
| Dell XPS 15 9575 i5-8305G | |
| Asus FX503VM-EH73 | |
| Alienware 13 R3 (i5-7300HQ, GTX 1050 Ti) | |
| Asus G501VW-FY081T | |
| Lenovo ThinkPad E580-20KS001RGE | |
| 3DMark 11 Performance | 9890 pontos | |
| 3DMark Ice Storm Standard Score | 67107 pontos | |
| 3DMark Cloud Gate Standard Score | 20851 pontos | |
| 3DMark Fire Strike Score | 6280 pontos | |
| 3DMark Fire Strike Extreme Score | 3100 pontos | |
| 3DMark Time Spy Score | 2225 pontos | |
Ajuda | ||
| baixo | média | alto | ultra | 4K | |
|---|---|---|---|---|---|
| BioShock Infinite (2013) | 224.5 | 181.4 | 161 | 52.5 | |
| Batman: Arkham Knight (2015) | 108 | 95 | 54 | 16 | |
| Rise of the Tomb Raider (2016) | 133.1 | 81.2 | 42.4 | 32.8 | 14.3 |
| Ashes of the Singularity (2016) | 54.9 | 37 | 32.7 |
Barulho
| Ocioso |
| 28.2 / 28.2 / 28.2 dB |
| Carga |
| 29 / 47.4 dB |
 | ||
30 dB silencioso 40 dB(A) audível 50 dB(A) ruidosamente alto |
||
min: | ||
| Dell XPS 15 9575 i7-8705G Vega M GL / 870, i7-8705G, SK hynix PC401 NVMe 500 GB | Lenovo Yoga 720-15IKB-80X7 GeForce GTX 1050 Mobile, i7-7700HQ, Samsung PM961 MZVLW256HEHP | Asus ZenBook Flip 15 UX561UD GeForce GTX 1050 Mobile, i5-8550U, Micron 1100 MTFDDAV256TBN | Asus Zenbook Pro UX550VE-DB71T GeForce GTX 1050 Ti Mobile, i7-7700HQ, Samsung PM961 NVMe MZVLW512HMJP | Alienware 13 R3 (i5-7300HQ, GTX 1050 Ti) GeForce GTX 1050 Ti Mobile, i5-7300HQ, Samsung PM961 MZVLW256HEHP | |
|---|---|---|---|---|---|
| Noise | -5% | -8% | -11% | -3% | |
| desligado / ambiente * (dB) | 28.2 | 28.2 -0% | 30.4 -8% | 28.3 -0% | 29.7 -5% |
| Idle Minimum * (dB) | 28.2 | 28.2 -0% | 31.3 -11% | 30.4 -8% | 29.7 -5% |
| Idle Average * (dB) | 28.2 | 28.2 -0% | 31.3 -11% | 31 -10% | 29.7 -5% |
| Idle Maximum * (dB) | 28.2 | 28.2 -0% | 31.3 -11% | 31.2 -11% | 29.7 -5% |
| Load Average * (dB) | 29 | 39 -34% | 36.4 -26% | 43.3 -49% | 32.7 -13% |
| Witcher 3 ultra * (dB) | 44.7 | 46.2 -3% | 36.4 19% | ||
| Load Maximum * (dB) | 47.4 | 46.3 2% | 37.1 22% | 46.2 3% | 50 -5% |
* ... menor é melhor
(±) A temperatura máxima no lado superior é 45 °C / 113 F, em comparação com a média de 36.8 °C / 98 F , variando de 21 a 71 °C para a classe Multimedia.
(+) A parte inferior aquece até um máximo de 36.6 °C / 98 F, em comparação com a média de 39.1 °C / 102 F
(+) Em uso inativo, a temperatura média para o lado superior é 24.8 °C / 77 F, em comparação com a média do dispositivo de 31.3 °C / ### class_avg_f### F.
(±) Jogando The Witcher 3, a temperatura média para o lado superior é 33.5 °C / 92 F, em comparação com a média do dispositivo de 31.3 °C / ## #class_avg_f### F.
(+) Os apoios para as mãos e o touchpad são mais frios que a temperatura da pele, com um máximo de 28 °C / 82.4 F e, portanto, são frios ao toque.
(±) A temperatura média da área do apoio para as mãos de dispositivos semelhantes foi 28.7 °C / 83.7 F (+0.7 °C / 1.3 F).
| desligado | |
| Ocioso | |
| Carga |
|
Key:
min: | |
| Dell XPS 15 9575 i7-8705G i7-8705G, Vega M GL / 870, SK hynix PC401 NVMe 500 GB, IPS, 3840x2160, 15.6" | Dell XPS 15 9560 (i7-7700HQ, UHD) i7-7700HQ, GeForce GTX 1050 Mobile, Lite-On CX2-8B512-Q11, IGZO IPS, 3840x2160, 15.6" | Lenovo Yoga 720-15IKB-80X7 i7-7700HQ, GeForce GTX 1050 Mobile, Samsung PM961 MZVLW256HEHP, IPS, 1920x1080, 15.6" | Asus ZenBook Flip 15 UX561UD i5-8550U, GeForce GTX 1050 Mobile, Micron 1100 MTFDDAV256TBN, IPS, 3840x2160, 15.6" | Asus Zenbook Pro UX550VE-DB71T i7-7700HQ, GeForce GTX 1050 Ti Mobile, Samsung PM961 NVMe MZVLW512HMJP, IPS, 1920x1080, 15.6" | |
|---|---|---|---|---|---|
| Power Consumption | -37% | -2% | -3% | 8% | |
| Idle Minimum * (Watt) | 6.2 | 11.9 -92% | 8.3 -34% | 5.4 13% | 6.3 -2% |
| Idle Average * (Watt) | 12.9 | 17.1 -33% | 10.2 21% | 10.8 16% | 7.9 39% |
| Idle Maximum * (Watt) | 13.6 | 17.3 -27% | 10.4 24% | 13.9 -2% | 8.1 40% |
| Load Average * (Watt) | 76.1 | 94.7 -24% | 67.5 11% | 94 -24% | 84.9 -12% |
| Witcher 3 ultra * (Watt) | 84.3 | 104.8 -24% | 96.5 -14% | 96.3 -14% | |
| Load Maximum * (Watt) | 99.4 | 122 -23% | 117.2 -18% | 116.6 -17% | 102.4 -3% |
* ... menor é melhor
| Dell XPS 15 9575 i7-8705G i7-8705G, Vega M GL / 870, 75 Wh | Dell XPS 15 9575 i5-8305G i5-8305G, Vega M GL / 870, 75 Wh | Lenovo Yoga 720-15IKB-80X7 i7-7700HQ, GeForce GTX 1050 Mobile, 72 Wh | Asus ZenBook Flip 15 UX561UD i5-8550U, GeForce GTX 1050 Mobile, 52 Wh | Asus Zenbook Pro UX550VE-DB71T i7-7700HQ, GeForce GTX 1050 Ti Mobile, 73 Wh | Asus Strix GL502VT-DS74 6700HQ, GeForce GTX 970M, 64 Wh | |
|---|---|---|---|---|---|---|
| Duração da bateria | 17% | 40% | -5% | 30% | -16% | |
| Reader / Idle (h) | 11.2 | 11.1 -1% | 17.8 59% | 9.3 -17% | 17.1 53% | 9.7 -13% |
| WiFi v1.3 (h) | 7 | 9.4 34% | 8.1 16% | 5.2 -26% | 8.9 27% | 5.9 -16% |
| Load (h) | 1.1 | 1.3 18% | 1.6 45% | 1.4 27% | 1.2 9% | 0.9 -18% |
Pro
Contra
Os SKUs atuais do XPS 15 9560 incluem o Core i5-7300HQ e o Core i7-7700HQ similar a como a atual seleção dos SKUs XPS 15 9575 incluem o Core i5-8305G e Core i7-8705G. Considerando que o salto de um i5-7300HQ para i7-7700HQ pode trazer um aumento de 40 por cento no desempenho, o salto de um i5-8305G para i7-8705G é apenas de 5 a 10 por cento. Quando você considera a enorme diferença de custo entre os SKUs i5 e i7 do XPS 15 9575 ($1300 USD vs. $2200 USD), fica claro que os usuários não devem comprar a configuração do Core i7 se o desempenho por dólar for prioridade.
Em vez disso, a Dell está justificando o grande preço delta com a maior RAM e o painel de resolução mais alta que só vem com o Core i7 SKU. Multi-taskers pesados, usuários de stylus de tela táctil e editores de vídeo encontrarão mais valor na opção de 16 GB de RAM e 4K UHD do que a maioria dos usuários domésticos. No entanto, é um pouco decepcionante que os atuais SKUs do Core i5 estejam limitados a apenas 8 GB de RAM.
Além das diferenças acima, nossos comentários existentes sobre o Core i5 XPS 15 9575 ainda se aplicam aqui. O Kaby Lake-G está provando ser uma excelente alternativa para o onipresente Core i7-7700HQ e GTX 1050 ou 1050 Ti comumente encontrados em portáteis concorrentes. O conversível da Dell é ainda mais eficiente em termos de energia e mais frio do que os sistemas mencionados e mais silencioso que o XPS 15 9560. Desde que os usuários estejam cientes de sua lista de inconvenientes (veja à direita), os conversíveis de 15 polegadas concorrentes não chegam perto do que o XPS 15 9575 pode oferecer, com a notável exceção do próximo HP Spectre x360 15 2018.
Você não precisa gastar $2200 USD na opção Core i7-8705G quando o Core i5-8705G estiver apenas um pouco mais lento por quase $1000 USD a menos. Mesmo a configuração mais barata do XPS 15 9575 é quase tão rápida quanto o XPS 15 9575 ou XPS 9560 mais caros. Esperamos ver mais RAM e opções de telas para os futuros SKUs Core i5 para tornar a série ainda mais atraente.
Dell XPS 15 9575 i7-8705G
- 05/08/2018 v6 (old)
Allen Ngo
Price comparison
