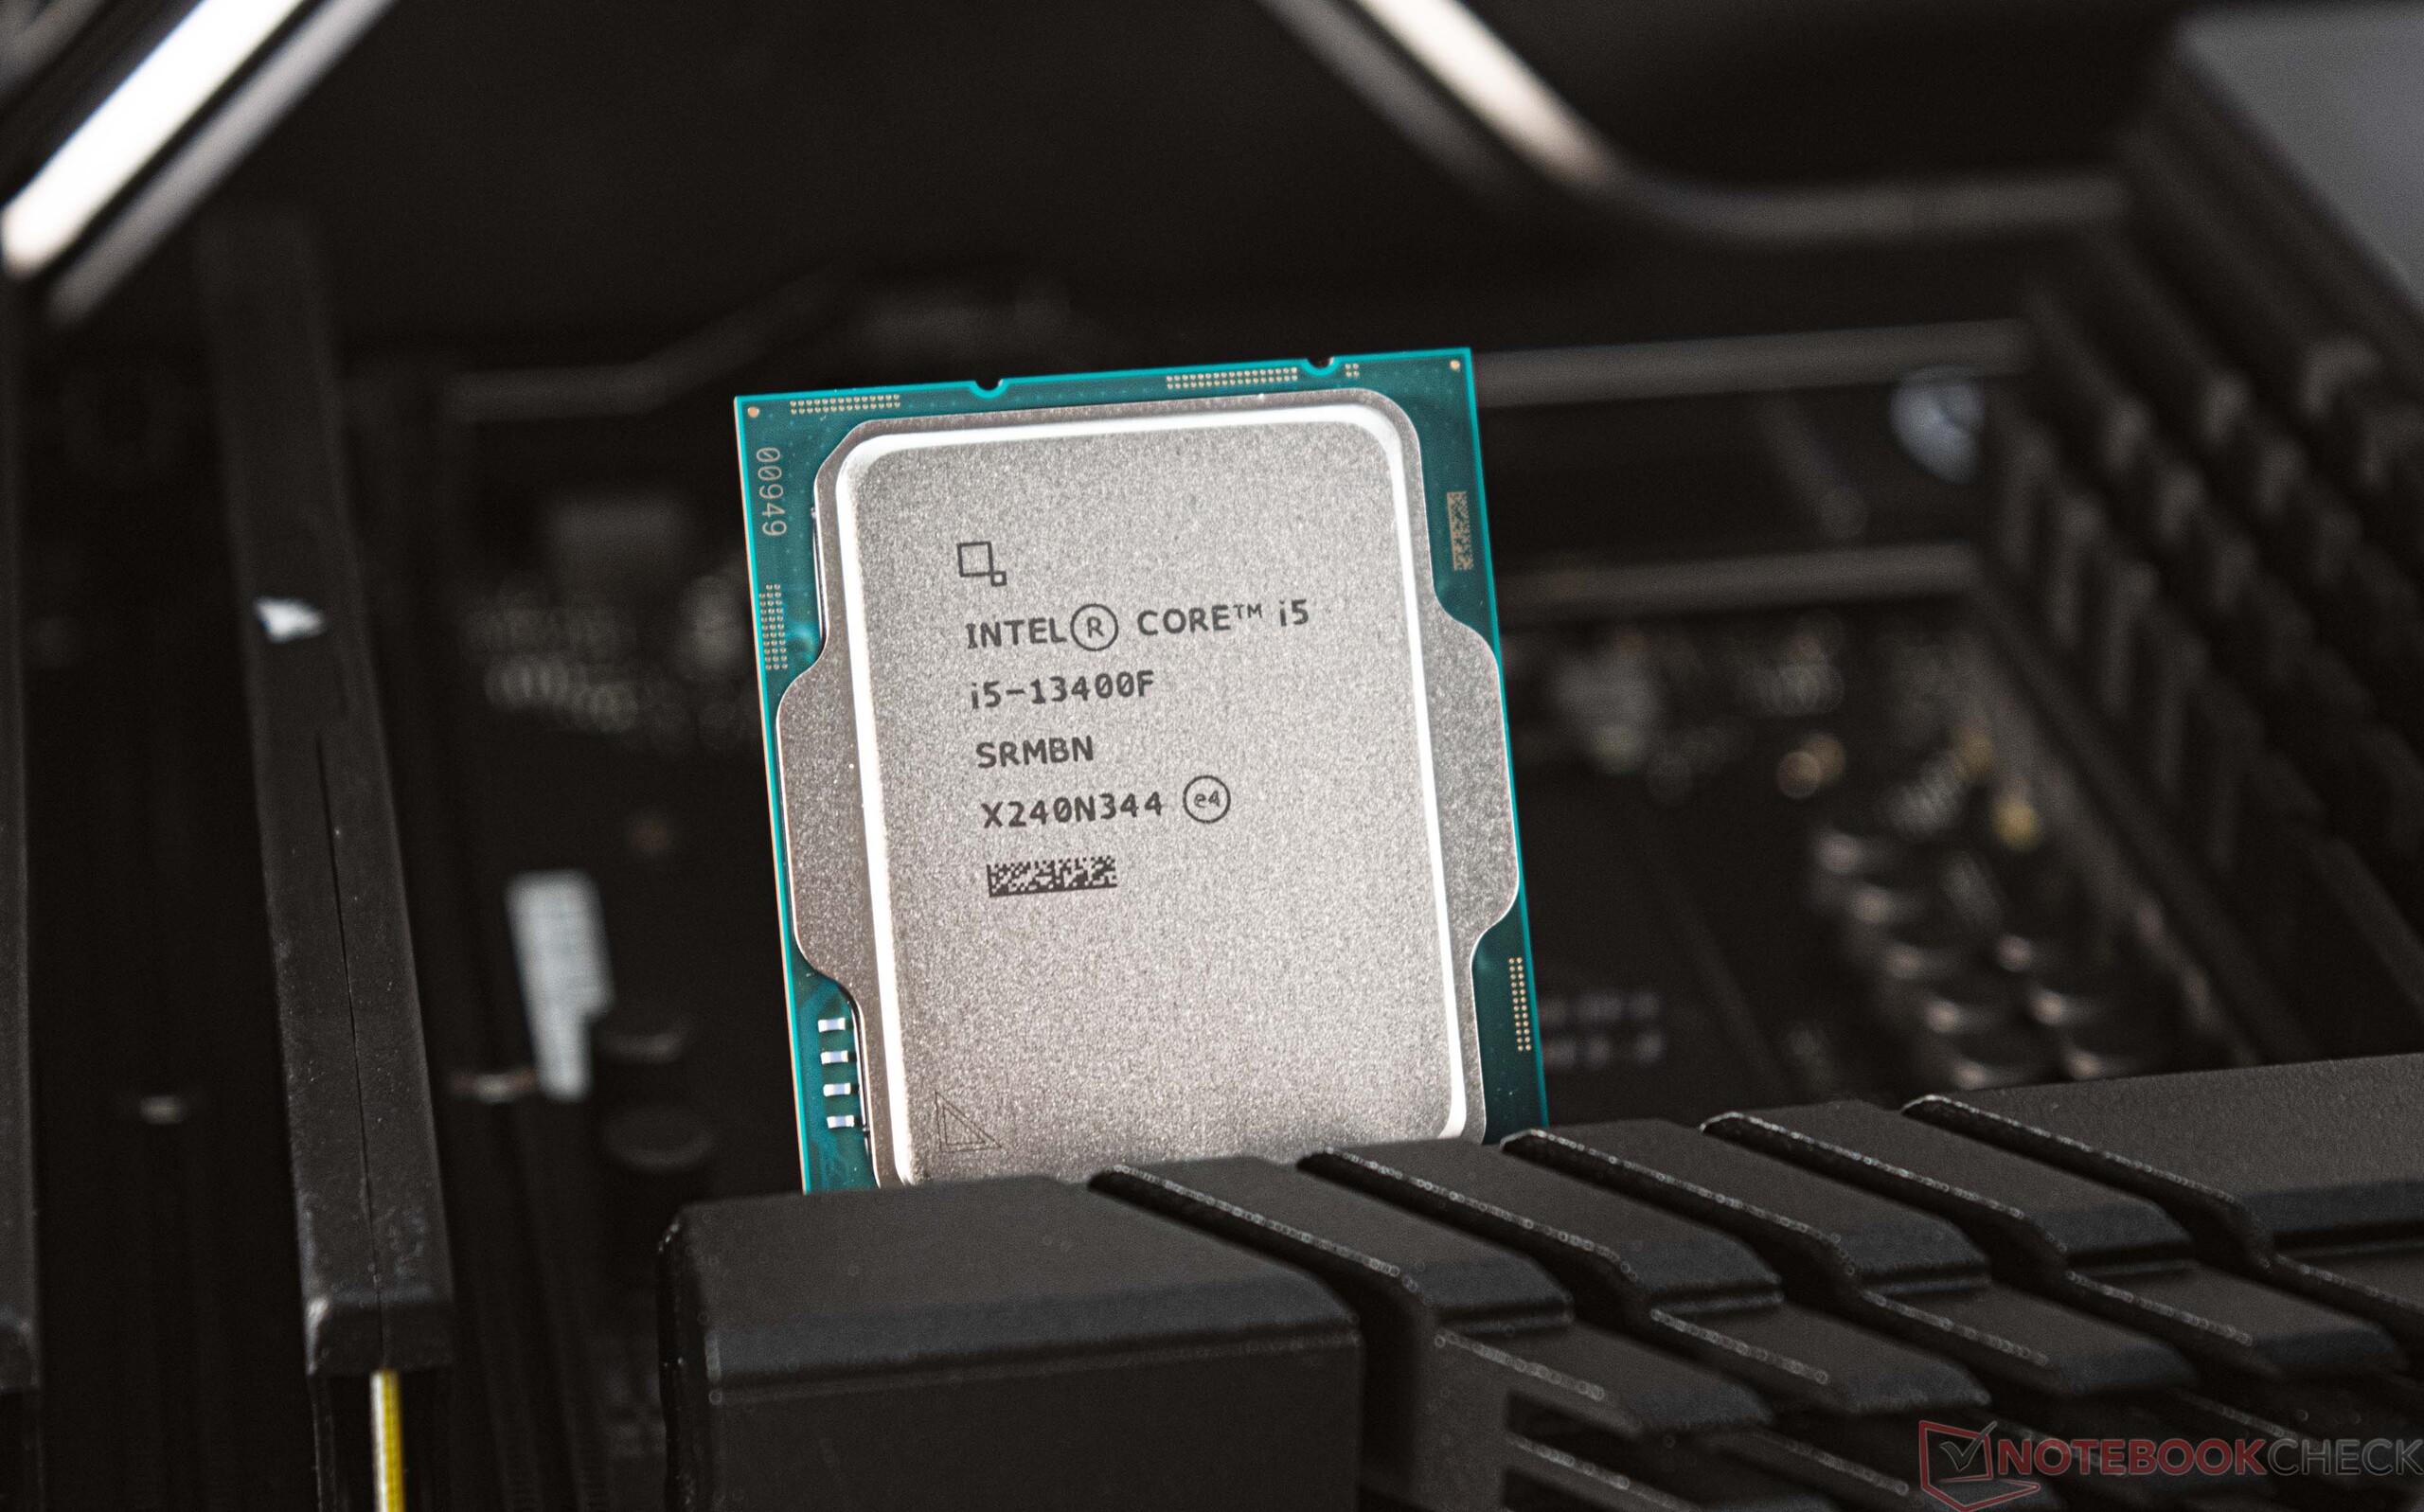
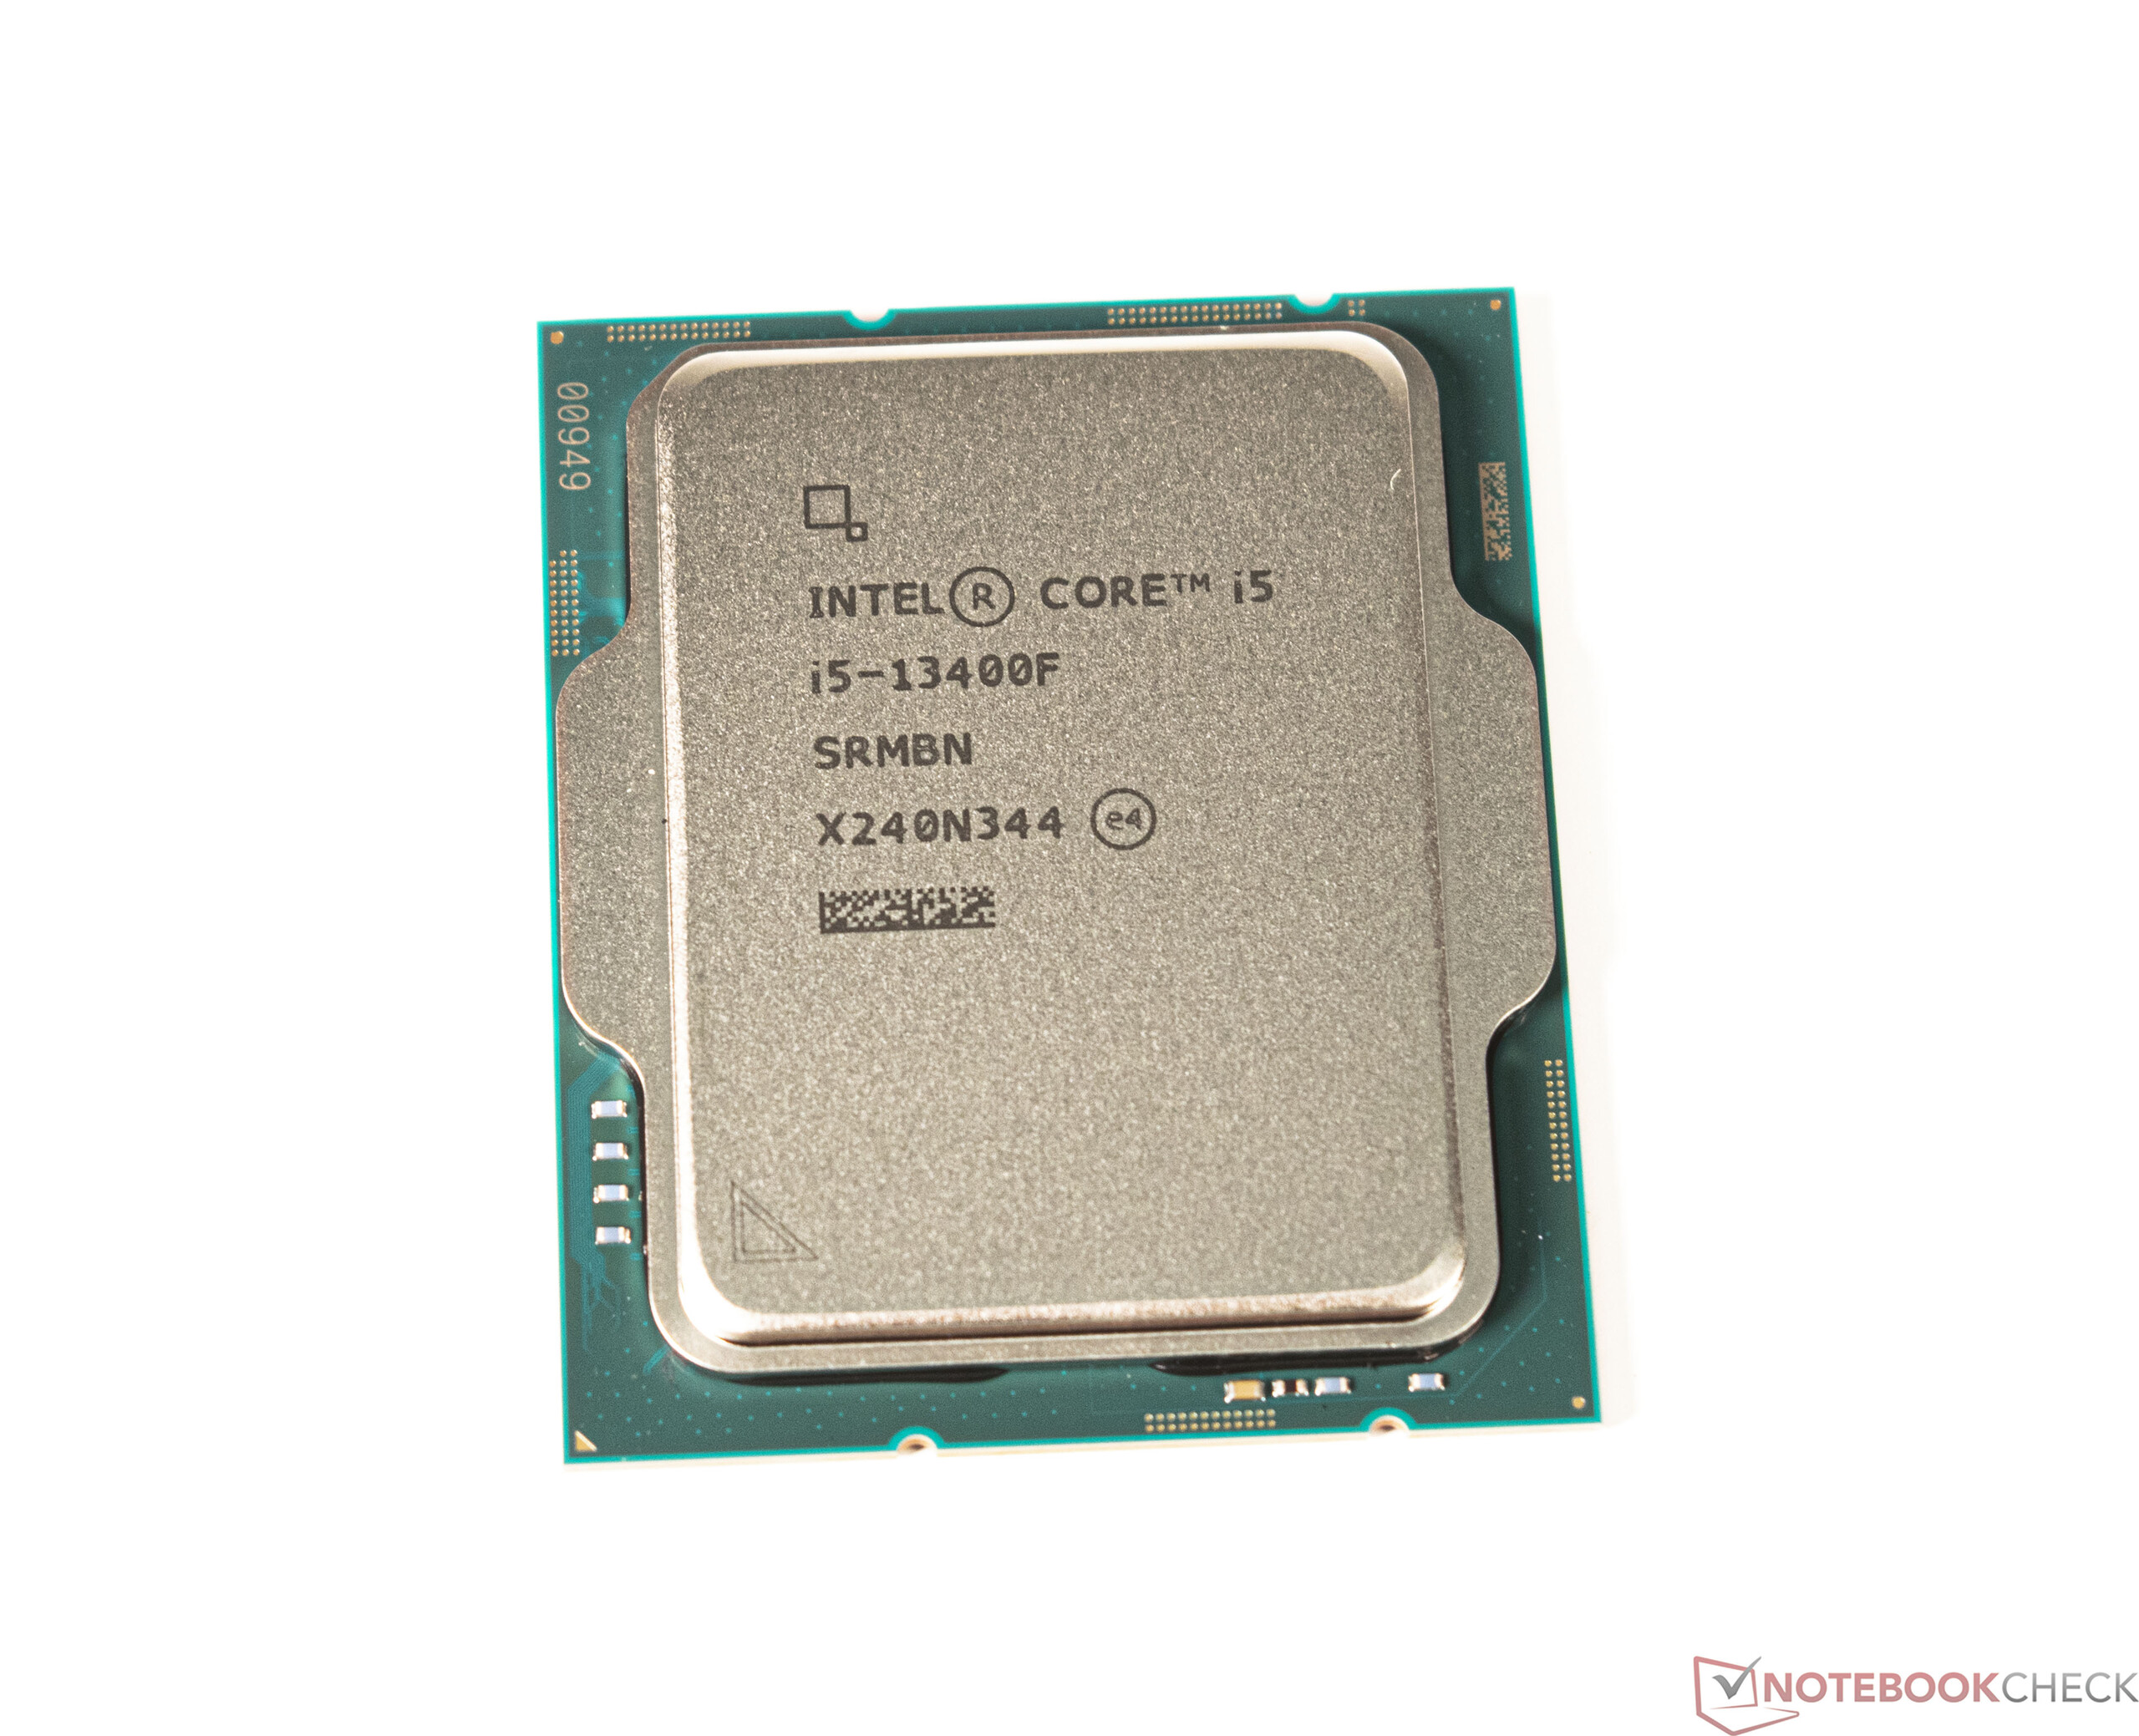
CPU desktop Intel Core i5-13400F em revisão: Processador econômico e barato de 10 núcleos para jogos e trabalho

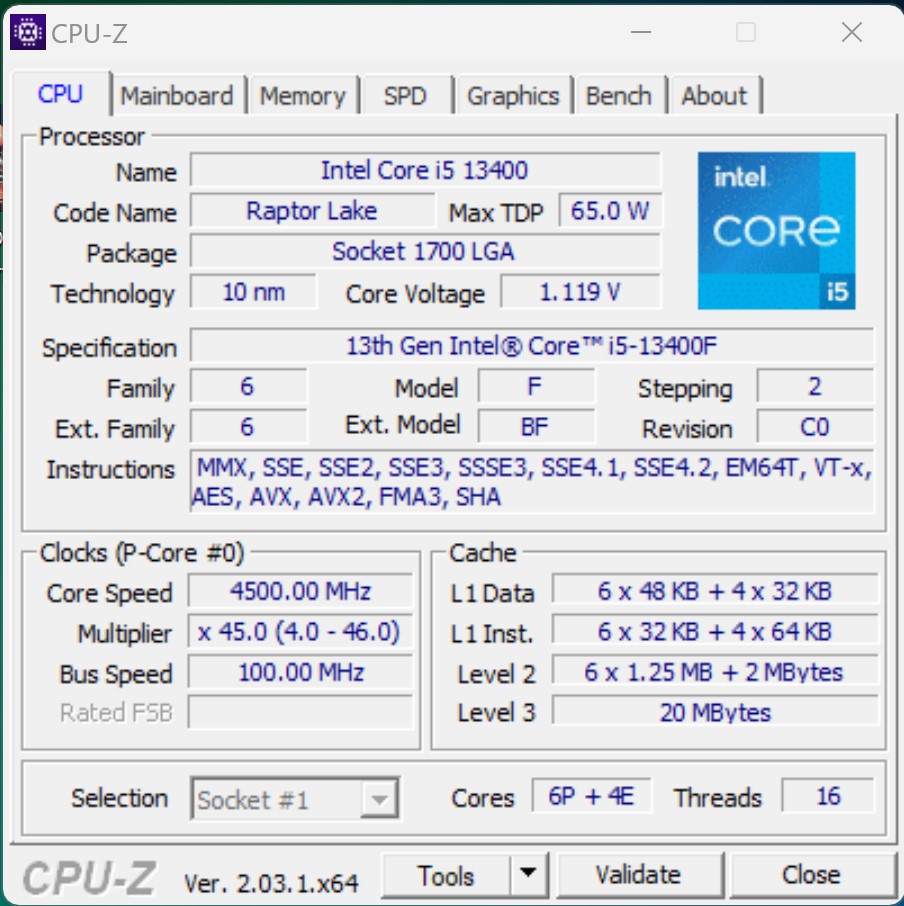
A Intel lançou a arquitetura híbrida de CPU com a série Alder Lake, que combina os chamados núcleos P e E sob um espalhador de calor. Os núcleos E foram omitidos das CPUs de nível básico até o momento, o que afetou principalmente o desempenho multi-tarefa. Com a 13ª geração Core, a Intel finalmente deu ao Core i5-13400F 4 mais E-cores, além dos 6 P-cores. Assim, ele agora está no mesmo nível de um Intel Core i5-12600K da série Alder Lake. No entanto, estes dois modelos diferem fortemente em seu consumo de energia. Entretanto, apenas alguns pontos percentuais separam os dois modelos em termos de desempenho, o que podemos revelar neste momento.
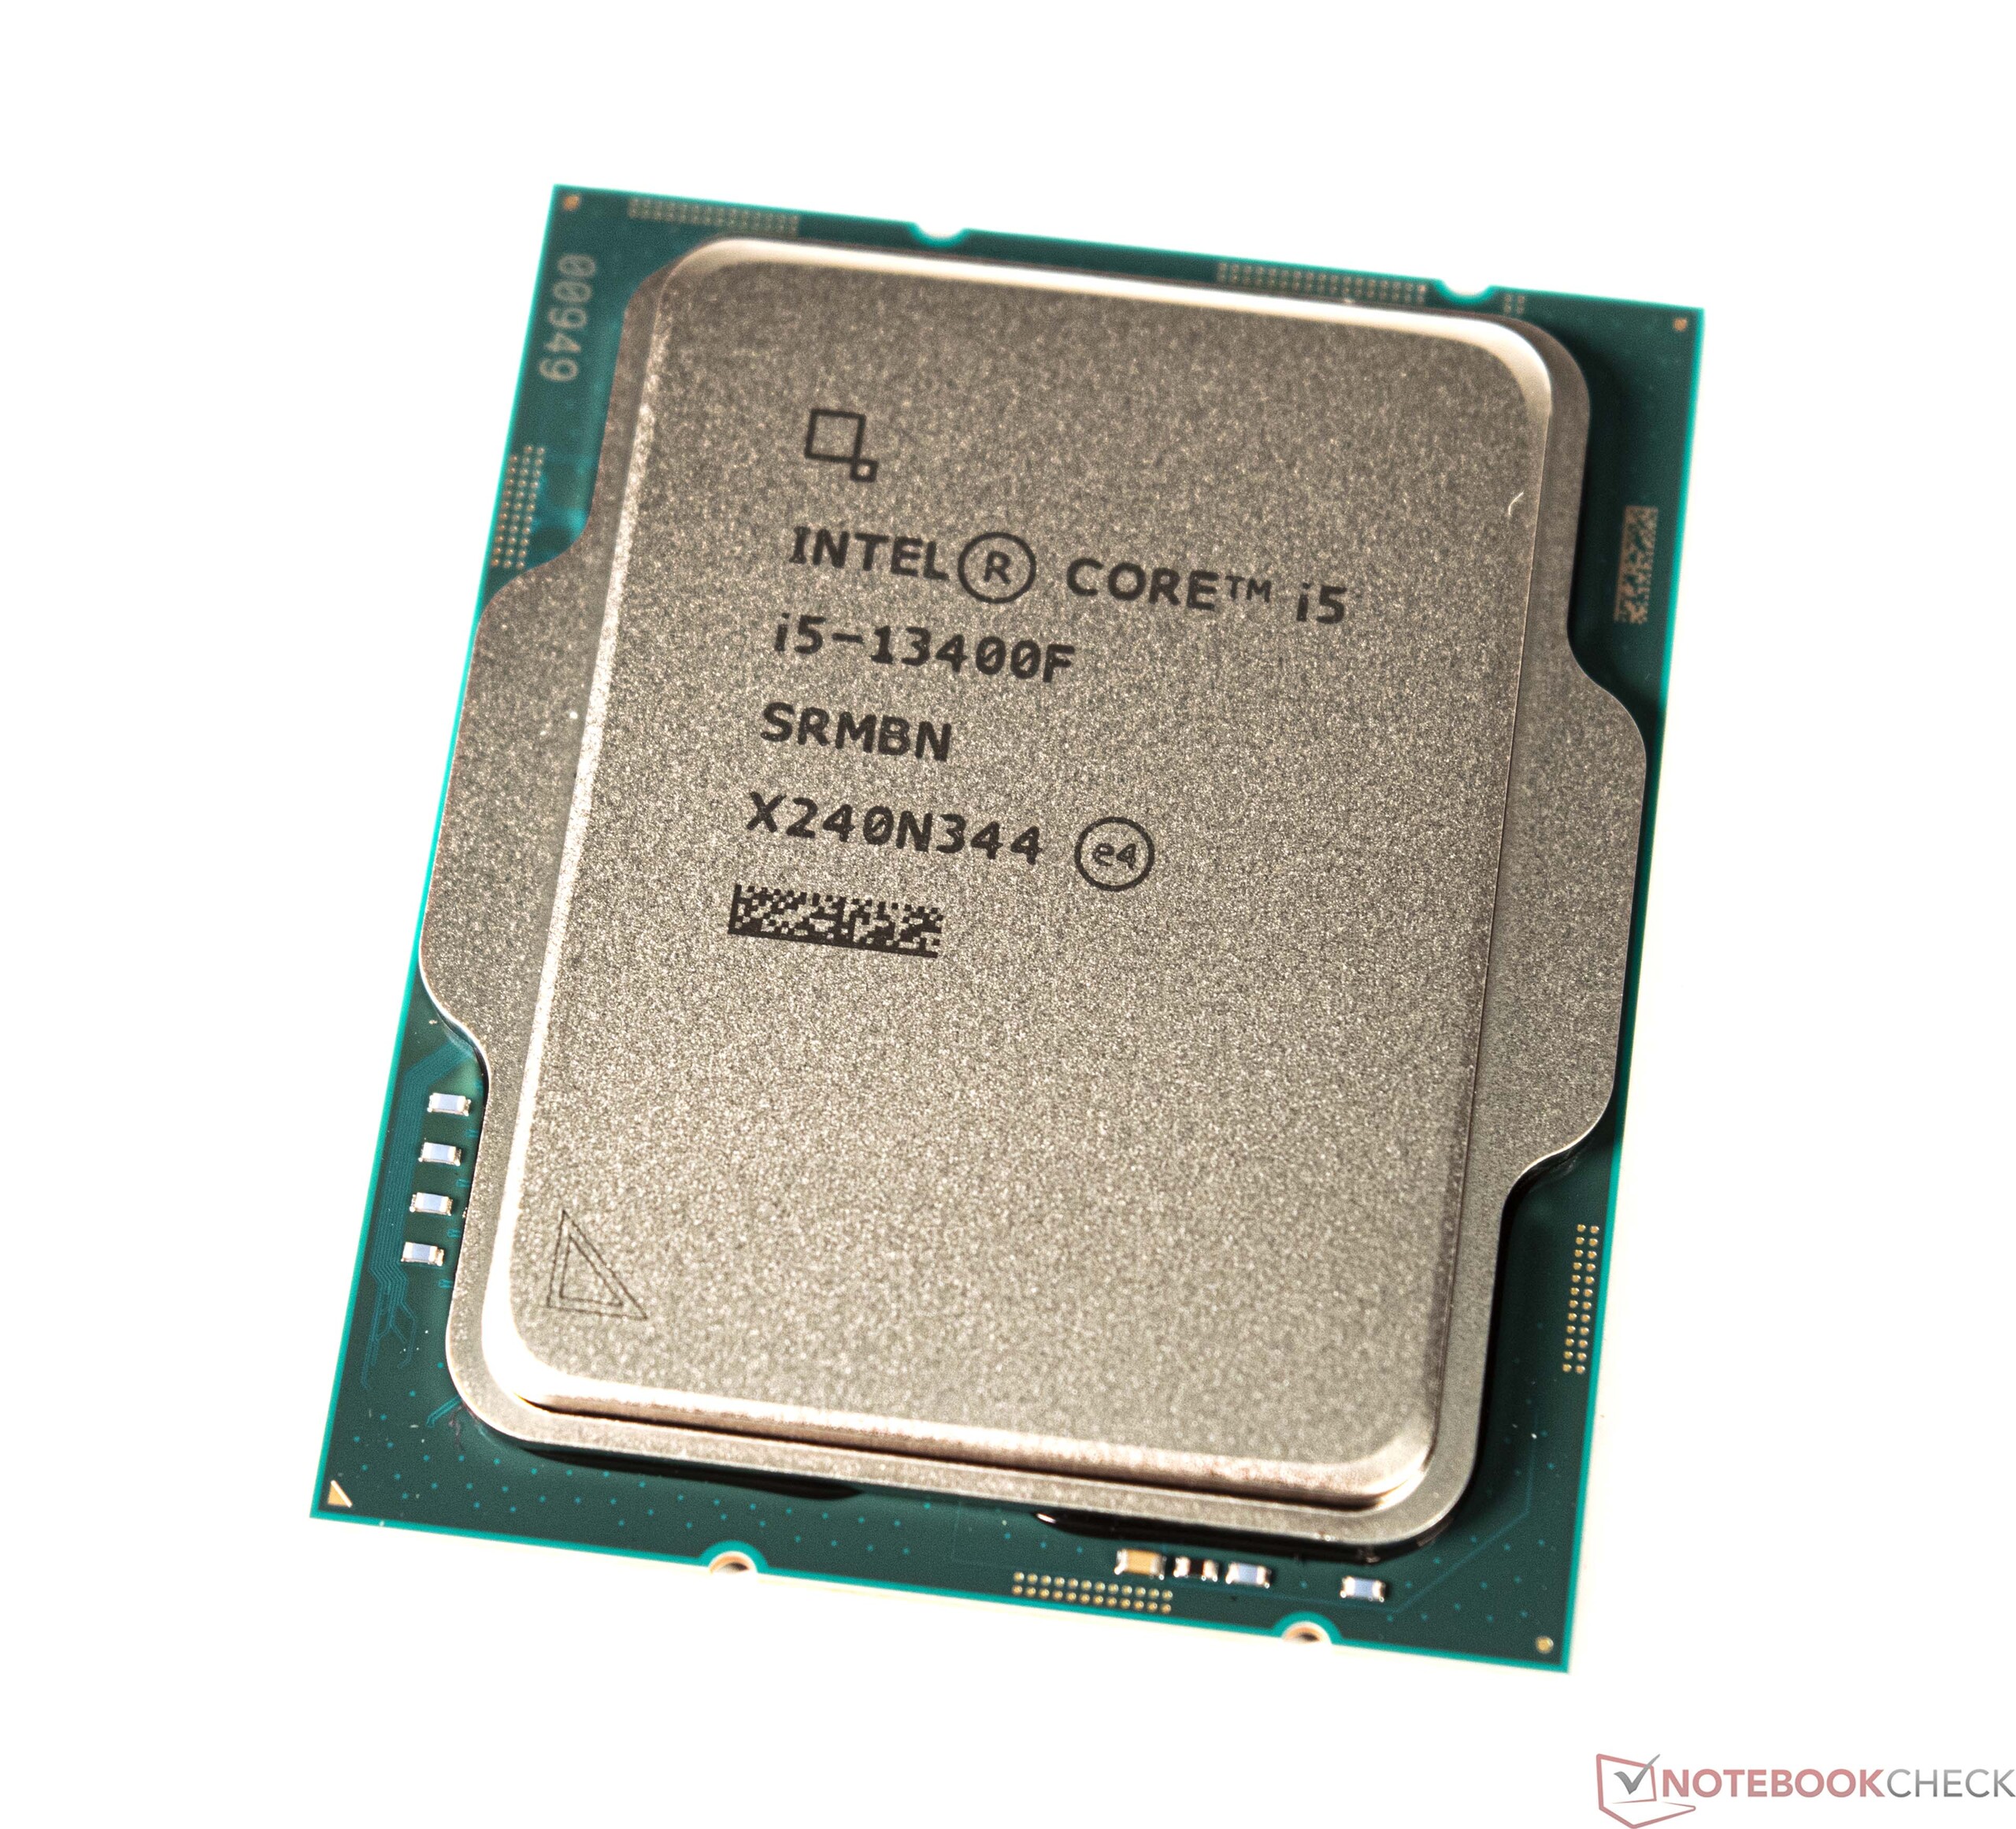
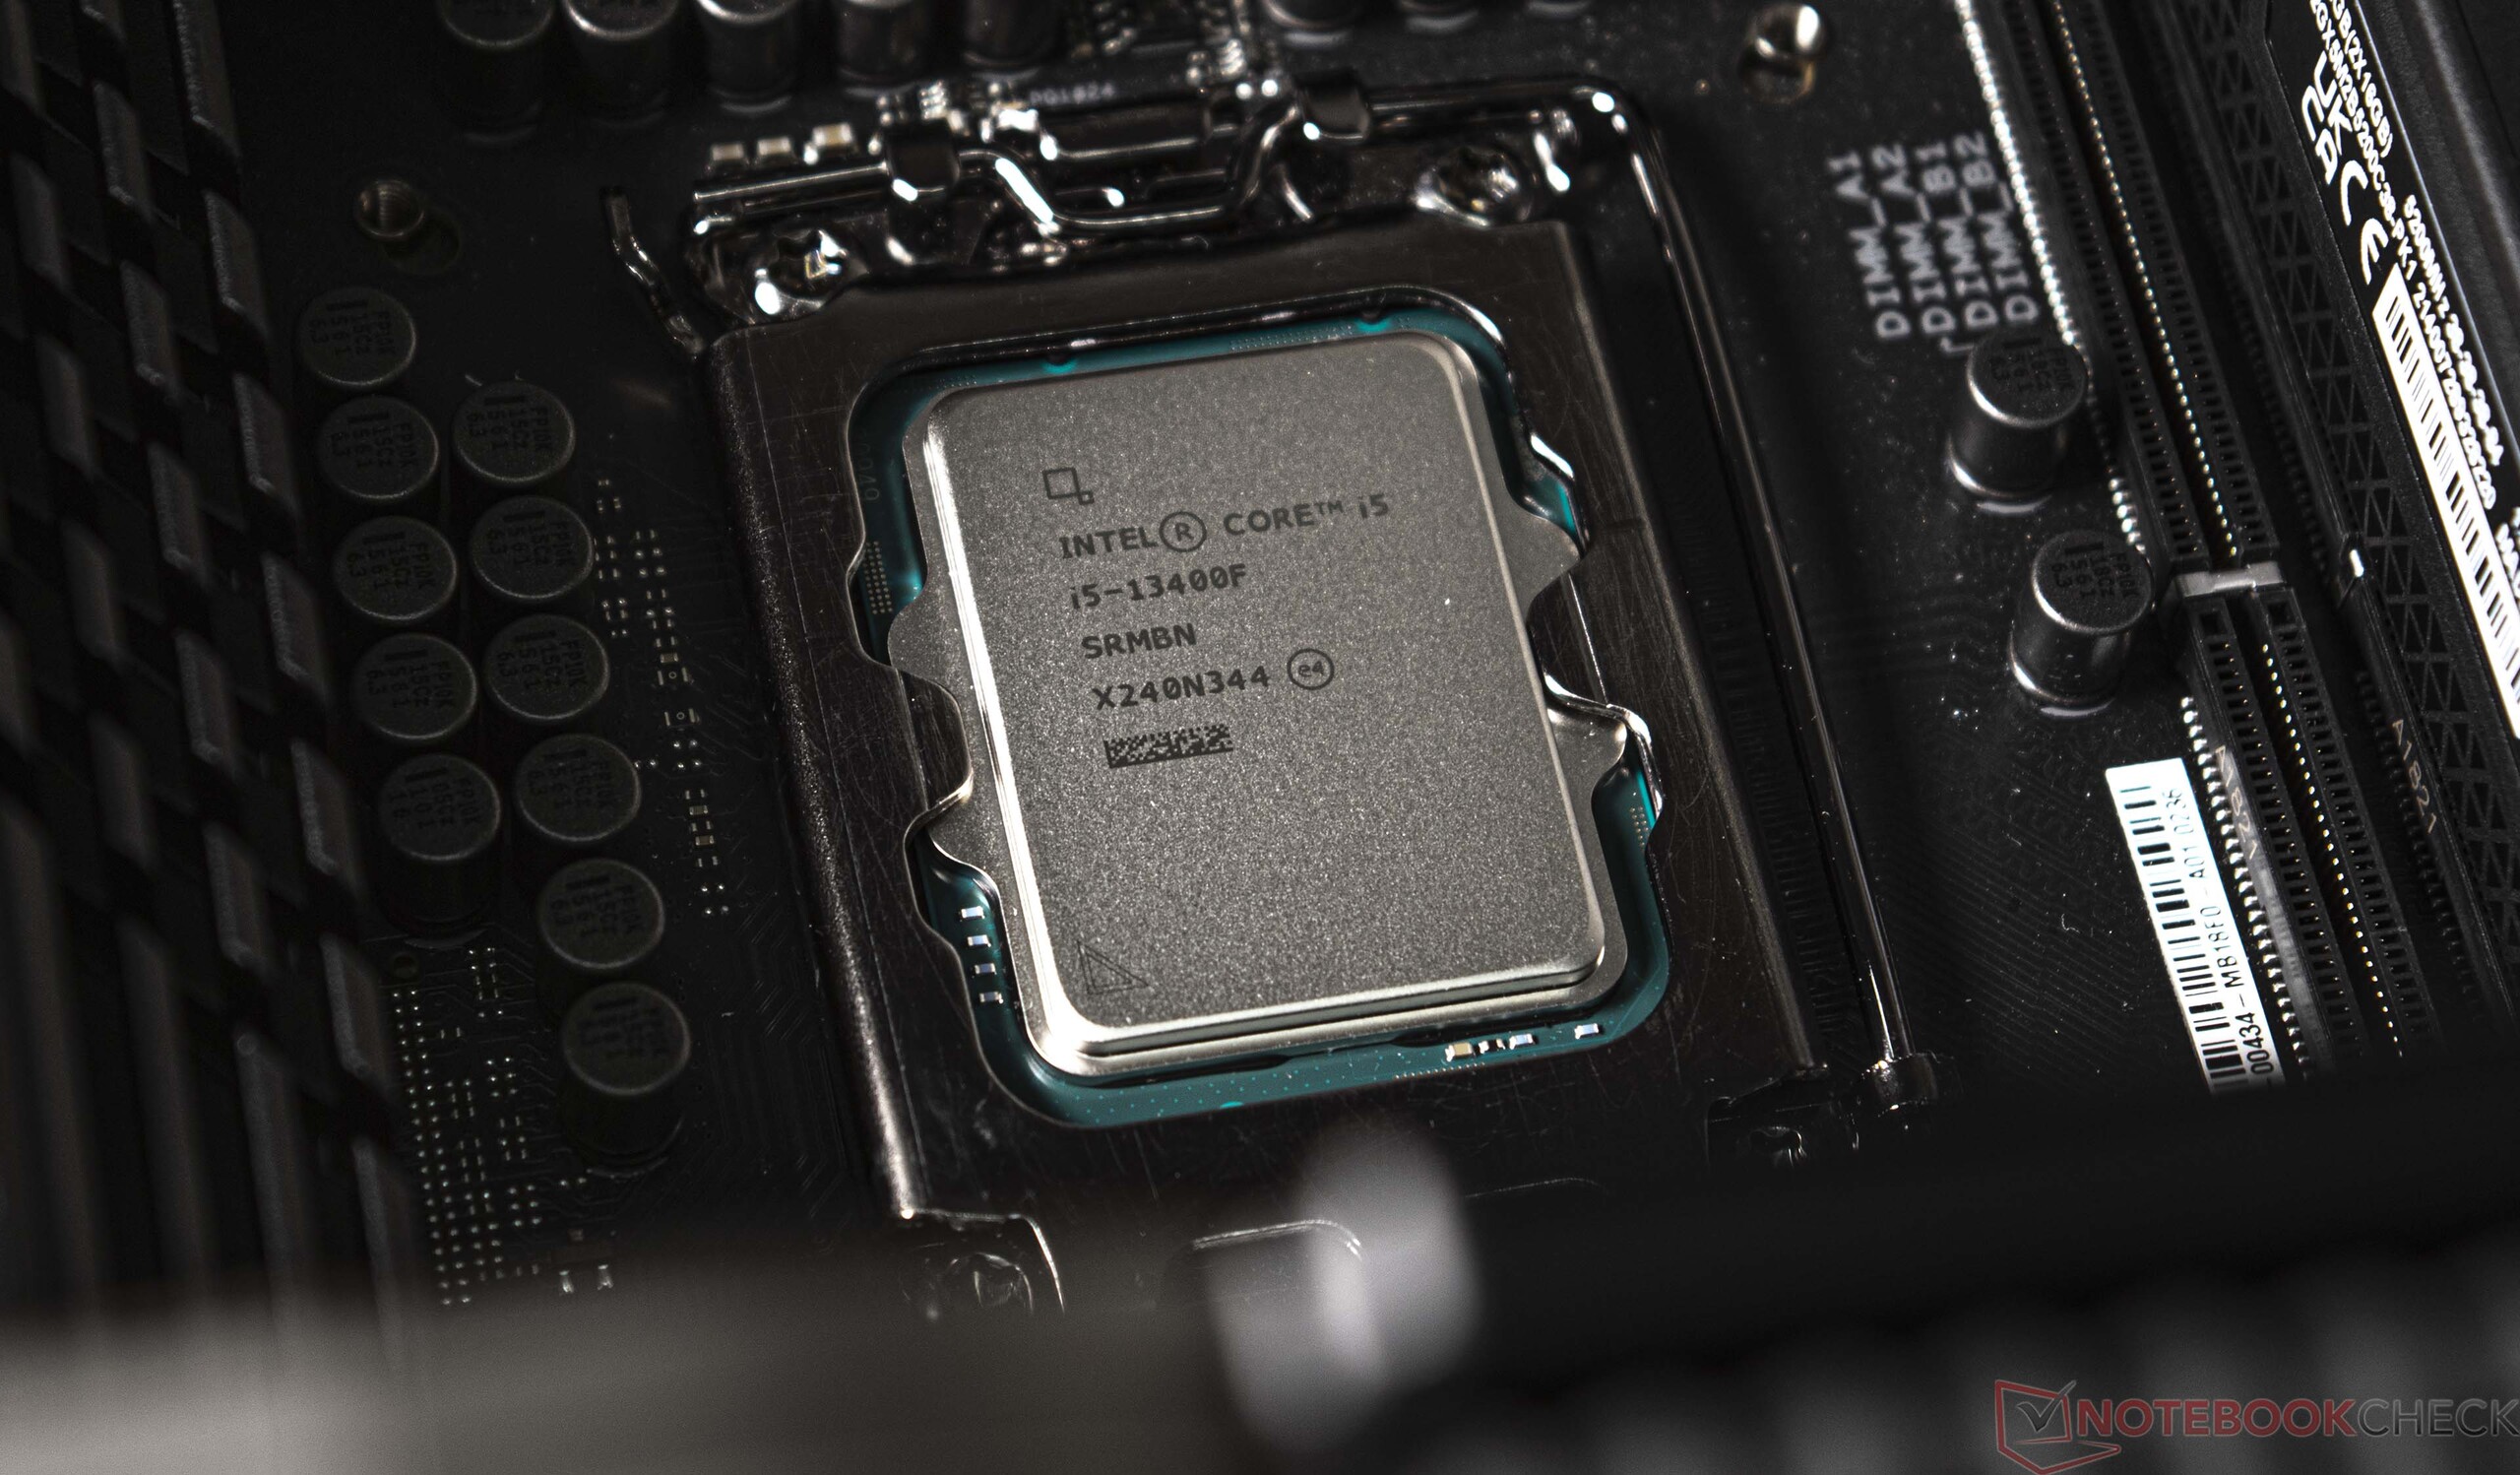
Intel Alder-Lake e Intel Raptor-Lake compartilham o soquete 1700 como uma subestrutura. Assim, todos os novos processadores também podem ser executados nos 600 conjuntos de chips mais antigos. No entanto, uma atualização da BIOS deve ser realizada com antecedência para que os últimos processadores sejam reconhecidos e devidamente suportados. Por falar em Alder-Lake e Raptor-Lake: O Intel Core i5-13400F pode ser opcionalmente disponível em passos B0 ou C0. O B0-stepping refere-se a um Raptor-Lake DIE, enquanto que um Alder-Lake DIE está sob o espalhador de calor no C0-stepping.
Na tabela a seguir, compilamos os representantes mais importantes da nova família Raptor Lake S para você. Mais detalhes sobre o O Intel Core i5-13400F pode ser encontrado aqui.
Os processadores Core da Intel em comparação
| Modelo | Cores / Roscas |
Relógio P-Core / Turbo | Relógio E-Core / Turbo | Cache L2 + L3 | Gráficos | PBP | MTB | Preço (MSRP) |
| Core i9-13900K | 24 (8P + 16E) /32 | 3,0 GHz / 5,8 GHz | 2,2 GHz / 4,3 GHz | 32 + 36 MB | UHD 770 | 125 Watt | 253 Watt | $ 589 |
| Core i9-13900KF | 16 (8P + 16E) /32 | 3,0 GHz / 5,8 GHz | 2,2 GHz / 4,3 GHz | 32 + 36 MB | - | 125 Watt | 253 Watt | $ 564 |
| Core i9-12900K | 16 (8P + 8E) /24 | 3,2 GHz / 5,1 GHz | 2,4 GHz / 3,9 GHz | 14 + 30 MB | UHD 770 | 125 Watt | 241 Watt | $ 589 |
| Core i9-12900KF | 16 (8P + 8E) /24 | 3,2 GHz / 5,1 GHz | 2,4 GHz / 3,9 GHz | 14 + 30 MB | - | 125 Watt | 241 Watt | $ 564 |
| Core i7-13700K | 16 (8P + 8E) /24 | 3,4 GHz / 5,4 GHz | 2,5 GHz / 4,2 GHz | 24 + 30 MB | UHD 770 | 125 Watt | 253 Watt | $ 409 |
| Core i7-13700KF | 16 (8P + 8E) /24 | 3,4 GHz / 5,4 GHz | 2,5 GHz / 4,2 GHz | 24 + 30 MB | - | 125 Watt | 253 Watt | $ 384 |
| Core i7-12700K | 12 (8P + 4E) /20 | 3,6 GHz / 4,9 GHz | 2,7 GHz / 3,8 GHz | 12 + 25 MB | UHD 770 | 125 Watt | 190 Watt | $ 409 |
| Core i7-12700KF | 12 (8P + 4E) /20 | 3,6 GHz / 4,9 GHz | 2,7 GHz / 3,8 GHz | 12 + 25 MB | - | 125 Watt | 190 Watt | $ 384 |
| Core i5-13600K | 14 (6P + 8E) /20 | 3,5 GHz / 5,1 GHz | 2,6 GHz / 3,9 GHz | 20 + 24 MB | UHD 770 | 125 Watt | 181 Watt | $ 319 |
| Core i5-13600KF | 14 (6P + 8E) /20 | 3,5 GHz / 5,1 GHz | 2,6 GHz / 3,9 GHz | 20 + 24 MB | - | 125 Wat | 181 Watt | $ 294 |
| Core i5-12600K | 10 (6P + 4E) /16 | 3,7 GHz / 4,9 GHz | 2,8 GHz / 3,6 GHz | 9,5 + 20 MB | UHD 770 | 125 Watts | 150 Watts | $ 289 |
| Core i5-12600KF | 10 (6P + 4E) /16 | 3,7 GHz / 4,9 GHz | 2,8 GHz / 3,6 GHz | 9,5 + 20 MB | - | 125 Watt | 150 Watt | $ 264 |
| Core i5-13400F | 10 (6P + 4E) /16 | 2,5 GHz / 4,6 GHz | 1,8 GHz / 3,3 GHz | 9,5 + 20 MB | - | 65 Watt | 148Watt | $ 196 |
| Core i5-12400F | 6 (6P + 0E) /12 | 2,5 GHz / 4,4 GHz | - | 7,5 + 18 MB | - | 65 Watt | 117 Watt | $ 194 |
Detalhes sobre nosso sistema de teste
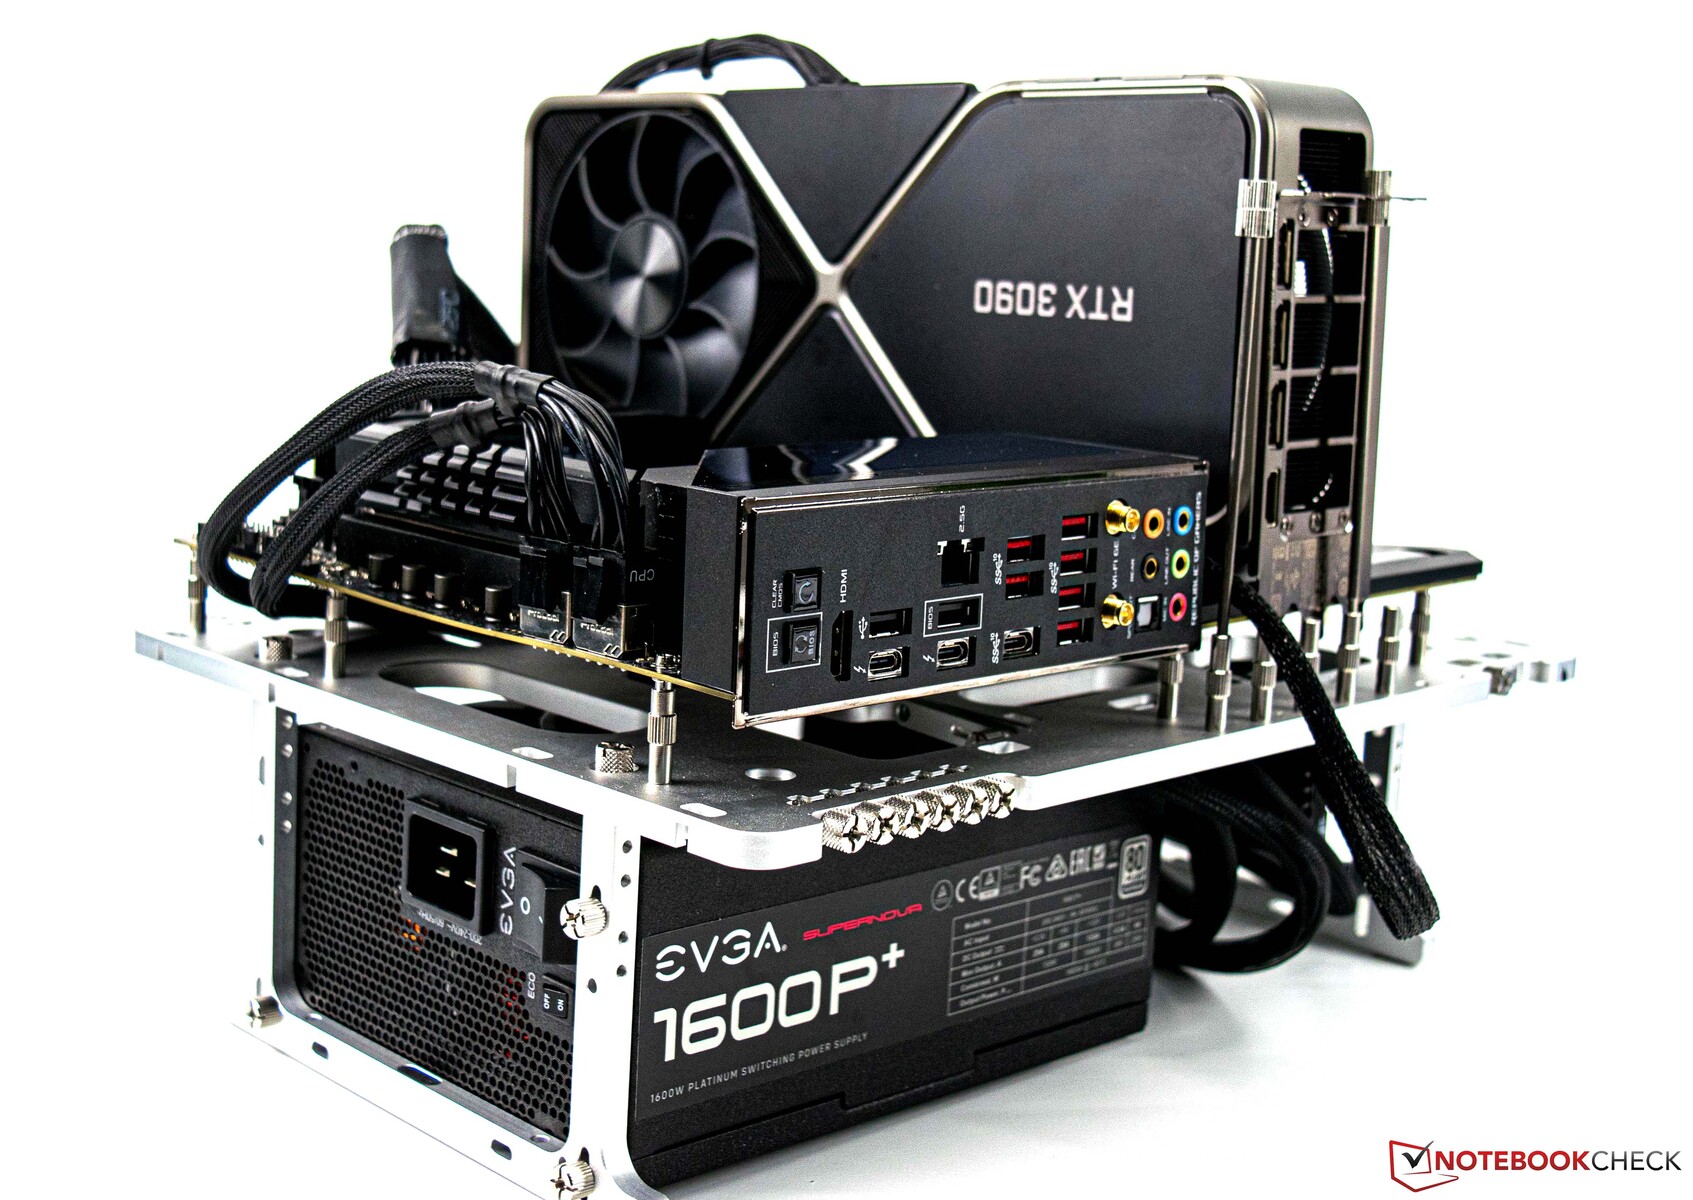
- Streacom BC1 V2 Bancada aberta
- Intel Core i5-13400F
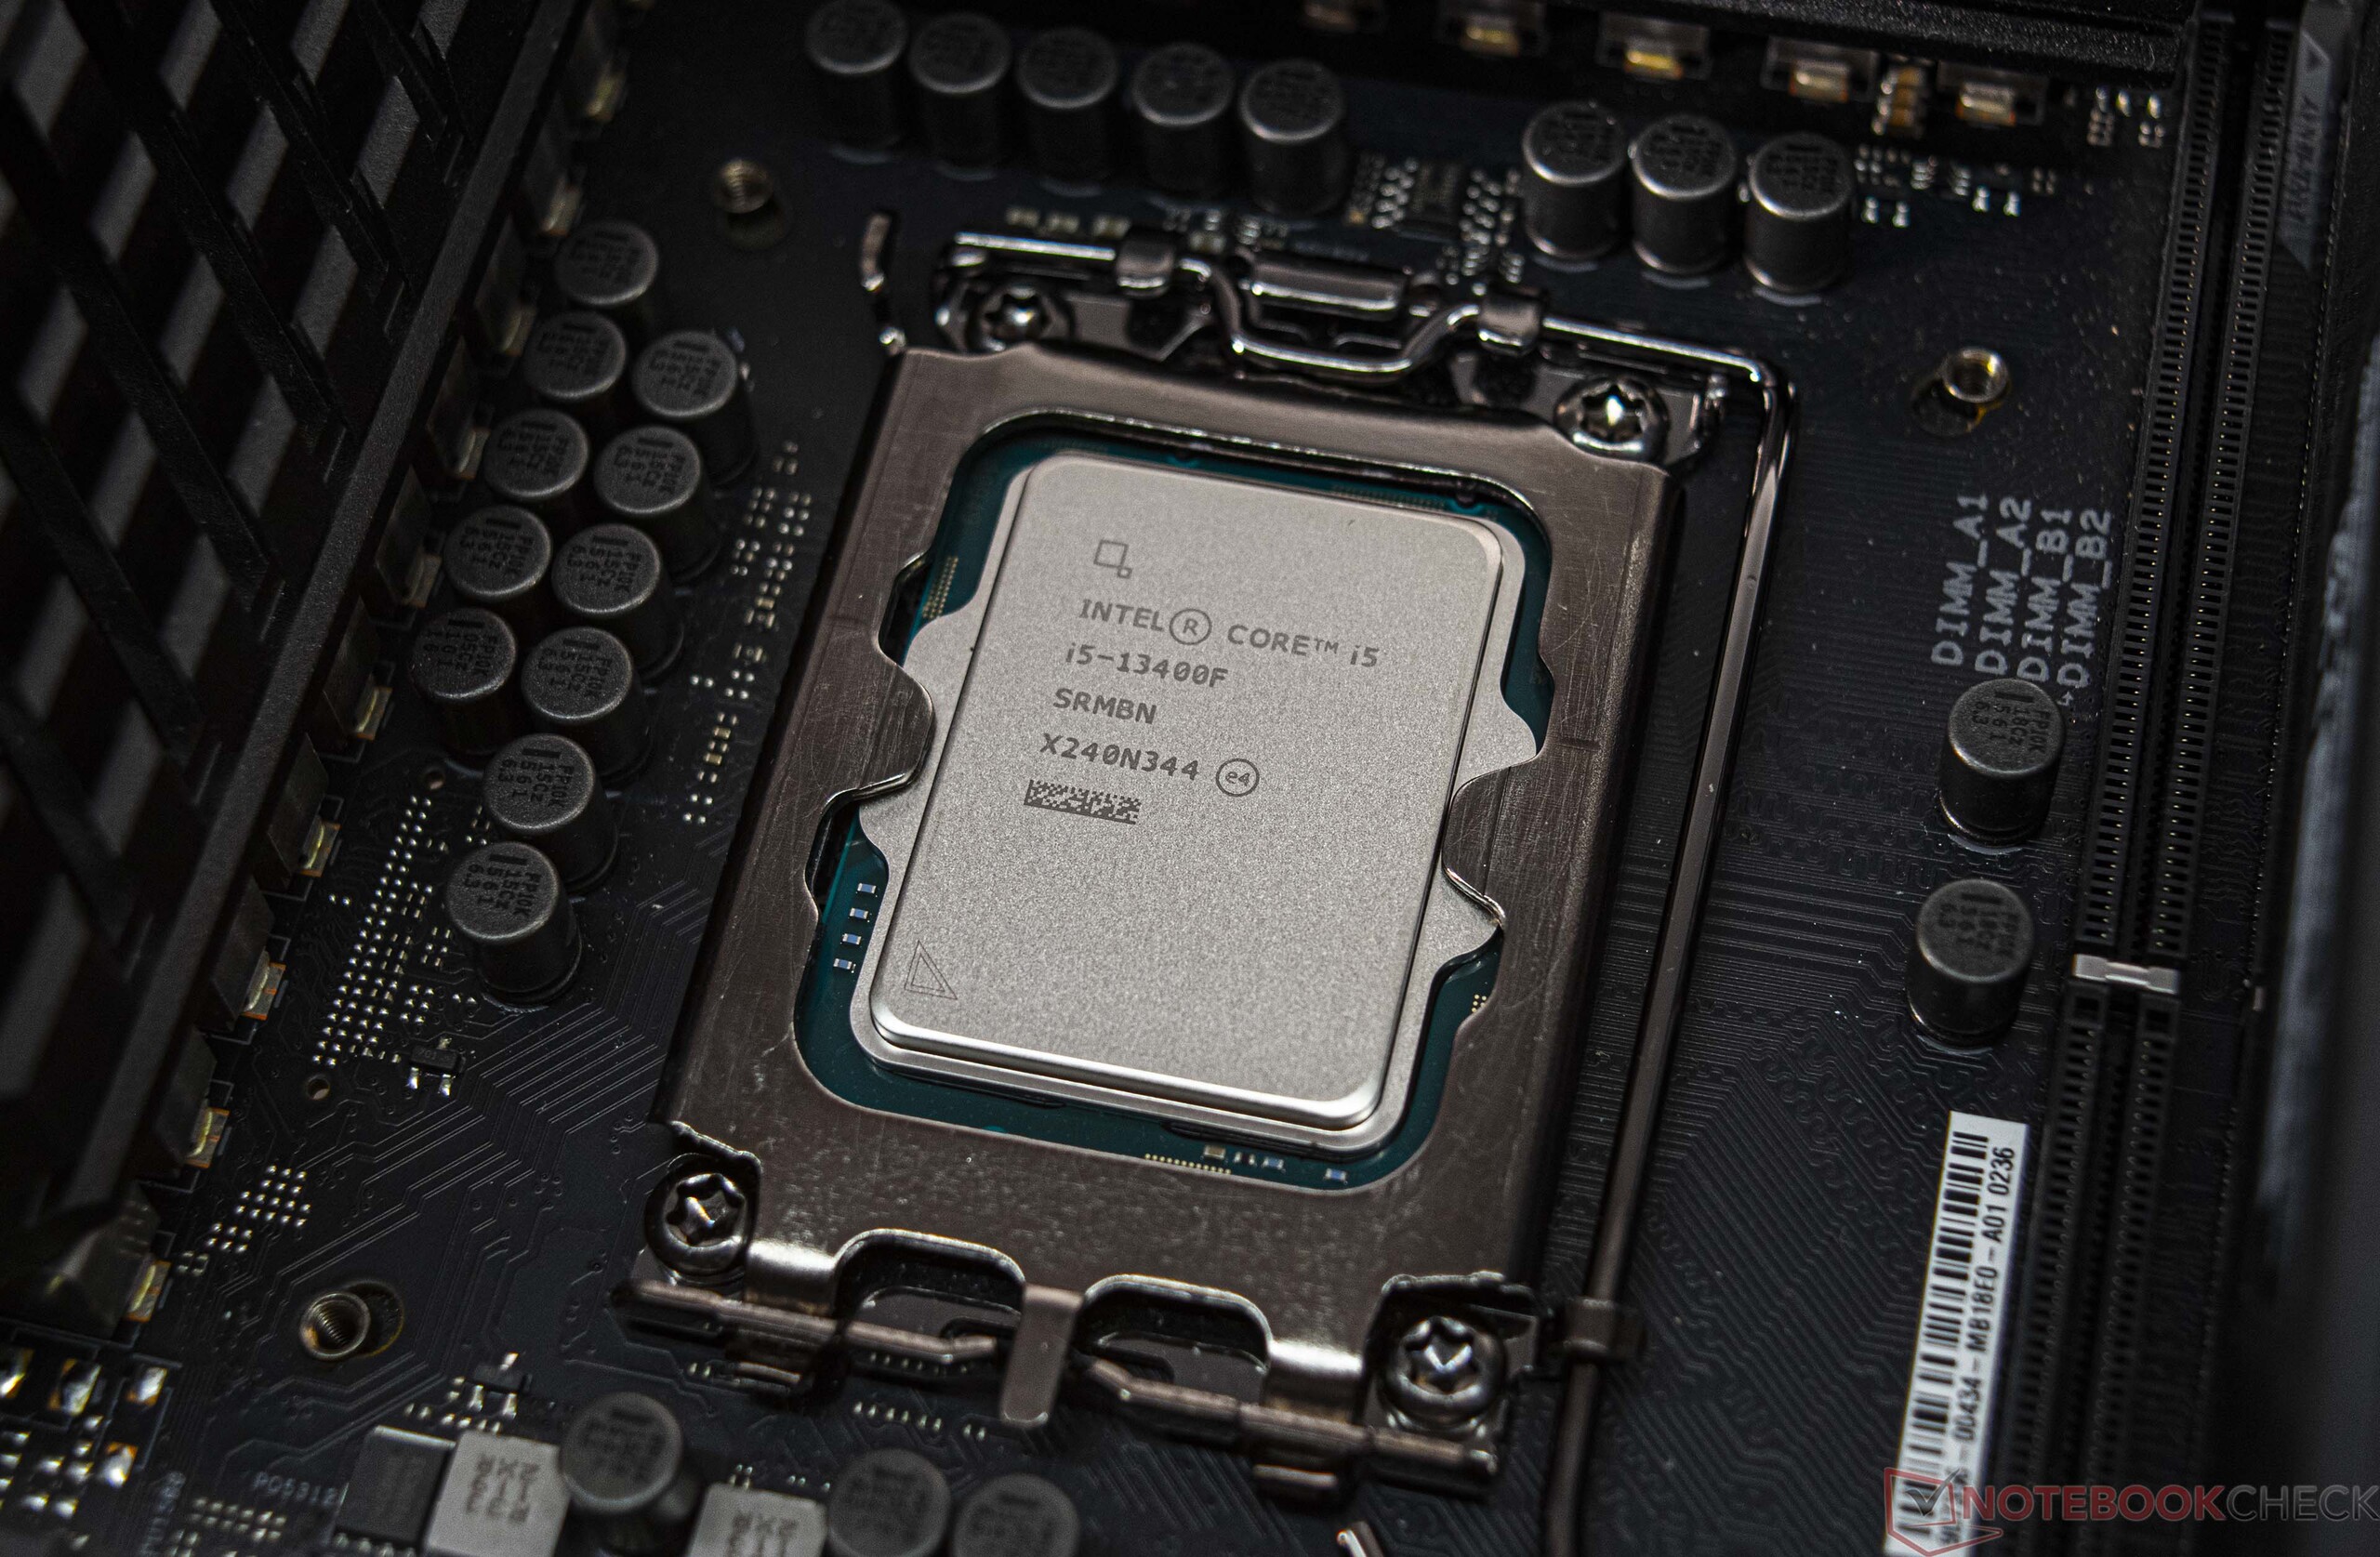
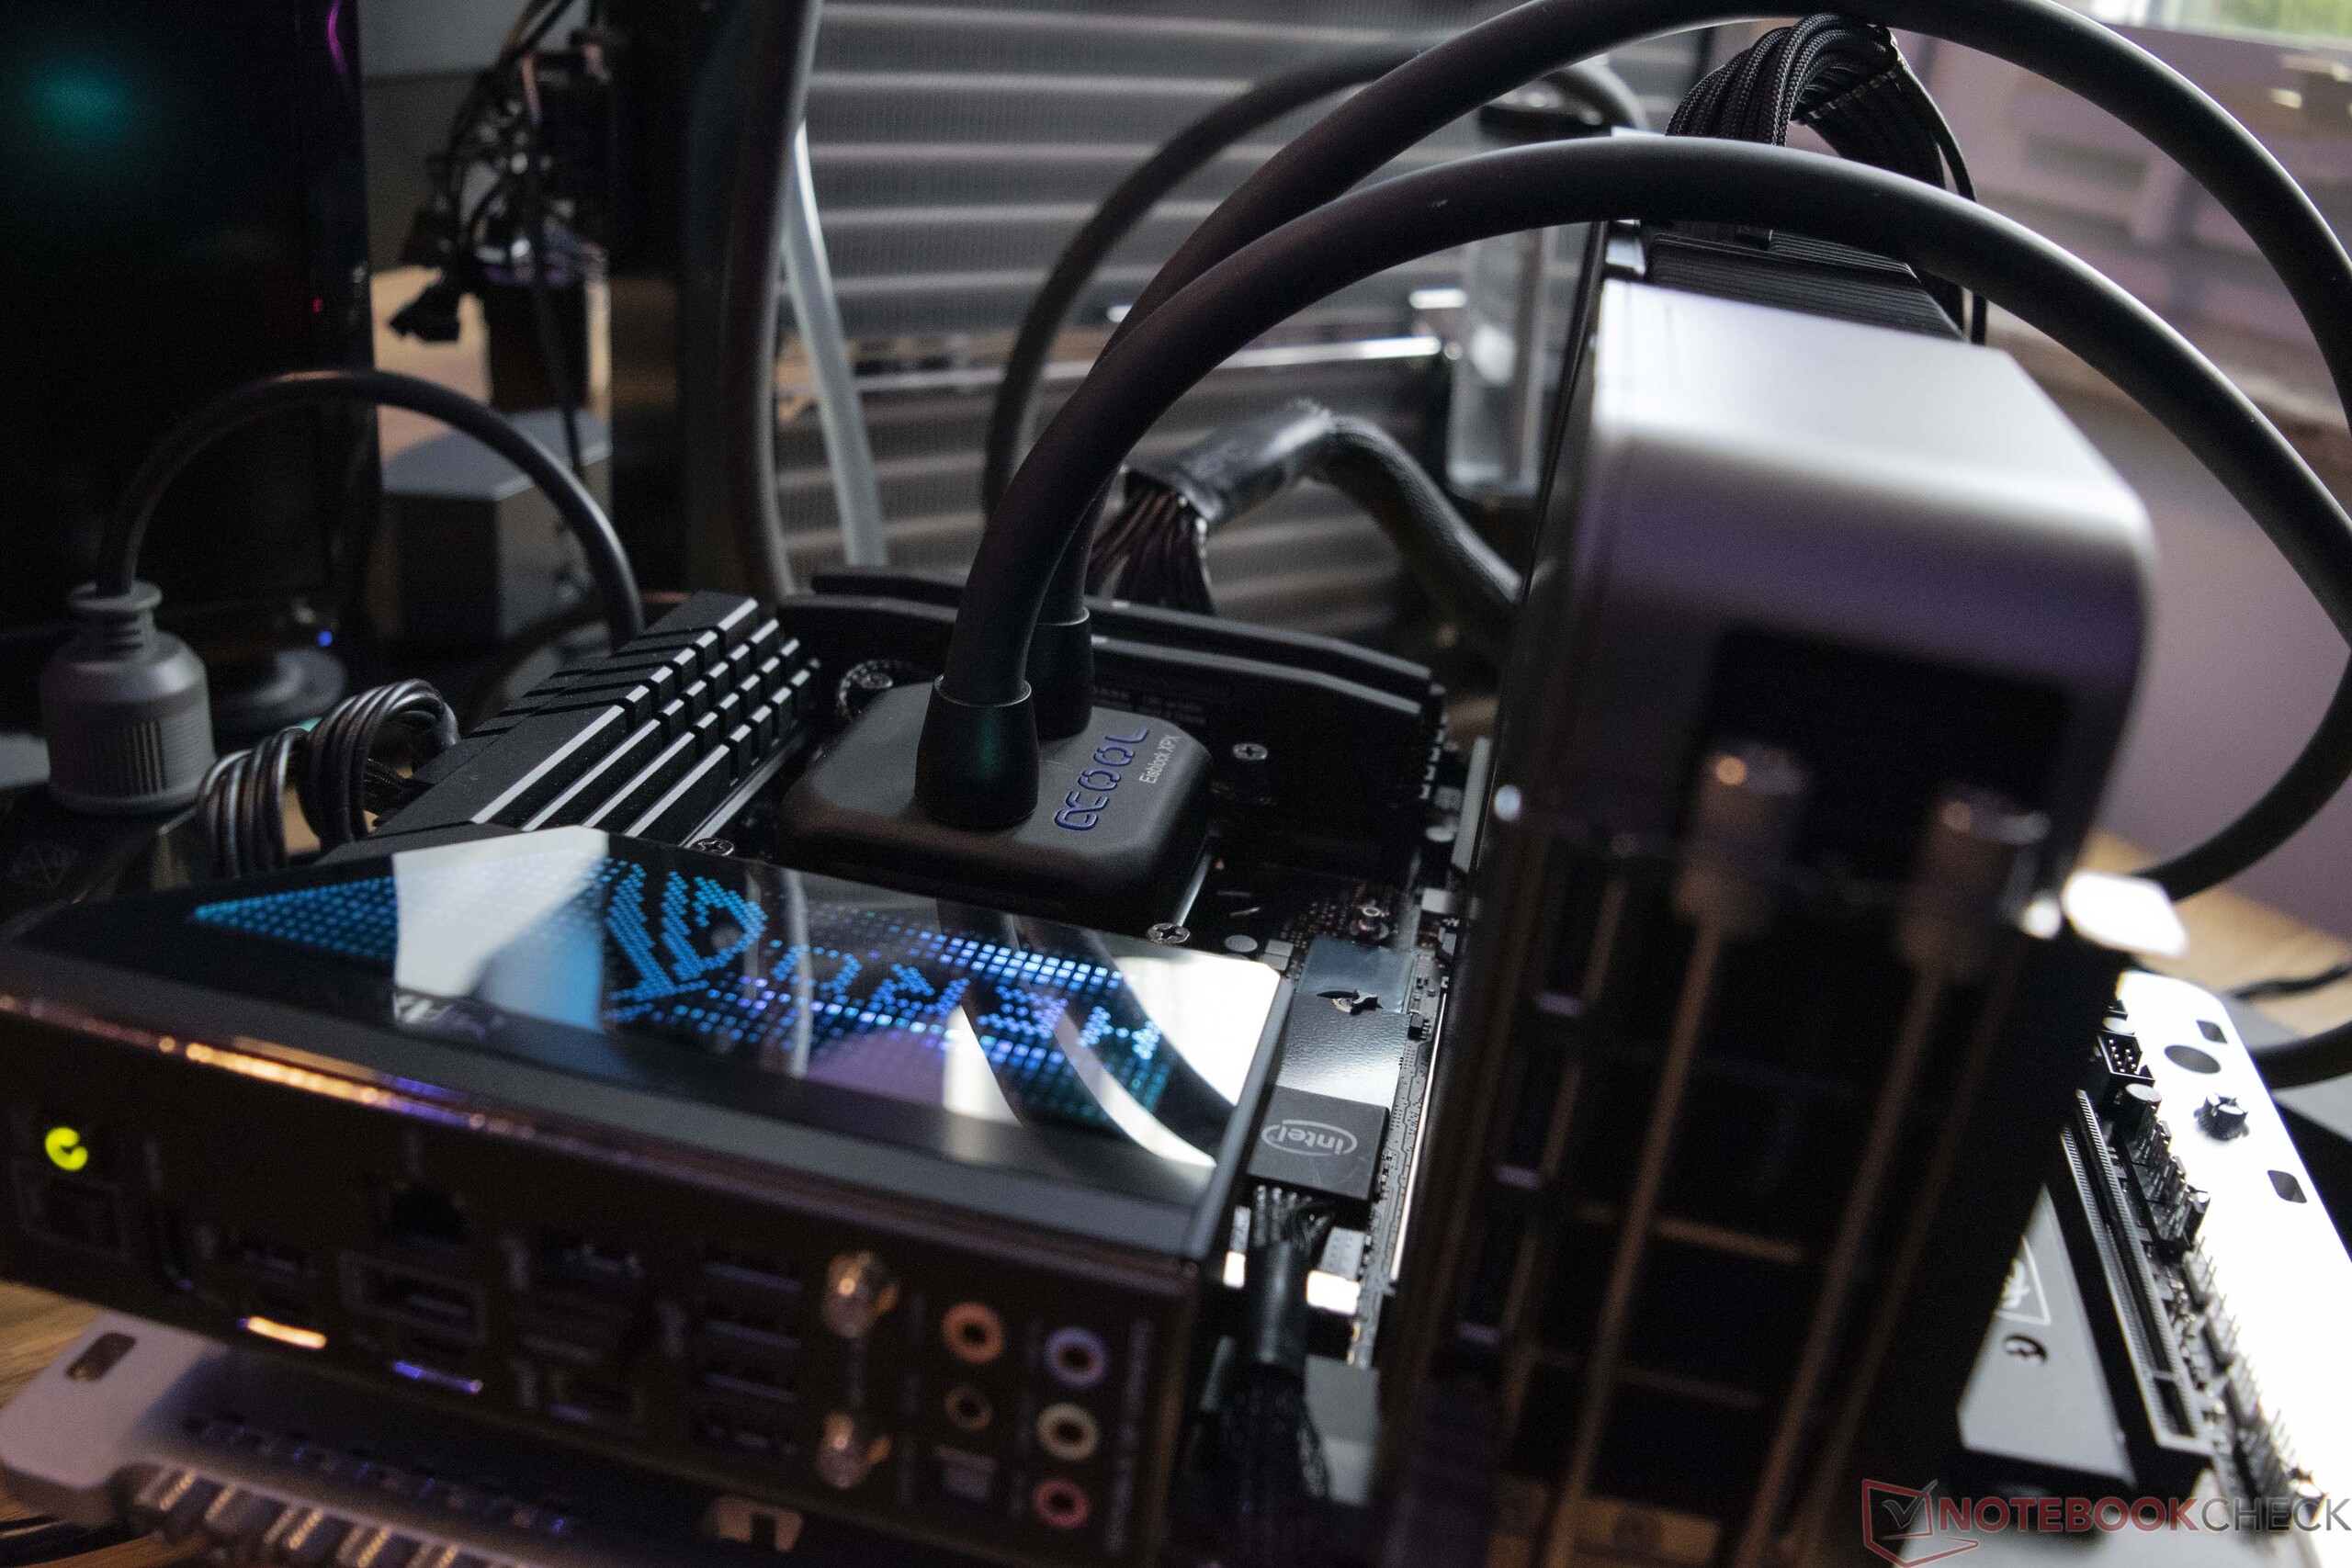
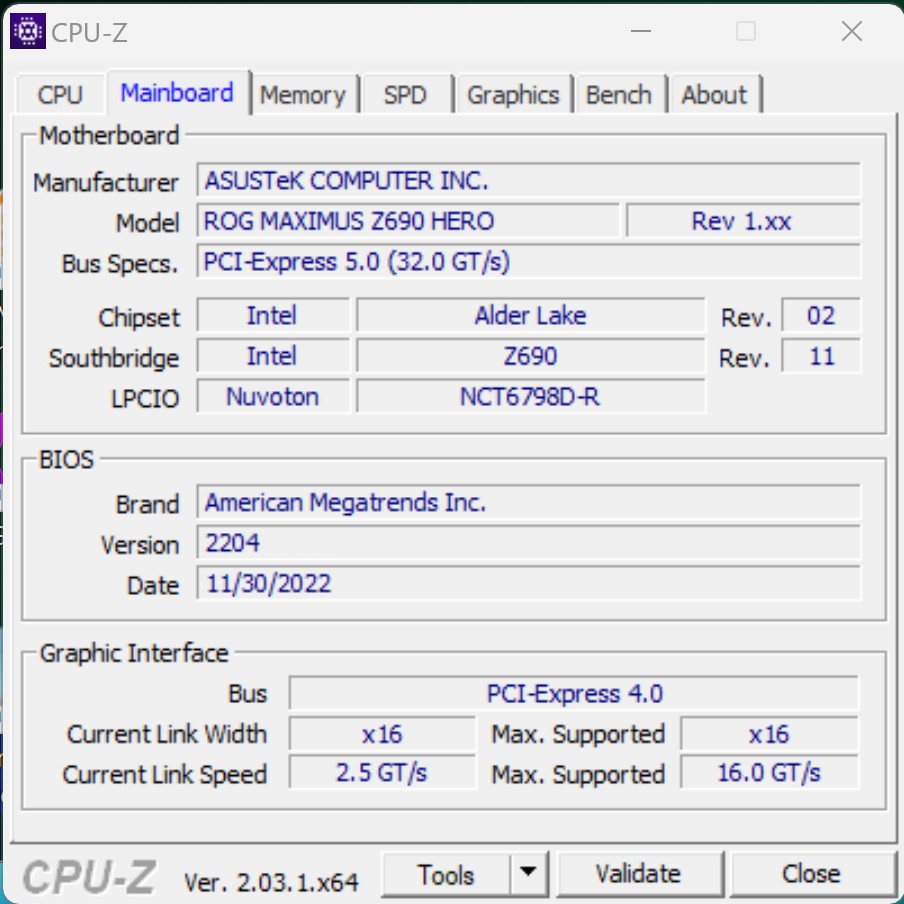
- Asus ROG Maximus Z690 Hero (BIOS v2204)
- Watercooling Custom-Loop (Bomba: Alphacool Aquastream XT Ultra, Radiador: EK MO-RA3 420 LT BLACK)
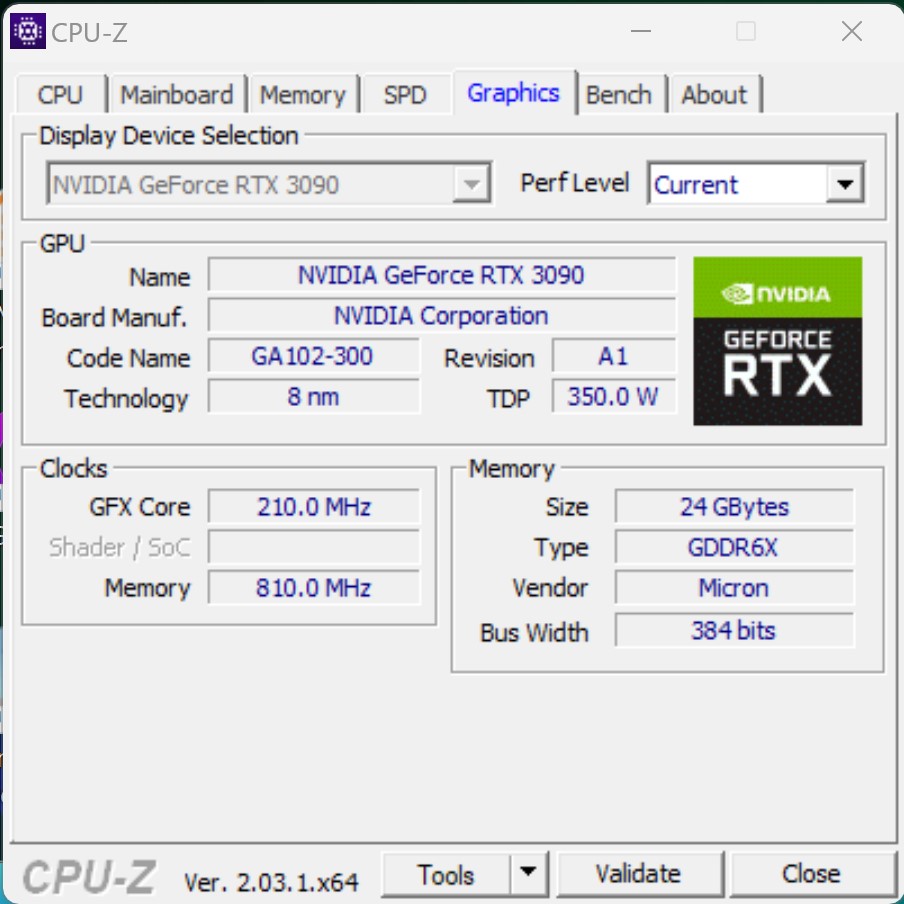
- Nvidia GeForce RTX 3090 Edição Fundadores (motorista: 528.02)
- EVGA SuperNOVA P+ 1600W
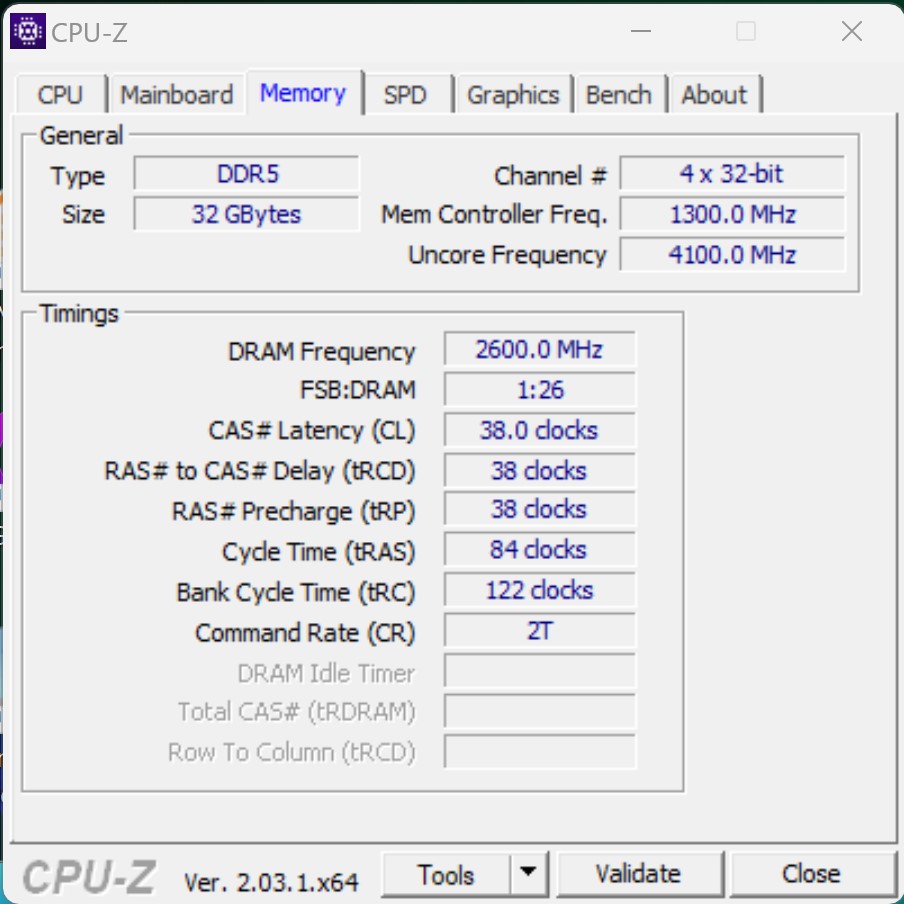
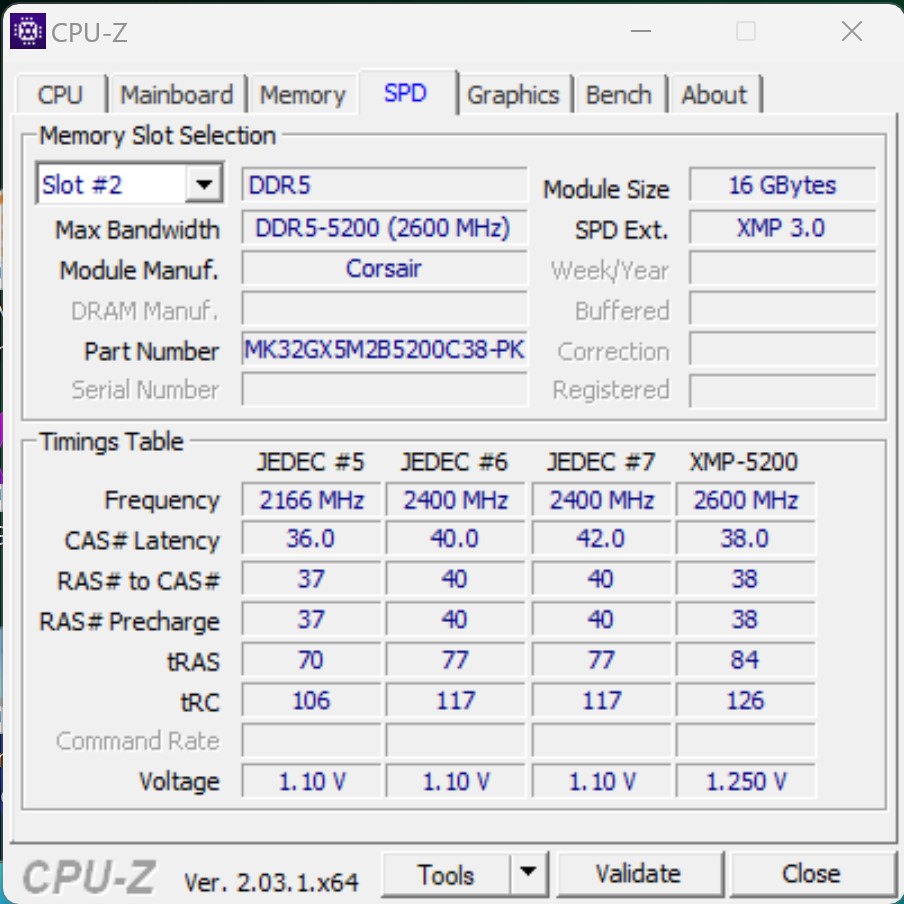
- G.Skill Ripjaws S5 (2x 16 GB - DDR5-5200 MT/s)
- Intel Optane 905p (sistema de 480 GB + benchmarks)
- Western Digital SN720 (Jogos)
- Microsoft Windows 11 Professional 64-bit (versão 22H2)
Condições de teste - Z690 ainda utilizável após atualização da BIOS
Continuamos a usar o Asus ROG Maximus Z690 Hero como base para este teste, que já foi nossa escolha desde a introdução do Processadores Alder-Lake. Depois de alguns problemas, que experimentamos durante nosso teste com o Intel Core i9-13900Knão houve complicações comIntel Core i5-13400F. A última BIOS v2204 foi instalada para iniciar o Intel Core i5-13400F. Felizmente, o Asus ROG Maximus Z690 Hero oferece a possibilidade de atualizar a BIOS sem CPU e memória RAM.
Todos os testes foram realizados com a última BIOS e habilitaram o perfil XMP1. Além disso, todas as restrições de limite de potência foram desativadas para acessar o desempenho total dos processadores.
Referências de processadores
Infelizmente, não podemos fazer uma comparação direta de desempenho com o Intel Core i5-12400F neste momento. Entretanto, temos muitos outros processadores em nosso banco de dados que podem ser usados como referência. Assim, vemos uma vantagem mínima para o Intel Core i5-13400F em comparação com um Intel Core i7-12700F. Em média, o Intel Core i5-13400F pode alcançar um resultado melhor, embora os fios que faltam definitivamente levem a uma pontuação pior em testes individuais. Vemos uma imagem quase idêntica na comparação direta com o AMD Ryzen 7 5800X. Como o Intel Core i5-13400F, este último oferece 16 roscas, mas pode pontuar melhor nos padrões de referência multi-tarefas puras.
Se você precisar de mais desempenho, você pode optar por um Intel Core i5-13600K. Há cerca de 20% a mais de desempenho aqui. O mesmo aumento de desempenho também pode ser alcançado com um AMD Ryzen 7 7700X.
Mais referências sobre os processadores podem ser encontradasaqui.
| Performance rating - Percent | |
| Intel Core i9-13900K | |
| Intel Core i5-13600K | |
| AMD Ryzen 7 7700X | |
| Intel Core i5-12600K | |
| AMD Ryzen 7 5800X | |
| Intel Core i7-12700F | |
| Intel Core i5-13400F | |
| AMD Ryzen 5 5600X | |
| Intel Core i5-11400F | |
| Cinebench R15 | |
| CPU Single 64Bit | |
| Intel Core i9-13900K | |
| AMD Ryzen 7 7700X | |
| Intel Core i5-13600K | |
| Intel Core i5-12600K | |
| Intel Core i7-12700F | |
| AMD Ryzen 7 5800X | |
| AMD Ryzen 5 5600X | |
| Intel Core i5-13400F | |
| Intel Core i5-11400F | |
| CPU Multi 64Bit | |
| Intel Core i9-13900K | |
| Intel Core i5-13600K | |
| AMD Ryzen 7 7700X | |
| AMD Ryzen 7 5800X | |
| Intel Core i7-12700F | |
| Intel Core i5-12600K | |
| Intel Core i5-13400F | |
| AMD Ryzen 5 5600X | |
| Intel Core i5-11400F | |
| Cinebench R20 | |
| CPU (Single Core) | |
| Intel Core i9-13900K | |
| Intel Core i5-13600K | |
| AMD Ryzen 7 7700X | |
| Intel Core i5-12600K | |
| Intel Core i7-12700F | |
| Intel Core i5-13400F | |
| AMD Ryzen 7 5800X | |
| AMD Ryzen 5 5600X | |
| Intel Core i5-11400F | |
| CPU (Multi Core) | |
| Intel Core i9-13900K | |
| Intel Core i5-13600K | |
| AMD Ryzen 7 7700X | |
| Intel Core i5-12600K | |
| Intel Core i5-13400F | |
| AMD Ryzen 7 5800X | |
| Intel Core i7-12700F | |
| AMD Ryzen 5 5600X | |
| Intel Core i5-11400F | |
| Cinebench R23 | |
| Single Core | |
| Intel Core i9-13900K | |
| Intel Core i5-13600K | |
| AMD Ryzen 7 7700X | |
| Intel Core i5-12600K | |
| Intel Core i7-12700F | |
| Intel Core i5-13400F | |
| AMD Ryzen 7 5800X | |
| AMD Ryzen 5 5600X | |
| Intel Core i5-11400F | |
| Multi Core | |
| Intel Core i9-13900K | |
| Intel Core i5-13600K | |
| AMD Ryzen 7 7700X | |
| Intel Core i5-12600K | |
| Intel Core i5-13400F | |
| Intel Core i7-12700F | |
| AMD Ryzen 7 5800X | |
| AMD Ryzen 5 5600X | |
| Intel Core i5-11400F | |
| Cinebench R11.5 | |
| CPU Single 64Bit | |
| Intel Core i9-13900K | |
| AMD Ryzen 7 7700X | |
| Intel Core i5-13600K | |
| Intel Core i5-12600K | |
| Intel Core i7-12700F | |
| AMD Ryzen 7 5800X | |
| Intel Core i5-13400F | |
| AMD Ryzen 5 5600X | |
| Intel Core i5-11400F | |
| CPU Multi 64Bit | |
| Intel Core i9-13900K | |
| Intel Core i5-13600K | |
| AMD Ryzen 7 7700X | |
| Intel Core i7-12700F | |
| Intel Core i5-12600K | |
| AMD Ryzen 7 5800X | |
| Intel Core i5-13400F | |
| AMD Ryzen 5 5600X | |
| Intel Core i5-11400F | |
| Blender - v2.79 BMW27 CPU | |
| Intel Core i5-11400F | |
| AMD Ryzen 5 5600X | |
| Intel Core i7-12700F | |
| Intel Core i5-13400F | |
| AMD Ryzen 7 5800X | |
| Intel Core i5-12600K | |
| AMD Ryzen 7 7700X | |
| Intel Core i5-13600K | |
| Intel Core i9-13900K | |
| WinRAR - Result | |
| AMD Ryzen 7 5800X | |
| AMD Ryzen 7 7700X | |
| Intel Core i9-13900K | |
| AMD Ryzen 5 5600X | |
| Intel Core i5-13600K | |
| Intel Core i7-12700F | |
| Intel Core i5-13400F | |
| Intel Core i5-11400F | |
| Intel Core i5-12600K | |
| TrueCrypt | |
| AES Mean 100MB | |
| Intel Core i9-13900K | |
| Intel Core i5-13600K | |
| AMD Ryzen 7 7700X | |
| AMD Ryzen 7 5800X | |
| Intel Core i5-12600K | |
| Intel Core i5-13400F | |
| AMD Ryzen 5 5600X | |
| Intel Core i5-11400F | |
| Intel Core i7-12700F | |
| Twofish Mean 100MB | |
| Intel Core i9-13900K | |
| Intel Core i5-13600K | |
| Intel Core i7-12700F | |
| AMD Ryzen 7 7700X | |
| Intel Core i5-12600K | |
| AMD Ryzen 7 5800X | |
| Intel Core i5-13400F | |
| AMD Ryzen 5 5600X | |
| Intel Core i5-11400F | |
| Serpent Mean 100MB | |
| Intel Core i9-13900K | |
| Intel Core i5-13600K | |
| Intel Core i7-12700F | |
| AMD Ryzen 7 7700X | |
| AMD Ryzen 7 5800X | |
| Intel Core i5-12600K | |
| Intel Core i5-13400F | |
| AMD Ryzen 5 5600X | |
| Intel Core i5-11400F | |
| Geekbench 5.5 | |
| Multi-Core | |
| Intel Core i9-13900K | |
| Intel Core i5-13600K | |
| AMD Ryzen 7 7700X | |
| Intel Core i5-12600K | |
| Intel Core i5-13400F | |
| AMD Ryzen 7 5800X | |
| Intel Core i7-12700F | |
| AMD Ryzen 5 5600X | |
| Intel Core i5-11400F | |
| Single-Core | |
| Intel Core i9-13900K | |
| AMD Ryzen 7 7700X | |
| Intel Core i5-13600K | |
| Intel Core i5-12600K | |
| Intel Core i5-13400F | |
| AMD Ryzen 7 5800X | |
| AMD Ryzen 5 5600X | |
| Intel Core i7-12700F | |
| Intel Core i5-11400F | |
| Geekbench 5.0 | |
| 5.0 Multi-Core | |
| Intel Core i9-13900K | |
| Intel Core i5-13600K | |
| AMD Ryzen 7 7700X | |
| Intel Core i5-12600K | |
| Intel Core i5-13400F | |
| AMD Ryzen 7 5800X | |
| Intel Core i7-12700F | |
| AMD Ryzen 5 5600X | |
| Intel Core i5-11400F | |
| 5.0 Single-Core | |
| Intel Core i9-13900K | |
| AMD Ryzen 7 7700X | |
| Intel Core i5-13600K | |
| Intel Core i5-12600K | |
| Intel Core i5-13400F | |
| AMD Ryzen 7 5800X | |
| AMD Ryzen 5 5600X | |
| Intel Core i7-12700F | |
| Intel Core i5-11400F | |
| Geekbench 4.4 | |
| 64 Bit Single-Core Score | |
| Intel Core i9-13900K | |
| AMD Ryzen 7 7700X | |
| Intel Core i5-13600K | |
| Intel Core i5-12600K | |
| Intel Core i5-13400F | |
| AMD Ryzen 7 5800X | |
| AMD Ryzen 5 5600X | |
| Intel Core i5-11400F | |
| Intel Core i7-12700F | |
| 64 Bit Multi-Core Score | |
| Intel Core i9-13900K | |
| Intel Core i5-13600K | |
| AMD Ryzen 7 7700X | |
| Intel Core i5-12600K | |
| AMD Ryzen 7 5800X | |
| Intel Core i5-13400F | |
| Intel Core i7-12700F | |
| AMD Ryzen 5 5600X | |
| Intel Core i5-11400F | |
| 3DMark 11 - 1280x720 Performance Physics | |
| Intel Core i9-13900K | |
| AMD Ryzen 7 7700X | |
| Intel Core i5-13600K | |
| Intel Core i5-12600K | |
| Intel Core i5-13400F | |
| Intel Core i7-12700F | |
| AMD Ryzen 7 5800X | |
| AMD Ryzen 5 5600X | |
| Intel Core i5-11400F | |
| HWBOT x265 Benchmark v2.2 - 4k Preset | |
| Intel Core i9-13900K | |
| Intel Core i5-12600K | |
| Intel Core i5-13600K | |
| AMD Ryzen 7 7700X | |
| AMD Ryzen 7 5800X | |
| Intel Core i5-13400F | |
| Intel Core i7-12700F | |
| AMD Ryzen 5 5600X | |
| Intel Core i5-11400F | |
| R Benchmark 2.5 - Overall mean | |
| Intel Core i5-11400F | |
| AMD Ryzen 5 5600X | |
| Intel Core i5-13400F | |
| AMD Ryzen 7 5800X | |
| Intel Core i5-12600K | |
| Intel Core i7-12700F | |
| Intel Core i5-13600K | |
| AMD Ryzen 7 7700X | |
| Intel Core i9-13900K | |
| LibreOffice - 20 Documents To PDF | |
| Intel Core i5-12600K | |
| Intel Core i7-12700F | |
| Intel Core i5-11400F | |
| AMD Ryzen 5 5600X | |
| AMD Ryzen 7 5800X | |
| Intel Core i5-13400F | |
| Intel Core i9-13900K | |
| Intel Core i5-13600K | |
| AMD Ryzen 7 7700X | |
| WebXPRT 3 - Overall | |
| Intel Core i9-13900K | |
| AMD Ryzen 7 7700X | |
| Intel Core i5-13600K | |
| AMD Ryzen 7 5800X | |
| Intel Core i5-13400F | |
| Intel Core i5-12600K | |
| AMD Ryzen 5 5600X | |
| Intel Core i7-12700F | |
| Intel Core i5-11400F | |
| Mozilla Kraken 1.1 - Total | |
| Intel Core i5-11400F | |
| AMD Ryzen 5 5600X | |
| AMD Ryzen 7 5800X | |
| Intel Core i5-13400F | |
| Intel Core i7-12700F | |
| Intel Core i5-12600K | |
| Intel Core i5-13600K | |
| AMD Ryzen 7 7700X | |
| Intel Core i9-13900K | |
| 3DMark | |
| 1920x1080 Fire Strike Physics | |
| Intel Core i9-13900K | |
| Intel Core i5-13600K | |
| AMD Ryzen 7 7700X | |
| Intel Core i7-12700F | |
| AMD Ryzen 7 5800X | |
| Intel Core i5-12600K | |
| Intel Core i5-13400F | |
| AMD Ryzen 5 5600X | |
| Intel Core i5-11400F | |
| 2560x1440 Time Spy CPU | |
| Intel Core i9-13900K | |
| Intel Core i5-13600K | |
| AMD Ryzen 7 7700X | |
| Intel Core i5-12600K | |
| Intel Core i5-13400F | |
| AMD Ryzen 7 5800X | |
| Intel Core i7-12700F | |
| AMD Ryzen 5 5600X | |
| Intel Core i5-11400F | |
* ... menor é melhor
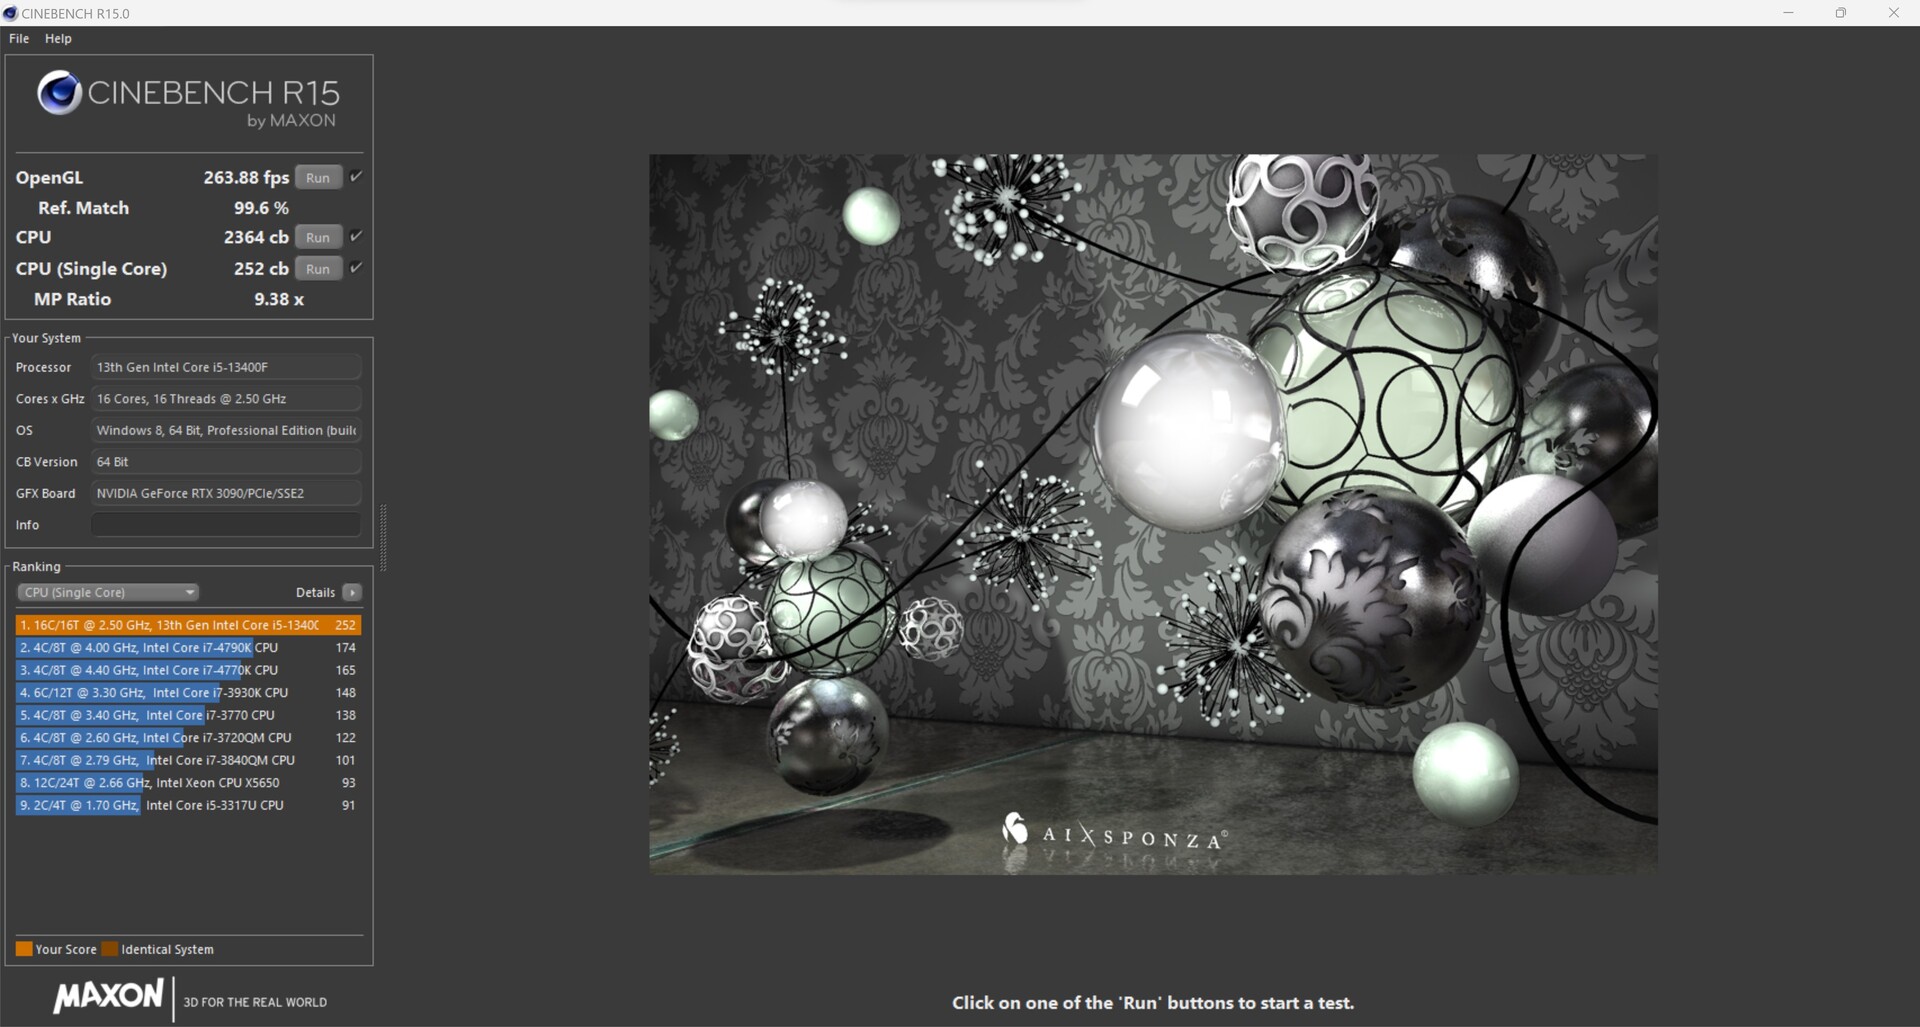
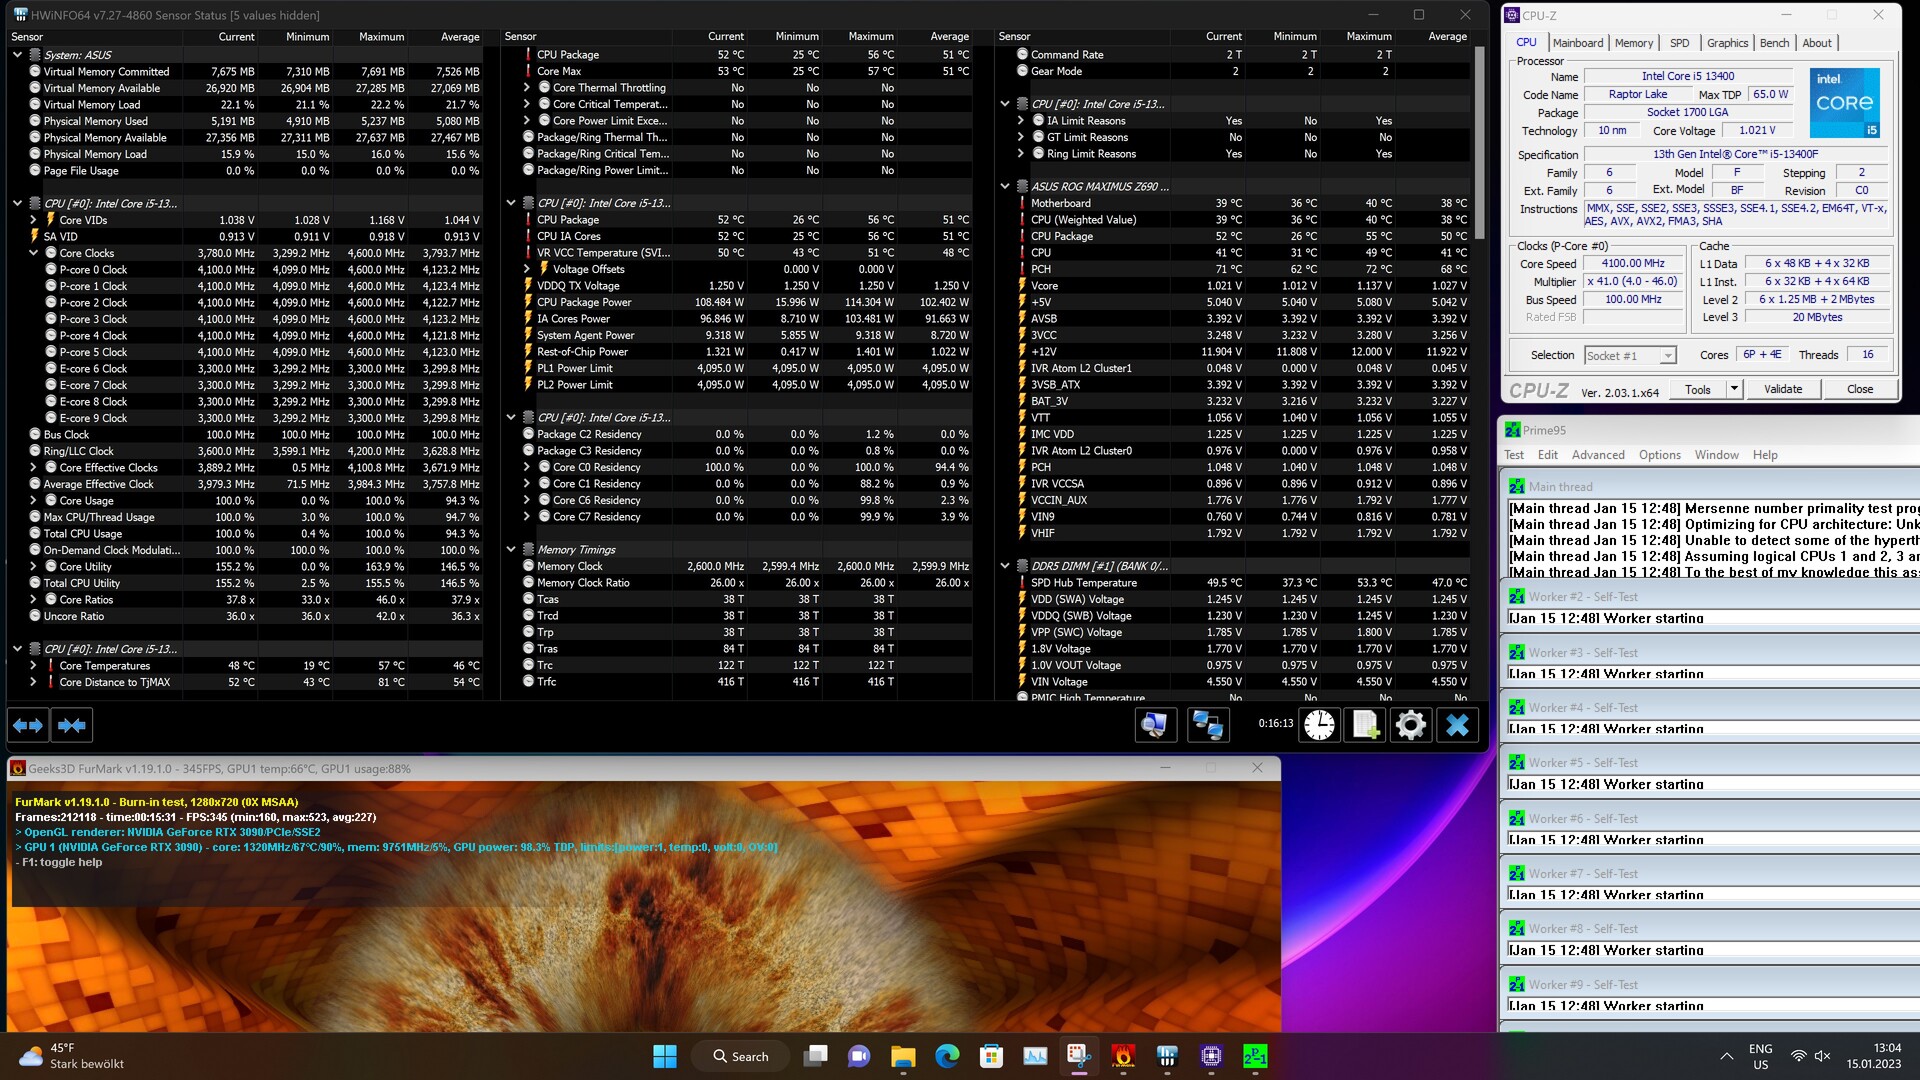
Intel Core i5-13400F vs. Cinebench R15 multi loop
Durante o teste de estresse, que realizamos com o loop contínuo Cinebench R15, não há problemas em termos de desenvolvimento estável de energia. Com um máximo de 148 watts, que a Intel permite o Core i5-13400F, o sistema de resfriamento não é particularmente desafiado. O Intel Core i5-13400F é apenas marginalmente mais lento do que um Intel Core i5-12600K com uma média de 2.338 pontos em todas as 50 corridas Intel Core i5-12600K (2.545 pontos).
Benchmarks sintéticos e desempenho de aplicação
O Intel Core i5-13400F também pode pontuar bem nos benchmarks de aplicação e é igual a um Intel Core i5-12600K em termos de desempenho. Comparado com os modelos K dos processadores Raptor-Lake listados aqui, nossa amostra de revisão tem que aceitar um claro déficit, no entanto. No entanto, o Intel Core i5-13400F oferece um desempenho sólido no uso diário, o que é completamente suficiente para a maioria das aplicações.
| 3DMark | |
| 1920x1080 Fire Strike Physics | |
| Intel Core i9-13900K | |
| AMD Ryzen 9 5950X | |
| Intel Core i9-12900K | |
| Intel Core i5-13600K | |
| AMD Ryzen 9 5900X | |
| Intel Core i7-12700F | |
| AMD Ryzen 5 7600X | |
| Intel Core i5-12600K | |
| Intel Core i5-13400F | |
| AMD Ryzen 5 5600X | |
| Intel Core i5-11400F | |
| 2560x1440 Time Spy CPU | |
| Intel Core i9-13900K | |
| Intel Core i9-12900K | |
| Intel Core i5-13600K | |
| Intel Core i5-12600K | |
| AMD Ryzen 9 5950X | |
| Intel Core i5-13400F | |
| AMD Ryzen 9 5900X | |
| Intel Core i7-12700F | |
| AMD Ryzen 5 7600X | |
| AMD Ryzen 5 5600X | |
| Intel Core i5-11400F | |
| 3DMark 11 - 1280x720 Performance Physics | |
| Intel Core i9-13900K | |
| Intel Core i5-13600K | |
| Intel Core i9-12900K | |
| AMD Ryzen 5 7600X | |
| AMD Ryzen 9 5950X | |
| Intel Core i5-12600K | |
| Intel Core i5-13400F | |
| Intel Core i7-12700F | |
| Intel Core i9-12900K | |
| AMD Ryzen 9 5900X | |
| AMD Ryzen 5 5600X | |
| Intel Core i5-11400F | |
| CrossMark - Overall | |
| Intel Core i9-13900K | |
| Intel Core i5-13600K | |
| AMD Ryzen 5 7600X | |
| Intel Core i5-13400F | |
| Intel Core i7-12700F | |
| Intel Core i5-12600K | |
| AMD Ryzen 9 5900X | |
| AMD Ryzen 9 5950X | |
| AMD Ryzen 5 5600X | |
| AIDA64 / Memory Copy | |
| Intel Core i9-13900K | |
| Intel Core i5-13600K | |
| Intel Core i5-13400F | |
| Intel Core i5-12600K | |
| AMD Ryzen 9 5900X | |
| AMD Ryzen 5 7600X | |
| AMD Ryzen 9 5950X | |
| AMD Ryzen 5 5600X | |
| Média da turma (4514 - 234662, n=2223) | |
| AIDA64 / Memory Read | |
| Intel Core i9-13900K | |
| Intel Core i5-13400F | |
| Intel Core i5-12600K | |
| Intel Core i5-13600K | |
| AMD Ryzen 9 5900X | |
| AMD Ryzen 9 5950X | |
| AMD Ryzen 5 5600X | |
| AMD Ryzen 5 7600X | |
| Média da turma (4031 - 271066, n=2185) | |
| AIDA64 / Memory Write | |
| AMD Ryzen 5 7600X | |
| Intel Core i9-13900K | |
| Intel Core i5-12600K | |
| Intel Core i5-13600K | |
| Intel Core i5-13400F | |
| Média da turma (3506 - 242868, n=2190) | |
| AMD Ryzen 9 5900X | |
| AMD Ryzen 9 5950X | |
| AMD Ryzen 5 5600X | |
| AIDA64 / Memory Latency | |
| Média da turma (6.1 - 536, n=2251) | |
| Intel Core i5-12600K | |
| Intel Core i5-13600K | |
| Intel Core i5-13400F | |
| Intel Core i9-13900K | |
| AMD Ryzen 9 5950X | |
| AMD Ryzen 5 5600X | |
| AMD Ryzen 5 7600X | |
| AMD Ryzen 9 5900X | |
* ... menor é melhor
Benchmarks de jogo
Como antes, nossa amostra de revisão duplica principalmente com o Intel Core i5-12600K nos testes de jogos. Em altas resoluções e uma alta predefinição, os rivais se aproximam mais. Se se trata apenas de jogos, você certamente não vai errar com o Intel Core i5-13400F. Com seus 16 fios, todos os jogos são atualmente jogáveis bem com a placa gráfica correspondente. Em nosso teste, usamos um Nvidia GeForce RTX 3090 Edição Fundadora a fim de comparar o desempenho de nossa amostra de teste com o dos dispositivos de comparação. Se você também quiser transmitir ao mesmo tempo que jogos, recomendamos atualmente um Intel Core i9-13900K ou agarrar um AMD Ryzen 9 7950X.
Gaming Performance
| Performance rating - Percent | |
| Intel Core i9-13900K | |
| AMD Ryzen 9 7900X | |
| AMD Ryzen 5 7600X | |
| Intel Core i9-12900K | |
| Intel Core i5-13600K | |
| Intel Core i5-13400F | |
| Intel Core i5-12600K | |
| F1 22 | |
| 1920x1080 Low Preset AA:T AF:16x | |
| AMD Ryzen 9 7900X | |
| AMD Ryzen 5 7600X | |
| Intel Core i5-13600K | |
| Intel Core i9-13900K | |
| Intel Core i9-12900K | |
| Intel Core i5-13400F | |
| Intel Core i5-12600K | |
| 1920x1080 Ultra High Preset AA:T AF:16x | |
| Intel Core i9-12900K | |
| Intel Core i5-12600K | |
| Intel Core i5-13600K | |
| Intel Core i5-13400F | |
| AMD Ryzen 5 7600X | |
| AMD Ryzen 9 7900X | |
| Intel Core i9-13900K | |
| Far Cry 5 | |
| 1920x1080 Ultra Preset AA:T | |
| Intel Core i9-13900K | |
| Intel Core i5-13600K | |
| Intel Core i9-12900K | |
| AMD Ryzen 9 7900X | |
| AMD Ryzen 5 7600X | |
| Intel Core i5-12600K | |
| Intel Core i5-13400F | |
| 1280x720 Low Preset AA:T | |
| Intel Core i9-13900K | |
| AMD Ryzen 9 7900X | |
| Intel Core i5-13600K | |
| AMD Ryzen 5 7600X | |
| Intel Core i9-12900K | |
| Intel Core i5-12600K | |
| Intel Core i5-13400F | |
| X-Plane 11.11 | |
| 1920x1080 high (fps_test=3) | |
| AMD Ryzen 9 7900X | |
| AMD Ryzen 5 7600X | |
| Intel Core i9-13900K | |
| Intel Core i9-12900K | |
| Intel Core i5-13600K | |
| Intel Core i5-13400F | |
| Intel Core i5-12600K | |
| 1280x720 low (fps_test=1) | |
| Intel Core i9-13900K | |
| AMD Ryzen 5 7600X | |
| AMD Ryzen 9 7900X | |
| Intel Core i9-12900K | |
| Intel Core i5-13600K | |
| Intel Core i5-13400F | |
| Intel Core i5-12600K | |
| Final Fantasy XV Benchmark | |
| 1920x1080 High Quality | |
| AMD Ryzen 9 7900X | |
| Intel Core i5-13600K | |
| Intel Core i9-13900K | |
| AMD Ryzen 5 7600X | |
| Intel Core i9-12900K | |
| Intel Core i5-13400F | |
| Intel Core i5-12600K | |
| 1280x720 Lite Quality | |
| AMD Ryzen 9 7900X | |
| Intel Core i5-13600K | |
| Intel Core i9-13900K | |
| Intel Core i9-12900K | |
| AMD Ryzen 5 7600X | |
| Intel Core i5-13400F | |
| Intel Core i5-12600K | |
| Dota 2 Reborn | |
| 1920x1080 ultra (3/3) best looking | |
| AMD Ryzen 9 7900X | |
| Intel Core i9-13900K | |
| AMD Ryzen 5 7600X | |
| Intel Core i5-13600K | |
| Intel Core i9-12900K | |
| Intel Core i5-12600K | |
| Intel Core i5-13400F | |
| 1280x720 min (0/3) fastest | |
| AMD Ryzen 5 7600X | |
| AMD Ryzen 9 7900X | |
| Intel Core i9-13900K | |
| Intel Core i5-13600K | |
| Intel Core i9-12900K | |
| Intel Core i5-12600K | |
| Intel Core i5-13400F | |
| GTA V | |
| 1920x1080 Highest AA:4xMSAA + FX AF:16x | |
| Intel Core i9-13900K | |
| AMD Ryzen 9 7900X | |
| AMD Ryzen 5 7600X | |
| Intel Core i5-13600K | |
| Intel Core i9-12900K | |
| Intel Core i5-12600K | |
| Intel Core i5-13400F | |
| 1024x768 Lowest Settings possible | |
| Intel Core i9-13900K | |
| AMD Ryzen 9 7900X | |
| AMD Ryzen 5 7600X | |
| Intel Core i5-13600K | |
| Intel Core i9-12900K | |
| Intel Core i5-13400F | |
| Intel Core i5-12600K | |
| baixo | média | alto | ultra | QHD | 4K | |
|---|---|---|---|---|---|---|
| GTA V (2015) | 187.5 | 187.5 | 187.1 | 161.4 | 151.8 | 182.2 |
| The Witcher 3 (2015) | 773 | 586 | 384 | 188.1 | 156.9 | |
| Dota 2 Reborn (2015) | 293.1 | 257 | 250.4 | 231.65 | 216.7 | |
| Final Fantasy XV Benchmark (2018) | 236 | 231 | 190.8 | 146.6 | 88.8 | |
| X-Plane 11.11 (2018) | 225 | 199.2 | 160.9 | 133.5 | ||
| Far Cry 5 (2018) | 244 | 211 | 203 | 186 | 176 | 110 |
| Strange Brigade (2018) | 741 | 479 | 380 | 329 | 249 | 153.1 |
| Shadow of the Tomb Raider (2018) | 314 | 261 | 251 | 234 | 172.2 | 99.6 |
| Far Cry New Dawn (2019) | 200 | 176 | 169 | 151 | 143 | 109 |
| Metro Exodus (2019) | 311 | 223 | 175.2 | 140.1 | 115.8 | 76.6 |
| Borderlands 3 (2019) | 244 | 213 | 190.8 | 164.1 | 131.6 | 75.3 |
| F1 2020 (2020) | 487 | 403 | 374 | 270 | 218 | 138.8 |
| F1 2021 (2021) | 648 | 548 | 441 | 224 | 175.4 | 105.3 |
| Cyberpunk 2077 1.6 (2022) | 214 | 213 | 174 | 173 | 88 | 46 |
| Tiny Tina's Wonderlands (2022) | 364 | 294 | 212 | 168.5 | 124 | 70.8 |
| F1 22 (2022) | 344 | 361 | 321 | 125.1 | 83.8 | 42.4 |
| The Quarry (2022) | 282 | 216 | 177.7 | 144.4 | 103.6 | 58.9 |
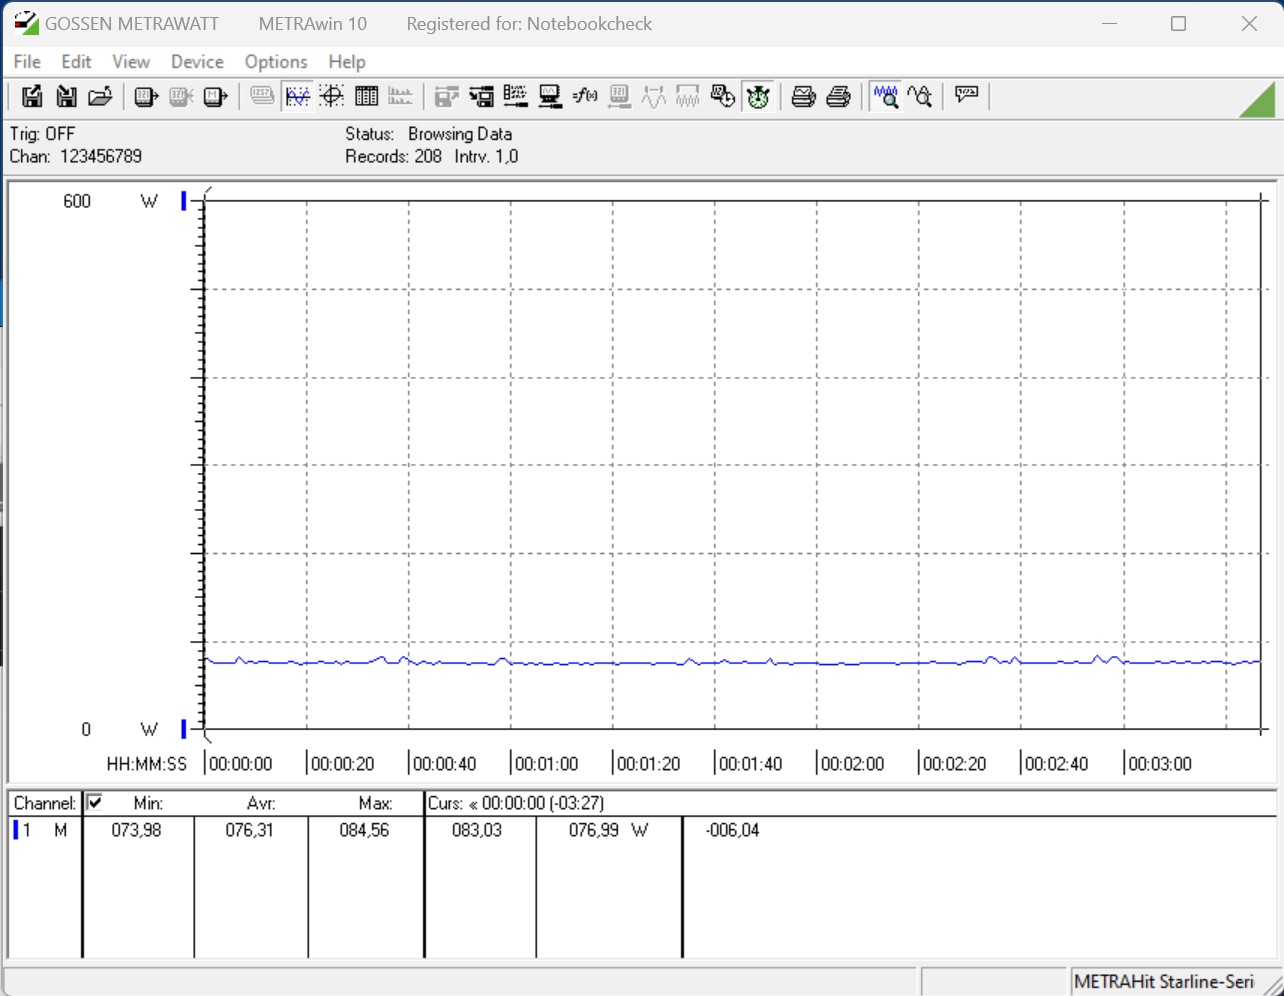
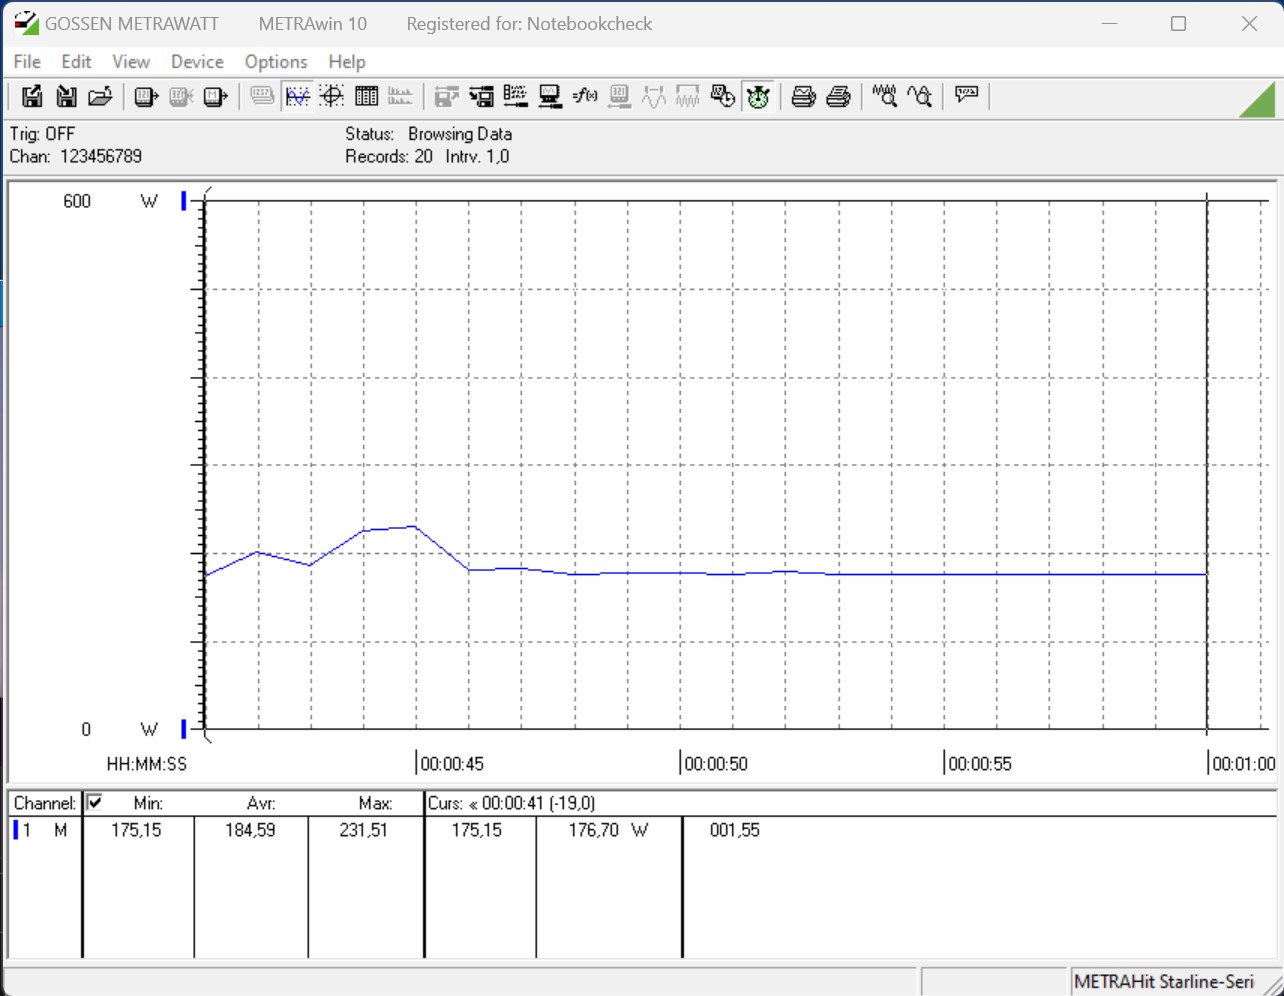
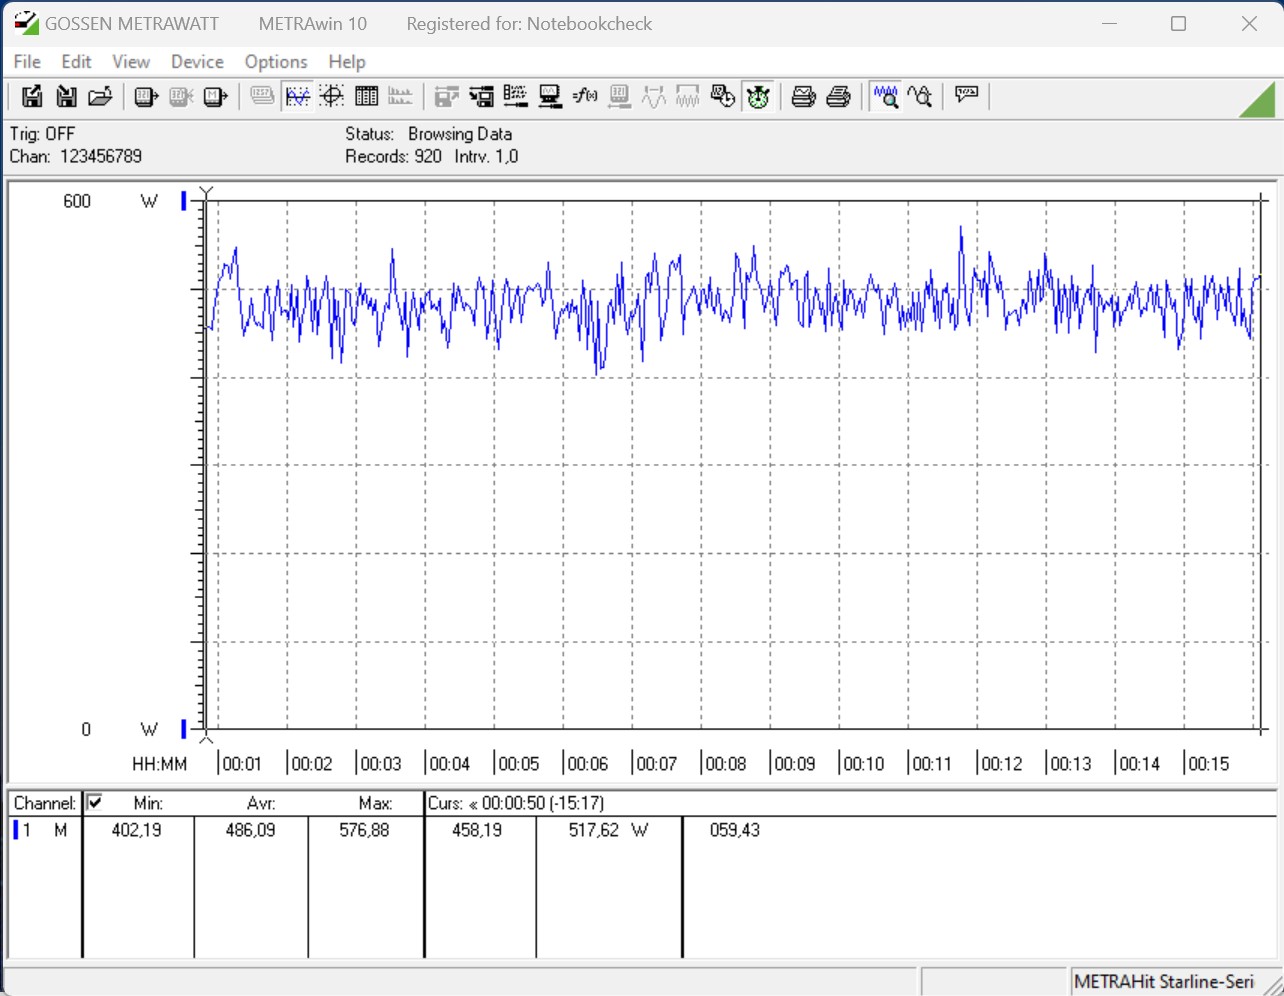
Consumo de energia
De acordo com as especificações técnicas do Intel Core i5-13400F, o consumo de energia é de 65 watts e pode chegar a 148 watts sob carga. Se as restrições do consumo de energia para o processador não forem limitadas na BIOS, os 148 watts estão permanentemente ligados e não são limitados temporalmente pelo valor de orvalho. Todos os testes que fizemos com o processador foram realizados sem nenhuma restrição. Registramos o consumo de energia do sistema de teste com apenas 184 watts no multiteste Cinebench R15. Assim, o Intel Core i5-13400F é consideravelmente mais frugal do que um Intel Core i5-12600K, que requer pouco menos de 206 watts em nosso teste. Observamos um pouco mais com 214 watts no teste de estresse. No entanto, o consumo de energia é agradavelmente baixo.
Devido ao baixo consumo de energia, o Intel Core i5-13400F não precisa de muito resfriamento. Assim, você pode passar com segurança sem AiO e um resfriador de ar de alta qualidade é completamente suficiente para esta CPU.
| Power Consumption / Cinebench R15 Multi (external Monitor) | |
| Intel Core i9-13900K | |
| Intel Core i9-12900K (Idle: 70.5 W) | |
| AMD Ryzen 9 7900X | |
| Intel Core i5-13600K | |
| AMD Ryzen 9 5900X (Idle: 78.1 W) | |
| AMD Ryzen 9 5950X (Idle: 78 W) | |
| AMD Ryzen 5 7600X | |
| Intel Core i5-12600K (Idle: 70.45 W) | |
| Intel Core i5-13400F | |
| AMD Ryzen 5 5600X (Idle: 79.23 W) | |
| Power Consumption / Prime95 V2810 Stress (external Monitor) | |
| Intel Core i9-13900K | |
| Intel Core i5-13600K | |
| AMD Ryzen 9 7900X | |
| Intel Core i9-12900K (Idle: 70.5 W) | |
| Intel Core i5-12600K (Idle: 70.45 W) | |
| AMD Ryzen 9 5950X (Idle: 78 W) | |
| AMD Ryzen 9 5900X (Idle: 78.1 W) | |
| AMD Ryzen 5 7600X | |
| Intel Core i5-13400F | |
| AMD Ryzen 5 5600X (Idle: 79.23 W) | |
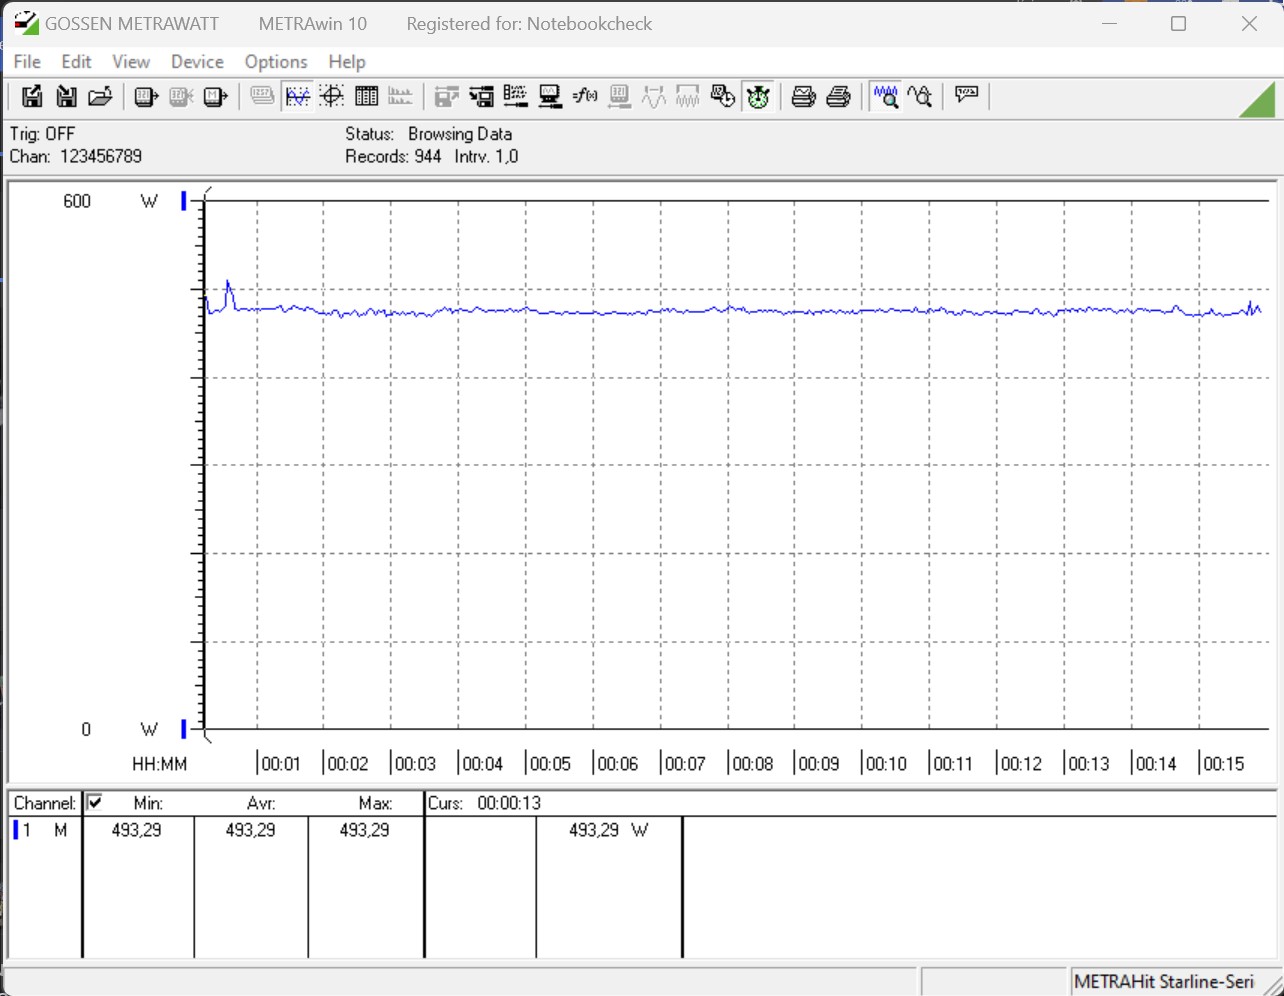
| Power Consumption / The Witcher 3 ultra (external Monitor) | |
| AMD Ryzen 9 7900X | |
| Intel Core i9-13900K | |
| AMD Ryzen 5 7600X | |
| Intel Core i5-13600K | |
| Intel Core i5-13400F | |
| Nvidia GeForce RTX 3090 Founders Edition (Idle: 91.1 W) | |
| Intel Core i9-12900K (Idle: 70.5 W) | |
| AMD Ryzen 9 5950X (Idle: 78 W) | |
| AMD Ryzen 9 5900X (Idle: 78.1 W) | |
| AMD Ryzen 5 5600X (Idle: 79.23 W) | |
| Intel Core i5-12600K (Idle: 70.45 W) | |
* ... menor é melhor
Power Consumption With External Monitor
Pro
Contra
Conclusão - Econômico, rápido e fácil de esfriar


A Intel já enviou um venerável sucessor da geração do Alder Lake para a corrida com Raptor Lake. Os modelos de gama média e de nível básico, na mesma base, estão agora chegando gradualmente. No entanto, é preciso olhar mais de perto e prestar atenção aos passos da CPU, pois nem sempre é uma CPU Raptor Lake. Em nosso caso, temos o Intel Core i5-13400F em C0-stepping, o que indica que é uma CPU Alder Lake no núcleo. Somente o B0-stepping indica uma CPU nativa Raptor-Lake. Ambas as versões devem estar disponíveis, e supomos que elas tenham o mesmo desempenho.
Enquanto isso, a Intel oferece um frugal 10-core com o Intel Core i5-13400F, que também tem 4 E-cores além dos P-cores. Com até 148 watts, o modelo é relativamente frugal sob carga total. Além disso, as temperaturas são fáceis de manusear e não requerem refrigeração complexa e cara. No teste, o Intel Core i5-13400F pode acompanhar muito bem com um Intel Core i5-12600K, a partida em termos de eficiência energética é claramente a favor do modelo mais frugal. Os processadores Zen 4 da AMD não podem ser mantidos em dia. Aqui, o núcleo 10 nativo de nosso teste está mais bem posicionado com um AMD Ryzen 7 5800X, que também tem um total de 16 roscas.
O Intel Core i5-13400F oferece um desempenho sólido para uso diário e também domina os jogos mais recentes. Devido ao baixo TDP, o processador frugal também pode ser resfriado em casos pequenos sem nenhum problema.
Uma placa-mãe com um chipset série 600 ainda pode ser usada para a unidade base. Isto não coloca muita tensão na carteira ao atualizar. No entanto, é preciso considerar que não haverá mais uma nova geração Intel para o soquete 1700. O atual moinho de rumores diz que o soquete 1851 será introduzido com Meteor Lake. Isto significa que uma nova placa-mãe será obrigatória novamente.
Preços e disponibilidade
O Intel Core i5-13400F está atualmente disponível por 227 Euros (~$247) em Notebooksbilliger.de. Por 260 Euross (~$283) você pode comprá-lo com uma unidade gráfica integrada, também em Notebooksbilliger.de.
