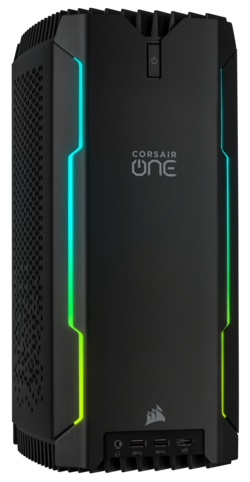
Corsair One i300 PC desktop domestica Core i9-12900K e RTX 3080 Ti em um estojo de 12 litros

Corsair tem vendido a série One desde 2018, embalando hardware de jogos atuais em uma caixa compacta que inclui refrigeração a água. Nós já vimos noCorsair One i160que este sistema funciona.
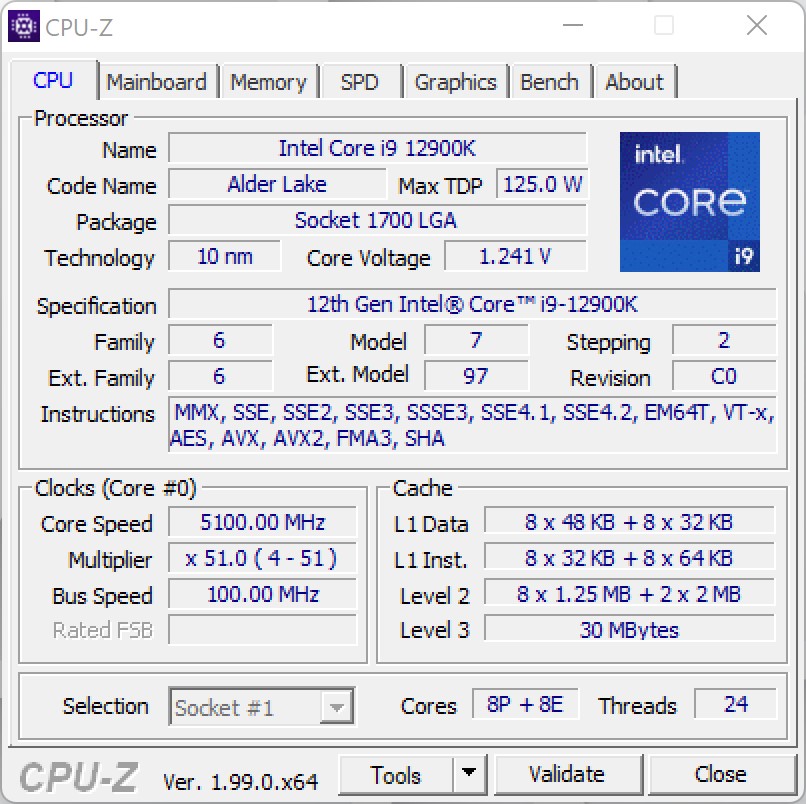
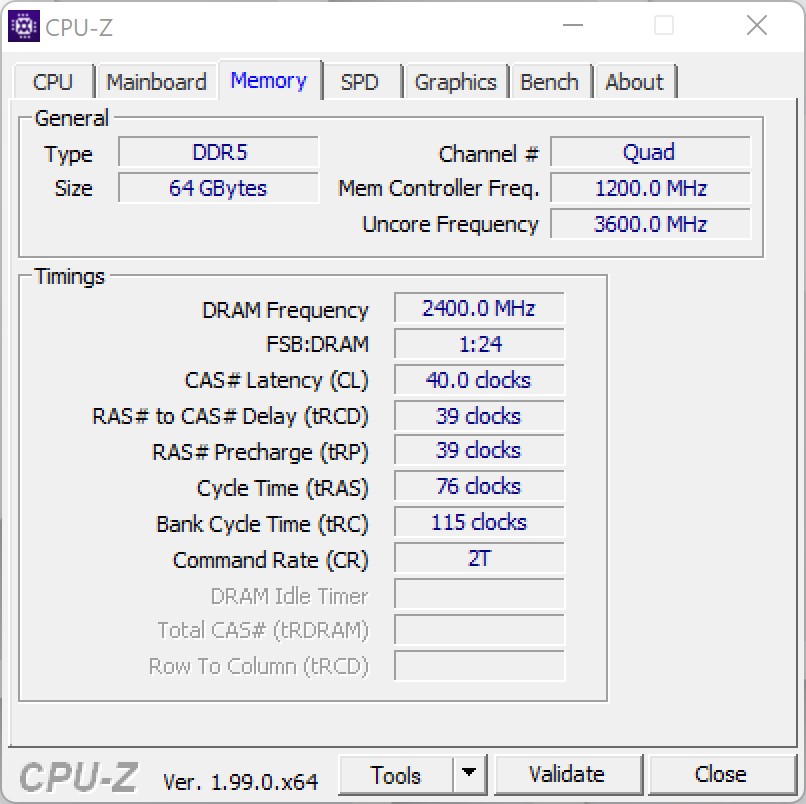
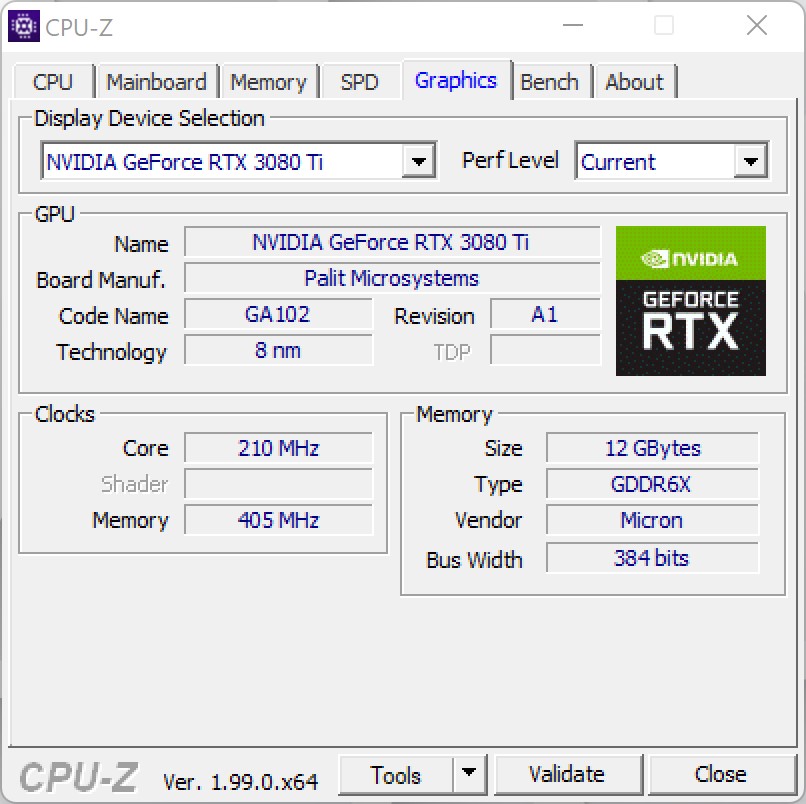
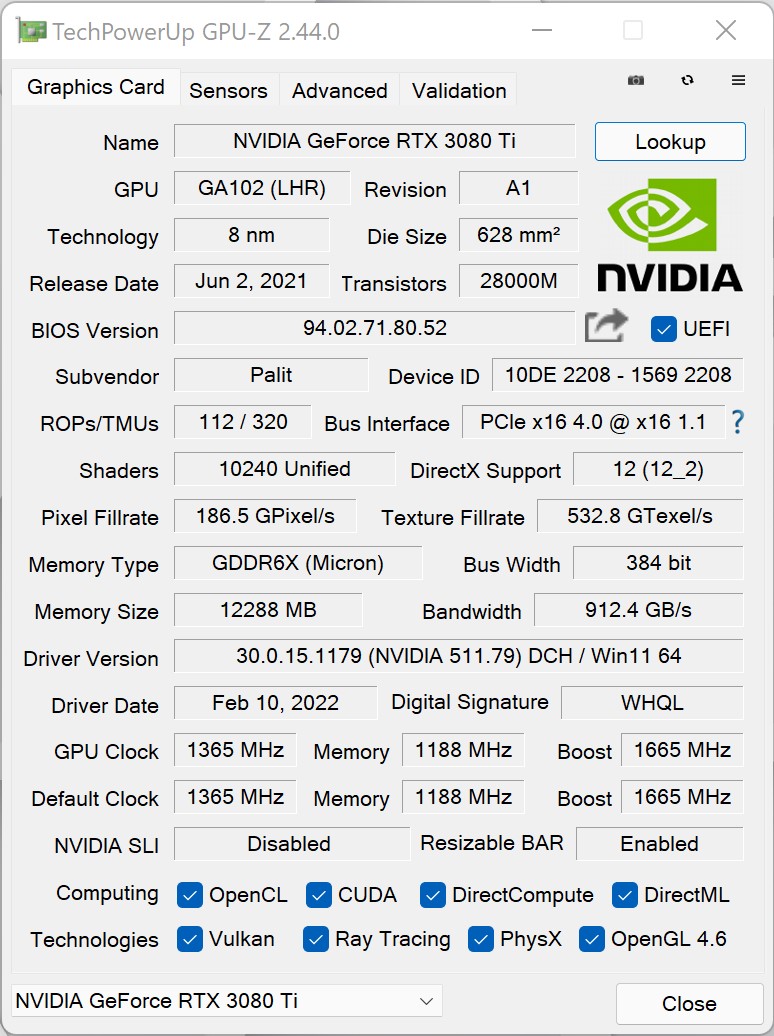
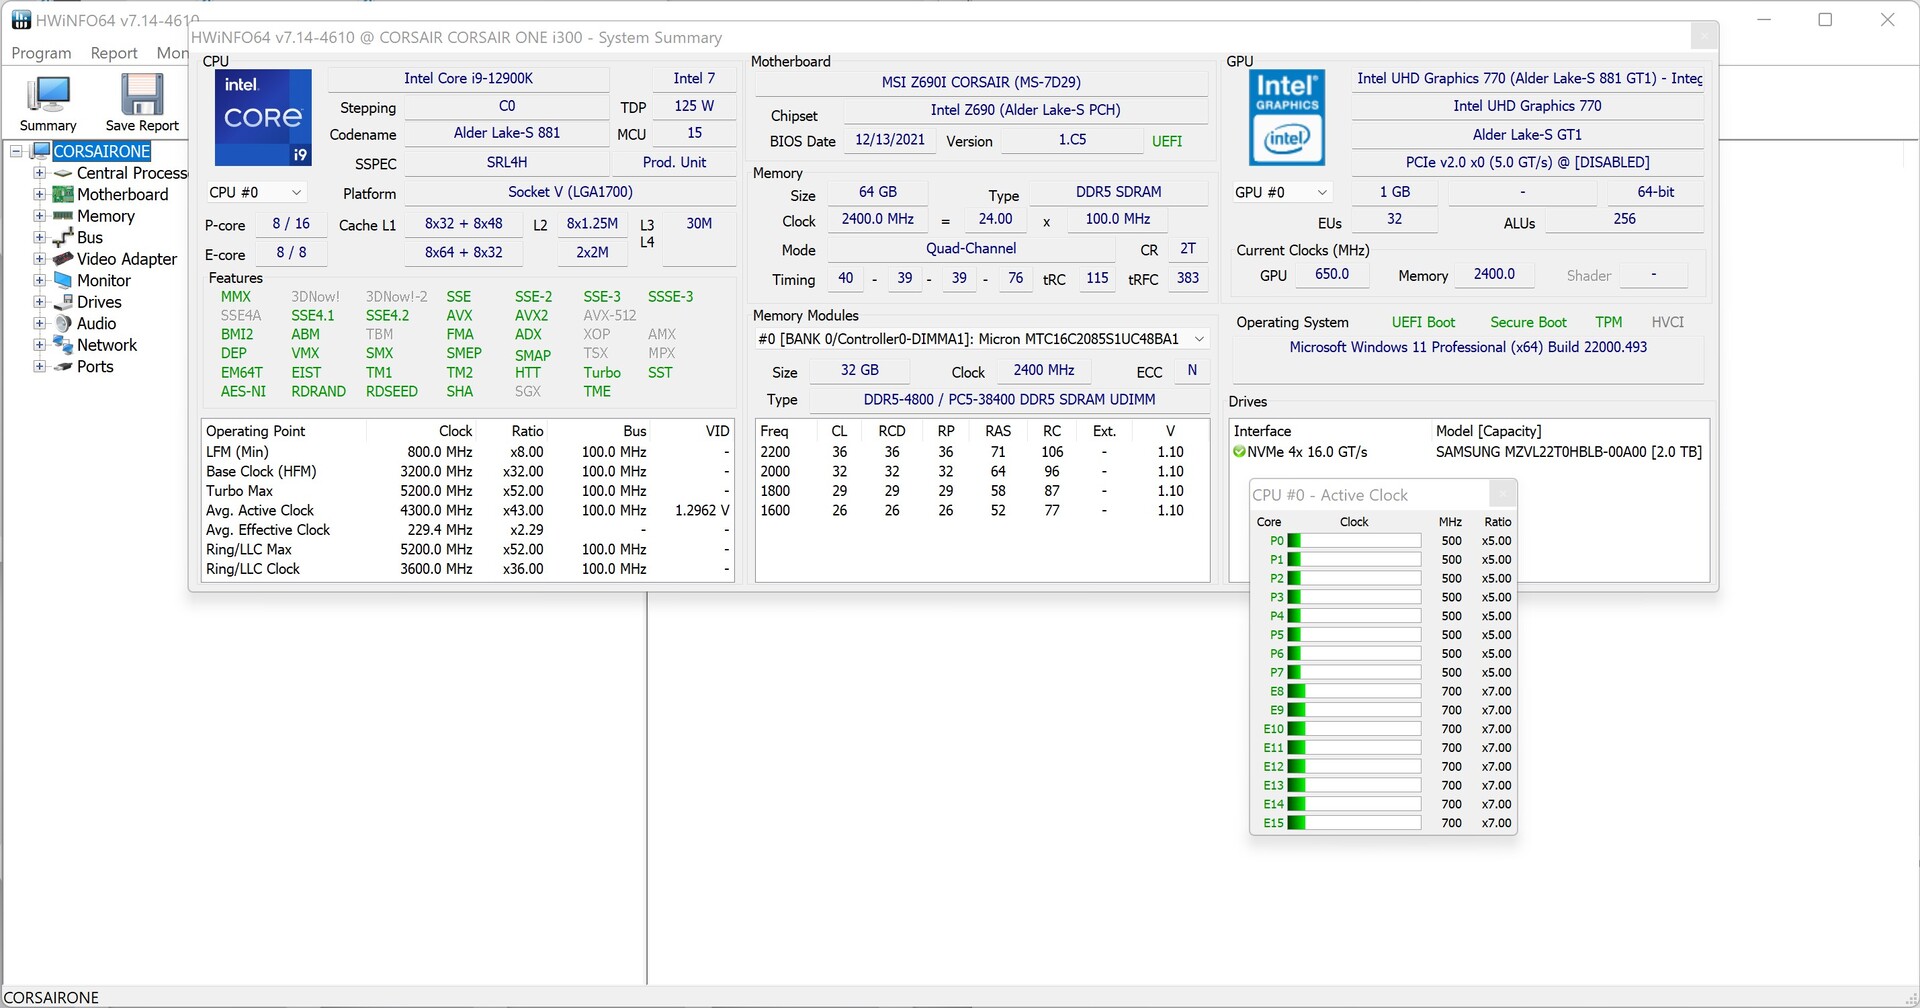
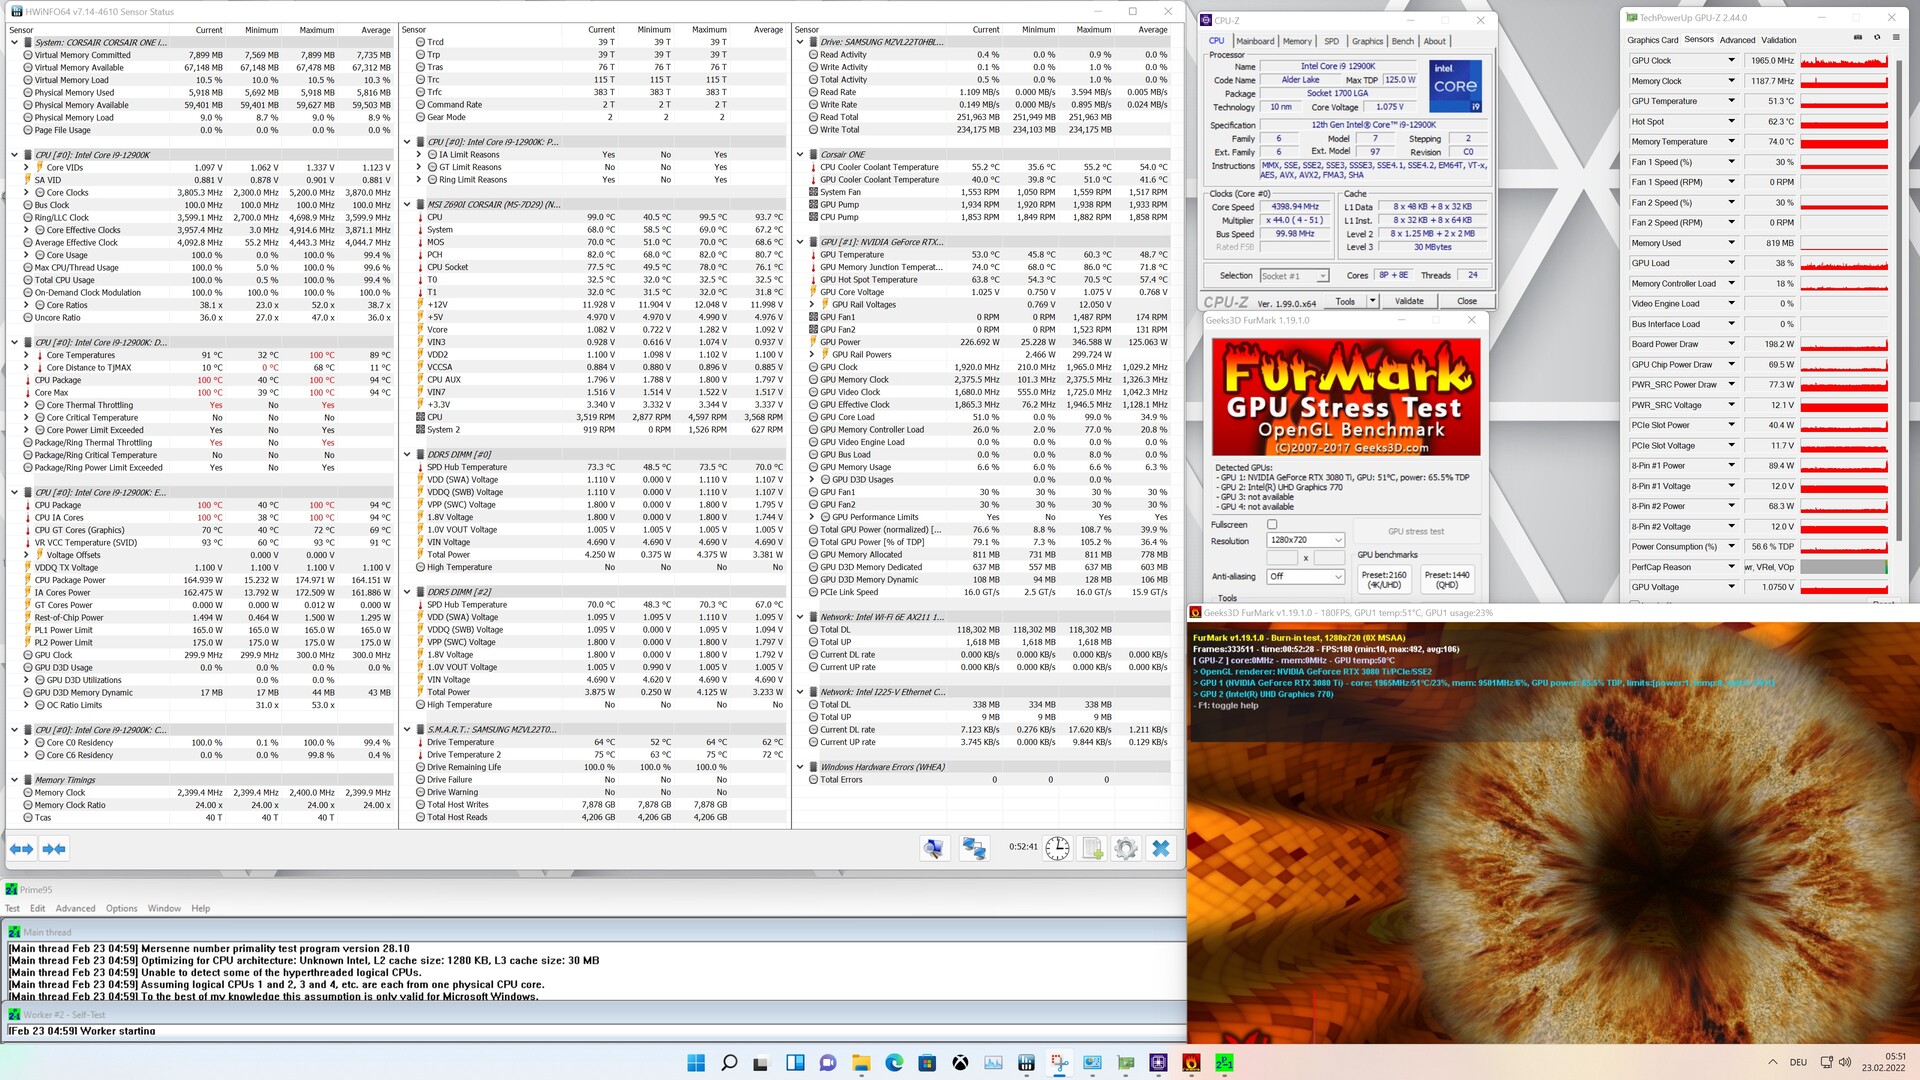
No CES deste ano, o Corsair anunciou uma atualização para o Corsair One que está equipado com a atual série Alder Lake, que agora recuperou a coroa de desempenho como a CPU de jogo mais rápida. Além da Intel Core i9-12900Kcorsair também inclui umNvidia GeForce RTX 3080 Ti. Ambos os componentes fornecem uma excelente base para jogos 4K sem compromissos. Após nossos testes iniciais, também pudemos confirmar isto, embora o fabricante ainda mantenha o Intel Core i9-12900K um pouco à trela. Mais sobre isto mais tarde no teste. Em termos de componentes potentes, existem também amplos 64 GB de memória de trabalho e um SSD de 2-TB rápido como um raio, incluindo a versão profissional do Windows 11.
Corsair pede 5100 euros (~$5724) para o sistema como equipado em nosso teste. Se você estiver satisfeito com 32 GB de memória de trabalho e umNvidia GeForce RTX 3080você tem que pagar exatamente 1000 euros (~$1122) a menos.
Caso
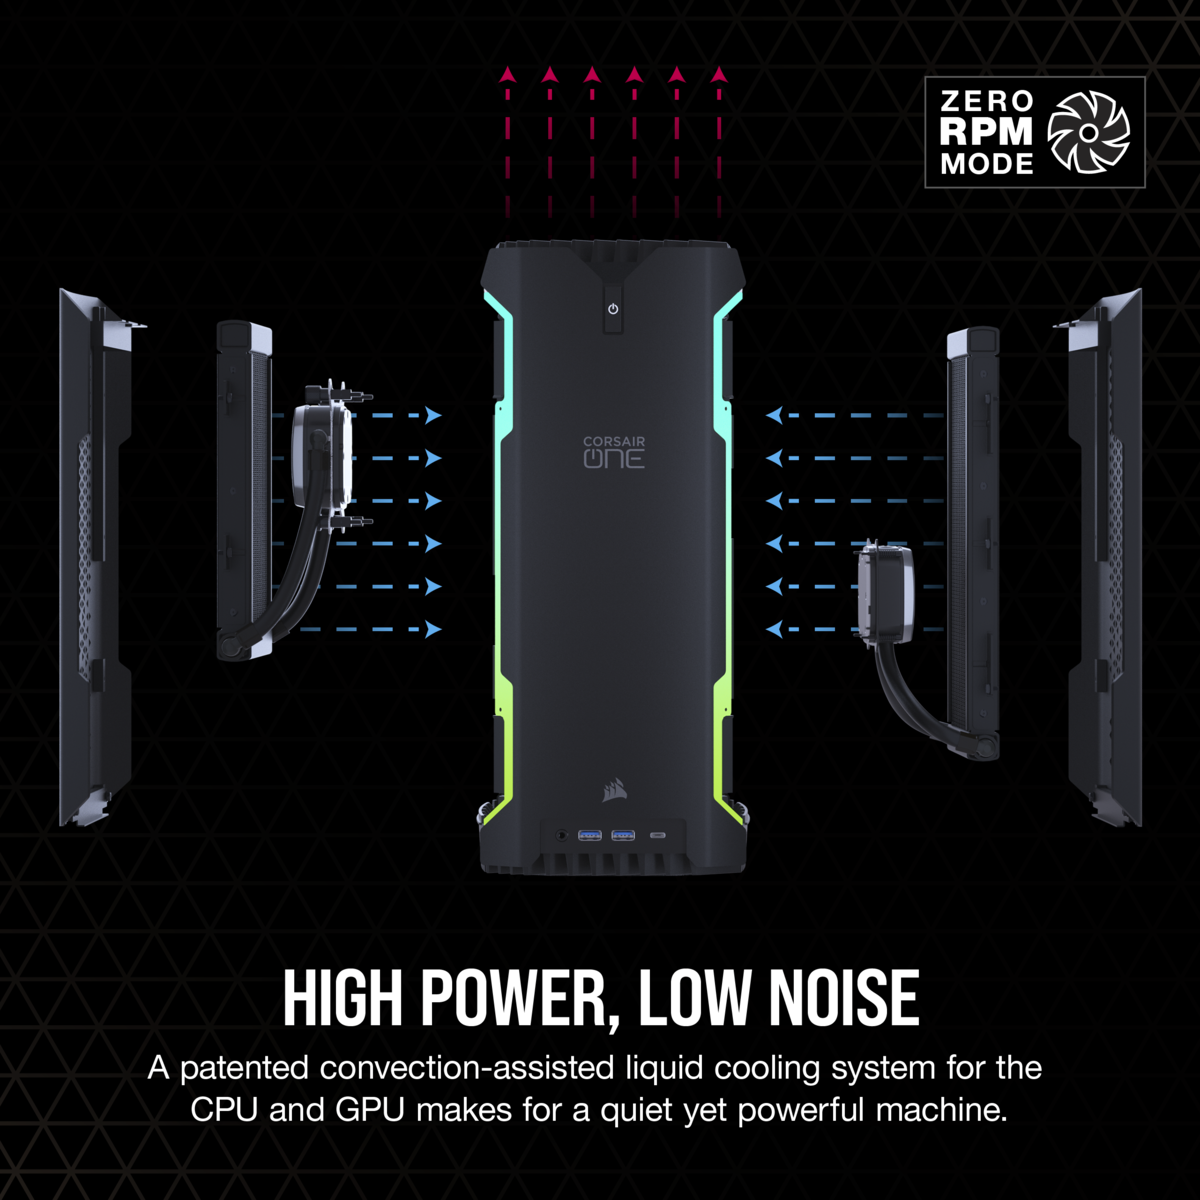
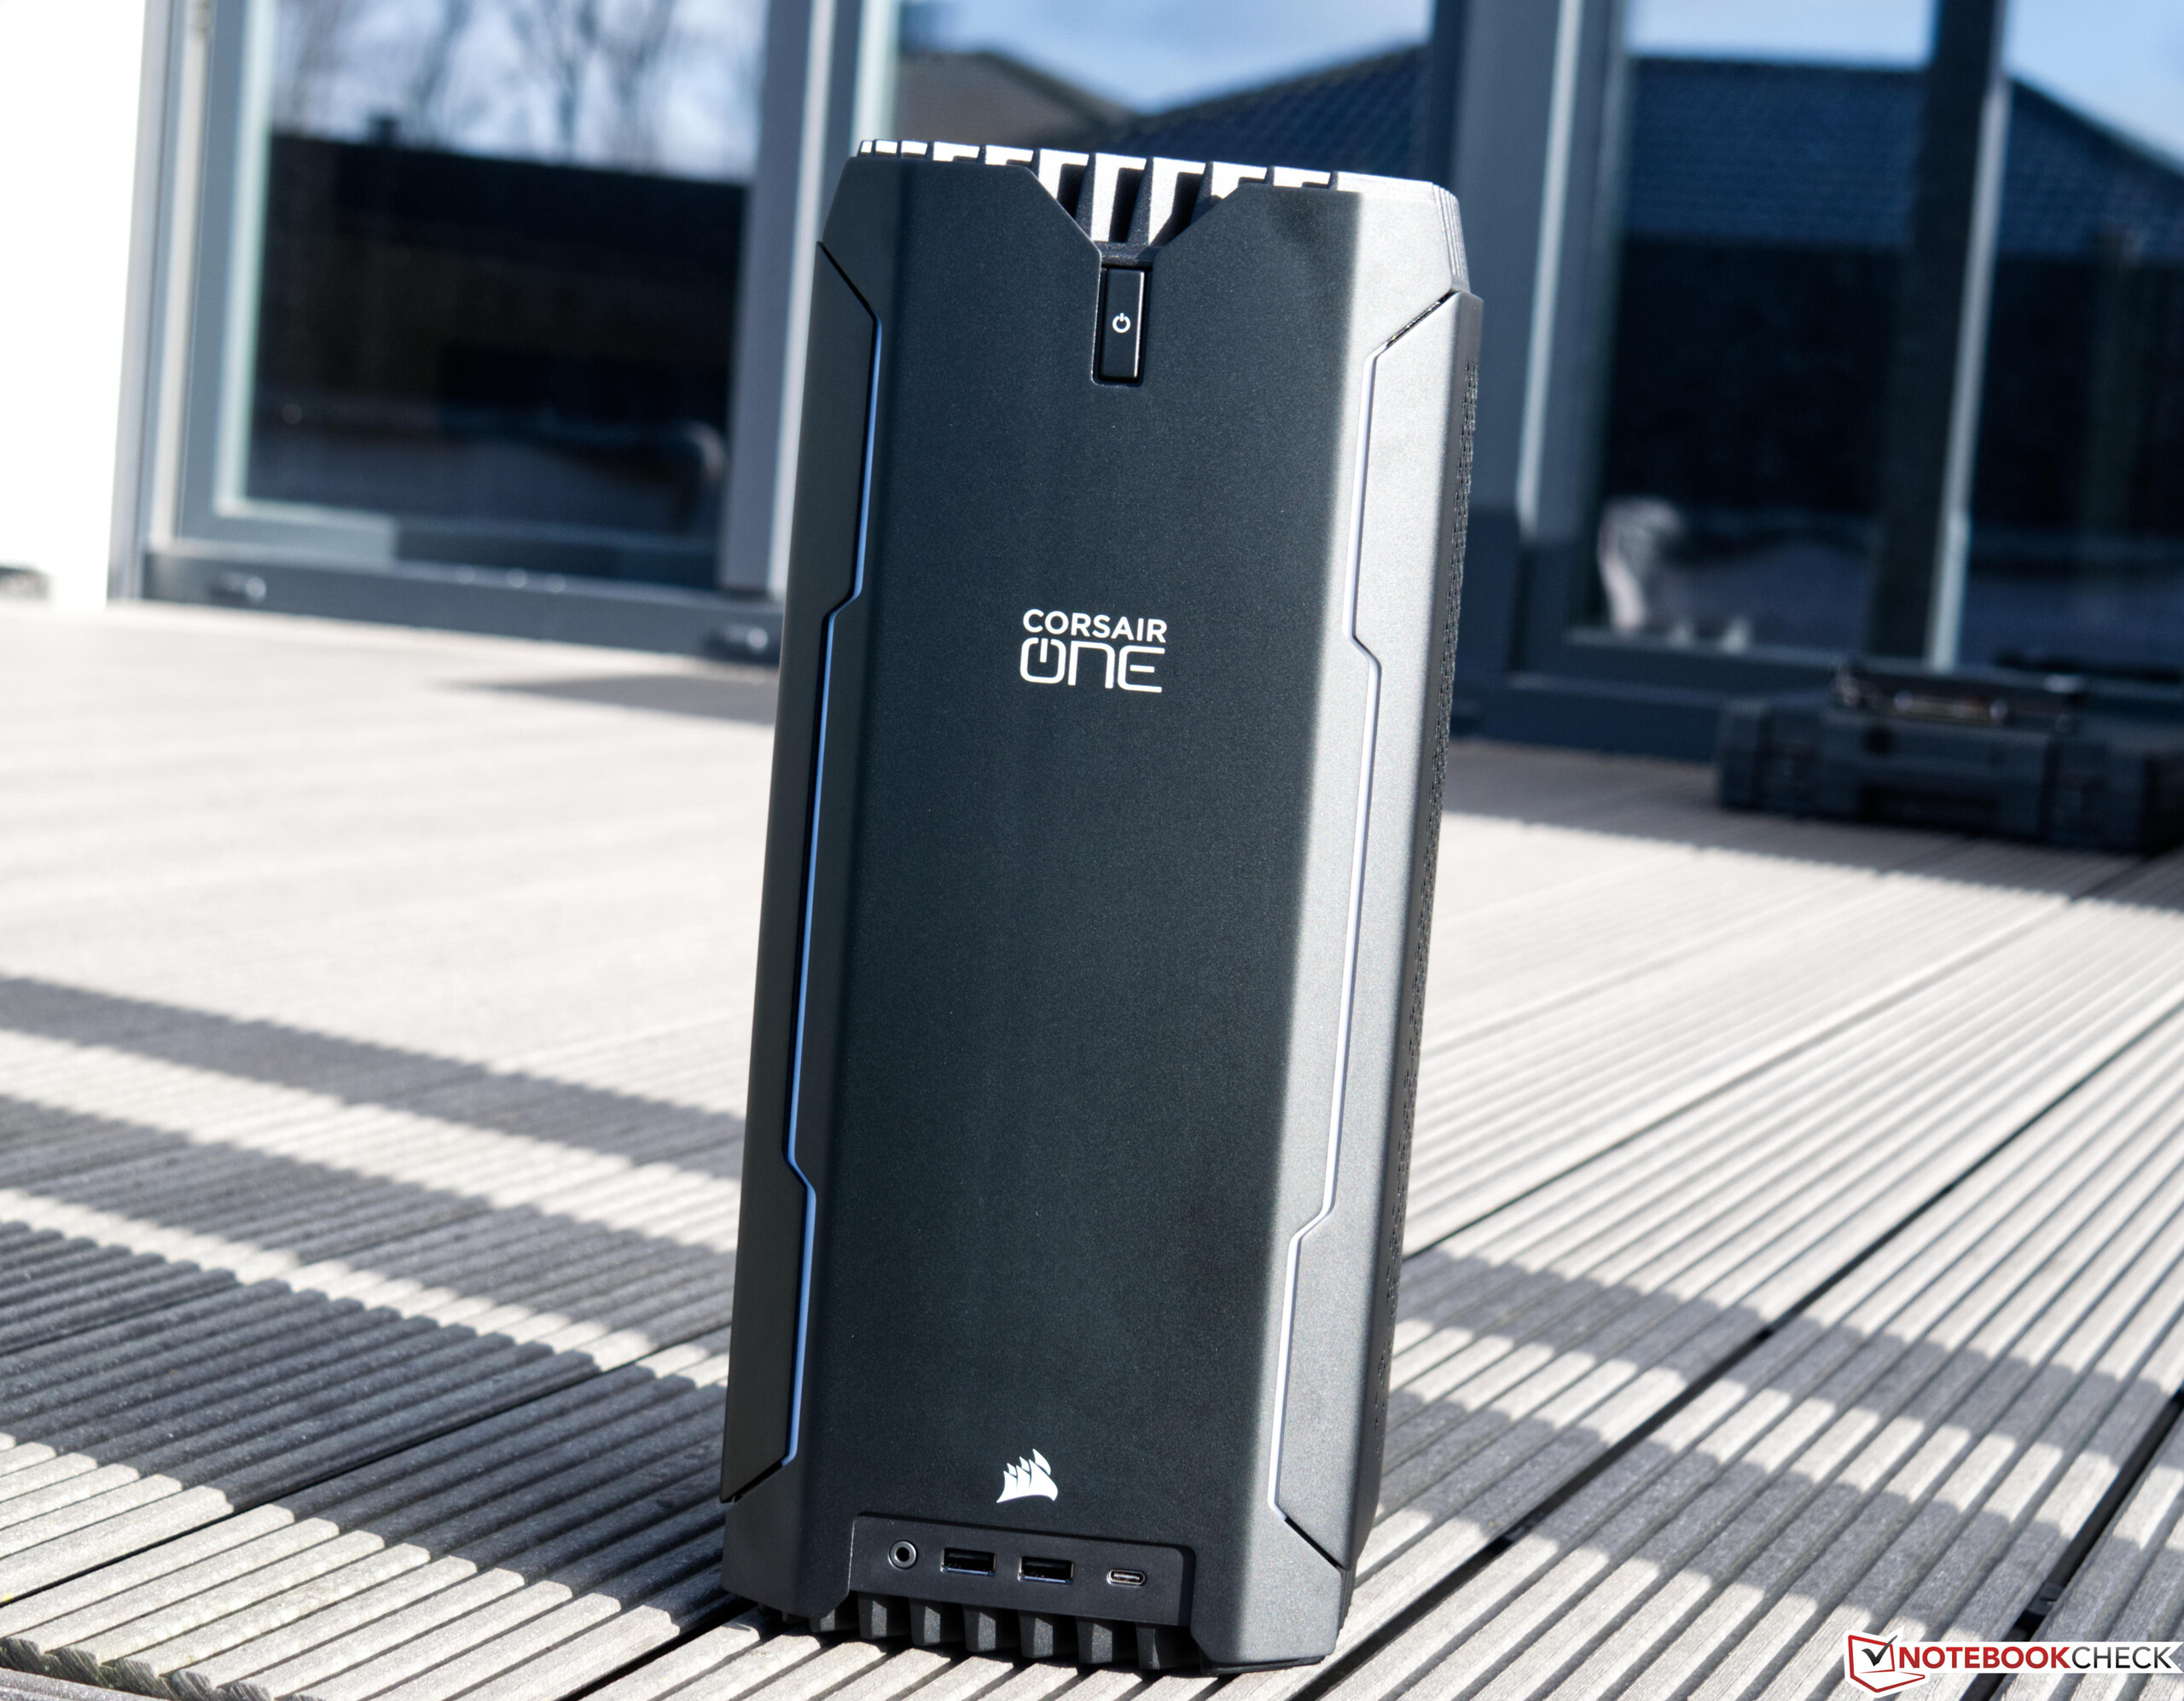
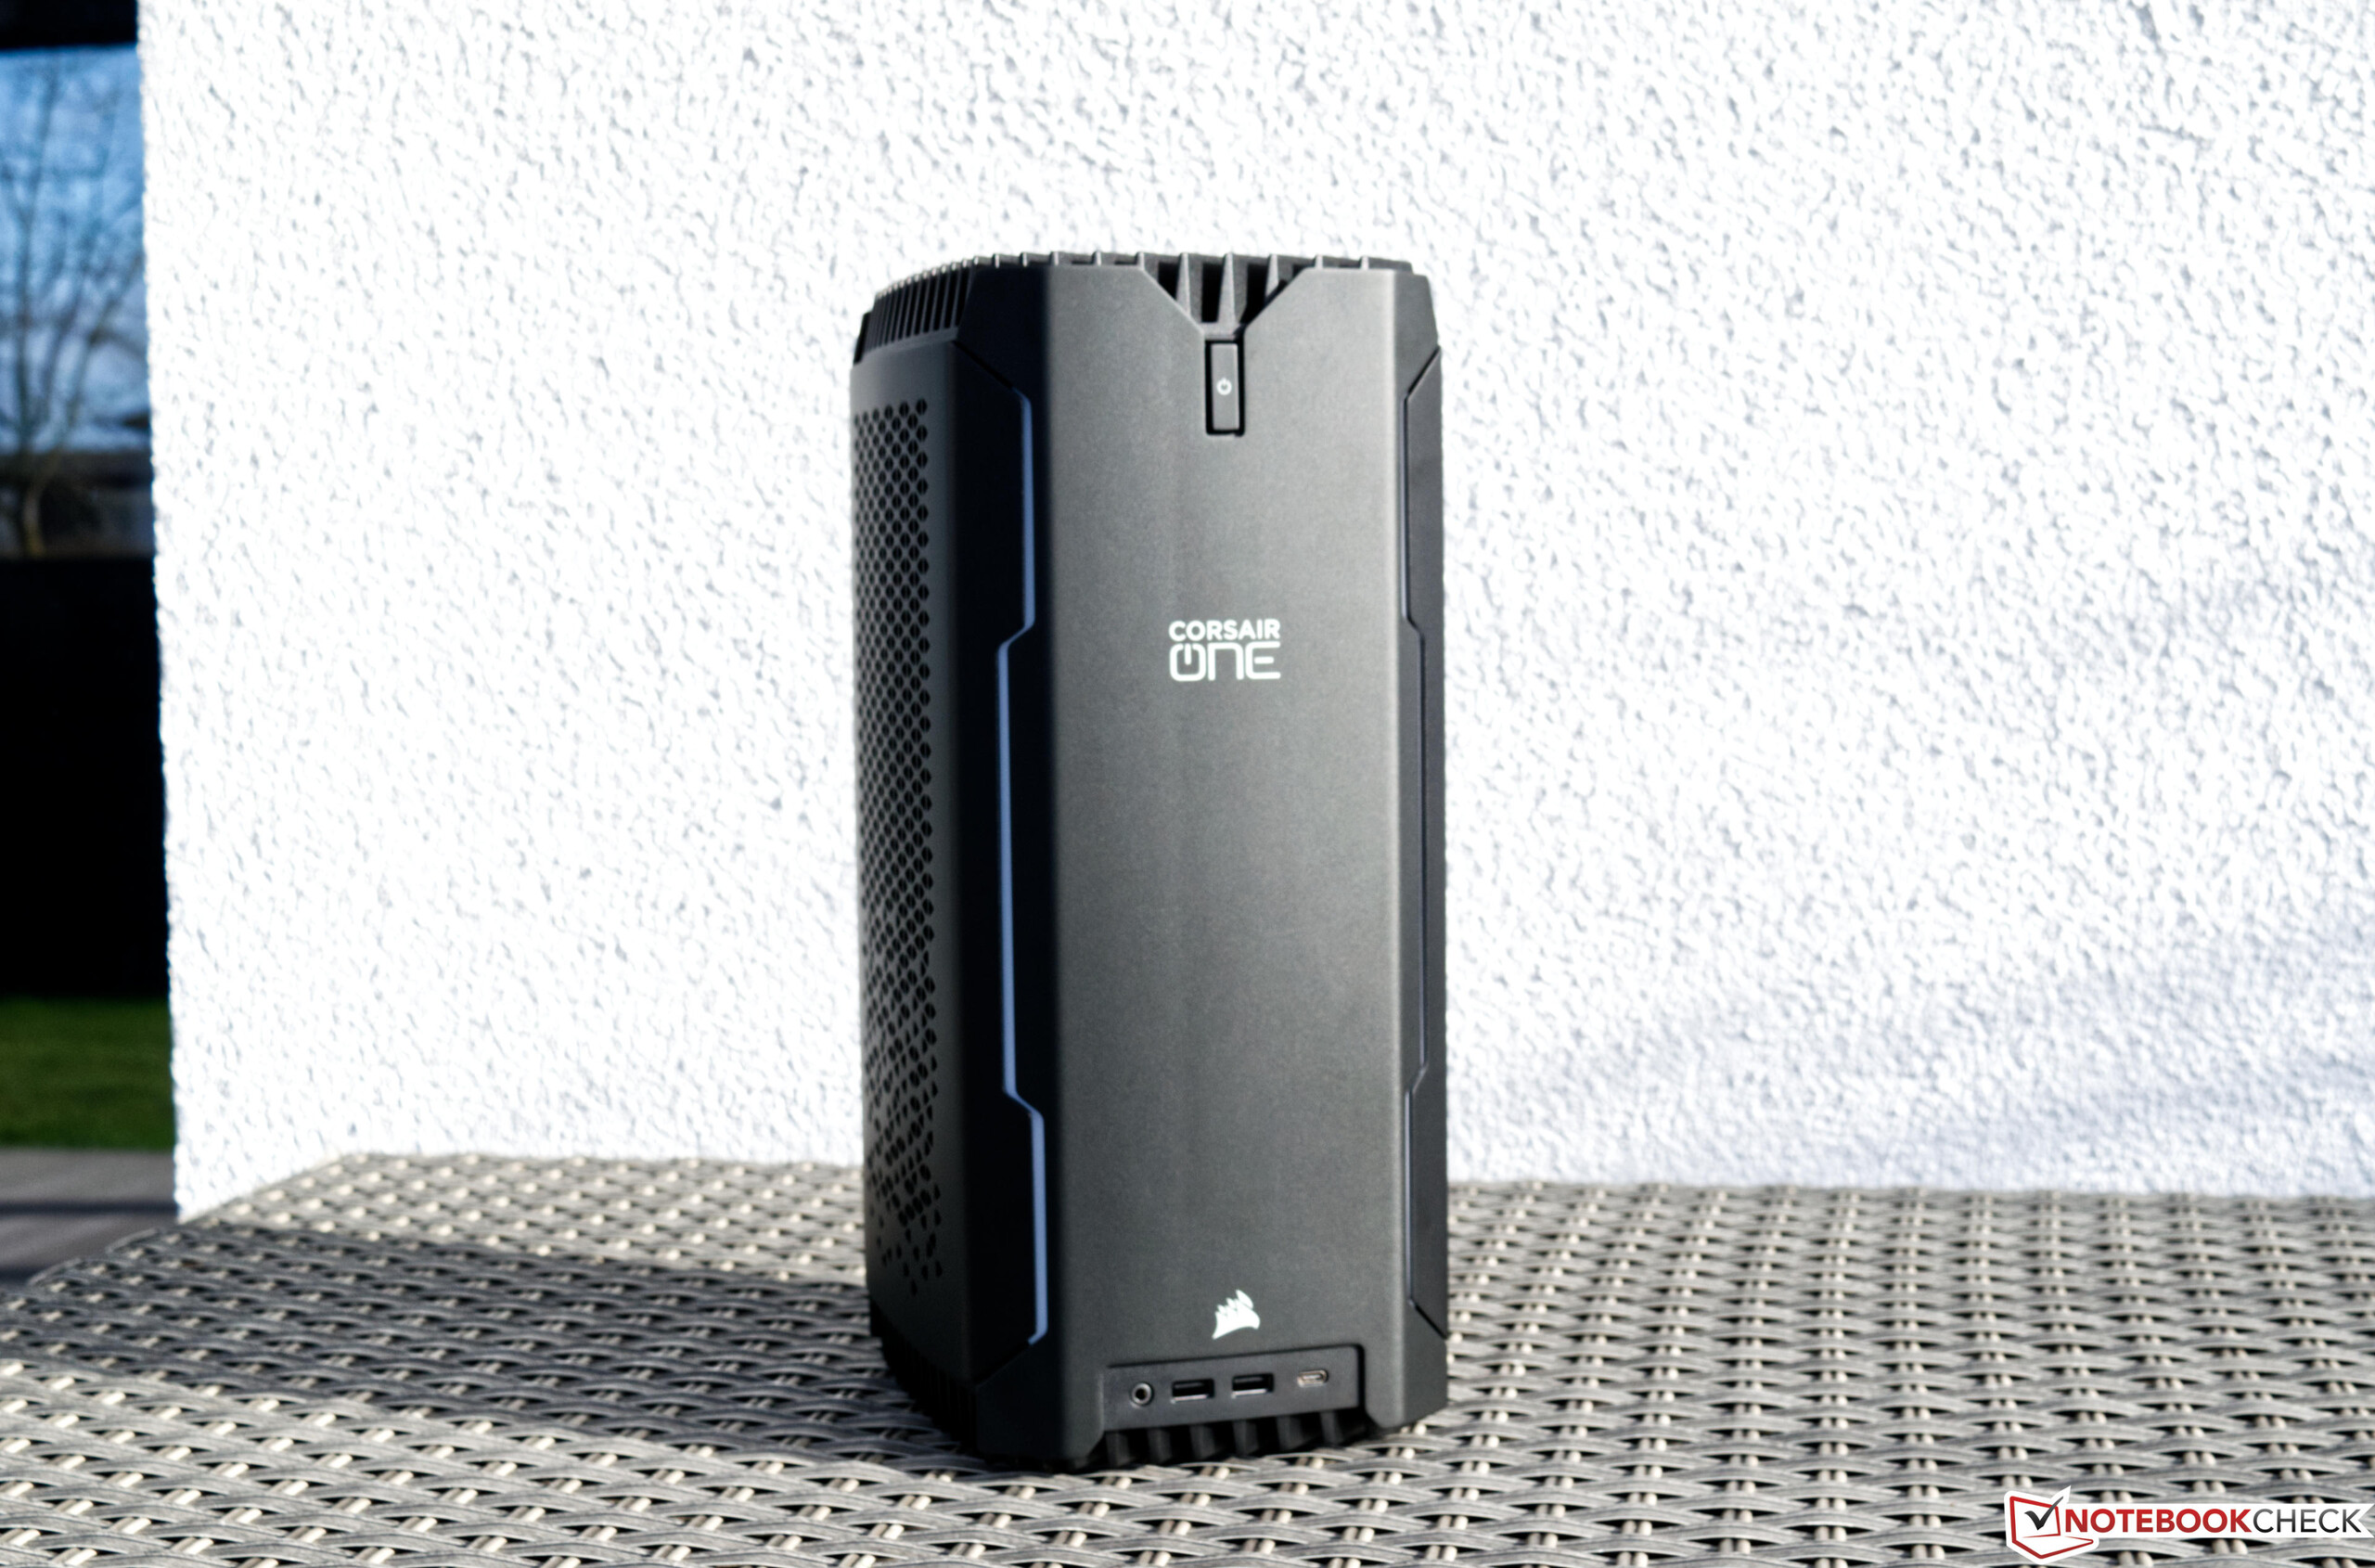
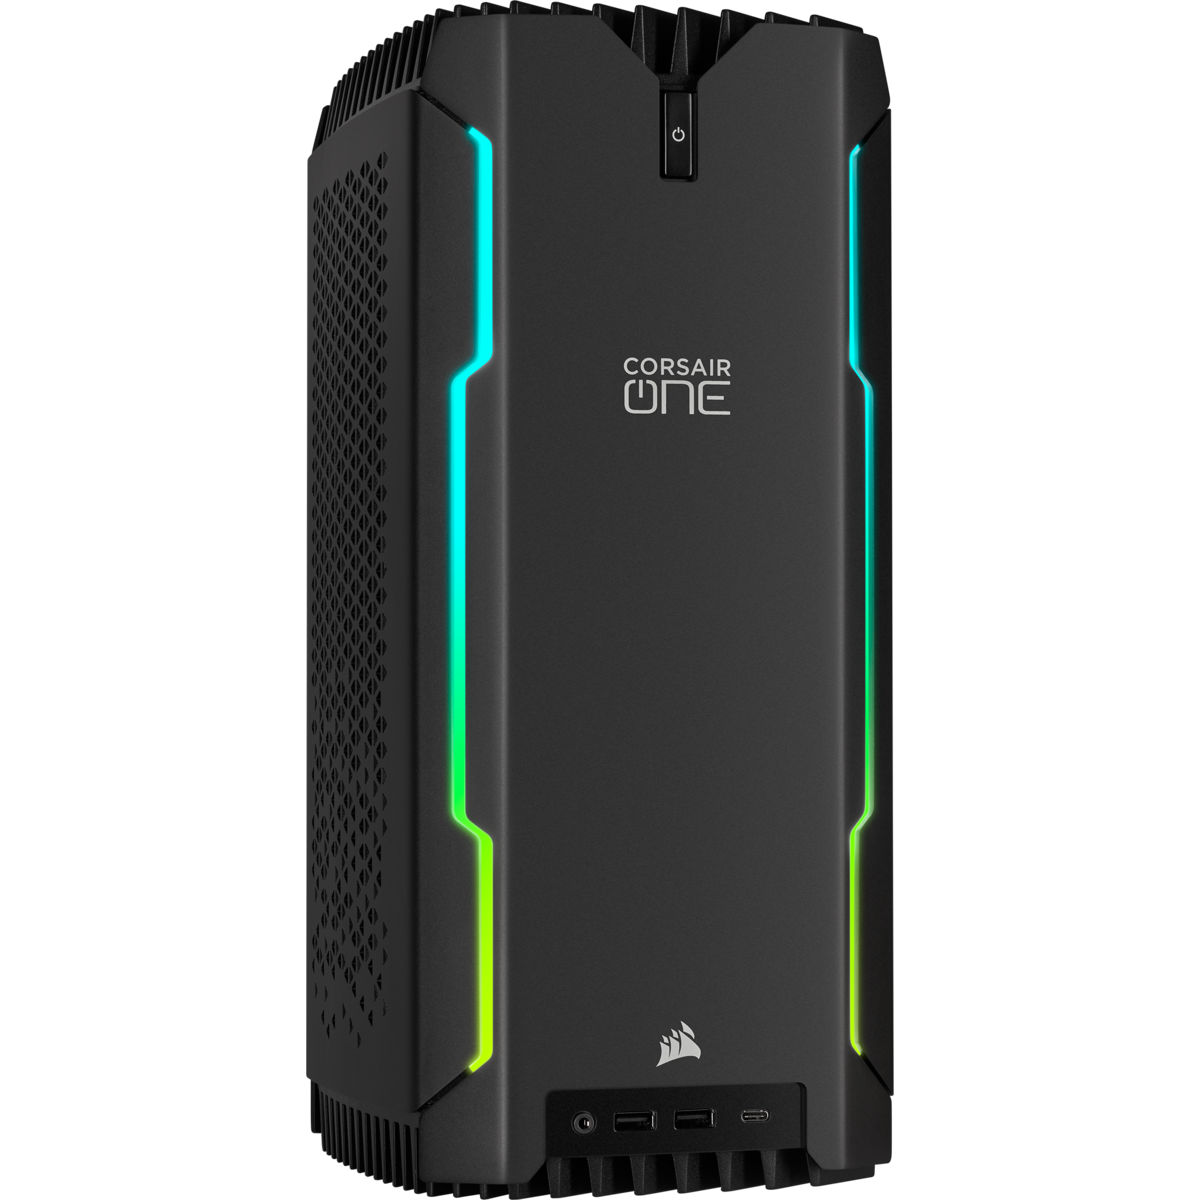
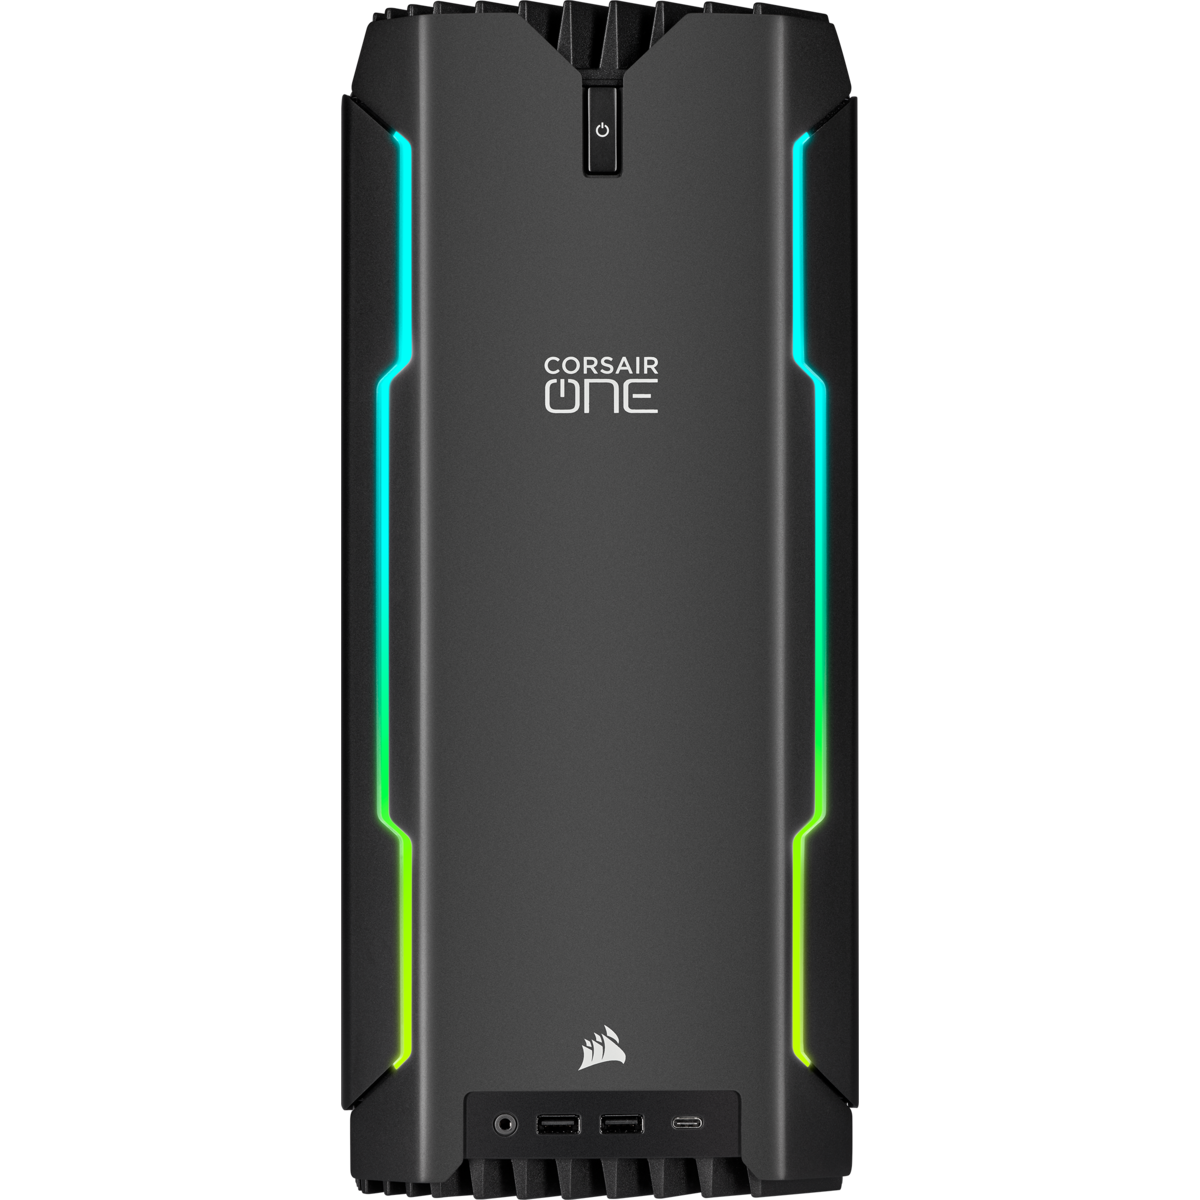
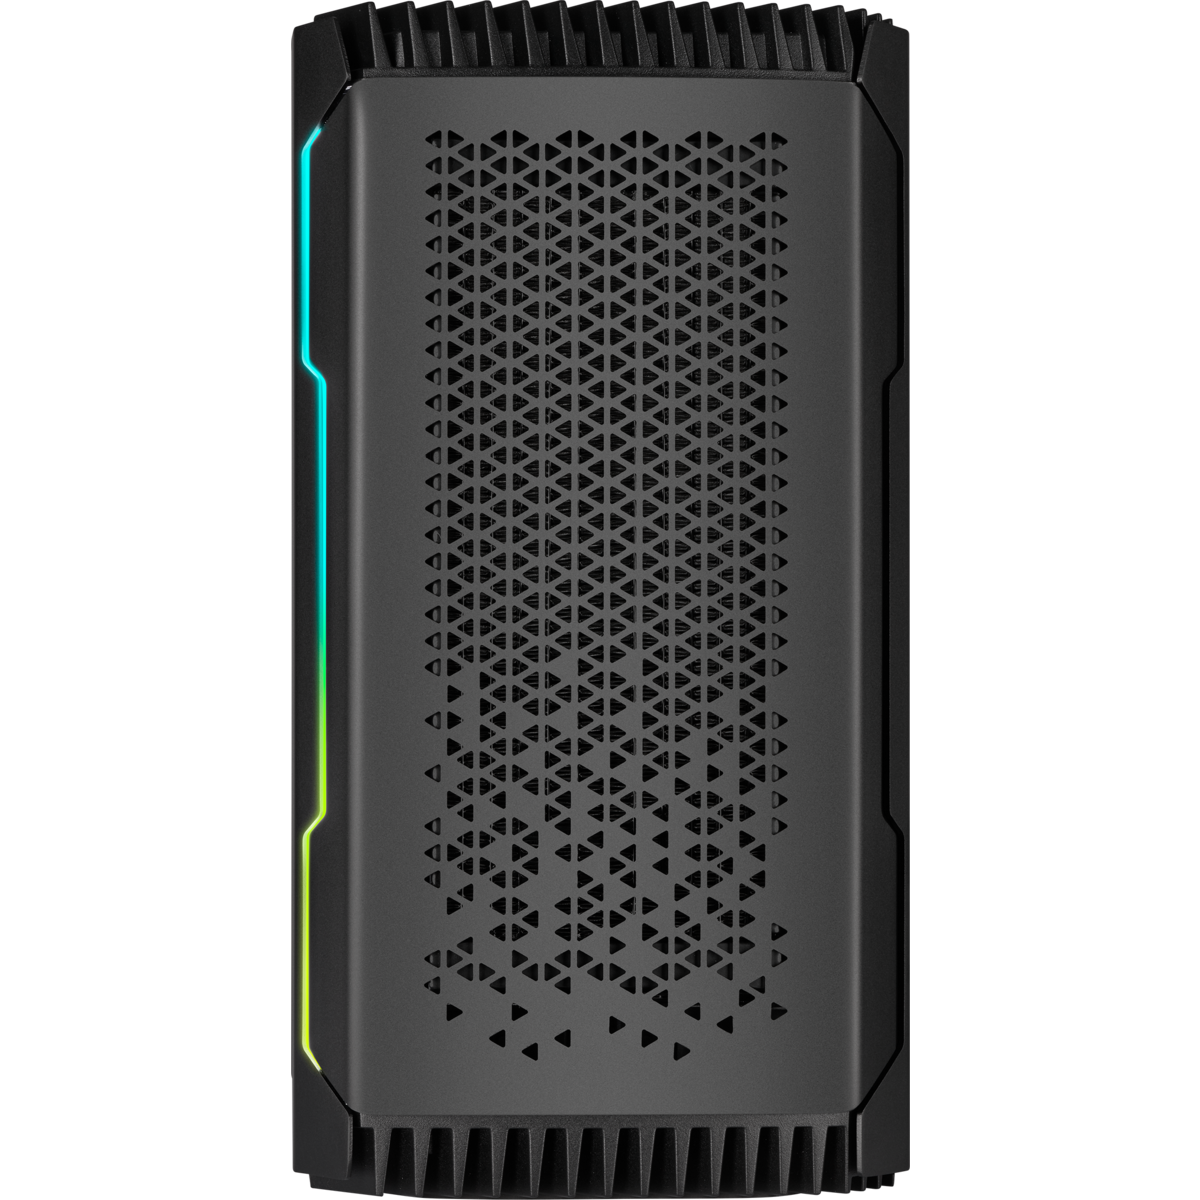
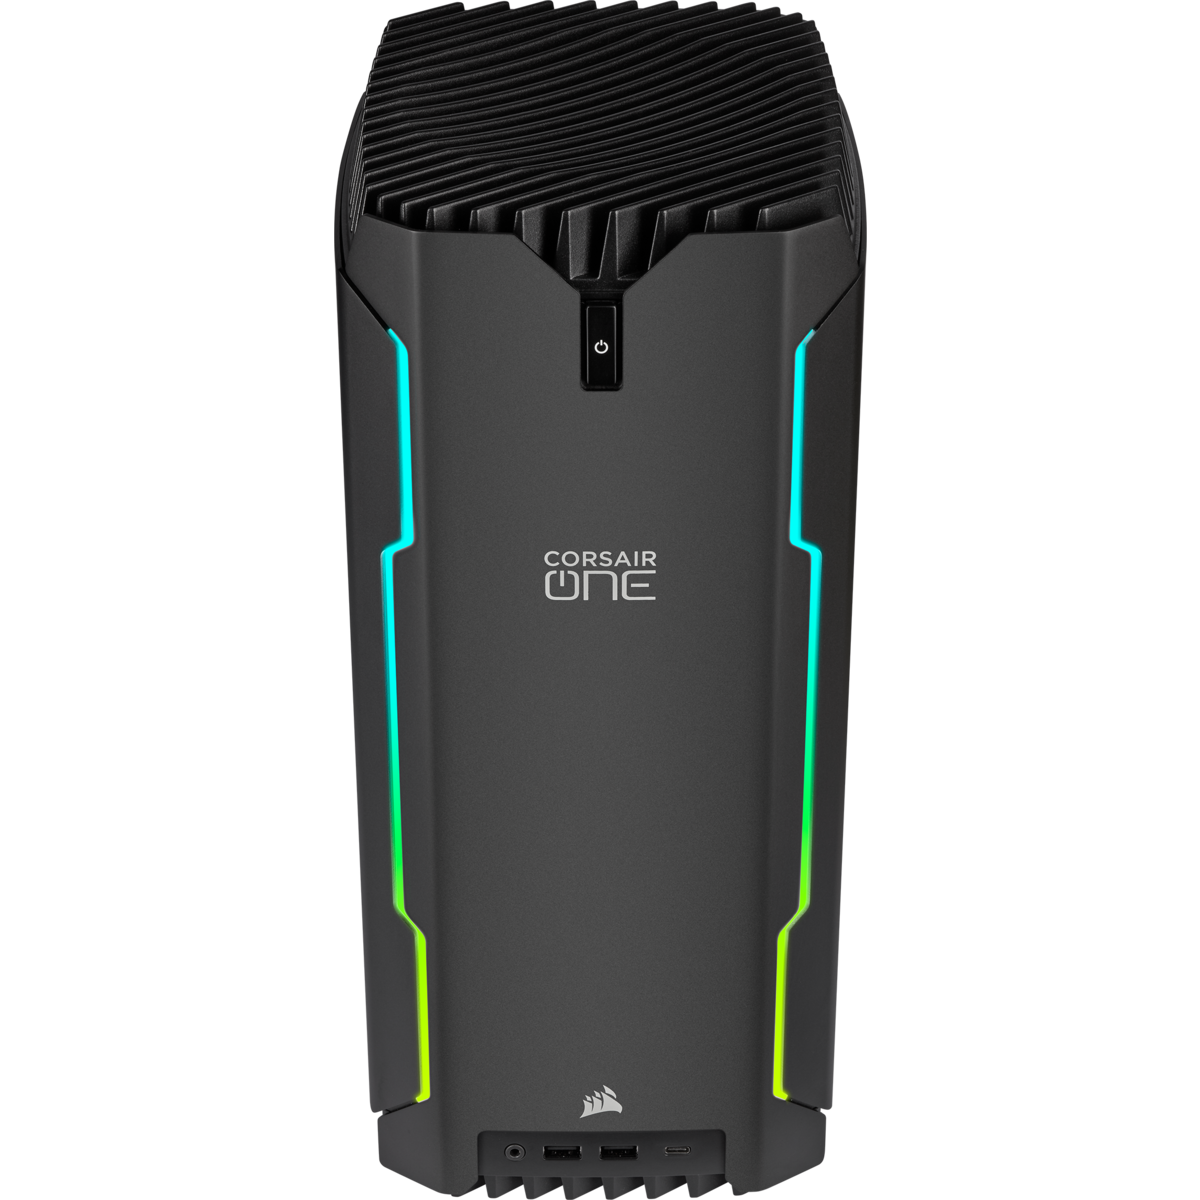
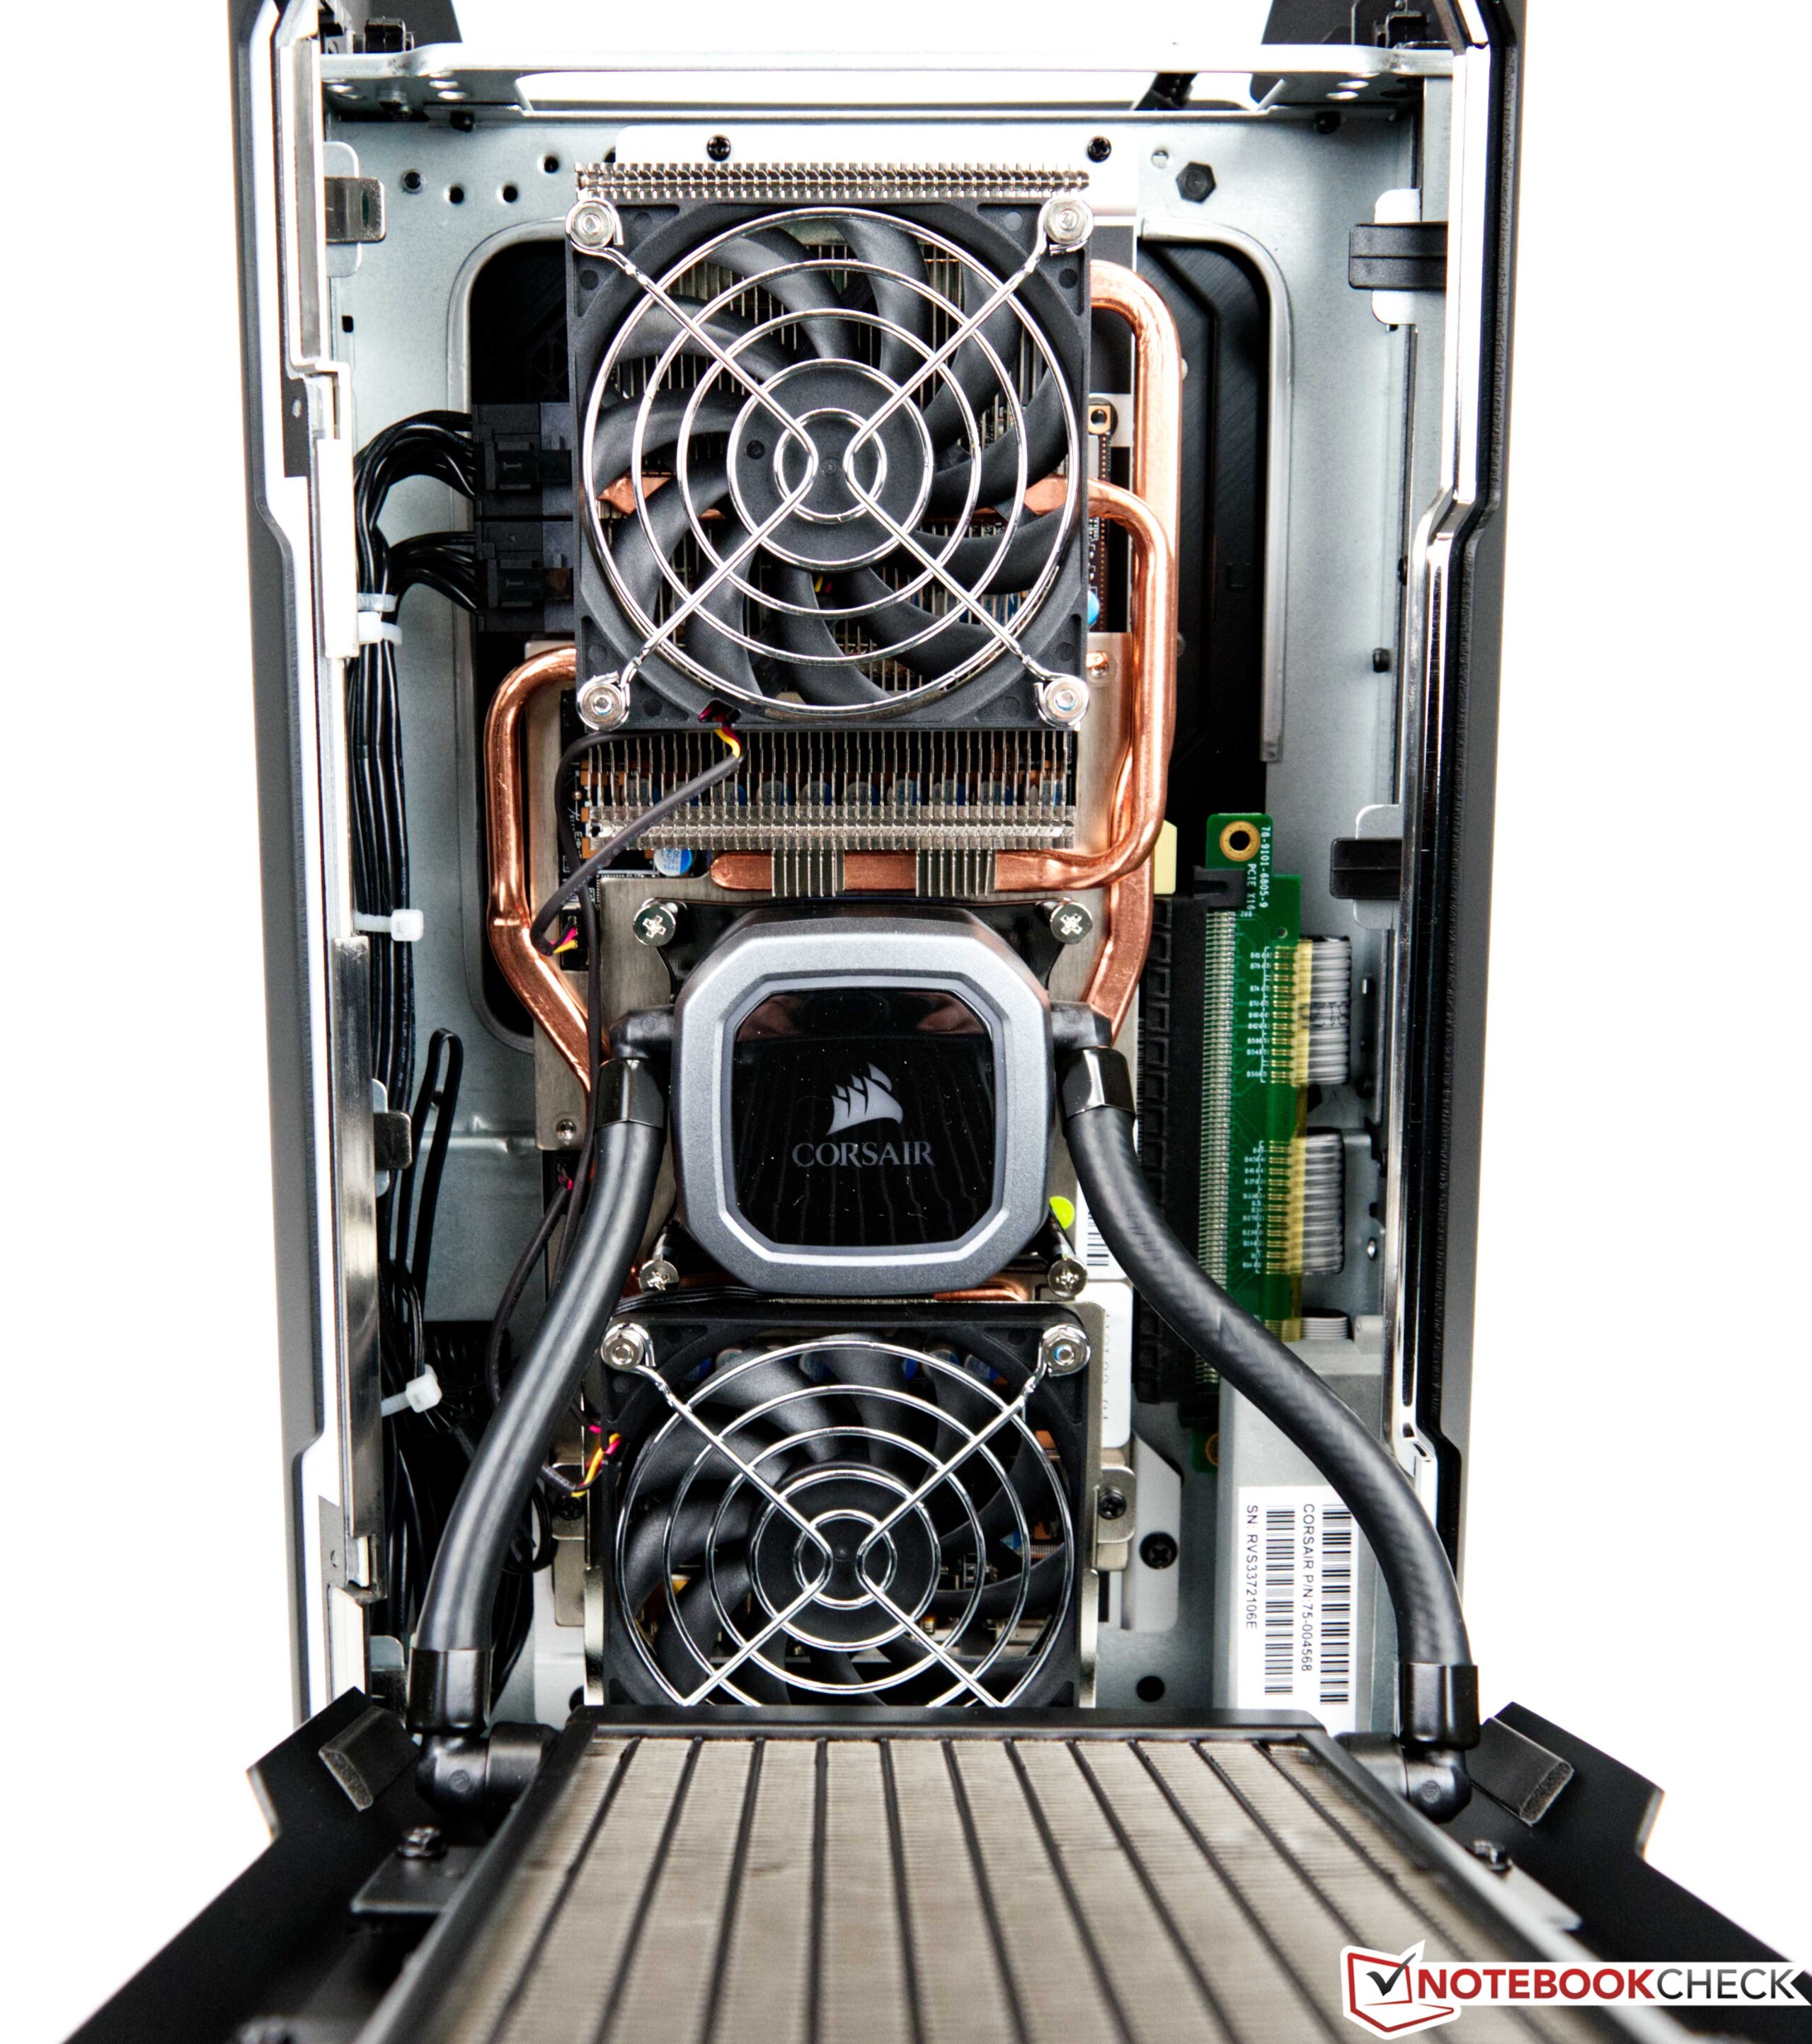
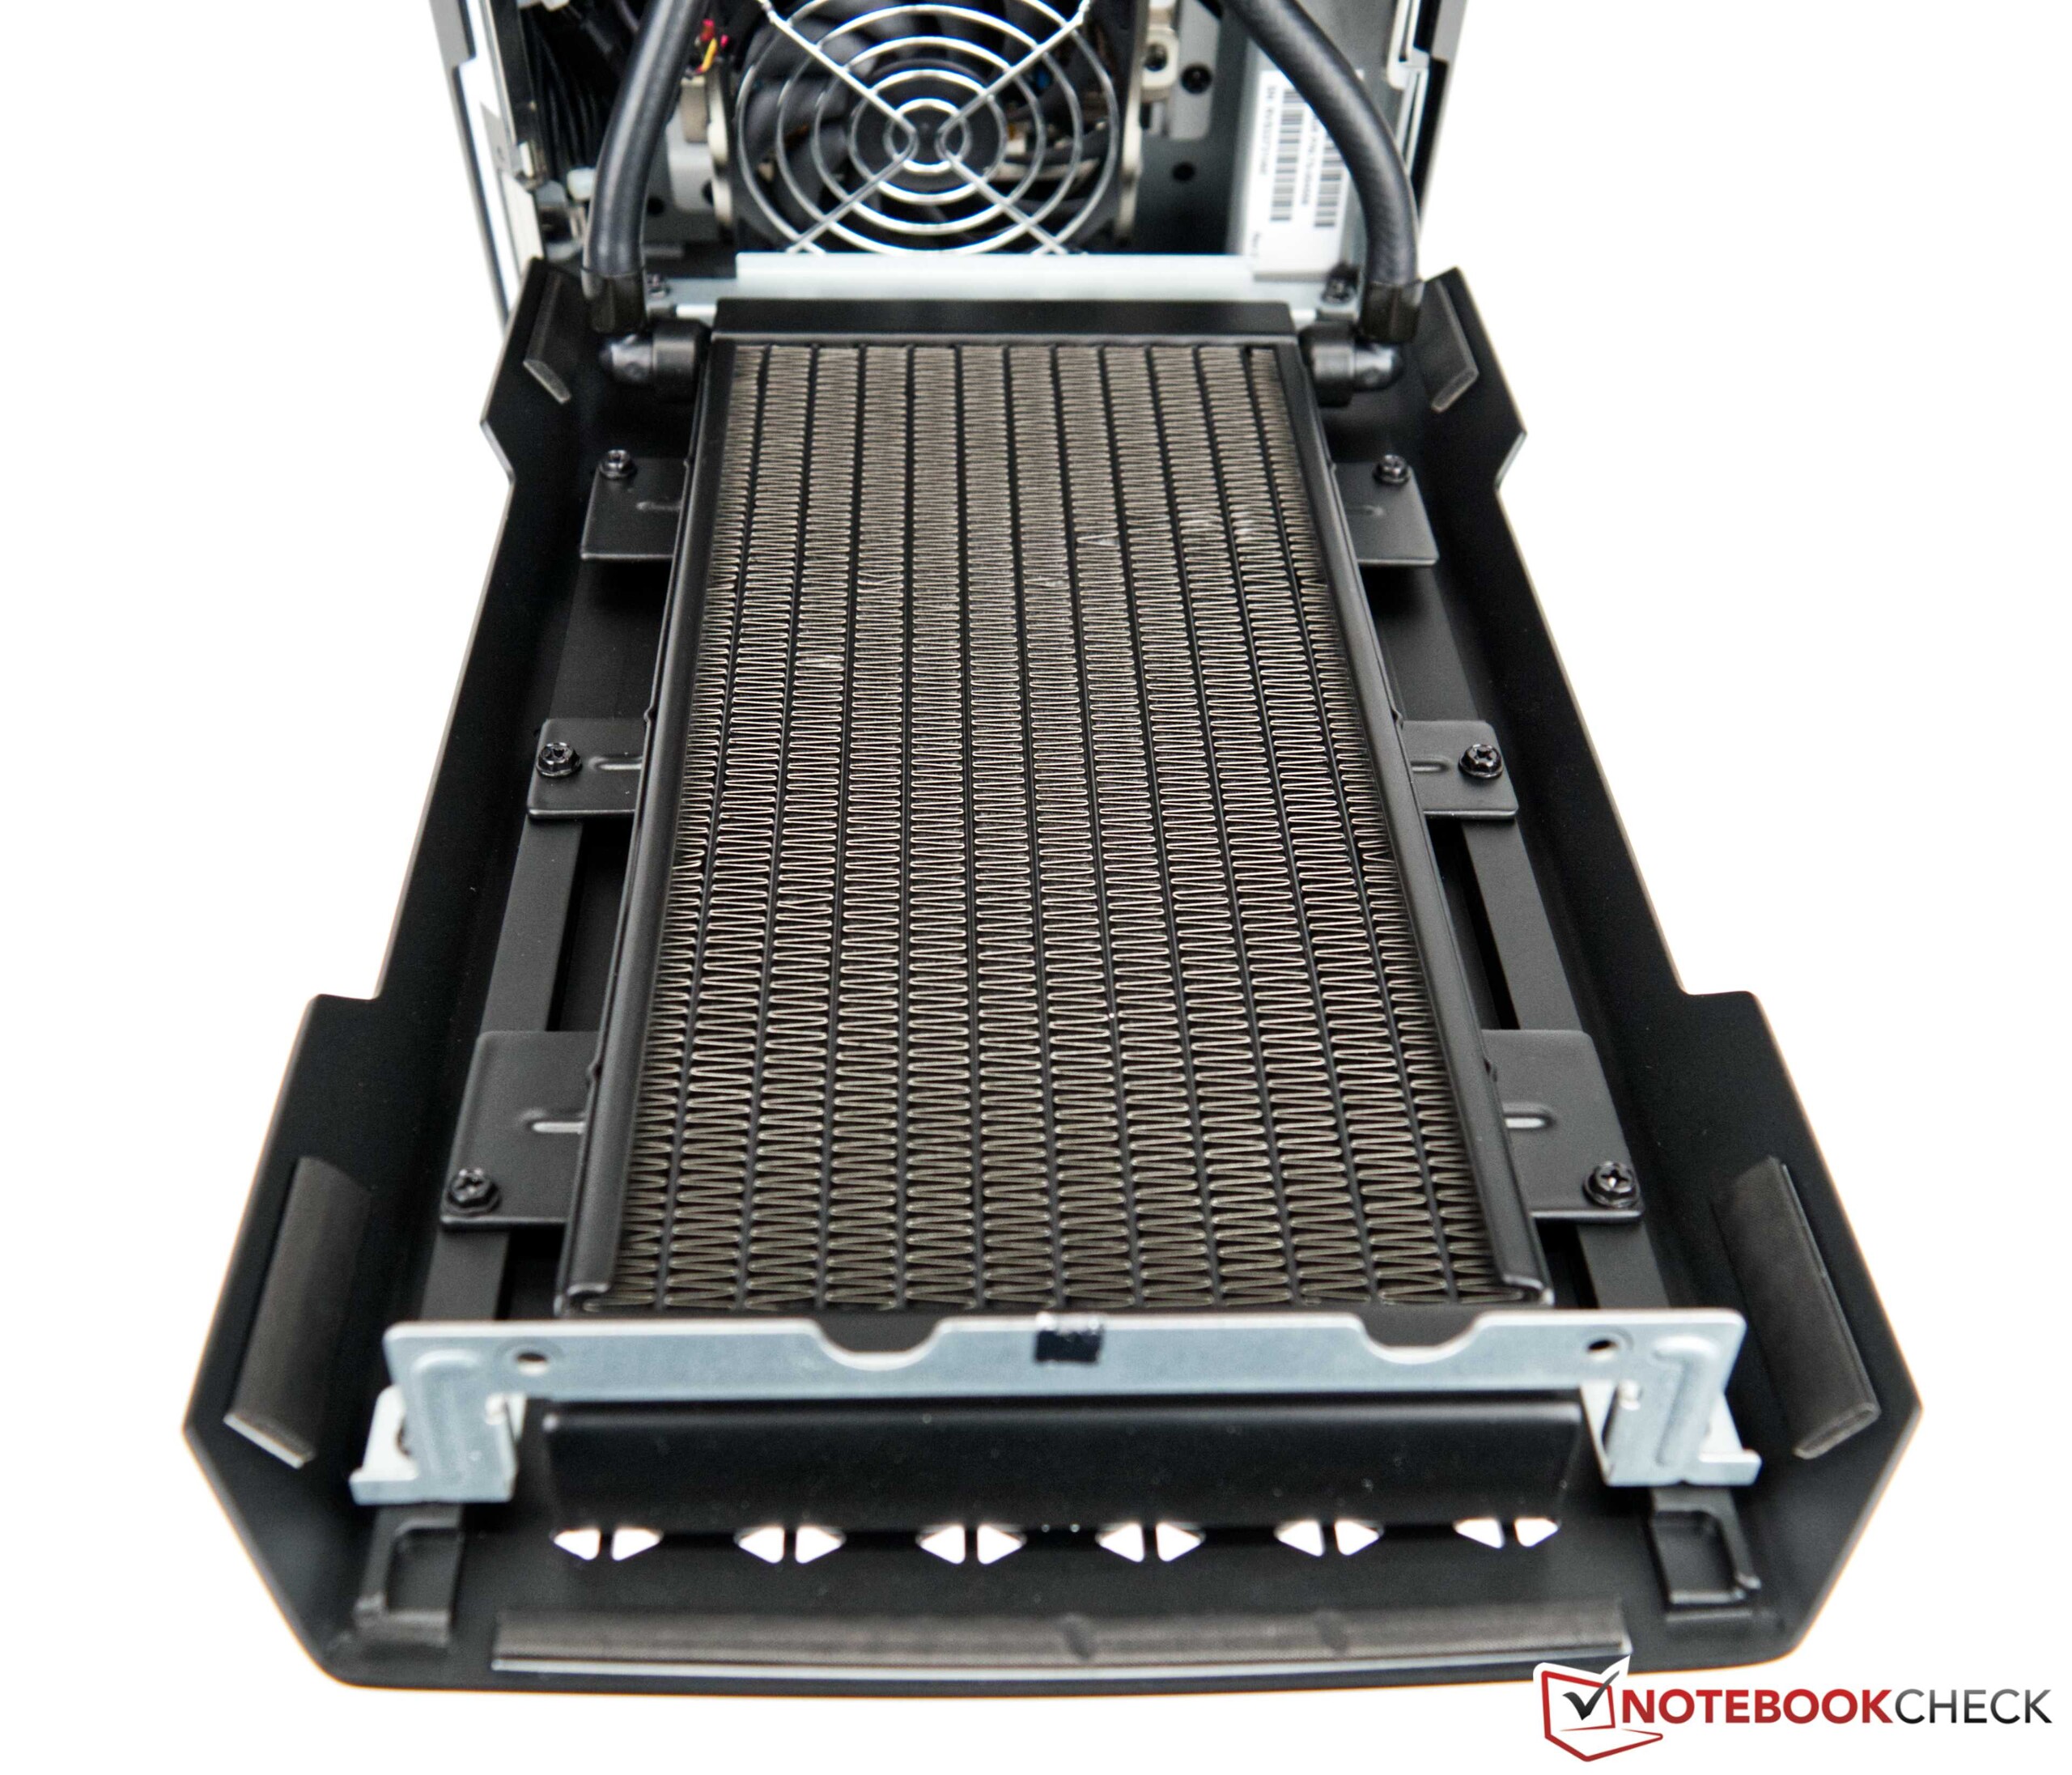
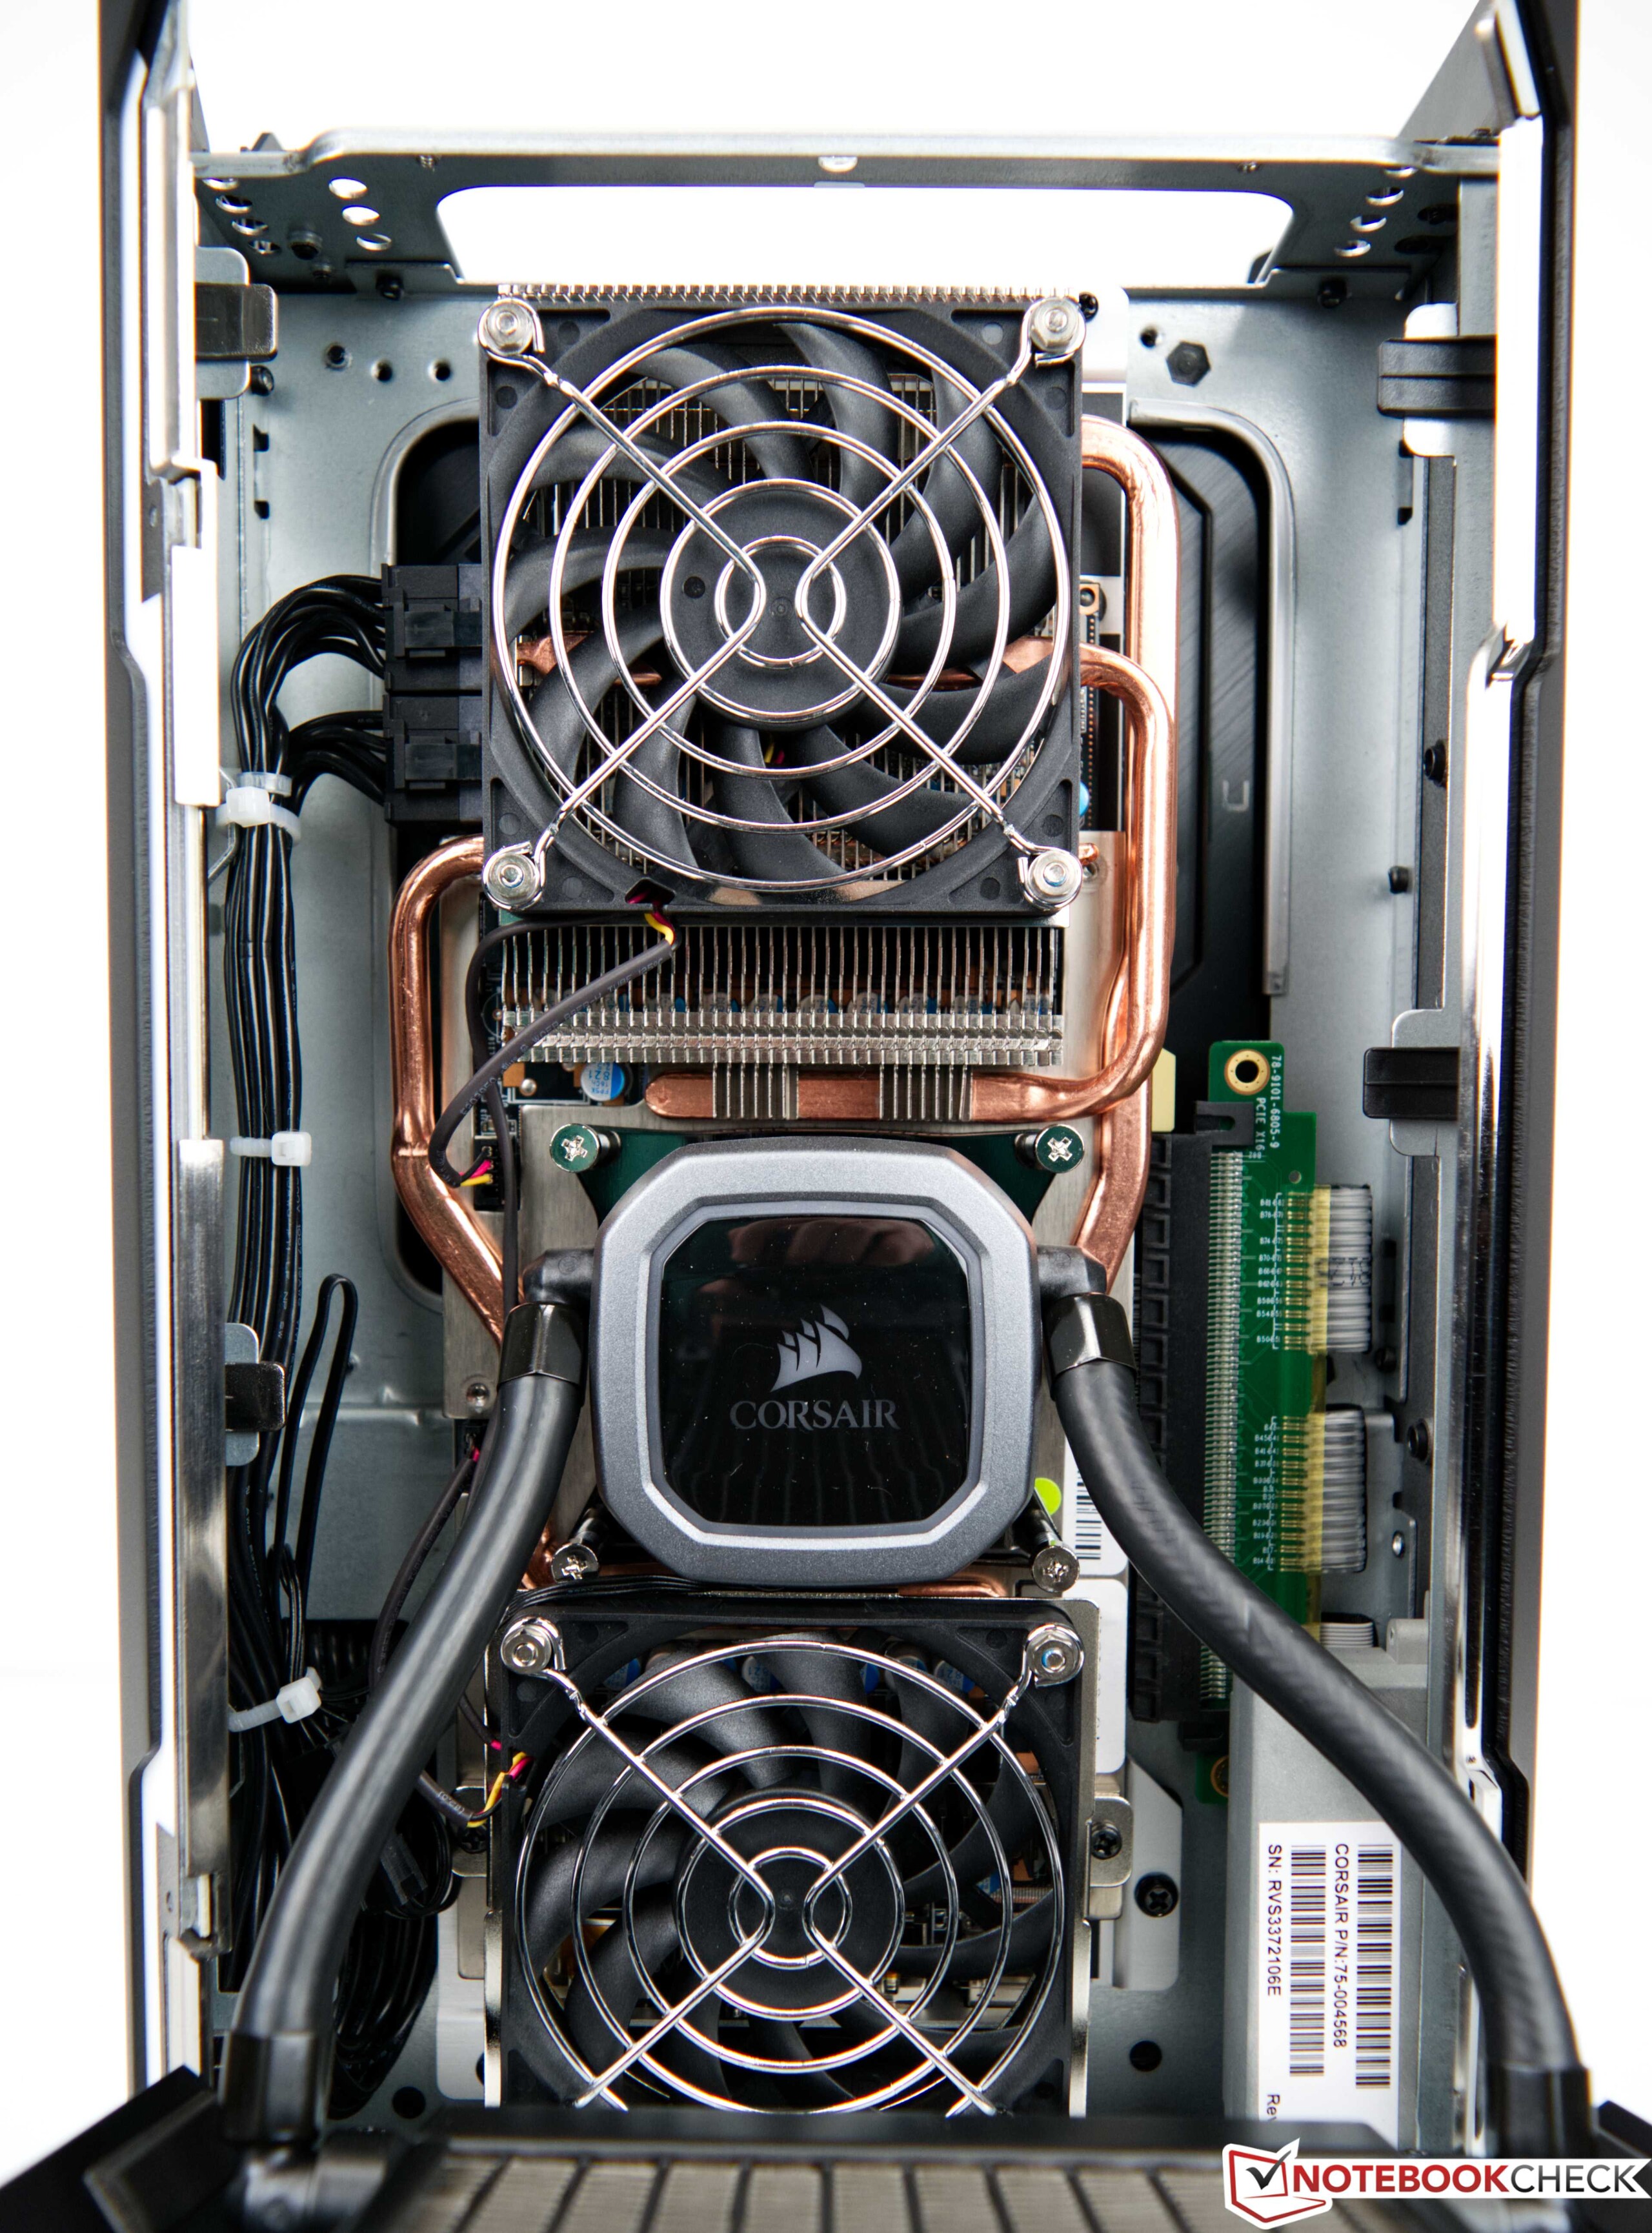
Visualmente, o caso do Corsair One i300 dificilmente pode ser distinguido doCorsair One i160e em termos de escolha de materiais, o fabricante também manteve o mesmo conceito com todas as superfícies feitas de metal que oferece uma impressão de alta qualidade não apenas em termos de aparência. O design preto e modesto é marcado por duas barras de luz RGB na frente, que podem ser ajustadas de acordo com suas preferências usando o software iCUE. O acabamento é de primeira, e não vimos nenhuma falha. O design dos interiores oferece espaço para dois sistemas independentes de resfriamento de água para CPU e GPU.
Apesar de ser compacto, o pequeno PC traz 7,5 kg para a balança. Você não esperaria isto à primeira vista, mas isto também confirma os materiais utilizados, já que em um caso tão pequeno, tudo o que for possível precisa ser utilizado para transferir o calor criado
Equipamentos - Os mais atuais

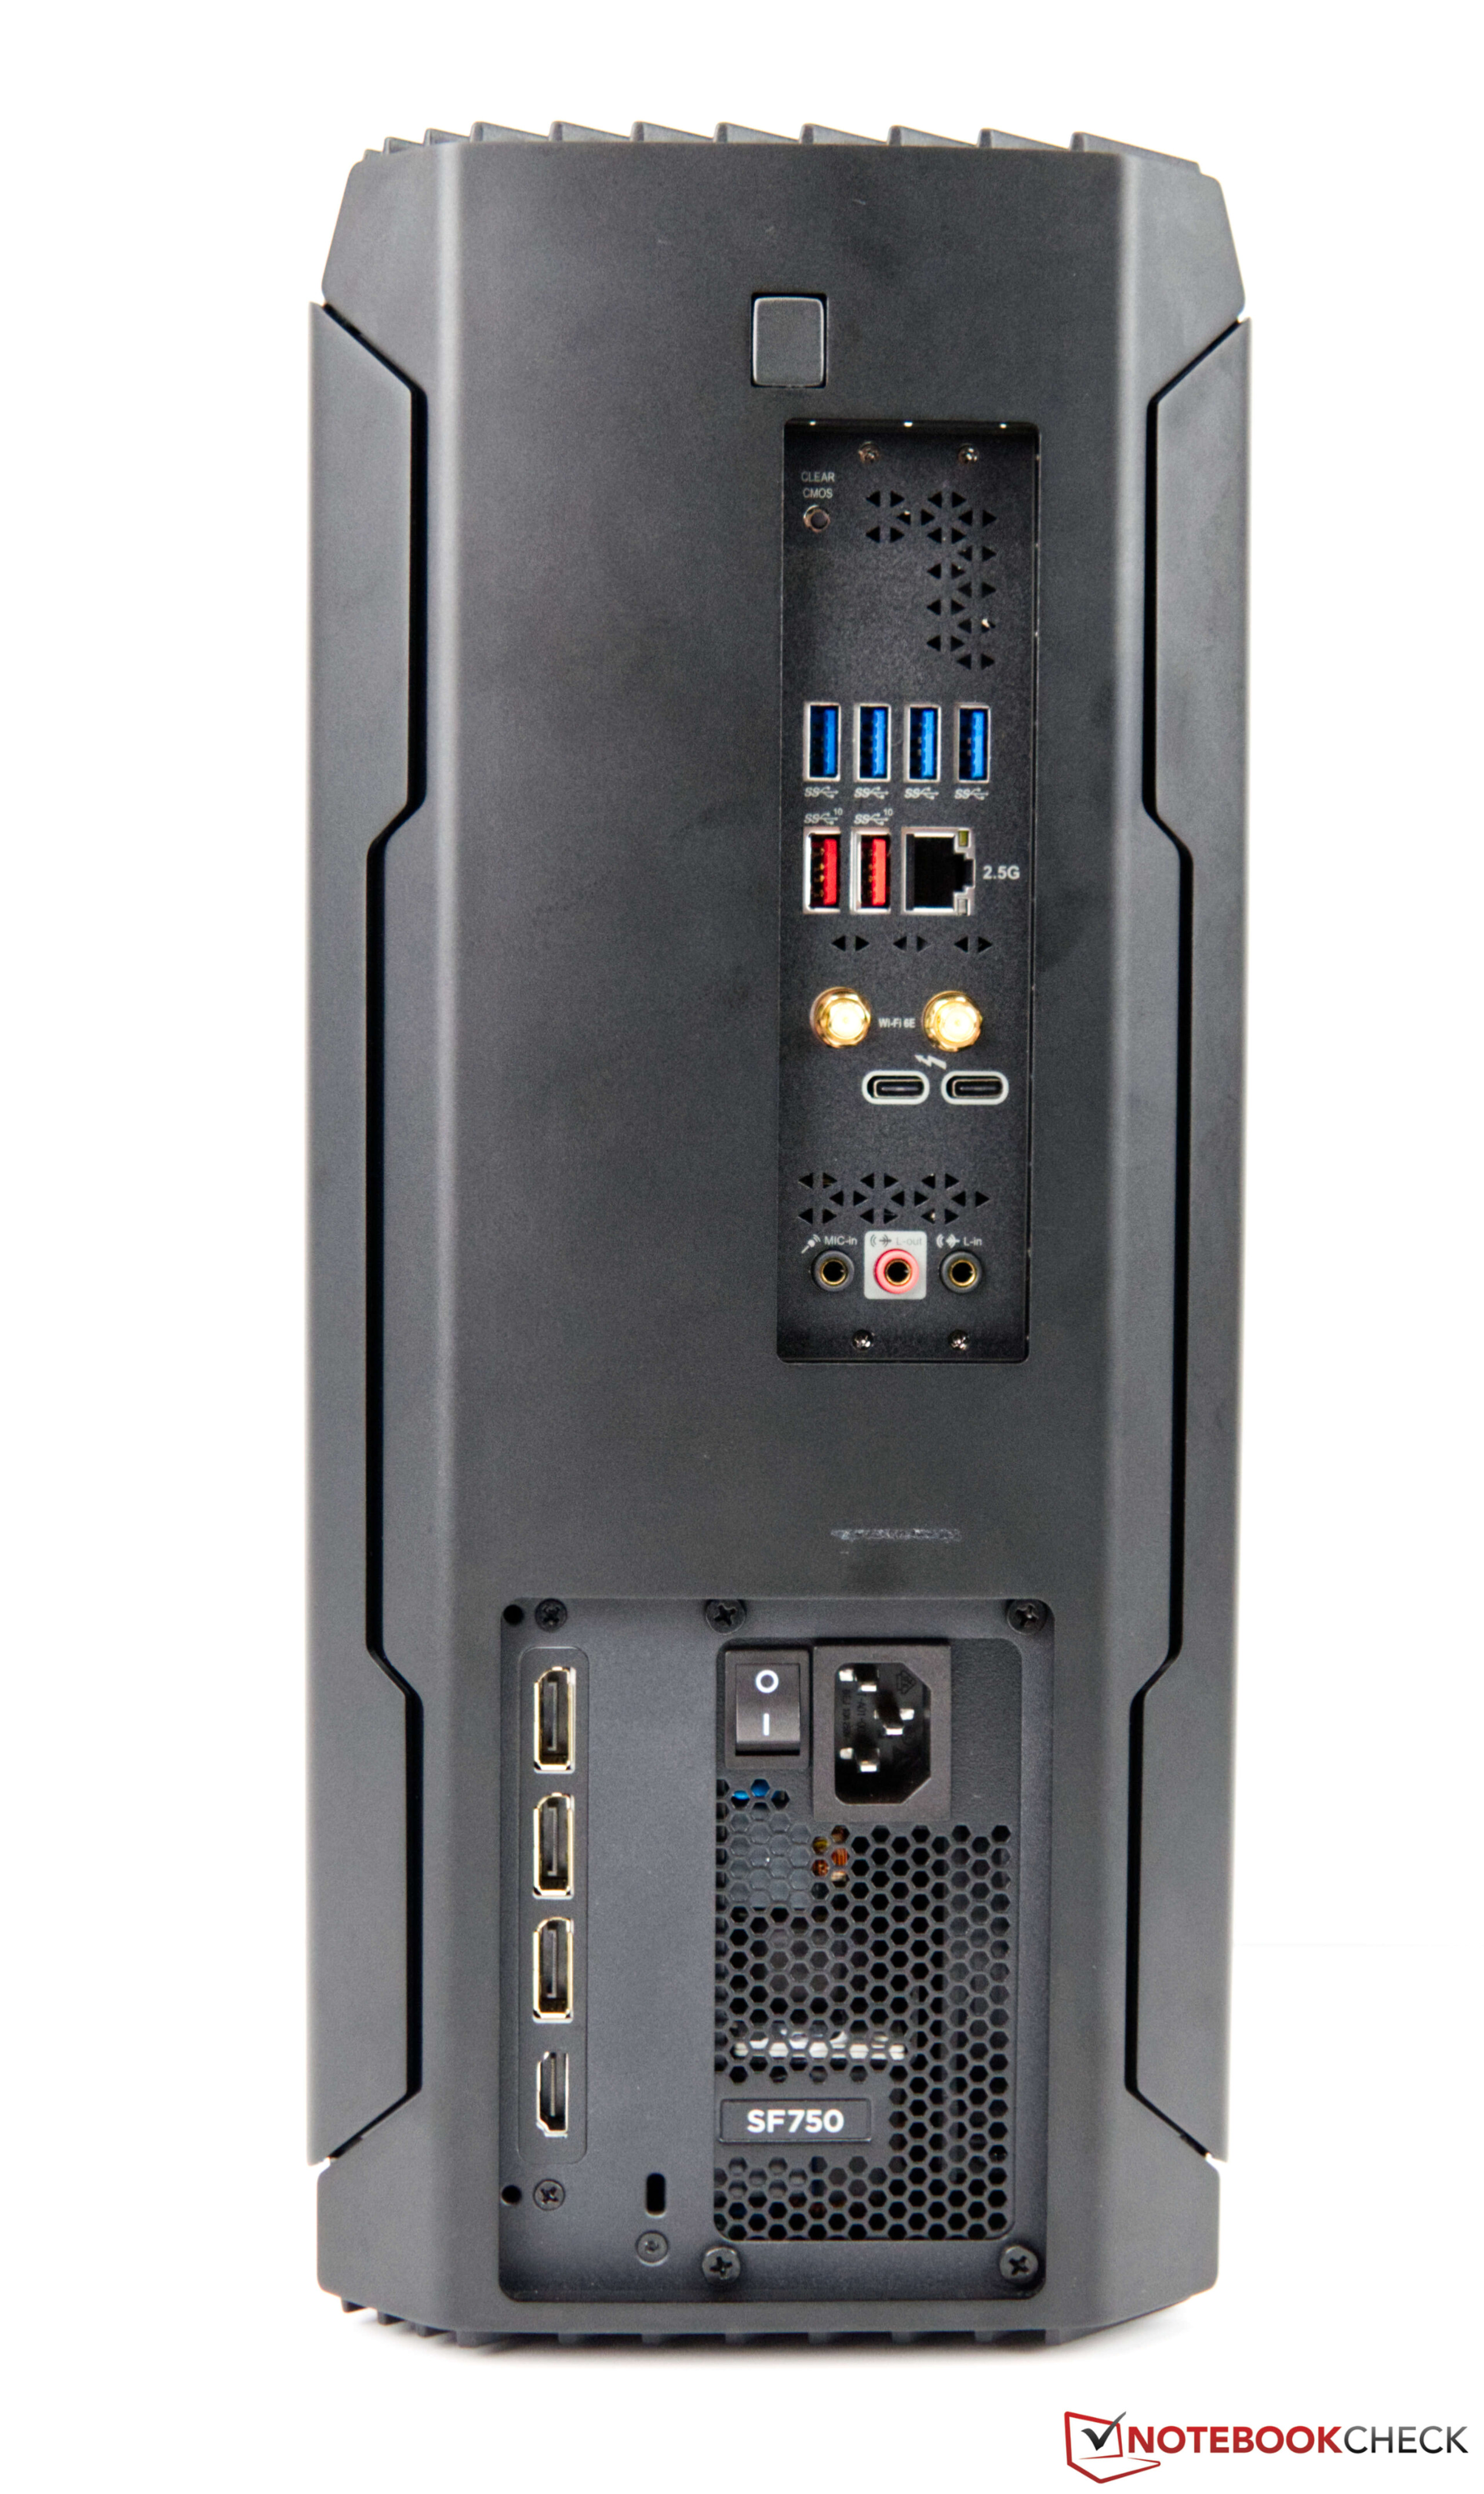
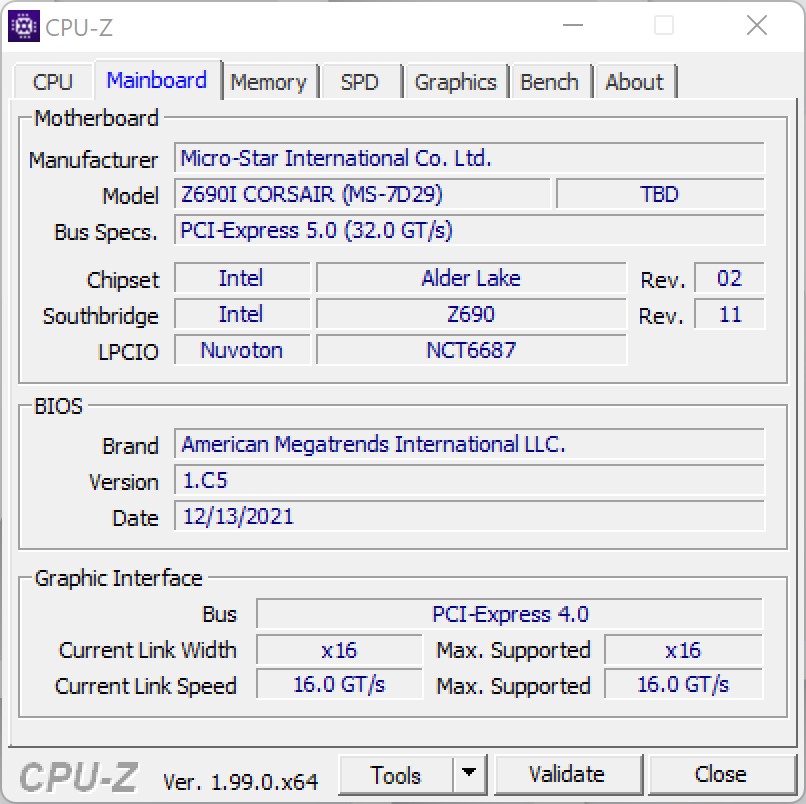
No One i300, Corsair utiliza uma placa principal Mini-ITX convencional da MSI. Para ser exato, a Corsair utiliza a MSI MEG Z690I Unify em nossa unidade de teste. Com isto, o PC de mesa também está bem equipado com conexões externas. Há um total de 8 portas USB na parte traseira, duas das quais também suportam o Thunderbolt 4. A frente abriga 3 portas USB adicionais. A própria Nvidia GeForce RTX 3080 Ti também adiciona 3x DisplayPort e uma conexão HDMI.
Em termos de conexões de rede, o usuário pode escolher entre WLAN no padrão mais atual ou Ethernet (2,5G).
Comunicação
O módulo Intel Wi-Fi 6E AX211 incorporado na placa principal é o mais atual disponível, portanto você também pode usar redes Wi-Fi 6G. Usando nosso roteador de teste atual, que também suporta o mais novo padrão, o Corsair One i300 oferece taxas de transferência rápidas e estáveis em nosso teste WLAN.
Nota: Como infelizmente nossa unidade de teste foi enviada para nós sem as antenas WLAN originais, realizamos este teste usando antenas alternativas. Atualmente, não podemos dizer se as taxas de transferência são ainda ligeiramente melhores quando usamos as antenas originais.
| Networking | |
| iperf3 transmit AX12 | |
| Asus ROG Flow Z13 GZ301ZE | |
| Média Intel Wi-Fi 6E AX211 (1003 - 1501, n=4) | |
| Huawei MateBook 13s i5 11300H | |
| iperf3 receive AX12 | |
| Média Intel Wi-Fi 6E AX211 (1178 - 1623, n=4) | |
| Asus ROG Flow Z13 GZ301ZE | |
| Huawei MateBook 13s i5 11300H | |
| iperf3 receive AXE11000 | |
| MSI Stealth GS66 12UGS | |
| Média Intel Wi-Fi 6E AX211 (582 - 1890, n=276) | |
| Corsair One i300 | |
| Média da turma Desktop (n=1últimos 2 anos) | |
| iperf3 transmit AXE11000 | |
| Corsair One i300 | |
| Média Intel Wi-Fi 6E AX211 (64 - 1921, n=276) | |
| Média da turma Desktop (n=1últimos 2 anos) | |
Manutenção
Caso o desempenho do Corsair One i300 seja insuficiente ou a solução de armazenamento se torne muito pequena, você também pode atualizar o computador. No entanto, você deve ter cuidado, já que o espaço interno é muito limitado. O PC desktop pode ser aberto facilmente. A tampa da caixa superior com o ventilador de 140 mm é rapidamente removida e as tampas laterais são fixadas apenas com dois parafusos. Mas então as mangueiras dos AiOs impedirão uma rápida substituição dos componentes. Embora você ainda possa acessar a memória de trabalho com bastante facilidade, as coisas parecem mais difíceis se você quiser chegar à solução de armazenamento. Por este motivo, gostaríamos de ter outra opção nas configurações disponíveis, já que há um total de três slots M.2 na placa principal. Entretanto, o sistema já está bem equipado com 2 TB de armazenamento.
Desempenho
Olhando puramente em termos dos componentes utilizados, o Corsair One i300 oferece processadores muito rápidos para jogos com o Intel Core i9-12900Ke oNvidia GeForce RTX 3080 Ti. Atualmente, a GeForce RTX 3080 Ti é a segunda placa gráfica mais rápida da Nvidia, permanecendo apenas alguns pontos percentuais atrás da GeForce RTX 3090. Embora isso também possa ter cabido no caso se você considerar apenas o tamanho físico, o resfriamento dos chips VRAM provavelmente levou a Corsair a usar "apenas" um GeForce RTX 3080 Ti. O modelo ligeiramente mais fraco do Corsair One i300 está equipado com um GeForce RTX 3080, que pode ser a escolha mais razoável por causa de seu preço de compra mais baixo.
Processador
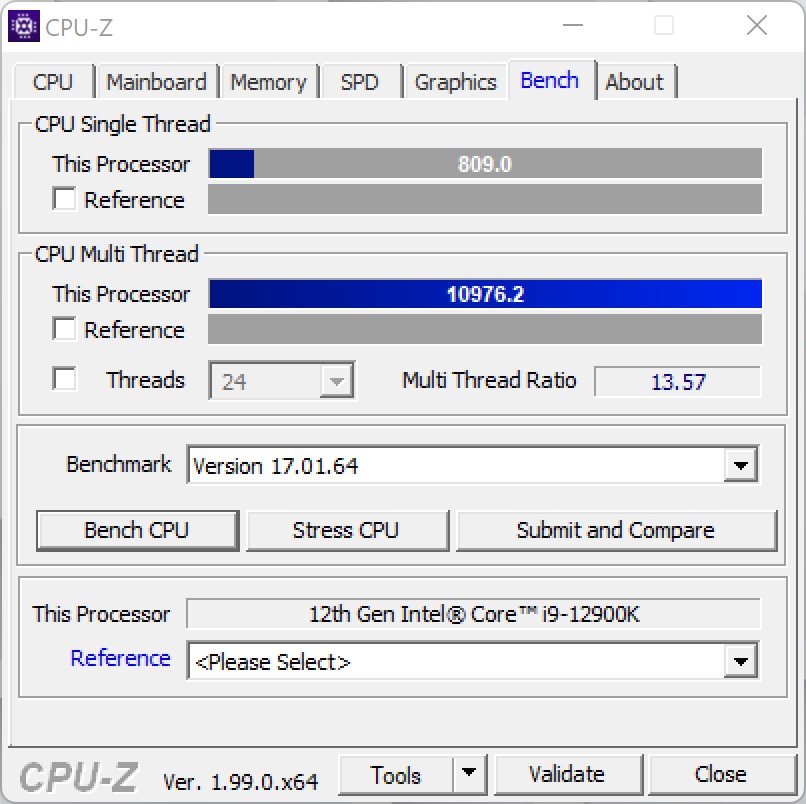
O Corsair One i300 está equipado com o processador mais rápido da Intel que está atualmente disponível para jogos. Para ser exato, o Corsair utiliza oIntel Core i9-12900Kcom base em uma placa Z690 da MSI. Já pudemos ver com antecedência qual desempenho pode ser entregue pela nova nave-chefe da Intel. Para mais detalhes sobre a Intel Core i9-12900Kreferimo-nos a isto página. Entretanto, há uma pequena limitação no Corsair One i300 em termos de consumo máximo de energia. PL1 e também PL2 são limitados aos valores de 165 e 175 watts respectivamente, o que significa que o processador é ligeiramente estrangulado sob carga. Sem esta limitação, o Intel Core i9-12900Kdeve ser capaz de consumir até 241 watts. Por outro lado, esta opção pode ser modificada na BIOS. Mas isto também resultaria em um volume de ruído e temperaturas mais altas.
No benchmark que estamos executando, o Intel Core i9-12900K se sai muito bem, mesmo que não seja capaz de usar seu desempenho total sob carga. O desempenho aumenta em comparação com o Corsair One i160 é imensa. Na classificação geral, o sistema atual oferece 48% a mais de desempenho.
Para comparações e benchmarks adicionais, nós o encaminhamos para nosso Gráfico de comparação de CPU.
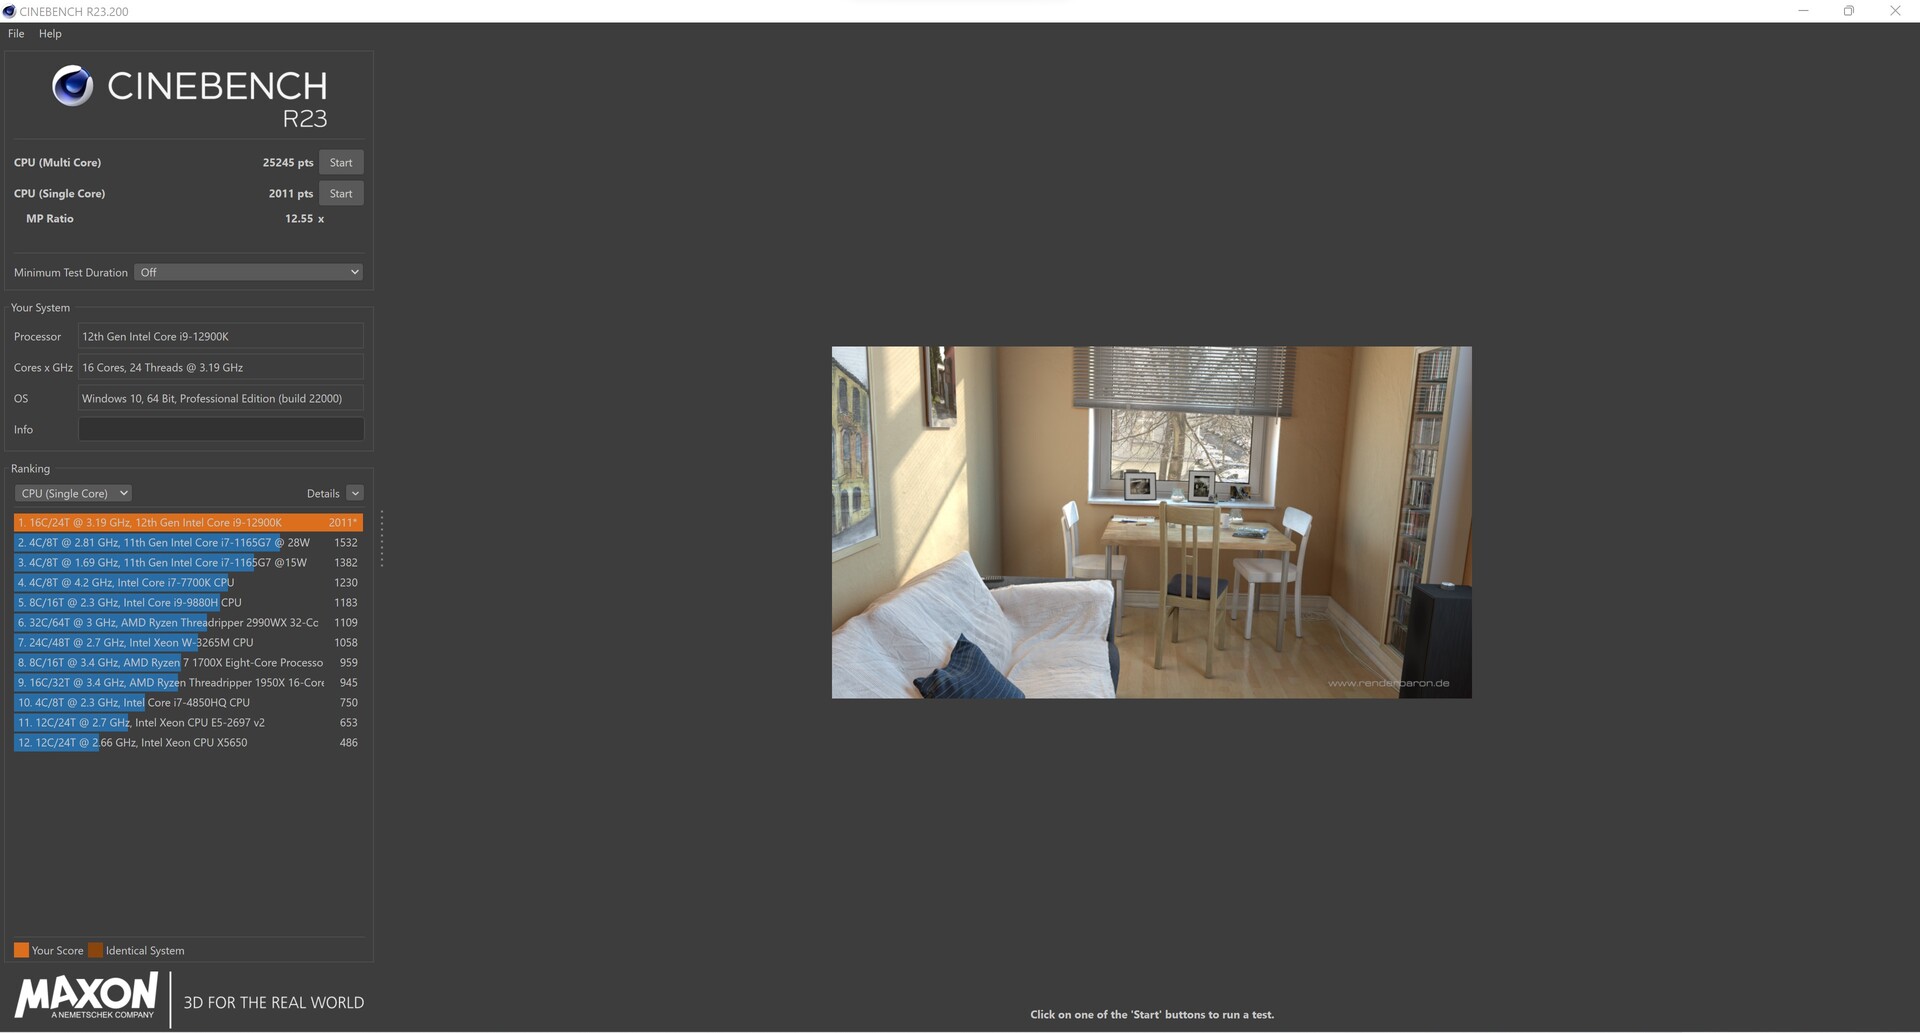
Cinebench R23: Multi Core | Single Core
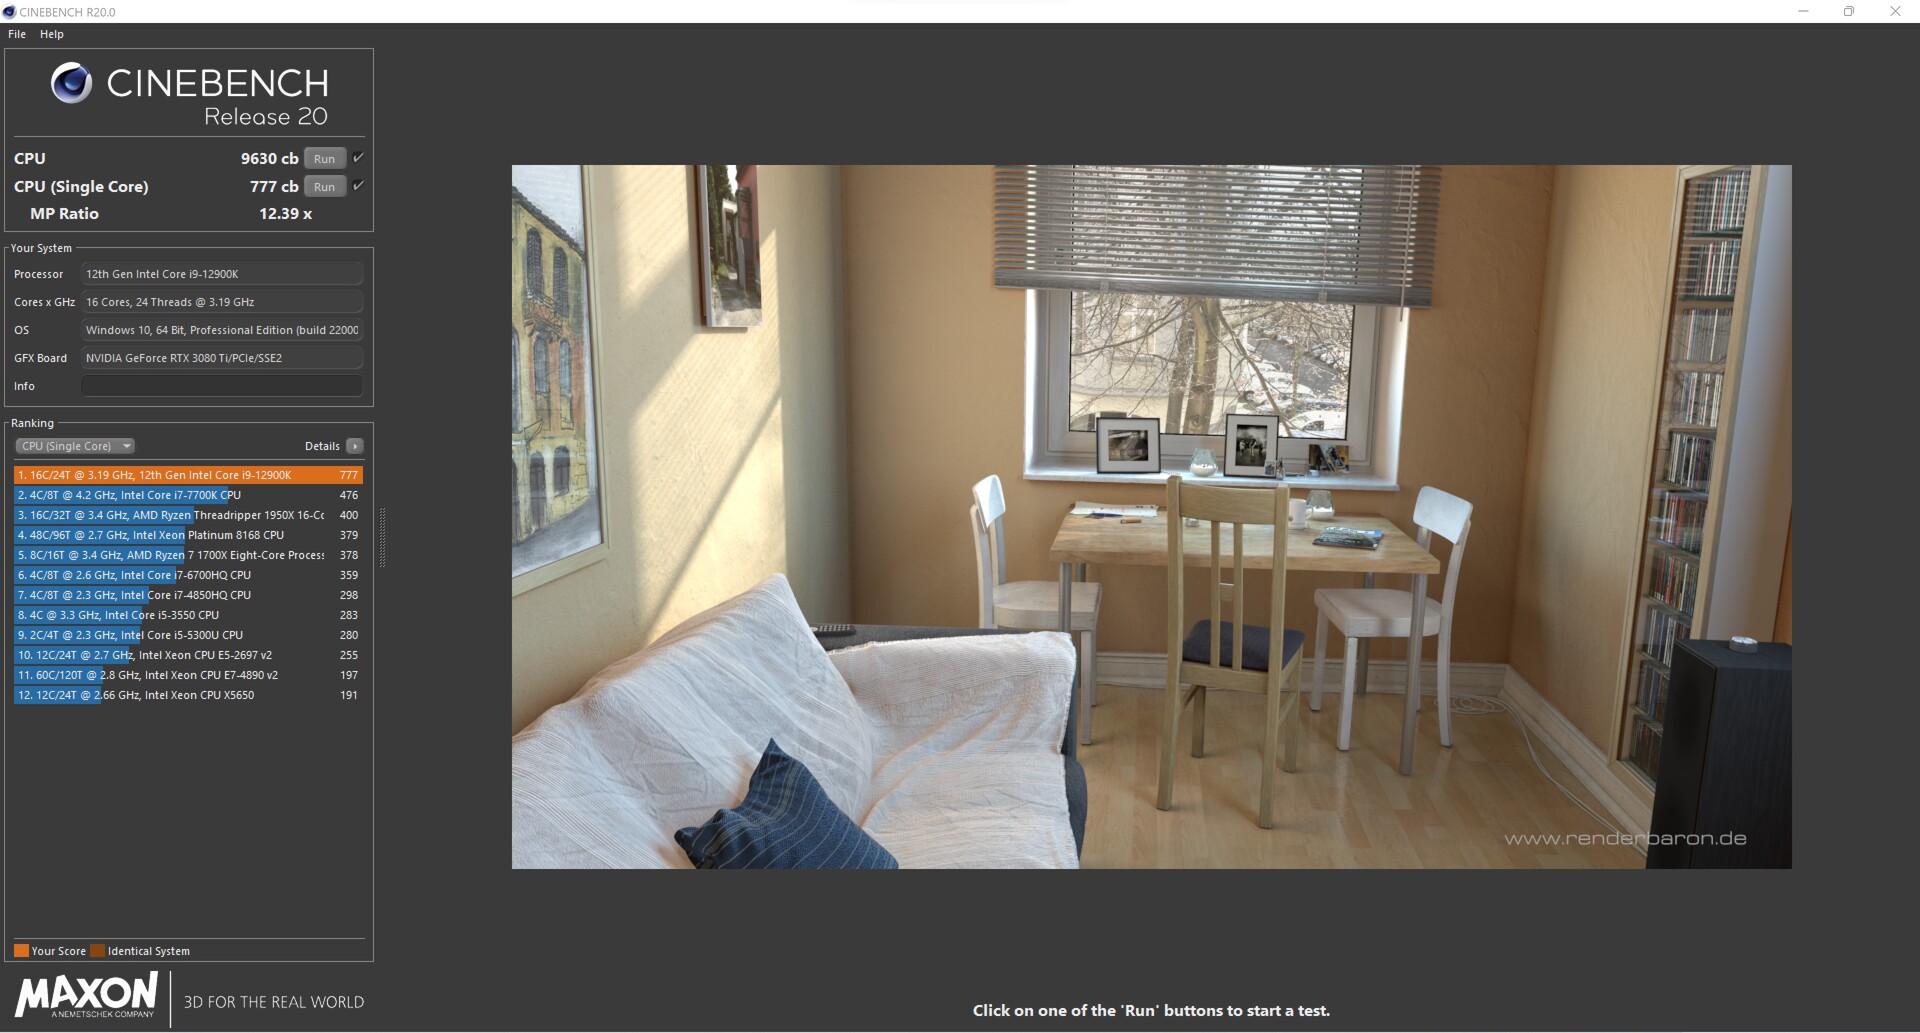
Cinebench R20: CPU (Multi Core) | CPU (Single Core)
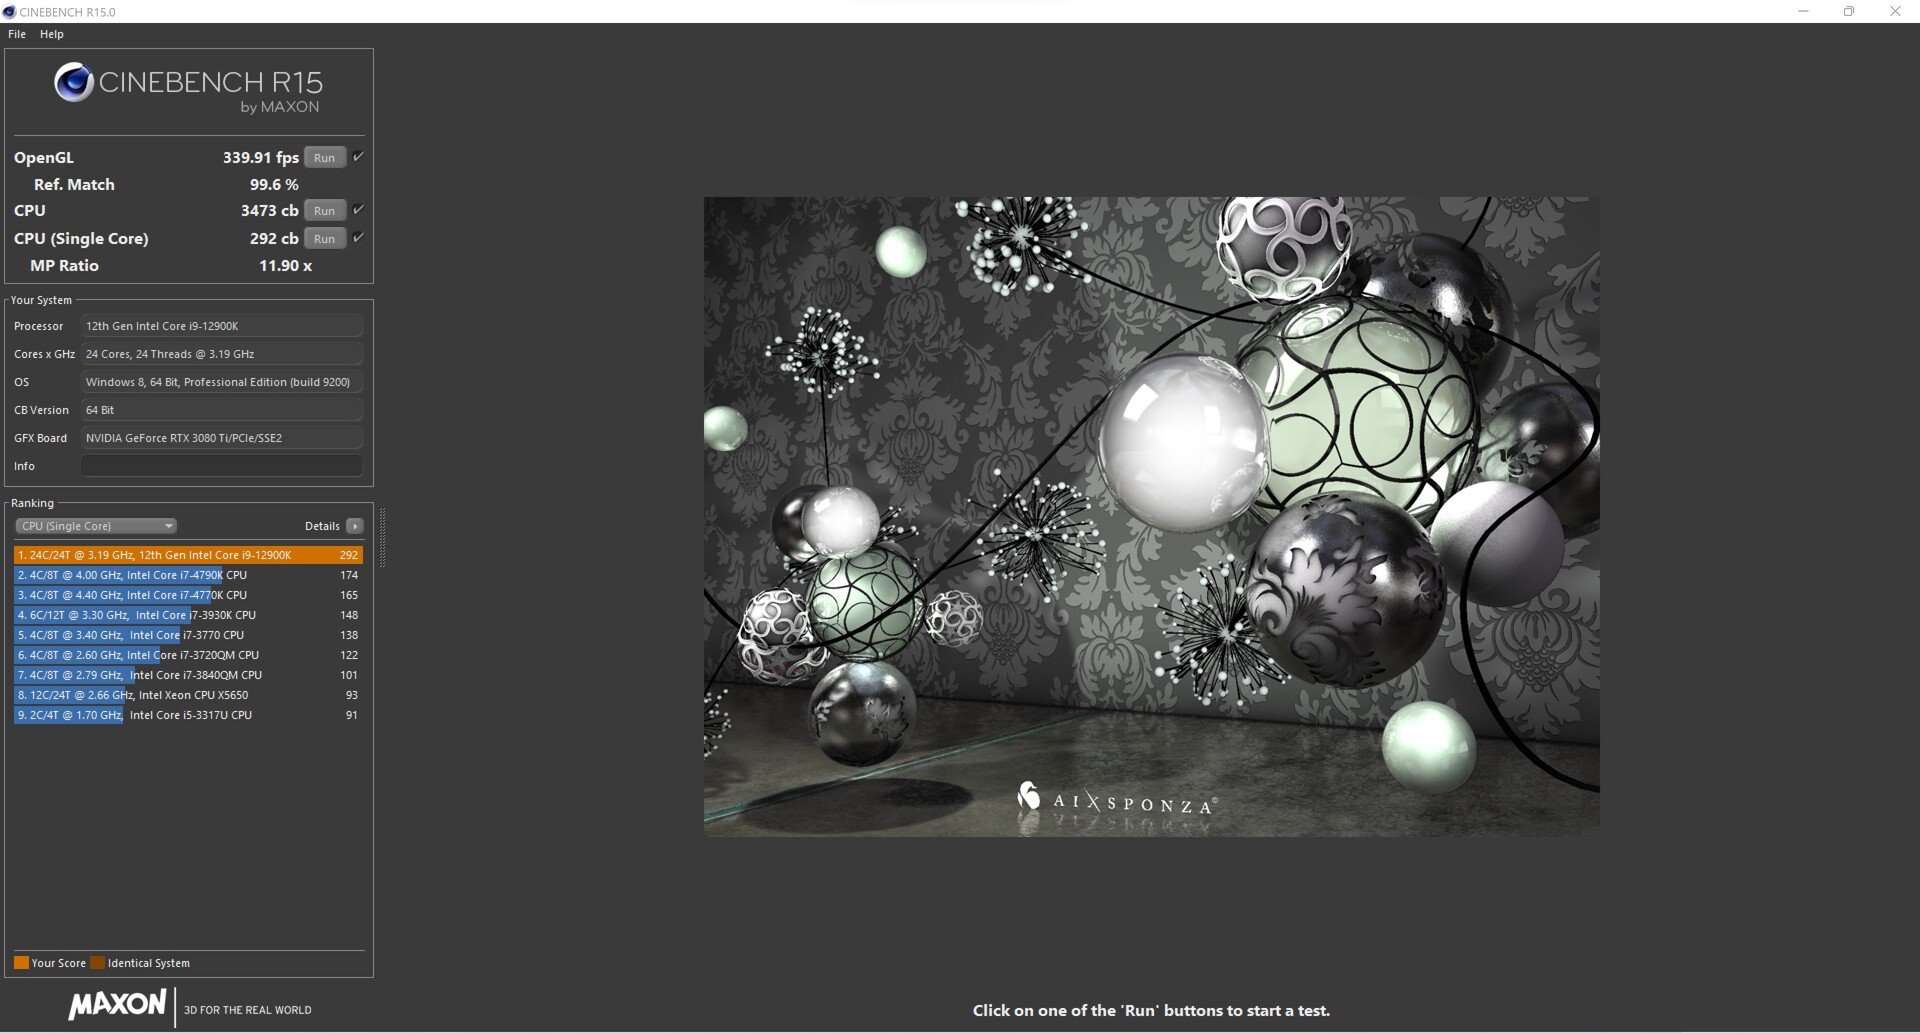
Cinebench R15: CPU Multi 64Bit | CPU Single 64Bit
Blender: v2.79 BMW27 CPU
7-Zip 18.03: 7z b 4 | 7z b 4 -mmt1
Geekbench 5.5: Multi-Core | Single-Core
HWBOT x265 Benchmark v2.2: 4k Preset
LibreOffice : 20 Documents To PDF
R Benchmark 2.5: Overall mean
| CPU Performance rating | |
| Média da turma Desktop | |
| Intel Core i9-12900K | |
| Média Intel Core i9-12900K | |
| AMD Ryzen 9 5950X | |
| Intel Core i9-12900K | |
| AMD Ryzen 9 5900X | |
| Intel Core i9-11900K | |
| Intel Core i9-10900K | |
| Intel Core i9-9900K -6! | |
| Cinebench R23 / Multi Core | |
| Média da turma Desktop (16119 - 44253, n=16, últimos 2 anos) | |
| AMD Ryzen 9 5950X | |
| Intel Core i9-12900K | |
| Média Intel Core i9-12900K (25245 - 27005, n=2) | |
| Intel Core i9-12900K | |
| AMD Ryzen 9 5900X | |
| Intel Core i9-10900K | |
| Intel Core i9-11900K | |
| Cinebench R23 / Single Core | |
| Média da turma Desktop (1722 - 2439, n=16, últimos 2 anos) | |
| Intel Core i9-12900K | |
| Média Intel Core i9-12900K (1998 - 2011, n=2) | |
| Intel Core i9-12900K | |
| Intel Core i9-11900K | |
| AMD Ryzen 9 5950X | |
| AMD Ryzen 9 5900X | |
| Intel Core i9-10900K | |
| Cinebench R20 / CPU (Multi Core) | |
| Média da turma Desktop (5710 - 17190, n=15, últimos 2 anos) | |
| AMD Ryzen 9 5950X | |
| Intel Core i9-12900K | |
| Média Intel Core i9-12900K (9630 - 10240, n=2) | |
| Intel Core i9-12900K | |
| AMD Ryzen 9 5900X | |
| Intel Core i9-10900K | |
| Intel Core i9-11900K | |
| Intel Core i9-9900K | |
| Cinebench R20 / CPU (Single Core) | |
| Média da turma Desktop (674 - 922, n=15, últimos 2 anos) | |
| Intel Core i9-12900K | |
| Média Intel Core i9-12900K (766 - 777, n=2) | |
| Intel Core i9-12900K | |
| Intel Core i9-11900K | |
| AMD Ryzen 9 5950X | |
| AMD Ryzen 9 5900X | |
| Intel Core i9-10900K | |
| Intel Core i9-9900K | |
| Cinebench R15 / CPU Multi 64Bit | |
| Média da turma Desktop (2652 - 6656, n=16, últimos 2 anos) | |
| AMD Ryzen 9 5950X | |
| Intel Core i9-12900K | |
| Média Intel Core i9-12900K (3473 - 4102, n=3) | |
| AMD Ryzen 9 5900X | |
| Intel Core i9-12900K | |
| Intel Core i9-10900K | |
| Intel Core i9-11900K | |
| Intel Core i9-9900K | |
| Cinebench R15 / CPU Single 64Bit | |
| Média da turma Desktop (246 - 356, n=16, últimos 2 anos) | |
| Intel Core i9-12900K | |
| Média Intel Core i9-12900K (286 - 292, n=3) | |
| Intel Core i9-12900K | |
| AMD Ryzen 9 5950X | |
| AMD Ryzen 9 5900X | |
| Intel Core i9-11900K | |
| Intel Core i9-10900K | |
| Intel Core i9-9900K | |
| Blender / v2.79 BMW27 CPU | |
| Intel Core i9-9900K | |
| Intel Core i9-11900K | |
| Intel Core i9-10900K | |
| AMD Ryzen 9 5900X | |
| Intel Core i9-12900K | |
| Média Intel Core i9-12900K (121.1 - 128.3, n=2) | |
| Intel Core i9-12900K | |
| Média da turma Desktop (75 - 218, n=15, últimos 2 anos) | |
| AMD Ryzen 9 5950X | |
| 7-Zip 18.03 / 7z b 4 | |
| AMD Ryzen 9 5950X | |
| Média da turma Desktop (91898 - 163125, n=17, últimos 2 anos) | |
| Intel Core i9-12900K | |
| Média Intel Core i9-12900K (96960 - 97671, n=2) | |
| Intel Core i9-12900K | |
| AMD Ryzen 9 5900X | |
| Intel Core i9-10900K | |
| Intel Core i9-11900K | |
| Intel Core i9-9900K | |
| 7-Zip 18.03 / 7z b 4 -mmt1 | |
| Média da turma Desktop (5092 - 8790, n=17, últimos 2 anos) | |
| AMD Ryzen 9 5950X | |
| AMD Ryzen 9 5900X | |
| Intel Core i9-11900K | |
| Intel Core i9-12900K | |
| Média Intel Core i9-12900K (6571 - 6580, n=2) | |
| Intel Core i9-12900K | |
| Intel Core i9-10900K | |
| Intel Core i9-9900K | |
| Geekbench 5.5 / Multi-Core | |
| Média da turma Desktop (12626 - 28535, n=30, últimos 2 anos) | |
| Intel Core i9-12900K | |
| Média Intel Core i9-12900K (17698 - 17854, n=2) | |
| Intel Core i9-12900K | |
| AMD Ryzen 9 5950X | |
| AMD Ryzen 9 5900X | |
| Intel Core i9-10900K | |
| Intel Core i9-11900K | |
| Geekbench 5.5 / Single-Core | |
| Média da turma Desktop (1755 - 2597, n=30, últimos 2 anos) | |
| Intel Core i9-12900K | |
| Média Intel Core i9-12900K (1969 - 2042, n=2) | |
| Intel Core i9-12900K | |
| Intel Core i9-11900K | |
| AMD Ryzen 9 5950X | |
| AMD Ryzen 9 5900X | |
| Intel Core i9-10900K | |
| HWBOT x265 Benchmark v2.2 / 4k Preset | |
| Média da turma Desktop (18.6 - 48.5, n=15, últimos 2 anos) | |
| AMD Ryzen 9 5950X | |
| Intel Core i9-12900K | |
| Média Intel Core i9-12900K (29 - 30, n=2) | |
| Intel Core i9-12900K | |
| AMD Ryzen 9 5900X | |
| Intel Core i9-10900K | |
| Intel Core i9-11900K | |
| Intel Core i9-9900K | |
| LibreOffice / 20 Documents To PDF | |
| Intel Core i9-10900K | |
| Intel Core i9-11900K | |
| AMD Ryzen 9 5900X | |
| AMD Ryzen 9 5950X | |
| Média da turma Desktop (35.5 - 79.2, n=16, últimos 2 anos) | |
| Intel Core i9-12900K | |
| Média Intel Core i9-12900K (38.1 - 40.6, n=2) | |
| Intel Core i9-12900K | |
| R Benchmark 2.5 / Overall mean | |
| Intel Core i9-10900K | |
| Intel Core i9-11900K | |
| AMD Ryzen 9 5950X | |
| AMD Ryzen 9 5900X | |
| Intel Core i9-12900K | |
| Média Intel Core i9-12900K (0.3946 - 0.4216, n=2) | |
| Intel Core i9-12900K | |
| Média da turma Desktop (0.3299 - 0.4909, n=16, últimos 2 anos) | |
* ... menor é melhor
AIDA64: FP32 Ray-Trace | FPU Julia | CPU SHA3 | CPU Queen | FPU SinJulia | FPU Mandel | CPU AES | CPU ZLib | FP64 Ray-Trace | CPU PhotoWorxx
| Performance rating | |
| Média da turma Desktop | |
| AMD Ryzen 9 5950X, NVIDIA Titan RTX | |
| AMD Ryzen 9 5900X, NVIDIA Titan RTX | |
| Intel Core i9-11900K, NVIDIA Titan RTX | |
| Intel Core i9-12900K, NVIDIA GeForce RTX 3080 Ti | |
| Média Intel Core i9-12900K | |
| Intel Core i9-12900K, NVIDIA Titan RTX | |
| AIDA64 / FP32 Ray-Trace | |
| Média da turma Desktop (12248 - 84577, n=21, últimos 2 anos) | |
| AMD Ryzen 9 5950X, NVIDIA Titan RTX | |
| AMD Ryzen 9 5900X, NVIDIA Titan RTX | |
| Intel Core i9-11900K, NVIDIA Titan RTX | |
| Intel Core i9-12900K, NVIDIA Titan RTX | |
| Média Intel Core i9-12900K (12739 - 13345, n=3) | |
| Intel Core i9-12900K, NVIDIA GeForce RTX 3080 Ti | |
| AIDA64 / FPU Julia | |
| Média da turma Desktop (65152 - 246125, n=21, últimos 2 anos) | |
| AMD Ryzen 9 5950X, NVIDIA Titan RTX | |
| AMD Ryzen 9 5900X, NVIDIA Titan RTX | |
| Intel Core i9-11900K, NVIDIA Titan RTX | |
| Intel Core i9-12900K, NVIDIA Titan RTX | |
| Média Intel Core i9-12900K (58406 - 59419, n=3) | |
| Intel Core i9-12900K, NVIDIA GeForce RTX 3080 Ti | |
| AIDA64 / CPU SHA3 | |
| Média da turma Desktop (2982 - 10804, n=21, últimos 2 anos) | |
| Intel Core i9-11900K, NVIDIA Titan RTX | |
| Média Intel Core i9-12900K (4796 - 5127, n=3) | |
| Intel Core i9-12900K, NVIDIA Titan RTX | |
| Intel Core i9-12900K, NVIDIA GeForce RTX 3080 Ti | |
| AMD Ryzen 9 5950X, NVIDIA Titan RTX | |
| AMD Ryzen 9 5900X, NVIDIA Titan RTX | |
| AIDA64 / CPU Queen | |
| AMD Ryzen 9 5950X, NVIDIA Titan RTX | |
| AMD Ryzen 9 5900X, NVIDIA Titan RTX | |
| Média da turma Desktop (76512 - 187912, n=18, últimos 2 anos) | |
| Intel Core i9-12900K, NVIDIA Titan RTX | |
| Média Intel Core i9-12900K (112066 - 112694, n=3) | |
| Intel Core i9-12900K, NVIDIA GeForce RTX 3080 Ti | |
| Intel Core i9-11900K, NVIDIA Titan RTX | |
| AIDA64 / FPU SinJulia | |
| AMD Ryzen 9 5950X, NVIDIA Titan RTX | |
| AMD Ryzen 9 5900X, NVIDIA Titan RTX | |
| Média da turma Desktop (6443 - 35251, n=21, últimos 2 anos) | |
| Intel Core i9-12900K, NVIDIA Titan RTX | |
| Média Intel Core i9-12900K (14590 - 14664, n=3) | |
| Intel Core i9-12900K, NVIDIA GeForce RTX 3080 Ti | |
| Intel Core i9-11900K, NVIDIA Titan RTX | |
| AIDA64 / FPU Mandel | |
| Média da turma Desktop (31697 - 129745, n=21, últimos 2 anos) | |
| AMD Ryzen 9 5950X, NVIDIA Titan RTX | |
| AMD Ryzen 9 5900X, NVIDIA Titan RTX | |
| Intel Core i9-11900K, NVIDIA Titan RTX | |
| Intel Core i9-12900K, NVIDIA Titan RTX | |
| Média Intel Core i9-12900K (35801 - 39323, n=3) | |
| Intel Core i9-12900K, NVIDIA GeForce RTX 3080 Ti | |
| AIDA64 / CPU AES | |
| Intel Core i9-11900K, NVIDIA Titan RTX | |
| AMD Ryzen 9 5950X, NVIDIA Titan RTX | |
| Média da turma Desktop (57777 - 513073, n=21, últimos 2 anos) | |
| Intel Core i9-12900K, NVIDIA GeForce RTX 3080 Ti | |
| Média Intel Core i9-12900K (94062 - 140055, n=3) | |
| AMD Ryzen 9 5900X, NVIDIA Titan RTX | |
| Intel Core i9-12900K, NVIDIA Titan RTX | |
| AIDA64 / CPU ZLib | |
| AMD Ryzen 9 5950X, NVIDIA Titan RTX | |
| Média da turma Desktop (887 - 2674, n=21, últimos 2 anos) | |
| Média Intel Core i9-12900K (1537 - 1608, n=3) | |
| Intel Core i9-12900K, NVIDIA Titan RTX | |
| Intel Core i9-12900K, NVIDIA GeForce RTX 3080 Ti | |
| AMD Ryzen 9 5900X, NVIDIA Titan RTX | |
| Intel Core i9-11900K, NVIDIA Titan RTX | |
| AIDA64 / FP64 Ray-Trace | |
| Média da turma Desktop (6471 - 44013, n=21, últimos 2 anos) | |
| AMD Ryzen 9 5950X, NVIDIA Titan RTX | |
| AMD Ryzen 9 5900X, NVIDIA Titan RTX | |
| Intel Core i9-11900K, NVIDIA Titan RTX | |
| Intel Core i9-12900K, NVIDIA Titan RTX | |
| Média Intel Core i9-12900K (7586 - 8283, n=3) | |
| Intel Core i9-12900K, NVIDIA GeForce RTX 3080 Ti | |
| AIDA64 / CPU PhotoWorxx | |
| Intel Core i9-12900K, NVIDIA GeForce RTX 3080 Ti | |
| Intel Core i9-12900K, NVIDIA Titan RTX | |
| Média da turma Desktop (38071 - 63949, n=21, últimos 2 anos) | |
| Média Intel Core i9-12900K (33311 - 49236, n=3) | |
| Intel Core i9-11900K, NVIDIA Titan RTX | |
| AMD Ryzen 9 5950X, NVIDIA Titan RTX | |
| AMD Ryzen 9 5900X, NVIDIA Titan RTX | |
Teste de carga multi-constante Cinebench R15
Damos uma olhada no sistema sob carga constante usando o Cinebench-R15 Multi loop. Desta forma, podemos determinar se o sistema de resfriamento é suficientemente potente para resfriar o processador de forma eficaz. No Corsair One i300, o trabalho do AiO é muito confiável, e o resultado permanece constante mesmo depois de 50 corridas. No entanto, o TDP ligeiramente inferior doIntel Core i9-12900K é claramente perceptível aqui. Se você deixar o Core i9-12900K funcionar sem as limitações, ele pode alcançar quase 500 pontos a mais.
Desempenho do sistema
Durante nosso período de testes, o sistema inteiro funcionou muito rápido. Isto também se reflete nos benchmarks do sistema. Nos testes do PCMark 10, o Corsair One i300 assume a liderança em todos os testes individuais. Somente nos testes de renderização, o Corsair One i300 não é capaz de acompanhar o ritmo devido à placa gráfica. O Nvidia Titan RTXdos sistemas de comparação é a melhor escolha aqui, o que se deve à proximidade com a série quad.
| PCMark 10 | |
| Score | |
| Intel Core i9-12900K | |
| AMD Ryzen 9 5950X | |
| Intel Core i9-12900K | |
| AMD Ryzen 9 5900X | |
| Intel Core i9-11900K | |
| Intel Core i9-10900K | |
| Intel Core i9-9900K | |
| Essentials | |
| Intel Core i9-12900K | |
| AMD Ryzen 9 5950X | |
| Intel Core i9-12900K | |
| AMD Ryzen 9 5900X | |
| Intel Core i9-9900K | |
| Intel Core i9-11900K | |
| Intel Core i9-10900K | |
| Productivity | |
| AMD Ryzen 9 5950X | |
| Intel Core i9-12900K | |
| Intel Core i9-12900K | |
| AMD Ryzen 9 5900X | |
| Intel Core i9-11900K | |
| Intel Core i9-10900K | |
| Intel Core i9-9900K | |
| Digital Content Creation | |
| Intel Core i9-12900K | |
| AMD Ryzen 9 5950X | |
| Intel Core i9-12900K | |
| AMD Ryzen 9 5900X | |
| Intel Core i9-10900K | |
| Intel Core i9-9900K | |
| Intel Core i9-11900K | |
| LuxMark v2.0 64Bit | |
| Room GPUs-only | |
| Intel Core i9-12900K | |
| Intel Core i9-9900K | |
| Sala GPUs-only | |
| Intel Core i9-12900K | |
| Intel Core i9-9900K | |
| ComputeMark v2.1 | |
| 1024x600 Normal, Score | |
| Intel Core i9-12900K | |
| Intel Core i9-9900K | |
| 1024x600 Normal, Fluid 3DTex | |
| Intel Core i9-12900K | |
| Intel Core i9-9900K | |
| 1024x600 Normal, Fluid 2DTexArr | |
| Intel Core i9-12900K | |
| Intel Core i9-9900K | |
| 1024x600 Normal, Mandel Vector | |
| Intel Core i9-12900K | |
| Intel Core i9-9900K | |
| 1024x600 Normal, Mandel Scalar | |
| Intel Core i9-12900K | |
| Intel Core i9-9900K | |
| 1024x600 Normal, QJuliaRayTrace | |
| Intel Core i9-12900K | |
| Intel Core i9-9900K | |
| PCMark 10 Score | 8897 pontos | |
Ajuda | ||
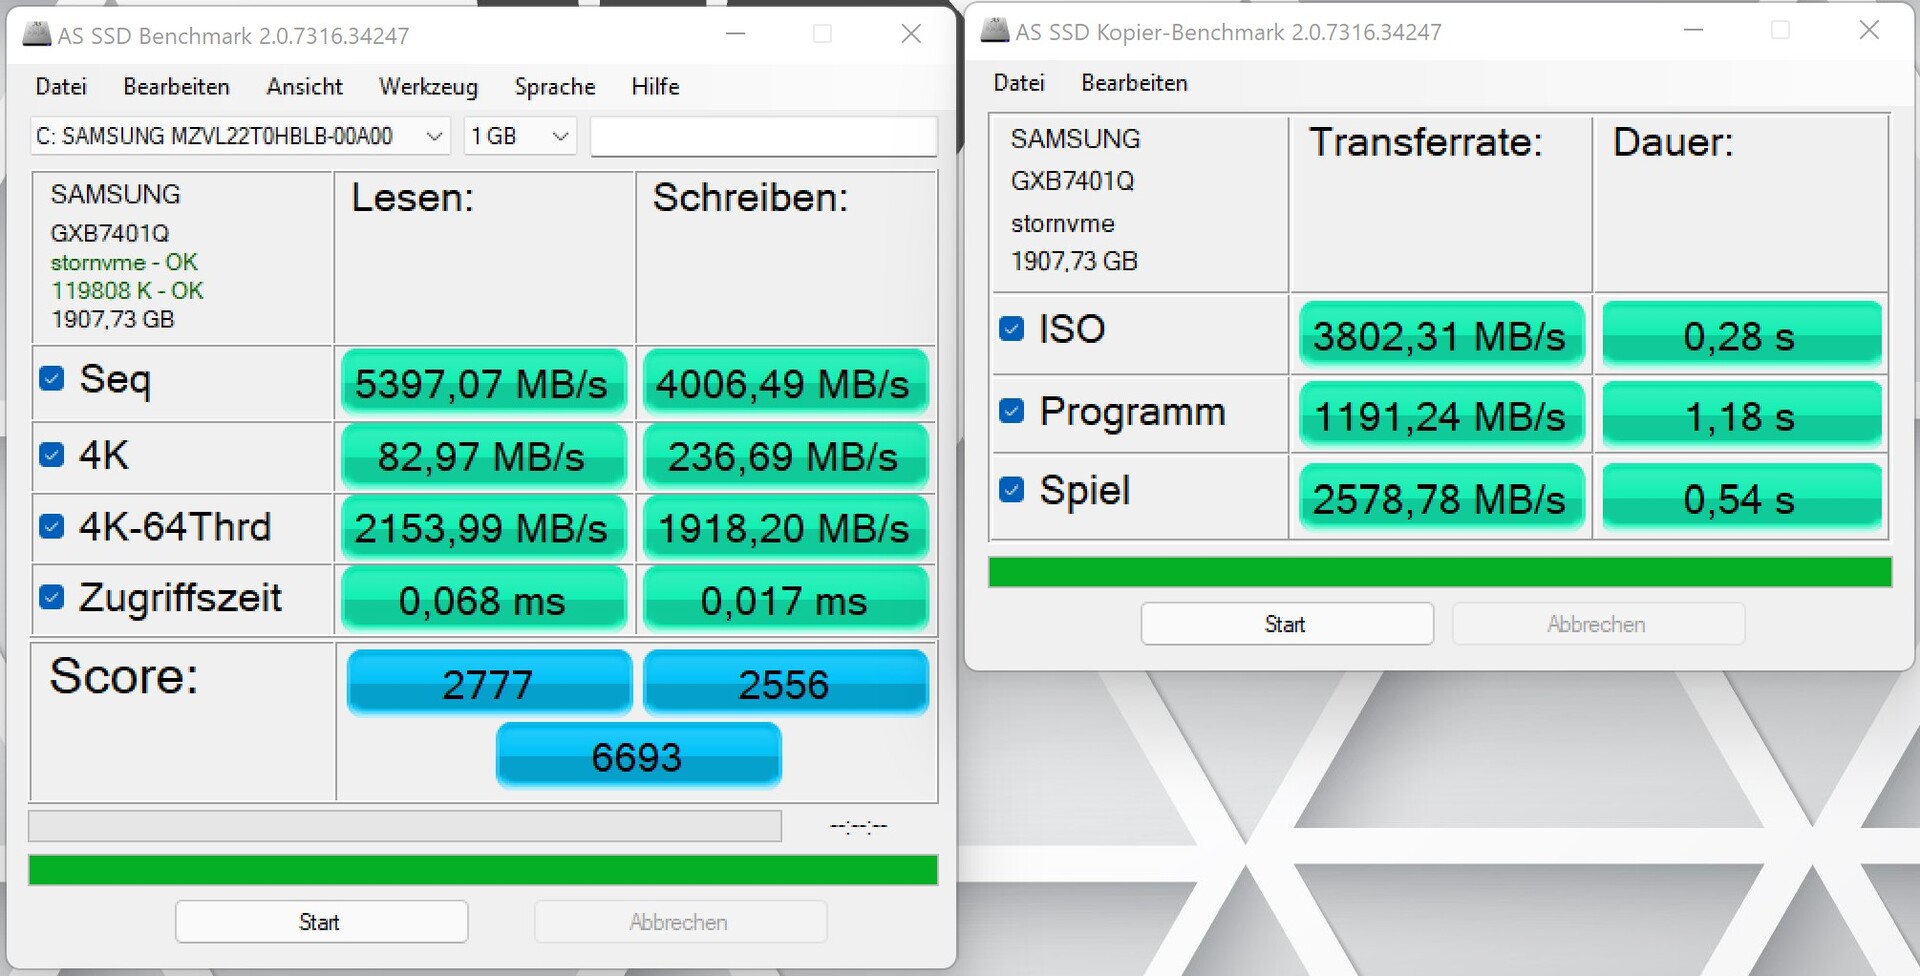
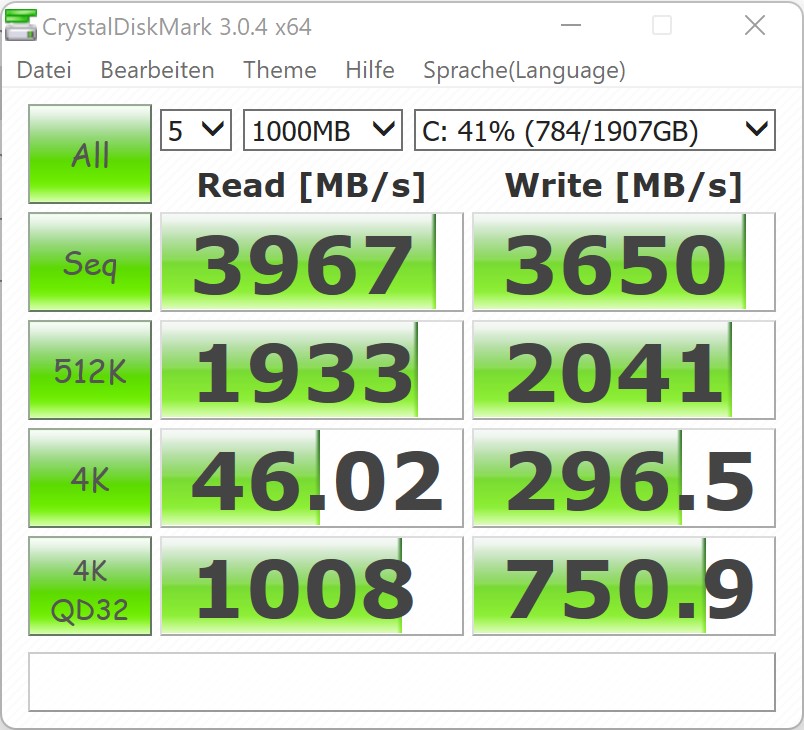
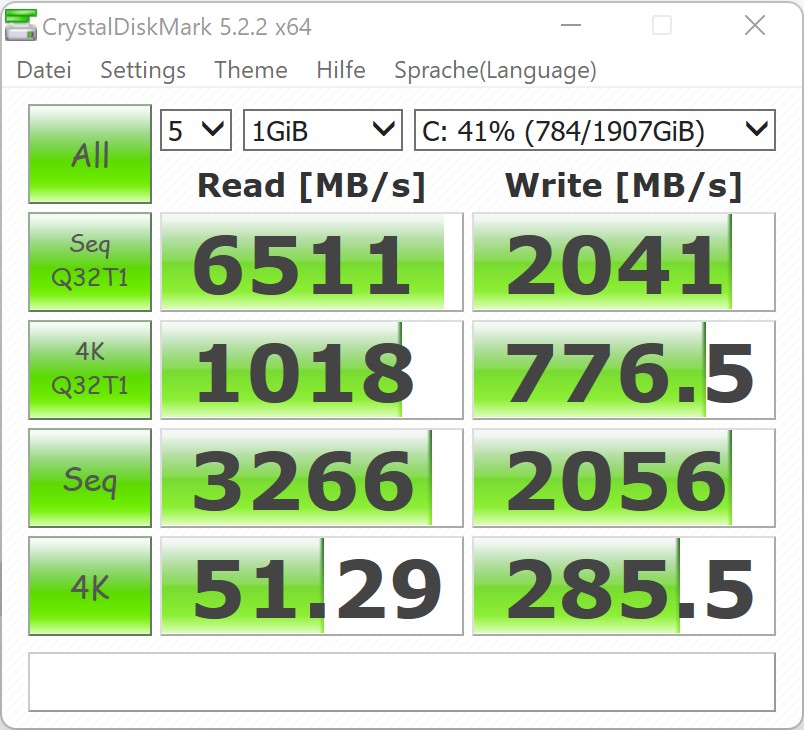
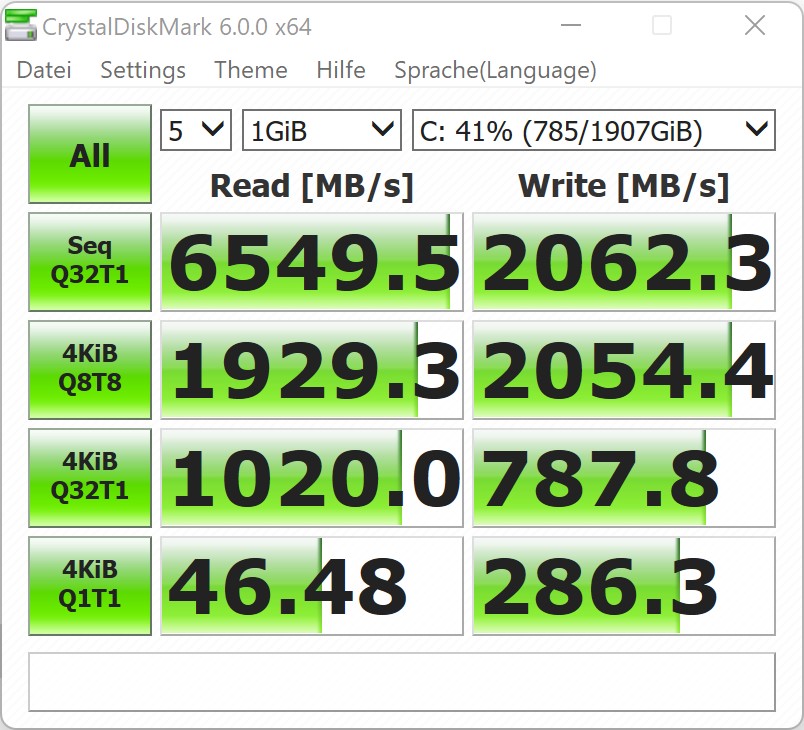
Solução de armazenamento
Como já mencionado acima, o Corsair One i160 está equipado com dois módulos de armazenamento. O sistema é instalado em um SSD PCIe rápido com 512 GB da Samsung, e há também um disco rígido convencional que oferece 2 TB de armazenamento.
No teste, o SSD da Samsung ofereceu um desempenho muito bom, beneficiando todo o sistema. Entretanto, para um desempenho geral ainda melhor, a Corsair deveria ter equipado o PC somente com SSDs. A taxa média de transferência do disco rígido da Seagate foi de 107 MB/s. Embora este valor não seja ruim, comparado a um SSD, um disco rígido tem desvantagens significativas em termos de desempenho.
Infelizmente, a caixa compacta não oferece nenhum espaço para módulos de armazenamento adicionais.

| Drive Performance rating - Percent | |
| Média da turma Desktop | |
| Corsair One i300 | |
| Média Samsung PM9A1 MZVL22T0HBLB | |
| AMD Ryzen 9 5950X | |
| Intel Beast Canyon NUC | |
| Corsair One i160 -8! | |
| Zotac Magnus One (ECM73070C) | |
* ... menor é melhor
Placa Gráfica
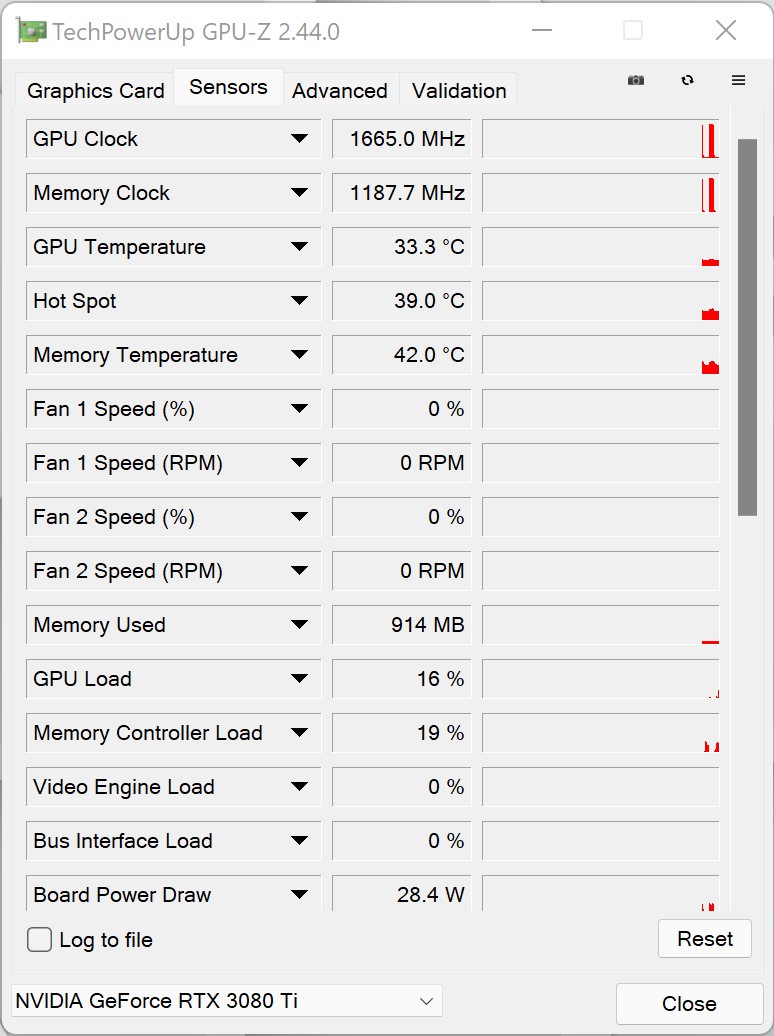
No sistema de jogo compacto, Corsair utiliza umNvidia GeForce RTX 3080 Tique é quase idêntica a uma Nvidia GeForce RTX 3090 em termos de desempenho. Entretanto, com 12 GB de VRAM, ela oferece apenas metade da RAM do modelo top da Nvidia, mas isso não importa muito com os jogos atuais. Com isto, o sistema oferece desempenho absoluto em termos de jogos. O resfriamento da placa gráfica é muito bem projetado, já que um AiO é usado como na CPU. Além disso, há também dois pequenos ventiladores na placa gráfica, a fim de fornecer algum resfriamento ativo adicional ao transformador e à VRAM. Você pode ver que este projeto funciona bem, se você der uma olhada nos benchmarks sintéticos. O Corsair One i300 também atinge os melhores valores devido ao Intel Core i9-12900K.
Em comparação com o Corsair One i160você pode esperar um aumento de desempenho de 20 a 30%.
| 3DMark 05 Standard | 63621 pontos | |
| 3DMark 06 Standard Score | 66161 pontos | |
| 3DMark Vantage P Result | 120236 pontos | |
| 3DMark 11 Performance | 47170 pontos | |
| 3DMark Ice Storm Standard Score | 336443 pontos | |
| 3DMark Cloud Gate Standard Score | 81921 pontos | |
| 3DMark Fire Strike Score | 40079 pontos | |
| 3DMark Fire Strike Extreme Score | 23109 pontos | |
| 3DMark Time Spy Score | 18985 pontos | |
Ajuda | ||
Desempenho nos jogos
Como o Corsair utiliza o hardware mais atual do One i300, ficou claro que o desempenho de jogo do sistema também está no nível superior. Atualmente, você pode desfrutar de todos os jogos sem nenhum compromisso em 2160p. Em comparação com as outras GPUs de mesa que testamos anteriormente, o desempenho de nossa unidade de teste se mostra significativamente melhor. A vantagem relativamente alta em comparação com as Nvidia GeForce RTX 3090 é devido à melhor CPU do Corsair One i300. Nosso sistema de teste de GPU é baseado em um AMD Ryzen 9 5900Xo que tem uma desvantagem significativa para a Intel Core i9-12900K.
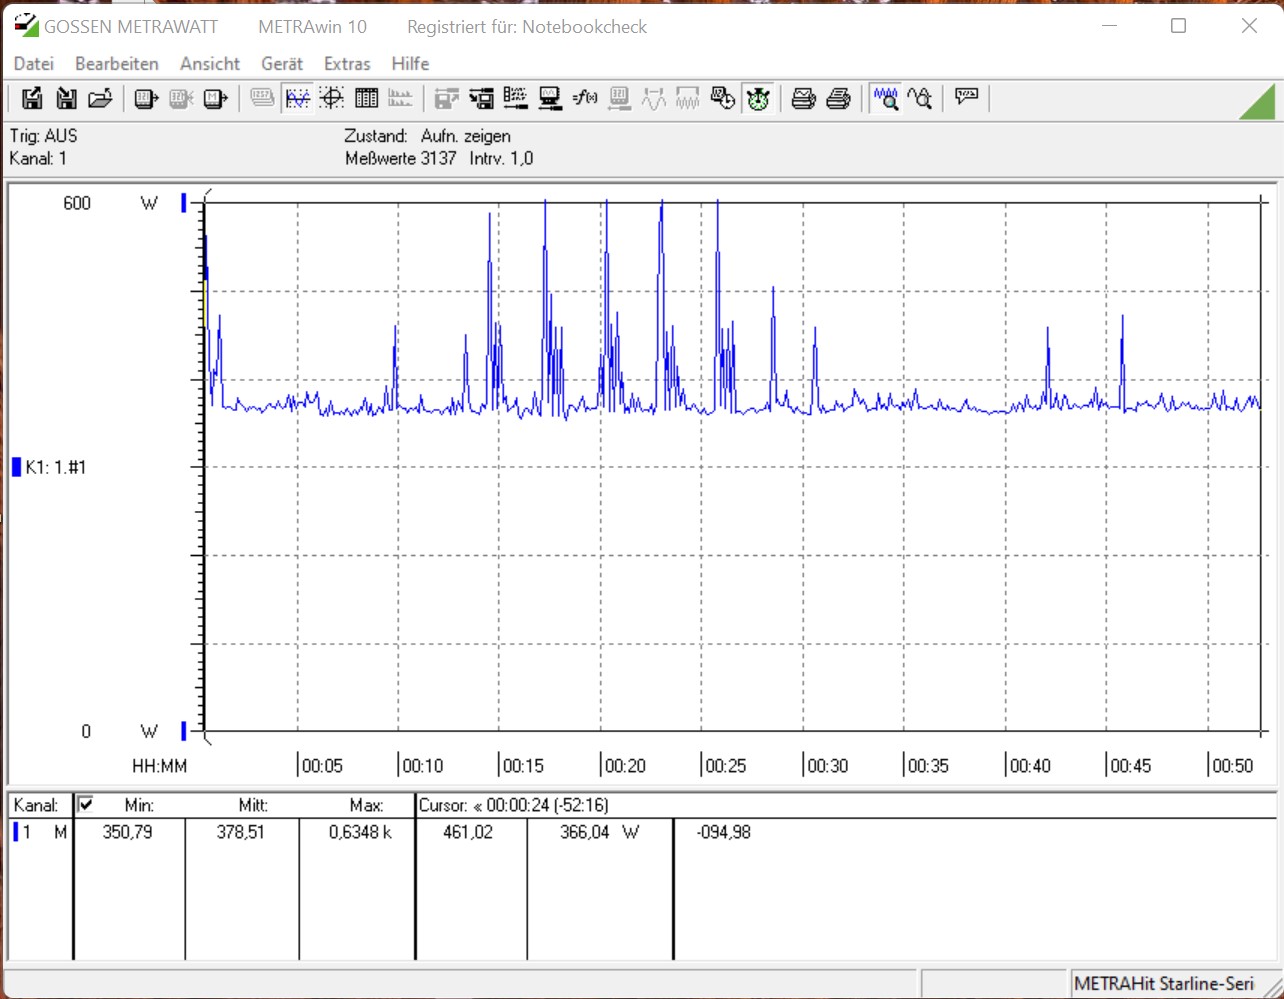
Como já nos testes da CPU, também colocamos a placa gráfica sob carga por um período de tempo mais longo. Para isso, usamos o "The Witcher 3" com o Ultra preset. Durante o teste, o desempenho da Nvidia GeForce RTX 3080 Tipermanece estável durante todo o tempo, e não notamos nenhuma queda de desempenho. Com uma média de 189 quadros por segundo, o jogo funciona muito bem, permitindo que você também utilize monitores com 165 Hz.
| The Witcher 3 | |
| 1920x1080 Ultra Graphics & Postprocessing (HBAO+) | |
| Corsair One i300 | |
| Média NVIDIA GeForce RTX 3090 (160 - 192.6, n=18) | |
| Média AMD Radeon RX 6800 (152.1 - 156, n=3) | |
| Média NVIDIA GeForce RTX 3080 (145 - 152, n=2) | |
| Média NVIDIA Titan RTX (124 - 150, n=28) | |
| Média AMD Radeon RX 6700 XT (117 - 130.4, n=3) | |
| Média NVIDIA GeForce RTX 3070 (52.8 - 132.2, n=7) | |
| 3840x2160 High Graphics & Postprocessing (Nvidia HairWorks Off) | |
| Média NVIDIA GeForce RTX 3090 (128 - 160.2, n=14) | |
| Corsair One i300 | |
| Média NVIDIA GeForce RTX 3080 (114 - 115, n=2) | |
| Média NVIDIA Titan RTX (94 - 107.1, n=28) | |
| Média AMD Radeon RX 6800 (96.8 - 100.7, n=3) | |
| Média NVIDIA GeForce RTX 3070 (84 - 93.9, n=5) | |
| Média AMD Radeon RX 6700 XT (63 - 75.7, n=3) | |
| Rise of the Tomb Raider | |
| 1920x1080 Very High Preset AA:FX AF:16x | |
| Média NVIDIA GeForce RTX 3090 (240 - 254, n=2) | |
| Média NVIDIA GeForce RTX 3080 (217 - 233, n=2) | |
| Corsair One i300 | |
| Média NVIDIA Titan RTX (n=1) | |
| Média AMD Radeon RX 6800 (n=1) | |
| Média NVIDIA GeForce RTX 3070 (151 - 169, n=3) | |
| Média AMD Radeon RX 6700 XT (n=1) | |
| 3840x2160 High Preset AA:FX AF:4x | |
| Média NVIDIA GeForce RTX 3090 (128 - 128.1, n=2) | |
| Corsair One i300 | |
| Média NVIDIA GeForce RTX 3080 (107 - 114, n=2) | |
| Média NVIDIA Titan RTX (n=1) | |
| Média AMD Radeon RX 6800 (n=1) | |
| Média NVIDIA GeForce RTX 3070 (76.7 - 83.8, n=3) | |
| Média AMD Radeon RX 6700 XT (n=1) | |
| Far Cry 6 | |
| 1920x1080 Ultra Graphics Quality + HD Textures AA:T | |
| Corsair One i300 | |
| Média NVIDIA GeForce RTX 3090 (94 - 177.6, n=10) | |
| Média AMD Radeon RX 6800 (116 - 152.5, n=3) | |
| Média NVIDIA Titan RTX (94.7 - 138.9, n=6) | |
| Média AMD Radeon RX 6700 XT (102 - 136.6, n=3) | |
| Média NVIDIA GeForce RTX 3070 (91 - 114.2, n=2) | |
| Média NVIDIA GeForce RTX 3080 (n=1) | |
| 3840x2160 Ultra Graphics Quality + HD Textures AA:T | |
| Média NVIDIA GeForce RTX 3090 (77 - 86.7, n=10) | |
| Corsair One i300 | |
| Média NVIDIA GeForce RTX 3080 (n=1) | |
| Média AMD Radeon RX 6800 (68.1 - 69.7, n=3) | |
| Média NVIDIA Titan RTX (52.8 - 64.2, n=6) | |
| Média AMD Radeon RX 6700 XT (50 - 52.7, n=3) | |
| Média NVIDIA GeForce RTX 3070 (26.4 - 57, n=2) | |
| Anno 1800 | |
| 1920x1080 Ultra Graphics Quality (DX11) | |
| Corsair One i300 | |
| Média NVIDIA GeForce RTX 3090 (51.5 - 85.5, n=4) | |
| Média NVIDIA GeForce RTX 3070 (46.5 - 74.7, n=3) | |
| Média NVIDIA GeForce RTX 3080 (54 - 54.1, n=2) | |
| Média AMD Radeon RX 6800 (n=1) | |
| Média AMD Radeon RX 6700 XT (n=1) | |
| Média NVIDIA Titan RTX (33.9 - 54.5, n=2) | |
| 3840x2160 Ultra Graphics Quality (DX11) | |
| Média NVIDIA GeForce RTX 3090 (51.3 - 87.4, n=4) | |
| Corsair One i300 | |
| Média NVIDIA GeForce RTX 3080 (43.2 - 46.3, n=2) | |
| Média AMD Radeon RX 6800 (n=1) | |
| Média NVIDIA GeForce RTX 3070 (34.3 - 41.8, n=3) | |
| Média NVIDIA Titan RTX (33 - 40.4, n=2) | |
| Média AMD Radeon RX 6700 XT (n=1) | |
| F1 2021 | |
| 1920x1080 Ultra High Preset + Raytracing AA:T AF:16x | |
| Corsair One i300 | |
| Média NVIDIA GeForce RTX 3090 (154 - 244, n=13) | |
| Média AMD Radeon RX 6800 (167 - 175.5, n=3) | |
| Média NVIDIA Titan RTX (160 - 172, n=6) | |
| Média NVIDIA GeForce RTX 3070 (148 - 158, n=2) | |
| Média NVIDIA GeForce RTX 3080 (n=1) | |
| Média AMD Radeon RX 6700 XT (143 - 145.2, n=3) | |
| 3840x2160 Ultra High Preset + Raytracing AA:T AF:16x | |
| Média NVIDIA GeForce RTX 3090 (100.4 - 110, n=13) | |
| Corsair One i300 | |
| Média NVIDIA GeForce RTX 3080 (n=1) | |
| Média NVIDIA Titan RTX (71.9 - 74.5, n=6) | |
| Média AMD Radeon RX 6800 (71.8 - 74, n=3) | |
| Média NVIDIA GeForce RTX 3070 (64 - 67.3, n=2) | |
| Média AMD Radeon RX 6700 XT (56.3 - 56.9, n=3) | |
| New World | |
| 1920x1080 Very High Video Quality | |
| Corsair One i300 | |
| Média NVIDIA Titan RTX (n=1) | |
| Média AMD Radeon RX 6700 XT (n=1) | |
| Média NVIDIA GeForce RTX 3070 (68.6 - 117.5, n=2) | |
| Média NVIDIA GeForce RTX 3090 (70.1 - 126, n=3) | |
| Média AMD Radeon RX 6800 (n=1) | |
| Média NVIDIA GeForce RTX 3080 (n=1) | |
| 3840x2160 Very High Video Quality | |
| Corsair One i300 | |
| Média NVIDIA GeForce RTX 3090 (n=1) | |
| Média NVIDIA GeForce RTX 3080 (n=1) | |
| Média NVIDIA Titan RTX (n=1) | |
| Média NVIDIA GeForce RTX 3070 (48.9 - 52.6, n=2) | |
| Média AMD Radeon RX 6800 (n=1) | |
| Média AMD Radeon RX 6700 XT (n=1) | |
The Witcher 3 FPS Chart
| baixo | média | alto | ultra | QHD | 4K | |
|---|---|---|---|---|---|---|
| GTA V (2015) | 187 | 187 | 187 | 149 | 147 | 180 |
| The Witcher 3 (2015) | 681 | 554 | 365 | 183 | 149 | |
| Dota 2 Reborn (2015) | 240.3 | 214.8 | 207.6 | 196.1 | 191.5 | |
| Rise of the Tomb Raider (2016) | 487 | 340 | 257 | 221 | 114 | |
| Final Fantasy XV Benchmark (2018) | 232 | 227 | 175 | 136 | 84 | |
| X-Plane 11.11 (2018) | 205 | 178 | 135 | 118 | ||
| Far Cry 5 (2018) | 230 | 200 | 190 | 175 | 168 | 108 |
| Strange Brigade (2018) | 667 | 484 | 392 | 345 | 260 | 156 |
| Shadow of the Tomb Raider (2018) | 245 | 226 | 226 | 212 | 164 | 93.7 |
| Far Cry New Dawn (2019) | 190 | 165 | 157 | 141 | 137 | 107 |
| Metro Exodus (2019) | 258 | 212 | 169 | 137 | 113 | 75 |
| Anno 1800 (2019) | 159 | 163 | 124 | 69.4 | 66.1 | 55.9 |
| Control (2019) | 240 | 233 | 187 | 124 | 63.9 | |
| Borderlands 3 (2019) | 208 | 181 | 167 | 152 | 125 | 72 |
| F1 2020 (2020) | 478 | 379 | 397 | 298 | 233 | 143 |
| F1 2021 (2021) | 534 | 498 | 410 | 219 | 170 | 101 |
| New World (2021) | 194 | 165 | 153 | 142 | 133 | 79.2 |
| Far Cry 6 (2021) | 200 | 176 | 155 | 149 | 129 | 81.6 |
| Guardians of the Galaxy (2021) | 194 | 196 | 191 | 191 | 186 | 110 |
| Riders Republic (2021) | 284 | 220 | 188 | 176 | 136 | 80 |
| Forza Horizon 5 (2021) | 292 | 200 | 188 | 126 | 111 | 84 |
| Battlefield 2042 (2021) | 216 | 194 | 169 | 150 | 123 | 83 |
| Farming Simulator 22 (2021) | 349 | 270 | 226 | 203 | 201 | 157 |
| Halo Infinite (2021) | 229 | 198 | 188 | 142 | 83.1 | |
| God of War (2022) | 209 | 181 | 163 | 117 | 98.7 | 64.7 |
| Rainbow Six Extraction (2022) | 365 | 353 | 348 | 282 | 194 | 104 |
| Dying Light 2 (2022) | 189 | 164 | 149 | 109 | 61.5 |
Emissões
Emissões sonoras
O resfriamento do Corsair One i300 é baseado no mesmo método que o do Corsair One i160. Em operação 2D, o sistema funciona relativamente silenciosamente a cerca de 32,6 dB(A). Neste ponto, o grande ventilador de 140 mm ainda não funciona, mas pode-se ouvir as duas bombas da AiO e seu som permanece sempre presente. Infelizmente, isto não é muito agradável a longo prazo. Deve haver também algumas bombas que podem fazer seu trabalho enquanto permanecem significativamente mais silenciosas. Sob carga, o ventilador de 140 mm na tampa da caixa também começará a funcionar após um curto período de tempo. A 44 dB(A) durante o teste de esforço, o sistema pode então ser ouvido claramente. Enquanto joga, ele ainda fica um pouco mais alto a um pouco mais de 46 dB(A).
Barulho
| Ocioso |
| 32.4 / 32.5 / 32.6 dB |
| Carga |
| / 44.13 dB |
 | ||
30 dB silencioso 40 dB(A) audível 50 dB(A) ruidosamente alto |
||
min: | ||
Temperatura e consumo de energia
A caixa maciça oferece uma área de superfície muito grande para permitir a transferência de calor. Sob carga, isto aquece notavelmente, e o chamado efeito chaminé assegura que o ar frio seja puxado para dentro pelos lados e guiado diretamente pelas aletas de resfriamento dos dois AiOs para depois ser empurrado para fora da caixa pelo grande ventilador de 140 mm no topo. Para um resfriamento efetivo da placa gráfica, este é equipado adicionalmente com dois ventiladores menores para resfriar o transformador e a VRAM.
Este conceito de resfriamento funciona bem, e todos os componentes são resfriados efetivamente, sem superaquecimento sob carga total. Entretanto, a CPU ainda atingiu 100 °C (212 °F) durante o teste de esforço. Isto mostra porque o Corsair estrangula seu desempenho a um máximo de 175 watts. Aqueles para os quais os 100 °C ainda estão muito quentes também podem reduzir ainda mais o desempenho na BIOS. No entanto, as temperaturas do Intel Core i9-12900Kainda não apresentam nenhum problema, como já descobrimos durante o Cinebench R15 Multi loop. O teste de estresse com FurMark e Prime95 funcionando ao mesmo tempo representa um cenário extremo que dificilmente deveria acontecer no dia-a-dia da operação
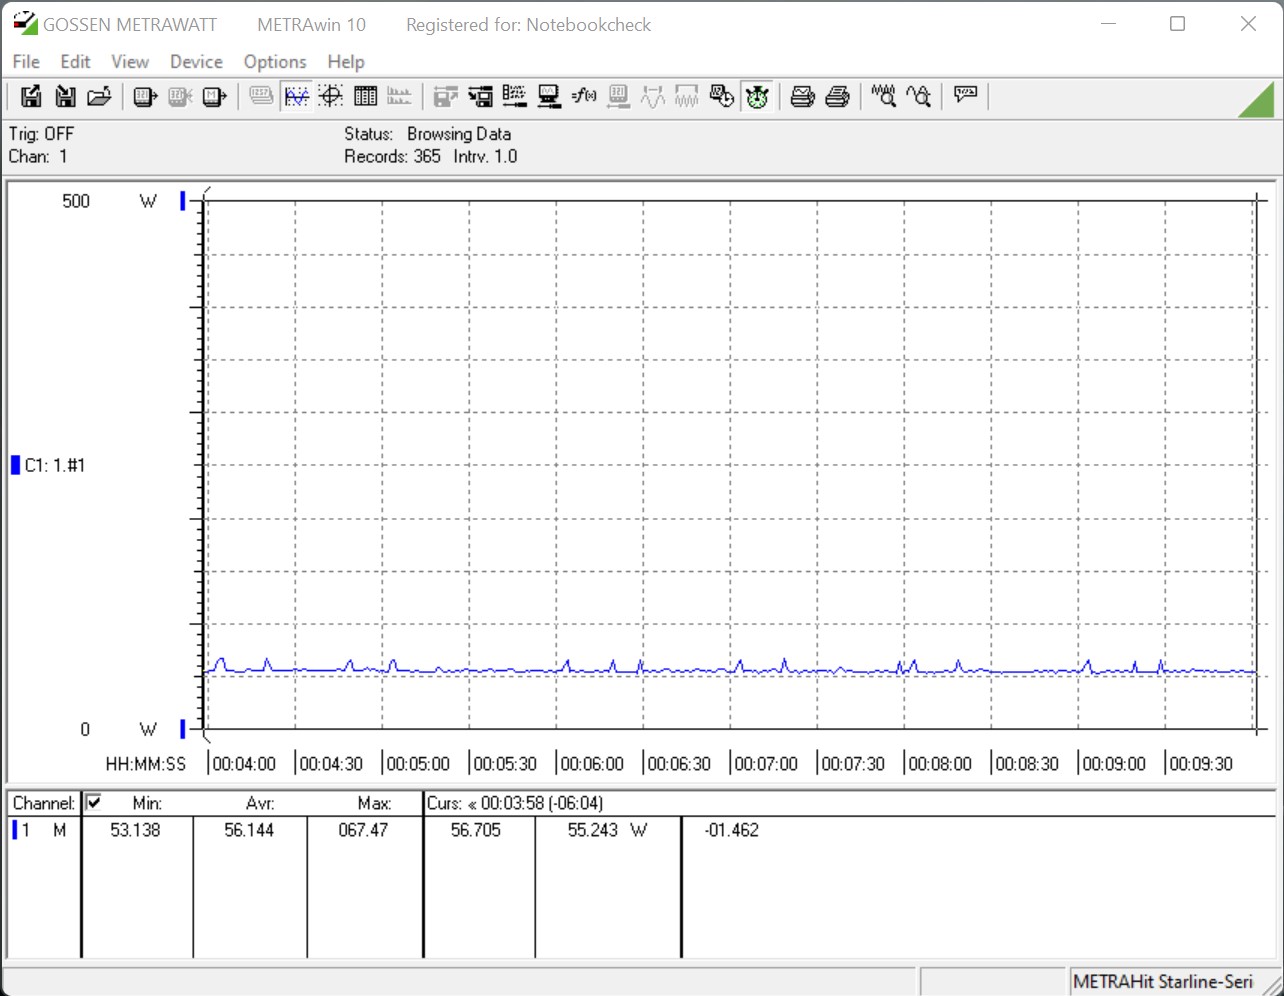
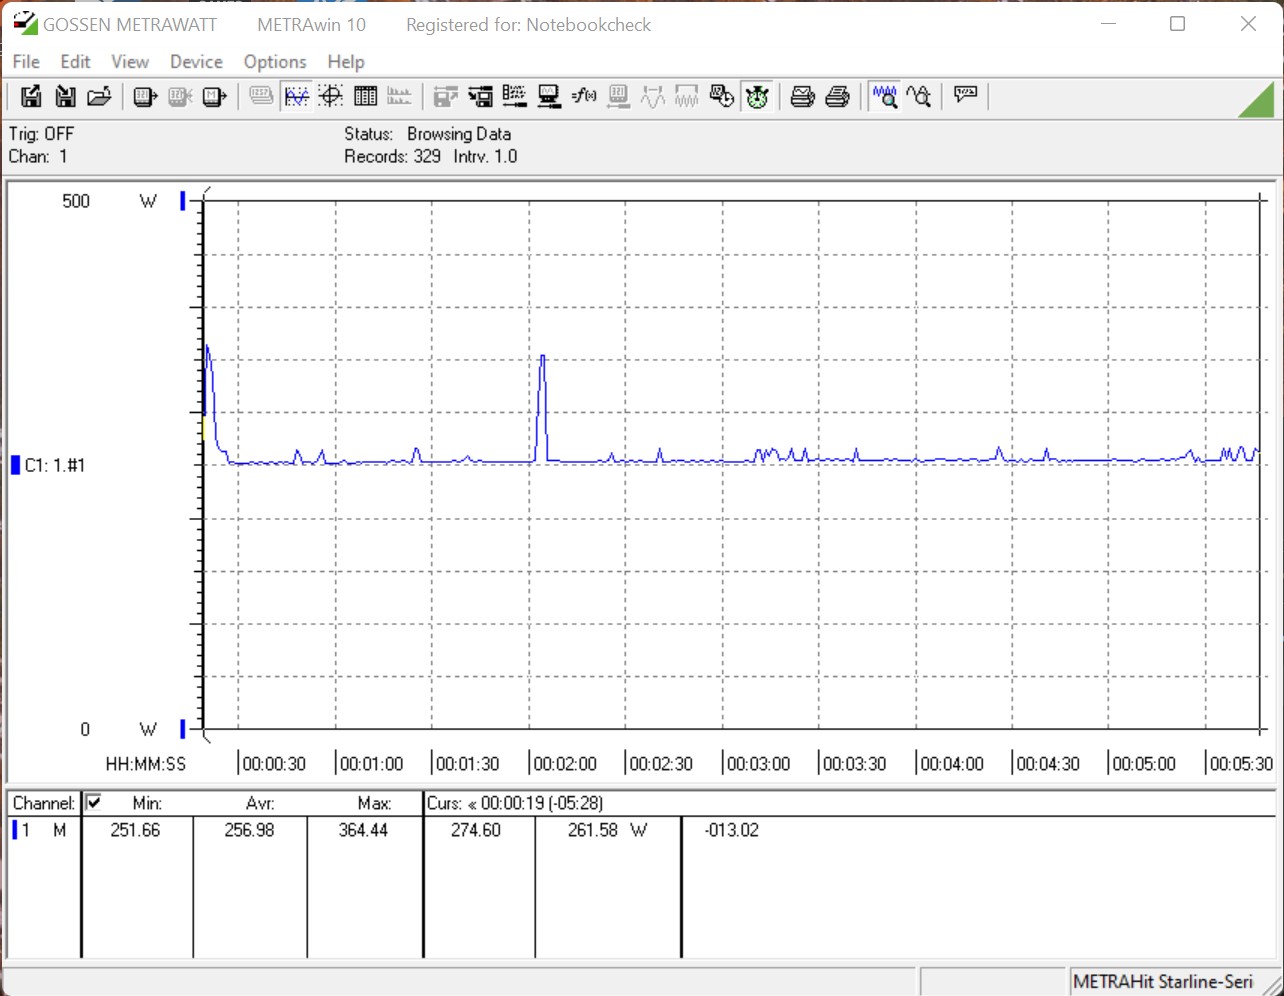
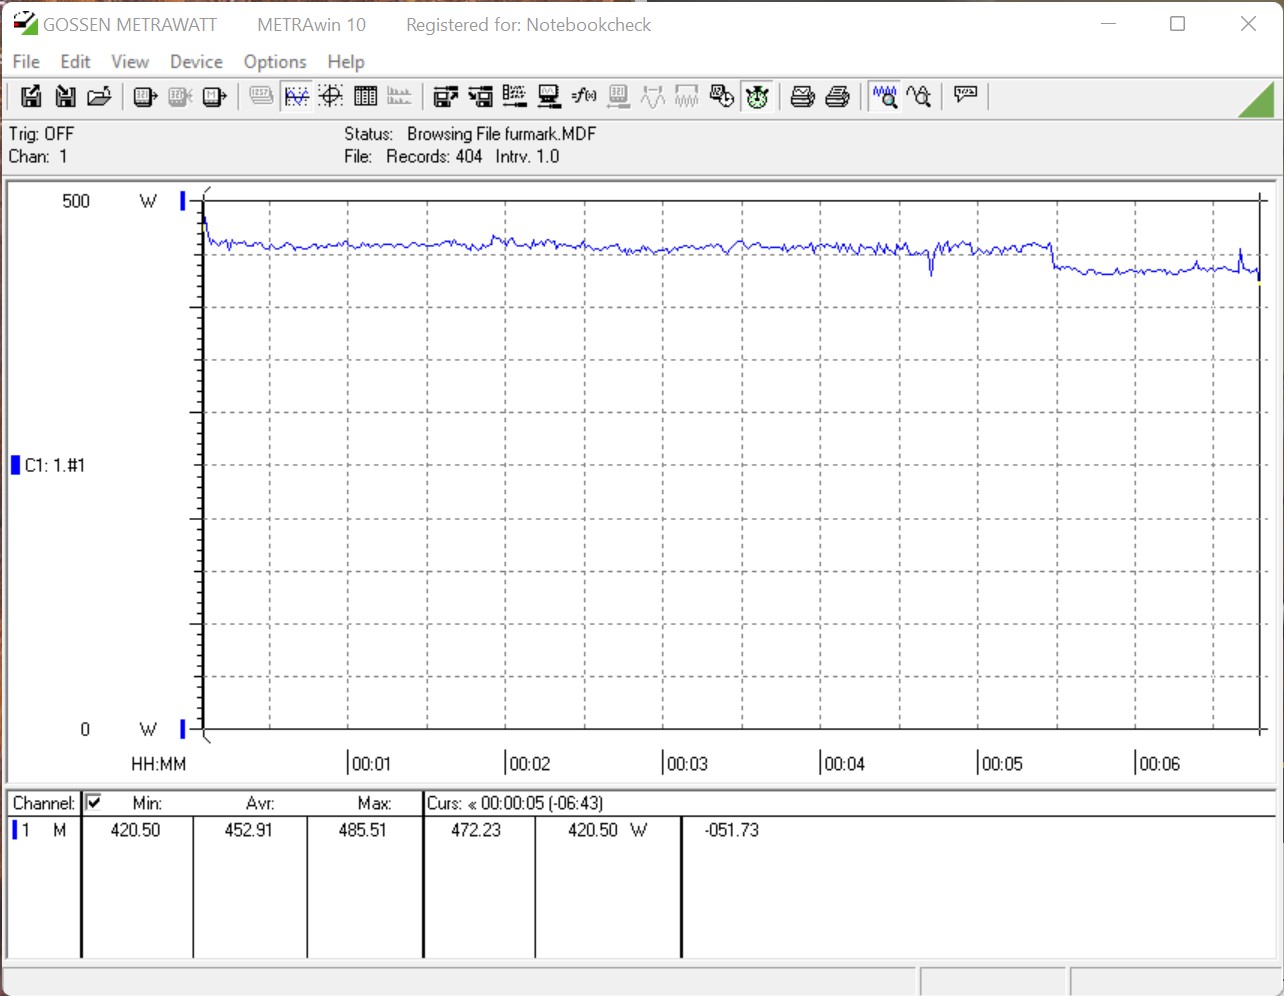
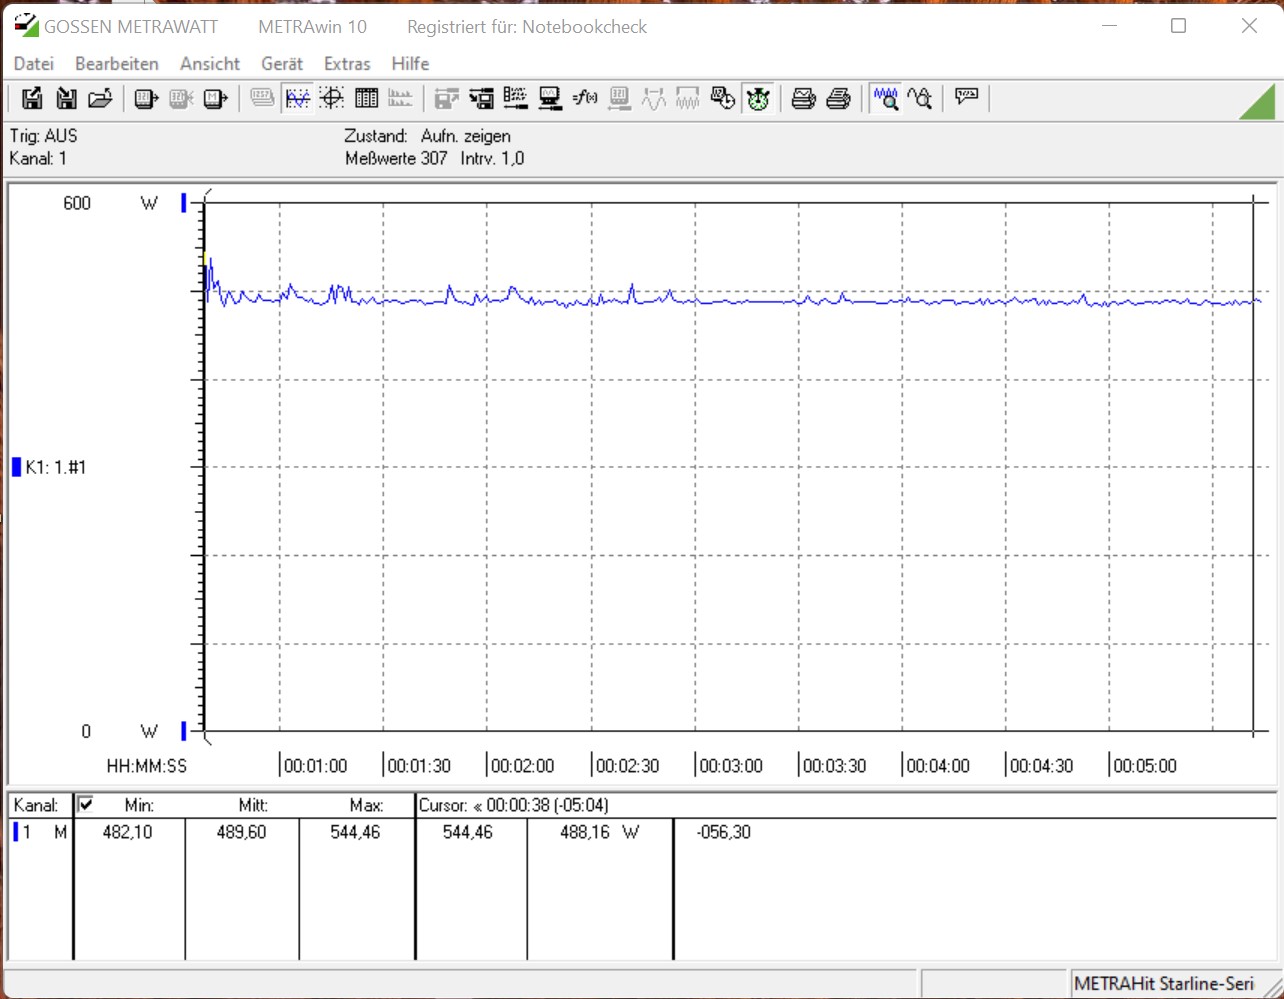
Em termos de consumo de energia, o sistema se destaca com um baixo consumo durante a operação ociosa. Apenas 56 watts é um bom valor. Enquanto o jogo, a fonte de energia compacta de 750 watts (construída pela SFF) tem que fornecer 489 watts em média, com os picos atingindo até 544 watts. Durante o teste de estresse, medimos até mesmo brevemente 635 watts. A fonte de alimentação sempre foi capaz de lidar com isso, e não notamos nenhum problema.
| Power Consumption - 1920x1080 The Witcher 3 ultra (external Monitor) | |
| Intel Core i9-12900K, NVIDIA GeForce RTX 3080 Ti | |
| Intel Core i9-12900K, NVIDIA Titan RTX (Idle: 70.5 W) | |
| AMD Ryzen 9 5950X, NVIDIA Titan RTX (Idle: 78 W) | |
| AMD Ryzen 9 5900X, NVIDIA Titan RTX (Idle: 78.1 W) | |
| Intel Core i5-11600K, NVIDIA Titan RTX (Idle: 69.49 W) | |
| Intel Core i5-12600K, NVIDIA Titan RTX (Idle: 70.45 W) | |
| Intel Core i9-11900K, NVIDIA Titan RTX (Idle: 57.3 W) | |
* ... menor é melhor
| Power Consumption - 1280x720 FurMark 1.19 GPU Stress Test (external Monitor) | |
| AMD Ryzen 9 5900X, NVIDIA GeForce RTX 3090 (Idle: 105.9 W) | |
| AMD Ryzen 9 5900X, NVIDIA GeForce RTX 3080 (Idle: 88.3 W) | |
| Intel Core i9-12900K, NVIDIA GeForce RTX 3080 Ti | |
| AMD Ryzen 9 5950X, AMD Radeon RX 6800 XT (Idle: 99.5 W) | |
| AMD Ryzen 9 5900X, NVIDIA GeForce RTX 3070 (Idle: 95.1 W) | |
| AMD Ryzen 9 5900X, AMD Radeon RX 6800 (Idle: 81.4 W) | |
| AMD Ryzen 9 5900X, AMD Radeon RX 6700 XT (Idle: 77.1 W) | |
* ... menor é melhor
Power consumption The Witcher 3 / stress test
Power consumption with external monitor
Veredicto - Um PC de jogo 4K perfeito
Pro
Contra
Embora o Corsair One i300 não seja uma novidade completa, isto não é absolutamente necessário. O visual do PC Premium compacto é simples e moderno. Além disso, o design interno permite o uso de componentes convencionais em termos de placa principal e fonte de alimentação. Somente o sistema de resfriamento é um projeto interno. Em nosso modelo de teste, infelizmente, ele não faz justiça ao segmento premium. No entanto, os dois AiOs funcionam bem, resfriando o sistema de forma confiável. No entanto, as duas bombas se tornaram acusticamente perceptíveis. A longo prazo, isto é desagradável e considerando o preço de compra de 5099 euros (~$5722), também não é algo que se tenha que aceitar. Mas o projeto do sistema de resfriamento ainda é o destaque, além dos componentes mais atuais. Com o Intel Core i9-12900Khá a CPU de jogos mais rápida, que combinada com uma placa principal atual, incluindo DDR5 RAM e umNvidia GeForce RTX 3080 Tipermite jogos 4K sem qualquer tipo de compromisso. Além disso, há também um SSD de 2 TB com taxas de transferência muito boas.
Graças a um Intel Core i9-12900K e Nvidia GeForce RTX 3080 Ti, oCorsair One i300 ofereceum desempenho de jogo de4K
utilizando a menor quantidade de espaço.
Um produto premium também tem, naturalmente, seu preço. Com 5099 euros (~5722) para nossa unidade de teste, isto não é exatamente barato, e ainda assim não devemos falar mal dos componentes separados. O estojo não está pronto para venda e não pode ser adquirido separadamente. Além disso, a disponibilidade de várias placas gráficas e outros componentes atuais ainda é um problema, o que quase torna o preço globalmente justificável. O sistema também está equipado com dois AiOs que foram especificamente desenvolvidos para a série Corsair One. Isto tem que ser levado em consideração ao considerar o preço. Entretanto, em nossa opinião, o Corsair One i300 com um Intel Core i9-12900K e Nvidia GeForce RTX 3080 seria o sistema mais razoável em termos de preço. Mas então a RAM e o SSD seriam apenas metade do tamanho com 32 GB e 1 TB respectivamente. Um sistema com esses componentes está disponível por 4099 euros ($4562). O déficit de desempenho do Nvidia GeForce RTX 3080 em comparação com o modelo Ti é limitado e aceitável.
Preço e Disponibilidade
No momento deste teste, o dispositivo pode ser adquirido diretamente de Corsair por $5000. Alternativamente, o modelo menor também pode ser adquirido em Amazon por $4000.

