Gigabyte A7 X1 em revisão: O laptop para jogos oferece um desempenho estável de resistência

Com o Gigabyte G5 KC, revisamos recentemente um laptop do fabricante que custa pouco menos de 1.000 Euros (~$1.162), mas que ainda é um dispositivo poderoso. Com preços em torno de 2.400 Euros (~$2.789), o Gigabyte também oferece modelos consideravelmente mais caros, como o Aero 15 OLED XD.
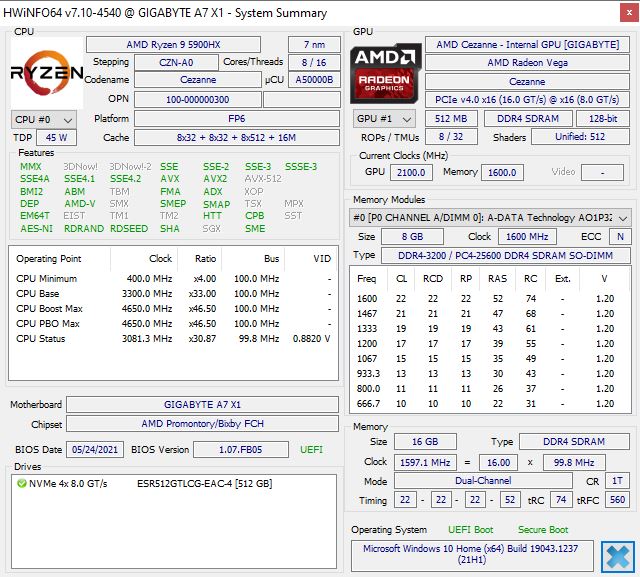
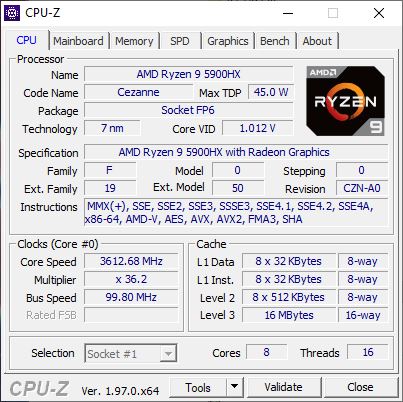
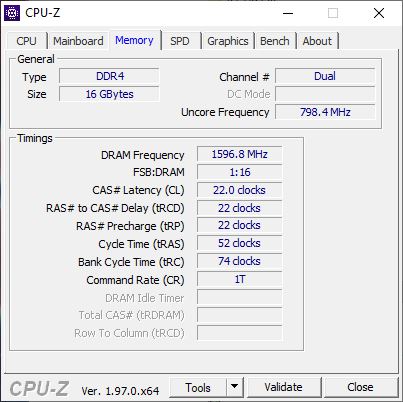
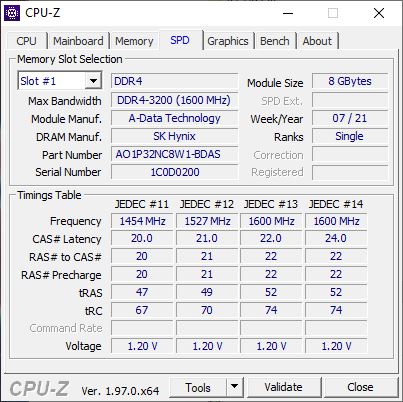
Nossa amostra de revisão atual está no meio em termos de preços em torno de 1.800 Euros (~$2.092) e está equipada com umAMD Ryzen 9 5900HX e um Nvidia GeForce RTX 3070. Também vem com 16 GB de RAM e um SSD de 512 GB
Possible contenders in comparison
Avaliação | Data | Modelo | Peso | Altura | Size | Resolução | Preço |
|---|---|---|---|---|---|---|---|
| 83.2 % v7 (old) | 10/2021 | Gigabyte A7 X1 R9 5900HX, GeForce RTX 3070 Laptop GPU | 2.5 kg | 34 mm | 17.30" | 1920x1080 | |
| 85 % v7 (old) | 07/2021 | Medion Erazer Beast X25 R9 5900HX, GeForce RTX 3080 Laptop GPU | 2.3 kg | 23 mm | 17.30" | 1920x1080 | |
| 85.5 % v7 (old) | 07/2021 | Medion Erazer Beast X20 i7-10870H, GeForce RTX 3070 Laptop GPU | 2.2 kg | 23 mm | 17.30" | 2560x1440 | |
| 82.8 % v7 (old) | 06/2021 | Asus TUF Gaming F17 FX706HM i9-11900H, GeForce RTX 3060 Laptop GPU | 2.7 kg | 26 mm | 17.30" | 1920x1080 | |
| 85.1 % v7 (old) | 01/2021 | Schenker XMG Neo 17 (Early 2021, RTX 3070, 5800H) R7 5800H, GeForce RTX 3070 Laptop GPU | 2.5 kg | 27 mm | 17.30" | 2560x1440 |
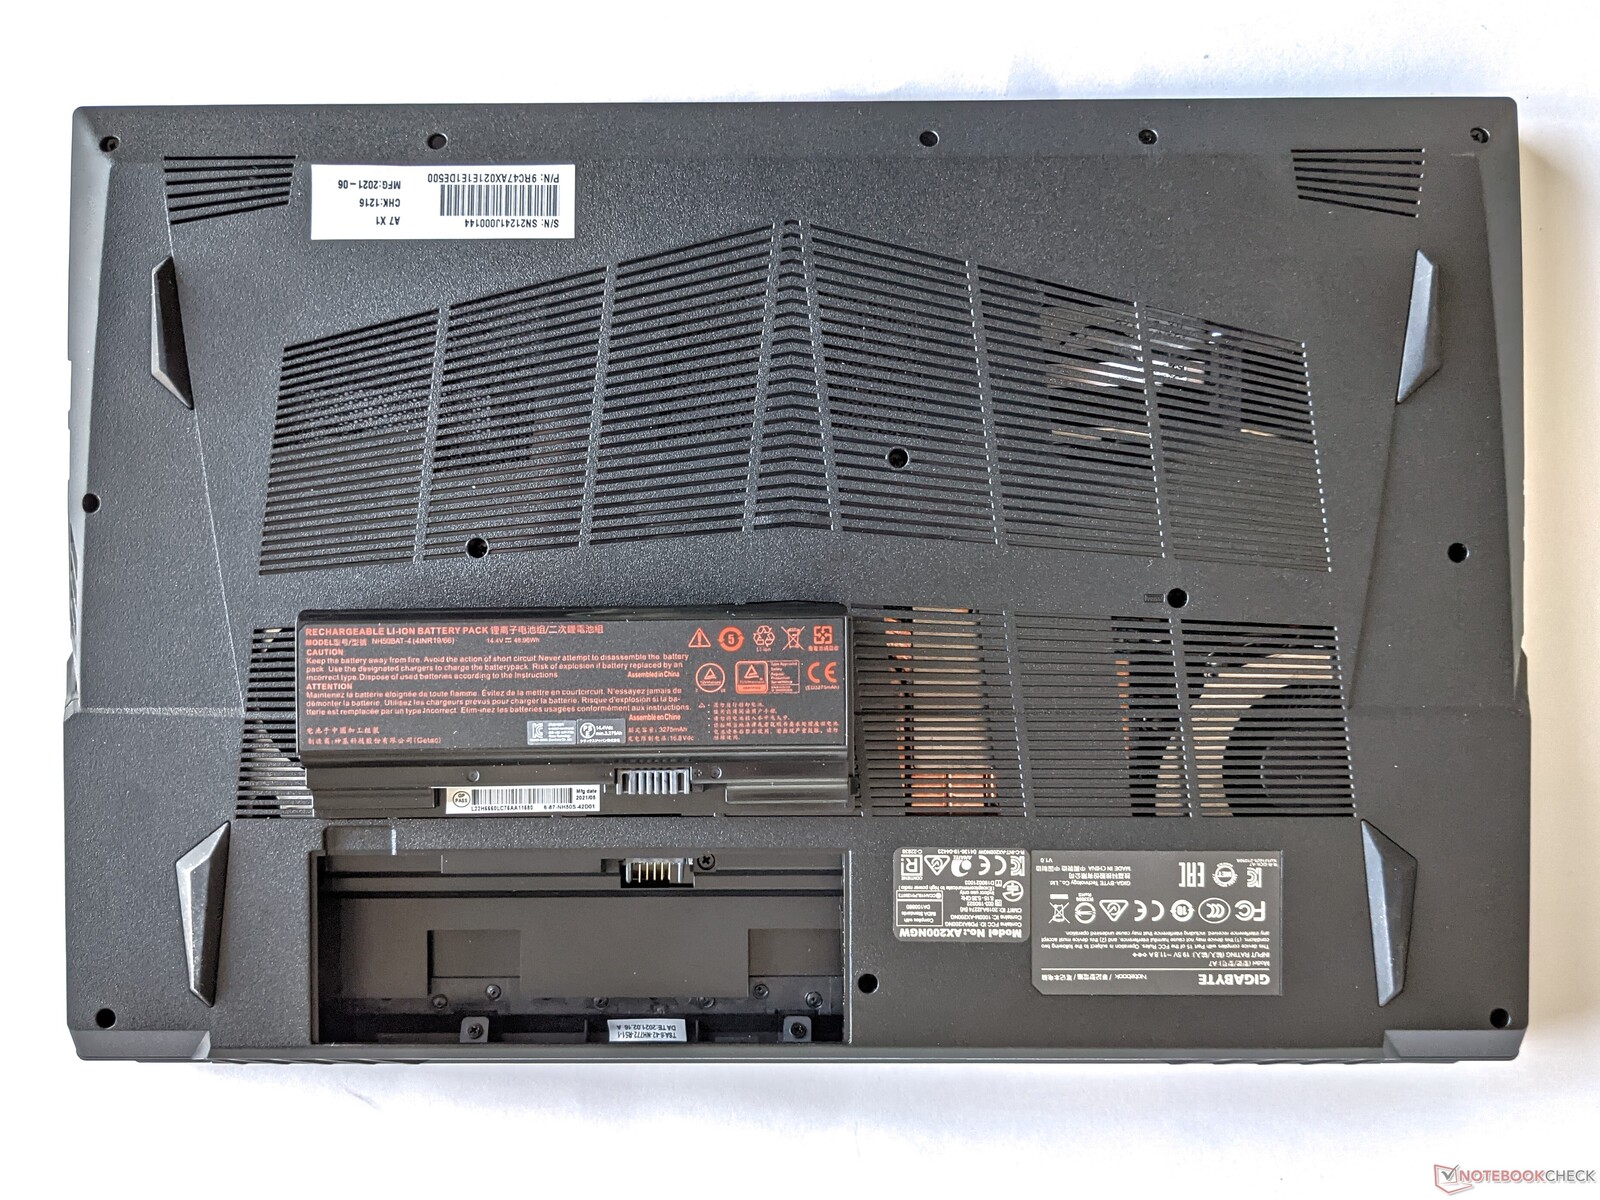
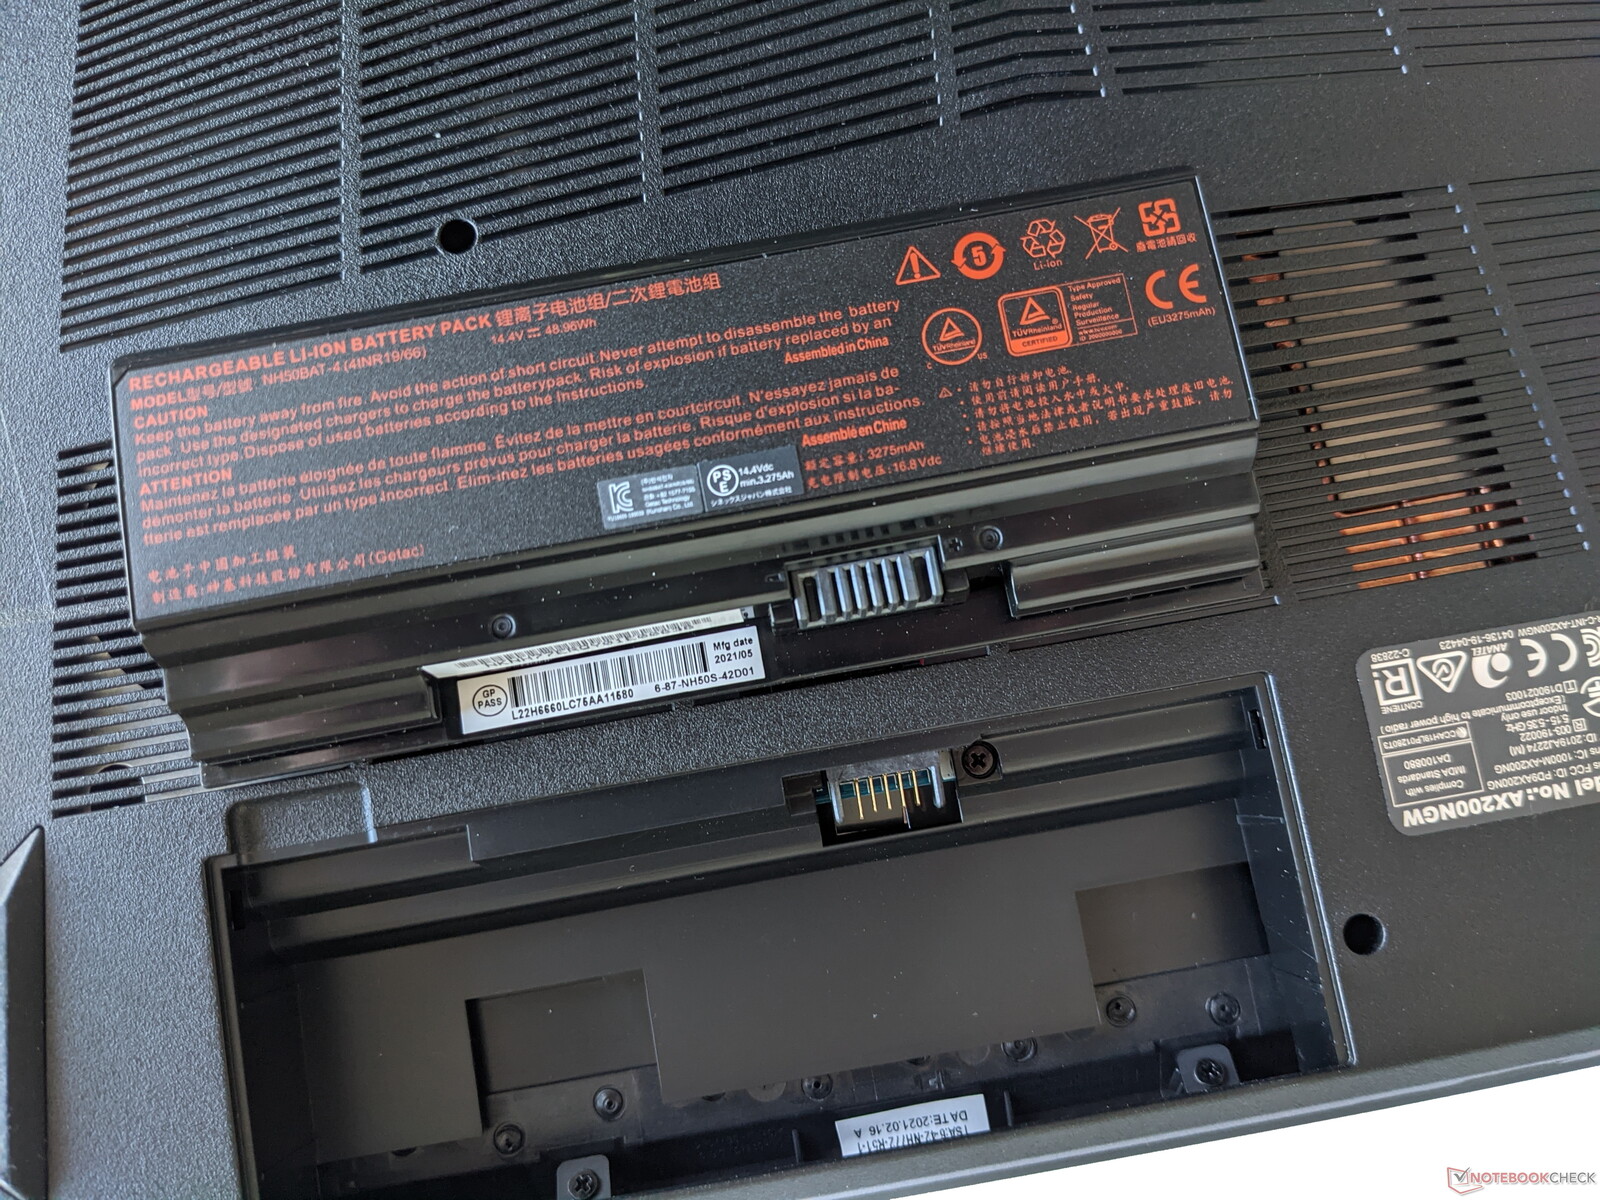
Estojo - Laptop de jogos com bateria substituível
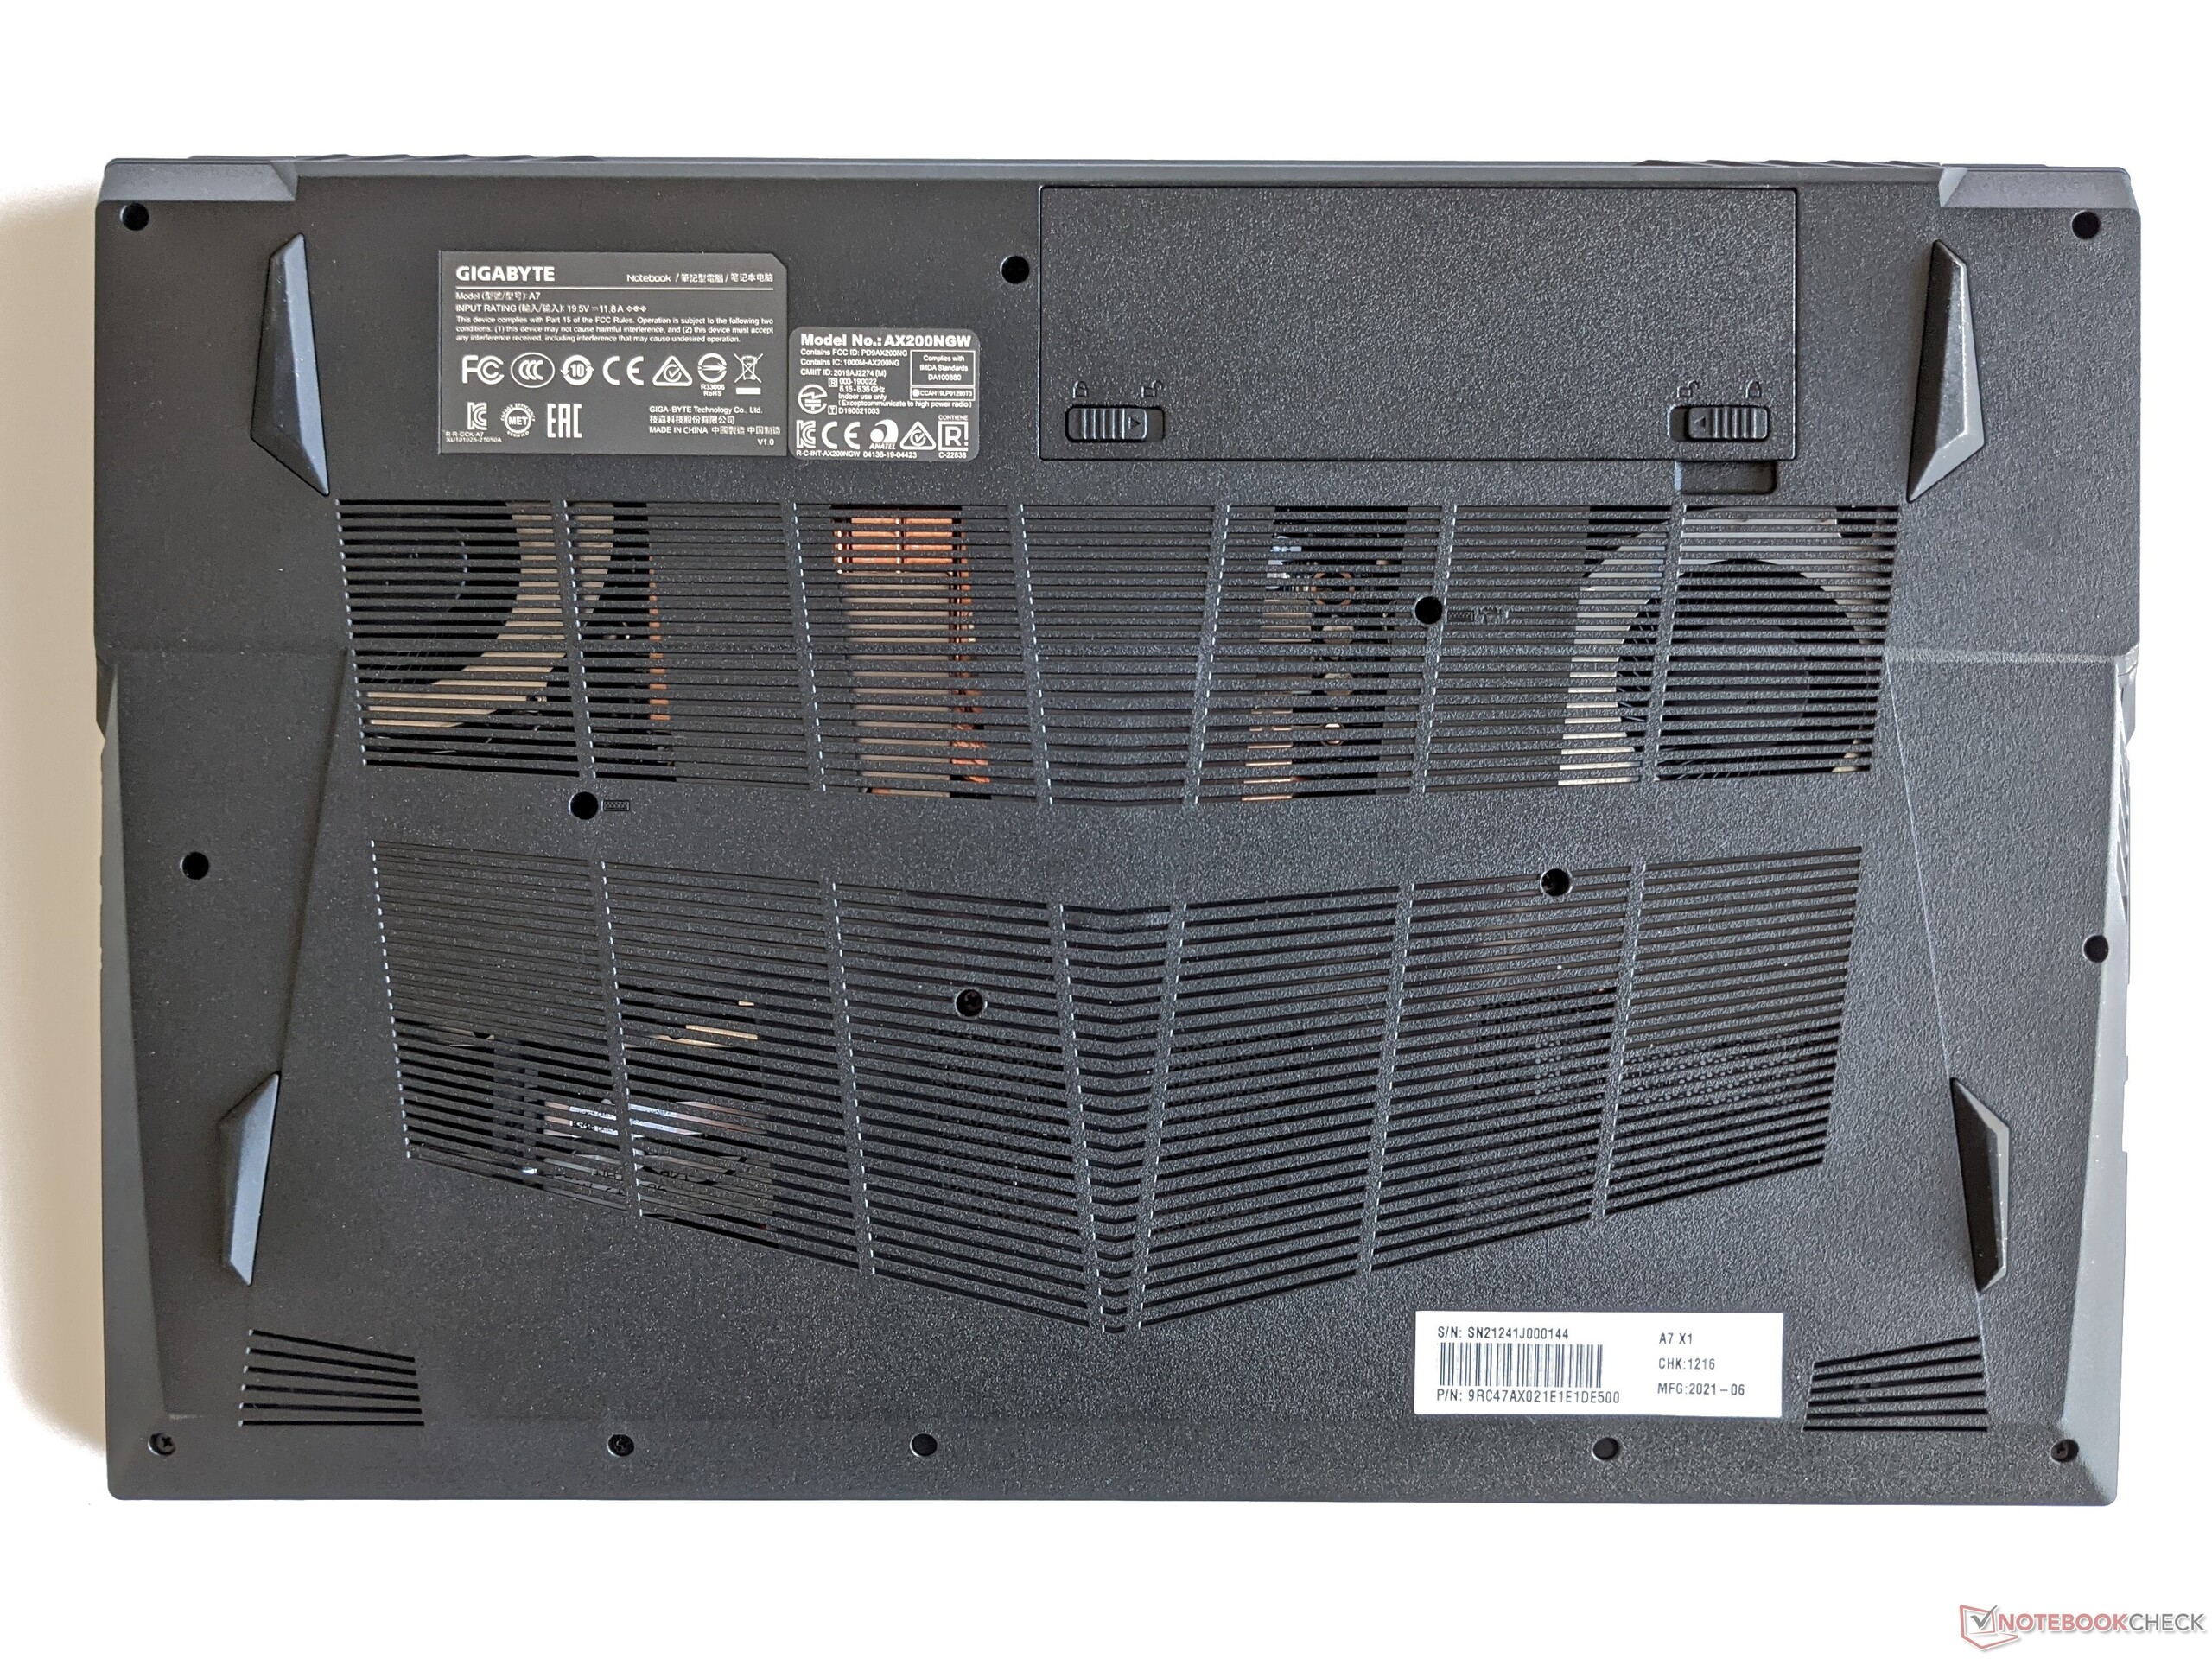
Gigabyte utiliza uma caixa plástica para o A7 X1, que tem uma qualidade de construção decente e parece robusta. O visor pode ser aberto a um ângulo máximo de cerca de 135° e é mantido firmemente em todas as posições pelas dobradiças. Há aberturas de ar generosas na parte inferior, e a bateria, que pode ser removida sem a necessidade de ferramentas, também é encontrada aqui
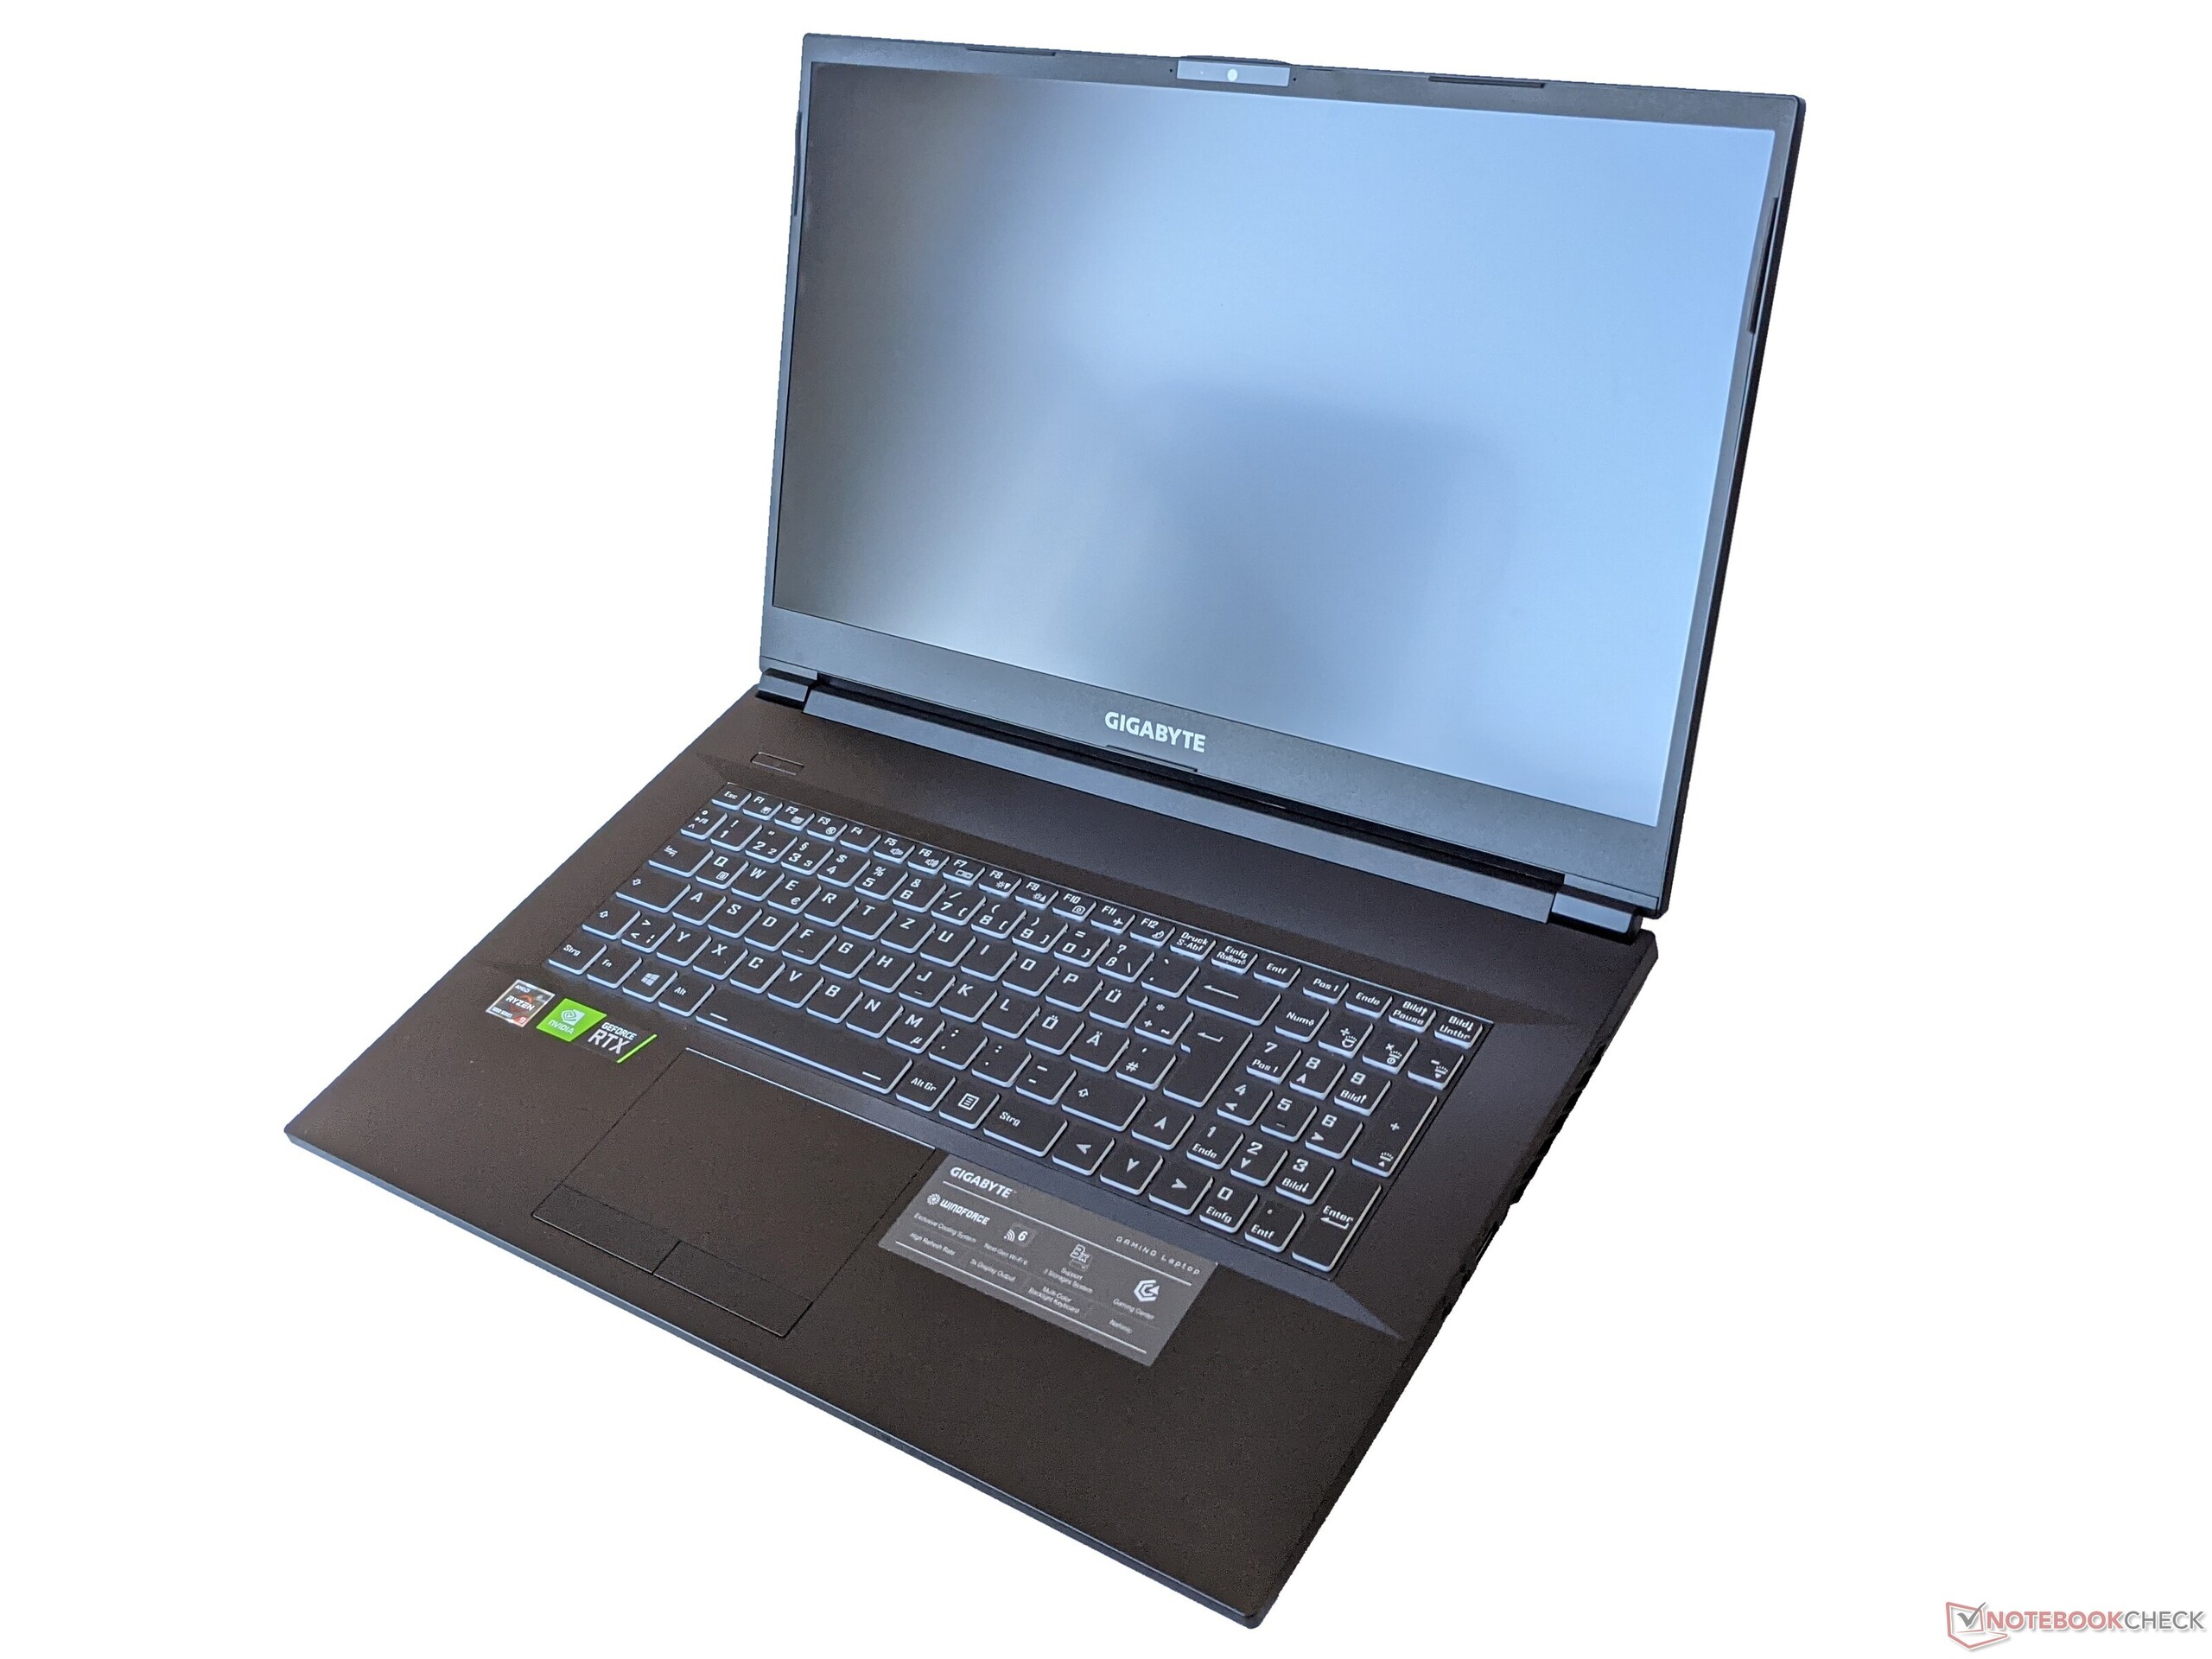
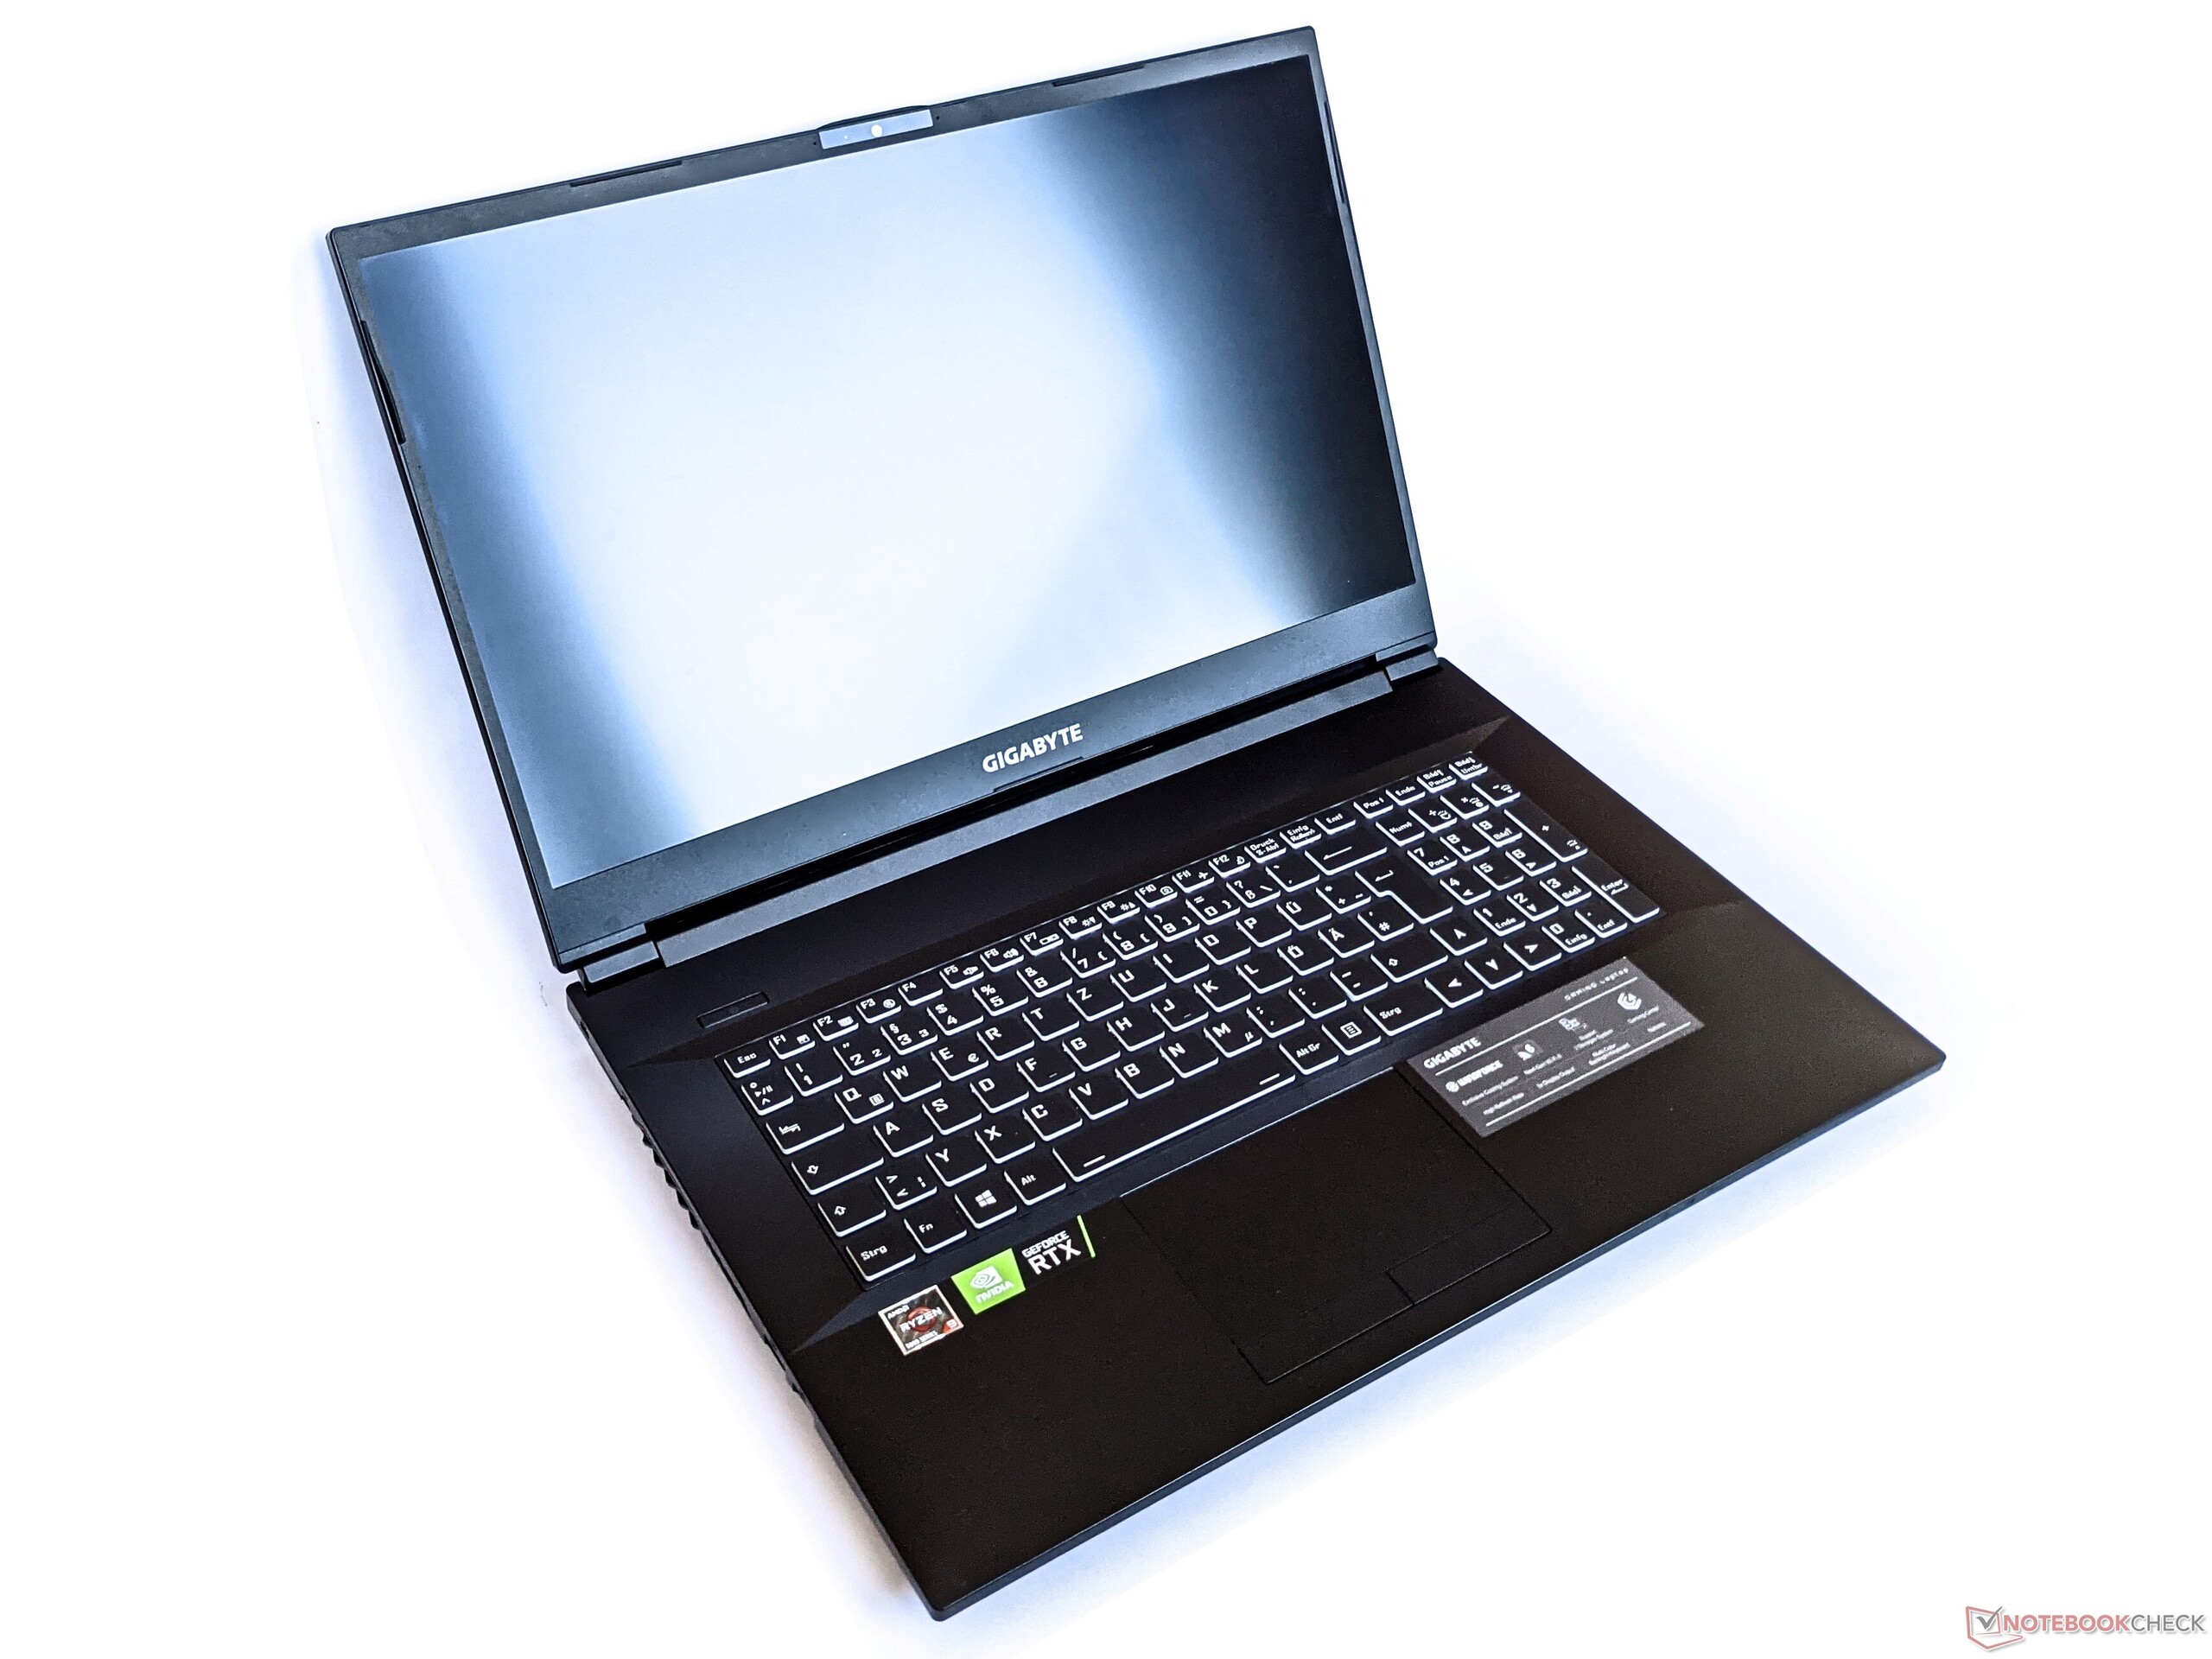
Em termos de comprimento e largura, o Gigabyte A7 X1 não difere muito de outros laptops de jogo de 17 polegadas. Entretanto, é significativamente mais espesso que a maioria dos concorrentes a 3,4 cm
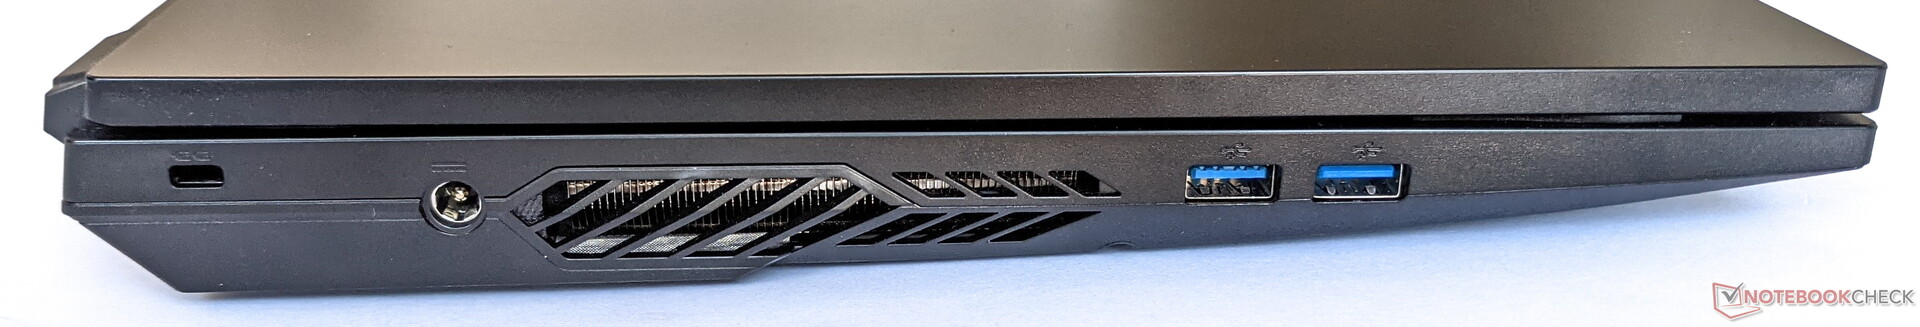
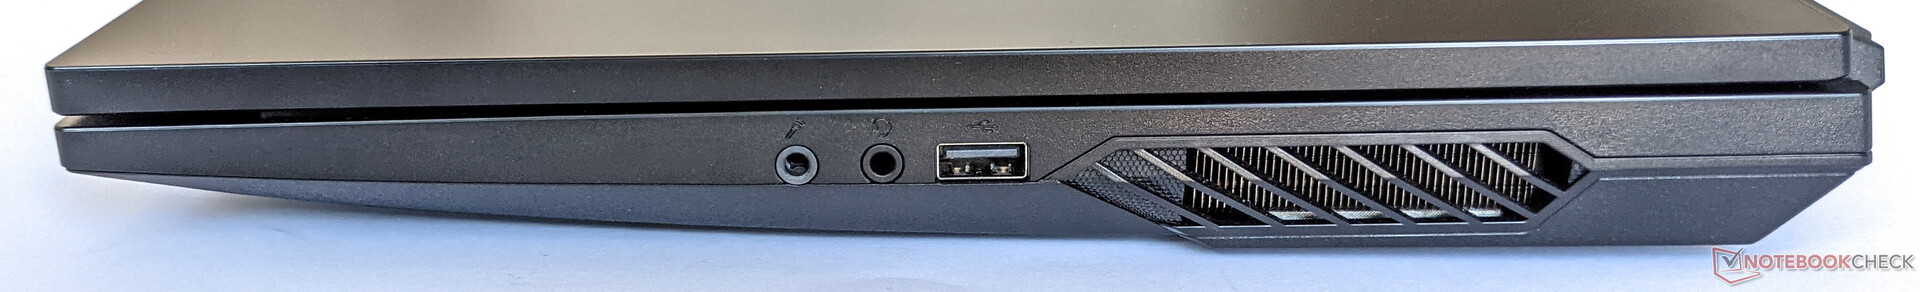
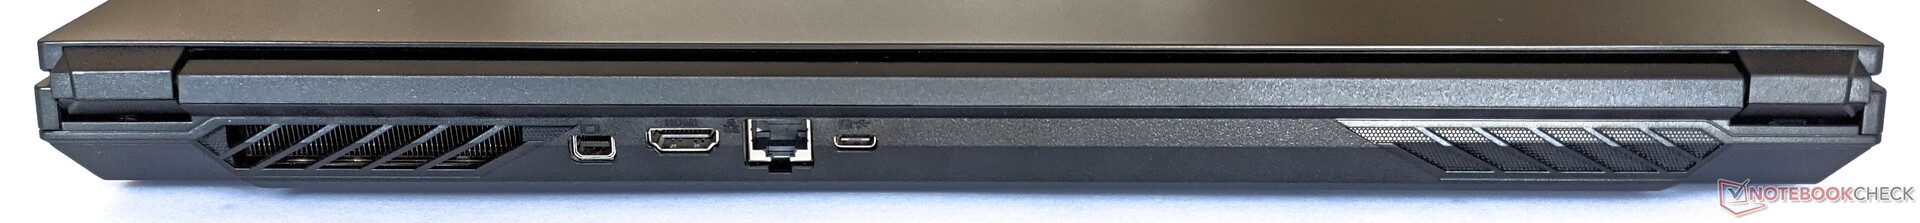
Conectividade - O notebook suporta a conexão de vários monitores
O Gigabyte A7 X1 oferece um sortimento básico de portos. Destaca-se aqui a porta USB-C na parte traseira, que também suporta DisplayPort 1.4. Em combinação com o Mini DP e HDMI, há numerosas opções de conexão para displays externos
Comunicação
O Gigabyte A7 X1 pode estabelecer conexões de rede sobre Gigabit LAN, Bluetooth 5.2, e Wi-Fi 6. Em combinação com nosso roteador de referência Netgear Nighthawk AX12, este último atinge velocidades médias de 988 Mb/s para o envio de dados e 1.432 Mb/s para a recepção dos mesmos. Enquanto o primeiro valor é apenas suficiente para o penúltimo lugar em nosso campo de teste, o A7 X1 supera nossos dispositivos de competição escolhidos quando se trata de receber dados
Webcam
Como a maioria dos outros fabricantes, a Gigabyte instalou uma webcam de baixa resolução de 0,9 MP na A7 X1. Mesmo em boas condições de iluminação, a câmera web mostra imagens e cores muito pálidas


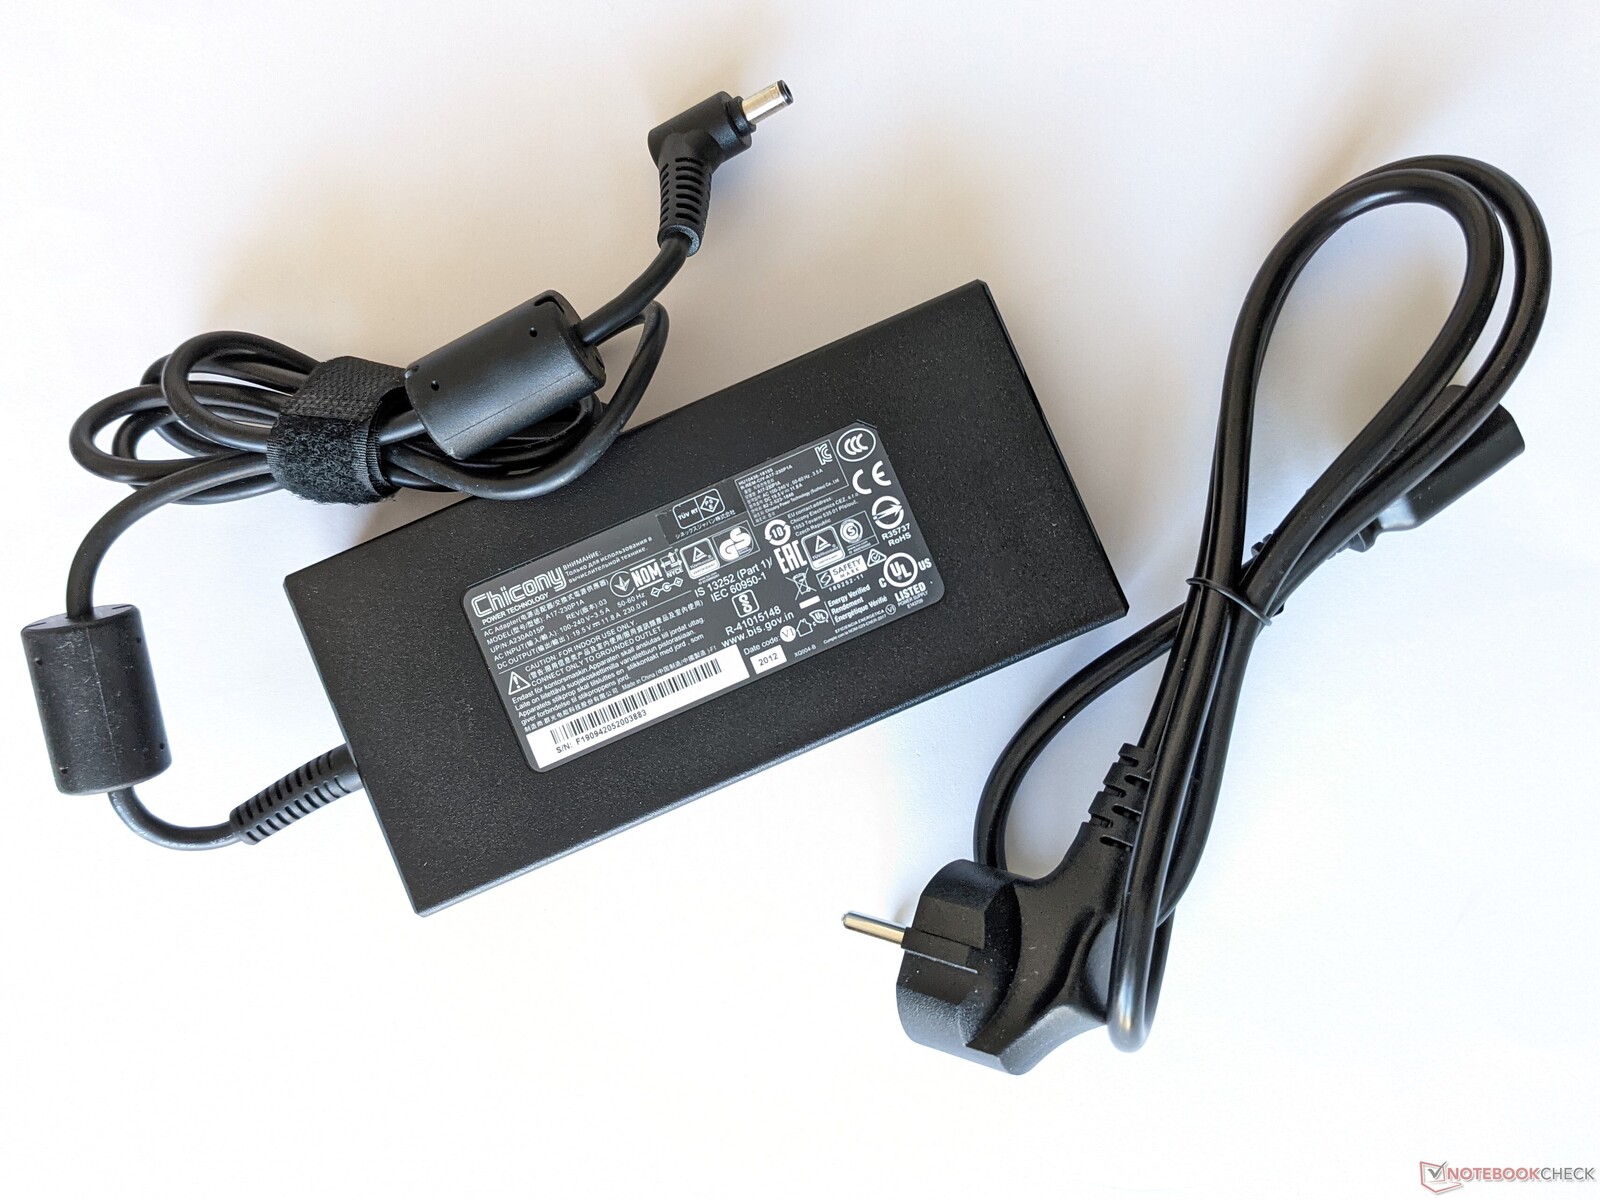
Acessórios
O Gigabyte A7 X1 vem com um adaptador de energia apropriado, além do laptop. Outros acessórios e uma bateria de reposição, por exemplo, podem ser encomendados diretamente da Gigabyte
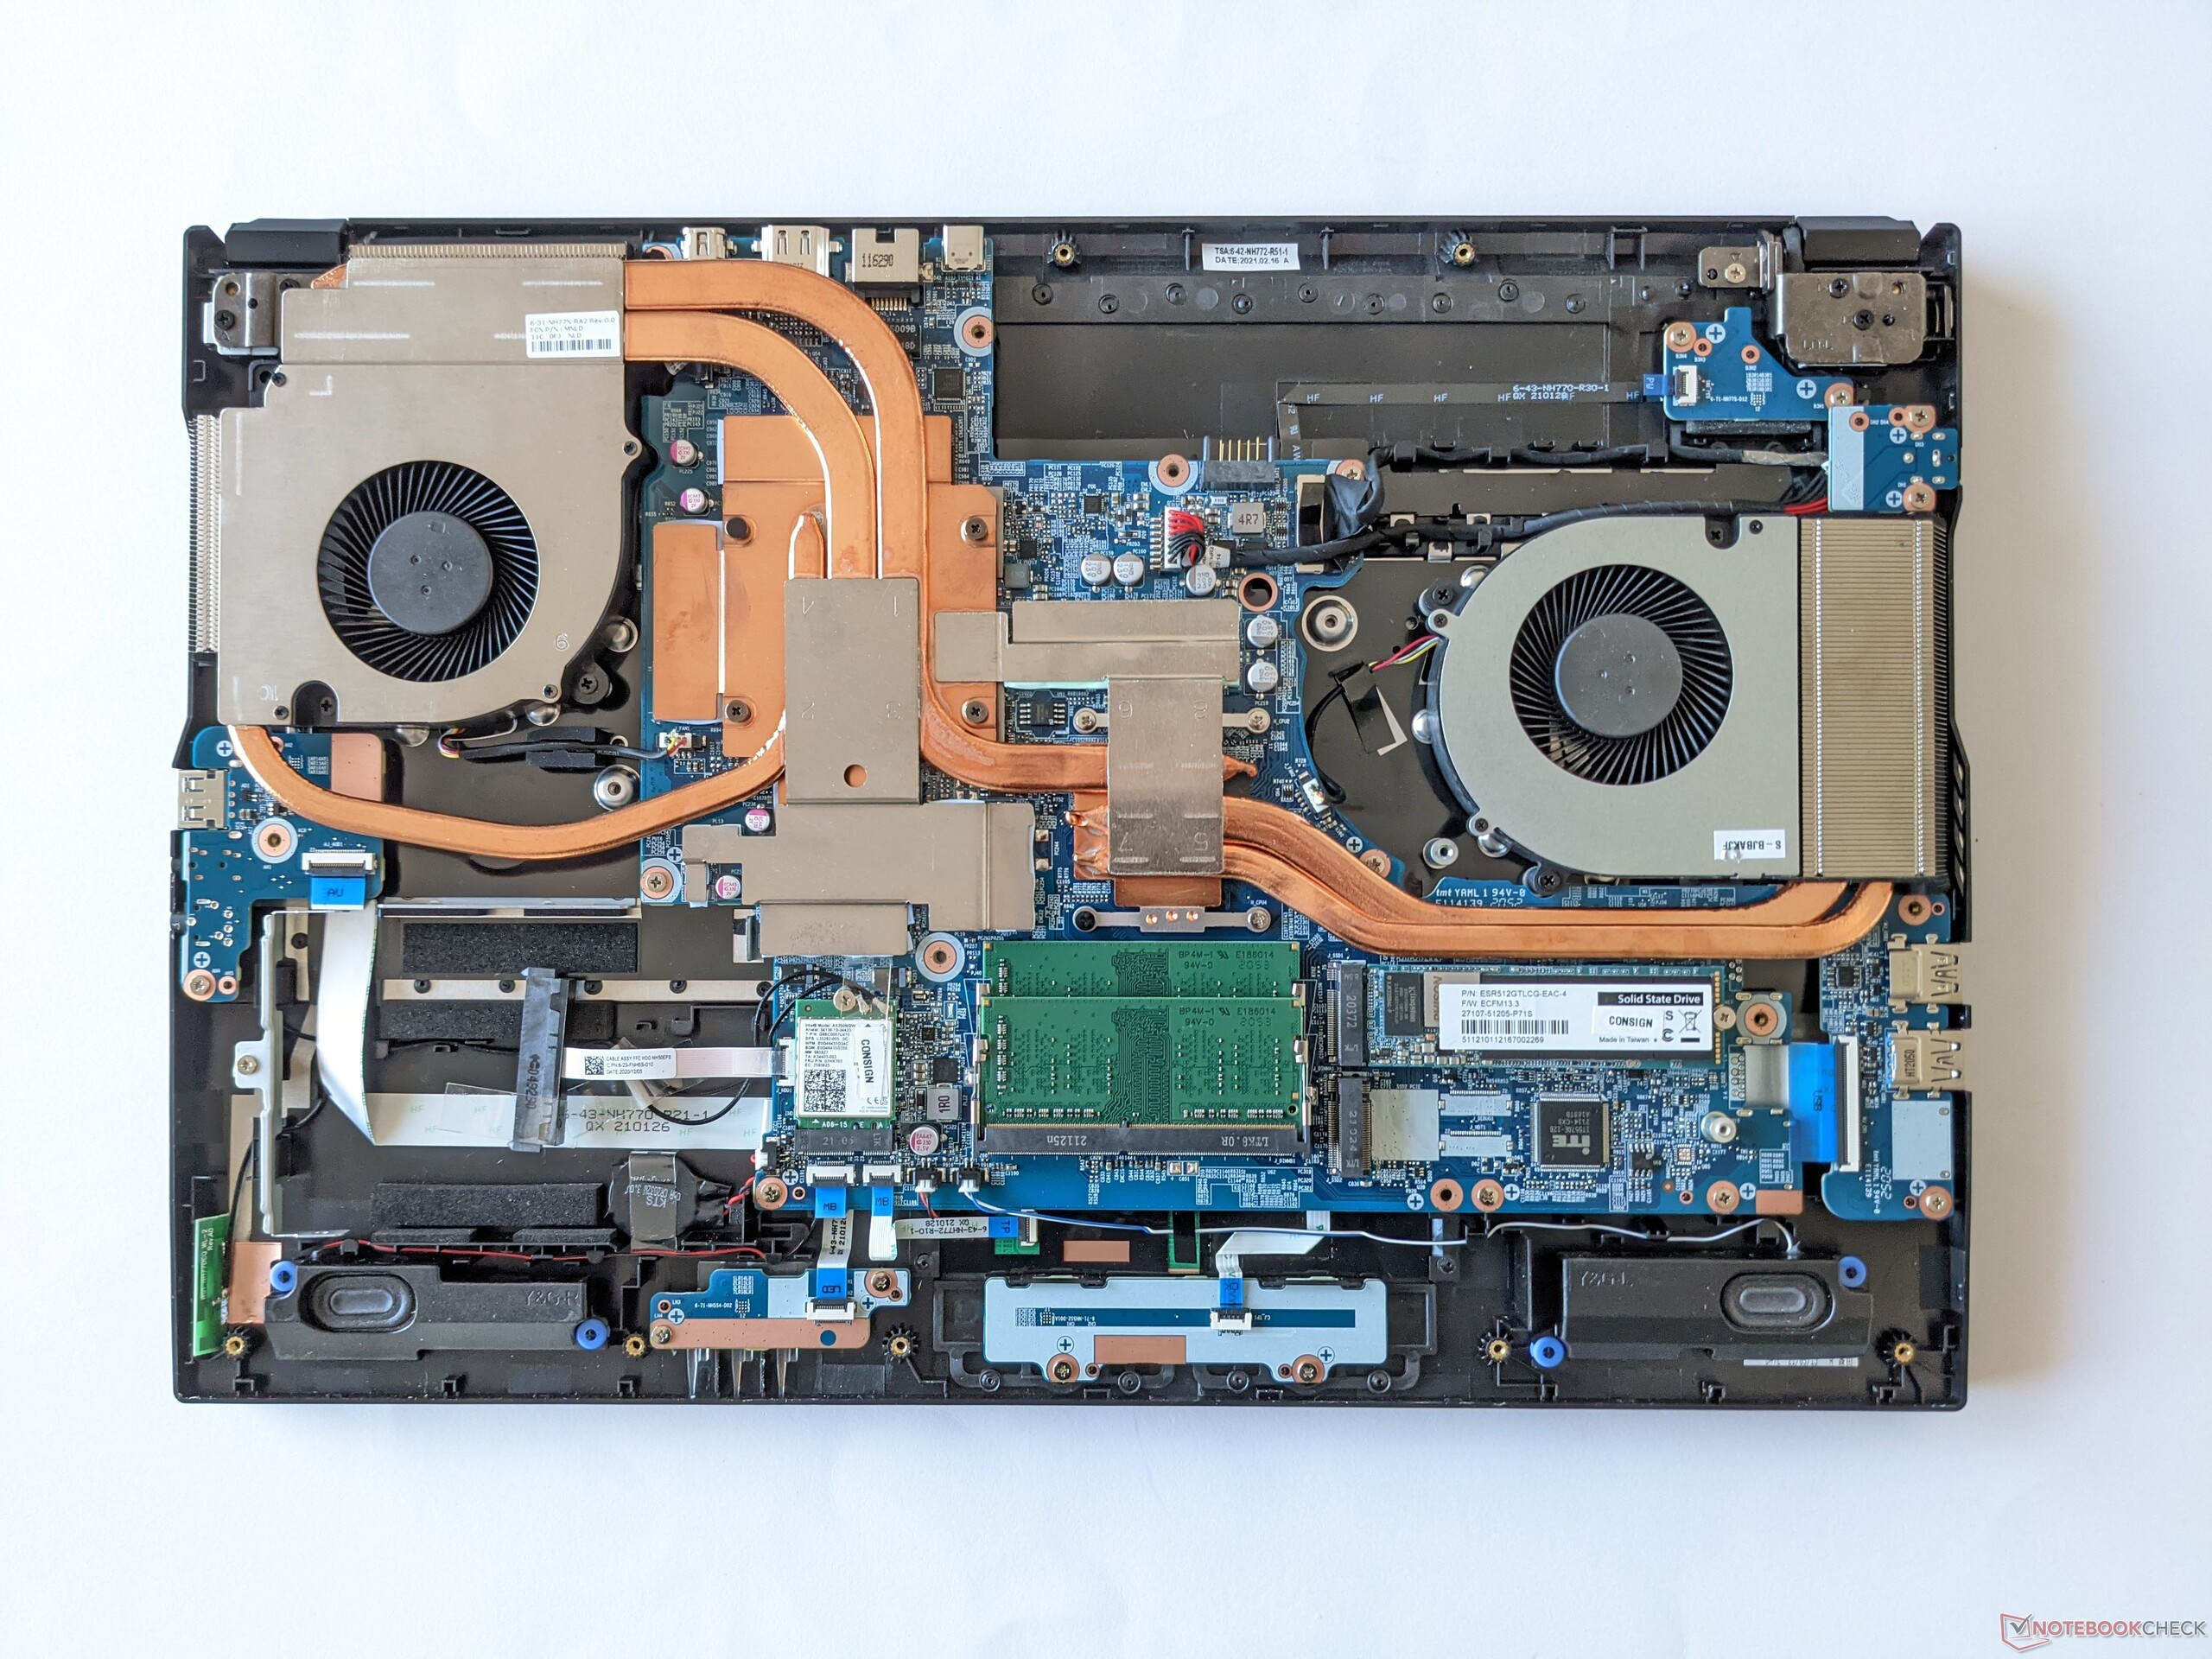
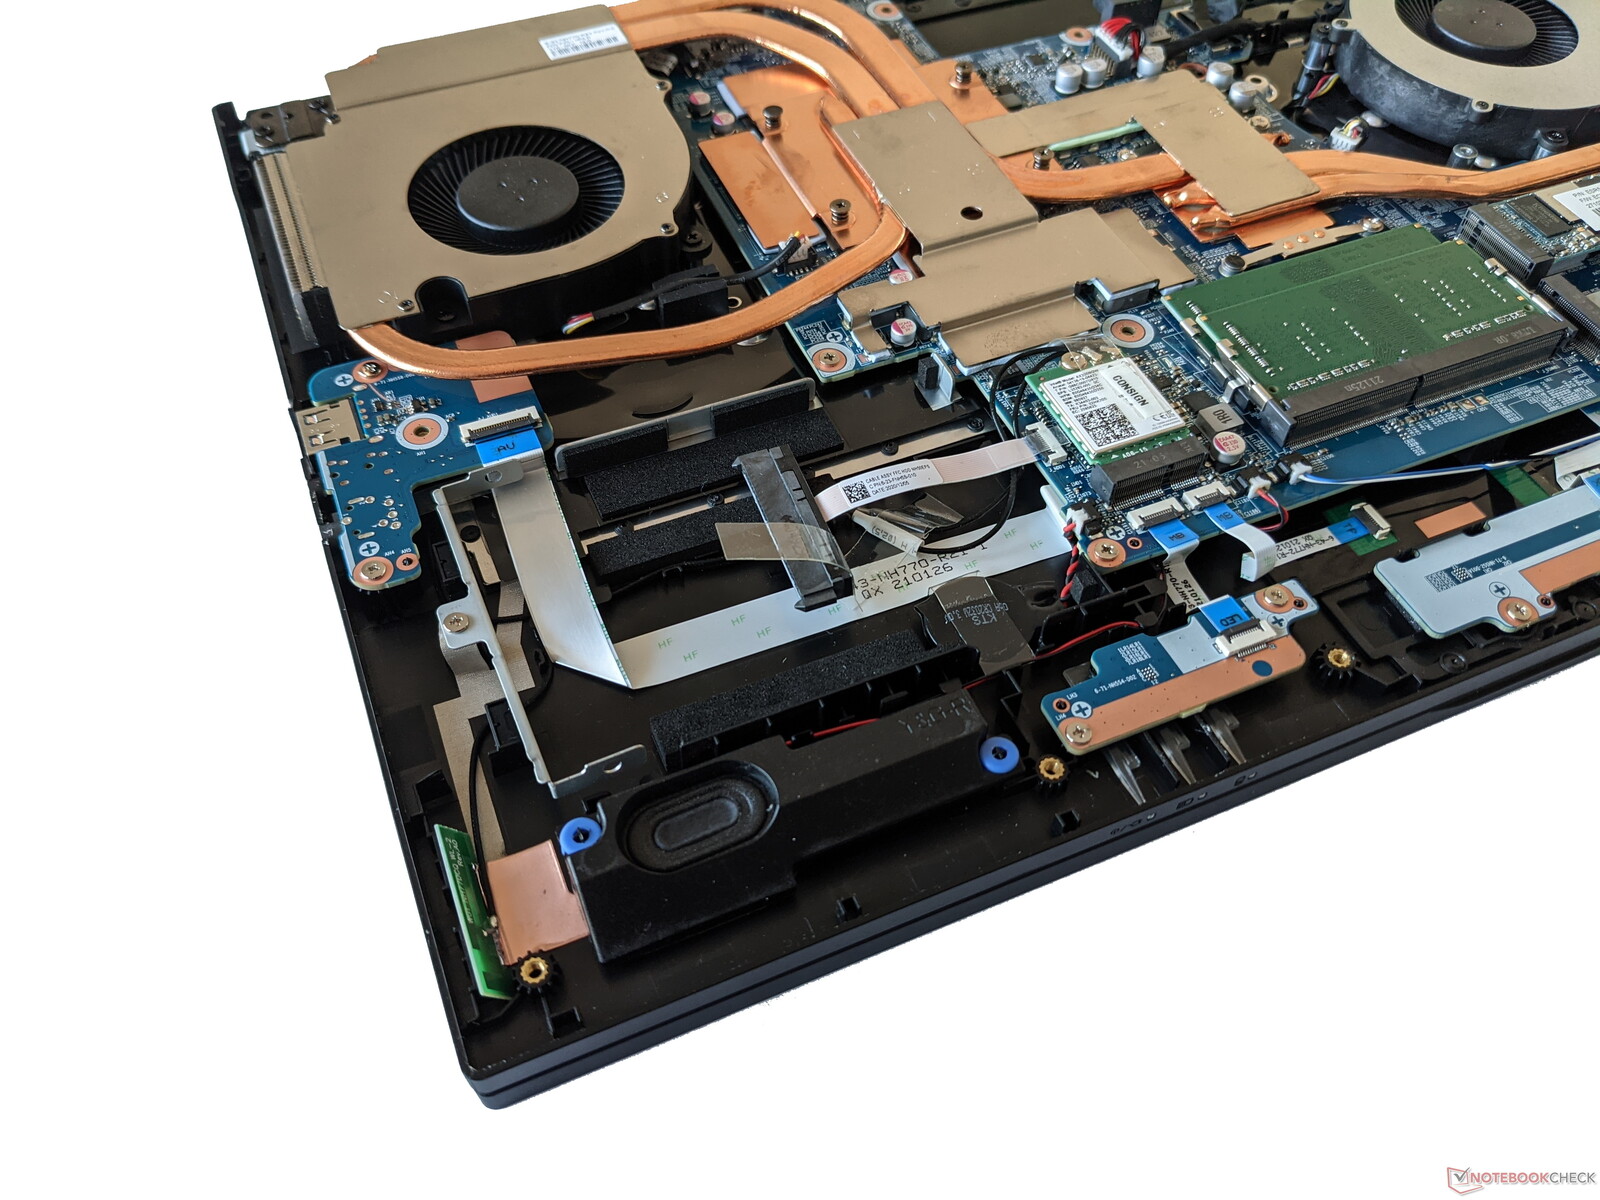
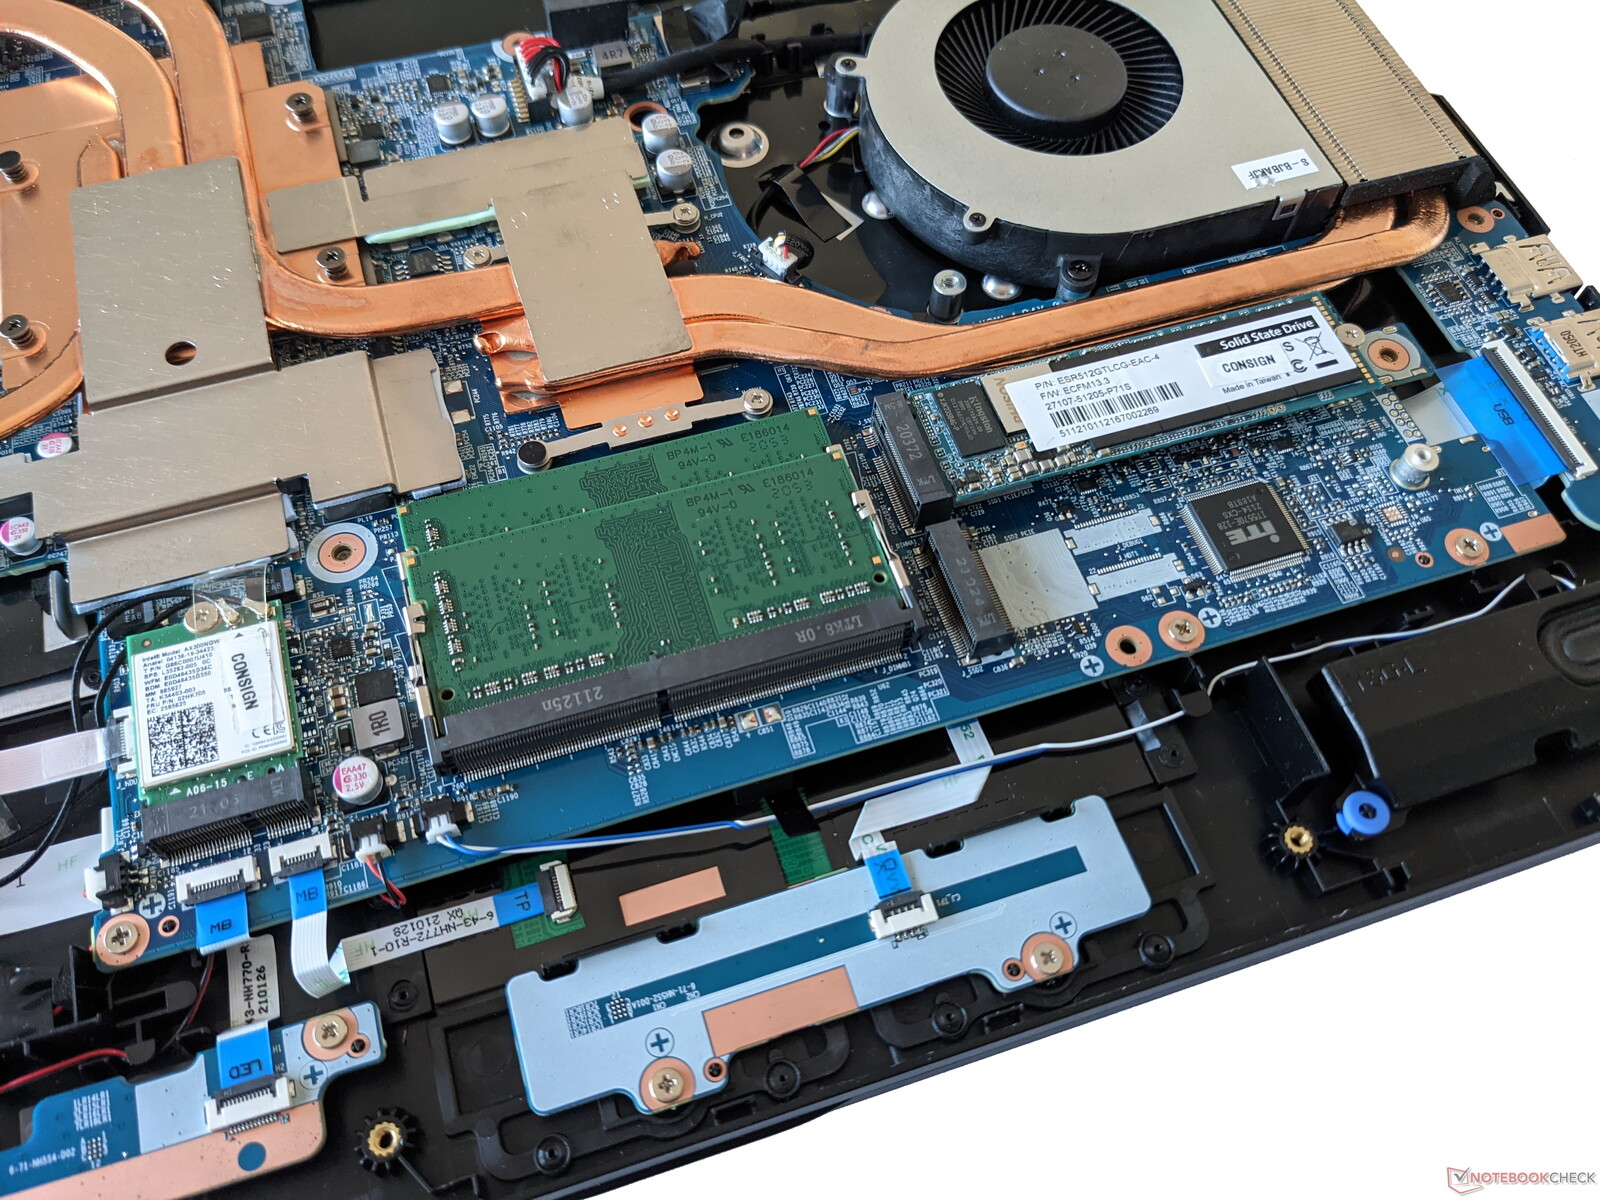
Manutenção
A tampa de base do Gigabyte A7 X1 pode ser retirada após todos os parafusos visíveis terem sido removidos. O interior revela acesso a um slot de acionamento vazio de 2,5 polegadas. O módulo WLAN e a RAM também podem ser substituídos. Além disso, há um segundo slot M.2 ao lado do ocupado pelo SSD instalado de fábrica
Garantia
A Gigabyte fornece ao A7 X1 um período de garantia de 24 meses
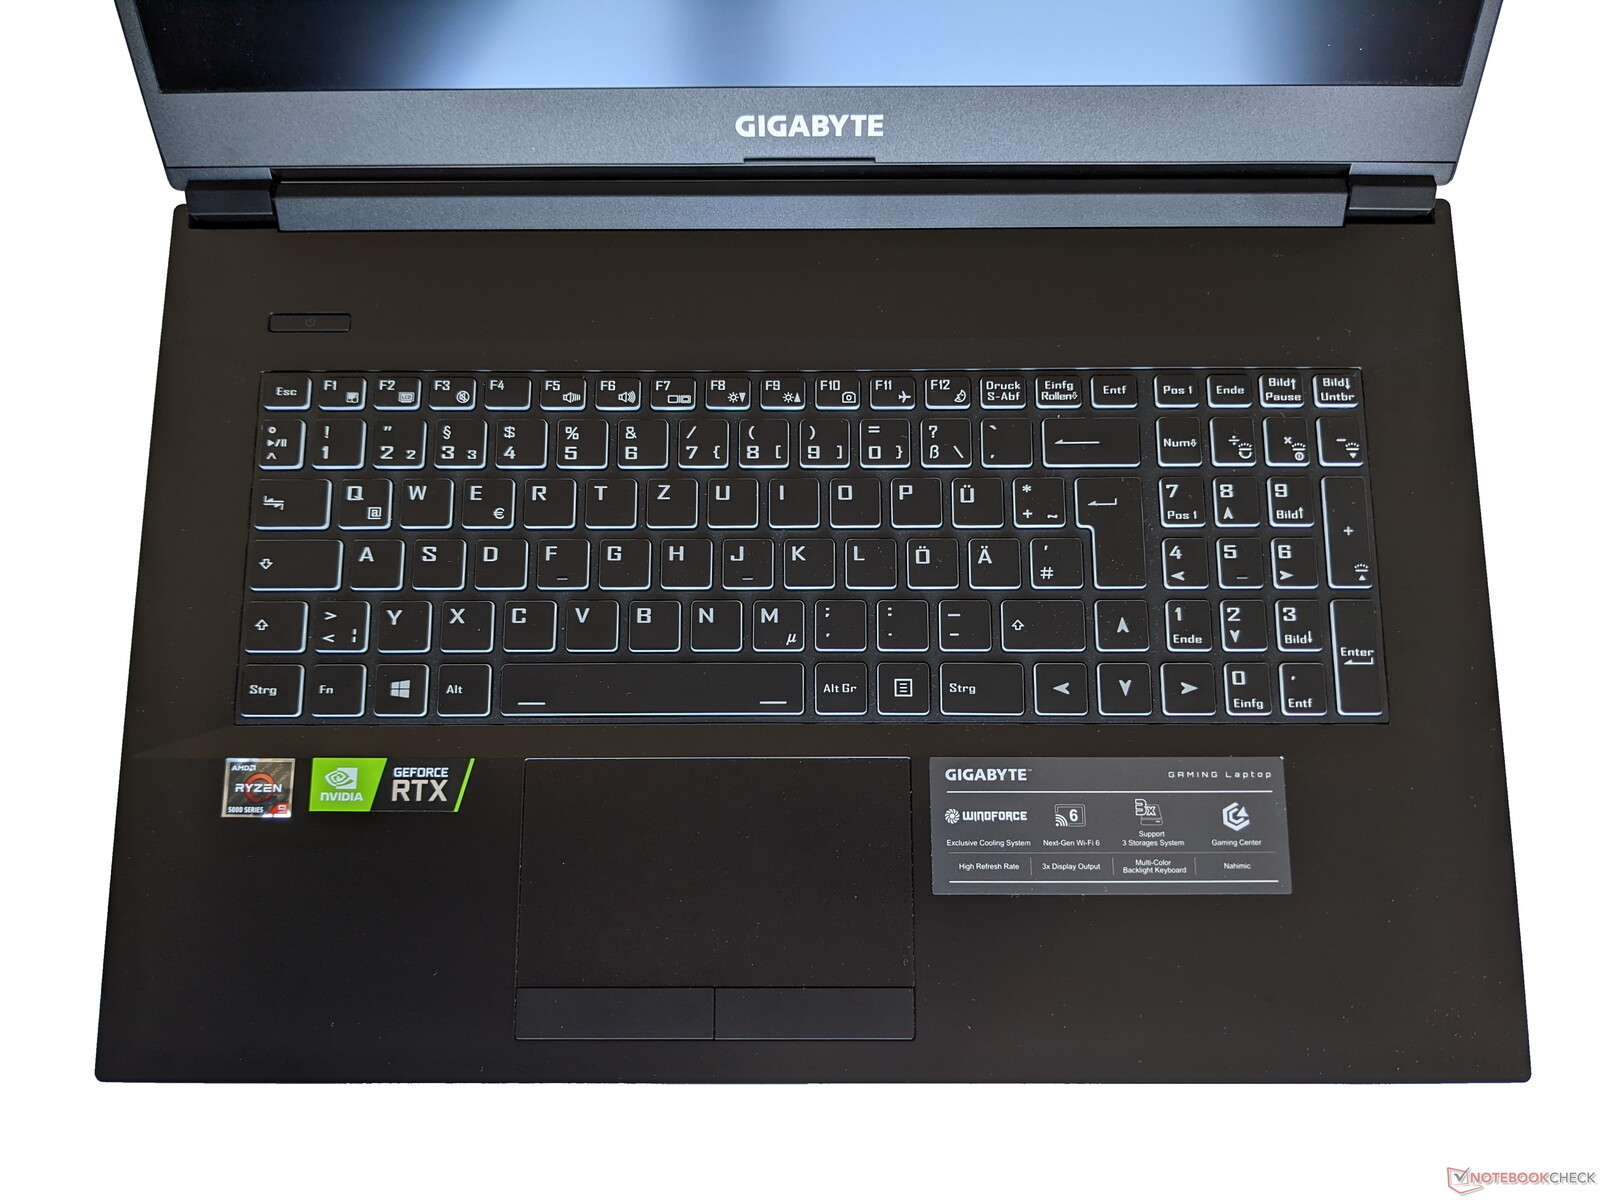
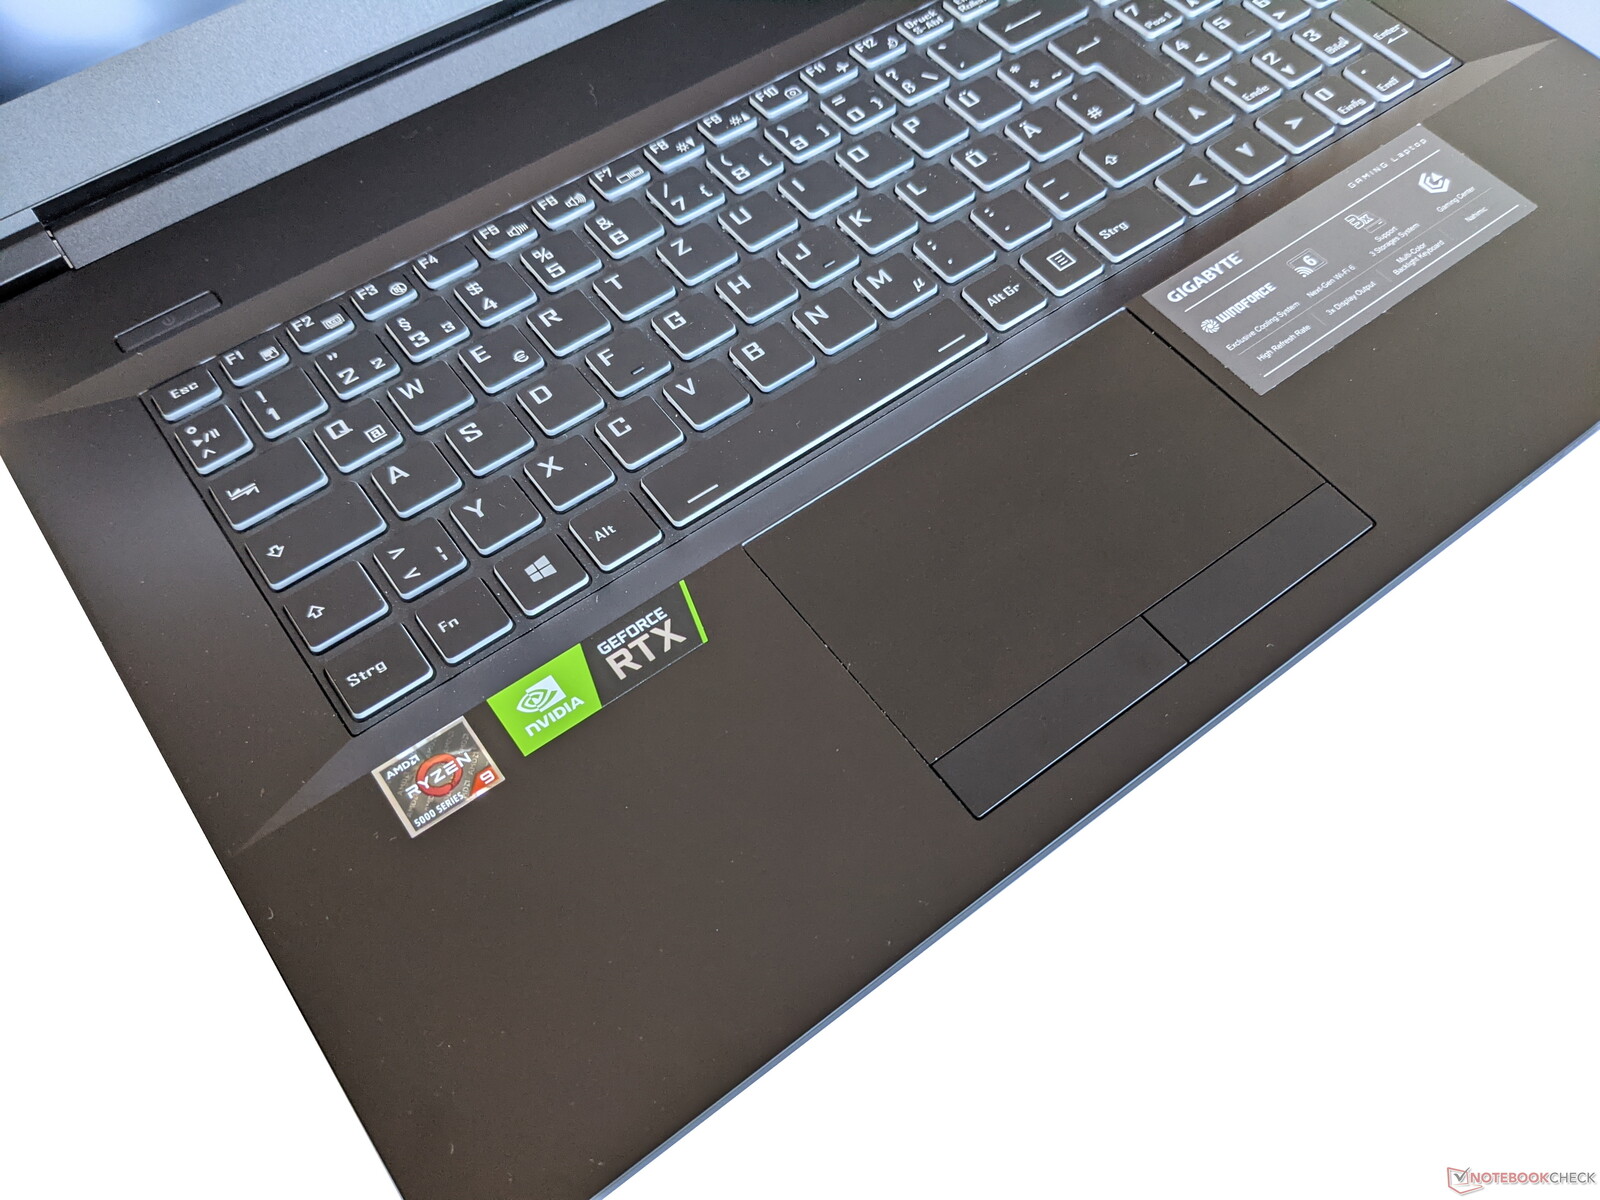
Dispositivos de entrada - Gigabyte laptop com iluminação de fundo de teclado
Teclado
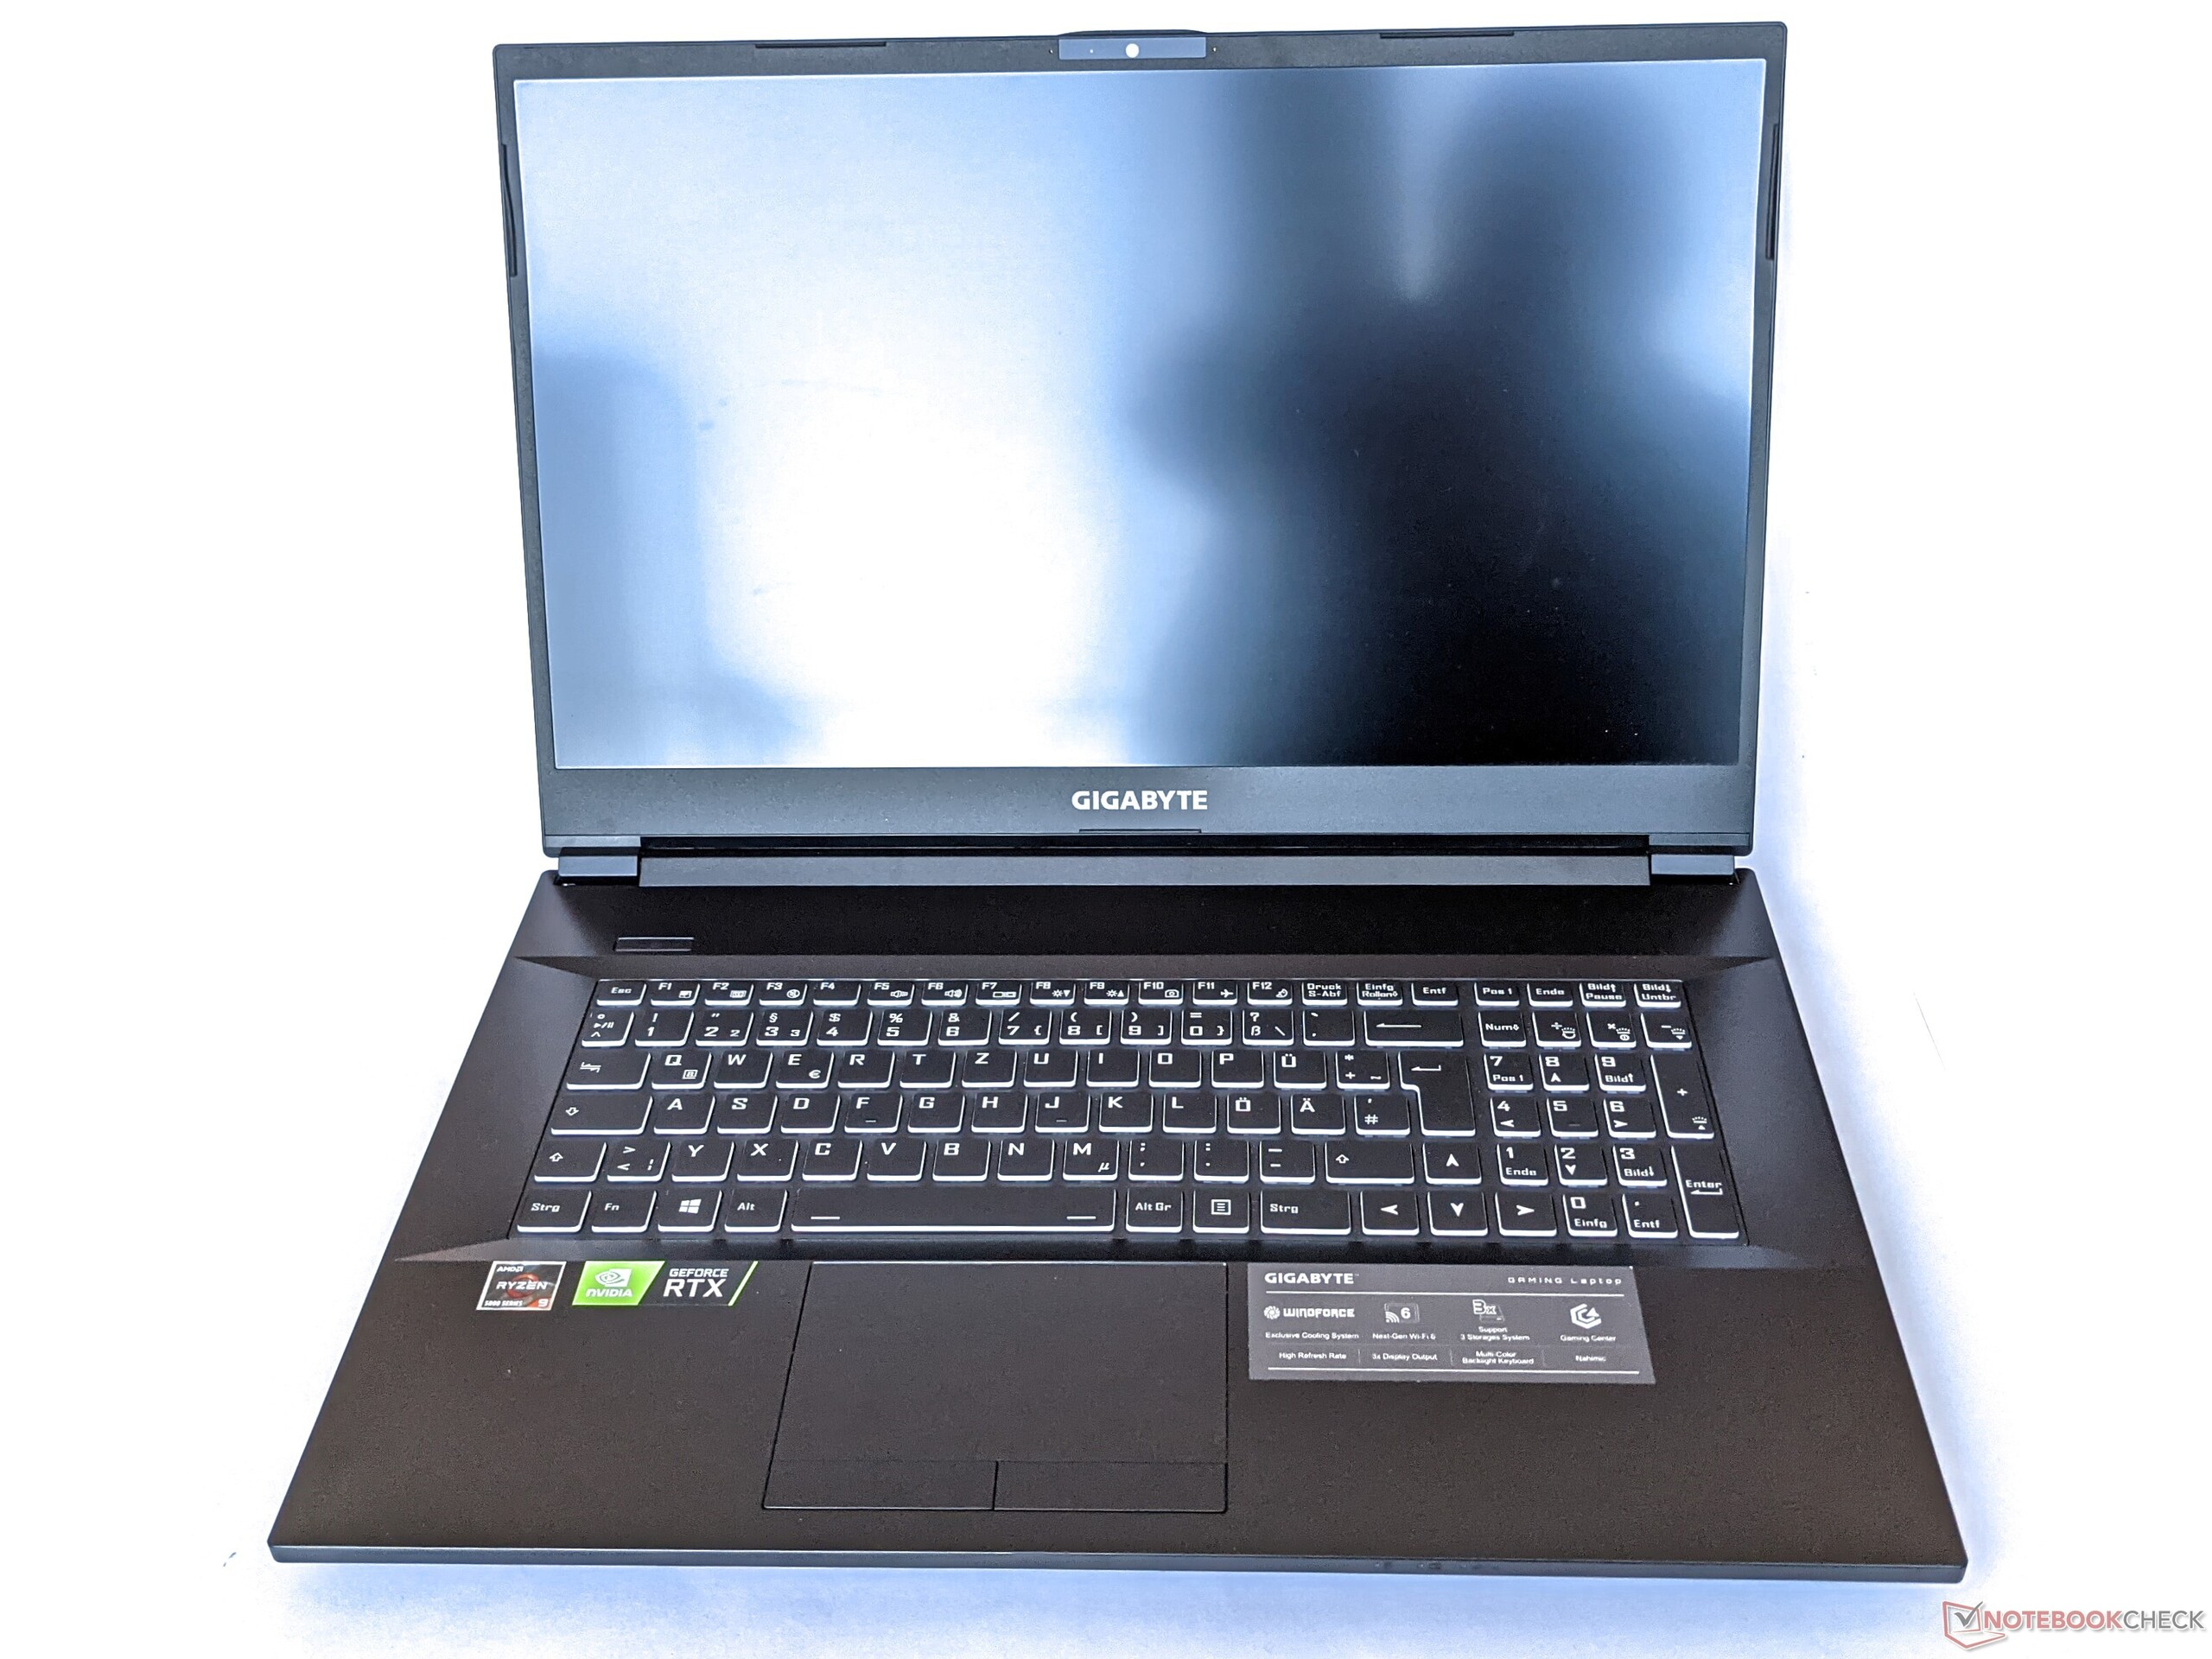
O teclado do A7 X1 proporciona uma boa aderência para os dedos e, portanto, também é adequado para inserir textos longos. Além disso, as teclas de seta são de tamanho normal, e apenas as teclas F e as teclas do teclado numérico são um pouco mais estreitas. Graças ao uso de um layout de teclado completo, também não há necessidade de atribuições duplas.
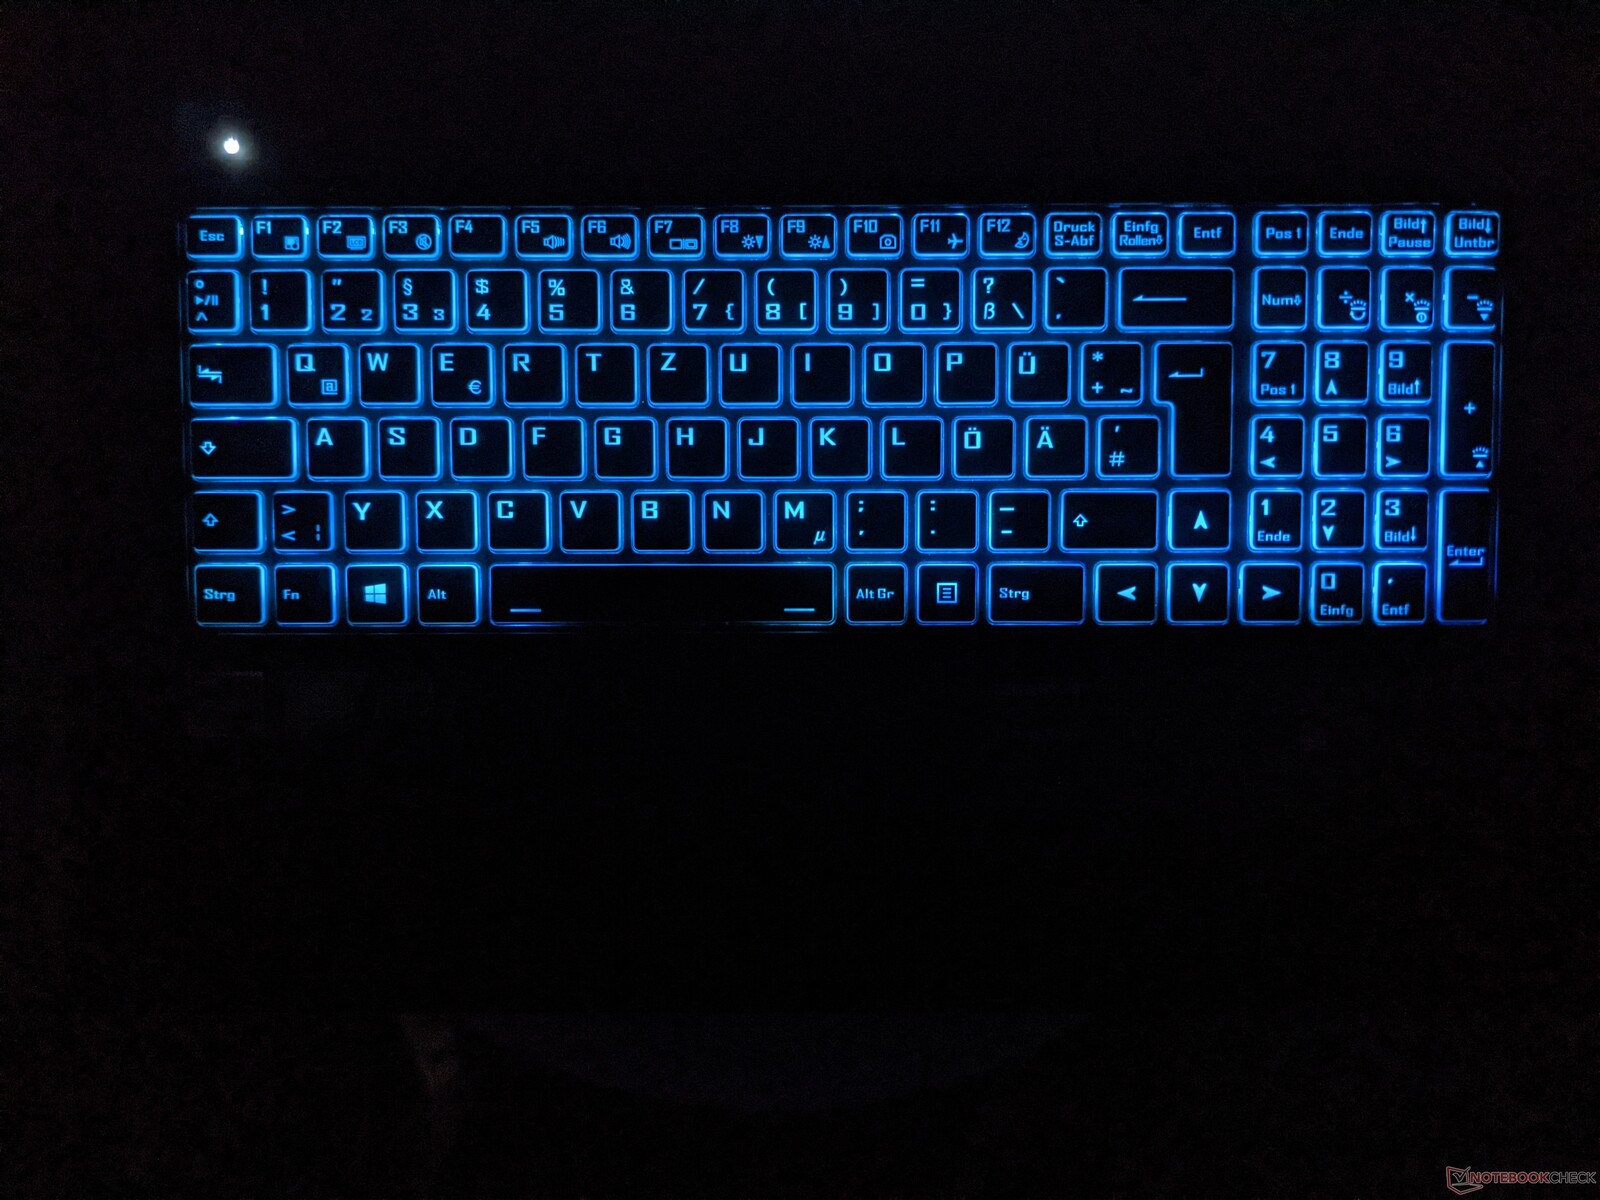
O teclado também apresenta retroiluminação, embora as cores não possam ser personalizadas. As letras são iluminadas uniformemente e sem ofuscamento
Touchpad
Gigabyte optou por um touchpad com botões do mouse separados para substituir o mouse. Enquanto a superfície do tapete é perfeitamente adequada para navegar no ponteiro do mouse, os botões do mouse parecem um pouco macios, dependendo de onde você os pressiona. No entanto, o pad responde às entradas acionadas com um clique audível
Visor - Painel IPS 144 Hz
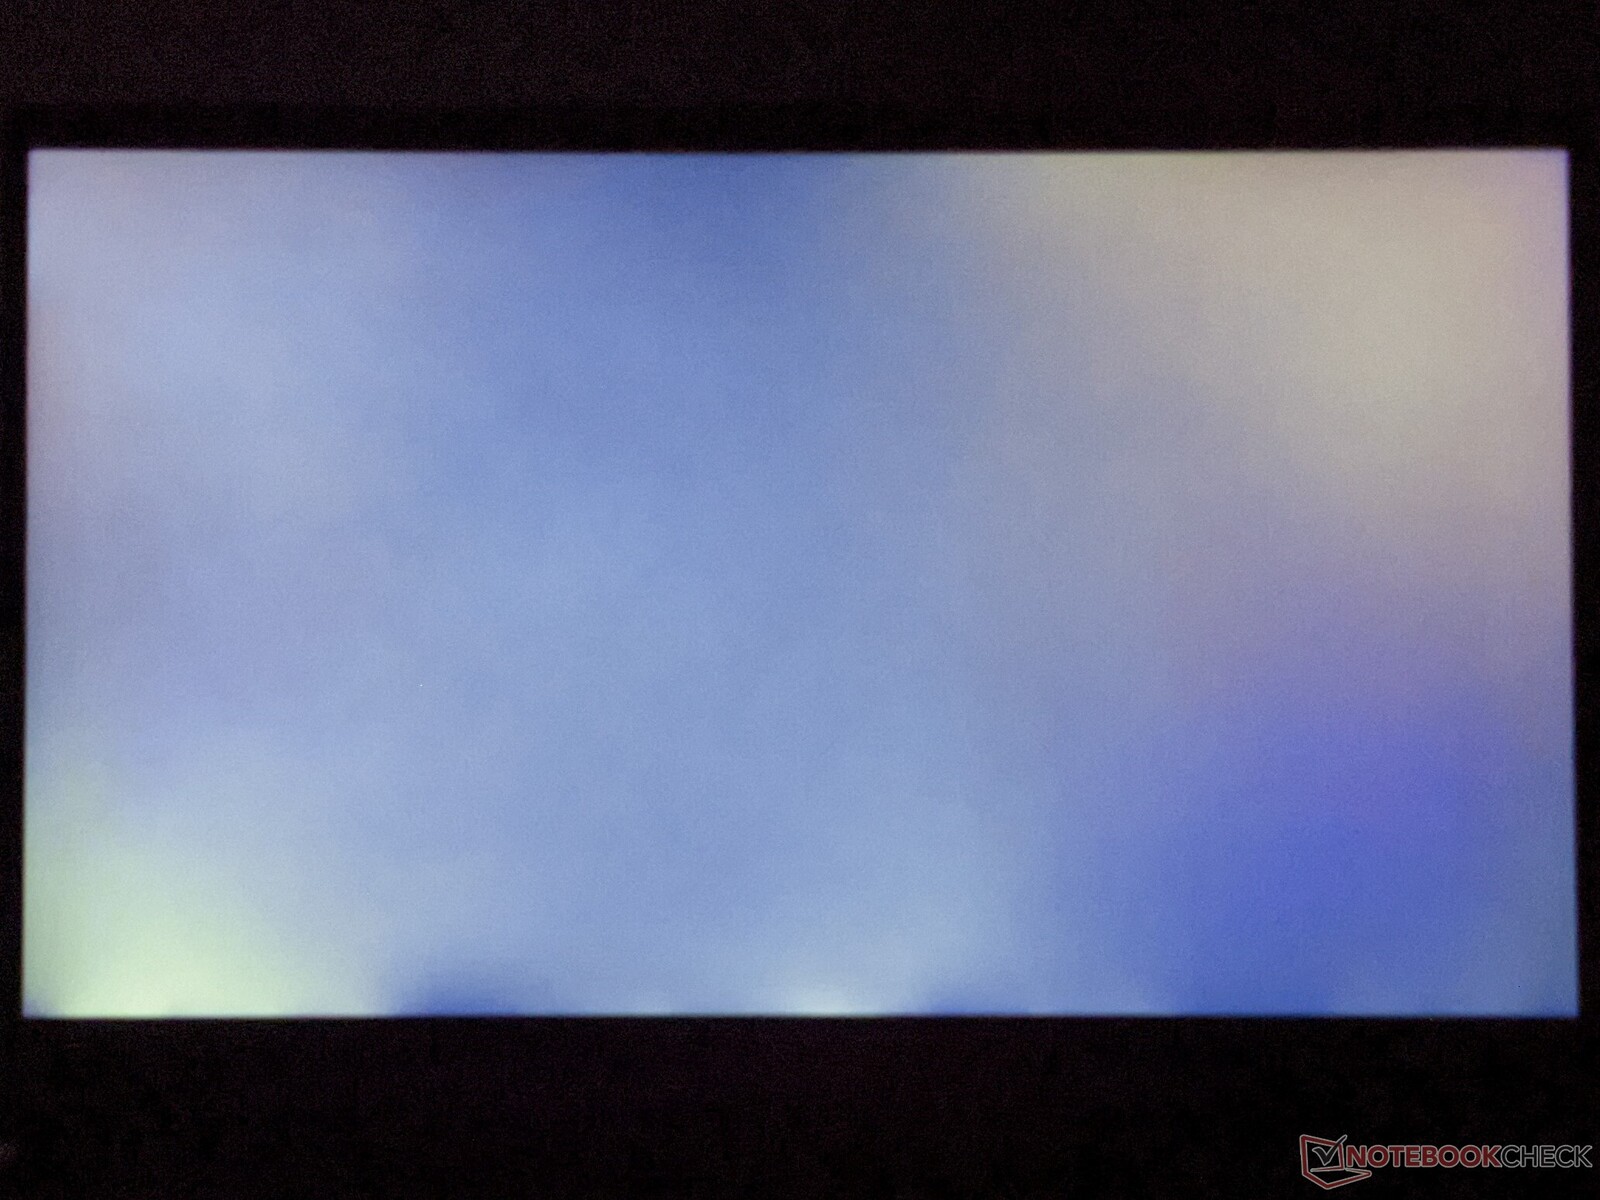
A tela do Gigabyte A7 X1 consiste em um painel IPS de 17,3 polegadas que oferece uma resolução de 1920x1080 pixels. O brilho máximo médio é de 318 cd/m², o que corresponde ao meio do nosso campo de teste. Por outro lado, a distribuição de brilho de 95% é a mais alta entre nossos dispositivos concorrentes escolhidos.
NãoPWM é usado para controle de brilho, o que é útil para usuários com olhos sensíveis.
| |||||||||||||||||||||||||
iluminação: 95 %
iluminação com acumulador: 325 cd/m²
Contraste: 1121:1 (Preto: 0.29 cd/m²)
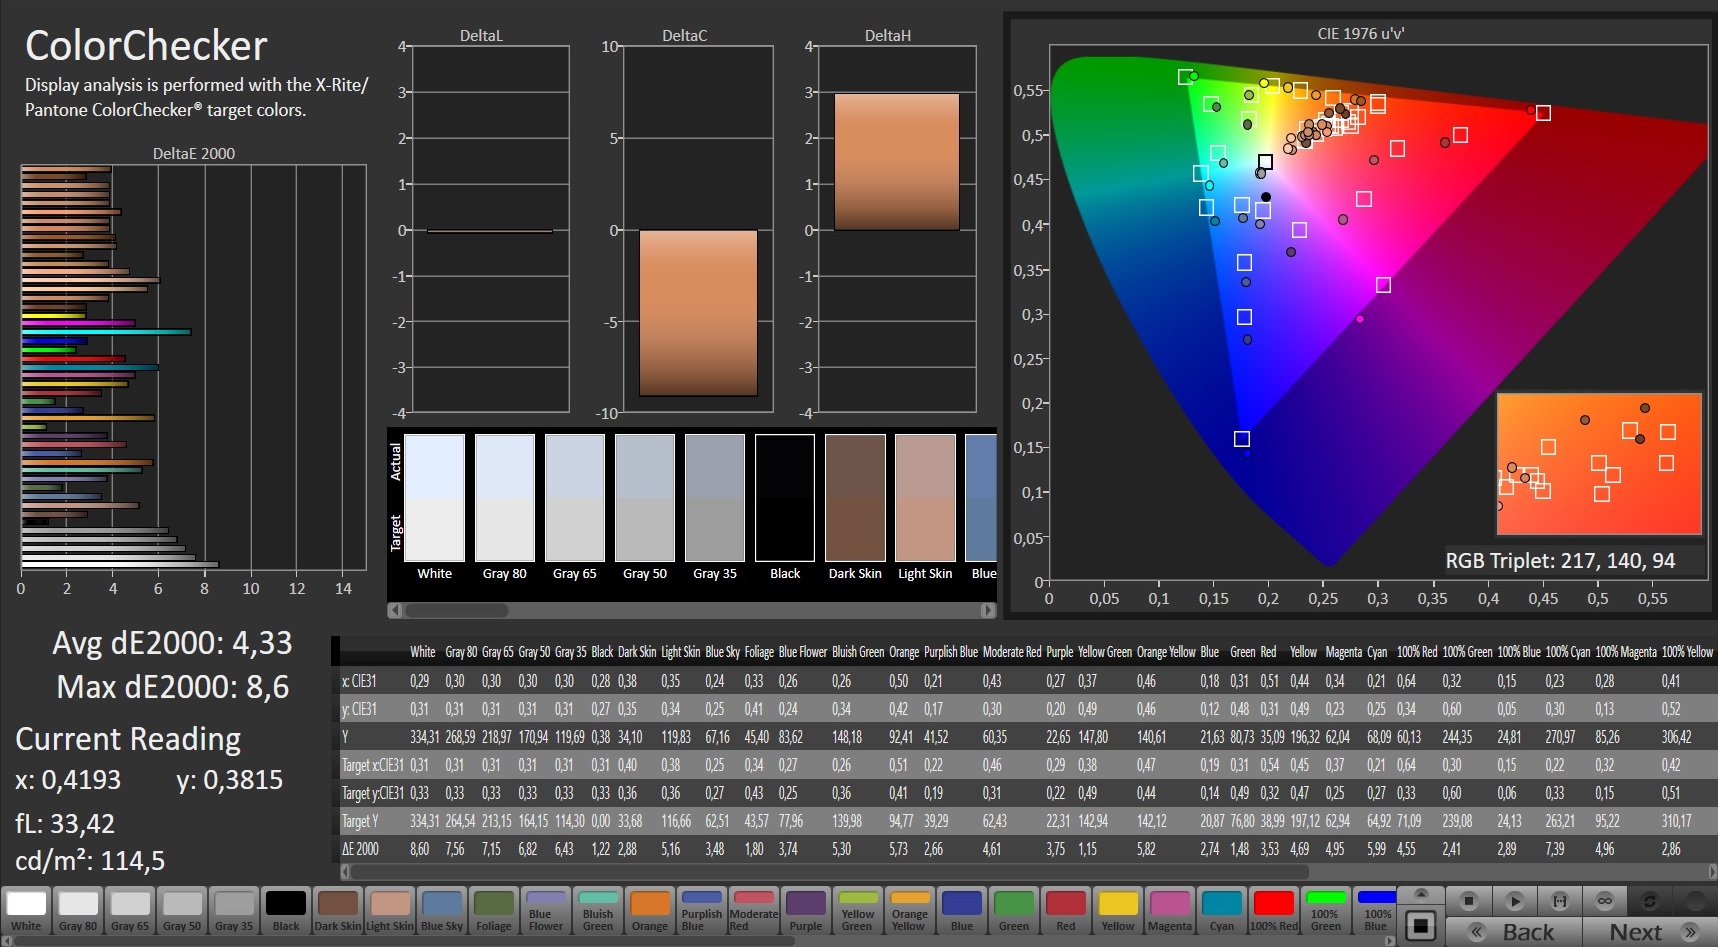
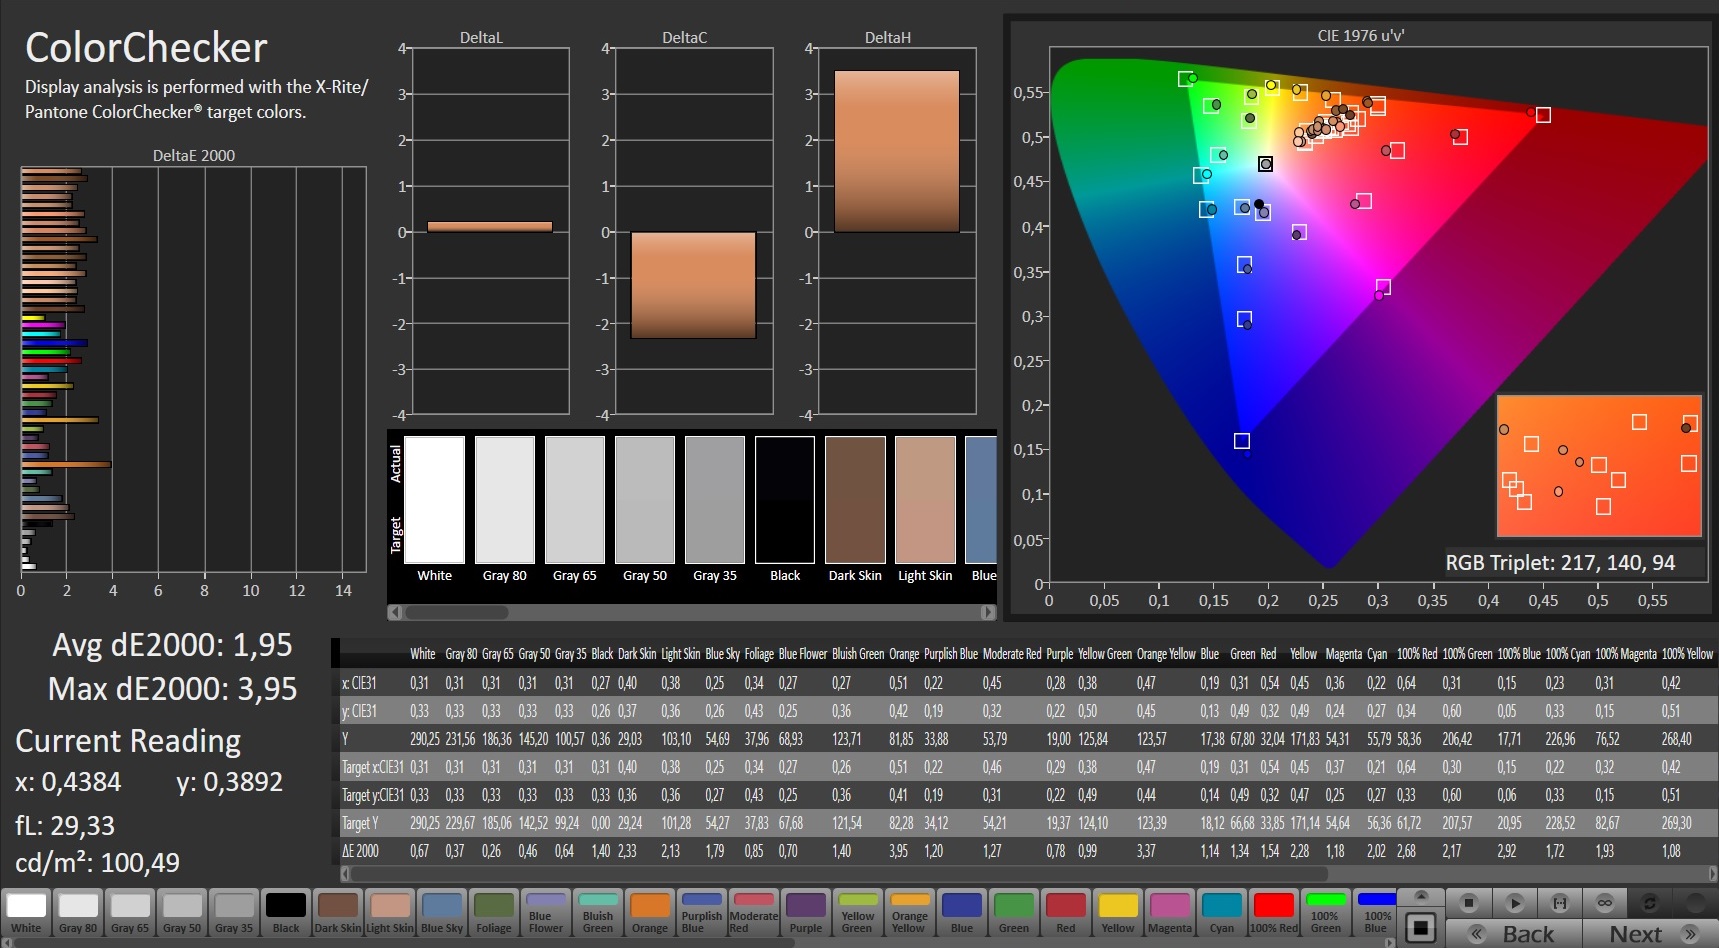
ΔE ColorChecker Calman: 4.33 | ∀{0.5-29.43 Ø4.71}
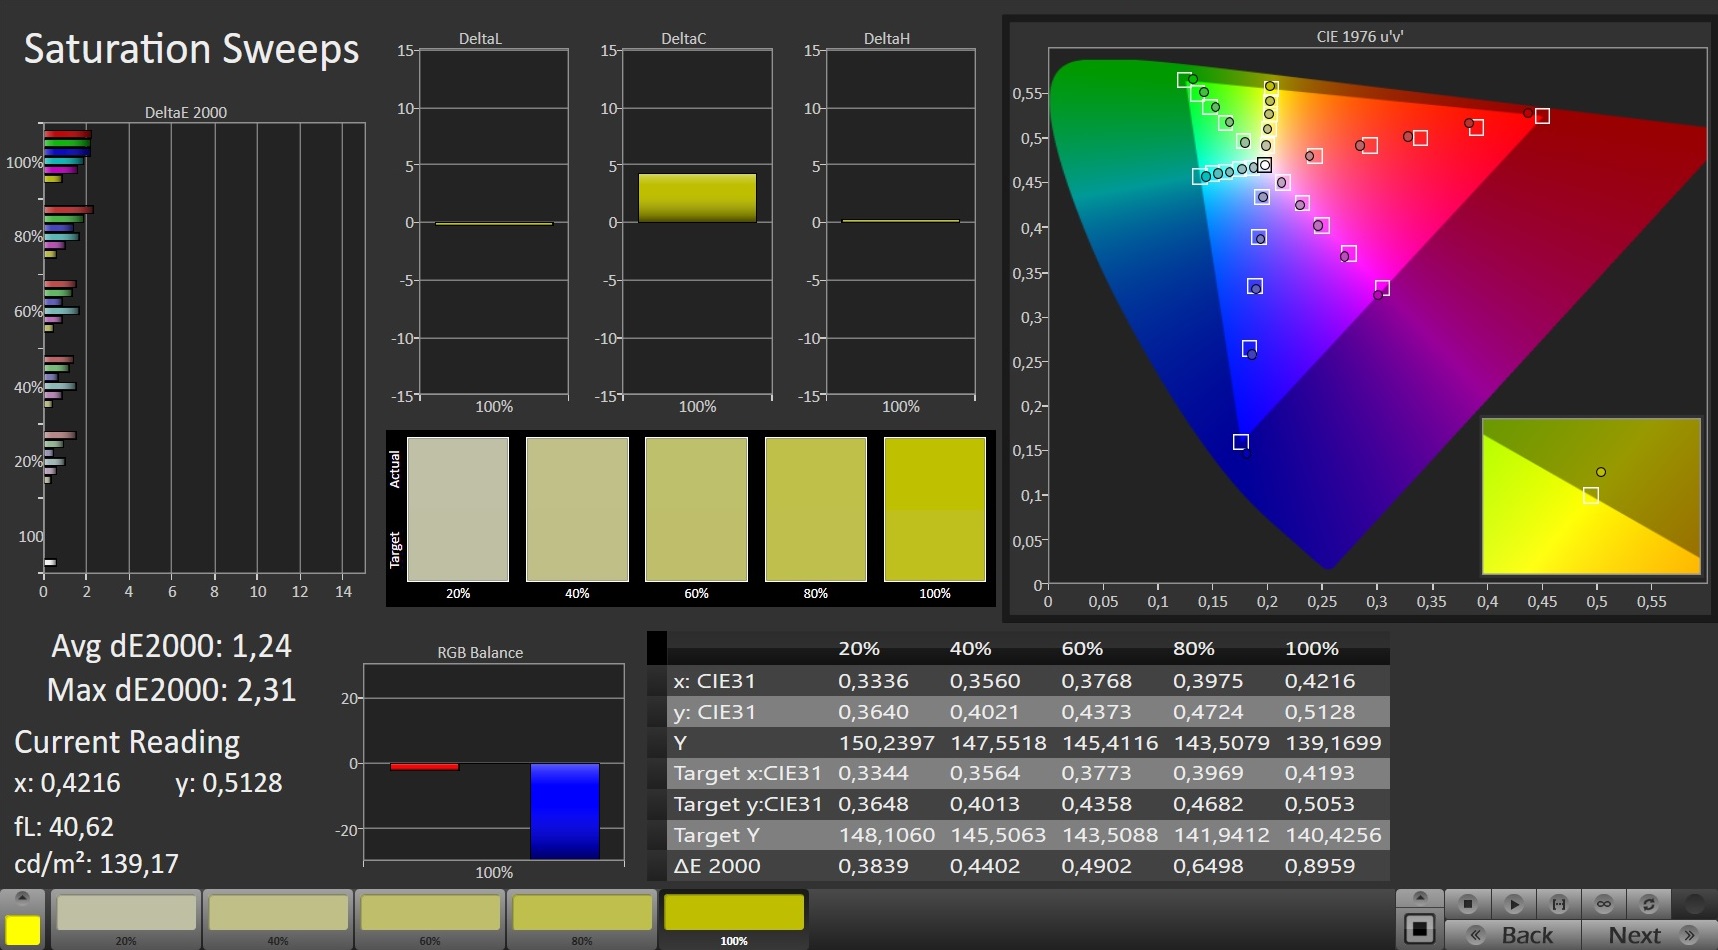
calibrated: 1.95
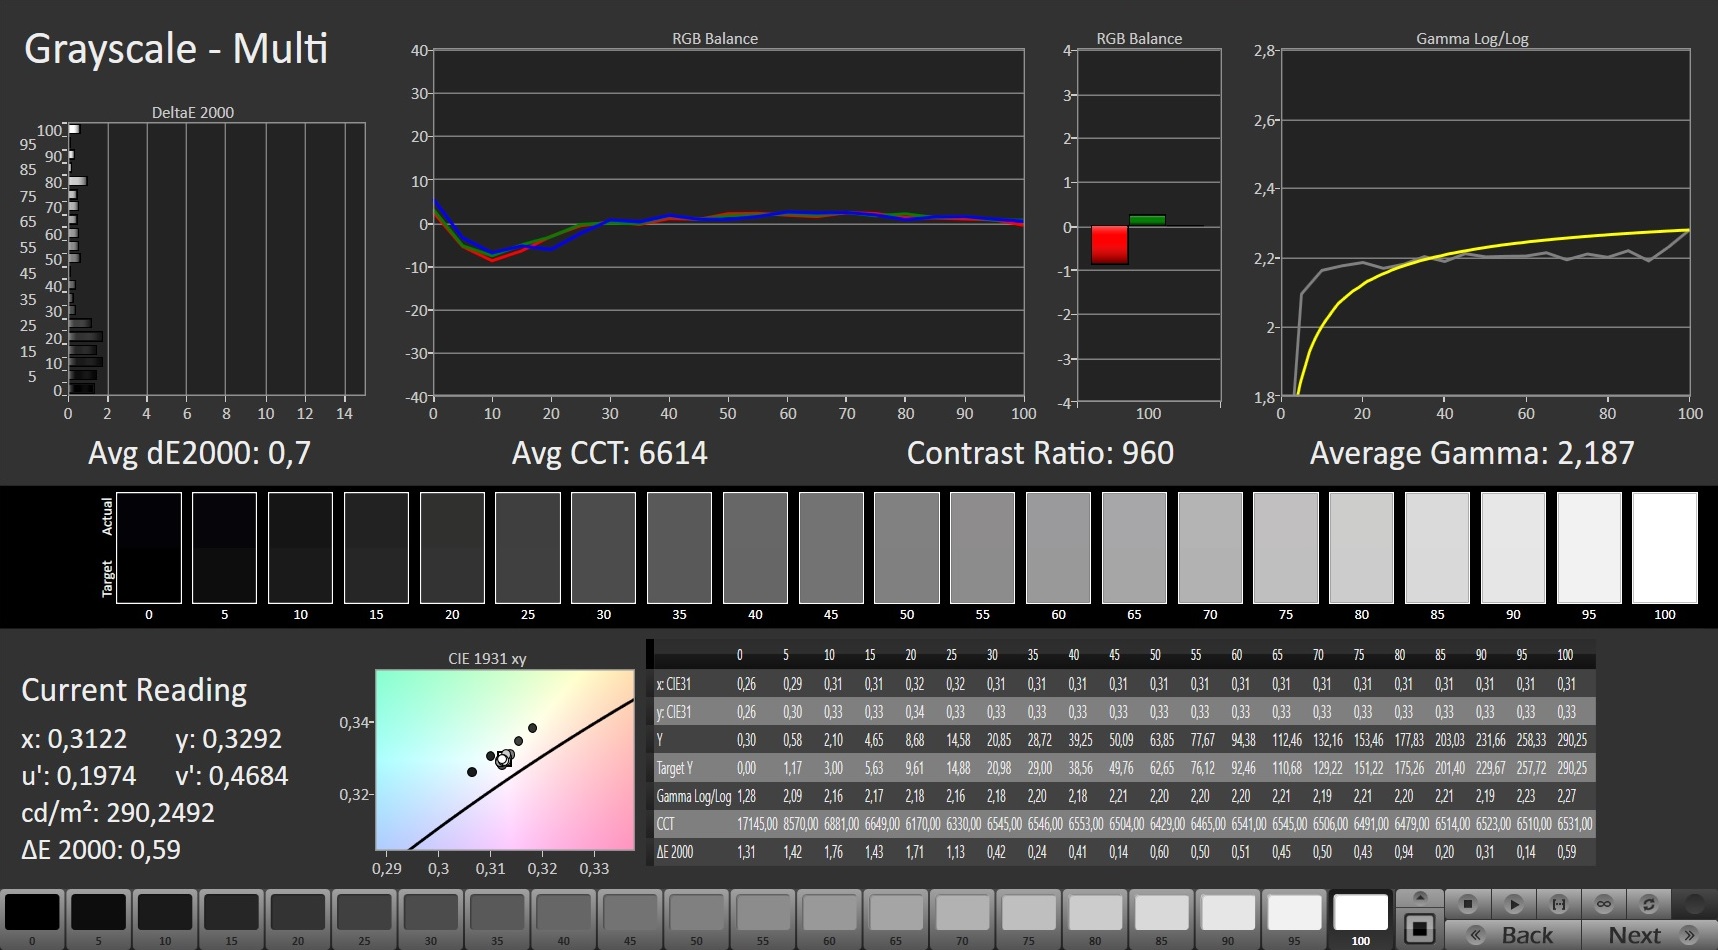
ΔE Greyscale Calman: 5.5 | ∀{0.09-98 Ø4.96}
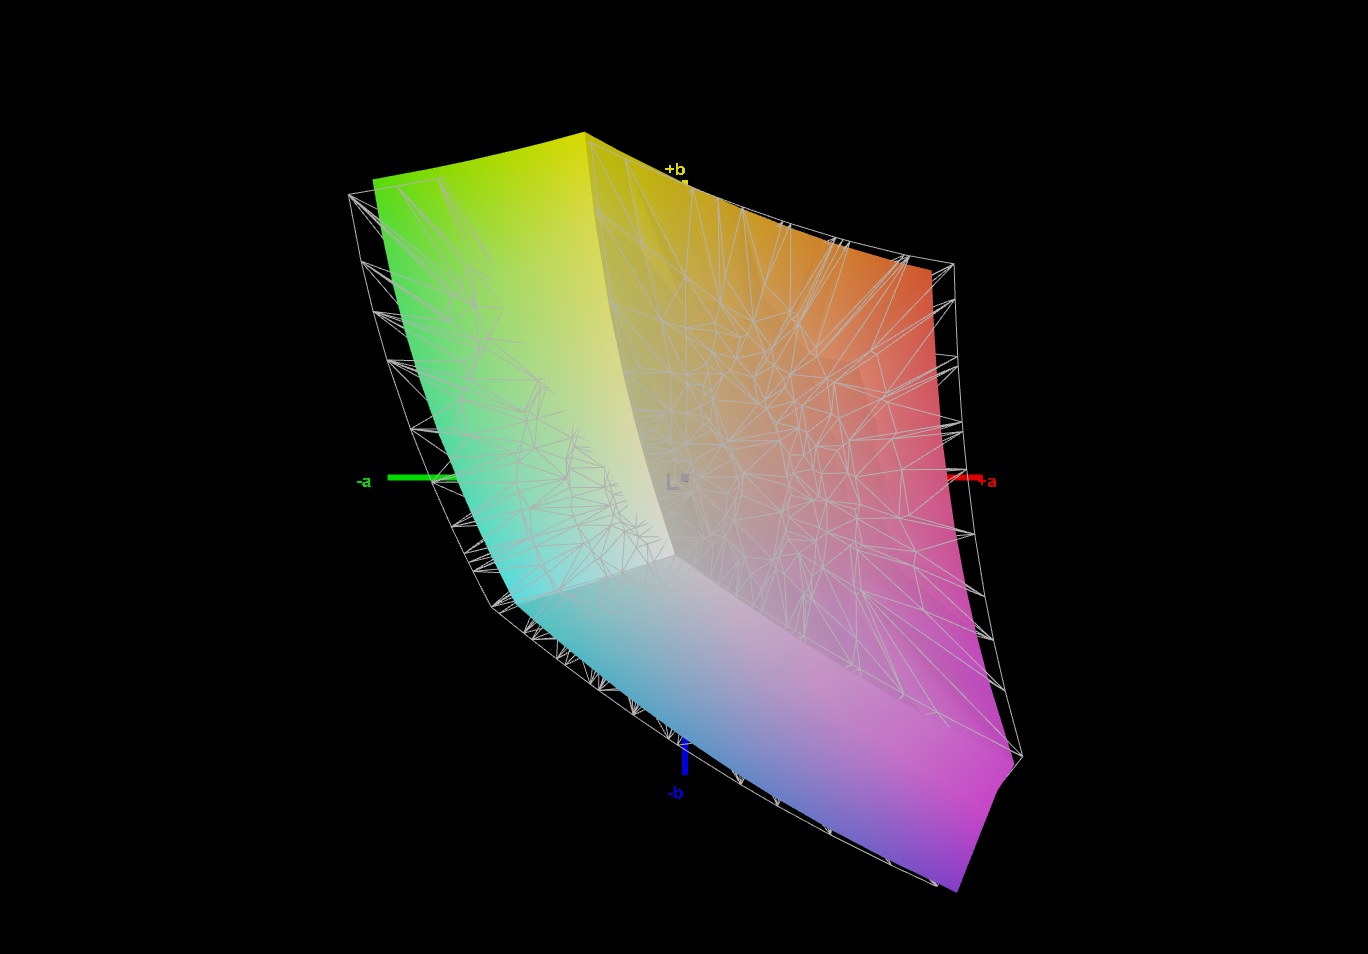
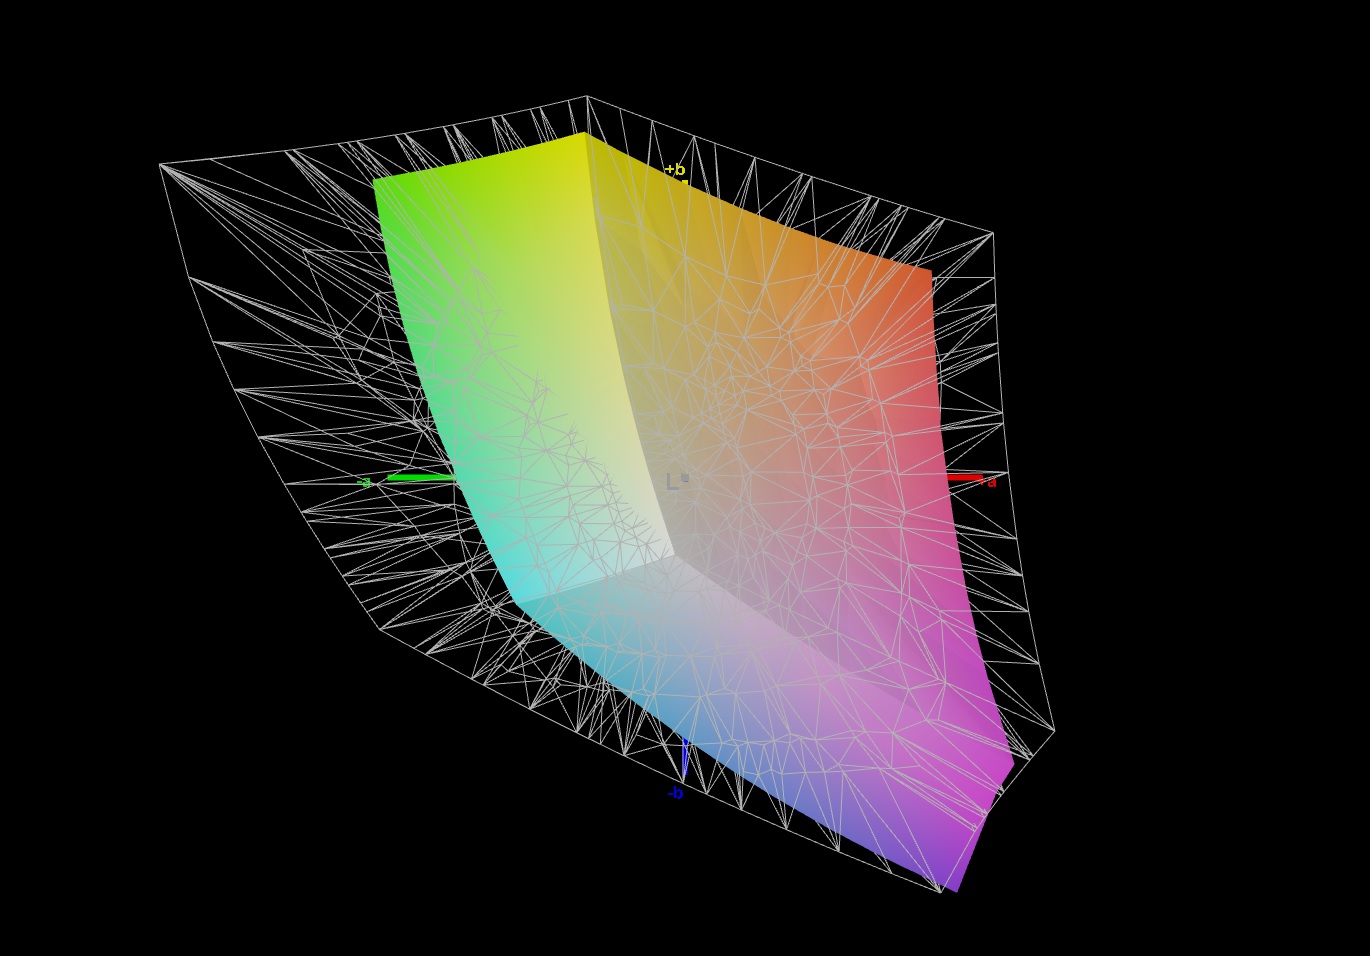
63.2% AdobeRGB 1998 (Argyll 3D)
90.9% sRGB (Argyll 3D)
61.5% Display P3 (Argyll 3D)
Gamma: 2.142
CCT: 7893 K
| Gigabyte A7 X1 AU Optronics AUO8E8D, IPS, 1920x1080, 17.3" | Medion Erazer Beast X25 BOE NE173FHM-NZ1 (BOE0884), IPS, 1920x1080, 17.3" | Medion Erazer Beast X20 BOE CQ NE173QHM-NY2, IPS, 2560x1440, 17.3" | Asus TUF Gaming F17 FX706HM AU Optronics AUI8294 (B173HAN04.9), IPS, 1920x1080, 17.3" | Schenker XMG Neo 17 (Early 2021, RTX 3070, 5800H) BOE NE173QHM-NY2 (BOE0977), IPS, 2560x1440, 17.3" | |
|---|---|---|---|---|---|
| Display | 12% | 12% | -34% | 13% | |
| Display P3 Coverage (%) | 61.5 | 70.4 14% | 70.1 14% | 40.1 -35% | 70.5 15% |
| sRGB Coverage (%) | 90.9 | 99.8 10% | 99 9% | 60 -34% | 99.5 9% |
| AdobeRGB 1998 Coverage (%) | 63.2 | 71.6 13% | 71.3 13% | 41.4 -34% | 71.8 14% |
| Response Times | 46% | 6% | -105% | 1% | |
| Response Time Grey 50% / Grey 80% * (ms) | 16 ? | 9.2 ? 43% | 16 ? -0% | 32.4 -103% | 16.8 ? -5% |
| Response Time Black / White * (ms) | 10.8 ? | 5.6 ? 48% | 9.6 ? 11% | 22.4 -107% | 10 ? 7% |
| PWM Frequency (Hz) | |||||
| Screen | 17% | 19% | -11% | 19% | |
| Brightness middle (cd/m²) | 325 | 329 1% | 370 14% | 266 -18% | 410 26% |
| Brightness (cd/m²) | 318 | 315 -1% | 341 7% | 264 -17% | 381 20% |
| Brightness Distribution (%) | 95 | 88 -7% | 82 -14% | 79 -17% | 88 -7% |
| Black Level * (cd/m²) | 0.29 | 0.33 -14% | 0.42 -45% | 0.32 -10% | 0.37 -28% |
| Contrast (:1) | 1121 | 997 -11% | 881 -21% | 831 -26% | 1108 -1% |
| Colorchecker dE 2000 * | 4.33 | 2.03 53% | 1.76 59% | 3.97 8% | 2.55 41% |
| Colorchecker dE 2000 max. * | 8.6 | 5.5 36% | 2.88 67% | 8.93 -4% | 4.33 50% |
| Colorchecker dE 2000 calibrated * | 1.95 | 0.82 58% | 1.3 33% | 3.5 -79% | 1.28 34% |
| Greyscale dE 2000 * | 5.5 | 3.5 36% | 1.8 67% | 1.8 67% | 3.4 38% |
| Gamma | 2.142 103% | 2.223 99% | 2.176 101% | 2.31 95% | 2.275 97% |
| CCT | 7893 82% | 6526 100% | 6543 99% | 6754 96% | 6637 98% |
| Color Space (Percent of AdobeRGB 1998) (%) | 41.4 | 72 | |||
| Color Space (Percent of sRGB) (%) | 60 | 95 | |||
| Média Total (Programa/Configurações) | 25% /
20% | 12% /
15% | -50% /
-29% | 11% /
15% |
* ... menor é melhor
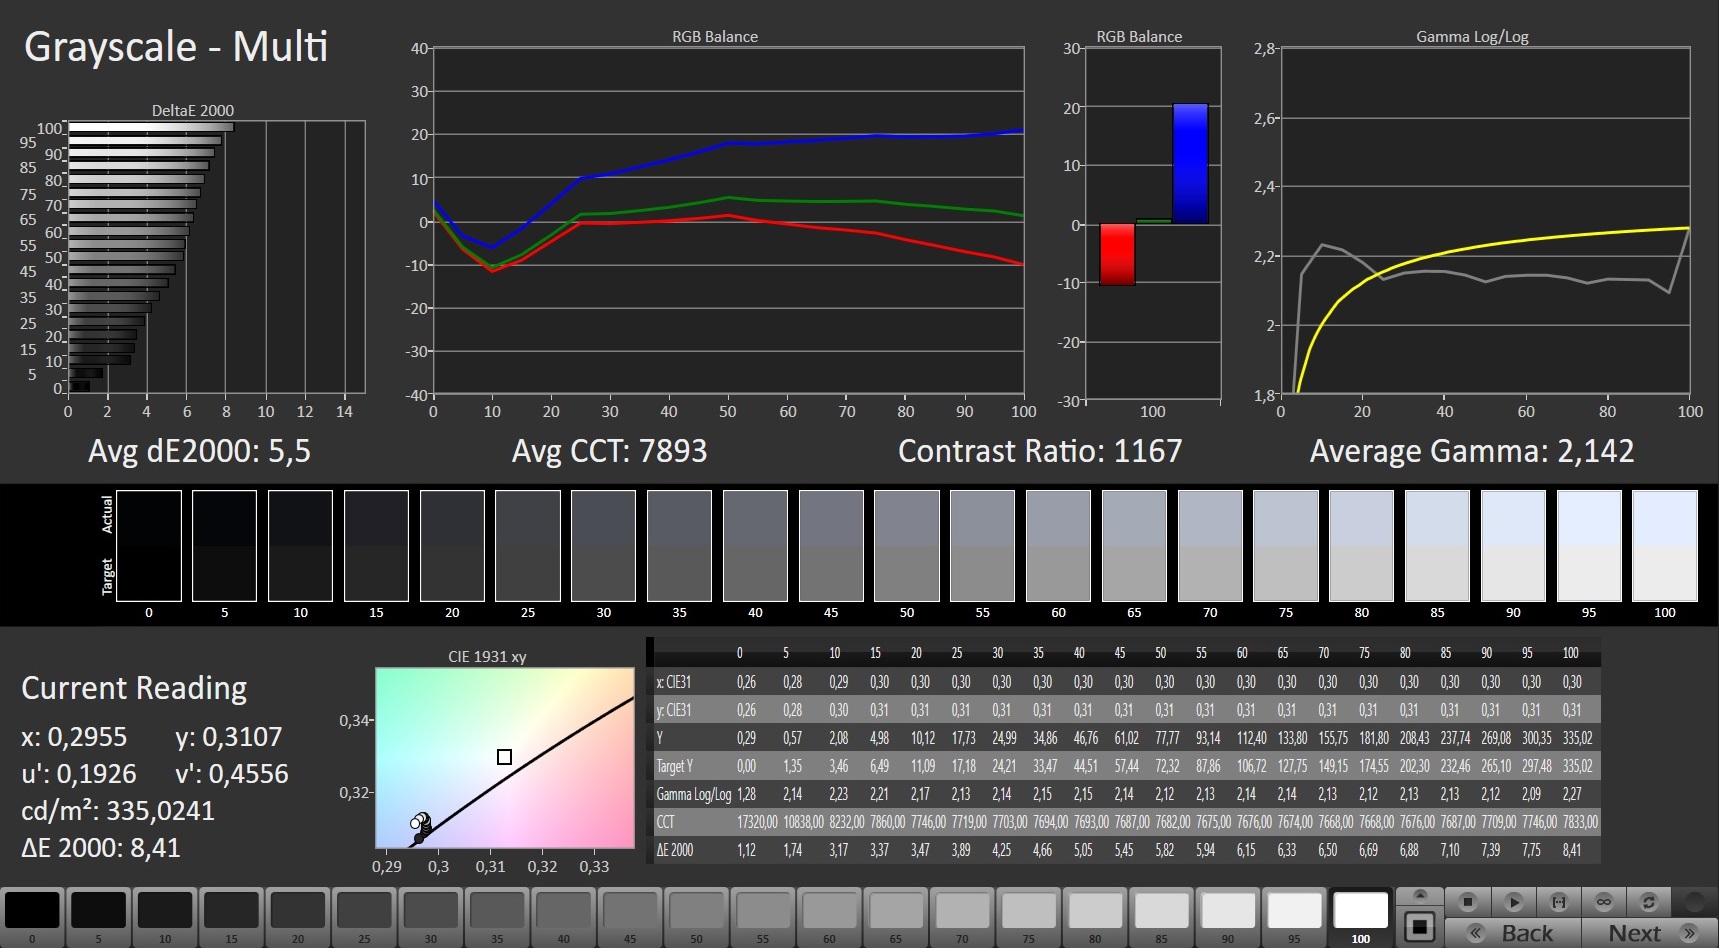
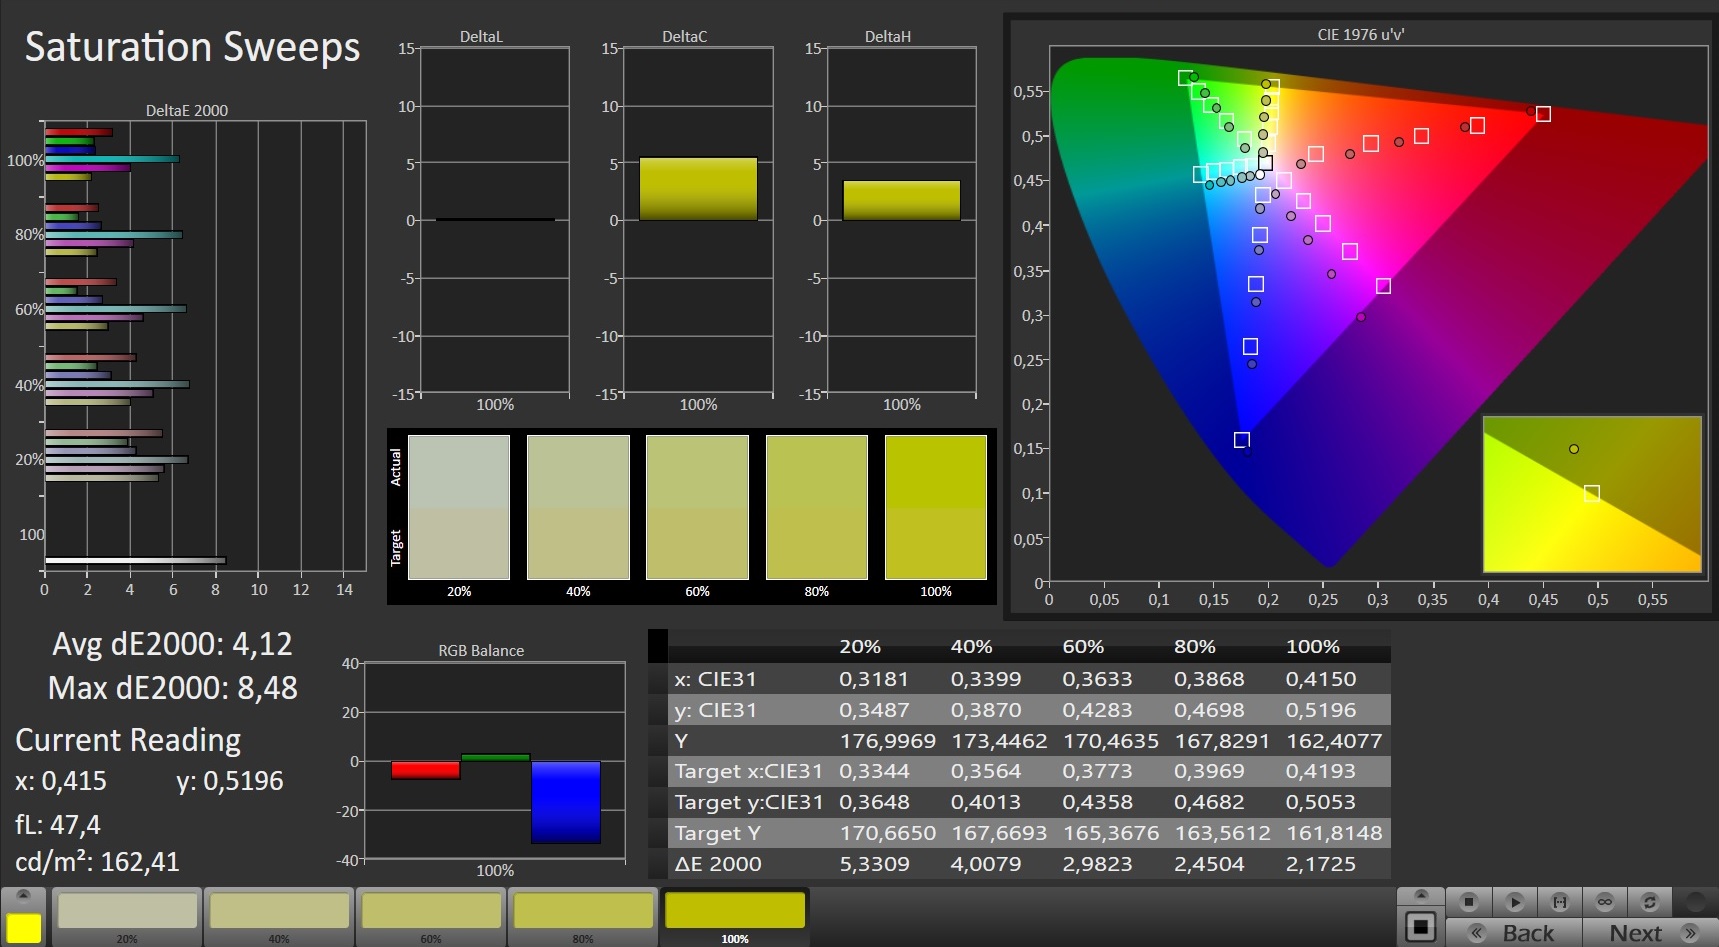
O laptop para jogos Gigabyte também é capaz de liderar nosso campo de teste com uma relação de contraste de 1.121:1 e um nível de preto de 0,29 cd/m². A cobertura de espaço de cor de 90,9% (sRGB) e 63,2% (AdobeRGB) é um pouco menor, mas as imagens ainda parecem vívidas.
A análise do CalMAN também mostra que as cores são exibidas com uma proporção azul que é muito alta fora da caixa. No entanto, isto pode ser corrigido quase completamente com uma calibração. O arquivo ICC correspondente pode ser baixado na janela localizada na parte superior, à direita do gráfico de distribuição de brilho da tela
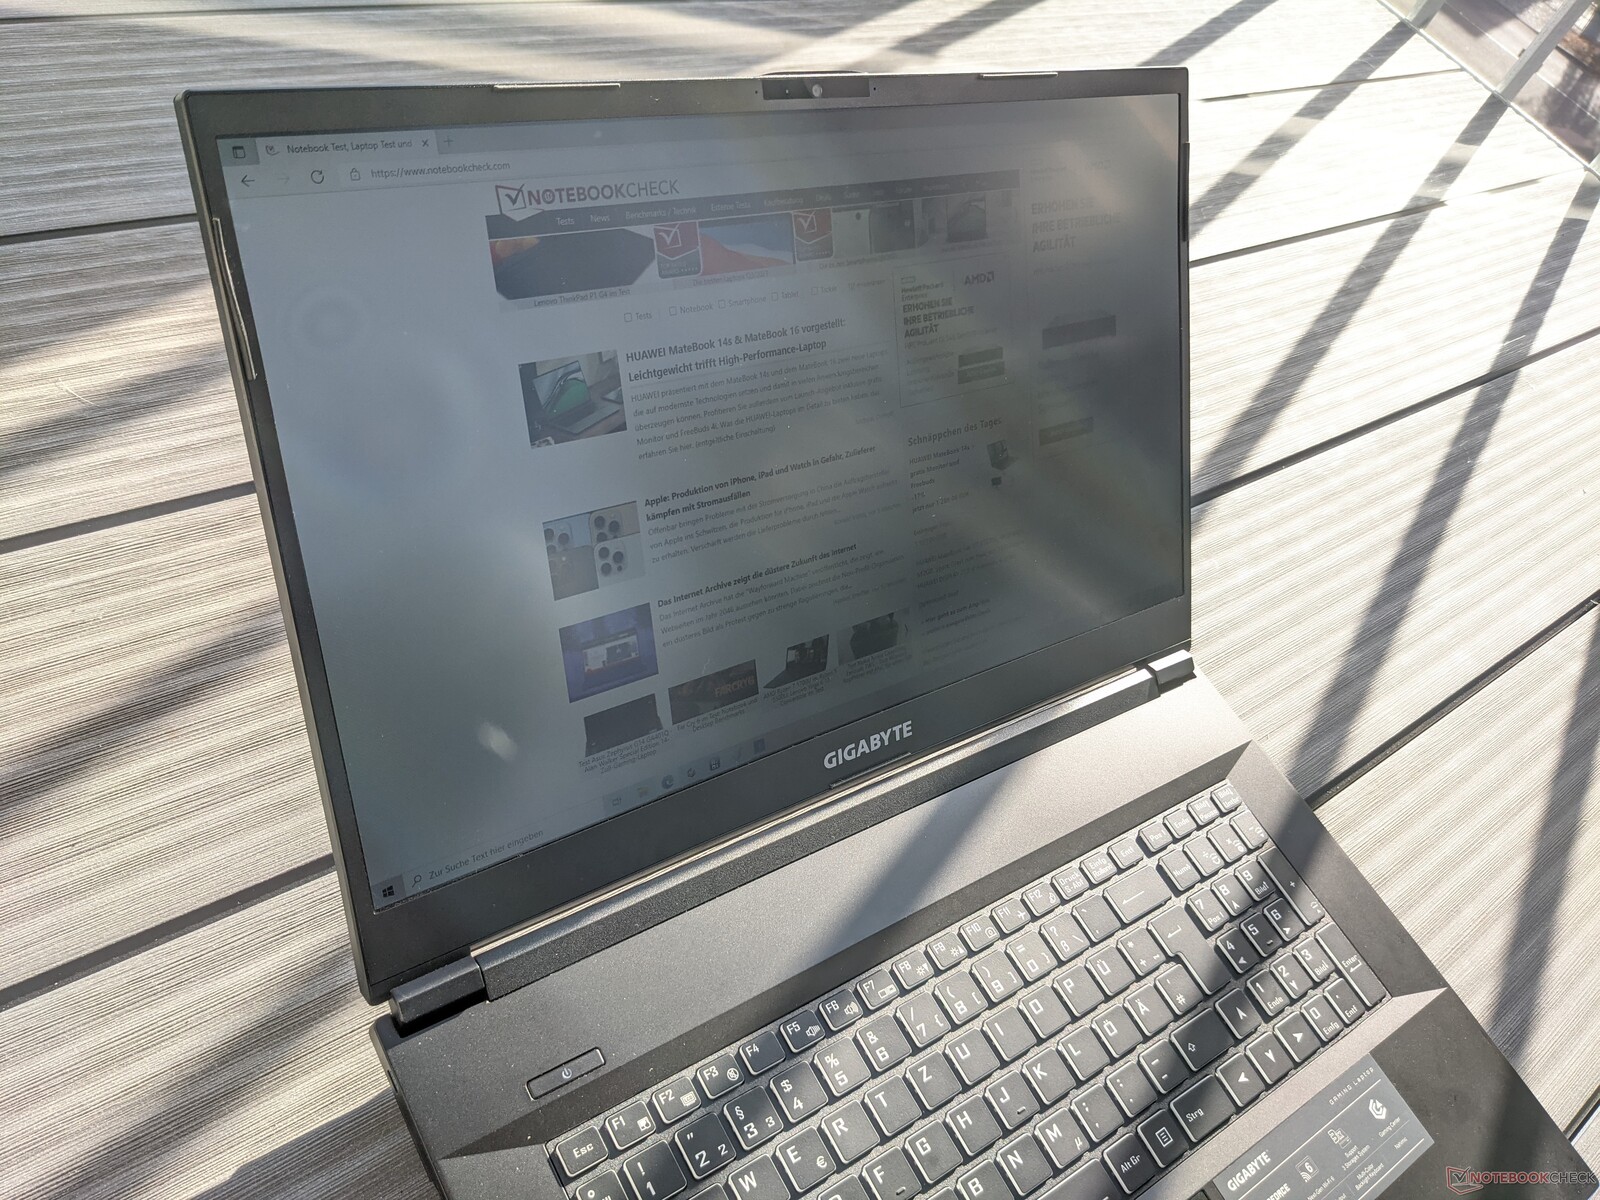
O laptop para jogos Gigabyte pode definitivamente ser usado ao ar livre, desde que as áreas com sombra sejam favorecidas. A tela mate não é reflexiva, mas o brilho da tela não é suficiente para compensar a forte luz ambiente
Exibir tempos de resposta
| ↔ Tempo de resposta preto para branco | ||
|---|---|---|
| 10.8 ms ... ascensão ↗ e queda ↘ combinadas | ↗ 6.4 ms ascensão | 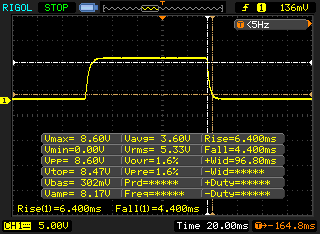 |
| ↘ 4.4 ms queda | ||
| A tela mostra boas taxas de resposta em nossos testes, mas pode ser muito lenta para jogadores competitivos. Em comparação, todos os dispositivos testados variam de 0.1 (mínimo) a 240 (máximo) ms. » 29 % de todos os dispositivos são melhores. Isso significa que o tempo de resposta medido é melhor que a média de todos os dispositivos testados (19.8 ms). | ||
| ↔ Tempo de resposta 50% cinza a 80% cinza | ||
| 16 ms ... ascensão ↗ e queda ↘ combinadas | ↗ 7.6 ms ascensão | 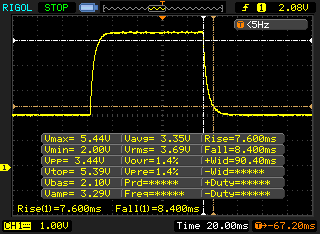 |
| ↘ 8.4 ms queda | ||
| A tela mostra boas taxas de resposta em nossos testes, mas pode ser muito lenta para jogadores competitivos. Em comparação, todos os dispositivos testados variam de 0.165 (mínimo) a 636 (máximo) ms. » 30 % de todos os dispositivos são melhores. Isso significa que o tempo de resposta medido é melhor que a média de todos os dispositivos testados (30.9 ms). | ||
Cintilação da tela / PWM (modulação por largura de pulso)
| Tela tremeluzindo / PWM não detectado | 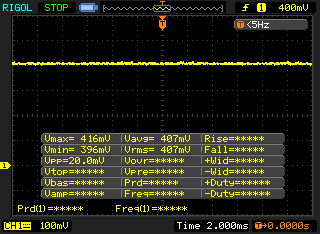 | ||
[pwm_comparison] Em comparação: 52 % de todos os dispositivos testados não usam PWM para escurecer a tela. Se PWM foi detectado, uma média de 7748 (mínimo: 5 - máximo: 343500) Hz foi medida. | |||
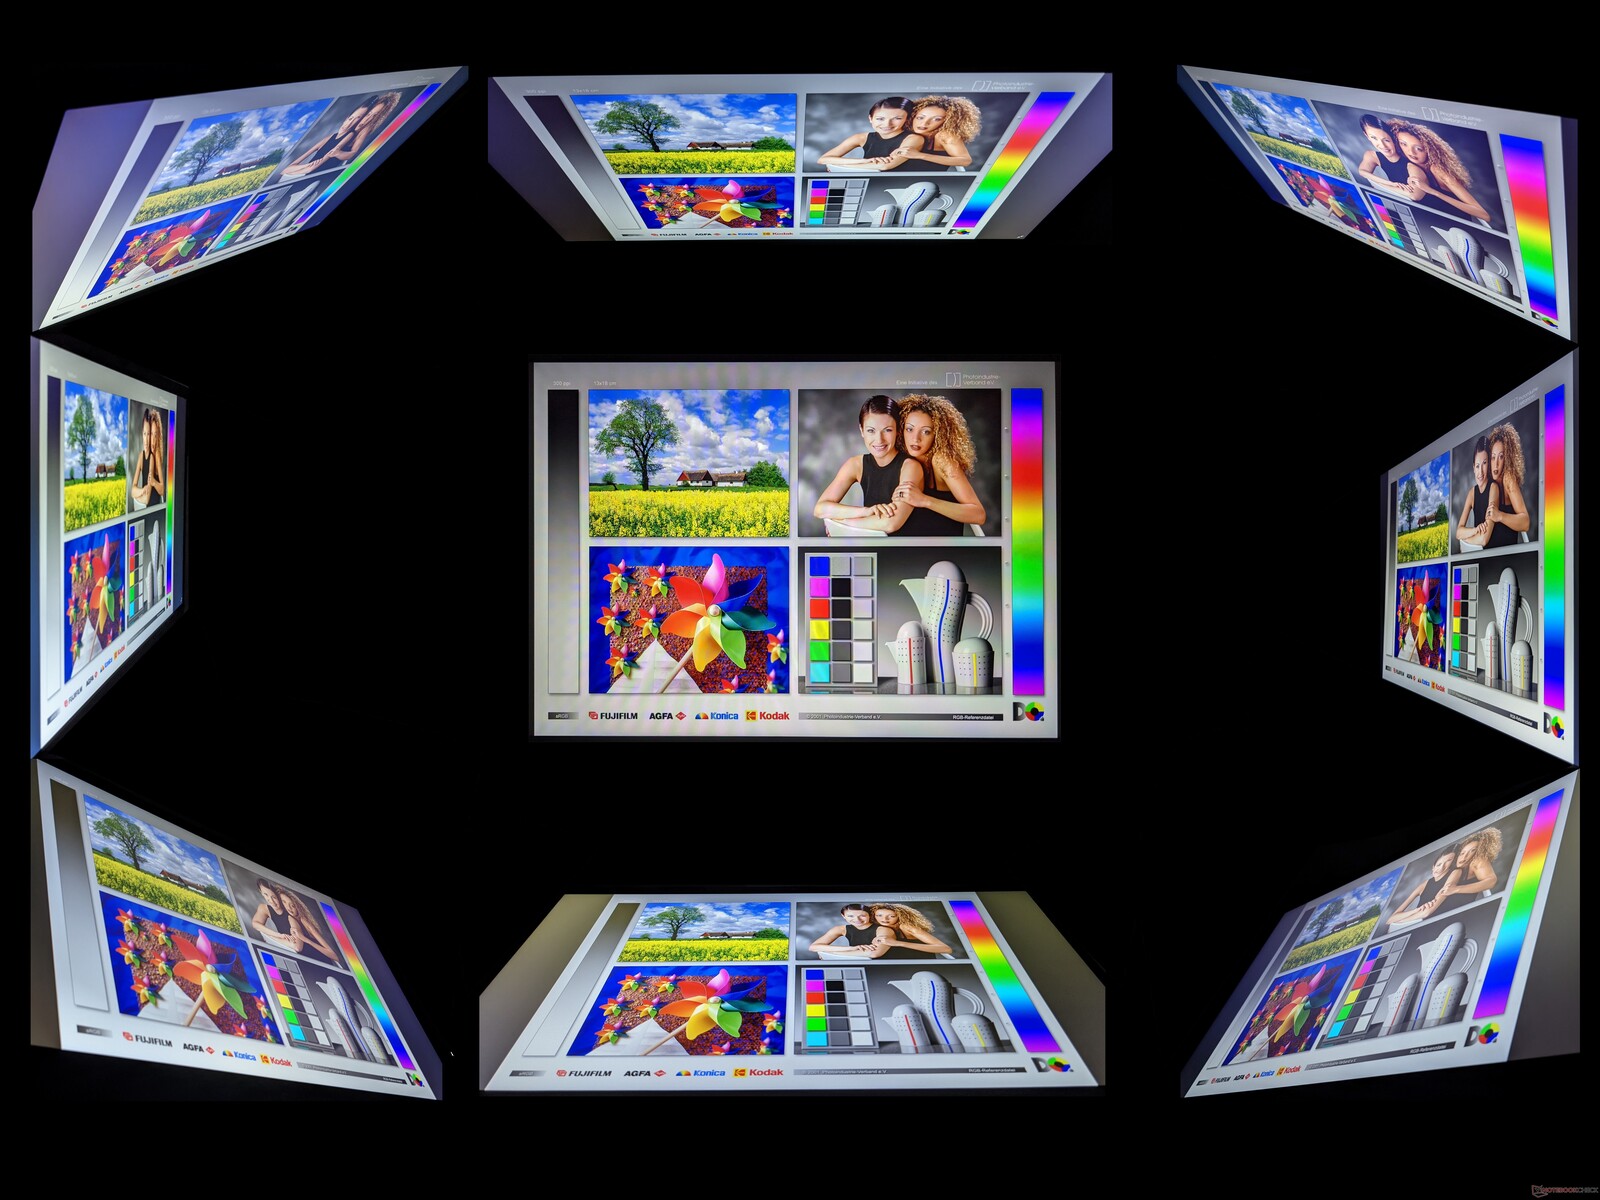
O painel IPS do Gigabyte A7 X1 é muito estável ao ângulo de visão. Isto permite que o conteúdo seja visualizado sem distorções ou cores imprecisas, mesmo de ângulos muito planos
Desempenho - Estável mesmo sob carga prolongada
A Gigabyte equipou o A7 X1 com o mais moderno hardware para jogos. Nossa configuração de revisão vem com uma poderosa CPU AMD, mas este modelo também está disponível como o Gigabyte K7 com o Intel Core i7-10870H e oNvidia GeForce RTX 3060
Processador
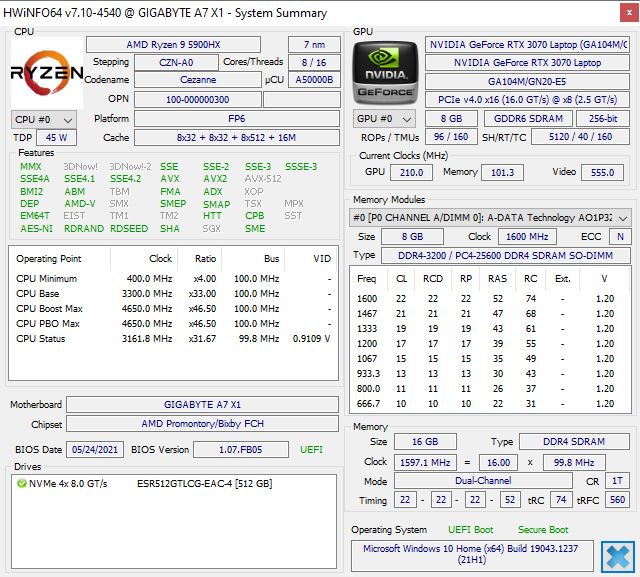
OAMD Ryzen 9 5900HX usado aqui é um processador com oito núcleos que pode lidar com até 16 tarefas simultaneamente. As taxas de relógio estão entre 3,3 e 4,6 GHz, sendo o sistema de resfriamento e o TDP pré-ajustado significativamente responsáveis pelo desempenho. A Gigabyte escolheu um valor de longo prazo do TDP (PL1) de 54 watts. O consumo de energia a curto prazo (PL2) pode chegar até 65 watts.
Em nosso loop de carga contínua Cinebench R15, o laptop para jogos da Gigabyte é capaz de manter seu desempenho de CPU a um nível muito estável e alto. O A7 X1 mostra um bom desempenho multi-core nos testes individuais em particular, o que normalmente é suficiente para um dos melhores lugares em nosso campo de testes.
Cinebench R15 Multi endurance test
* ... menor é melhor
Desempenho do sistema
O Gigabyte A7 X1 atinge uma pontuação no meio do nosso campo de teste no teste PCMark 10 para avaliar o desempenho do sistema. Enquanto alcançou o primeiro lugar nas subcategorias "Produtividade" e "Criação de Conteúdo Digital", a modesta pontuação "Essentials" traz a classificação geral para baixo.
Durante nosso período de teste, o sistema funcionou muito bem e respondeu com extrema rapidez às entradas. Tanto as aplicações quanto as pastas foram lançadas e abertas sem atrasos.
| PCMark 10 / Score | |
| Média da turma Gaming (5828 - 12414, n=94, últimos 2 anos) | |
| Schenker XMG Neo 17 (Early 2021, RTX 3070, 5800H) | |
| Média AMD Ryzen 9 5900HX, NVIDIA GeForce RTX 3070 Laptop GPU (6875 - 6967, n=4) | |
| Asus TUF Gaming F17 FX706HM | |
| Gigabyte A7 X1 | |
| Medion Erazer Beast X25 | |
| Medion Erazer Beast X20 | |
| PCMark 10 / Essentials | |
| Média da turma Gaming (8810 - 11935, n=98, últimos 2 anos) | |
| Asus TUF Gaming F17 FX706HM | |
| Média AMD Ryzen 9 5900HX, NVIDIA GeForce RTX 3070 Laptop GPU (9991 - 10413, n=3) | |
| Schenker XMG Neo 17 (Early 2021, RTX 3070, 5800H) | |
| Medion Erazer Beast X25 | |
| Gigabyte A7 X1 | |
| Medion Erazer Beast X20 | |
| PCMark 10 / Productivity | |
| Média da turma Gaming (6845 - 25323, n=96, últimos 2 anos) | |
| Média AMD Ryzen 9 5900HX, NVIDIA GeForce RTX 3070 Laptop GPU (9301 - 9381, n=3) | |
| Gigabyte A7 X1 | |
| Medion Erazer Beast X25 | |
| Asus TUF Gaming F17 FX706HM | |
| Schenker XMG Neo 17 (Early 2021, RTX 3070, 5800H) | |
| Medion Erazer Beast X20 | |
| PCMark 10 / Digital Content Creation | |
| Média da turma Gaming (7602 - 19954, n=96, últimos 2 anos) | |
| Schenker XMG Neo 17 (Early 2021, RTX 3070, 5800H) | |
| Gigabyte A7 X1 | |
| Média AMD Ryzen 9 5900HX, NVIDIA GeForce RTX 3070 Laptop GPU (9383 - 9561, n=3) | |
| Medion Erazer Beast X25 | |
| Asus TUF Gaming F17 FX706HM | |
| Medion Erazer Beast X20 | |
| PCMark 10 Score | 6898 pontos | |
Ajuda | ||
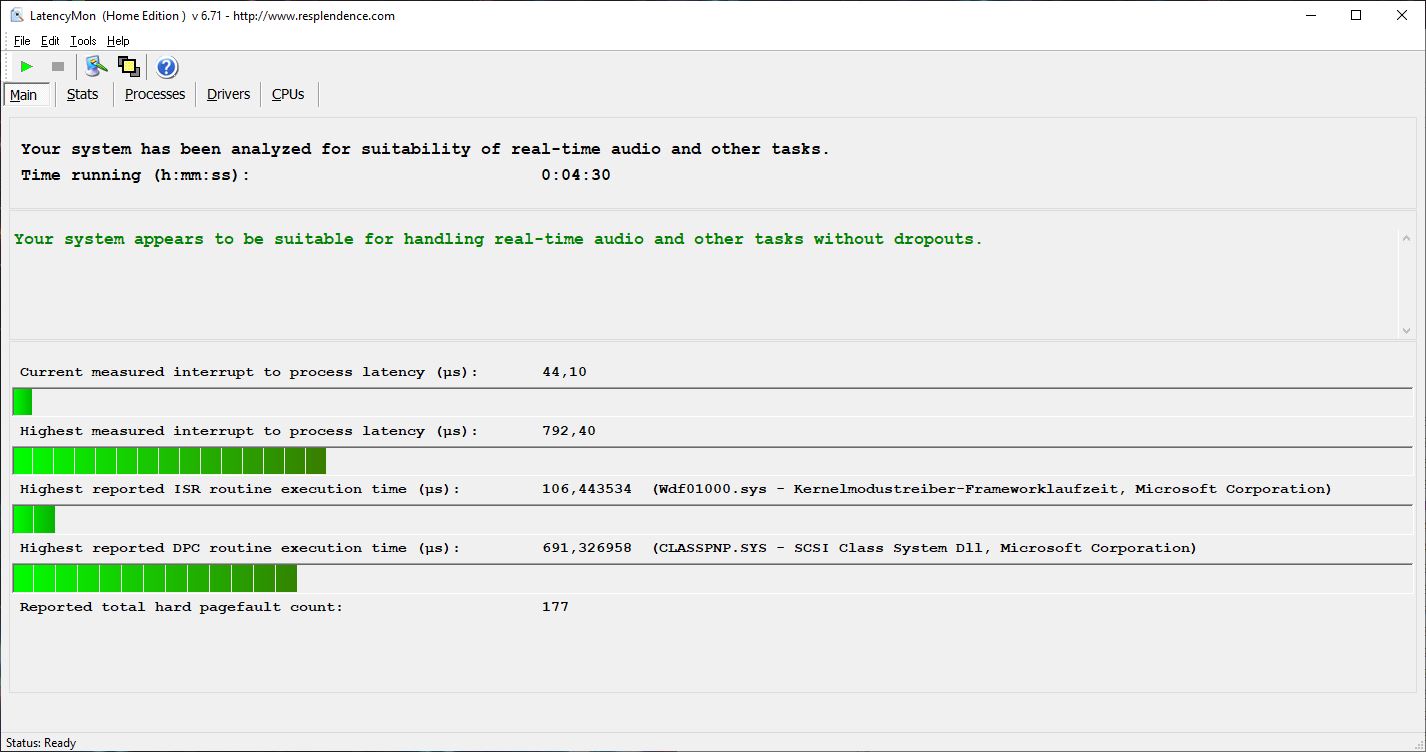
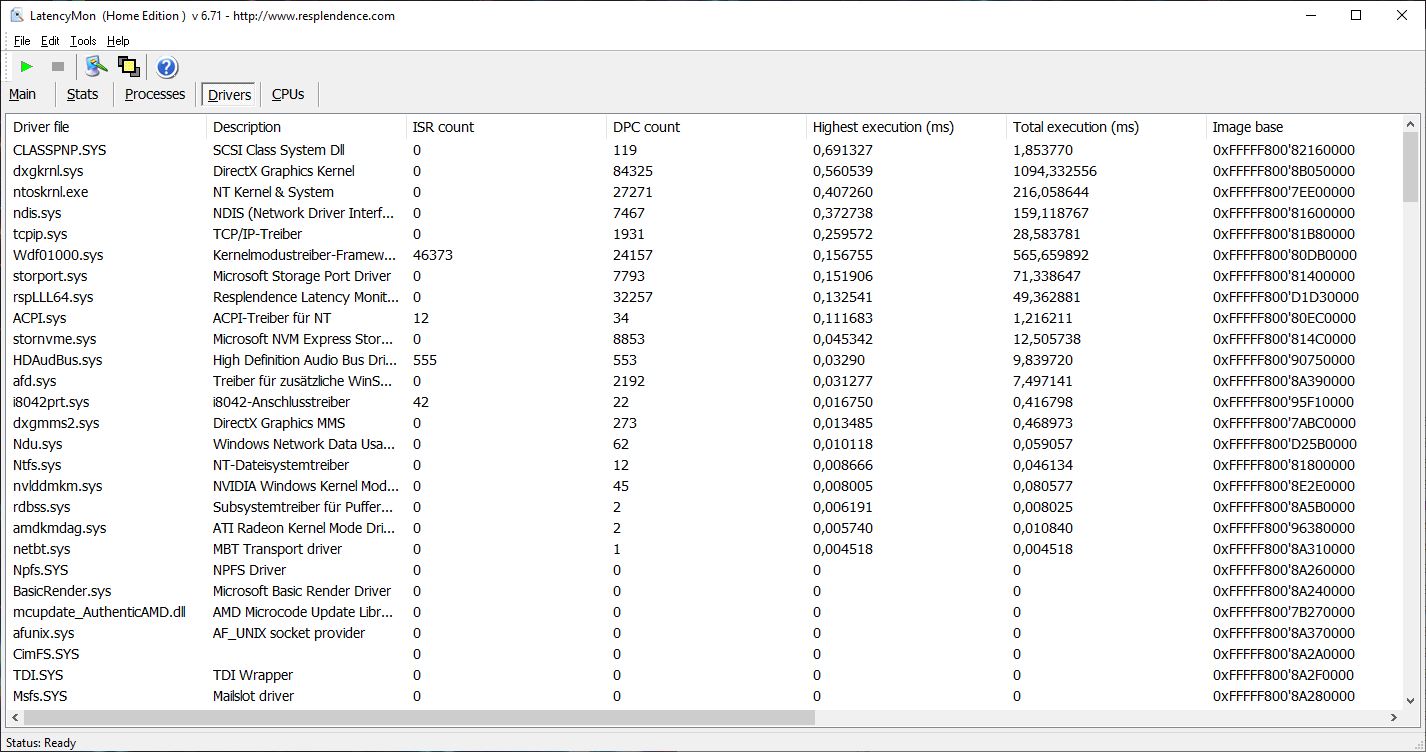
Latências DPC
Em nossa configuração de teste, o Gigabyte A7 X1 mostra latências muito baixas no teste LatencyMon. Isto o torna bem adequado para aplicações em tempo real
| DPC Latencies / LatencyMon - interrupt to process latency (max), Web, Youtube, Prime95 | |
| Schenker XMG Neo 17 (Early 2021, RTX 3070, 5800H) | |
| Asus TUF Gaming F17 FX706HM | |
| Medion Erazer Beast X25 | |
| Medion Erazer Beast X20 | |
| Gigabyte A7 X1 | |
* ... menor é melhor
Armazenamento
O SSD usado pela Gigabyte em nossa configuração de teste mostra taxas de leitura e escrita muito boas, que são apenas ligeiramente ultrapassadas pelo resto de nosso campo de teste na maioria dos casos.
Para uma comparação com outros dispositivos de armazenamento em massa, consulte nosso artigoHDD/SSD Benchmarks.
| Gigabyte A7 X1 ESR512GTLCG-EAC-4 | Medion Erazer Beast X25 Samsung PM9A1 MZVL22T0HBLB | Medion Erazer Beast X20 Phison E12S-2TB-Phison-SSD-BICS4 | Asus TUF Gaming F17 FX706HM SK Hynix HFM001TD3JX013N | Schenker XMG Neo 17 (Early 2021, RTX 3070, 5800H) Samsung SSD 970 EVO Plus 500GB | Média ESR512GTLCG-EAC-4 | |
|---|---|---|---|---|---|---|
| CrystalDiskMark 5.2 / 6 | 14% | 3% | 18% | 27% | 3% | |
| Write 4K (MB/s) | 125.1 | 129.7 4% | 155.5 24% | 168.8 35% | 206.1 65% | 131.6 ? 5% |
| Read 4K (MB/s) | 43.51 | 62.4 43% | 47.96 10% | 72 65% | 53 22% | 45.4 ? 4% |
| Write Seq (MB/s) | 2128 | 2436 14% | 1591 -25% | 3018 42% | 2303 ? 8% | |
| Read Seq (MB/s) | 1958 | 2354 20% | 1371 -30% | 2575 32% | 1716 ? -12% | |
| Write 4K Q32T1 (MB/s) | 579 | 512 -12% | 532 -8% | 459.5 -21% | 535 -8% | 525 ? -9% |
| Read 4K Q32T1 (MB/s) | 464.4 | 436.2 -6% | 627 35% | 473.1 2% | 608 31% | 581 ? 25% |
| Write Seq Q32T1 (MB/s) | 2501 | 3541 42% | 3017 21% | 3129 25% | 3242 30% | 2515 ? 1% |
| Read Seq Q32T1 (MB/s) | 3473 | 3568 3% | 3440 -1% | 3529 2% | 3617 4% | 3417 ? -2% |
| AS SSD | 16% | 15% | 10% | 26% | 6% | |
| Seq Read (MB/s) | 2859 | 2591 -9% | 2849 0% | 2837 -1% | 3020 6% | 2643 ? -8% |
| Seq Write (MB/s) | 1530 | 1900 24% | 2831 85% | 1565 2% | 2631 72% | 2134 ? 39% |
| 4K Read (MB/s) | 41.47 | 53.9 30% | 51.3 24% | 55.4 34% | 60.3 45% | 48.3 ? 16% |
| 4K Write (MB/s) | 133.9 | 112.6 -16% | 106.3 -21% | 152.9 14% | 171.6 28% | 116.4 ? -13% |
| 4K-64 Read (MB/s) | 1218 | 1335 10% | 1763 45% | 1327 9% | 1410 16% | 1586 ? 30% |
| 4K-64 Write (MB/s) | 2108 | 2966 41% | 2010 -5% | 1922 -9% | 2324 10% | 1975 ? -6% |
| Access Time Read * (ms) | 0.098 | 0.038 61% | 0.093 5% | 0.035 64% | 0.045 54% | 0.09975 ? -2% |
| Access Time Write * (ms) | 0.028 | 0.036 -29% | 0.035 -25% | 0.028 -0% | 0.024 14% | 0.03325 ? -19% |
| Score Read (Points) | 1545 | 1648 7% | 2099 36% | 1666 8% | 1773 15% | 1899 ? 23% |
| Score Write (Points) | 2395 | 3269 36% | 2399 0% | 2232 -7% | 2759 15% | 2305 ? -4% |
| Score Total (Points) | 4666 | 5733 23% | 5573 19% | 4695 1% | 5429 16% | 5151 ? 10% |
| Média Total (Programa/Configurações) | 15% /
15% | 9% /
10% | 14% /
13% | 27% /
27% | 5% /
5% |
* ... menor é melhor

Continuous load read: DiskSpd Read Loop, Queue Depth 8
Placa gráfica
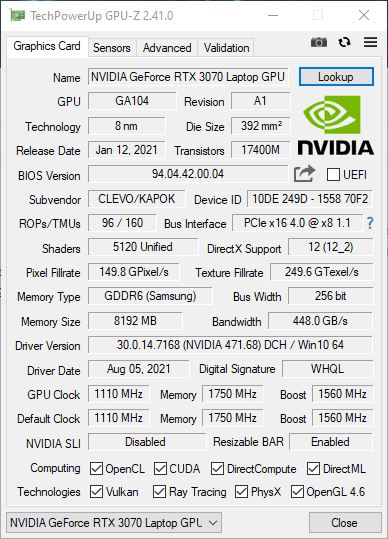
UmNvidia GeForce RTX 3070 é responsável pela renderização de conteúdo de imagem exigente no A7 X1. Este último pode operar com um TDP de 140 watts, obtendo assim resultados muito bons nos testes 3DMark, que estão apenas um pouco aquém de um dos melhores lugares em nosso campo de testes. Por outro lado, o laptop Gigabyte pode liderar nosso campo de testes quando se trata do benchmark 3DMark 11.
Para ver como outras placas gráficas funcionam em comparação, consulte nosso artigoGPU Benchmarks.
| 3DMark 11 Performance | 26404 pontos | |
| 3DMark Cloud Gate Standard Score | 54931 pontos | |
| 3DMark Fire Strike Score | 23233 pontos | |
| 3DMark Time Spy Score | 10315 pontos | |
Ajuda | ||
Desempenho do jogo
O Gigabyte A7 X1 alcança consistentemente taxas de quadros suaves e altas com resolução Full HD e o máximo de detalhes nos jogos que testamos. Isto significa que tanto os títulos recentes quanto os próximos serão executados sem nenhum problema. Em comparação com nosso campo de teste, as taxas alcançadas estão em um nível médio e um pouco abaixo da média de outros laptops de jogos com oNvidia GeForce RTX 3070 às vezes.
NossoartigoGPU Benchmarks mostra o desempenho que pode ser esperado doNvidia GeForce RTX 3070 em outros jogos.
| The Witcher 3 - 1920x1080 Ultra Graphics & Postprocessing (HBAO+) | |
| Média da turma Gaming (104.7 - 240, n=7, últimos 2 anos) | |
| Medion Erazer Beast X20 | |
| Schenker XMG Neo 17 (Early 2021, RTX 3070, 5800H) | |
| Medion Erazer Beast X25 | |
| Gigabyte A7 X1 | |
| Média NVIDIA GeForce RTX 3070 Laptop GPU (34.9 - 109, n=52) | |
| Asus TUF Gaming F17 FX706HM | |
| Final Fantasy XV Benchmark - 1920x1080 High Quality | |
| Média da turma Gaming (41 - 215, n=95, últimos 2 anos) | |
| Medion Erazer Beast X25 | |
| Medion Erazer Beast X20 | |
| Média NVIDIA GeForce RTX 3070 Laptop GPU (27.9 - 107, n=49) | |
| Asus TUF Gaming F17 FX706HM | |
| Strange Brigade - 1920x1080 ultra AA:ultra AF:16 | |
| Média da turma Gaming (76.3 - 458, n=87, últimos 2 anos) | |
| Gigabyte A7 X1 | |
| Medion Erazer Beast X20 | |
| Medion Erazer Beast X25 | |
| Média NVIDIA GeForce RTX 3070 Laptop GPU (36.2 - 194, n=46) | |
| Asus TUF Gaming F17 FX706HM | |
Nosso teste de resistência com o The Witcher 3 também mostra que o desempenho não sofre notavelmente mesmo durante longas sessões de jogo, e que o sistema é capaz de compensar bem as flutuações
The Witcher 3 FPS diagram
| baixo | média | alto | ultra | |
|---|---|---|---|---|
| GTA V (2015) | 174 | 164 | 139 | 83.6 |
| The Witcher 3 (2015) | 95.9 | |||
| Dota 2 Reborn (2015) | 139 | 125 | 119 | 113 |
| X-Plane 11.11 (2018) | 98.9 | 86.8 | 72.2 | |
| Strange Brigade (2018) | 311 | 232 | 208 | 185 |
| Cyberpunk 2077 1.0 (2020) | 104.5 | 89.6 | 77.1 | 66.3 |
Emissões - O laptop também pode funcionar silenciosamente
Emissões sonoras
Quando o Gigabyte A7 X1 é usado apenas para executar o navegador e realizar tarefas de escritório, o laptop geralmente é silencioso, e os ventiladores raramente sobem a um silencioso 35 dB(A). Sob carga e em modo de jogo, porém, o nível de ruído pode ficar consideravelmente mais alto e irritante com até 59 dB(A).
Não fomos capazes de detectar qualquer outro ruído de fundo, como choro de bobina ou algo parecido.
Barulho
| Ocioso |
| 25 / 29 / 35 dB |
| Carga |
| 58 / 59 dB |
 | ||
30 dB silencioso 40 dB(A) audível 50 dB(A) ruidosamente alto |
||
min: | ||
Temperatura
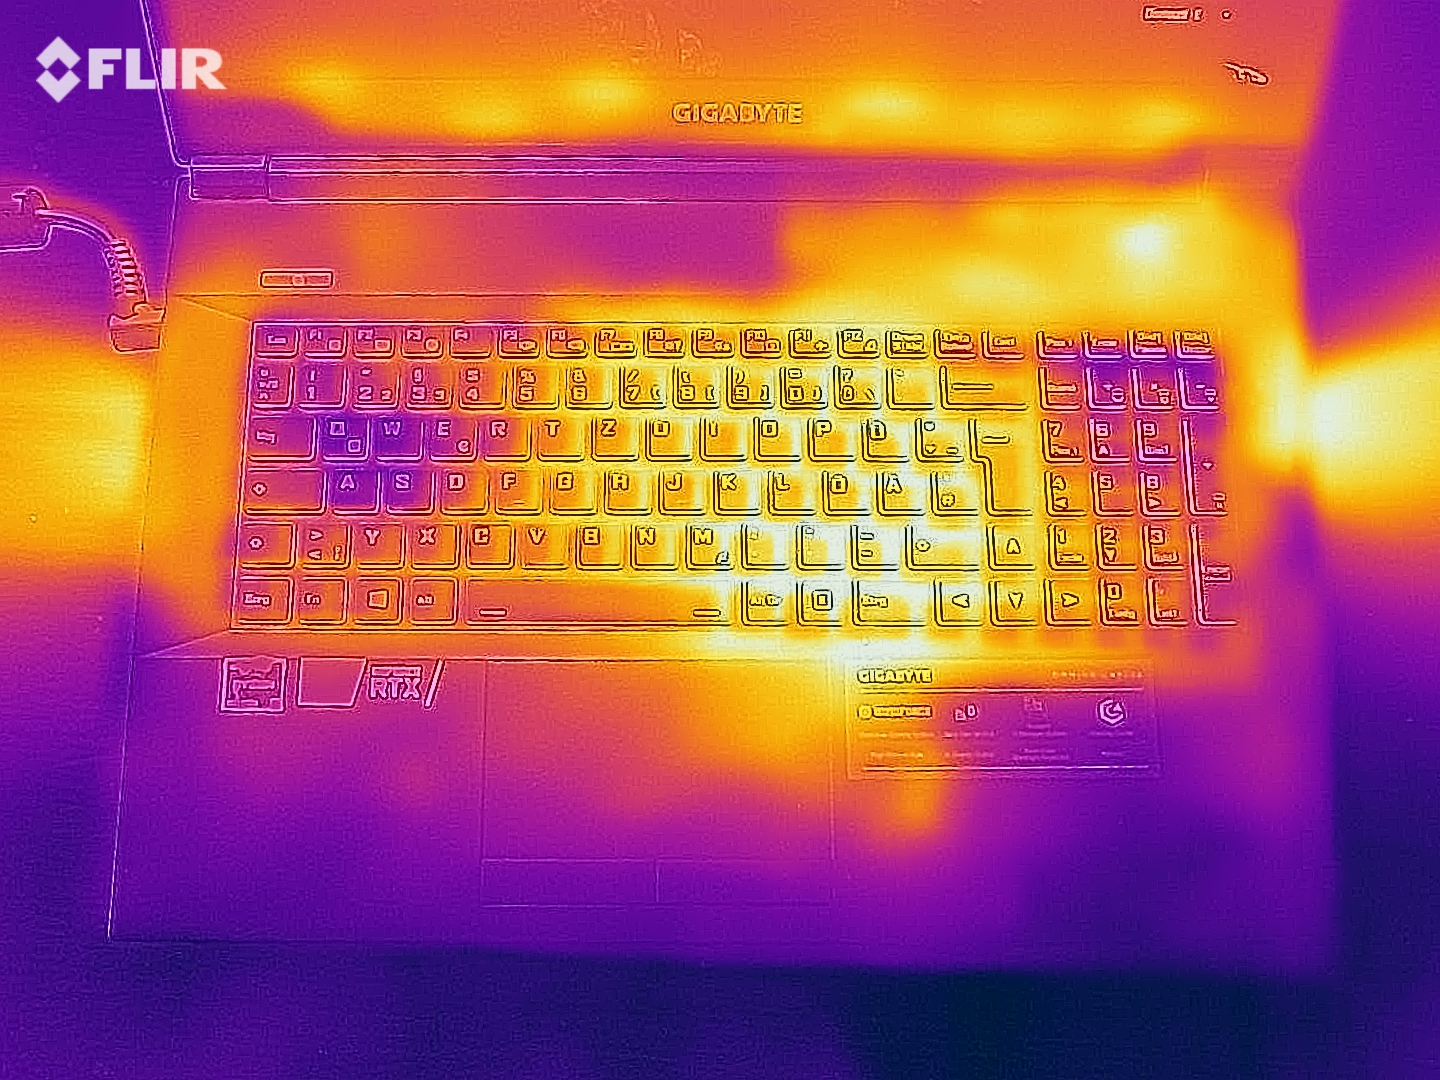
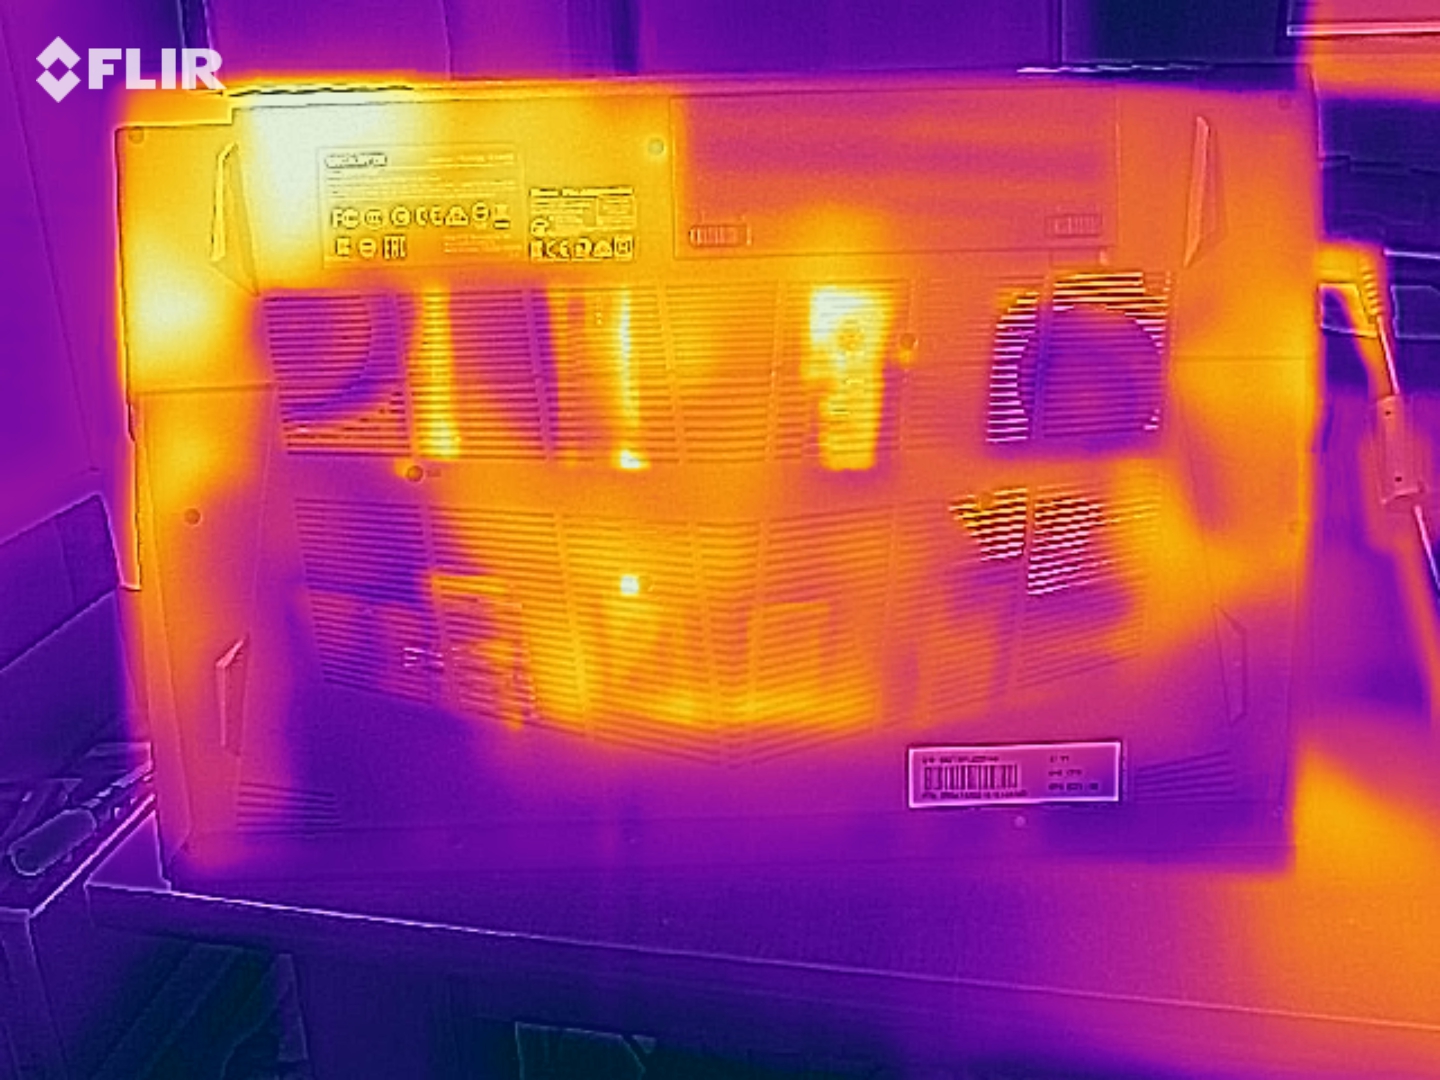
De acordo com nossas medidas, as superfícies do Gigabyte A7 X1 aquecem até 49 °C (~120 °F). O ponto mais quente é no canto inferior esquerdo, mas o laptop de jogo nunca se sente muito quente. O descanso da palma da mão também só aquece moderadamente
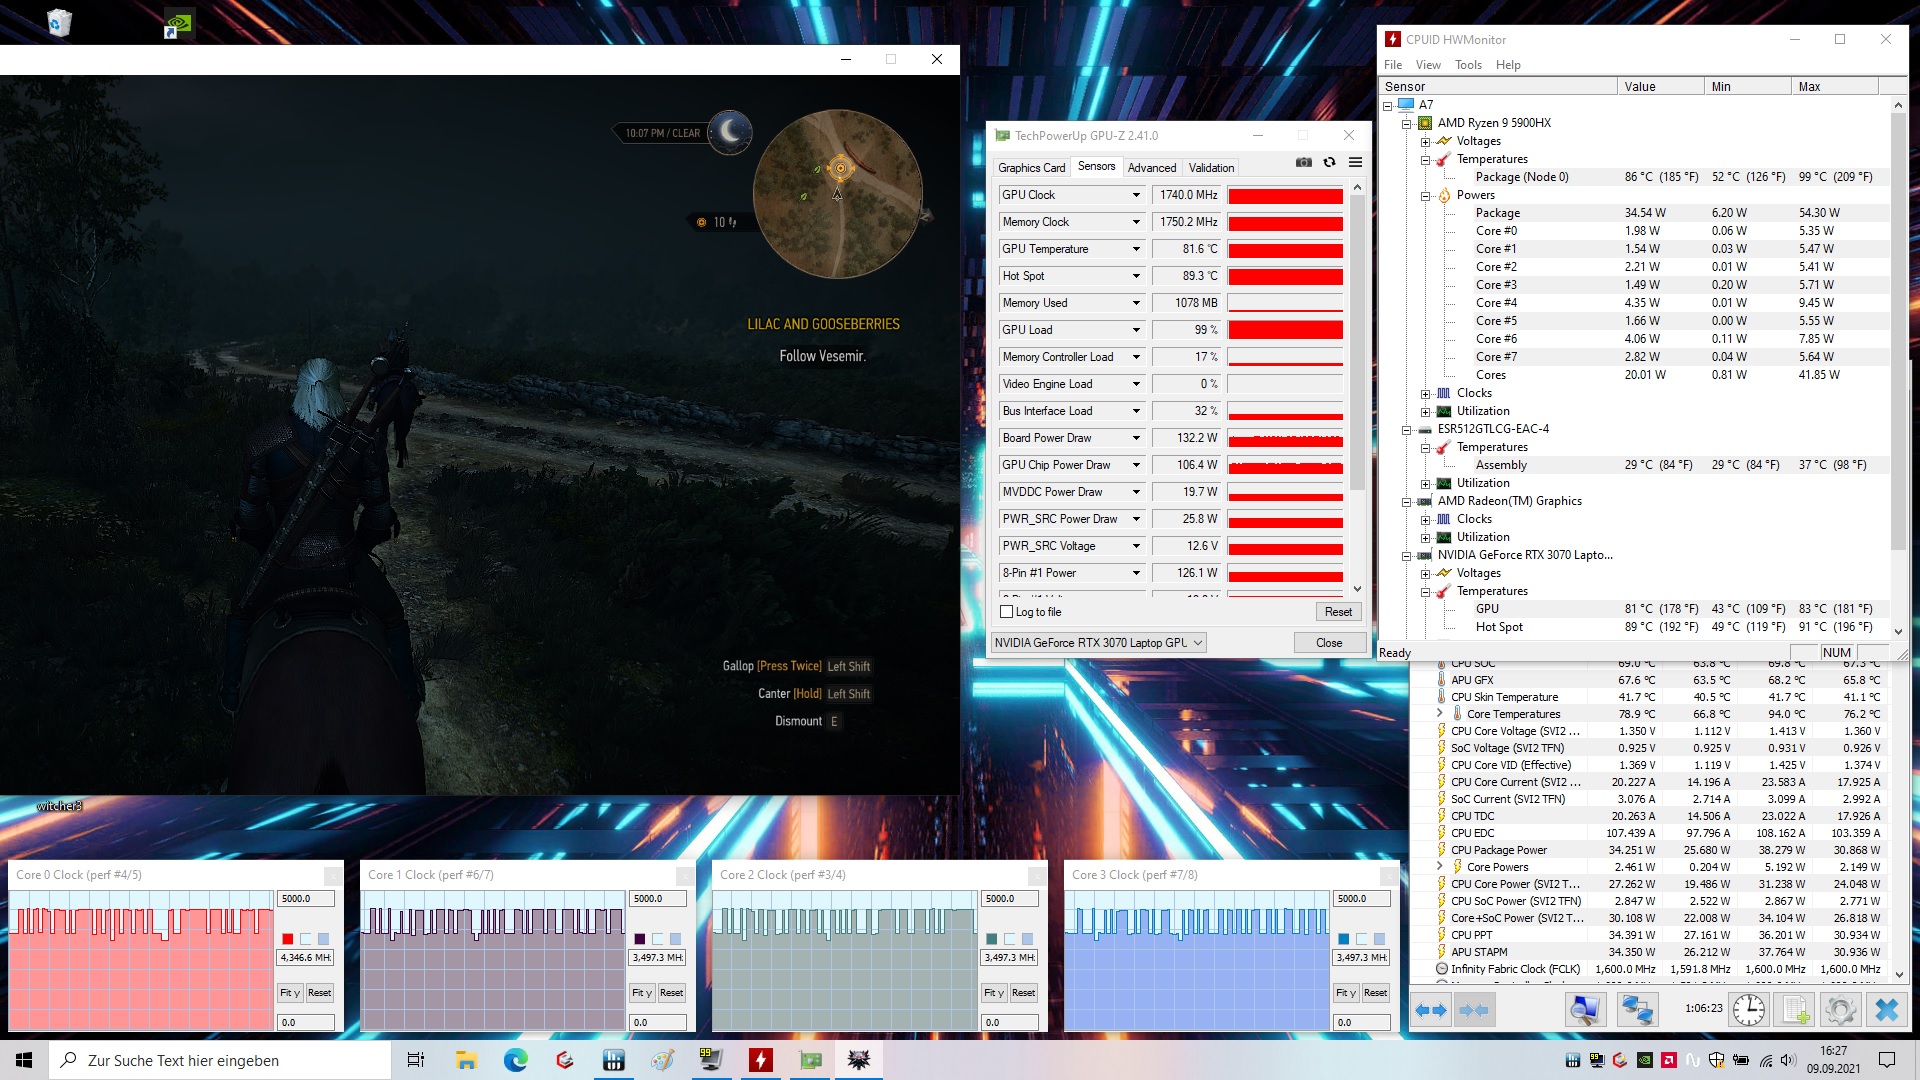
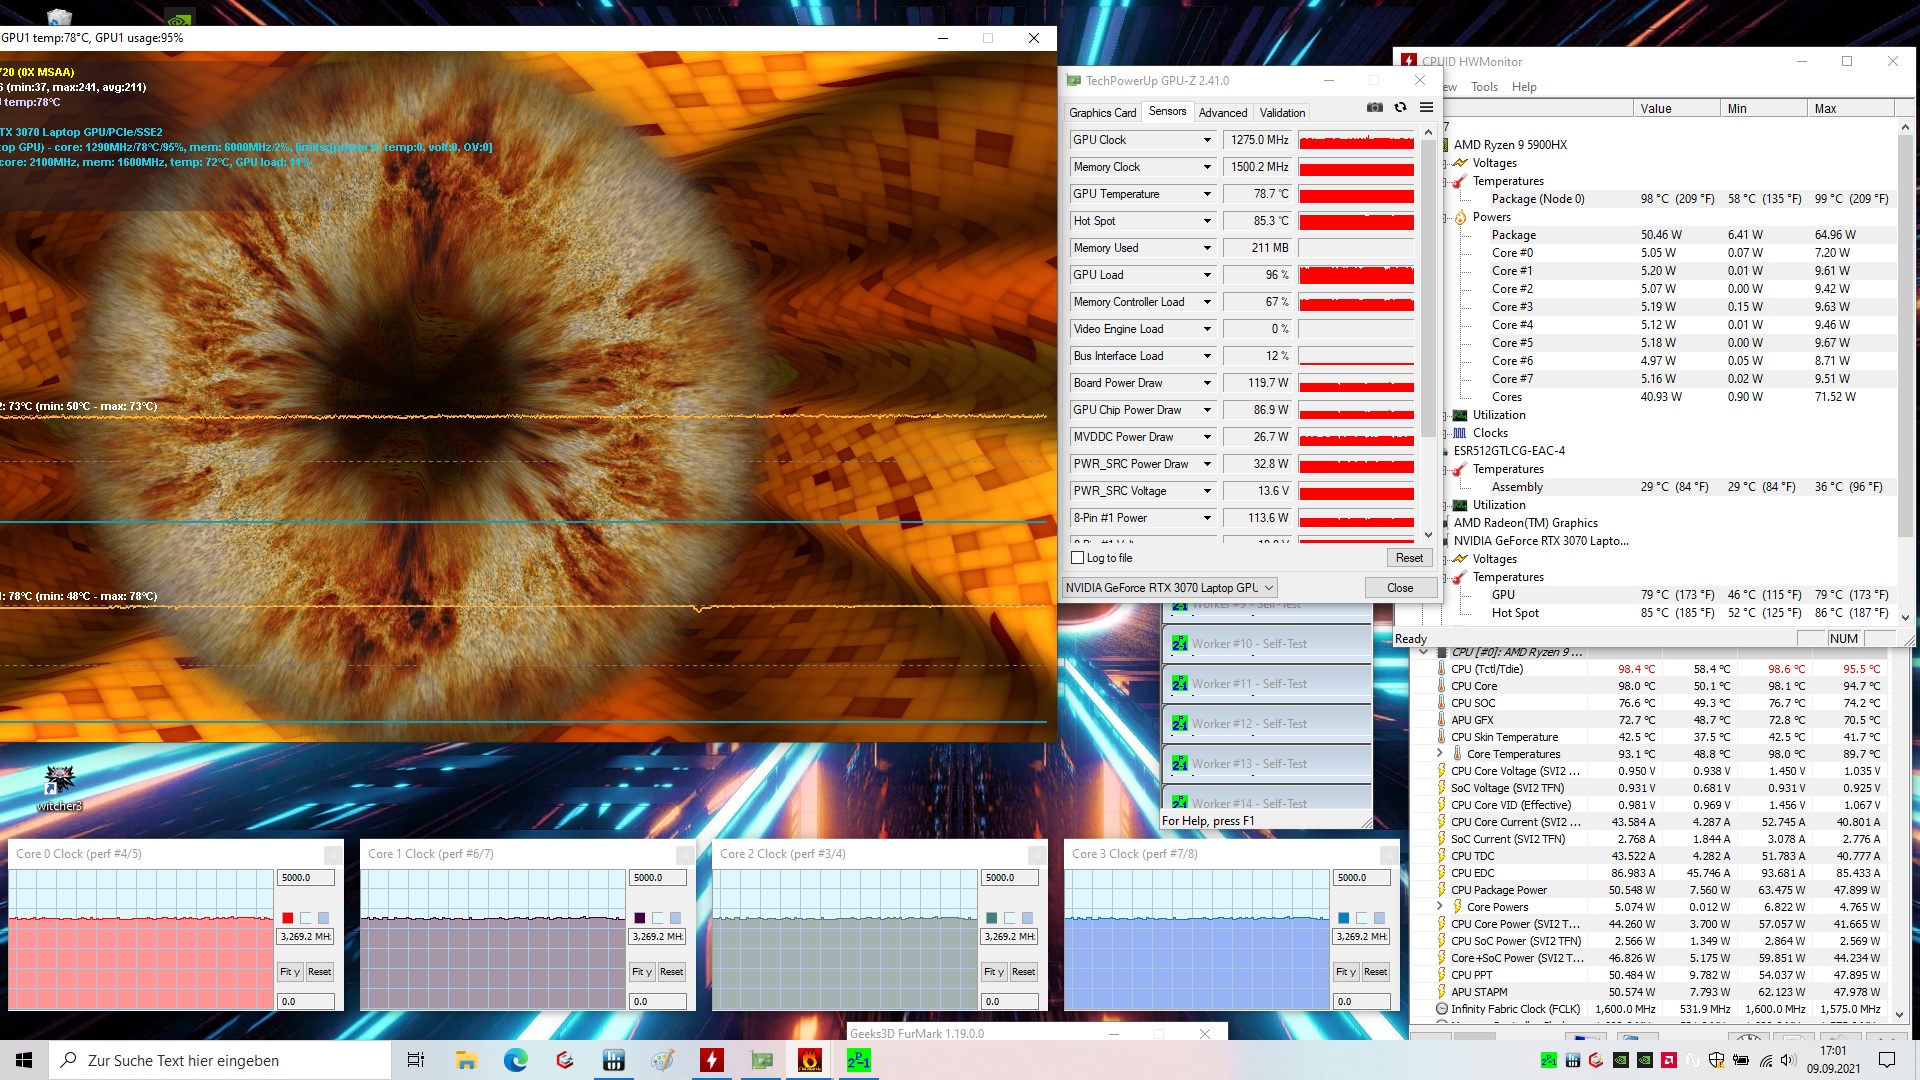
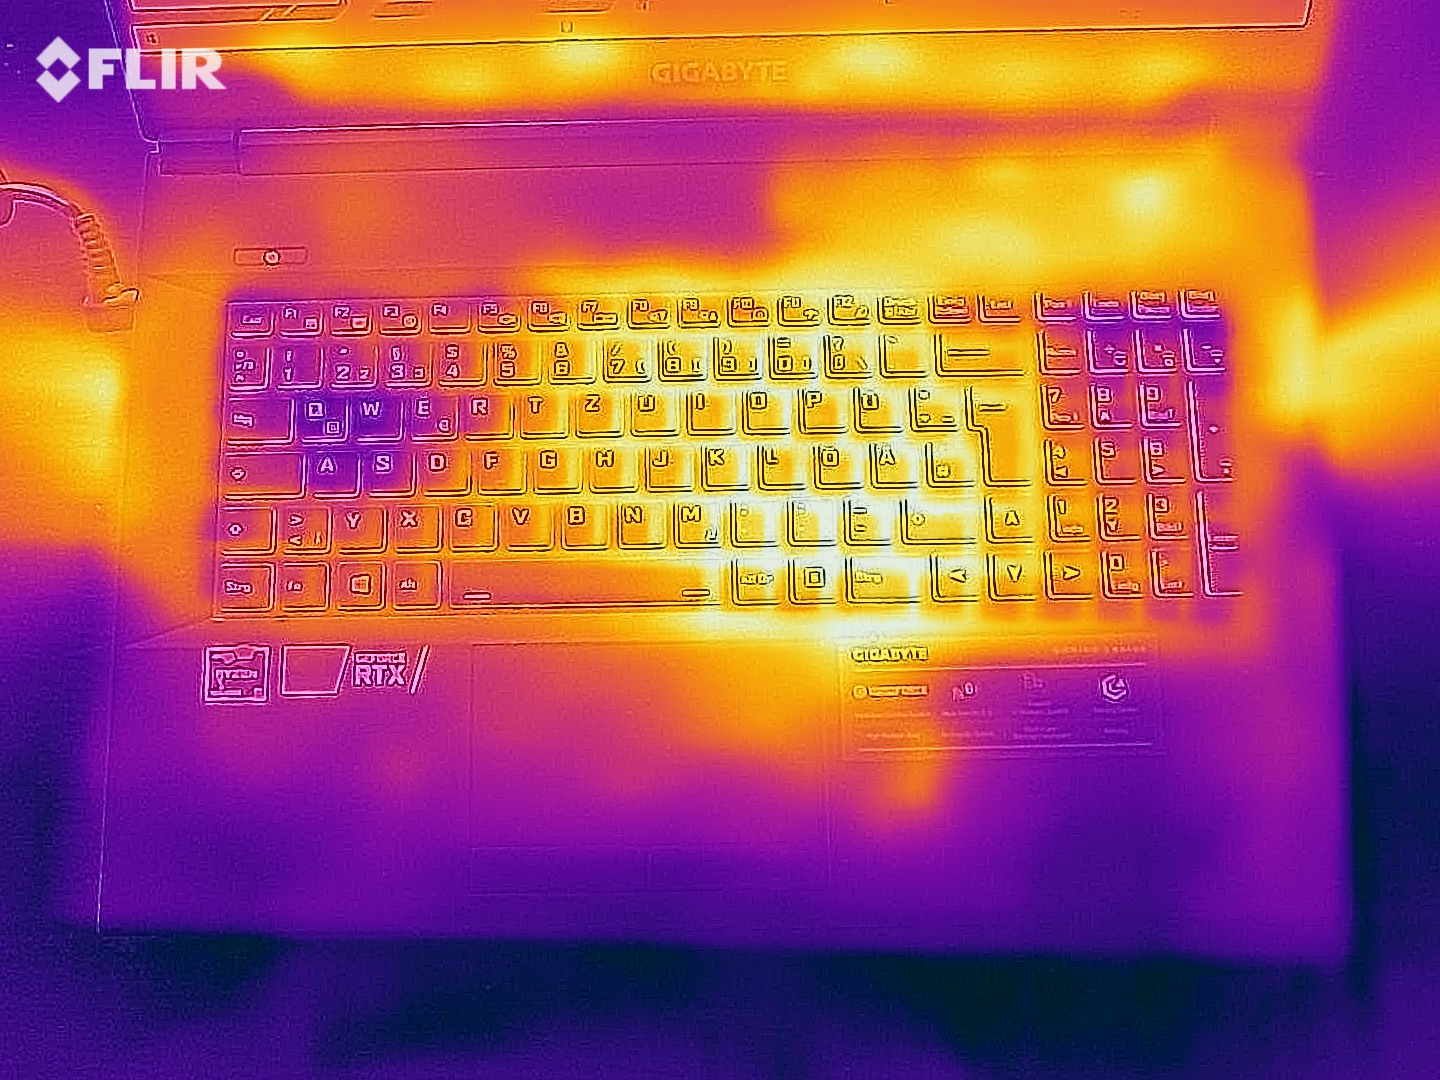
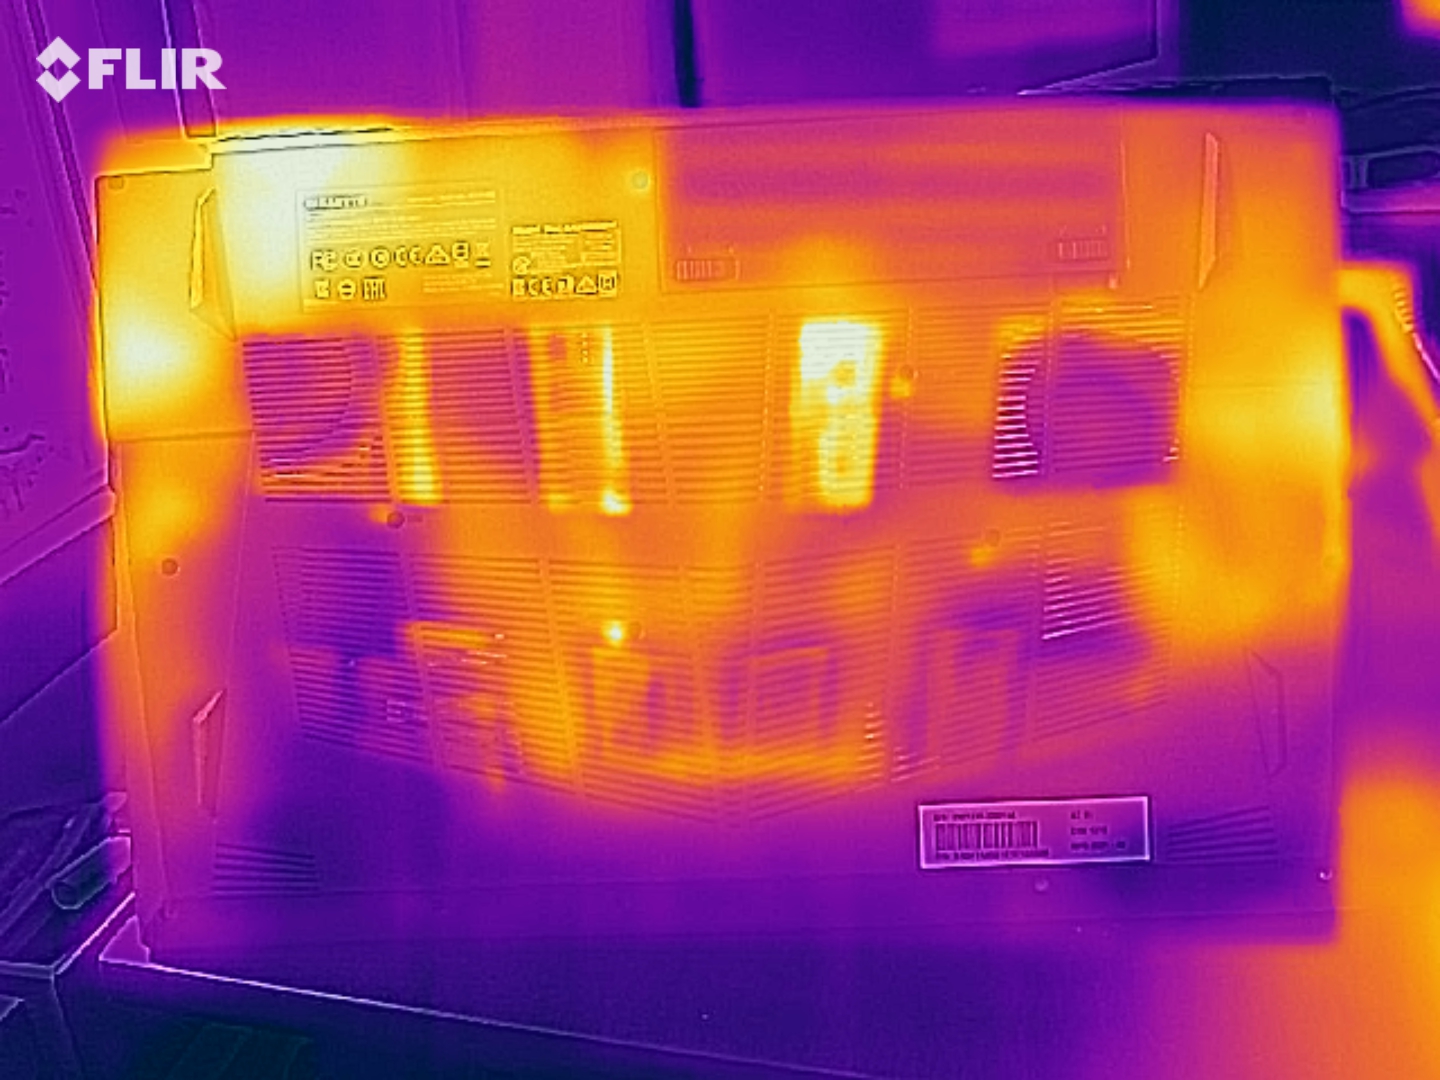
As temperaturas dentro do Gigabyte A7 X1 sobem até 99 °C (~210 °F) em nosso teste de resistência ao estresse que dura cerca de uma hora. No entanto, as taxas de relógio da CPU nunca caem abaixo do valor base de 3,3 GHz, e o sistema continua a funcionar sem problemas. Também podemos ver este comportamento no teste de resistência com o The Witcher 3, embora as taxas de clock sejam ainda um pouco mais altas aqui em aproximadamente 3,5 GHz.
(±) A temperatura máxima no lado superior é 44 °C / 111 F, em comparação com a média de 40.4 °C / 105 F , variando de 21.2 a 68.8 °C para a classe Gaming.
(-) A parte inferior aquece até um máximo de 49 °C / 120 F, em comparação com a média de 43.2 °C / 110 F
(+) Em uso inativo, a temperatura média para o lado superior é 26.1 °C / 79 F, em comparação com a média do dispositivo de 33.9 °C / ### class_avg_f### F.
(-) Jogando The Witcher 3, a temperatura média para o lado superior é 40.6 °C / 105 F, em comparação com a média do dispositivo de 33.9 °C / ## #class_avg_f### F.
(-) Os apoios para as mãos e o touchpad podem ficar muito quentes ao toque, com um máximo de 41 °C / 105.8 F.
(-) A temperatura média da área do apoio para as mãos de dispositivos semelhantes foi 28.8 °C / 83.8 F (-12.2 °C / -22 F).
Oradores
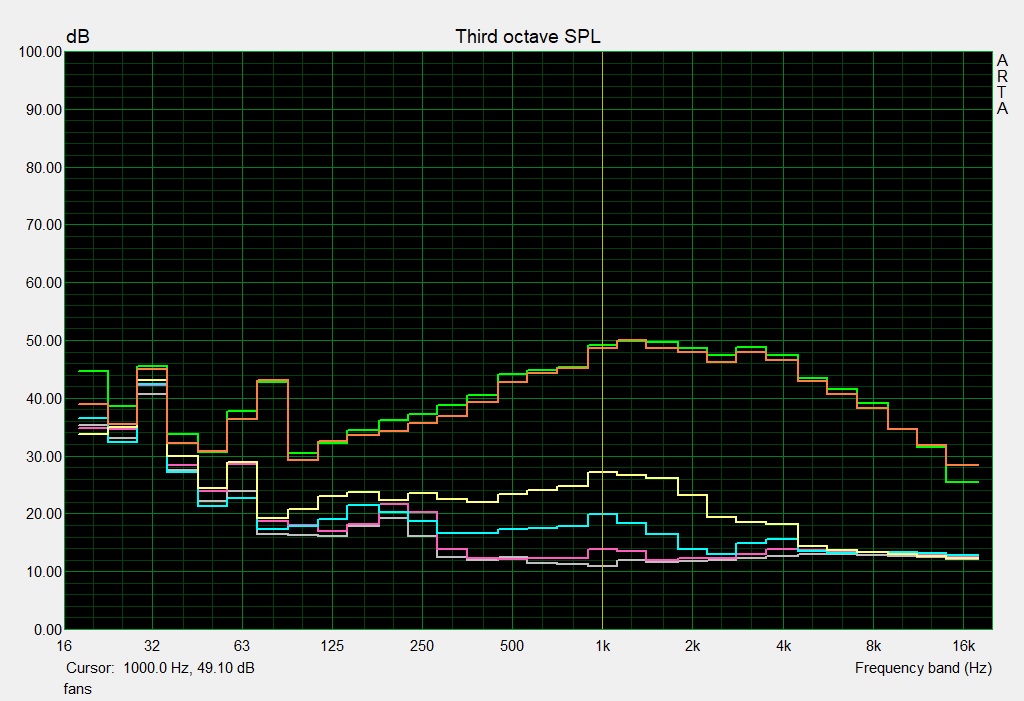
Os alto-falantes do Gigabyte A7 X1 oferecem um volume relativamente alto e um espectro sonoro dominado por médias e altas. Isto os torna perfeitamente adequados para reproduzir conteúdo de mídia. No entanto, os alto-falantes externos ou fones de ouvido são recomendados a longo prazo
Gigabyte A7 X1 análise de áudio
(+) | os alto-falantes podem tocar relativamente alto (###valor### dB)
Graves 100 - 315Hz
(-) | quase nenhum baixo - em média 30.3% menor que a mediana
(±) | a linearidade dos graves é média (13.4% delta para a frequência anterior)
Médios 400 - 2.000 Hz
(±) | médios mais altos - em média 6.8% maior que a mediana
(±) | a linearidade dos médios é média (11.3% delta para frequência anterior)
Altos 2 - 16 kHz
(+) | agudos equilibrados - apenas 4.4% longe da mediana
(+) | os máximos são lineares (5.4% delta da frequência anterior)
Geral 100 - 16.000 Hz
(±) | a linearidade do som geral é média (23.5% diferença em relação à mediana)
Comparado com a mesma classe
» 85% de todos os dispositivos testados nesta classe foram melhores, 5% semelhantes, 10% piores
» O melhor teve um delta de 6%, a média foi 18%, o pior foi 132%
Comparado com todos os dispositivos testados
» 70% de todos os dispositivos testados foram melhores, 6% semelhantes, 24% piores
» O melhor teve um delta de 4%, a média foi 23%, o pior foi 134%
Schenker XMG Neo 17 (Early 2021, RTX 3070, 5800H) análise de áudio
(+) | os alto-falantes podem tocar relativamente alto (###valor### dB)
Graves 100 - 315Hz
(-) | quase nenhum baixo - em média 20.8% menor que a mediana
(±) | a linearidade dos graves é média (12.3% delta para a frequência anterior)
Médios 400 - 2.000 Hz
(+) | médios equilibrados - apenas 2.9% longe da mediana
(+) | médios são lineares (5.1% delta para frequência anterior)
Altos 2 - 16 kHz
(+) | agudos equilibrados - apenas 2.7% longe da mediana
(±) | a linearidade dos máximos é média (7.6% delta para frequência anterior)
Geral 100 - 16.000 Hz
(+) | o som geral é linear (14.5% diferença em relação à mediana)
Comparado com a mesma classe
» 27% de todos os dispositivos testados nesta classe foram melhores, 7% semelhantes, 66% piores
» O melhor teve um delta de 6%, a média foi 18%, o pior foi 132%
Comparado com todos os dispositivos testados
» 19% de todos os dispositivos testados foram melhores, 4% semelhantes, 77% piores
» O melhor teve um delta de 4%, a média foi 23%, o pior foi 134%
Gerenciamento de energia - Duração da bateria levemente fraca
Consumo de energia
Com um consumo médio de energia de 14 watts em nosso cenário de inatividade, o Gigabyte A7 X1 é um dos laptops mais frugal em nosso campo de testes. Sob carga, porém, o consumo de energia pode chegar a picos curtos de até 229 watts. Valores de cerca de 205 watts são de se esperar durante os jogos.
O adaptador de energia incluído pode suportar uma potência de 230 watts, o que é uma capacidade suficientemente alta.
| desligado | |
| Ocioso | |
| Carga |
|
Key:
min: | |
| Gigabyte A7 X1 R9 5900HX, GeForce RTX 3070 Laptop GPU | Medion Erazer Beast X25 R9 5900HX, GeForce RTX 3080 Laptop GPU | Medion Erazer Beast X20 i7-10870H, GeForce RTX 3070 Laptop GPU | Asus TUF Gaming F17 FX706HM i9-11900H, GeForce RTX 3060 Laptop GPU | Schenker XMG Neo 17 (Early 2021, RTX 3070, 5800H) R7 5800H, GeForce RTX 3070 Laptop GPU | Média da turma Gaming | |
|---|---|---|---|---|---|---|
| Power Consumption | -41% | -15% | 17% | -12% | -16% | |
| Idle Minimum * (Watt) | 12 | 22 -83% | 13 -8% | 10.3 14% | 13 -8% | 13 ? -8% |
| Idle Average * (Watt) | 14 | 26 -86% | 18 -29% | 13.1 6% | 16 -14% | 19 ? -36% |
| Idle Maximum * (Watt) | 19 | 34 -79% | 32 -68% | 14.1 26% | 26 -37% | 24.5 ? -29% |
| Load Average * (Watt) | 118 | 120 -2% | 106 10% | 110 7% | 125 -6% | 111.1 ? 6% |
| Witcher 3 ultra * (Watt) | 205 | 189 8% | 192 6% | 138 33% | 187 9% | |
| Load Maximum * (Watt) | 229 | 231 -1% | 232 -1% | 190 17% | 259 -13% | 260 ? -14% |
* ... menor é melhor
Energy consumption during The Witcher 3 / stress test
Duração da bateria
O Gigabyte A7 X1 atinge um tempo de execução de 4:40 horas em nosso teste Wi-Fi do mundo real. Isto significa que ele faz bom uso de sua bateria de 48,96 Wh, mas não alcança os índices de nossa concorrência escolhida. Em troca, a bateria do laptop para jogos pode ser removida sem a necessidade de ferramentas e substituída, se necessário
| Gigabyte A7 X1 R9 5900HX, GeForce RTX 3070 Laptop GPU, 48.96 Wh | Medion Erazer Beast X25 R9 5900HX, GeForce RTX 3080 Laptop GPU, 91 Wh | Medion Erazer Beast X20 i7-10870H, GeForce RTX 3070 Laptop GPU, 91 Wh | Asus TUF Gaming F17 FX706HM i9-11900H, GeForce RTX 3060 Laptop GPU, 90 Wh | Schenker XMG Neo 17 (Early 2021, RTX 3070, 5800H) R7 5800H, GeForce RTX 3070 Laptop GPU, 62 Wh | Média da turma Gaming | |
|---|---|---|---|---|---|---|
| Duração da bateria | 31% | 62% | 85% | -34% | 38% | |
| WiFi v1.3 (h) | 4.7 | 6.8 45% | 6.2 32% | 7.6 62% | 3.5 -26% | 7.11 ? 51% |
| Load (h) | 1.2 | 1.4 17% | 2.3 92% | 2.5 108% | 0.7 -42% | 1.502 ? 25% |
Pro
Contra
Veredicto - Poderoso e atualizável
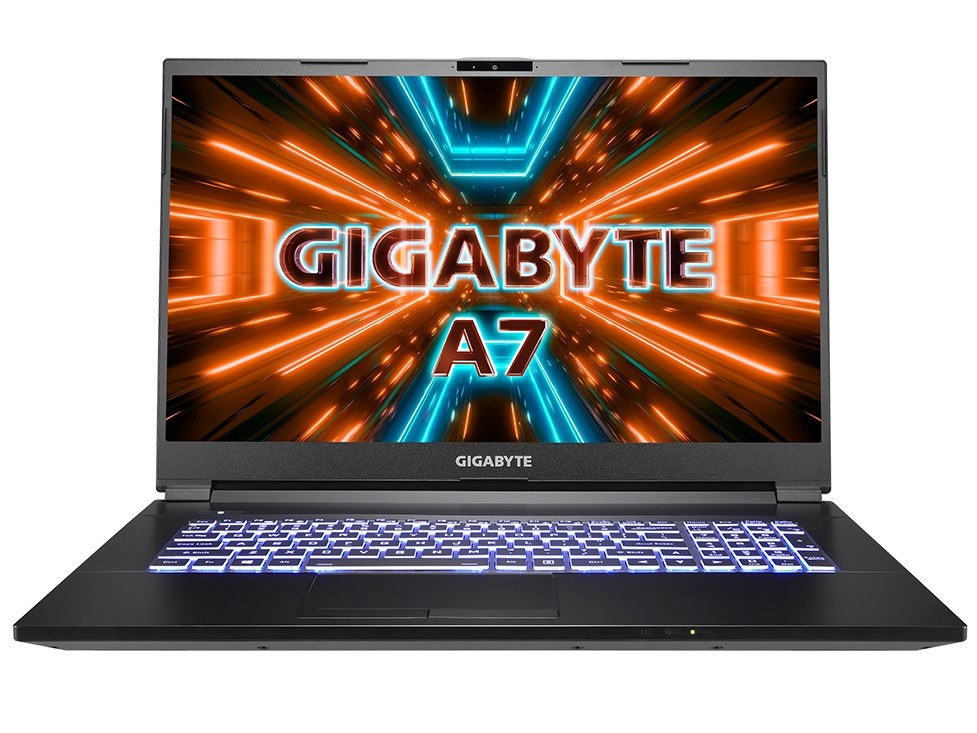
Em termos de aparência, o Gigabyte A7 X1 certamente não é um laptop de jogos da moda, fino e ultra-móvel. Mas ele faz muito bem o que deve fazer, ou seja, trazer os jogos suavemente para a tela. Tanto o processador quanto o GeForce RTX 3070 são capazes de liberar seu desempenho sem restrições, graças ao estojo bem ventilado.
O Gigabyte A7 X1 traz os jogos modernos suavemente para a tela e oferece excelentes opções de manutenção.
Outra vantagem da construção grande é que muitos componentes podem ser facilmente atualizados ou substituídos. Por exemplo, não só a bateria pode ser substituída completamente sem ferramentas, mas também há slots adicionais gratuitos para dispositivos de armazenamento em massa no interior, e você também pode ter acesso ao módulo WLAN e à RAM.
Se você achar o A7 X1 muito volumoso, você pode dar uma olhada na contraparte Gigabyte G5 KC de 15 polegadas, que está equipada com uma CPU Intel. OSchenker XMG Neo 17 é um pouco mais fino, mas também mais caro.
Preço e disponibilidade
Gigabyte A7 X1
- 10/13/2021 v7 (old)
Mike Wobker
Price comparison

