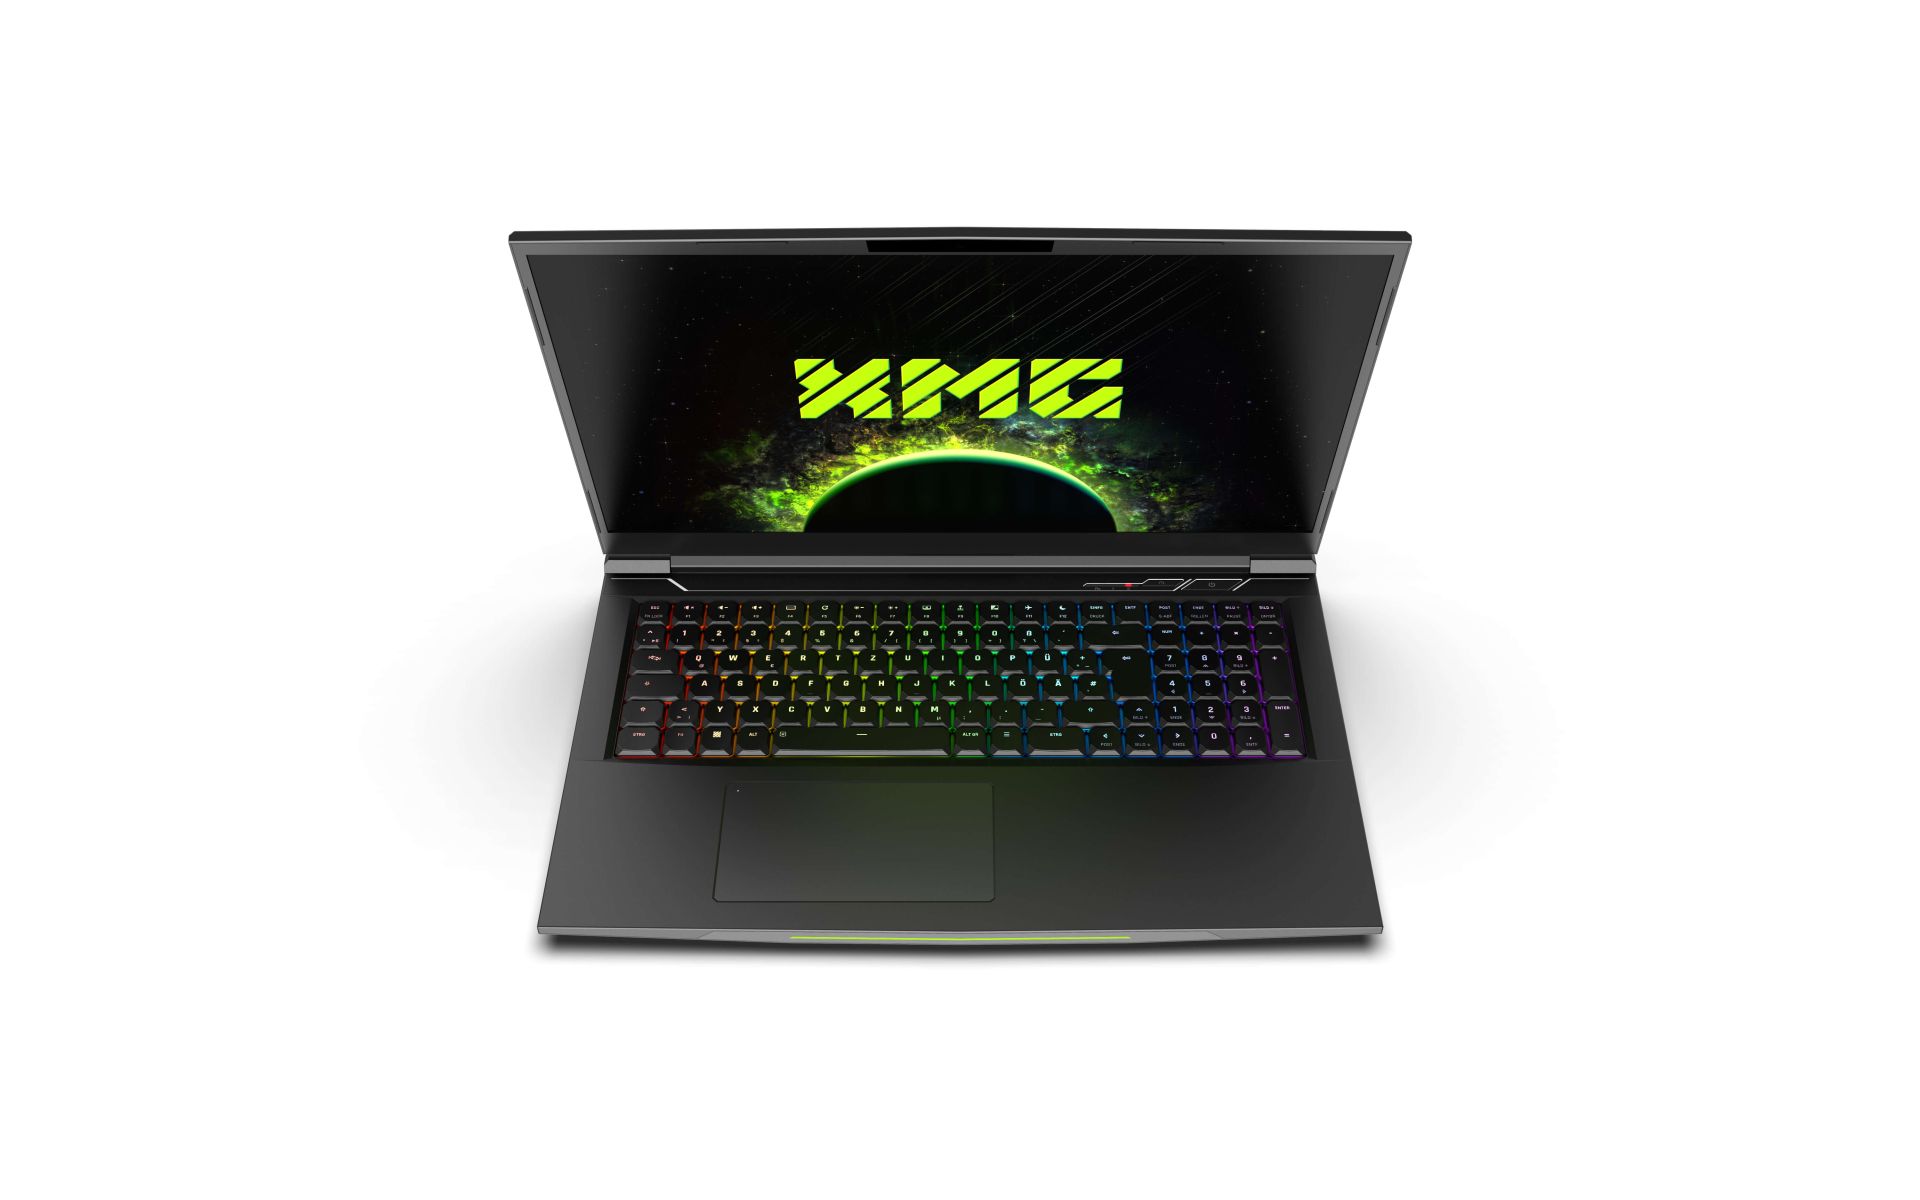
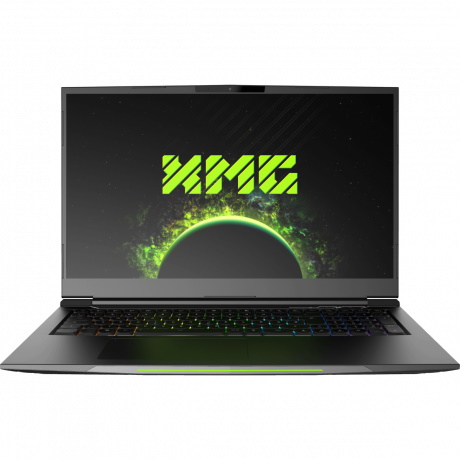
Schenker XMG NEO 17 com RTX 3080 em revisão de laptop: Os usuários podem liberar o próprio RTX 3080
No início do ano, revisamos o Schenker XMG Neo 17 com CPU AMD e RTX 3070, e agora um dos modelos superiores segue com RTX 3080 e CPU Intel Tiger Lake, e o teclado mecânico também está novamente a bordo. Assim como no modelo irmão, o TGP da placa gráfica pode ser completamente configurado via software, e os 165 W completos podem ser atribuídos à GPU desta forma. Entretanto, o modelo irmão já estava muito barulhento sob carga com um RTX 3070, então os desenvolvedores ainda ajustaram o sistema de resfriamento nesse ínterim?
Os principais concorrentes são os Aorus 17G YDcom a mesma CPU e GPU, o Medion Erazer Beast X25mais caro Asus ROG Zephyrus S17 e o Asus Strix Scar 17. Além disso, nós comparamos com o predecessor
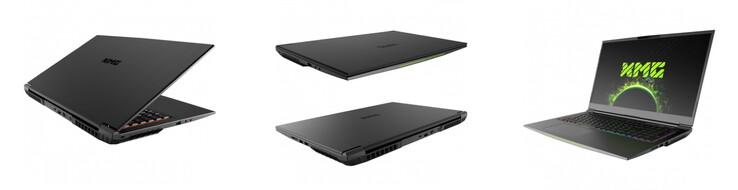
Uma vez que praticamente nada mudou no caso desde 2019, nos referimos à revisão do Schenker XMG Neo 17 (Tongfang GK7CP7S) para as seções de chassis, equipamentos e dispositivos de entrada
Possible competitors in comparison
Avaliação | Data | Modelo | Peso | Altura | Size | Resolução | Preço |
|---|---|---|---|---|---|---|---|
| 87.4 % v7 (old) | 09/2021 | Schenker XMG NEO 17 GM7TG8S i7-11800H, GeForce RTX 3080 Laptop GPU | 2.6 kg | 27.45 mm | 17.30" | 2560x1440 | |
| 85.1 % v7 (old) | 01/2021 | Schenker XMG Neo 17 (Early 2021, RTX 3070, 5800H) R7 5800H, GeForce RTX 3070 Laptop GPU | 2.5 kg | 27 mm | 17.30" | 2560x1440 | |
| 86 % v7 (old) | 06/2021 | Aorus 17G YD i7-11800H, GeForce RTX 3080 Laptop GPU | 2.8 kg | 26 mm | 17.30" | 1920x1080 | |
| 85 % v7 (old) | 07/2021 | Medion Erazer Beast X25 R9 5900HX, GeForce RTX 3080 Laptop GPU | 2.3 kg | 23 mm | 17.30" | 1920x1080 | |
| 90.1 % v7 (old) | 07/2021 | Asus ROG Zephyrus S17 GX703HSD i9-11900H, GeForce RTX 3080 Laptop GPU | 2.8 kg | 19.9 mm | 17.30" | 2560x1440 | |
| 86.6 % v7 (old) | 05/2021 | Asus Strix Scar 17 G733QSA-XS99 R9 5900HX, GeForce RTX 3080 Laptop GPU | 2.8 kg | 28.3 mm | 17.30" | 1920x1080 |
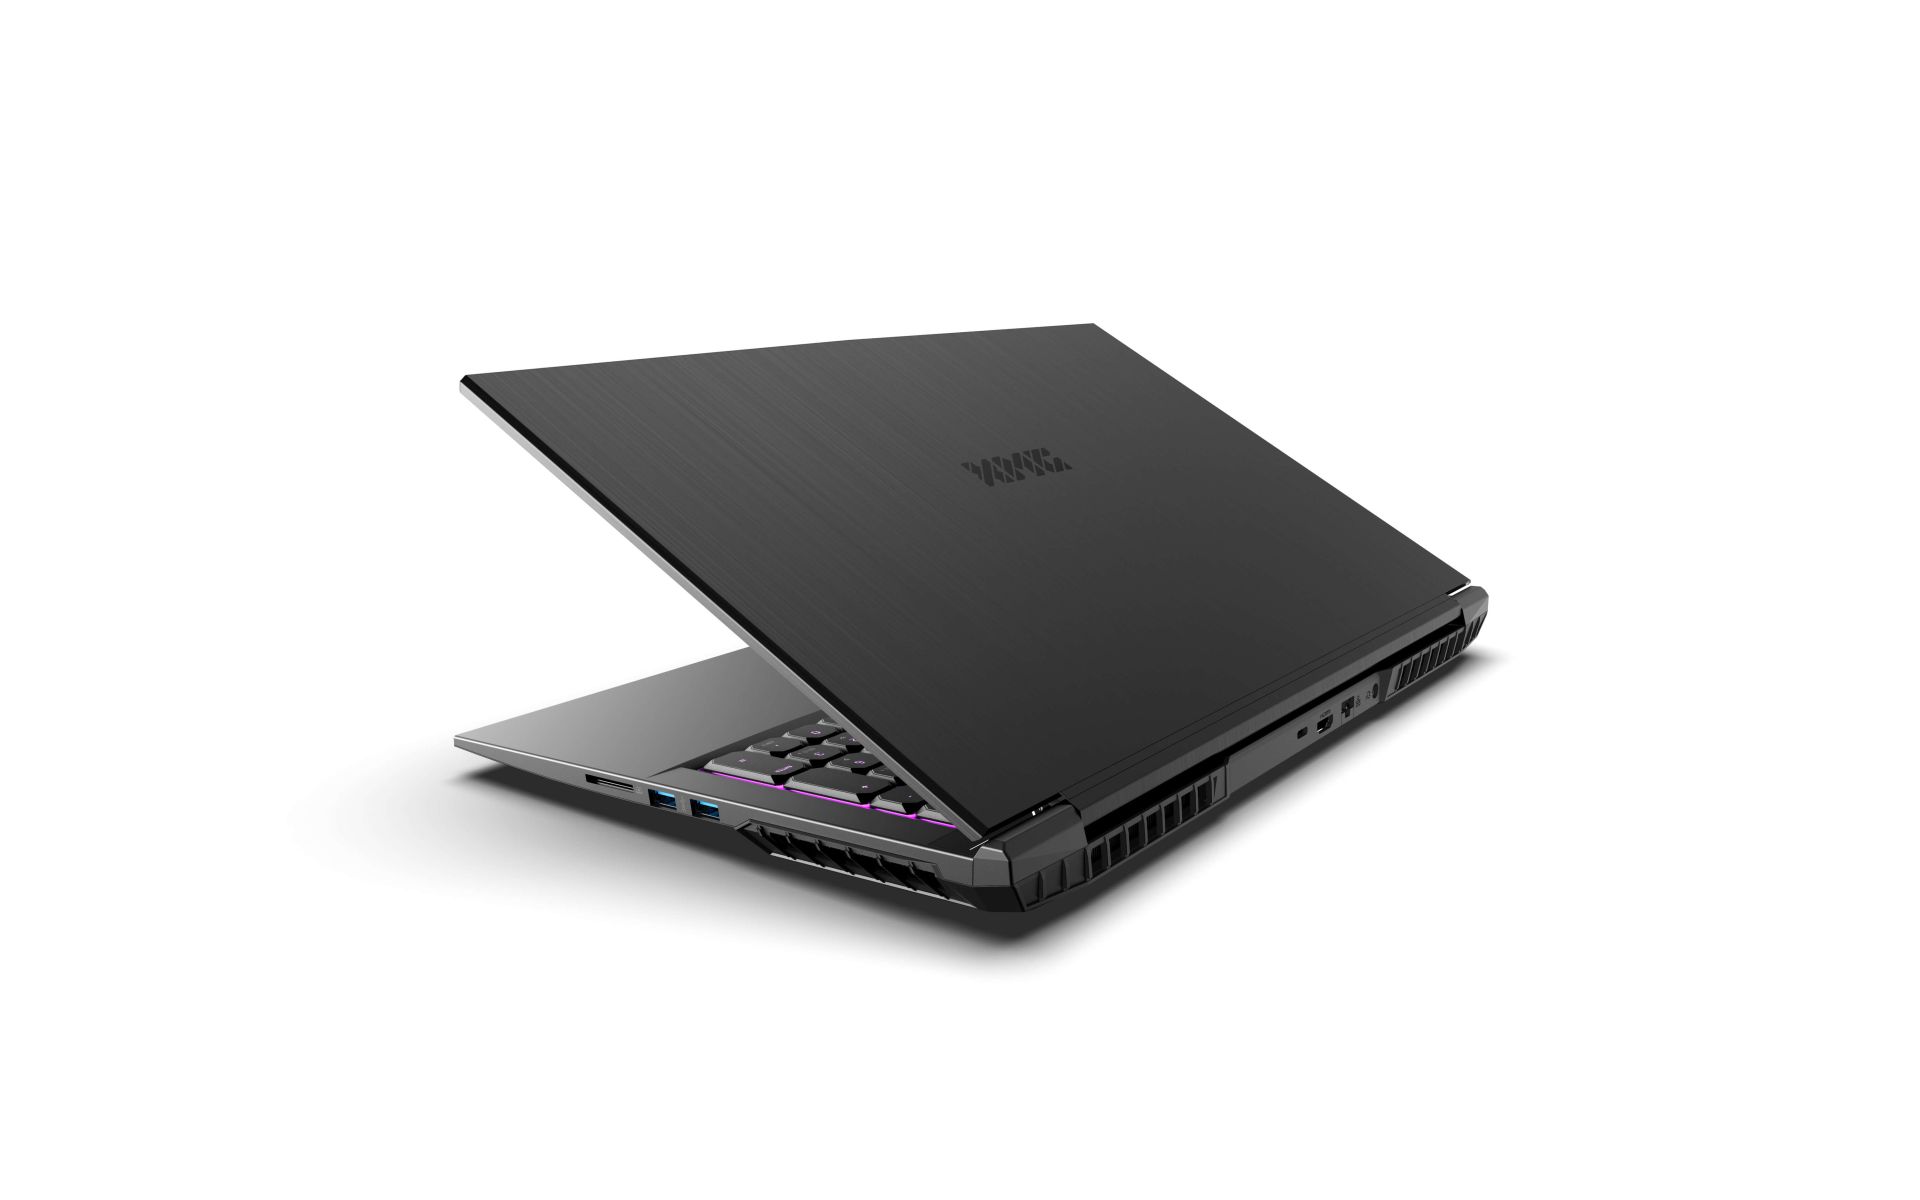
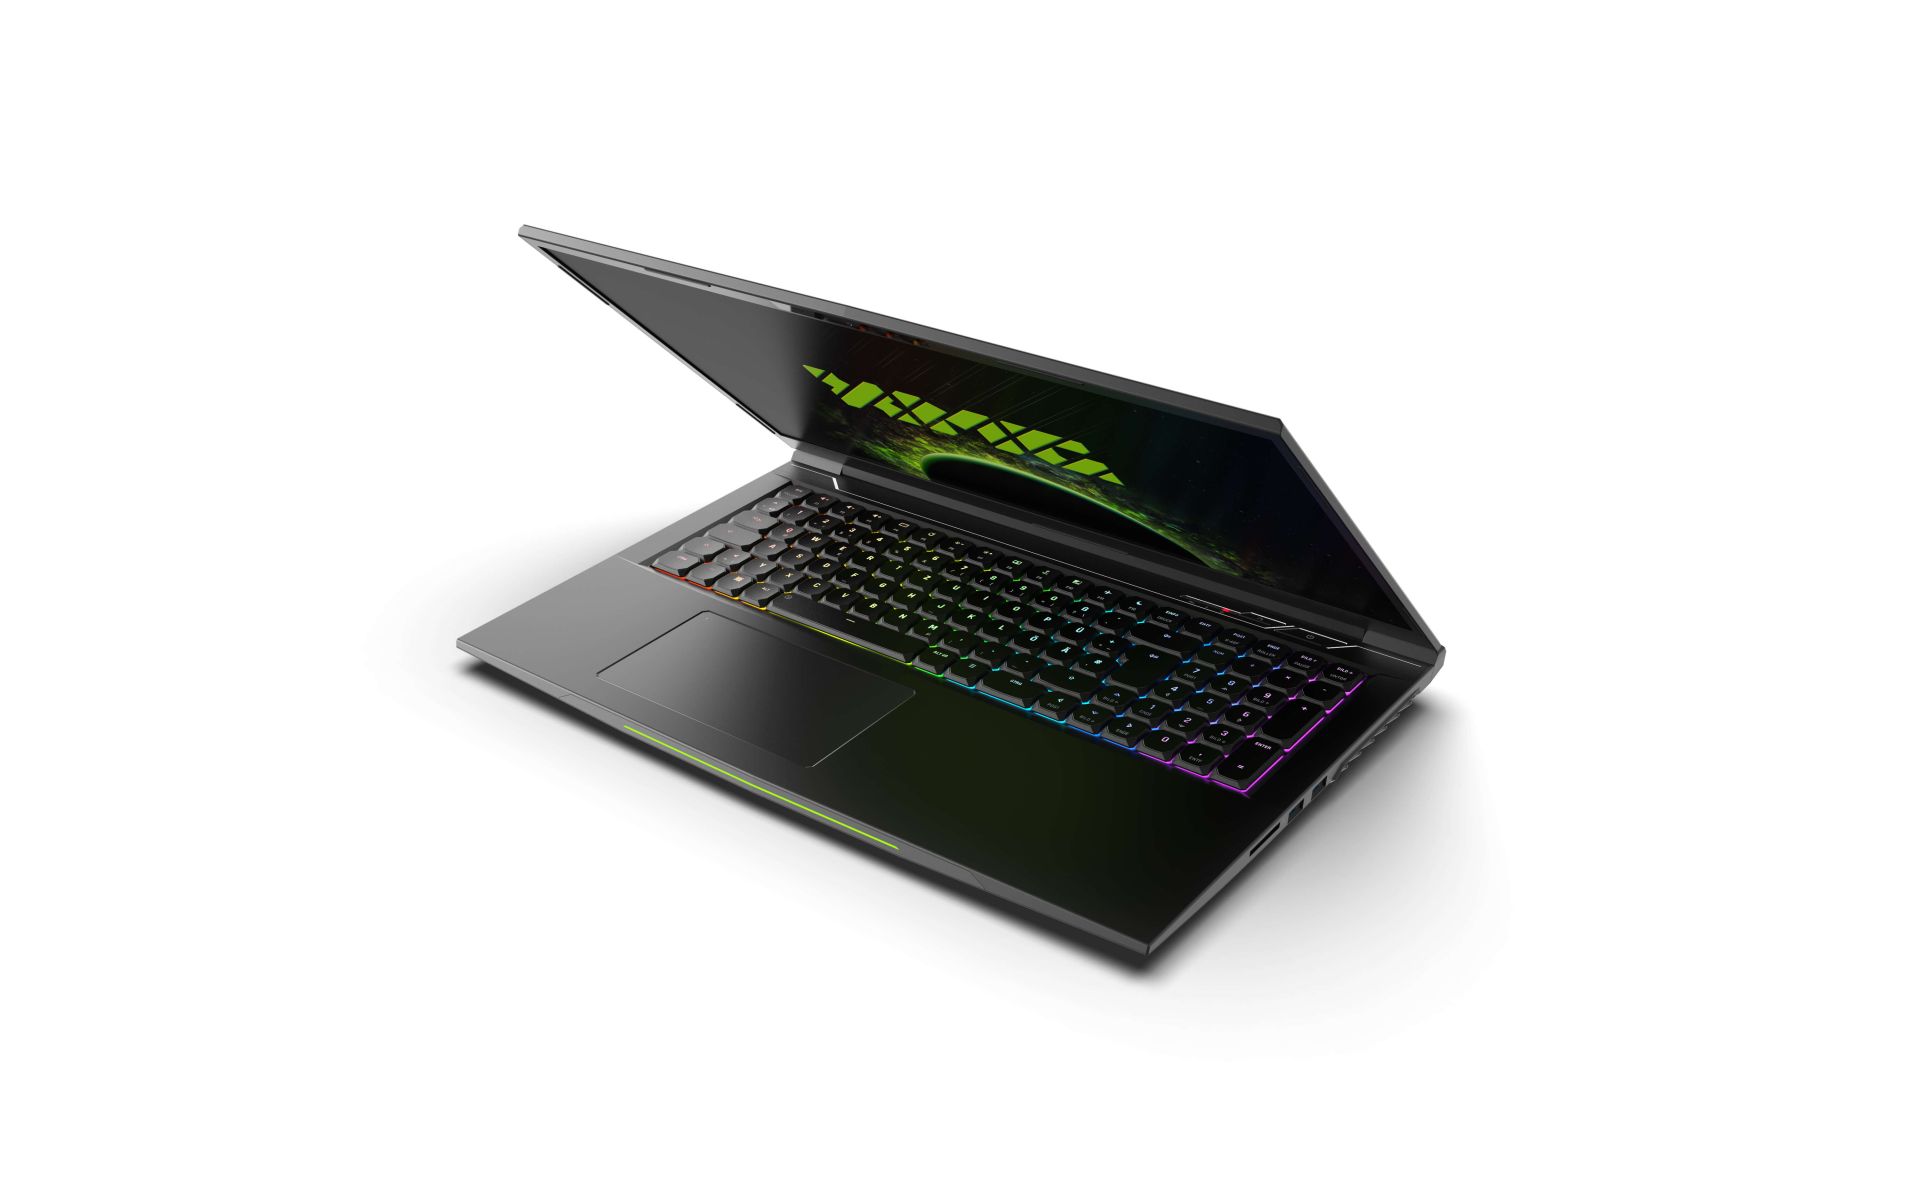
Estojo - Estável e relativamente estreito
(Fonte da imagem: Schenker)
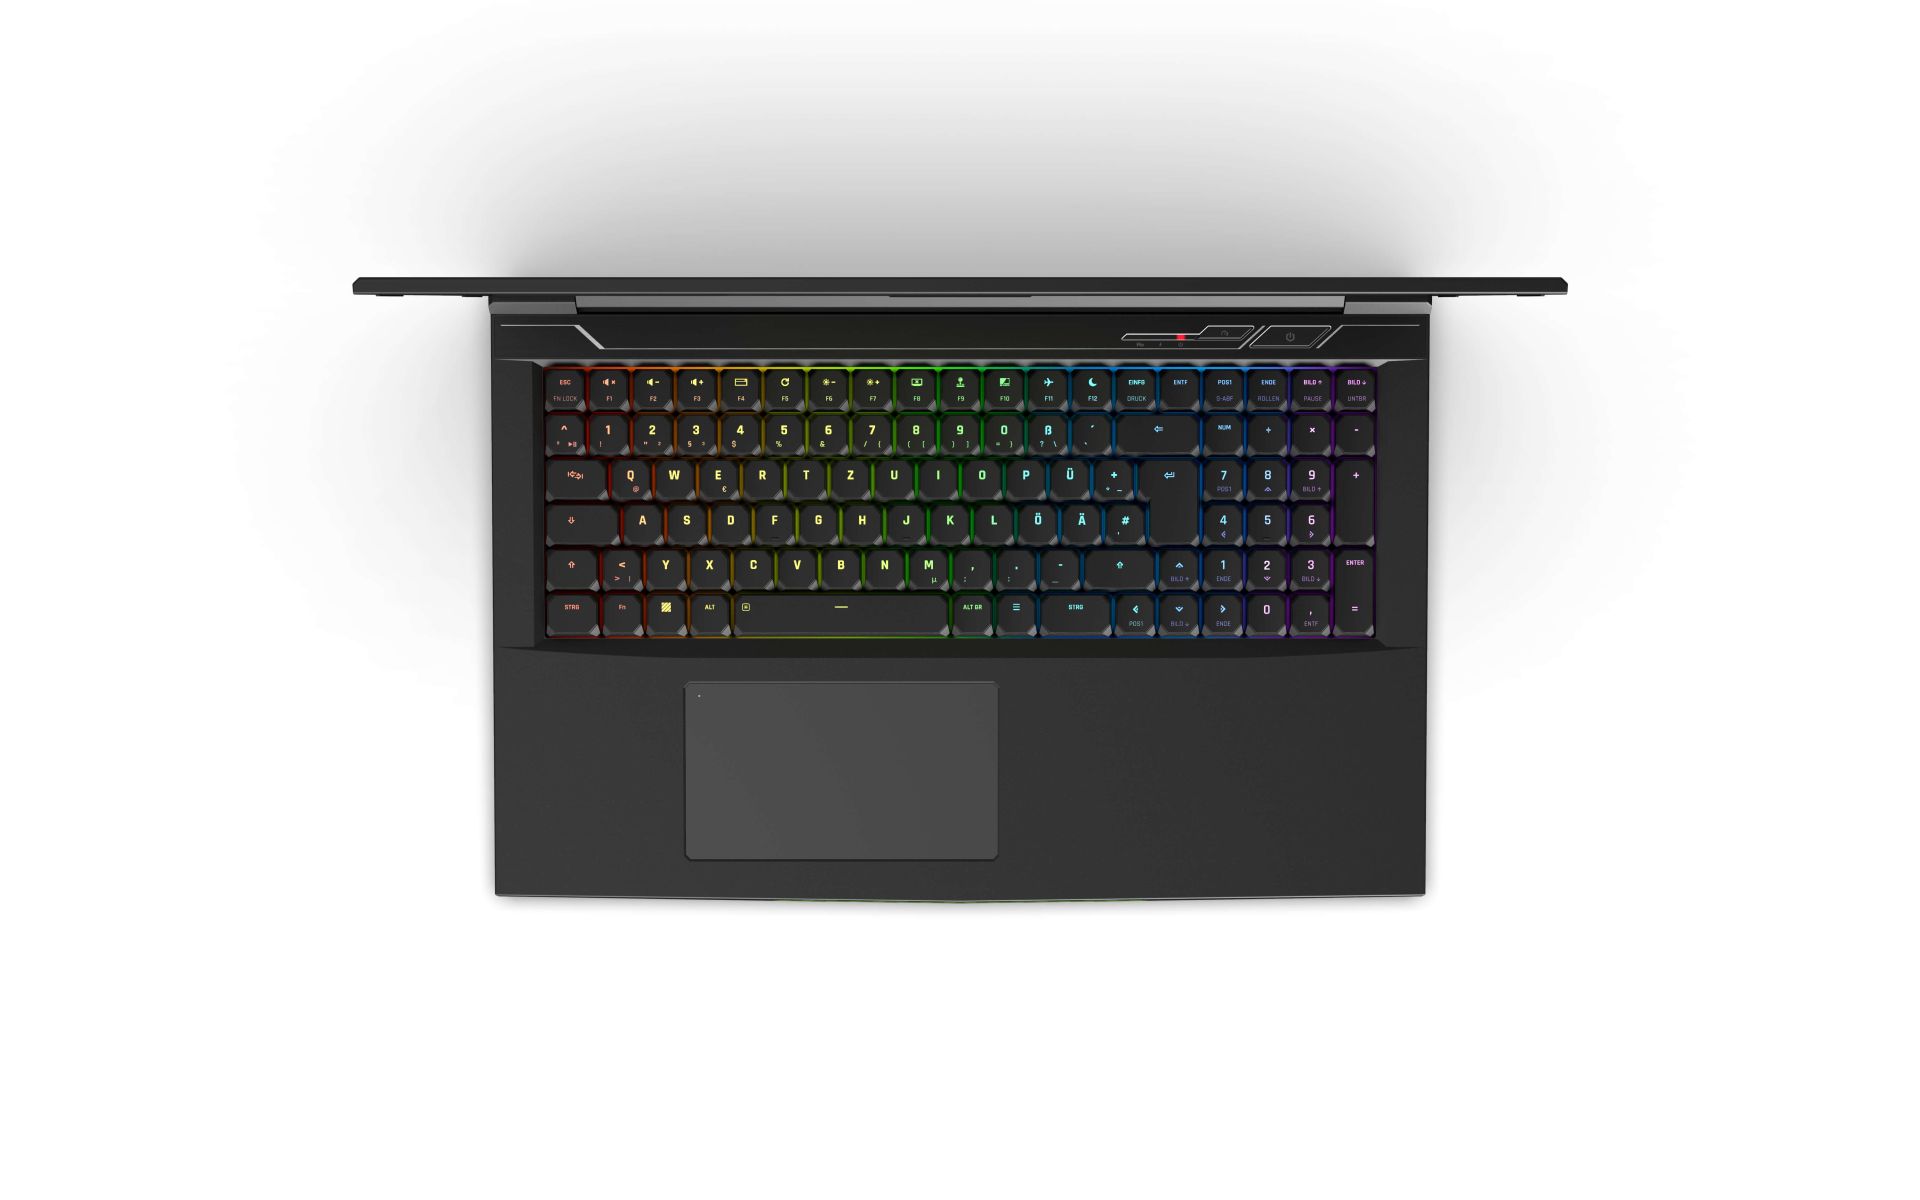
Equipamentos - Cura por manivela com atualização de velocidade
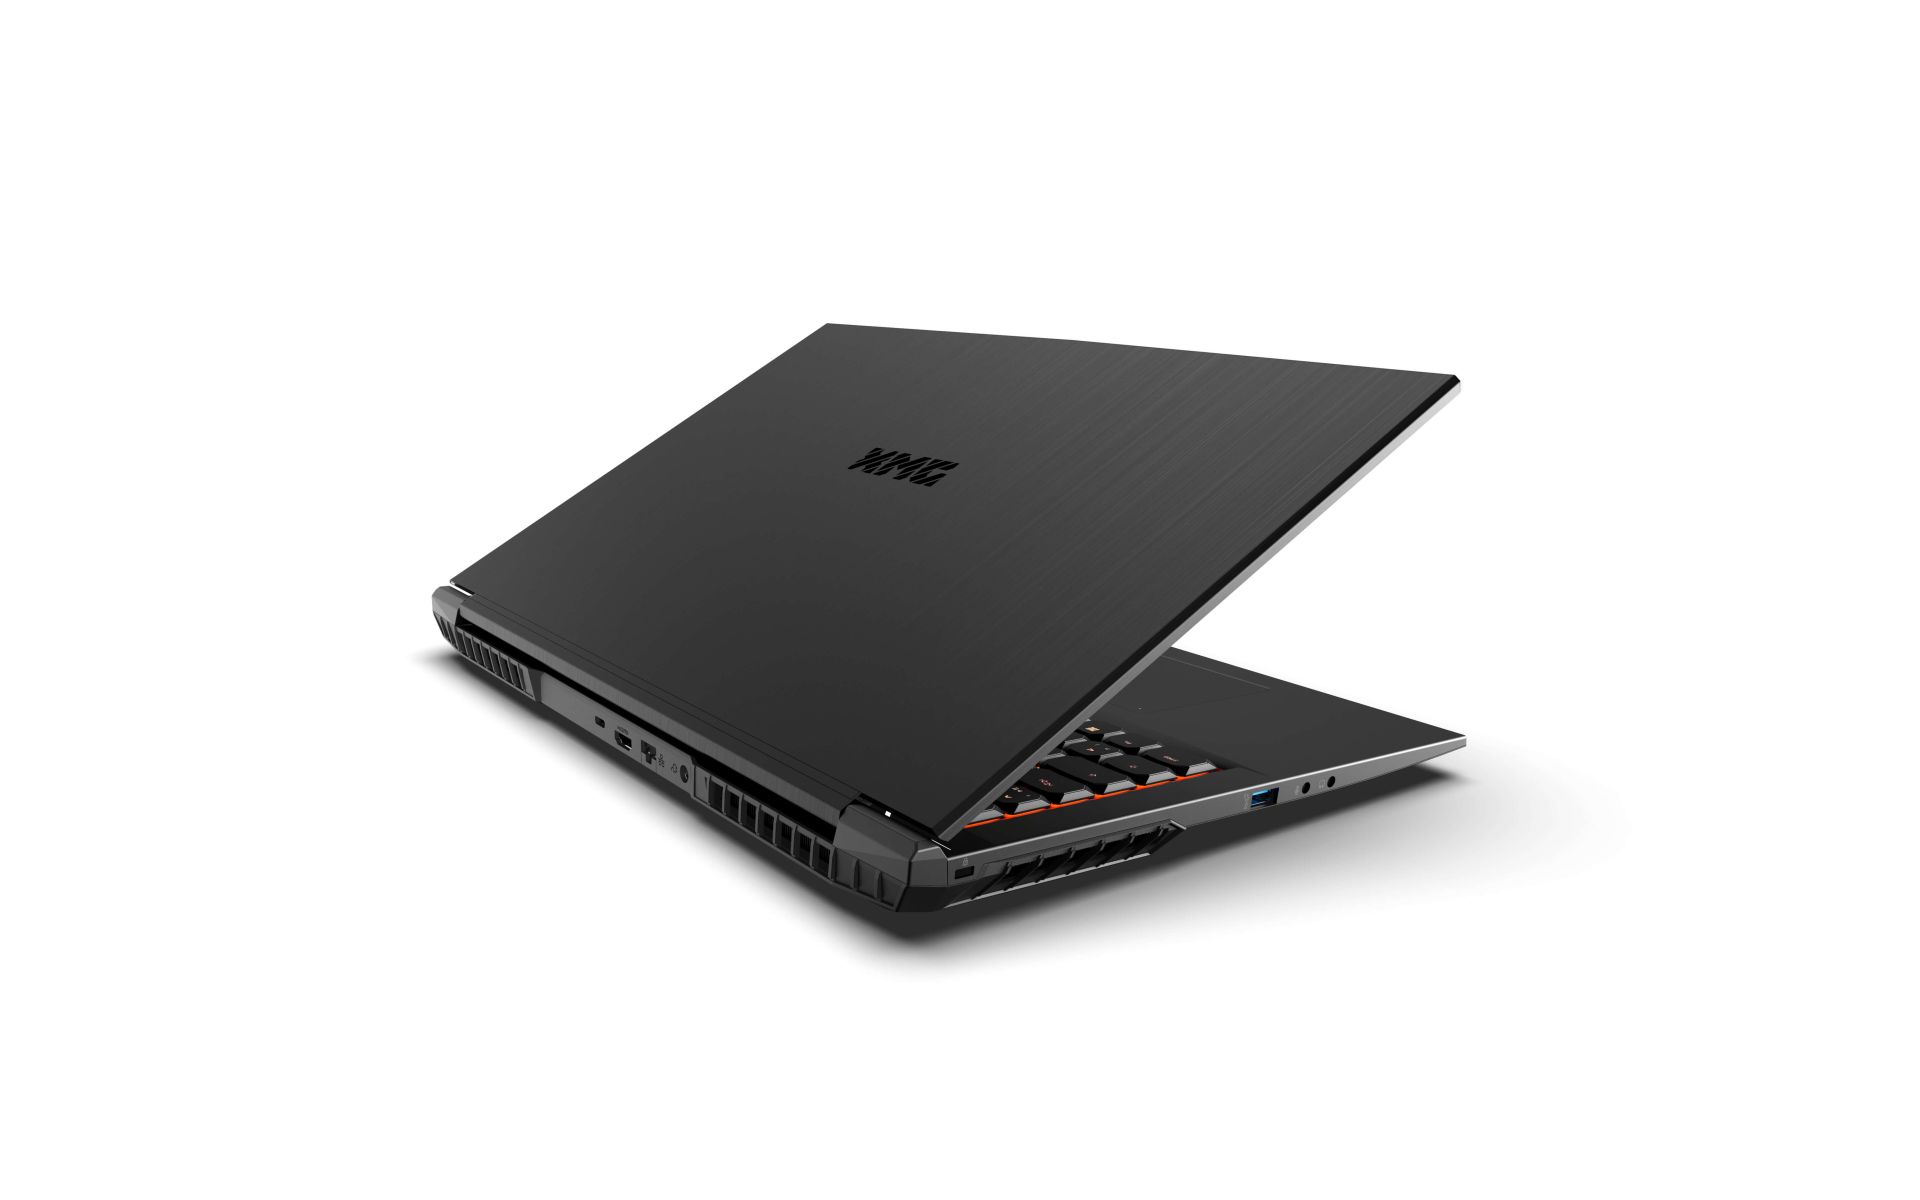
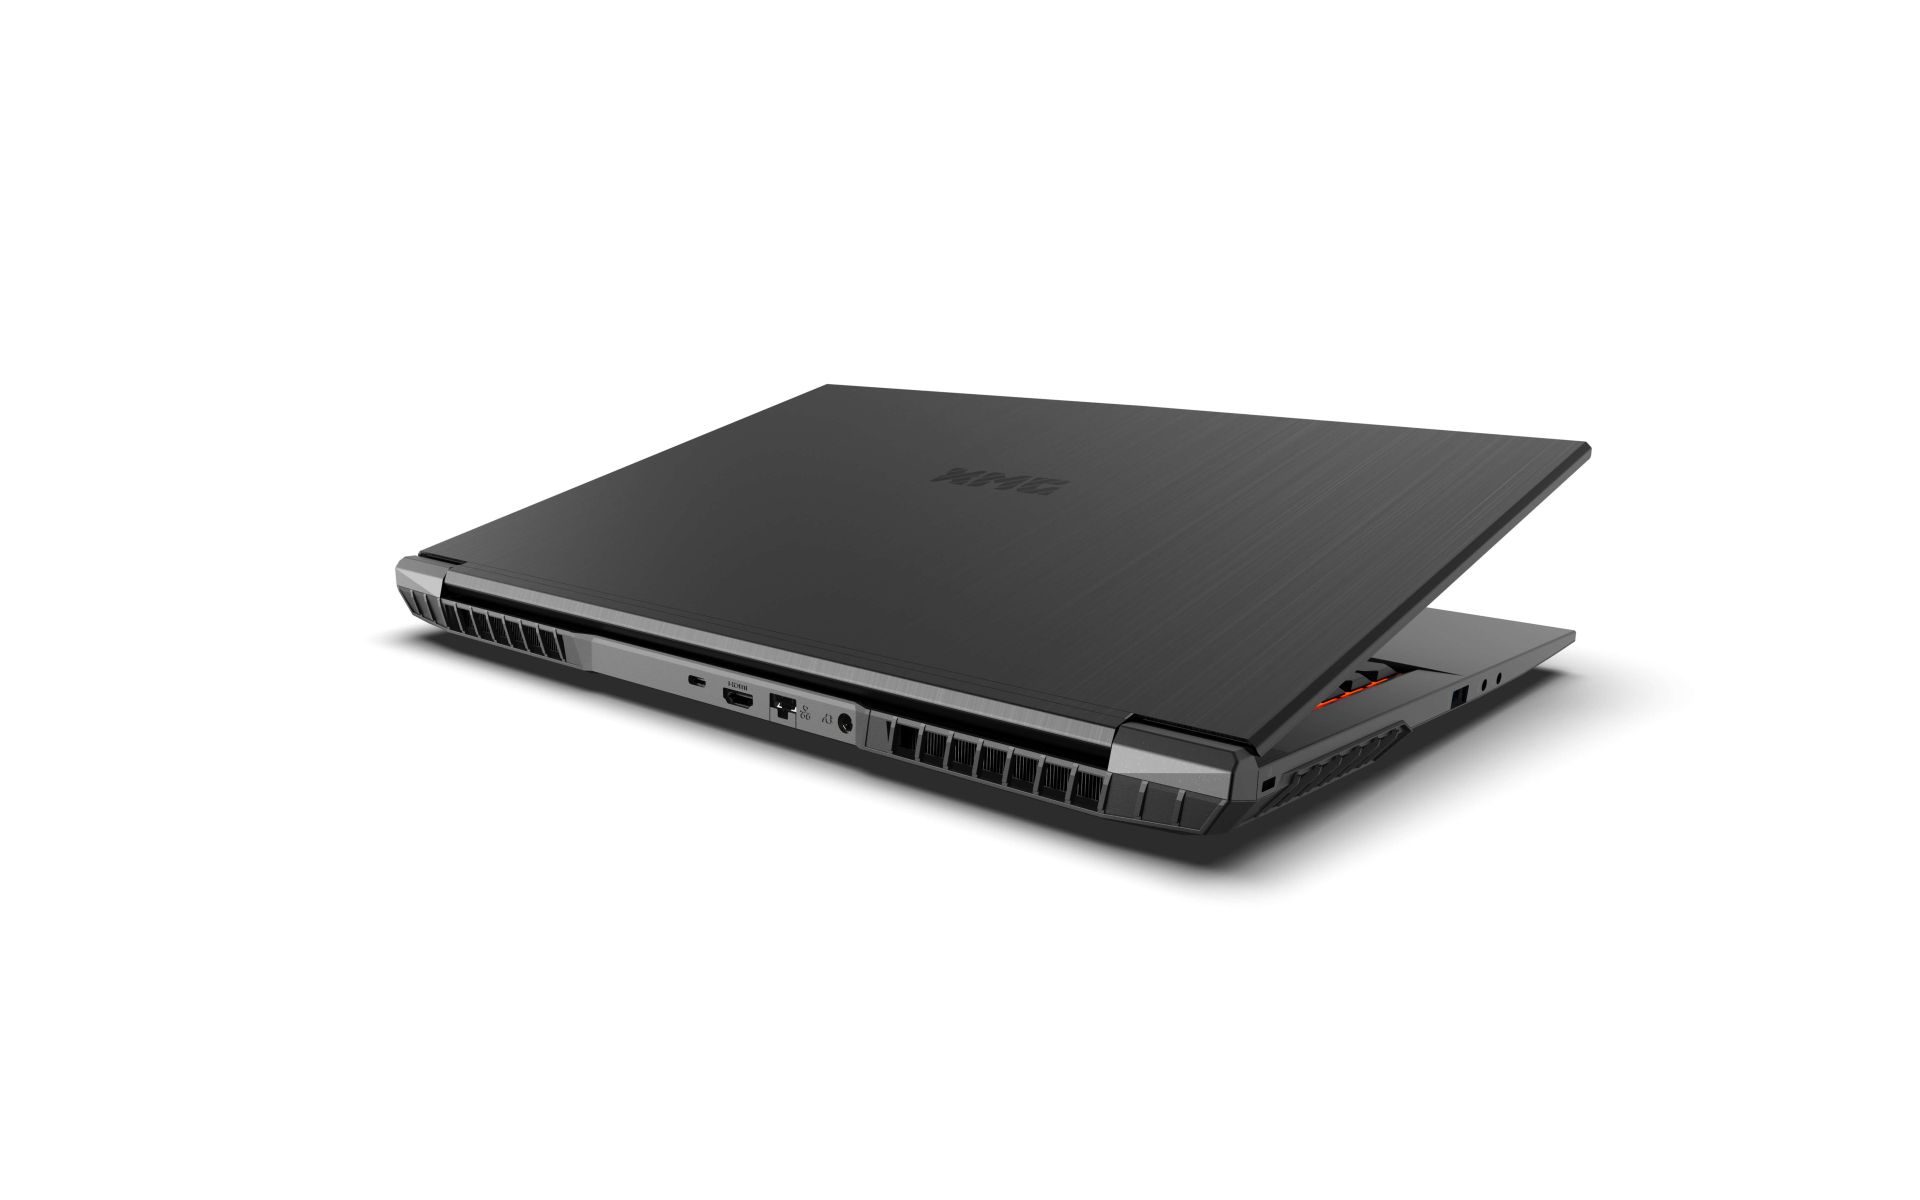
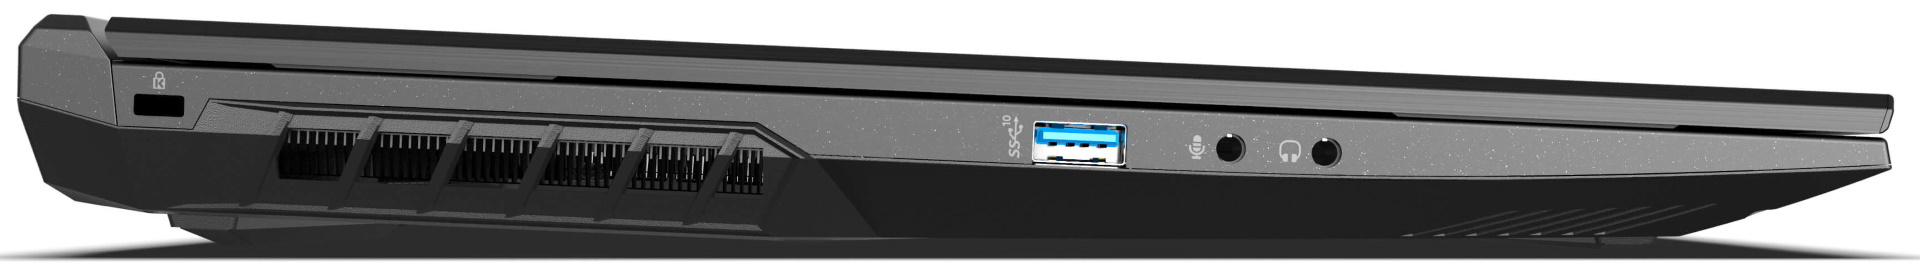
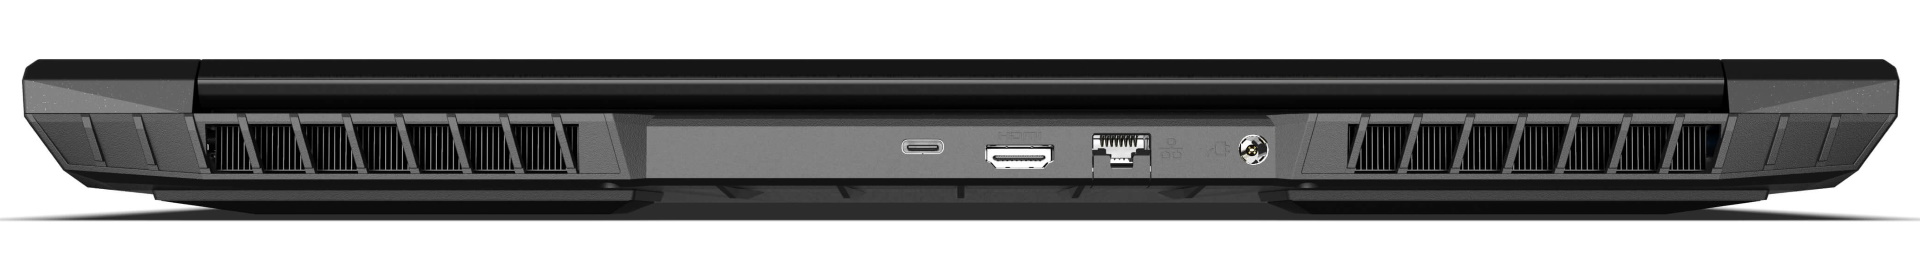
É claro que algumas coisas já mudaram aqui desde 2019, mas não necessariamente apenas para melhor. Por exemplo, ambos os portos miniDP são abandonados, o que não é compensado por nada. Caso contrário, alguns portos mudam de posição: Por exemplo, a porta LAN agora se move para trás. As duas portas USB-A da direita suportam apenas a 3.0, enquanto a porta USB-A da esquerda suporta a 3.2 Gen2. A porta USB-C 4.0 na parte traseira suporta Thunderbolt 4, incluindo DisplayPort 1.4 e compatibilidade G-SYNC, mas sem fornecimento de energia; o jogador não pode carregar via USB-C
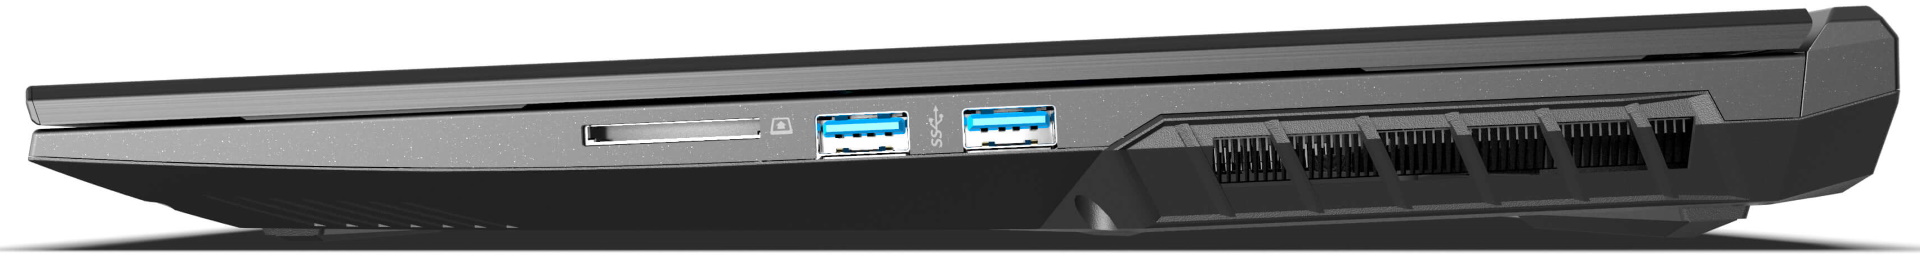
Leitor de cartões SD
O leitor SD aceita cartões SD de tamanho padrão, que não se encaixam no lugar e ficam na metade do caminho. O teste de velocidade com nosso cartão de memória de referência AV PRO microSD 128 GB V60 resulta em taxas médias. Os leitores no Zephyrus e Aorus são significativamente mais rápidos, enquanto que o Medion tem taxas similares. Em geral, as taxas estão claramente abaixo da média para o setor de jogos, especialmente considerando o preço
| SD Card Reader | |
| average JPG Copy Test (av. of 3 runs) | |
| Aorus 17G YD (AV PRO microSD 128 GB V60) | |
| Asus ROG Zephyrus S17 GX703HSD | |
| Média da turma Gaming (20.9 - 210, n=54, últimos 2 anos) | |
| Schenker XMG Neo 17 (Early 2021, RTX 3070, 5800H) (Toshiba Exceria Pro SDXC 64 GB UHS-II) | |
| Medion Erazer Beast X25 (AV PRO microSD 128 GB V60) | |
| Schenker XMG NEO 17 GM7TG8S | |
| maximum AS SSD Seq Read Test (1GB) | |
| Asus ROG Zephyrus S17 GX703HSD | |
| Aorus 17G YD (AV PRO microSD 128 GB V60) | |
| Média da turma Gaming (25.5 - 261, n=51, últimos 2 anos) | |
| Schenker XMG NEO 17 GM7TG8S | |
| Schenker XMG Neo 17 (Early 2021, RTX 3070, 5800H) (Toshiba Exceria Pro SDXC 64 GB UHS-II) | |
| Medion Erazer Beast X25 (AV PRO microSD 128 GB V60) | |
Comunicação
A porta LAN suporta 2,5 Gbit/s. Em termos de taxas de transferência WLAN, o NEO está assegurado um lugar no meio-campo inferior, mas a maioria dos concorrentes são ligeiramente mais rápidos. O desempenho de transmissão, em particular, flutua fortemente e tem valores aberrantes em direção à base
Webcam
A webcam é abismal mesmo para câmeras padrão 720p. Embora os desvios de cor sejam surpreendentemente baixos, as imagens são muito escuras, desfocadas e lavadas mesmo sob o sol, e é por isso que a webcam só é utilizável em uma emergência. Se você não quiser se deparar como um gótico em suas videoconferências, você deve confiar em uma solução externa e ignorar a câmera interna


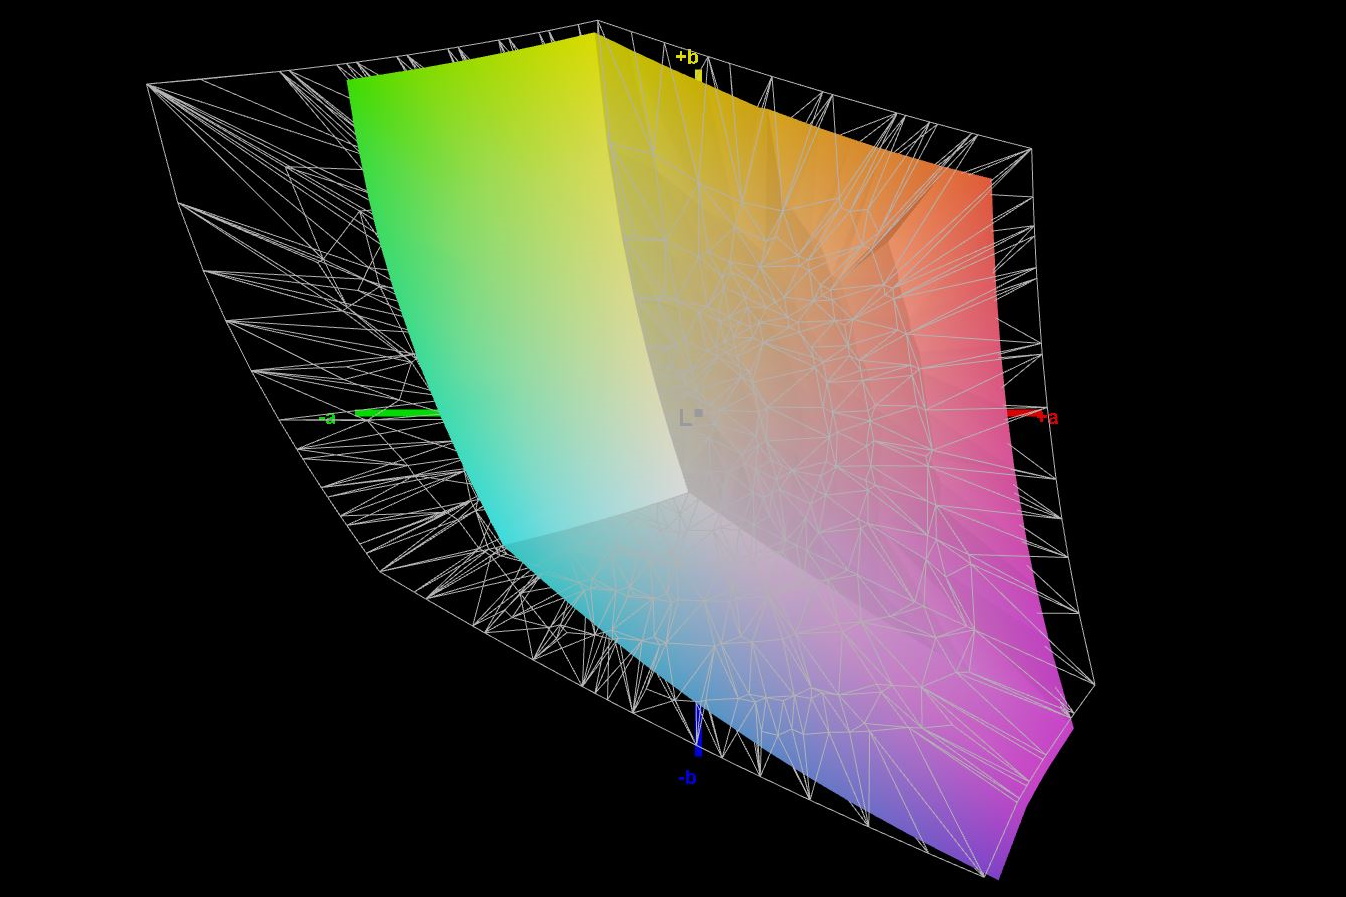
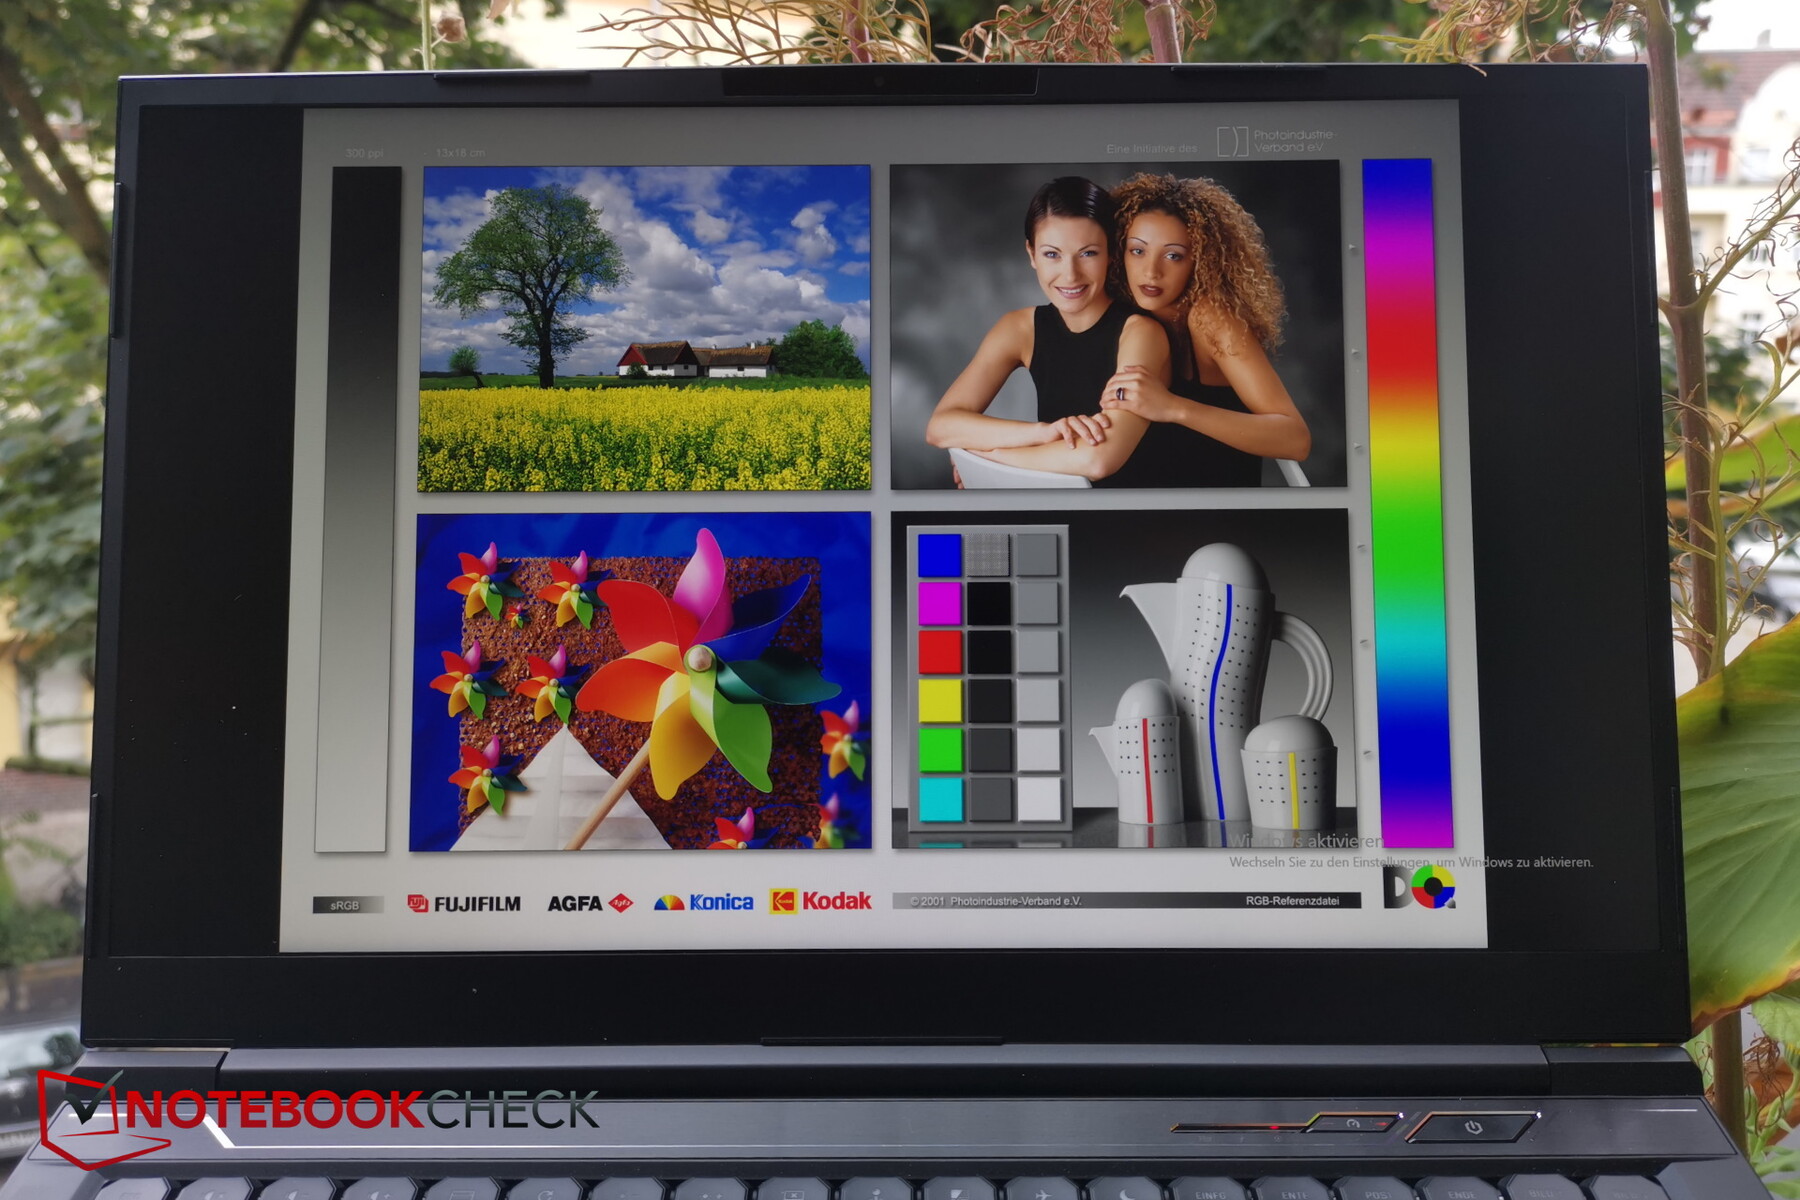
Display - Painel WQHD bem calibrado
Schenker conta com uma tela IPS mate de 17,3 polegadas da BOE com resolução 16:9 de 2.560 x 1.440 pixels e uma taxa de atualização de 165 Hz. Assim, o display é o mesmo que no NEO 17 com CPU AMD e RTX 3060
O brilho médio de 366 lêndeas é bom, e a iluminação de 82% é aceitável
| |||||||||||||||||||||||||
iluminação: 82 %
iluminação com acumulador: 397 cd/m²
Contraste: 880:1 (Preto: 0.45 cd/m²)
ΔE ColorChecker Calman: 1.43 | ∀{0.5-29.43 Ø4.71}
calibrated: 1.34
ΔE Greyscale Calman: 1.8 | ∀{0.09-98 Ø4.96}
68.6% AdobeRGB 1998 (Argyll 3D)
96.3% sRGB (Argyll 3D)
67.1% Display P3 (Argyll 3D)
Gamma: 2.4
CCT: 6489 K
| Schenker XMG NEO 17 GM7TG8S BOE0977 (NE173QHM-NY2), IPS, 2560x1440, 17.3" | Schenker XMG Neo 17 (Early 2021, RTX 3070, 5800H) BOE NE173QHM-NY2 (BOE0977), IPS, 2560x1440, 17.3" | Aorus 17G YD Sharp LQ173M1JW04, IPS, 1920x1080, 17.3" | Medion Erazer Beast X25 BOE NE173FHM-NZ1 (BOE0884), IPS, 1920x1080, 17.3" | Asus ROG Zephyrus S17 GX703HSD BOE099D (BOE CQ NE173QHM-NY3), IPS, 2560x1440, 17.3" | Asus Strix Scar 17 G733QSA-XS99 AU Optronics B173HAN05.4, IPS, 1920x1080, 17.3" | |
|---|---|---|---|---|---|---|
| Display | 4% | 6% | 4% | 22% | 5% | |
| Display P3 Coverage (%) | 67.1 | 70.5 5% | 72.3 8% | 70.4 5% | 94.2 40% | 71 6% |
| sRGB Coverage (%) | 96.3 | 99.5 3% | 100 4% | 99.8 4% | 98.7 2% | 99.4 3% |
| AdobeRGB 1998 Coverage (%) | 68.6 | 71.8 5% | 73.7 7% | 71.6 4% | 84.4 23% | 72.2 5% |
| Response Times | -13% | 3% | 38% | 39% | 17% | |
| Response Time Grey 50% / Grey 80% * (ms) | 15.2 | 16.8 ? -11% | 13.6 ? 11% | 9.2 ? 39% | 4.8 68% | 6.6 ? 57% |
| Response Time Black / White * (ms) | 8.8 | 10 ? -14% | 9.2 ? -5% | 5.6 ? 36% | 8 9% | 10.8 ? -23% |
| PWM Frequency (Hz) | ||||||
| Screen | -22% | -35% | -26% | -40% | -9% | |
| Brightness middle (cd/m²) | 396 | 410 4% | 286 -28% | 329 -17% | 322 -19% | 303.8 -23% |
| Brightness (cd/m²) | 366 | 381 4% | 282 -23% | 315 -14% | 288 -21% | 292 -20% |
| Brightness Distribution (%) | 82 | 88 7% | 73 -11% | 88 7% | 72 -12% | 85 4% |
| Black Level * (cd/m²) | 0.45 | 0.37 18% | 0.24 47% | 0.33 27% | 0.3 33% | 0.23 49% |
| Contrast (:1) | 880 | 1108 26% | 1192 35% | 997 13% | 1073 22% | 1321 50% |
| Colorchecker dE 2000 * | 1.43 | 2.55 -78% | 2.79 -95% | 2.03 -42% | 3.05 -113% | 1.87 -31% |
| Colorchecker dE 2000 max. * | 2.2 | 4.33 -97% | 6.23 -183% | 5.5 -150% | 5.23 -138% | 3.26 -48% |
| Colorchecker dE 2000 calibrated * | 1.34 | 1.28 4% | 0.82 39% | 0.82 39% | 1.92 -43% | 1.45 -8% |
| Greyscale dE 2000 * | 1.8 | 3.4 -89% | 3.5 -94% | 3.5 -94% | 3.11 -73% | 2.7 -50% |
| Gamma | 2.4 92% | 2.275 97% | 2.358 93% | 2.223 99% | 2.13 103% | 2.26 97% |
| CCT | 6489 100% | 6637 98% | 6147 106% | 6526 100% | 6553 99% | 6436 101% |
| Color Space (Percent of AdobeRGB 1998) (%) | 72 | 74 | 84 | 65.6 | ||
| Color Space (Percent of sRGB) (%) | 95 | 96 | 99 | 99.4 | ||
| Média Total (Programa/Configurações) | -10% /
-15% | -9% /
-21% | 5% /
-10% | 7% /
-16% | 4% /
-2% |
* ... menor é melhor
O nível de preto e o contraste são ligeiramente piores do que no AMD NEO, mas a tela parece estar melhor calibrada em troca. Os desvios de cor são mínimos, uma calibração manual só traz pequenas melhorias
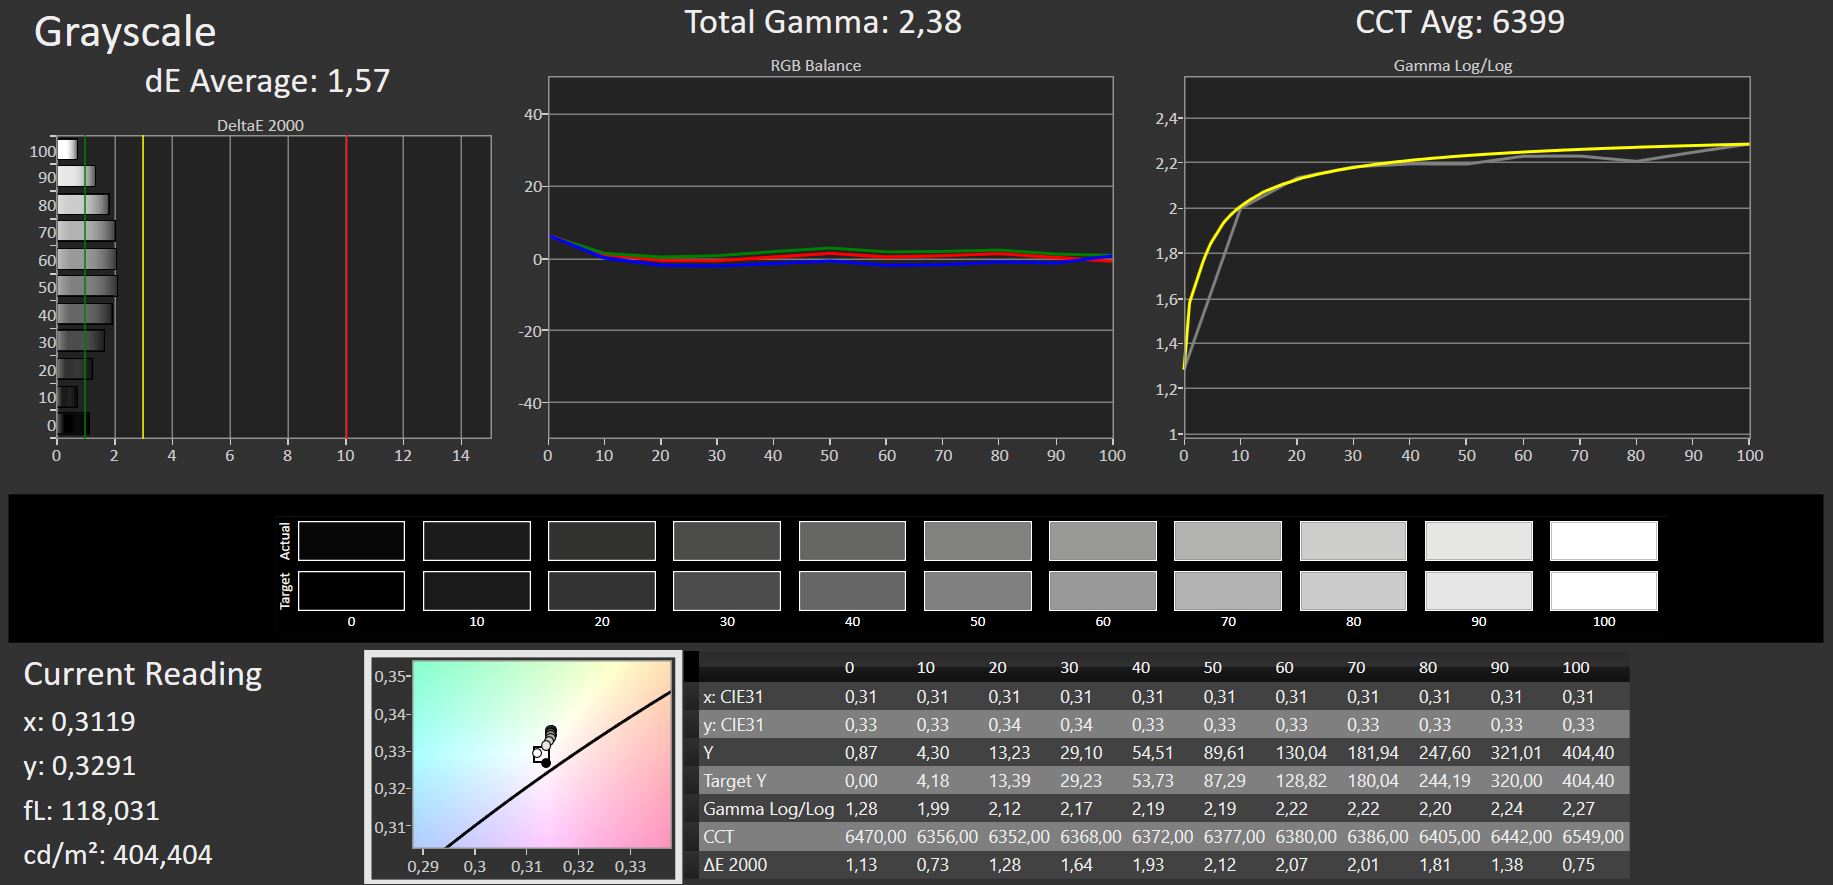
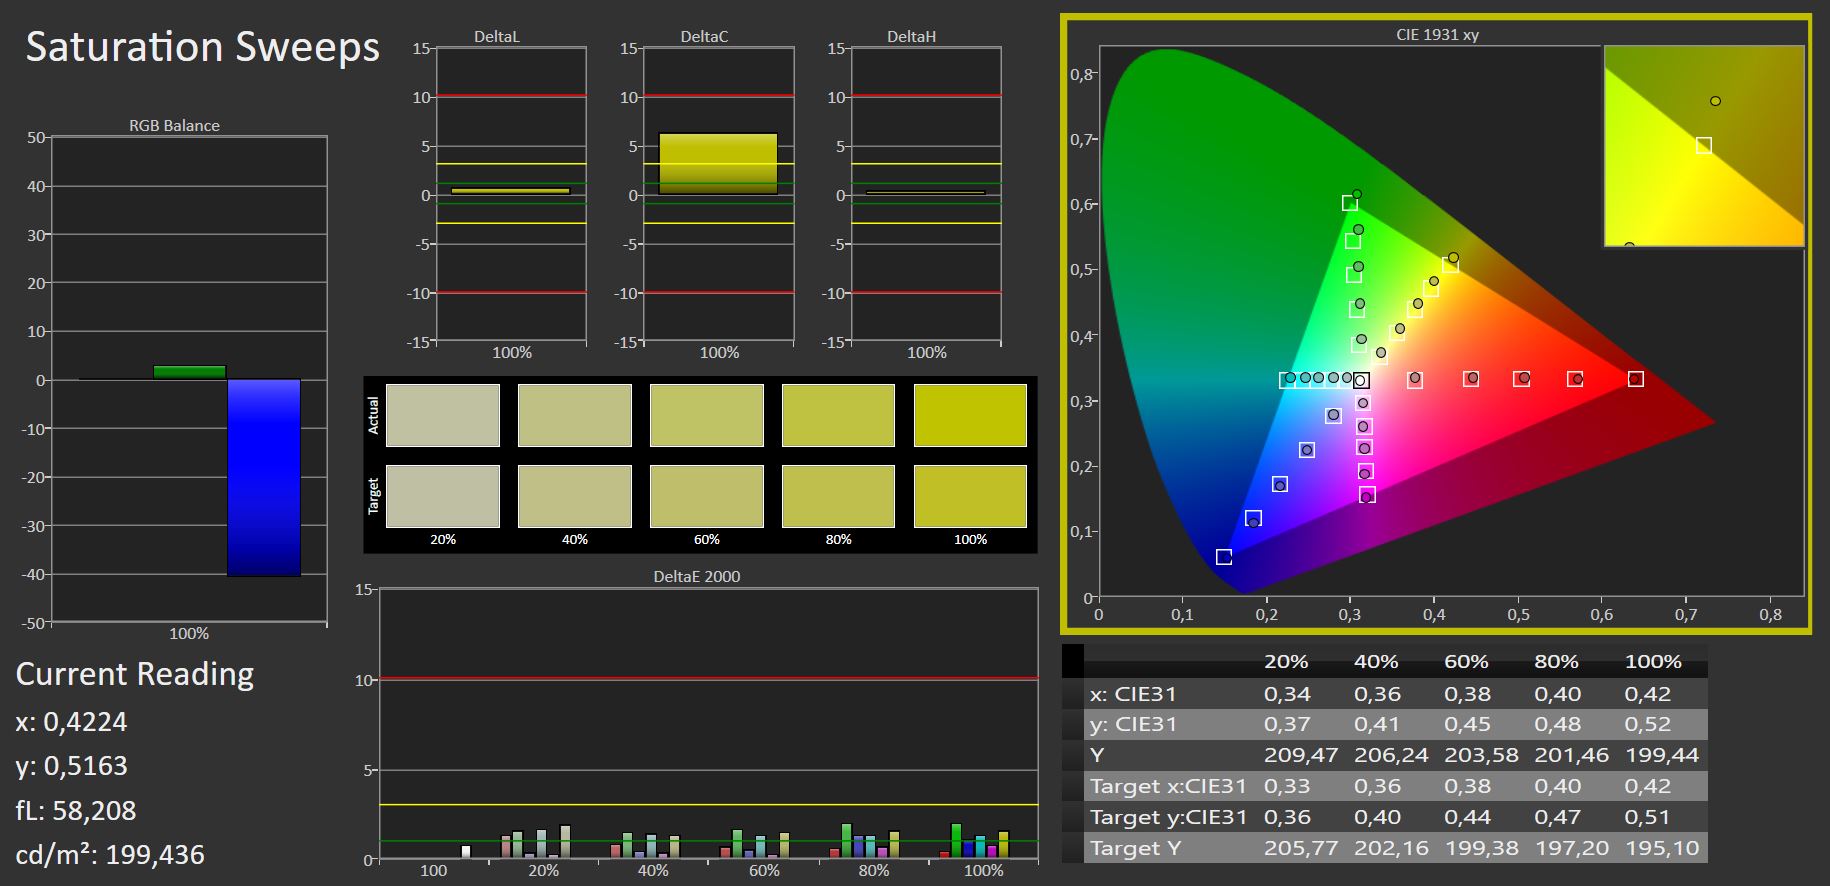
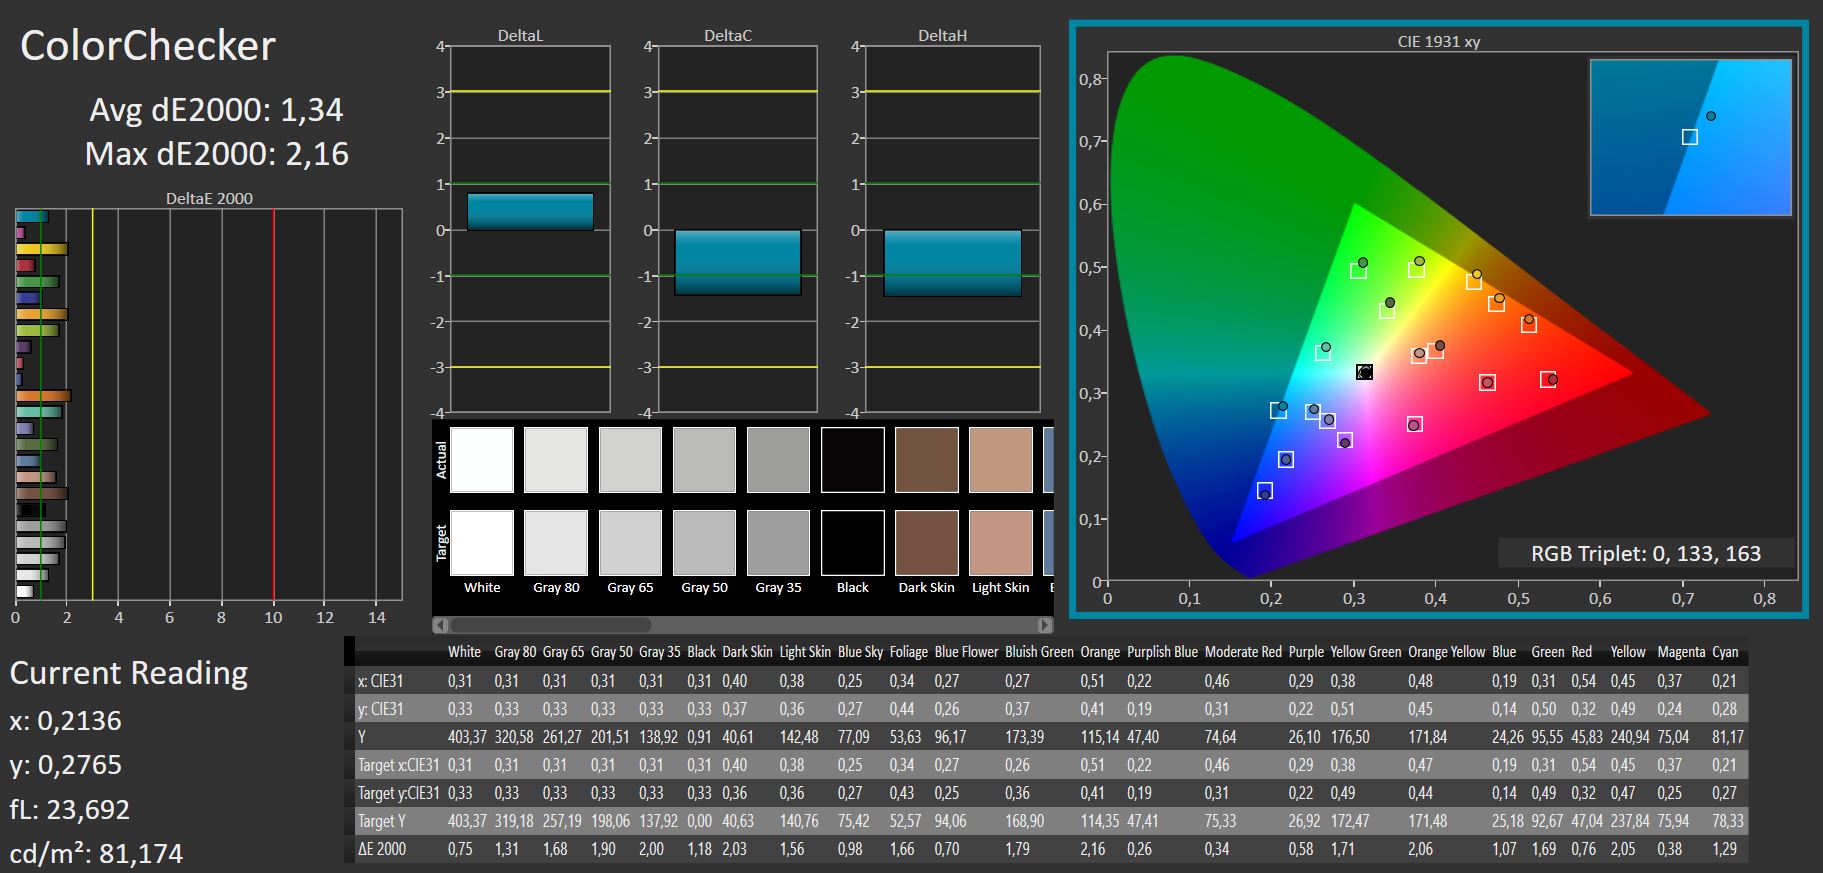
O AdobeRGB ainda é coberto por cerca de 69 por cento, o sRGB quase completamente.
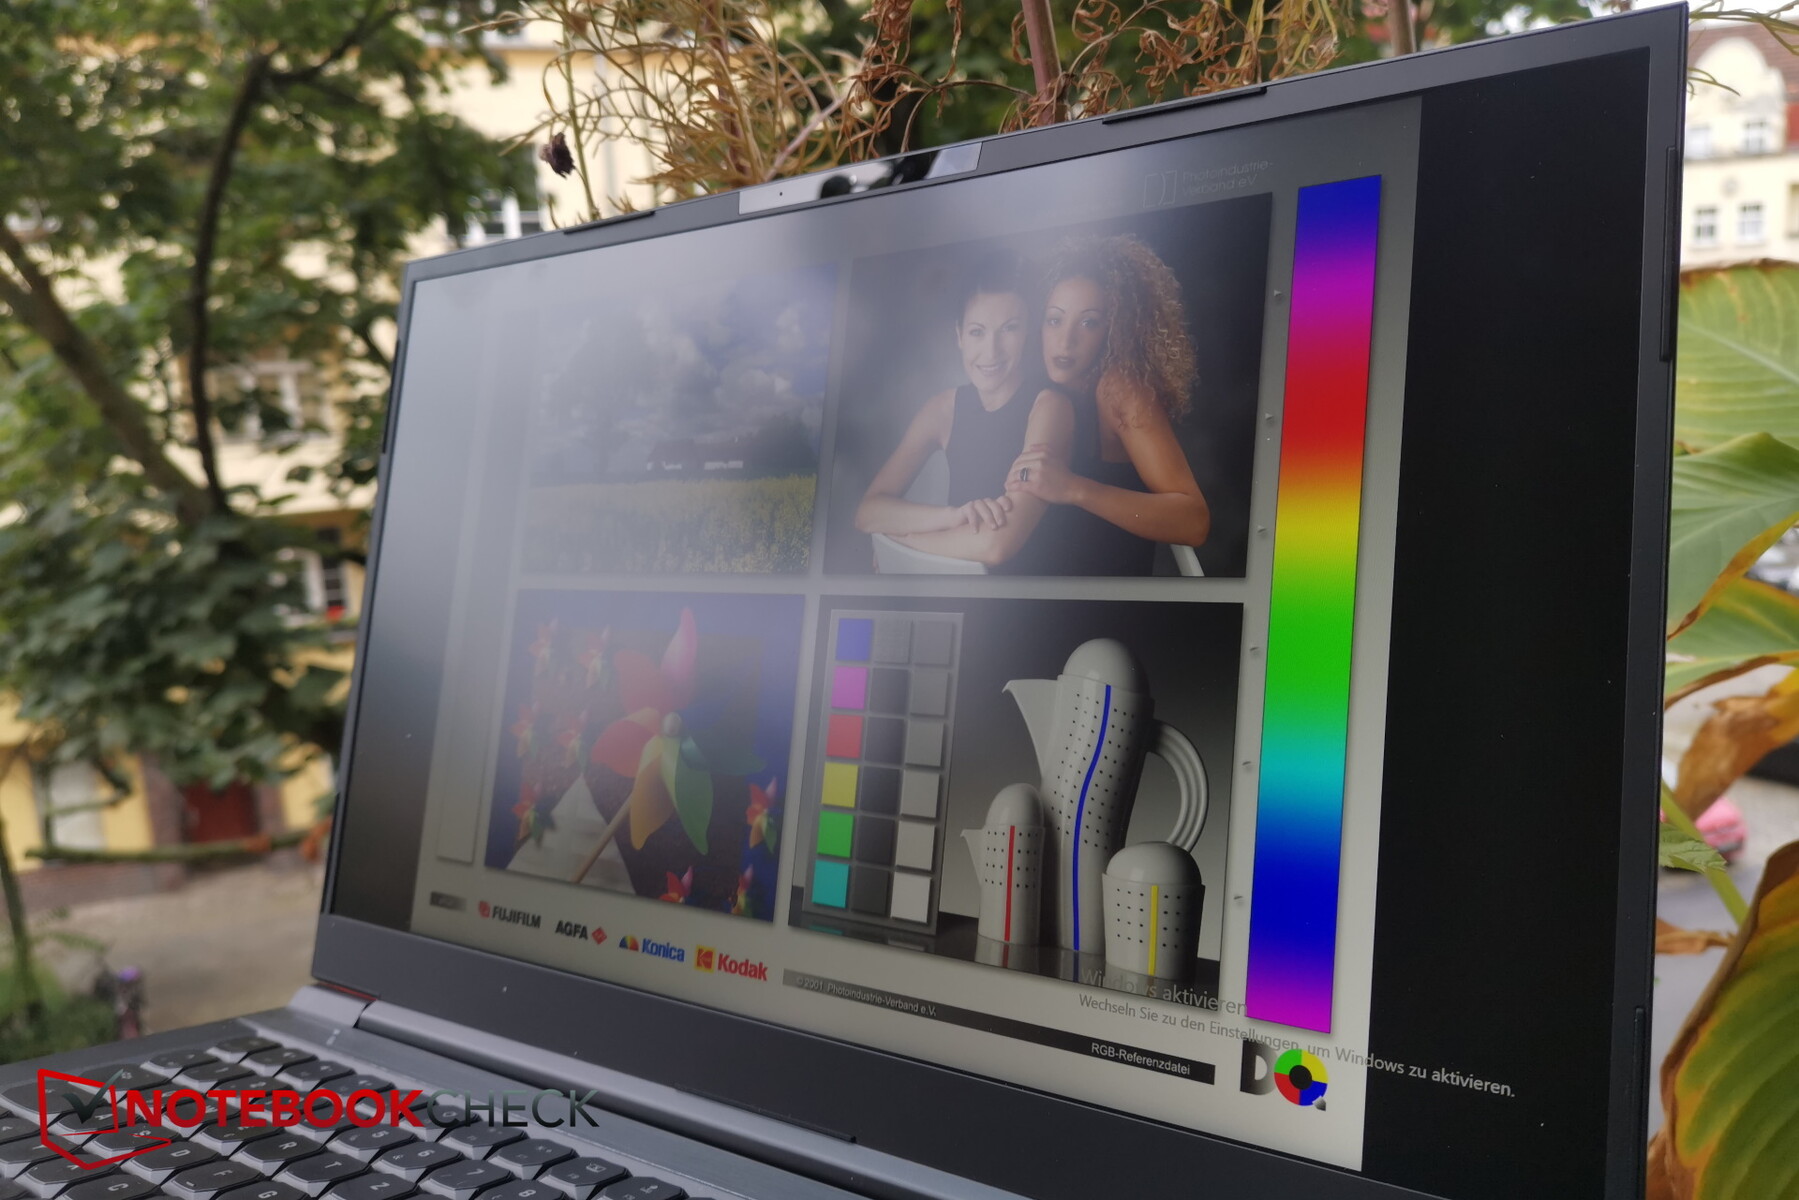
Devido à superfície fosca e ao brilho bastante bom, o NEO 17 também pode ser usado bastante bem ao ar livre, pelo menos na sombra
Os tempos de resposta não são excelentes para um jogador, mas suficientes. Não notamos nenhum PWM
Exibir tempos de resposta
| ↔ Tempo de resposta preto para branco | ||
|---|---|---|
| 8.8 ms ... ascensão ↗ e queda ↘ combinadas | ↗ ms ascensão | |
| ↘ ms queda | ||
| A tela mostra taxas de resposta rápidas em nossos testes e deve ser adequada para jogos. Em comparação, todos os dispositivos testados variam de 0.1 (mínimo) a 240 (máximo) ms. » 25 % de todos os dispositivos são melhores. Isso significa que o tempo de resposta medido é melhor que a média de todos os dispositivos testados (19.8 ms). | ||
| ↔ Tempo de resposta 50% cinza a 80% cinza | ||
| 15.2 ms ... ascensão ↗ e queda ↘ combinadas | ↗ ms ascensão | |
| ↘ ms queda | ||
| A tela mostra boas taxas de resposta em nossos testes, mas pode ser muito lenta para jogadores competitivos. Em comparação, todos os dispositivos testados variam de 0.165 (mínimo) a 636 (máximo) ms. » 29 % de todos os dispositivos são melhores. Isso significa que o tempo de resposta medido é melhor que a média de todos os dispositivos testados (31 ms). | ||
Cintilação da tela / PWM (modulação por largura de pulso)
| Tela tremeluzindo / PWM não detectado | ||
[pwm_comparison] Em comparação: 52 % de todos os dispositivos testados não usam PWM para escurecer a tela. Se PWM foi detectado, uma média de 7754 (mínimo: 5 - máximo: 343500) Hz foi medida. | ||
Perde-se um pouco de brilho quando se vê de ângulos extremos, mas a perda é muito limitada, como é típico do IPS

Desempenho - RTX 3080 desenfreado
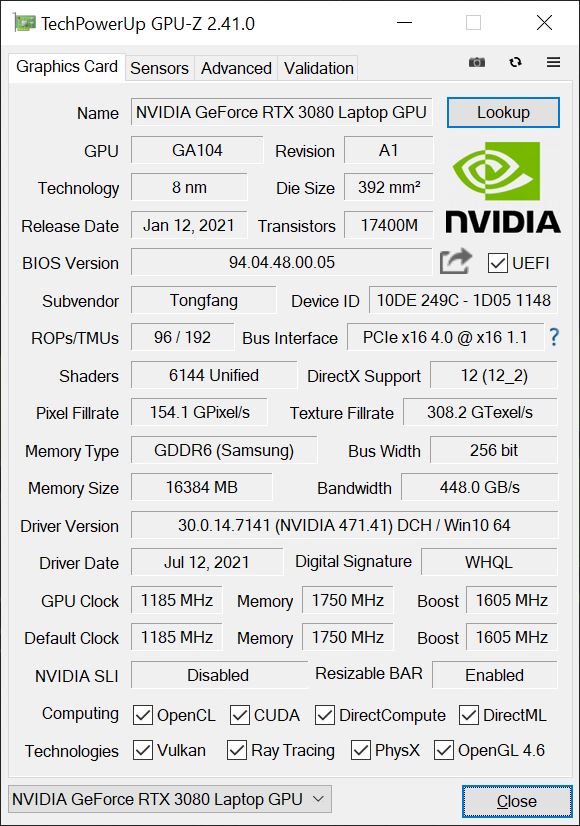
O NEO 17 é claramente um jogador, não apenas por causa do Nvidia GeForce RTX 3080 GPU para laptop ou a CPU Intel Core i7-11800H de 8 núcleos. A iluminação RGB do teclado também dá algumas dicas. Com esta combinação de hardware, mesmo os jogos mais recentes e mais exigentes devem ser jogáveis sem problemas na resolução nativa, e há reservas suficientes para jogos de 4K em monitores externos.
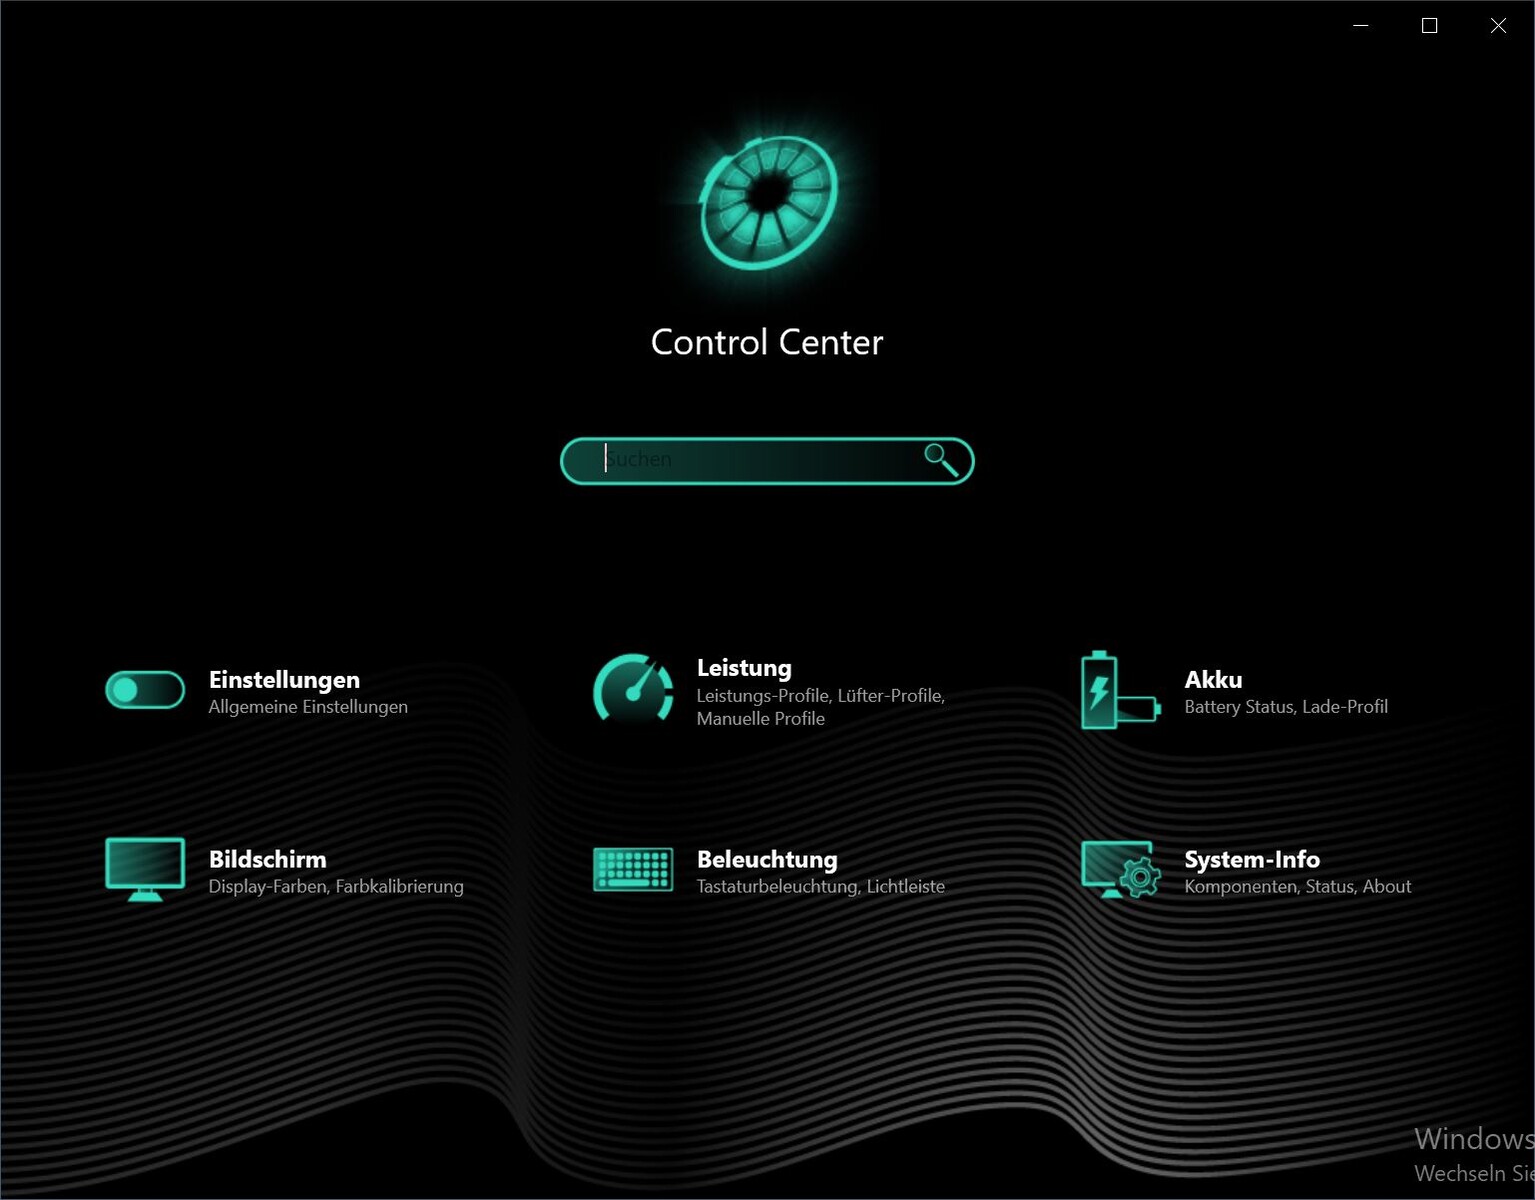
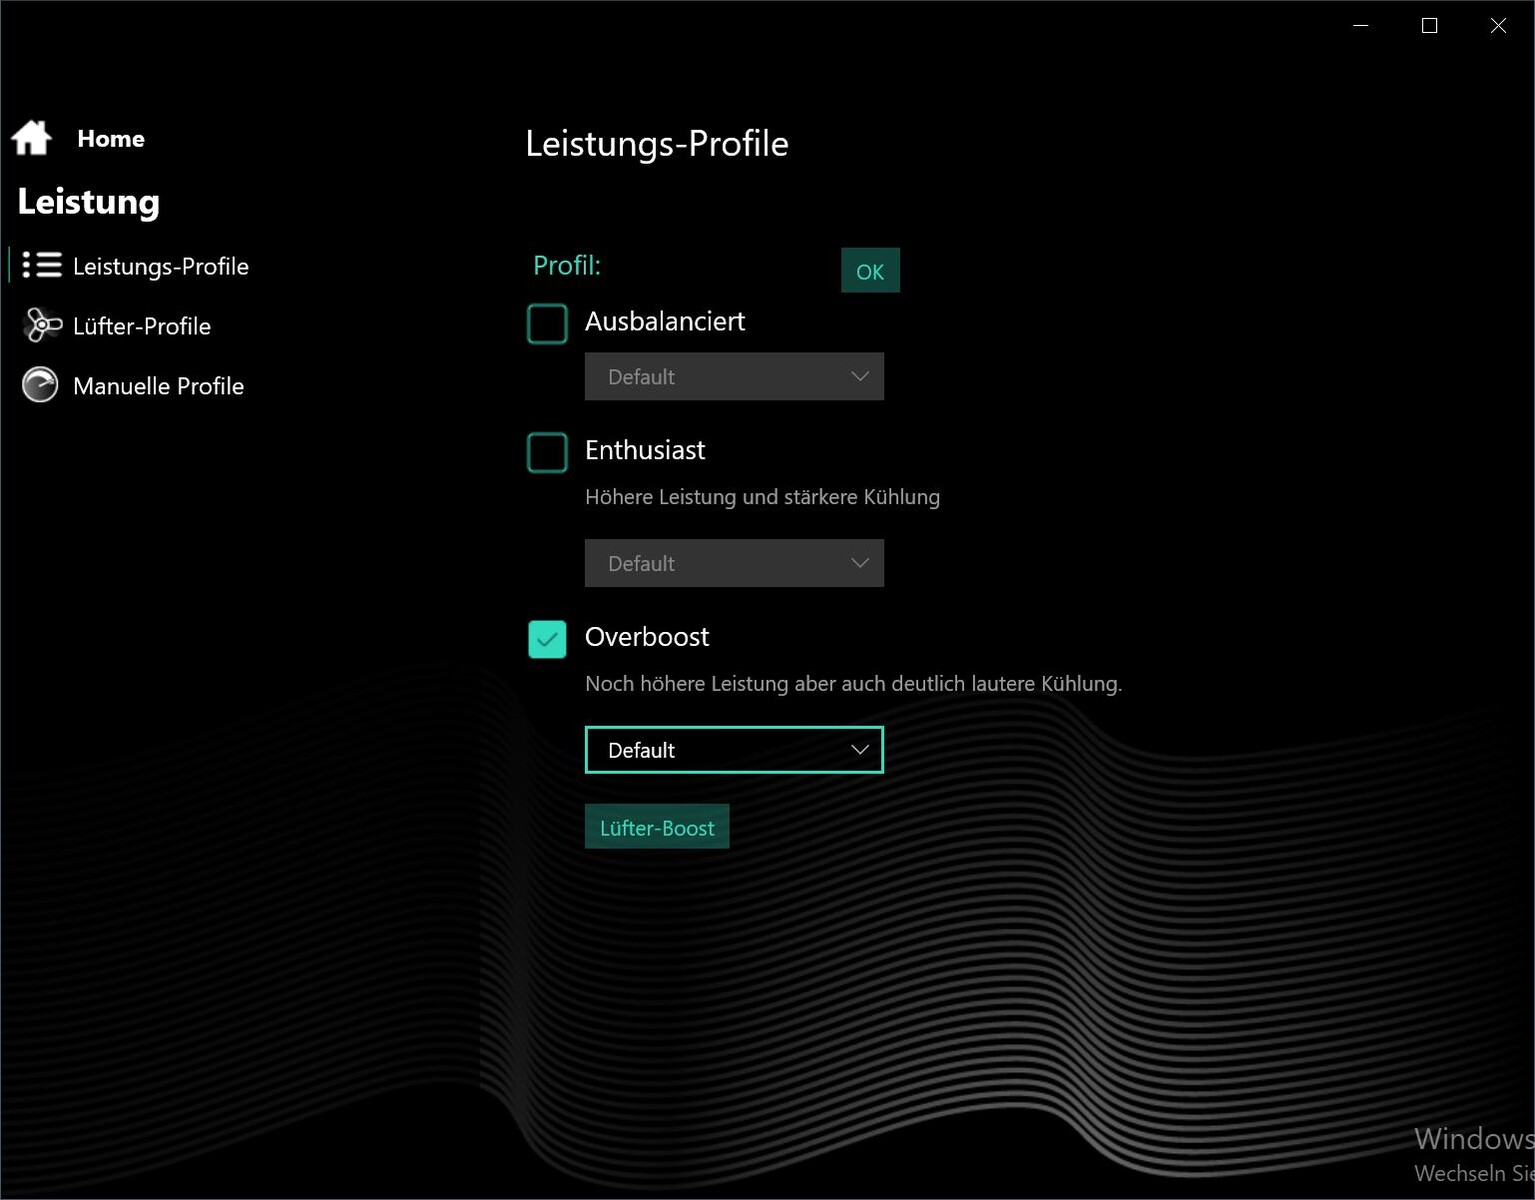
Para obter os melhores resultados nos benchmarks, desativamos a GPU interna no Centro de Controle e ativamos o modo Overboost
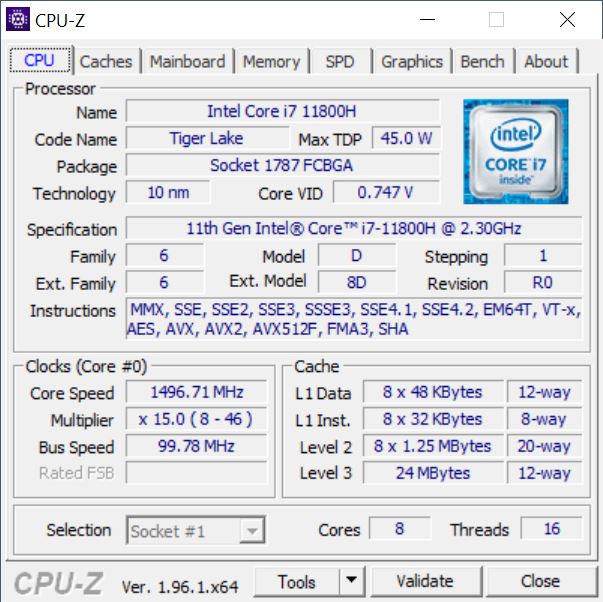
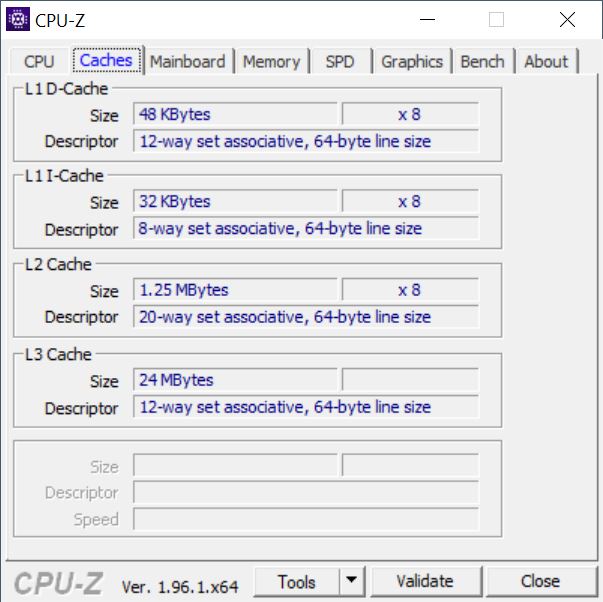
Processador
Os 8 núcleos do núcleo i7-11800H da Intel https://www.notebookcheck.com/Intel-Core-i7-11800H-Prozessor-Benchmarks-und-Specs.525579.0.html relógio entre 2,3 e 4,6 GHz
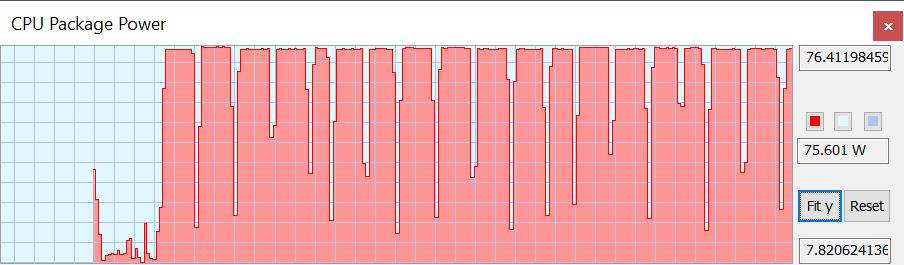
O NEO 17 tem um desempenho um pouco abaixo da média no loop contínuo Cinebench R15 apesar do modo overboost, mas a diferença é apenas pequena. Por exemplo, o Aorus com a mesma CPU é um pouco mais rápido. O TDP é sempre 75 W nas execuções individuais. No entanto, você poderia aumentar manualmente o TDP no Centro de Controle, mas o deixamos nas configurações padrão do modo de overboost
O NEO 17 perde cerca de 20% no modo de bateria e só pontua 1.420 em vez de 1.767 pontos no Cinebench R15 Multi.
Cinebench R15 Multi Endurance test
Cinebench R20: CPU (Single Core) | CPU (Multi Core)
Cinebench R15: CPU Single 64Bit | CPU Multi 64Bit
Blender: v2.79 BMW27 CPU
7-Zip 18.03: 7z b 4 -mmt1 | 7z b 4
Geekbench 5.5: Single-Core | Multi-Core
HWBOT x265 Benchmark v2.2: 4k Preset
LibreOffice : 20 Documents To PDF
R Benchmark 2.5: Overall mean
| Cinebench R23 / Single Core | |
| Média da turma Gaming (1166 - 2415, n=107, últimos 2 anos) | |
| Asus ROG Zephyrus S17 GX703HSD | |
| Aorus 17G YD | |
| Asus Strix Scar 17 G733QSA-XS99 | |
| Média Intel Core i7-11800H (1386 - 1522, n=45) | |
| Schenker XMG NEO 17 GM7TG8S | |
| Medion Erazer Beast X25 | |
| Schenker XMG Neo 17 (Early 2021, RTX 3070, 5800H) | |
| Cinebench R23 / Multi Core | |
| Média da turma Gaming (10488 - 42661, n=107, últimos 2 anos) | |
| Asus Strix Scar 17 G733QSA-XS99 | |
| Aorus 17G YD | |
| Asus ROG Zephyrus S17 GX703HSD | |
| Medion Erazer Beast X25 | |
| Schenker XMG Neo 17 (Early 2021, RTX 3070, 5800H) | |
| Média Intel Core i7-11800H (6508 - 14088, n=48) | |
| Schenker XMG NEO 17 GM7TG8S | |
| Cinebench R20 / CPU (Single Core) | |
| Média da turma Gaming (442 - 913, n=106, últimos 2 anos) | |
| Asus ROG Zephyrus S17 GX703HSD | |
| Schenker XMG NEO 17 GM7TG8S | |
| Medion Erazer Beast X25 | |
| Média Intel Core i7-11800H (520 - 586, n=47) | |
| Asus Strix Scar 17 G733QSA-XS99 | |
| Aorus 17G YD | |
| Schenker XMG Neo 17 (Early 2021, RTX 3070, 5800H) | |
| Cinebench R20 / CPU (Multi Core) | |
| Média da turma Gaming (4029 - 16433, n=106, últimos 2 anos) | |
| Asus Strix Scar 17 G733QSA-XS99 | |
| Asus ROG Zephyrus S17 GX703HSD | |
| Aorus 17G YD | |
| Medion Erazer Beast X25 | |
| Schenker XMG Neo 17 (Early 2021, RTX 3070, 5800H) | |
| Média Intel Core i7-11800H (2498 - 5408, n=50) | |
| Schenker XMG NEO 17 GM7TG8S | |
| Cinebench R15 / CPU Single 64Bit | |
| Média da turma Gaming (188.8 - 350, n=106, últimos 2 anos) | |
| Asus ROG Zephyrus S17 GX703HSD | |
| Asus Strix Scar 17 G733QSA-XS99 | |
| Medion Erazer Beast X25 | |
| Schenker XMG Neo 17 (Early 2021, RTX 3070, 5800H) | |
| Schenker XMG NEO 17 GM7TG8S | |
| Aorus 17G YD | |
| Média Intel Core i7-11800H (201 - 231, n=46) | |
| Cinebench R15 / CPU Multi 64Bit | |
| Média da turma Gaming (1578 - 6330, n=105, últimos 2 anos) | |
| Asus Strix Scar 17 G733QSA-XS99 | |
| Asus ROG Zephyrus S17 GX703HSD | |
| Schenker XMG Neo 17 (Early 2021, RTX 3070, 5800H) | |
| Aorus 17G YD | |
| Medion Erazer Beast X25 | |
| Média Intel Core i7-11800H (1342 - 2173, n=50) | |
| Schenker XMG NEO 17 GM7TG8S | |
| Blender / v2.79 BMW27 CPU | |
| Aorus 17G YD | |
| Média Intel Core i7-11800H (217 - 454, n=46) | |
| Schenker XMG NEO 17 GM7TG8S | |
| Medion Erazer Beast X25 | |
| Schenker XMG Neo 17 (Early 2021, RTX 3070, 5800H) | |
| Asus ROG Zephyrus S17 GX703HSD | |
| Asus Strix Scar 17 G733QSA-XS99 | |
| Média da turma Gaming (79 - 330, n=104, últimos 2 anos) | |
| 7-Zip 18.03 / 7z b 4 -mmt1 | |
| Média da turma Gaming (4199 - 7436, n=105, últimos 2 anos) | |
| Asus ROG Zephyrus S17 GX703HSD | |
| Asus Strix Scar 17 G733QSA-XS99 | |
| Medion Erazer Beast X25 | |
| Schenker XMG Neo 17 (Early 2021, RTX 3070, 5800H) | |
| Aorus 17G YD | |
| Schenker XMG NEO 17 GM7TG8S | |
| Média Intel Core i7-11800H (5138 - 5732, n=46) | |
| 7-Zip 18.03 / 7z b 4 | |
| Média da turma Gaming (33491 - 148086, n=105, últimos 2 anos) | |
| Asus Strix Scar 17 G733QSA-XS99 | |
| Medion Erazer Beast X25 | |
| Schenker XMG Neo 17 (Early 2021, RTX 3070, 5800H) | |
| Asus ROG Zephyrus S17 GX703HSD | |
| Média Intel Core i7-11800H (33718 - 56758, n=46) | |
| Aorus 17G YD | |
| Schenker XMG NEO 17 GM7TG8S | |
| Geekbench 5.5 / Single-Core | |
| Média da turma Gaming (986 - 2474, n=105, últimos 2 anos) | |
| Asus ROG Zephyrus S17 GX703HSD | |
| Schenker XMG NEO 17 GM7TG8S | |
| Aorus 17G YD | |
| Média Intel Core i7-11800H (1429 - 1625, n=40) | |
| Asus Strix Scar 17 G733QSA-XS99 | |
| Medion Erazer Beast X25 | |
| Schenker XMG Neo 17 (Early 2021, RTX 3070, 5800H) | |
| Geekbench 5.5 / Multi-Core | |
| Média da turma Gaming (6460 - 28263, n=105, últimos 2 anos) | |
| Asus ROG Zephyrus S17 GX703HSD | |
| Aorus 17G YD | |
| Medion Erazer Beast X25 | |
| Schenker XMG NEO 17 GM7TG8S | |
| Asus Strix Scar 17 G733QSA-XS99 | |
| Média Intel Core i7-11800H (4655 - 9851, n=40) | |
| Schenker XMG Neo 17 (Early 2021, RTX 3070, 5800H) | |
| HWBOT x265 Benchmark v2.2 / 4k Preset | |
| Média da turma Gaming (11.5 - 44.4, n=105, últimos 2 anos) | |
| Asus Strix Scar 17 G733QSA-XS99 | |
| Asus ROG Zephyrus S17 GX703HSD | |
| Aorus 17G YD | |
| Medion Erazer Beast X25 | |
| Schenker XMG Neo 17 (Early 2021, RTX 3070, 5800H) | |
| Média Intel Core i7-11800H (7.38 - 17.4, n=46) | |
| Schenker XMG NEO 17 GM7TG8S | |
| LibreOffice / 20 Documents To PDF | |
| Schenker XMG Neo 17 (Early 2021, RTX 3070, 5800H) | |
| Média da turma Gaming (33.2 - 88.8, n=105, últimos 2 anos) | |
| Medion Erazer Beast X25 | |
| Média Intel Core i7-11800H (38.6 - 59.9, n=45) | |
| Asus Strix Scar 17 G733QSA-XS99 | |
| Asus ROG Zephyrus S17 GX703HSD | |
| Schenker XMG NEO 17 GM7TG8S | |
| Aorus 17G YD | |
| R Benchmark 2.5 / Overall mean | |
| Schenker XMG NEO 17 GM7TG8S | |
| Média Intel Core i7-11800H (0.548 - 0.615, n=46) | |
| Aorus 17G YD | |
| Asus ROG Zephyrus S17 GX703HSD | |
| Schenker XMG Neo 17 (Early 2021, RTX 3070, 5800H) | |
| Asus Strix Scar 17 G733QSA-XS99 | |
| Medion Erazer Beast X25 | |
| Média da turma Gaming (0.3439 - 0.759, n=106, últimos 2 anos) | |
* ... menor é melhor
Desempenho do sistema
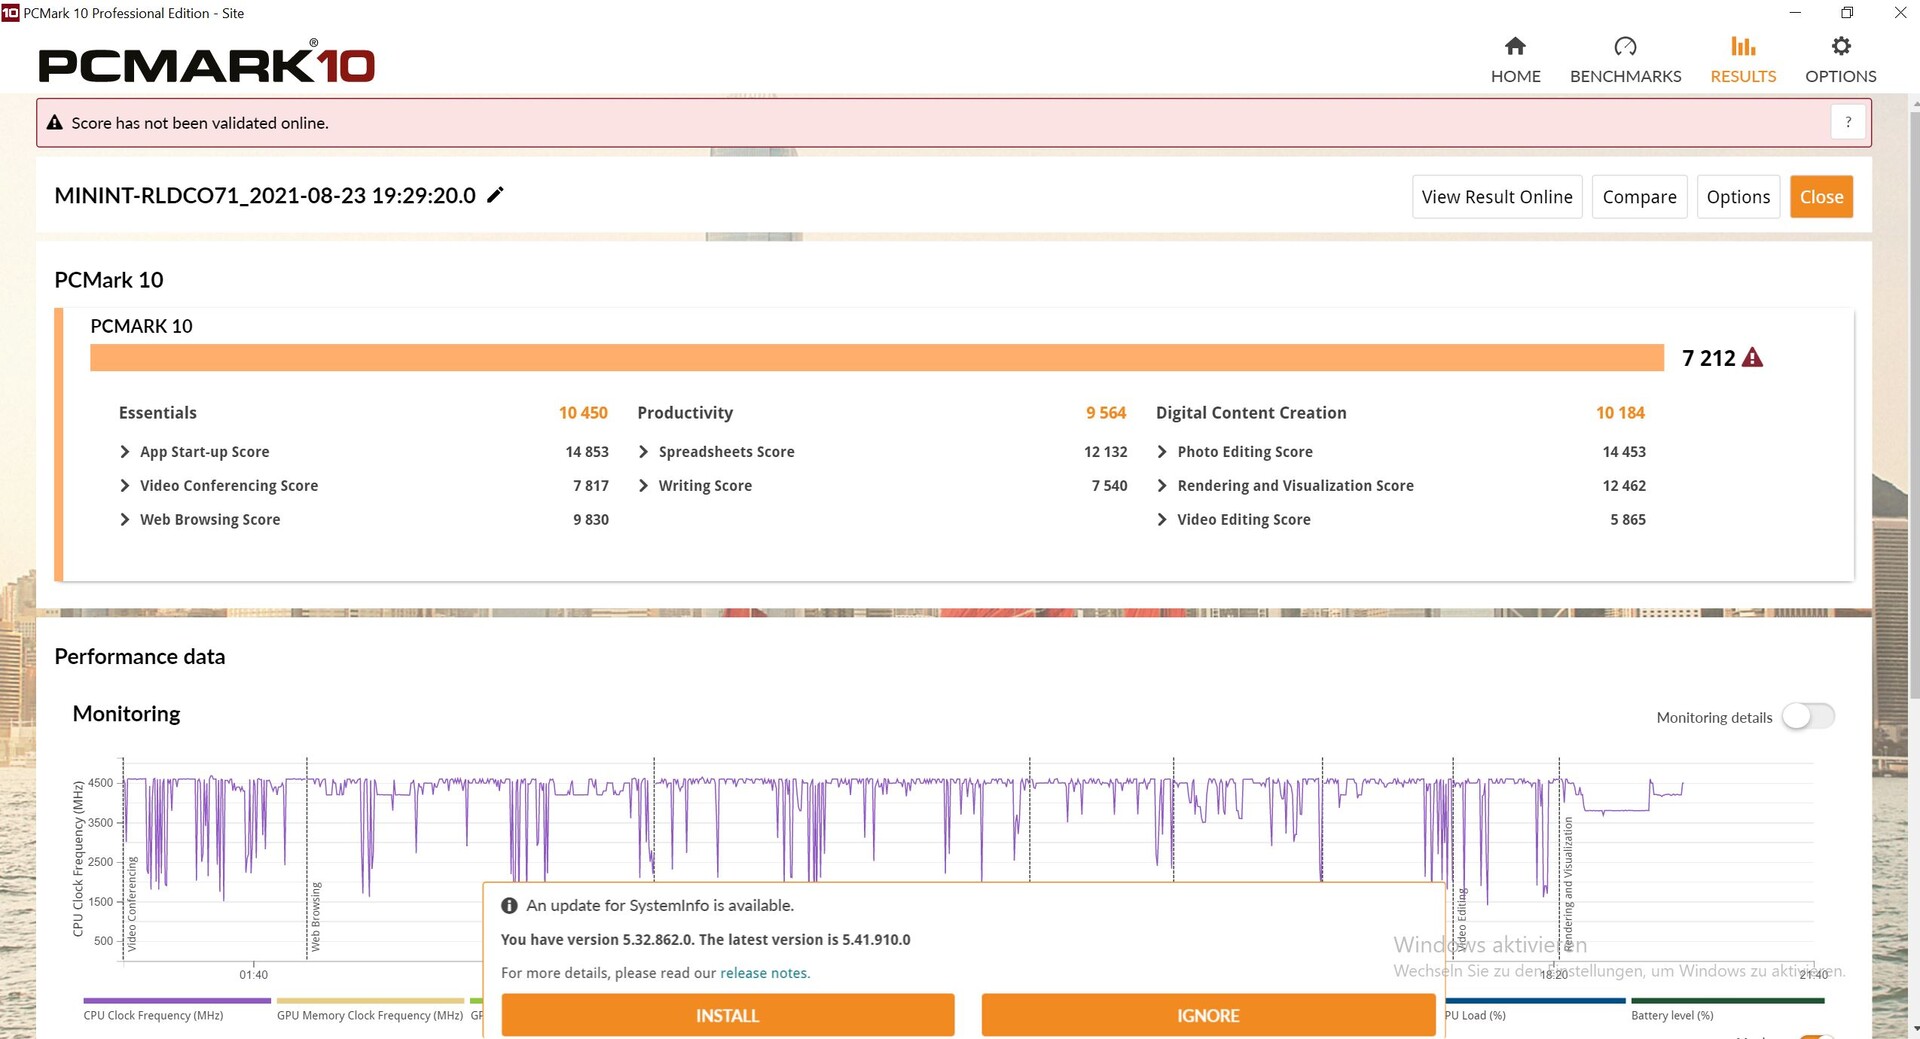
No entanto, o desempenho do sistema está no nível esperado, e o NEO 17 ocupa até mesmo um dos primeiros lugares aqui
| PCMark 10 / Score | |
| Média da turma Gaming (5828 - 12414, n=93, últimos 2 anos) | |
| Asus ROG Zephyrus S17 GX703HSD | |
| Schenker XMG NEO 17 GM7TG8S | |
| Asus Strix Scar 17 G733QSA-XS99 | |
| Média Intel Core i7-11800H, NVIDIA GeForce RTX 3080 Laptop GPU (6673 - 7470, n=11) | |
| Aorus 17G YD | |
| Schenker XMG Neo 17 (Early 2021, RTX 3070, 5800H) | |
| Medion Erazer Beast X25 | |
| PCMark 10 / Essentials | |
| Média da turma Gaming (8810 - 11935, n=97, últimos 2 anos) | |
| Asus ROG Zephyrus S17 GX703HSD | |
| Asus Strix Scar 17 G733QSA-XS99 | |
| Schenker XMG NEO 17 GM7TG8S | |
| Média Intel Core i7-11800H, NVIDIA GeForce RTX 3080 Laptop GPU (9862 - 11064, n=11) | |
| Aorus 17G YD | |
| Schenker XMG Neo 17 (Early 2021, RTX 3070, 5800H) | |
| Medion Erazer Beast X25 | |
| PCMark 10 / Productivity | |
| Média da turma Gaming (6845 - 25323, n=95, últimos 2 anos) | |
| Asus Strix Scar 17 G733QSA-XS99 | |
| Schenker XMG NEO 17 GM7TG8S | |
| Aorus 17G YD | |
| Medion Erazer Beast X25 | |
| Asus ROG Zephyrus S17 GX703HSD | |
| Média Intel Core i7-11800H, NVIDIA GeForce RTX 3080 Laptop GPU (8278 - 9803, n=11) | |
| Schenker XMG Neo 17 (Early 2021, RTX 3070, 5800H) | |
| PCMark 10 / Digital Content Creation | |
| Média da turma Gaming (7602 - 19954, n=95, últimos 2 anos) | |
| Asus ROG Zephyrus S17 GX703HSD | |
| Média Intel Core i7-11800H, NVIDIA GeForce RTX 3080 Laptop GPU (9881 - 11323, n=11) | |
| Schenker XMG Neo 17 (Early 2021, RTX 3070, 5800H) | |
| Schenker XMG NEO 17 GM7TG8S | |
| Aorus 17G YD | |
| Asus Strix Scar 17 G733QSA-XS99 | |
| Medion Erazer Beast X25 | |
| PCMark 10 Score | 7212 pontos | |
Ajuda | ||
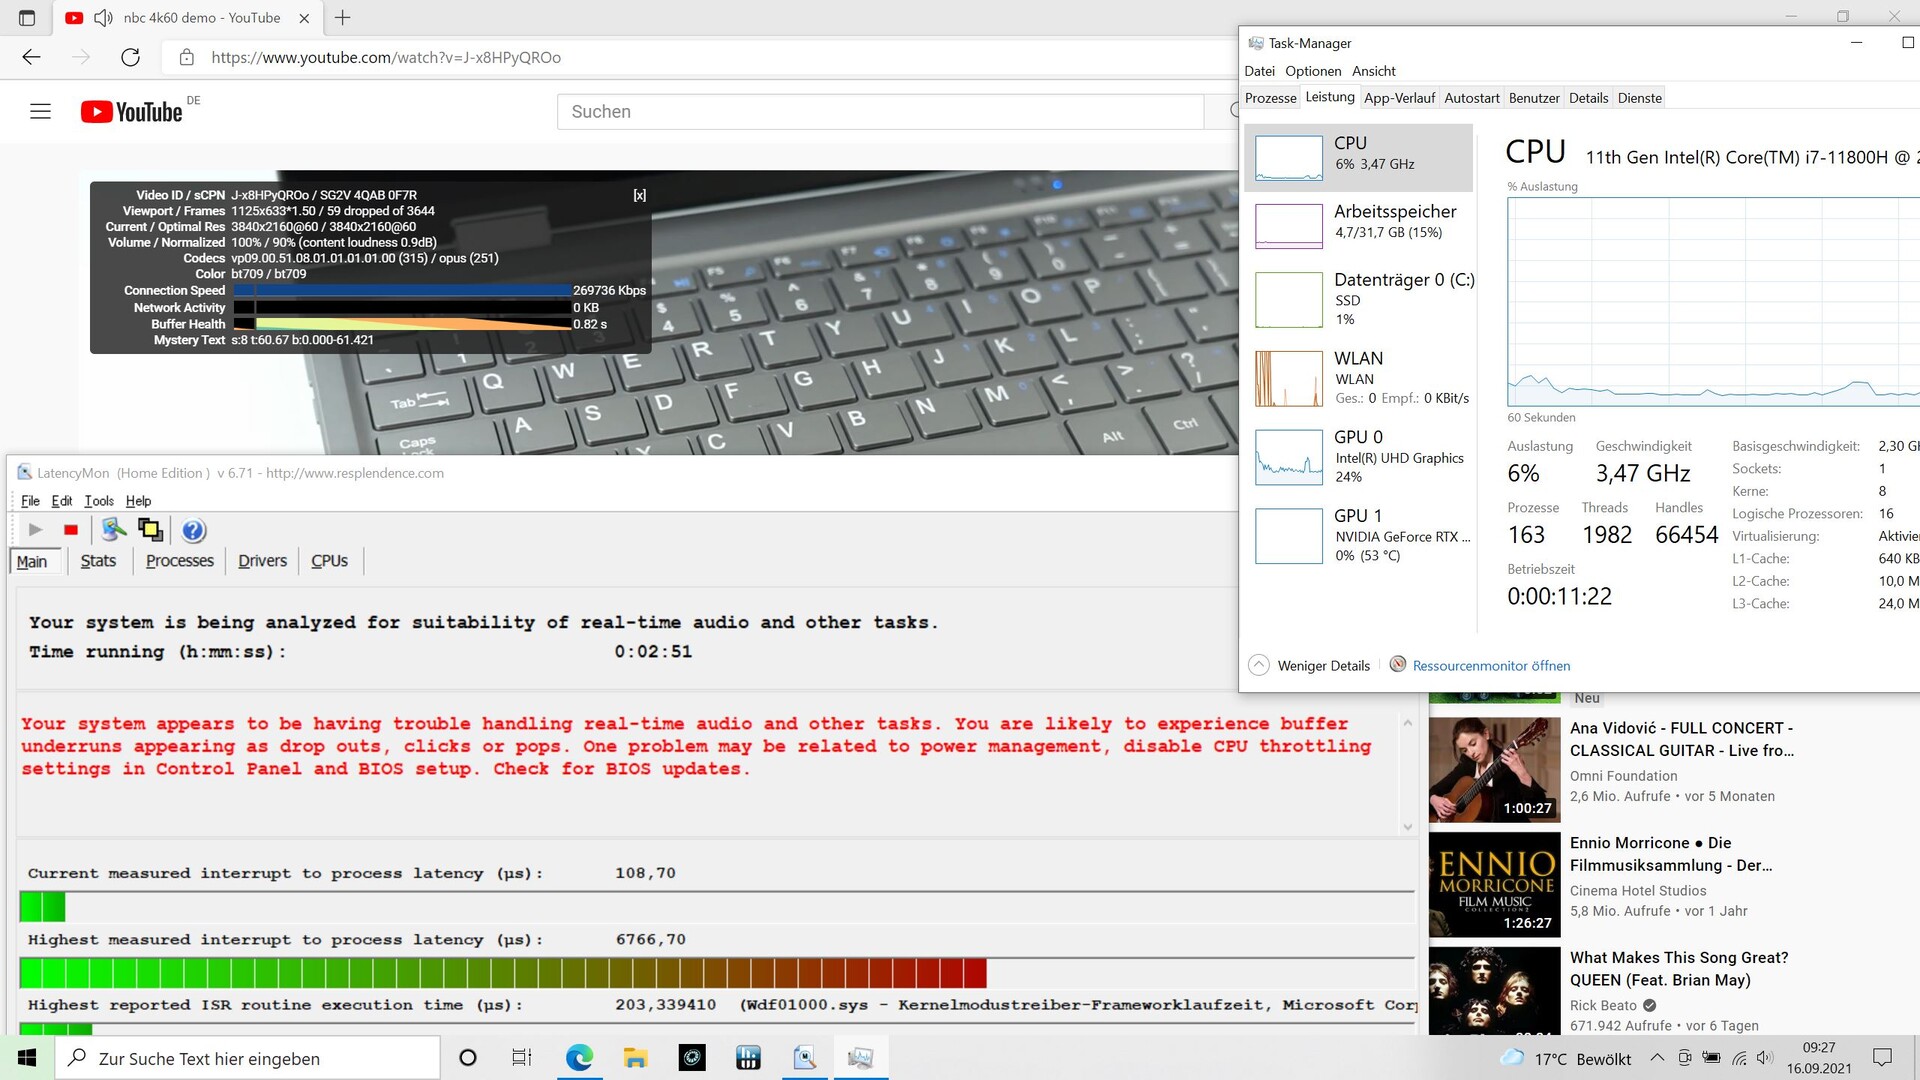
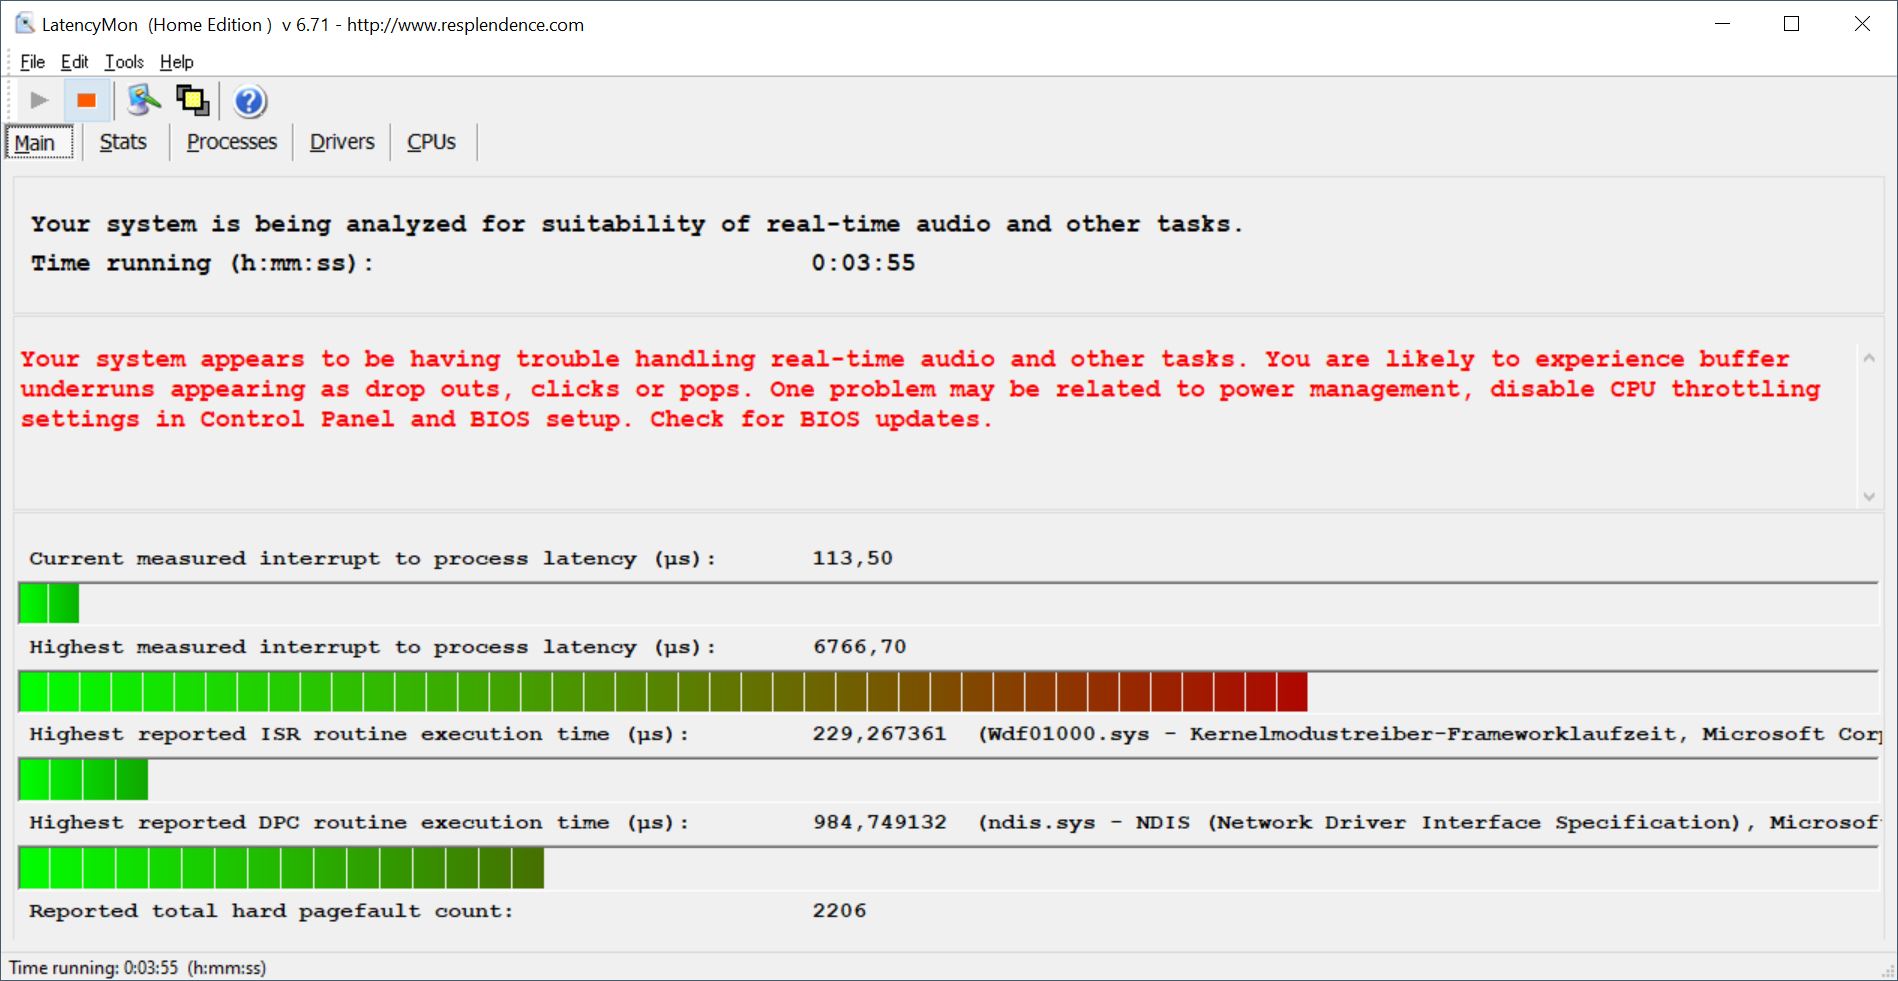
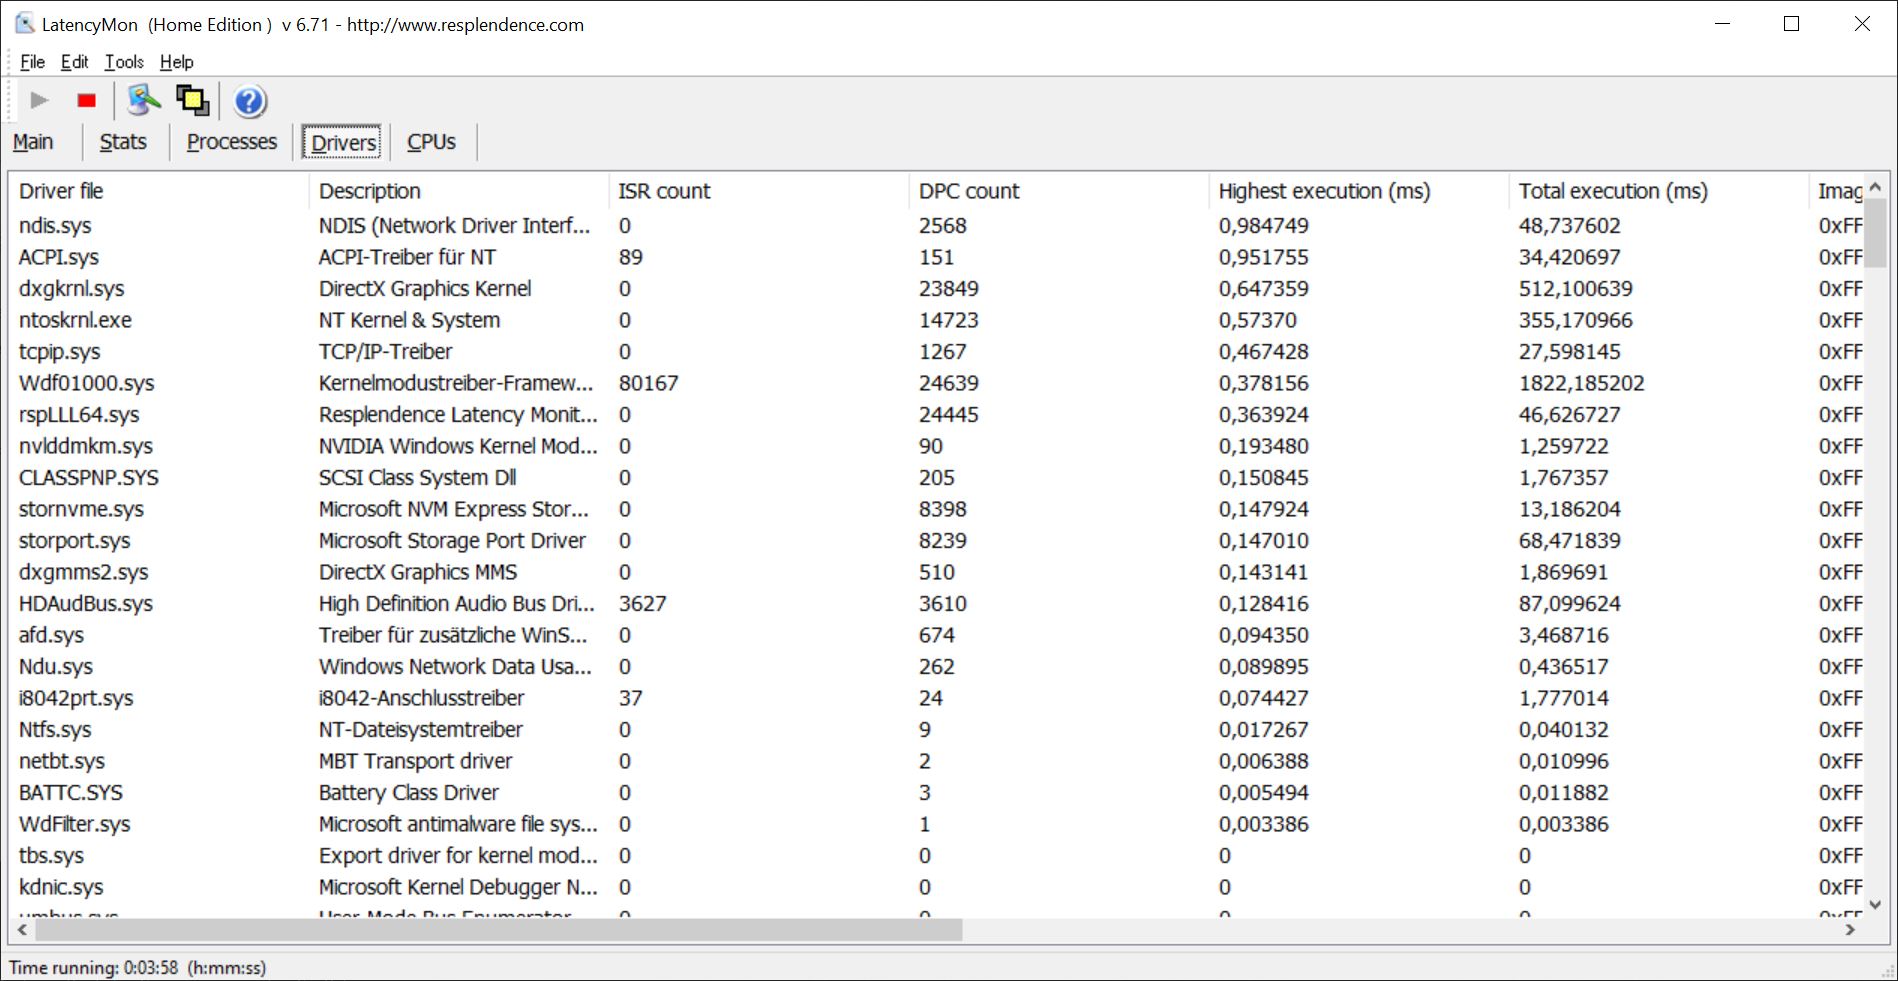
Latências DPC
Se abrirmos vários artigos do Notebookcheck.com em suas próprias abas, o NEO 17 copia bem. A situação é diferente quando reproduzimos nosso vídeo de teste 4K/60 fps no YouTube. O resultado é uma triste queda de 59 quadros, bem como um atraso bastante alto na renderização em tempo real, o que dá ao Schenker as piores taxas em comparação. Vários motoristas são os culpados; Schenker deve melhorar isto com uma atualização da BIOS
| DPC Latencies / LatencyMon - interrupt to process latency (max), Web, Youtube, Prime95 | |
| Schenker XMG NEO 17 GM7TG8S | |
| Schenker XMG Neo 17 (Early 2021, RTX 3070, 5800H) | |
| Asus ROG Zephyrus S17 GX703HSD | |
| Aorus 17G YD | |
| Medion Erazer Beast X25 | |
| Asus Strix Scar 17 G733QSA-XS99 | |
* ... menor é melhor
Armazenamento em massa
Schenker instala um Samsung SSD 980 Pro com 1 TB de espaço de armazenamento, que está no topo do nosso Tabela HDD/SSD. Por conseguinte, também supera a maioria dos concorrentes em termos de velocidade. Somente o Samsung PM9A1 no Asus ROG Zephyrus é ainda um pouco mais rápido
| Schenker XMG NEO 17 GM7TG8S Samsung SSD 980 Pro 1TB MZ-V8P1T0BW | Schenker XMG Neo 17 (Early 2021, RTX 3070, 5800H) Samsung SSD 970 EVO Plus 500GB | Aorus 17G YD Samsung PM9A1 MZVL2512HCJQ | Medion Erazer Beast X25 Samsung PM9A1 MZVL22T0HBLB | Asus ROG Zephyrus S17 GX703HSD Samsung PM9A1 MZVL22T0HBLB | Asus Strix Scar 17 G733QSA-XS99 2x Samsung PM981a MZVLB1T0HBLR (RAID 0) | Média Samsung SSD 980 Pro 1TB MZ-V8P1T0BW | |
|---|---|---|---|---|---|---|---|
| CrystalDiskMark 5.2 / 6 | -29% | -13% | -37% | 0% | -6% | 0% | |
| Write 4K (MB/s) | 225.9 | 206.1 -9% | 227.4 1% | 129.7 -43% | 244.2 8% | 235.9 4% | 220 ? -3% |
| Read 4K (MB/s) | 90.3 | 53 -41% | 91.3 1% | 62.4 -31% | 89.8 -1% | 48.02 -47% | 85.1 ? -6% |
| Write Seq (MB/s) | 4289 | 3018 -30% | 2241 -48% | 2436 -43% | 4822 12% | 3911 ? -9% | |
| Read Seq (MB/s) | 4228 | 2575 -39% | 4496 6% | 2354 -44% | 5043 19% | 3999 ? -5% | |
| Write 4K Q32T1 (MB/s) | 626 | 535 -15% | 661 6% | 512 -18% | 607 -3% | 625 0% | 551 ? -12% |
| Read 4K Q32T1 (MB/s) | 685 | 608 -11% | 712 4% | 436.2 -36% | 658 -4% | 392.3 -43% | 977 ? 43% |
| Write Seq Q32T1 (MB/s) | 5184 | 3242 -37% | 1540 -70% | 3541 -32% | 5270 2% | 5350 3% | 4932 ? -5% |
| Read Seq Q32T1 (MB/s) | 7088 | 3617 -49% | 6806 -4% | 3568 -50% | 7091 0% | 7130 1% | 6842 ? -3% |
| Write 4K Q8T8 (MB/s) | 2270 | 1390 ? | |||||
| Read 4K Q8T8 (MB/s) | 2490 | 2134 ? | |||||
| AS SSD | -34% | -23% | -39% | 10% | -26% | -19% | |
| Seq Read (MB/s) | 5223 | 3020 -42% | 5150 -1% | 2591 -50% | 5085 -3% | 4981 -5% | 4838 ? -7% |
| Seq Write (MB/s) | 3922 | 2631 -33% | 3920 0% | 1900 -52% | 4434 13% | 3050 -22% | 3490 ? -11% |
| 4K Read (MB/s) | 82.2 | 60.3 -27% | 46.6 -43% | 53.9 -34% | 80.3 -2% | 57 -31% | 72 ? -12% |
| 4K Write (MB/s) | 207.6 | 171.6 -17% | 145.8 -30% | 112.6 -46% | 214.7 3% | 261.3 26% | 188.8 ? -9% |
| 4K-64 Read (MB/s) | 2439 | 1410 -42% | 2071 -15% | 1335 -45% | 2573 5% | 1205 -51% | 2234 ? -8% |
| 4K-64 Write (MB/s) | 2652 | 2324 -12% | 3267 23% | 2966 12% | 2972 12% | 1290 -51% | 2622 ? -1% |
| Access Time Read * (ms) | 0.022 | 0.045 -105% | 0.078 -255% | 0.038 -73% | 0.018 18% | 0.032 -45% | 0.04075 ? -85% |
| Access Time Write * (ms) | 0.021 | 0.024 -14% | 0.029 -38% | 0.036 -71% | 0.02 5% | 0.044 -110% | 0.03363 ? -60% |
| Score Read (Points) | 3044 | 1773 -42% | 2633 -14% | 1648 -46% | 3161 4% | 1760 -42% | 2811 ? -8% |
| Score Write (Points) | 3252 | 2759 -15% | 2805 -14% | 3269 1% | 3631 12% | 1857 -43% | 3159 ? -3% |
| Score Total (Points) | 7794 | 5429 -30% | 7716 -1% | 5733 -26% | 8380 8% | 4428 -43% | 7334 ? -6% |
| Copy ISO MB/s (MB/s) | 3221 | 3190 -1% | 3239 1% | 3357 4% | 2688 ? -17% | ||
| Copy Program MB/s (MB/s) | 1151 | 987 -14% | 899 -22% | 966 -16% | 568 ? -51% | ||
| Copy Game MB/s (MB/s) | 1194 | 2096 76% | 2171 82% | 2051 72% | 1346 ? 13% | ||
| Média Total (Programa/Configurações) | -32% /
-32% | -18% /
-20% | -38% /
-38% | 5% /
7% | -16% /
-19% | -10% /
-12% |
* ... menor é melhor

Continuous load read: DiskSpd Read Loop, Queue Depth 8
Placa gráfica
No Neo, os gráficos integrados Intel Xe funcionam primeiro, enquanto os fortesNvidia GeForce RTX 3080 GPU para laptop espera por tarefas exigentes. Você pode desativar a Nvidia Optimus e assim a GPU integrada no Centro de Controle, o que pode resultar em mais alguns fps devido à conexão direta sem redirecionamento de sinal para a iGPU. Recomendável: Schenker passa ao cliente a opção TGP da GPU liberada pela Nvidia. Isto significa que os usuários podem atribuir o TGP máximo de 165 W (incluindo 15 W Turbo Boost) a seu NEO no Centro de Controle.
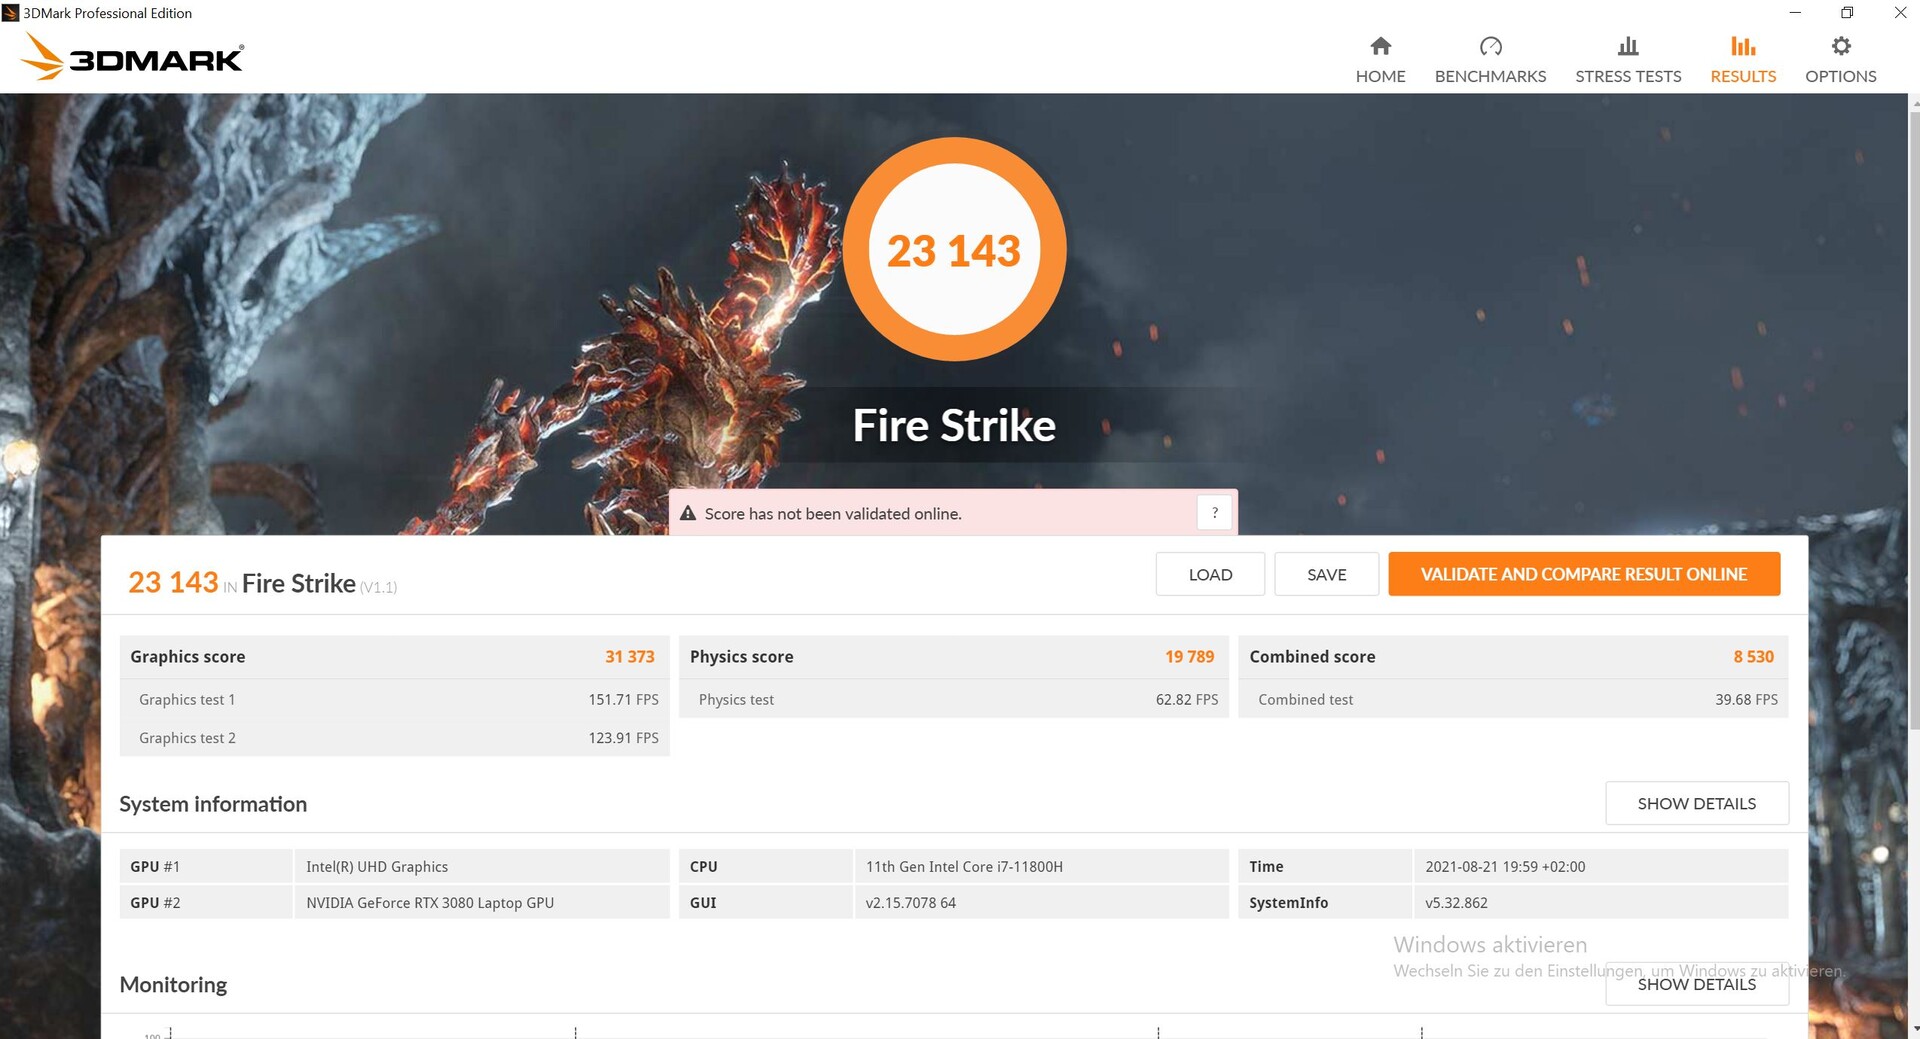
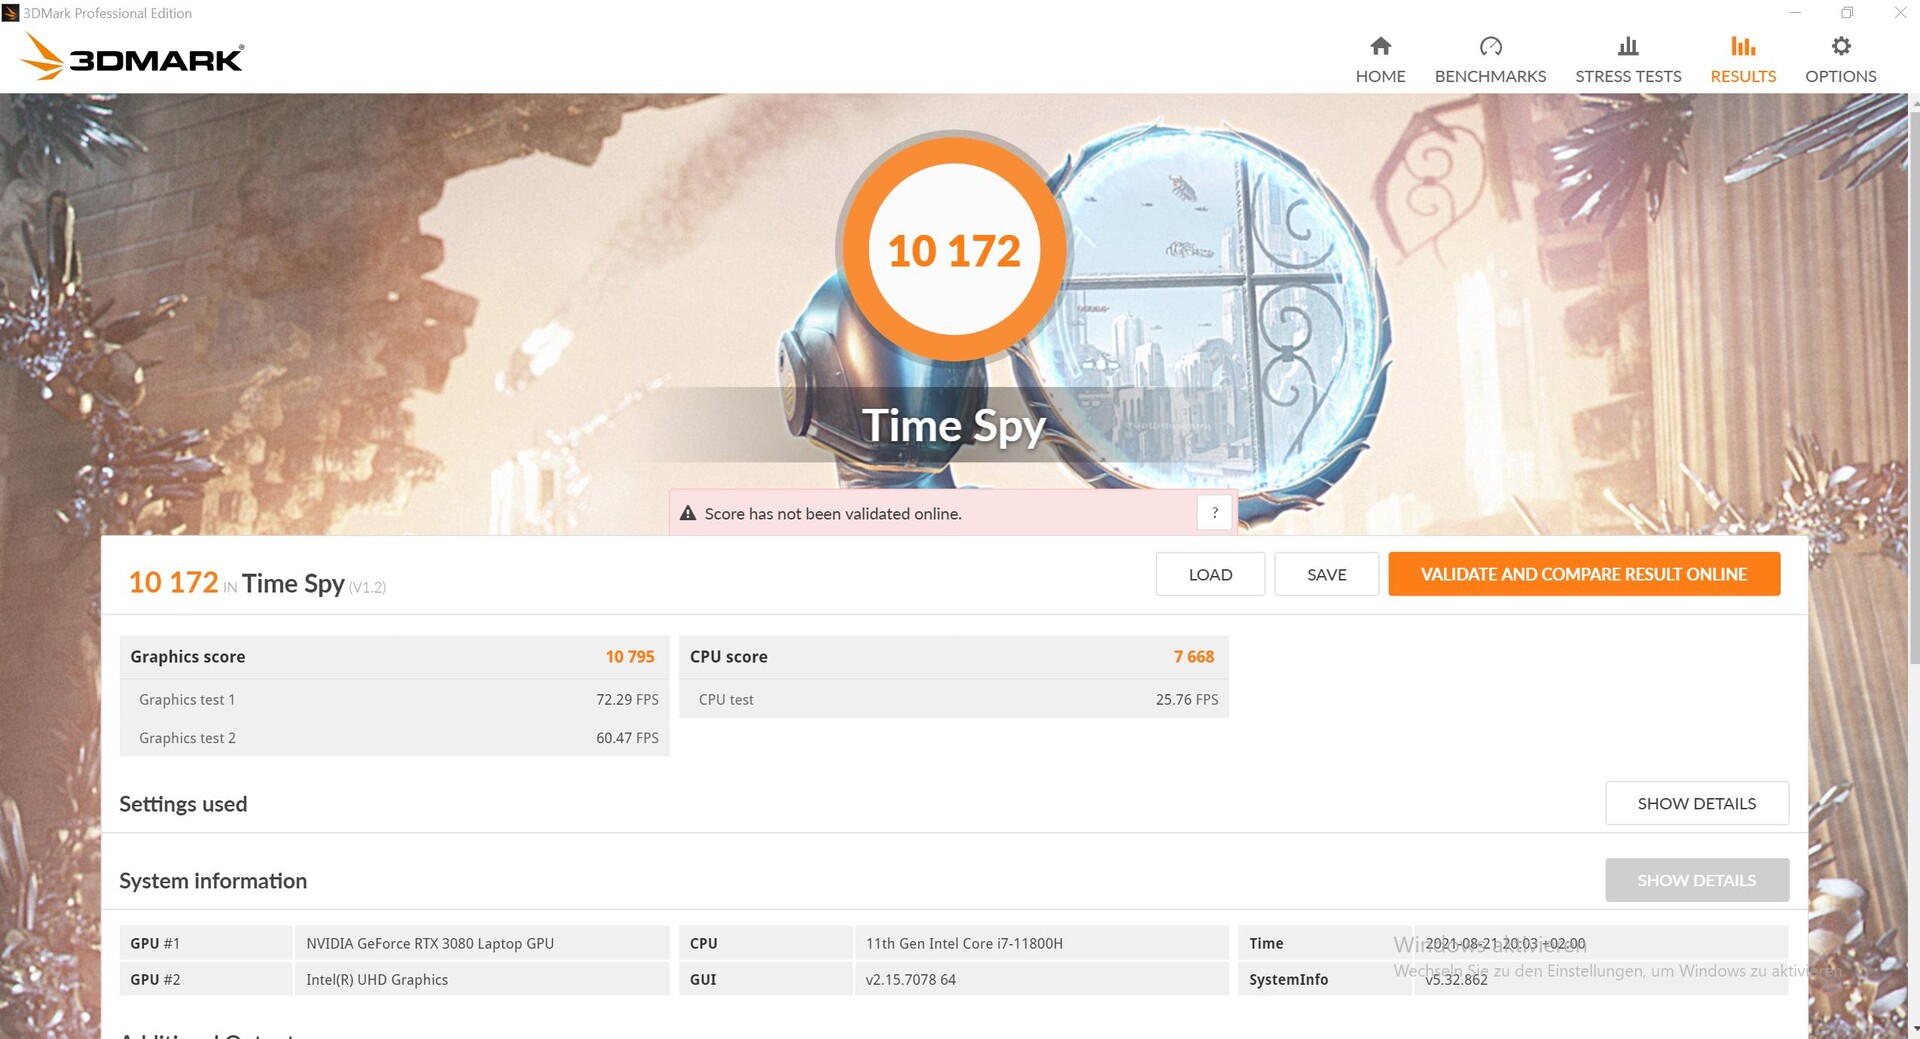
Nosso NEO também assume a liderança no 3DMark 11, por exemplo, bem como no teste 3DMark's Fire Strike. Entretanto, o laptop tem um desempenho um pouco abaixo da média em Time Spy e Cloud Gate. No geral, podemos ver que o desempenho do RTX 3080 é muito alto
Outro 3DMark 11 executado em modo de bateria revela uma perda de desempenho de cerca de 64%!
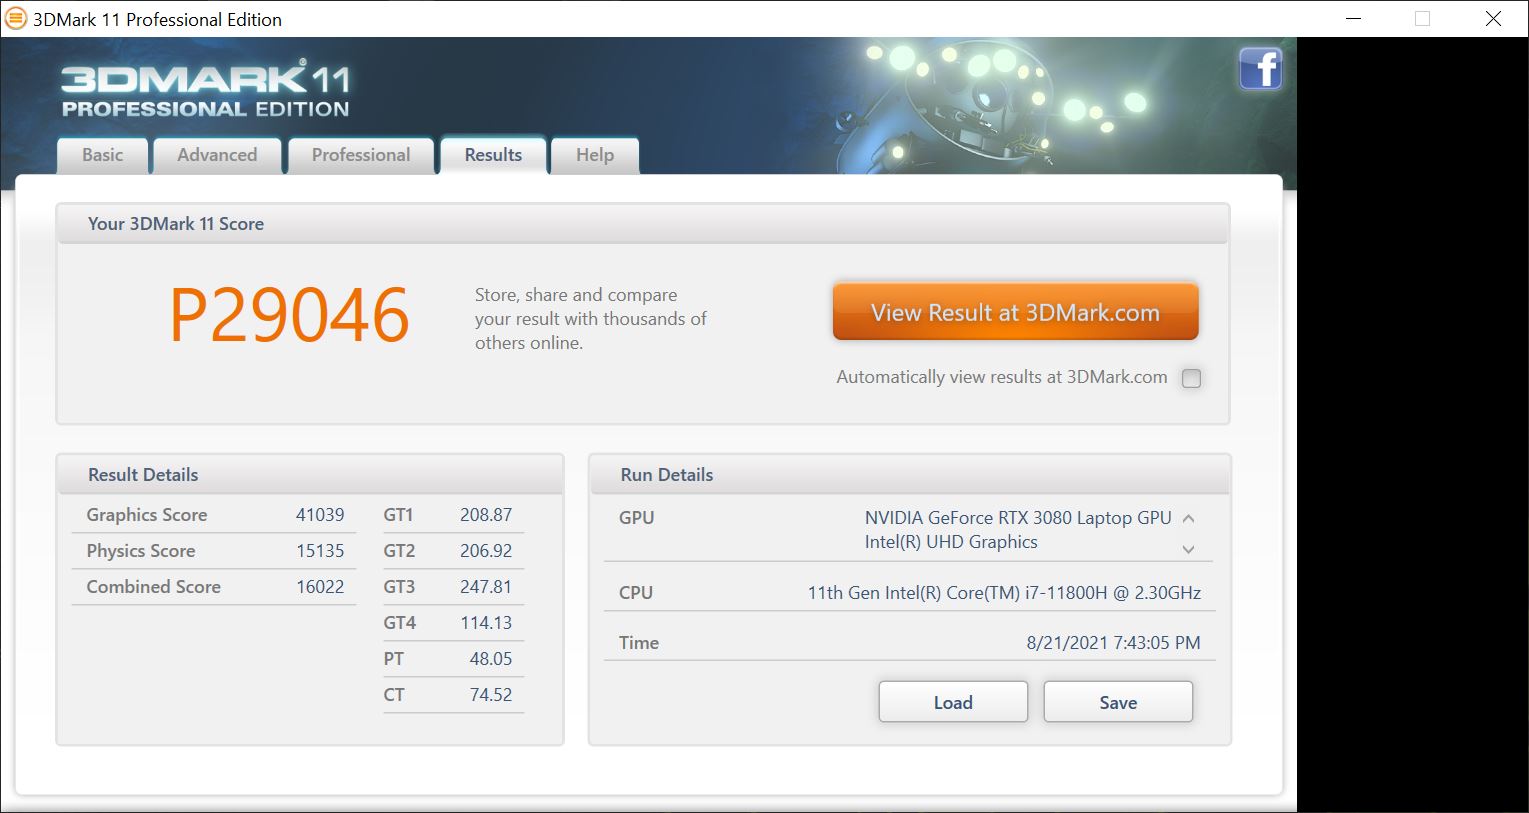

| 3DMark 11 Performance | 29046 pontos | |
| 3DMark Cloud Gate Standard Score | 40008 pontos | |
| 3DMark Fire Strike Score | 23143 pontos | |
| 3DMark Time Spy Score | 10172 pontos | |
Ajuda | ||
Desempenho do jogo
Nos vários benchmarks de jogos, o NEO ocupa o primeiro lugar de forma quase consistente graças à sua forte GPU, com o RTX 3080 executando cerca de 10% acima de todos os modelos que testamos. O Zephyrus é seu concorrente mais forte e muitas vezes chega muito perto do NEO, embora o RTX 3080 no Zephyrus tenha apenas um TGP de 140W. Portanto, embora o NEO esteja frequentemente no topo, o desempenho poderia ser um pouco melhor.
| Shadow of the Tomb Raider | |
| 1920x1080 Lowest Preset | |
| Schenker XMG NEO 17 GM7TG8S | |
| Média NVIDIA GeForce RTX 3080 Laptop GPU (117 - 178.7, n=8) | |
| Asus ROG Zephyrus S17 GX703HSD | |
| 1920x1080 Medium Preset | |
| Schenker XMG NEO 17 GM7TG8S | |
| Asus ROG Zephyrus S17 GX703HSD | |
| Média NVIDIA GeForce RTX 3080 Laptop GPU (81.6 - 164, n=12) | |
| 1920x1080 High Preset AA:SM | |
| Asus ROG Zephyrus S17 GX703HSD | |
| Schenker XMG NEO 17 GM7TG8S | |
| Média NVIDIA GeForce RTX 3080 Laptop GPU (79.4 - 160, n=13) | |
| Média da turma Gaming (107 - 127, n=2, últimos 2 anos) | |
| 1920x1080 Highest Preset AA:T | |
| Schenker XMG NEO 17 GM7TG8S | |
| Asus ROG Zephyrus S17 GX703HSD | |
| Média NVIDIA GeForce RTX 3080 Laptop GPU (76.6 - 151, n=13) | |
| Média da turma Gaming (96 - 116, n=2, últimos 2 anos) | |
| 2560x1440 Highest Preset AA:T | |
| Schenker XMG NEO 17 GM7TG8S | |
| Asus ROG Zephyrus S17 GX703HSD | |
| Média NVIDIA GeForce RTX 3080 Laptop GPU (79 - 113, n=7) | |
Ao analisar o Witcher 3 durante um período de uma hora, é perceptível que o fps cai ligeiramente, mas continuamente ao longo do tempo. Assim, o estrangulamento é definitivamente visto durante uma carga prolongada
Witcher 3 FPS-Diagram
| baixo | média | alto | ultra | QHD | |
|---|---|---|---|---|---|
| GTA V (2015) | 185 | 182 | 176 | 112 | |
| The Witcher 3 (2015) | 418 | 329 | 210 | 113 | |
| Dota 2 Reborn (2015) | 179 | 157 | 141.5 | 134.7 | |
| X-Plane 11.11 (2018) | 132 | 118 | 88.9 | ||
| Far Cry 5 (2018) | 168 | 143 | 137 | 127 | 112 |
| Strange Brigade (2018) | 535 | 305 | 247 | 218 | |
| Shadow of the Tomb Raider (2018) | 170 | 150 | 131 | 132 | 113 |
Emissões - Ruído irritante
Emissões sonoras
Mesmo no modo overboost, os ventiladores muitas vezes permanecem em silêncio enquanto ociosos. Entretanto, se uma carga fosse aplicada antes, os ventiladores ainda rugem silenciosamente por um longo tempo em inatividade subseqüente. Sob carga, o desenvolvimento do ruído é comparável ao da concorrência, mas 55 dB(A) é claramente irritante para todos eles, apenas o Zephyrus permanece um pouco mais silencioso sob carga total.
Entretanto, há ruídos perturbadores temporários. Um ruído eletrônico um tanto mais alto ocorre temporariamente quando certas cargas são aplicadas, como o 3DMark ou jogos, mas depois desaparecem novamente. Estes ruídos eram mais gritantes no Zephyrus, mas também são irritantes aqui porque parecem desnecessários
Barulho
| Ocioso |
| 23 / 23 / 23 dB |
| Carga |
| 39.5 / 55.09 dB |
 | ||
30 dB silencioso 40 dB(A) audível 50 dB(A) ruidosamente alto |
||
min: | ||
| Schenker XMG NEO 17 GM7TG8S GeForce RTX 3080 Laptop GPU, i7-11800H, Samsung SSD 980 Pro 1TB MZ-V8P1T0BW | Schenker XMG Neo 17 (Early 2021, RTX 3070, 5800H) GeForce RTX 3070 Laptop GPU, R7 5800H, Samsung SSD 970 EVO Plus 500GB | Aorus 17G YD GeForce RTX 3080 Laptop GPU, i7-11800H, Samsung PM9A1 MZVL2512HCJQ | Medion Erazer Beast X25 GeForce RTX 3080 Laptop GPU, R9 5900HX, Samsung PM9A1 MZVL22T0HBLB | Asus ROG Zephyrus S17 GX703HSD GeForce RTX 3080 Laptop GPU, i9-11900H, Samsung PM9A1 MZVL22T0HBLB | Asus Strix Scar 17 G733QSA-XS99 GeForce RTX 3080 Laptop GPU, R9 5900HX, 2x Samsung PM981a MZVLB1T0HBLR (RAID 0) | |
|---|---|---|---|---|---|---|
| Noise | -22% | -25% | -24% | 3% | -1% | |
| desligado / ambiente * (dB) | 23 | 24 -4% | 25 -9% | 25 -9% | 23 -0% | 25 -9% |
| Idle Minimum * (dB) | 23 | 29 -26% | 32 -39% | 26 -13% | 23 -0% | 25.2 -10% |
| Idle Average * (dB) | 23 | 32 -39% | 33 -43% | 30 -30% | 23 -0% | 25.2 -10% |
| Idle Maximum * (dB) | 23 | 38 -65% | 39 -70% | 43 -87% | 23 -0% | 25.2 -10% |
| Load Average * (dB) | 39.5 | 49 -24% | 43 -9% | 54 -37% | 41 -4% | 30.7 22% |
| Witcher 3 ultra * (dB) | 54.5 | 53 3% | 52 5% | 52 5% | 45 17% | 51.3 6% |
| Load Maximum * (dB) | 55.09 | 55 -0% | 61 -11% | 55 -0% | 52 6% | 51.3 7% |
* ... menor é melhor
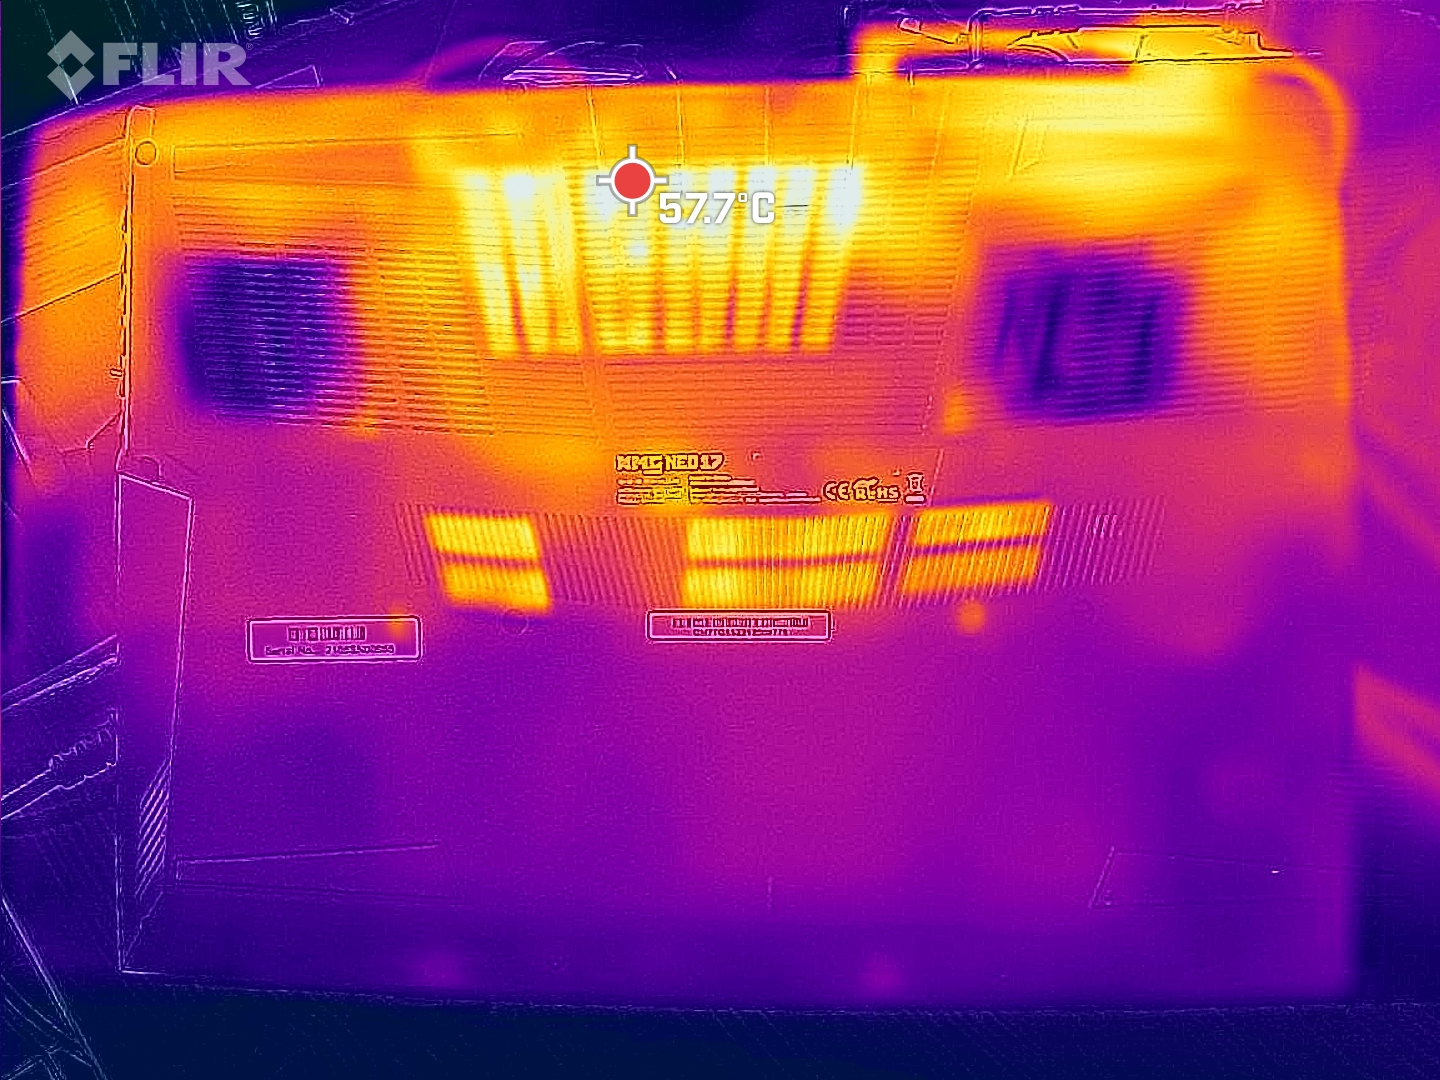
Temperatura
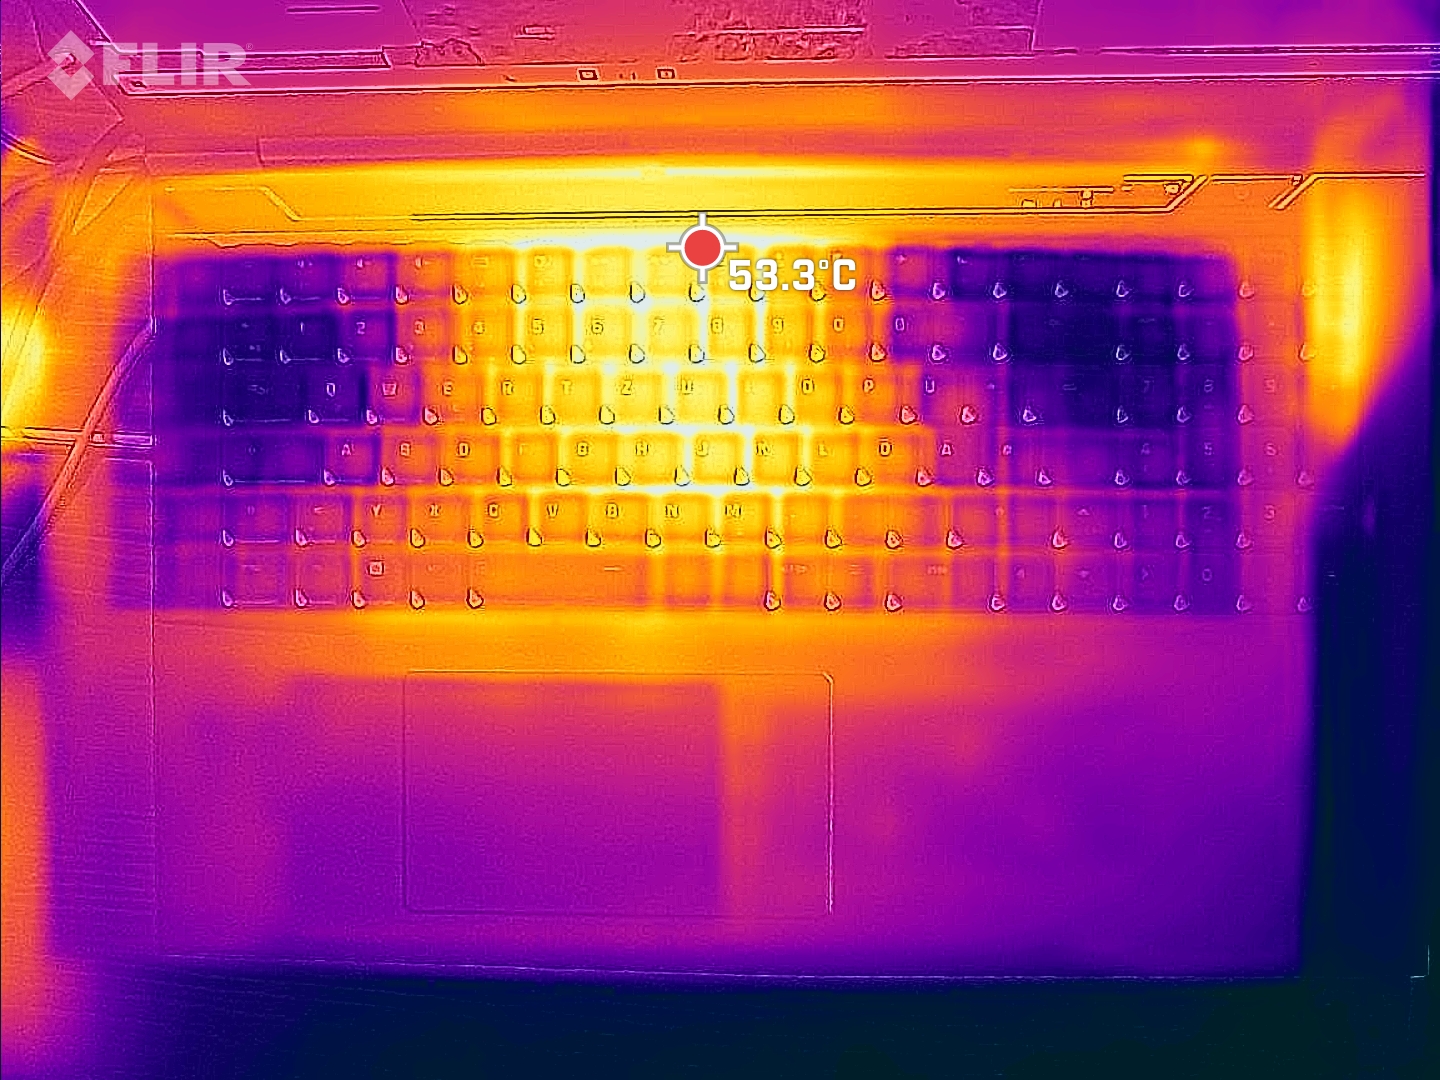
Pontos quentes de mais de 60 °C (140 °F) podem se desenvolver na parte inferior sob carga total, o que torna o NEO um pouco mais quente do que a maioria dos rivais. Ele fica especialmente quente no centro e em direção à tela, mas felizmente o descanso da palma permanece sempre frio. A área chave WASD aquece até cerca de 41 °C(105,8°F) ao jogar Witcher 3. Especialmente o Aorus ou o Asus Strix Scar permanecem mais frios sob carga
(-) A temperatura máxima no lado superior é 51 °C / 124 F, em comparação com a média de 40.4 °C / 105 F , variando de 21.2 a 68.8 °C para a classe Gaming.
(-) A parte inferior aquece até um máximo de 62 °C / 144 F, em comparação com a média de 43.2 °C / 110 F
(+) Em uso inativo, a temperatura média para o lado superior é 30.9 °C / 88 F, em comparação com a média do dispositivo de 33.9 °C / ### class_avg_f### F.
(-) Jogando The Witcher 3, a temperatura média para o lado superior é 39.6 °C / 103 F, em comparação com a média do dispositivo de 33.9 °C / ## #class_avg_f### F.
(±) Os apoios para as mãos e o touchpad podem ficar muito quentes ao toque, com um máximo de 37 °C / 98.6 F.
(-) A temperatura média da área do apoio para as mãos de dispositivos semelhantes foi 28.8 °C / 83.8 F (-8.2 °C / -14.8 F).
| Schenker XMG NEO 17 GM7TG8S GeForce RTX 3080 Laptop GPU, i7-11800H, Samsung SSD 980 Pro 1TB MZ-V8P1T0BW | Schenker XMG Neo 17 (Early 2021, RTX 3070, 5800H) GeForce RTX 3070 Laptop GPU, R7 5800H, Samsung SSD 970 EVO Plus 500GB | Aorus 17G YD GeForce RTX 3080 Laptop GPU, i7-11800H, Samsung PM9A1 MZVL2512HCJQ | Medion Erazer Beast X25 GeForce RTX 3080 Laptop GPU, R9 5900HX, Samsung PM9A1 MZVL22T0HBLB | Asus ROG Zephyrus S17 GX703HSD GeForce RTX 3080 Laptop GPU, i9-11900H, Samsung PM9A1 MZVL22T0HBLB | Asus Strix Scar 17 G733QSA-XS99 GeForce RTX 3080 Laptop GPU, R9 5900HX, 2x Samsung PM981a MZVLB1T0HBLR (RAID 0) | |
|---|---|---|---|---|---|---|
| Heat | 10% | 19% | 3% | 2% | 15% | |
| Maximum Upper Side * (°C) | 51 | 47 8% | 36 29% | 54 -6% | 59 -16% | 40 22% |
| Maximum Bottom * (°C) | 62 | 51 18% | 52 16% | 57 8% | 53 15% | 39.8 36% |
| Idle Upper Side * (°C) | 35 | 32 9% | 29 17% | 34 3% | 35 -0% | 34.6 1% |
| Idle Bottom * (°C) | 38 | 37 3% | 33 13% | 35 8% | 35 8% | 38.4 -1% |
* ... menor é melhor
Os núcleos da CPU começam nosso teste de estresse com cerca de 4,2 GHz. O relógio flutua fortemente e é apenas 2,3 GHz no final, que é o relógio de base. O estrangulamento térmico é assim bastante pronunciado ao longo do tempo no NEO, o que provavelmente se deve também ao fato de que concedemos ao RTX 3080 o TGP máximo. Aqui, os usuários devem testar um bom compromisso entre o TDP da CPU, o TGP da GPU e o desenvolvimento do calor. Esta necessidade de testar é um dos inconvenientes das liberdades, de outra forma agradáveis, do NEO 17.
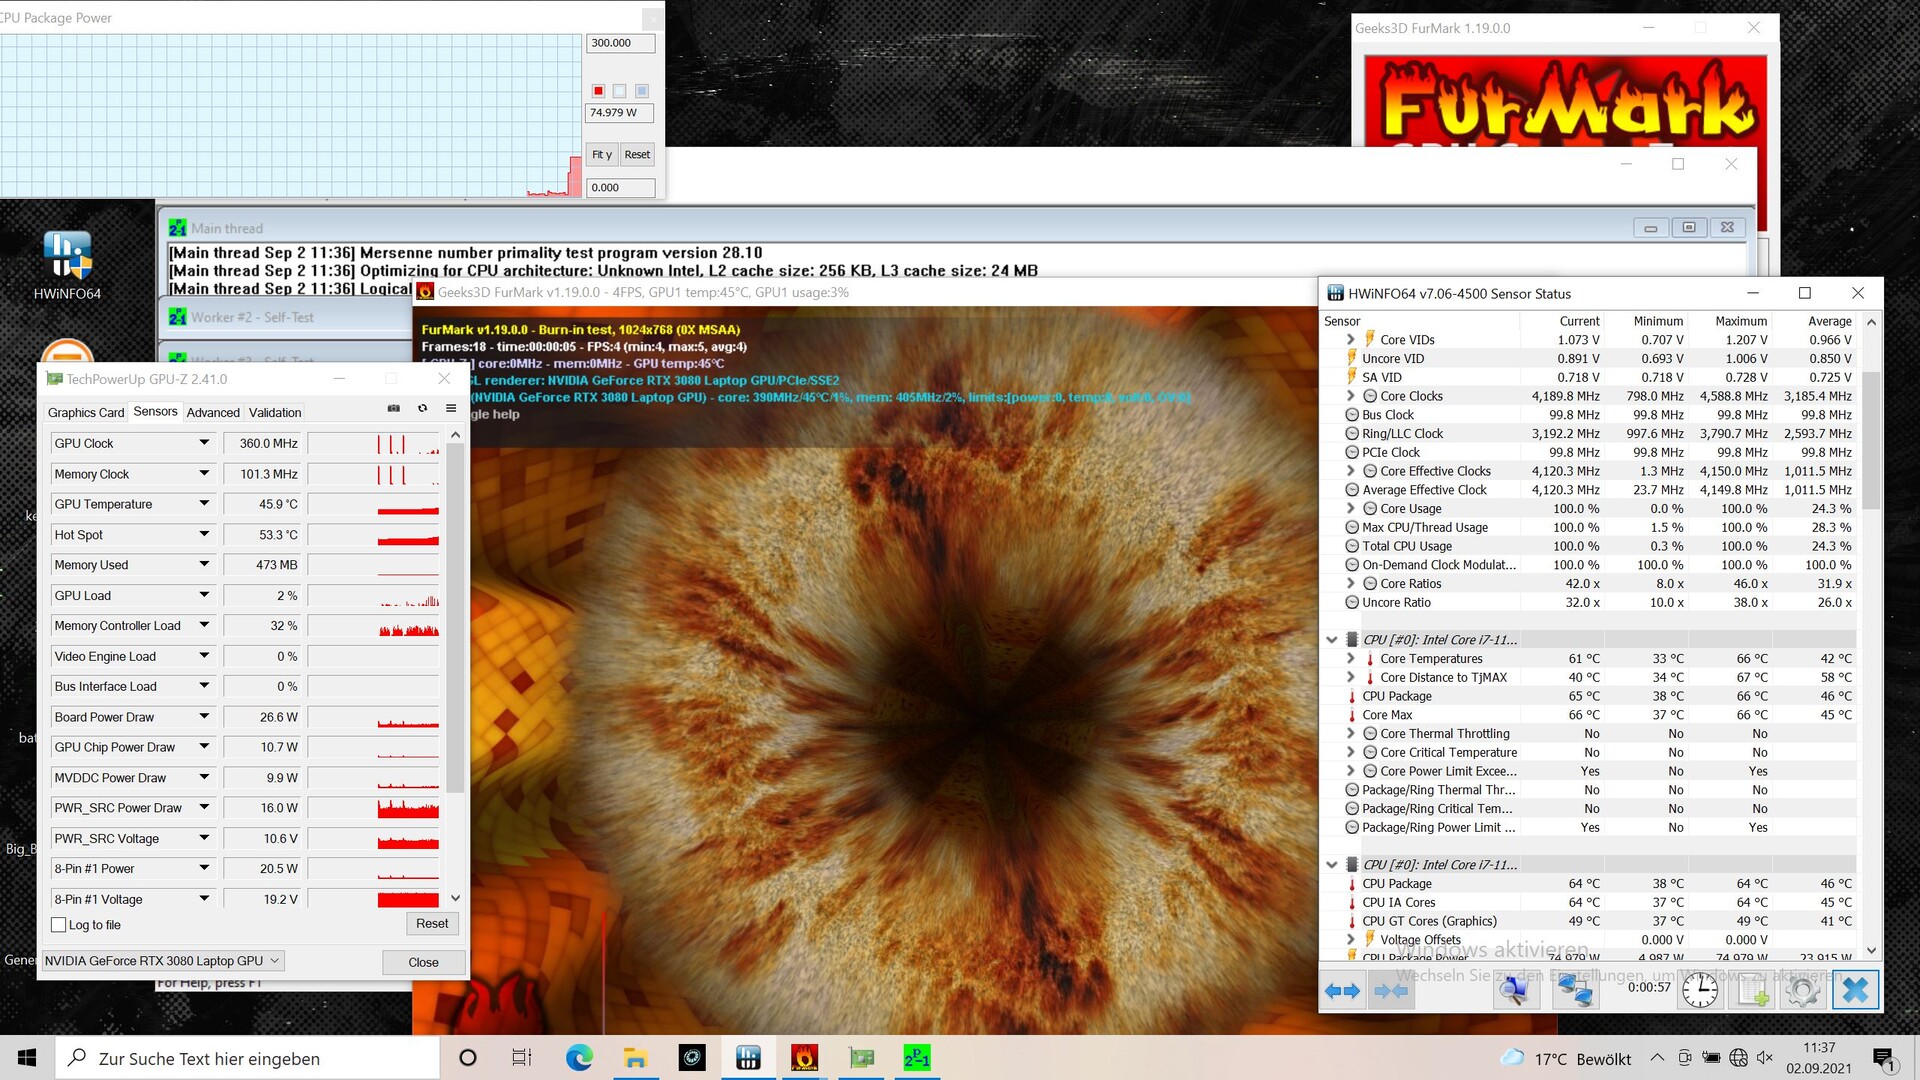
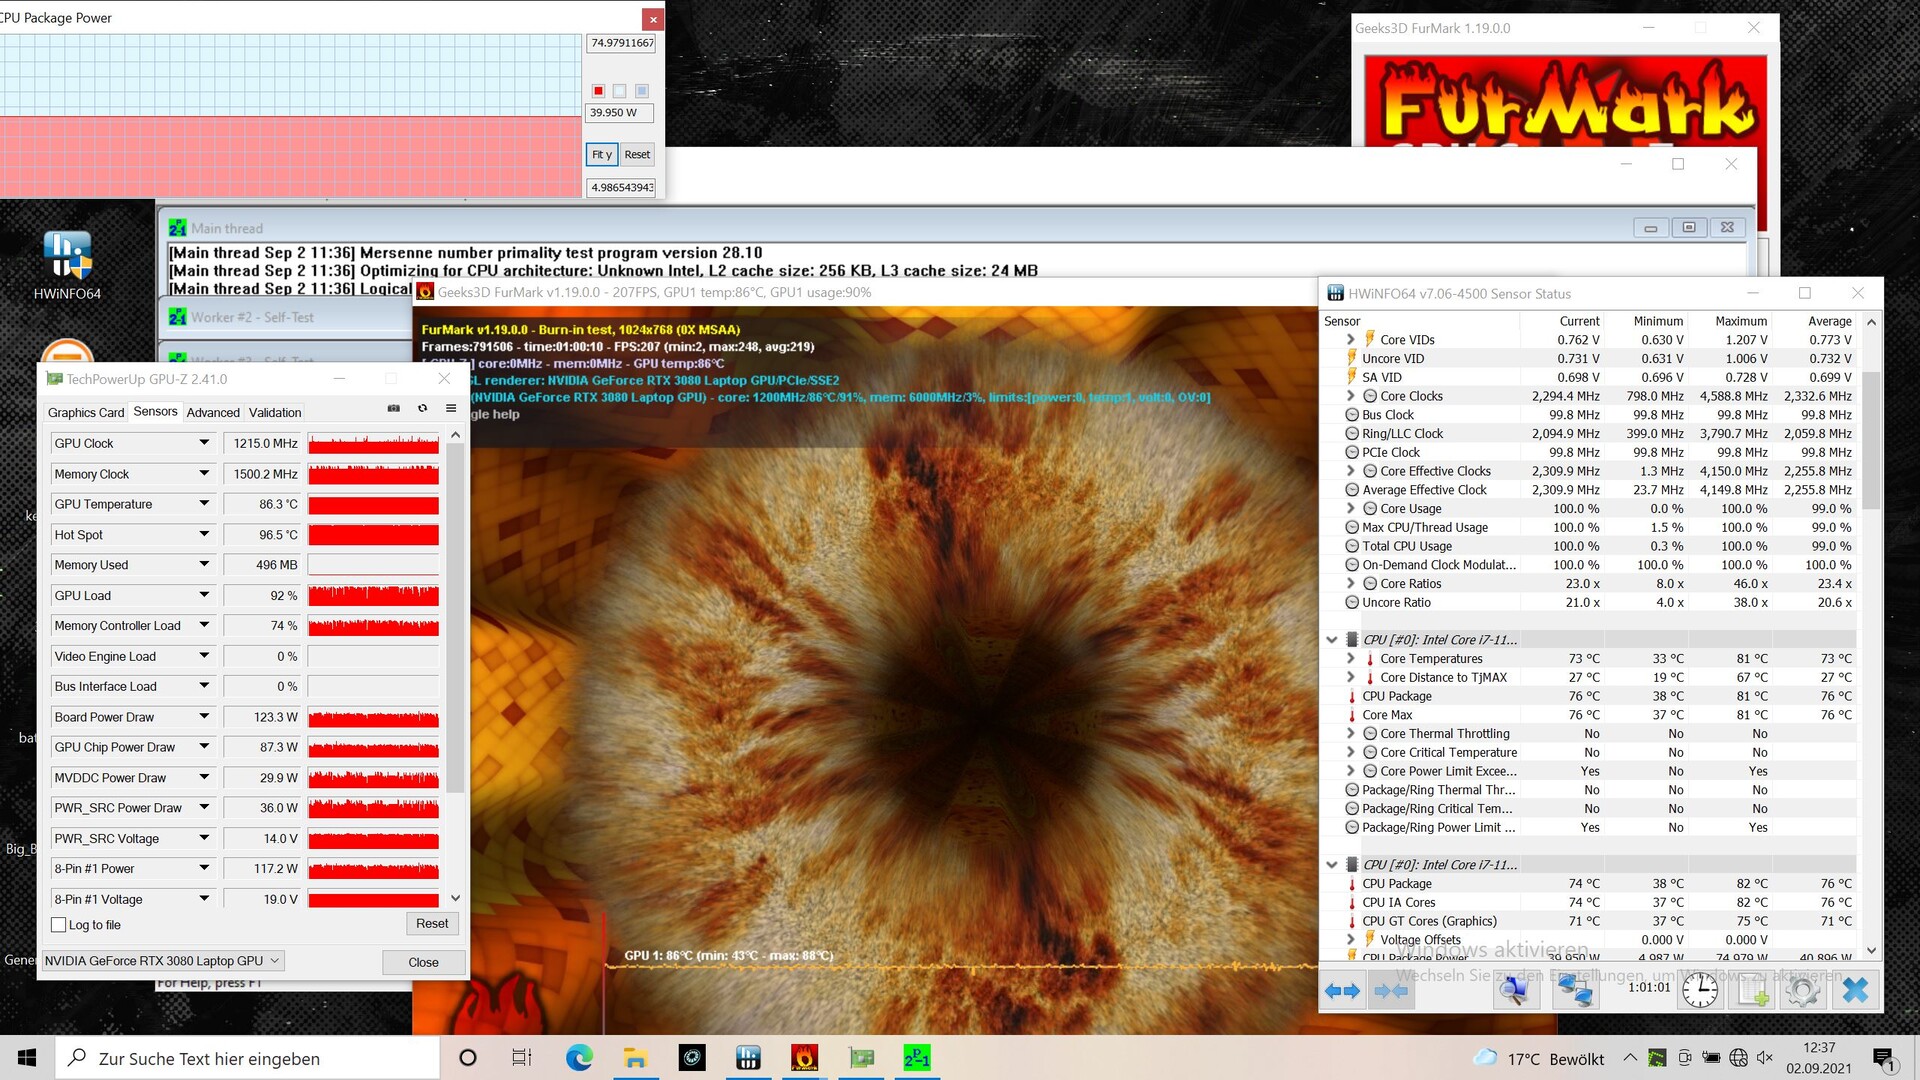
O NEO ainda tem algum espaço para melhorias em termos de temperaturas centrais, que são de apenas 73 °C(163,4°F) após uma hora de testes, com um máximo de apenas 81 °C(177,8°F)
O relógio GPU cai de 1.485 MHz no início para 1.215 MHz no final. O núcleo aquece até cerca de 86 °C(186,8°F), e o limite térmico é atingido a 87 °C(188,6°F).
Orador
Os alto-falantes já estão entre os melhores no campo dos alto-falantes para notebook. Eles são bastante barulhentos e produzem uma gama média e aguda equilibrada. É claro que o baixo é um pouco mais baixo, mas comparado com muitos outros alto-falantes, o baixo se encontra. No geral, a impressão de audição é positiva em comparação. Entretanto, o equipamento externo deve ser usado para um verdadeiro prazer de áudio. Uma entrada de microfone separada e uma saída de fone de ouvido estão disponíveis para conexões analógicas
Schenker XMG NEO 17 GM7TG8S análise de áudio
(±) | o volume do alto-falante é médio, mas bom (###valor### dB)
Graves 100 - 315Hz
(±) | graves reduzidos - em média 13.7% menor que a mediana
(±) | a linearidade dos graves é média (12.5% delta para a frequência anterior)
Médios 400 - 2.000 Hz
(±) | médios mais altos - em média 5.3% maior que a mediana
(+) | médios são lineares (6.2% delta para frequência anterior)
Altos 2 - 16 kHz
(+) | agudos equilibrados - apenas 2.8% longe da mediana
(+) | os máximos são lineares (5.7% delta da frequência anterior)
Geral 100 - 16.000 Hz
(+) | o som geral é linear (14.8% diferença em relação à mediana)
Comparado com a mesma classe
» 30% de todos os dispositivos testados nesta classe foram melhores, 7% semelhantes, 63% piores
» O melhor teve um delta de 6%, a média foi 18%, o pior foi 132%
Comparado com todos os dispositivos testados
» 20% de todos os dispositivos testados foram melhores, 4% semelhantes, 76% piores
» O melhor teve um delta de 4%, a média foi 23%, o pior foi 134%
Apple MacBook 12 (Early 2016) 1.1 GHz análise de áudio
(+) | os alto-falantes podem tocar relativamente alto (###valor### dB)
Graves 100 - 315Hz
(±) | graves reduzidos - em média 11.3% menor que a mediana
(±) | a linearidade dos graves é média (14.2% delta para a frequência anterior)
Médios 400 - 2.000 Hz
(+) | médios equilibrados - apenas 2.4% longe da mediana
(+) | médios são lineares (5.5% delta para frequência anterior)
Altos 2 - 16 kHz
(+) | agudos equilibrados - apenas 2% longe da mediana
(+) | os máximos são lineares (4.5% delta da frequência anterior)
Geral 100 - 16.000 Hz
(+) | o som geral é linear (10.2% diferença em relação à mediana)
Comparado com a mesma classe
» 7% de todos os dispositivos testados nesta classe foram melhores, 2% semelhantes, 90% piores
» O melhor teve um delta de 5%, a média foi 18%, o pior foi 53%
Comparado com todos os dispositivos testados
» 5% de todos os dispositivos testados foram melhores, 1% semelhantes, 94% piores
» O melhor teve um delta de 4%, a média foi 23%, o pior foi 134%
Gestão de energia - frugal ao ocioso, desperdício durante os jogos
Consumo de energia
Em todos os cenários, o NEO 17 é relativamente frugal, sendo que apenas o Asus Strix consome menos. Entretanto, o consumo é relativamente alto nos jogos, o que provavelmente se deve ao RTX liberado e normalmente coloca o NEO em primeiro lugar em termos de fps.
Medimos picos de consumo muito curtos de pouco mais de 230 W no teste de estresse. No entanto, como o consumo médio é de 226 W mesmo neste cenário de carga extrema, a fonte de energia de 230 W deve realmente ser suficientemente dimensionada
| Ocioso | |
| Carga |
|
Key:
min: | |
| Schenker XMG NEO 17 GM7TG8S i7-11800H, GeForce RTX 3080 Laptop GPU, Samsung SSD 980 Pro 1TB MZ-V8P1T0BW, IPS, 2560x1440, 17.3" | Schenker XMG Neo 17 (Early 2021, RTX 3070, 5800H) R7 5800H, GeForce RTX 3070 Laptop GPU, Samsung SSD 970 EVO Plus 500GB, IPS, 2560x1440, 17.3" | Aorus 17G YD i7-11800H, GeForce RTX 3080 Laptop GPU, Samsung PM9A1 MZVL2512HCJQ, IPS, 1920x1080, 17.3" | Medion Erazer Beast X25 R9 5900HX, GeForce RTX 3080 Laptop GPU, Samsung PM9A1 MZVL22T0HBLB, IPS, 1920x1080, 17.3" | Asus ROG Zephyrus S17 GX703HSD i9-11900H, GeForce RTX 3080 Laptop GPU, Samsung PM9A1 MZVL22T0HBLB, IPS, 2560x1440, 17.3" | Asus Strix Scar 17 G733QSA-XS99 R9 5900HX, GeForce RTX 3080 Laptop GPU, 2x Samsung PM981a MZVLB1T0HBLR (RAID 0), IPS, 1920x1080, 17.3" | Média NVIDIA GeForce RTX 3080 Laptop GPU | Média da turma Gaming | |
|---|---|---|---|---|---|---|---|---|
| Power Consumption | 10% | -6% | -7% | -4% | 17% | -5% | 10% | |
| Idle Minimum * (Watt) | 19 | 13 32% | 24 -26% | 22 -16% | 21.7 -14% | 10.9 43% | 19.8 ? -4% | 13 ? 32% |
| Idle Average * (Watt) | 25 | 16 36% | 26 -4% | 26 -4% | 27 -8% | 14.7 41% | 24.3 ? 3% | 19 ? 24% |
| Idle Maximum * (Watt) | 28 | 26 7% | 38 -36% | 34 -21% | 33 -18% | 26.8 4% | 33.3 ? -19% | 24.6 ? 12% |
| Load Average * (Watt) | 105 | 125 -19% | 101 4% | 120 -14% | 108 -3% | 106.7 -2% | 108.1 ? -3% | 110.7 ? -5% |
| Witcher 3 ultra * (Watt) | 223 | 187 16% | 164 26% | 189 15% | 195 13% | 192.4 14% | ||
| Load Maximum * (Watt) | 226 | 259 -15% | 230 -2% | 231 -2% | 210 7% | 228.4 -1% | 230 ? -2% | 259 ? -15% |
* ... menor é melhor
Energy consumption Witcher 3 / Stress test
Duração da bateria
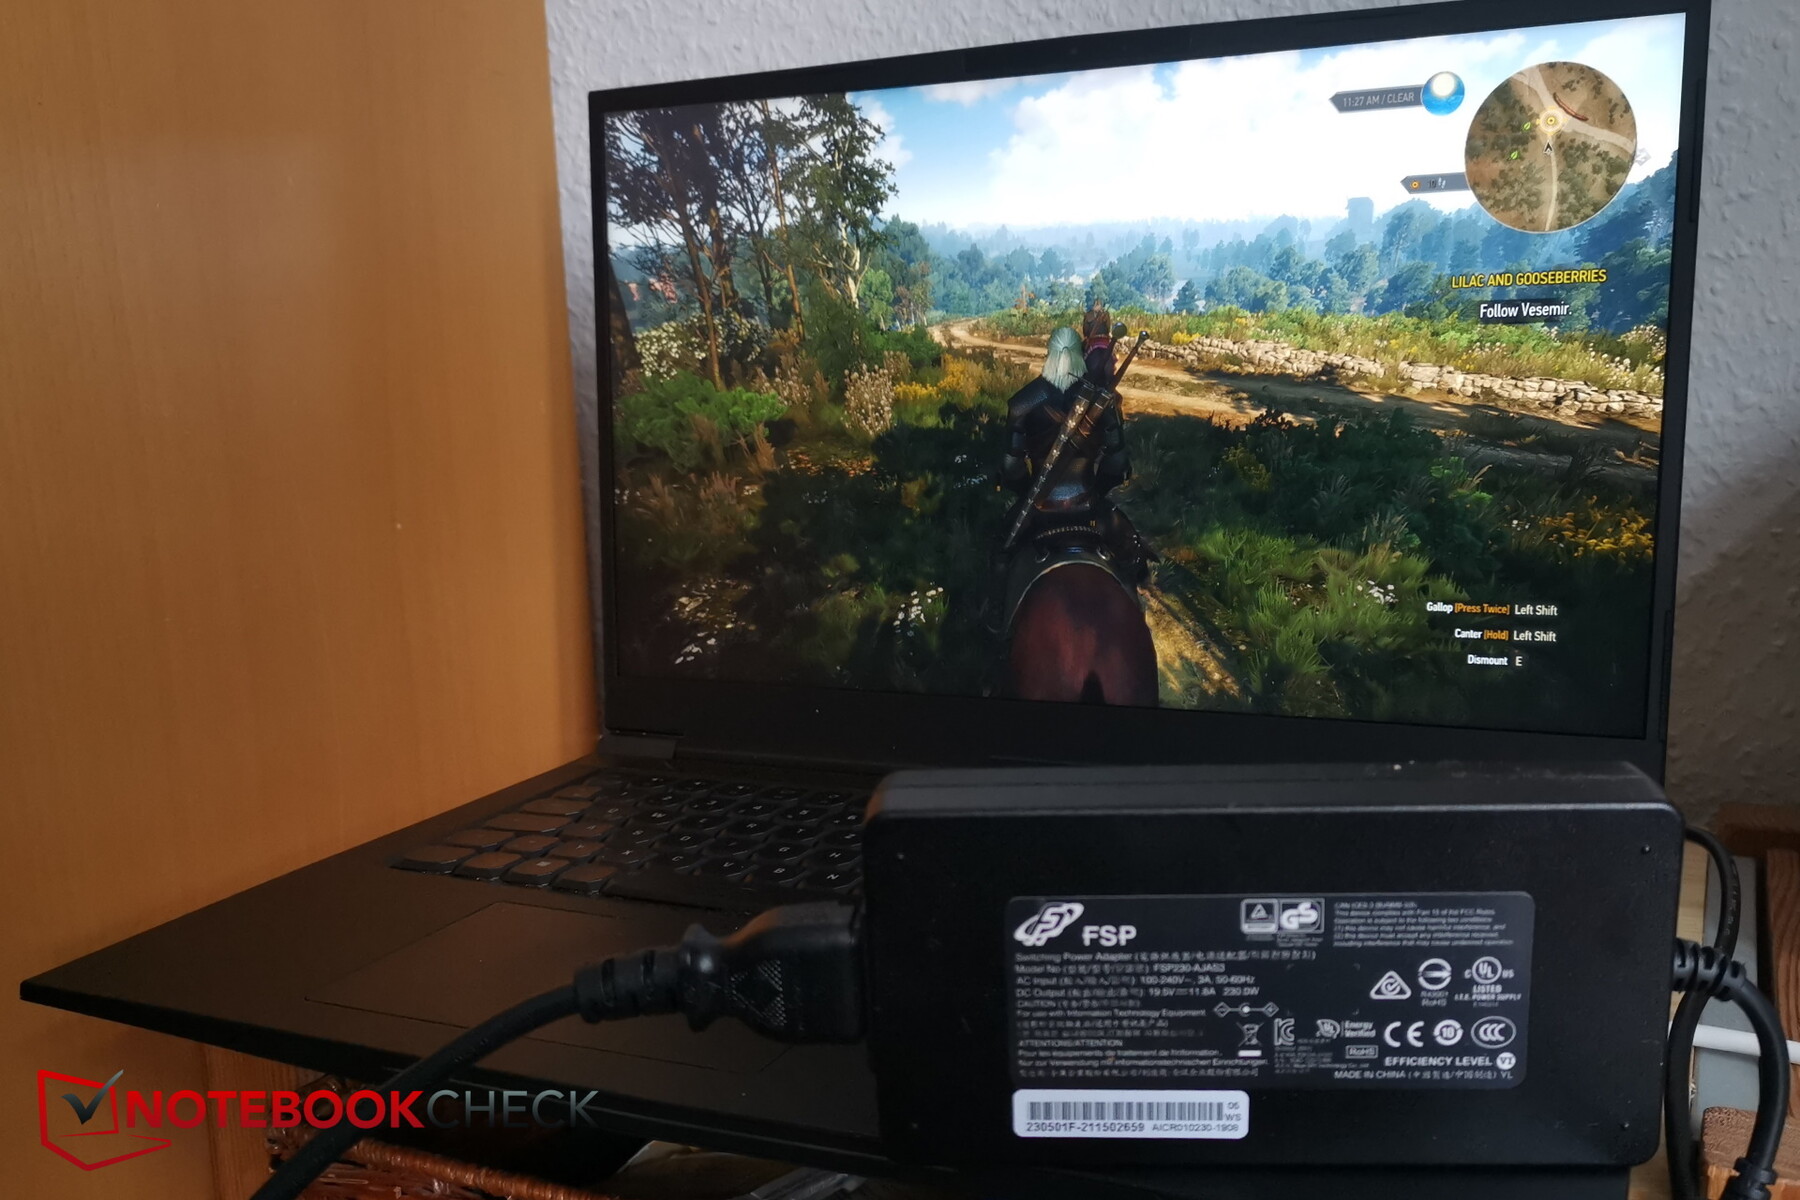
Schenker economiza em bateria e só instala uma capacidade de 62 Wh. Isso é muito pouco para um jogador tão faminto de desempenho. A competição utiliza pelo menos 90 Wh, e isso também é perceptível nos tempos de corrida. Os rivais duram quase o dobro do tempo no teste de Wi-Fi e vídeo! A duração do NEO é de apenas 3 horas e 45 minutos. Ao contrário dos benchmarks de desempenho, ativamos novamente o Optimus e voltamos ao modo balanceado no Centro de Controle em vez de Overboost
| Schenker XMG NEO 17 GM7TG8S i7-11800H, GeForce RTX 3080 Laptop GPU, 62 Wh | Schenker XMG Neo 17 (Early 2021, RTX 3070, 5800H) R7 5800H, GeForce RTX 3070 Laptop GPU, 62 Wh | Aorus 17G YD i7-11800H, GeForce RTX 3080 Laptop GPU, 99 Wh | Medion Erazer Beast X25 R9 5900HX, GeForce RTX 3080 Laptop GPU, 91 Wh | Asus ROG Zephyrus S17 GX703HSD i9-11900H, GeForce RTX 3080 Laptop GPU, 90 Wh | Asus Strix Scar 17 G733QSA-XS99 R9 5900HX, GeForce RTX 3080 Laptop GPU, 90 Wh | Média da turma Gaming | |
|---|---|---|---|---|---|---|---|
| Duração da bateria | -31% | 43% | 36% | 89% | 69% | 70% | |
| H.264 (h) | 3.7 | 6.2 68% | 7.2 95% | 8.32 ? 125% | |||
| WiFi v1.3 (h) | 3.7 | 3.5 -5% | 6 62% | 6.8 84% | 7.5 103% | 9.3 151% | 7.11 ? 92% |
| Load (h) | 1.6 | 0.7 -56% | 1.6 0% | 1.4 -13% | 2.7 69% | 1.4 -13% | 1.502 ? -6% |
| Reader / Idle (h) | 4.7 | 9 | 9.9 | 13.3 | 8.27 ? | ||
| Witcher 3 ultra (h) | 1 |
Pro
Contra
Veredicto - Configure-se
A vantagem do NEO é tanto uma maldição quanto uma bênção: Quase todos os parâmetros de desempenho podem ser definidos manualmente no software. Isto permite liberar o RTX 3080, por exemplo, atribuindo-lhe o TGP máximo. Os entusiastas de jogos provavelmente gostarão de personalizar o NEO 17 de acordo com suas necessidades e de espremer cada frame extra dele. Os não-gamers podem pelo menos usar perfis pré-definidos, mas podem ser sobrecarregados pelo equilíbrio manual do desempenho da CPU e da GPU no estojo fino.
Como tantas vezes, a versão AMD tem o melhor desempenho da CPU, mas o Thunderbolt é omitido. Infelizmente, os tempos de funcionamento da bateria não são muito competitivos para todas as configurações NEO-17, especialmente neste ponto de preço.
No entanto, não há nada a reclamar no resto do hardware. Além da CPU e GPU, o SSD, por exemplo, também está no topo.
O NEO 17 possui muitas opções de ajuste; quase todos os parâmetros de desempenho podem ser definidos manualmente no software. Há críticas para o mau tempo de funcionamento da bateria.
Preço e disponibilidade
A Schenker oferece um link para bestware.com onde nosso modelo de teste está atualmente disponível no configurador por por 2.721,98 euros (~$3.196)
Schenker XMG NEO 17 GM7TG8S
- 09/30/2021 v7 (old)
Christian Hintze
Price comparison
