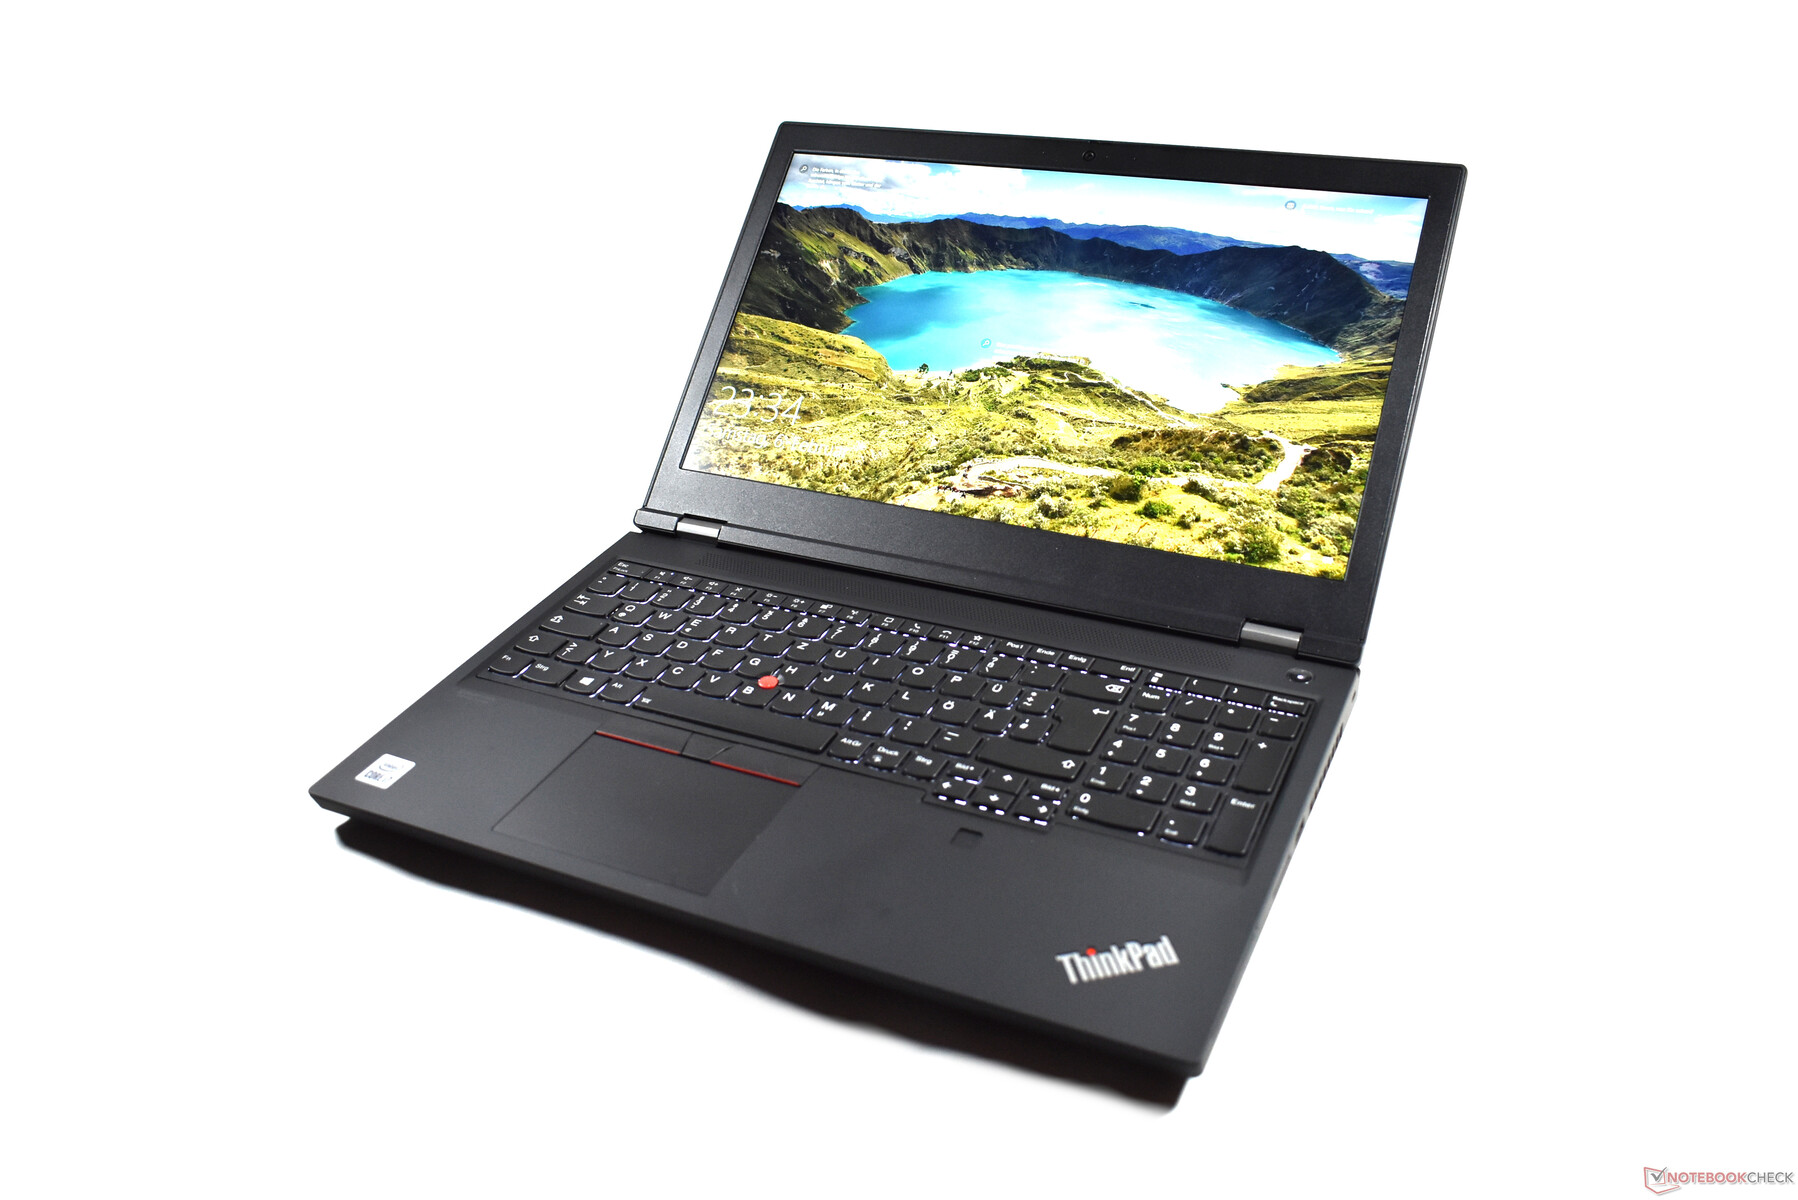
Lenovo ThinkPad P15 Gen 1 revisão de laptop: Estação de trabalho móvel com um ponto fraco no teclado
Quando a Lenovo introduziu o ThinkPad P50 no mercado em 2015, ele foi o primeiro modelo da nova série ThinkPad P, que deveria formar o ramo da estação de trabalho em vez da série W. Desde então, a Lenovo expandiu a série, mas as estações de trabalho clássicas ainda representam o núcleo do portfólio das estações de trabalho. O modelo de 15 polegadas do ano passado deste ramo foi chamado de Lenovo ThinkPad P53. O sucessor atual não se chama ThinkPad P54, mas LenovoThinkPad P15 Gen 1, seguindo o novo esquema de nomenclatura ThinkPad.
A Lenovo não está apenas introduzindo um novo esquema de nomenclatura com o ThinkPad P15, mas também um novo desenho de caso. Mas como ele compartilha a mesma construção com o Lenovo ThinkPad T15g Gen 1, não iremos relatar aqui os aspectos do design, características e dispositivos de entrada em detalhes. Você pode encontrar mais informações sobre estas áreas em nossarevisão do ThinkPadT15g
Possible competitors in our comparison
Avaliação | Data | Modelo | Peso | Altura | Size | Resolução | Preço |
|---|---|---|---|---|---|---|---|
| 85.6 % v7 (old) | 03/2021 | Lenovo ThinkPad P15 Gen1-20ST000DGE i7-10750H, Quadro T1000 (Laptop) | 2.7 kg | 31.45 mm | 15.60" | 1920x1080 | |
| 89.8 % v7 (old) | 11/2019 | Lenovo ThinkPad P53-20QN000YGE i7-9850H, Quadro RTX 5000 Max-Q | 2.7 kg | 29.4 mm | 15.60" | 1920x1080 | |
| 86.3 % v7 (old) | 03/2021 | Lenovo ThinkPad T15g-20UR000GGE i7-10750H, GeForce RTX 2070 Super Max-Q | 2.8 kg | 31.45 mm | 15.60" | 1920x1080 | |
| 86.6 % v7 (old) | 02/2021 | Lenovo ThinkPad T15p-20TN0006GE i7-10750H, GeForce GTX 1050 Mobile | 2.2 kg | 22.7 mm | 15.60" | 3840x2160 | |
| 87.8 % v7 (old) | 08/2020 | Dell Precision 7550 W-10885M, Quadro RTX 5000 Max-Q | 2.8 kg | 27.36 mm | 15.60" | 3840x2160 | |
| 90.2 % v7 (old) | 01/2021 | HP ZBook Fury 15 G7 W-10885M, Quadro RTX 5000 Max-Q | 2.4 kg | 25.9 mm | 15.60" | 3840x2160 |
Mudanças mais importantes do ThinkPad P53 da Lenovo
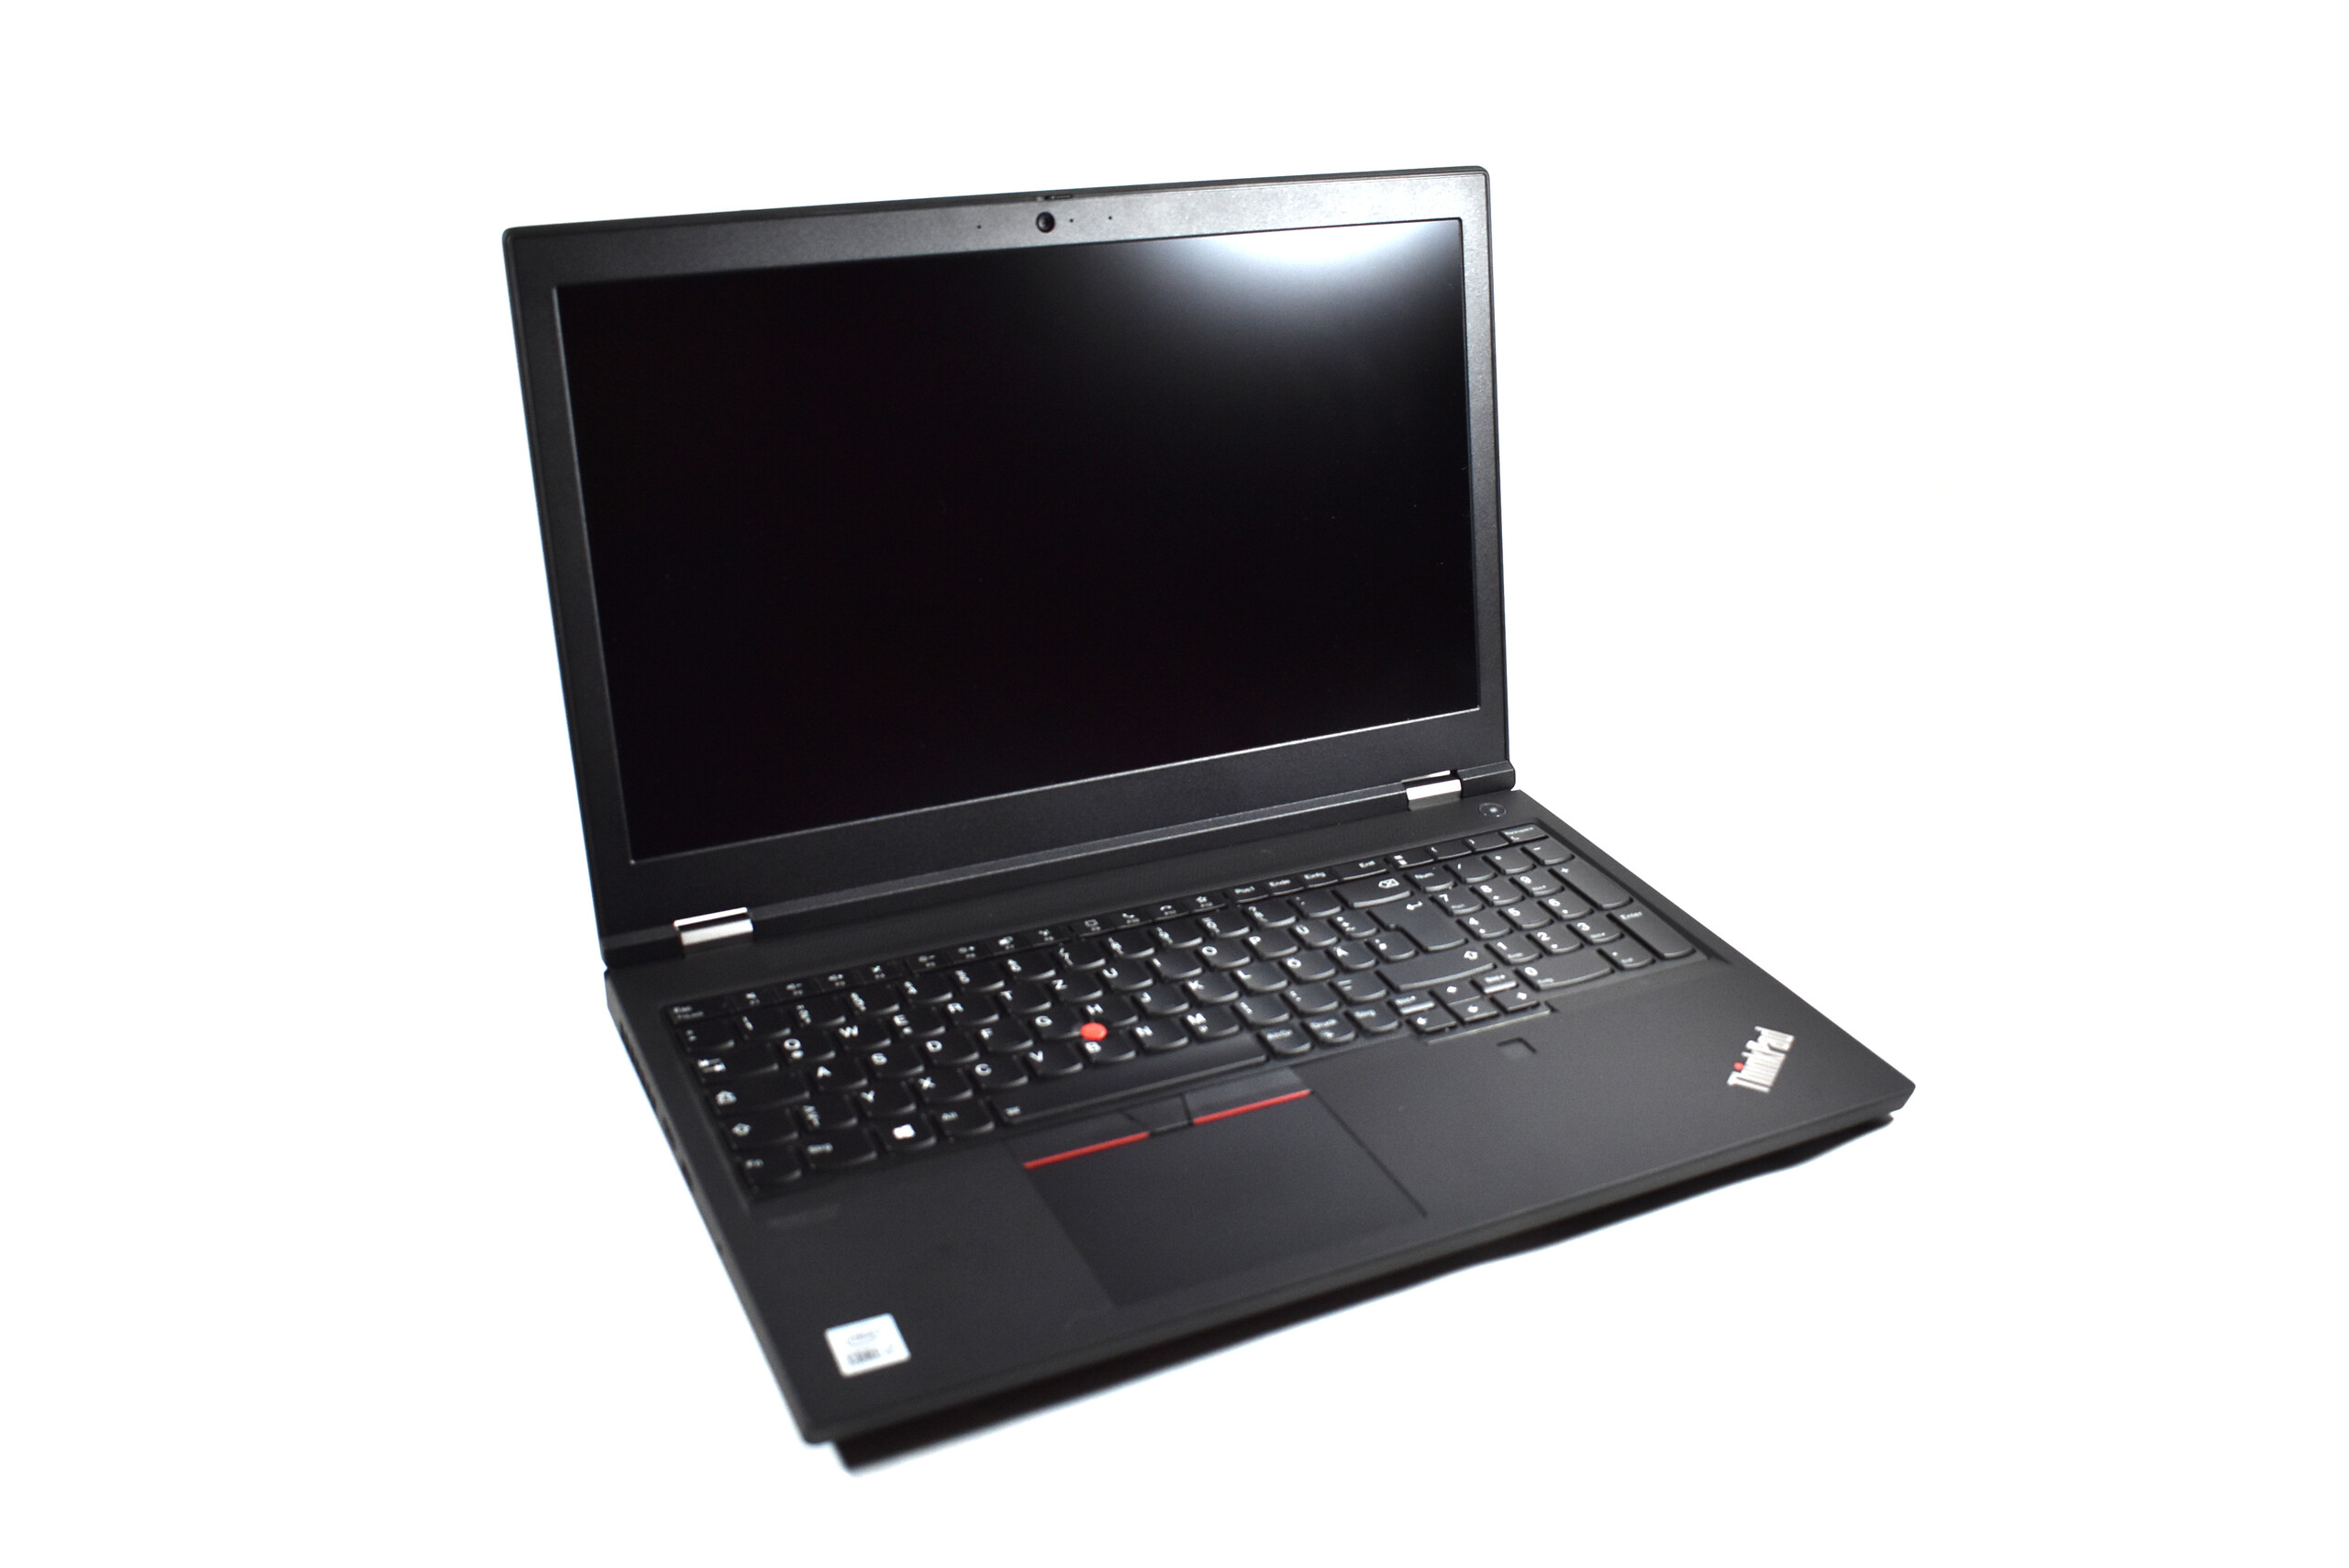
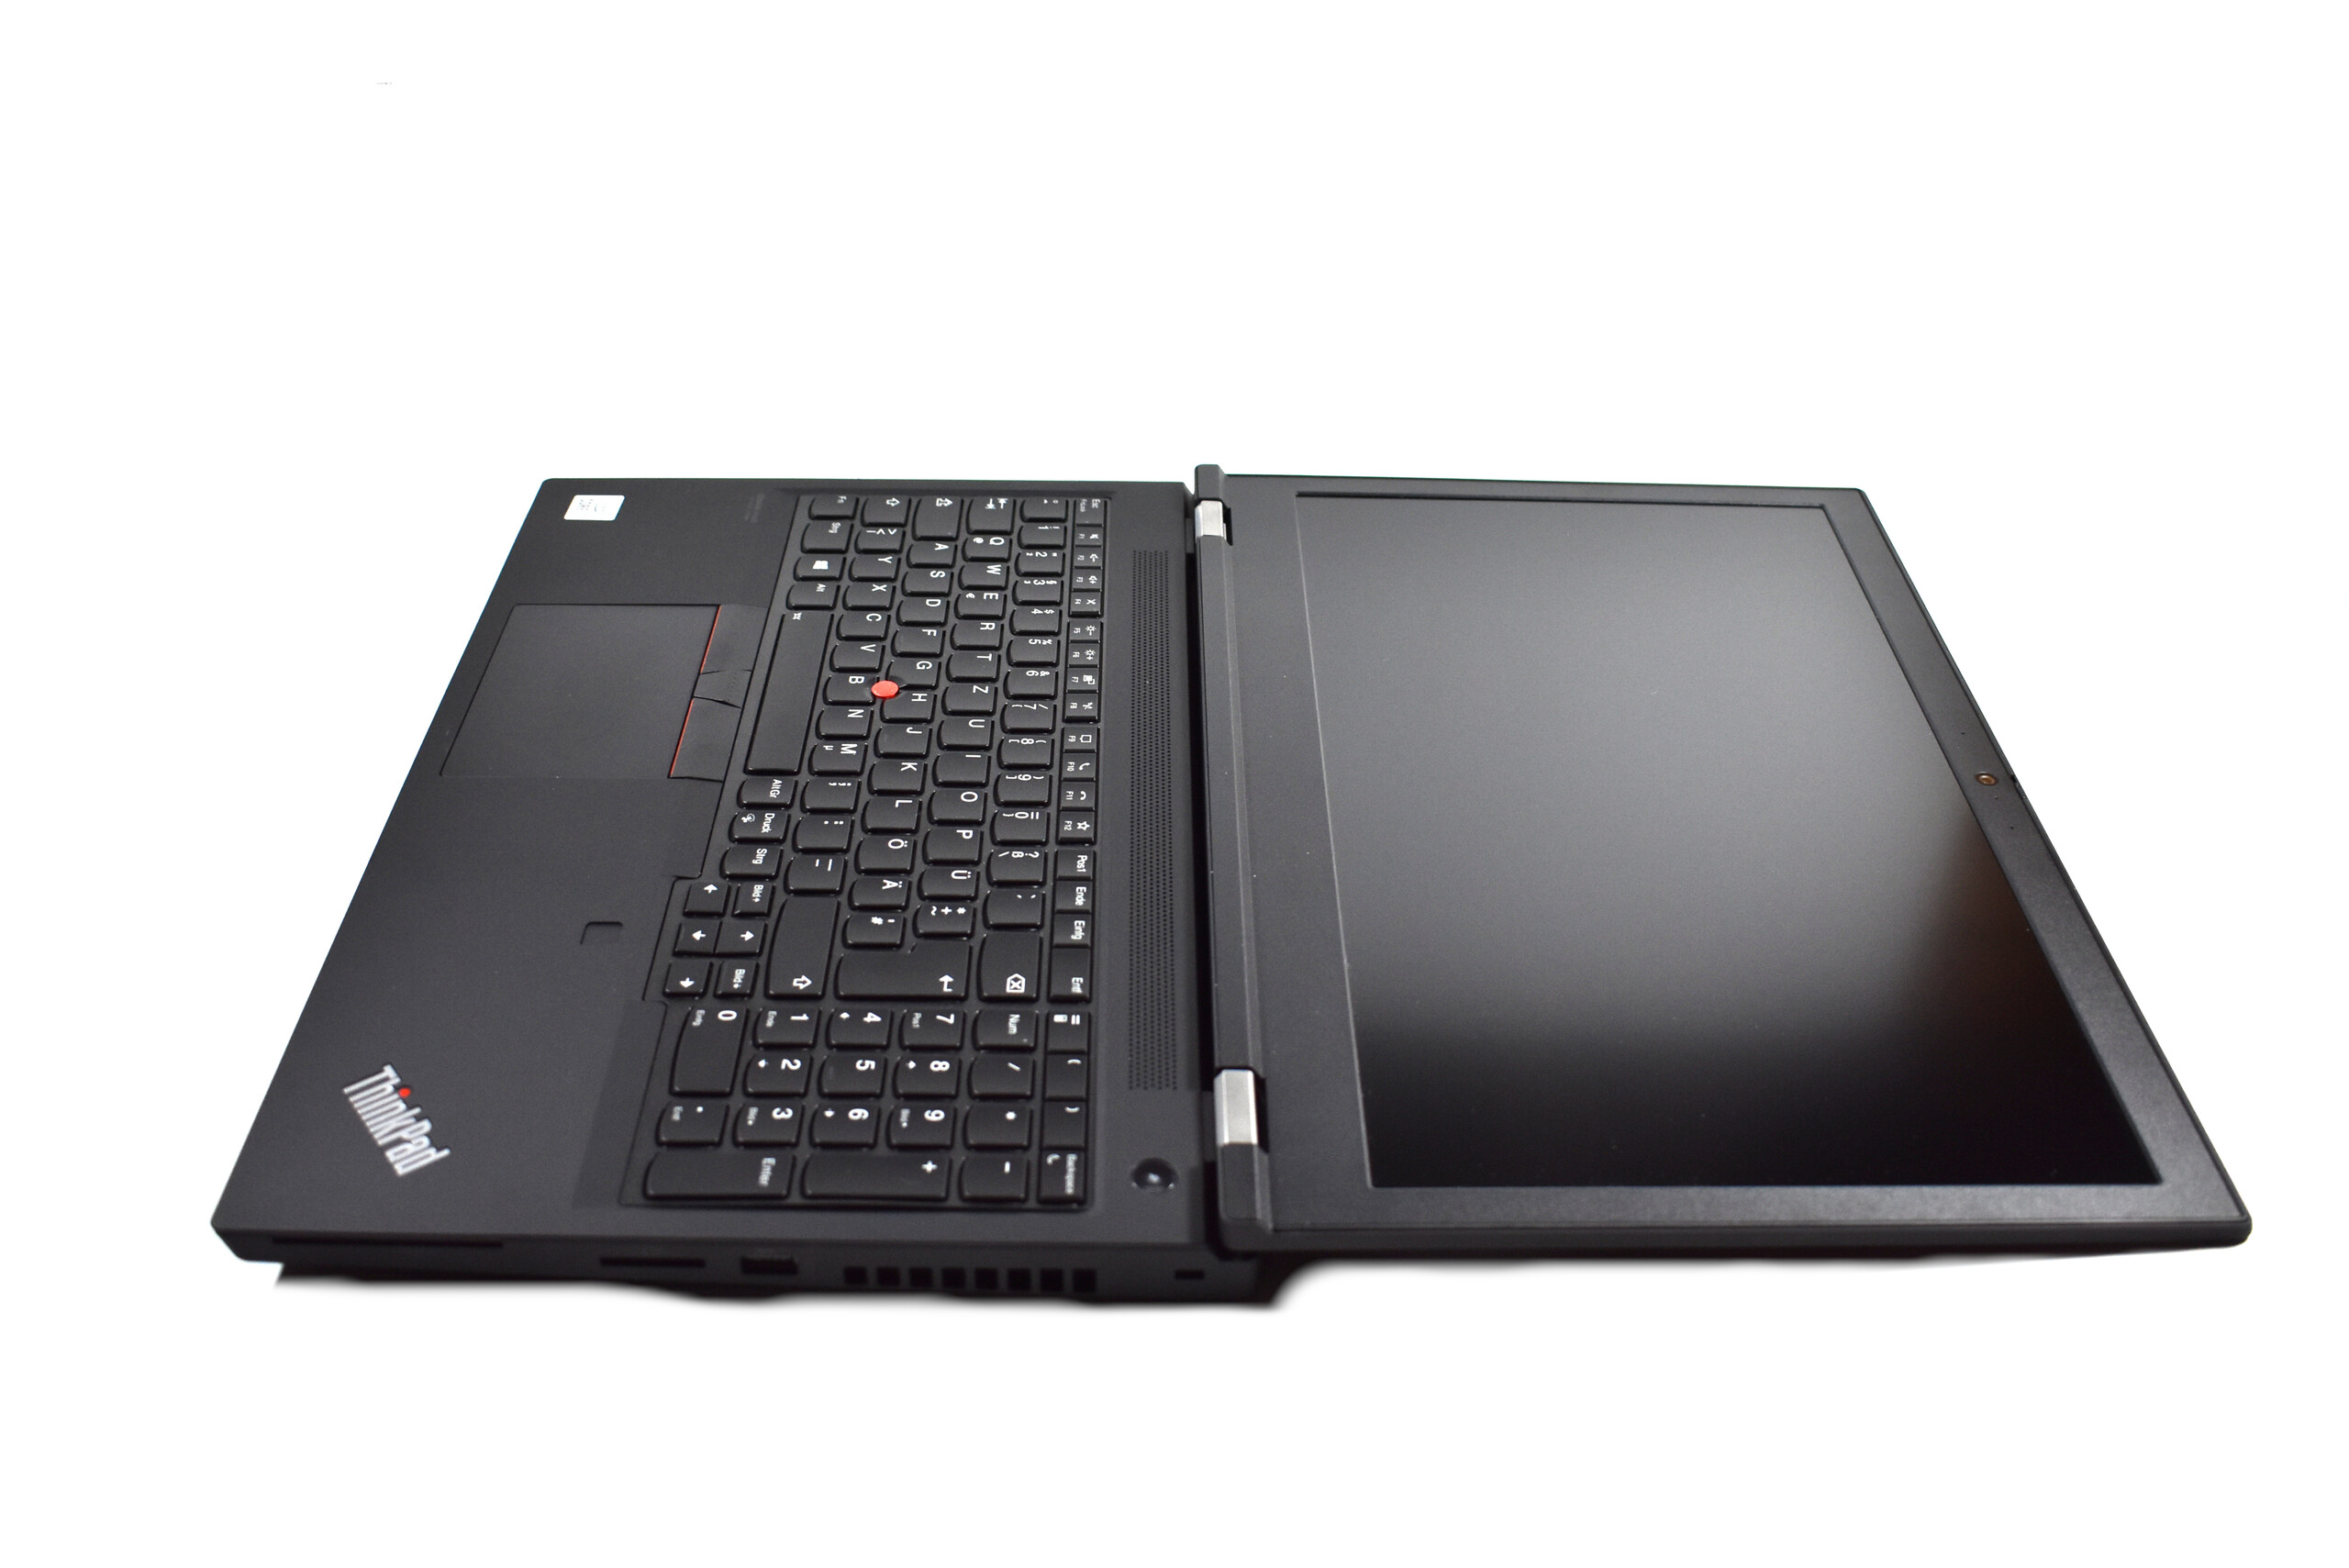
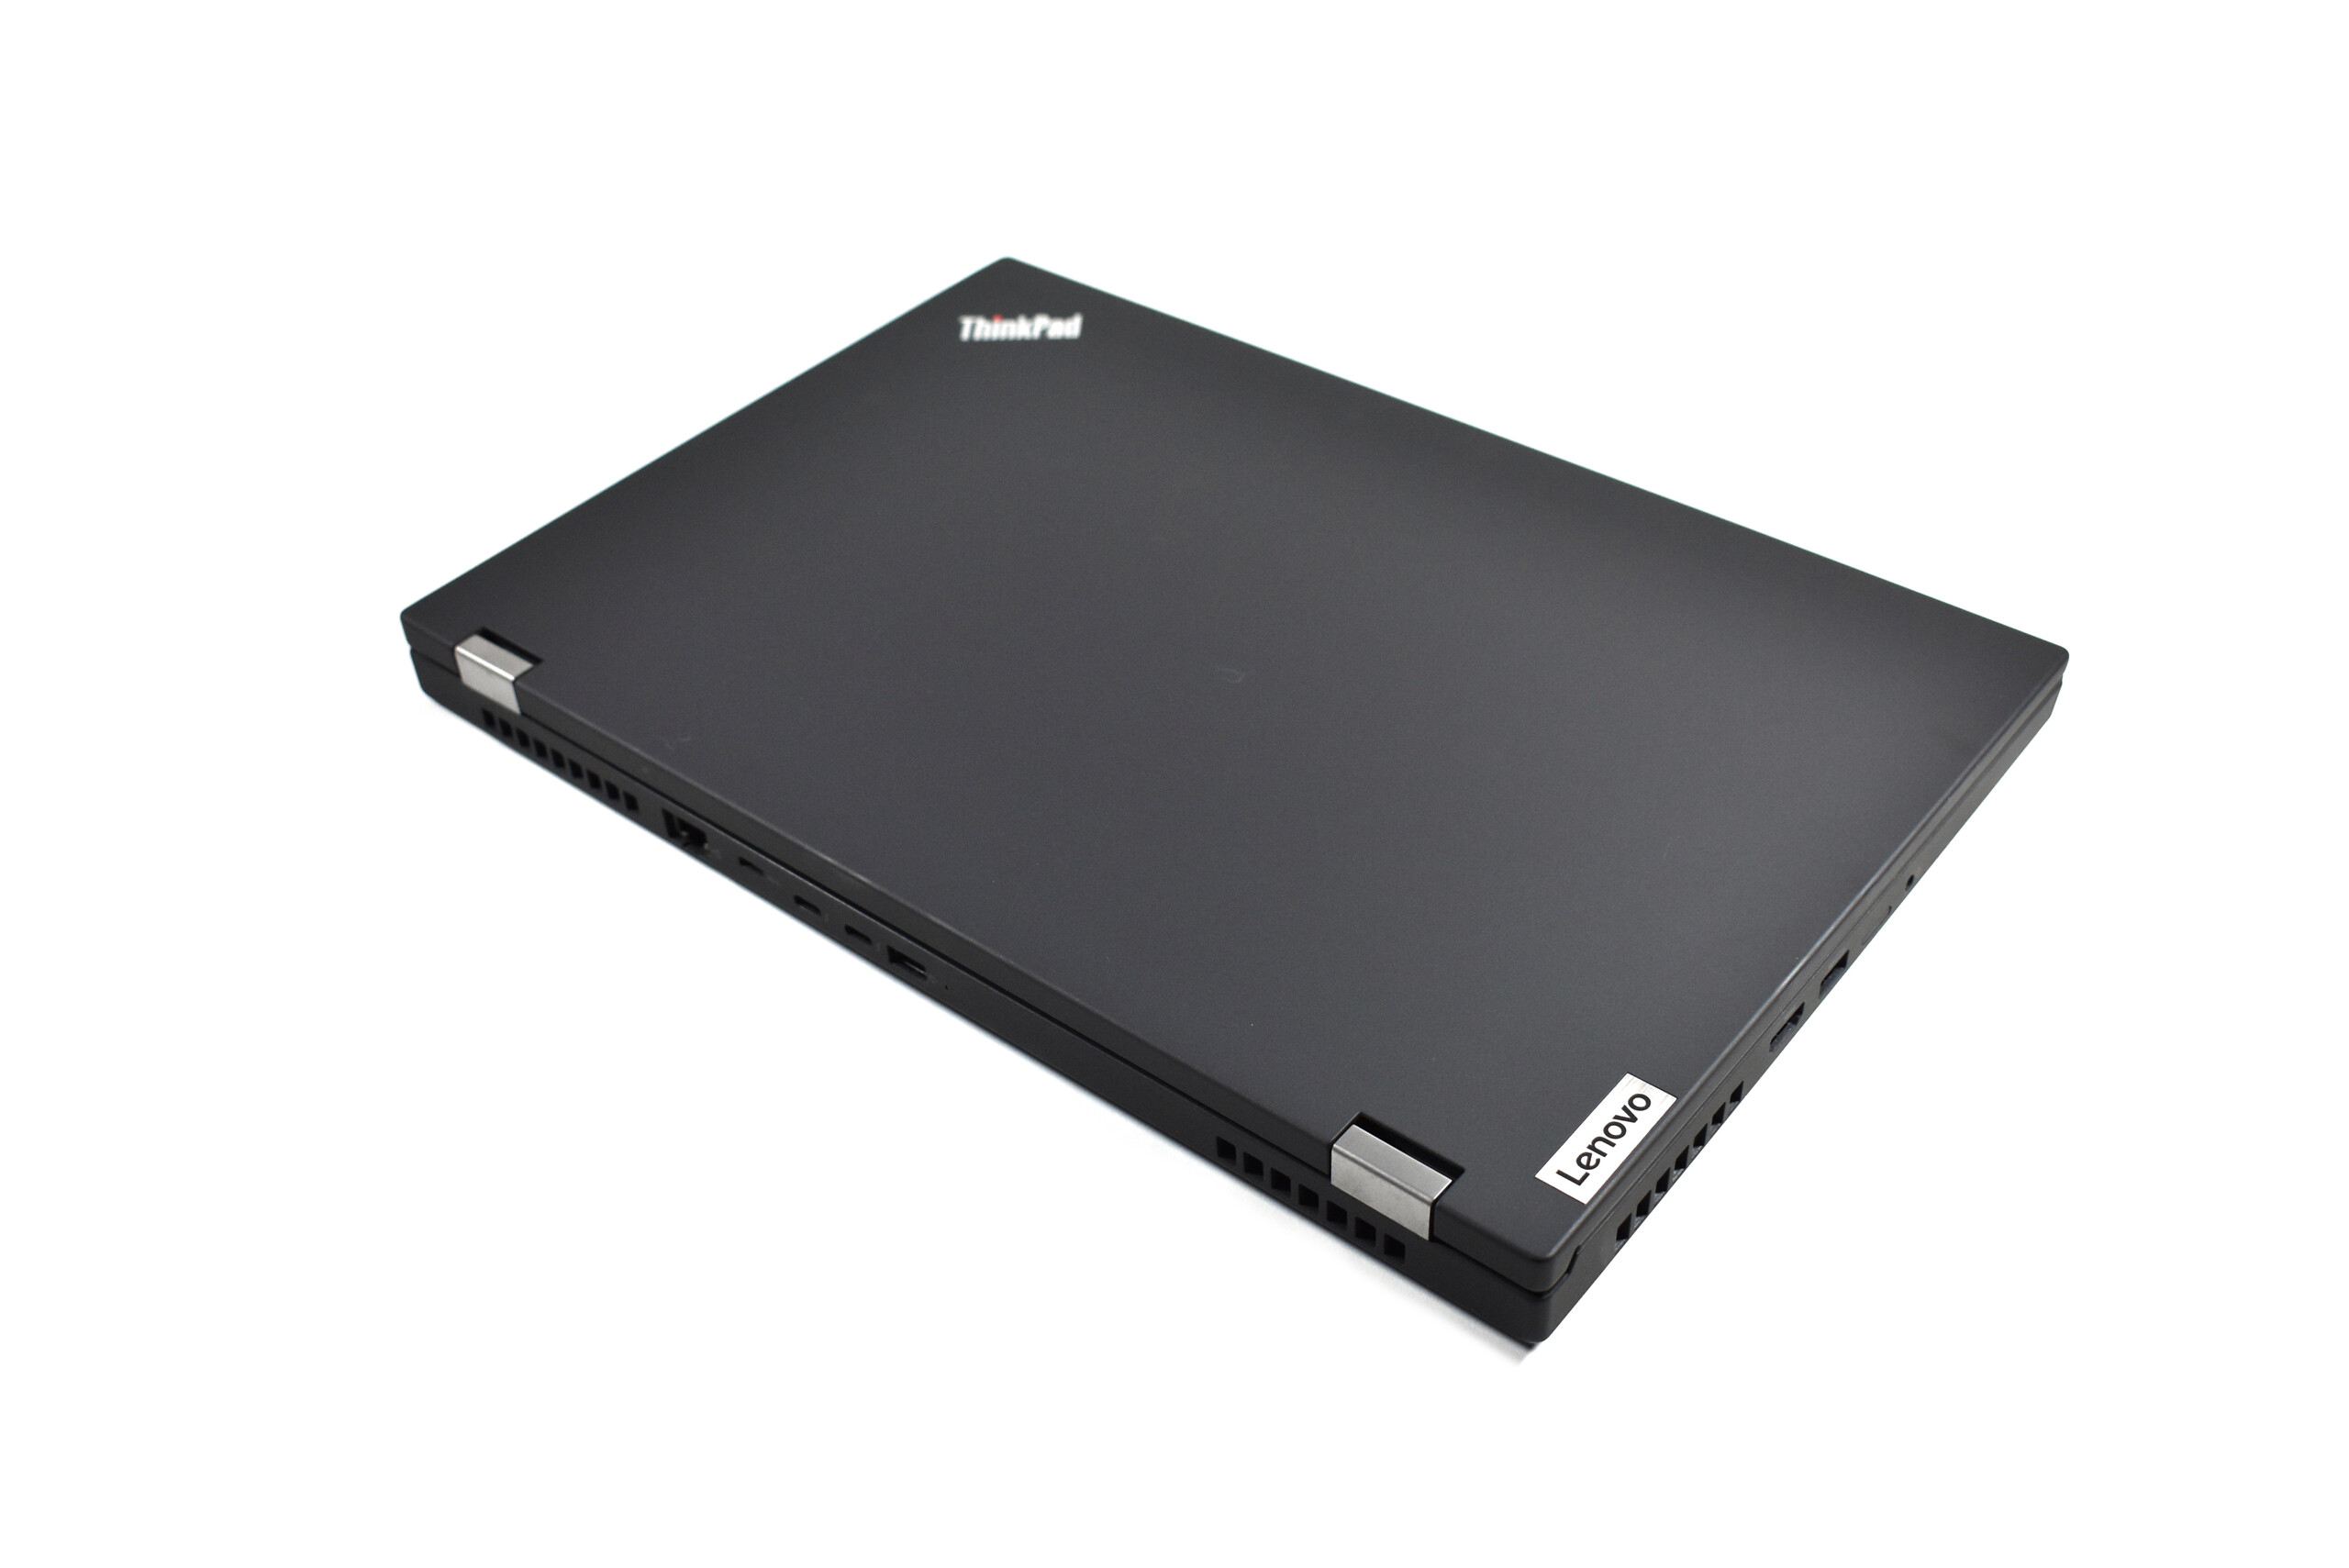
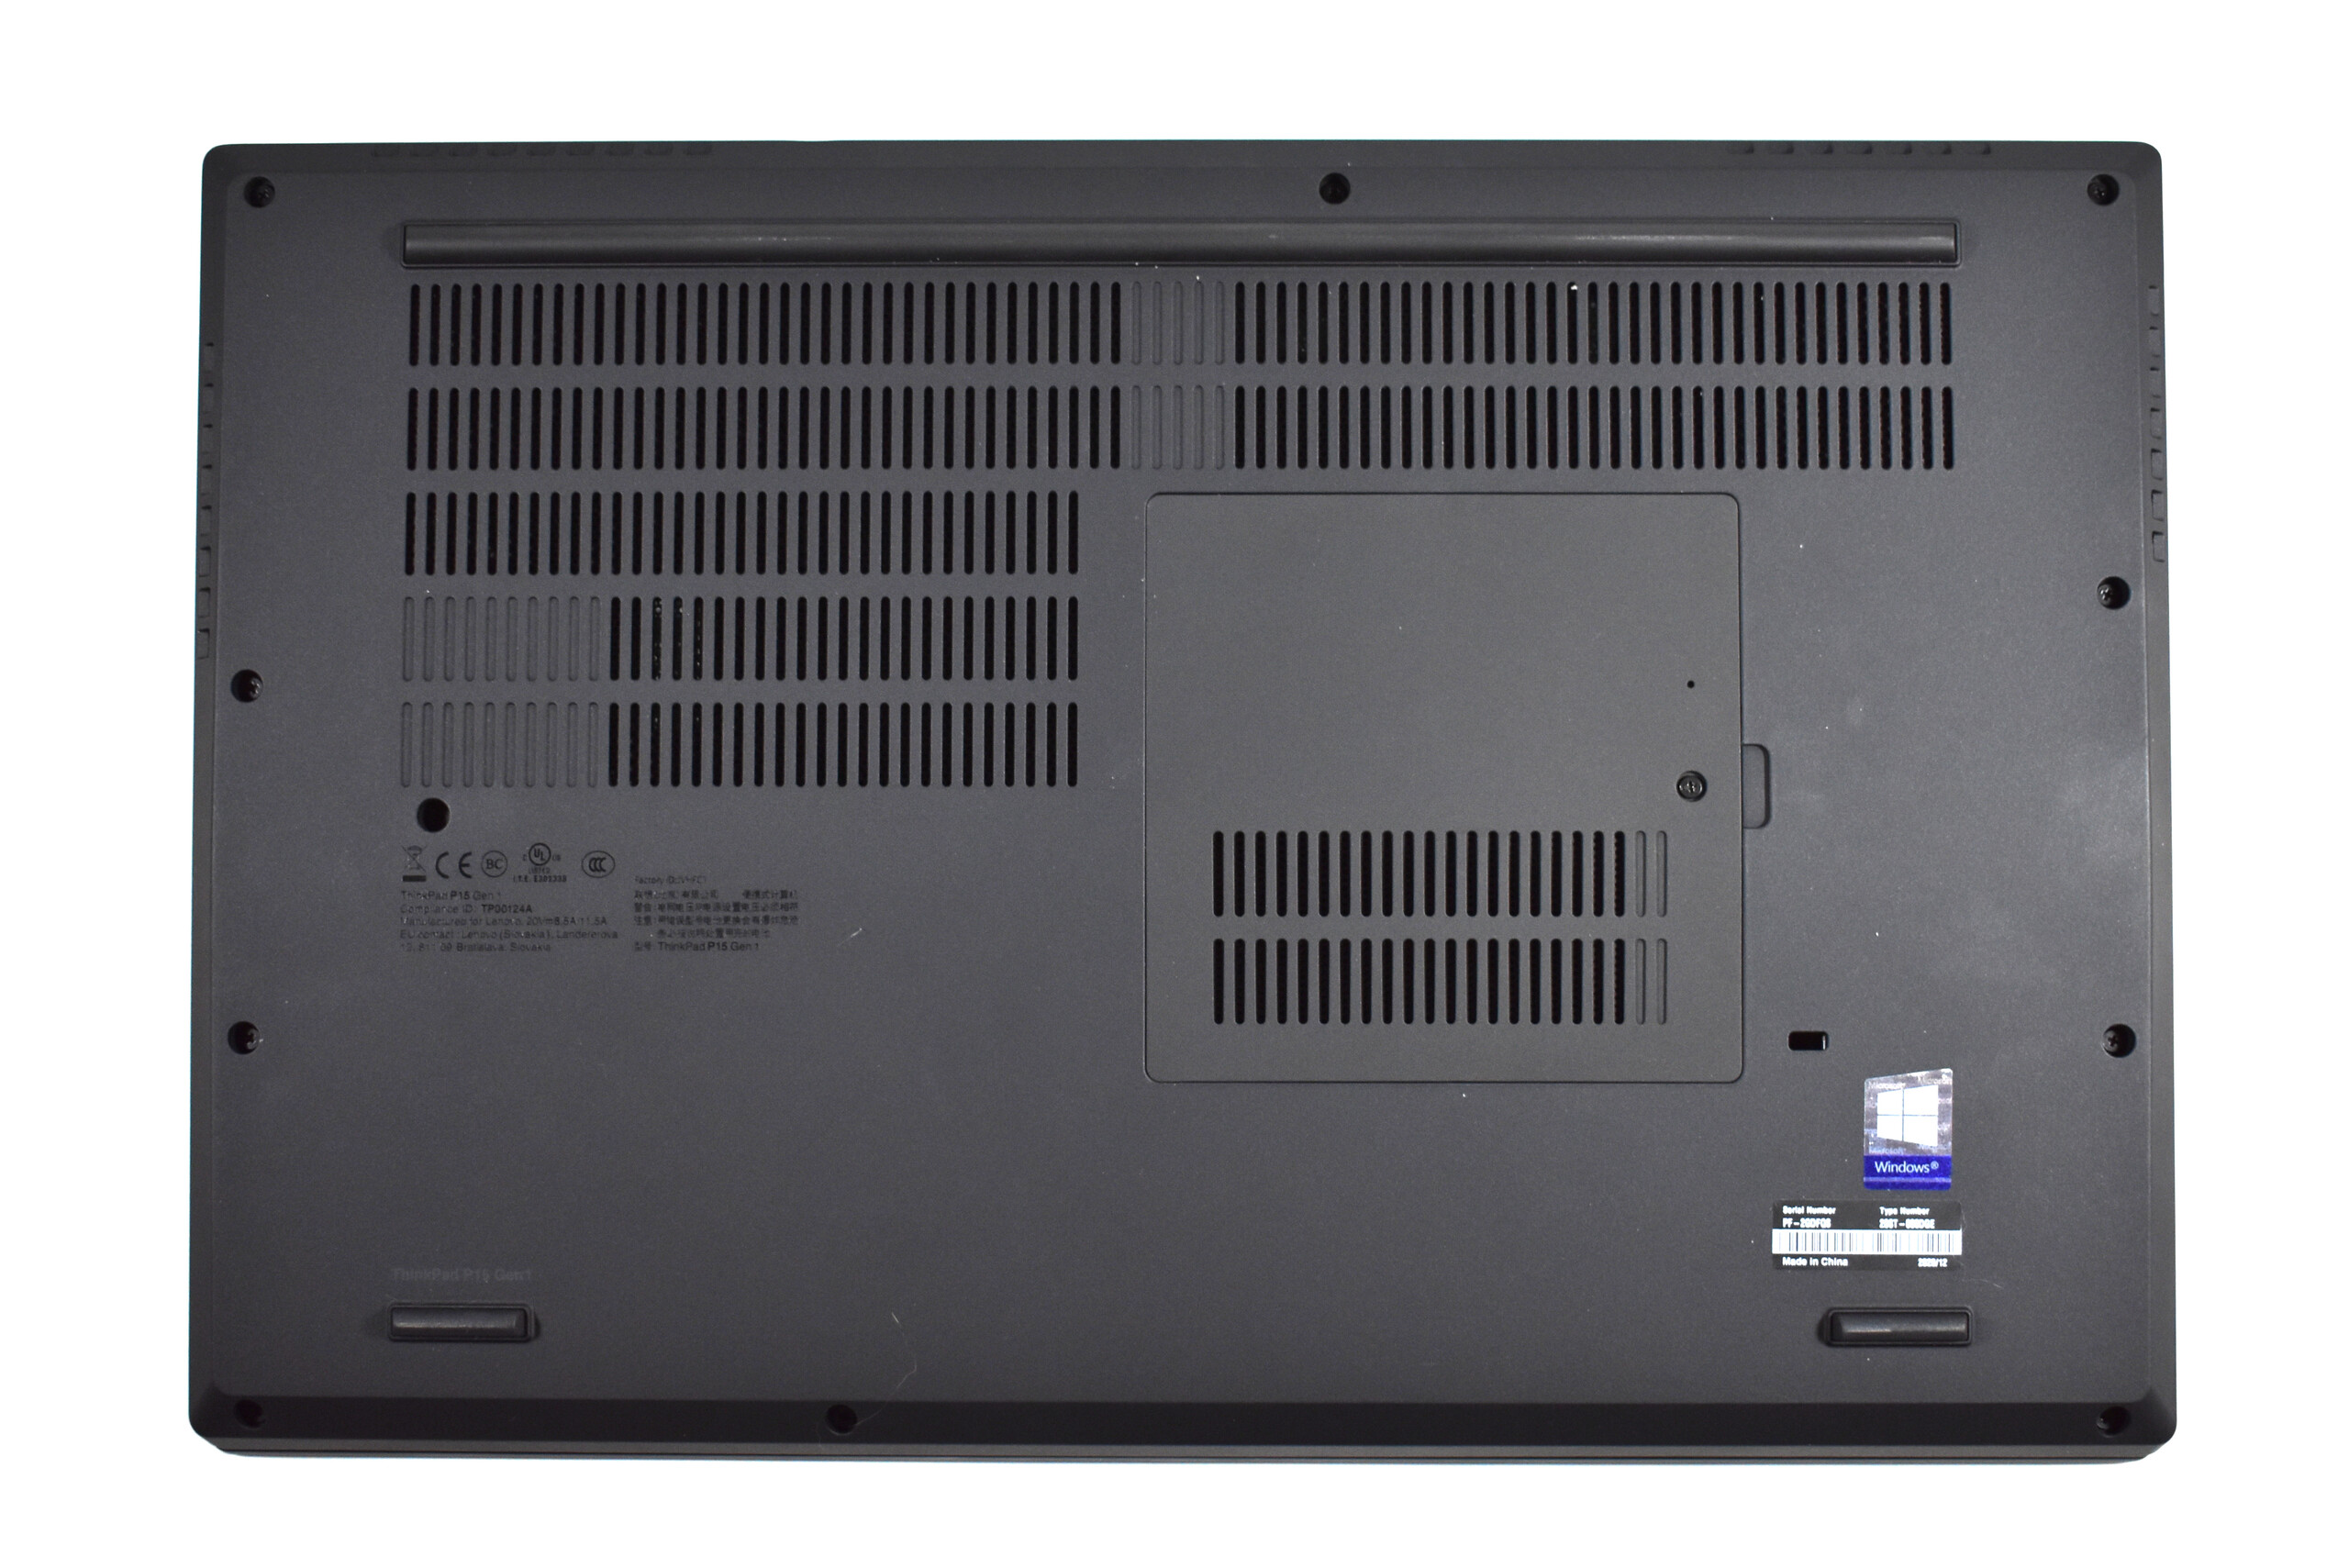
Externamente, o Lenovo ThinkPad P15 Gen 1 parece muito semelhante ao seu predecessor. Entretanto, sob o capô e na caixa preta, muitas coisas mudaram em relação ao ThinkPad P53. Com exceção da moldura de magnésio no interior, a caixa doThinkPad P15é agora completamente feita de plástico de fibra de vidro, enquanto que o fundo da caixa ainda era feito de uma liga de magnésio-alumínio no P53. Embora a estabilidade geral não sofra com isso, a háptica, de certa forma, sofre, já que você pode apenas sentir a diferença entre metal e plástico.
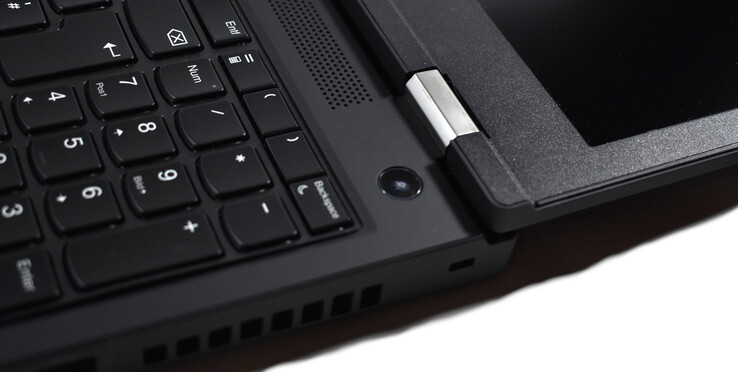
Surpreendentemente, a Lenovo faz um grande erro no que diz respeito à mão-de-obra: Assim como no ThinkPad T15g, o teclado tem uma queda notável no canto inferior esquerdo. Além disso, nem todas as mudanças de design são positivas: os dois LEDs de status abaixo do visor foram removidos, assim como as teclas dedicadas do touchpad.
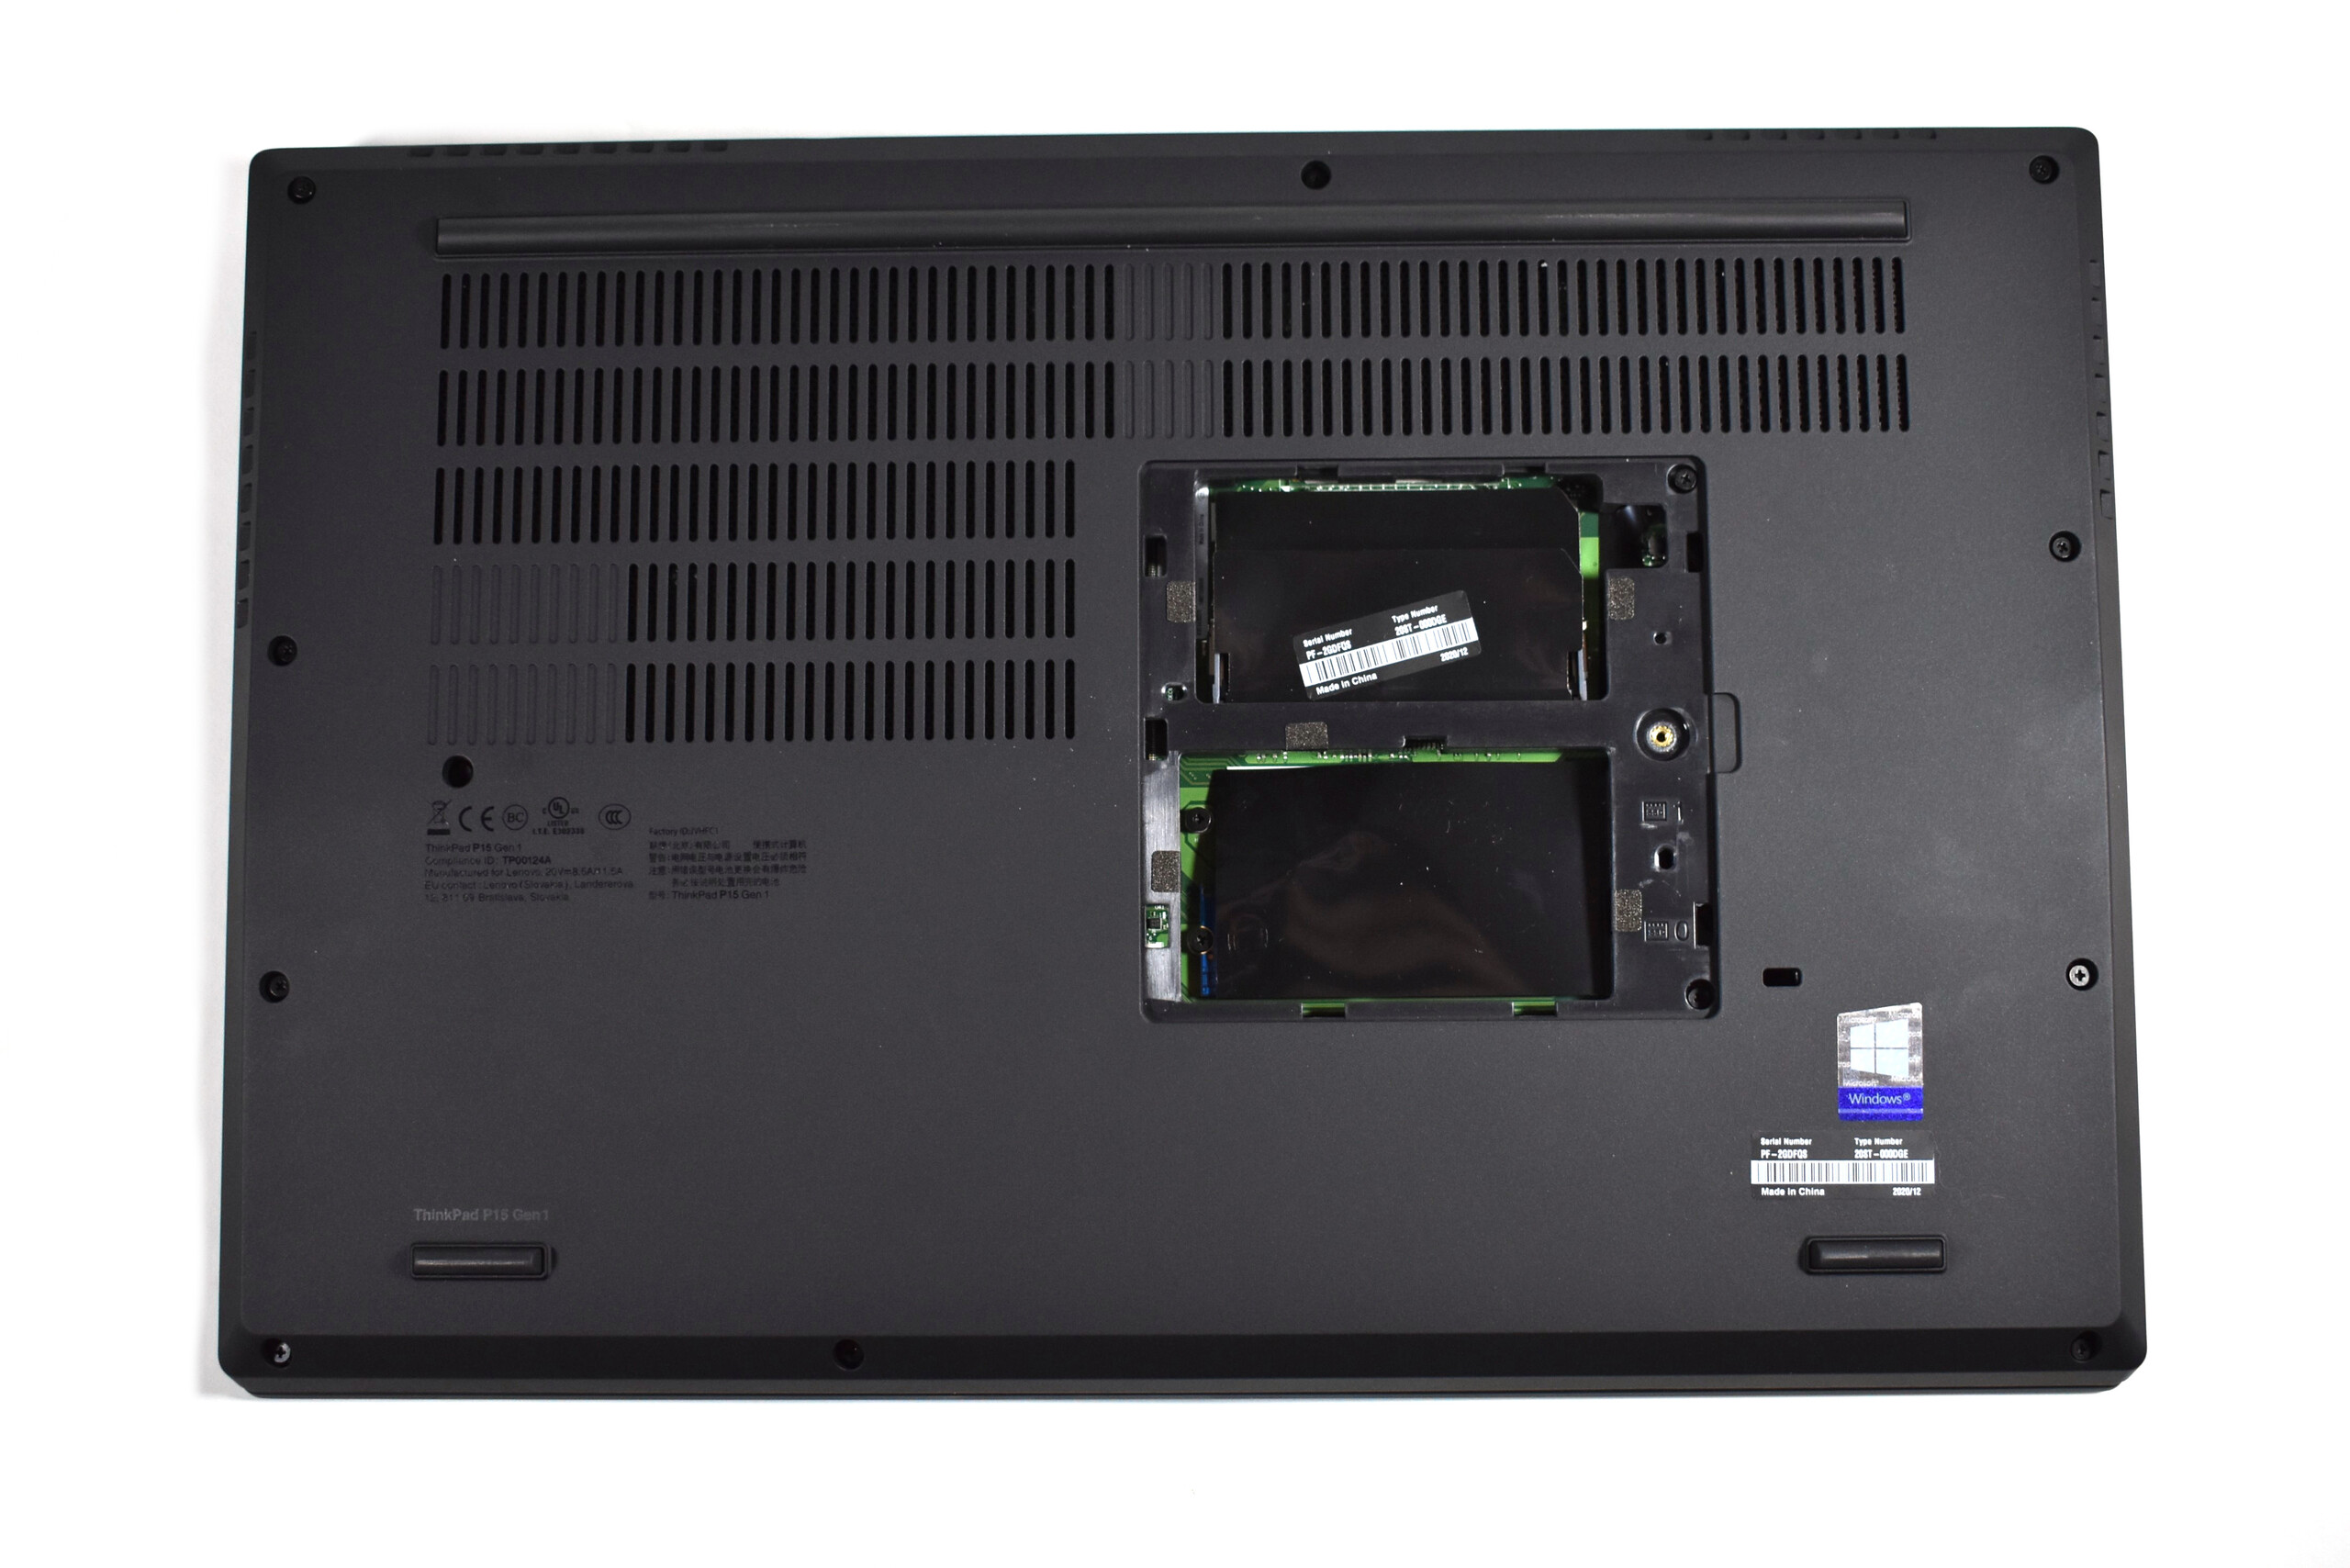
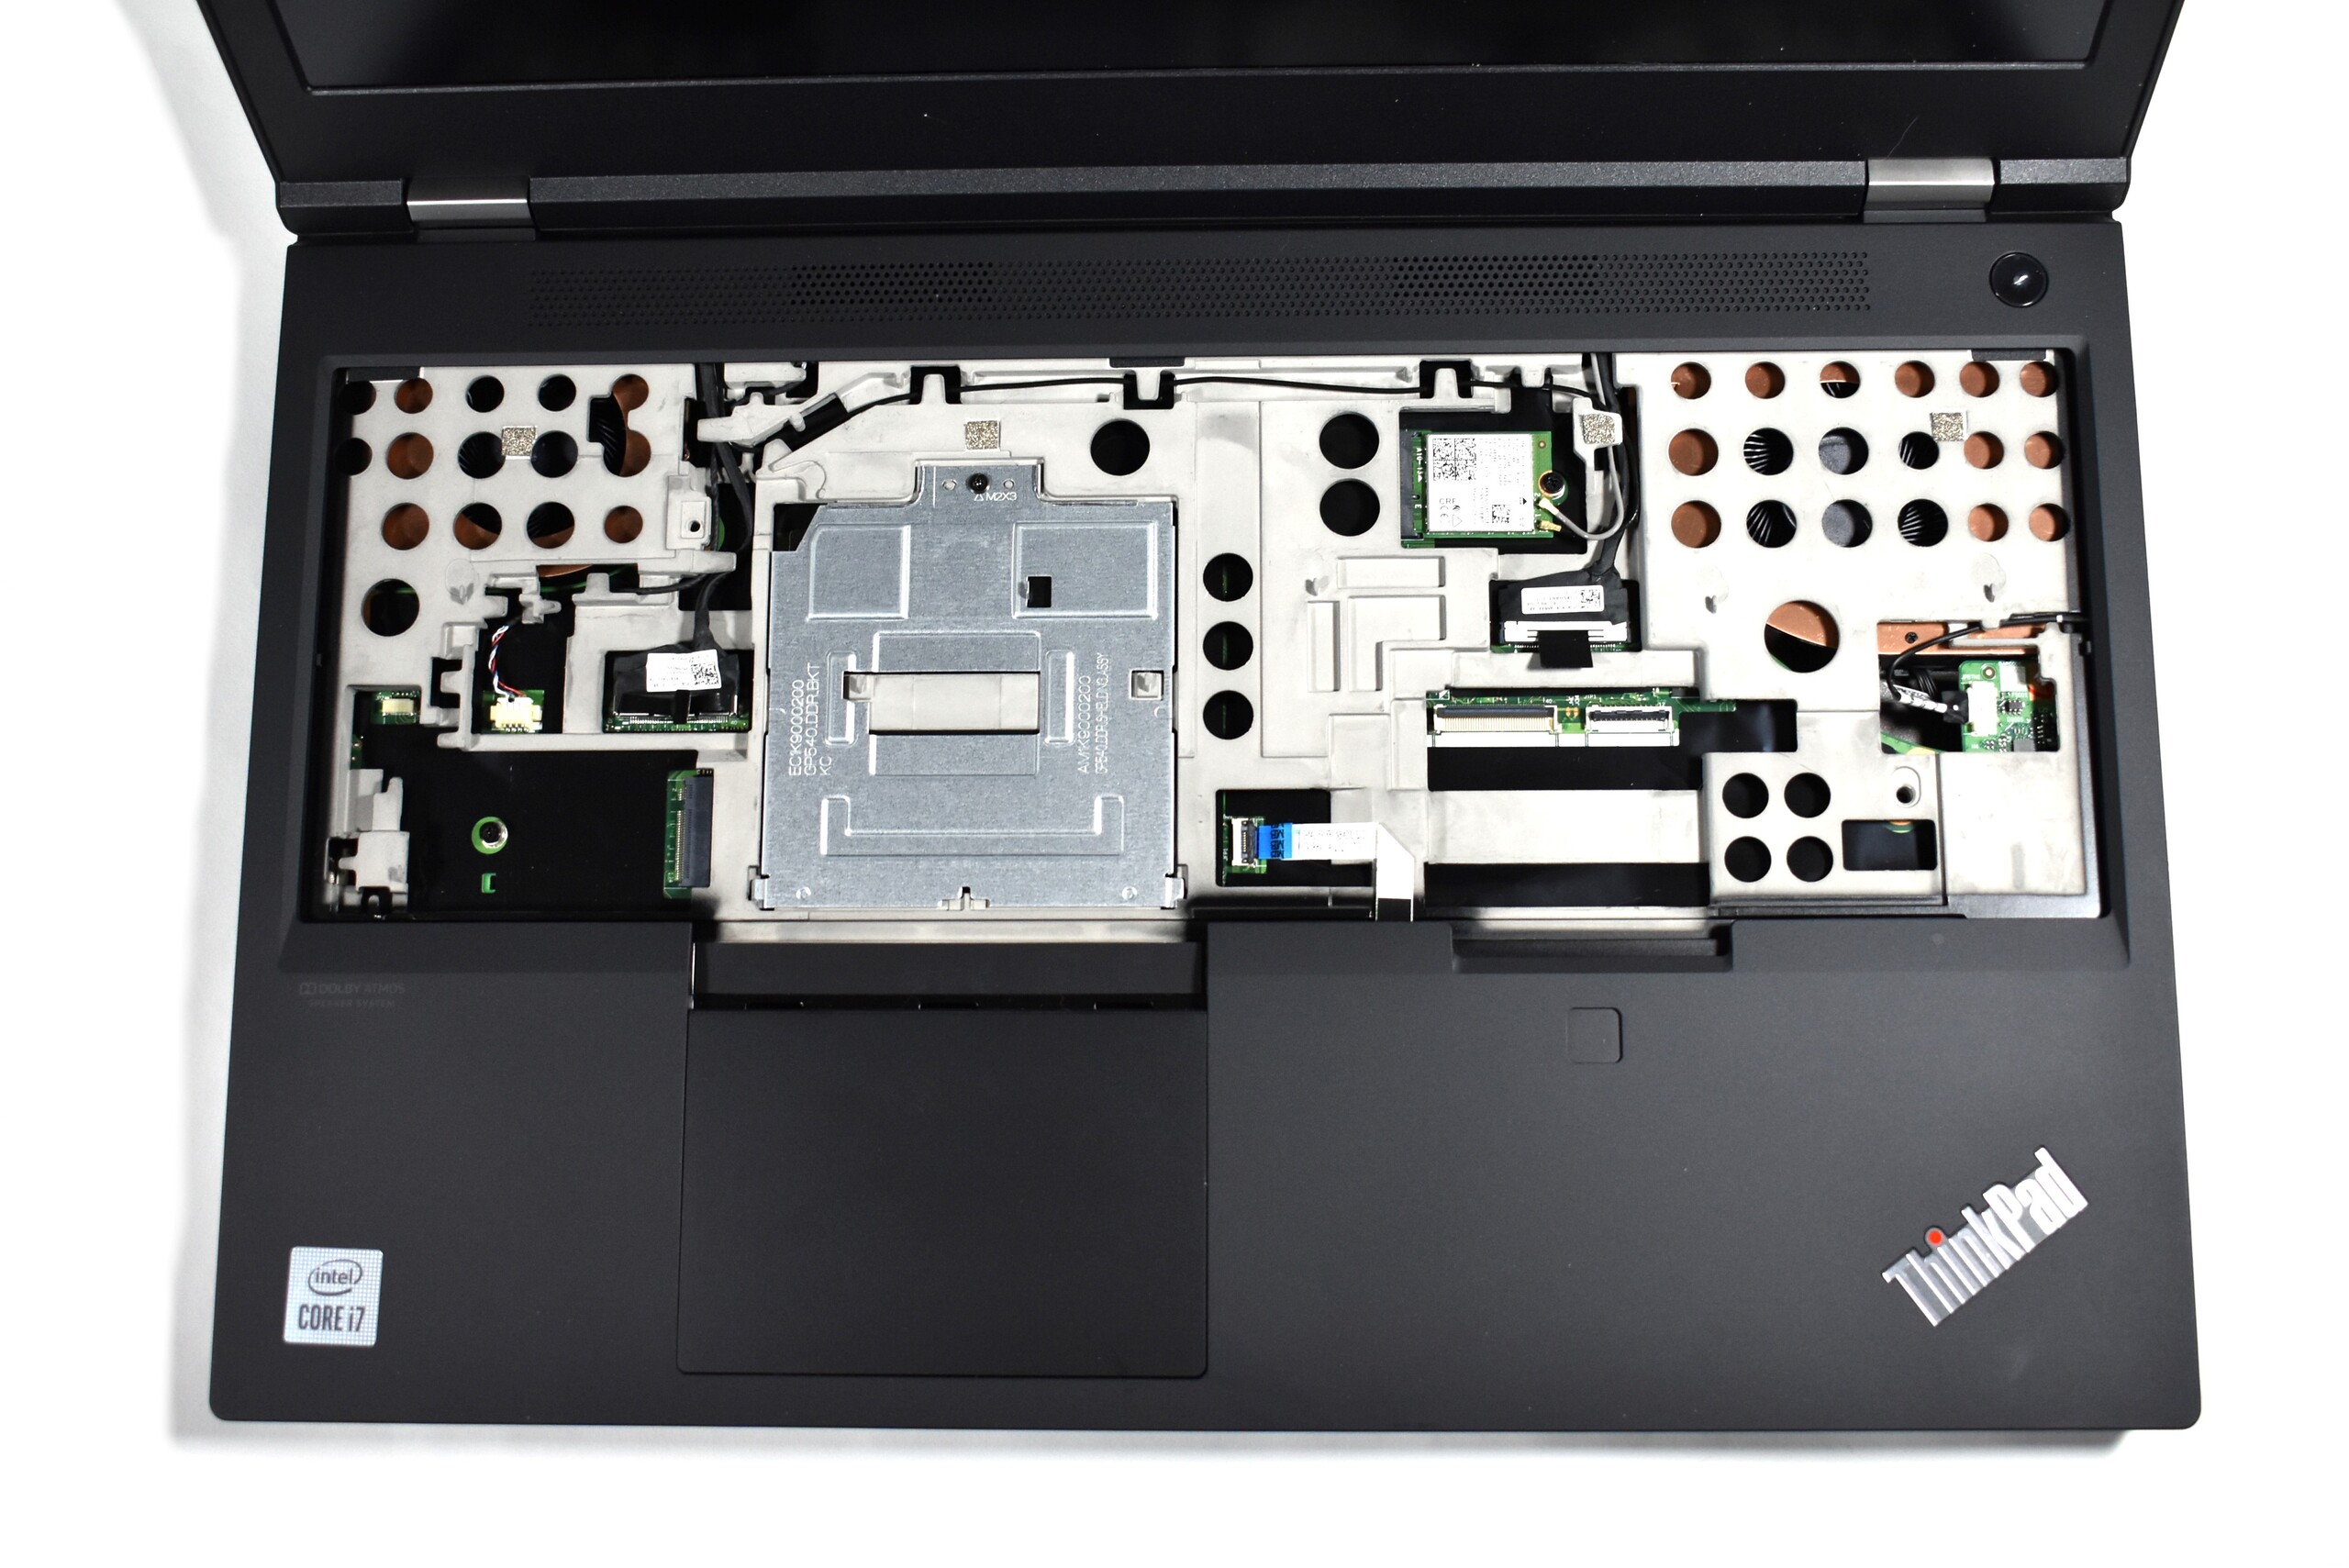
Embora algumas dessas mudanças nos deixem bastante preocupados, com certeza gostamos das melhores opções de manutenção e do aumento da modularidade. No predecessor, ainda era preciso desmontar o estojo inteiro para acessar o sistema de refrigeração, mas no ThinkPad P15, basta apenas remover a placa inferior. Remover o teclado com teclado numérico é igualmente fácil, dando acesso a dois dos quatro slots de RAM
| SD Card Reader | |
| average JPG Copy Test (av. of 3 runs) | |
| Dell Precision 7550 (Toshiba Exceria Pro SDXC 64 GB UHS-II) | |
| Lenovo ThinkPad P53-20QN000YGE (Toshiba Exceria Pro SDXC 64 GB UHS-II) | |
| HP ZBook Fury 15 G7 (Toshiba Exceria Pro SDXC 64 GB UHS-II) | |
| Média da turma Workstation (49.6 - 681, n=14, últimos 2 anos) | |
| Lenovo ThinkPad T15p-20TN0006GE (Toshiba Exceria Pro SDXC 64 GB UHS-II) | |
| Lenovo ThinkPad P15 Gen1-20ST000DGE (Toshiba Exceria Pro SDXC 64 GB UHS-II) | |
| maximum AS SSD Seq Read Test (1GB) | |
| Média da turma Workstation (87.6 - 1455, n=14, últimos 2 anos) | |
| HP ZBook Fury 15 G7 (Toshiba Exceria Pro SDXC 64 GB UHS-II) | |
| Lenovo ThinkPad P53-20QN000YGE (Toshiba Exceria Pro SDXC 64 GB UHS-II) | |
| Dell Precision 7550 (Toshiba Exceria Pro SDXC 64 GB UHS-II) | |
| Lenovo ThinkPad T15p-20TN0006GE (Toshiba Exceria Pro SDXC 64 GB UHS-II) | |
| Lenovo ThinkPad P15 Gen1-20ST000DGE (Toshiba Exceria Pro SDXC 64 GB UHS-II) | |
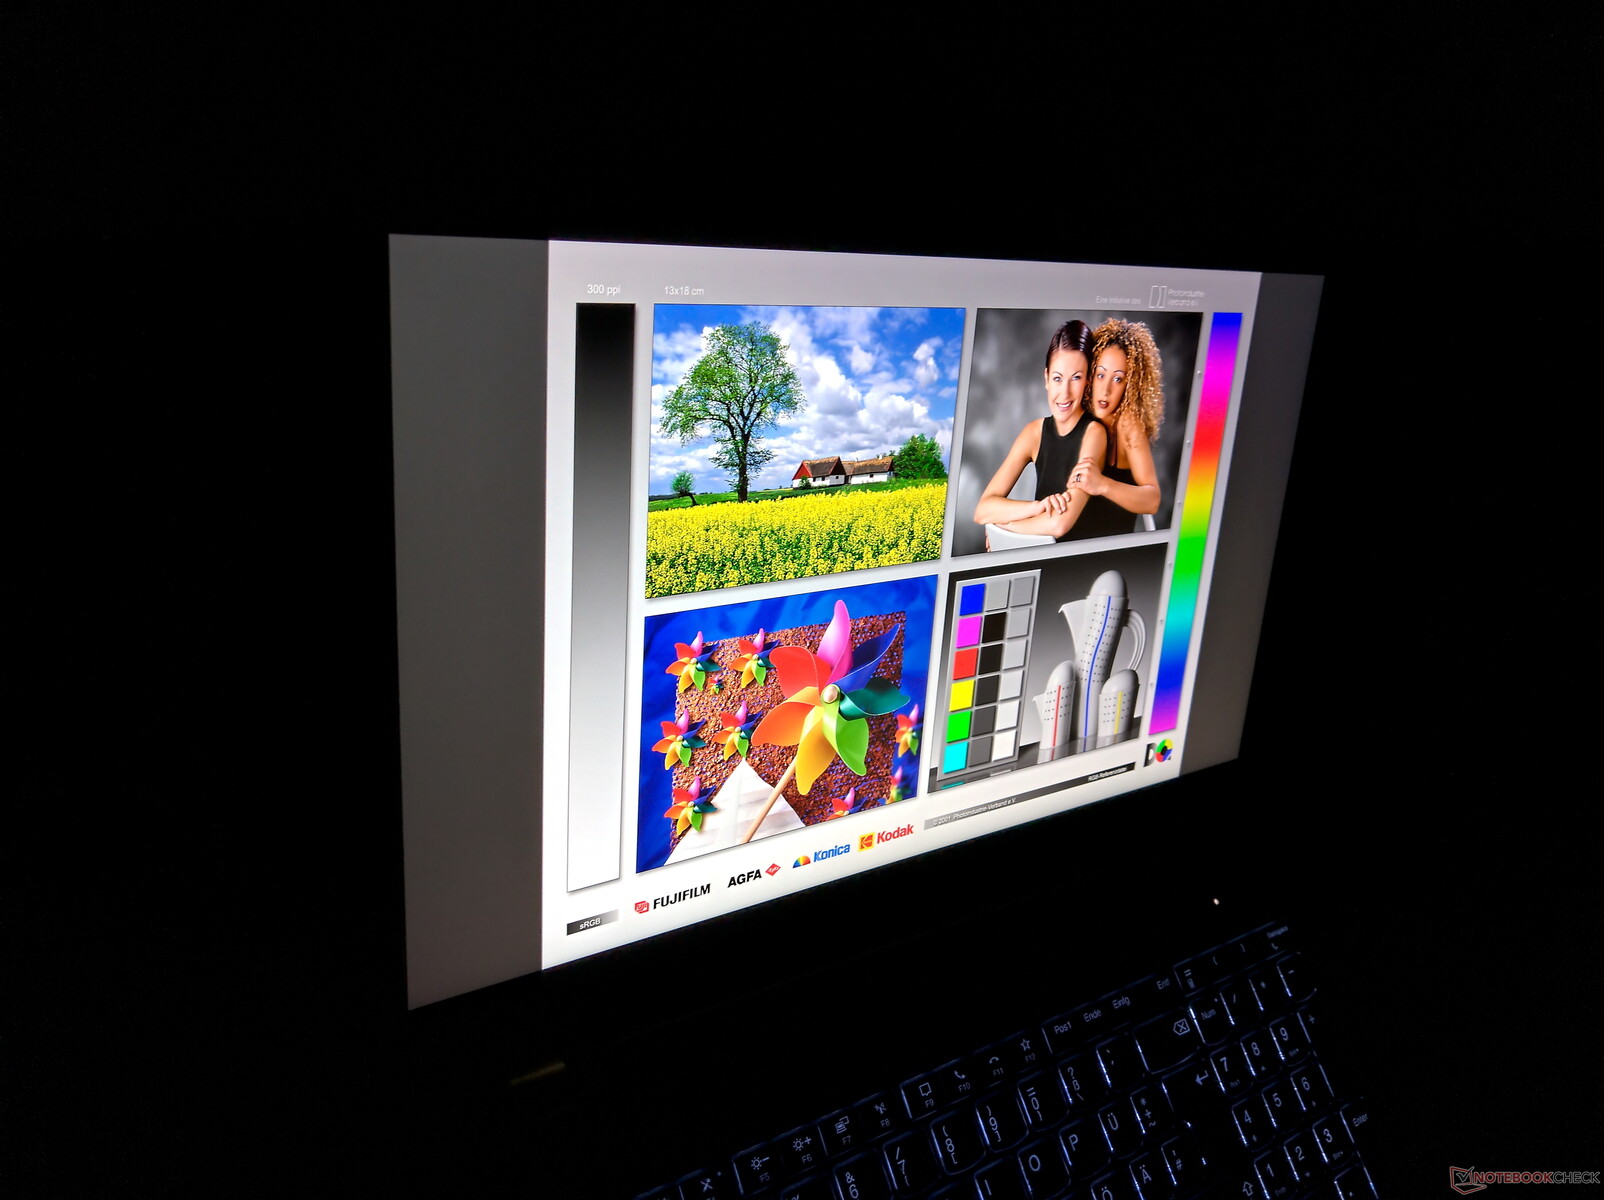
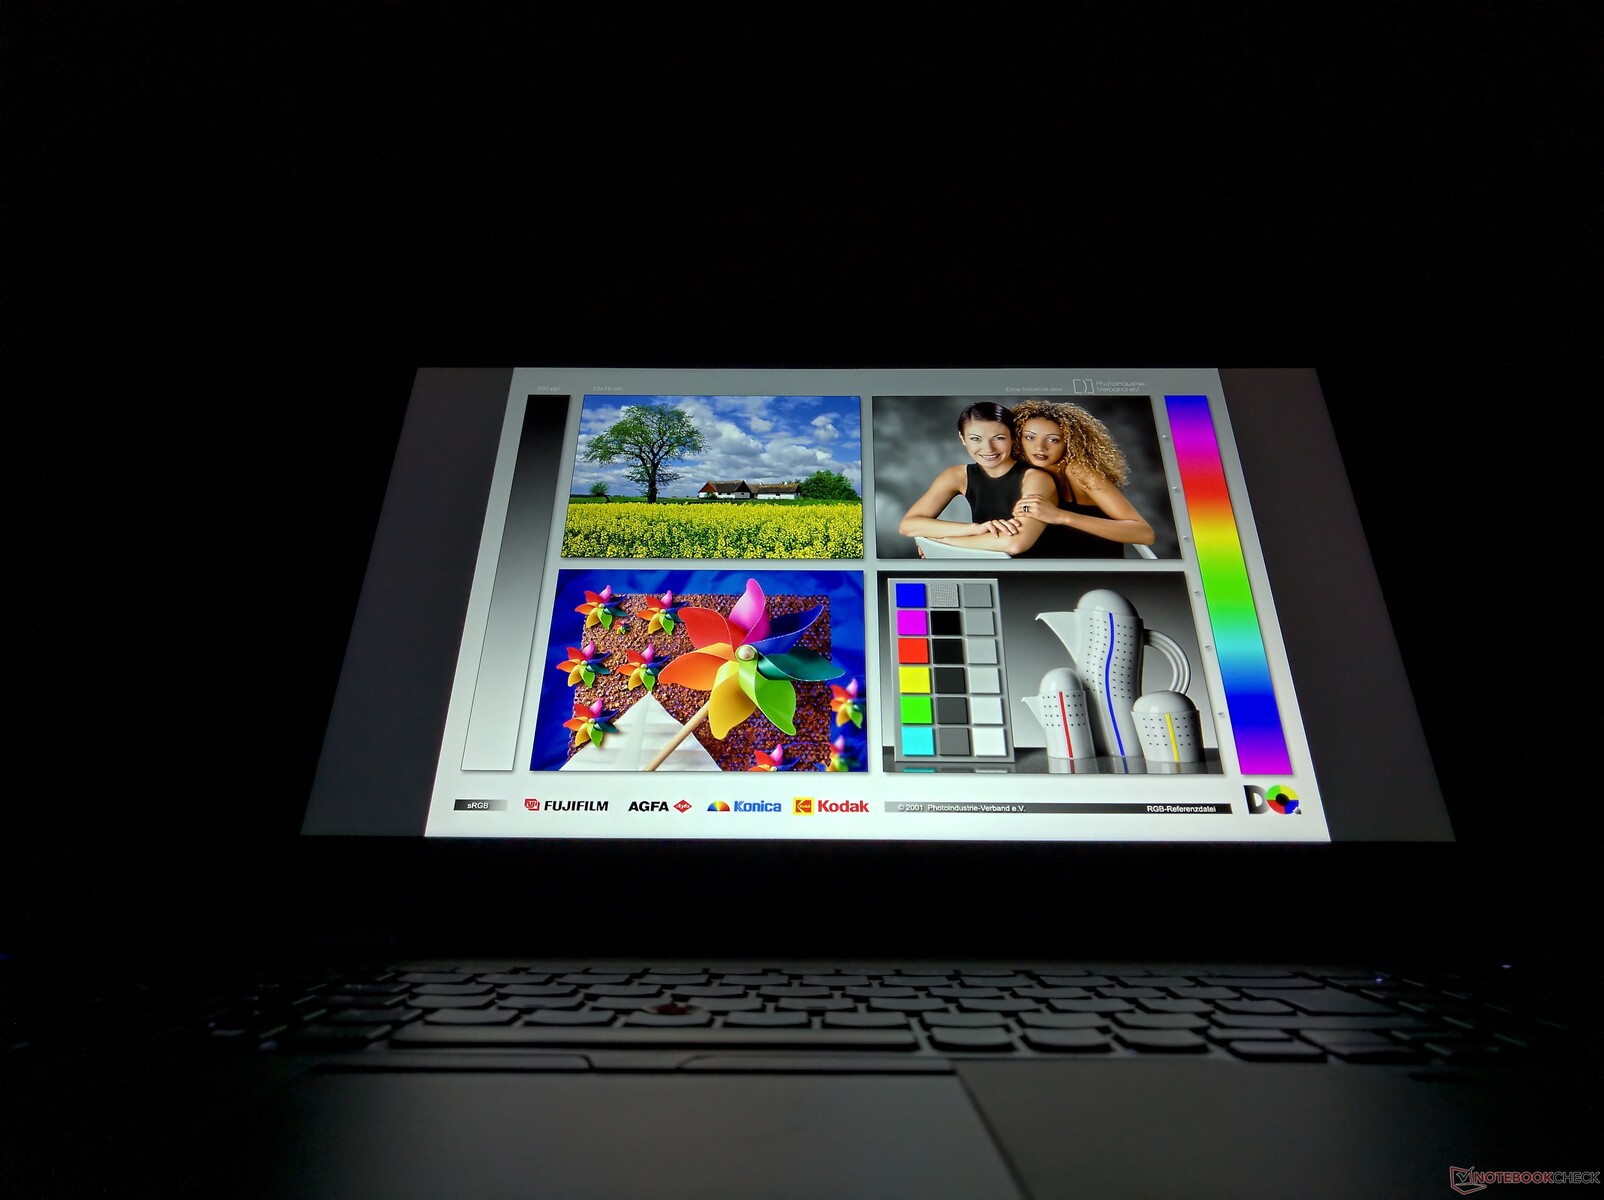
Mostrar: Teste do painel de nível básico do ThinkPad P15 da Lenovo

Como muitos outros laptops ThinkPad, o Lenovo ThinkPad P15 Gen 1 também oferece uma seleção de displays disponíveis que têm todos o formato diagonal de 15,6 polegadas e 16:9 em comum
- Full-HD (1920 x 1080), IPS LCD, 300 cd/m², 72% NTSC, fosco
- Full-HD (1920 x 1080), IPS LCD, 500 cd/m², 72% NTSC, matte, Dolby Vision
- 4K-UHD (3840 x 2160), IPS LCD, 600 cd/m², 100% AdobeRGB, matte, Dolby Vision
- 4K-UHD (3840 x 2160), OLED, 400 cd/m² (pico 500 cd/m²), 100% DCI-P3, brilhante, Dolby Vision, touchscreen
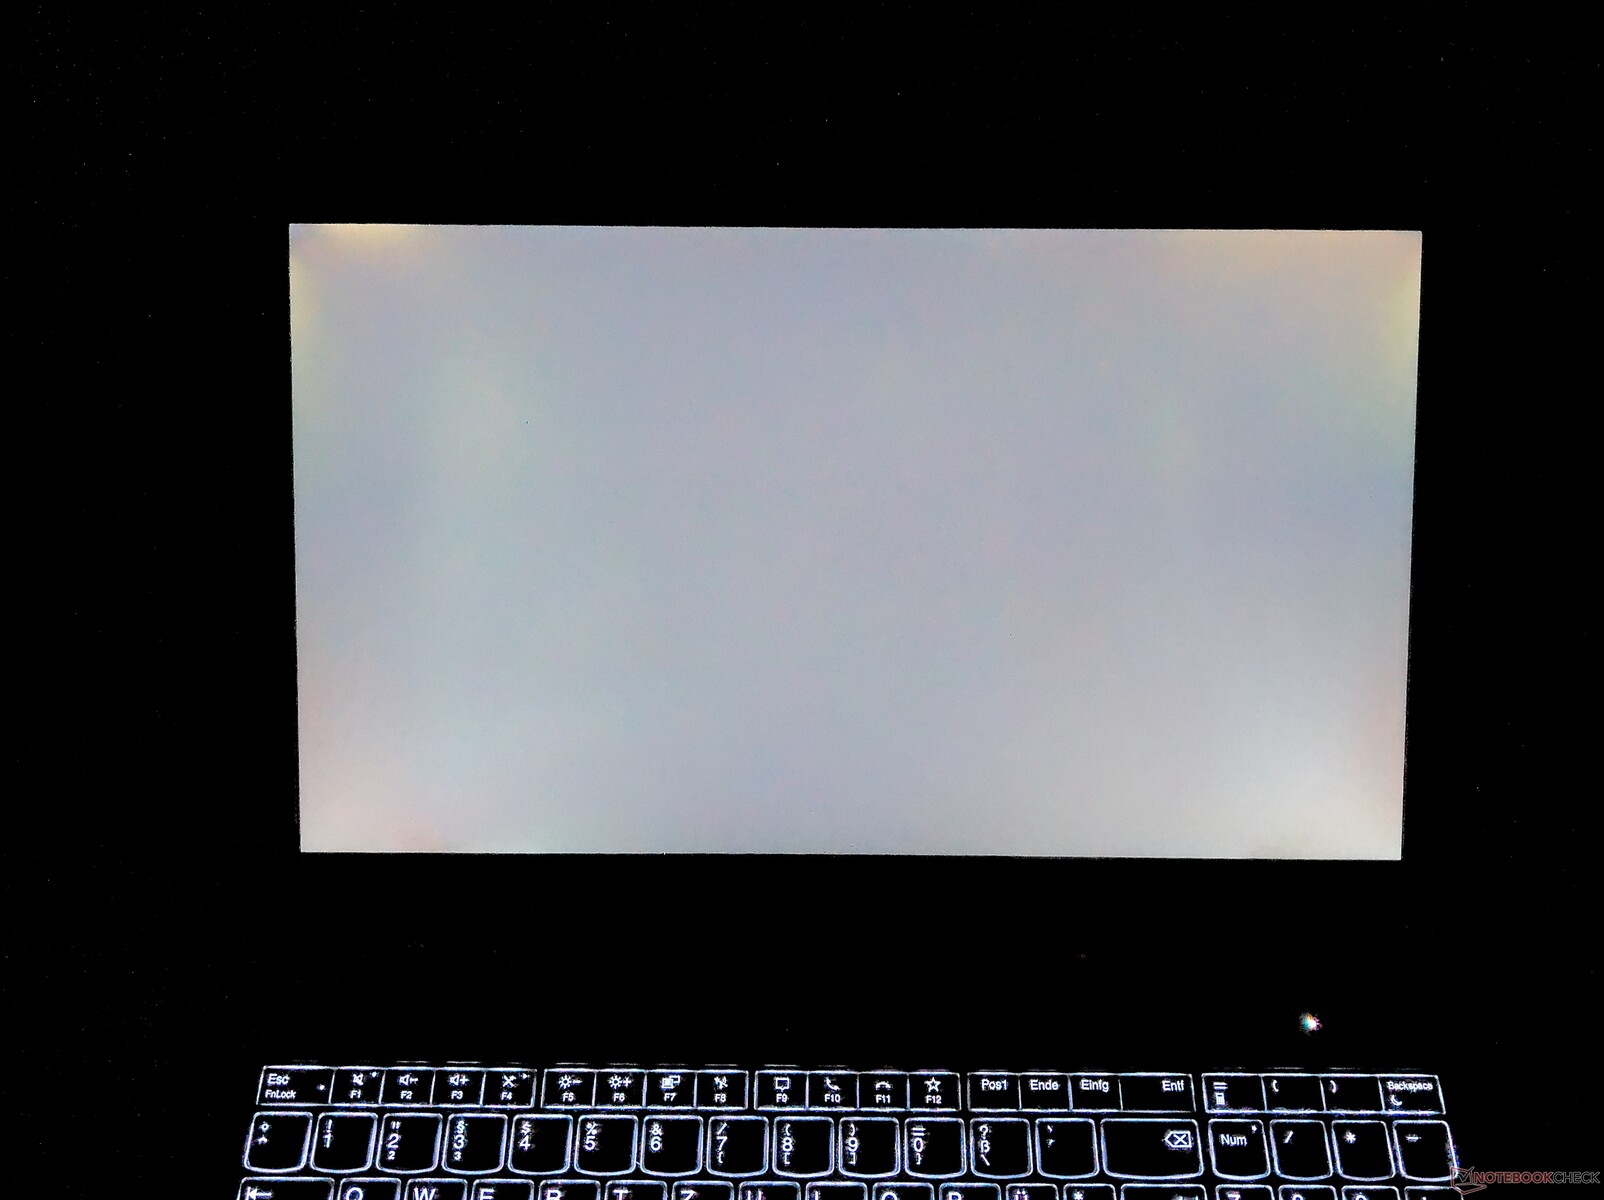
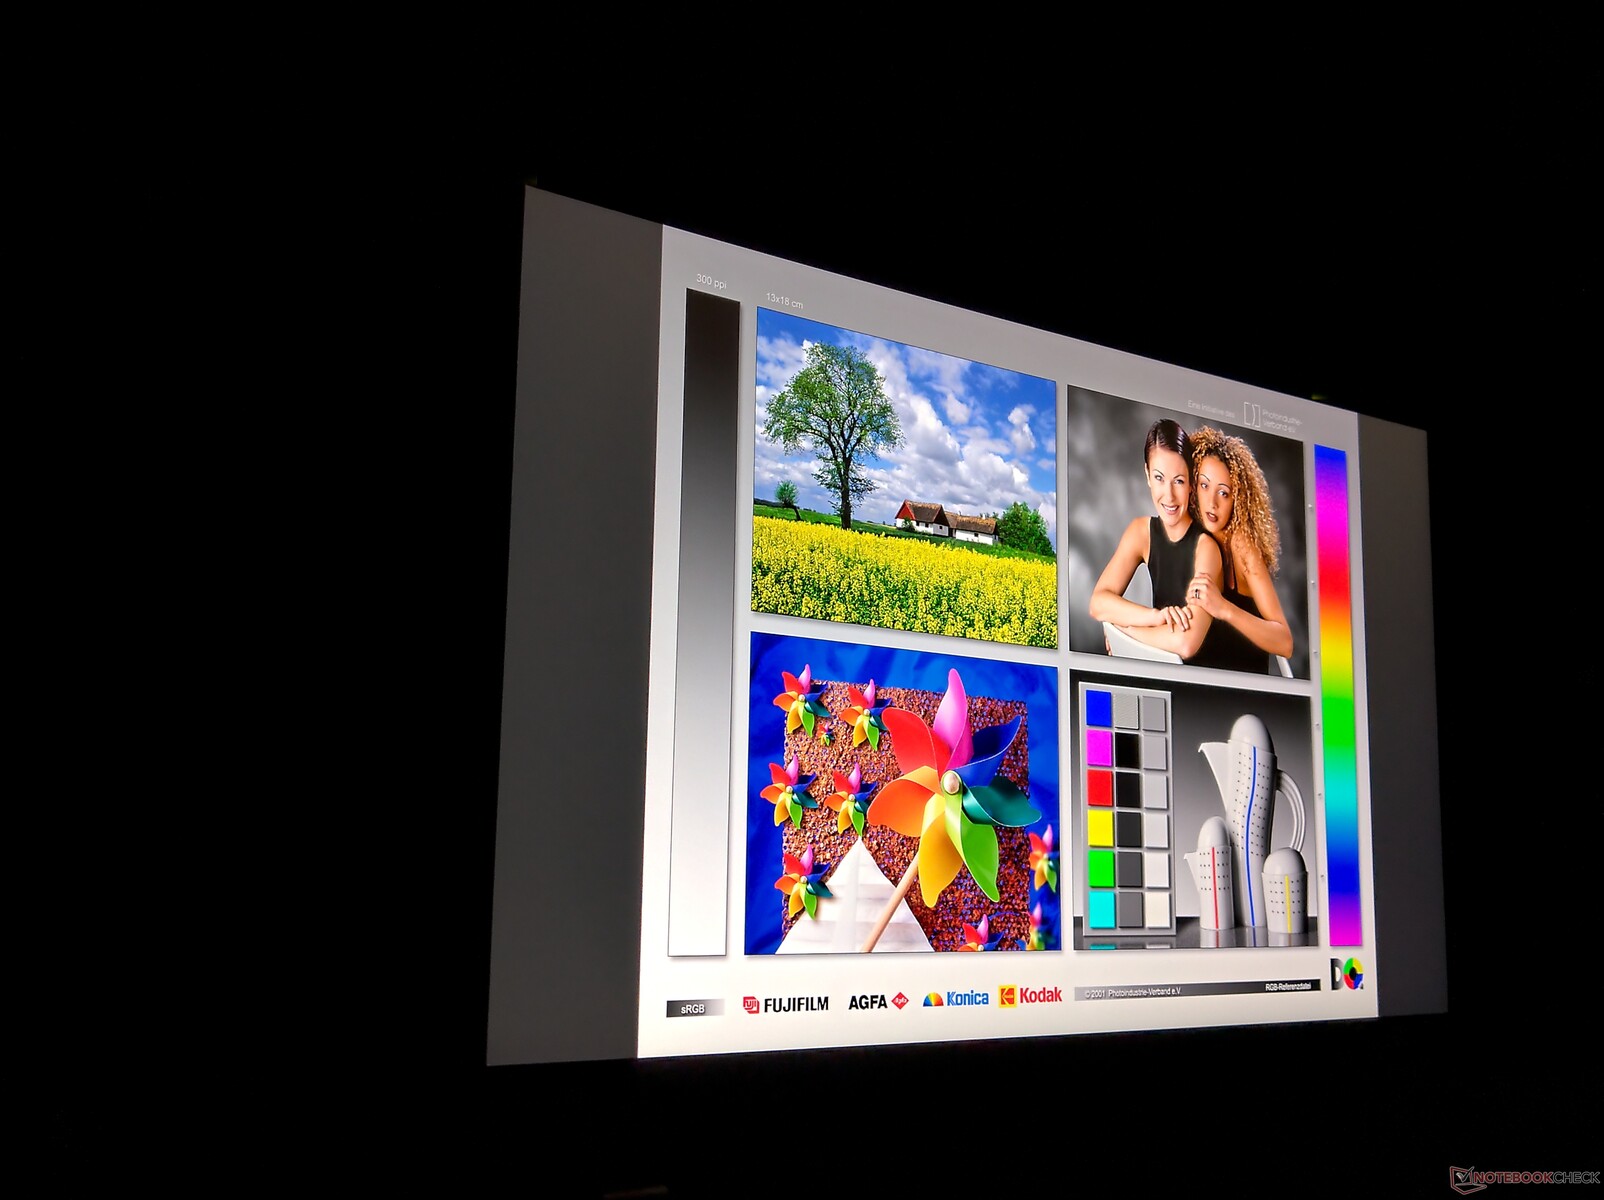
Com um brilho médio medido de 304 cd/m², o visor de nível básico em nossa unidade de teste atinge o valor de brilho prometido. Embora isto torne o visor o mais escuro de nossa comparação, isto não é surpreendente, uma vez que as outras estações de trabalho estão equipadas com displays UHD 4K e o ThinkPad P53 tinha o LCD Full-HD mais brilhante.
A distribuição de brilho abaixo da média se destaca, mas não há nenhum sombreamento perceptível a olho nu
| |||||||||||||||||||||||||
iluminação: 81 %
iluminação com acumulador: 336 cd/m²
Contraste: 751:1 (Preto: 0.45 cd/m²)
ΔE ColorChecker Calman: 5.5 | ∀{0.5-29.43 Ø4.71}
calibrated: 1.9
ΔE Greyscale Calman: 7.8 | ∀{0.09-98 Ø4.96}
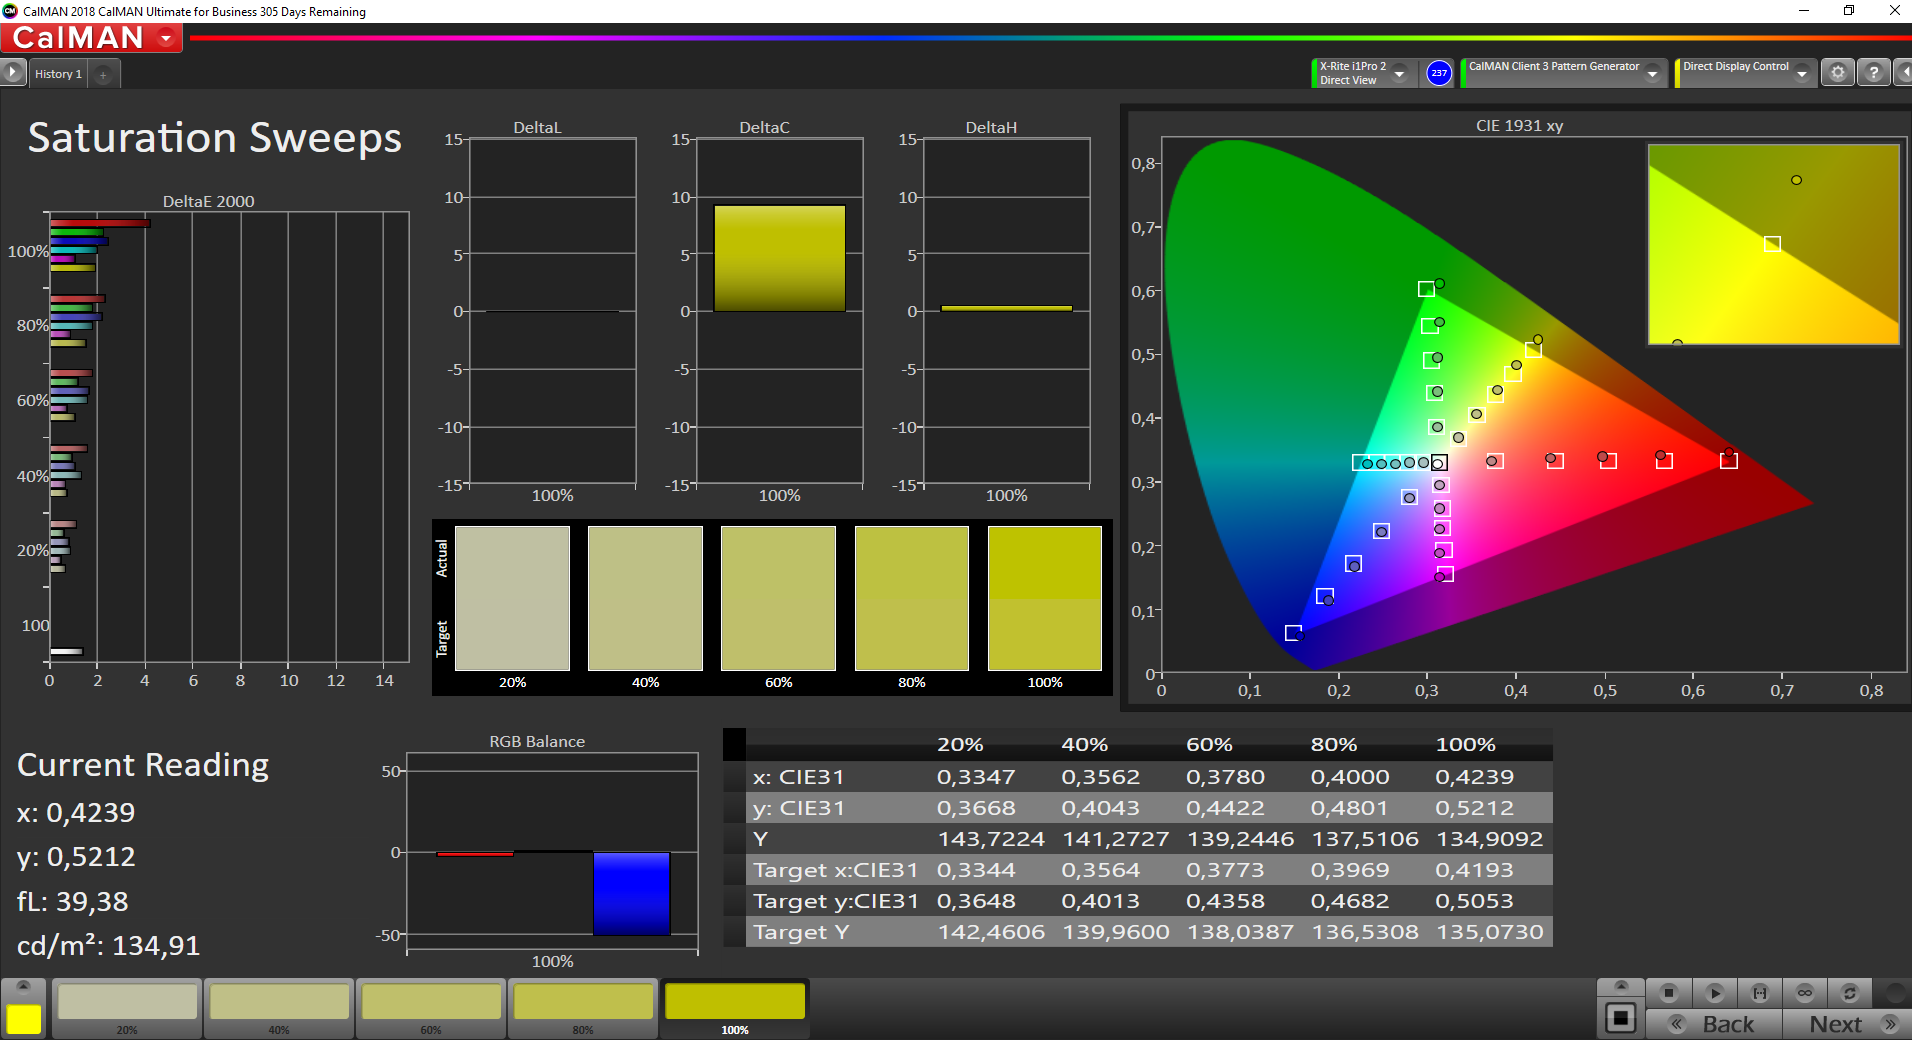
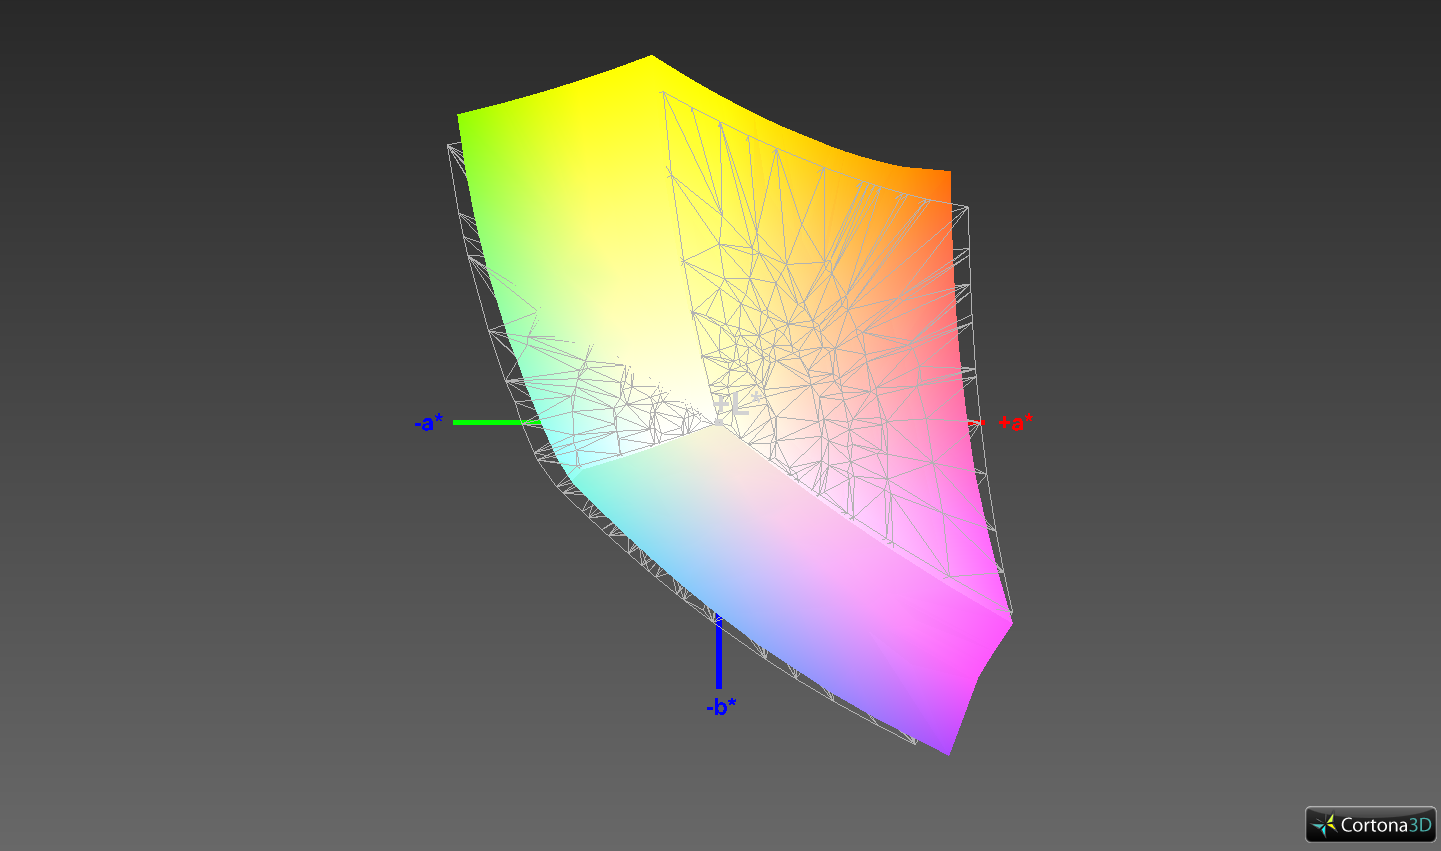
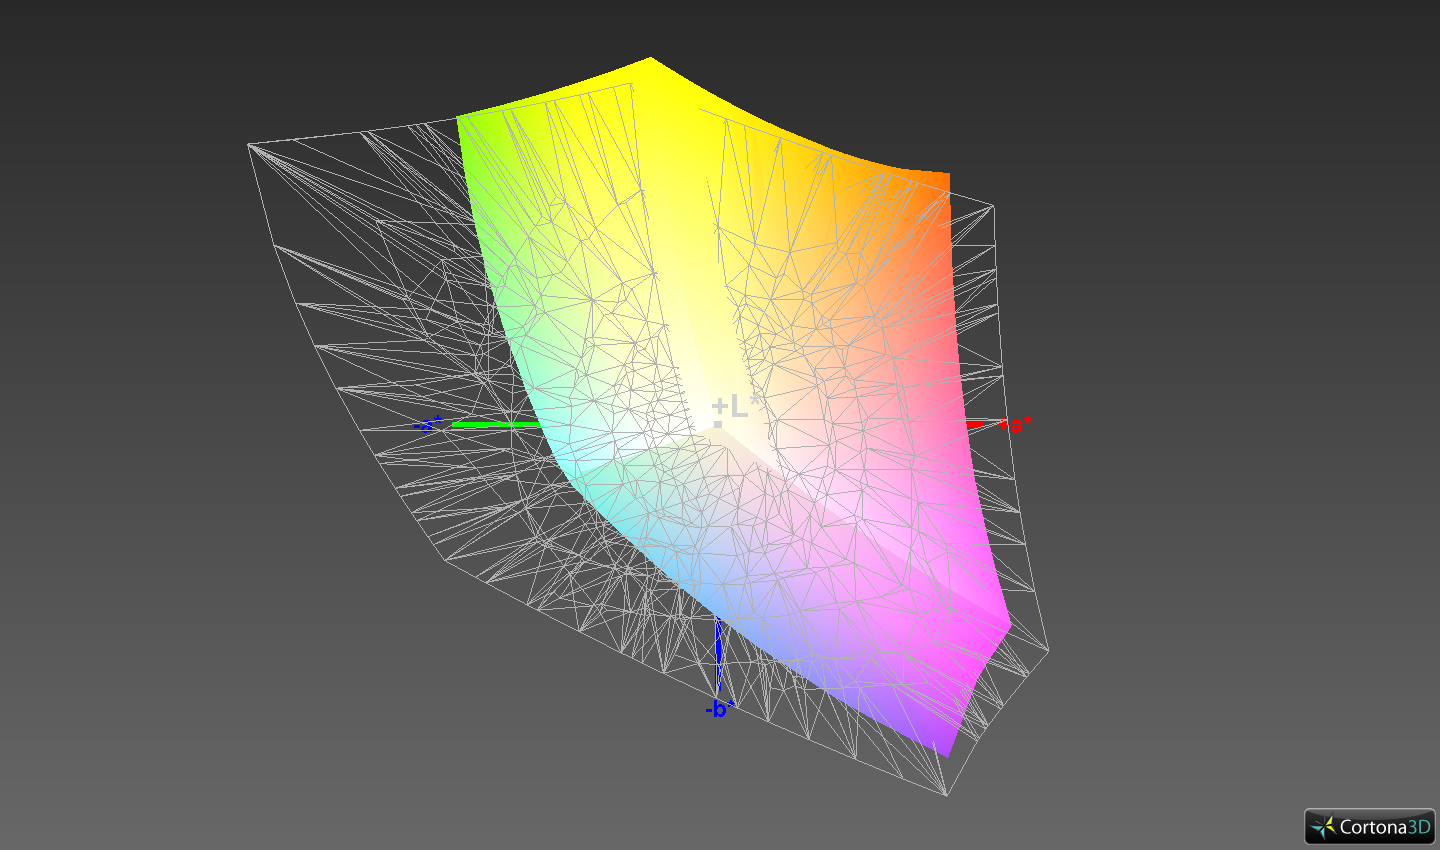
92.1% sRGB (Argyll 1.6.3 3D)
60% AdobeRGB 1998 (Argyll 1.6.3 3D)
67.1% AdobeRGB 1998 (Argyll 3D)
92.3% sRGB (Argyll 3D)
66.6% Display P3 (Argyll 3D)
Gamma: 2.24
CCT: 6764 K
| Lenovo ThinkPad P15 Gen1-20ST000DGE N156HCE-EN1, a-Si IPS LED, 1920x1080, 15.6" | Lenovo ThinkPad P53-20QN000YGE N156HCE-GN1, IPS, 1920x1080, 15.6" | Lenovo ThinkPad T15p-20TN0006GE MNF601EA1-1, IPS LED, 3840x2160, 15.6" | Dell Precision 7550 AU Optronics B156ZAN, IPS, 3840x2160, 15.6" | HP ZBook Fury 15 G7 LG Philips LGD0661, IPS, 3840x2160, 15.6" | |
|---|---|---|---|---|---|
| Display | -3% | 28% | 25% | 26% | |
| Display P3 Coverage (%) | 66.6 | 63.2 -5% | 86.8 30% | 82.1 23% | 95.6 44% |
| sRGB Coverage (%) | 92.3 | 92.9 1% | 99.3 8% | 99.6 8% | 99.8 8% |
| AdobeRGB 1998 Coverage (%) | 67.1 | 64.3 -4% | 98.5 47% | 96.8 44% | 84.5 26% |
| Response Times | 15% | 17% | -14% | -23% | |
| Response Time Grey 50% / Grey 80% * (ms) | 41.2 ? | 38.4 ? 7% | 41.6 ? -1% | 51.2 ? -24% | 56 ? -36% |
| Response Time Black / White * (ms) | 32.8 ? | 25.2 ? 23% | 21.2 ? 35% | 34 ? -4% | 36 ? -10% |
| PWM Frequency (Hz) | 24270 | 26040 ? | |||
| Screen | 39% | 64% | 14% | 35% | |
| Brightness middle (cd/m²) | 338 | 510 51% | 595 76% | 473.5 40% | 672.8 99% |
| Brightness (cd/m²) | 304 | 468 54% | 594 95% | 461 52% | 674 122% |
| Brightness Distribution (%) | 81 | 89 10% | 94 16% | 90 11% | 89 10% |
| Black Level * (cd/m²) | 0.45 | 0.36 20% | 0.32 29% | 0.55 -22% | 0.5 -11% |
| Contrast (:1) | 751 | 1417 89% | 1859 148% | 861 15% | 1346 79% |
| Colorchecker dE 2000 * | 5.5 | 2.3 58% | 1.2 78% | 4.8 13% | 3.48 37% |
| Colorchecker dE 2000 max. * | 11.5 | 5.5 52% | 2.5 78% | 8.73 24% | 9.44 18% |
| Colorchecker dE 2000 calibrated * | 1.9 | 1.2 37% | 1 47% | 3.08 -62% | 3.03 -59% |
| Greyscale dE 2000 * | 7.8 | 3.2 59% | 1.4 82% | 5.6 28% | 3.1 60% |
| Gamma | 2.24 98% | 2.34 94% | 2.1 105% | 2.34 94% | 2.04 108% |
| CCT | 6764 96% | 7036 92% | 6492 100% | 7549 86% | 6380 102% |
| Color Space (Percent of AdobeRGB 1998) (%) | 60 | 59.4 -1% | 85.3 42% | 86.4 44% | 75.2 25% |
| Color Space (Percent of sRGB) (%) | 92.1 | 93.1 1% | 99.2 8% | 99.7 8% | 100 9% |
| Média Total (Programa/Configurações) | 17% /
28% | 36% /
51% | 8% /
12% | 13% /
26% |
* ... menor é melhor
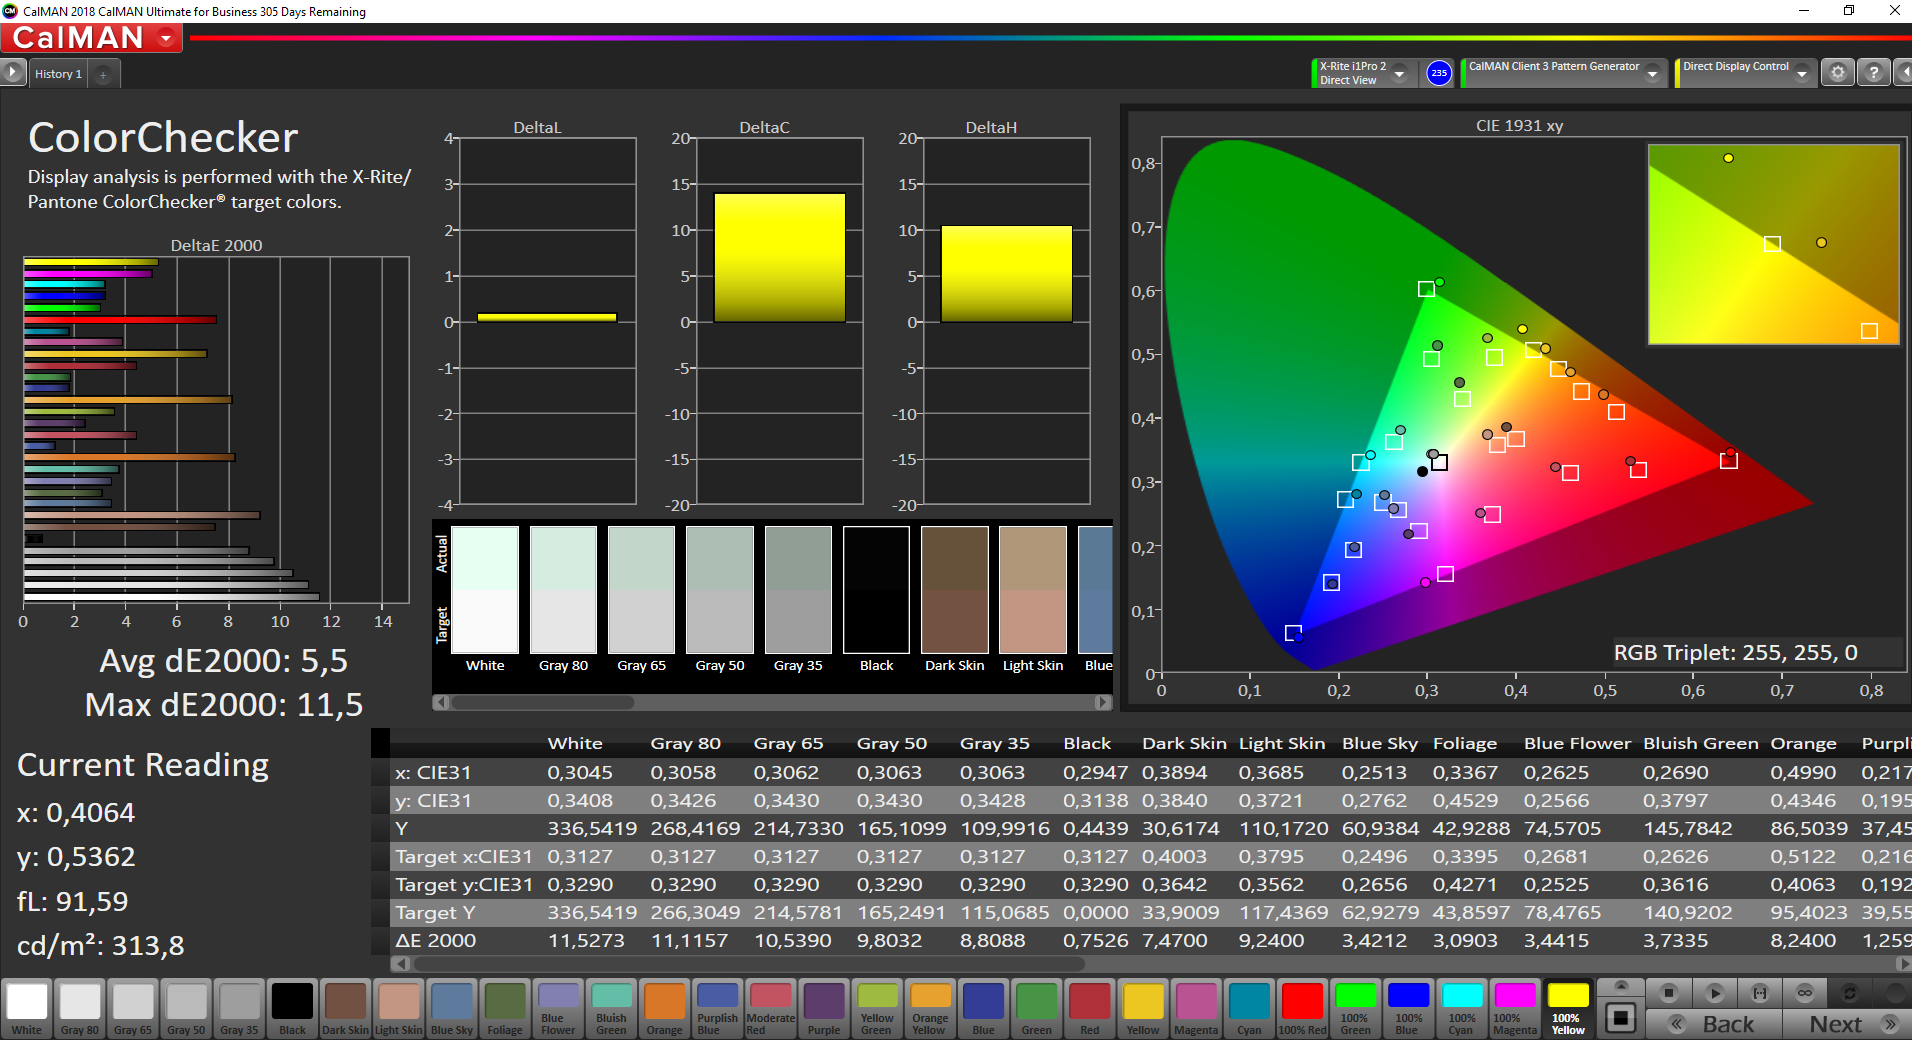
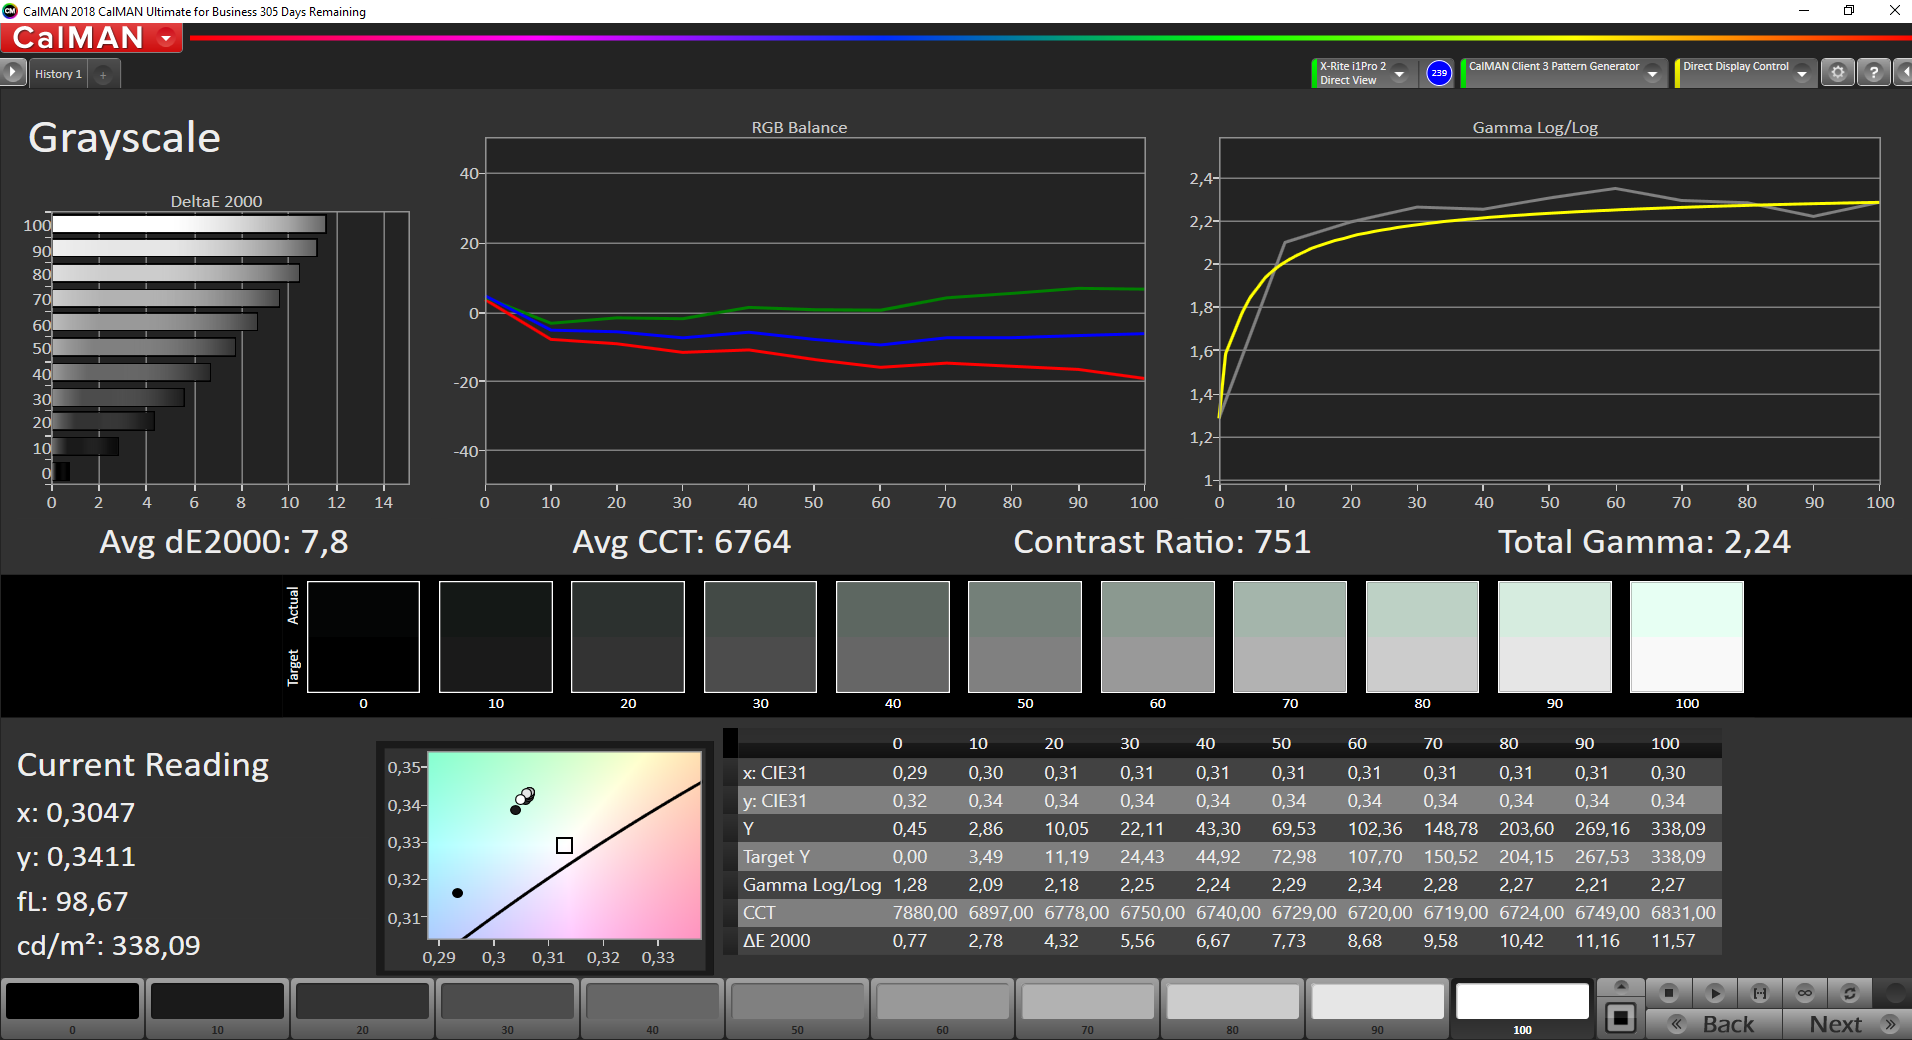
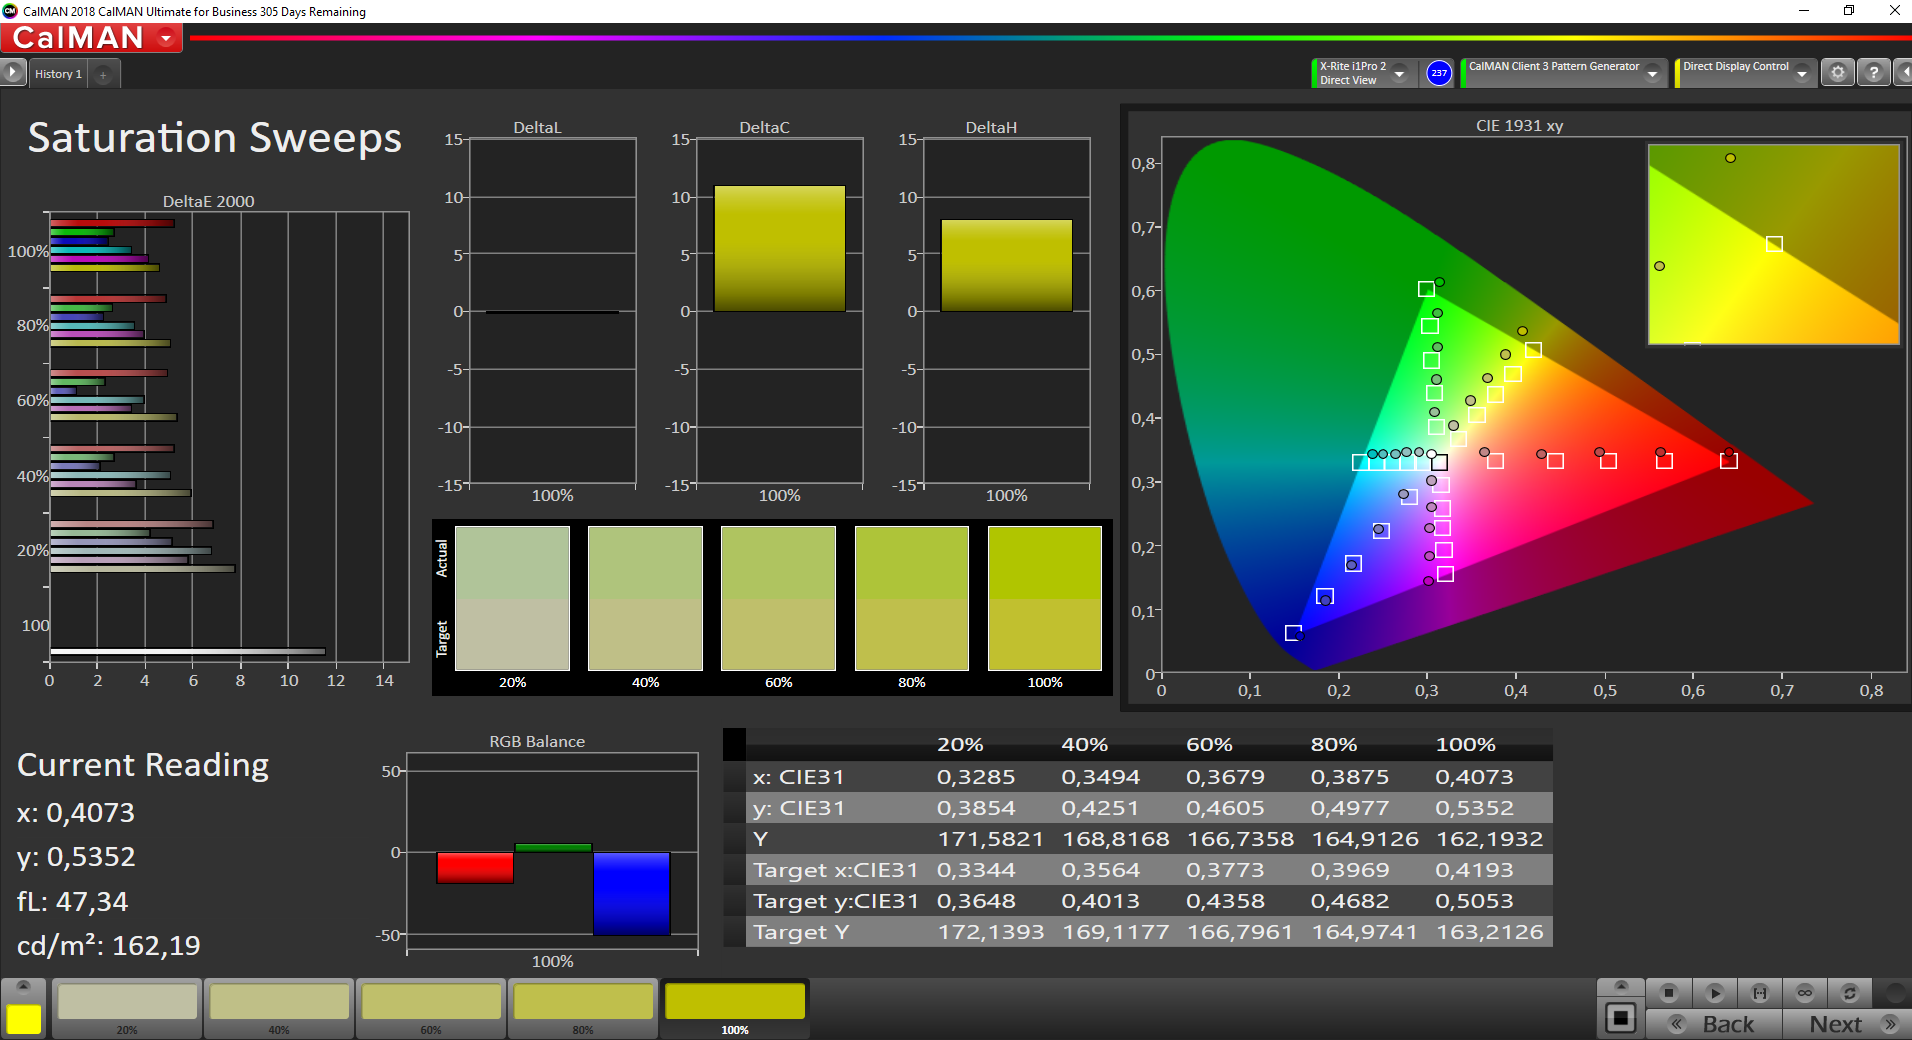
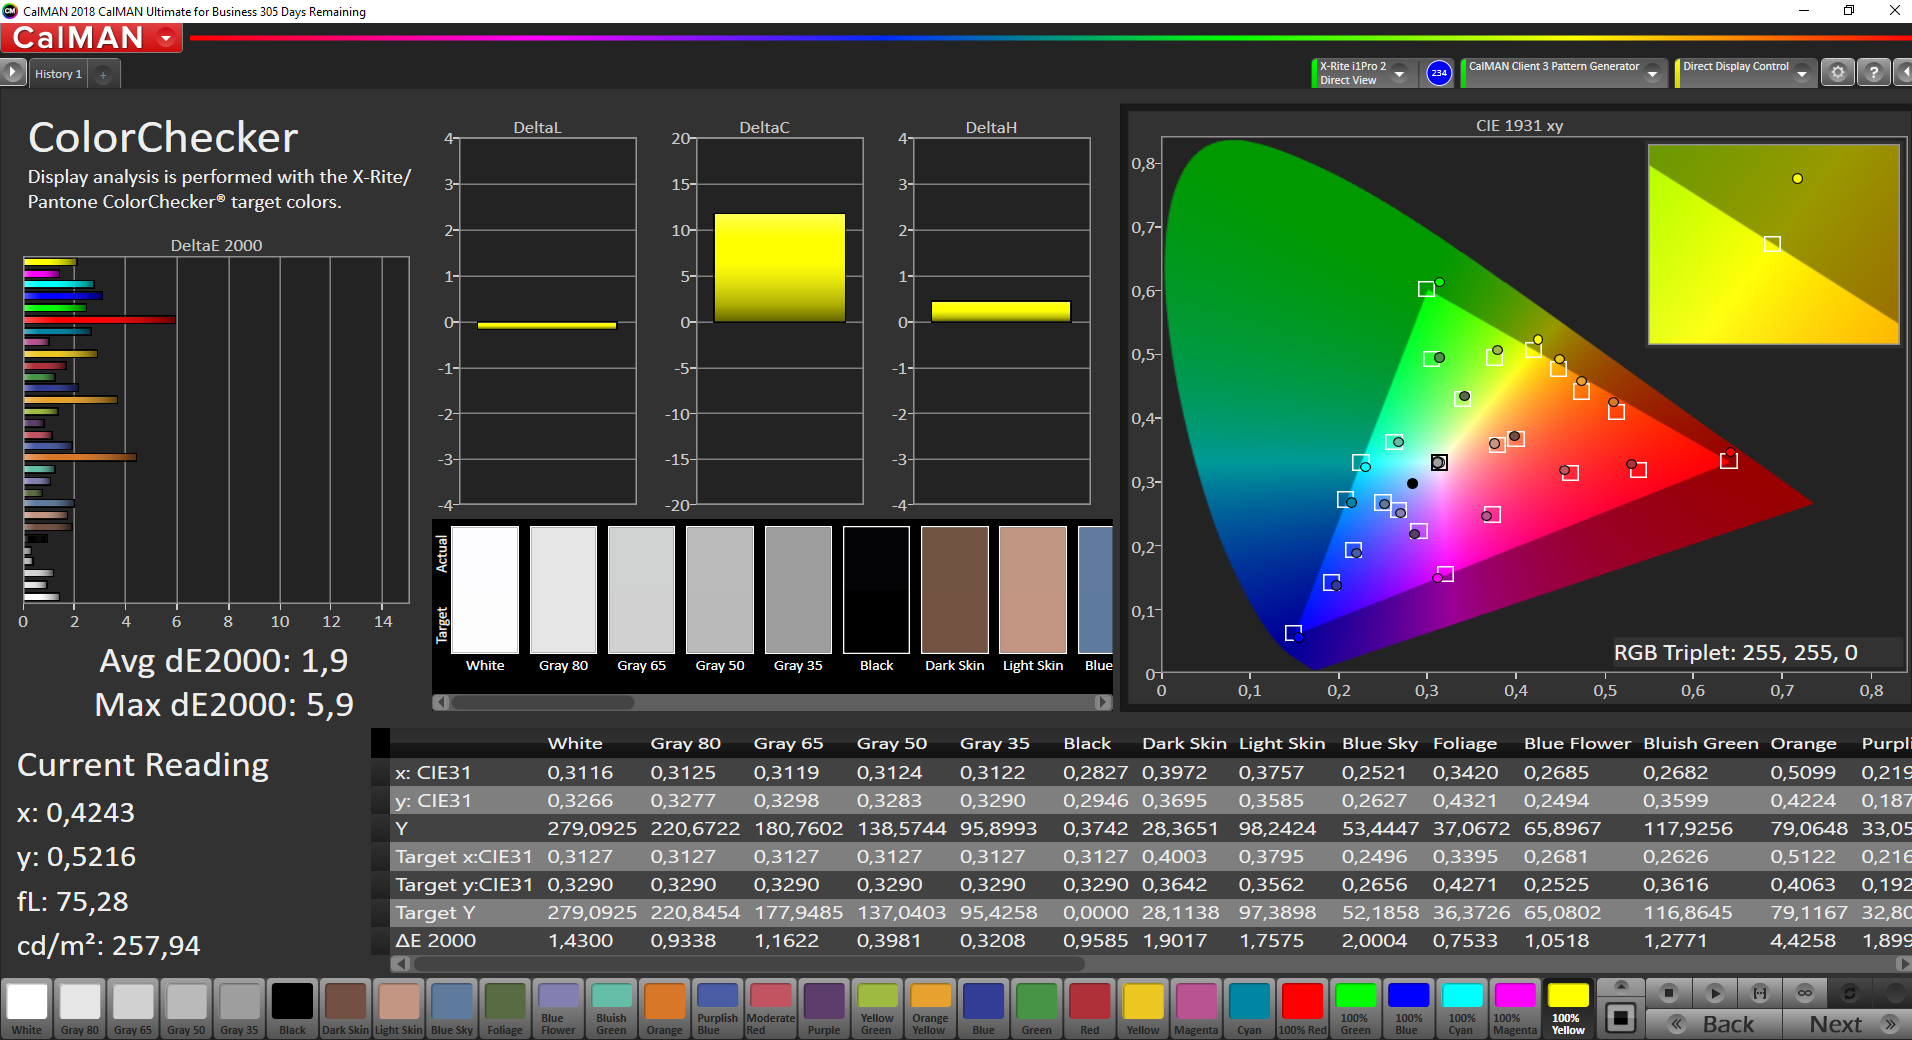
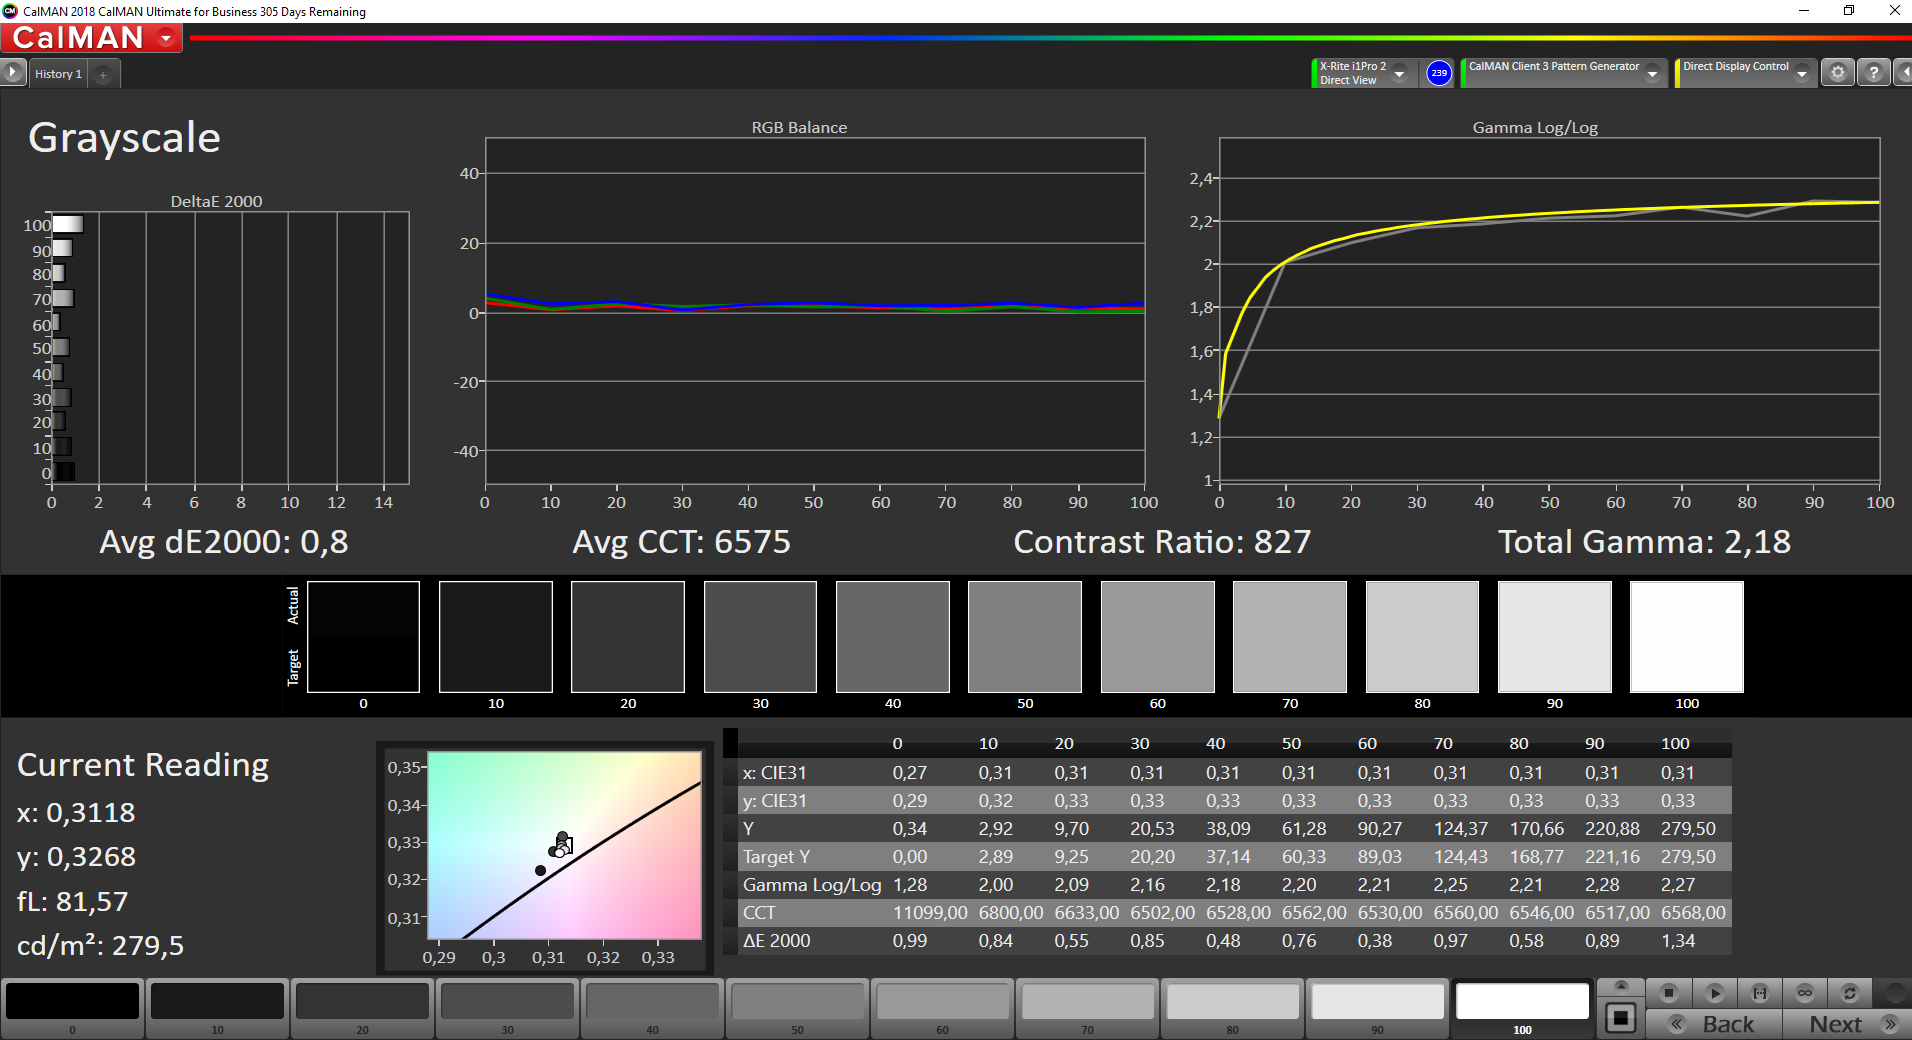
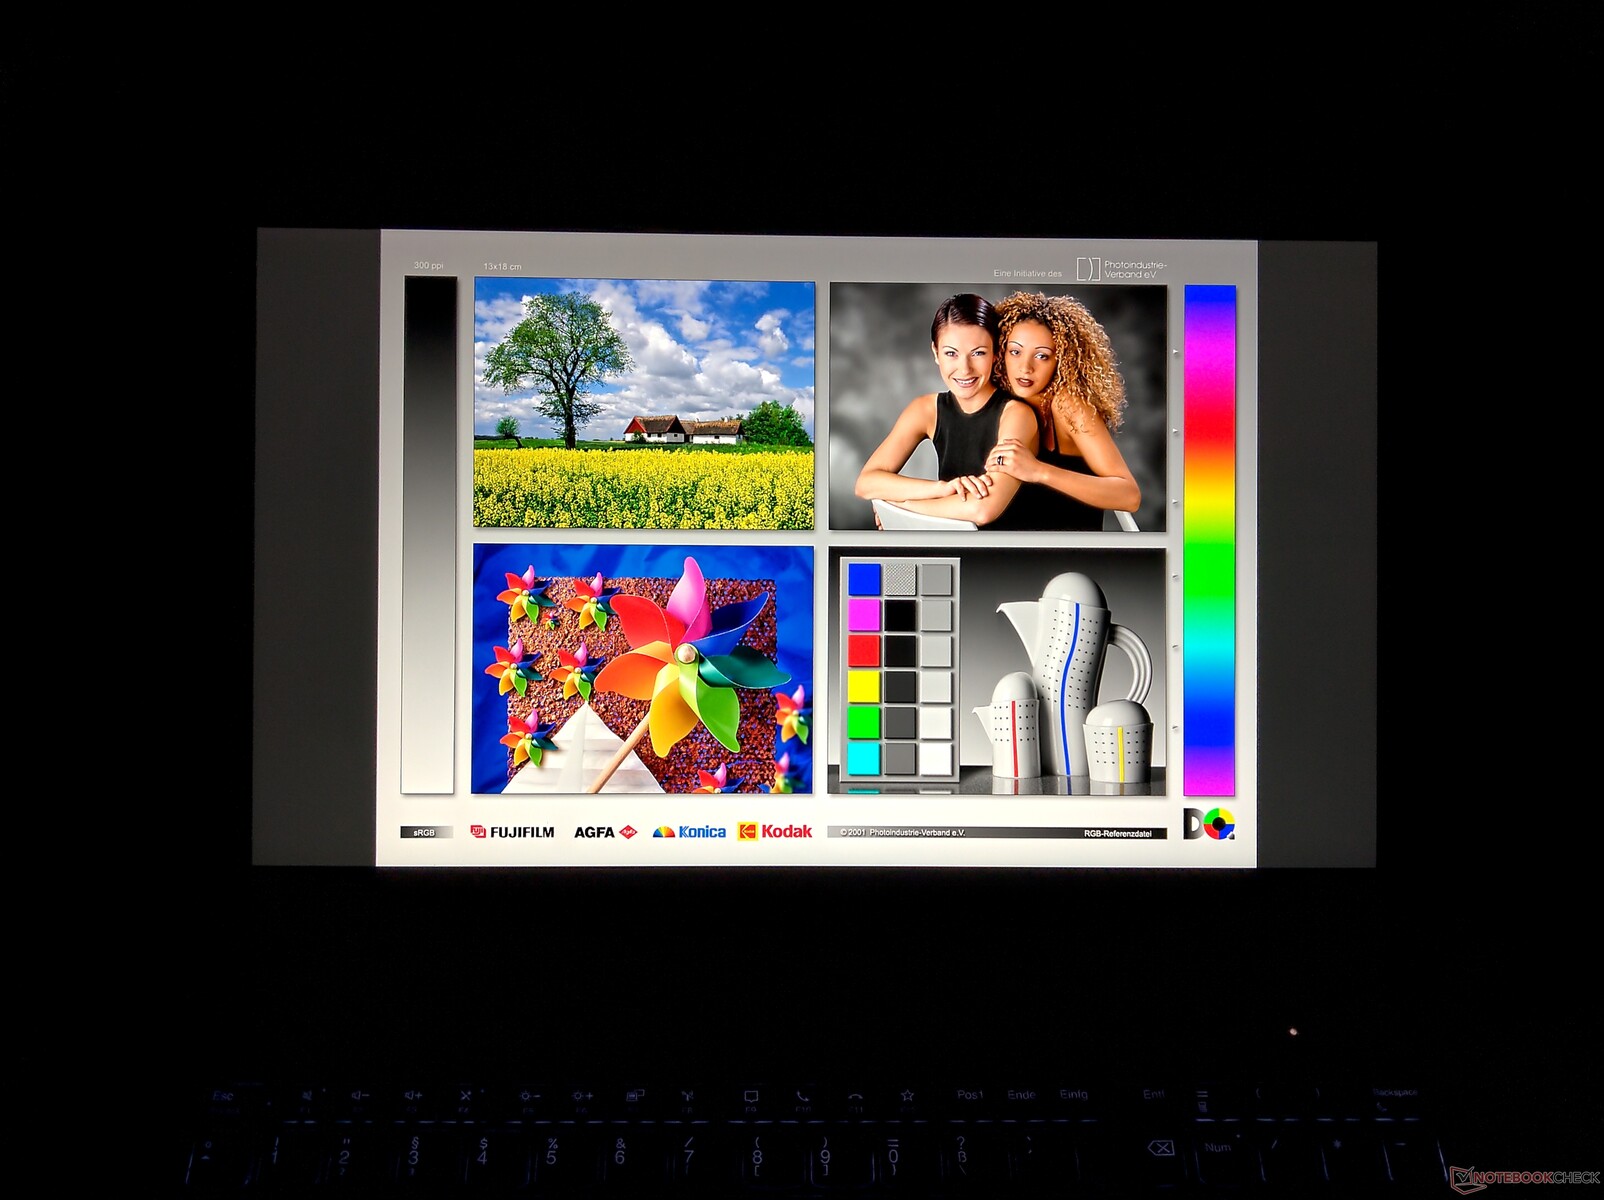
No estado de entrega, o visor não está bem calibrado, o que pode ser visto claramente nos valores que medimos com o CalMan e o medidor de cores X-Rite i1 Pro 2: O LCD do ThinkPad tem uma tonalidade verde. Uma calibragem decente irá remediar isto, e estamos oferecendo o perfil de cor correspondente como um download gratuito. Entretanto, devido à calibração, o brilho máximo no centro do painel LCD cairá em cerca de 60 cd/m².
Estamos um pouco desapontados com o valor do contraste. Embora 751:1 não seja extremamente ruim, também não é um bom valor. Também faltam alguns pontos percentuais para cobrir totalmente o espaço de cor sRGB, mas este também foi o caso no ThinkPad P53 com a tela de 500-cd/m²
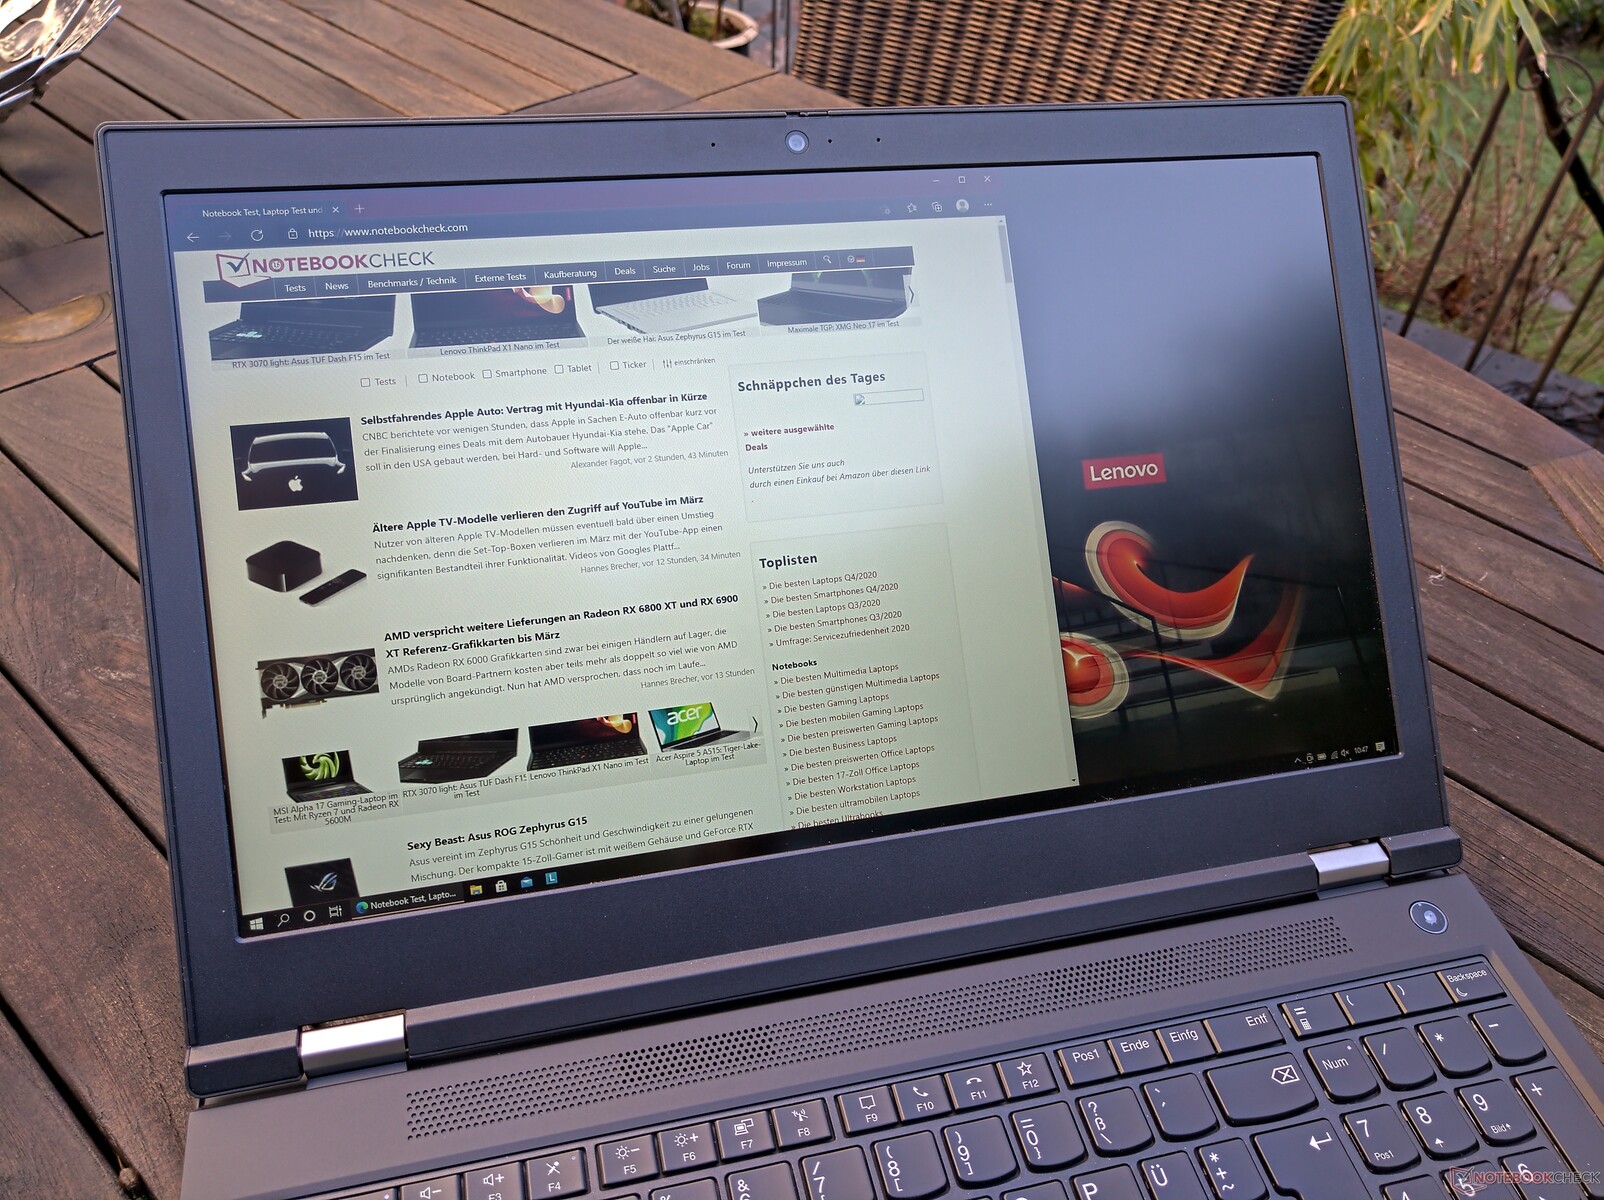
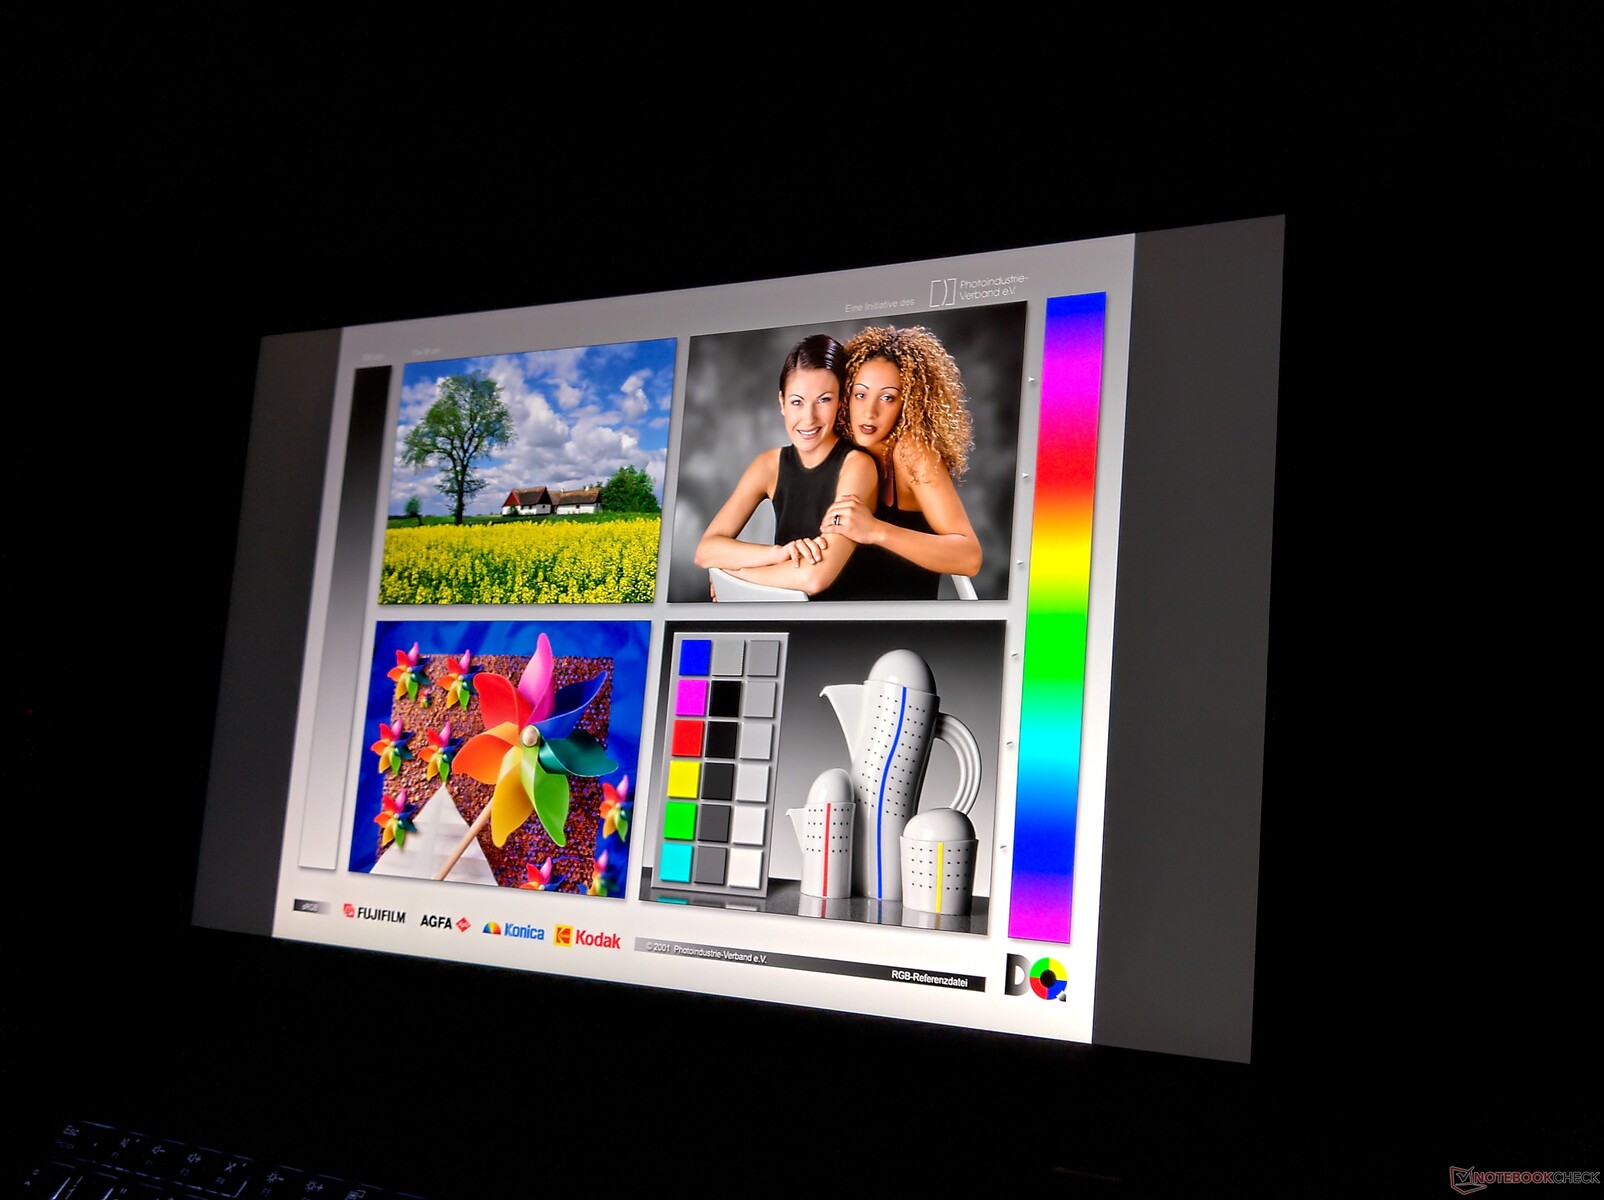
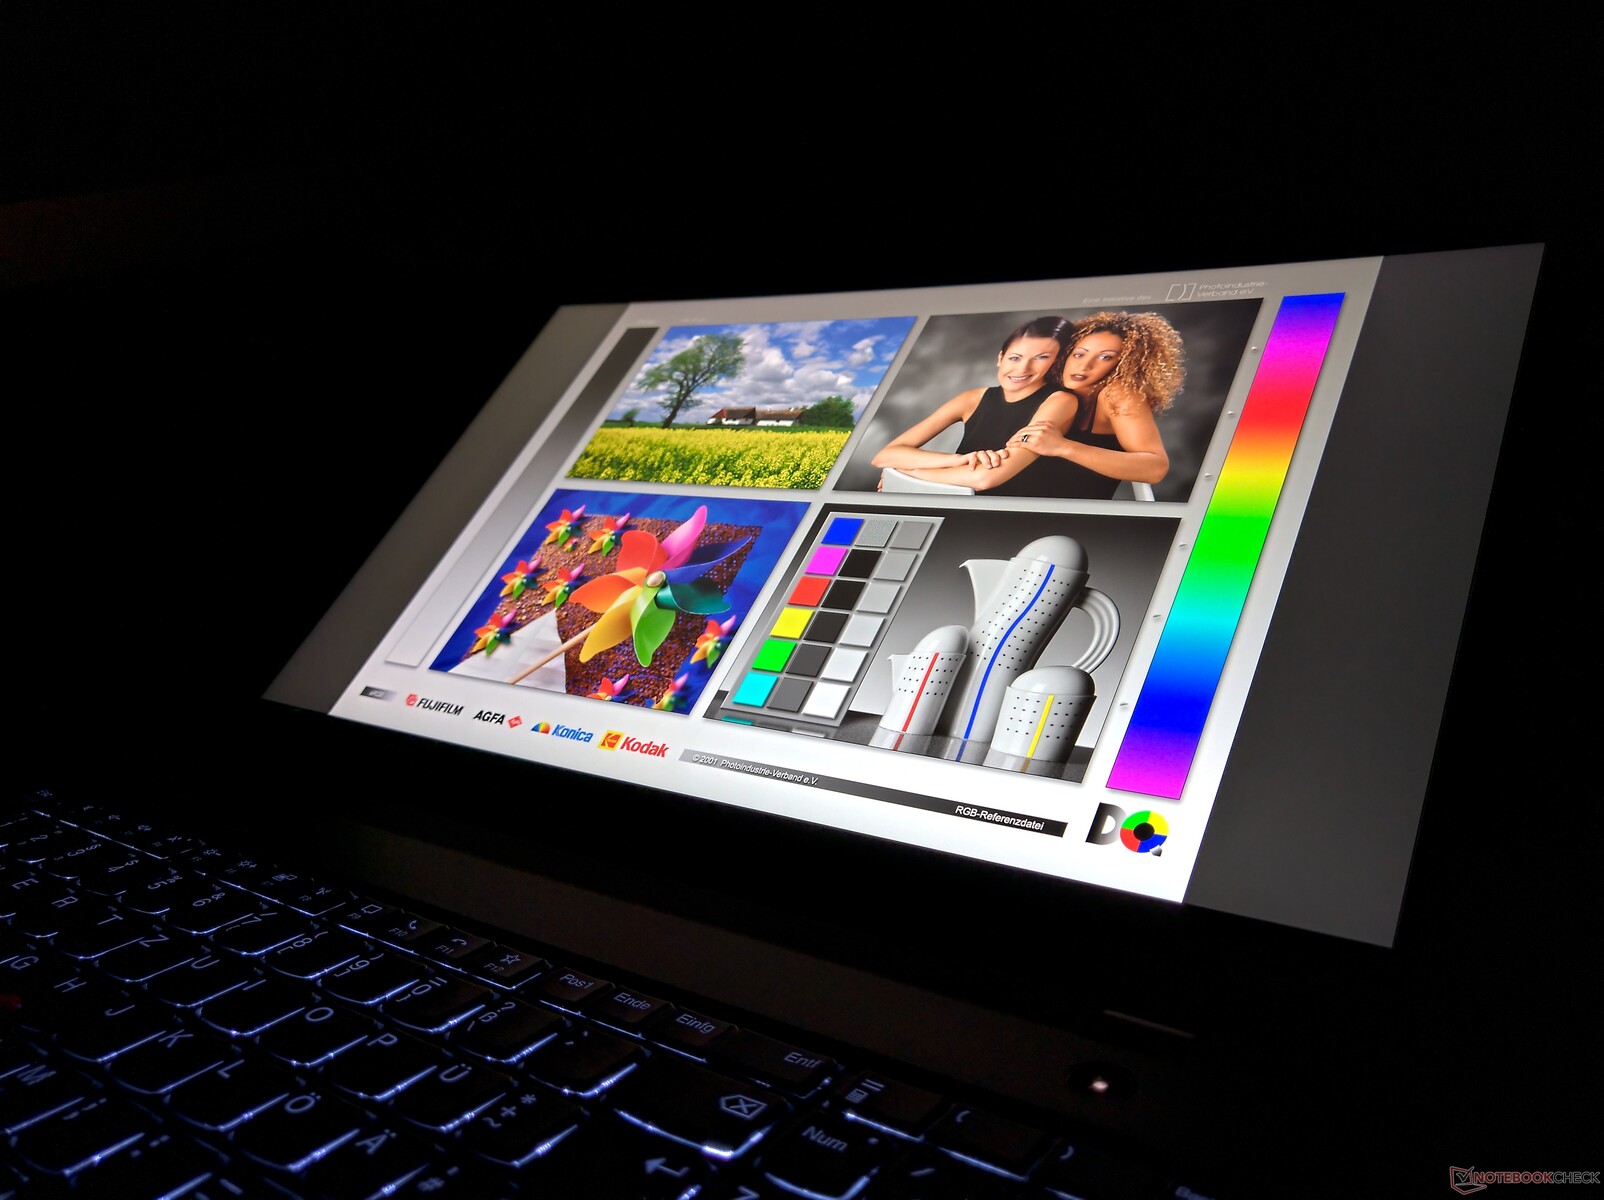
Embora você também possa usar o Lenovo ThinkPad P15 Gen 1 ao ar livre, este é apenas o caso na sombra ou em dias nublados. Para a luz solar direta, seria necessário um brilho mais alto
Exibir tempos de resposta
| ↔ Tempo de resposta preto para branco | ||
|---|---|---|
| 32.8 ms ... ascensão ↗ e queda ↘ combinadas | ↗ 18.8 ms ascensão | 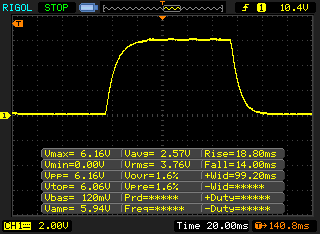 |
| ↘ 14 ms queda | ||
| A tela mostra taxas de resposta lentas em nossos testes e será insatisfatória para os jogadores. Em comparação, todos os dispositivos testados variam de 0.1 (mínimo) a 240 (máximo) ms. » 88 % de todos os dispositivos são melhores. Isso significa que o tempo de resposta medido é pior que a média de todos os dispositivos testados (19.8 ms). | ||
| ↔ Tempo de resposta 50% cinza a 80% cinza | ||
| 41.2 ms ... ascensão ↗ e queda ↘ combinadas | ↗ 22 ms ascensão | 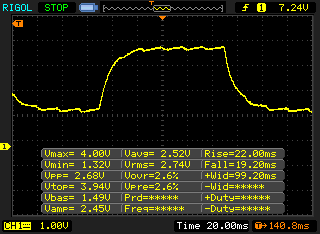 |
| ↘ 19.2 ms queda | ||
| A tela mostra taxas de resposta lentas em nossos testes e será insatisfatória para os jogadores. Em comparação, todos os dispositivos testados variam de 0.165 (mínimo) a 636 (máximo) ms. » 66 % de todos os dispositivos são melhores. Isso significa que o tempo de resposta medido é pior que a média de todos os dispositivos testados (30.9 ms). | ||
Cintilação da tela / PWM (modulação por largura de pulso)
| Tela tremeluzindo/PWM detectado | 24270 Hz | 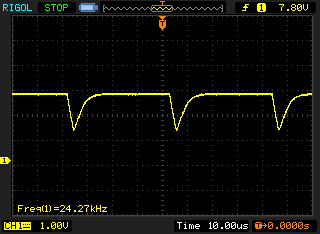 | |
A luz de fundo da tela pisca em 24270 Hz (pior caso, por exemplo, utilizando PWM) . A frequência de 24270 Hz é bastante alta, então a maioria dos usuários sensíveis ao PWM não deve notar nenhuma oscilação. [pwm_comparison] Em comparação: 52 % de todos os dispositivos testados não usam PWM para escurecer a tela. Se PWM foi detectado, uma média de 7748 (mínimo: 5 - máximo: 343500) Hz foi medida. | |||
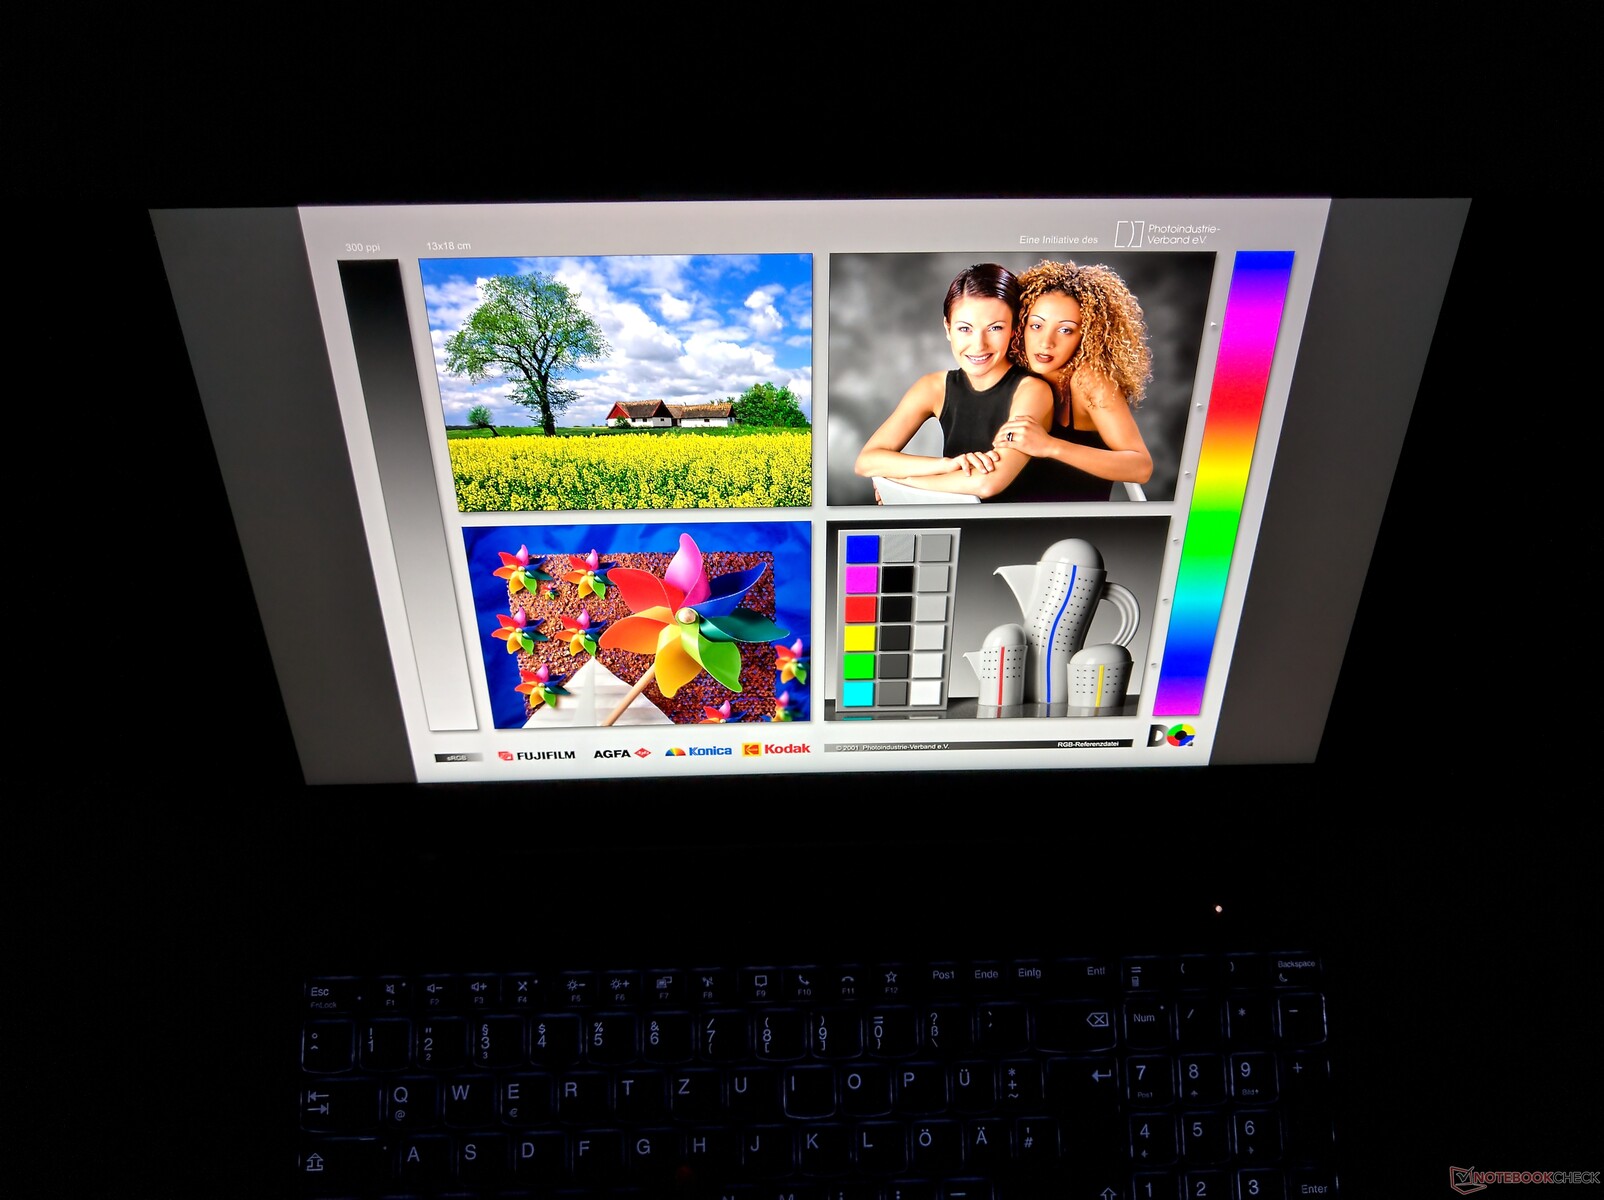
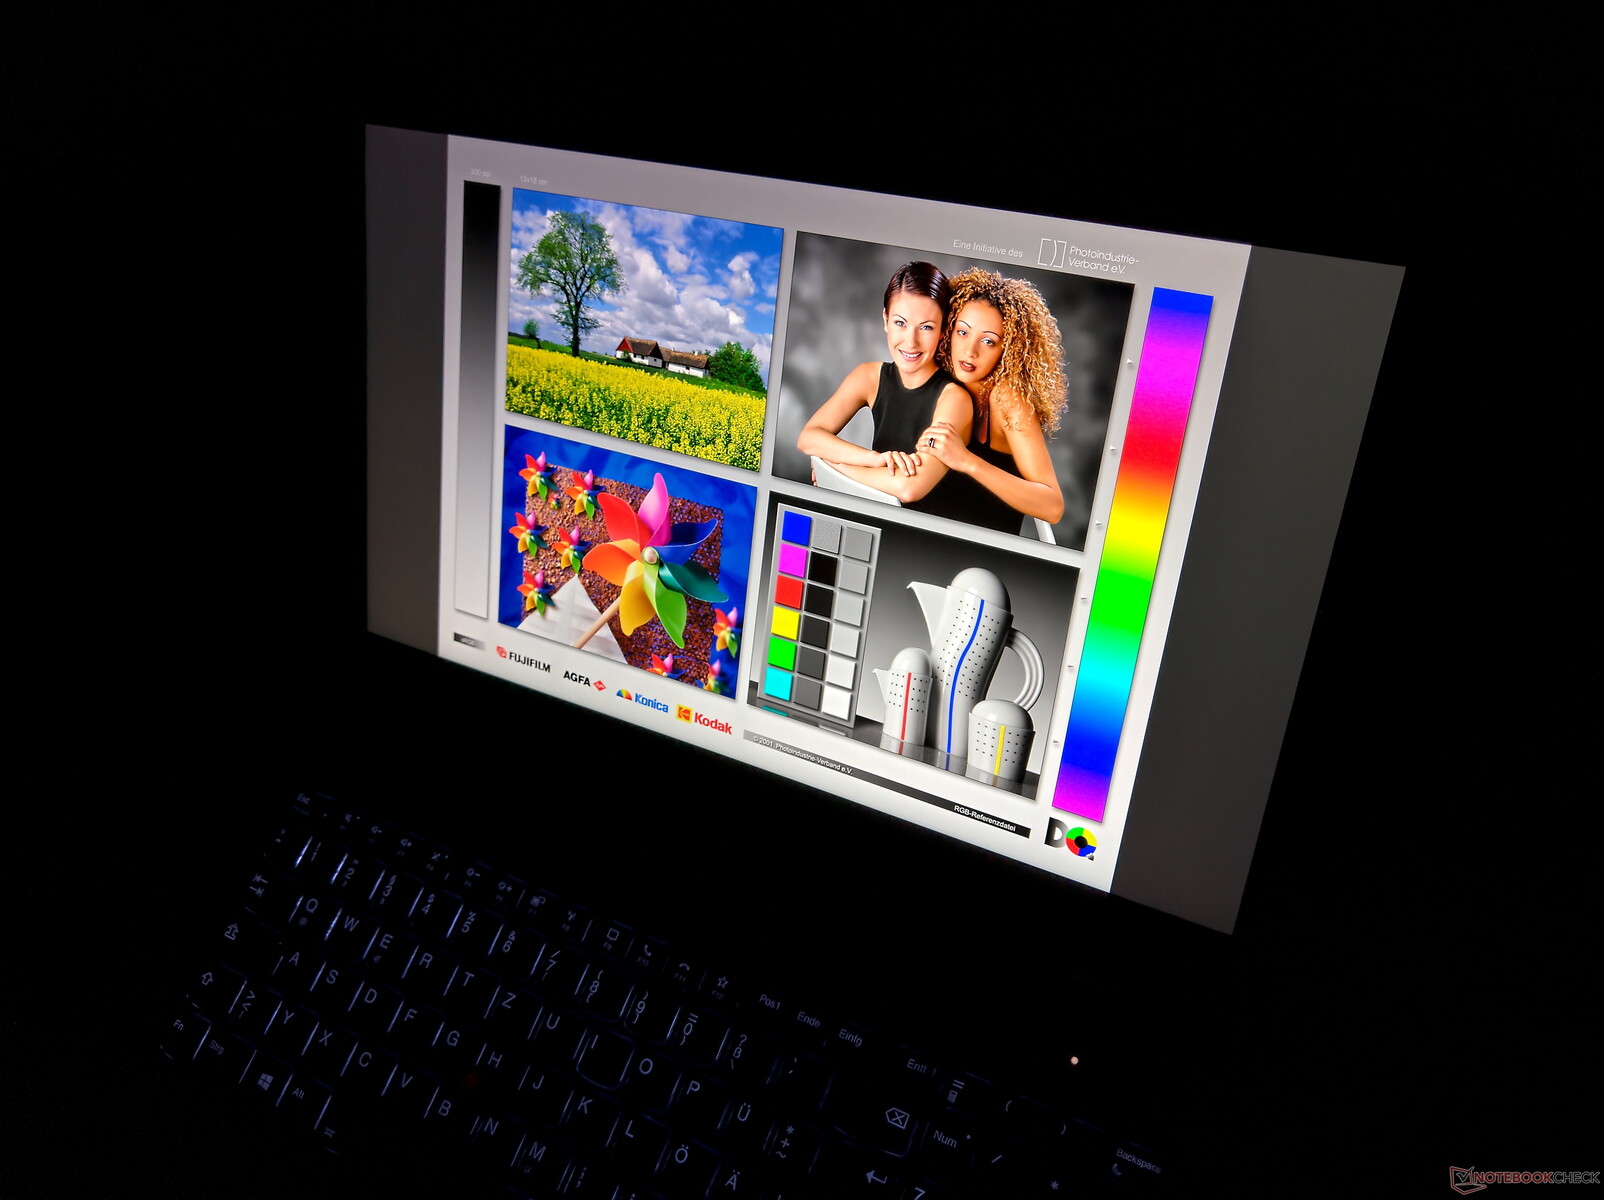
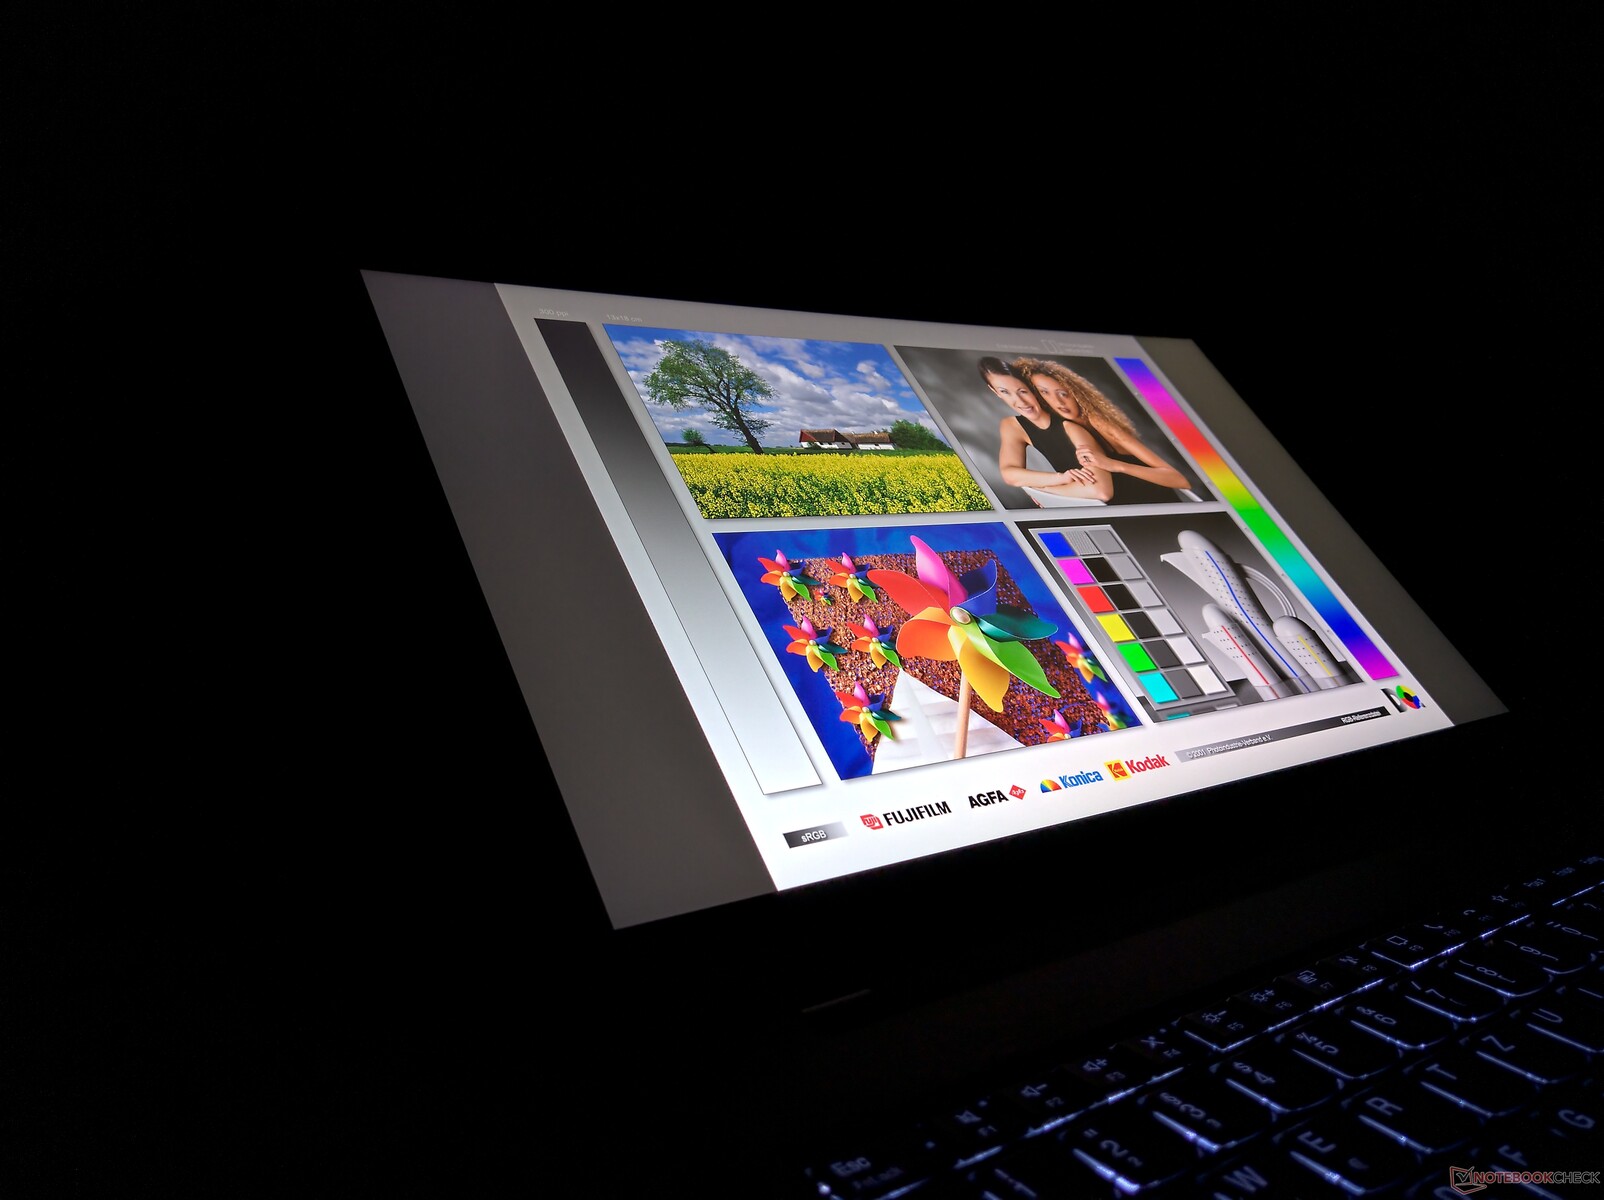
A estabilidade do ângulo de visão do visor IPS não oferece motivo de reclamação.
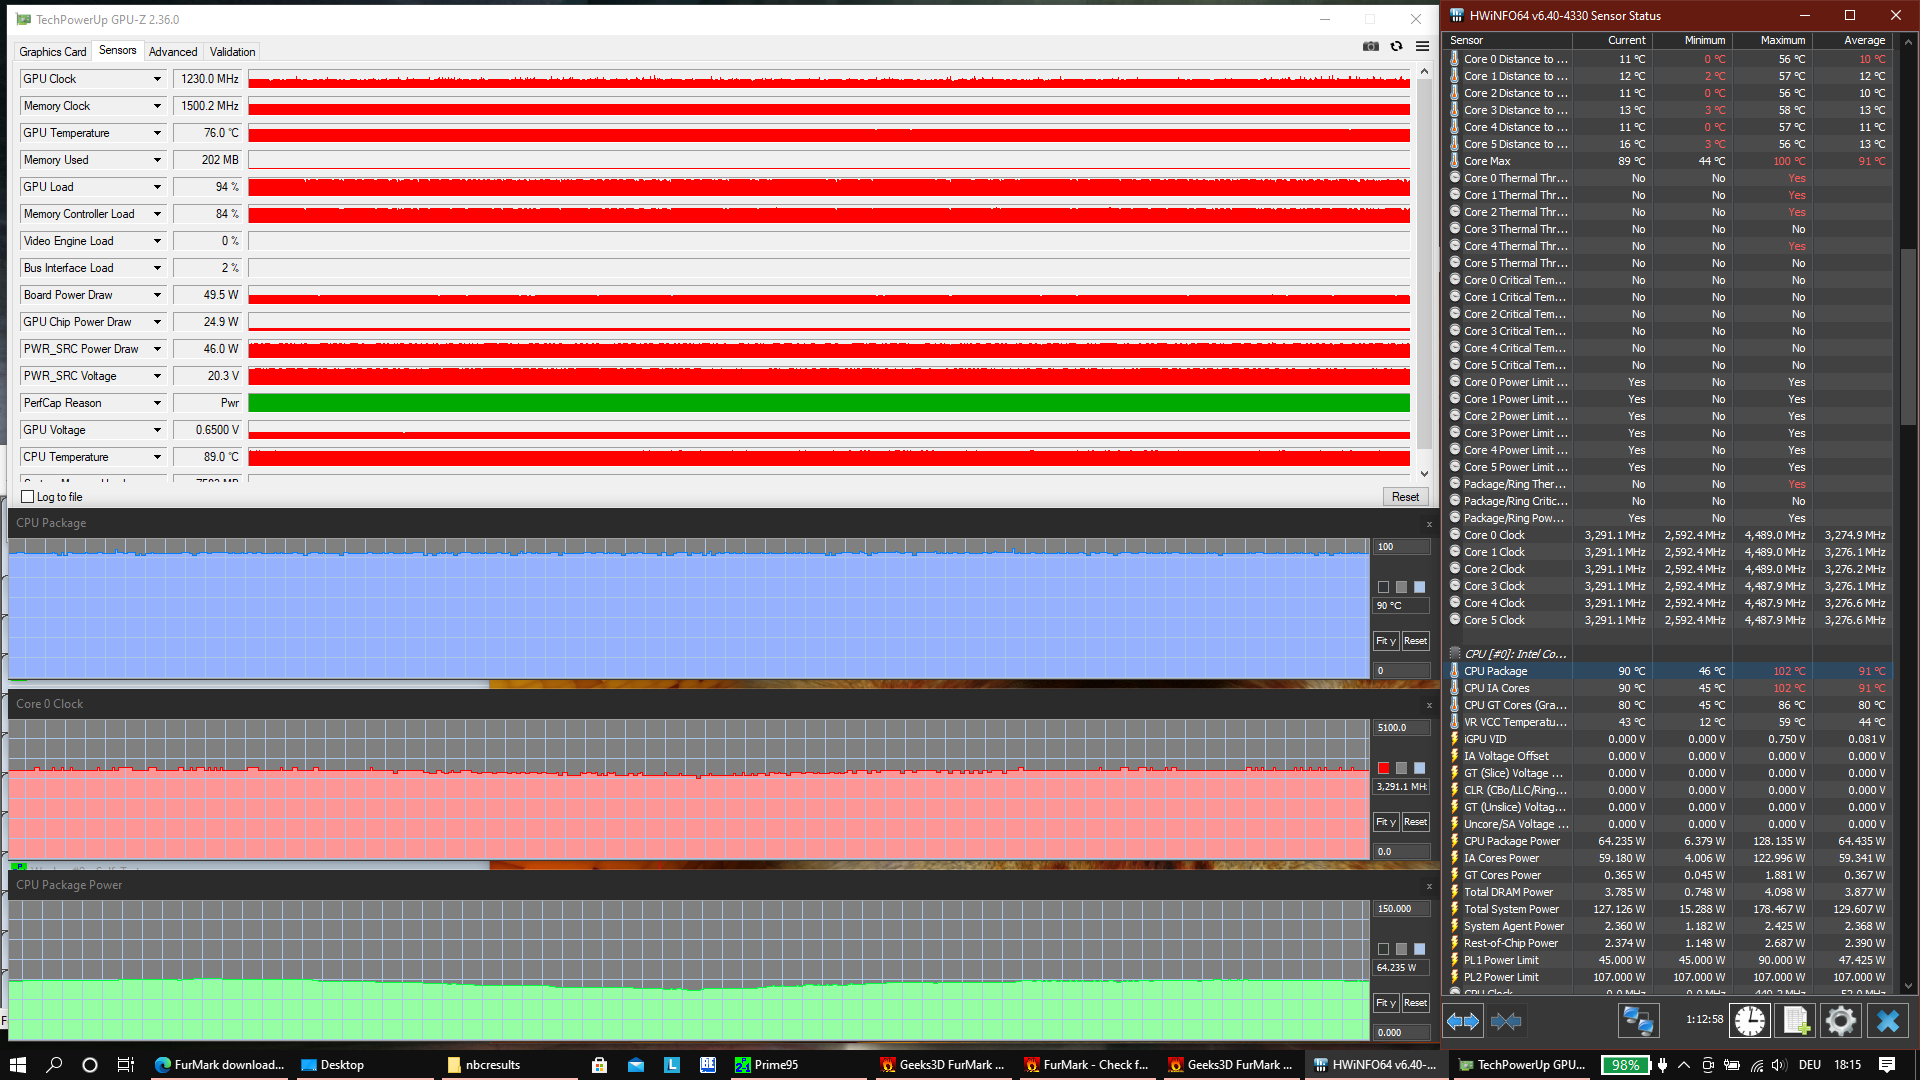
Desempenho: A CPU do laptop Lenovo pode consumir mais de 100 watts
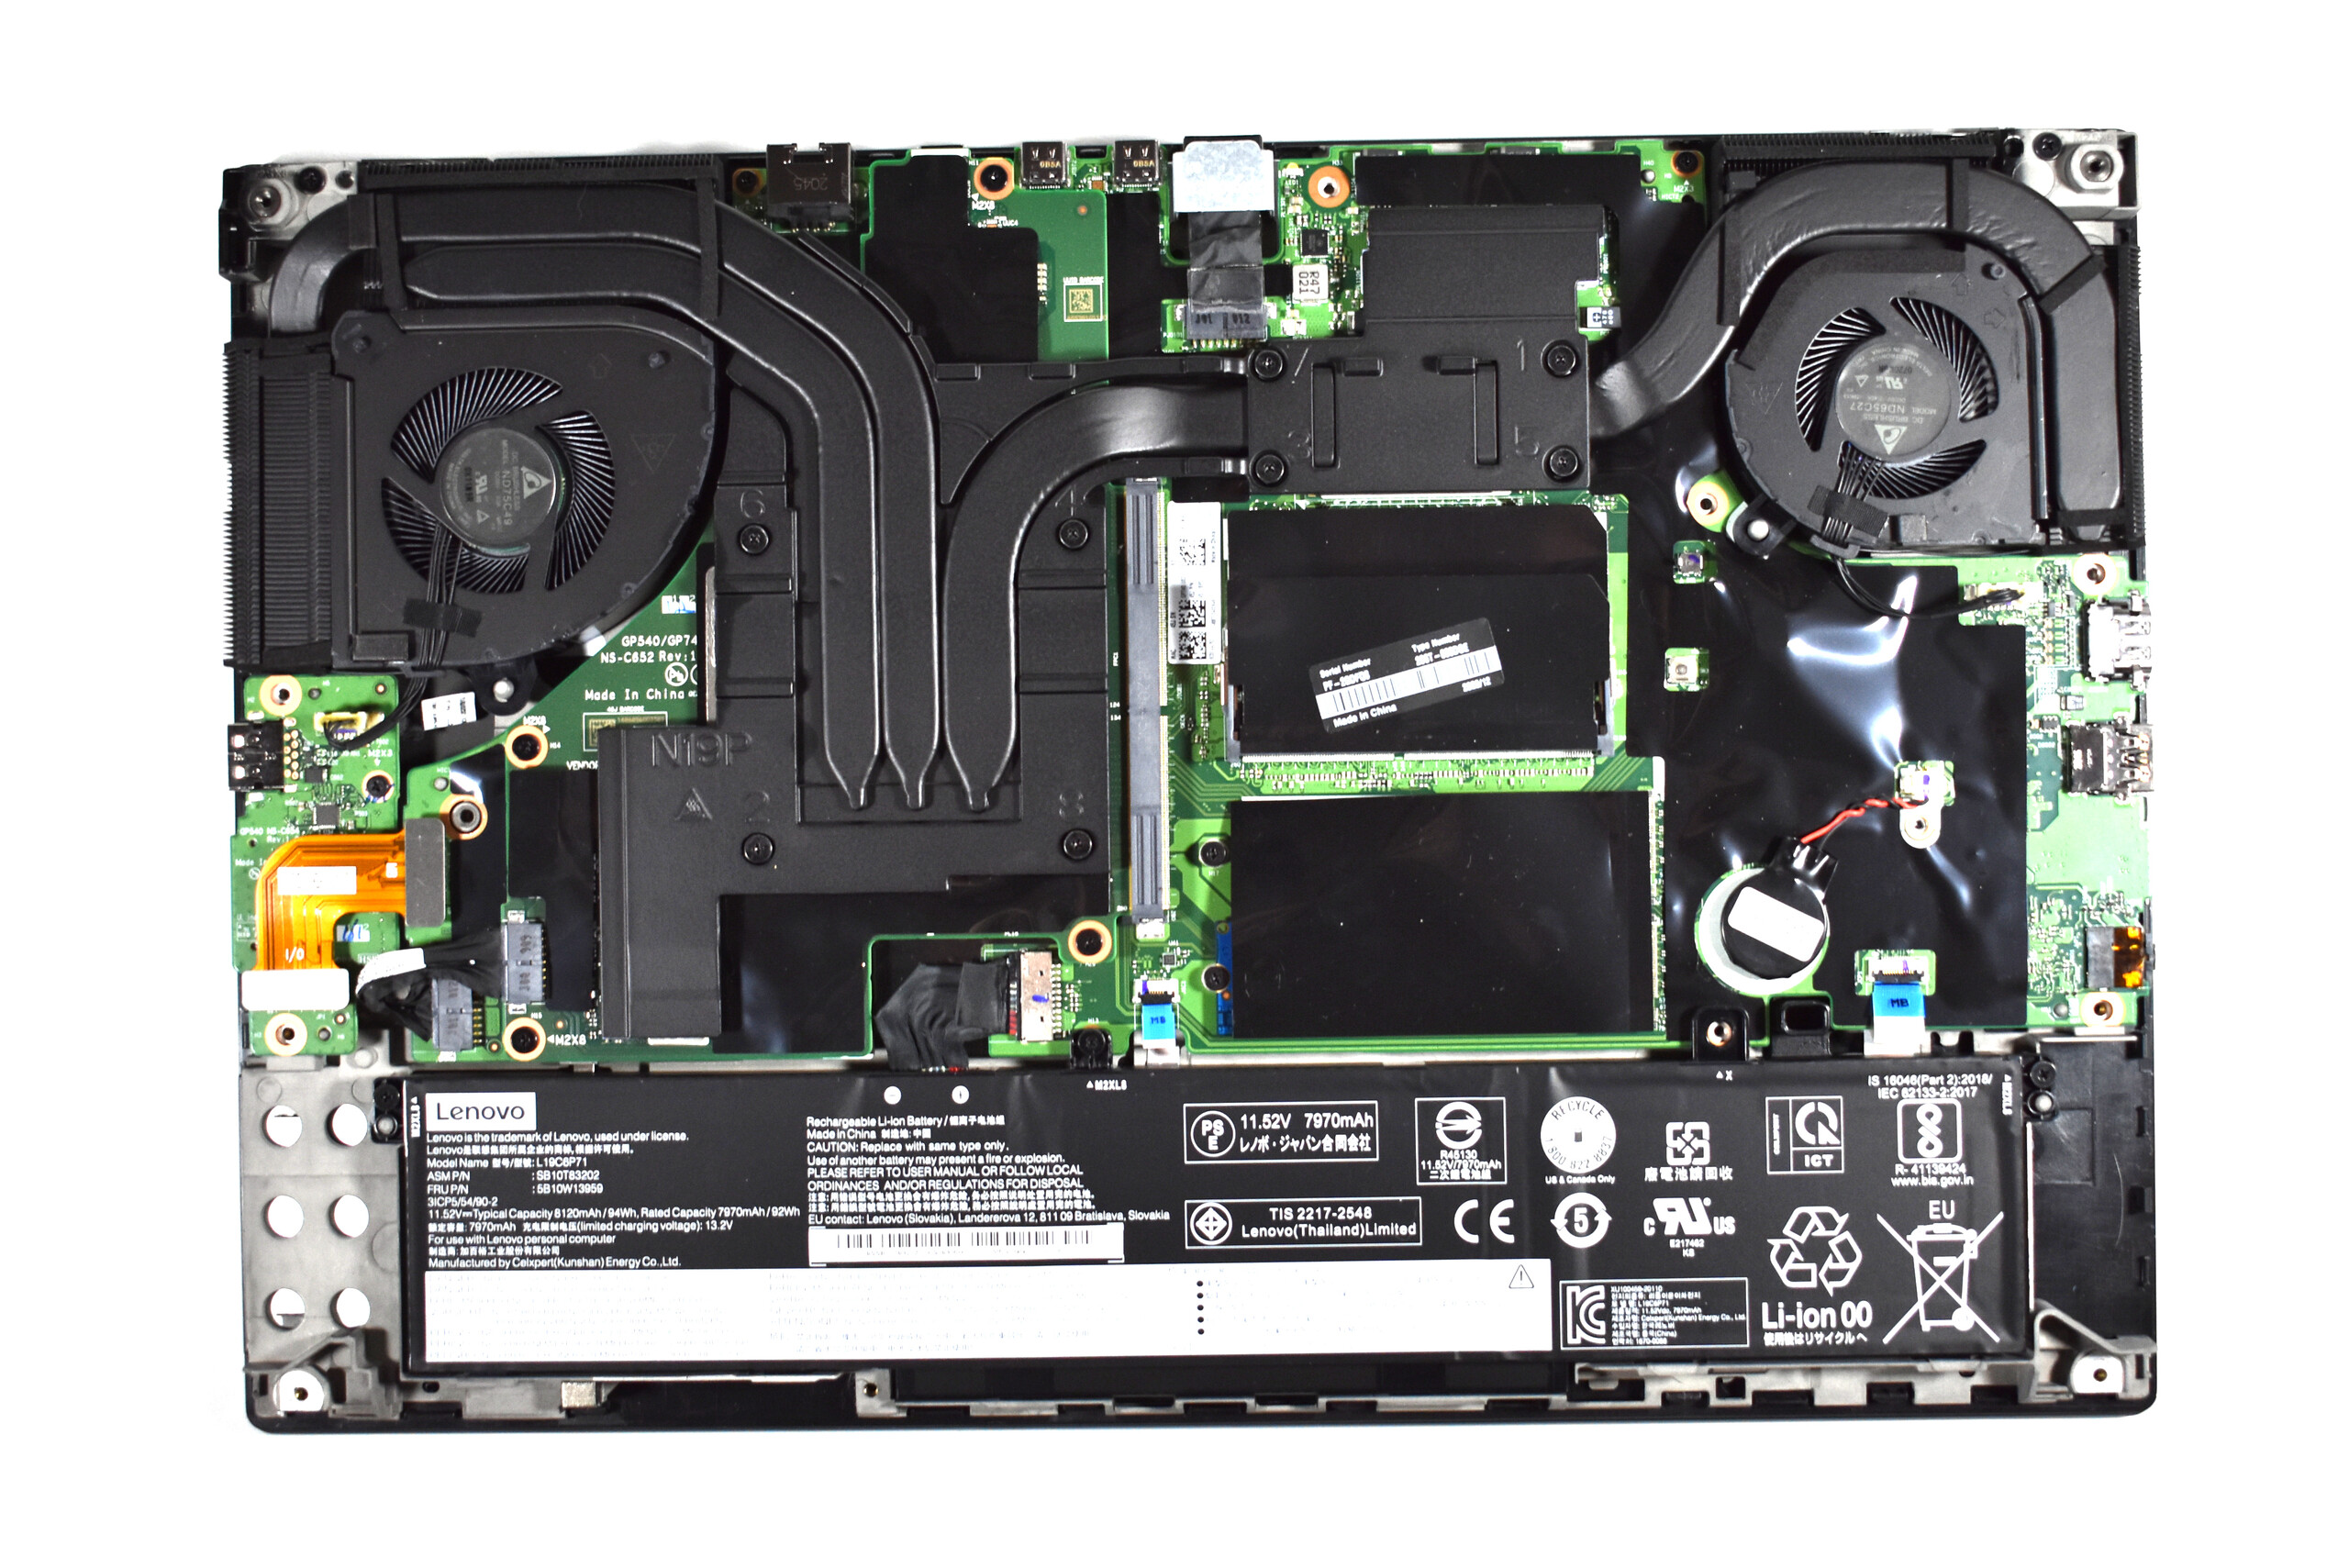
Uma melhoria central em comparação com o ThinkPad P53 é o fato de que as opções de GPU não estão mais ligadas às CPUs, porque os chips gráficos não são soldados na placa principal, mas integrados através de uma placa filha separada agora. Isto significa que qualquer uma das GPUs profissionais da geração Nvidia Turing(Quadro T1000, T2000, RTX 3000, RTX 4000 Max-Q, RTX 5000 Max-Q) pode ser combinada com todas as CPUs Intel disponíveis da série "Comet Lake H"(Core i5-10400H, i7-10750H, i7-10850H, i7-10875H, i9-10885H, i9-10980HK, Xeon W-10855M, W-10885M).
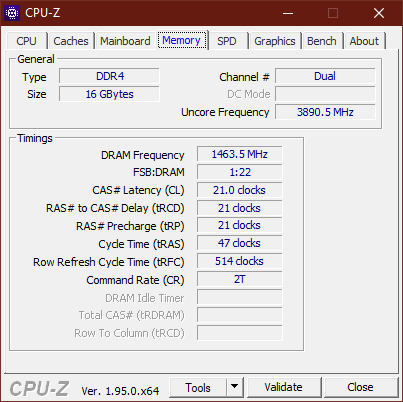
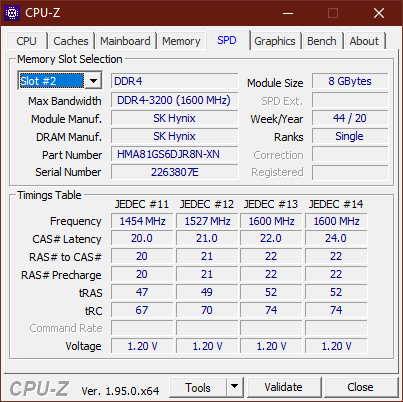
A RAM pode ser completamente atualizada, e os quatro slots DDR4-2933 SO-DIMM permitem um máximo de 128 GB - nos modelos Xeon, mesmo como armazenamento ECC. Em termos da solução de armazenamento, restam apenas dois M.2-2280 SSDs, enquanto o predecessor ainda permite três, além de oferecer algumas opções de HDD para alguns modelos
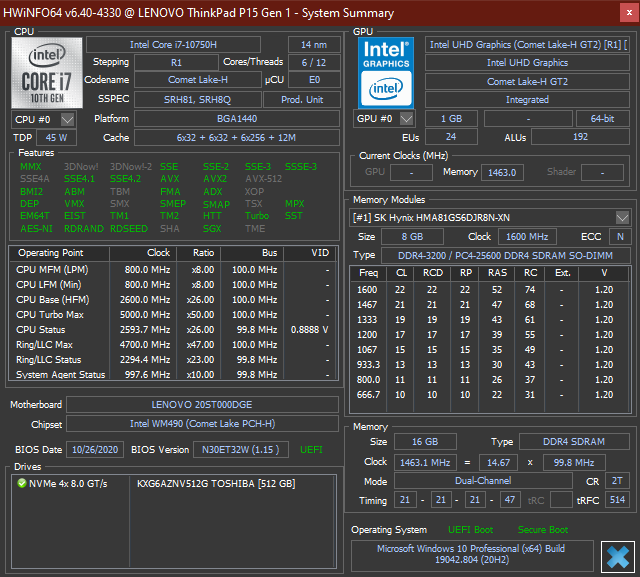
Processador
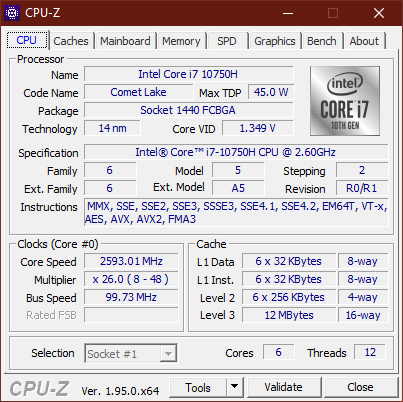
O IntelCore i7-10750H pertence à série "Comet Lake H" da Intel e é provavelmente um dos últimos chips de 14 nanômetros em um laptop. Os seis núcleos com um TDP nominal de 45 watts têm uma velocidade máxima teórica de relógio de 5 GHz (velocidade básica do relógio: 2,6 GHz). Nossa lista de CPU pode ajudar você a comparar referências adicionais
Com quase 130 watts (impulso curto) e 75 watts (constante) sob carga multicondutor, o processador no ThinkPad P15 pode consumir significativamente mais de 45 watts. Embora isto contribua para um bom desempenho da CPU, ele ainda não pode competir com as CPUs octa-core. Além disso, a CPU é bastante ineficiente, e o consideravelmente mais eficiente AMD Ryzen 7 Pro 4750U no ThinkPad L15 acessível é mais rápido sob carga em todos os núcleos.
Na operação por bateria, o desempenho da CPU é acelerado com um consumo máximo de 65 watts. Em 1172 pontos, o resultado do multicore CB15 se revela cerca de 10% menor
Cinebench R15: CPU Single 64Bit | CPU Multi 64Bit
Blender: v2.79 BMW27 CPU
7-Zip 18.03: 7z b 4 -mmt1 | 7z b 4
Geekbench 5.5: Single-Core | Multi-Core
HWBOT x265 Benchmark v2.2: 4k Preset
LibreOffice : 20 Documents To PDF
R Benchmark 2.5: Overall mean
| Cinebench R20 / CPU (Single Core) | |
| Média da turma Workstation (671 - 857, n=23, últimos 2 anos) | |
| HP ZBook Fury 15 G7 | |
| HP ZBook Fury 15 G7 | |
| Lenovo ThinkPad P15 Gen1-20ST000DGE | |
| Dell Precision 7550 | |
| Lenovo ThinkPad T15g-20UR000GGE | |
| Média Intel Core i7-10750H (431 - 504, n=43) | |
| Lenovo ThinkPad T15p-20TN0006GE | |
| Cinebench R20 / CPU (Multi Core) | |
| Média da turma Workstation (5760 - 15043, n=23, últimos 2 anos) | |
| Dell Precision 7550 | |
| HP ZBook Fury 15 G7 | |
| HP ZBook Fury 15 G7 | |
| Lenovo ThinkPad P15 Gen1-20ST000DGE | |
| Lenovo ThinkPad T15p-20TN0006GE | |
| Lenovo ThinkPad T15g-20UR000GGE | |
| Média Intel Core i7-10750H (1749 - 3325, n=43) | |
| Cinebench R15 / CPU Single 64Bit | |
| Média da turma Workstation (191.4 - 328, n=23, últimos 2 anos) | |
| HP ZBook Fury 15 G7 | |
| HP ZBook Fury 15 G7 | |
| Dell Precision 7550 | |
| Lenovo ThinkPad P15 Gen1-20ST000DGE | |
| Lenovo ThinkPad T15g-20UR000GGE | |
| Lenovo ThinkPad T15p-20TN0006GE | |
| Média Intel Core i7-10750H (184 - 213, n=45) | |
| Lenovo ThinkPad P53-20QN000YGE | |
| Cinebench R15 / CPU Multi 64Bit | |
| Média da turma Workstation (2489 - 5810, n=23, últimos 2 anos) | |
| Dell Precision 7550 | |
| HP ZBook Fury 15 G7 | |
| HP ZBook Fury 15 G7 | |
| Lenovo ThinkPad P15 Gen1-20ST000DGE | |
| Lenovo ThinkPad T15g-20UR000GGE | |
| Lenovo ThinkPad T15p-20TN0006GE | |
| Média Intel Core i7-10750H (804 - 1418, n=50) | |
| Lenovo ThinkPad P53-20QN000YGE | |
| Blender / v2.79 BMW27 CPU | |
| Lenovo ThinkPad P53-20QN000YGE | |
| HP ZBook Fury 15 G7 | |
| Média Intel Core i7-10750H (322 - 587, n=43) | |
| Lenovo ThinkPad T15p-20TN0006GE | |
| Lenovo ThinkPad P15 Gen1-20ST000DGE | |
| Lenovo ThinkPad T15g-20UR000GGE | |
| Dell Precision 7550 | |
| Média da turma Workstation (91 - 222, n=23, últimos 2 anos) | |
| 7-Zip 18.03 / 7z b 4 -mmt1 | |
| Média da turma Workstation (5126 - 6960, n=23, últimos 2 anos) | |
| HP ZBook Fury 15 G7 | |
| Dell Precision 7550 | |
| Lenovo ThinkPad T15g-20UR000GGE | |
| Lenovo ThinkPad P15 Gen1-20ST000DGE | |
| Média Intel Core i7-10750H (4504 - 5470, n=43) | |
| Lenovo ThinkPad P53-20QN000YGE | |
| Lenovo ThinkPad T15p-20TN0006GE | |
| 7-Zip 18.03 / 7z b 4 | |
| Média da turma Workstation (60489 - 116969, n=23, últimos 2 anos) | |
| Dell Precision 7550 | |
| Lenovo ThinkPad T15g-20UR000GGE | |
| Lenovo ThinkPad P15 Gen1-20ST000DGE | |
| HP ZBook Fury 15 G7 | |
| Lenovo ThinkPad T15p-20TN0006GE | |
| Média Intel Core i7-10750H (26040 - 37345, n=43) | |
| Lenovo ThinkPad P53-20QN000YGE | |
| Geekbench 5.5 / Single-Core | |
| Média da turma Workstation (1783 - 2183, n=23, últimos 2 anos) | |
| HP ZBook Fury 15 G7 | |
| Dell Precision 7550 | |
| Lenovo ThinkPad T15g-20UR000GGE | |
| Lenovo ThinkPad P15 Gen1-20ST000DGE | |
| Média Intel Core i7-10750H (1114 - 1333, n=43) | |
| Lenovo ThinkPad T15p-20TN0006GE | |
| Geekbench 5.5 / Multi-Core | |
| Média da turma Workstation (11542 - 25554, n=23, últimos 2 anos) | |
| Dell Precision 7550 | |
| HP ZBook Fury 15 G7 | |
| Lenovo ThinkPad T15g-20UR000GGE | |
| Lenovo ThinkPad P15 Gen1-20ST000DGE | |
| Média Intel Core i7-10750H (4443 - 6674, n=43) | |
| Lenovo ThinkPad T15p-20TN0006GE | |
| HWBOT x265 Benchmark v2.2 / 4k Preset | |
| Média da turma Workstation (17.8 - 40.5, n=23, últimos 2 anos) | |
| Dell Precision 7550 | |
| Lenovo ThinkPad T15g-20UR000GGE | |
| Lenovo ThinkPad P15 Gen1-20ST000DGE | |
| Média Intel Core i7-10750H (5.54 - 11.6, n=43) | |
| Lenovo ThinkPad T15p-20TN0006GE | |
| Lenovo ThinkPad P53-20QN000YGE | |
| HP ZBook Fury 15 G7 | |
| LibreOffice / 20 Documents To PDF | |
| HP ZBook Fury 15 G7 | |
| Lenovo ThinkPad P15 Gen1-20ST000DGE | |
| Média Intel Core i7-10750H (43.1 - 99.2, n=43) | |
| Lenovo ThinkPad T15g-20UR000GGE | |
| Média da turma Workstation (37.1 - 74.7, n=23, últimos 2 anos) | |
| Dell Precision 7550 | |
| Lenovo ThinkPad T15p-20TN0006GE | |
| R Benchmark 2.5 / Overall mean | |
| Lenovo ThinkPad T15p-20TN0006GE | |
| Lenovo ThinkPad P15 Gen1-20ST000DGE | |
| Média Intel Core i7-10750H (0.578 - 0.708, n=42) | |
| Lenovo ThinkPad T15g-20UR000GGE | |
| Dell Precision 7550 | |
| HP ZBook Fury 15 G7 | |
| Média da turma Workstation (0.3825 - 0.603, n=23, últimos 2 anos) | |
* ... menor é melhor
Desempenho do sistema
Com seus poderosos componentes, o ThinkPad P15 não mostra nenhuma fraqueza no desempenho do sistema.
| PCMark 10 Score | 5620 pontos | |
Ajuda | ||
Latências DPC
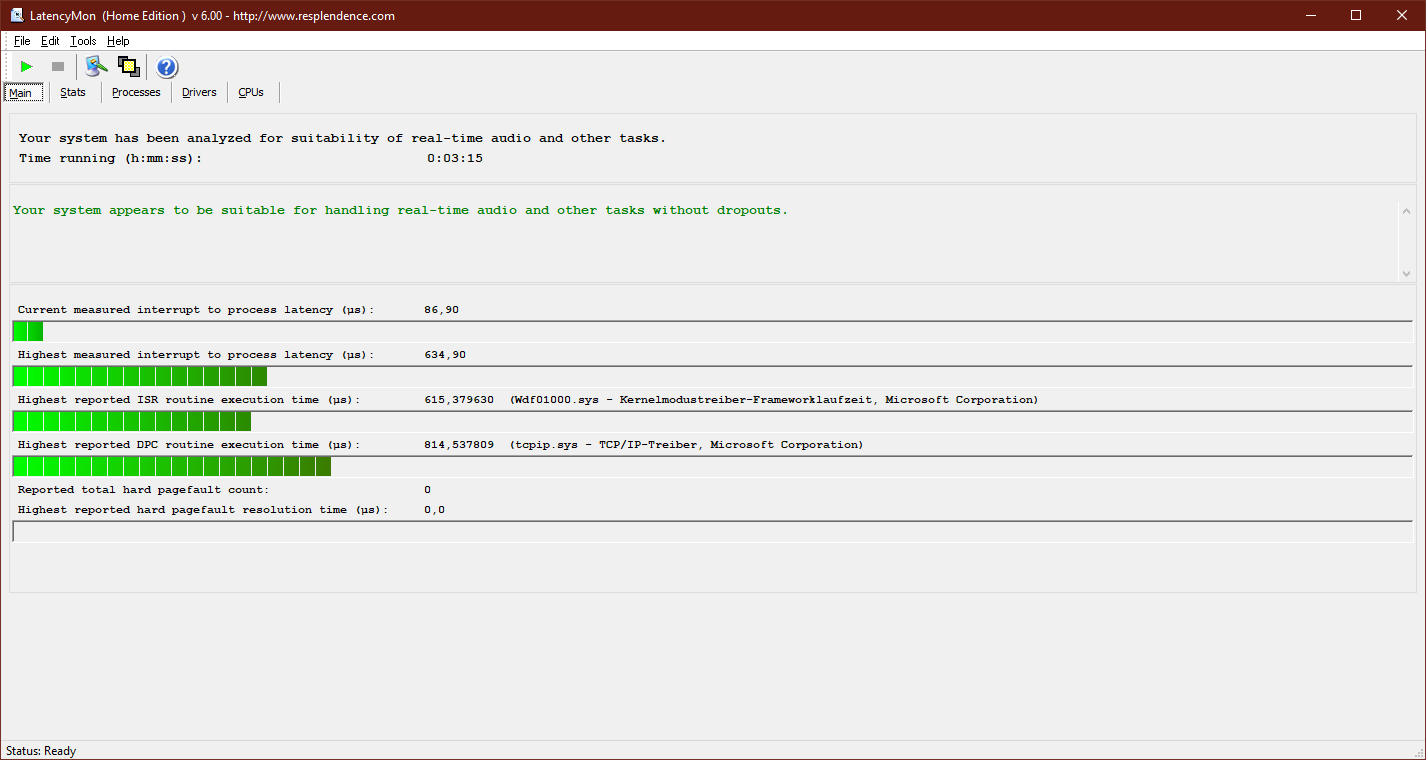
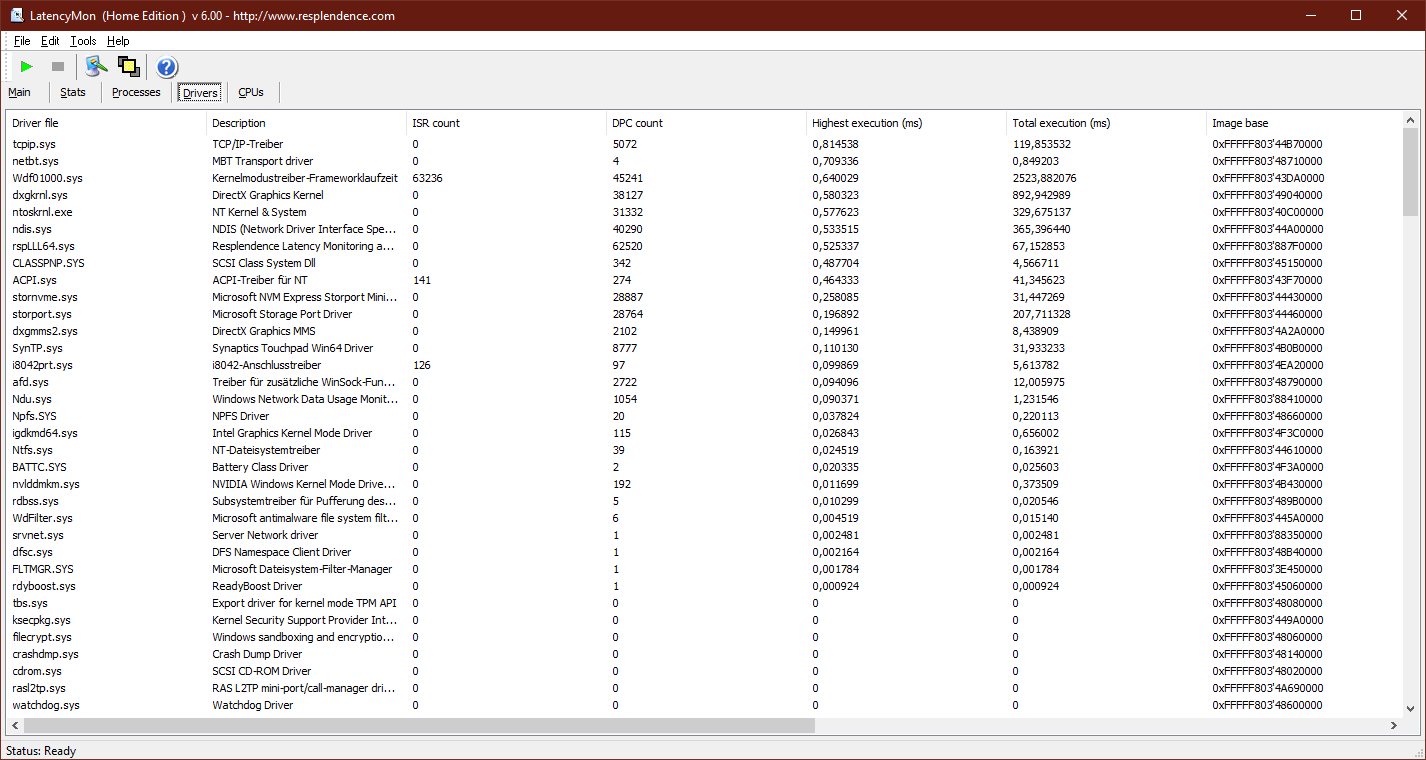
| DPC Latencies / LatencyMon - interrupt to process latency (max), Web, Youtube, Prime95 | |
| Lenovo ThinkPad P15 Gen1-20ST000DGE | |
* ... menor é melhor
Solução de armazenamento
O SSD M.2 2280 fornece resultados muito bons nos benchmarks. É feito pela Toshiba, oferece uma capacidade de 512 GB e é conectado via PCIe NVMe
| Lenovo ThinkPad P15 Gen1-20ST000DGE Toshiba XG6 KXG6AZNV512G | Lenovo ThinkPad P53-20QN000YGE Samsung PM981a MZVLB1T0HBLR | Lenovo ThinkPad T15g-20UR000GGE SK Hynix PC401 512GB M.2 (HFS512GD9TNG) | Lenovo ThinkPad T15p-20TN0006GE WDC PC SN730 SDBQNTY-512GB | Dell Precision 7550 SK Hynix PC601A NVMe 1TB | HP ZBook Fury 15 G7 Samsung PM981a MZVLB1T0HBLR | Média Toshiba XG6 KXG6AZNV512G | |
|---|---|---|---|---|---|---|---|
| CrystalDiskMark 5.2 / 6 | -4% | 2% | 0% | -12% | -1% | -12% | |
| Write 4K (MB/s) | 129.5 | 147 14% | 154 19% | 141.8 9% | 121 -7% | 114.1 -12% | 139 ? 7% |
| Read 4K (MB/s) | 49.54 | 48.3 -3% | 46.01 -7% | 47.39 -4% | 42.16 -15% | 57.2 15% | 45.8 ? -8% |
| Write Seq (MB/s) | 2379 | 1402 -41% | 2561 8% | 2404 1% | 2150 -10% | 2580 8% | 1628 ? -32% |
| Read Seq (MB/s) | 1989 | 1503 -24% | 1799 -10% | 2124 7% | 1755 -12% | 2527 27% | 1647 ? -17% |
| Write 4K Q32T1 (MB/s) | 663 | 475.2 -28% | 452.2 -32% | 637 -4% | 395.3 -40% | 480.2 -28% | 547 ? -17% |
| Read 4K Q32T1 (MB/s) | 425.2 | 581 37% | 570 34% | 414.8 -2% | 381.8 -10% | 387.6 -9% | 436 ? 3% |
| Write Seq Q32T1 (MB/s) | 2960 | 2936 -1% | 2736 -8% | 2706 -9% | 2730 -8% | 2996 1% | 2522 ? -15% |
| Read Seq Q32T1 (MB/s) | 3182 | 3539 11% | 3468 9% | 3319 4% | 3468 9% | 2853 -10% | 2739 ? -14% |

Constant Performance Reads: DiskSpd Read Loop, Queue Depth 8
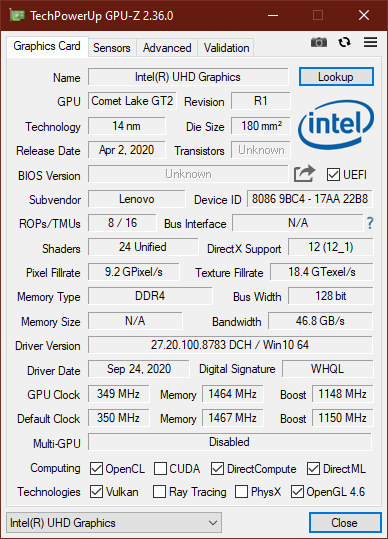
Placa Gráfica
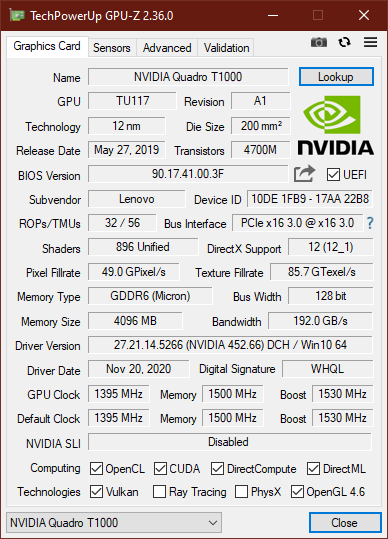
O NvidiaQuadro T1000 representa a opção de nível básico no Lenovo ThinkPad P15. É claro que o Nvidia Quadro RTX 5000 Max-Q no ThinkPad P53 predecessor é consideravelmente mais rápido, mas isto não é nenhuma surpresa. Uma comparação mais interessante é o Nvidia GeForce GTX 1050 do ThinkPadT15p da Lenovo. Dependendo do teste, o T1000 tem uma vantagem de cerca de 50 a 75%, aqui. Portanto, se você quiser muito desempenho gráfico, mesmo a configuração de nível básico do ThinkPad P15 é uma escolha melhor do que o ThinkPad T15p. Comparações adicionais estão disponíveis em nossa lista de comparação de GPU.
Como no processador, também pode ser determinada aqui uma ligeira redução de desempenho no modo de bateria. Em 9654 pontos no teste 3DMark 11 GPU, o desempenho ficou cerca de 15% mais baixo
| 3DMark 11 Performance | 11592 pontos | |
| 3DMark Fire Strike Score | 8173 pontos | |
| 3DMark Time Spy Score | 3565 pontos | |
Ajuda | ||
Desempenho nos jogos
Geralmente, as estações de trabalho não são destinadas a jogos, mas não são completamente inadequadas. O P15 também é capaz de exibir os jogos modernos suavemente em resolução Full HD e em configurações de alto detalhe. Entretanto, para jogos 4K, o ThinkPad T15g com um RTX GeForce seria mais adequado
| The Witcher 3 - 1920x1080 High Graphics & Postprocessing (Nvidia HairWorks Off) | |
| Média da turma Workstation (n=1últimos 2 anos) | |
| Lenovo ThinkPad T15g-20UR000GGE | |
| Lenovo ThinkPad P15 Gen1-20ST000DGE | |
| Média NVIDIA Quadro T1000 (Laptop) (52.7 - 62.9, n=3) | |
| Lenovo ThinkPad T15p-20TN0006GE | |
| baixo | média | alto | ultra | |
|---|---|---|---|---|
| The Witcher 3 (2015) | 189 | 114 | 62.9 | 35 |
| Dota 2 Reborn (2015) | 151 | 136 | 123 | 115 |
| X-Plane 11.11 (2018) | 108 | 96 | 80.1 | |
| Shadow of the Tomb Raider (2018) | 111 | 56.7 | 54.1 | 46 |
| Total War: Three Kingdoms (2019) | 189 | 60.4 | 39.1 | 24.7 |
Emissões: Os ventiladores podem ficar mais altos no ThinkPad P15
Emissões sonoras
Em operação ociosa, a Lenovo consegue deixar os ventiladores desligados a maior parte do tempo, e se eles rodam, dificilmente são audíveis a 28,8 dB(a). Sob carga, a situação muda: Um nível de ruído de 37,7 dB(a) pode ser facilmente percebido, e o nível máximo de ruído de 44,6 dB(a) pode se tornar irritante. Em comparação com o ThinkPad P53, os dois ventiladores podem se tornar significativamente mais altos aqui.
Não notamos nenhuma lamentação da bobina
Barulho
| Ocioso |
| 24.9 / 24.9 / 28.8 dB |
| Carga |
| 37.7 / 44.6 dB |
 | ||
30 dB silencioso 40 dB(A) audível 50 dB(A) ruidosamente alto |
||
min: | ||
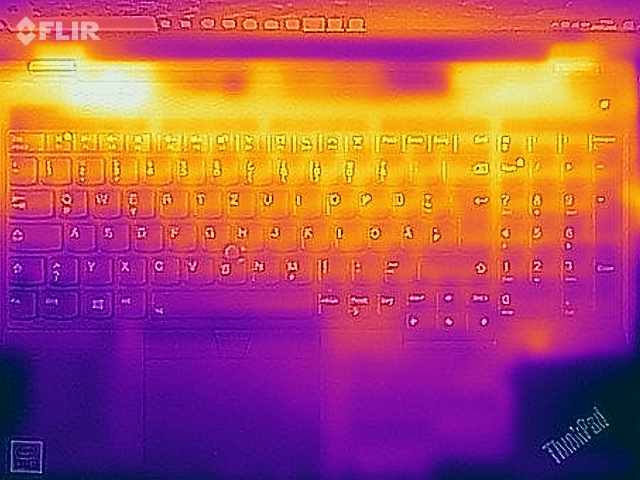
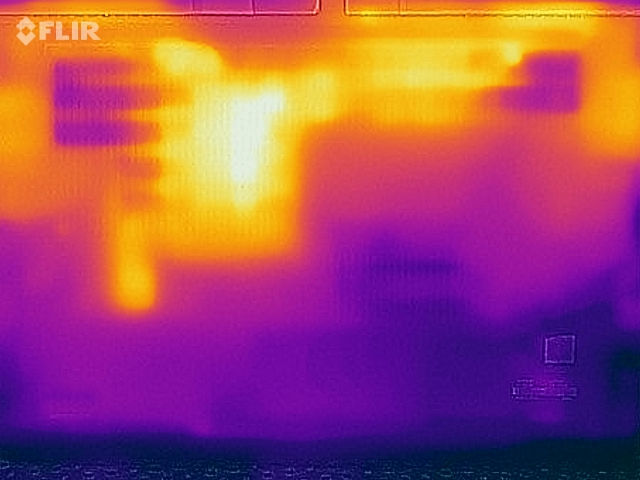
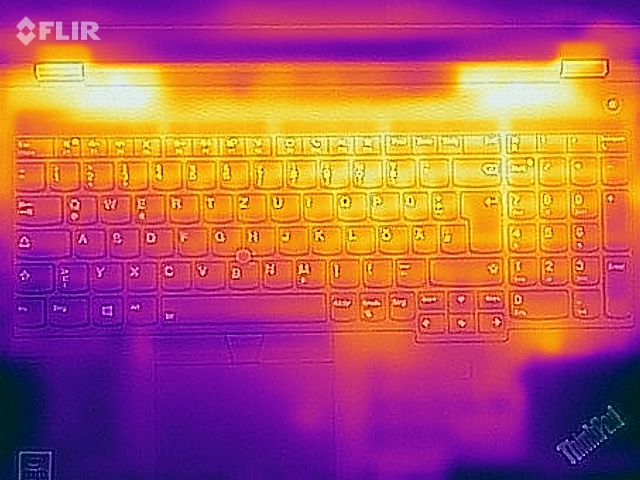
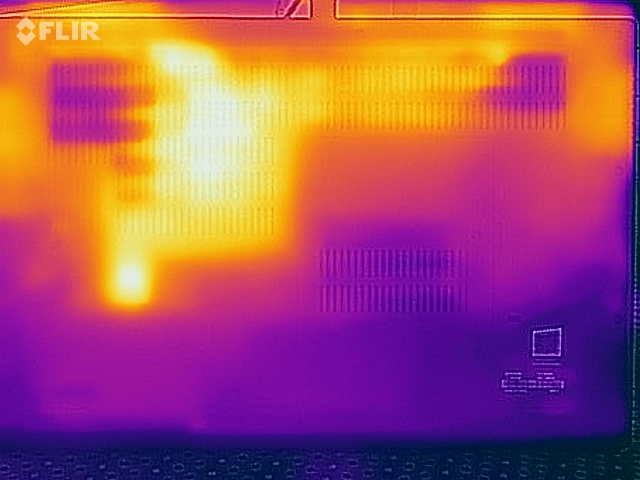
Temperatura
Os altos valores de consumo da CPU têm um preço: as temperaturas externas sobem até 60 °C (140 °F)no fundo - e isso em um modelo de nível básico! Com CPUs e GPUs mais potentes, as temperaturas podem subir ainda mais
É claro que o teste de estresse representa um cenário extremo. Após uma hora no teste de estresse, nem a CPU nem a GPU apresentam qualquer estrangulamento devido às altas temperaturas. O chip gráfico é capaz de consumir 50 watts, e a CPU 65 watts - o desempenho de resfriamento parece ter melhorado em comparação com o laptop Lenovo ThinkPad P53
(-) A temperatura máxima no lado superior é 45.4 °C / 114 F, em comparação com a média de 38.2 °C / 101 F , variando de 22.2 a 69.8 °C para a classe Workstation.
(-) A parte inferior aquece até um máximo de 60.6 °C / 141 F, em comparação com a média de 41.1 °C / 106 F
(+) Em uso inativo, a temperatura média para o lado superior é 25.8 °C / 78 F, em comparação com a média do dispositivo de 32 °C / ### class_avg_f### F.
(±) Jogando The Witcher 3, a temperatura média para o lado superior é 36.1 °C / 97 F, em comparação com a média do dispositivo de 32 °C / ## #class_avg_f### F.
(+) Os apoios para as mãos e o touchpad estão atingindo a temperatura máxima da pele (32.5 °C / 90.5 F) e, portanto, não estão quentes.
(-) A temperatura média da área do apoio para as mãos de dispositivos semelhantes foi 27.8 °C / 82 F (-4.7 °C / -8.5 F).
Oradores
Lenovo ThinkPad P15 Gen1-20ST000DGE análise de áudio
(±) | o volume do alto-falante é médio, mas bom (###valor### dB)
Graves 100 - 315Hz
(-) | quase nenhum baixo - em média 15.1% menor que a mediana
(±) | a linearidade dos graves é média (11.4% delta para a frequência anterior)
Médios 400 - 2.000 Hz
(±) | médios mais altos - em média 7.6% maior que a mediana
(+) | médios são lineares (5.4% delta para frequência anterior)
Altos 2 - 16 kHz
(+) | agudos equilibrados - apenas 3.4% longe da mediana
(+) | os máximos são lineares (6.9% delta da frequência anterior)
Geral 100 - 16.000 Hz
(±) | a linearidade do som geral é média (18.2% diferença em relação à mediana)
Comparado com a mesma classe
» 59% de todos os dispositivos testados nesta classe foram melhores, 10% semelhantes, 31% piores
» O melhor teve um delta de 7%, a média foi 17%, o pior foi 35%
Comparado com todos os dispositivos testados
» 39% de todos os dispositivos testados foram melhores, 8% semelhantes, 53% piores
» O melhor teve um delta de 4%, a média foi 23%, o pior foi 134%
Lenovo ThinkPad T15p-20TN0006GE análise de áudio
(±) | o volume do alto-falante é médio, mas bom (###valor### dB)
Graves 100 - 315Hz
(-) | quase nenhum baixo - em média 22.8% menor que a mediana
(±) | a linearidade dos graves é média (12.2% delta para a frequência anterior)
Médios 400 - 2.000 Hz
(±) | médios mais altos - em média 6.4% maior que a mediana
(±) | a linearidade dos médios é média (8.5% delta para frequência anterior)
Altos 2 - 16 kHz
(+) | agudos equilibrados - apenas 3.6% longe da mediana
(+) | os máximos são lineares (6.3% delta da frequência anterior)
Geral 100 - 16.000 Hz
(±) | a linearidade do som geral é média (29.3% diferença em relação à mediana)
Comparado com a mesma classe
» 95% de todos os dispositivos testados nesta classe foram melhores, 2% semelhantes, 3% piores
» O melhor teve um delta de 5%, a média foi 17%, o pior foi 45%
Comparado com todos os dispositivos testados
» 87% de todos os dispositivos testados foram melhores, 3% semelhantes, 10% piores
» O melhor teve um delta de 4%, a média foi 23%, o pior foi 134%
Gerenciamento de energia: Uma estação de trabalho ThinkPad com uma grande bateria
Consumo de energia
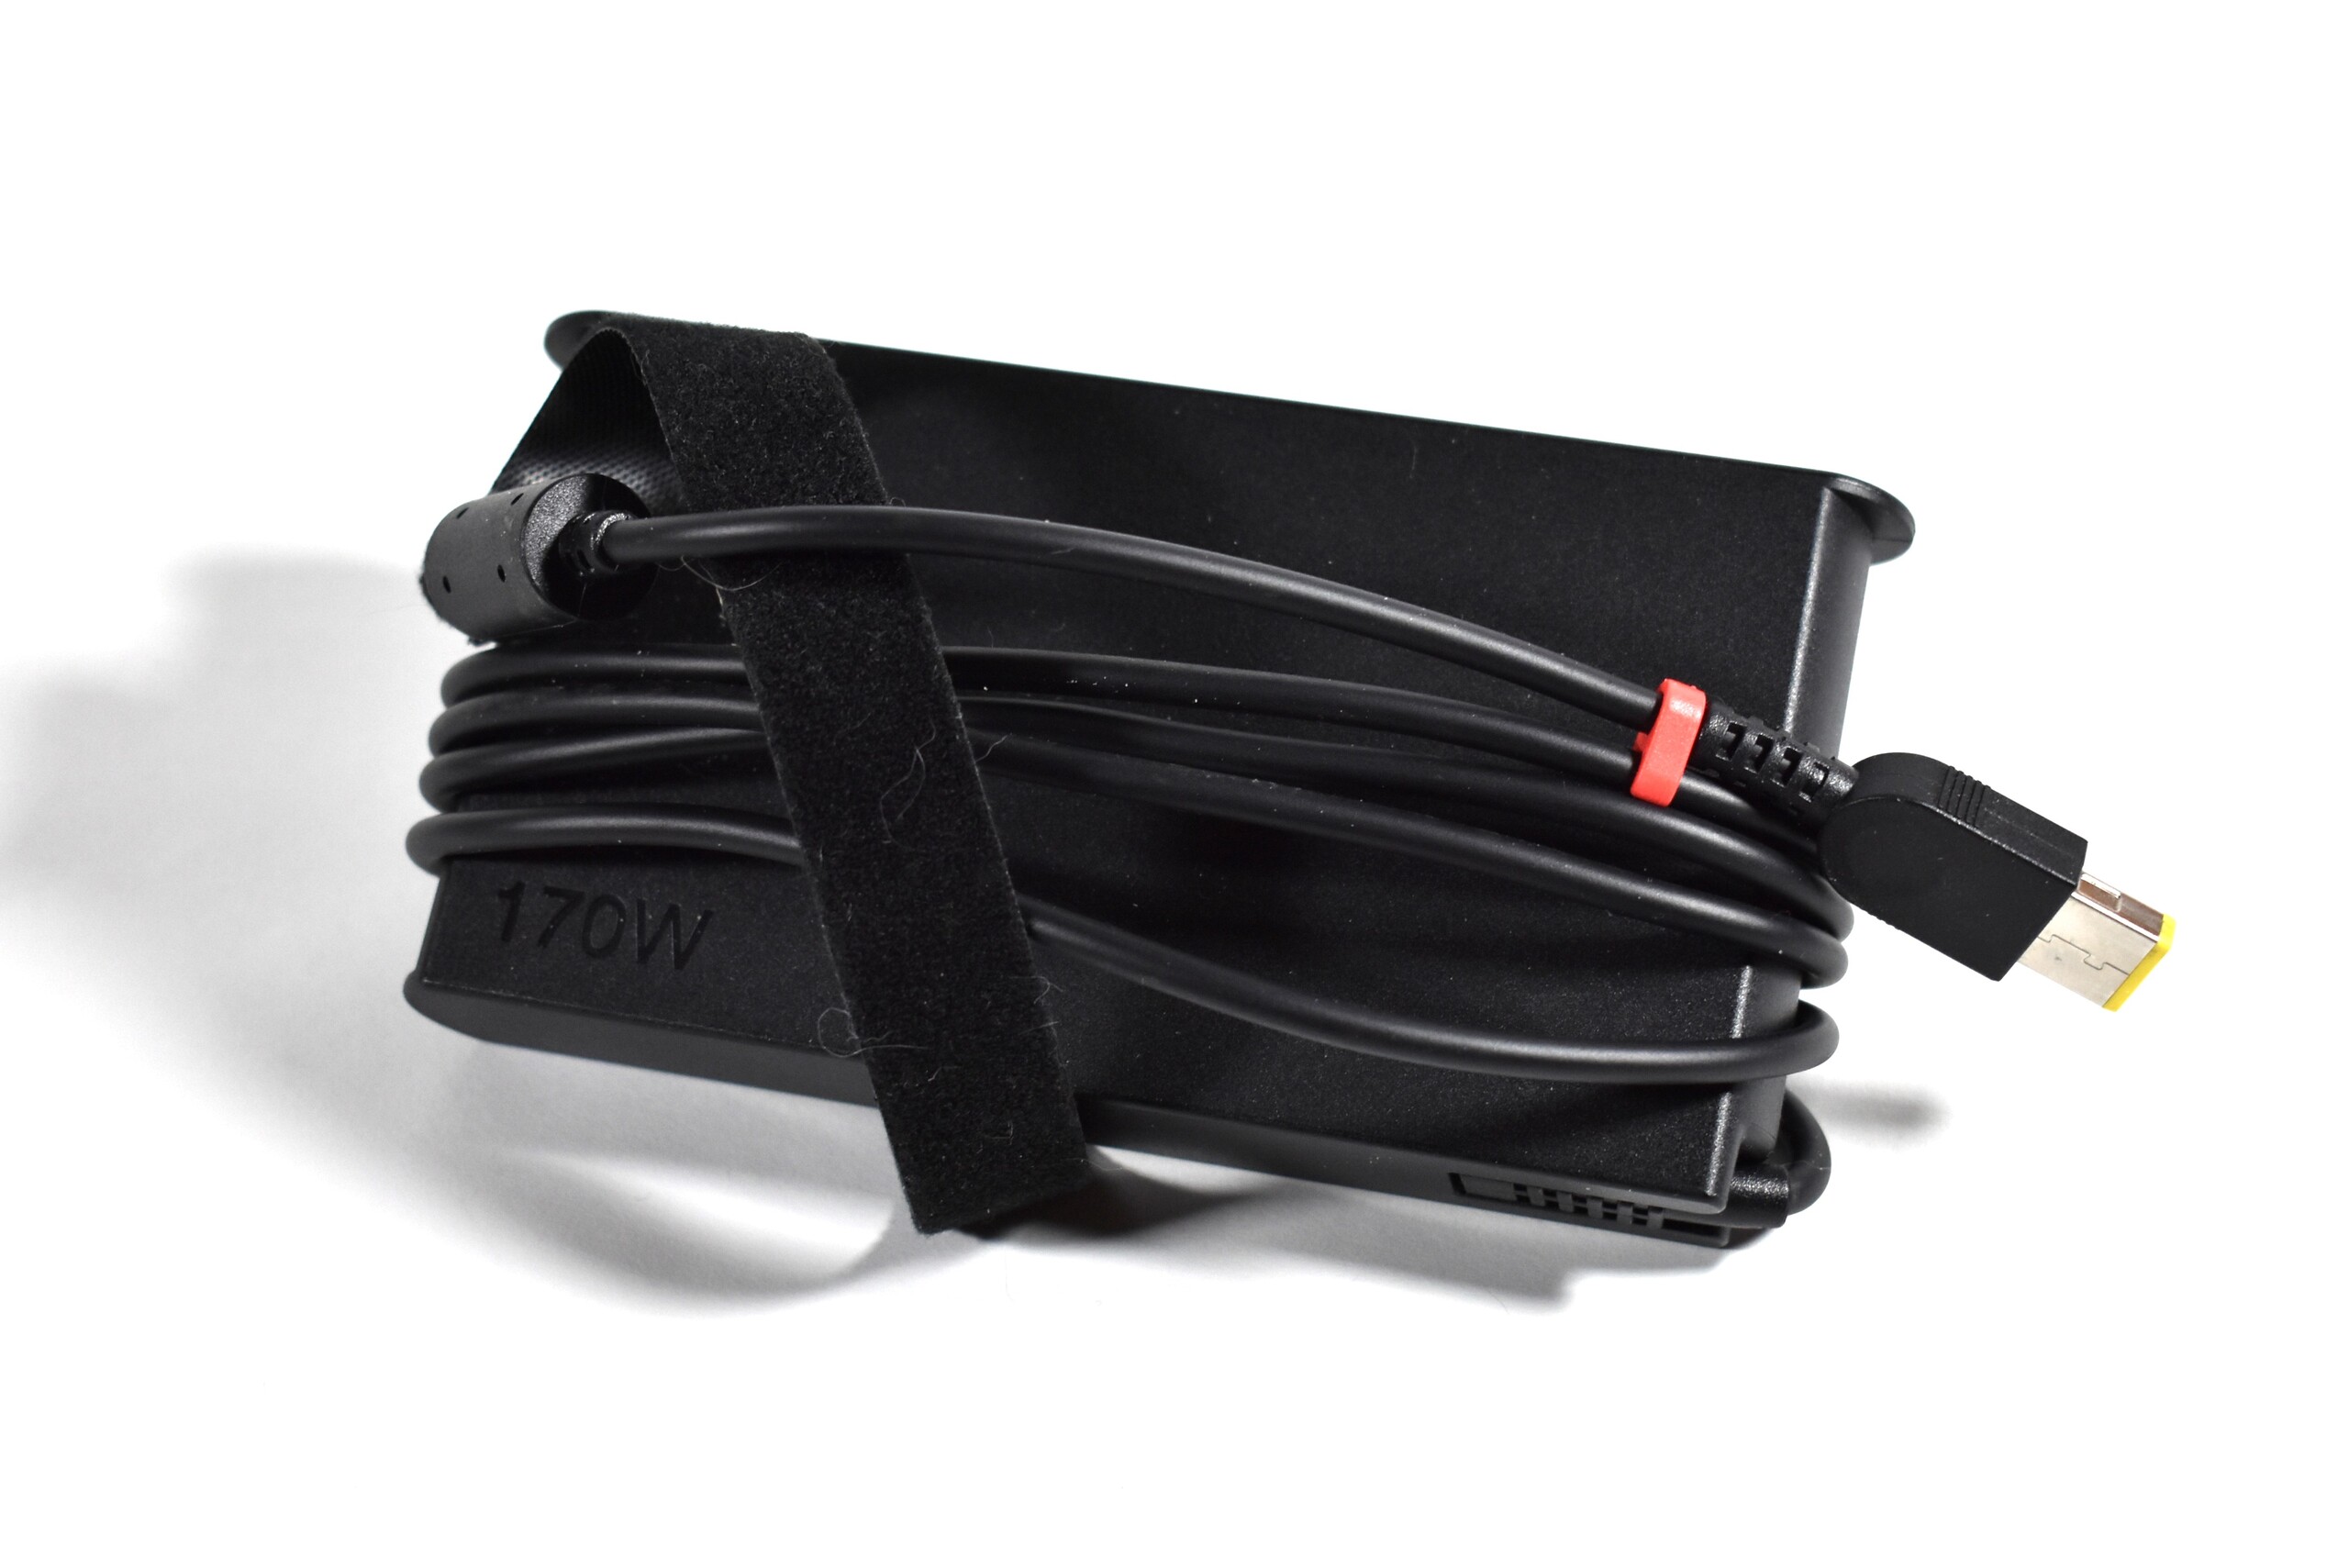
Nada mudou muito em comparação com o Lenovo ThinkPad P53 em termos de consumo de energia, pelo menos em operação ociosa. Sob carga, o consumo é significativamente menor, o que pode ser atribuído à GPU mais fraca. O consumo máximo é uma brincadeira de criança para a fonte de energia de 170 watts
| desligado | |
| Ocioso | |
| Carga |
|
Key:
min: | |
| Lenovo ThinkPad P15 Gen1-20ST000DGE i7-10750H, Quadro T1000 (Laptop), Toshiba XG6 KXG6AZNV512G, a-Si IPS LED, 1920x1080, 15.6" | Lenovo ThinkPad P53-20QN000YGE i7-9850H, Quadro RTX 5000 Max-Q, Samsung PM981a MZVLB1T0HBLR, IPS, 1920x1080, 15.6" | Lenovo ThinkPad T15g-20UR000GGE i7-10750H, GeForce RTX 2070 Super Max-Q, SK Hynix PC401 512GB M.2 (HFS512GD9TNG), IPS, 1920x1080, 15.6" | Lenovo ThinkPad T15p-20TN0006GE i7-10750H, GeForce GTX 1050 Mobile, WDC PC SN730 SDBQNTY-512GB, IPS LED, 3840x2160, 15.6" | Dell Precision 7550 W-10885M, Quadro RTX 5000 Max-Q, SK Hynix PC601A NVMe 1TB, IPS, 3840x2160, 15.6" | HP ZBook Fury 15 G7 W-10885M, Quadro RTX 5000 Max-Q, Samsung PM981a MZVLB1T0HBLR, IPS, 3840x2160, 15.6" | Média NVIDIA Quadro T1000 (Laptop) | Média da turma Workstation | |
|---|---|---|---|---|---|---|---|---|
| Power Consumption | -13% | -8% | 8% | -38% | -20% | 6% | -11% | |
| Idle Minimum * (Watt) | 8.4 | 7.9 6% | 5.8 31% | 6 29% | 8.2 2% | 4.6 45% | 8.33 ? 1% | 9.11 ? -8% |
| Idle Average * (Watt) | 12.3 | 11.8 4% | 11.4 7% | 12.8 -4% | 16.8 -37% | 13.6 -11% | 11.8 ? 4% | 13.8 ? -12% |
| Idle Maximum * (Watt) | 14.2 | 14.9 -5% | 13.9 2% | 16.1 -13% | 24.4 -72% | 21.5 -51% | 15.2 ? -7% | 17.9 ? -26% |
| Load Average * (Watt) | 96 | 96 -0% | 93.2 3% | 95.6 -0% | 131 -36% | 113.1 -18% | 86.4 ? 10% | 96 ? -0% |
| Witcher 3 ultra * (Watt) | 95 | 149 -57% | 145 -53% | 84 12% | 156.6 -65% | 157.5 -66% | ||
| Load Maximum * (Watt) | 168.8 | 207.8 -23% | 234 -39% | 131.1 22% | 201.8 -20% | 199 -18% | 131.1 ? 22% | 180.3 ? -7% |
* ... menor é melhor
Vida útil da bateria
Com 94 Wh, o Lenovo ThinkPad P15 Gen 1 tem a maior bateria de um ThinkPad de 15 polegadas atualmente. Com o baixo consumo da tela Full-HD, a Lenovo atinge uma longa duração da bateria, durando quase 14 horas no teste Wi-Fi (150 cd/m²), o que é excelente. E quase 10 horas no mesmo teste com brilho máximo também são uma conquista
| Lenovo ThinkPad P15 Gen1-20ST000DGE i7-10750H, Quadro T1000 (Laptop), 94 Wh | Lenovo ThinkPad P53-20QN000YGE i7-9850H, Quadro RTX 5000 Max-Q, 90 Wh | Lenovo ThinkPad T15g-20UR000GGE i7-10750H, GeForce RTX 2070 Super Max-Q, 94 Wh | Lenovo ThinkPad T15p-20TN0006GE i7-10750H, GeForce GTX 1050 Mobile, 68 Wh | Dell Precision 7550 W-10885M, Quadro RTX 5000 Max-Q, 95 Wh | HP ZBook Fury 15 G7 W-10885M, Quadro RTX 5000 Max-Q, 94 Wh | Média da turma Workstation | |
|---|---|---|---|---|---|---|---|
| Duração da bateria | 6% | -10% | -34% | -27% | -16% | -15% | |
| H.264 (h) | 13.9 | 9.8 -29% | 12.7 -9% | 7.7 -45% | 10.1 ? -27% | ||
| WiFi v1.3 (h) | 14.1 | 11.1 -21% | 11.2 -21% | 7.3 -48% | 8.9 -37% | 8.6 -39% | 8.55 ? -39% |
| Load (h) | 1.2 | 2 67% | 1.2 0% | 1.1 -8% | 1 -17% | 1.3 8% | 1.441 ? 20% |
Pro
Contra
Veredicto: Uma impressão mista para o ThinkPad P15 Gen 1 da Lenovo
Mesmo que não pareça assim à primeira vista, a Lenovo mudou algumas coisas no ThinkPad P15 Gen 1 em comparação com o modelopredecessor do ThinkPad P53. Embora haja várias melhorias, o novo caderno ThinkPad é pior em outros aspectos.
Um aspecto é o caso, que não se sente tão bem de forma feliz. Isto também inclui um problema de estabilidade na área do teclado, que se agita na parte inferior esquerda. Também não gostamos que algumas características, como as teclas dedicadas do touchpad, tenham sido removidas. Não vemos nenhuma razão válida para que Lenove tivesse que fazer alguns cortes em um dispositivo profissional tão caro. O contraste da opção de exibição de nível de entrada do P15 também poderia ser maior. E também há um slot M.2 a menos do que no predecessor.
As mudanças positivas dizem respeito à construção e ao resfriamento. O ThinkPad P15 Gen 1 é mais fácil de manter, porque o sistema de resfriamento é mais acessível. O último também é melhorado em relação ao predecessor e não há estrangulamento, embora os ventiladores possam ficar mais altos. O resultado é um melhor desempenho da CPU. Em comparação com a P53, o tamanho da bateria também aumentou, resultando em uma melhor duração da bateria.
No geral, o ThinkPad P15 Gen 1 é uma estação de trabalho bem equipada com várias fraquezas que a Lenovo talvez pudesse remediar no sucessor (palavra-chave: teclado de barulho).
Teríamos algumas dificuldades em recomendar o Lenovo ThinkPad P15 Gen 1. Por um lado, por causa do ponto fraco do teclado e, por outro, porque as CPUs utilizadas são simplesmente ineficientes. Um ThinkPad P15 Gen 2 com CPUs de 10 nm da Intel poderia funcionar significativamente mais frio e silencioso com as mesmas capacidades de desempenho.
Preço e Disponibilidade
Na configuração testada, o Lenovo ThinkPad P15 Gen 1 custa cerca de 1980 euros (~$2371) na Alemanha. Nos EUA, o ThinkPad P15 Gen 1 está disponível na Amazon a partir de US$1545.
Lenovo ThinkPad P15 Gen1-20ST000DGE
- 03/04/2021 v7 (old)
Benjamin Herzig
Price comparison

