Revisão da estação de trabalho HP ZBook Fury 15 G7: Câmara de Vapor para máximo desempenho
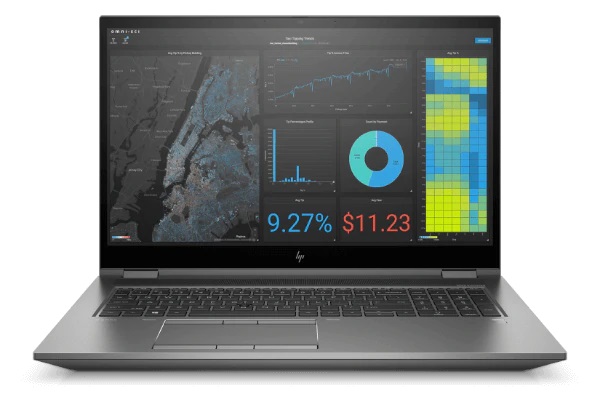
O HP ZBook Fury 15 G7 é a principal estação de trabalho móvel de 15,6 polegadas da empresa, projetada para usuários e profissionais CAD de alto desempenho. Ao contrário da série mais fina ZBook 15u ou Firefly, a ZBook Fury 15 utiliza CPUs Intel série H muito mais rápidas com opções de GPUs mais altas GeForce RTX em vez das GPUs Intel série U mais lentas com GPUs Quadro P.
Uma ampla gama de configurações está disponível desde a CPU Core i5-10300H até a Xeon W-10885M, 16 GB de RAM até 128 GB, tela de 1080p 250 nit até 4K UHD 600 nits, e a GPU Quadro T2000 Max-Q até a RTX 5000 Max-Q. A lista completa de especificações pode ser encontrada na folha de dados oficial da HP aqui. A unidade que temos em mãos em uma configuração superior com a CPU Xeon, tela 4K e GPU Quadr RTX 5000 Max-Q por aproximadamente $6100 USD.
As alternativas ao ZBook Fury 15 G7 incluem outras estações de trabalho high-end de 15,6 polegadas como a Dell Precision 7550, Lenovo ThinkPad P series, Asus ProArt StudioBook Pro 15, ou a MSI WS66.
Mais resenhas da HP:
potential competitors in comparison
Avaliação | Data | Modelo | Peso | Altura | Size | Resolução | Preço |
|---|---|---|---|---|---|---|---|
| 90.2 % v7 (old) | 01/2021 | HP ZBook Fury 15 G7 W-10885M, Quadro RTX 5000 Max-Q | 2.4 kg | 25.9 mm | 15.60" | 3840x2160 | |
| 83.1 % v7 (old) | 11/2020 | Asus ProArt StudioBook Pro 15 W500G5T i7-9750H, Quadro RTX 5000 Max-Q | 2 kg | 18.9 mm | 15.60" | 3840x2160 | |
| 83.4 % v7 (old) | 09/2020 | MSI WS66 10TMT-207US i9-10980HK, Quadro RTX 5000 Max-Q | 2.3 kg | 19.8 mm | 15.60" | 1920x1080 | |
| 87.8 % v7 (old) | 08/2020 | Dell Precision 7550 W-10885M, Quadro RTX 5000 Max-Q | 2.8 kg | 27.36 mm | 15.60" | 3840x2160 | |
| 87 % v7 (old) | 08/2020 | Razer Blade 15 Studio Edition 2020 i7-10875H, Quadro RTX 5000 Max-Q | 2.2 kg | 13.98 mm | 15.60" | 3840x2160 | |
| 87.8 % v7 (old) | 08/2019 | Lenovo ThinkPad P1 2019-20QT000RGE i7-9850H, Quadro T1000 (Laptop) | 1.7 kg | 18.4 mm | 15.60" | 1920x1080 |
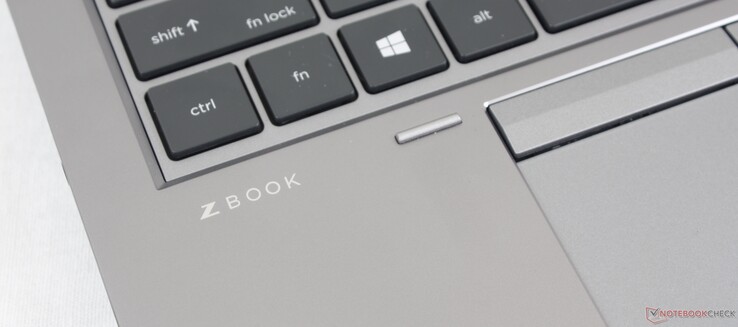
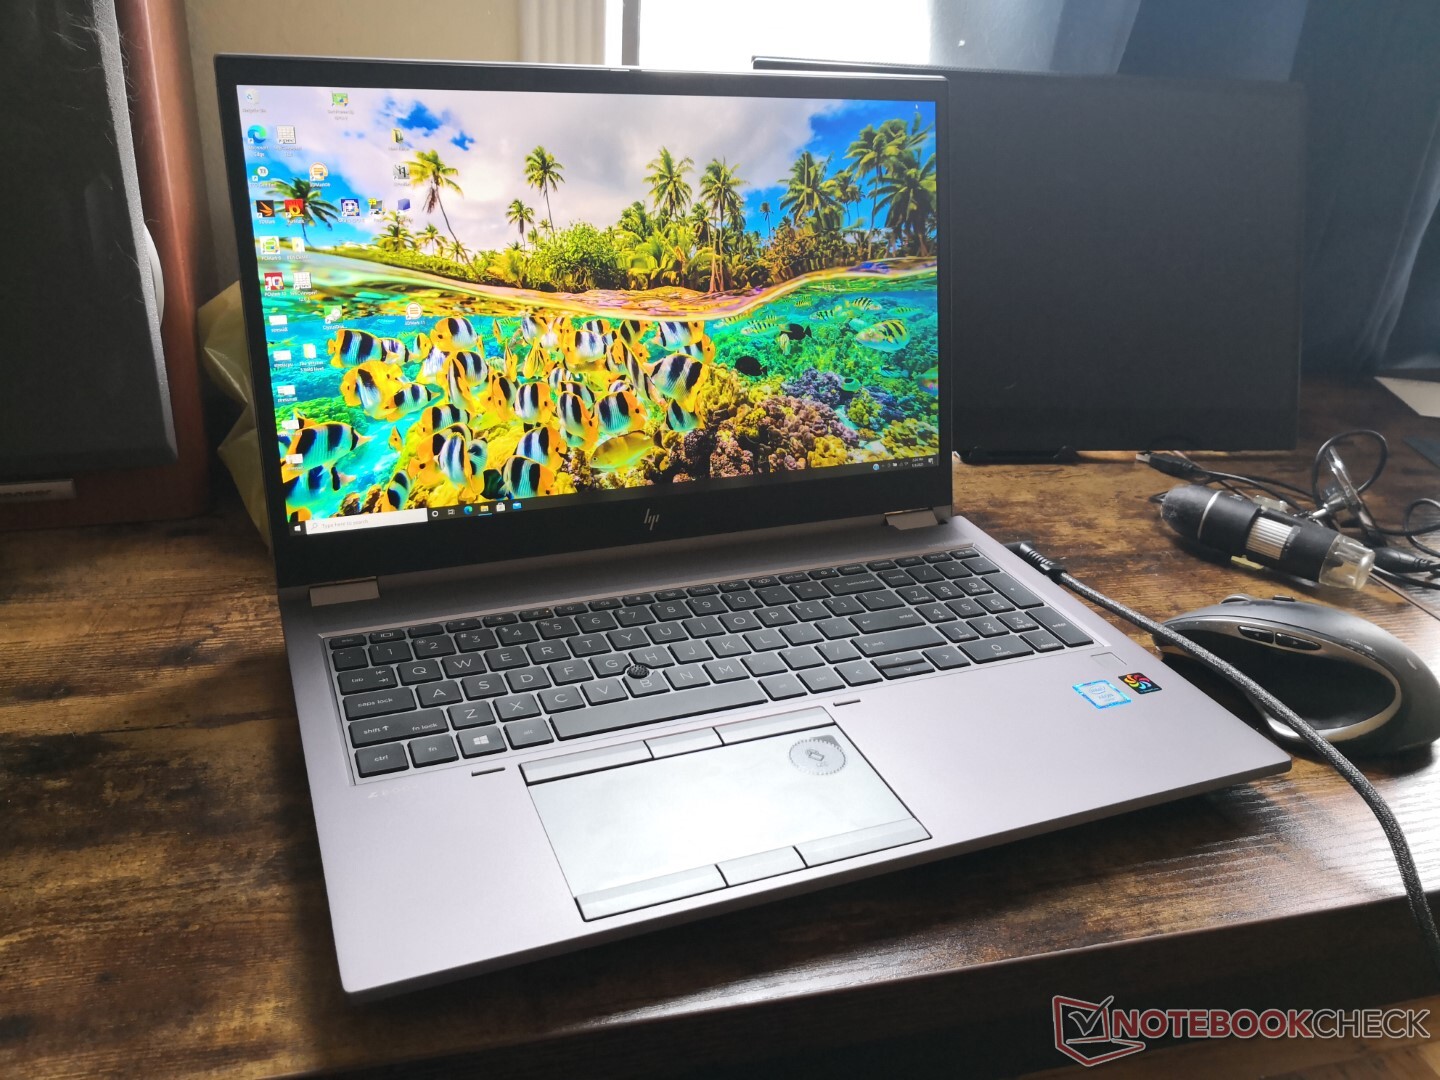
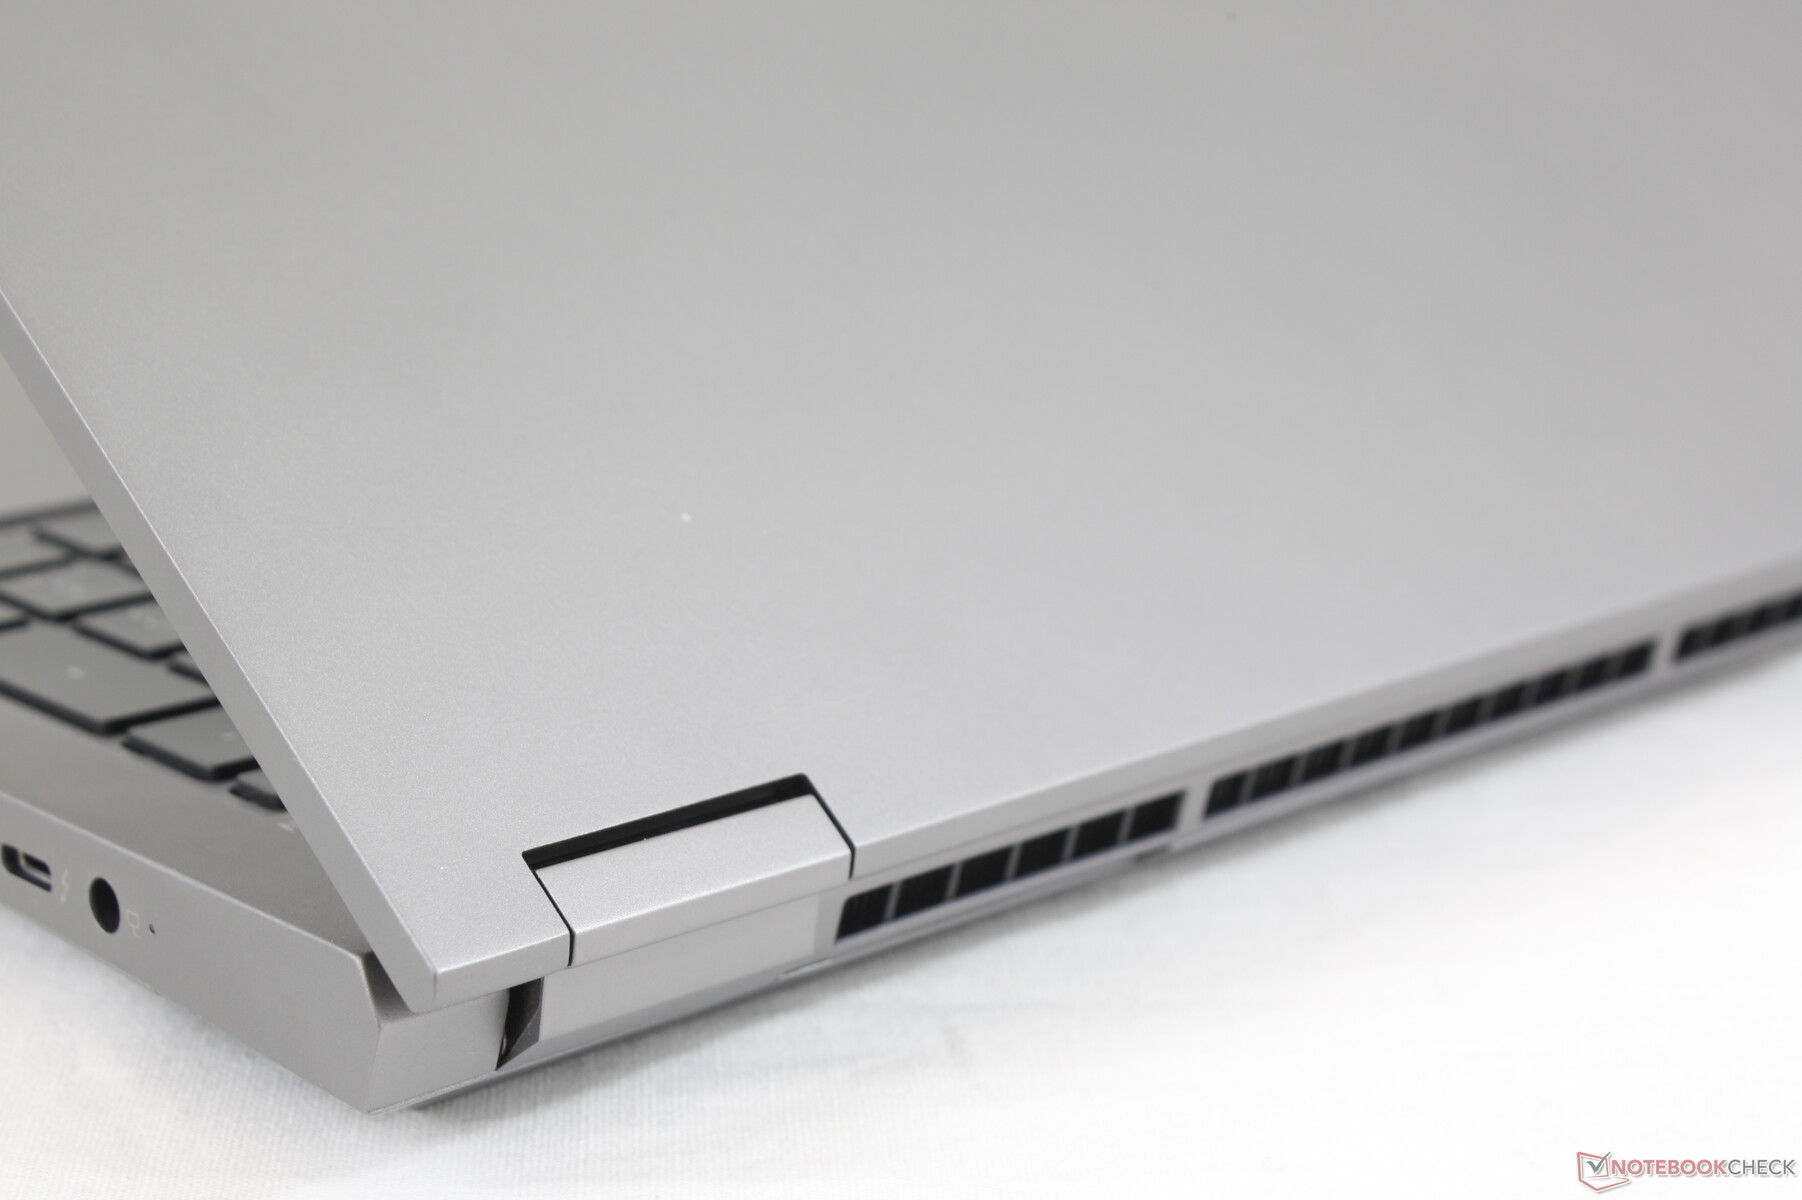
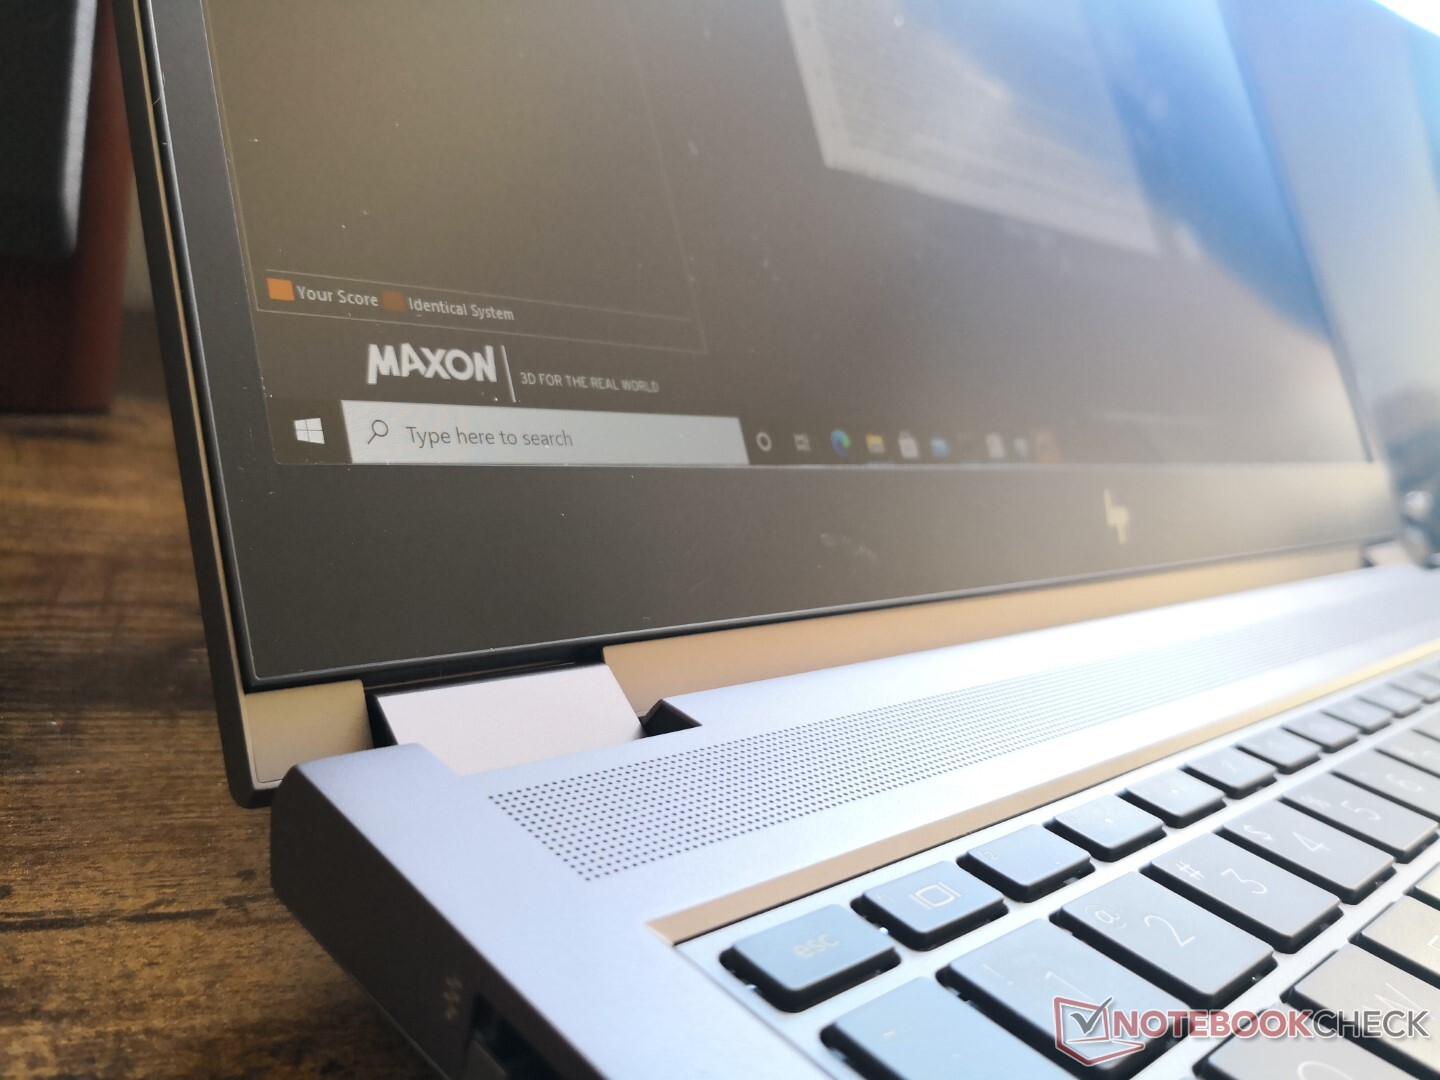
Caso
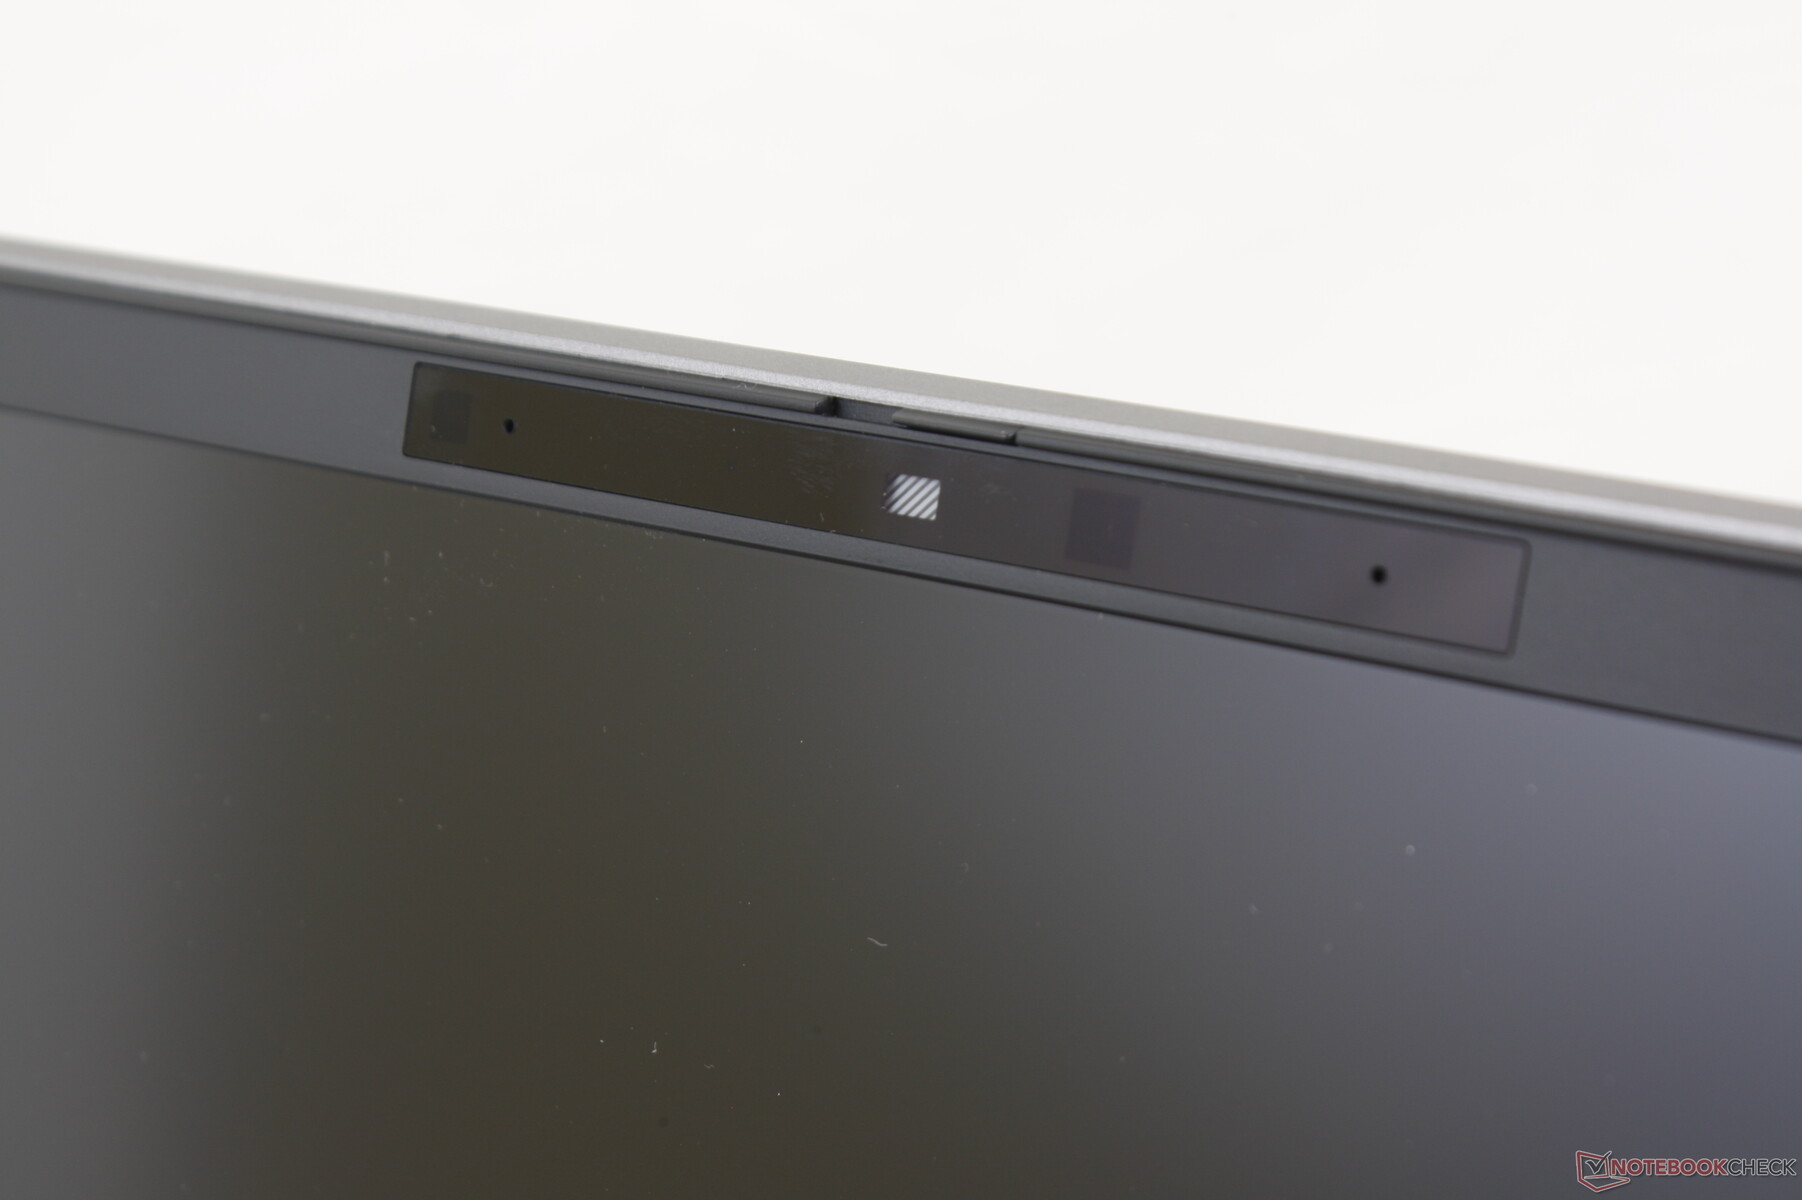
Já se passaram alguns anos desde a última vez que verificamos um ZBook 15 em tamanho real e muita coisa mudou. A HP redesenhou o chassi da cabeça aos pés com aparência mais afiada sem sacrificar muitas das características que as estações de trabalho mais finas tendem a omitir como os leitores de cartões inteligentes, o nó do bastão apontador e os botões dedicados do mouse. A HP diz que as luneiras superior, lateral e inferior são 59,7%, 53,1% e 10,6% menores, respectivamente, do que a ZBook 15 G6 de saída. A base é firme, com pouca ou nenhuma deformação ou rangido, incluindo o centro do teclado, que é onde a maioria dos laptops é mais fraca. A tampa flexiona um pouco mais, mas não o suficiente para ser motivo de qualquer preocupação.
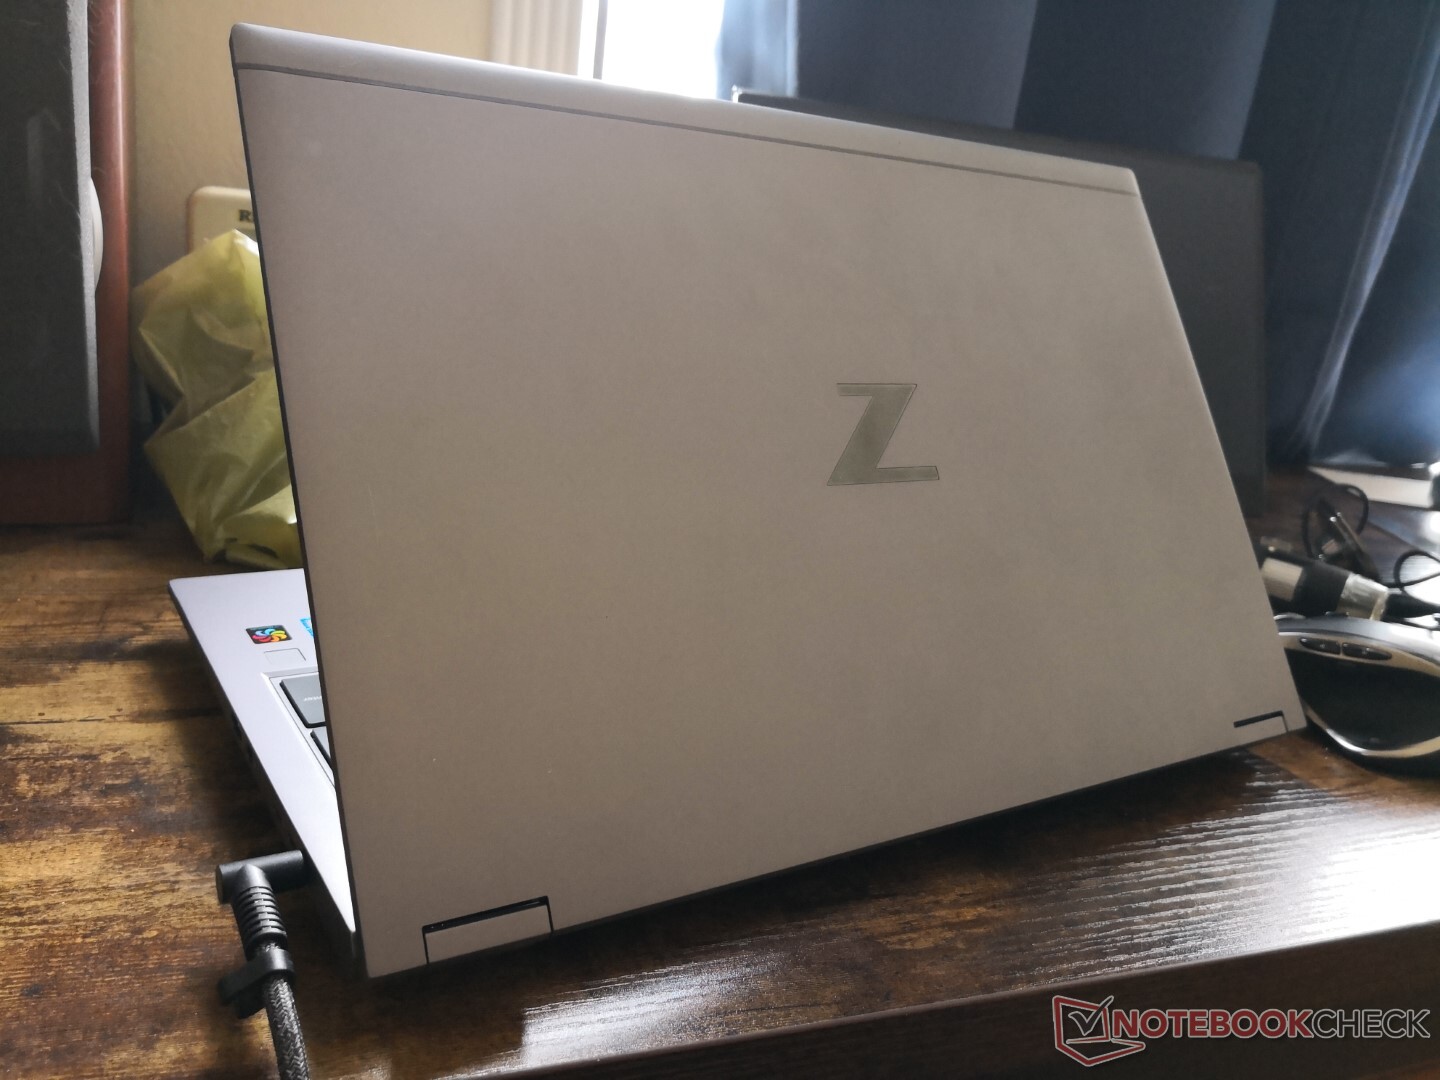
O HP é visivelmente mais leve do que o Precision 7550 por cerca de 400 g, apesar de suas dimensões semelhantes. O sistema Dell parece mais sólido, no entanto, provavelmente devido ao seu peso mais maciço. Há muitas estações de trabalho ultraleves como a Razer Blade ou MSI WS66 que são projetadas para serem ainda mais finas e leves se os usuários quiserem algo mais portátil.
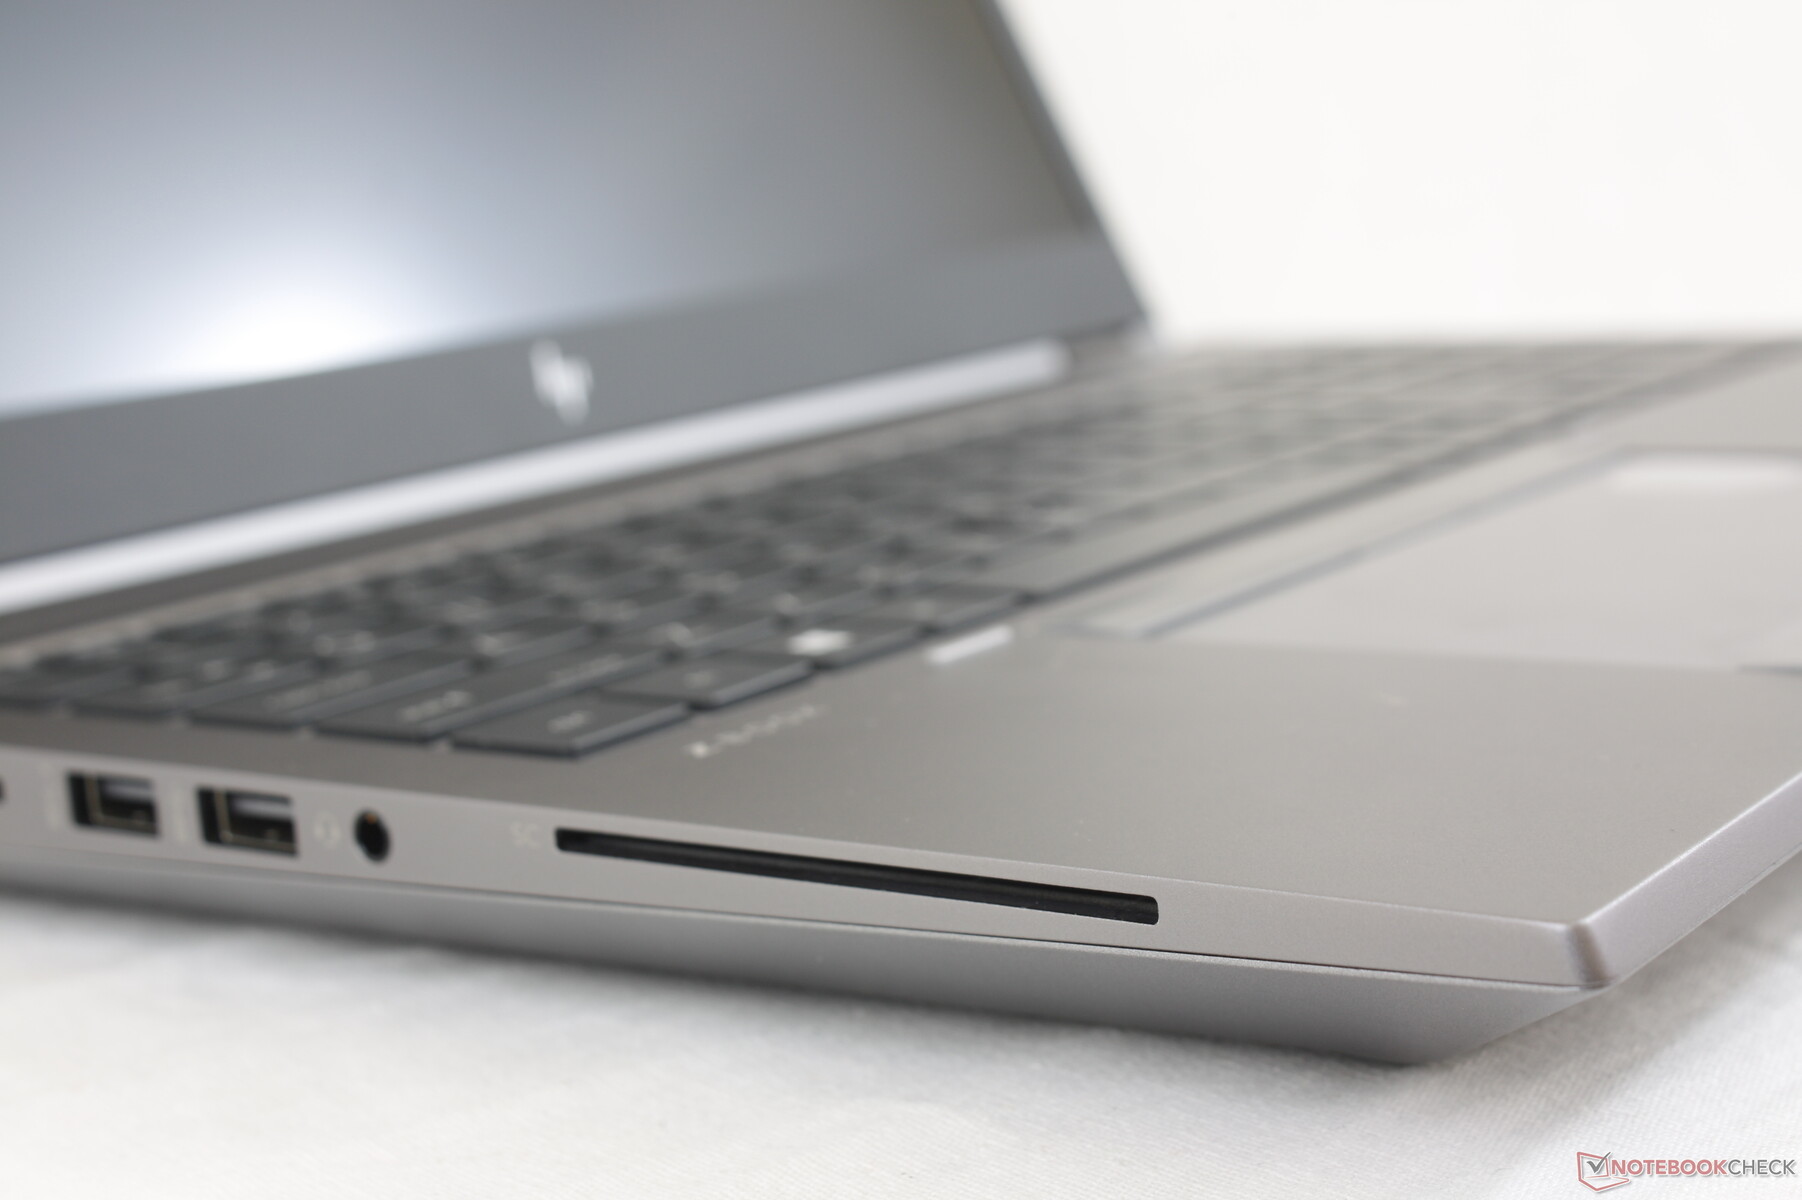
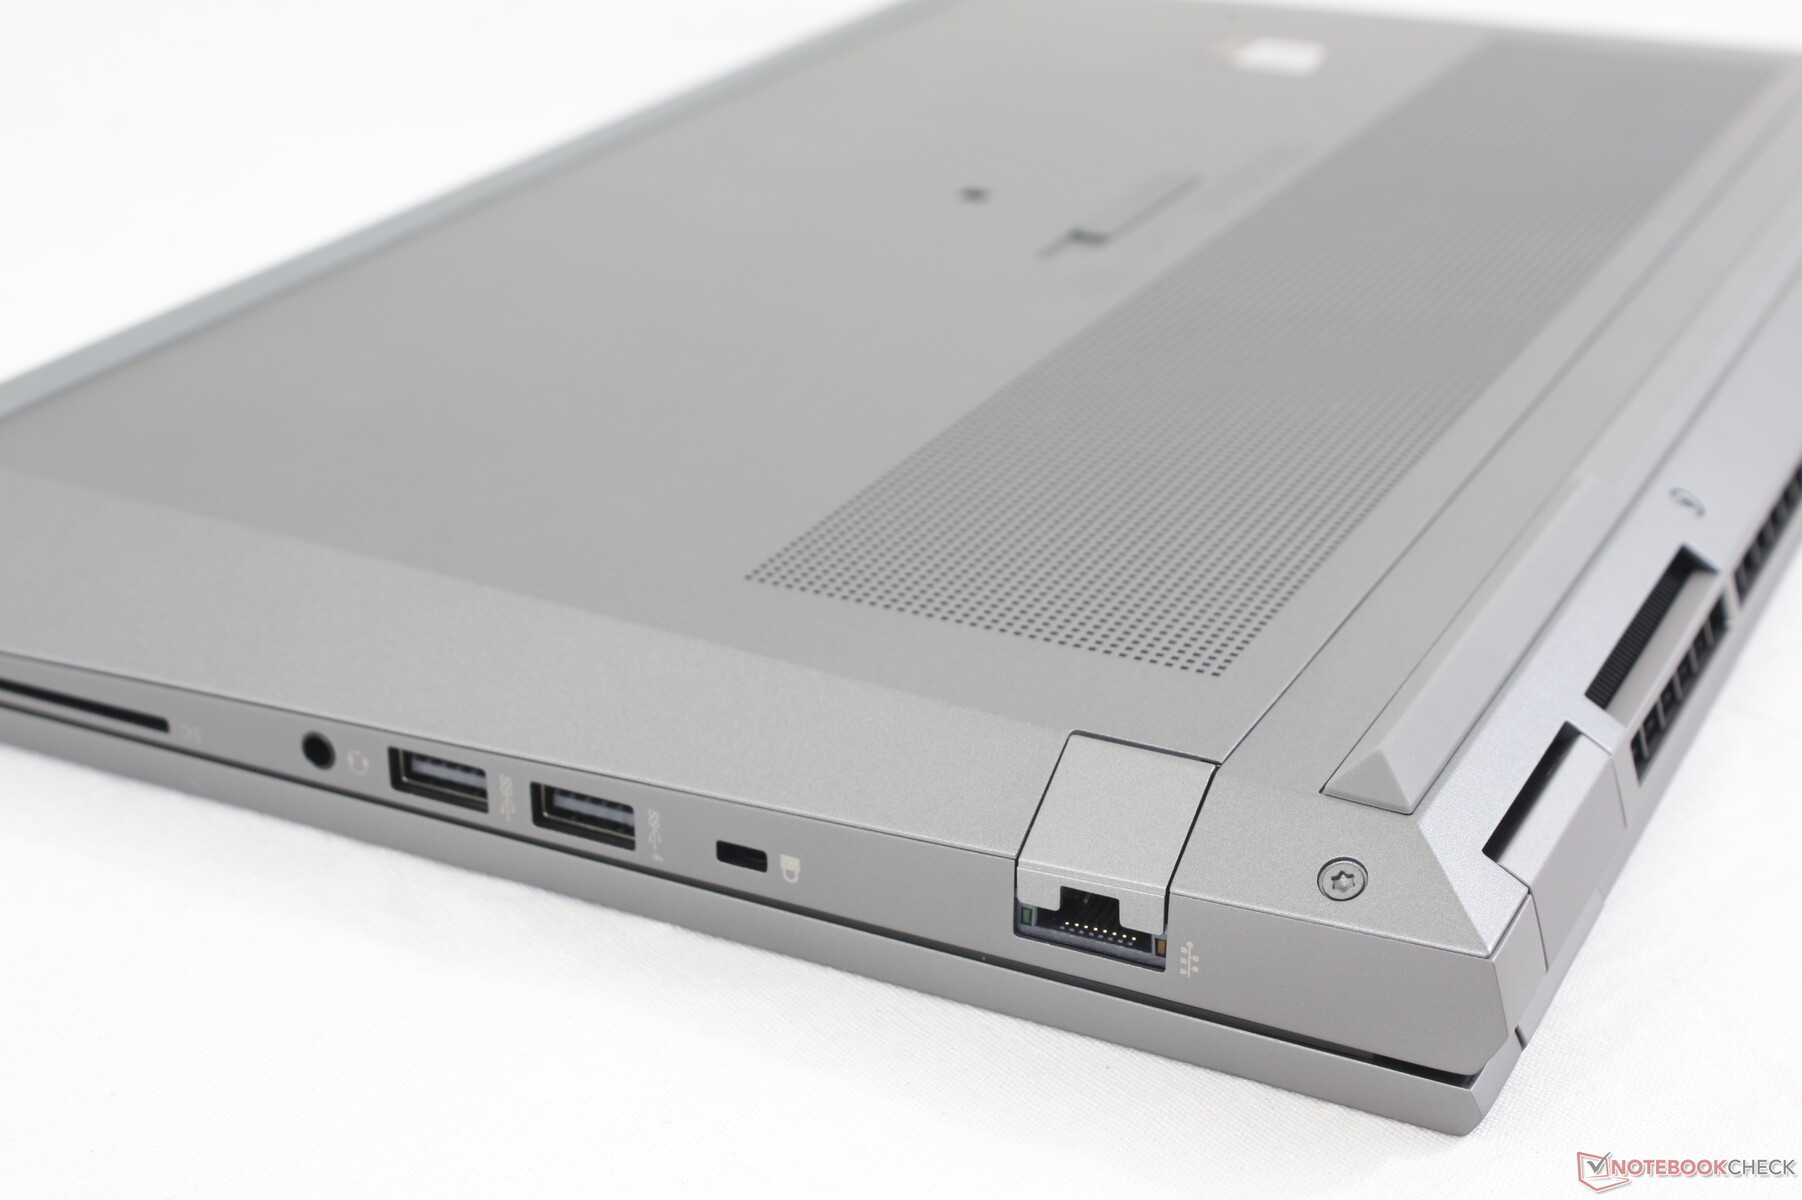
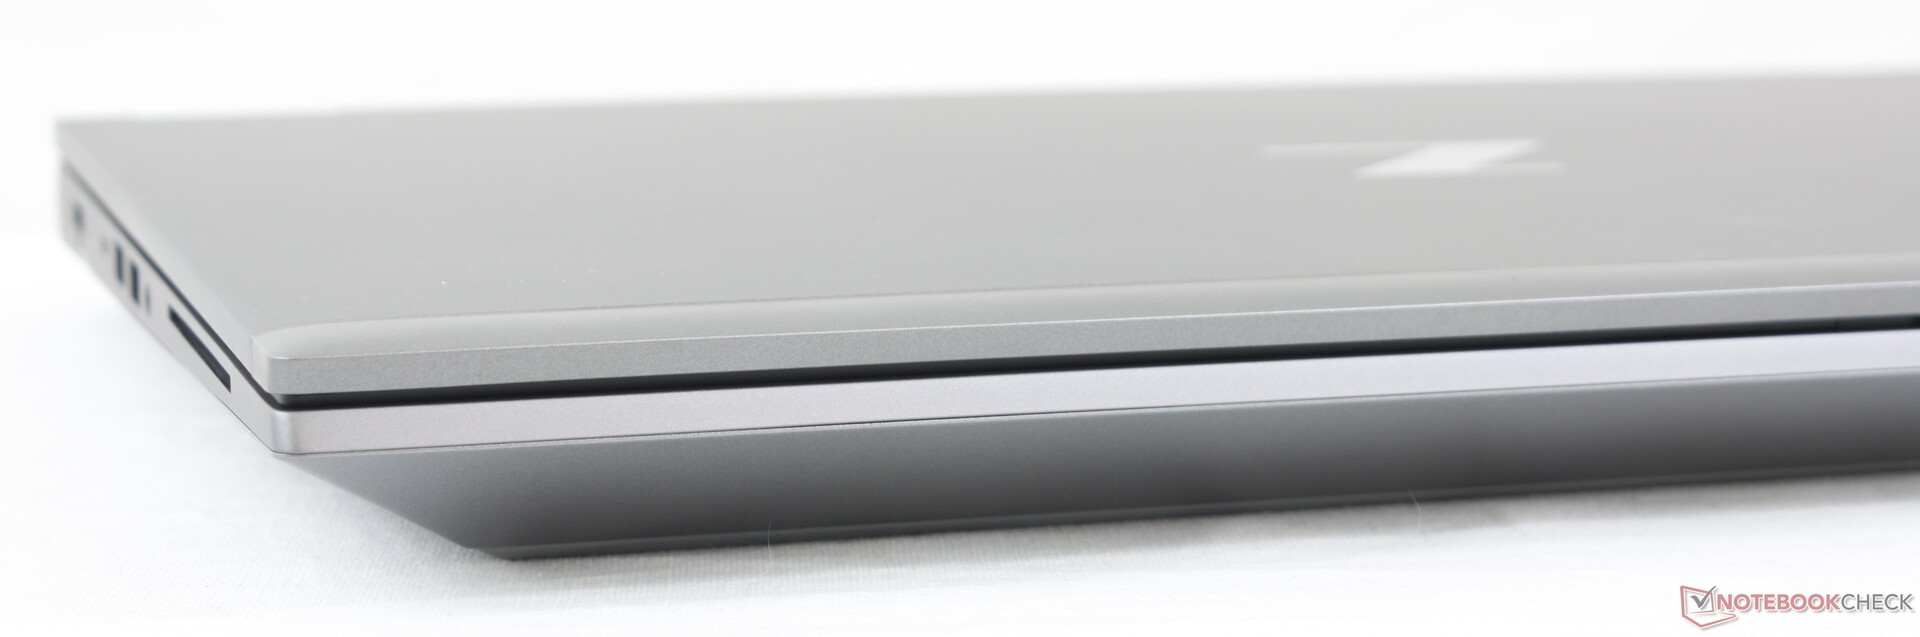
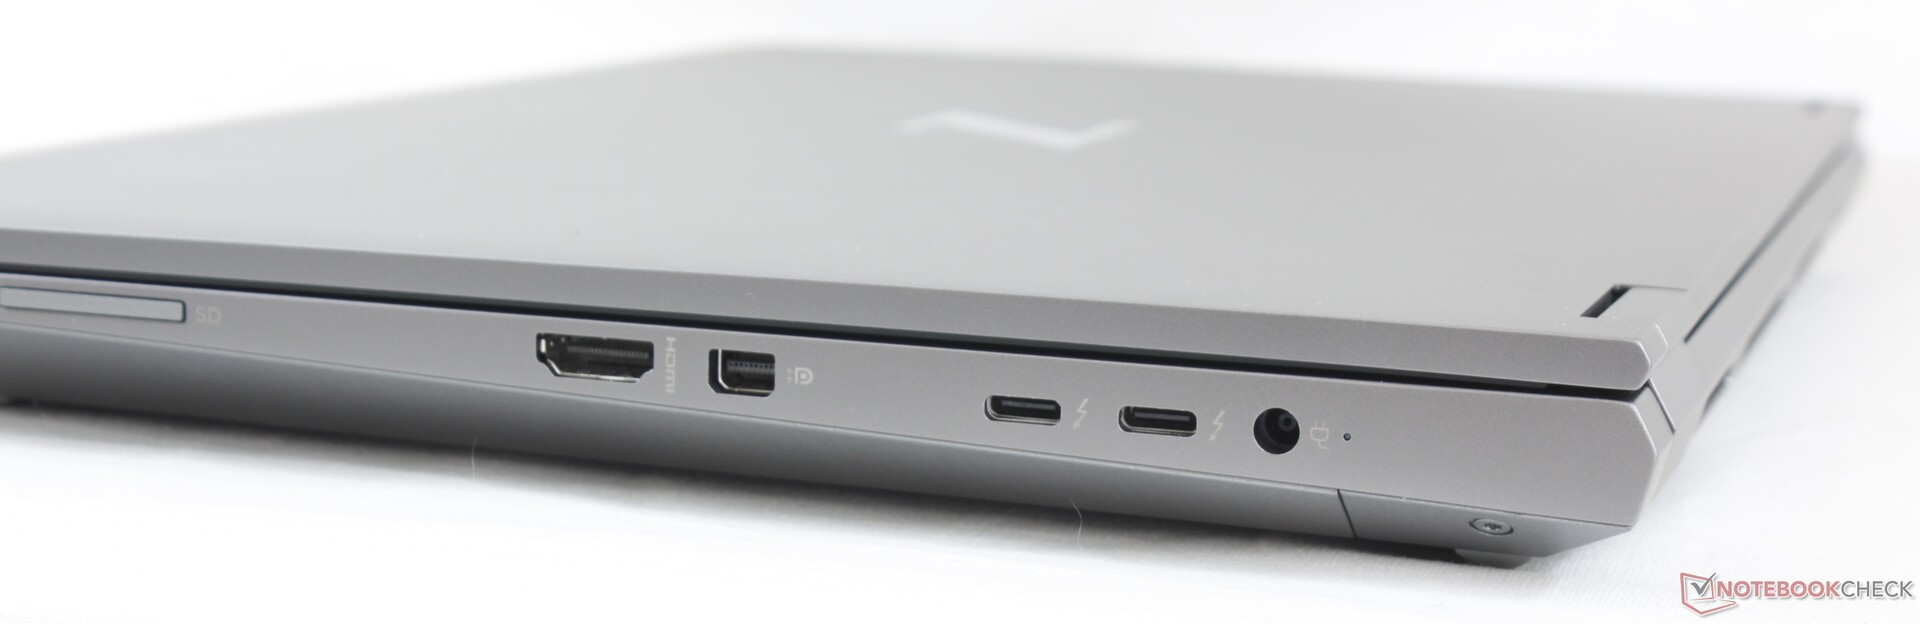
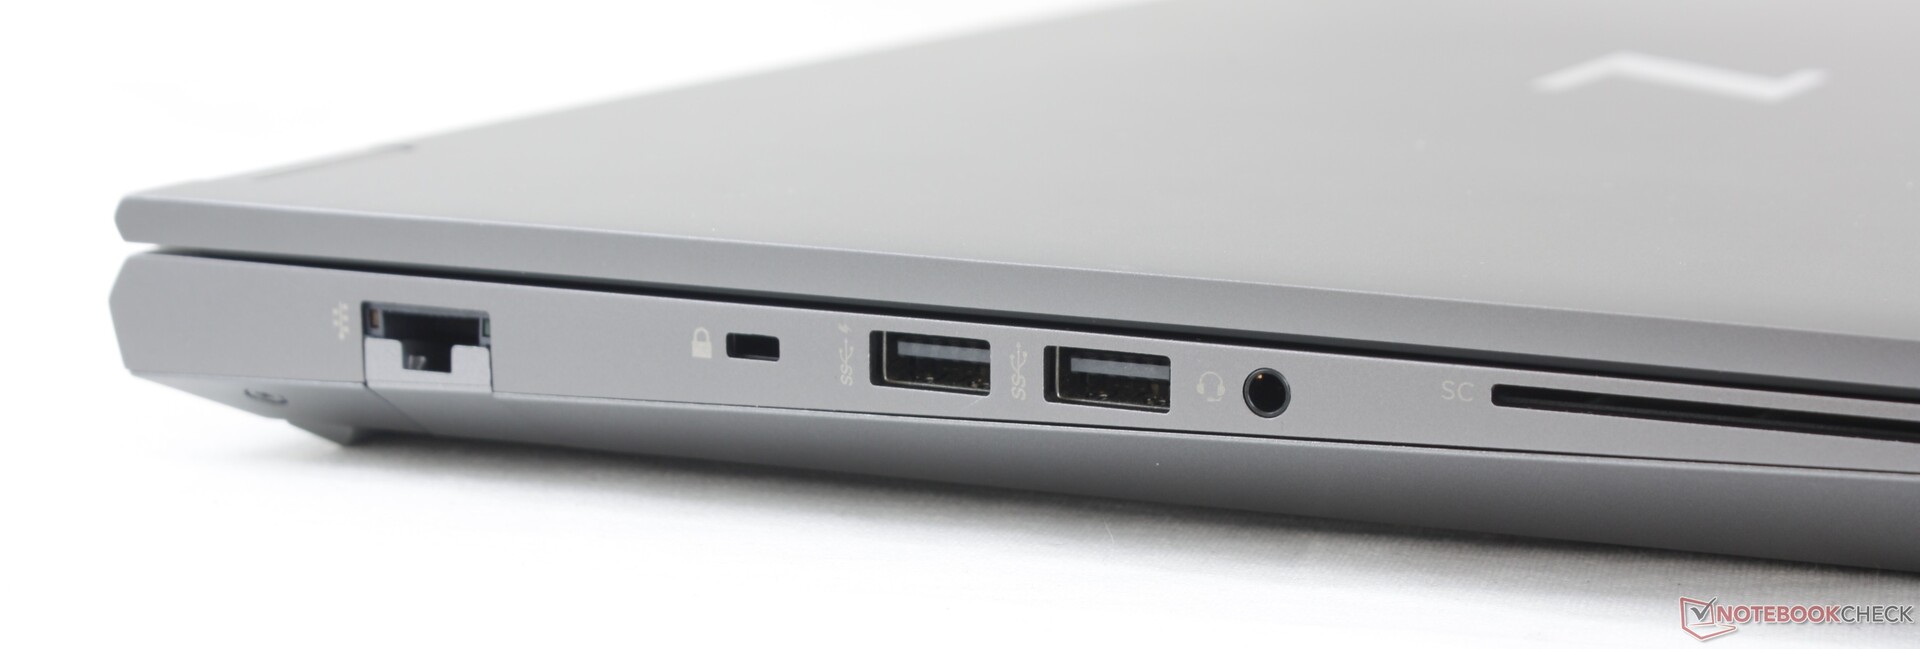
Conectividade
As opções de portos são abundantes e idênticas às da Dell Precision 7550. O posicionamento das portas é mais acessível no HP, uma vez que não há nenhuma ao longo da borda traseira.
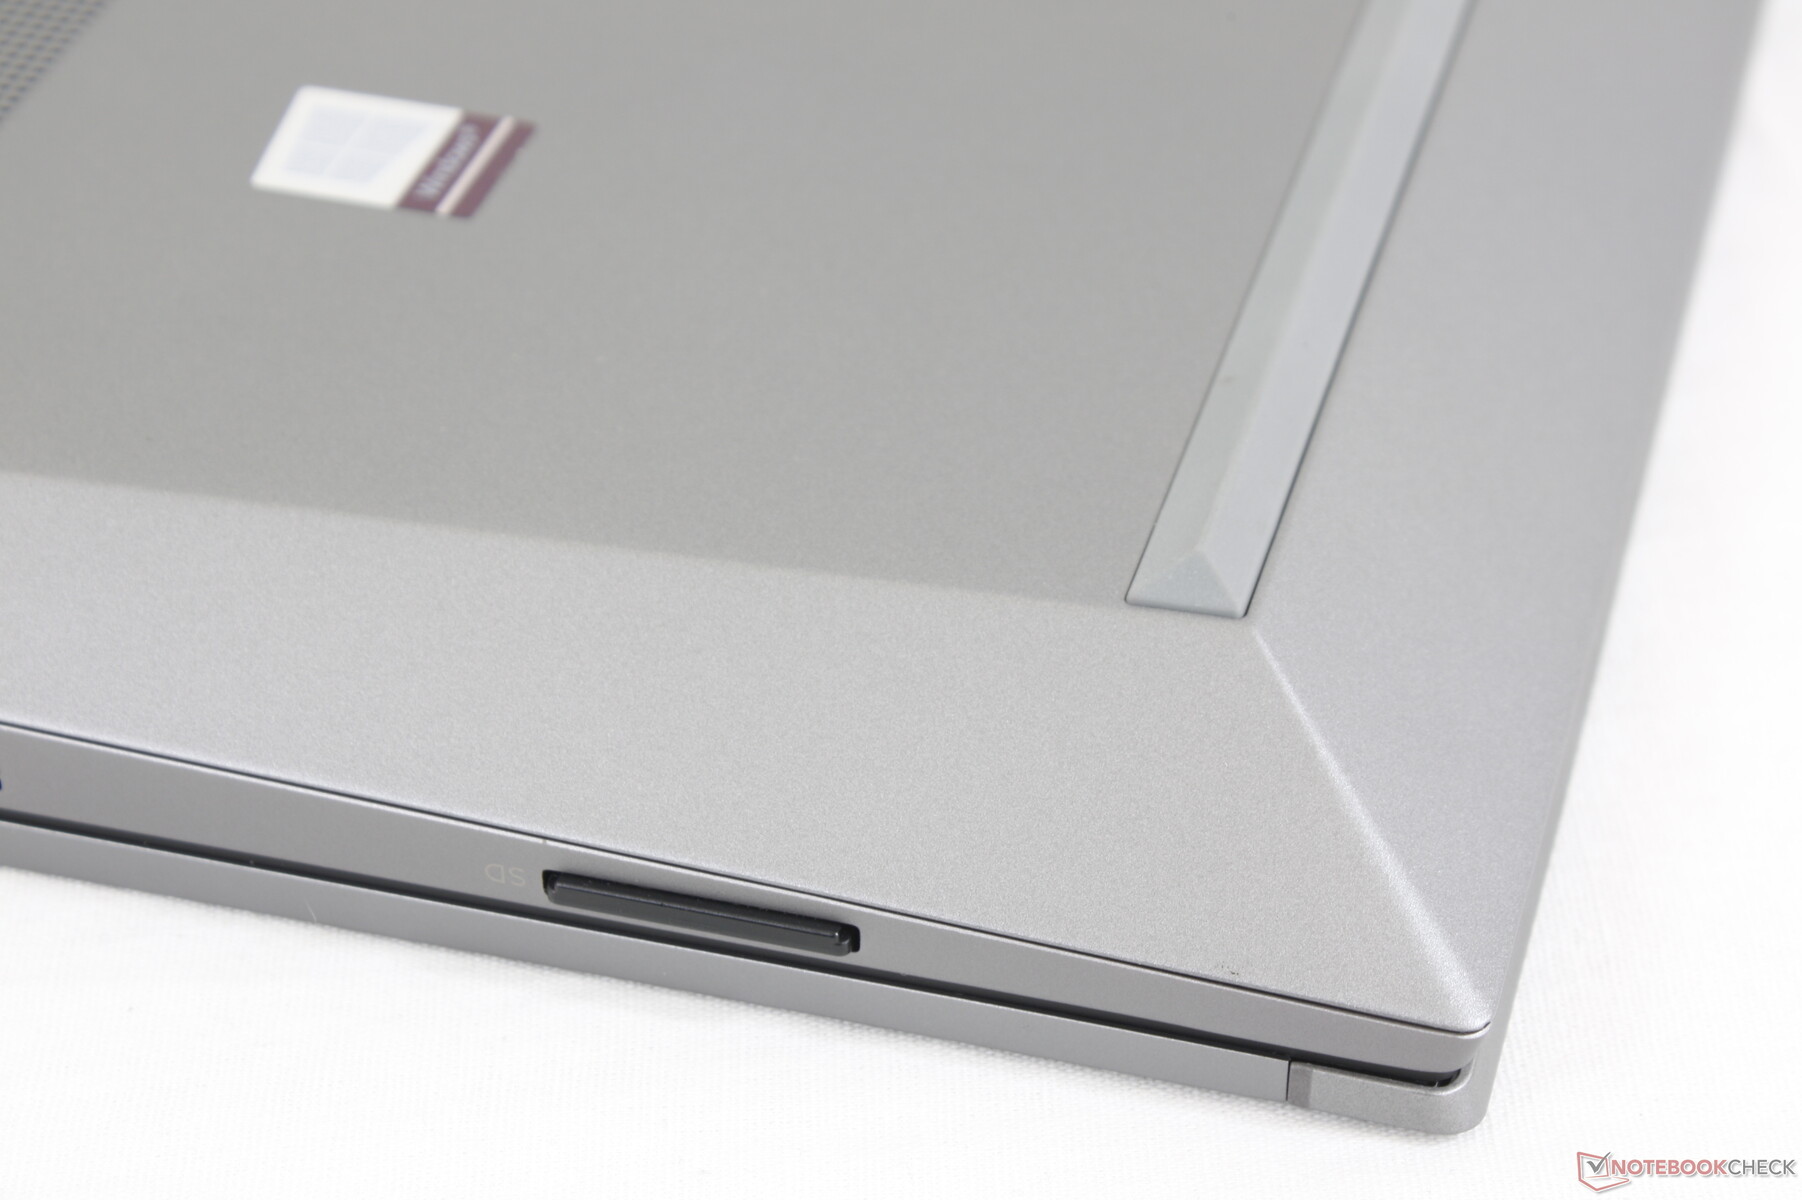
Leitor de cartões SD
O leitor de cartões SD integrado oferece taxas de transferência rápidas. A transferência de 1 GB de imagens de nosso cartão UHS-II para a área de trabalho leva cerca de 6 segundos para estar em linha com a maioria das outras estações de trabalho de alta tecnologia.
| SD Card Reader | |
| average JPG Copy Test (av. of 3 runs) | |
| MSI WS66 10TMT-207US (Toshiba Exceria Pro SDXC 64 GB UHS-II) | |
| Dell Precision 7550 (Toshiba Exceria Pro SDXC 64 GB UHS-II) | |
| Lenovo ThinkPad P1 2019-20QT000RGE (Toshiba Exceria Pro SDXC 64 GB UHS-II) | |
| HP ZBook Fury 15 G7 (Toshiba Exceria Pro SDXC 64 GB UHS-II) | |
| Razer Blade 15 Studio Edition 2020 (Toshiba Exceria Pro SDXC 64 GB UHS-II) | |
| maximum AS SSD Seq Read Test (1GB) | |
| MSI WS66 10TMT-207US (Toshiba Exceria Pro SDXC 64 GB UHS-II) | |
| HP ZBook Fury 15 G7 (Toshiba Exceria Pro SDXC 64 GB UHS-II) | |
| Lenovo ThinkPad P1 2019-20QT000RGE (Toshiba Exceria Pro SDXC 64 GB UHS-II) | |
| Dell Precision 7550 (Toshiba Exceria Pro SDXC 64 GB UHS-II) | |
Comunicação
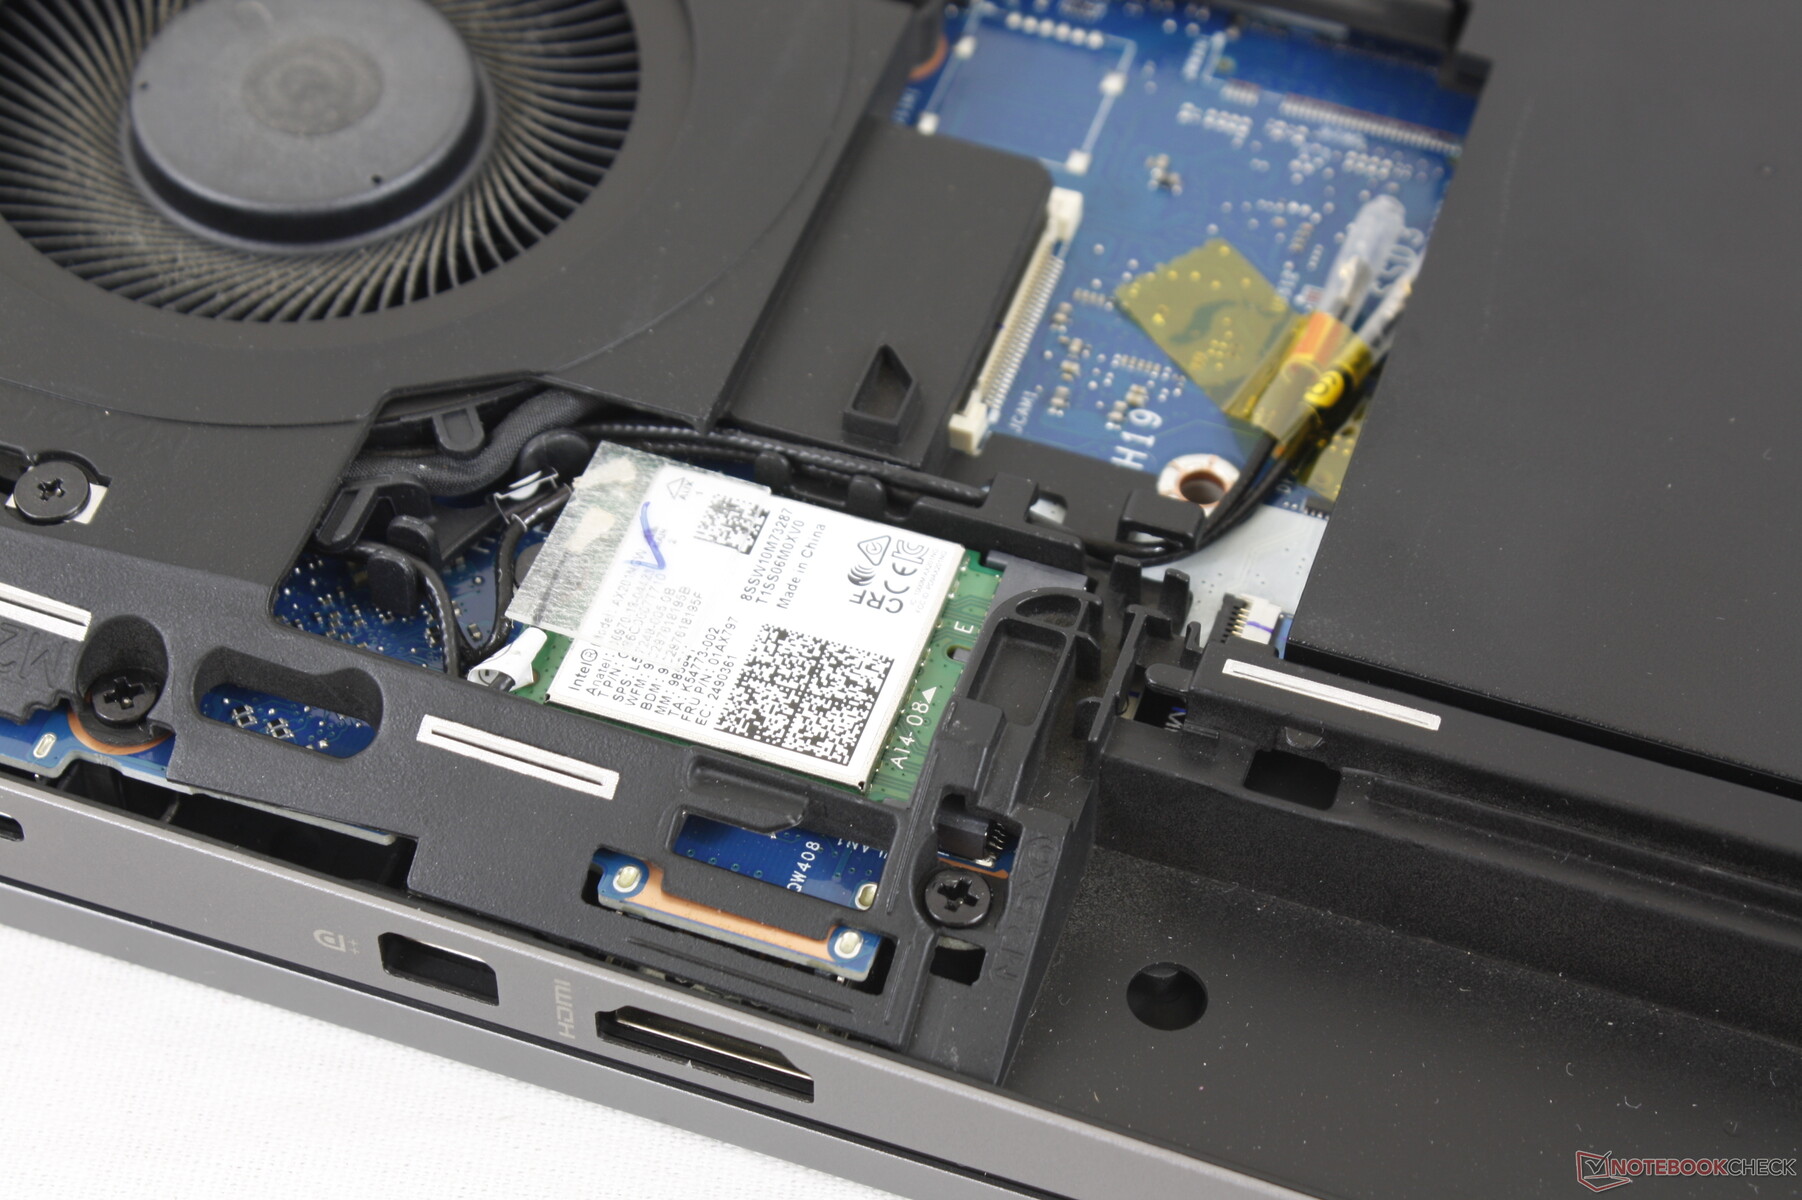
O Intel AX201 vem como padrão para conectividade Wi-Fi 6 e Bluetooth 5.1. Não tivemos nenhum problema quando acoplado ao nosso roteador de teste Netgear RAX200. As taxas médias de transferência variam de acordo com o ambiente.
Webcam


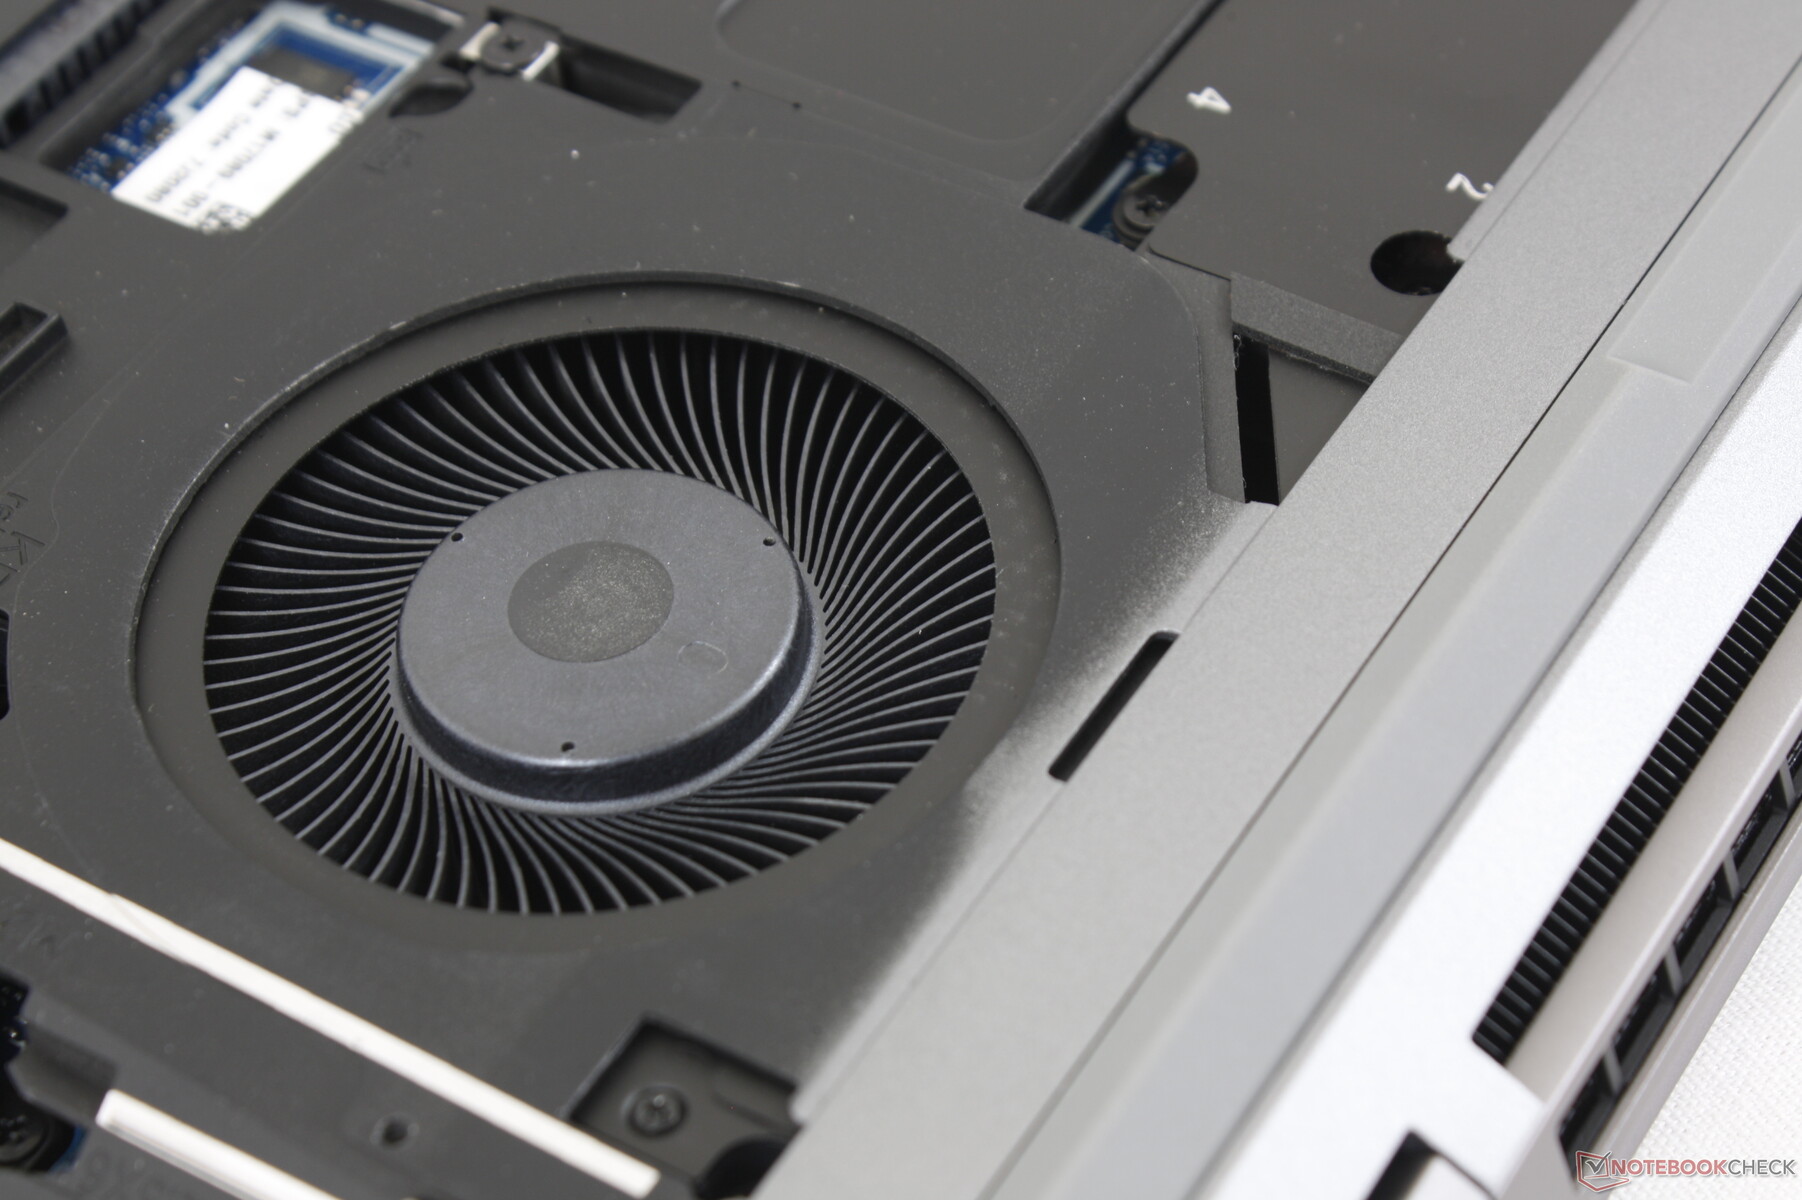
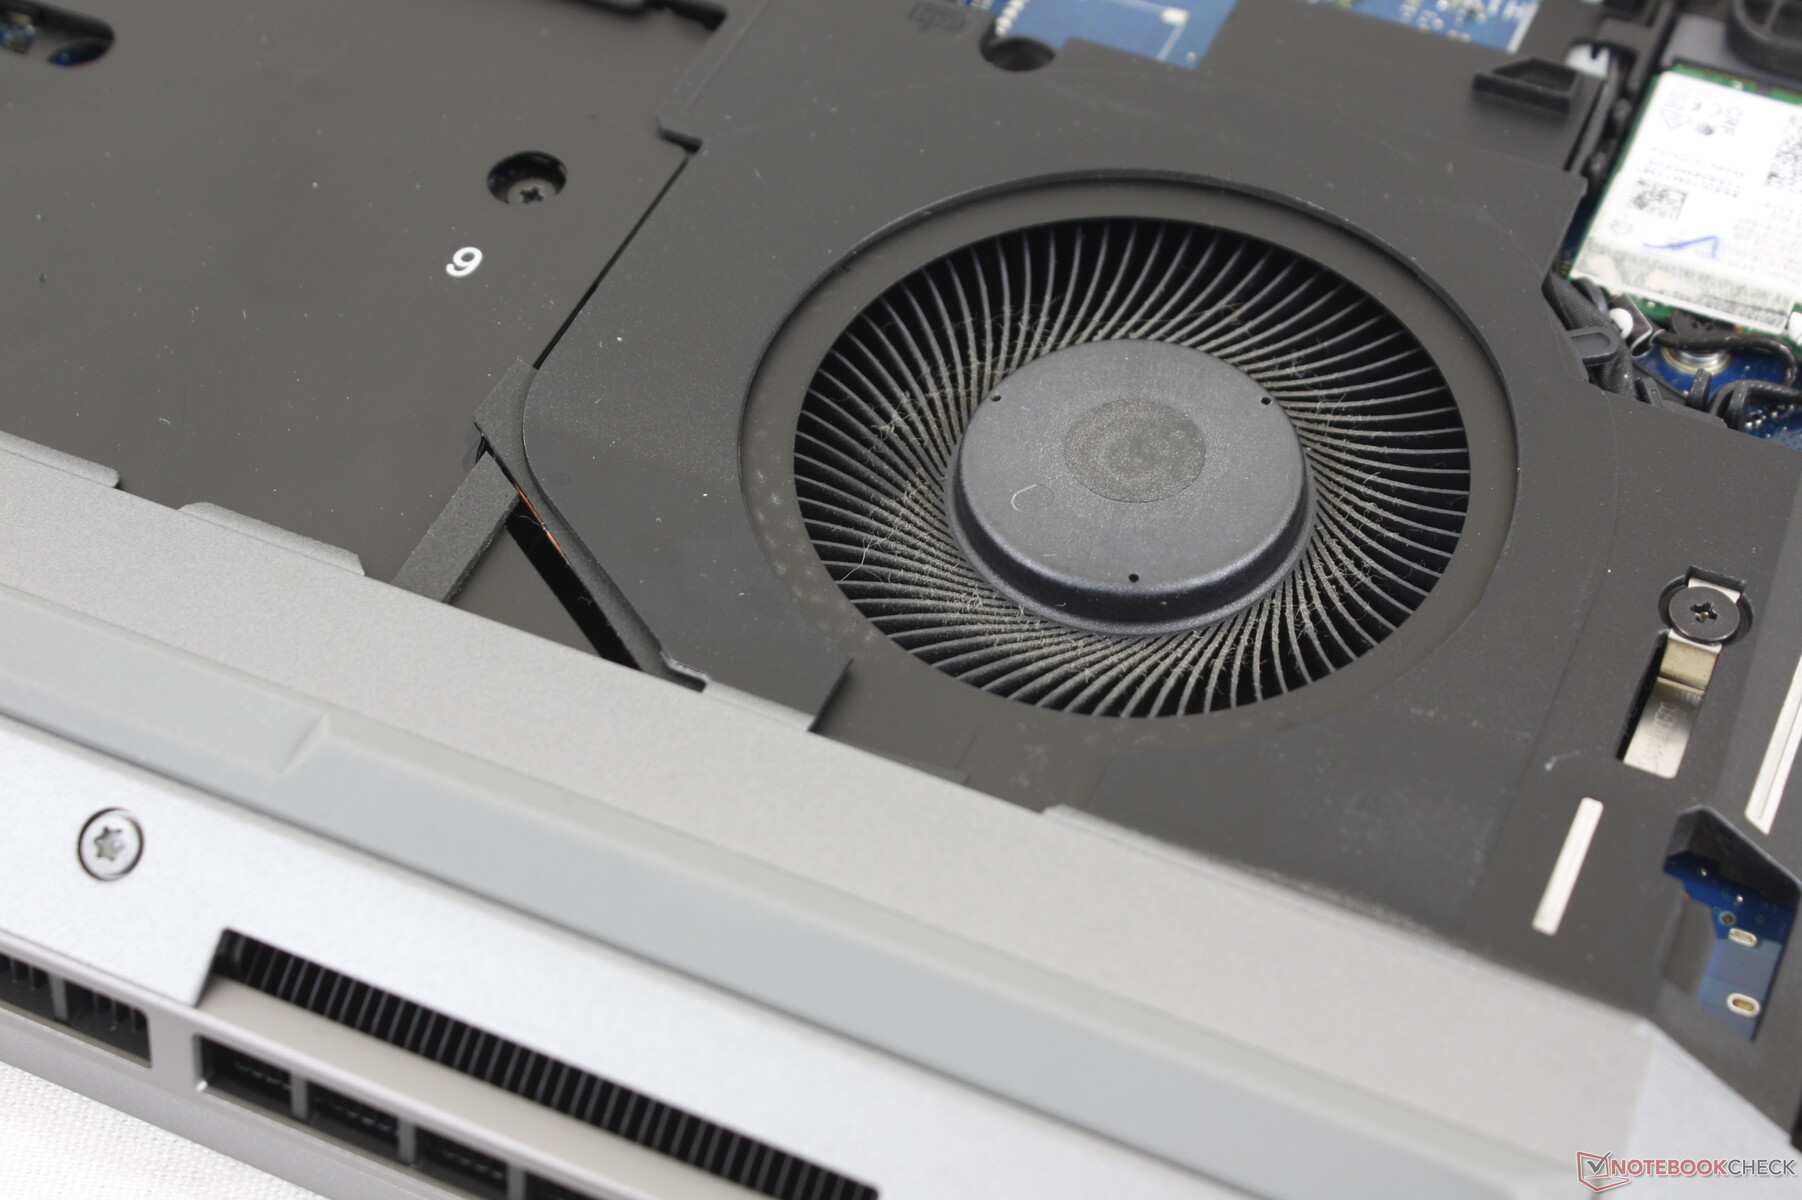
Manutenção
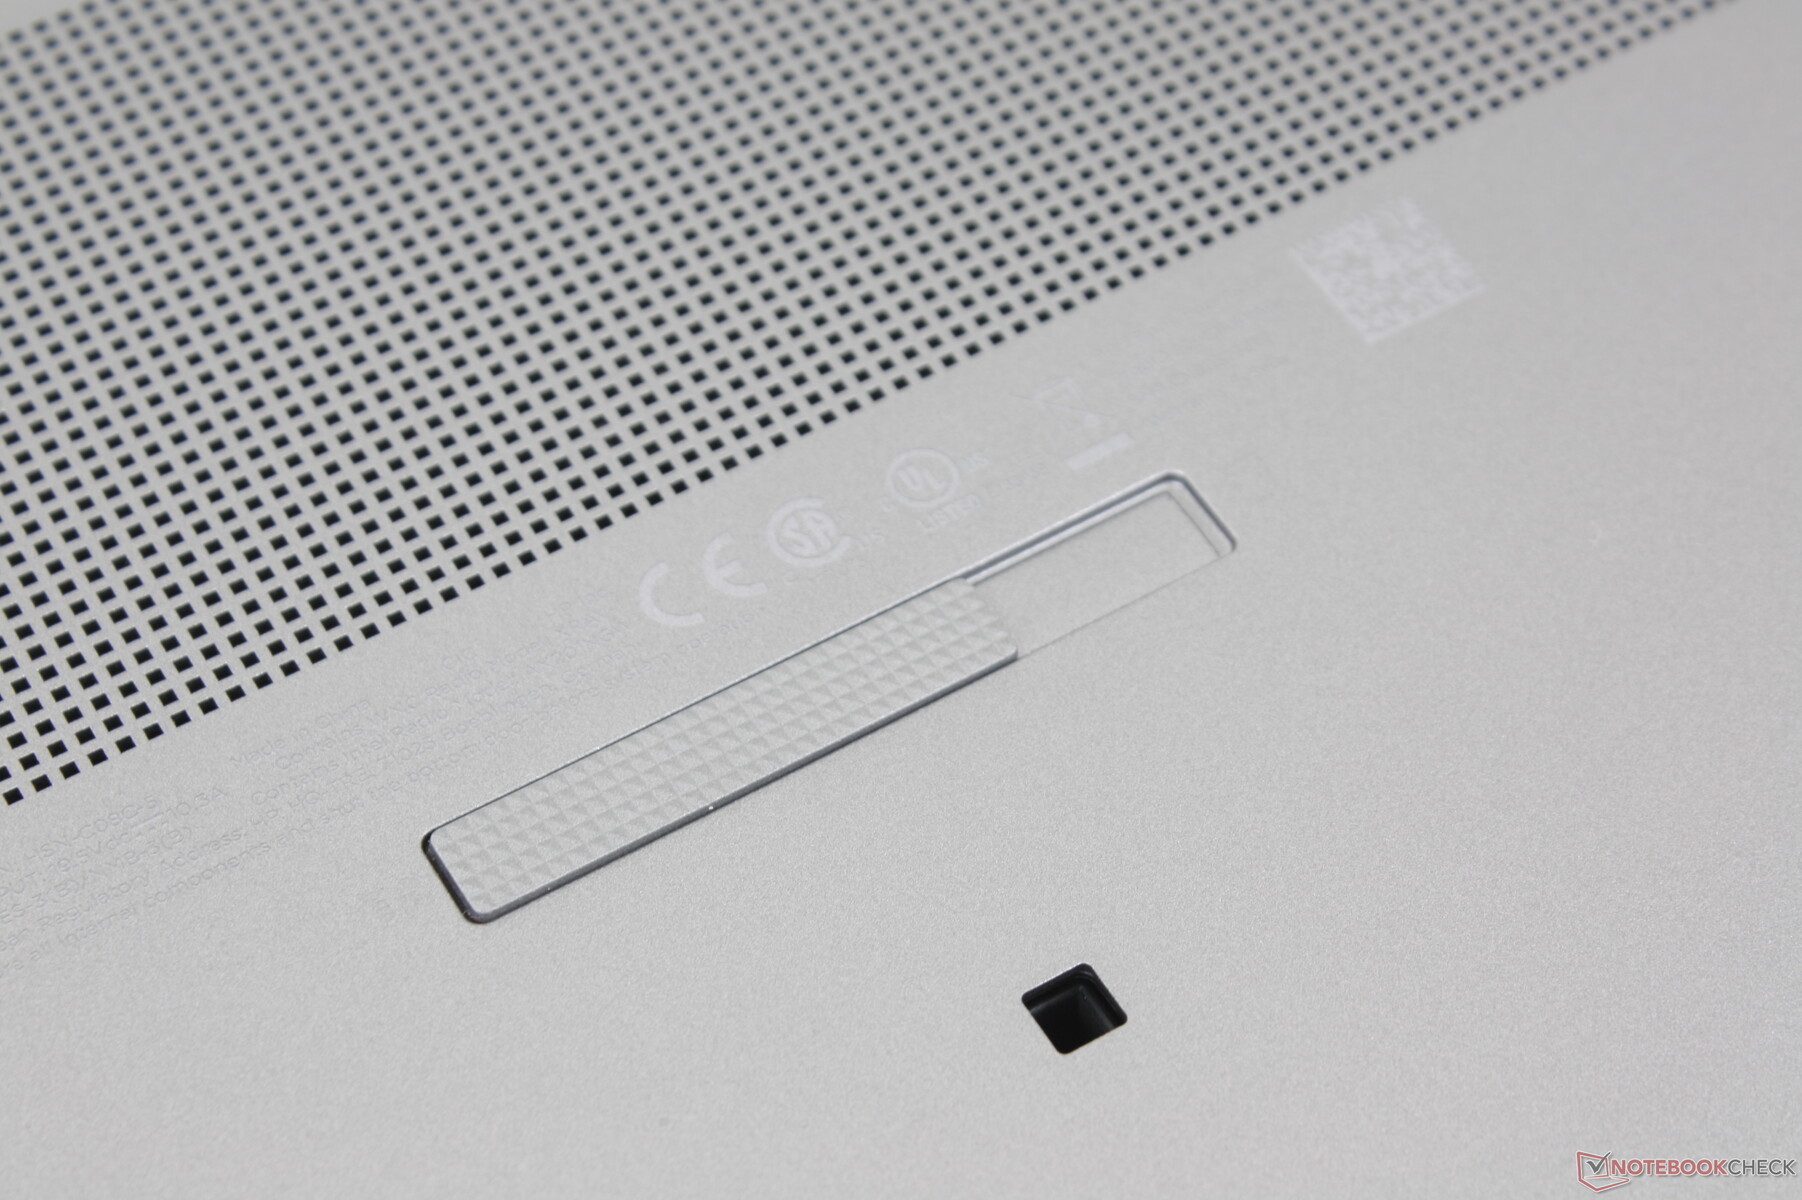
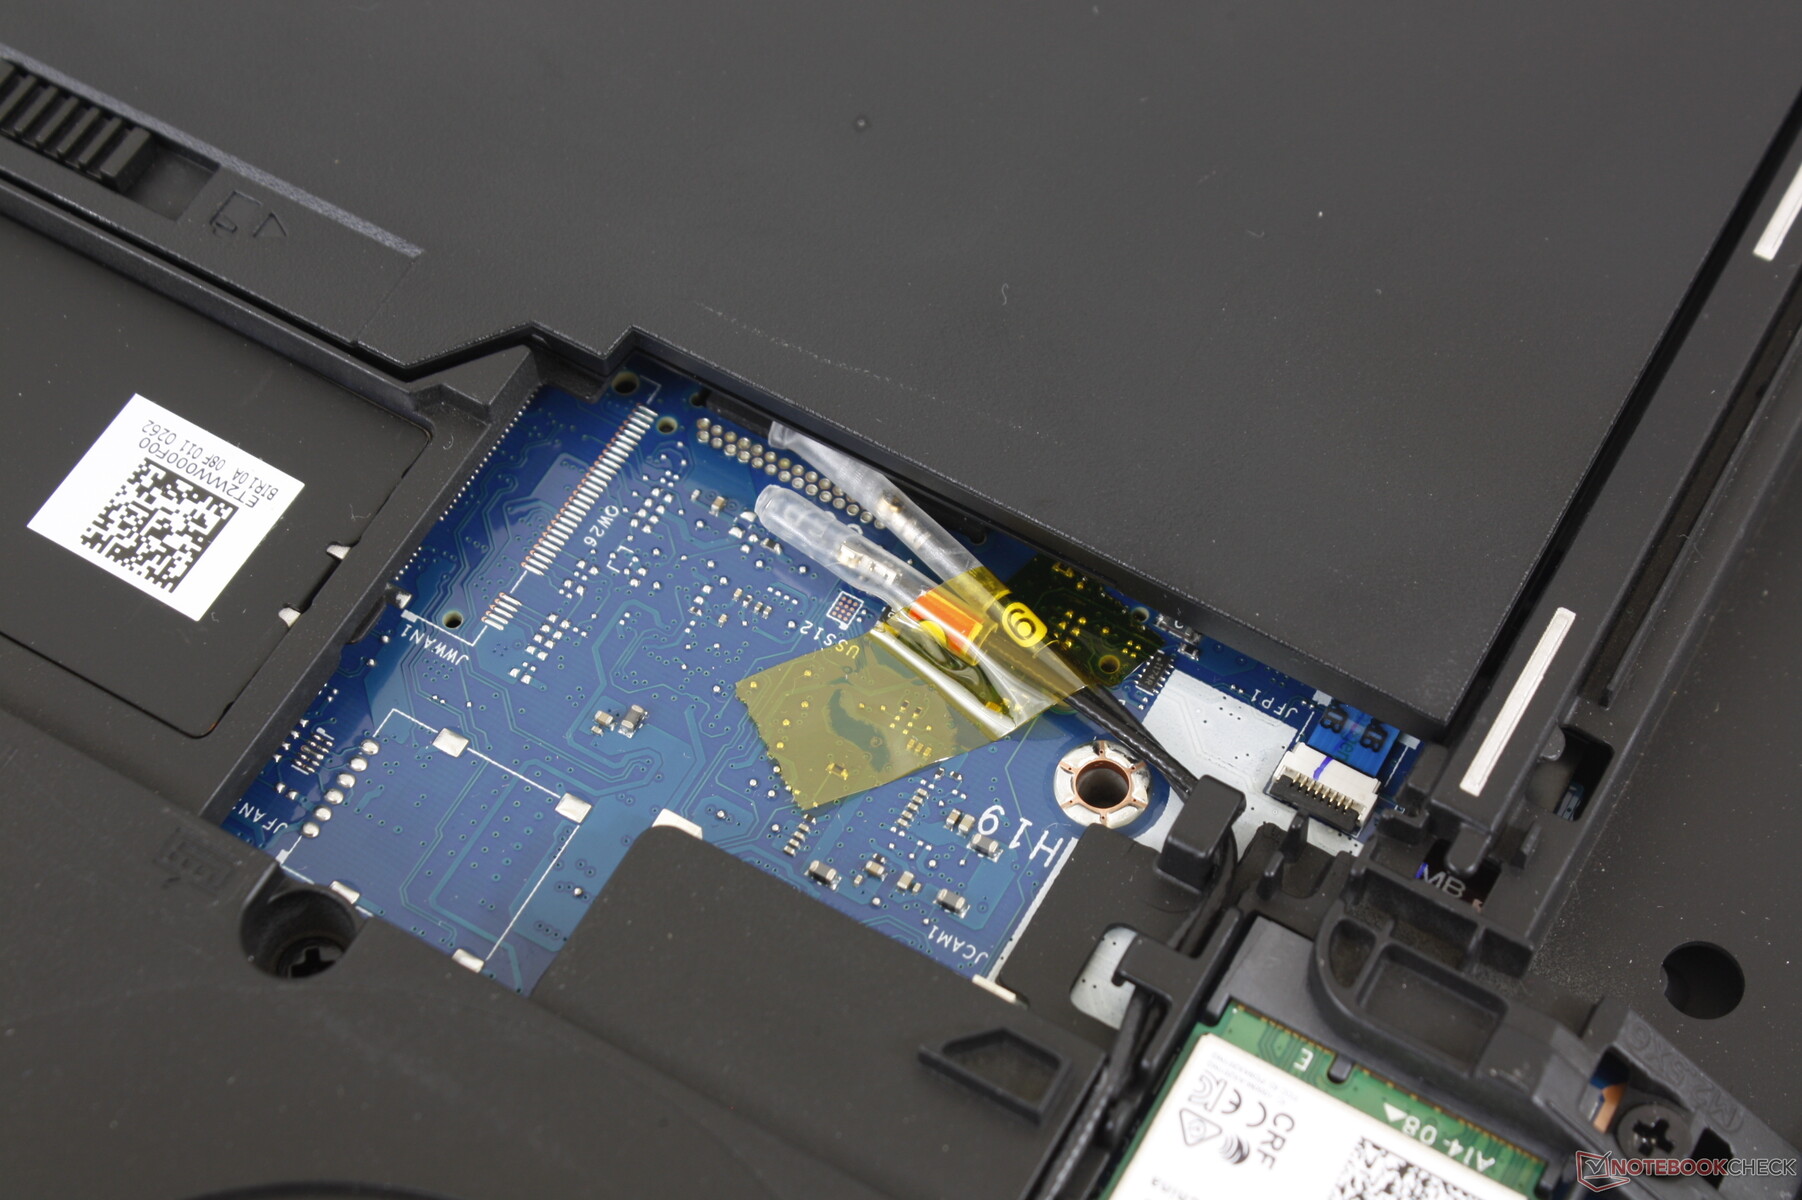
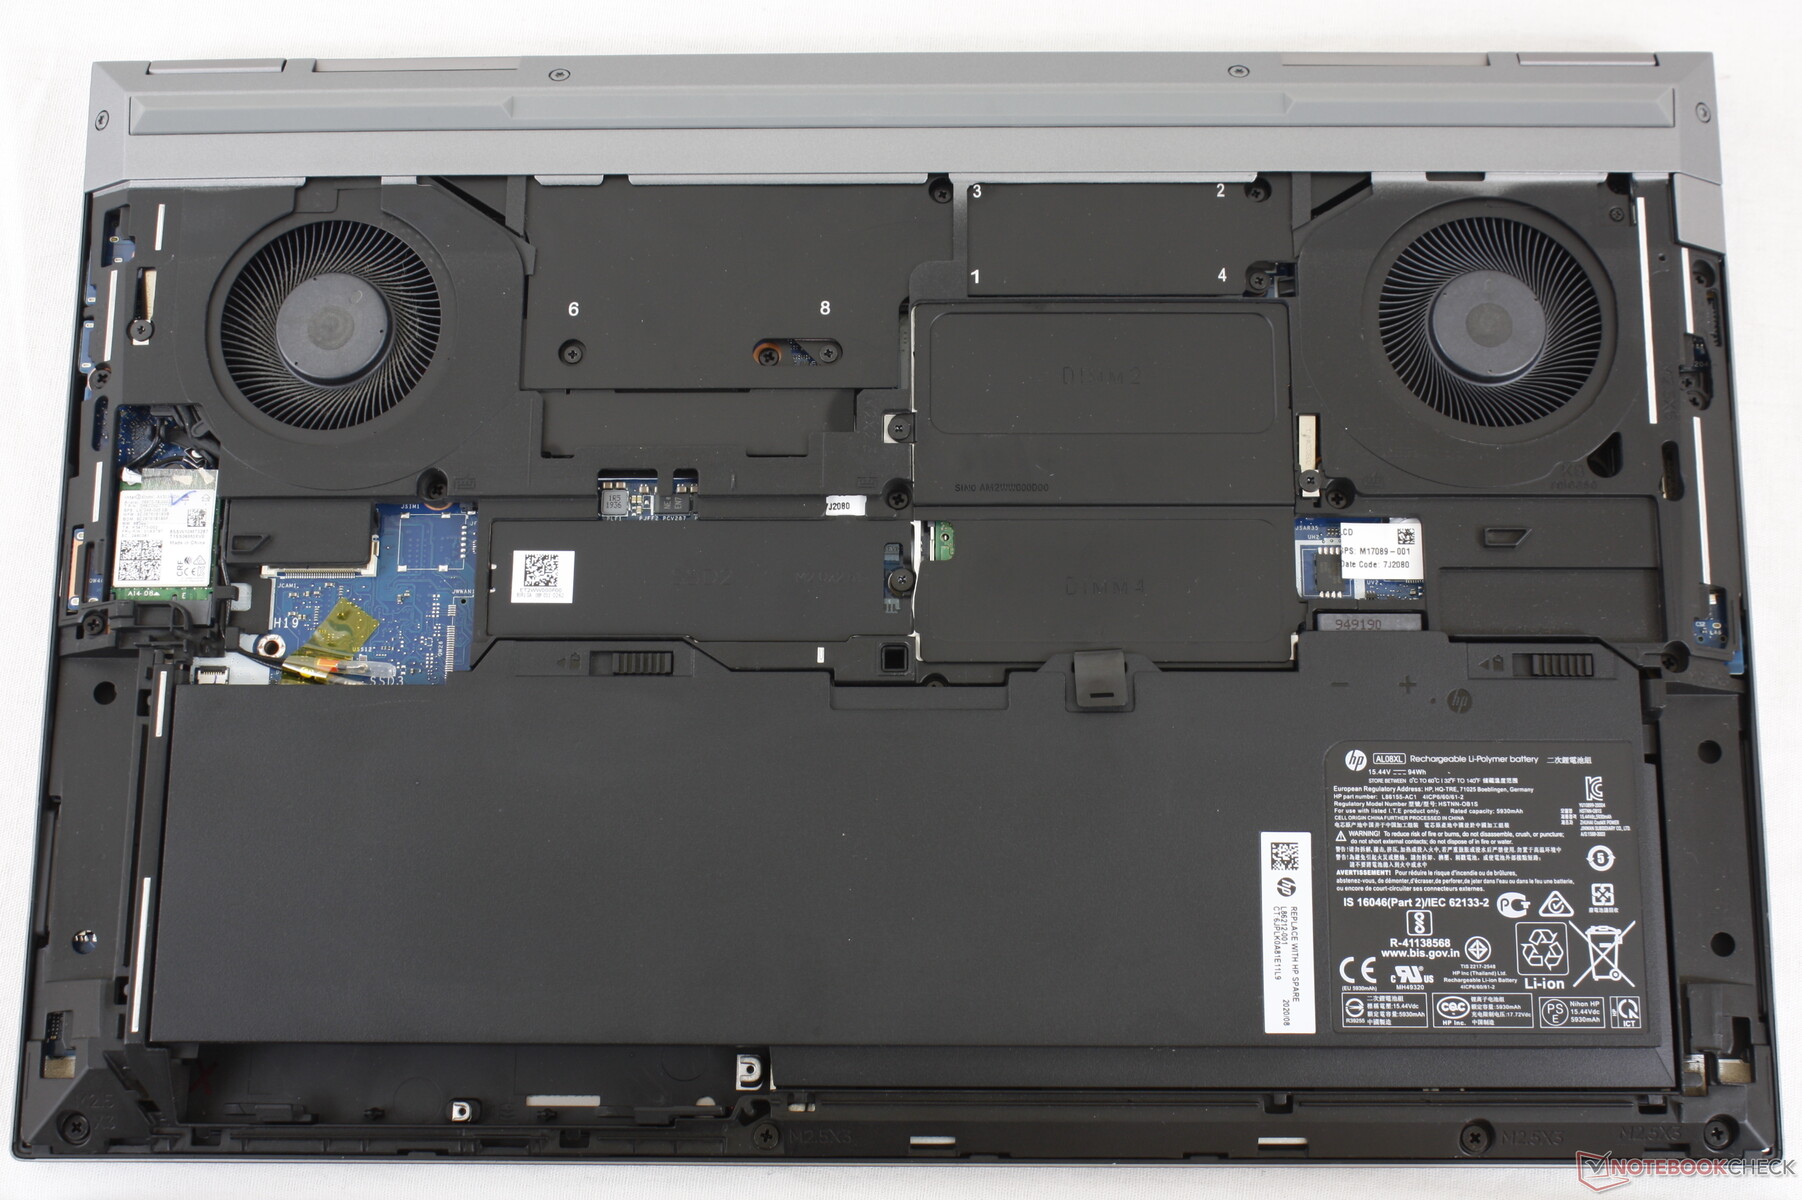
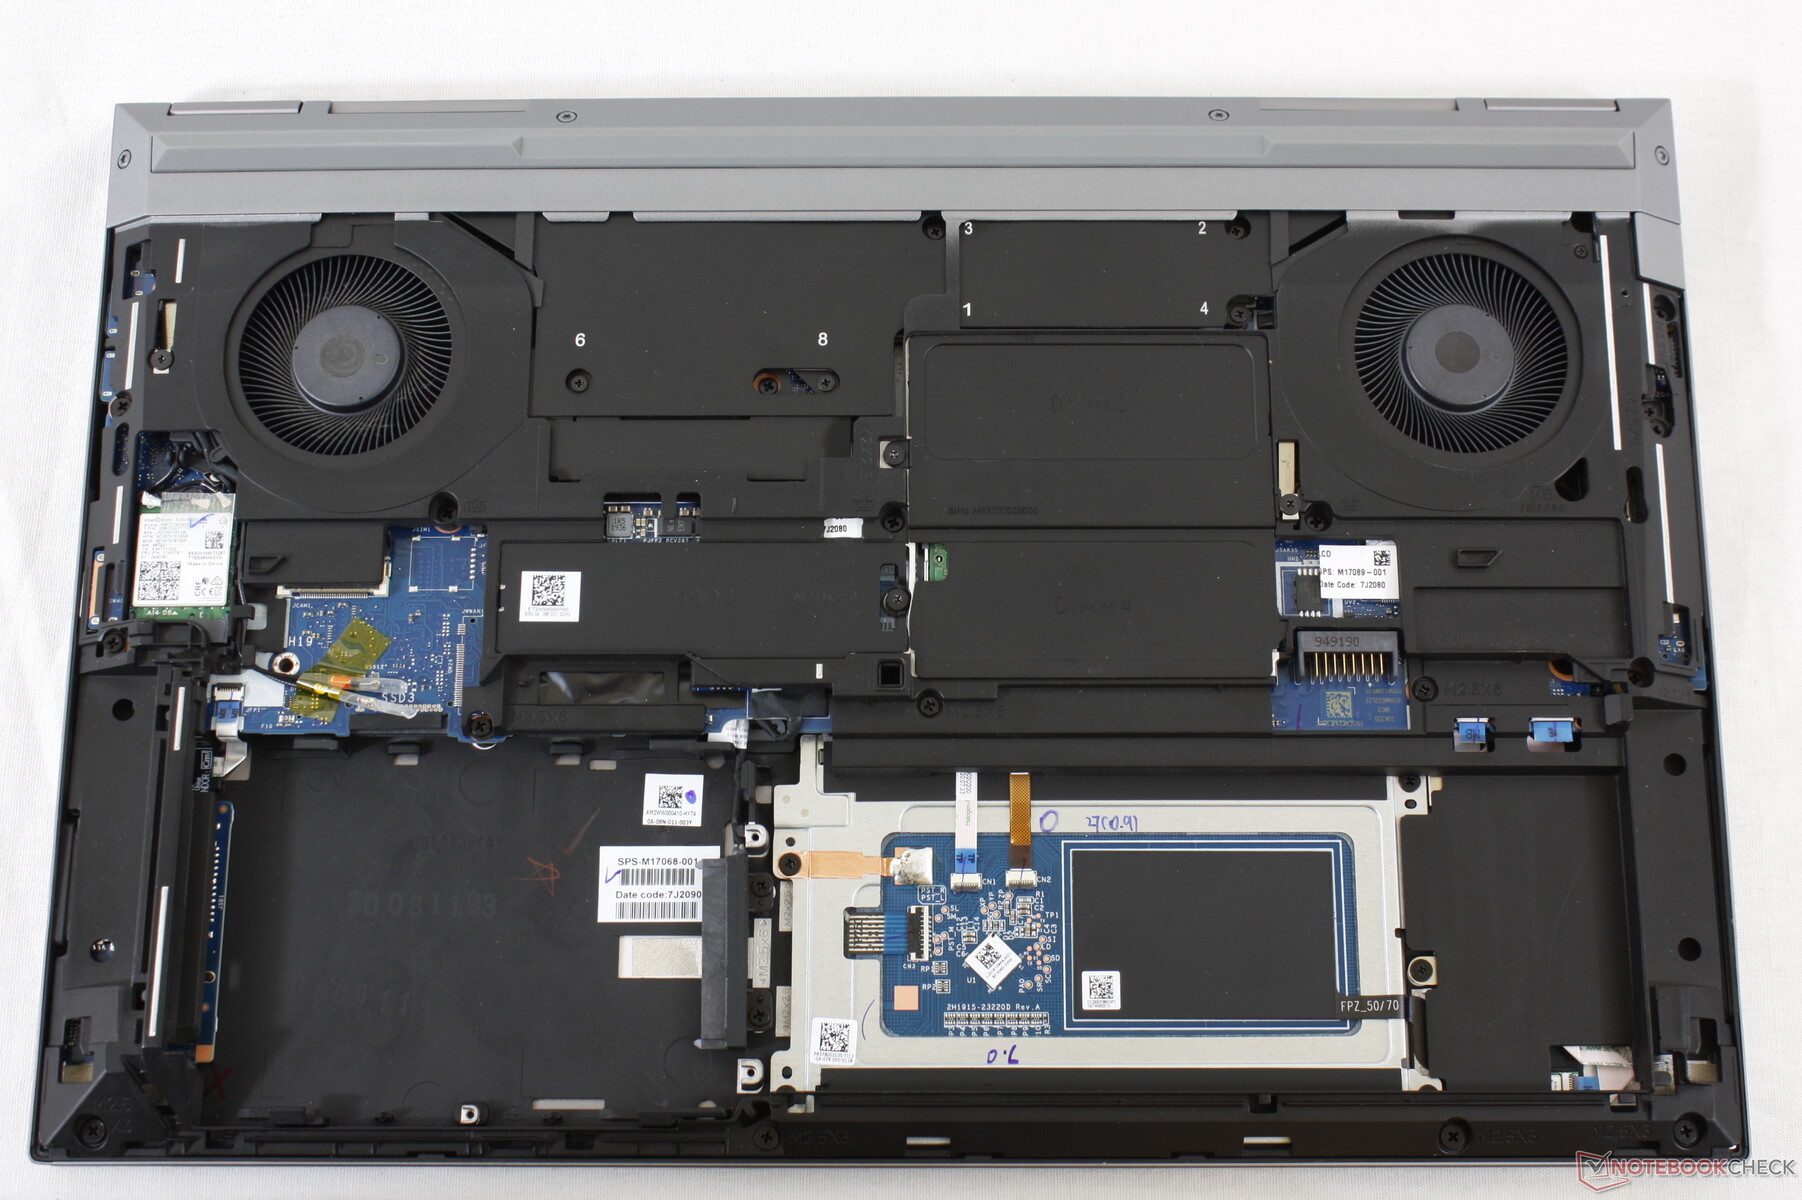
A HP anuncia serviço "sem ferramentas" porque o painel inferior e a bateria principal podem ser facilmente removidos, desengatando um par de travas. Adoramos esta abordagem e pensamos que mais OEMs deveriam implementar algo semelhante para seus laptops profissionais. Infelizmente, há uma grande advertência: uma chave de fenda ainda é necessária para realmente acessar quase tudo mais. RAM e armazenamento estão por trás de uma blindagem adicional, o que significa que o projeto "sem ferramentas" não é totalmente preciso.
Além disso, os parafusos que fixam os slots de RAM e SSD são apertados e macios, o que significa que eles podem sair mais facilmente. Desmontamos muitos laptops em nossos laboratórios e os parafusos neste HP são mais difíceis de remover
Acessórios e Garantia
Não há extras na caixa além da papelada usual e do adaptador AC. No entanto, há muitas estações de acoplamento e acessórios opcionais, incluindo o Dock HP Thunderbolt Dock.
Uma garantia limitada de três anos vem de série com opções de extensão se encomendada diretamente da HP.
Dispositivos de entrada
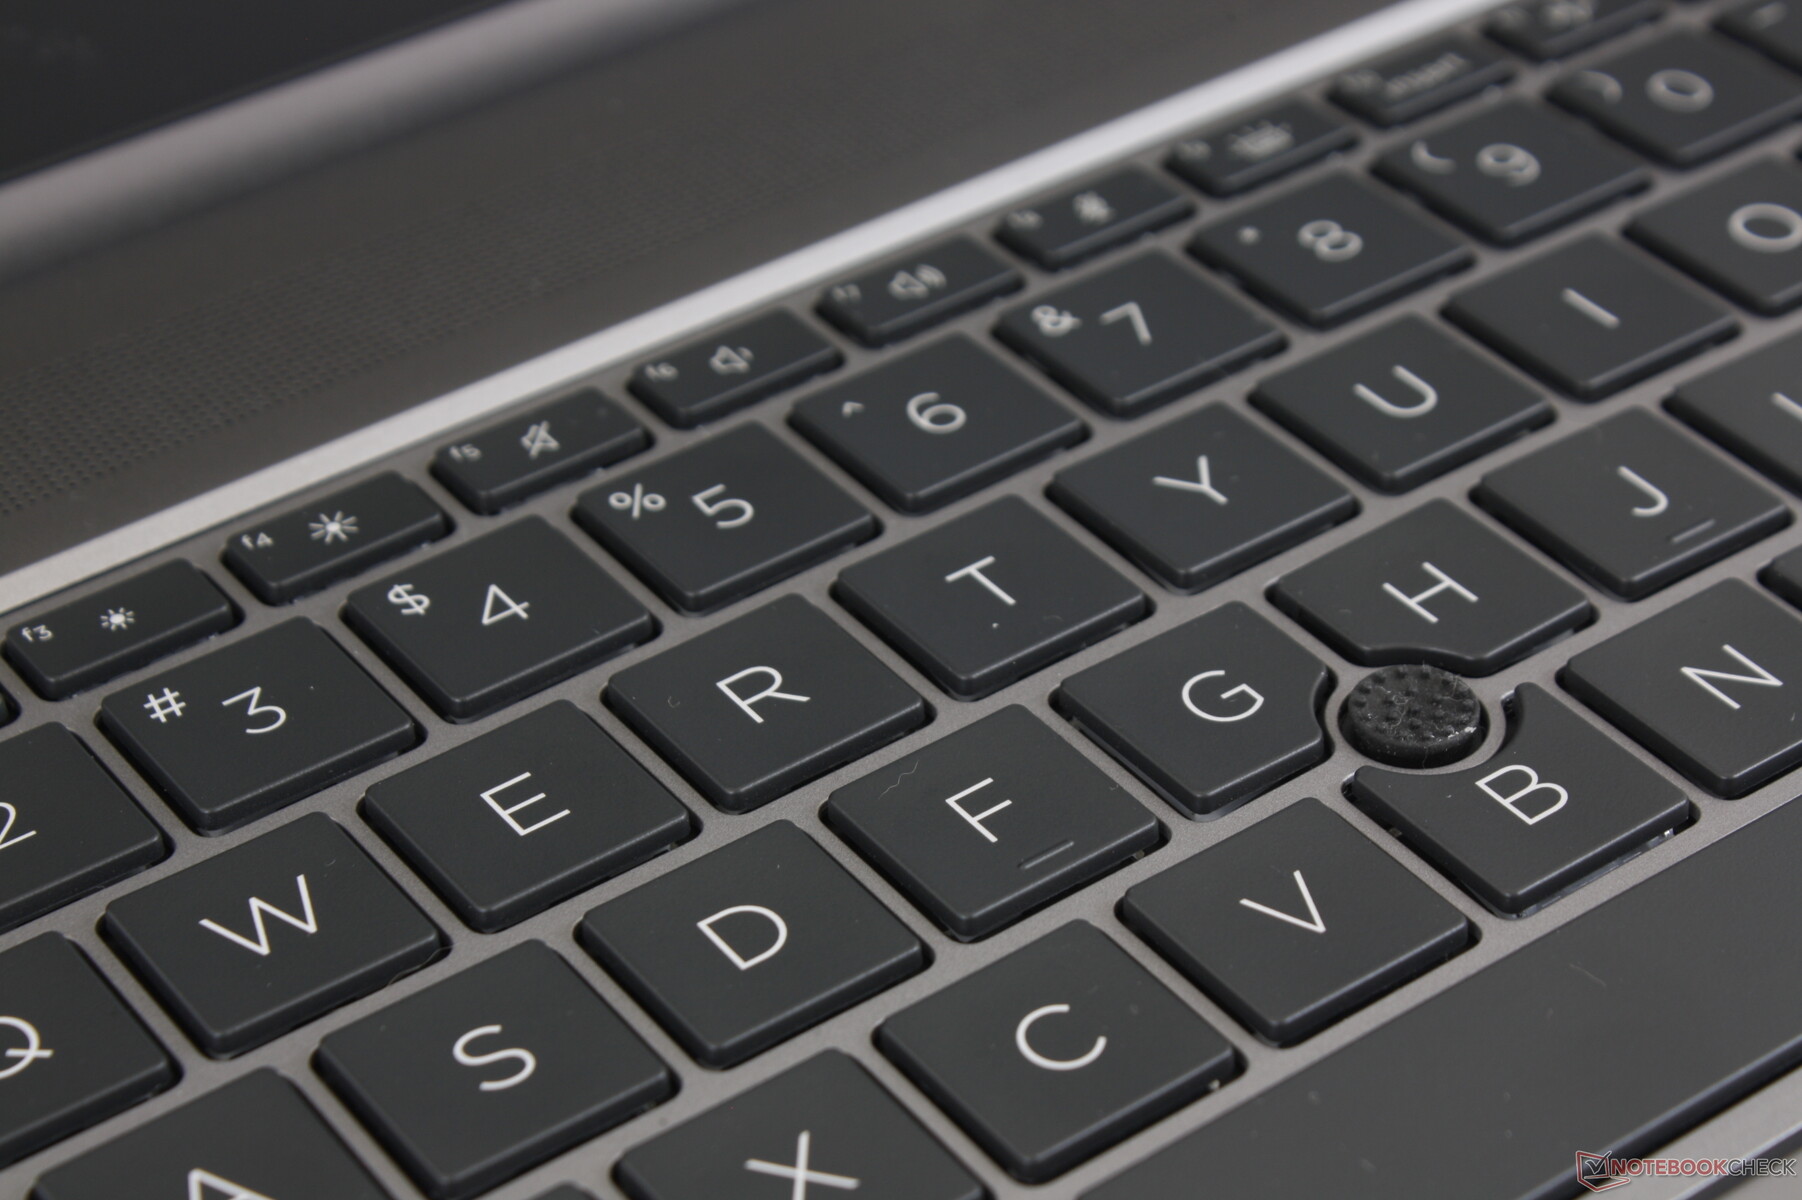
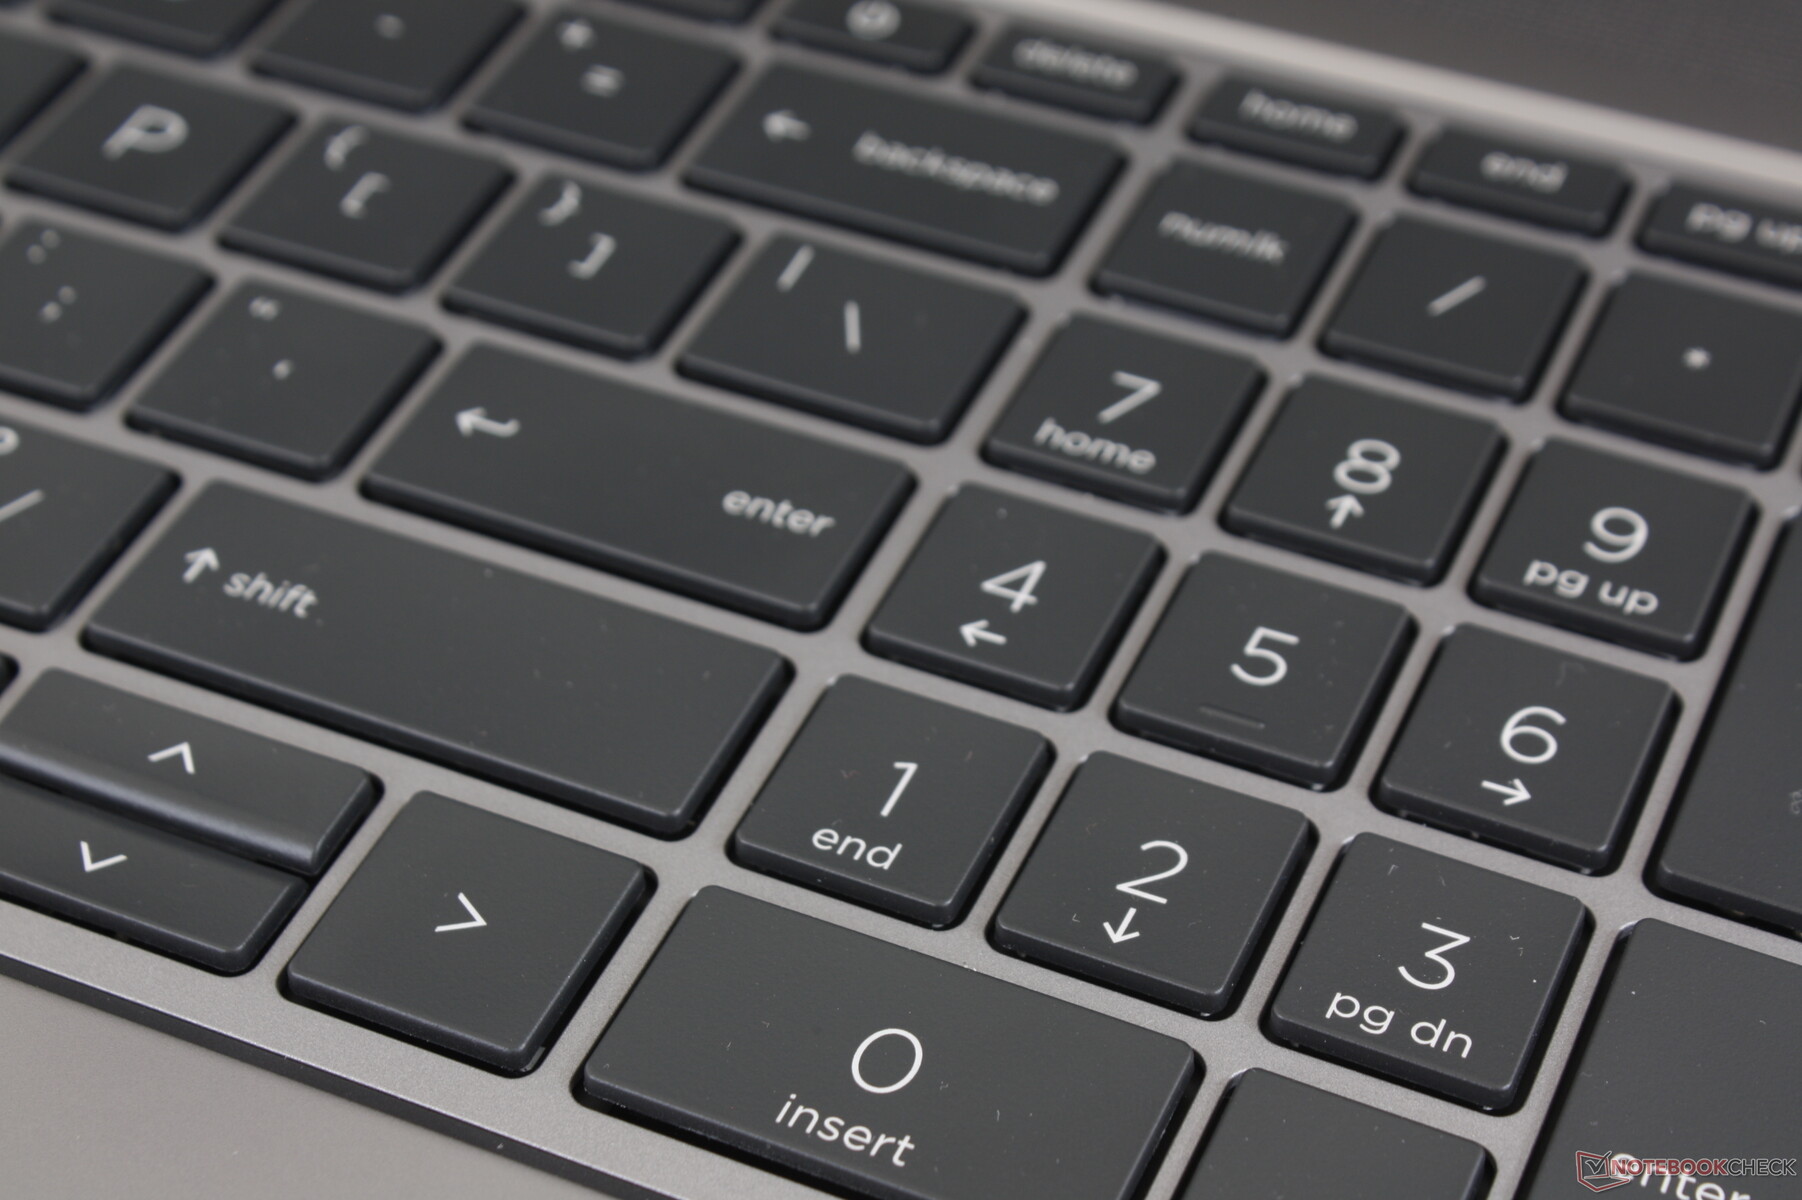
Teclado
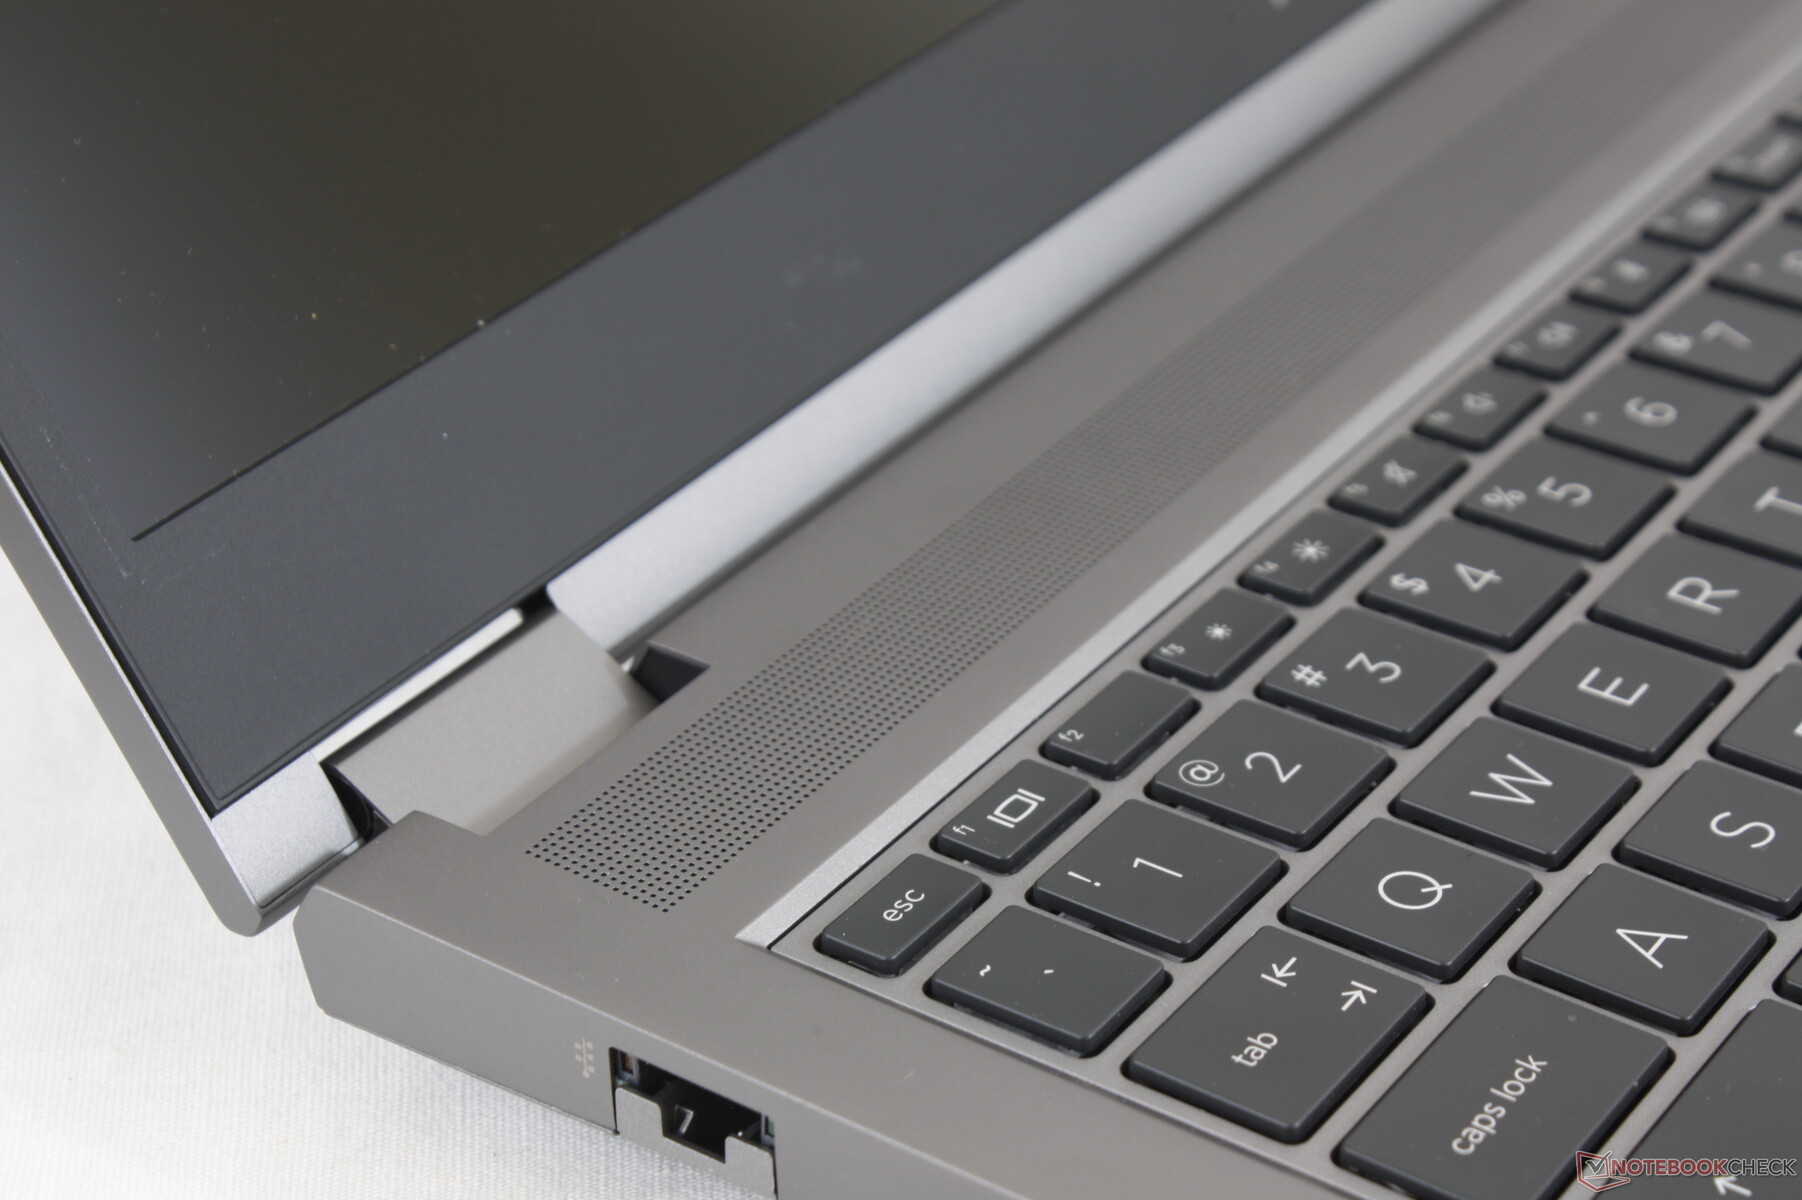
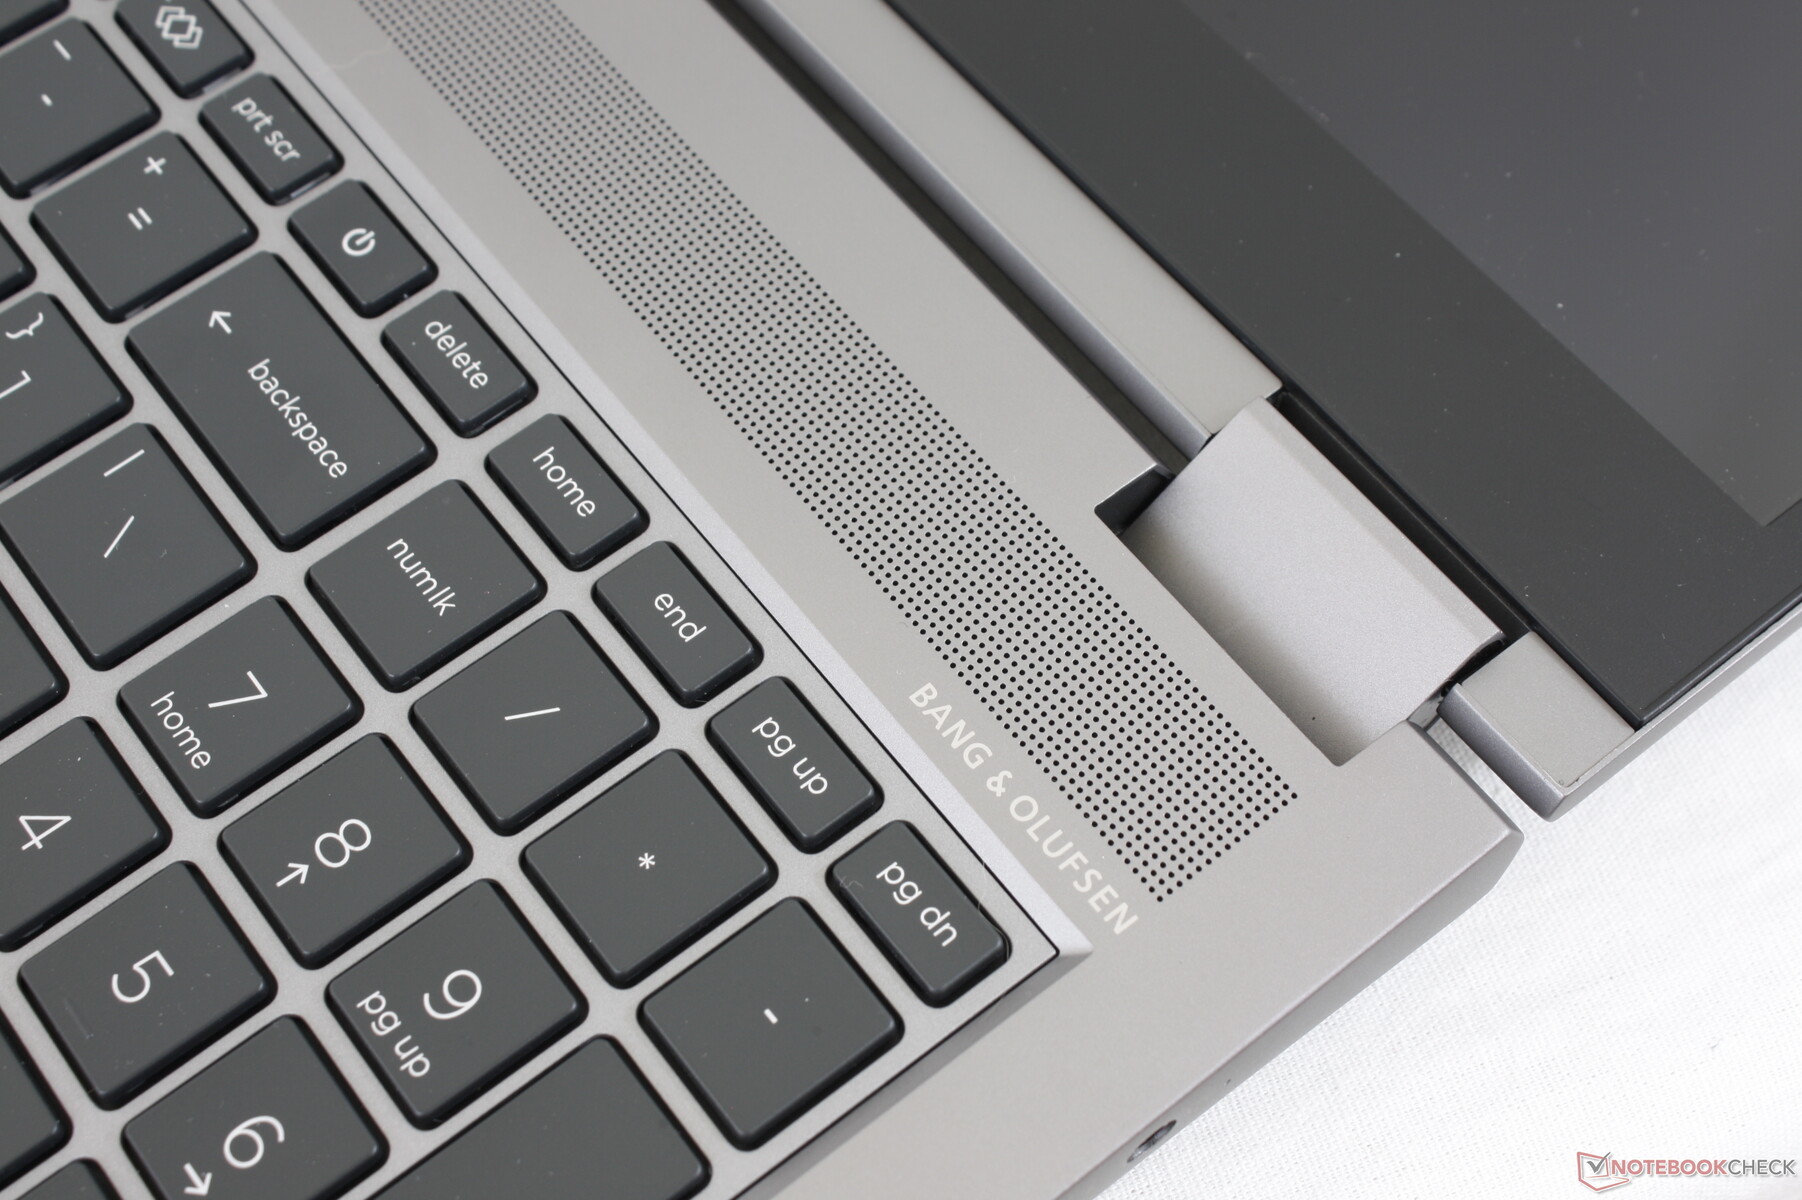
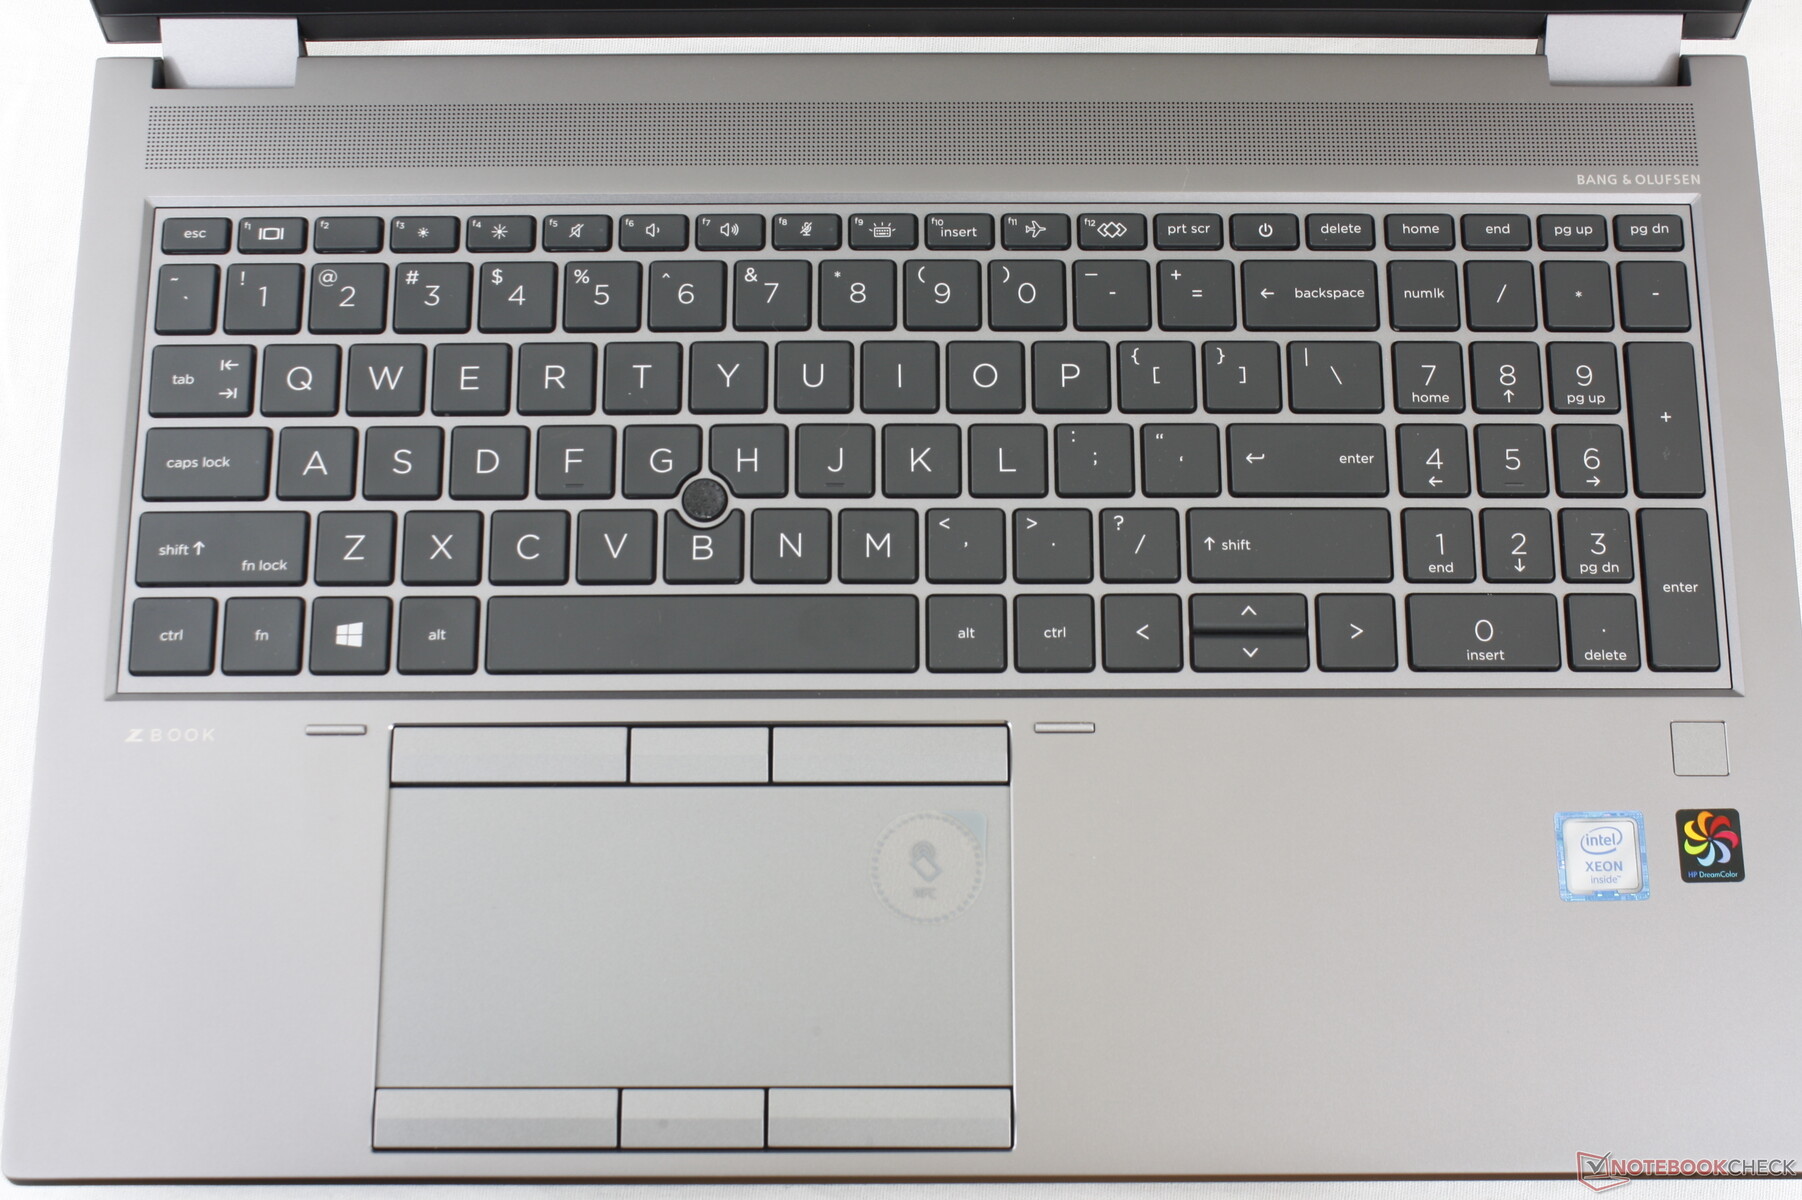
Os teclados dos computadores portáteis HP Spectre, EliteBook e ZBook são alguns dos melhores em suas respectivas categorias. O feedback é nítido com viagens relativamente profundas para não parecer que você está digitando em um Ultrabook fino com teclas rasas. O Clatter também é relativamente silencioso, exceto pela tecla Space mais alta. O fato de a base ser tão densa ajuda cada chave a se sentir uniforme de canto a canto.
Uma nova característica do teclado é sua tecla F12 personalizável, que também pode ser encontrada nos últimos laptops Envy e Spectre. Os usuários podem configurar a tecla para lançar rapidamente programas, arquivos, pastas ou websites. No entanto, ela não suporta macros, o que nos parece uma enorme supervisão.
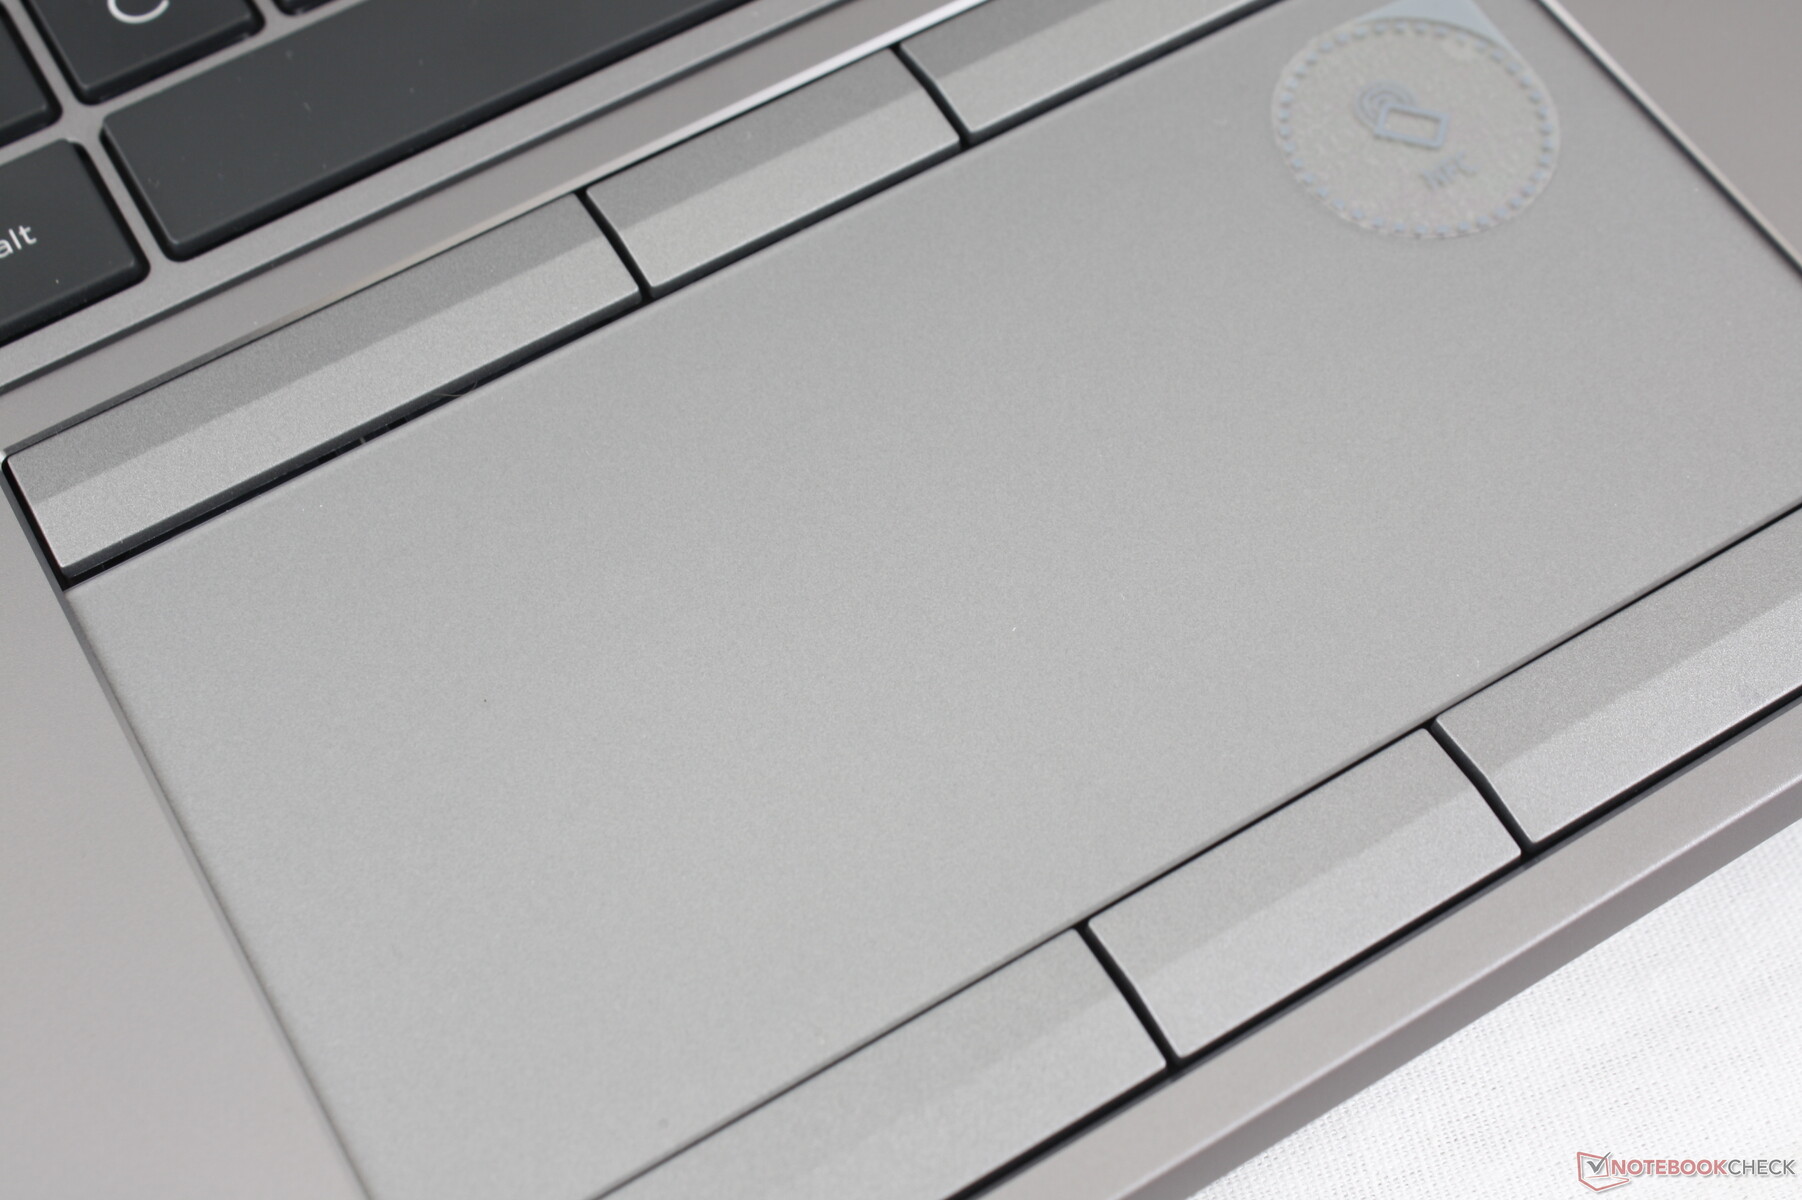
Touchpad
O touchpad aqui é um dos melhores que já usamos em qualquer estação de trabalho de 15,6 polegadas. É firme com propriedades de deslizamento suave e apenas um pouco grudado a velocidades mais lentas. A superfície também é maior do que no Precision 7550 (12,5 x 6 cm vs. 10 x 6,5 cm), oferecendo ao mesmo tempo botões do mouse mais dedicados.
O feedback dos botões dedicados também é satisfatório com viagens mais profundas do que na maioria dos laptops. O ruído é moderado, mas não alto o suficiente para ser irritante. O feedback não parece uniforme entre cada tecla, no entanto, pois a tecla inferior direita parece um pouco mais suave do que o resto das teclas.
Mostrar
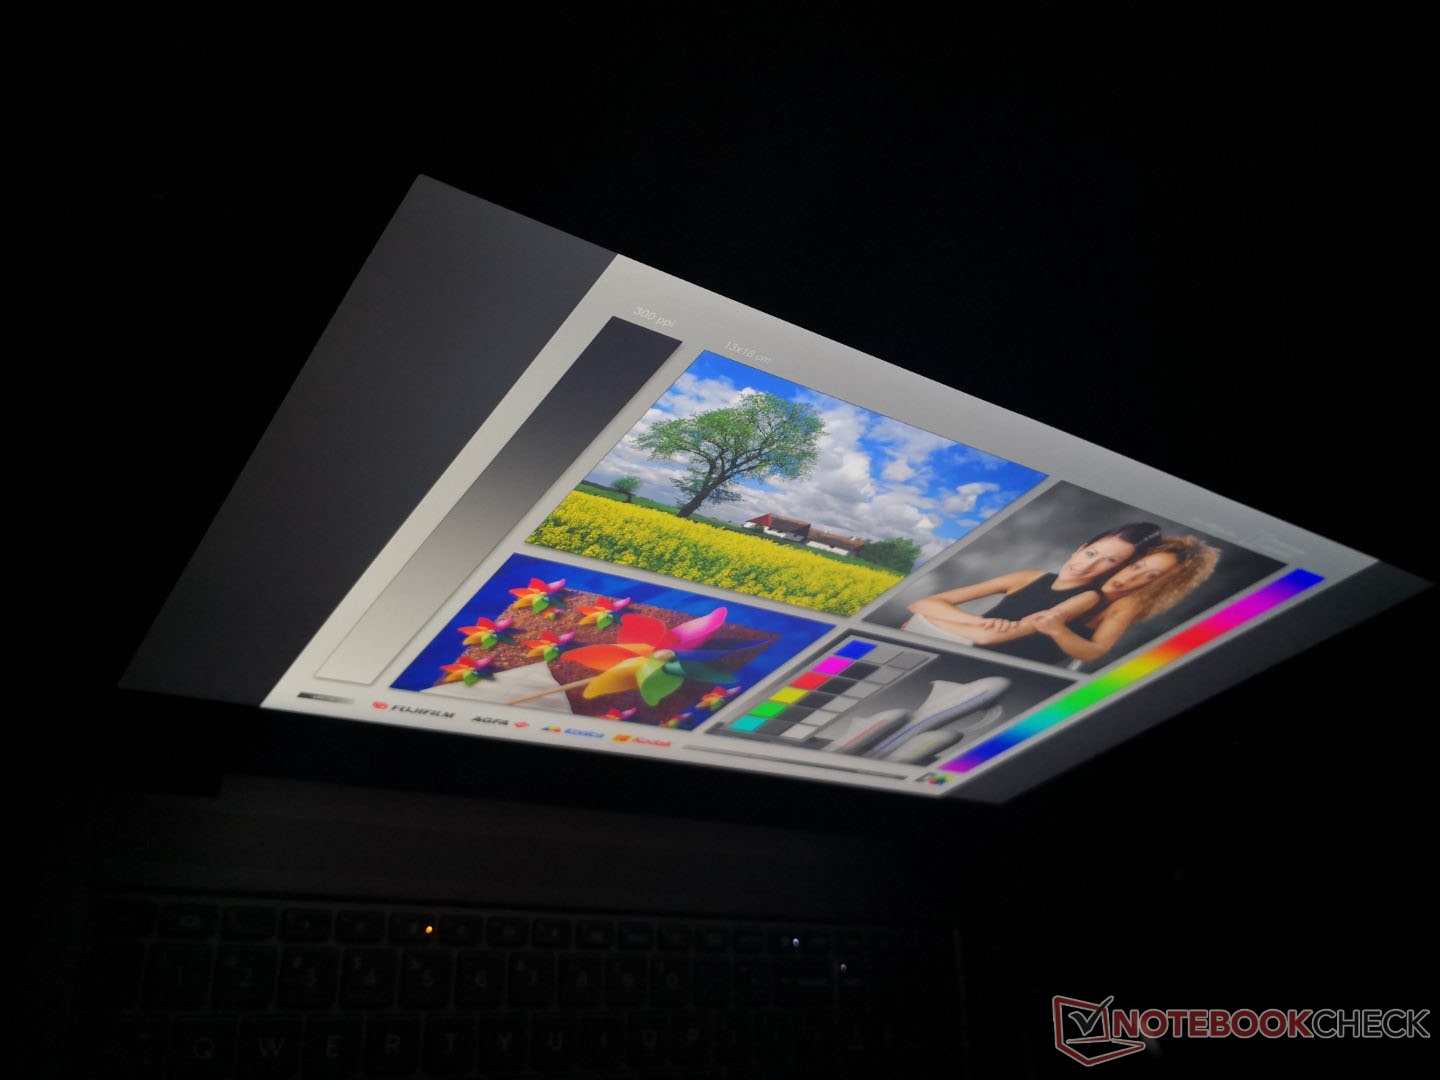
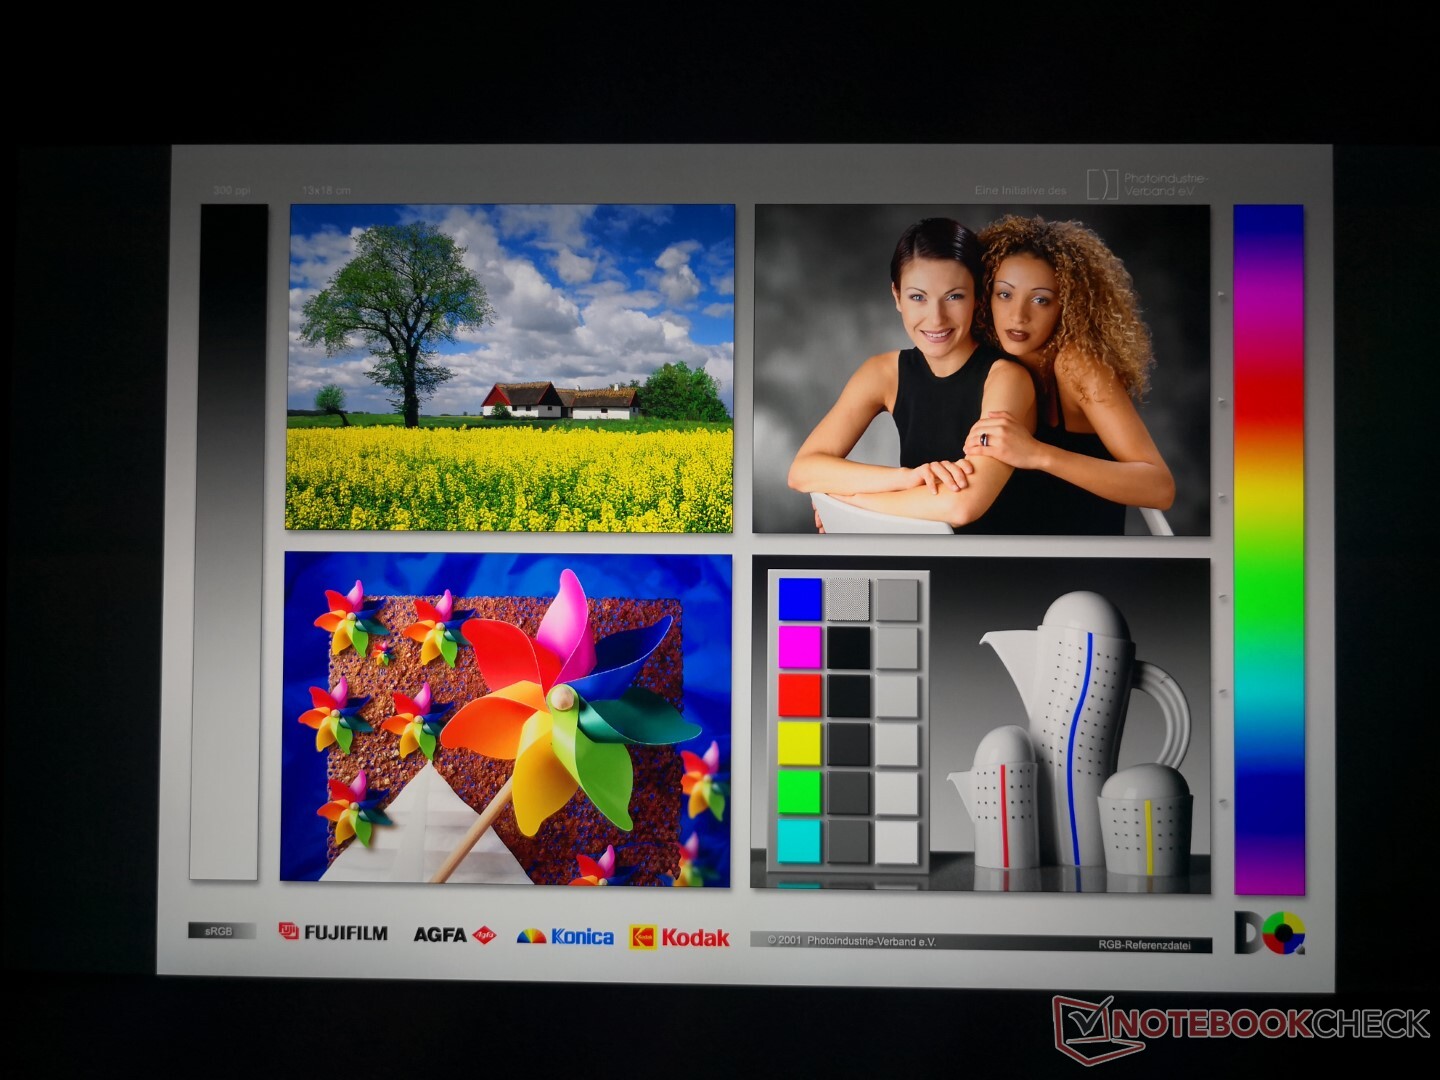
A HP oferece um grande número de opções de exibição - 13, na verdade - variando de FHD a 4K, 250 a 1000 lêndeas, tela sensível ao toque e sem tela sensível ao toque, e tudo o que estiver entre elas. Nossas medidas e impressões abaixo refletem apenas o painel sem toque 4K UHD HDR400 DreamColor, já que os outros painéis quase certamente terão atributos diferentes.
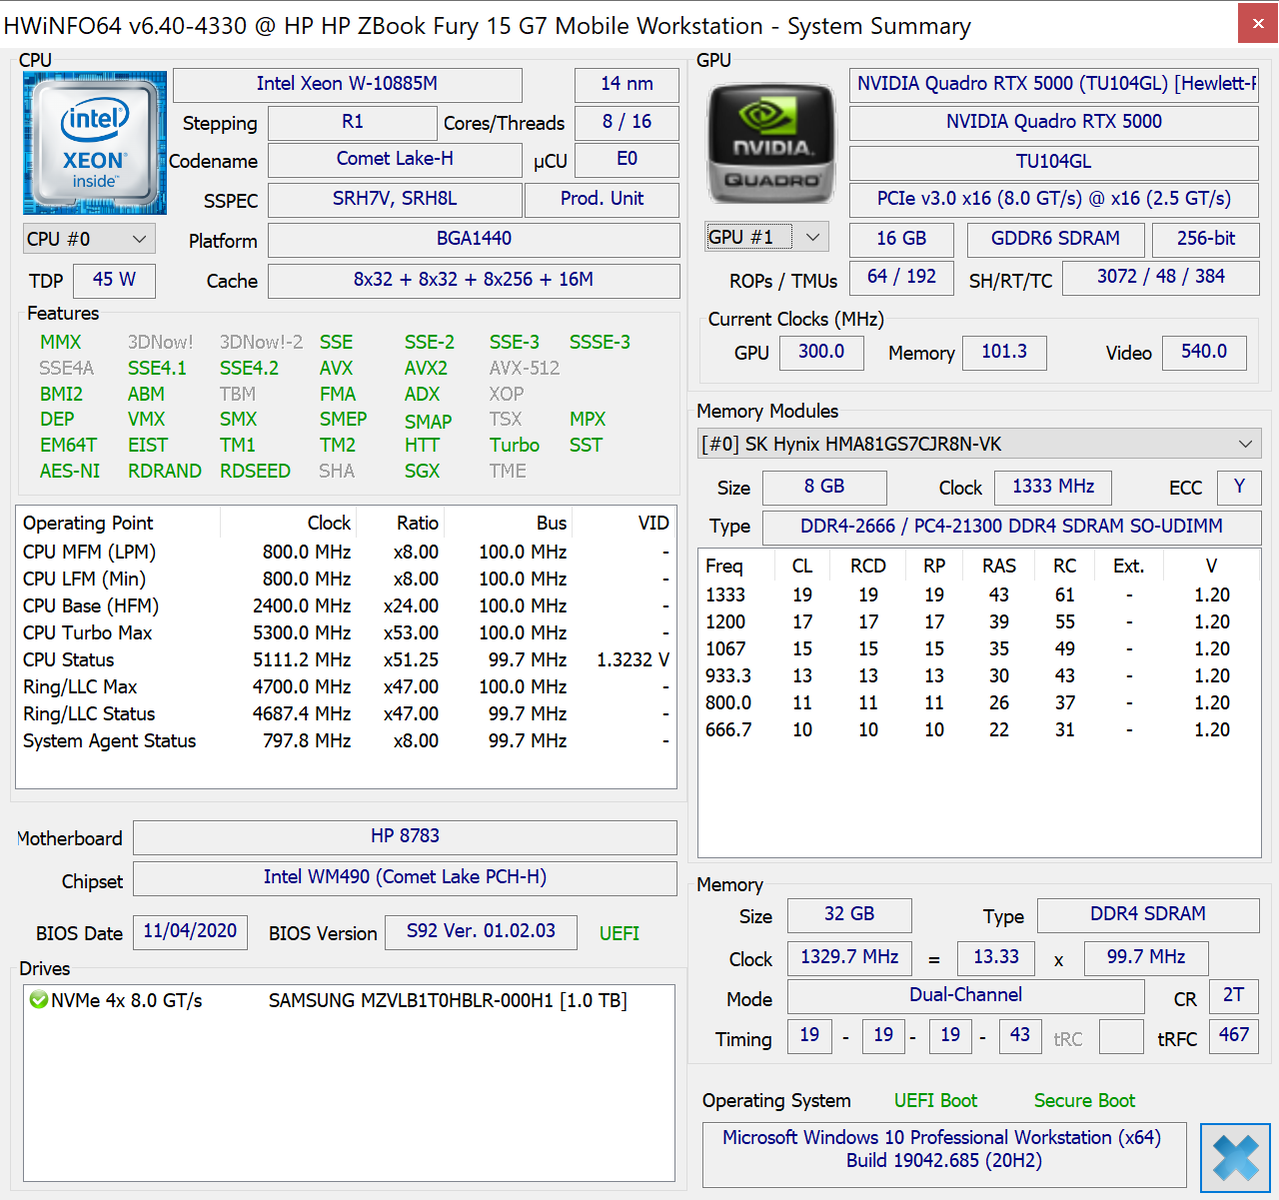
A HWiNFO é incapaz de puxar o nome exato do painel de nossa unidade e só pode devolver o controlador LG Philips LGD0661. No entanto, podemos confirmar a alta taxa de contraste e o visor de 600 nit para ser mais brilhante do que a maioria das outras estações de trabalho.
| |||||||||||||||||||||||||
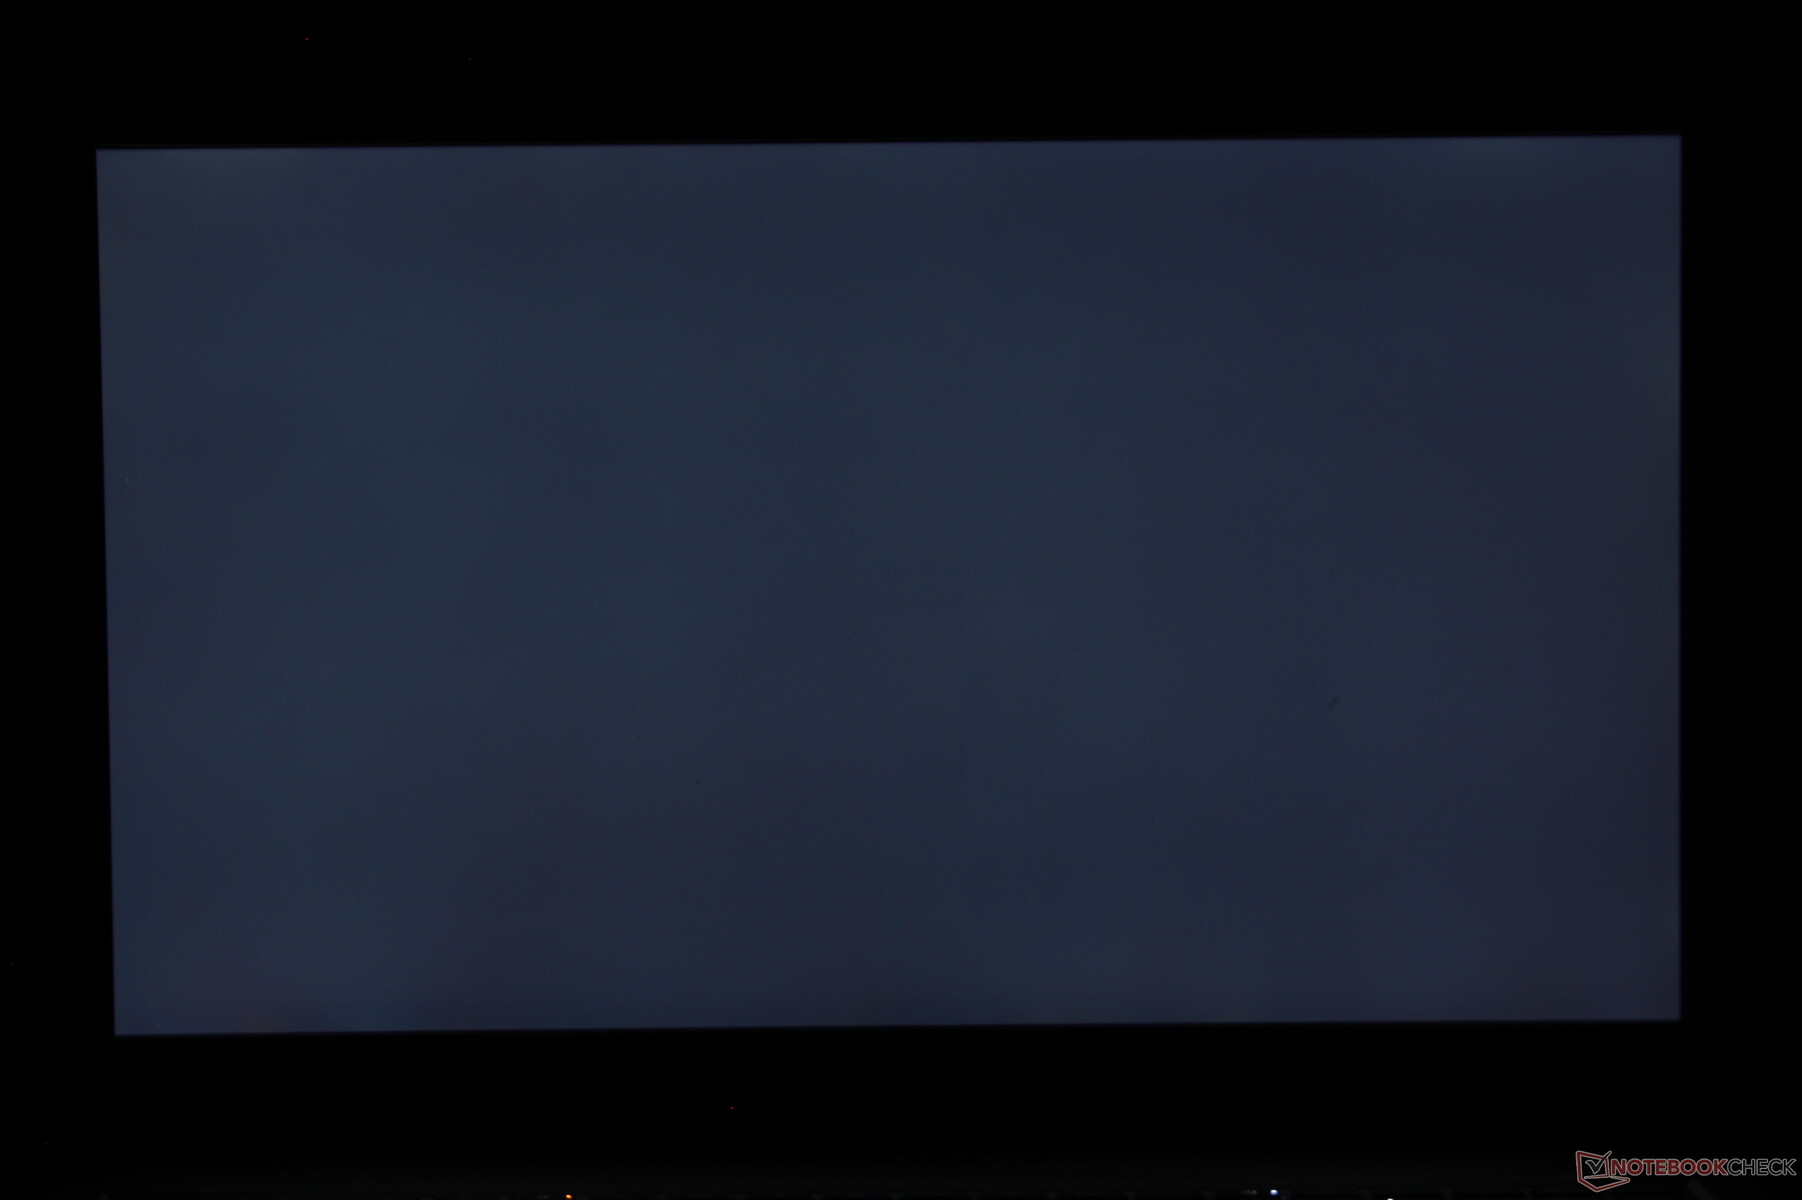
iluminação: 89 %
iluminação com acumulador: 672.8 cd/m²
Contraste: 1346:1 (Preto: 0.5 cd/m²)
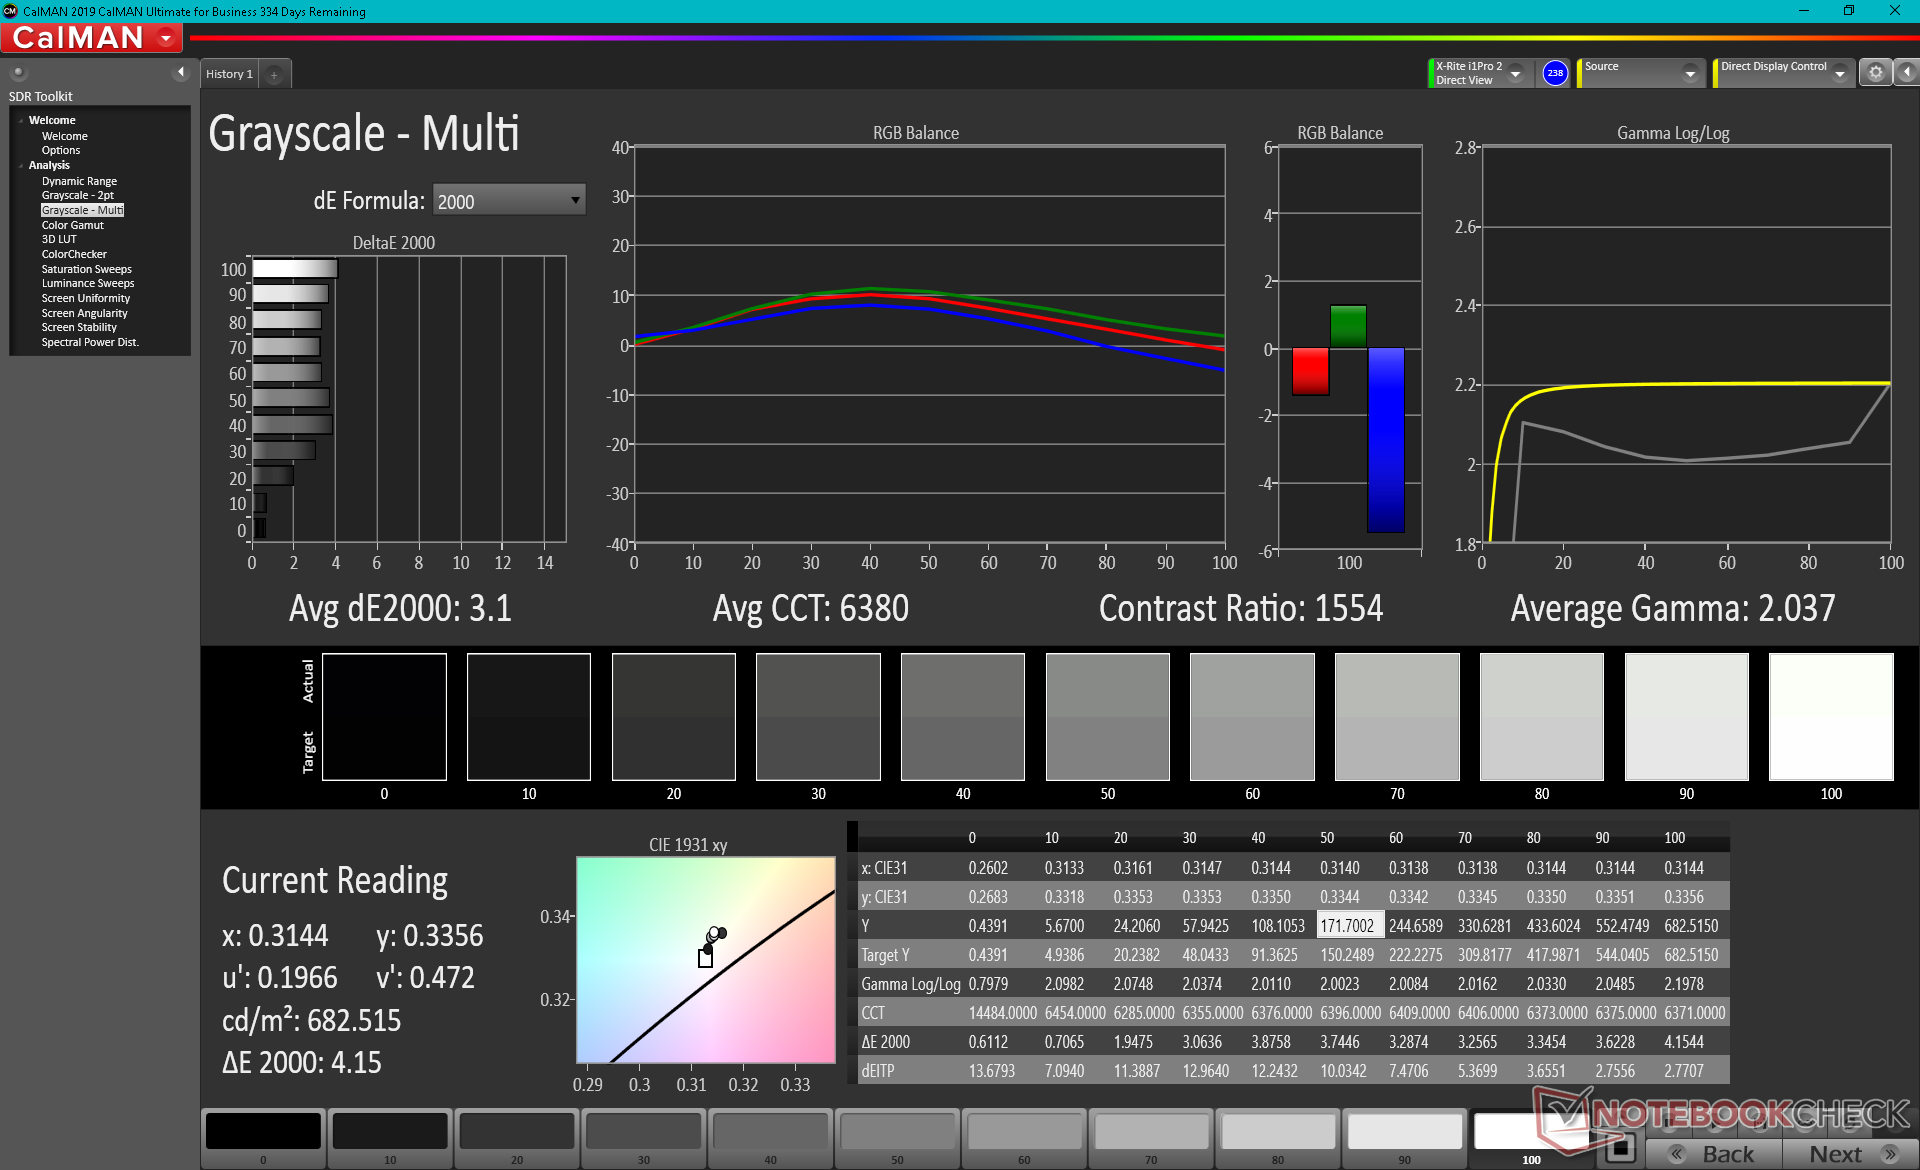
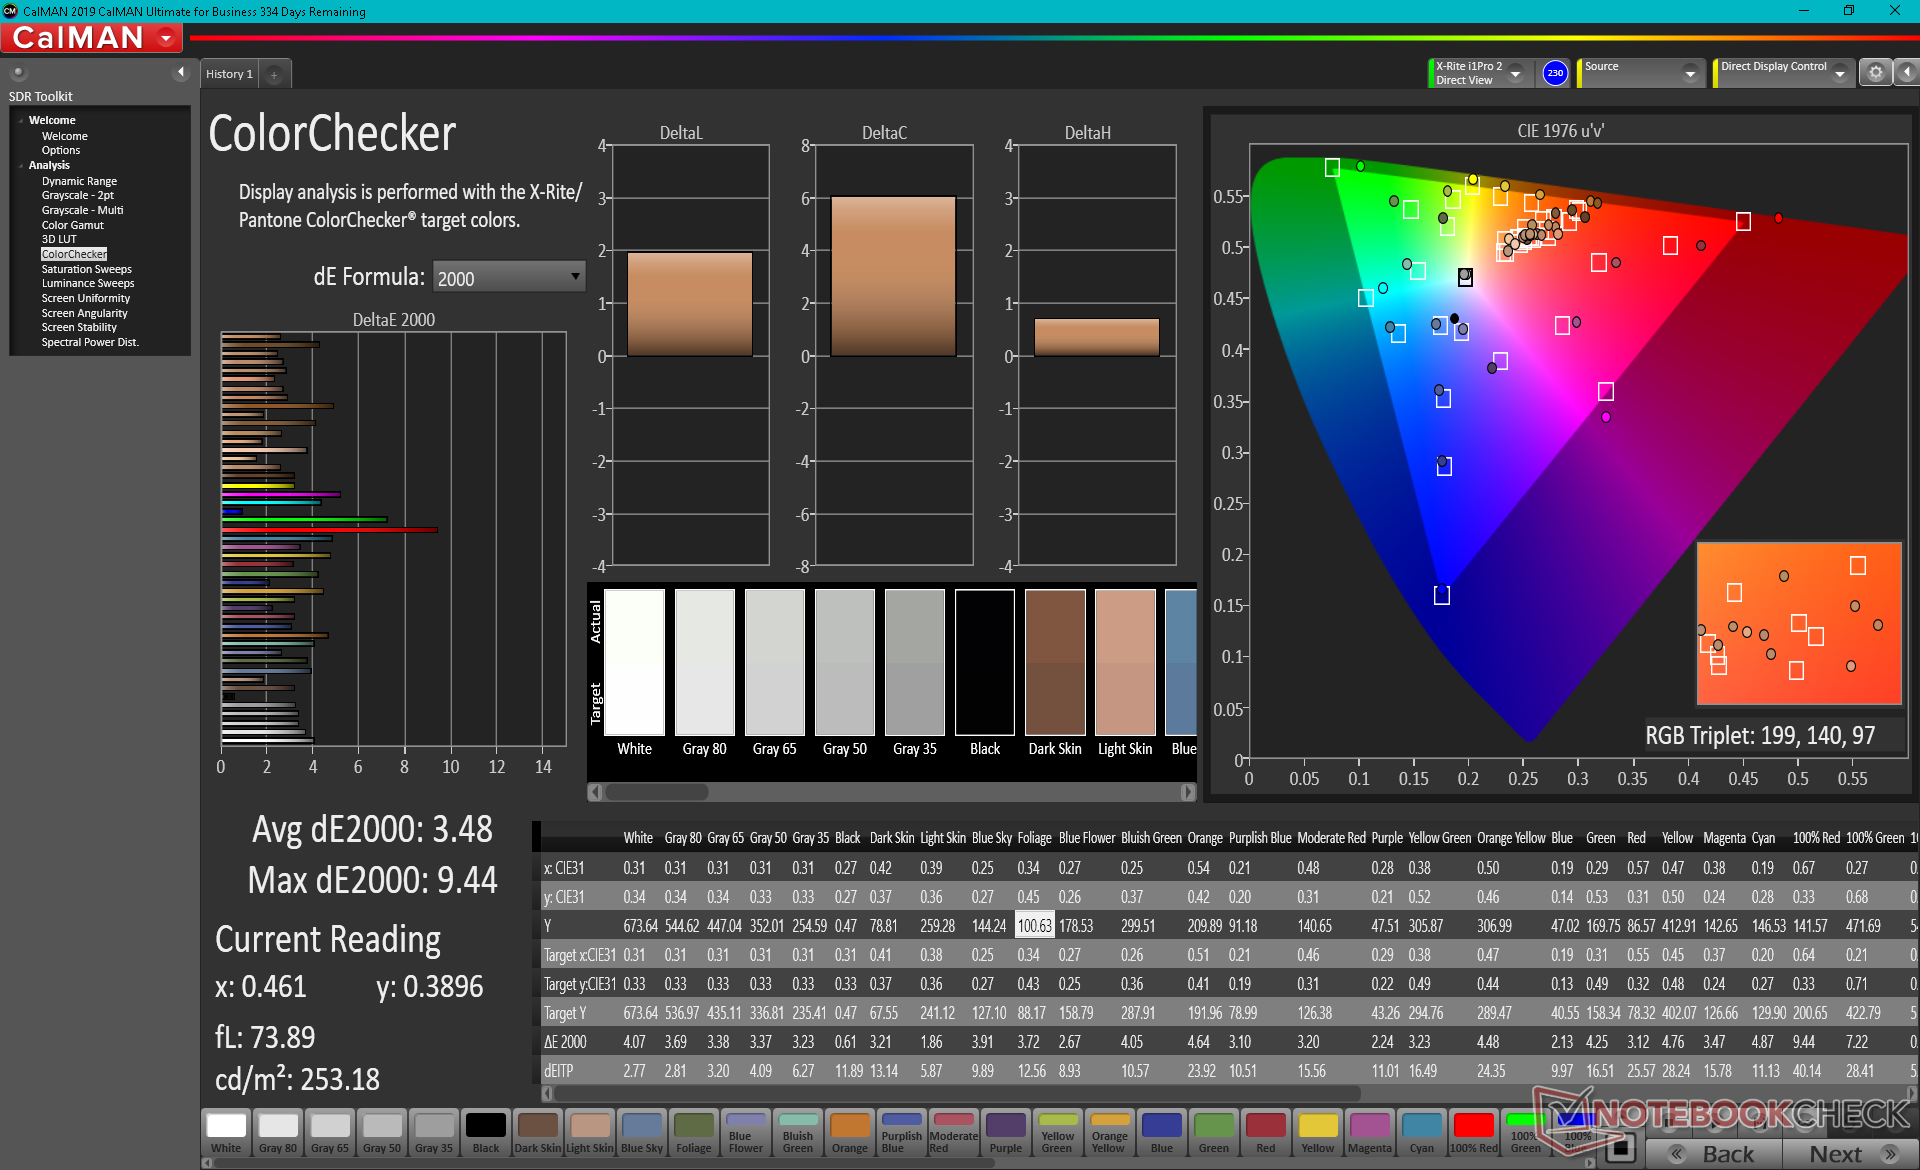
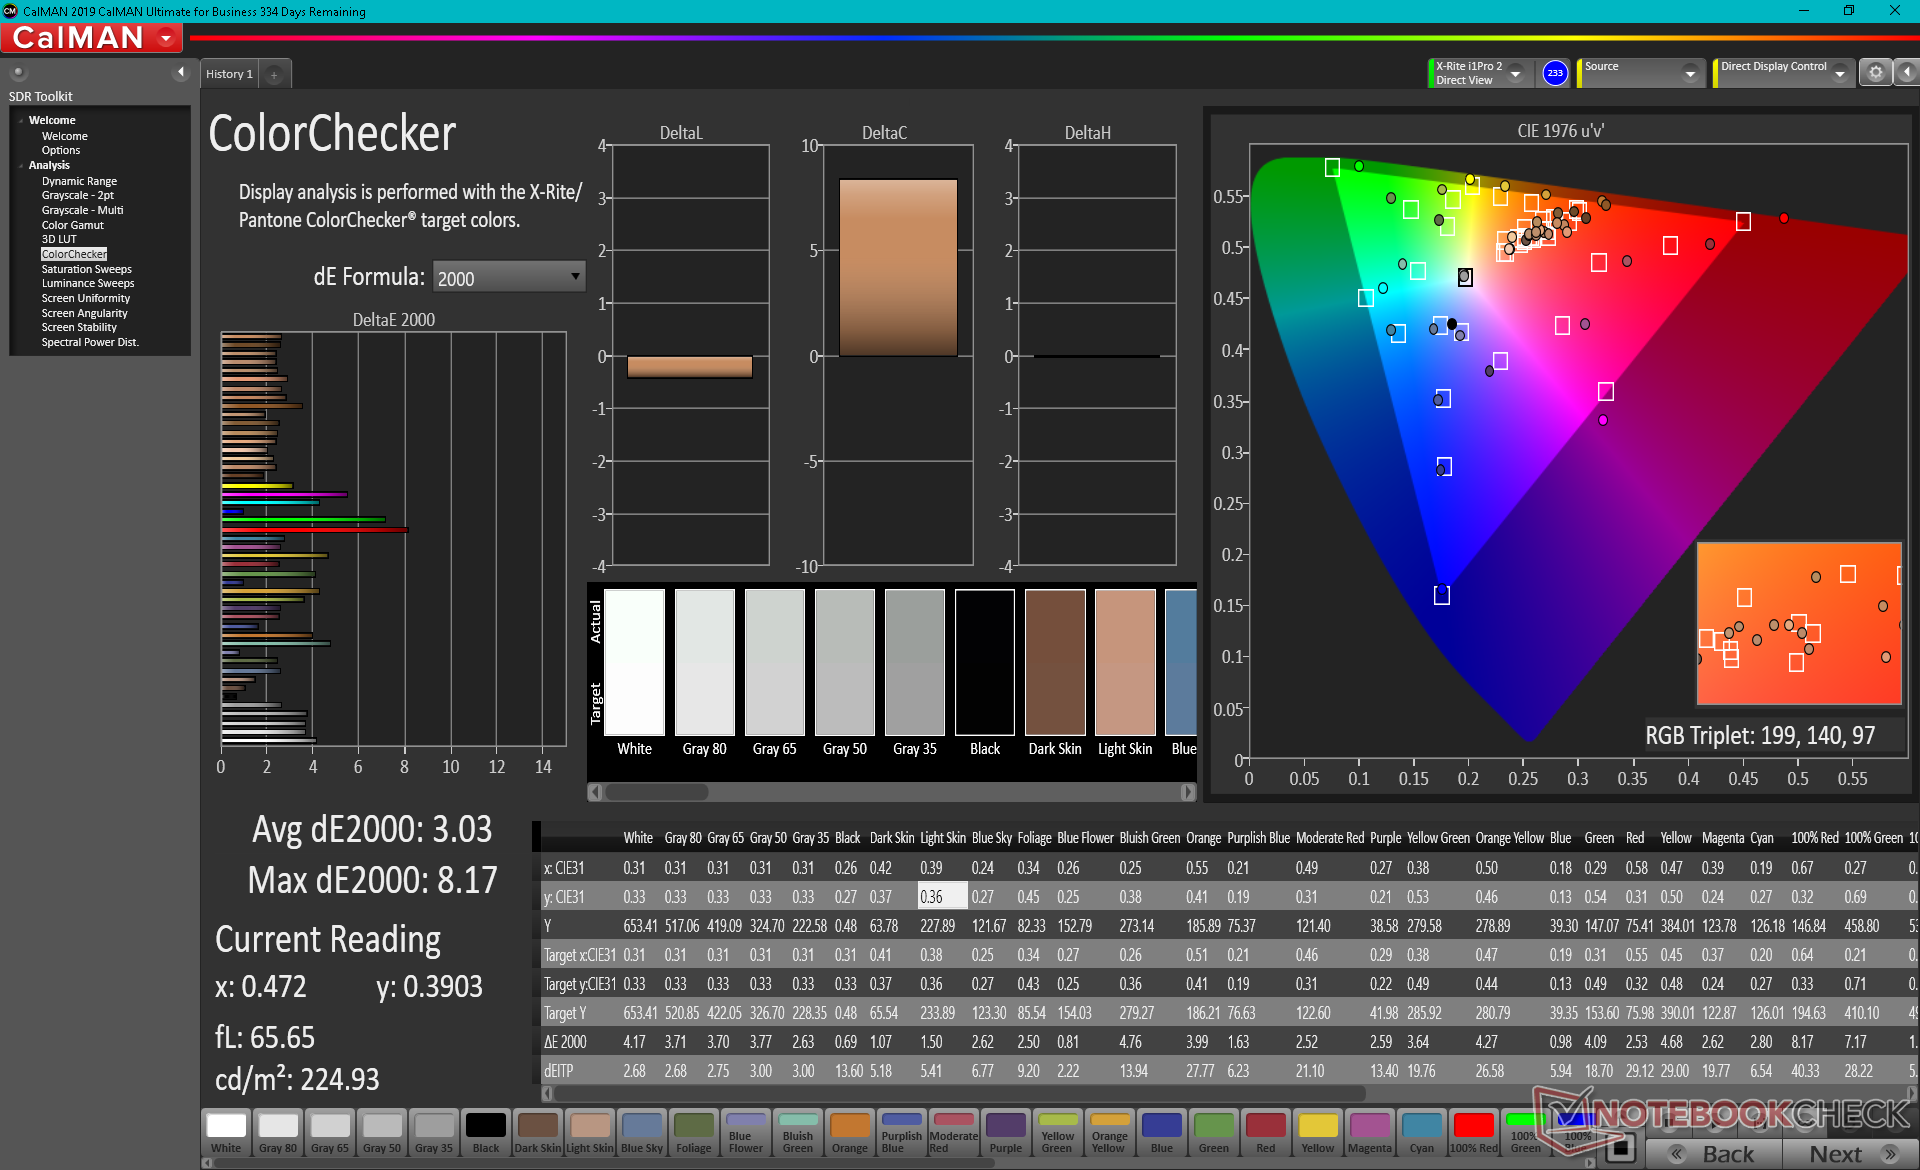
ΔE ColorChecker Calman: 3.48 | ∀{0.5-29.43 Ø4.72}
calibrated: 3.03
ΔE Greyscale Calman: 3.1 | ∀{0.09-98 Ø4.97}
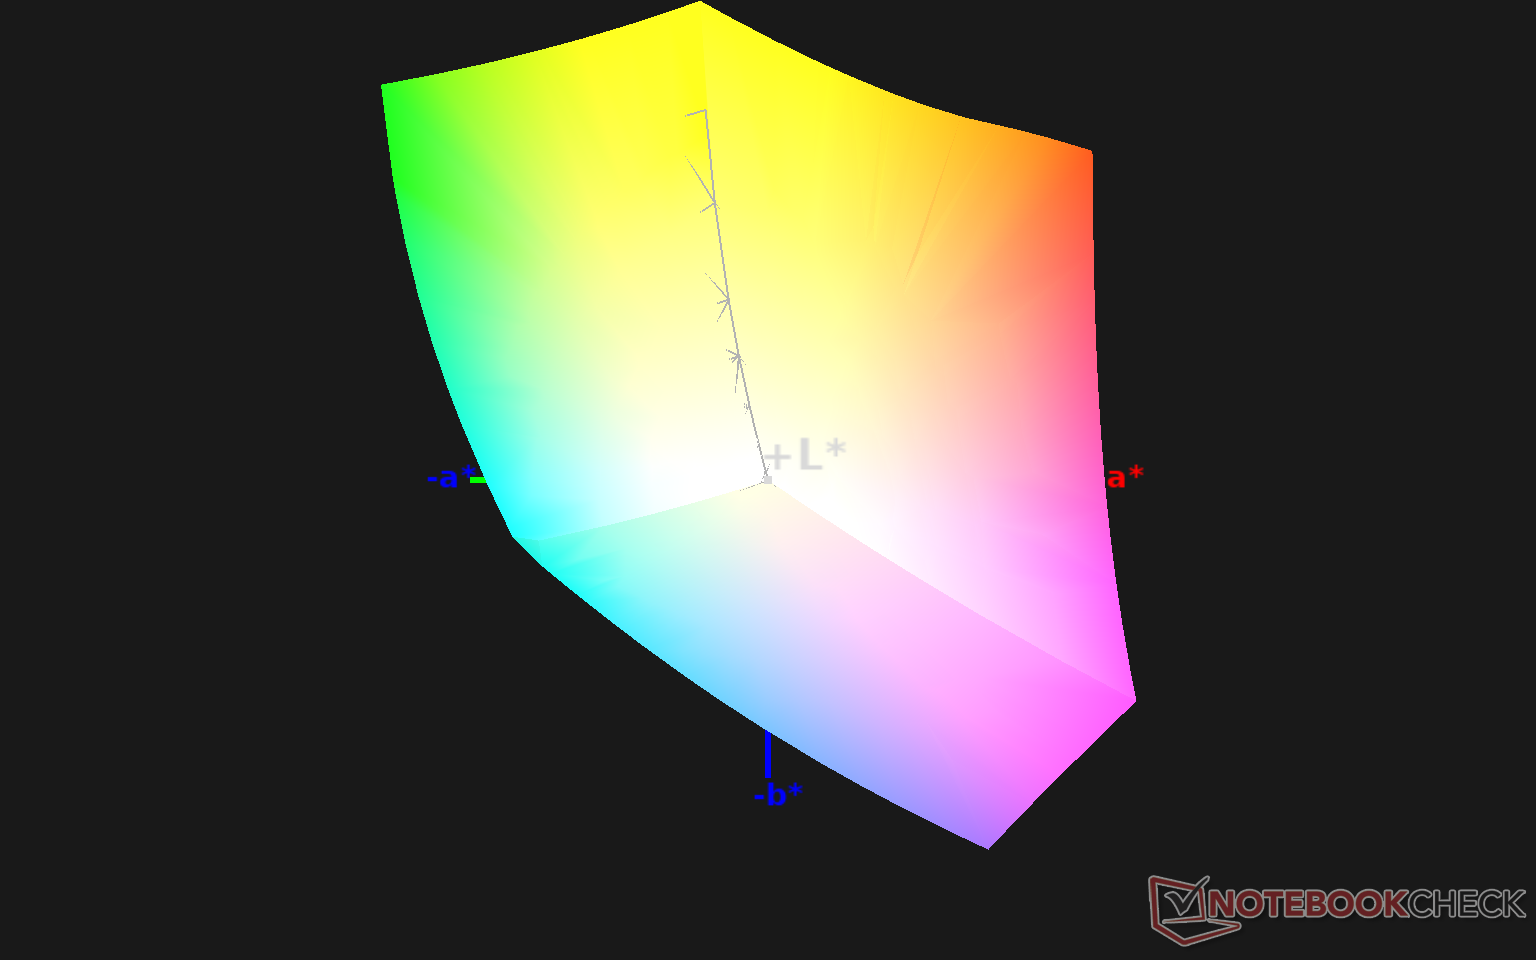
100% sRGB (Argyll 1.6.3 3D)
75.2% AdobeRGB 1998 (Argyll 1.6.3 3D)
84.5% AdobeRGB 1998 (Argyll 3D)
99.8% sRGB (Argyll 3D)
95.6% Display P3 (Argyll 3D)
Gamma: 2.04
CCT: 6380 K
| HP ZBook Fury 15 G7 LG Philips LGD0661, IPS, 15.6", 3840x2160 | Asus ProArt StudioBook Pro 15 W500G5T AU Optronics B156ZAN03.1, IPS, 15.6", 3840x2160 | MSI WS66 10TMT-207US AU Optronics B156HAB03.0, IPS, 15.6", 1920x1080 | Dell Precision 7550 AU Optronics B156ZAN, IPS, 15.6", 3840x2160 | Razer Blade 15 Studio Edition 2020 Samsung SDCA029, OLED, 15.6", 3840x2160 | Lenovo ThinkPad P1 2019-20QT000RGE N156HCE-GN1, IPS LED, 15.6", 1920x1080 | |
|---|---|---|---|---|---|---|
| Display | -1% | -24% | 0% | 6% | -23% | |
| Display P3 Coverage (%) | 95.6 | 82.1 -14% | 62.8 -34% | 82.1 -14% | 99.9 4% | 62.4 -35% |
| sRGB Coverage (%) | 99.8 | 97.6 -2% | 86.9 -13% | 99.6 0% | 100 0% | 91.5 -8% |
| AdobeRGB 1998 Coverage (%) | 84.5 | 95 12% | 63.6 -25% | 96.8 15% | 97.3 15% | 63.4 -25% |
| Response Times | -1% | 20% | 8% | 91% | 50% | |
| Response Time Grey 50% / Grey 80% * (ms) | 56 ? | 58 ? -4% | 44.8 ? 20% | 51.2 ? 9% | 4 ? 93% | 34.4 ? 39% |
| Response Time Black / White * (ms) | 36 ? | 35 ? 3% | 28.8 ? 20% | 34 ? 6% | 4 ? 89% | 14 ? 61% |
| PWM Frequency (Hz) | 26040 ? | |||||
| Screen | 1% | -16% | -19% | 126% | -4% | |
| Brightness middle (cd/m²) | 672.8 | 344 -49% | 374.5 -44% | 473.5 -30% | 380 -44% | 542 -19% |
| Brightness (cd/m²) | 674 | 335 -50% | 363 -46% | 461 -32% | 388 -42% | 528 -22% |
| Brightness Distribution (%) | 89 | 93 4% | 91 2% | 90 1% | 93 4% | 84 -6% |
| Black Level * (cd/m²) | 0.5 | 0.37 26% | 0.42 16% | 0.55 -10% | 0.018 96% | 0.41 18% |
| Contrast (:1) | 1346 | 930 -31% | 892 -34% | 861 -36% | 21111 1468% | 1322 -2% |
| Colorchecker dE 2000 * | 3.48 | 1.76 49% | 4.05 -16% | 4.8 -38% | 5.47 -57% | 3.5 -1% |
| Colorchecker dE 2000 max. * | 9.44 | 4.31 54% | 8.17 13% | 8.73 8% | 8.19 13% | 7.8 17% |
| Colorchecker dE 2000 calibrated * | 3.03 | 4.36 -44% | 3.08 -2% | 3.04 -0% | 1.3 57% | |
| Greyscale dE 2000 * | 3.1 | 3.12 -1% | 2.6 16% | 5.6 -81% | 5.3 -71% | 4.8 -55% |
| Gamma | 2.04 108% | 2.2 100% | 2.21 100% | 2.34 94% | 2.15 102% | 2.33 94% |
| CCT | 6380 102% | 6563 99% | 7027 93% | 7549 86% | 6128 106% | 7690 85% |
| Color Space (Percent of AdobeRGB 1998) (%) | 75.2 | 85 13% | 56.4 -25% | 86.4 15% | 86 14% | 58.8 -22% |
| Color Space (Percent of sRGB) (%) | 100 | 98 -2% | 86.3 -14% | 99.7 0% | 100 0% | 91.1 -9% |
| Média Total (Programa/Configurações) | -0% /
1% | -7% /
-13% | -4% /
-12% | 74% /
99% | 8% /
-1% |
* ... menor é melhor
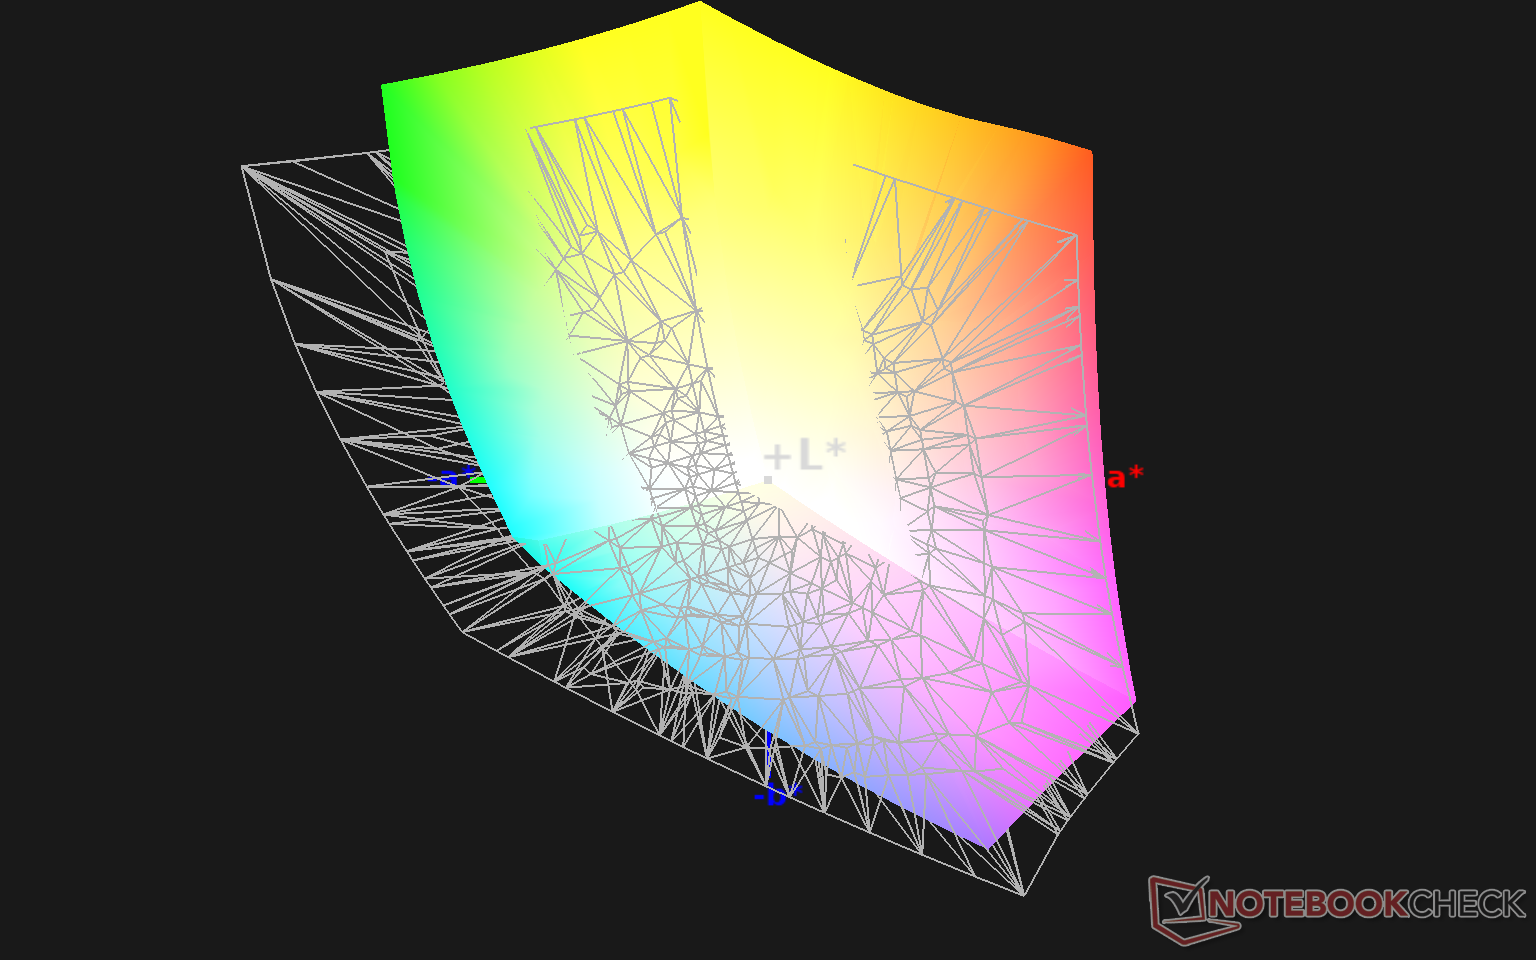
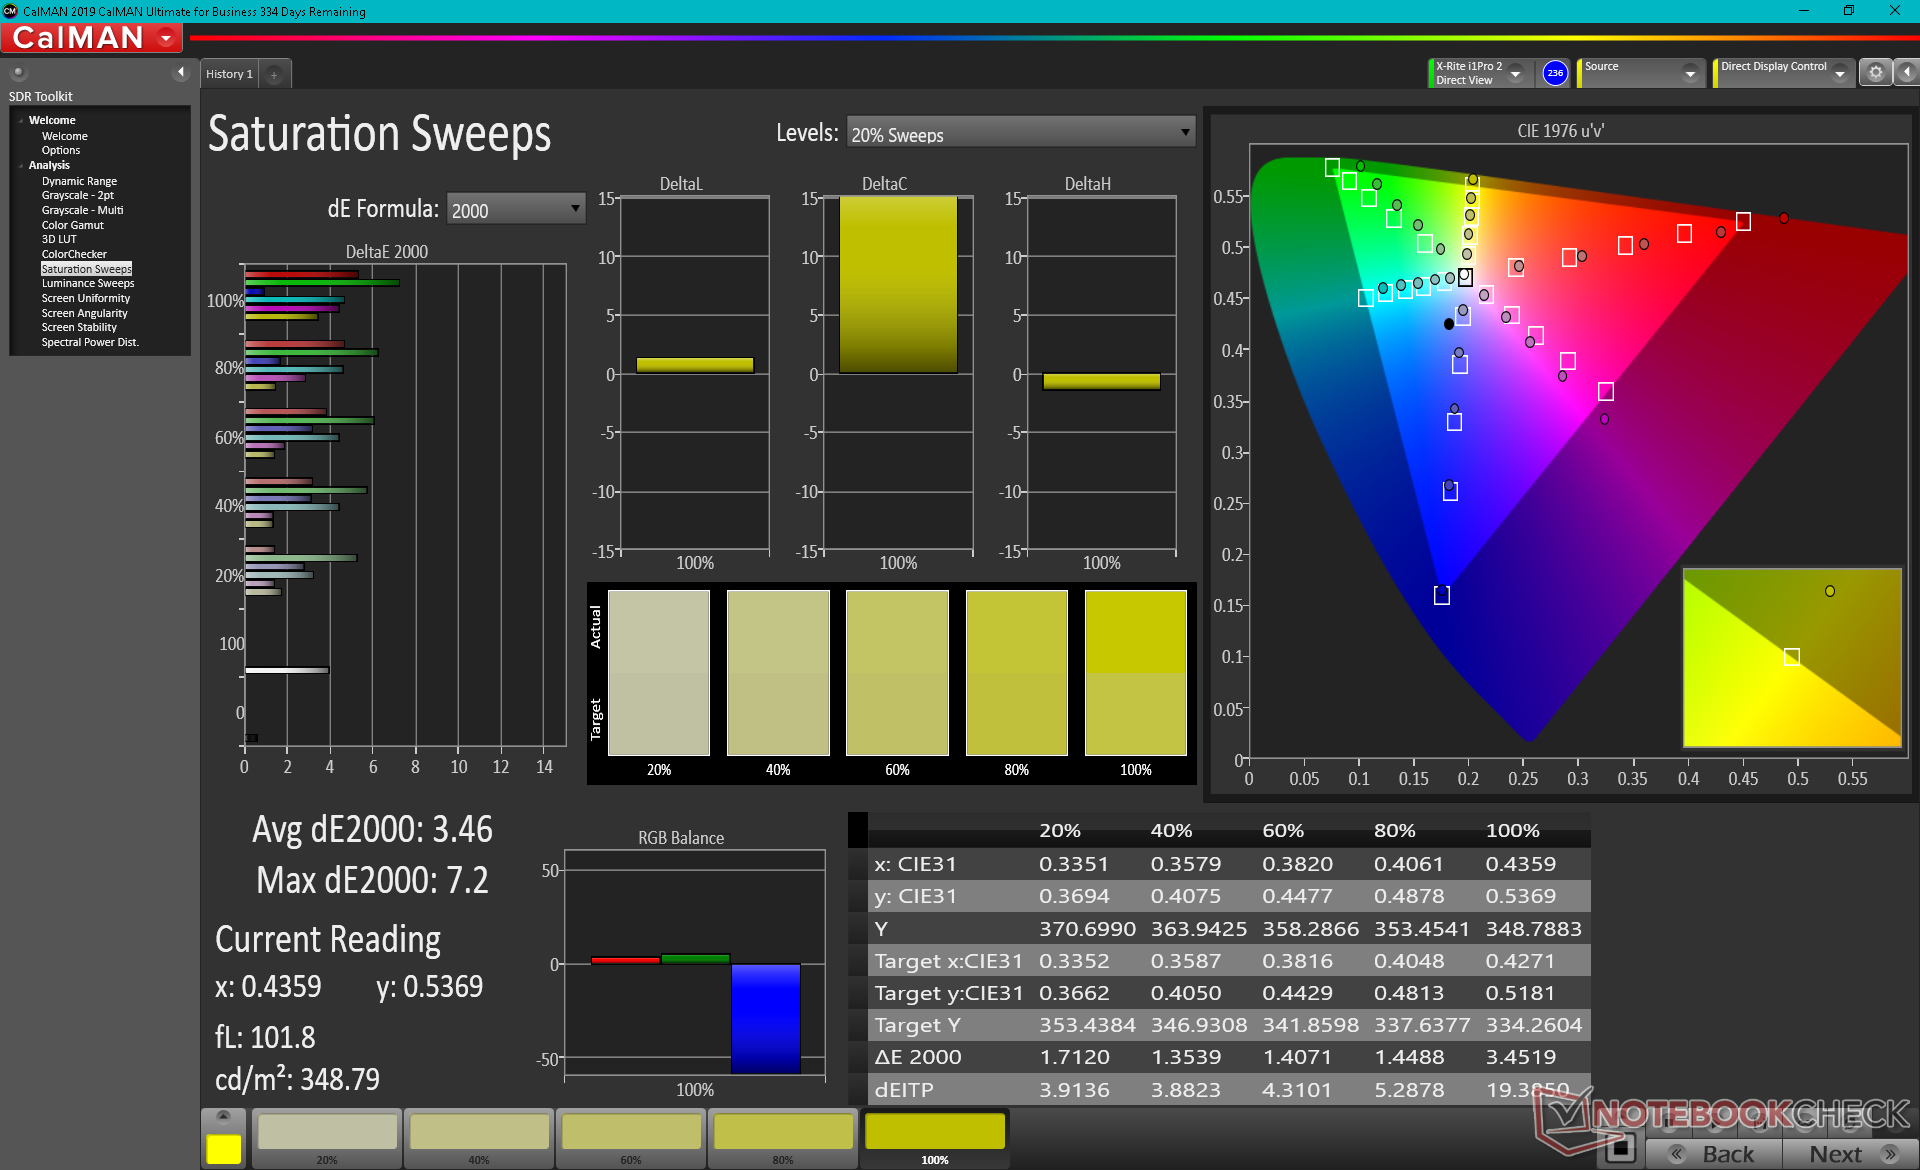
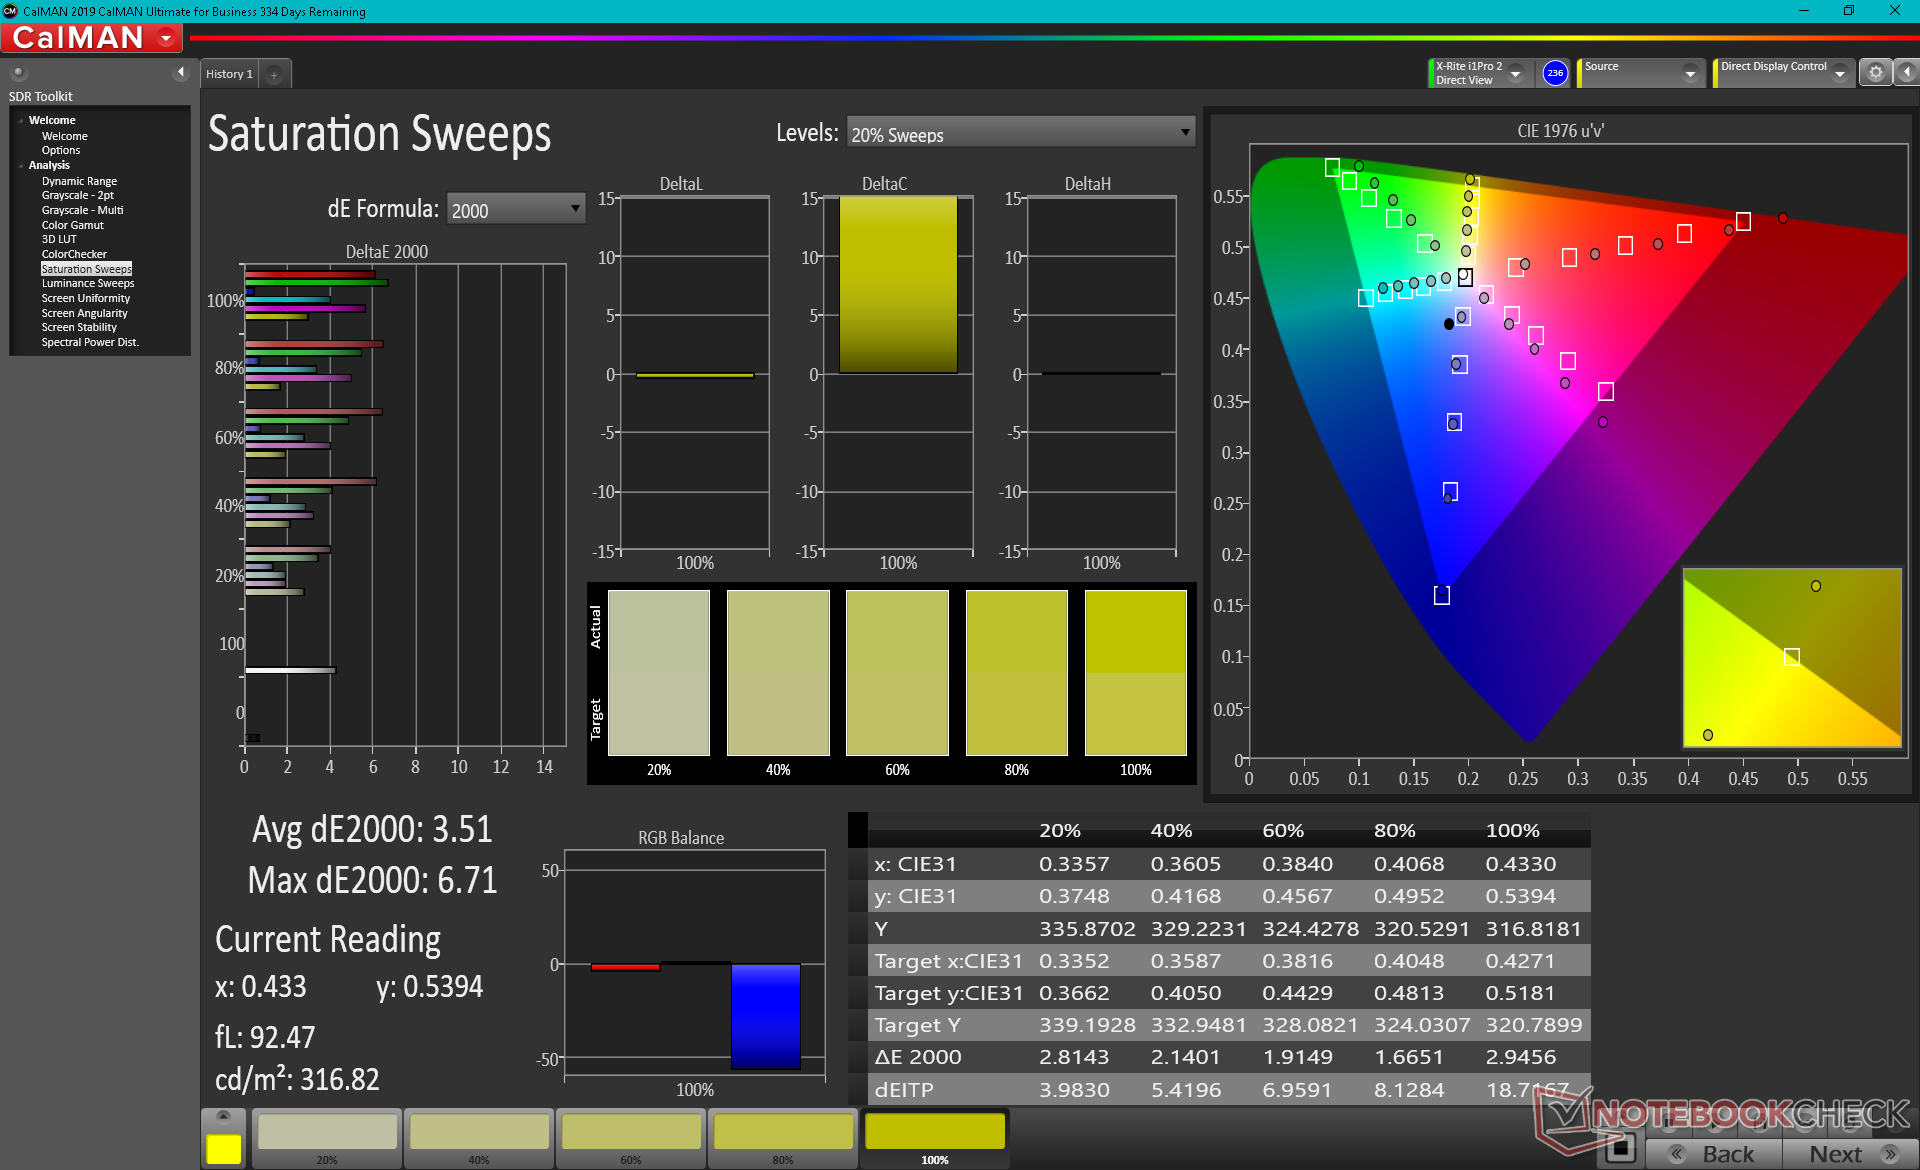
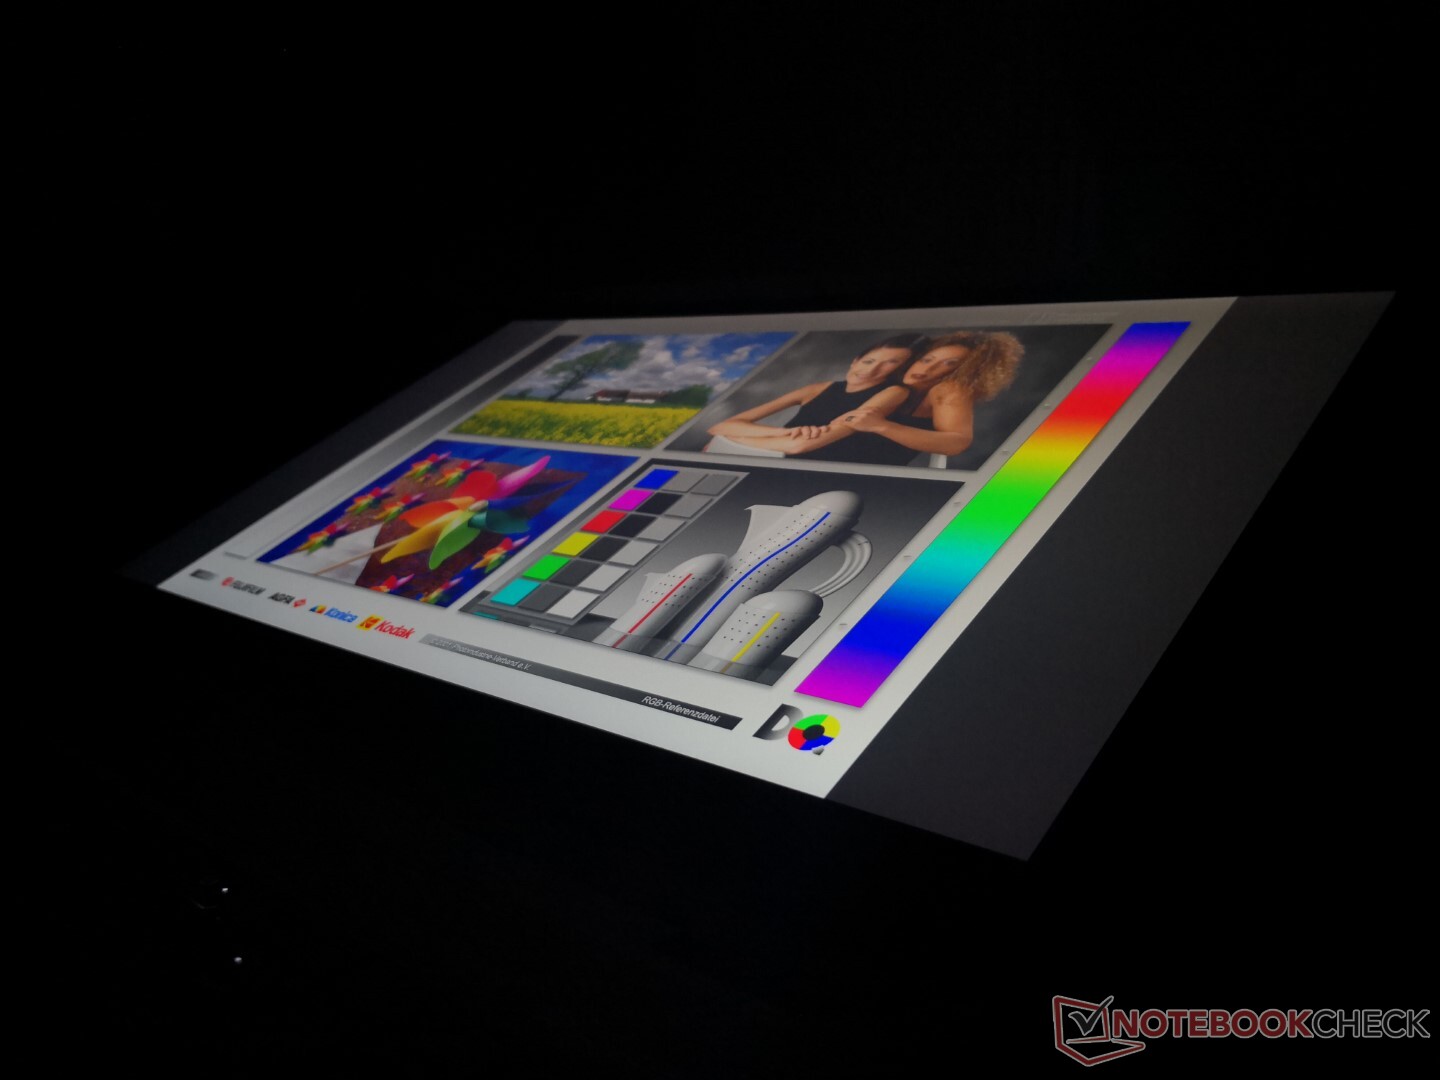
O espaço de cores cobre todo o sRGB e DCI-P3. Quando comparado ao AdobeRGB, o DCI-P3 cobre mais amarelo e vermelhos que nossas imagens abaixo podem confirmar para nosso ZBook.
As medidas do colorímetro X-Rite mostram que a temperatura da cor deve estar ligeiramente no lado quente. Calibrando o display nós mesmos abordamos o pequeno problema para um balanço RGB mais plano e curvas gama. A HP não oferece nenhum software de gerenciamento de cores pré-instalado, ao contrário da Dell e seu software Premier Color.

Exibir tempos de resposta
| ↔ Tempo de resposta preto para branco | ||
|---|---|---|
| 36 ms ... ascensão ↗ e queda ↘ combinadas | ↗ 20.4 ms ascensão | 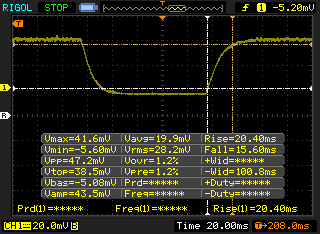 |
| ↘ 15.6 ms queda | ||
| A tela mostra taxas de resposta lentas em nossos testes e será insatisfatória para os jogadores. Em comparação, todos os dispositivos testados variam de 0.1 (mínimo) a 240 (máximo) ms. » 94 % de todos os dispositivos são melhores. Isso significa que o tempo de resposta medido é pior que a média de todos os dispositivos testados (19.8 ms). | ||
| ↔ Tempo de resposta 50% cinza a 80% cinza | ||
| 56 ms ... ascensão ↗ e queda ↘ combinadas | ↗ 27.6 ms ascensão | 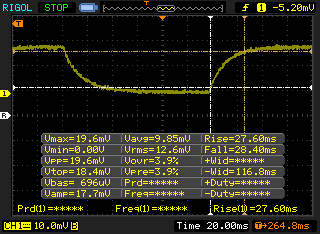 |
| ↘ 28.4 ms queda | ||
| A tela mostra taxas de resposta lentas em nossos testes e será insatisfatória para os jogadores. Em comparação, todos os dispositivos testados variam de 0.165 (mínimo) a 636 (máximo) ms. » 93 % de todos os dispositivos são melhores. Isso significa que o tempo de resposta medido é pior que a média de todos os dispositivos testados (31 ms). | ||
Cintilação da tela / PWM (modulação por largura de pulso)
| Tela tremeluzindo / PWM não detectado |  | ||
[pwm_comparison] Em comparação: 52 % de todos os dispositivos testados não usam PWM para escurecer a tela. Se PWM foi detectado, uma média de 7753 (mínimo: 5 - máximo: 343500) Hz foi medida. | |||
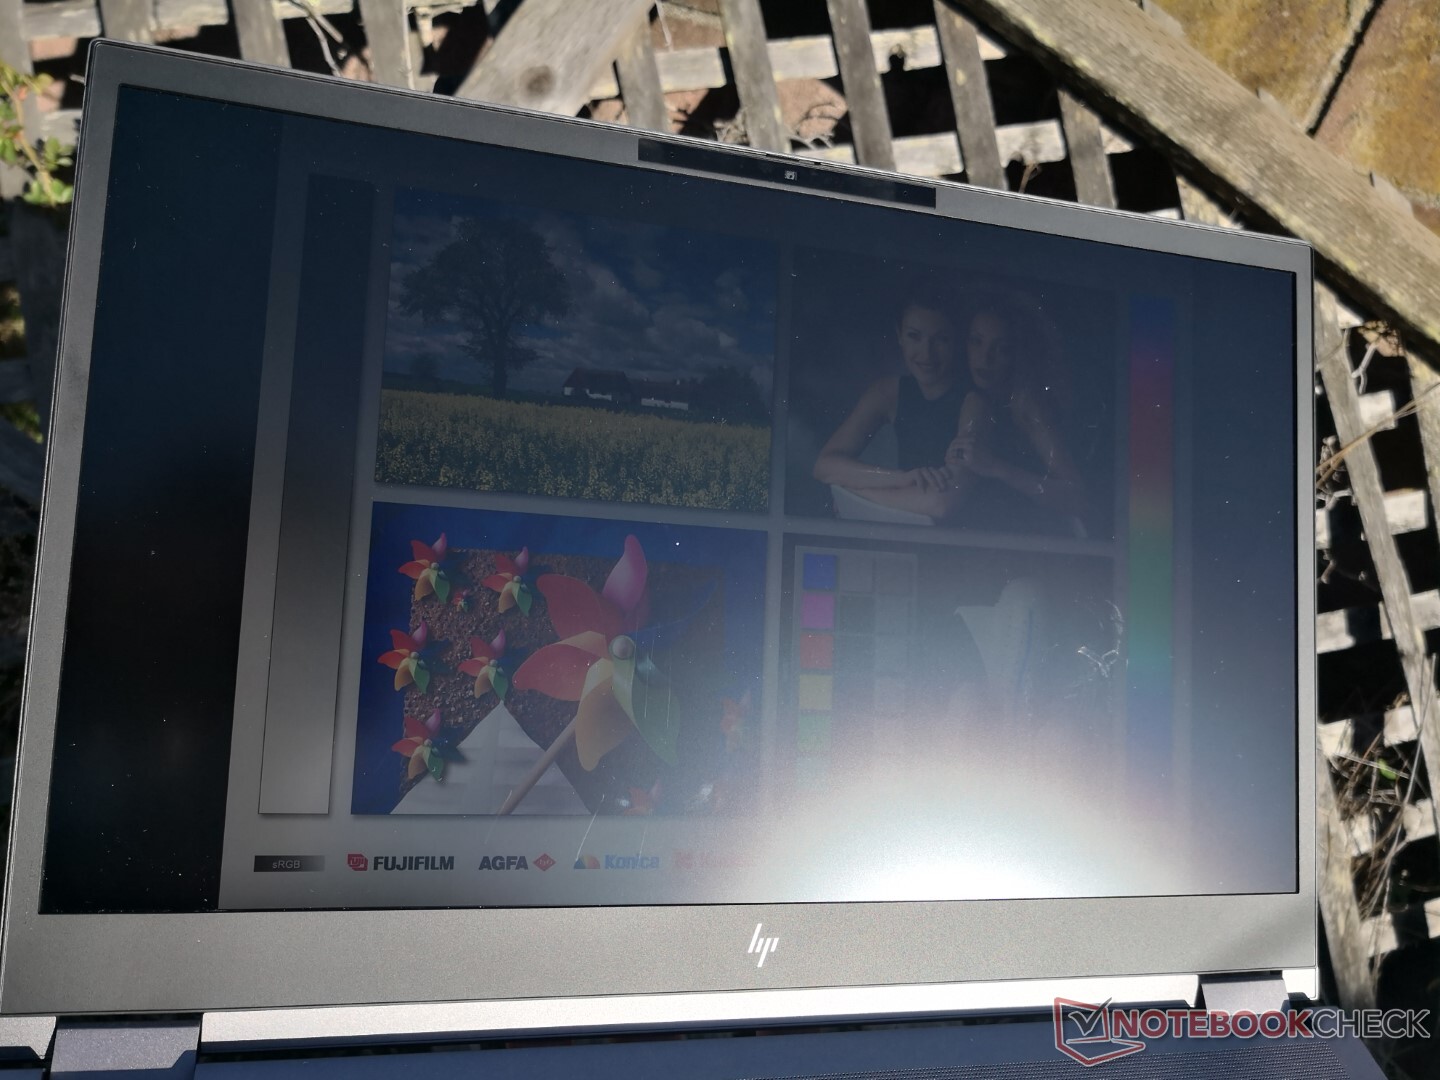
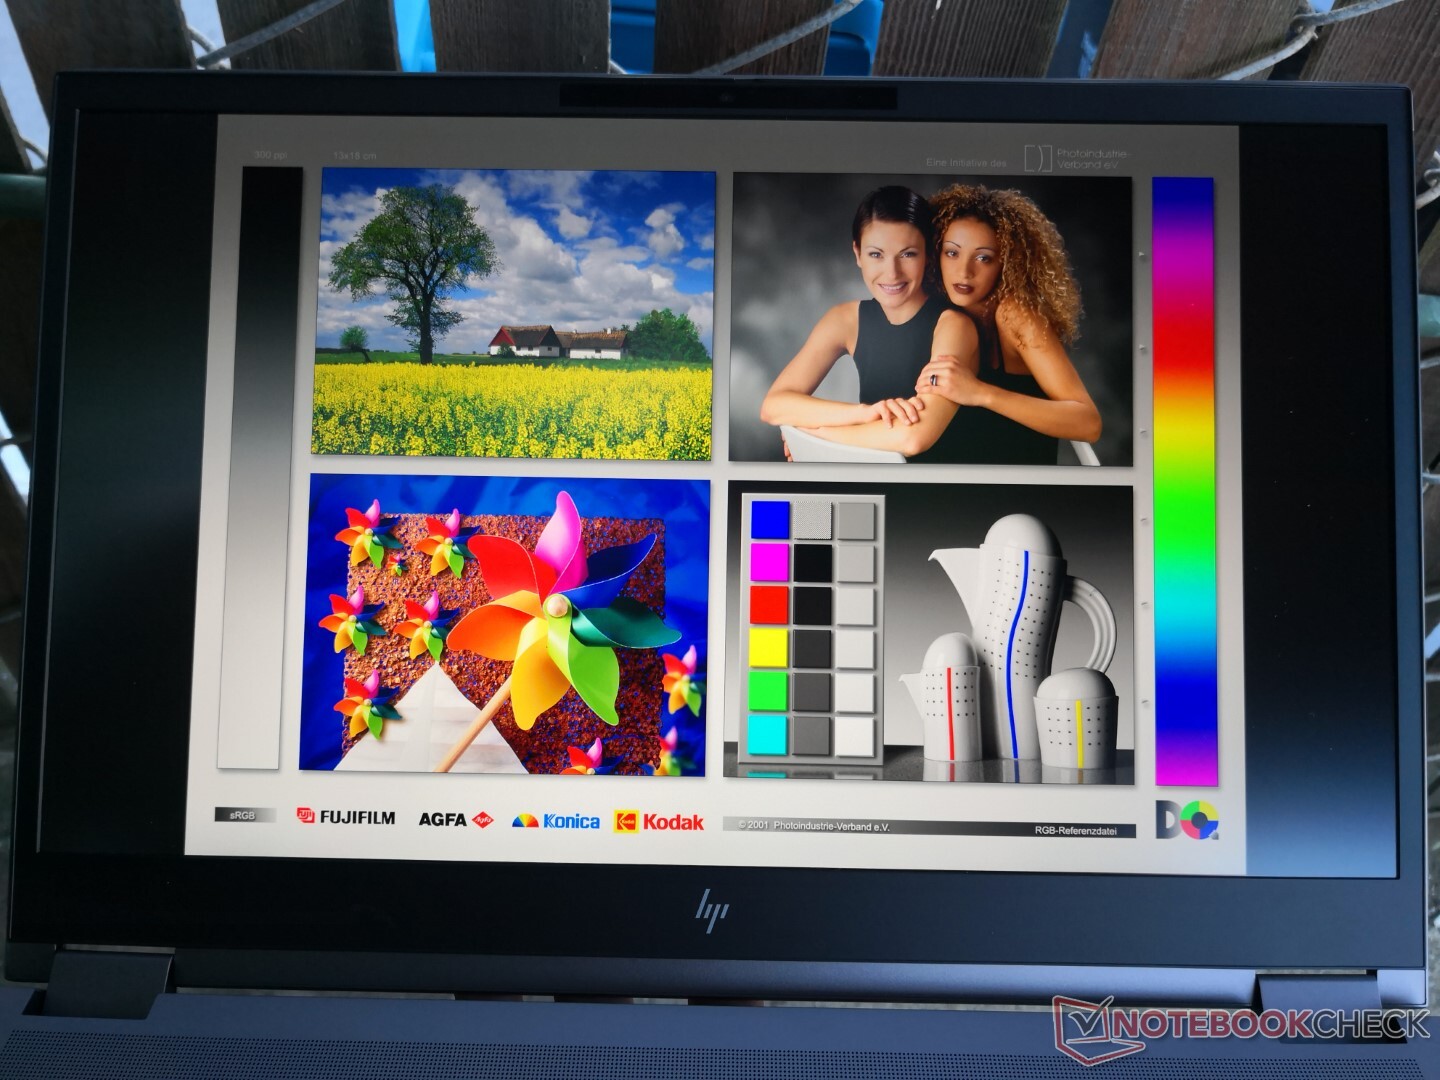
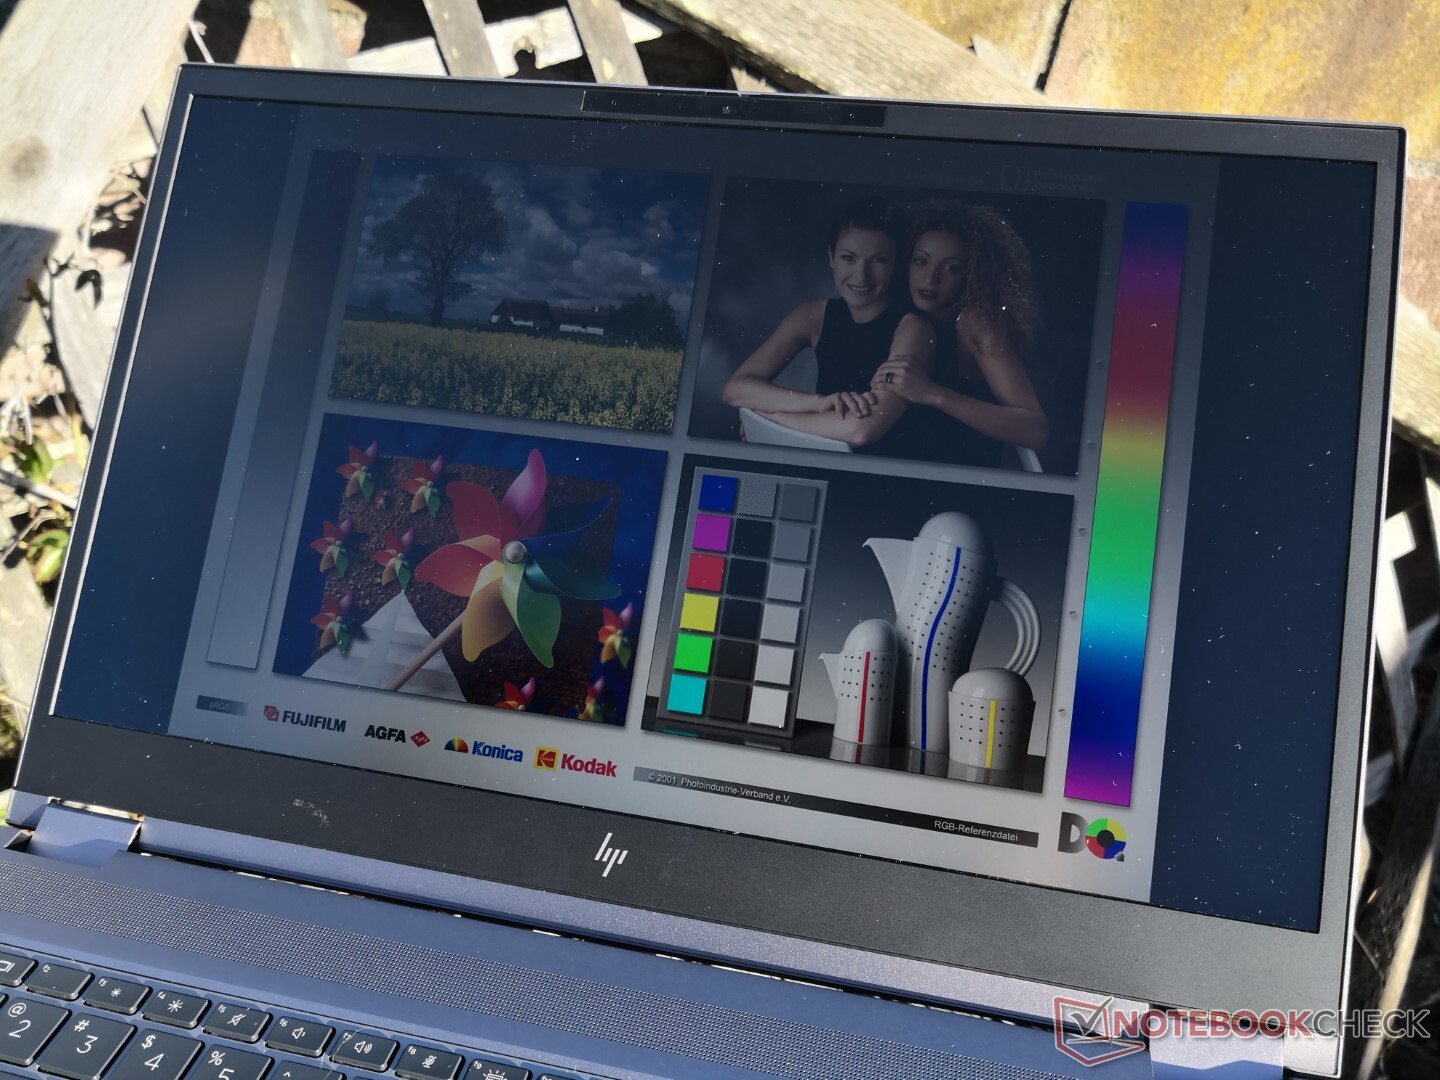
A visibilidade externa é boa se estiver sob sombra, especialmente porque a tela é significativamente mais brilhante do que a média do laptop ou estação de trabalho de 15,6 polegadas. No entanto, a luz direta do sol ainda irá lavar a tela.
Desempenho
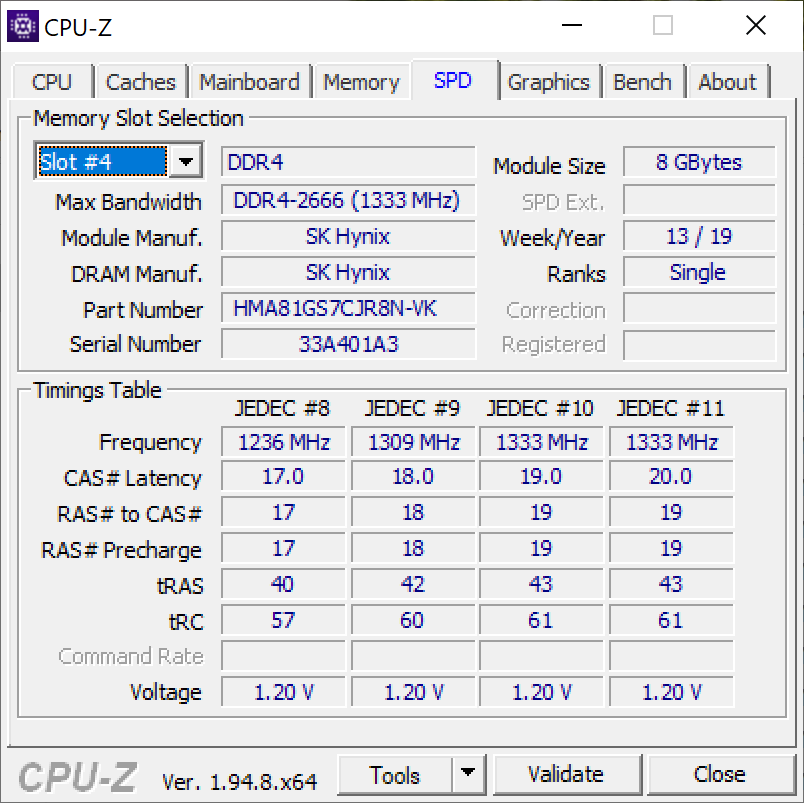
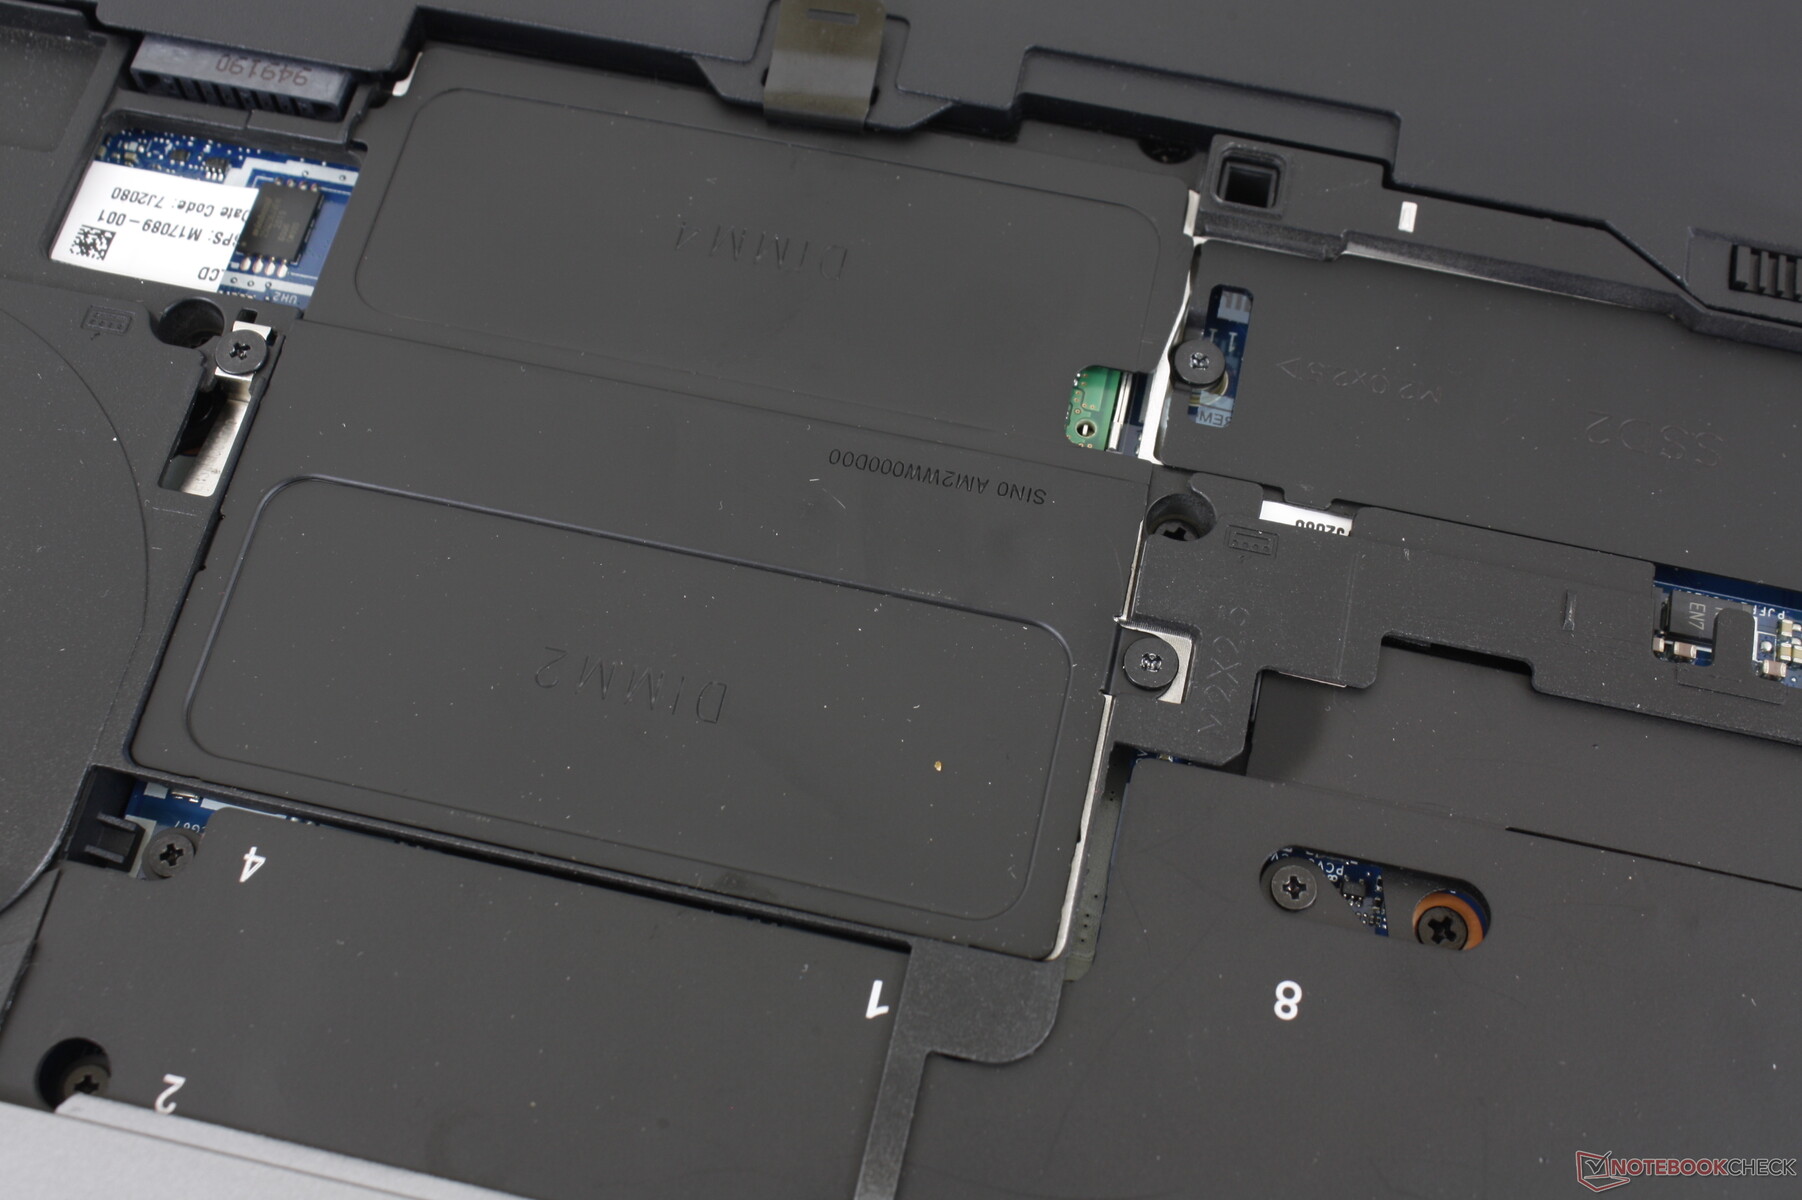
Como uma estação de trabalho móvel completa, o ZBook Fury 15 pode ser equipado com o Core i9-10885H ou Xeon W-10885M para suporte de RAM ECC. Vale ressaltar que os usuários podem configurar até 128 GB de RAM não-ECC enquanto o ECC será limitado a 64 GB. Os profissionais que não são usuários de energia podem preferir o menor e mais portátil HP ZBook Firefly.
Nossa unidade foi configurada para o modo High Performance via Windows antes de executar todos os benchmarks abaixo para obter as melhores pontuações possíveis.
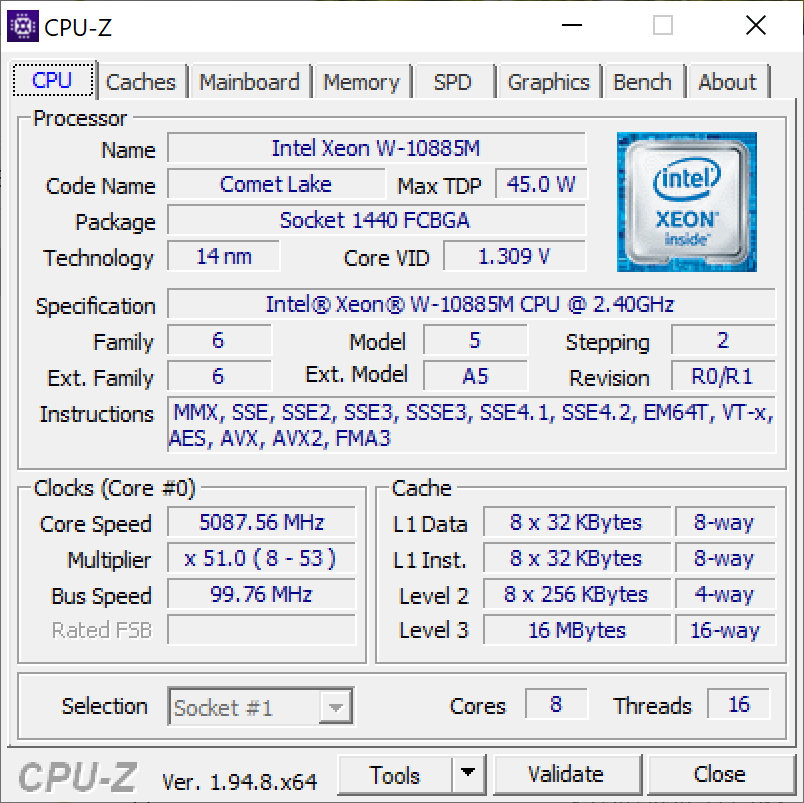
Processador
O desempenho bruto multi-fio é mais lento do que o esperado, cerca de 30% mais lento do que o do Precision 7550 equipado com a mesma CPU Xeon. Os benefícios do Turbo Boost são mínimos, como mostra nosso CineBench R15 xT resultados de teste de loop abaixo.
O desempenho melhora significativamente após a atualização da BIOS para 1.04.01 provavelmente devido a um bug em nossa versão mais antiga da BIOS. O desempenho bruto multi-tarefa saltaria quase 50% para estar mais em linha com a Dell acima mencionada. Isto tem um custo, no entanto, que nossa seção de Teste de Estresse abaixo detalha
Cinebench R15: CPU Multi 64Bit | CPU Single 64Bit
Blender: v2.79 BMW27 CPU
7-Zip 18.03: 7z b 4 -mmt1 | 7z b 4
Geekbench 5.5: Single-Core | Multi-Core
HWBOT x265 Benchmark v2.2: 4k Preset
LibreOffice : 20 Documents To PDF
R Benchmark 2.5: Overall mean
| HWBOT x265 Benchmark v2.2 / 4k Preset | |
| MSI WS66 10TMT-207US | |
| Média Intel Xeon W-10885M (8.89 - 13.6, n=3) | |
| Dell Precision 5540 | |
| Dell Precision 3000 3551 | |
| Dell Precision 5550 P91F | |
| Lenovo ThinkPad X1 Extreme Gen3-20TLS0UV00 | |
| Acer Nitro 5 AN515-44-R5FT | |
| HP ZBook Fury 15 G7 | |
| Asus ProArt StudioBook Pro 15 W500G5T | |
| Dell XPS 15 9500 Core i5 | |
| LibreOffice / 20 Documents To PDF | |
| Acer Nitro 5 AN515-44-R5FT | |
| Dell XPS 15 9500 Core i5 | |
| Asus ProArt StudioBook Pro 15 W500G5T | |
| HP ZBook Fury 15 G7 | |
| Média Intel Xeon W-10885M (44.4 - 58.1, n=3) | |
| Lenovo ThinkPad X1 Extreme Gen3-20TLS0UV00 | |
| Dell Precision 3000 3551 | |
| MSI WS66 10TMT-207US | |
| Dell Precision 5550 P91F | |
| R Benchmark 2.5 / Overall mean | |
| Dell XPS 15 9500 Core i5 | |
| Asus ProArt StudioBook Pro 15 W500G5T | |
| Acer Nitro 5 AN515-44-R5FT | |
| Lenovo ThinkPad X1 Extreme Gen3-20TLS0UV00 | |
| Dell Precision 5550 P91F | |
| MSI WS66 10TMT-207US | |
| Dell Precision 3000 3551 | |
| Média Intel Xeon W-10885M (0.551 - 0.57, n=3) | |
| HP ZBook Fury 15 G7 | |
* ... menor é melhor
Desempenho do sistema
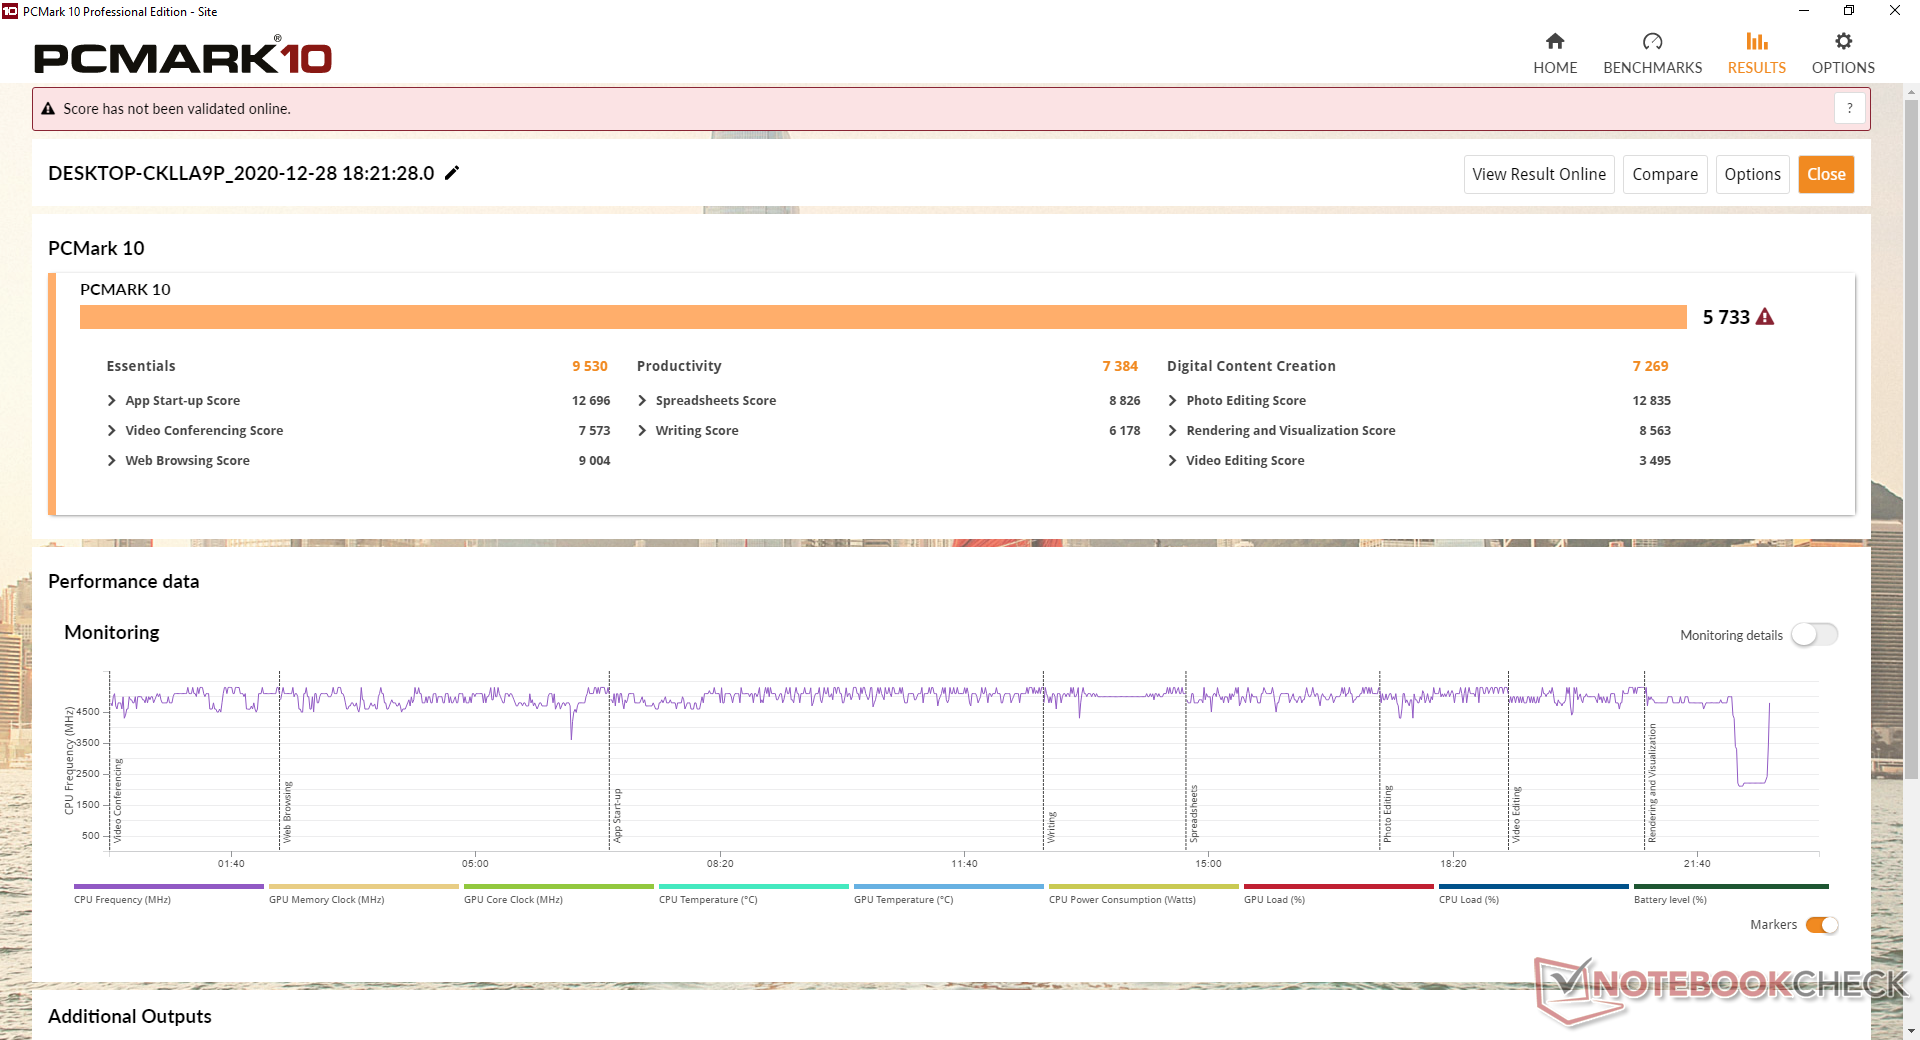
Os benchmarks da PCMark estão onde esperamos que sejam relativos a outras estações de trabalho móveis. O Precision 7550, que vem com exatamente a mesma CPU e GPU que nosso HP, é capaz de superar o nosso sistema por meros pontos percentuais.
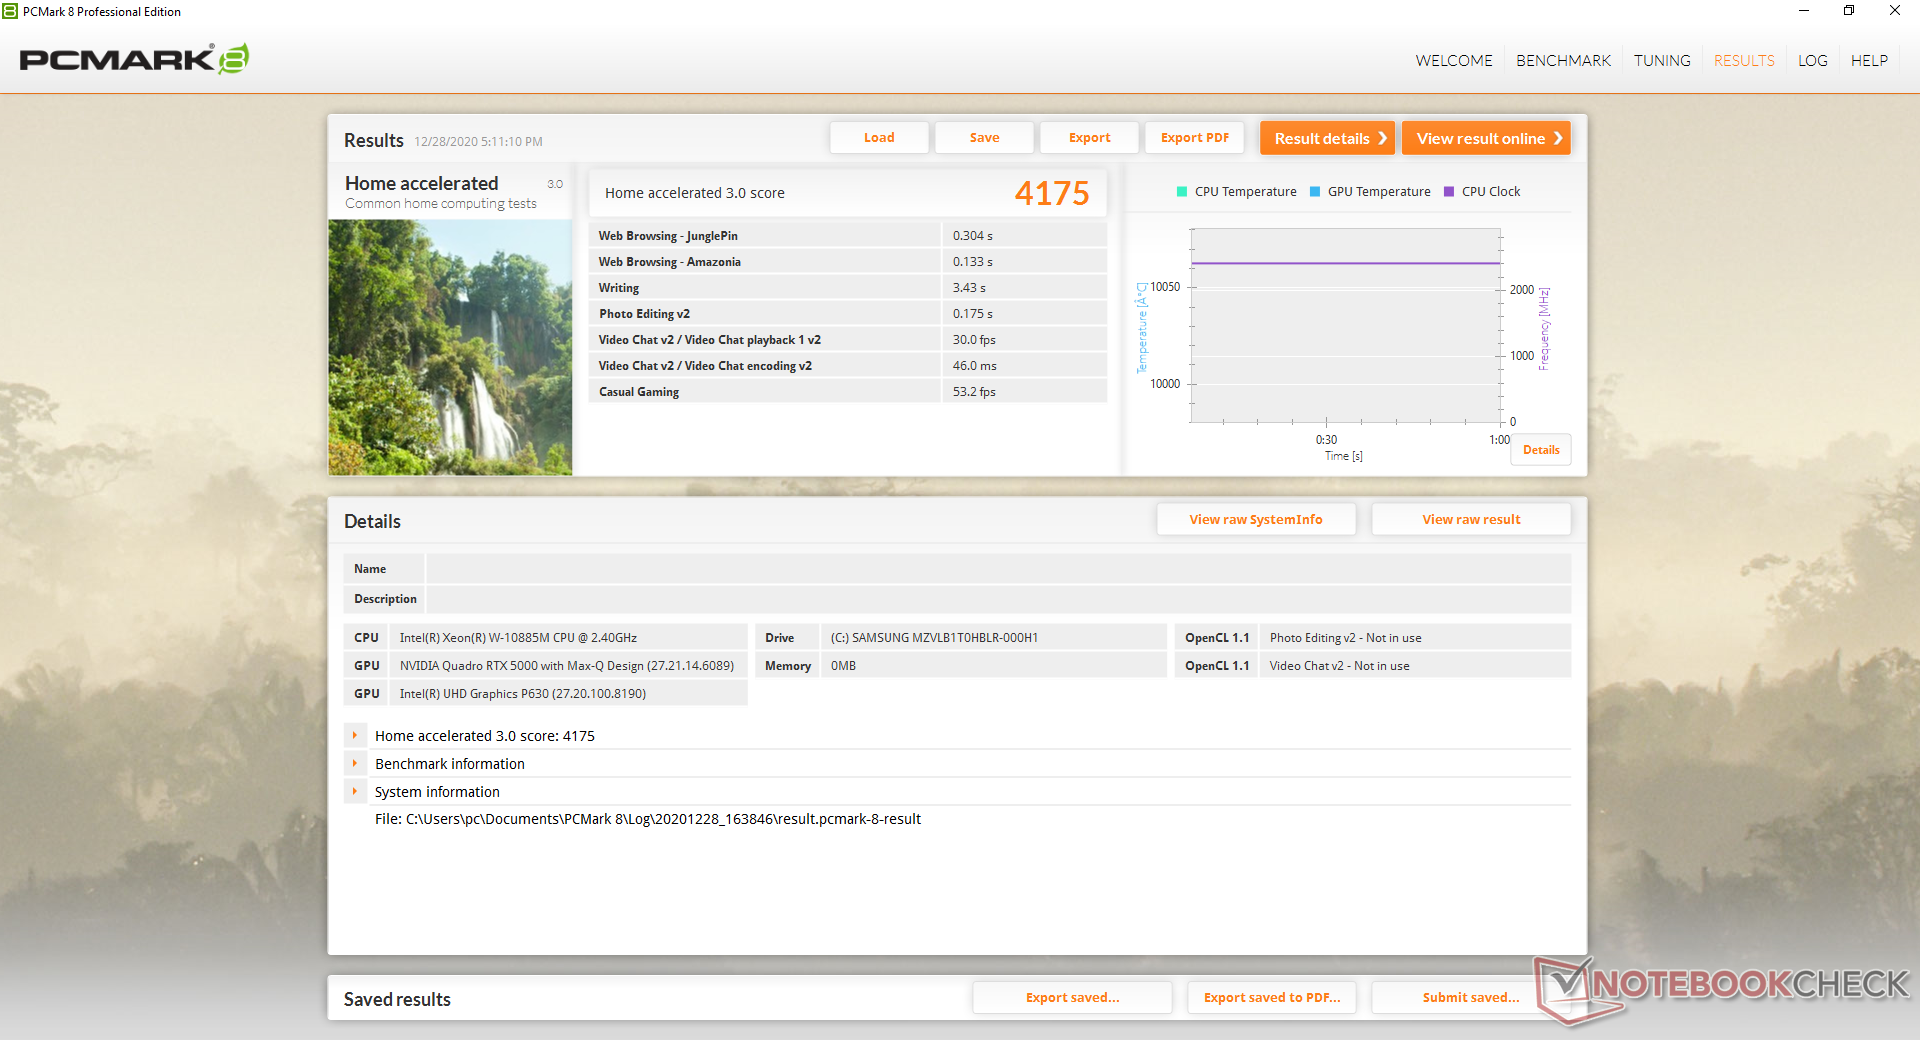
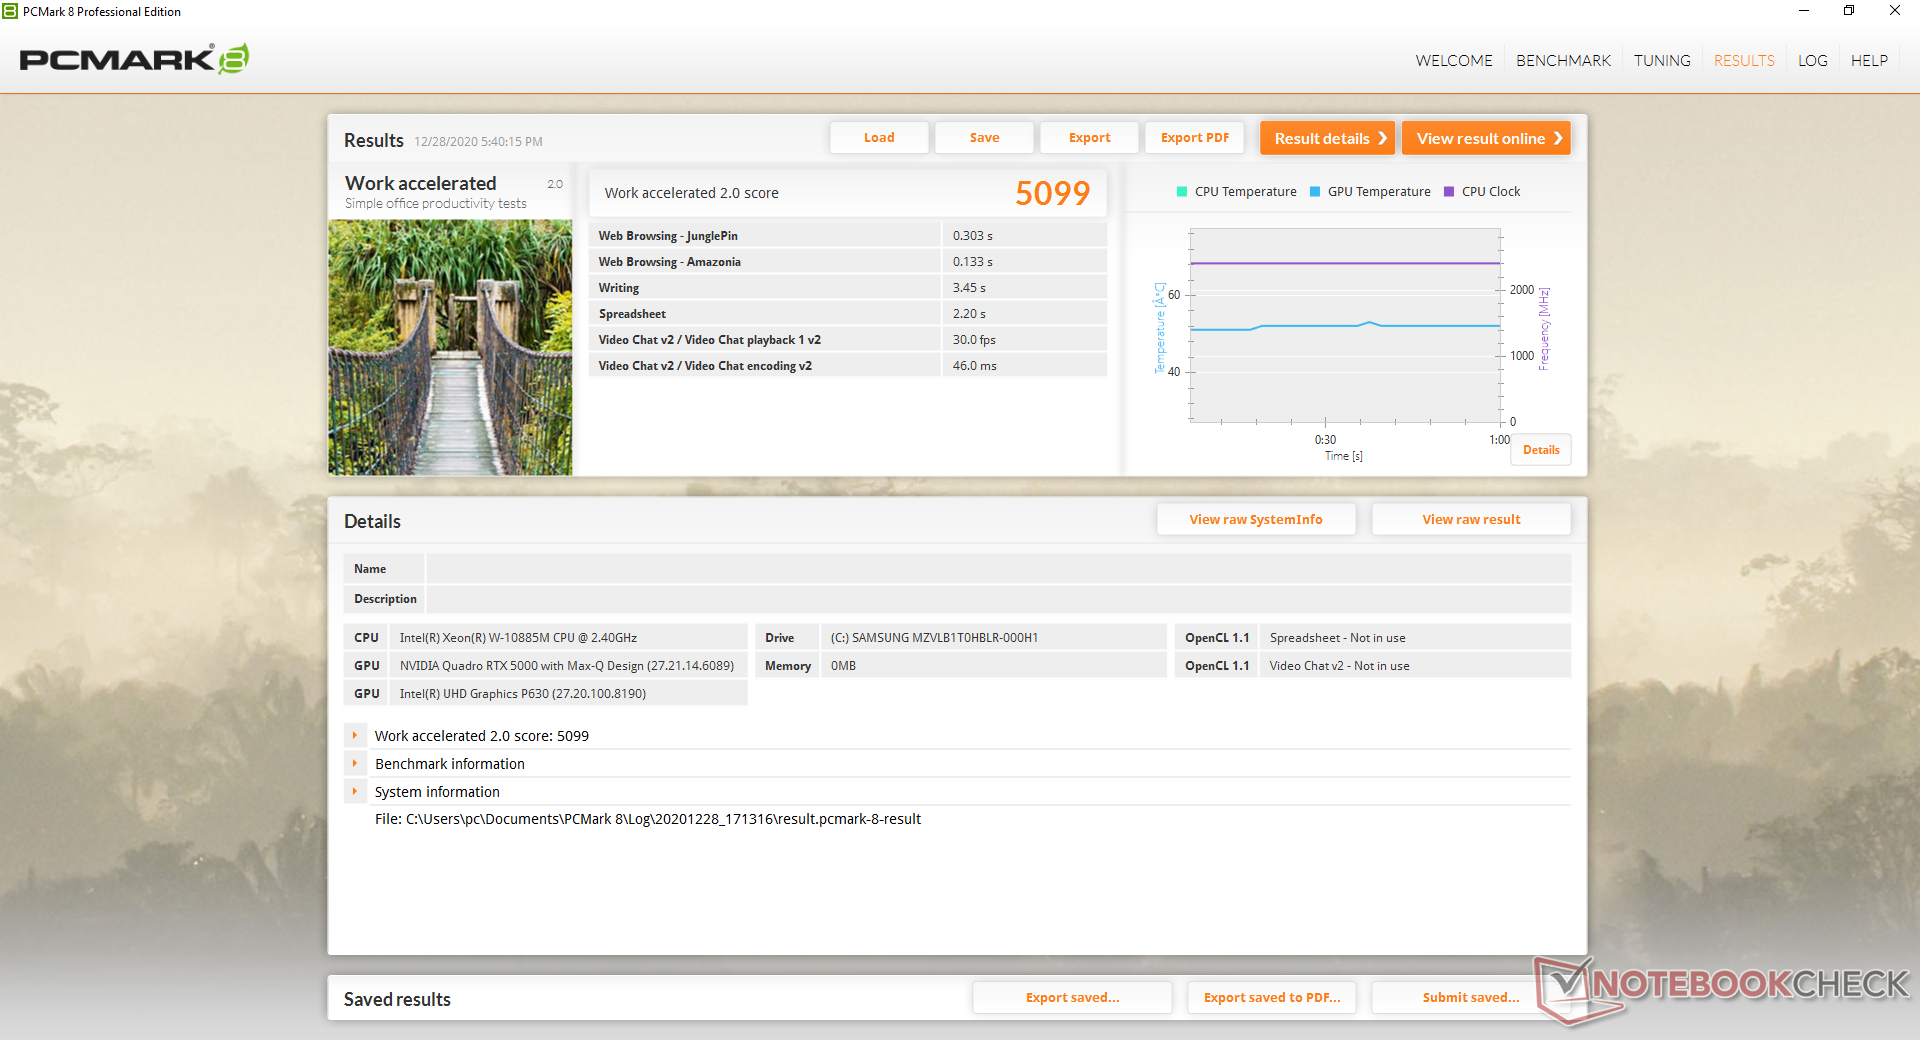
| PCMark 8 Home Score Accelerated v2 | 4175 pontos | |
| PCMark 8 Work Score Accelerated v2 | 5099 pontos | |
| PCMark 10 Score | 5733 pontos | |
Ajuda | ||
Latência do DPC
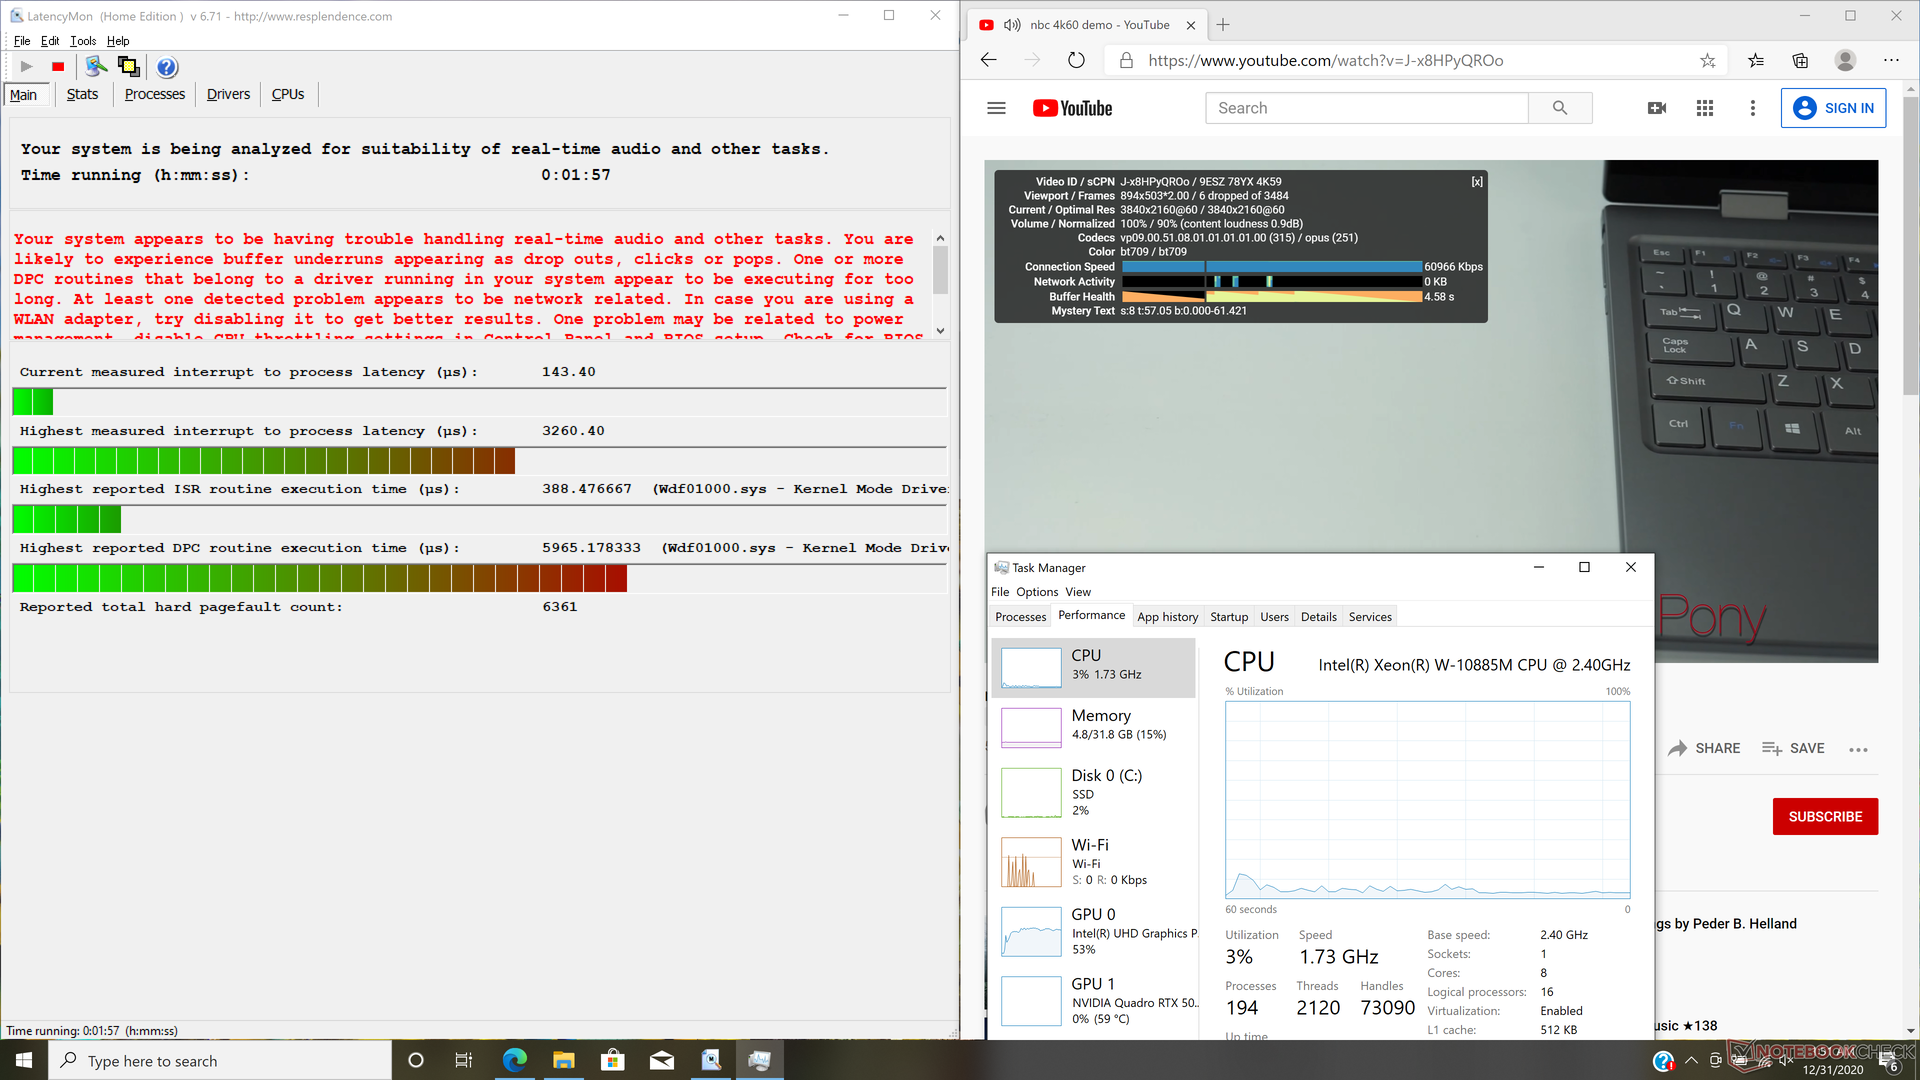
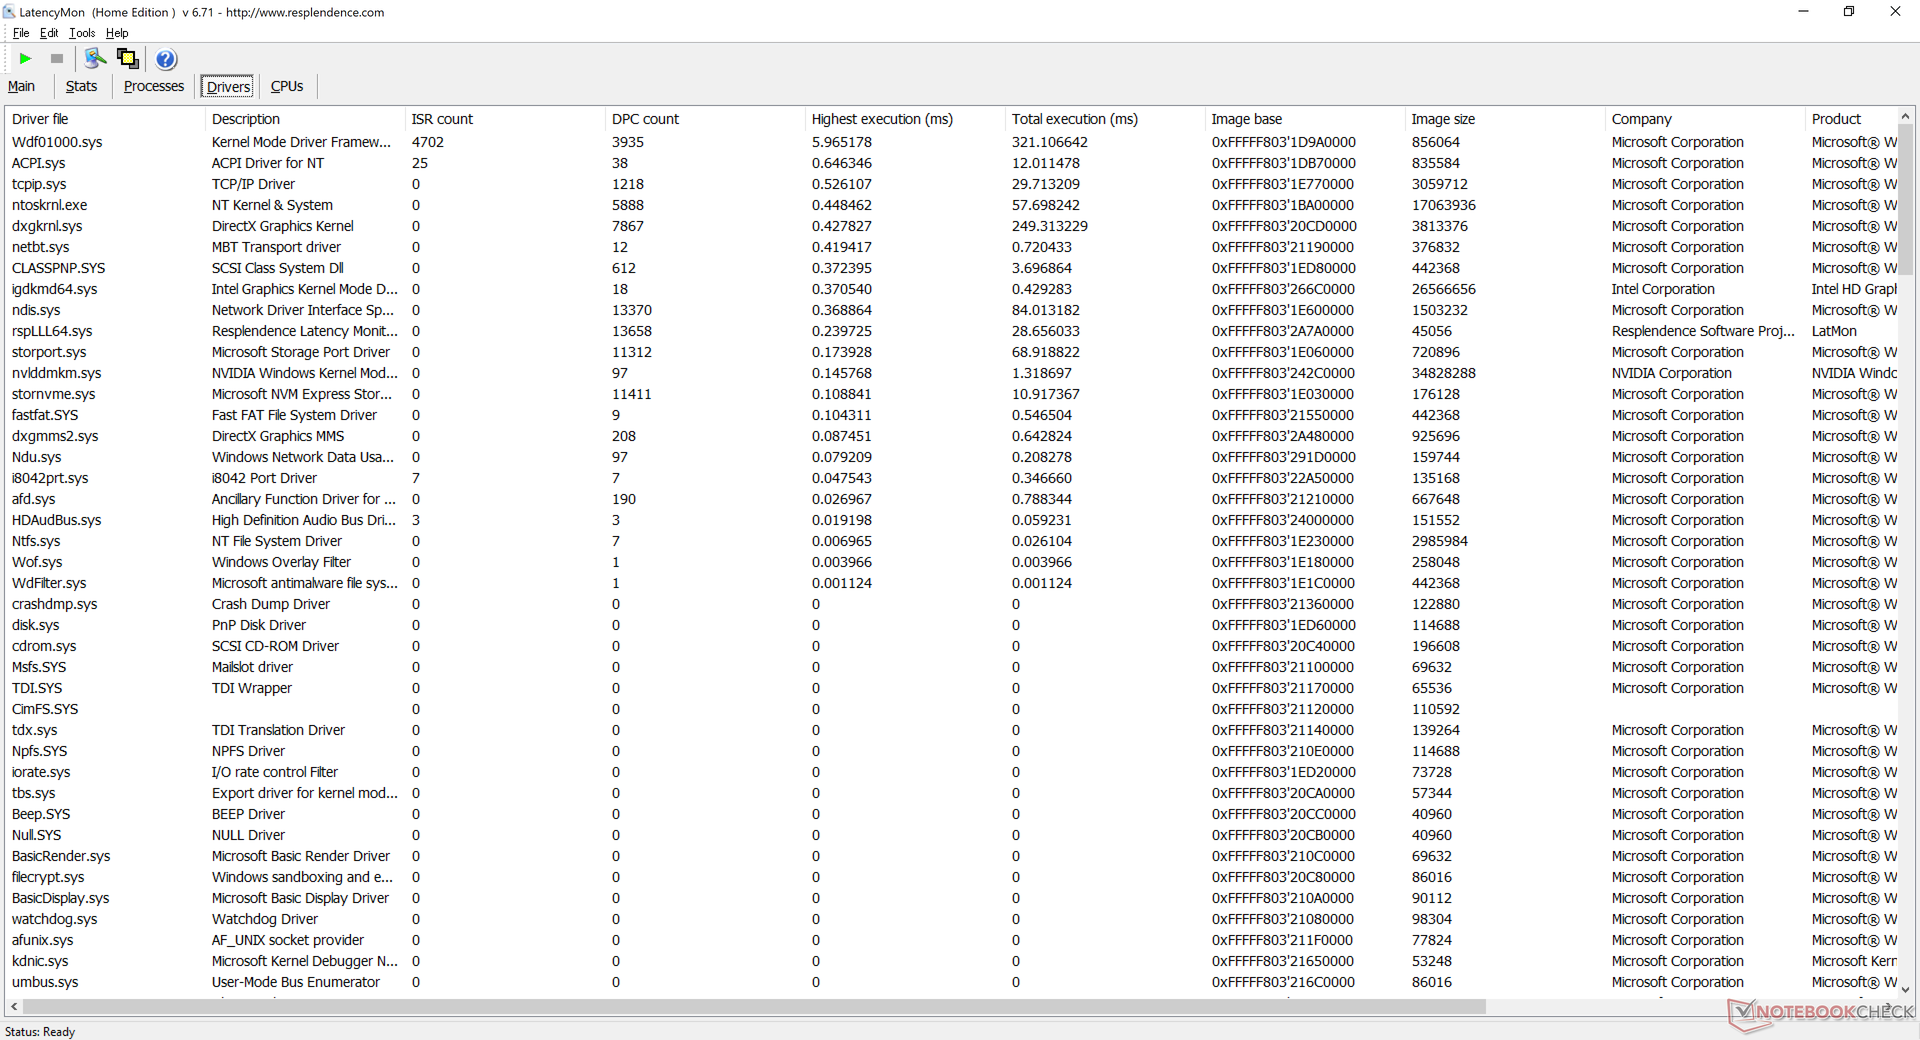
LatencyMon revela problemas de latência do DPC ao abrir várias abas do navegador de nossa página inicial, mesmo depois de vários testes repetidos. A reprodução do vídeo de 4K a 60 FPS é suave, mas não perfeita, já que gravamos 6 quadros perdidos durante um vídeo de um minuto no YouTube.
| DPC Latencies / LatencyMon - interrupt to process latency (max), Web, Youtube, Prime95 | |
| Dell Precision 7550 | |
| MSI WS66 10TMT-207US | |
| HP ZBook Fury 15 G7 | |
| Asus ProArt StudioBook Pro 15 W500G5T | |
| Razer Blade 15 Studio Edition 2020 | |
* ... menor é melhor
Dispositivos de armazenamento
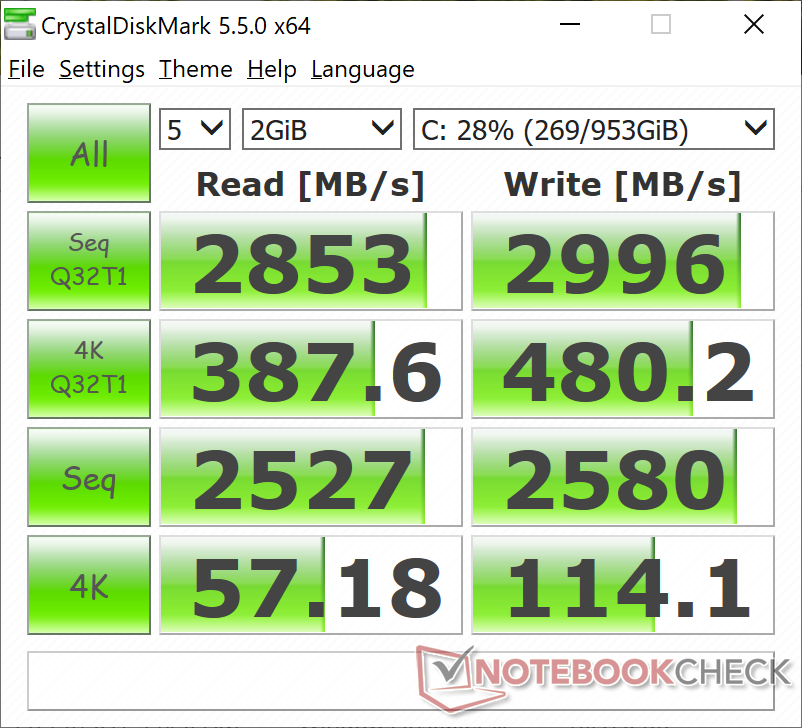
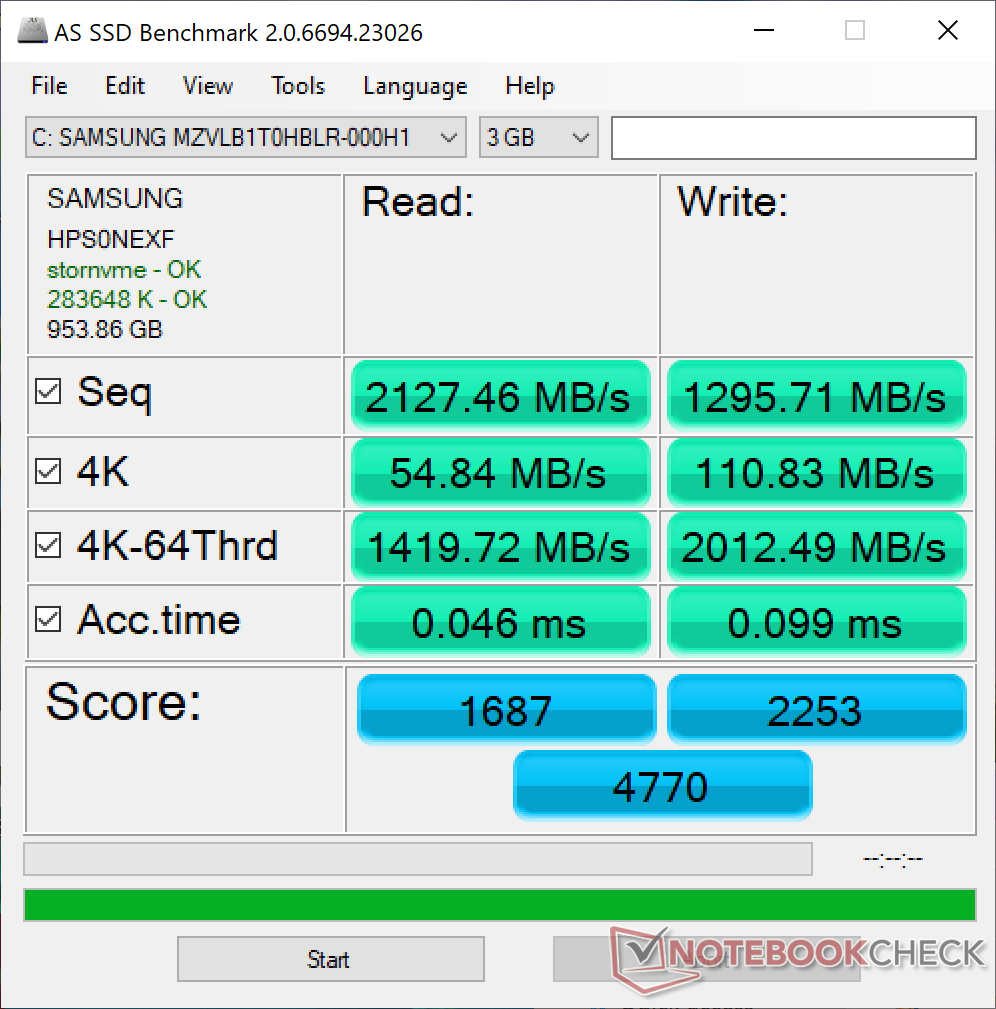
Nossa unidade de teste vem com um Samsung PM981a de 1 TB que é um dos mais rápidos PCIe 3 x4 NVMe SSDs disponíveis para o consumidor. Os usuários podem configurar com outros tamanhos ou modelos com segurança SED, se desejarem.
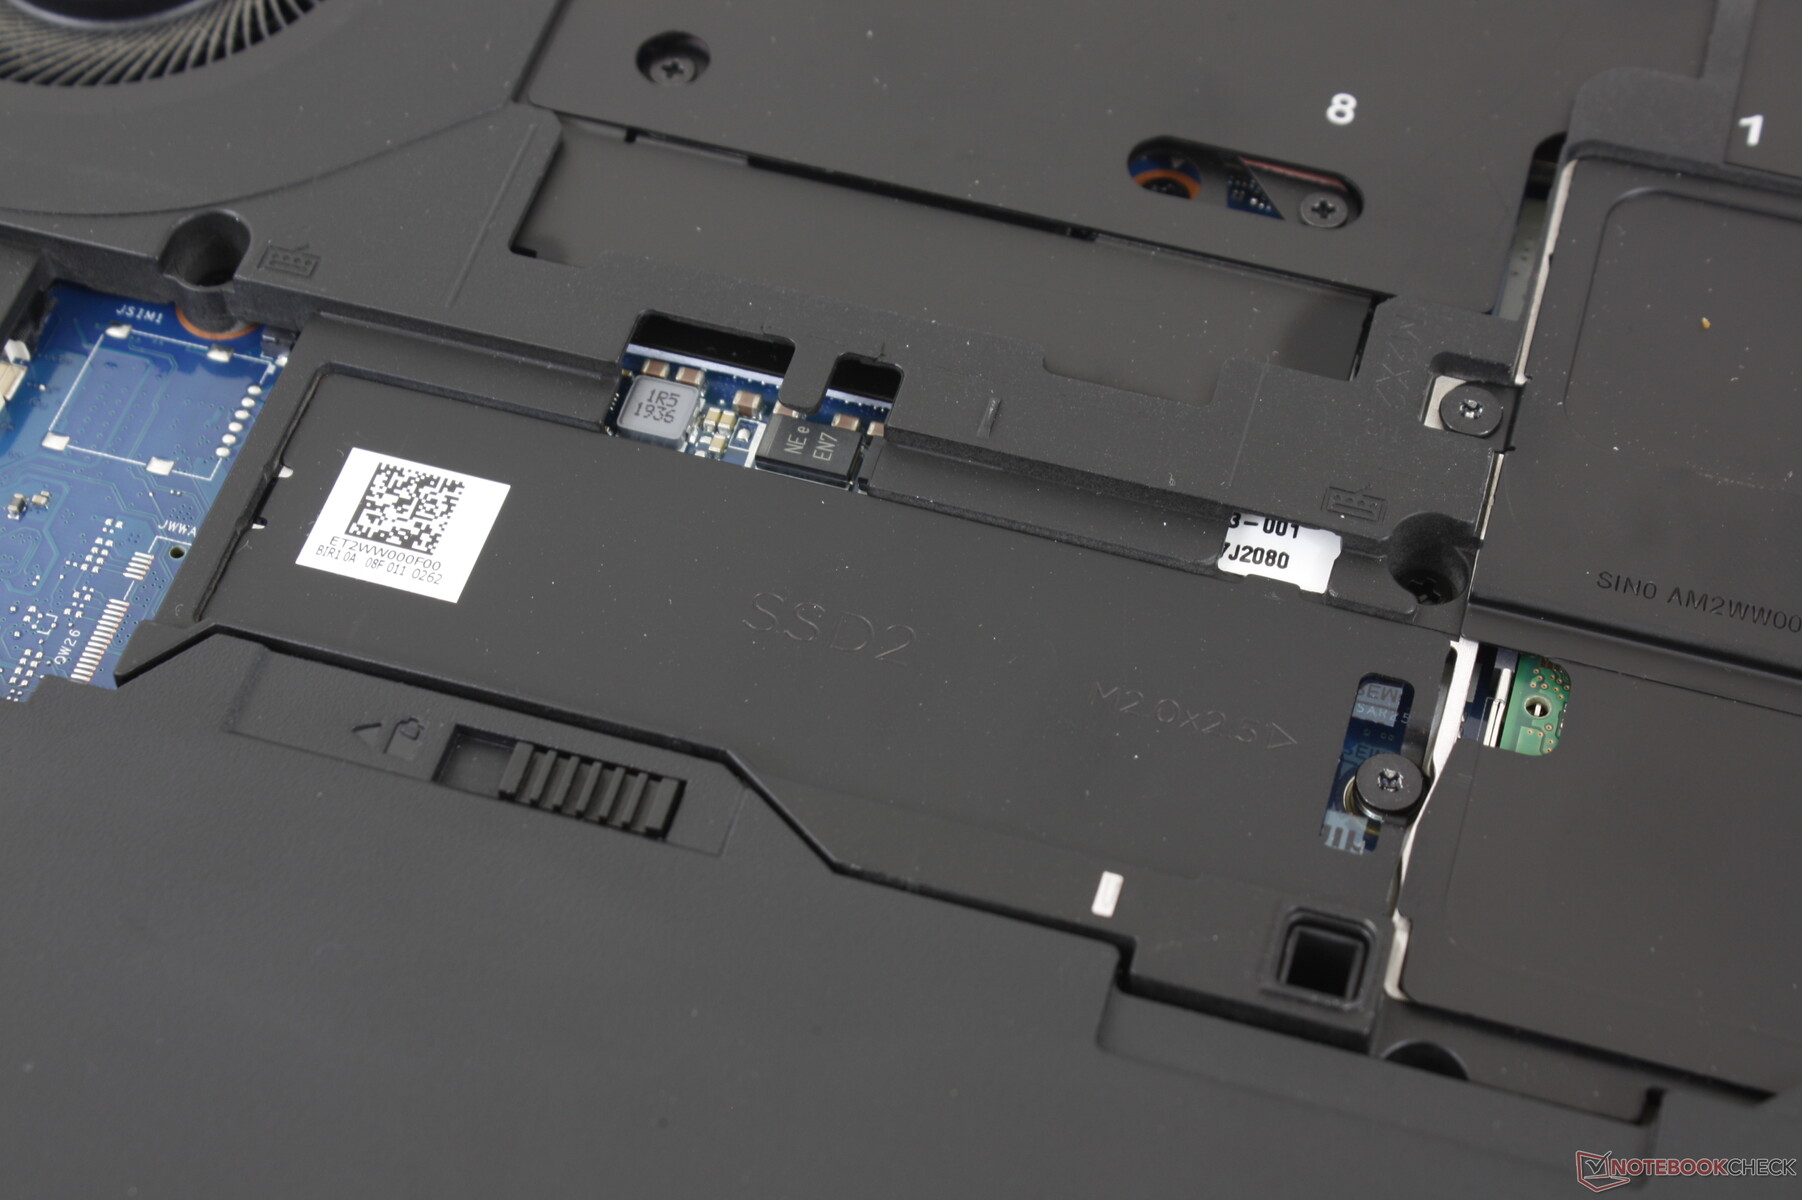
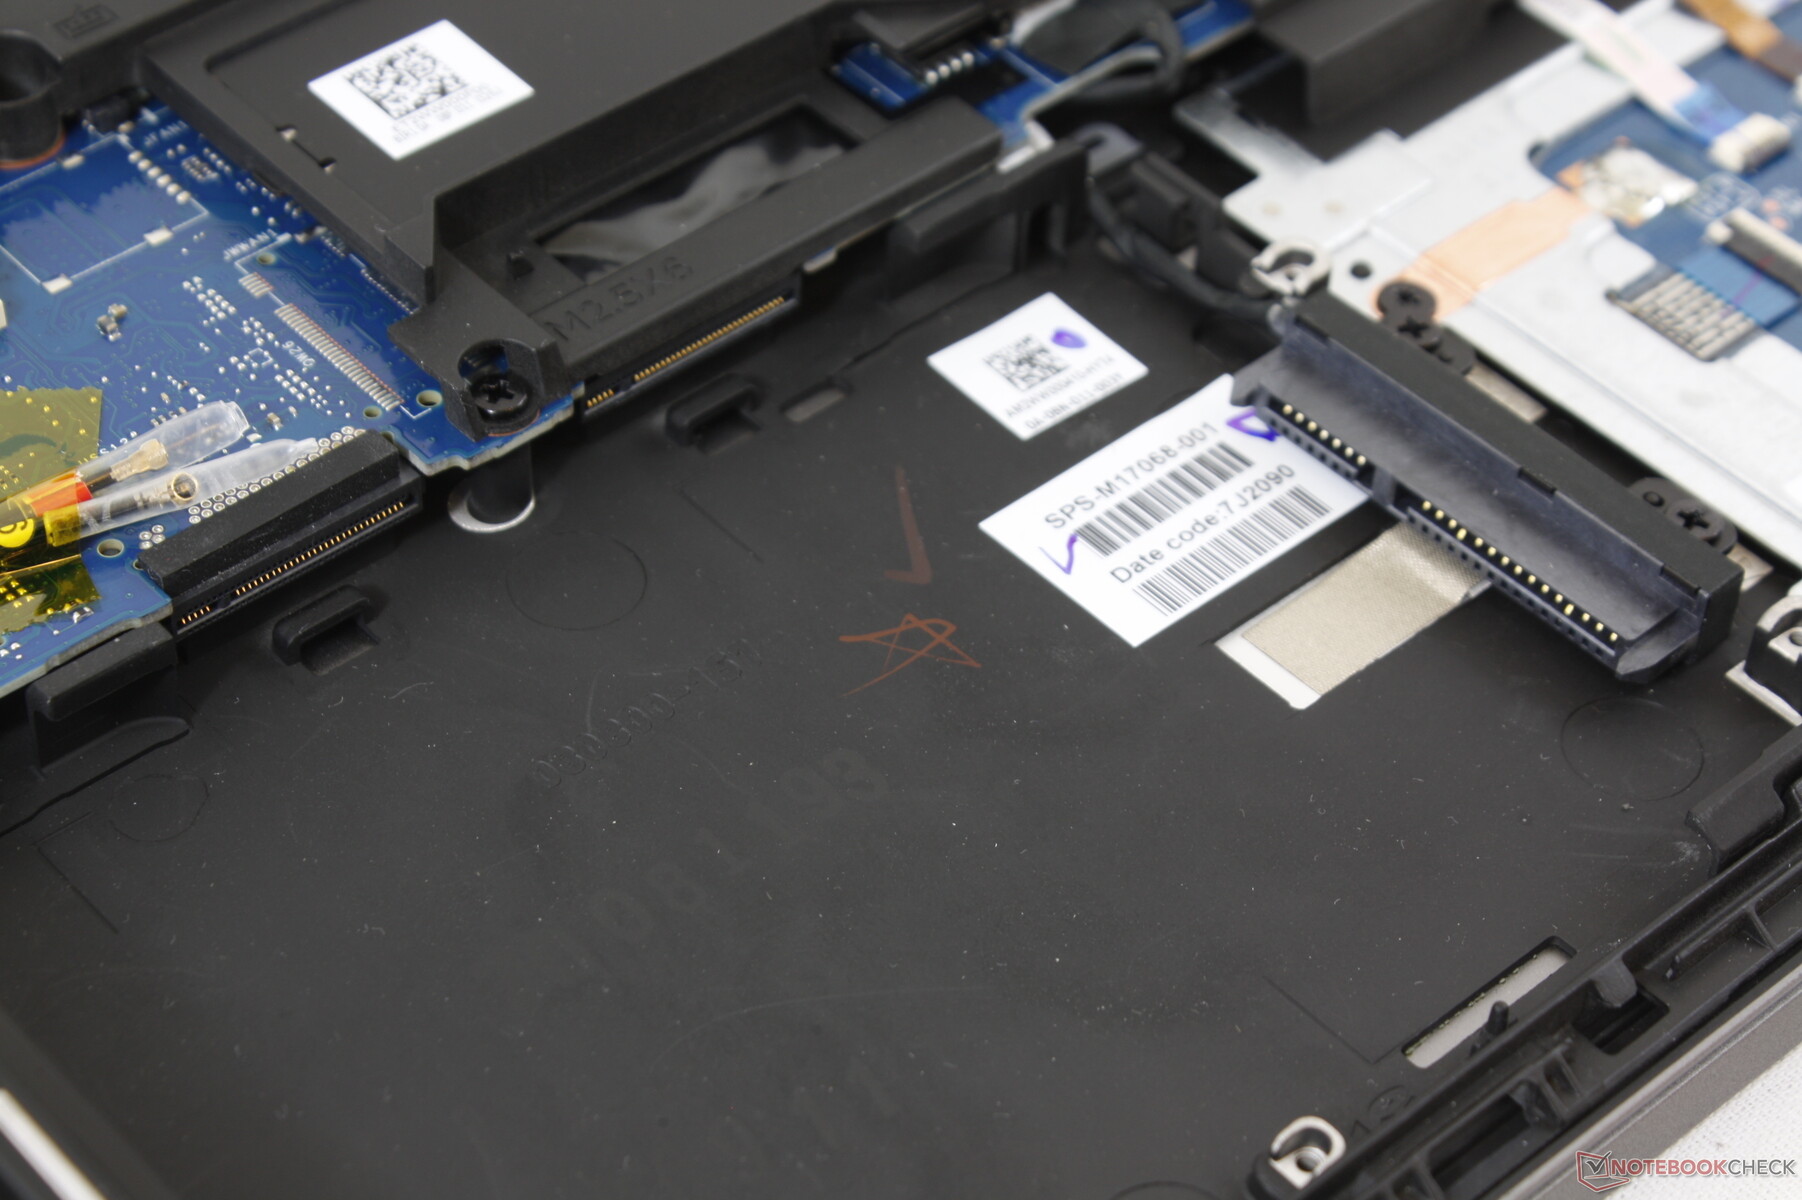
Um total de quatro slots de armazenamento estão disponíveis (3x M.2 2280 + 1x SATA III de 2,5 polegadas). Entretanto, o compartimento de 2,5 polegadas compartilha o mesmo espaço que dois dos slots M.2, o que significa que não há espaço suficiente para instalar quatro drives. Os usuários podem instalar até três drives M.2 ou um drive M.2 mais um drive de 2,5 polegadas.
Algumas SKUs omitem o conector de 2,5 polegadas para um slot M.2 adicional para suportar até quatro drives M.2 simultaneamente.
| HP ZBook Fury 15 G7 Samsung PM981a MZVLB1T0HBLR | MSI WS66 10TMT-207US WDC PC SN730 SDBPNTY-1T00 | Dell Precision 7550 SK Hynix PC601A NVMe 1TB | Razer Blade 15 Studio Edition 2020 Samsung PM981a MZVLB1T0HBLR | Lenovo ThinkPad P1 2019-20QT000RGE WDC PC SN720 SDAQNTW-512G | |
|---|---|---|---|---|---|
| AS SSD | 74% | 29% | 31% | 49% | |
| Seq Read (MB/s) | 2127 | 2321 9% | 2028 -5% | 1982 -7% | 2980 40% |
| Seq Write (MB/s) | 1296 | 2620 102% | 1193 -8% | 2252 74% | 2094 62% |
| 4K Read (MB/s) | 54.8 | 48.57 -11% | 42.31 -23% | 47.13 -14% | 45.05 -18% |
| 4K Write (MB/s) | 110.8 | 165.1 49% | 105.5 -5% | 88.2 -20% | 155.4 40% |
| 4K-64 Read (MB/s) | 1420 | 1712 21% | 1128 -21% | 1481 4% | 1291 -9% |
| 4K-64 Write (MB/s) | 2012 | 2174 8% | 1537 -24% | 1842 -8% | 1506 -25% |
| Access Time Read * (ms) | 0.046 | 0.057 -24% | 0.069 -50% | 0.087 -89% | 0.064 -39% |
| Access Time Write * (ms) | 0.099 | 0.068 31% | 0.106 -7% | 0.04 60% | 0.024 76% |
| Score Read (Points) | 1687 | 1993 18% | 1373 -19% | 1726 2% | 1634 -3% |
| Score Write (Points) | 2253 | 2601 15% | 1762 -22% | 2155 -4% | 1871 -17% |
| Score Total (Points) | 4770 | 5630 18% | 3801 -20% | 4781 0% | 4300 -10% |
| Copy ISO MB/s (MB/s) | 2779 | 2589 -7% | 1768 -36% | 1982 -29% | 2015 -27% |
| Copy Program MB/s (MB/s) | 123.3 | 791 542% | 627 409% | 501 306% | 597 384% |
| Copy Game MB/s (MB/s) | 440.8 | 1625 269% | 1477 235% | 1140 159% | 1449 229% |
| CrystalDiskMark 5.2 / 6 | 12% | -9% | 2% | 1% | |
| Write 4K (MB/s) | 114.1 | 185.8 63% | 121 6% | 132.9 16% | 162.2 42% |
| Read 4K (MB/s) | 57.2 | 47.21 -17% | 42.16 -26% | 46.73 -18% | 43.71 -24% |
| Write Seq (MB/s) | 2580 | 2874 11% | 2150 -17% | 2214 -14% | 2441 -5% |
| Read Seq (MB/s) | 2527 | 1786 -29% | 1755 -31% | 2018 -20% | 1753 -31% |
| Write 4K Q32T1 (MB/s) | 480.2 | 466.8 -3% | 395.3 -18% | 478.9 0% | 397.6 -17% |
| Read 4K Q32T1 (MB/s) | 387.6 | 563 45% | 381.8 -1% | 540 39% | 520 34% |
| Write Seq Q32T1 (MB/s) | 2996 | 3091 3% | 2730 -9% | 2975 -1% | 2519 -16% |
| Read Seq Q32T1 (MB/s) | 2853 | 3395 19% | 3468 22% | 3195 12% | 3448 21% |
| Write 4K Q8T8 (MB/s) | 1381 | ||||
| Read 4K Q8T8 (MB/s) | 1371 | ||||
| Média Total (Programa/Configurações) | 43% /
51% | 10% /
15% | 17% /
20% | 25% /
31% |
* ... menor é melhor

Disk Throttling: DiskSpd Read Loop, Queue Depth 8
Desempenho da GPU
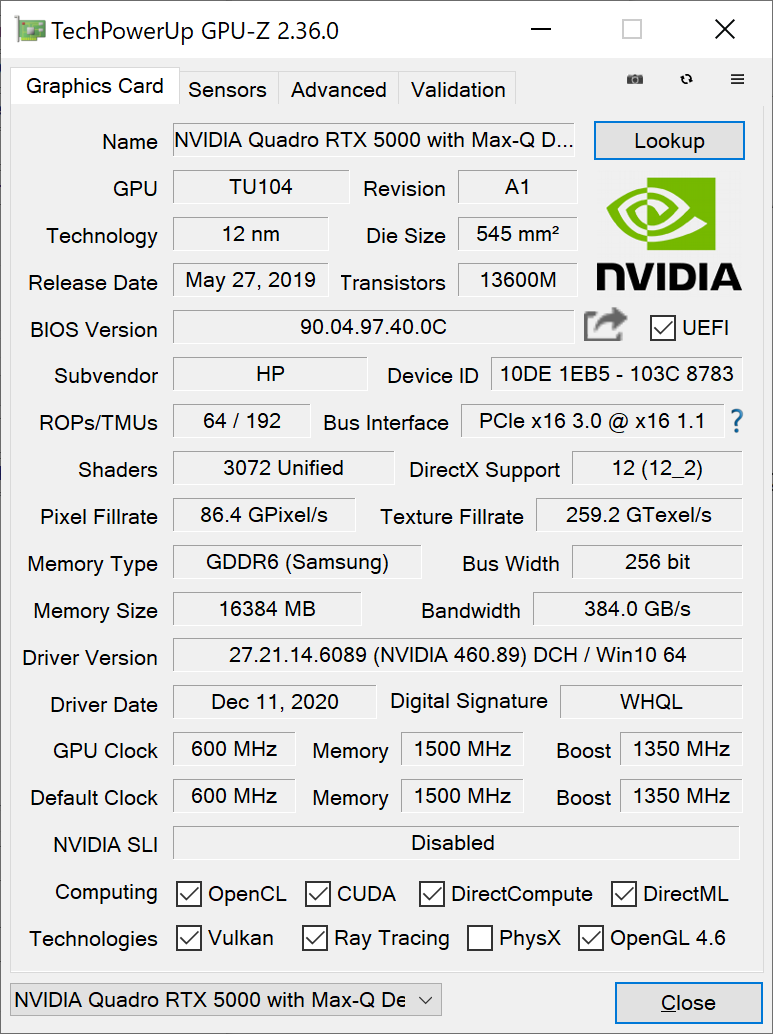
O sistema utiliza uma GPU Quadro RTX 5000 Max-Q em vez da mais rápida Quadro RTX 5000 Max-P que é capaz de oferecer até 30 a 35 por cento mais desempenho do que nossa variante Max-Q. Os usuários que desejam um desempenho máximo do RTX 5000 devem procurar o Acer ConceptD 9 Pro maior em vez disso.
O desempenho gráfico bruto ainda é excelente com resultados de referência apenas tímidos de um Quadro RTX 4000 Max-P.
| 3DMark 11 Performance | 20890 pontos | |
| 3DMark Cloud Gate Standard Score | 30434 pontos | |
| 3DMark Fire Strike Score | 16005 pontos | |
| 3DMark Time Spy Score | 7276 pontos | |
Ajuda | ||
| Final Fantasy XV Benchmark | |
| 1920x1080 Standard Quality | |
| MSI RTX 2080 Gaming X Trio | |
| MSI WS66 10TMT-207US | |
| HP ZBook Fury 15 G7 | |
| Dell Precision 7550 | |
| Média NVIDIA Quadro RTX 5000 Max-Q (82.3 - 103, n=4) | |
| Dell Precision 5000 5750 P92F | |
| Acer ConceptD 3 Pro CN315-71P-73W1 | |
| Dell Precision 5550 P91F | |
| Lenovo ThinkPad P1 2019-20QT000RGE | |
| Dell Precision 5540 | |
| Dell Precision 3000 3551 | |
| 1920x1080 High Quality | |
| MSI RTX 2080 Gaming X Trio | |
| MSI WS66 10TMT-207US | |
| HP ZBook Fury 15 G7 | |
| Dell Precision 7550 | |
| Média NVIDIA Quadro RTX 5000 Max-Q (65.8 - 80.8, n=4) | |
| Dell Precision 5000 5750 P92F | |
| Dell Precision 5550 P91F | |
| Acer ConceptD 3 Pro CN315-71P-73W1 | |
| Lenovo ThinkPad P1 2019-20QT000RGE | |
| Dell Precision 5540 | |
| Dell Precision 3000 3551 | |
| 3840x2160 High Quality | |
| MSI RTX 2080 Gaming X Trio | |
| HP ZBook Fury 15 G7 | |
| Dell Precision 7550 | |
| Média NVIDIA Quadro RTX 5000 Max-Q (30.6 - 33.9, n=3) | |
| Dell Precision 5000 5750 P92F | |
| Dell Precision 5550 P91F | |
| Dell Precision 5540 | |
| baixo | média | alto | ultra | QHD | 4K | |
|---|---|---|---|---|---|---|
| The Witcher 3 (2015) | 298.9 | 235.8 | 149.8 | 79.5 | 55.4 | |
| Dota 2 Reborn (2015) | 142 | 126 | 119 | 112 | 96.7 | |
| Final Fantasy XV Benchmark (2018) | 132 | 101 | 79.4 | 58.4 | 33.9 | |
| X-Plane 11.11 (2018) | 96.1 | 86.9 | 73.4 | 60.6 |
Emissions
Ruído do sistema
O ruído dos ventiladores nunca é um problema quando a carga é baixa a média. A primeira cena de referência de 90 segundos do 3DMark 06, por exemplo, induz um ruído do ventilador de apenas 31,7 dB(A) a ser muito mais silencioso do que o que observamos no site Precision 7550 ou MSI WS66. O ruído dos ventiladores atinge 47 dB(A) quando se corre com cargas mais altas.
Não podemos notar nenhum ruído eletrônico ou lamentação da bobina de nossa unidade de teste.
| HP ZBook Fury 15 G7 Quadro RTX 5000 Max-Q, W-10885M, Samsung PM981a MZVLB1T0HBLR | Asus ProArt StudioBook Pro 15 W500G5T Quadro RTX 5000 Max-Q, i7-9750H, Samsung SSD PM981 MZVLB1T0HALR | MSI WS66 10TMT-207US Quadro RTX 5000 Max-Q, i9-10980HK, WDC PC SN730 SDBPNTY-1T00 | Dell Precision 7550 Quadro RTX 5000 Max-Q, W-10885M, SK Hynix PC601A NVMe 1TB | Razer Blade 15 Studio Edition 2020 Quadro RTX 5000 Max-Q, i7-10875H, Samsung PM981a MZVLB1T0HBLR | Lenovo ThinkPad P1 2019-20QT000RGE Quadro T1000 (Laptop), i7-9850H, WDC PC SN720 SDAQNTW-512G | |
|---|---|---|---|---|---|---|
| Noise | -10% | -17% | -11% | -12% | -5% | |
| desligado / ambiente * (dB) | 26.4 | 25.2 5% | 26 2% | 25.8 2% | 30.1 -14% | 28.8 -9% |
| Idle Minimum * (dB) | 26.4 | 27.9 -6% | 32 -21% | 25.8 2% | 30.1 -14% | 28.8 -9% |
| Idle Average * (dB) | 26.4 | 27.9 -6% | 32 -21% | 25.8 2% | 30.1 -14% | 28.8 -9% |
| Idle Maximum * (dB) | 26.4 | 27.9 -6% | 32 -21% | 25.9 2% | 30.1 -14% | 28.8 -9% |
| Load Average * (dB) | 31.7 | 47 -48% | 42 -32% | 51.2 -62% | 42.3 -33% | 36.1 -14% |
| Witcher 3 ultra * (dB) | 47 | 47.4 -1% | 51.9 -10% | 48.2 -3% | ||
| Load Maximum * (dB) | 47 | 46.9 -0% | 59.7 -27% | 51.9 -10% | 42.1 10% | 36.7 22% |
* ... menor é melhor
Barulho
| Ocioso |
| 26.4 / 26.4 / 26.4 dB |
| Carga |
| 31.7 / 47 dB |
 | ||
30 dB silencioso 40 dB(A) audível 50 dB(A) ruidosamente alto |
||
min: | ||
Temperatura
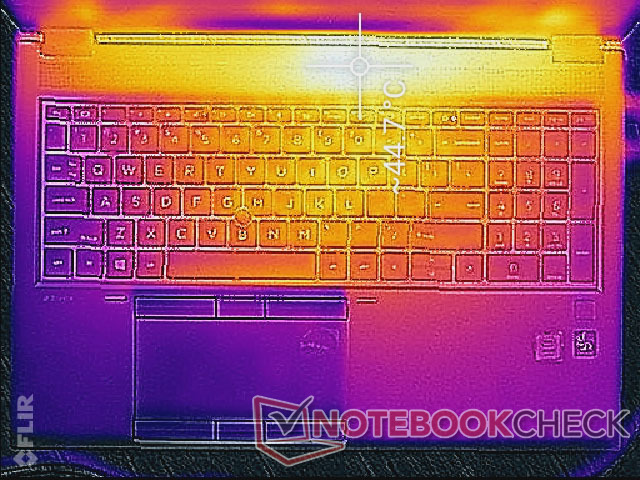
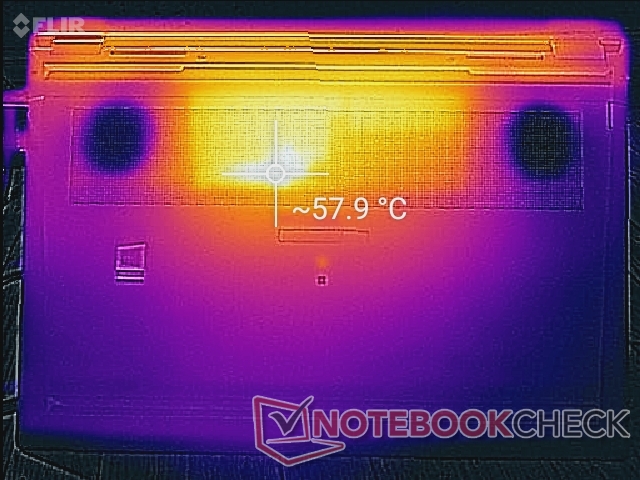
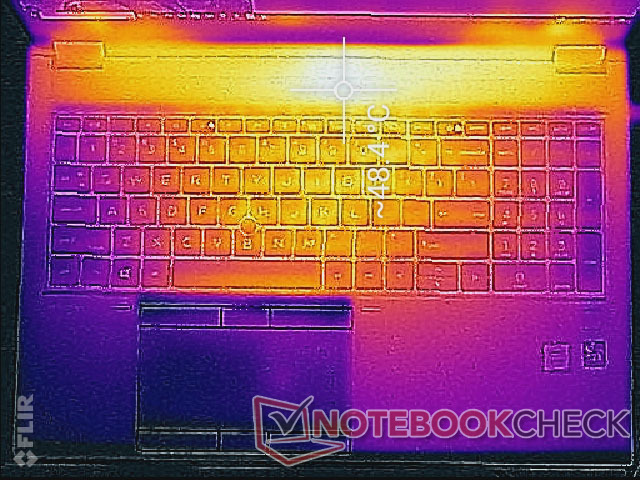
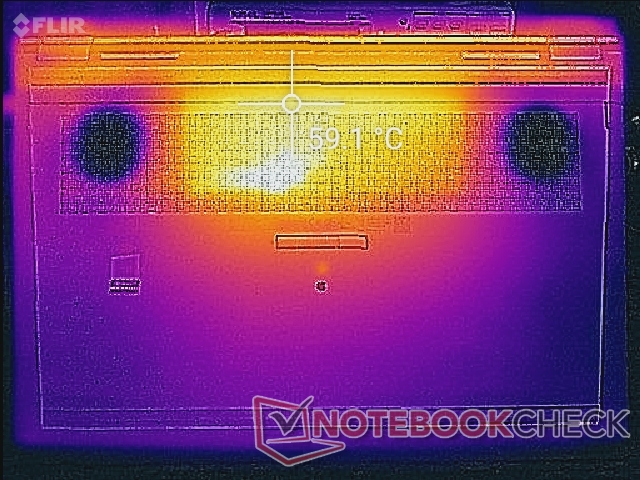
Os pontos quentes podem se tornar tão quentes quanto 49 C a 60 C nos lados superior e inferior do laptop, respectivamente. Felizmente, estas áreas estão na parte de trás do laptop, onde os usuários são menos propensos a se tocar. O AsusProArt StudioBook Pro 15, que vem com o mesmo RTX 5000 Max-Q GPU, funciona ainda mais quente a até 66 C quando em condições similares.
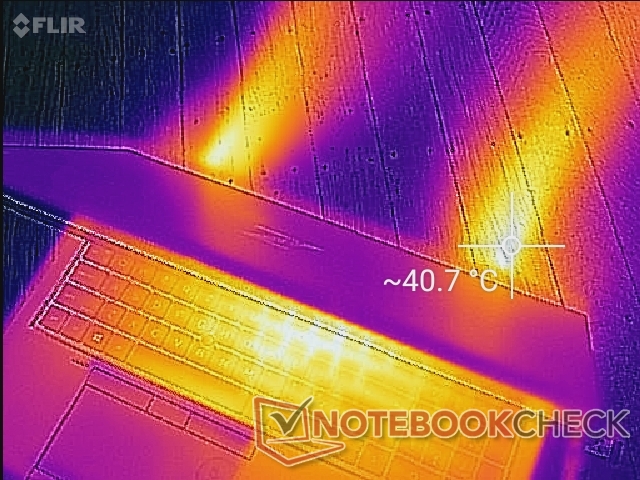
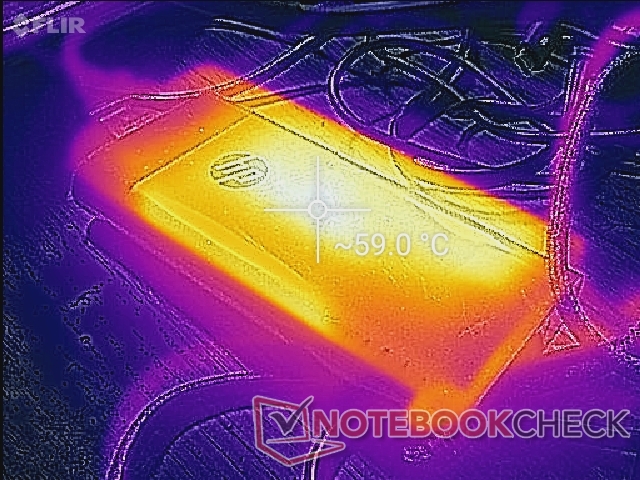
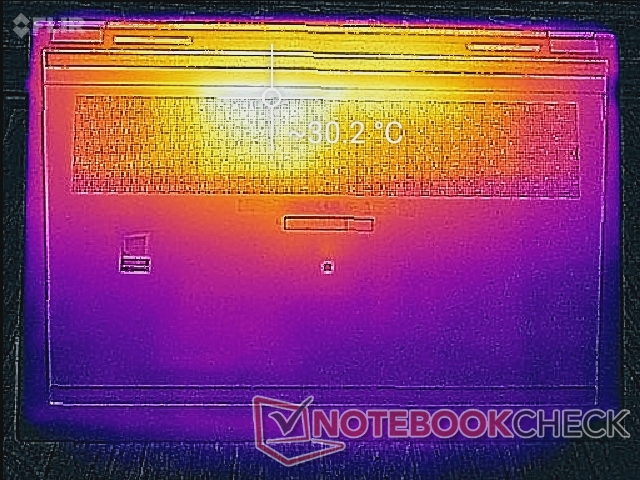
(-) A temperatura máxima no lado superior é 48.8 °C / 120 F, em comparação com a média de 38.2 °C / 101 F , variando de 22.2 a 69.8 °C para a classe Workstation.
(-) A parte inferior aquece até um máximo de 62.6 °C / 145 F, em comparação com a média de 41.1 °C / 106 F
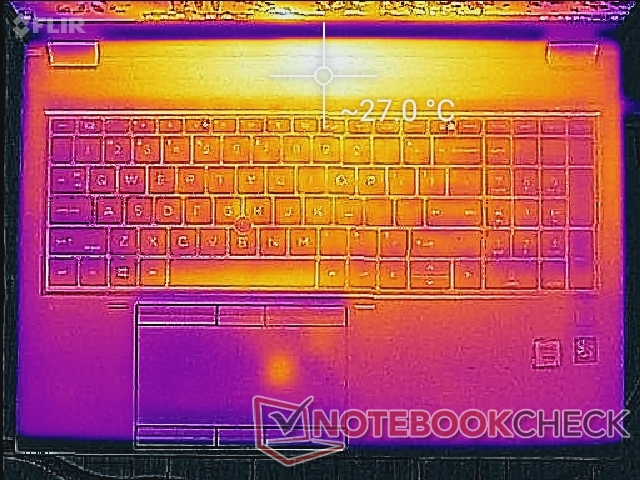
(+) Em uso inativo, a temperatura média para o lado superior é 24.5 °C / 76 F, em comparação com a média do dispositivo de 32 °C / ### class_avg_f### F.
(±) Jogando The Witcher 3, a temperatura média para o lado superior é 33.9 °C / 93 F, em comparação com a média do dispositivo de 32 °C / ## #class_avg_f### F.
(+) Os apoios para as mãos e o touchpad estão atingindo a temperatura máxima da pele (33 °C / 91.4 F) e, portanto, não estão quentes.
(-) A temperatura média da área do apoio para as mãos de dispositivos semelhantes foi 27.8 °C / 82 F (-5.2 °C / -9.4 F).
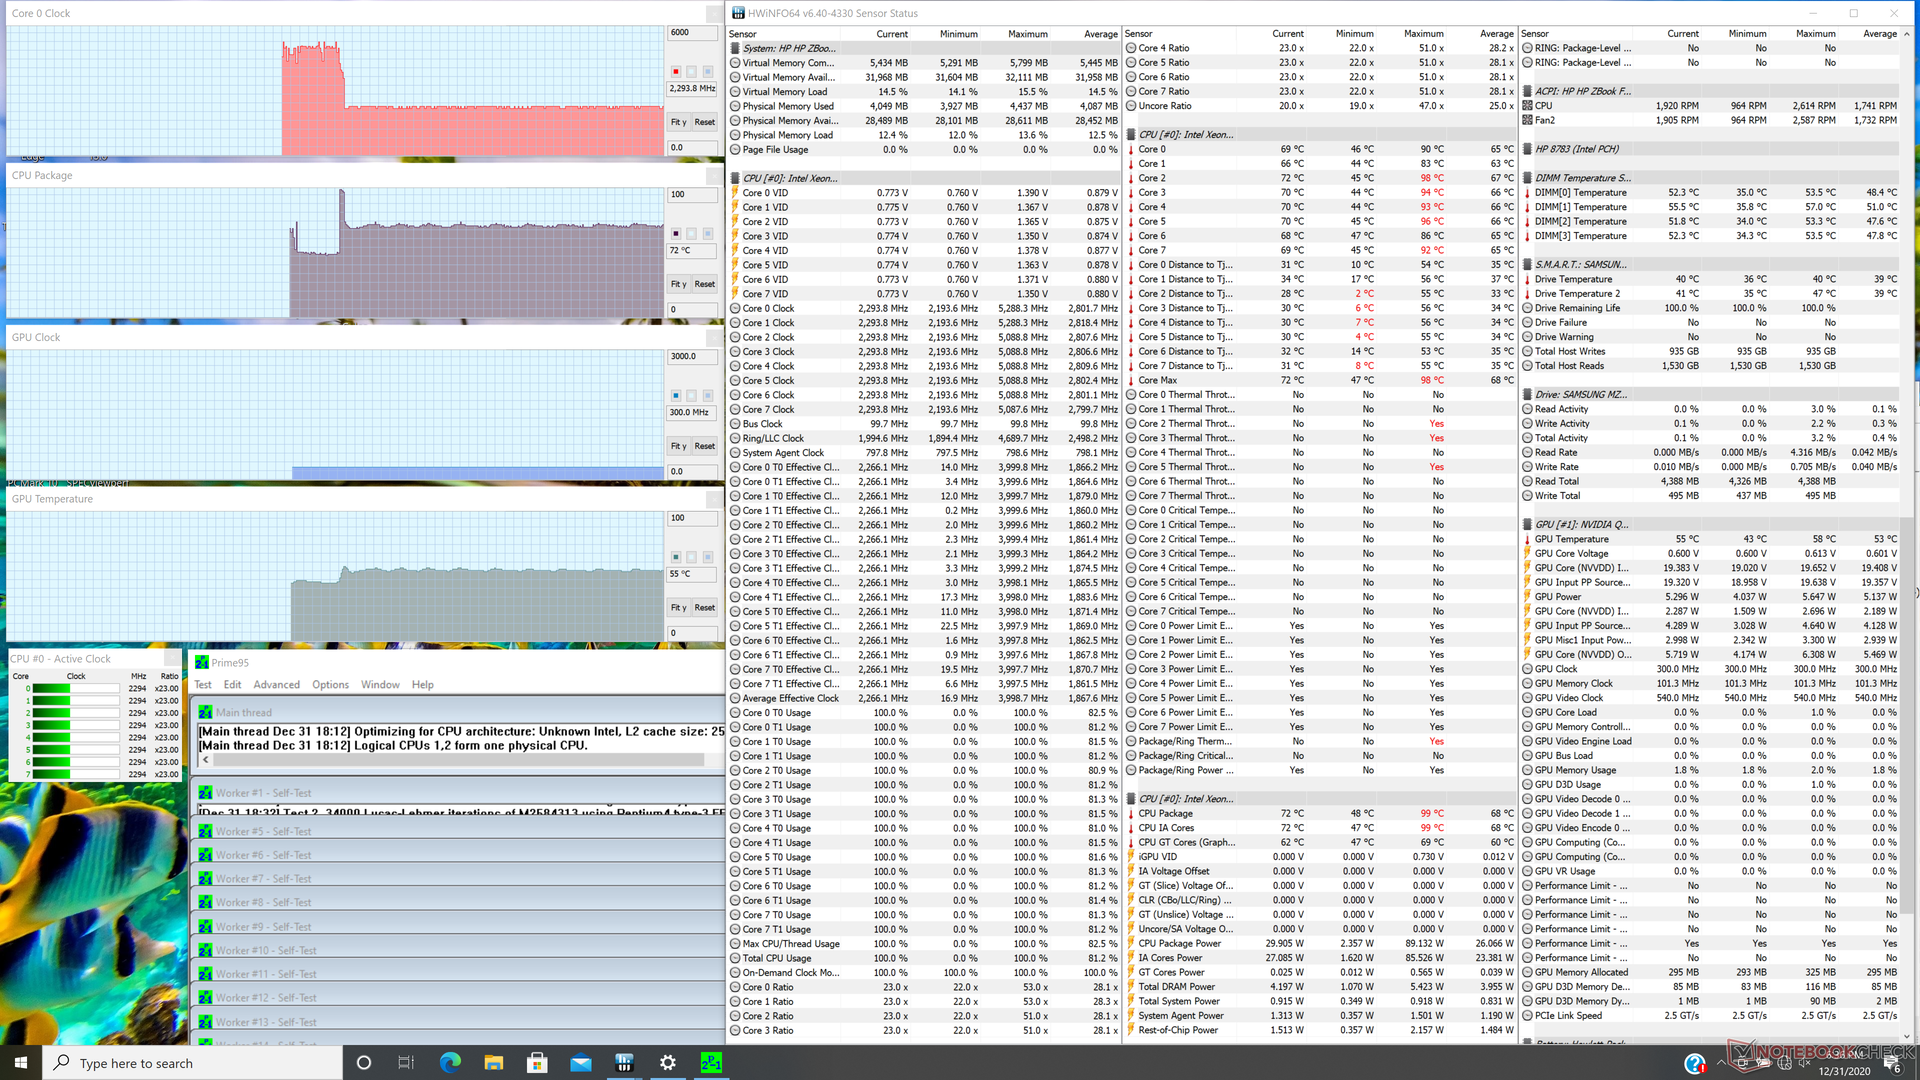
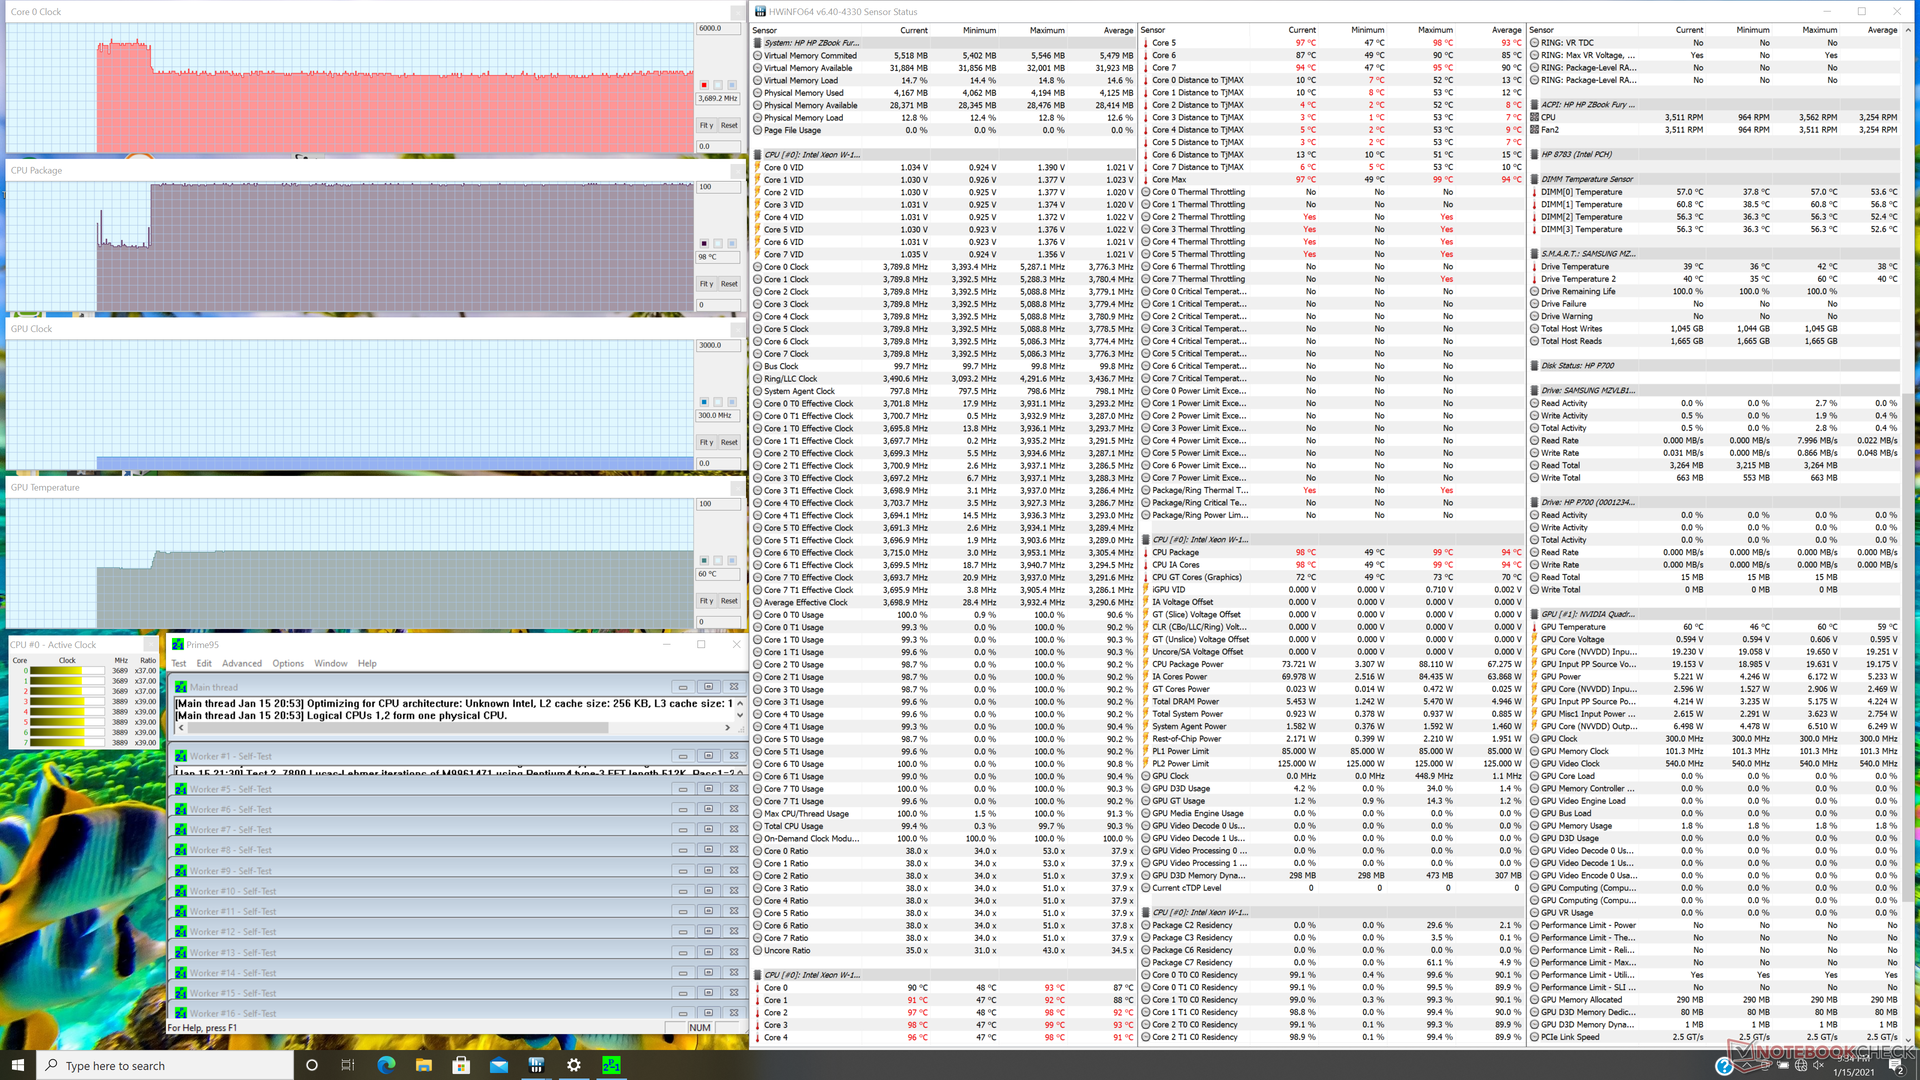
Teste de estresse
Enfatizamos o sistema com cargas sintéticas para identificar qualquer problema potencial de estrangulamento ou estabilidade. Ao executar Prime95, a CPU aumentaria até a faixa de 3,6 a 4 GHz por apenas alguns segundos e a uma temperatura central de 99 C. Em seguida, cairia imediatamente para apenas 2,3 GHz para uma temperatura central muito mais fria de 72 C. Após atualizar nossa BIOS, entretanto, a CPU se estabilizaria em torno de 3,6 GHz e 98 C para um desempenho dramaticamente mais rápido, embora ao custo de temperaturas centrais muito mais quentes. Os resultados gerais após a atualização são semelhantes ao que observamos no site Precision 7550.
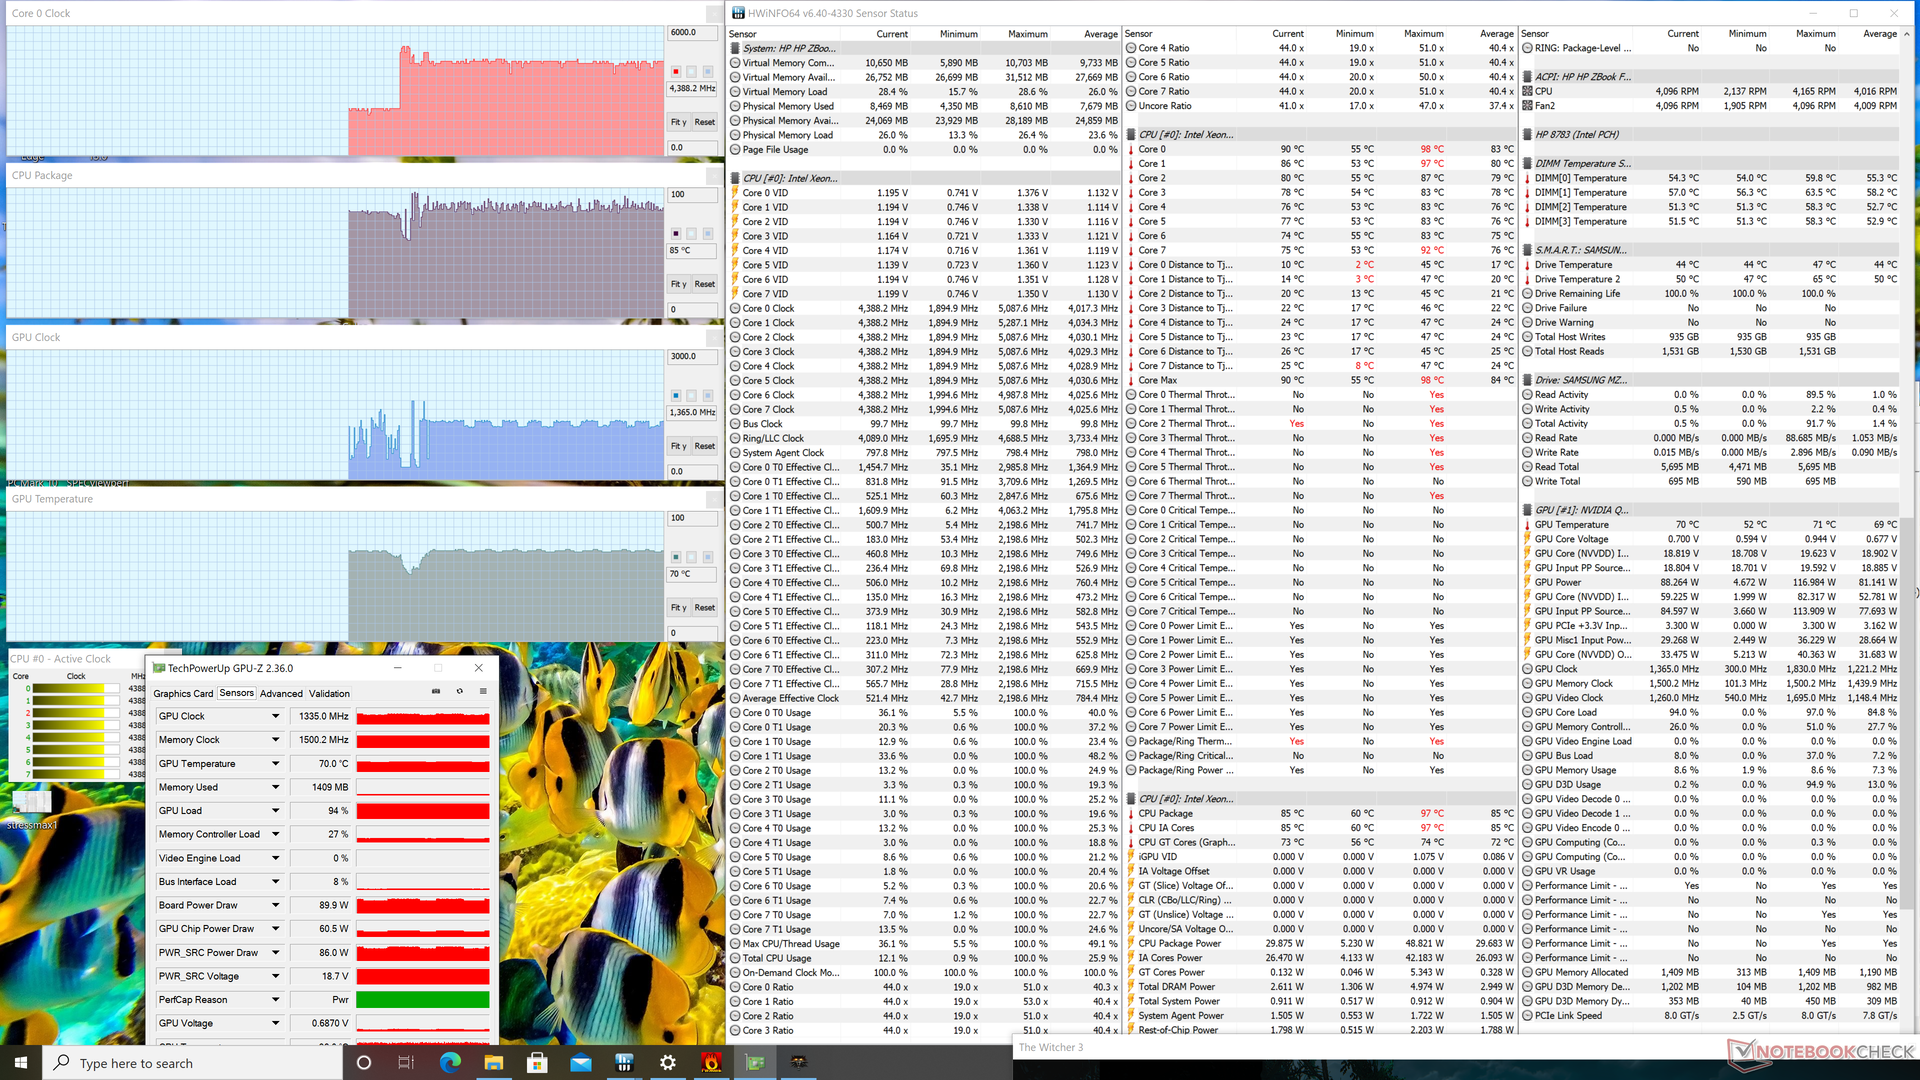
A execução em bateria afeta o desempenho gráfico. Um Fire Strike executado com baterias resultaria em pontuações de Física e Gráficos de 15724 e 9428 pontos, respectivamente, em comparação com 15118 e 19759 pontos quando em rede elétrica.
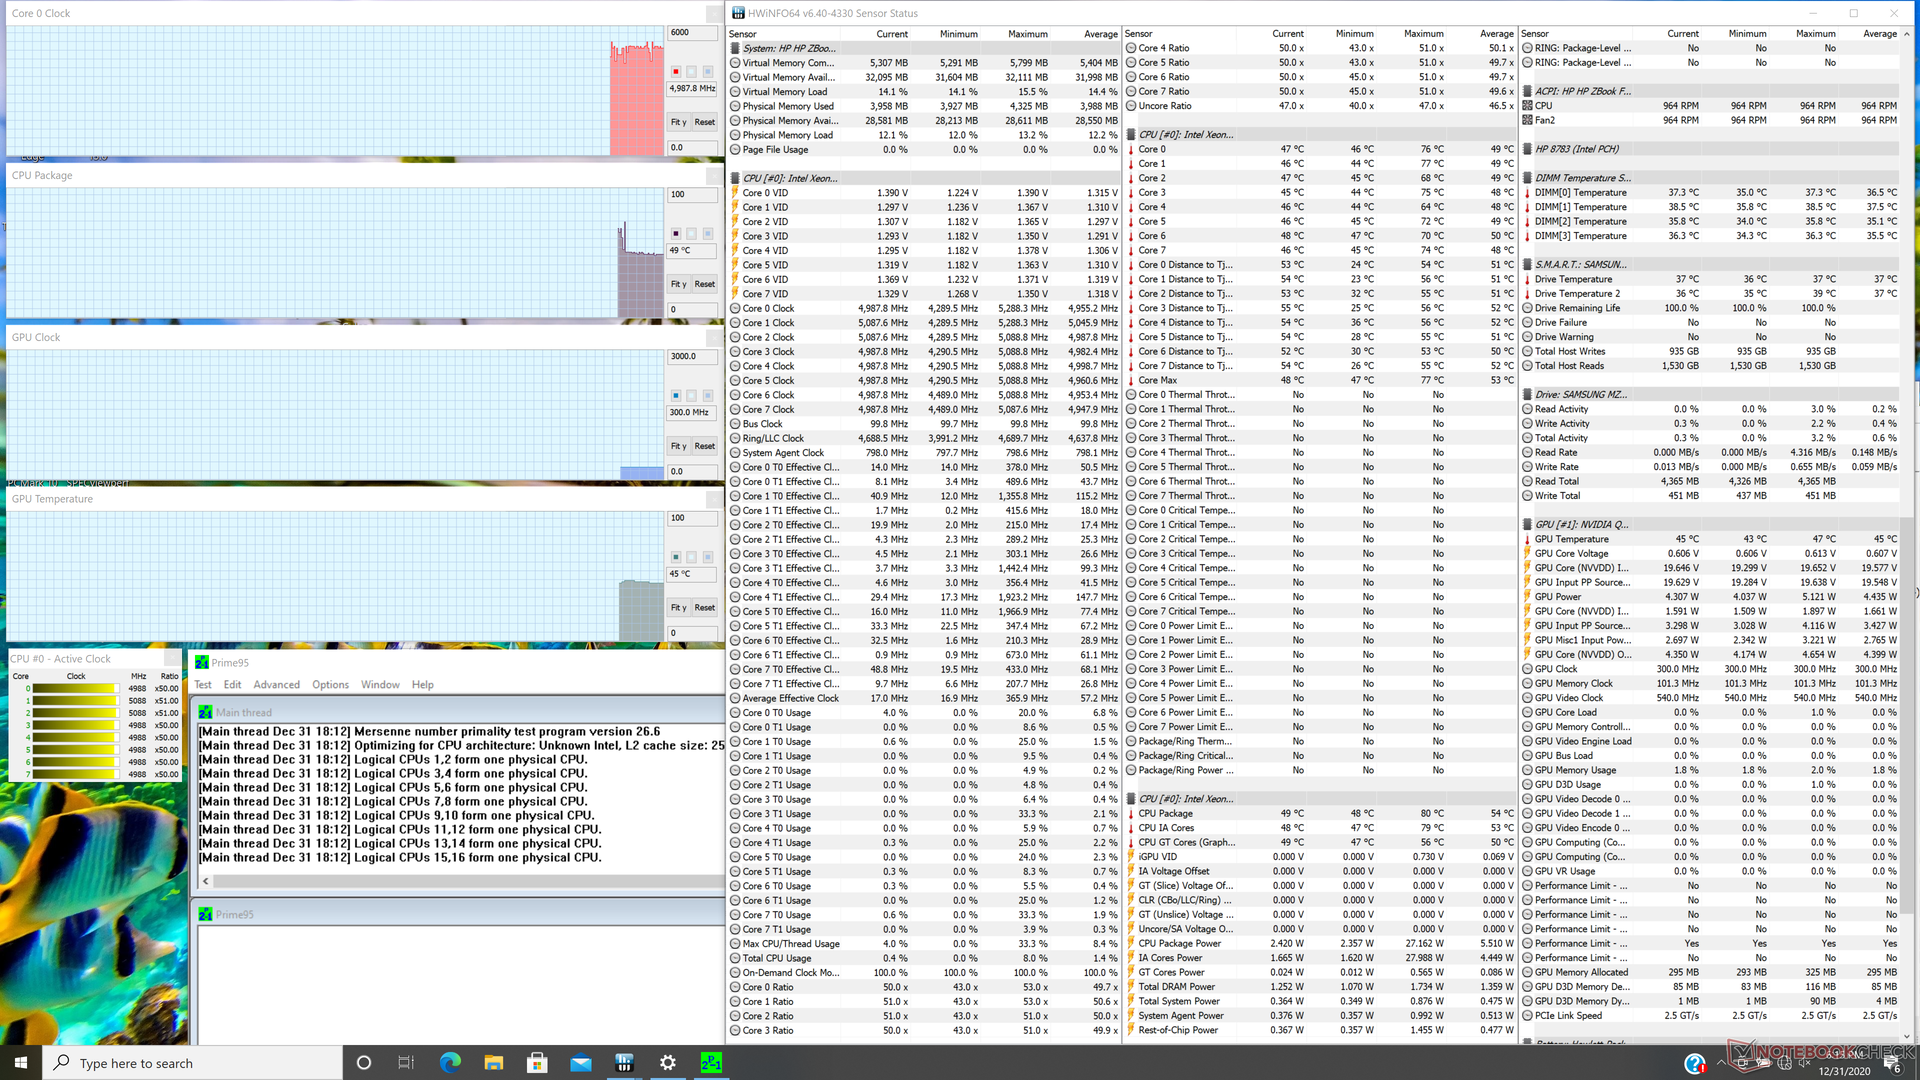
| RelógioCPU (GHz) | RelógioGPU (MHz) | Temperaturamédiada CPU (°C) | Temperaturamédiada GPU (°C) | |
| System Idle | -- | --48 | 45 | |
| Prime95 Stress | 2.2 - 2.3 | -72 | 55 | |
| Prime95 Stress (BIOS 1.04.01) | 3.5 - 3.6 | -98 | ||
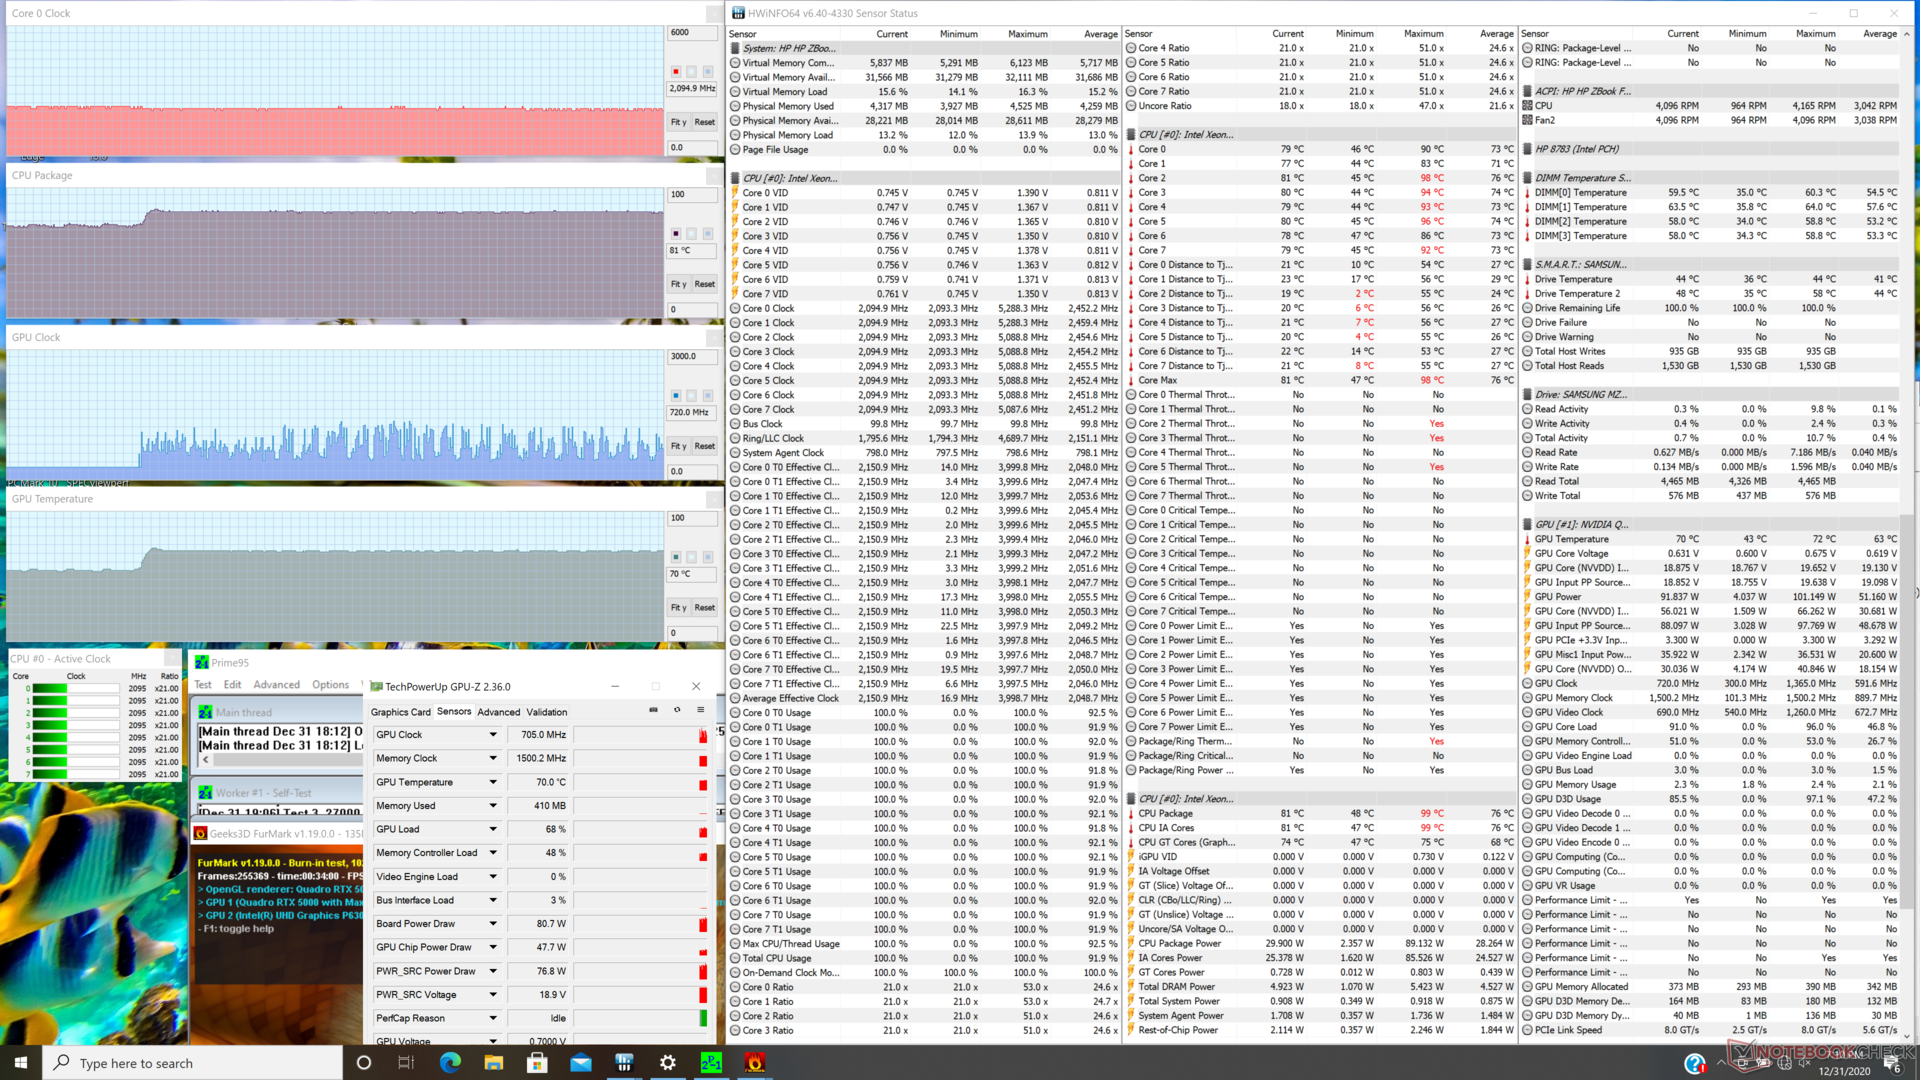
| Prime95 + FurMark Stress | 2.0 - 2.1 | ~510 - 1575 | 81 | 70 |
| Prime95 + FurMark Stress (BIOS 1.04.01) | 2.9 - 3.5 | ~510 - 1575 | 88 - 98 | 71 |
| Witcher 3 Stress | ~4.4 | 1230 - 1380 | 85 | 70 |
Oradores

HP ZBook Fury 15 G7 análise de áudio
(±) | o volume do alto-falante é médio, mas bom (###valor### dB)
Graves 100 - 315Hz
(±) | graves reduzidos - em média 8% menor que a mediana
(±) | a linearidade dos graves é média (9.5% delta para a frequência anterior)
Médios 400 - 2.000 Hz
(+) | médios equilibrados - apenas 3.3% longe da mediana
(+) | médios são lineares (4.8% delta para frequência anterior)
Altos 2 - 16 kHz
(+) | agudos equilibrados - apenas 2.2% longe da mediana
(+) | os máximos são lineares (3.5% delta da frequência anterior)
Geral 100 - 16.000 Hz
(+) | o som geral é linear (10.1% diferença em relação à mediana)
Comparado com a mesma classe
» 6% de todos os dispositivos testados nesta classe foram melhores, 4% semelhantes, 90% piores
» O melhor teve um delta de 7%, a média foi 17%, o pior foi 35%
Comparado com todos os dispositivos testados
» 5% de todos os dispositivos testados foram melhores, 1% semelhantes, 94% piores
» O melhor teve um delta de 4%, a média foi 23%, o pior foi 134%
Apple MacBook 12 (Early 2016) 1.1 GHz análise de áudio
(+) | os alto-falantes podem tocar relativamente alto (###valor### dB)
Graves 100 - 315Hz
(±) | graves reduzidos - em média 11.3% menor que a mediana
(±) | a linearidade dos graves é média (14.2% delta para a frequência anterior)
Médios 400 - 2.000 Hz
(+) | médios equilibrados - apenas 2.4% longe da mediana
(+) | médios são lineares (5.5% delta para frequência anterior)
Altos 2 - 16 kHz
(+) | agudos equilibrados - apenas 2% longe da mediana
(+) | os máximos são lineares (4.5% delta da frequência anterior)
Geral 100 - 16.000 Hz
(+) | o som geral é linear (10.2% diferença em relação à mediana)
Comparado com a mesma classe
» 7% de todos os dispositivos testados nesta classe foram melhores, 2% semelhantes, 91% piores
» O melhor teve um delta de 5%, a média foi 18%, o pior foi 53%
Comparado com todos os dispositivos testados
» 5% de todos os dispositivos testados foram melhores, 1% semelhantes, 94% piores
» O melhor teve um delta de 4%, a média foi 23%, o pior foi 134%
Energy Management
Consumo de energia
A manipulação na área de trabalho exige entre 4 W e 22 W, dependendo do nível de brilho e se a GPU discreta estiver ativa. A diferença entre brilho mínimo e máximo é de até 9 W, já que a tela é mais brilhante do que a maioria dos outros laptops.
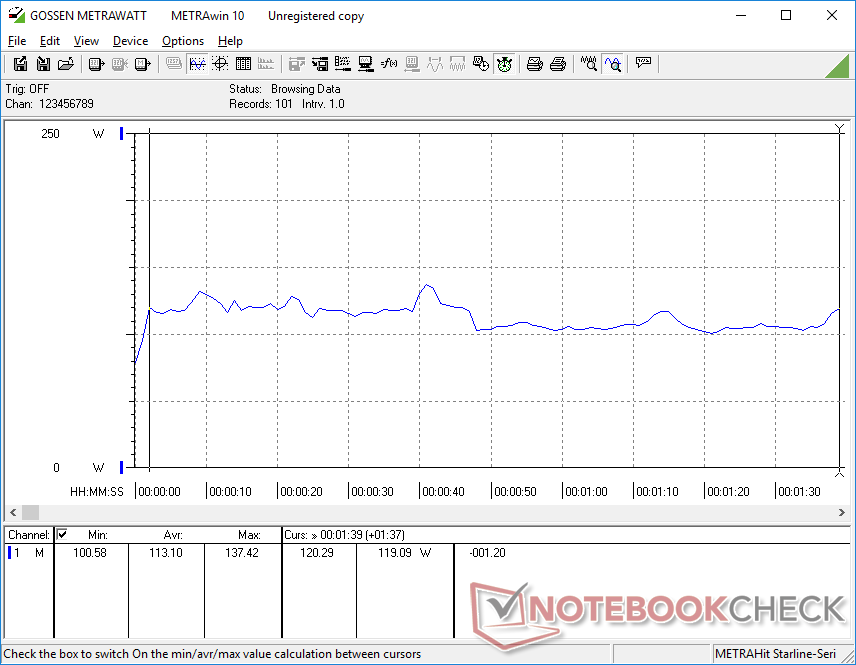
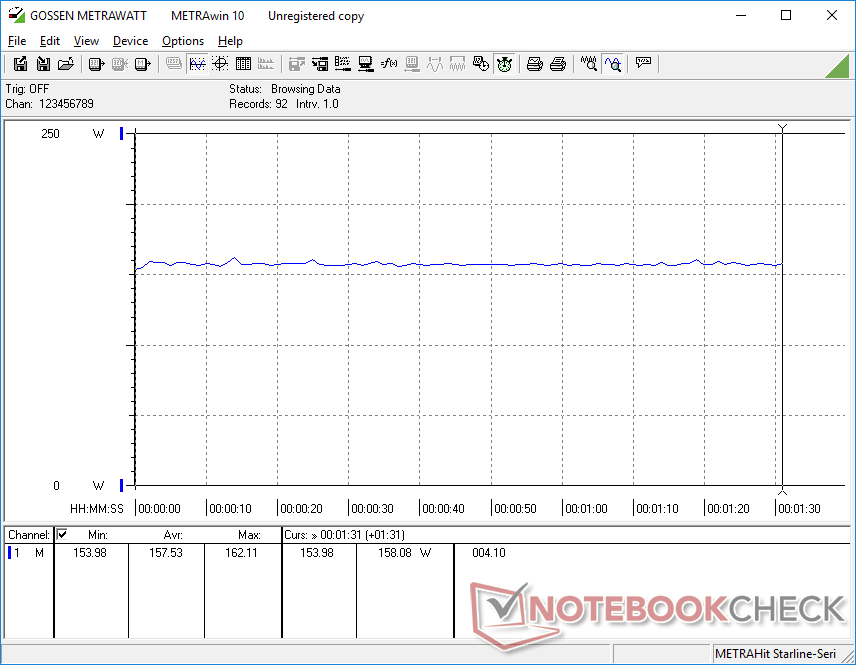
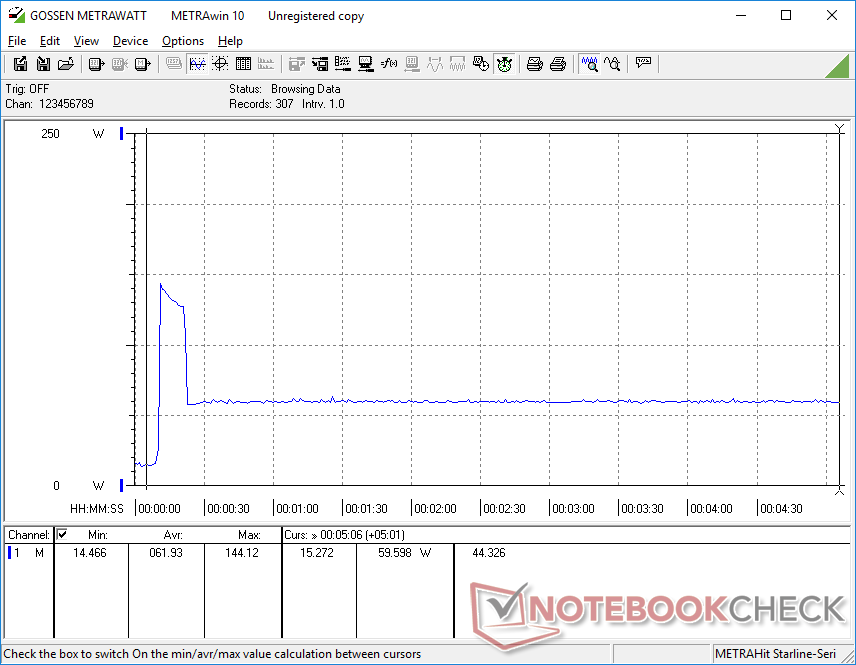
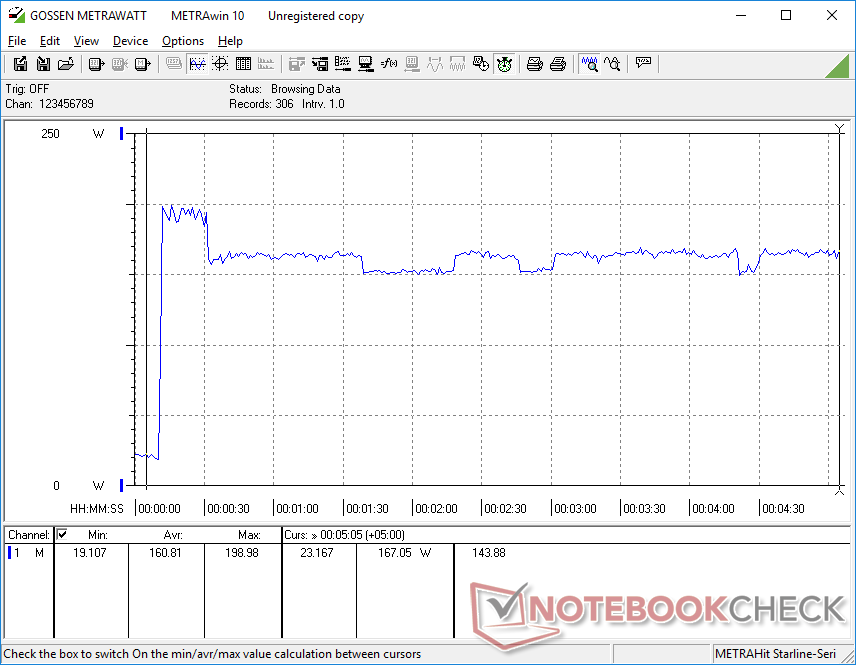
Cargas mais altas equivalentes a jogos podem ser extraídas entre 113 W a 158 W, que é quase exatamente o que medimos no Precision 7550 ou MSI WS66 também, cada um equipado com a mesma CPU e GPU. Entretanto, uma grande diferença pode ser observada ao executar Prime95. O consumo de energia se estabilizaria em apenas 59,6 W em nosso HP, comparado a 135,3 W em nossa Dell. Isto também explicaria o notável déficit de desempenho de nosso HP durante as seções de teste de loop do CineBench e Teste de Estresse acima.
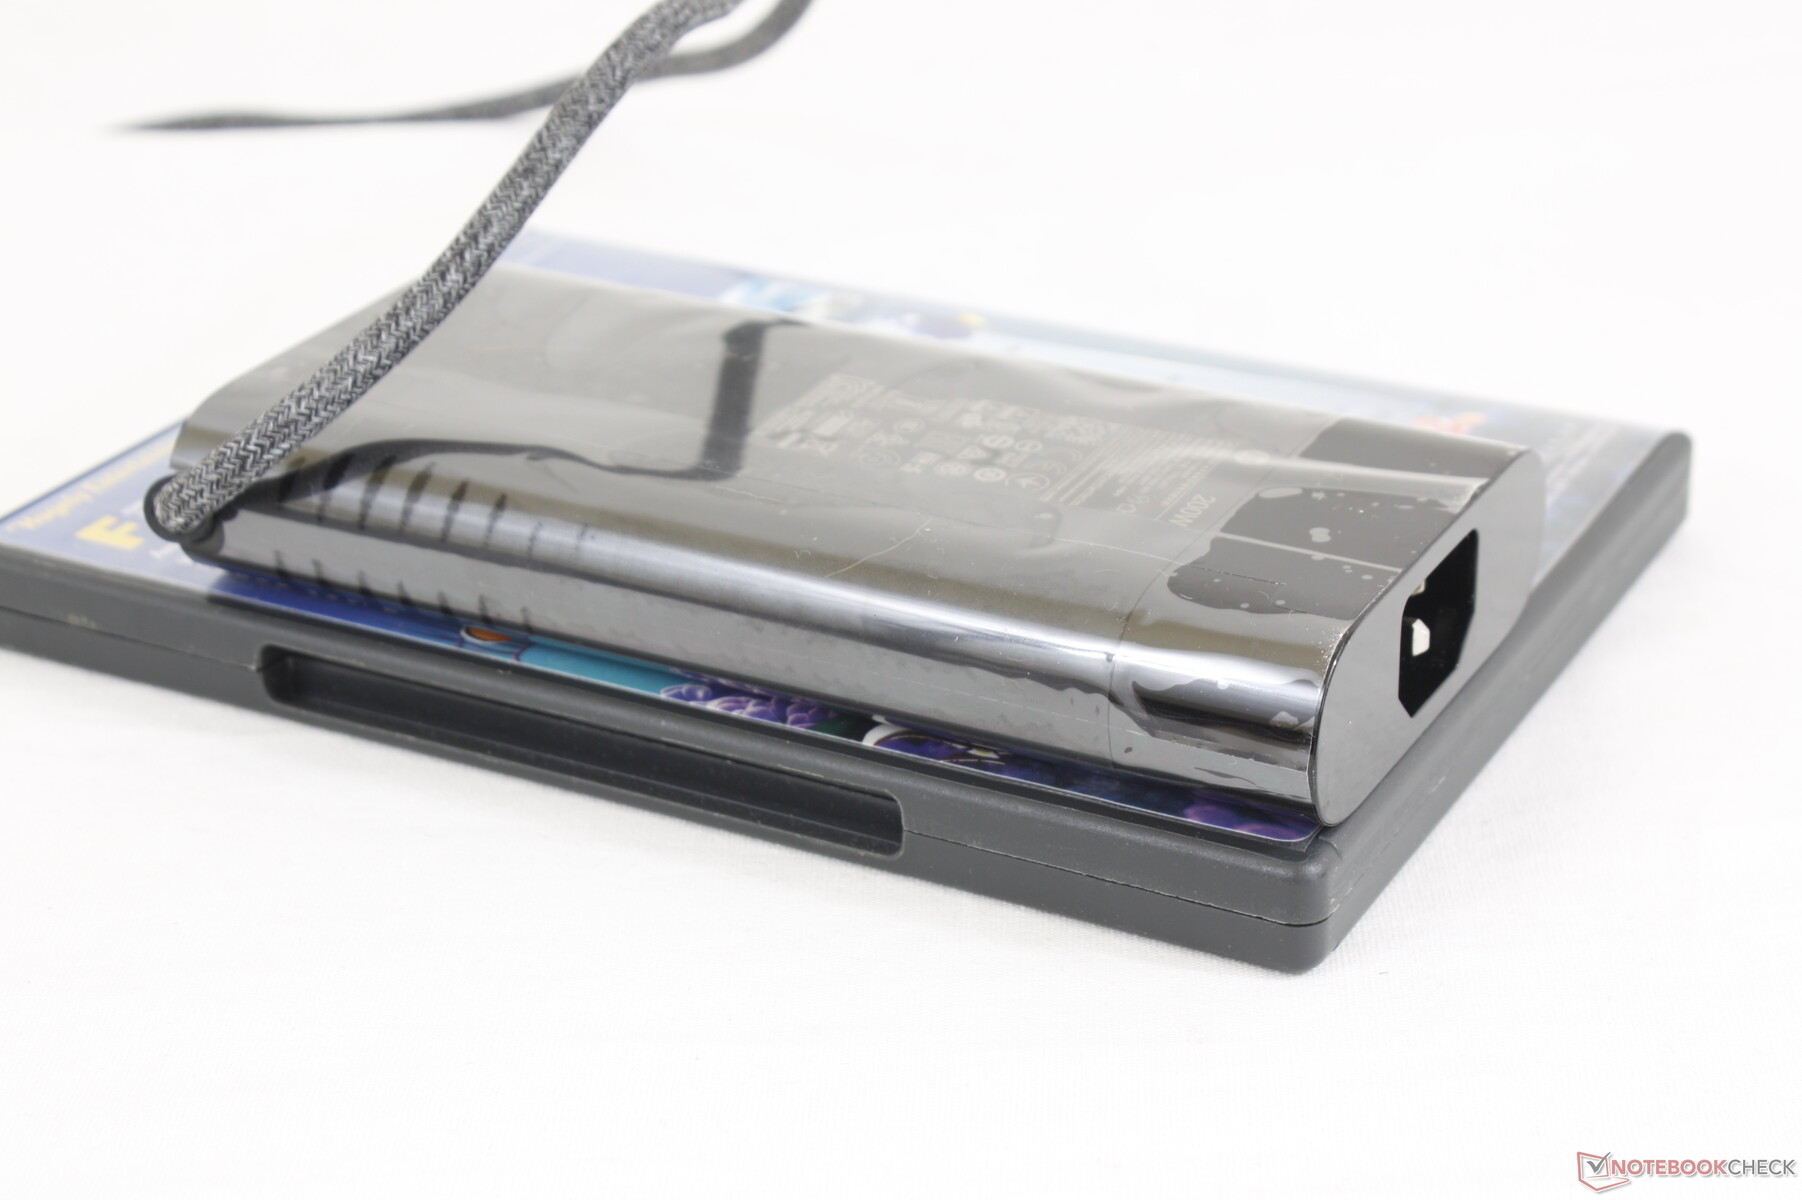
Somos capazes de registrar um consumo máximo de 199 W a partir do adaptador AC de tamanho médio (~15 x 7,2 x 2,4 cm) 200 W. Esta taxa é apenas temporária, como mostram nossos gráficos abaixo, provavelmente devido a razões térmicas. A execução de cargas extremas diminuirá a taxa de carga, mas não drenará a bateria, ao contrário do que acontece em alguns modelos antigos da Dell Precision .
| desligado | |
| Ocioso | |
| Carga |
|
Key:
min: | |
| HP ZBook Fury 15 G7 W-10885M, Quadro RTX 5000 Max-Q, Samsung PM981a MZVLB1T0HBLR, IPS, 3840x2160, 15.6" | Asus ProArt StudioBook Pro 15 W500G5T i7-9750H, Quadro RTX 5000 Max-Q, Samsung SSD PM981 MZVLB1T0HALR, IPS, 3840x2160, 15.6" | MSI WS66 10TMT-207US i9-10980HK, Quadro RTX 5000 Max-Q, WDC PC SN730 SDBPNTY-1T00, IPS, 1920x1080, 15.6" | Dell Precision 7550 W-10885M, Quadro RTX 5000 Max-Q, SK Hynix PC601A NVMe 1TB, IPS, 3840x2160, 15.6" | Razer Blade 15 Studio Edition 2020 i7-10875H, Quadro RTX 5000 Max-Q, Samsung PM981a MZVLB1T0HBLR, OLED, 3840x2160, 15.6" | Lenovo ThinkPad P1 2019-20QT000RGE i7-9850H, Quadro T1000 (Laptop), WDC PC SN720 SDAQNTW-512G, IPS LED, 1920x1080, 15.6" | |
|---|---|---|---|---|---|---|
| Power Consumption | -33% | -56% | -22% | -37% | -31% | |
| Idle Minimum * (Watt) | 4.6 | 11.6 -152% | 13.8 -200% | 8.2 -78% | 13.4 -191% | 13.7 -198% |
| Idle Average * (Watt) | 13.6 | 19 -40% | 18.4 -35% | 16.8 -24% | 18 -32% | 17.5 -29% |
| Idle Maximum * (Watt) | 21.5 | 20.6 4% | 41.5 -93% | 24.4 -13% | 26.1 -21% | 20.9 3% |
| Load Average * (Watt) | 113.1 | 102 10% | 110.5 2% | 131 -16% | 115 -2% | 77.2 32% |
| Witcher 3 ultra * (Watt) | 157.5 | 151.6 4% | 156.6 1% | 145 8% | ||
| Load Maximum * (Watt) | 199 | 178 11% | 227.1 -14% | 201.8 -1% | 165 17% | 123.7 38% |
* ... menor é melhor
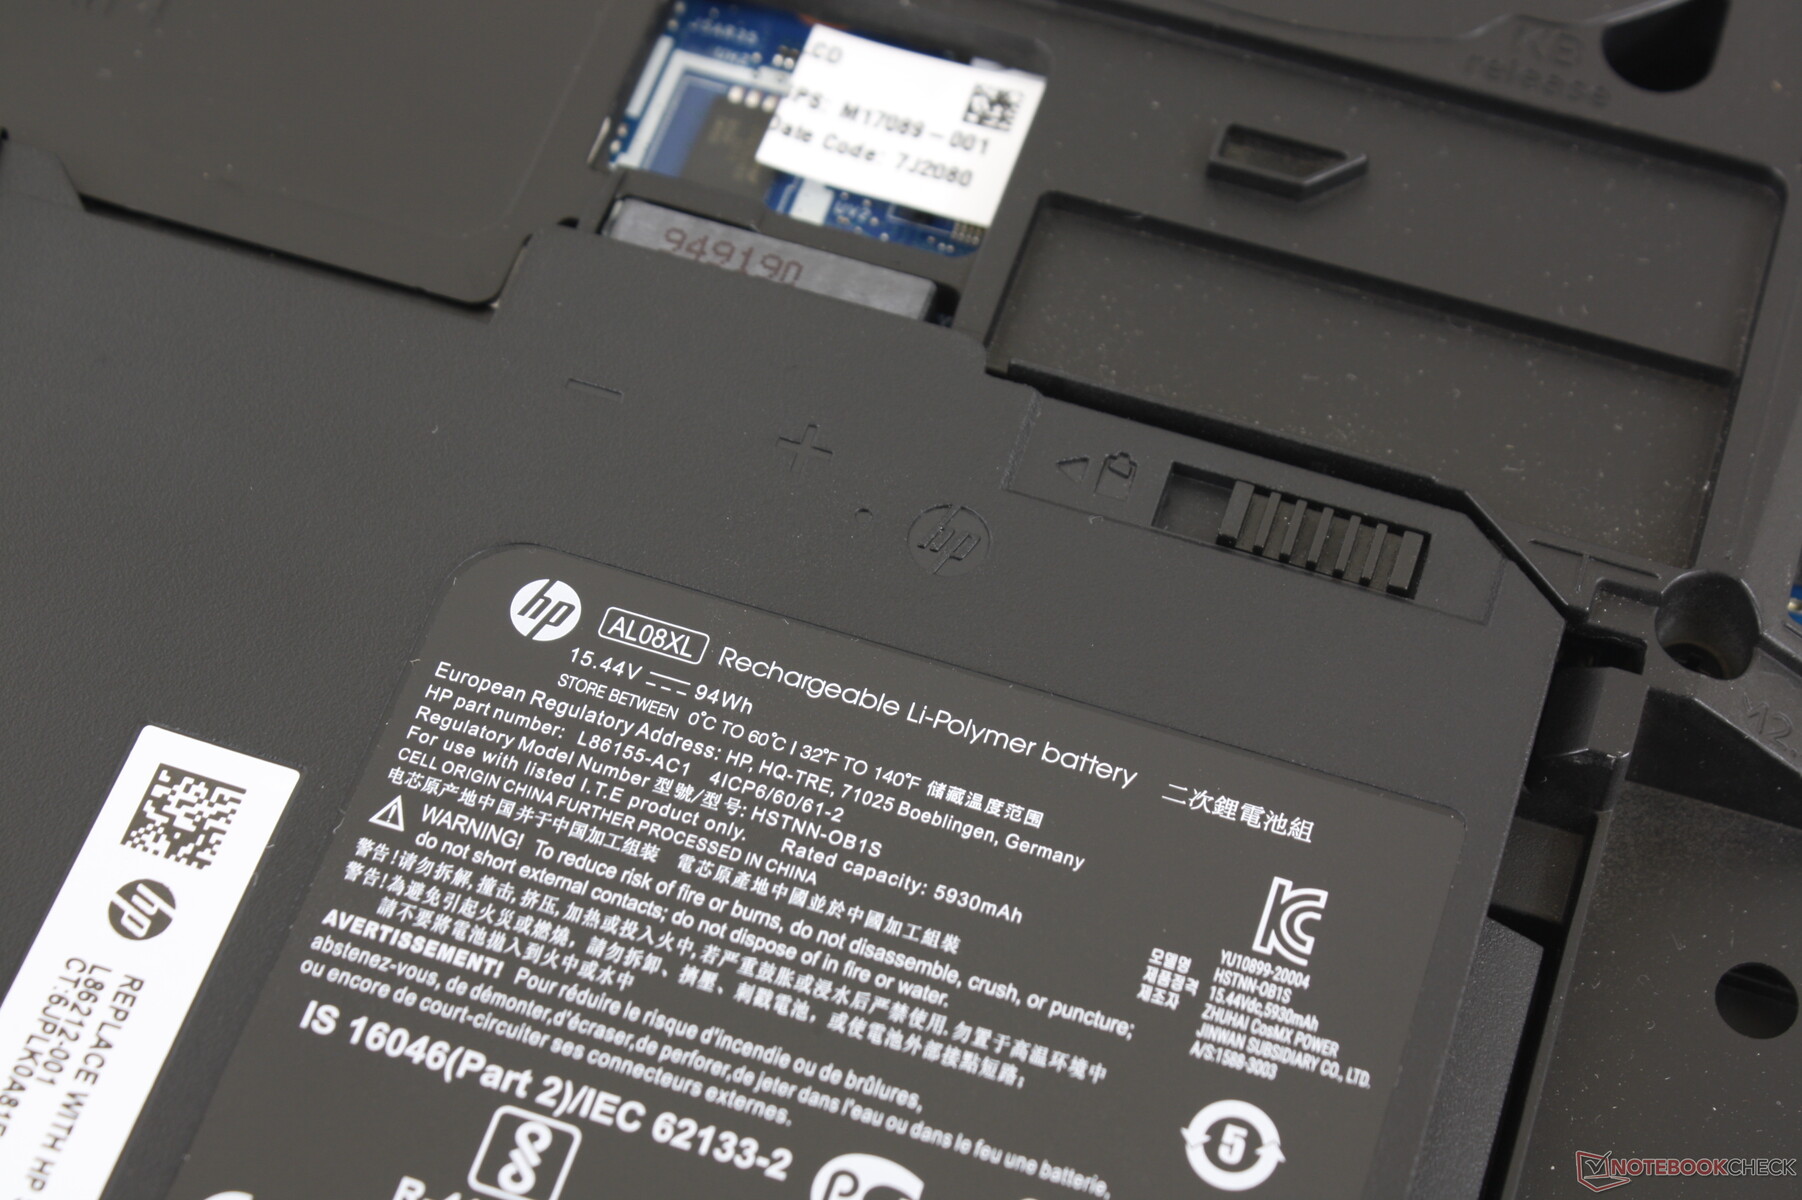
Vida útil da bateria
Esperar 8,5 horas de uso da WLAN no mundo real. A carga de vazio a cheio também é rápida, apesar da grande capacidade da bateria de 94 Wh. O sistema pode ser carregado via USB-C, embora a um ritmo mais lento.
| HP ZBook Fury 15 G7 W-10885M, Quadro RTX 5000 Max-Q, 94 Wh | Asus ProArt StudioBook Pro 15 W500G5T i7-9750H, Quadro RTX 5000 Max-Q, 76 Wh | MSI WS66 10TMT-207US i9-10980HK, Quadro RTX 5000 Max-Q, 99.99 Wh | Dell Precision 7550 W-10885M, Quadro RTX 5000 Max-Q, 95 Wh | Razer Blade 15 Studio Edition 2020 i7-10875H, Quadro RTX 5000 Max-Q, 80 Wh | Lenovo ThinkPad P1 2019-20QT000RGE i7-9850H, Quadro T1000 (Laptop), 80 Wh | |
|---|---|---|---|---|---|---|
| Duração da bateria | -45% | -18% | -12% | -4% | 2% | |
| Reader / Idle (h) | 13.2 | 8.3 -37% | 11.1 -16% | 8.8 -33% | ||
| WiFi v1.3 (h) | 8.6 | 4.7 -45% | 7.8 -9% | 8.9 3% | 5.7 -34% | 8.9 3% |
| Load (h) | 1.3 | 1.2 -8% | 1 -23% | 2 54% | 1.3 0% |
Pro
Contra
Veredicto
O aspecto mais notável do ZBook Fury 15 é sua capacidade de oferecer essencialmente todas as características e opções de desempenho da Dell Precision 7550, mas em um pacote visivelmente mais leve. Isto torna a HP uma boa solução de meio-termo para usuários que desejam uma estação de trabalho móvel sem sacrificar muitas das características auxiliares que modelos mais finos e leves como o Razer Blade Studio, MSI WS66 ou Asus ProArt frequentemente omitem. É também uma das poucas estações de trabalho a incluir opções de painéis de 1000-nit para os cenários ocasionais ao ar livre.
Expansível e confortável com muitas opções de configuração à sua escolha. O ZBook Fury 15 consegue encher muitas características clássicas de estações de trabalho, apesar de seu peso moderado.
A experiência de digitação e trackpad merece elogios por ser uma das mais confortáveis que já experimentamos em uma estação de trabalho móvel. É ótimo que a HP não tenha achado a necessidade de "burlar" o teclado ou o touchpad para se adequar às tendências atuais de laptops ultrafinos ou designs minimalistas. Este é um sistema projetado desde o início para profissionais e não apenas um laptop de jogos lembrado.
Os usuários de energia não vão gostar do fato de que o processador se estabilizará em 98 C quando sob carga total e que a GPU Quadro RTX 5000 é da variedade Max-Q. WAN e certas opções de armazenamento podem ser excluídas dependendo do SKU, o que significa que você não pode simplesmente comprar uma configuração mais barata e depois atualizar você mesmo certos componentes porque os conectores estarão faltando. Dobradiças mais firmes para minimizar os ângulos de ajuste fariam com que o chassi se sentisse ainda melhor.
Preço e disponibilidade
O ZBook Fury 15 vem em uma infinidade de configurações que são todas muito diferentes das que revisamos. Tanto a Amazon quanto o Walmart têm SKU de última geração por cerca de US$1999 dólares na época ou por escrito.
Notebookcheck pode receber uma comissão por compras feitas através de nossos links de afiliados
HP ZBook Fury 15 G7
- 01/16/2021 v7 (old)
Allen Ngo
Price comparison

