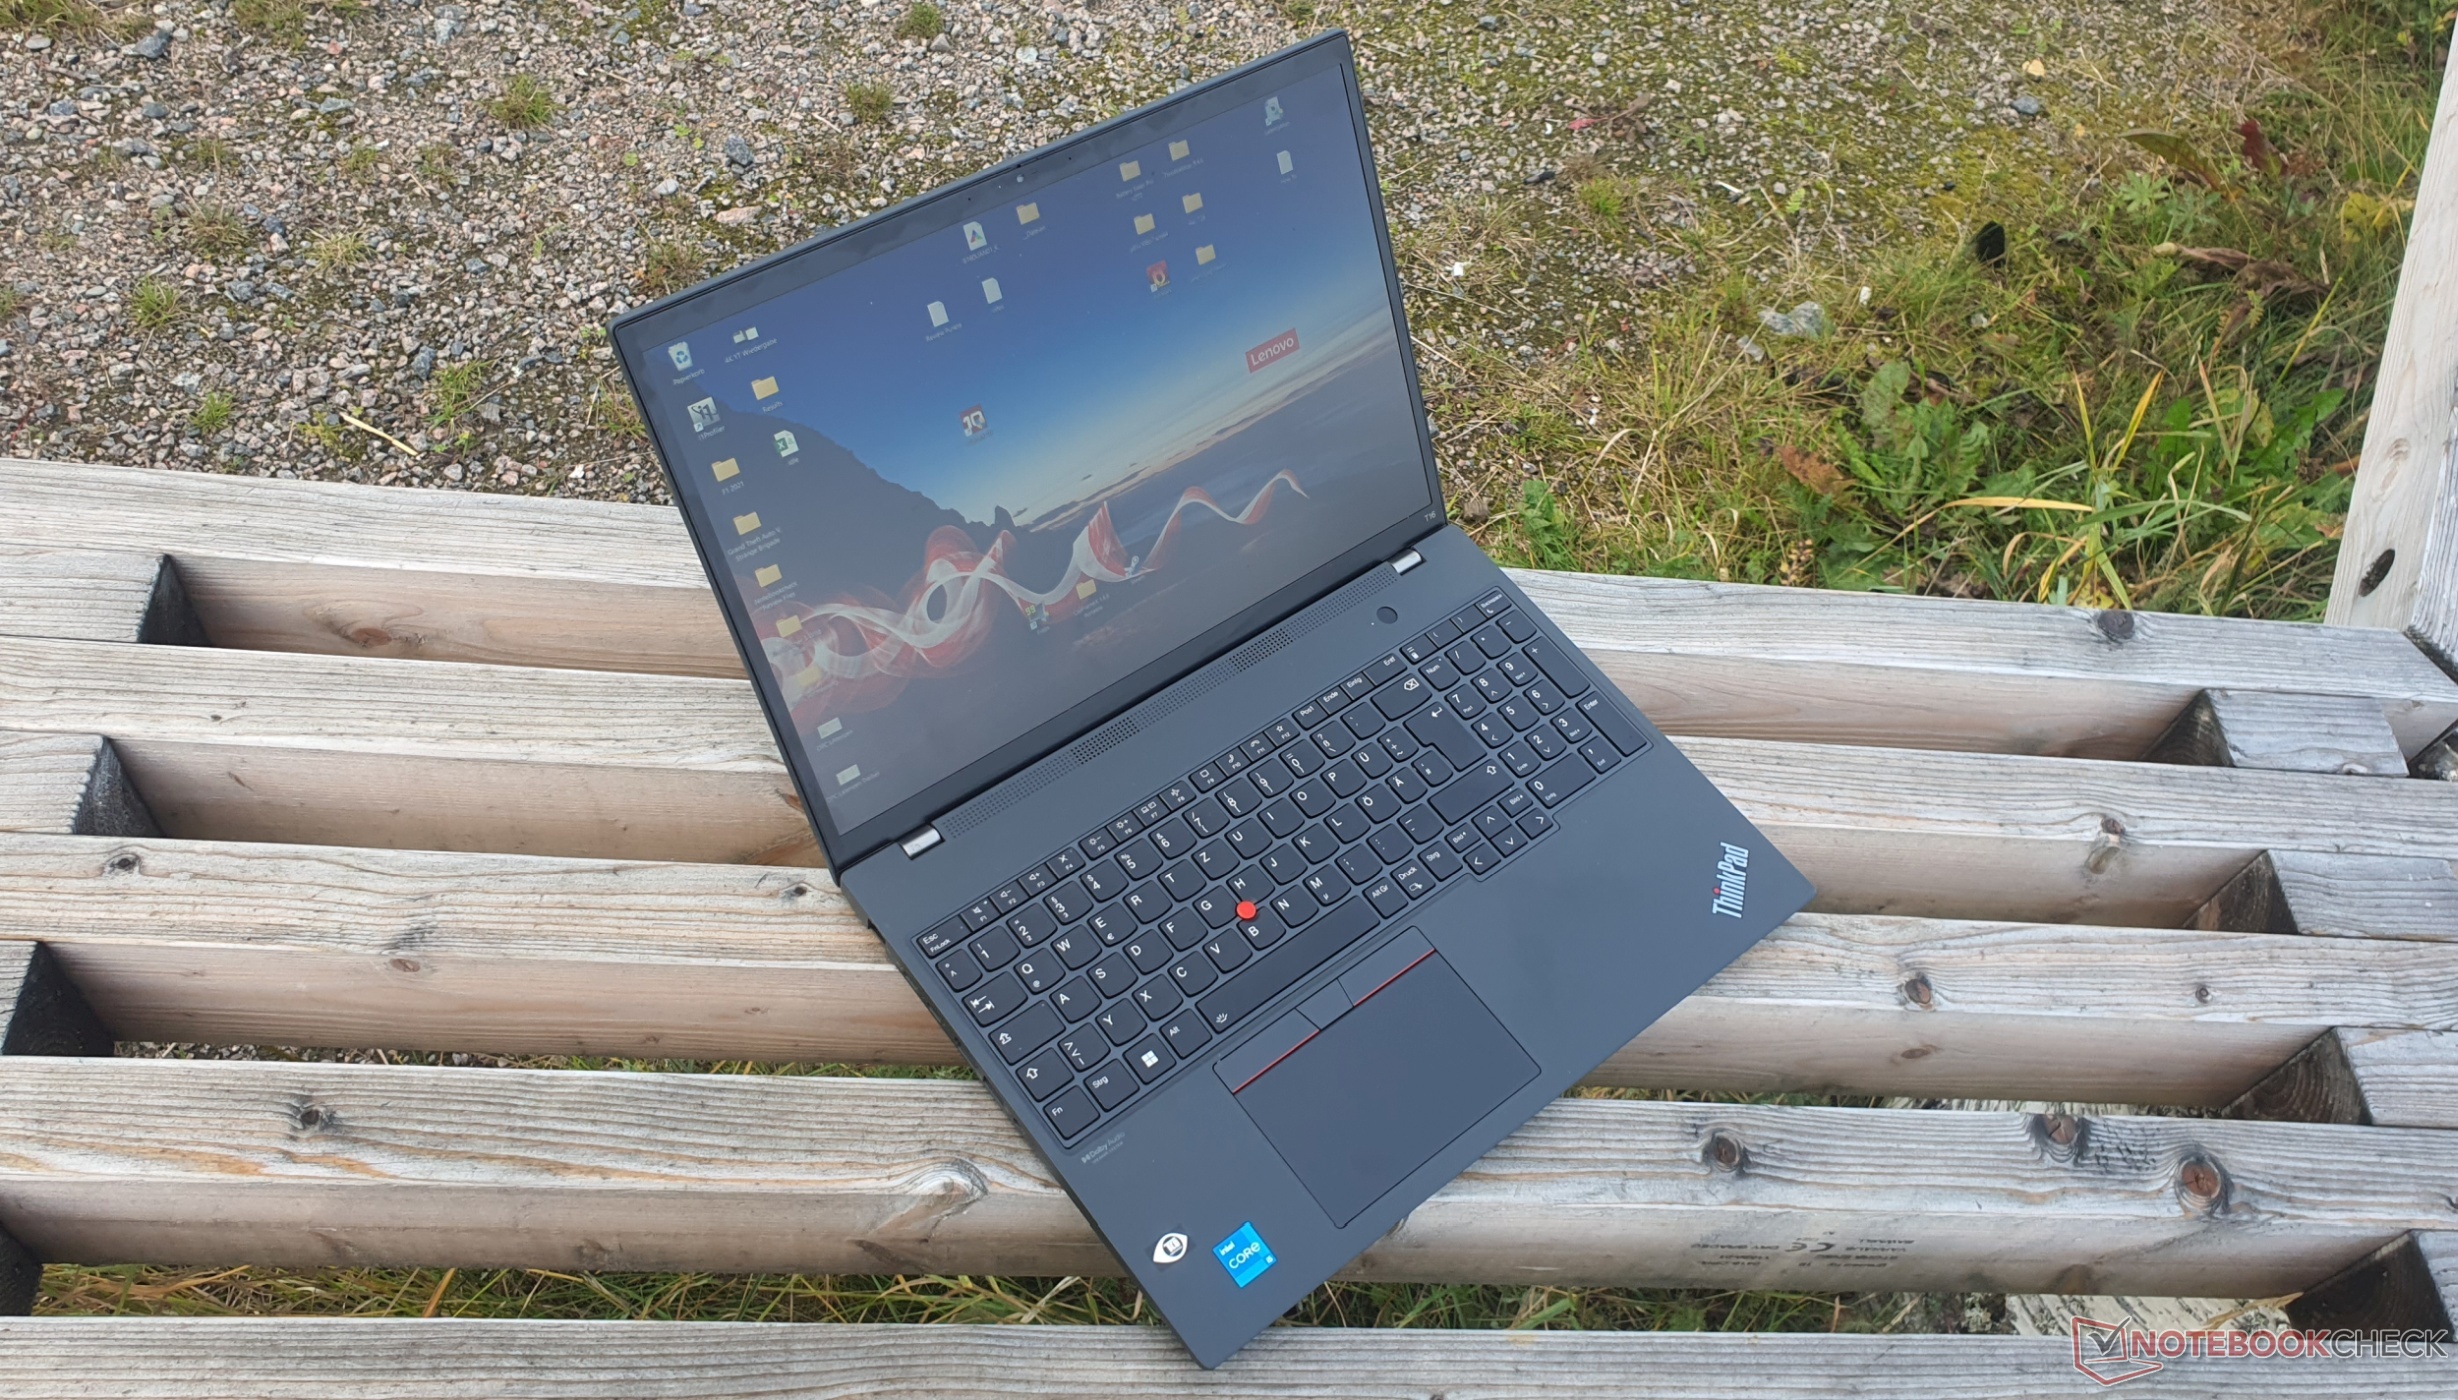
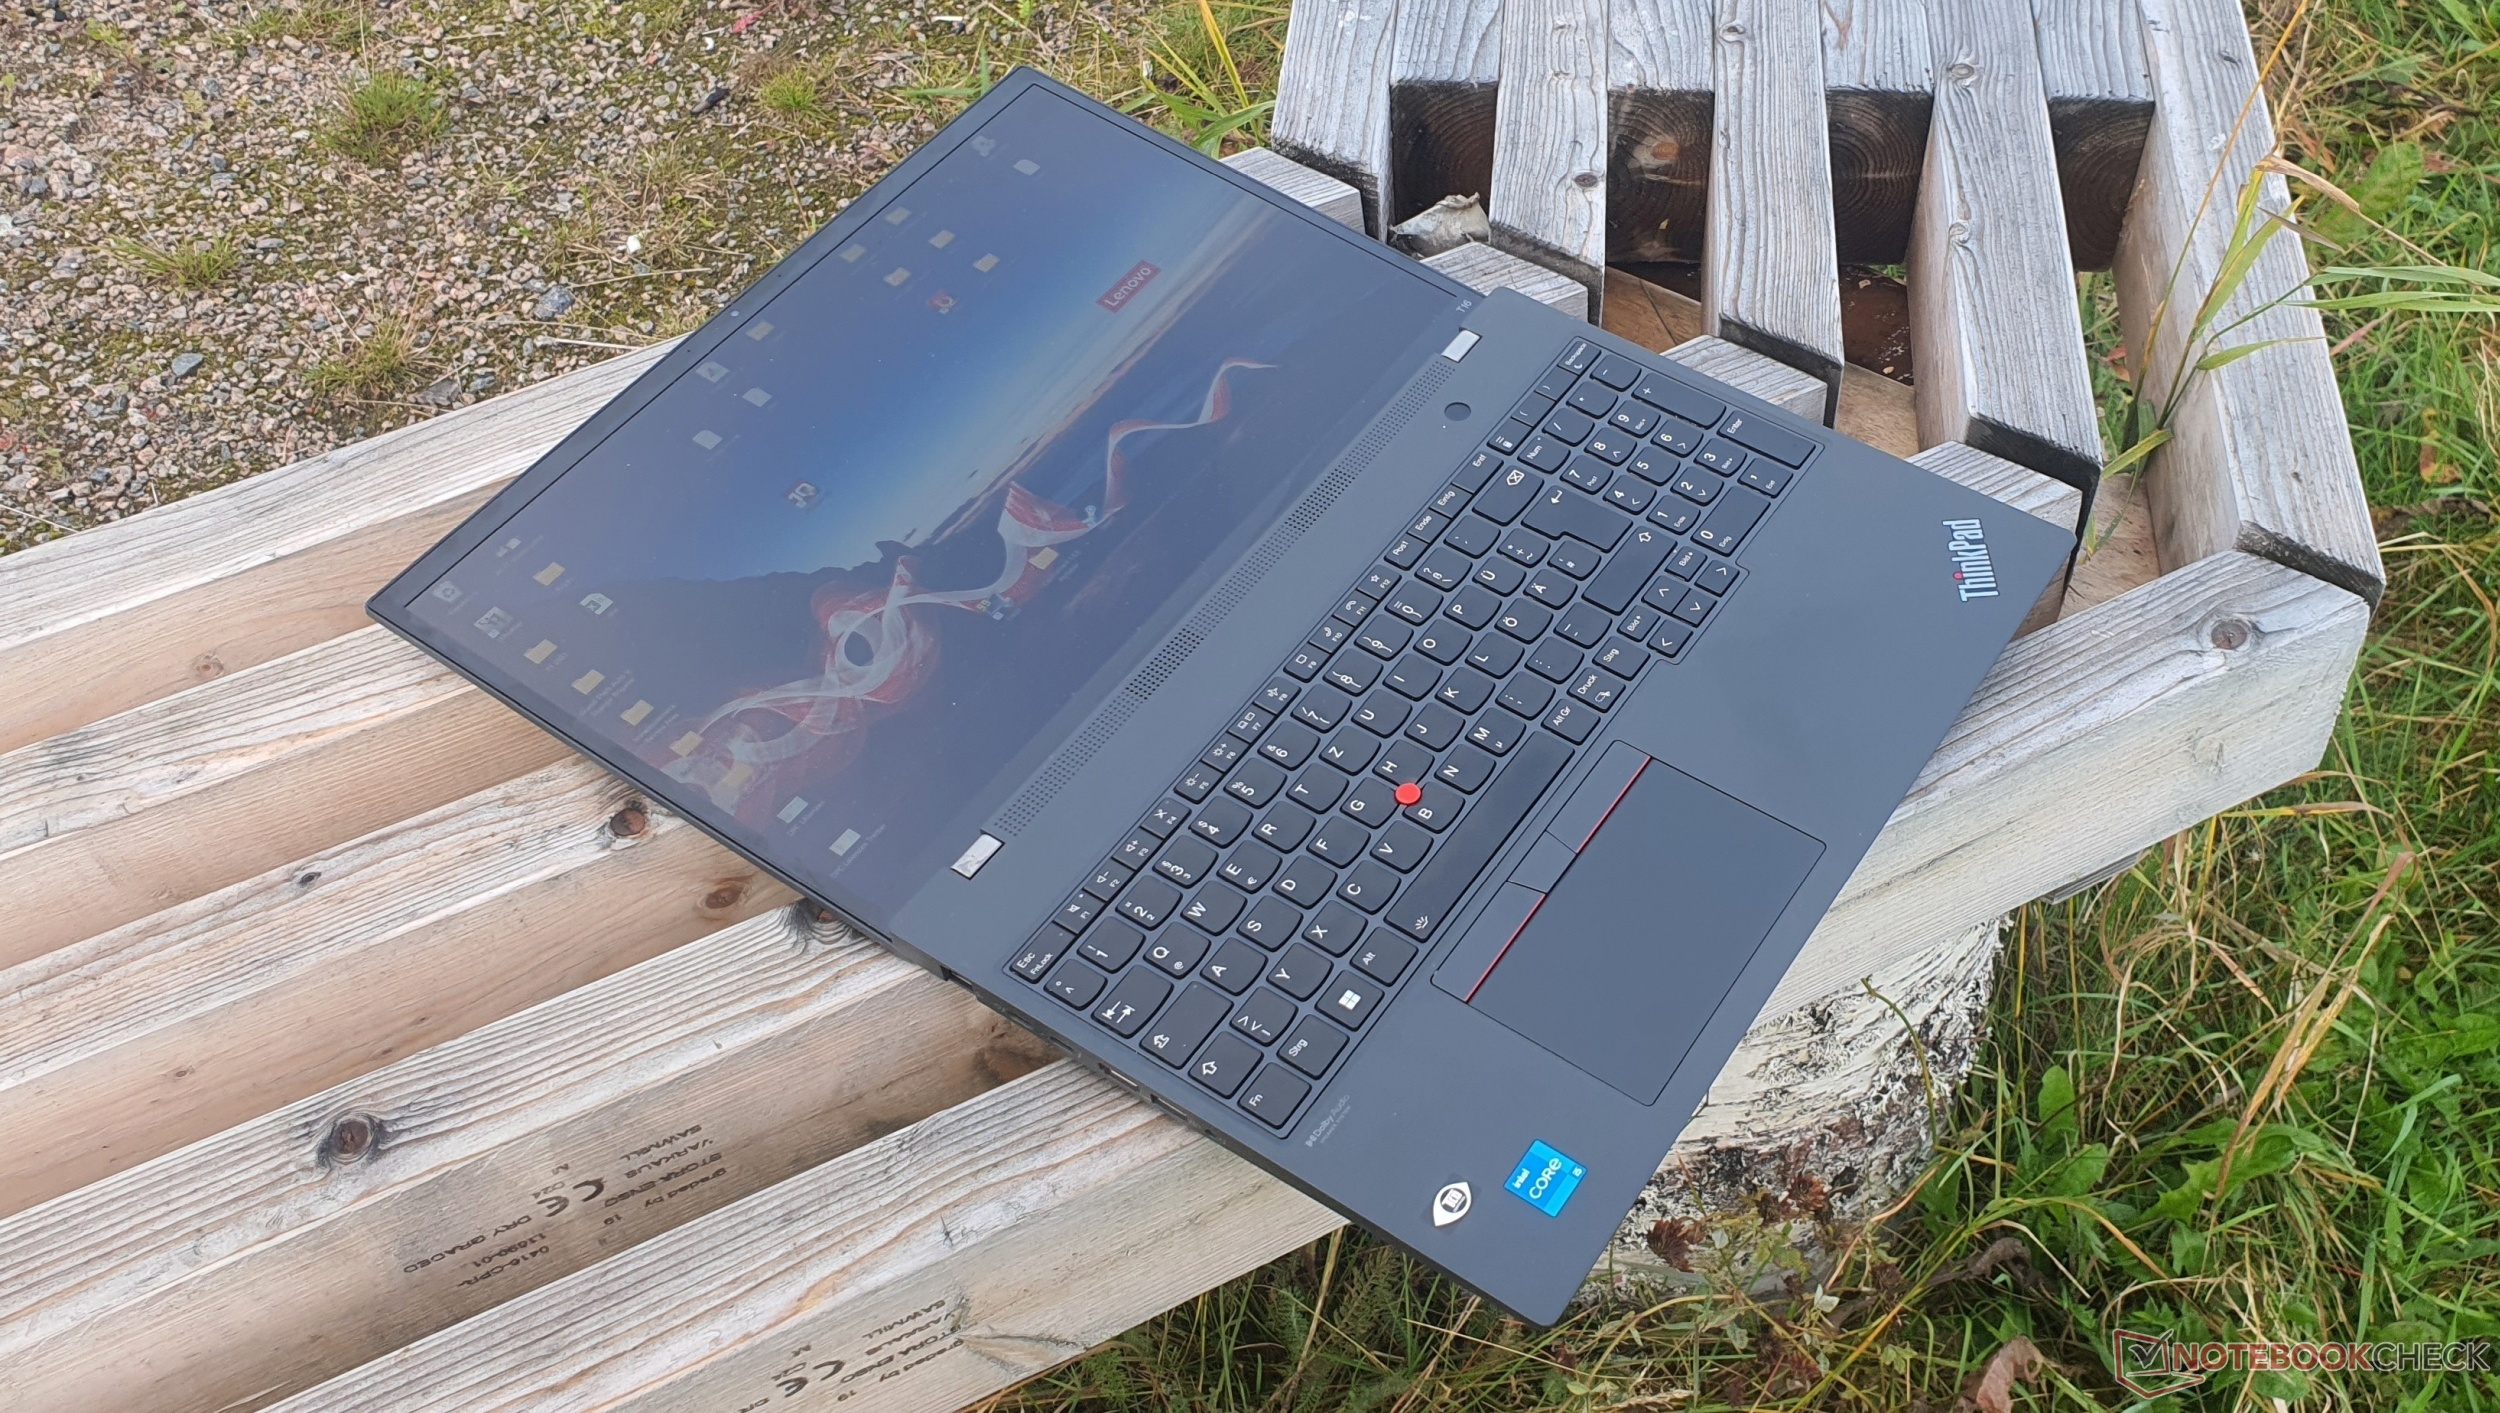
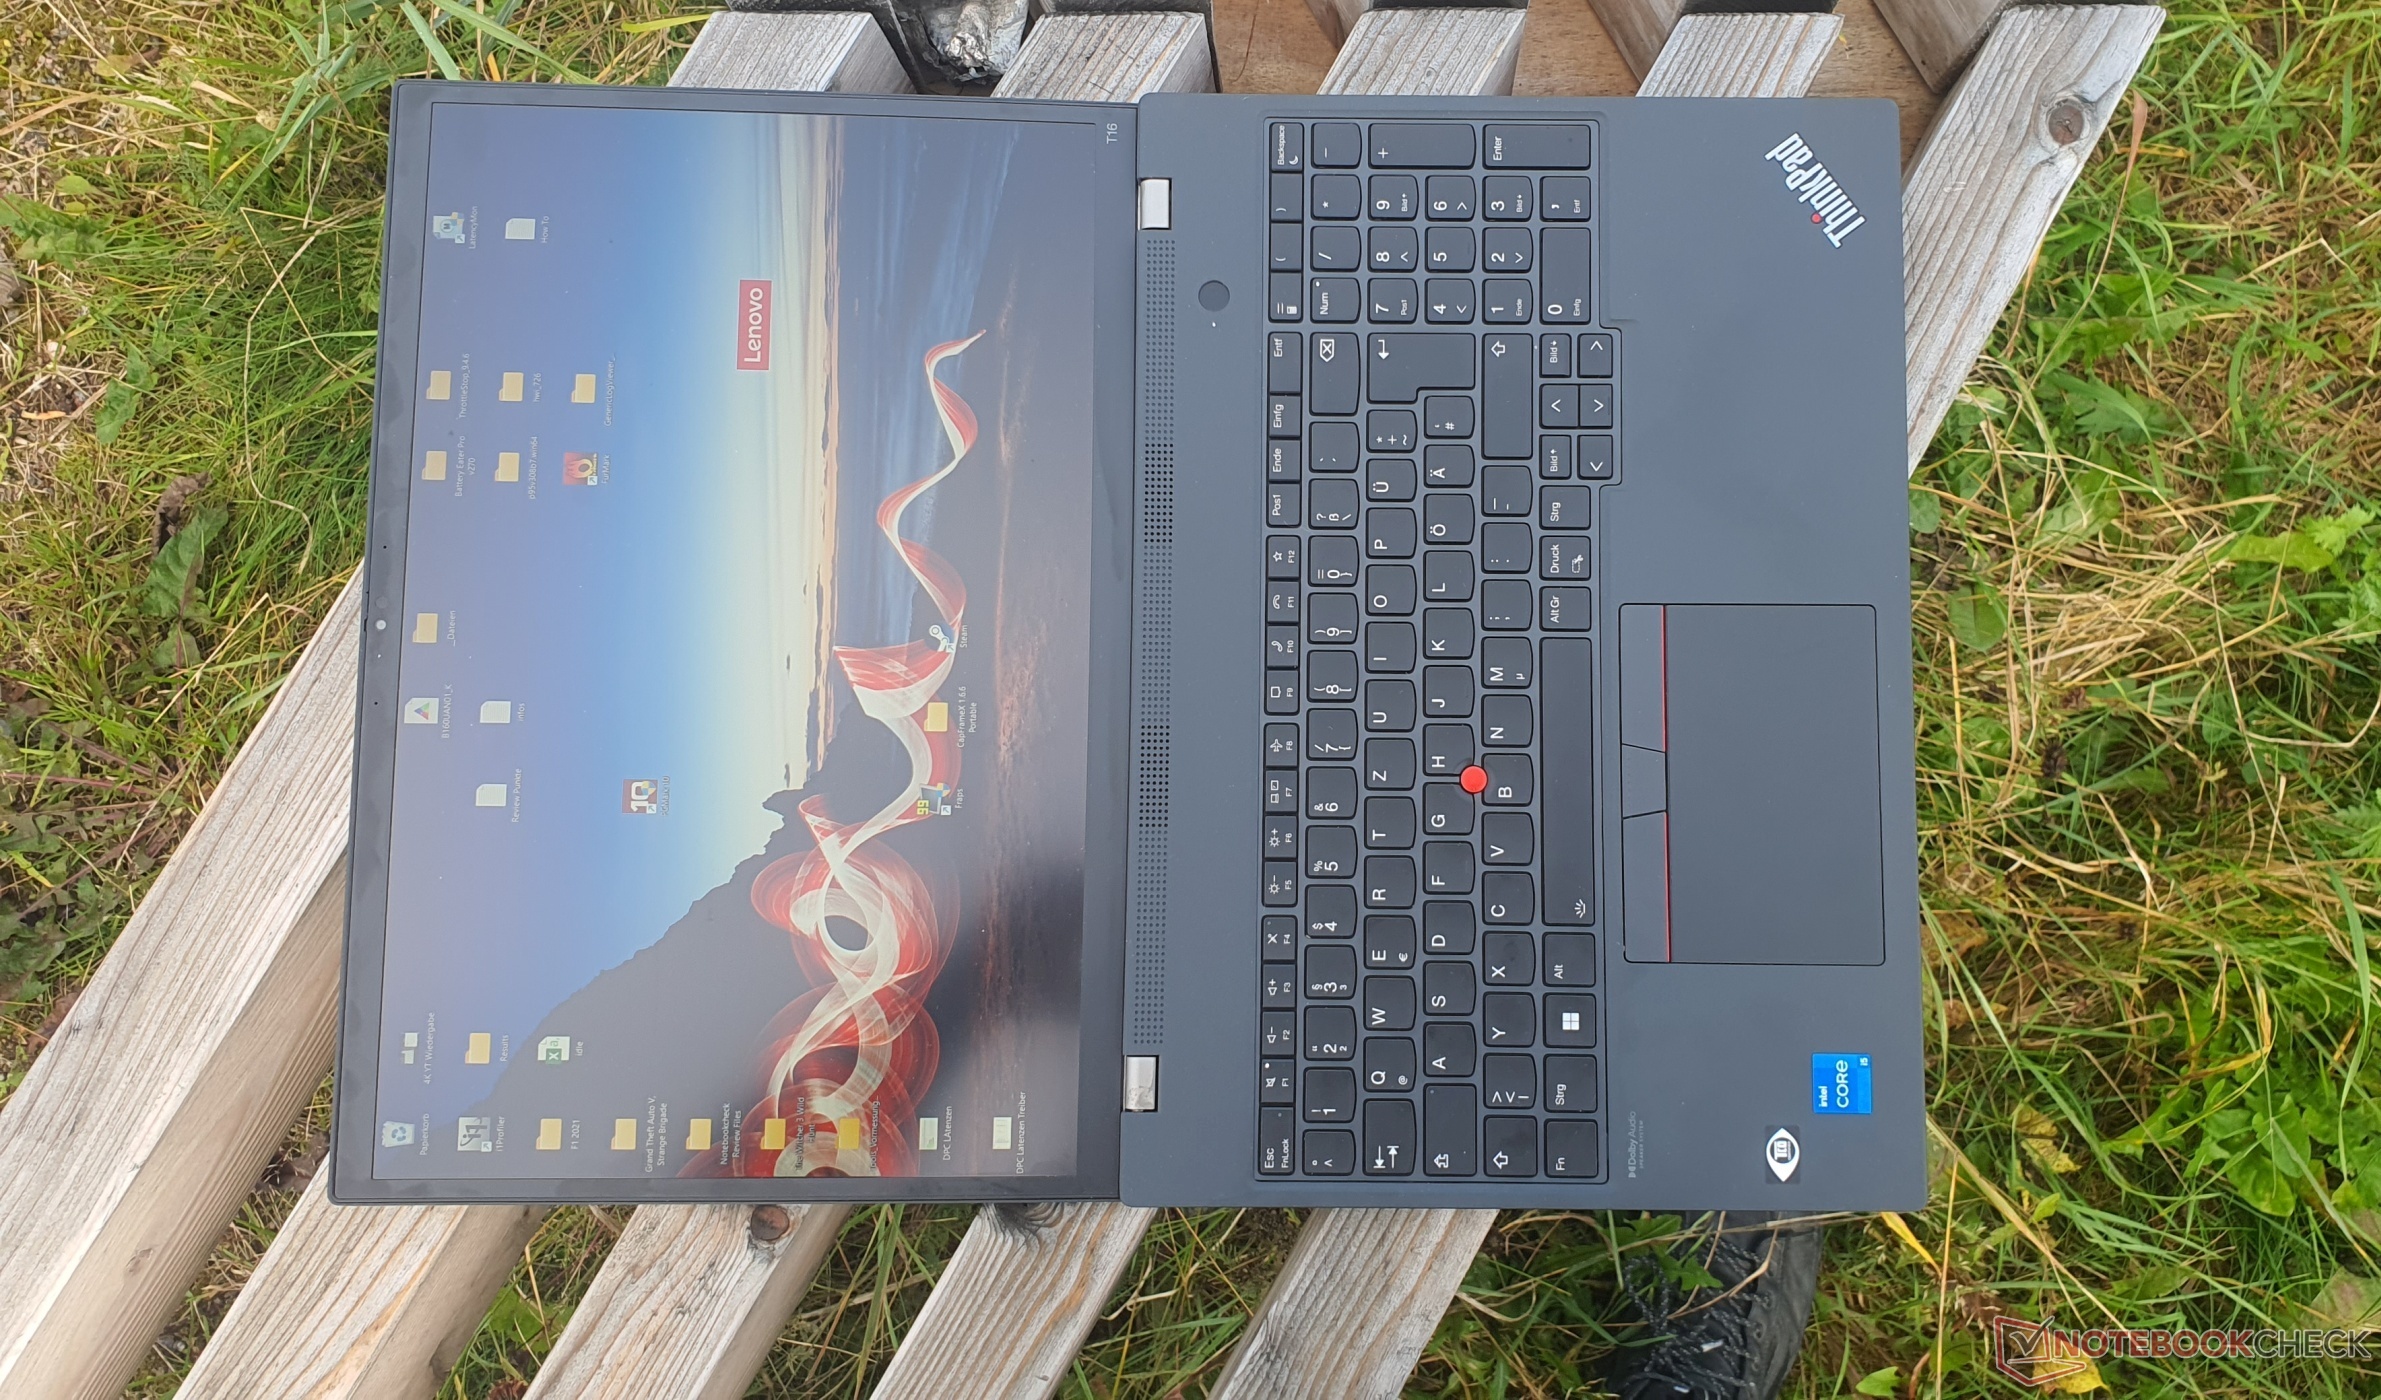
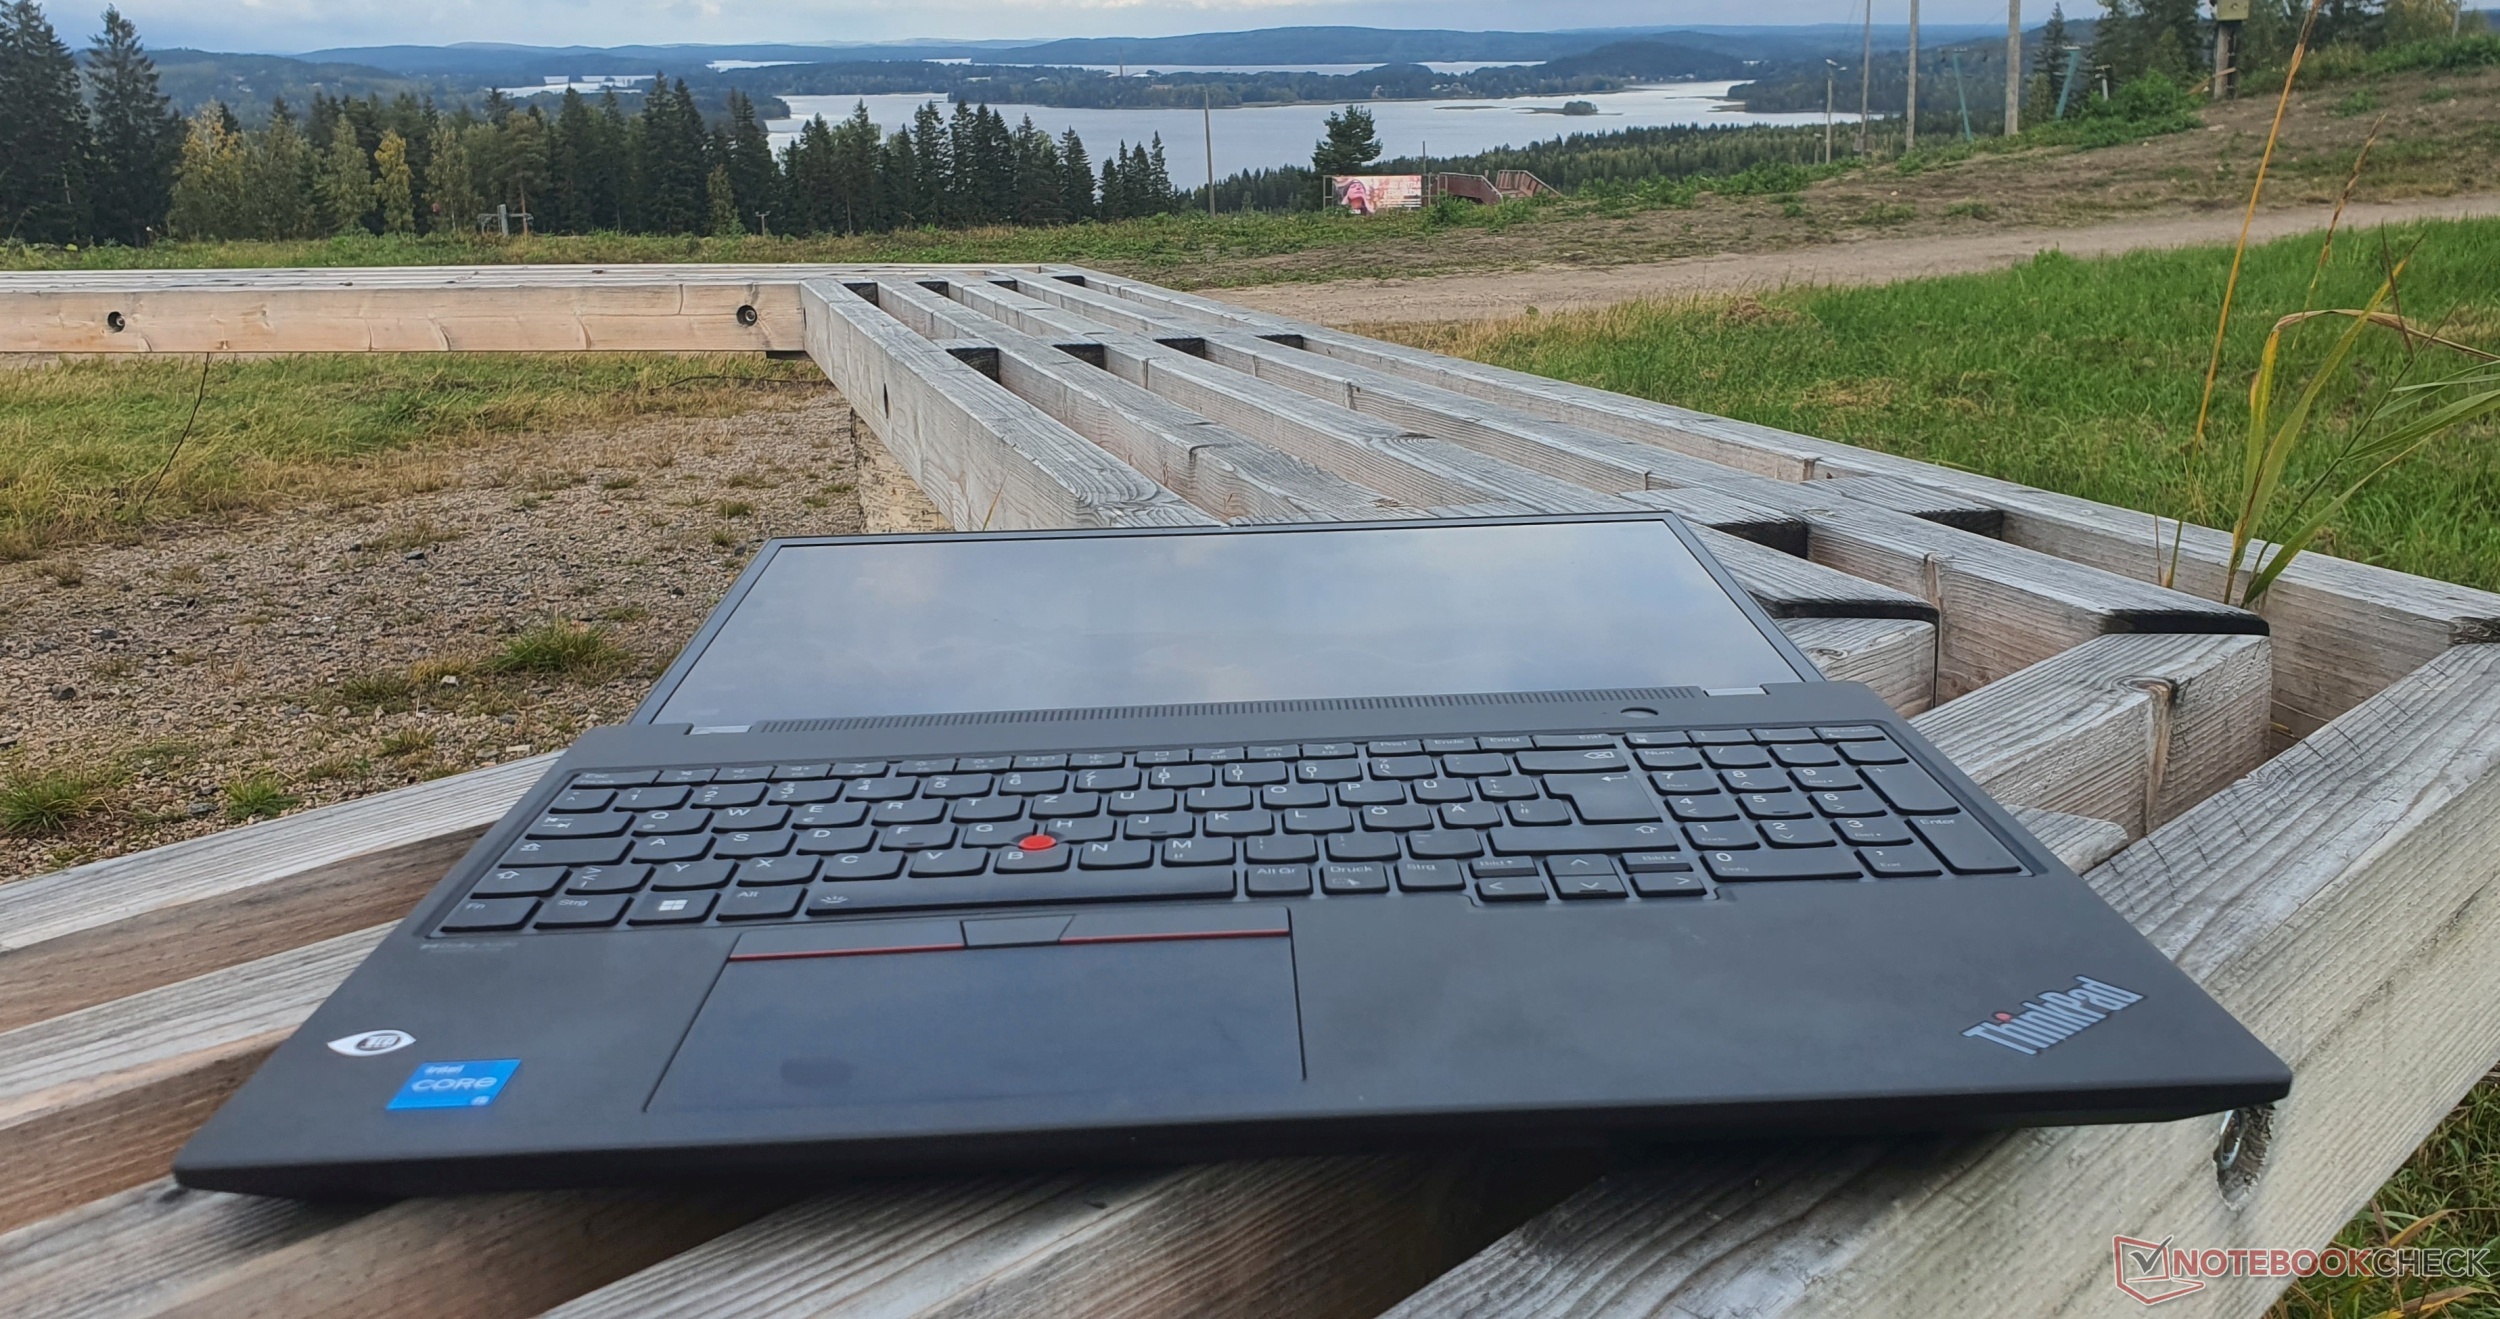
Lenovo ThinkPad T16 G1 Revisão de laptop Intel: corredor de maratona de 16 polegadas
Finalmente, os ThinkPads da Lenovo da clássica série T também estão recebendo um redesenho. A tela 16:10 do ThinkPad T16 G1, que foi ampliada para 16 polegadas, provavelmente será a primeira coisa que chama sua atenção. A opção de uma bateria significativamente maior aumenta a esperança de longos tempos de funcionamento da bateria, assim como a tela opcional de baixa potência. Outras mudanças serão explicadas durante esta revisão, bem como possíveis inconvenientes em comparaçãoao predecessor.
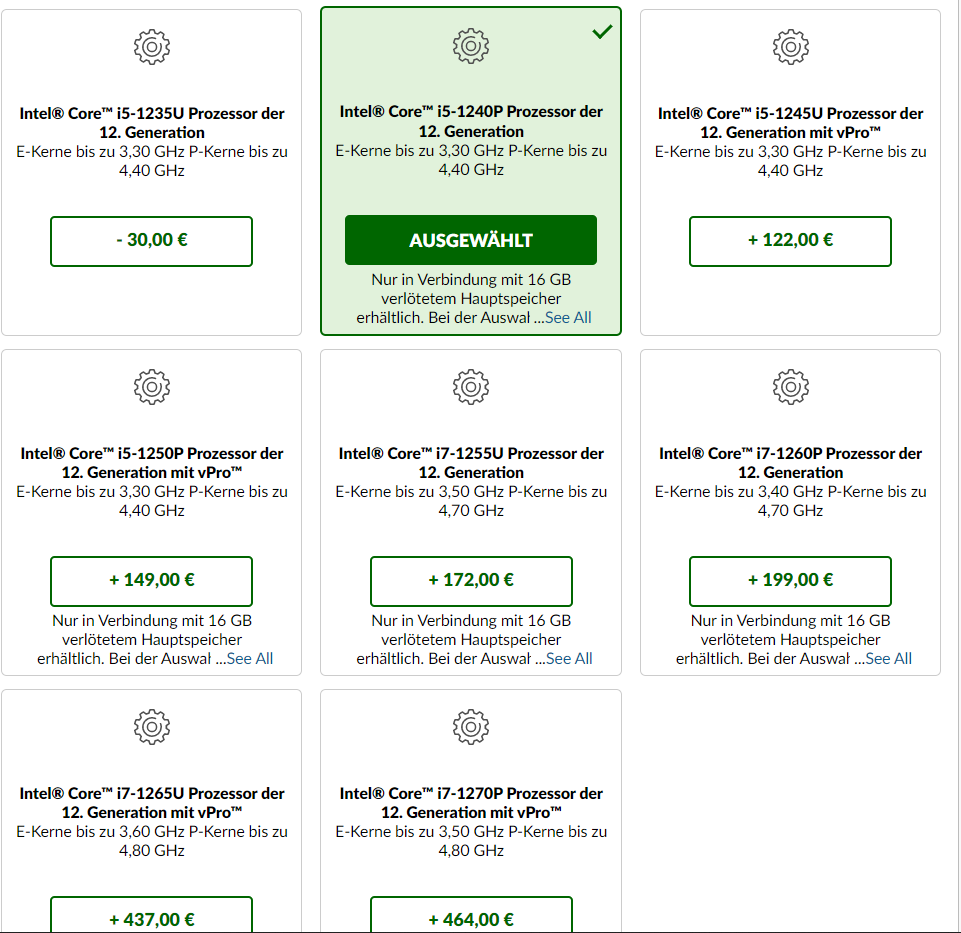
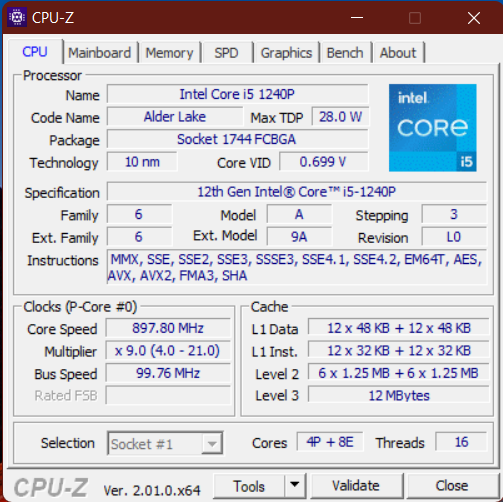
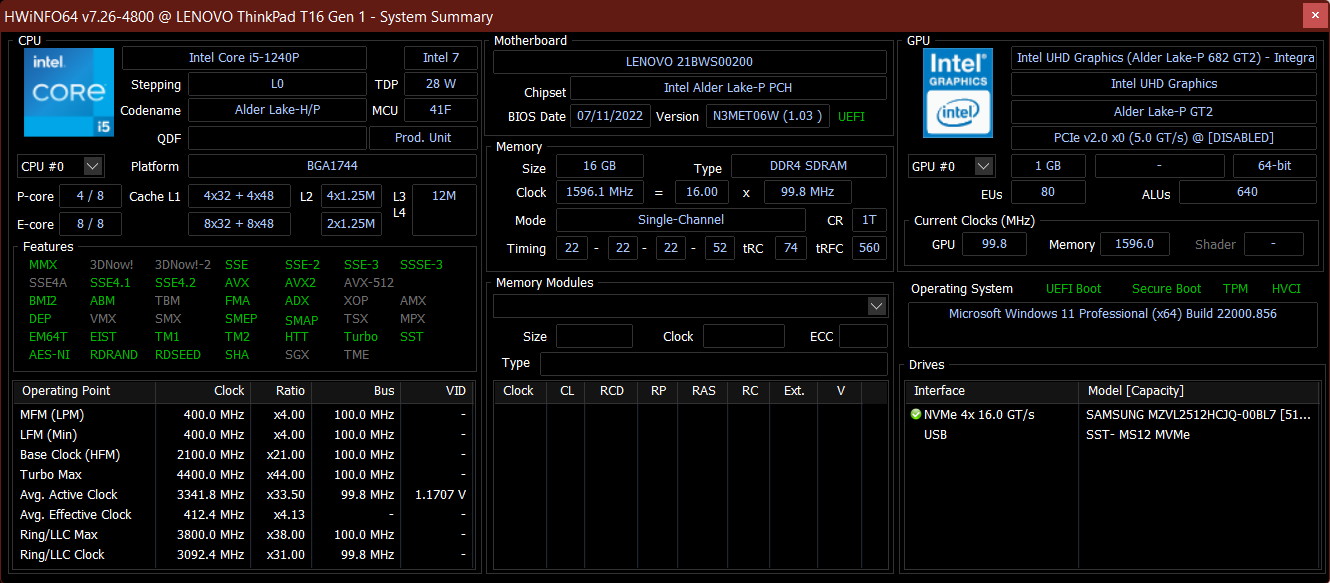
Nosso modelo vem com um Intel Core i5-1240P, 16 GB de RAM DDR4-3200, um SSD PCIe 4.0 de 512 GB, um display FHD+ de baixa potência e uma grande bateria 86 Wh. As CPUs opcionais Intel U parecem ser um pouco mais econômicas de acordo com nossas análises até agora. Um painel de 2,5K também está disponível, mas a opção 4K UHD do predecessor com 100% DCI-P3 não está mais disponível. O painel Nvidia GeForce MX550 também é opcional.
A concorrência do ThinkPad T16 como um dispositivo comercial de ponta entre os portáteis de 15/16-polegadas inclui principalmente o Dell's Latitude 15 5531 e o EliteBook 865 G9 da HP. Mas a comparação com laptops de médio porte é certamente interessante, incluindo híbridos de escritório multimídia como o MateBook D 16 da Huawei e o Vivobook Pro 16X da Asus .
Possíveis concorrentes em comparação
Avaliação | Data | Modelo | Peso | Altura | Size | Resolução | Preço |
|---|---|---|---|---|---|---|---|
| 89.3 % v7 (old) | 09/2022 | Lenovo ThinkPad T16 G1 21BWS00200 i5-1240P, Iris Xe G7 80EUs | 1.9 kg | 20.5 mm | 16.00" | 1920x1200 | |
| 87.1 % v7 (old) | 05/2021 | Lenovo ThinkPad T15 Gen2-20W5S00100 i7-1165G7, GeForce MX450 | 1.9 kg | 19.1 mm | 15.60" | 1920x1080 | |
| 85.5 % v7 (old) | 08/2021 | Lenovo ThinkPad E15 G3-20YG003UGE R7 5700U, Vega 8 | 1.8 kg | 18.9 mm | 15.60" | 1920x1080 | |
| 85.1 % v7 (old) | 07/2021 | Lenovo ThinkPad L15 G2 AMD R5 5600U, Vega 7 | 1.9 kg | 21 mm | 15.60" | 1920x1080 | |
| 85 % v7 (old) | 08/2022 | HP ProBook 450 G9 6A180EA i7-1255U, Iris Xe G7 96EUs | 1.7 kg | 19.9 mm | 15.60" | 1920x1080 | |
| 87.7 % v7 (old) | 07/2022 | HP ZBook Power 15 G8 313S5EA i7-11800H, T600 Laptop GPU | 2 kg | 22.8 mm | 15.60" | 1920x1080 | |
v (old) | 09/2022 | Dell Latitude 15 5531, i5-12600H MX550 i5-12600H, GeForce MX550 | 1.8 kg | 24.05 mm | 15.60" | 1920x1080 | |
| 87.4 % v7 (old) | 08/2022 | Dell Inspiron 16 Plus 7620 i7-12700H, GeForce RTX 3050 Ti Laptop GPU | 2.1 kg | 18.99 mm | 16.00" | 3072x1920 | |
| 83.6 % v7 (old) | 07/2022 | Huawei MateBook D 16 2022 i7-12700H, Iris Xe G7 96EUs | 1.7 kg | 18.4 mm | 16.00" | 1920x1200 | |
v (old) | 12/2021 | Asus Vivobook Pro 16X-M7600QE R9 5900HX, GeForce RTX 3050 Ti Laptop GPU | 1.9 kg | 19 mm | 16.10" | 3840x2400 |
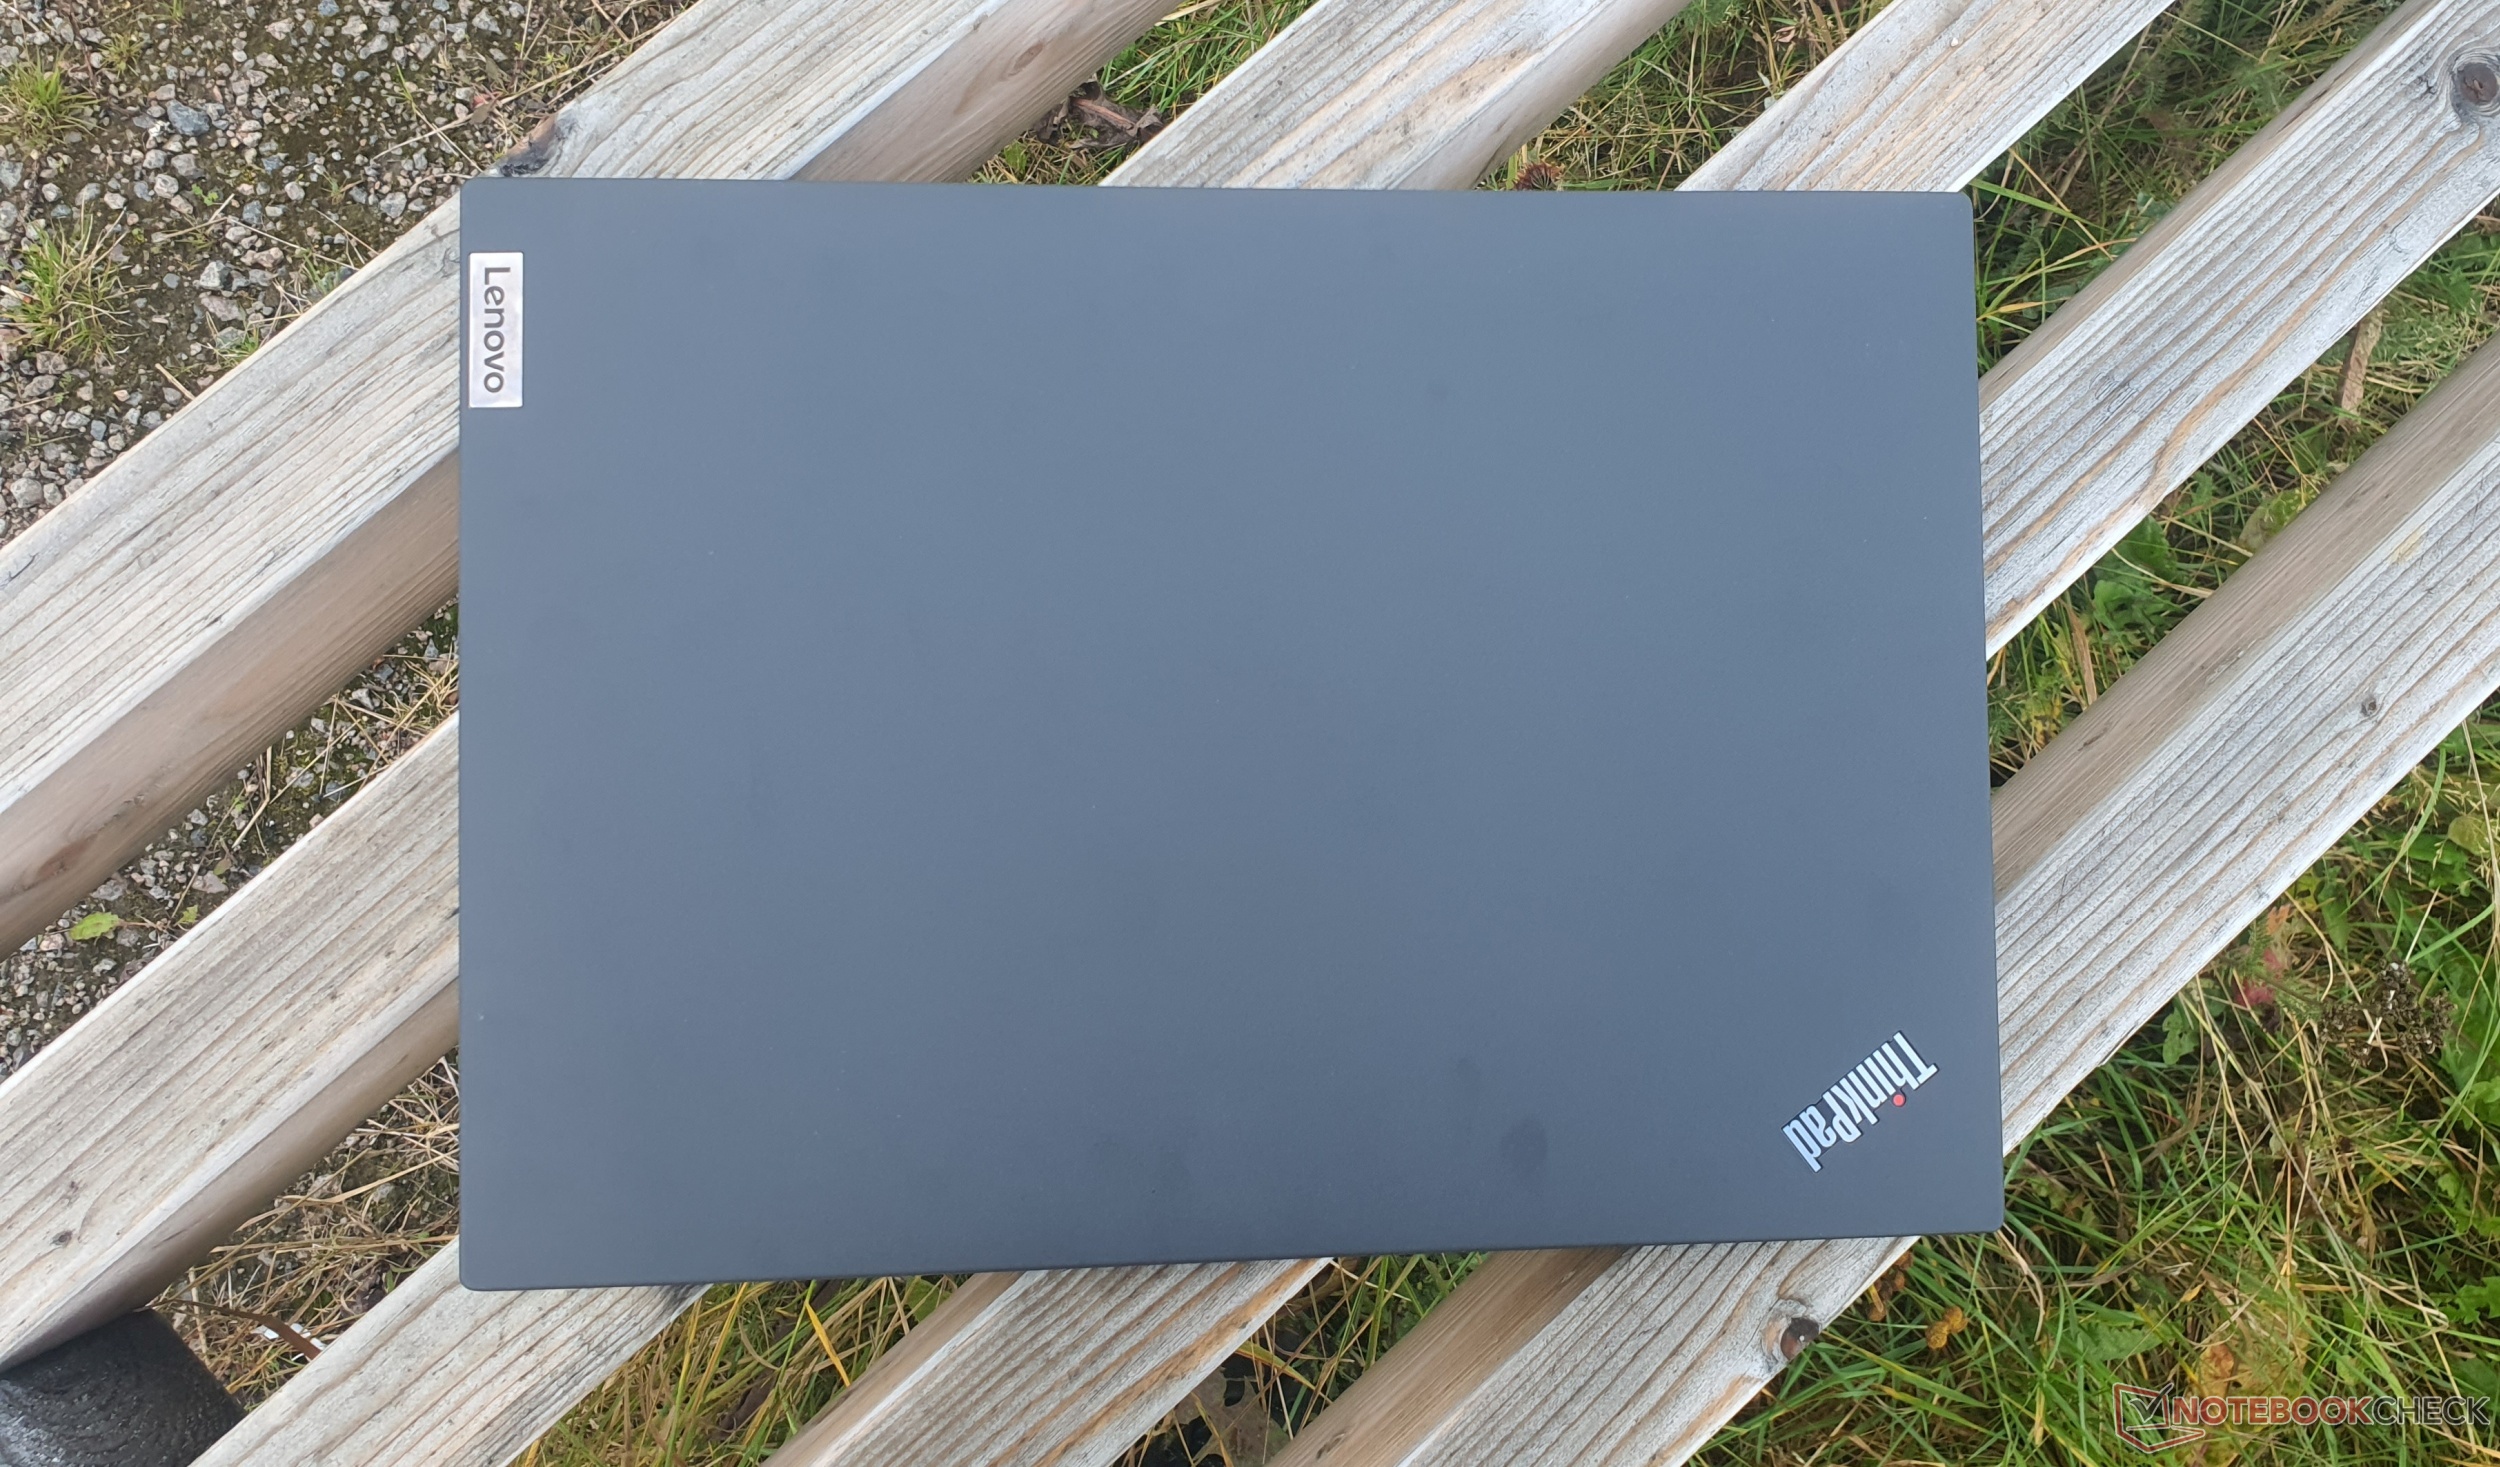
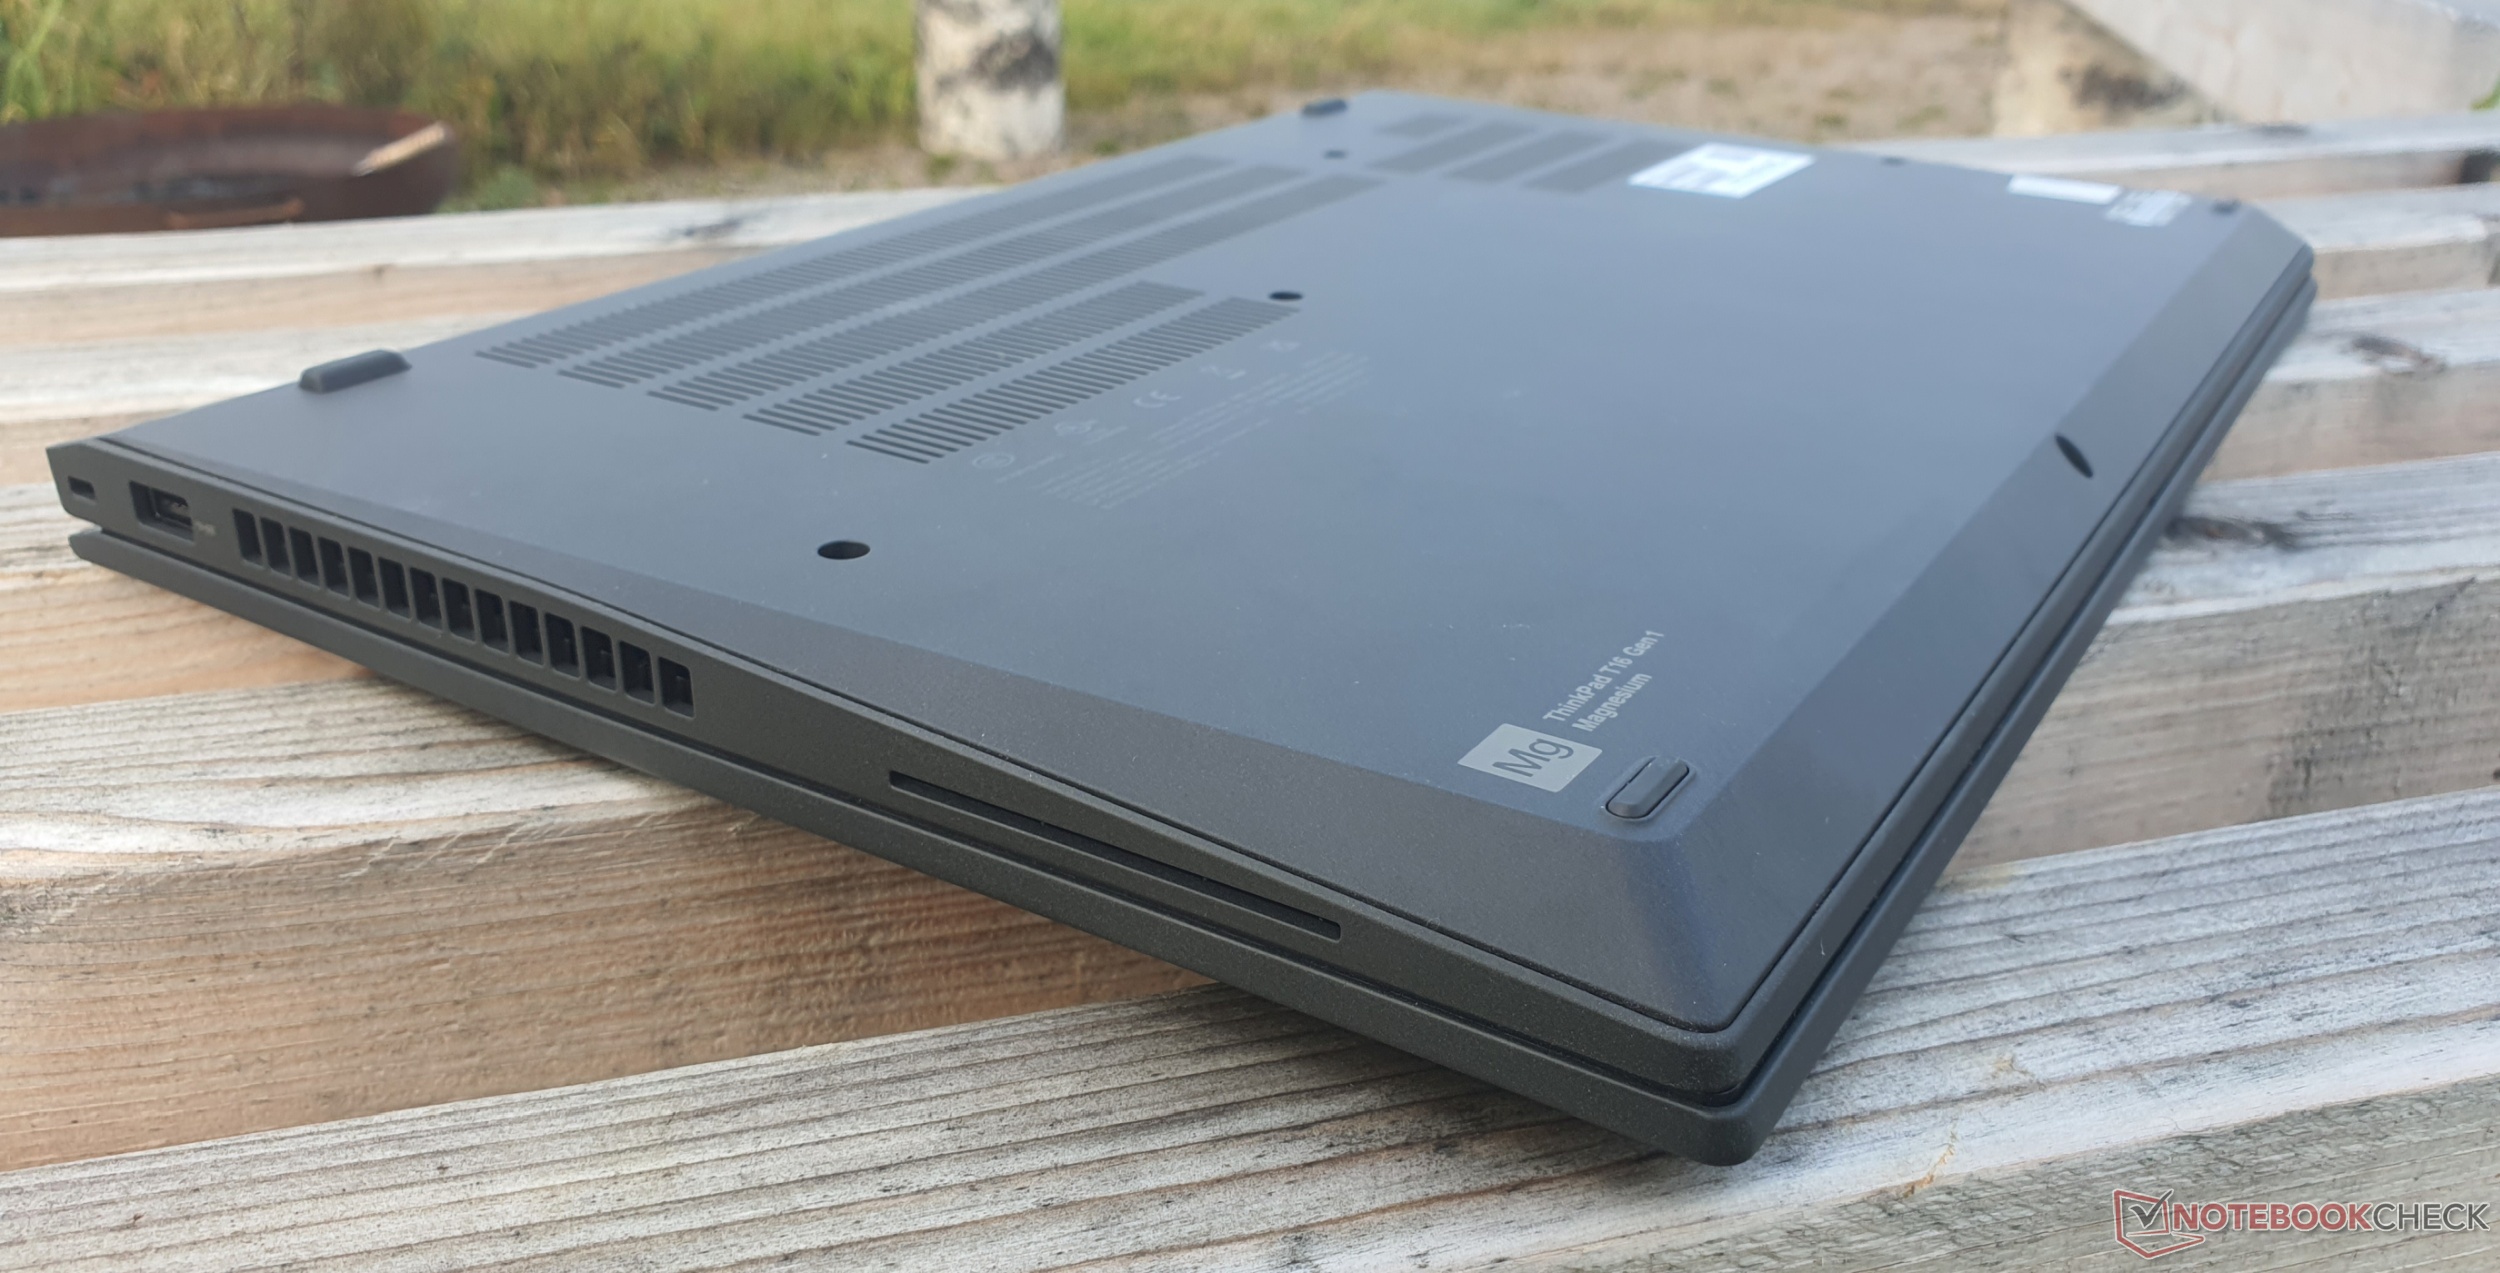
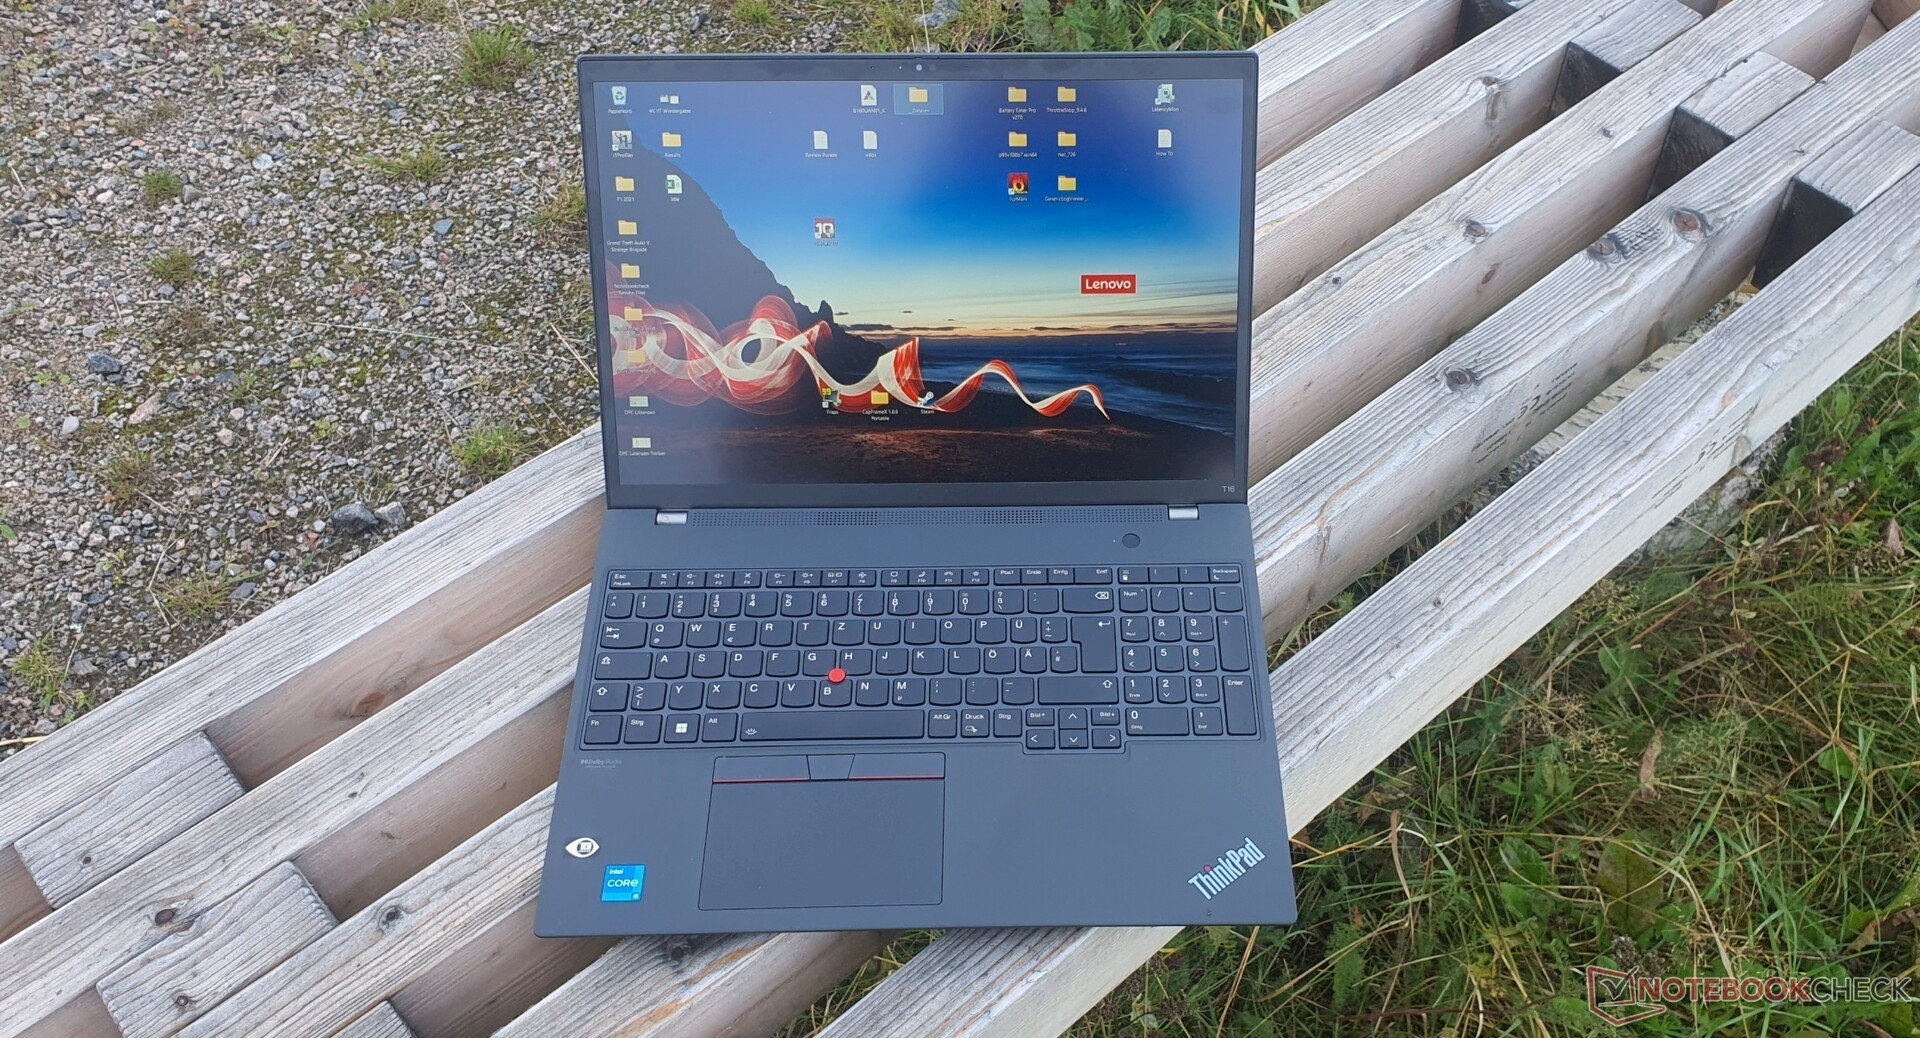
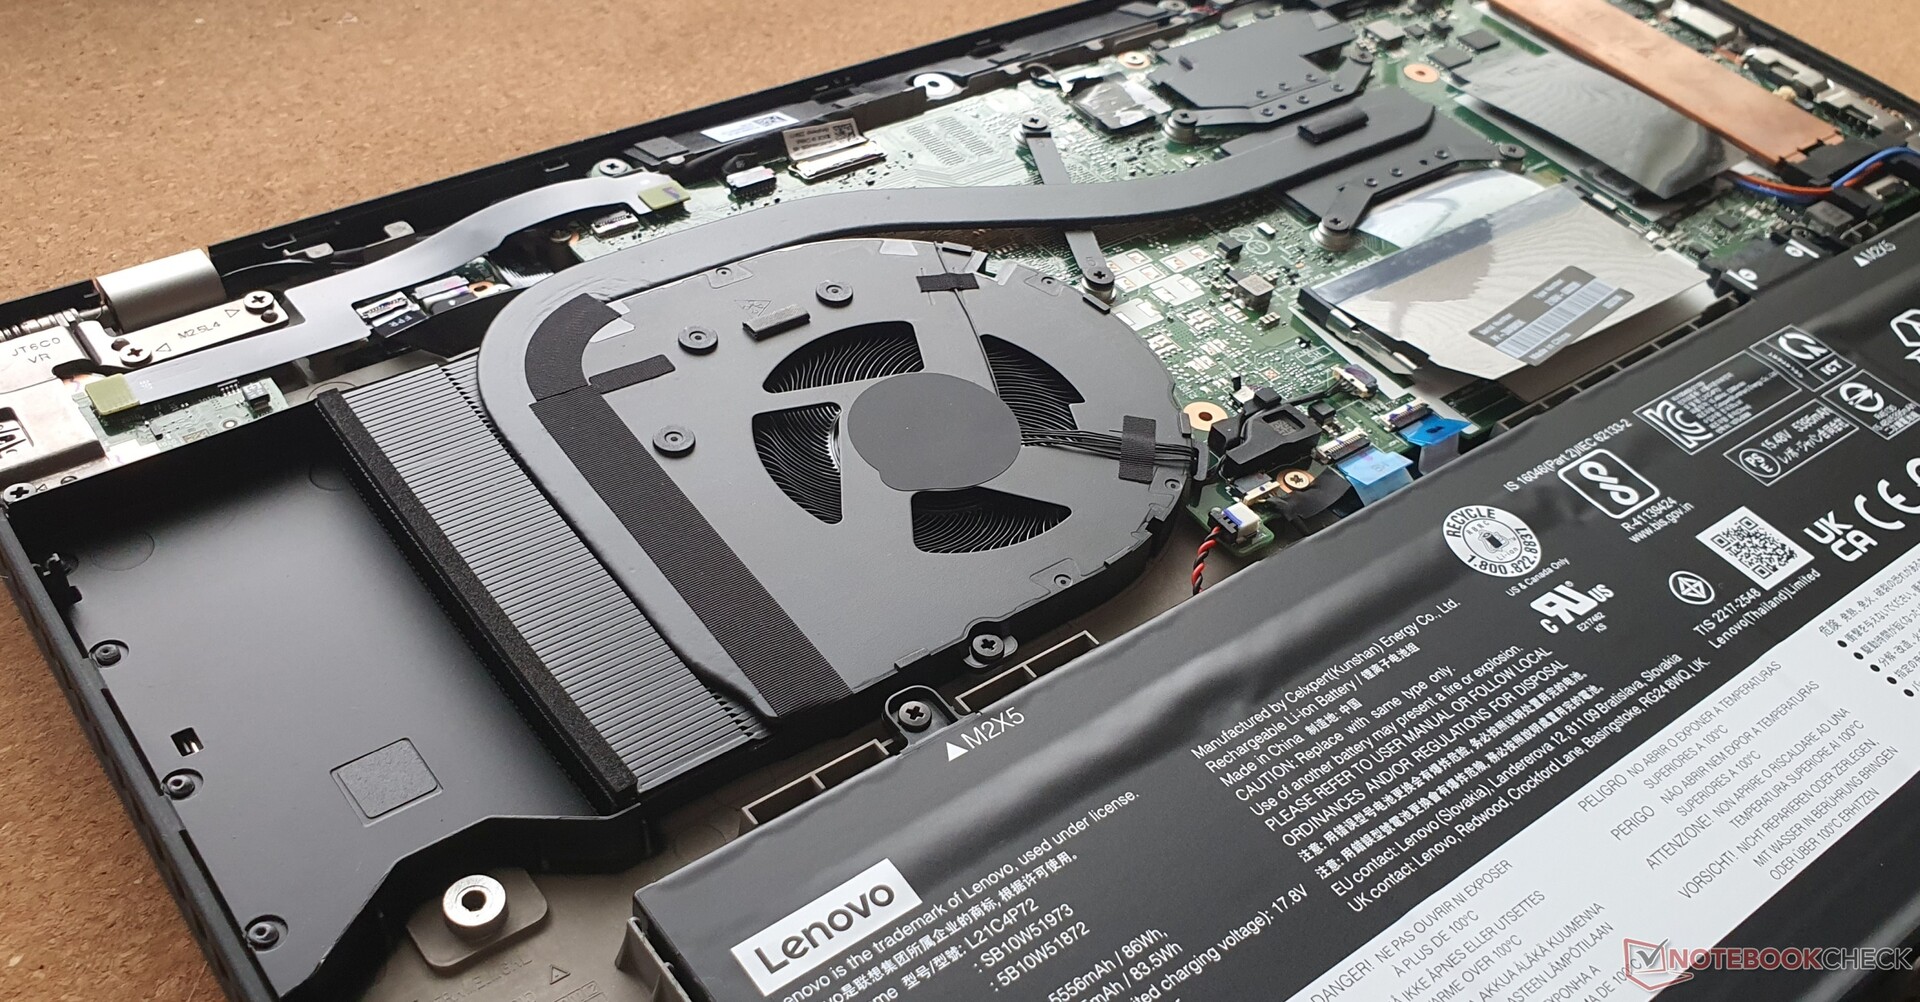
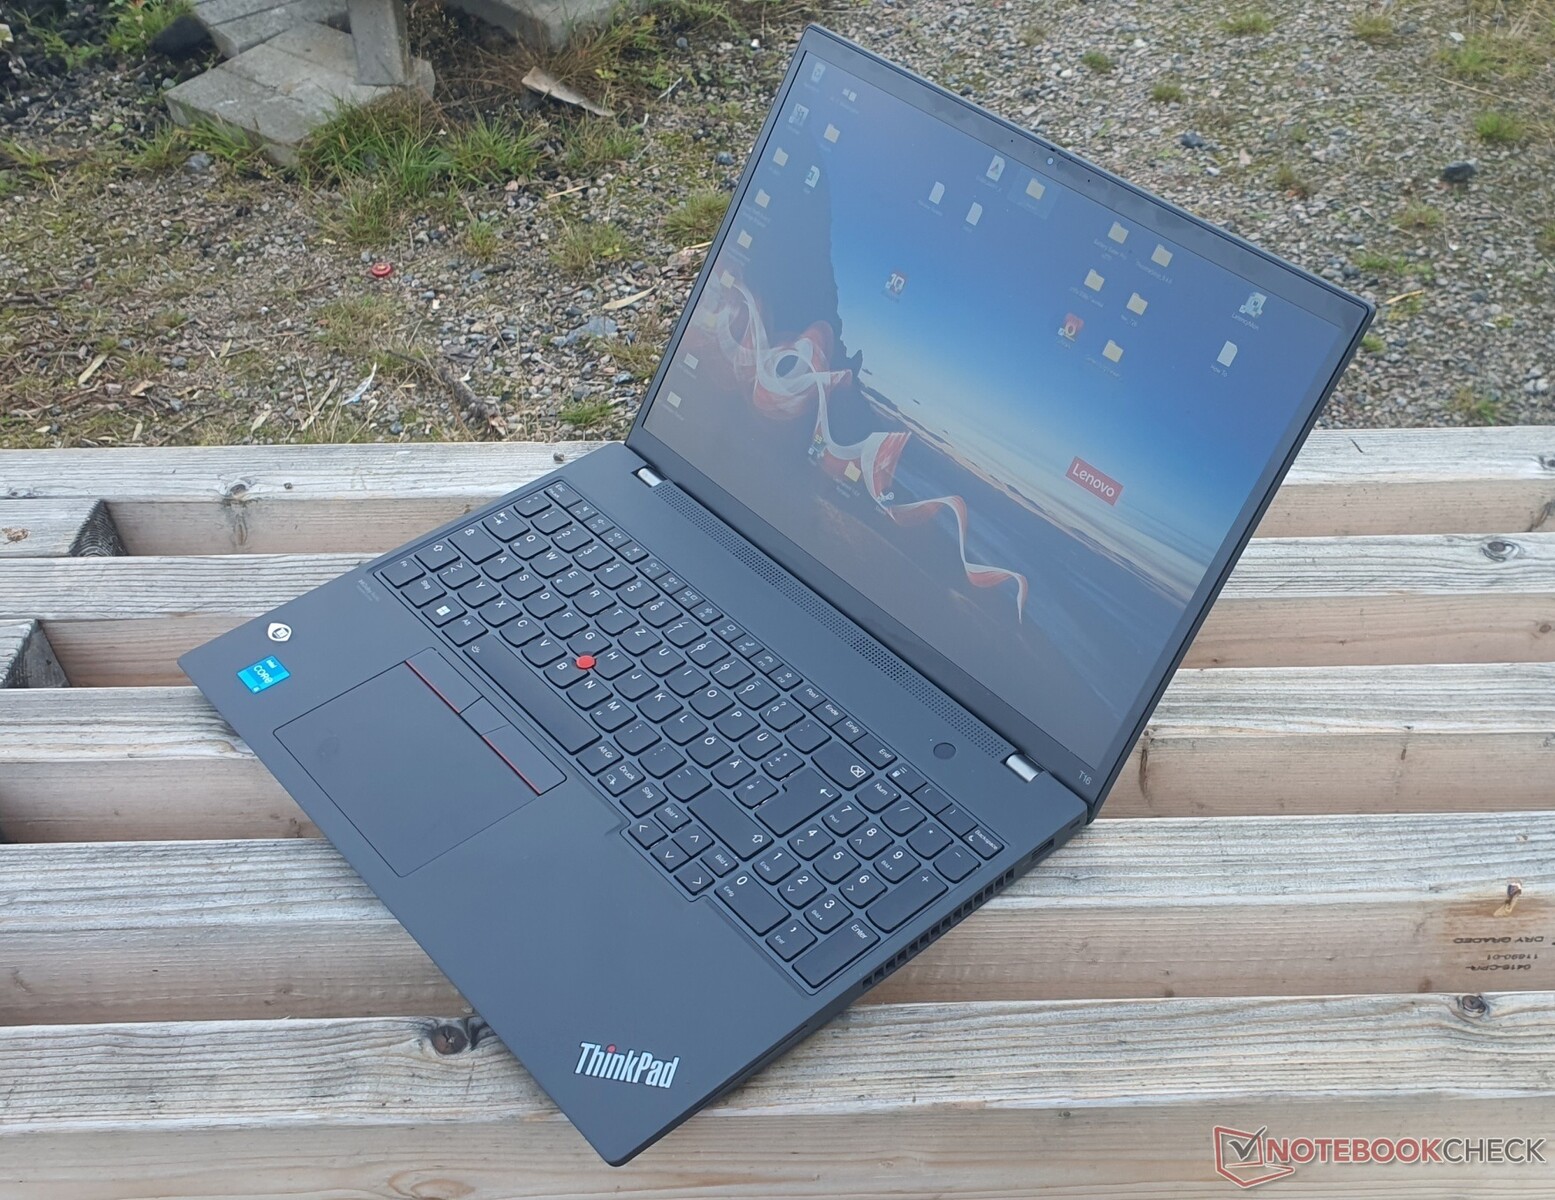
Case - Fibra de carbono utilizada no robusto ThinkPad T16 pela primeira vez
O ThinkPad T16 é de cor antracite, semelhante aoT14s G2as superfícies ligeiramente ásperas e emborrachadas também são as mesmas e têm uma sensação de qualidade muito alta.
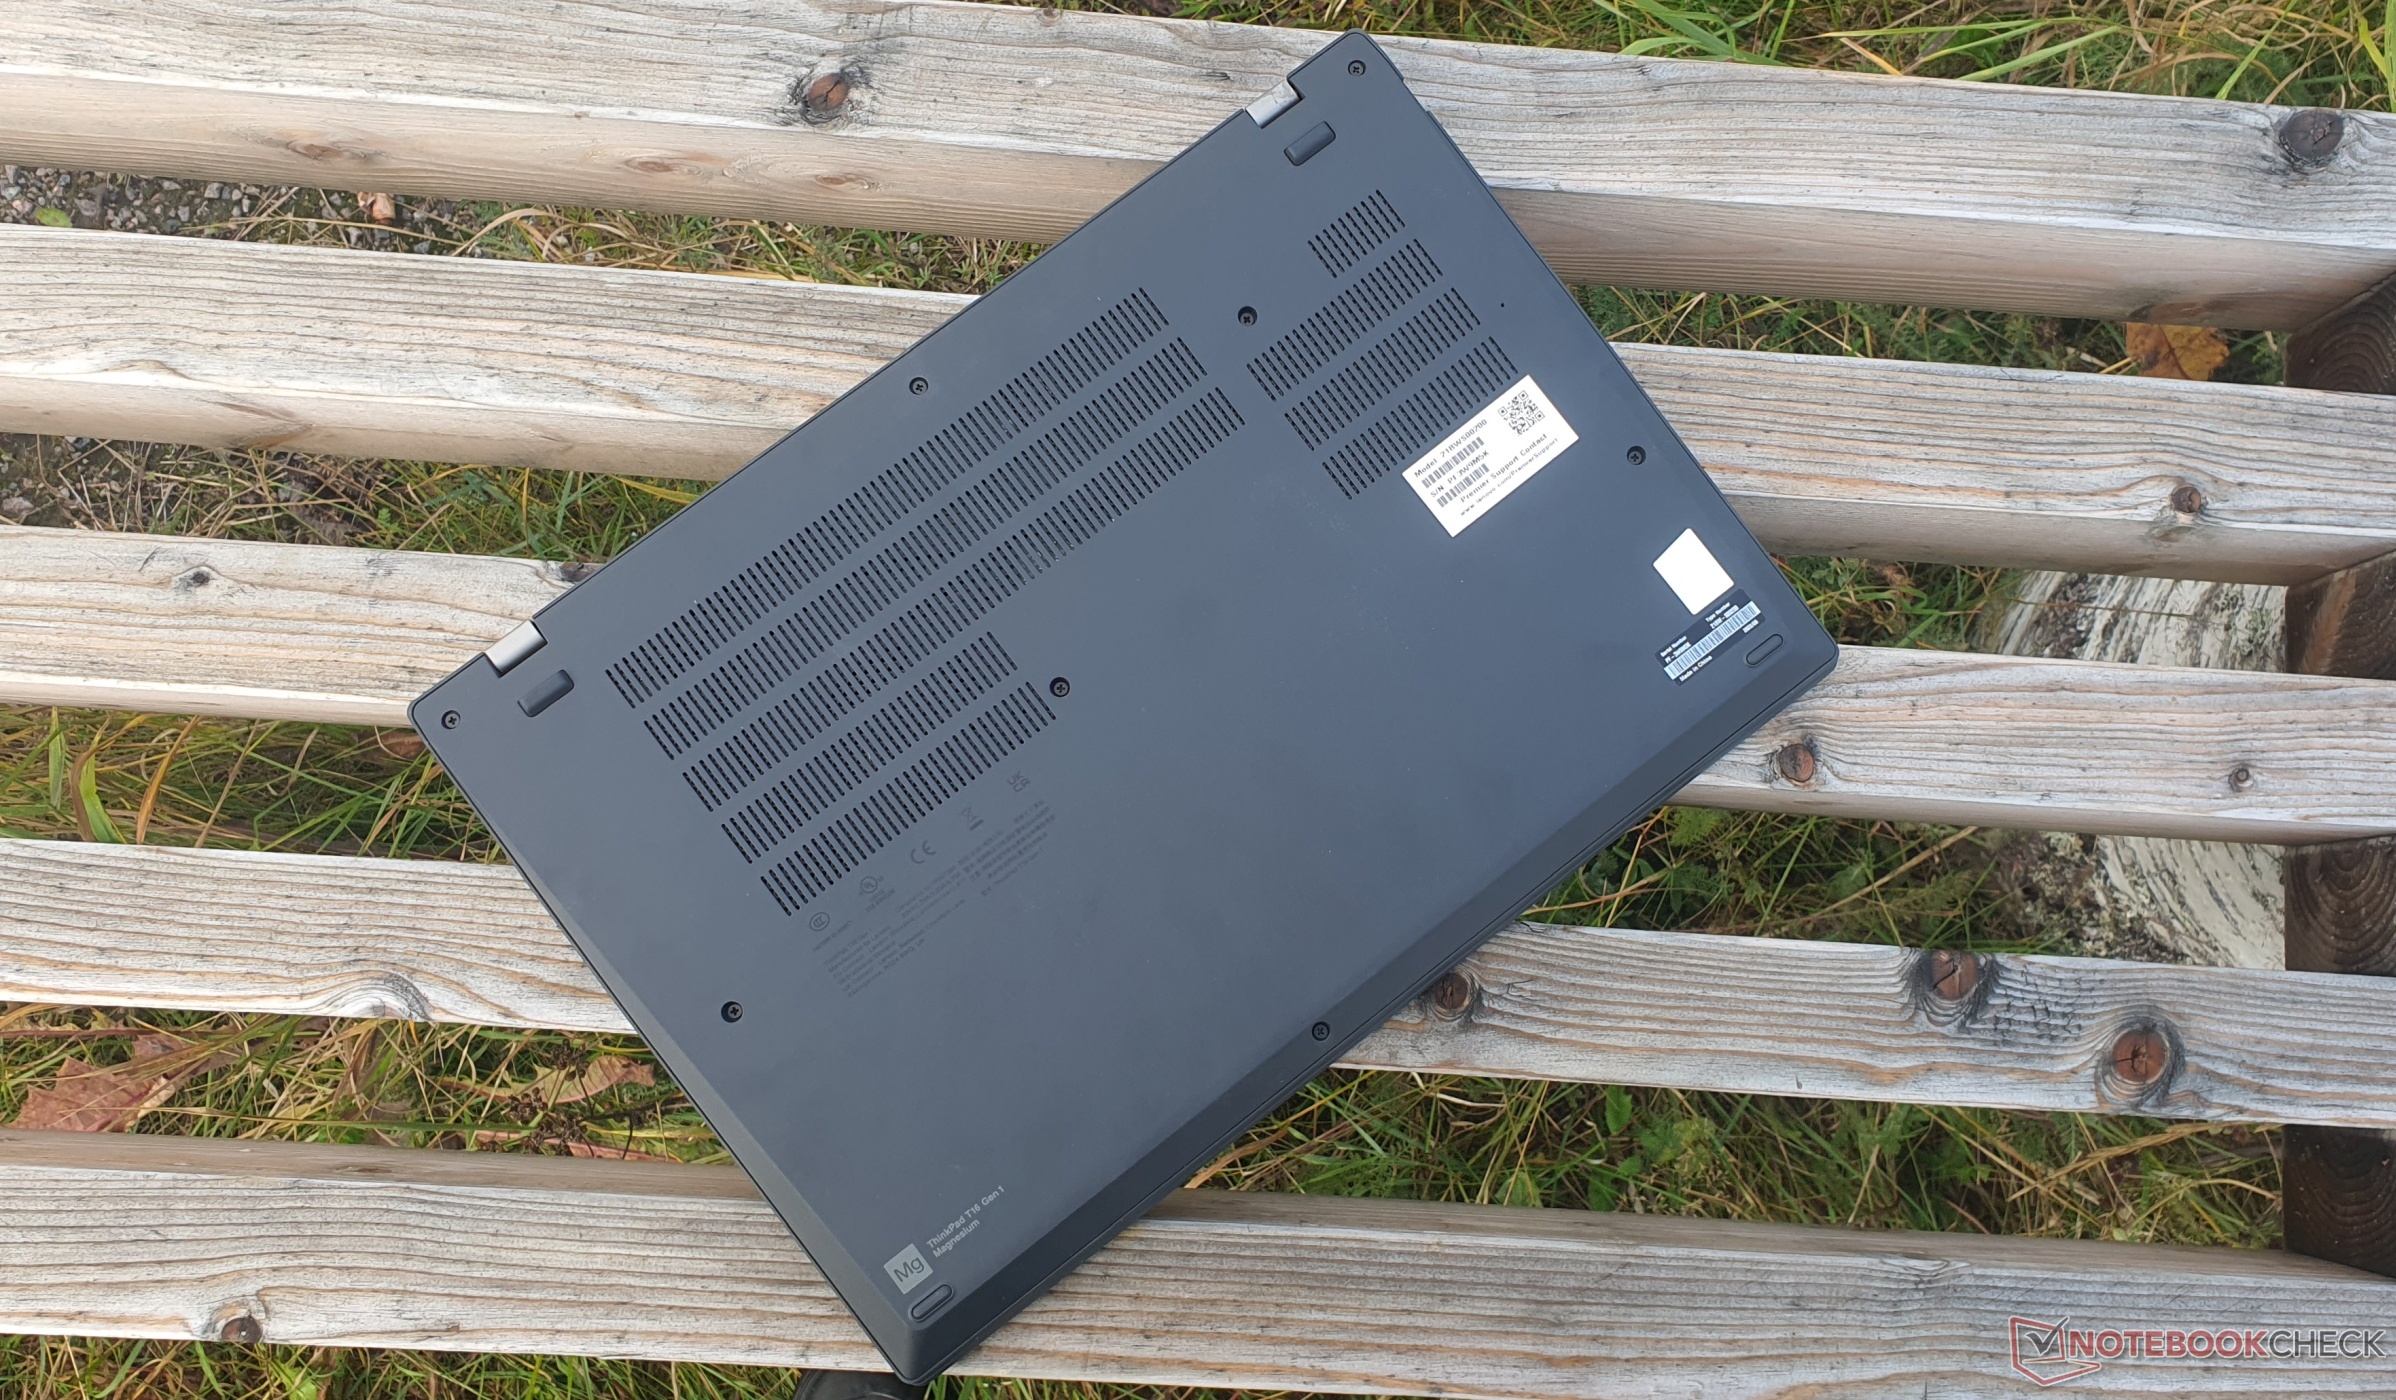
As impressões digitais são visíveis, mas muito menos do que antes. As bordas da tela são mais estreitas devido ao formato 16:10, enquanto o resto do desenho permanece mais ou menos o mesmo. No entanto, o dispositivo é 1,4 mm mais grosso, um pouco mais curto, mas também um pouco mais profundo. Nosso modelo pesa 1,95 kg, o que se deve principalmente à capacidade da bateria selecionada.
A mão-de-obra, livre de lacunas, é excelente, assim como a estabilidade. A tampa dificilmente pode ser torcida, e a pressão dirigida sobre a tampa traseira não resulta em distorções de imagem. Não é de se admirar, já que a tampa é feita de uma mistura de fibra de carbono, fibra de vidro e plástico. A fibra de carbono era reservada anteriormente e exclusivamente para os modelos mais caros com o s-suffix
O apoio de palma é feito de uma combinação de plástico, fibra de vidro, magnésio e alumínio. A base, portanto, revela-se muito teimosa contra a tensão de torção. A parte inferior é feita inteiramente de termoplástico. As dobradiças robustas são apertadas, mas ainda é possível a abertura com uma mão até 180°.
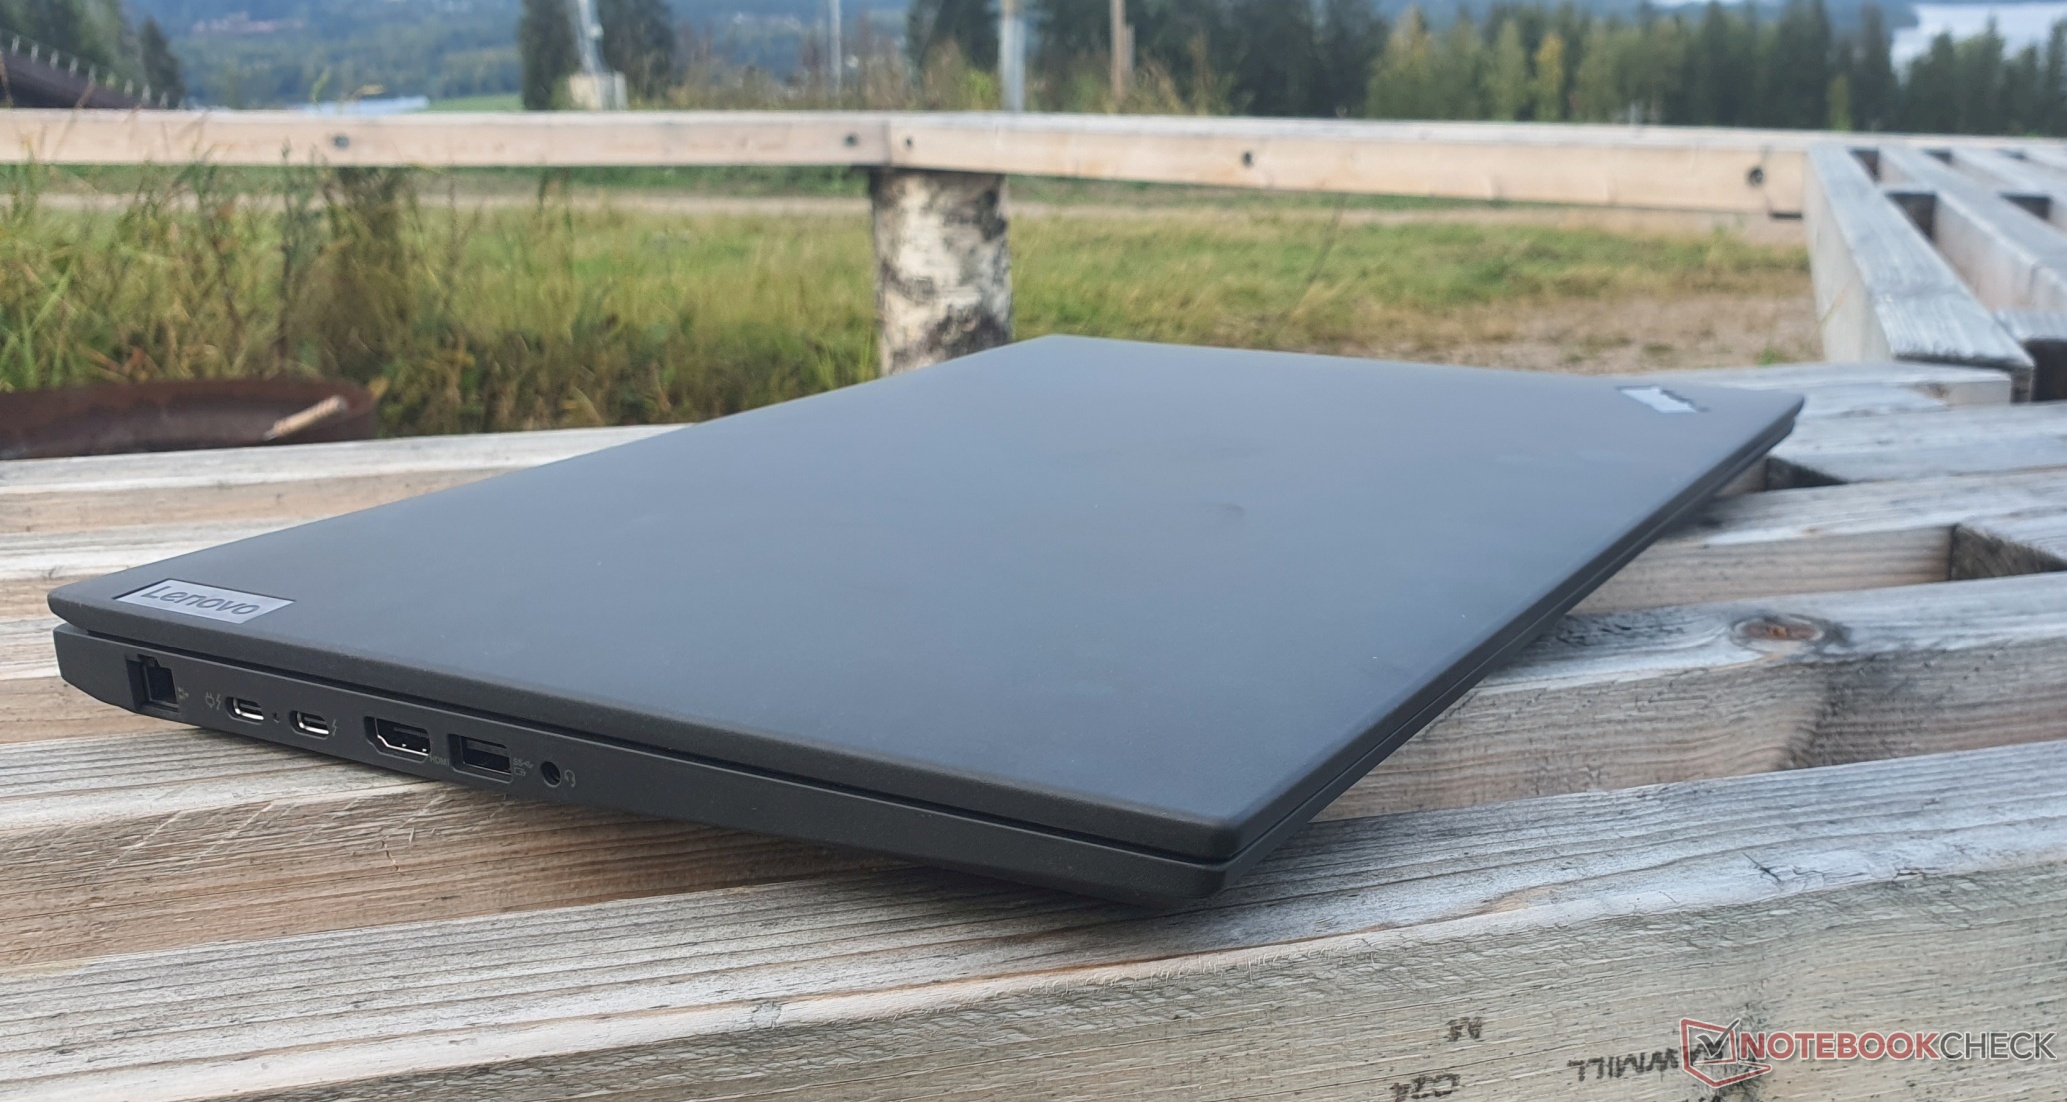

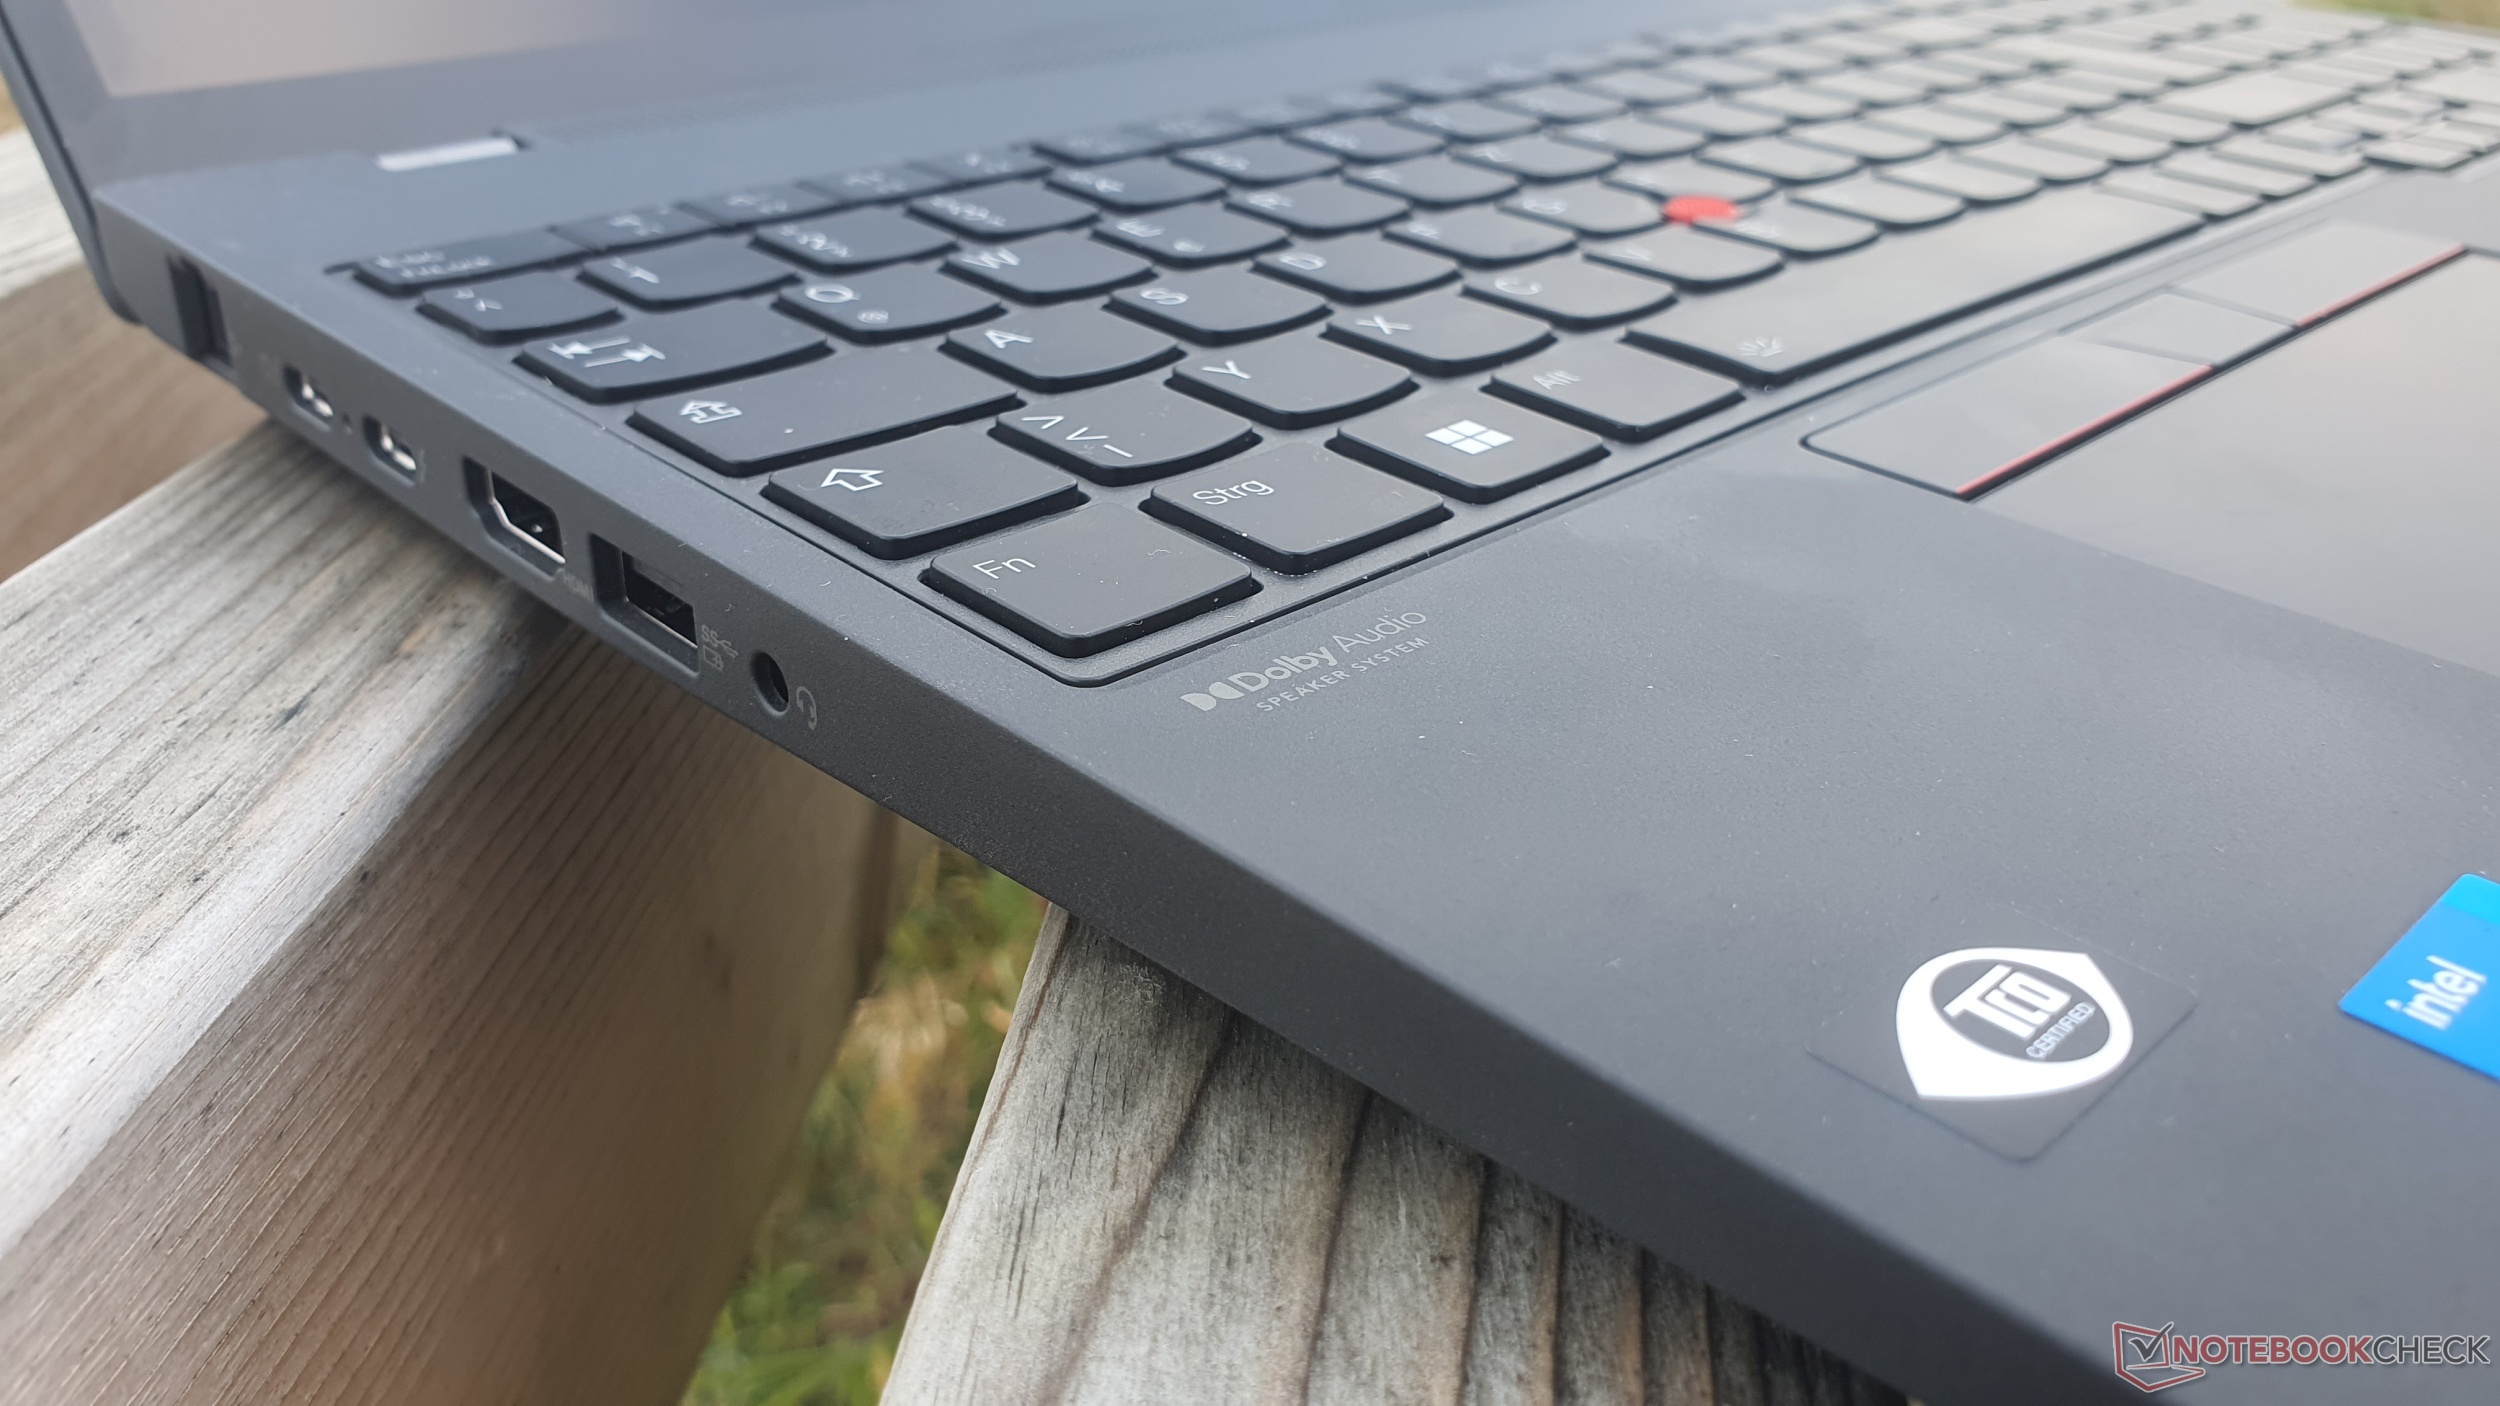
Equipamentos - RJ45, TB4, soldado Wi-Fi 6E e cam 1080p
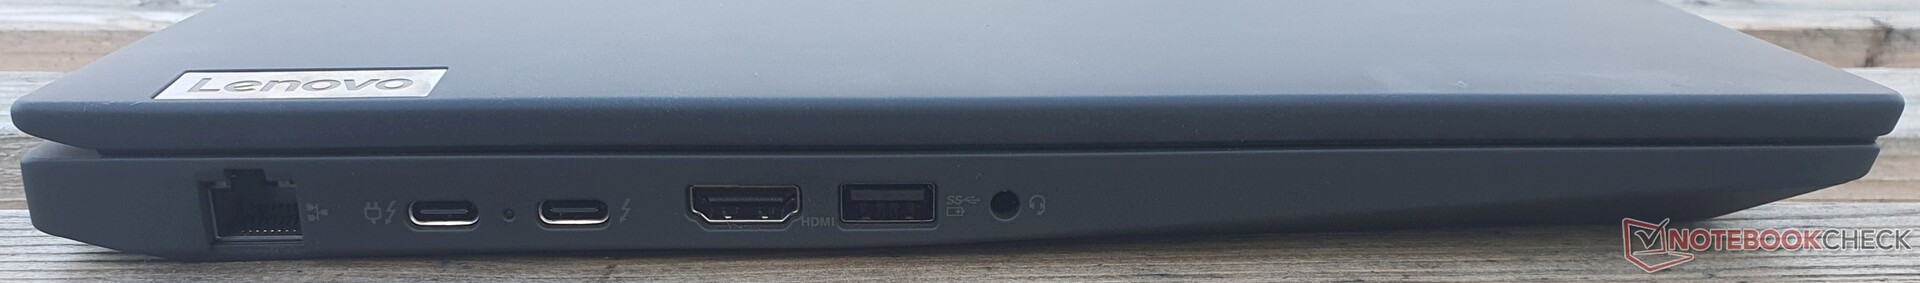
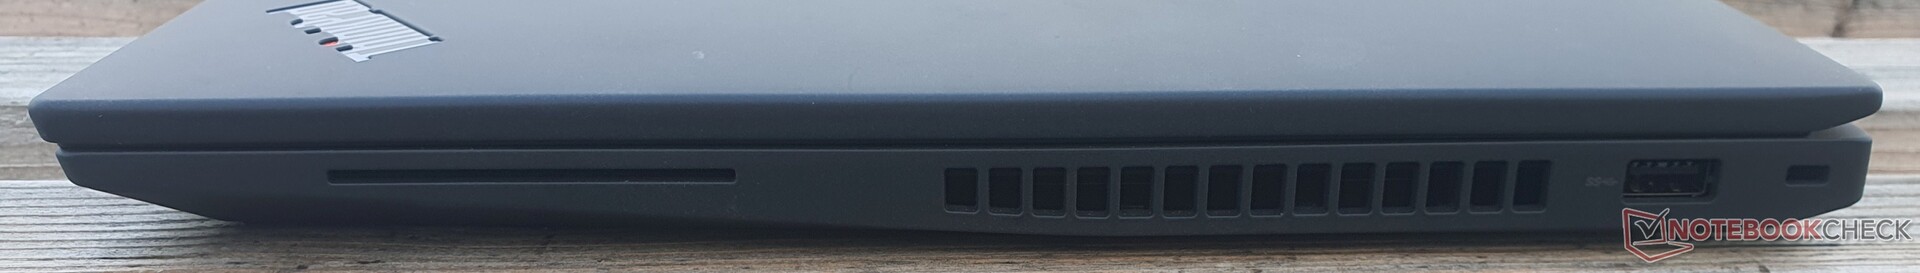
O uso contínuo de uma porta LAN GBit é agradável, mas a omissão do leitor de cartões microSD na série T é menos. Caso contrário, o ThinkPad oferece tudo o que você precisa com 2x USB-A 3.2 Gen 1, HDMI 2.0b e 2x Thunderbolt 4, incluindo 100 watts de carga e DisplayPort 1.4. Isto significa que até três monitores adicionais podem ser conectados: 2x 5K60 @TB4 + 1x 4K60 @HDMI.
Comunicação
O AX211 soldado da Intel é responsável pelo Wi-Fi 6E. Registramos velocidades exemplares de mais de 1,6 GBit/s em ambas as direções, de modo que nosso campo de comparação é facilmente conduzido pelo Lenovo ThinkPad T16 G1.
Bluetooth 5.2 e WWAN opcional com 4G também estão disponíveis. Em nossa amostra de revisão, há um slot M.2 2242 gratuito, e as antenas podem ser atualizadas. O NFC é opcional.
| Networking | |
| Lenovo ThinkPad T16 G1 21BWS00200 | |
| iperf3 transmit AXE11000 6GHz | |
| iperf3 receive AXE11000 6GHz | |
| Huawei MateBook D 16 2022 | |
| iperf3 receive AXE11000 | |
| iperf3 transmit AXE11000 | |
| Lenovo ThinkPad T15 Gen2-20W5S00100 | |
| iperf3 transmit AX12 | |
| iperf3 receive AX12 | |
| HP ZBook Power 15 G8 313S5EA | |
| iperf3 transmit AX12 | |
| iperf3 receive AX12 | |
| HP ProBook 450 G9 6A180EA | |
| iperf3 transmit AXE11000 6GHz | |
| iperf3 receive AXE11000 6GHz | |
| Lenovo ThinkPad X1 Extreme G4-20Y5CTO1WW (3050 Ti) | |
| iperf3 transmit AX12 | |
| iperf3 receive AX12 | |
| Dell Inspiron 16 Plus 7620 | |
| iperf3 transmit AXE11000 6GHz | |
| iperf3 receive AXE11000 6GHz | |
| Lenovo ThinkPad E15 G3-20YG003UGE | |
| iperf3 transmit AX12 | |
| iperf3 receive AX12 | |
| Lenovo ThinkPad L15 G2 AMD | |
| iperf3 transmit AX12 | |
| iperf3 receive AX12 | |
Webcam
A webcam 1080p continua a ser pouco impressionante, mas é muito menos barulhenta e lavada. Além disso, há dois microfones de dois raios com boa qualidade de gravação, bem como o IR para Windows Olá.


Segurança
Para segurança, a Lenovo oferece um leitor de cartão inteligente opcional, IR para Windows Hello, e uma abertura física da câmera no ThinkPad T16 Gen. 1. Outras características de segurança incluem o TPM 2.0, um cadeado Kensington e o leitor de impressões digitais opcional. Detecção de presença humana e Mirametrix Glance são utilizados para o software.
Acessórios
Não há porta de acoplamento, mas as docas USB-C podem ser usadas. O escopo da entrega inclui apenas um carregador USB-C Slim de 135 watts. Os modelos com CPUs da série U têm de se contentar com 65 watts. Por outro lado, também é possível usar seu próprio carregador com 45 watts. A embalagem é 90% reciclada ou feita de madeira sustentável.
Manutenção
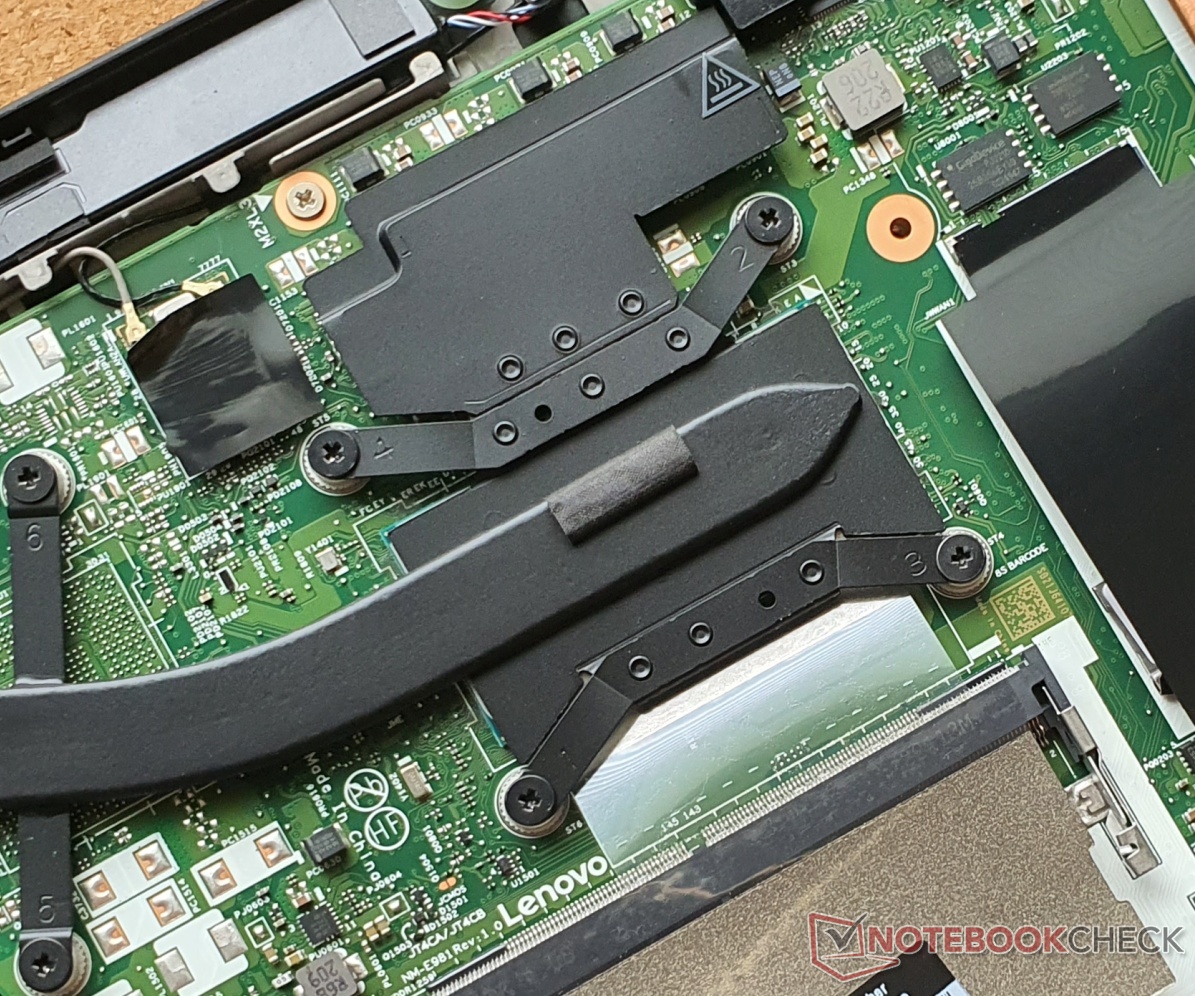
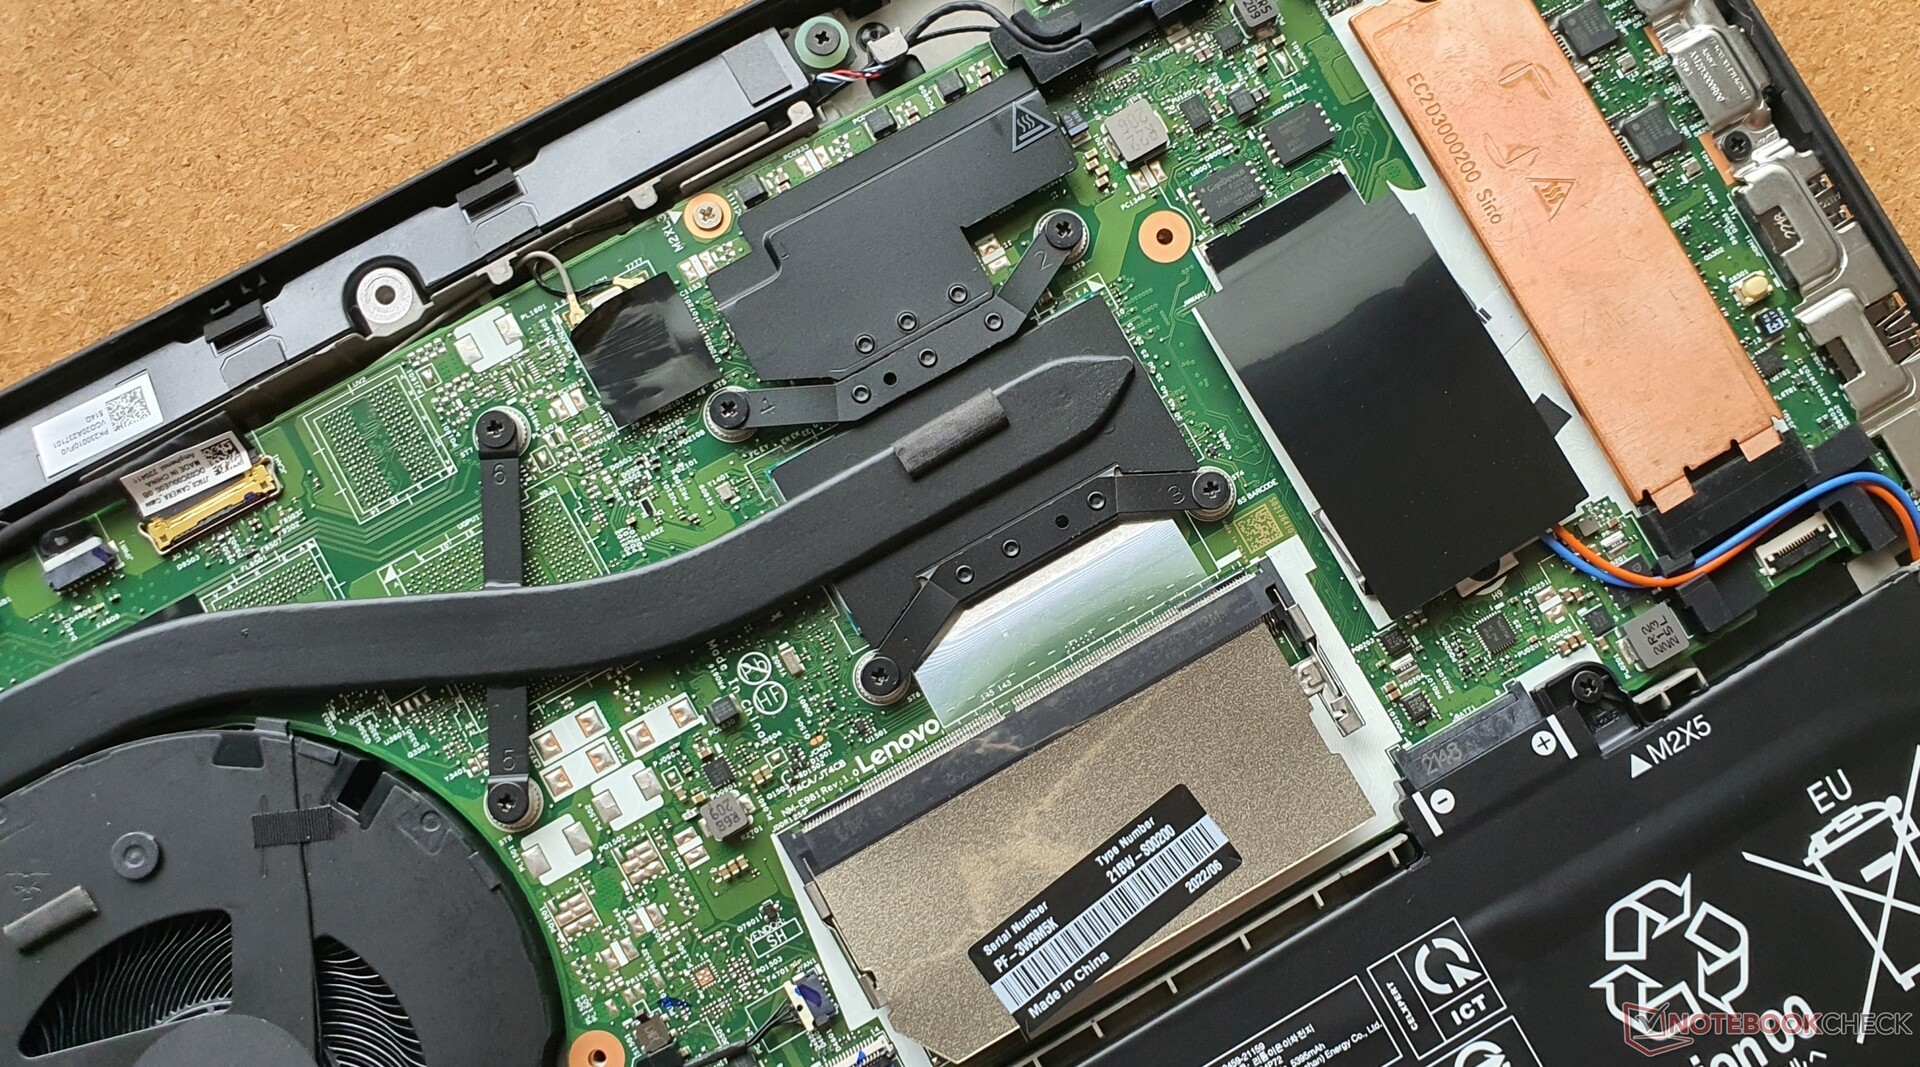
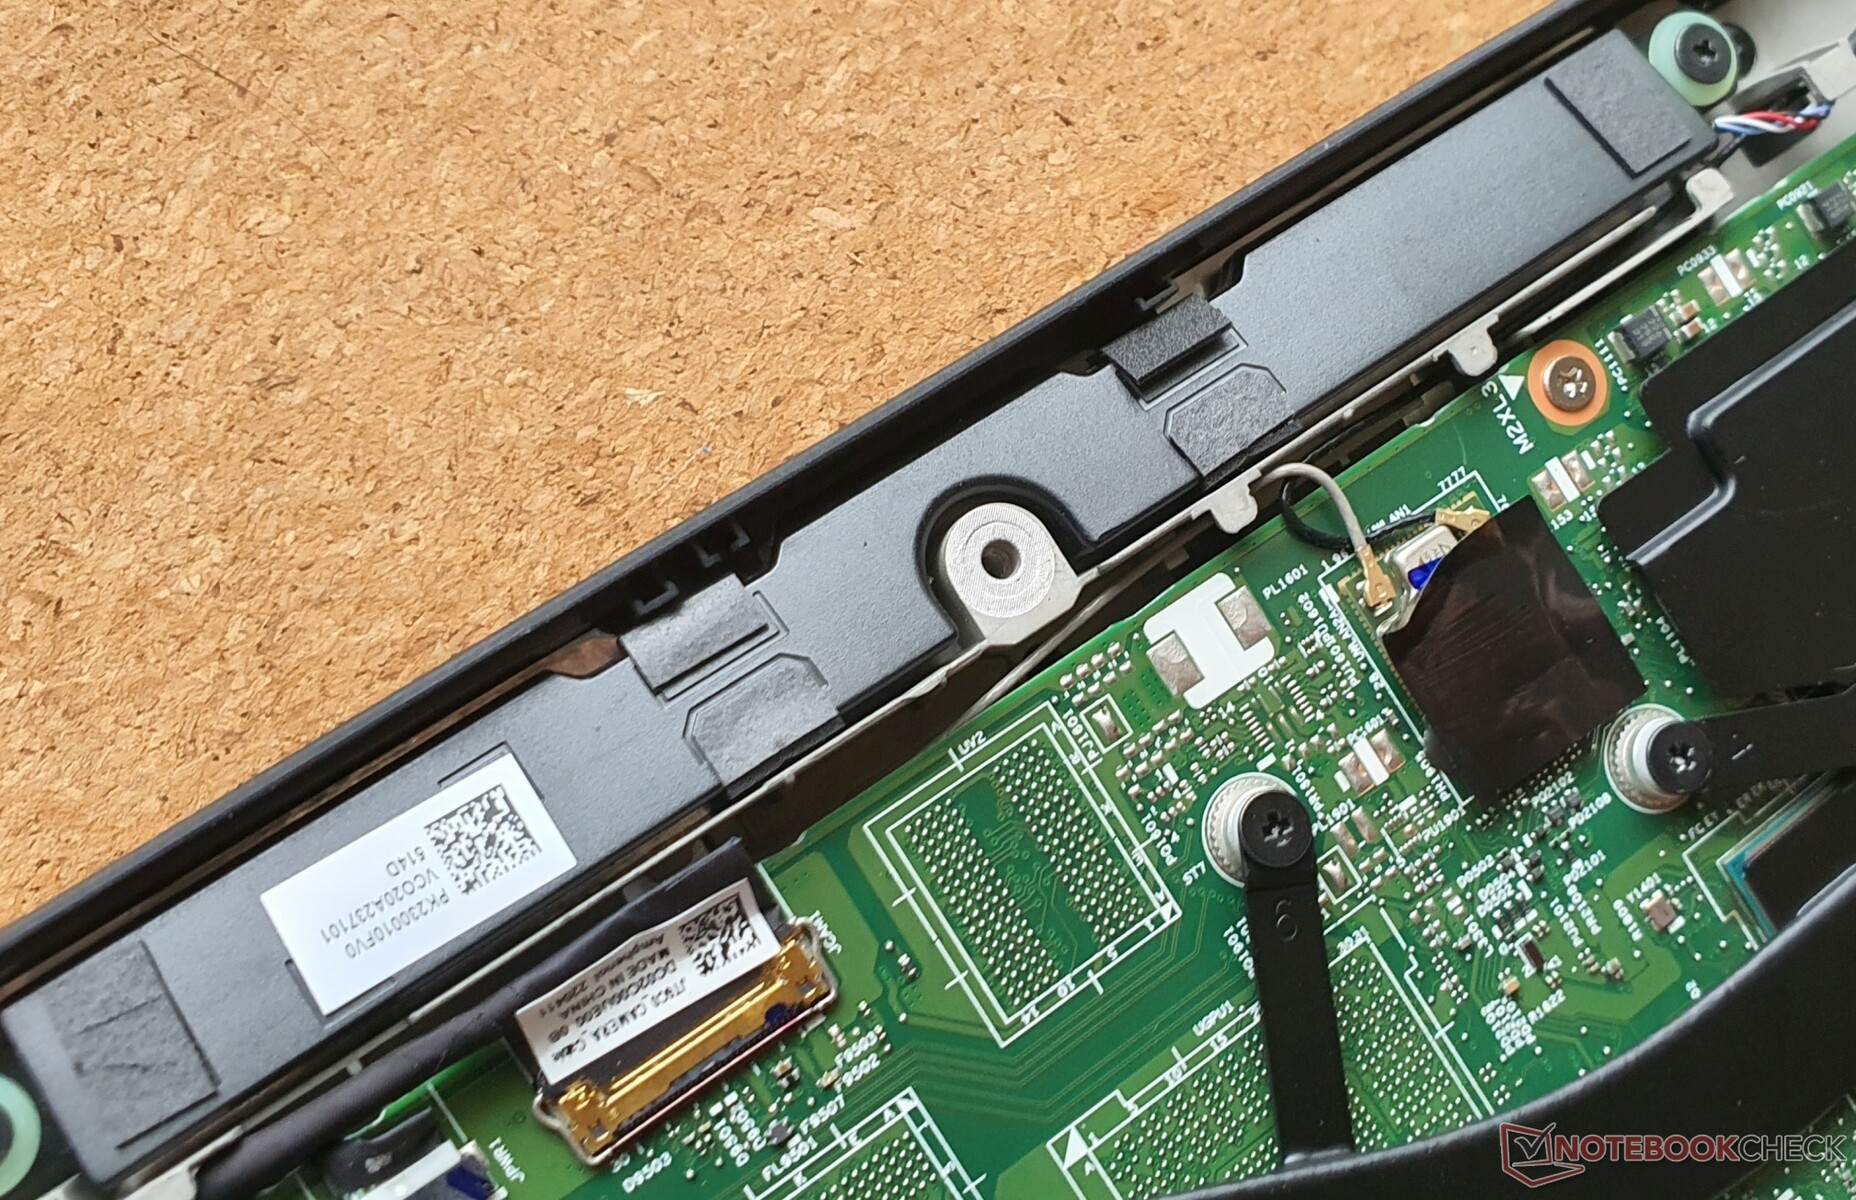
Antes de abrir o dispositivo, você deve desativar a bateria interna na BIOS. Após soltar 8 parafusos Phillips, você ainda precisa soltar algumas travas com um spudger. Depois disso, você tem acesso ao M.2-2280-SSD (PCIe 4.0) inserido, um slot RAM (livre), um slot WWAN, a bateria parafusada 86 Wh e o sistema de resfriamento, que pode ser limpo.
A inserção de um SSD no slot WWAN não é possível.
Garantia
Na Alemanha, a Lenovo fornece uma garantia de 3 anos (1 ano para a bateria). Nosso modelo vem com Premier Support, que inclui serviço no local. No entanto, o padrão é o serviço de courier ou carry-in. Uma extensão até 5 anos é possível: 223 Euros (~US$ 223) para o primeiro e 521 Euros (~US$ 521) para dois anos extras.
Estes termos de garantia podem diferir em outros países, portanto, certifique-se de verificar com seu fornecedor antes de comprar.
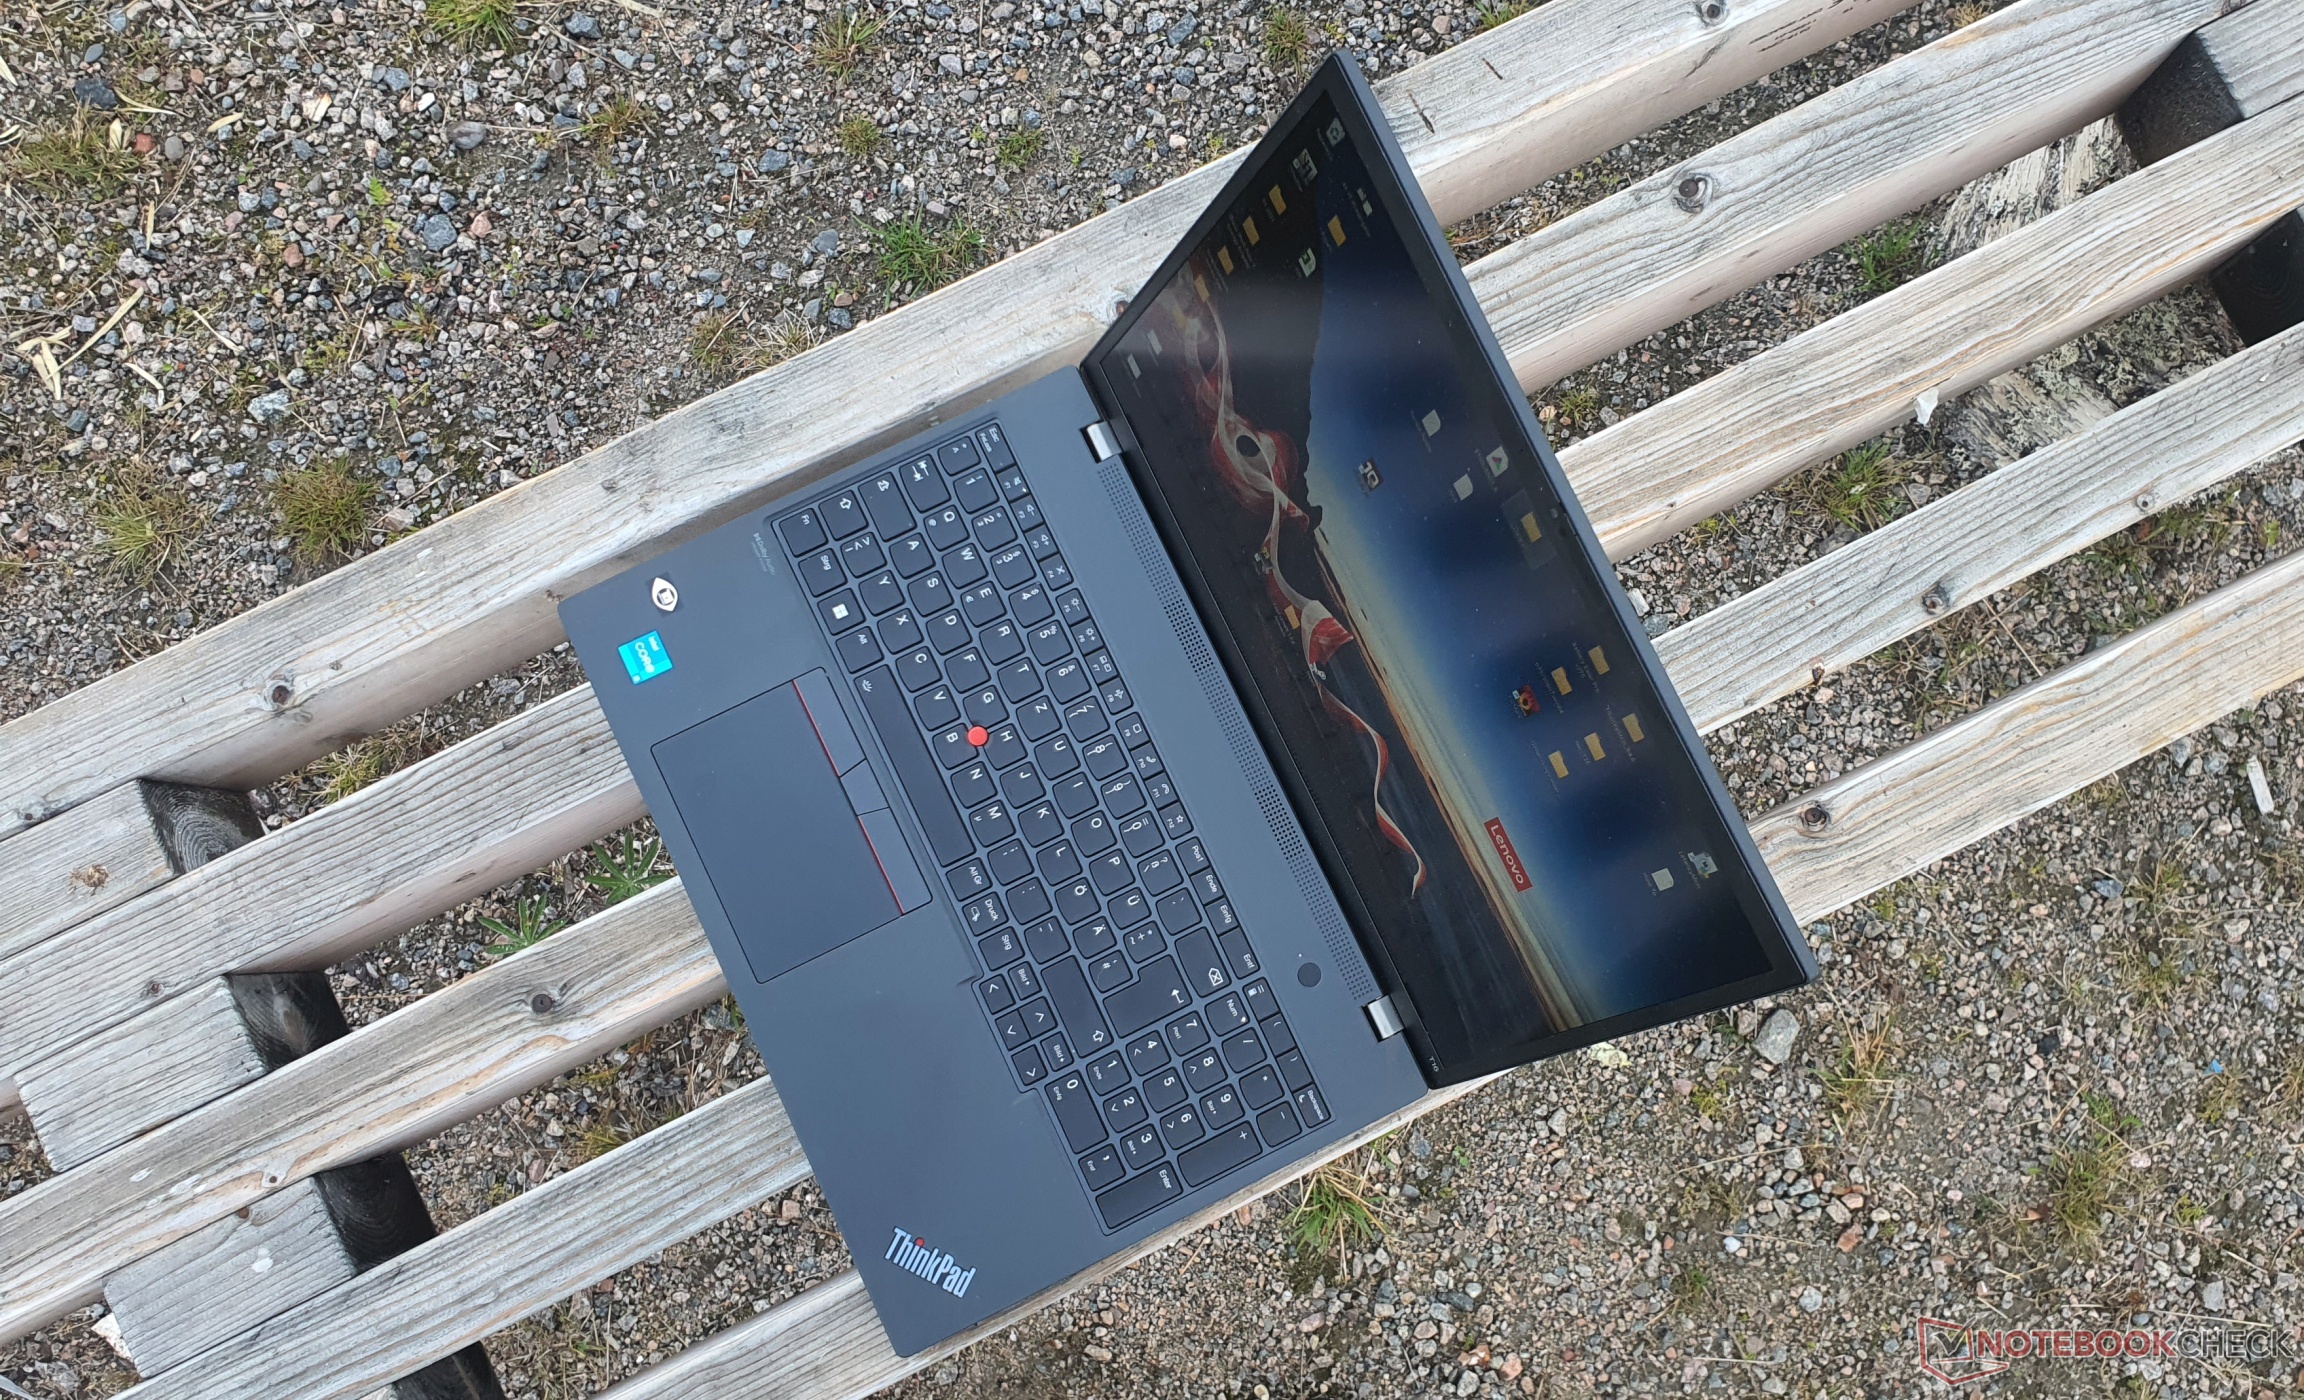
Dispositivos de entrada - curso de 1,5 mm com teclado ThinkPad substituível
Teclado
O teclado chiclet de 6 linhas à prova de respingos vem com teclas de 16x16 mm. A linha inferior e as teclas de deslocamento são agora quadradas. Algumas teclas foram reduzidas em tamanho, tais como o NumPad e as teclas de seta, mas não reduzidas pela metade (como em alguns outros modelos). Todas as chaves importantes também são dedicadas.
O deslocamento das chaves, que foi reduzido para 1,5 mm, encontrou seu caminho para a série T sem o s-sufixo este ano. Como o ponto de pressão é muito conciso e a resistência das teclas bem implementada, isto garante uma digitação mais rápida, mais precisa e também mais silenciosa do que quase todos os outros teclados. Além disso, o teclado pode ser substituído em caso de desgaste ou dano. A base do teclado só rende um pouco sob pressão dirigida, o que não é o caso quando se digita.
Touchpad & TrackPoint
O touchpad, que foi ampliado para 11,5x6,7 cm com uma superfície Mylar melhorada, é um passo mais alto em termos de capacidade de resposta, desliza mais suavemente e parece mais um vidro liso. O trabalho de beliscar e arrastar e soltar funciona maravilhosamente. As entradas são implementadas com precisão. As teclas de clique integradas oferecem uma viagem curta, mas rica e clara de feedback.
Os ventiladores TrackPoint ainda podem fazer uso do vantajoso método de controle do mouse, o que torna desnecessária a remoção da mão do teclado. Entretanto, as três teclas associadas acima do touchpad são agora completamente planas, com menos retorno e viagens. Isto pode demorar um pouco para se acostumar. No entanto, elas ainda funcionam de forma precisa e confiável.
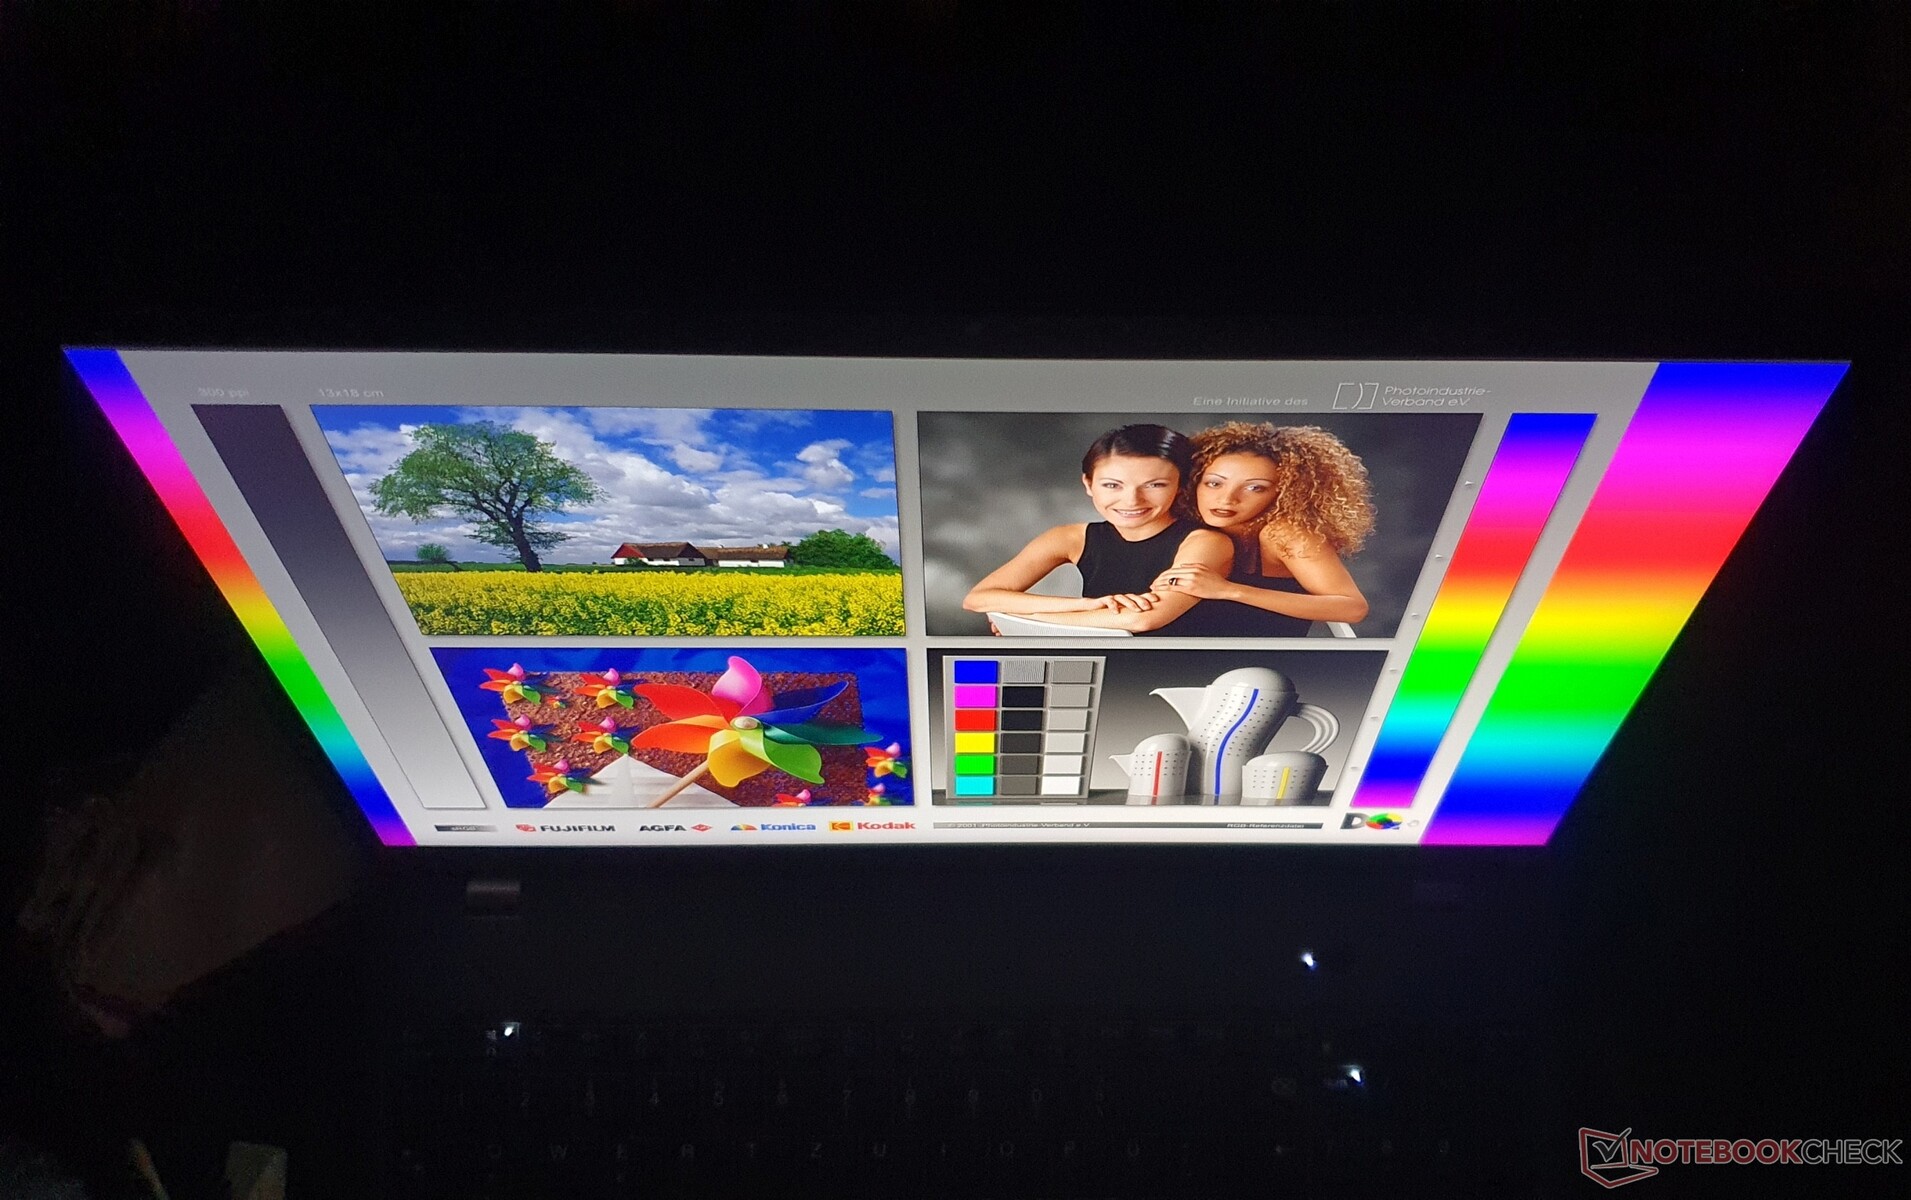
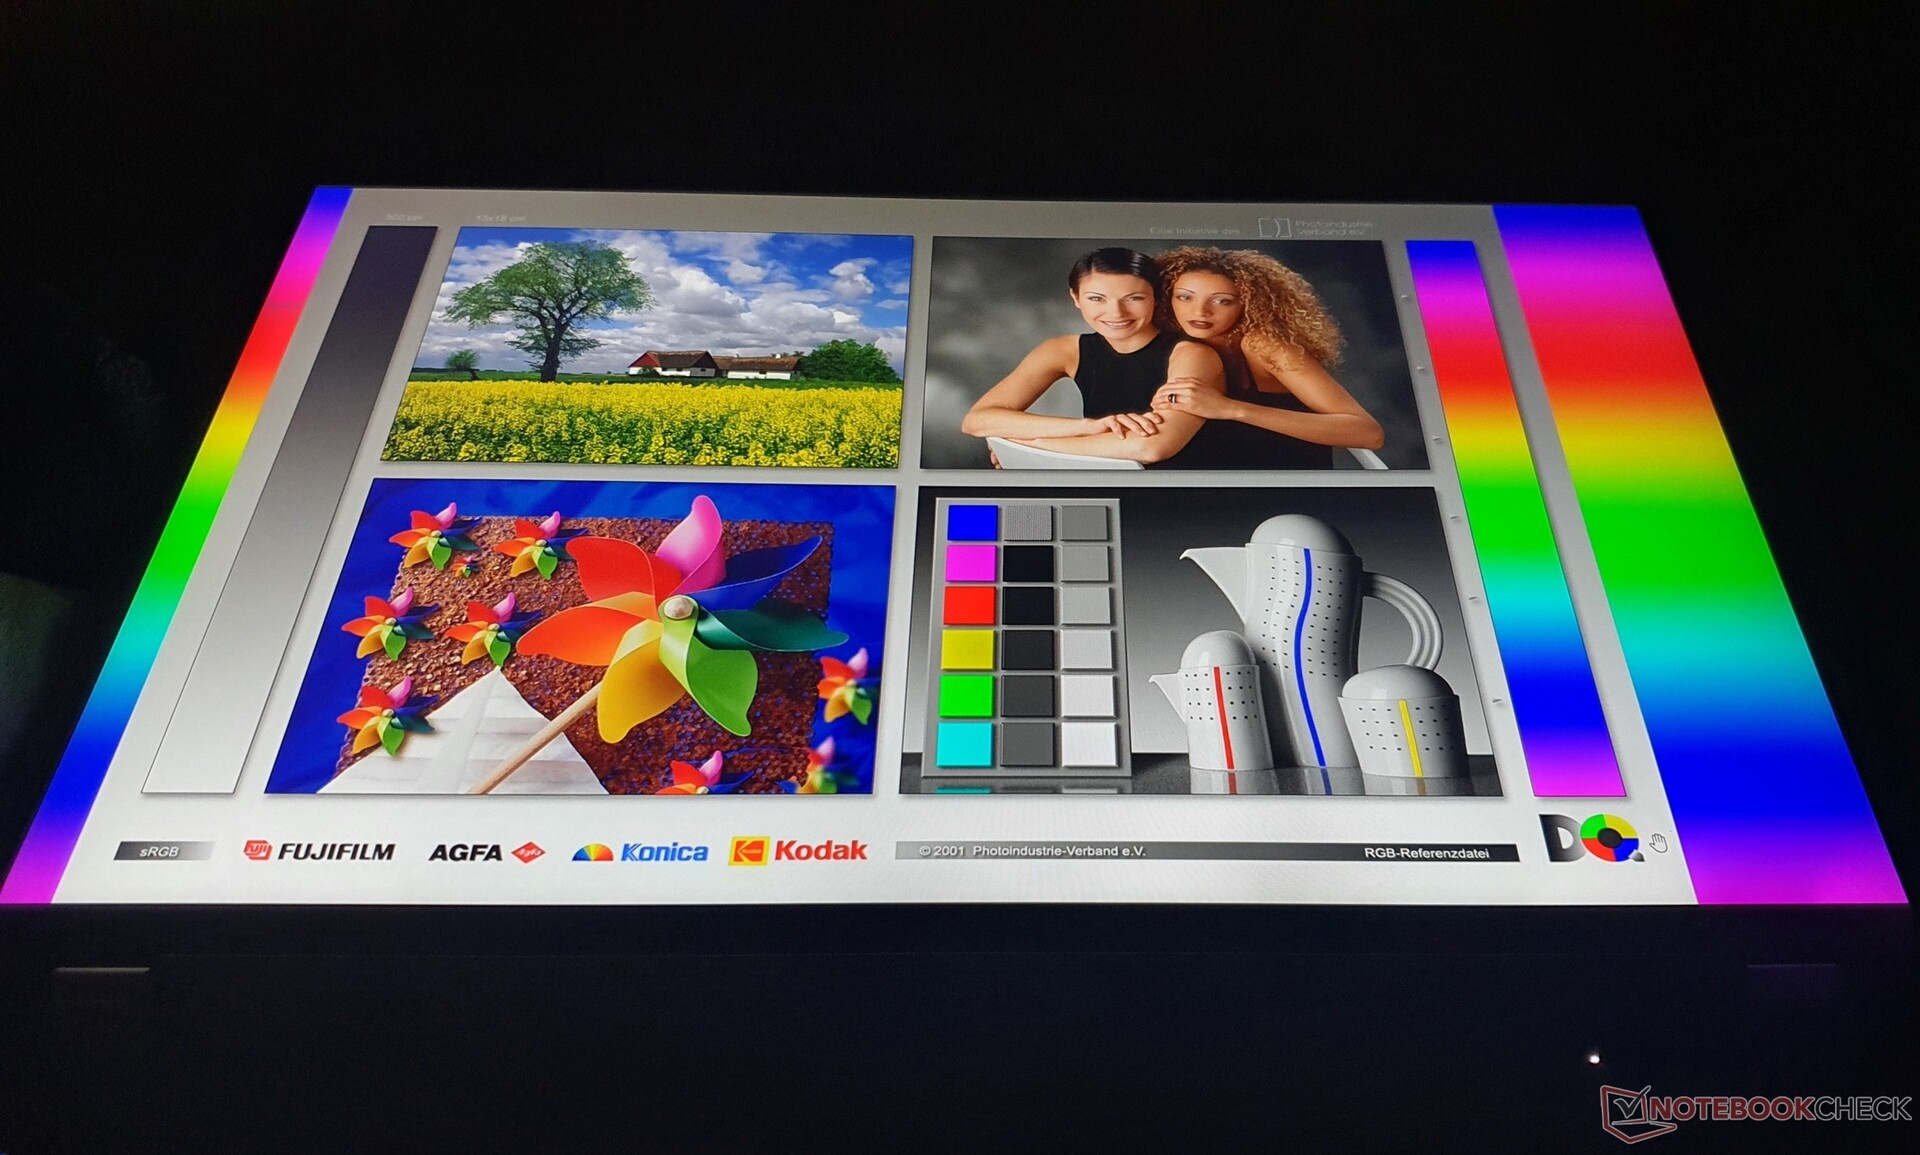
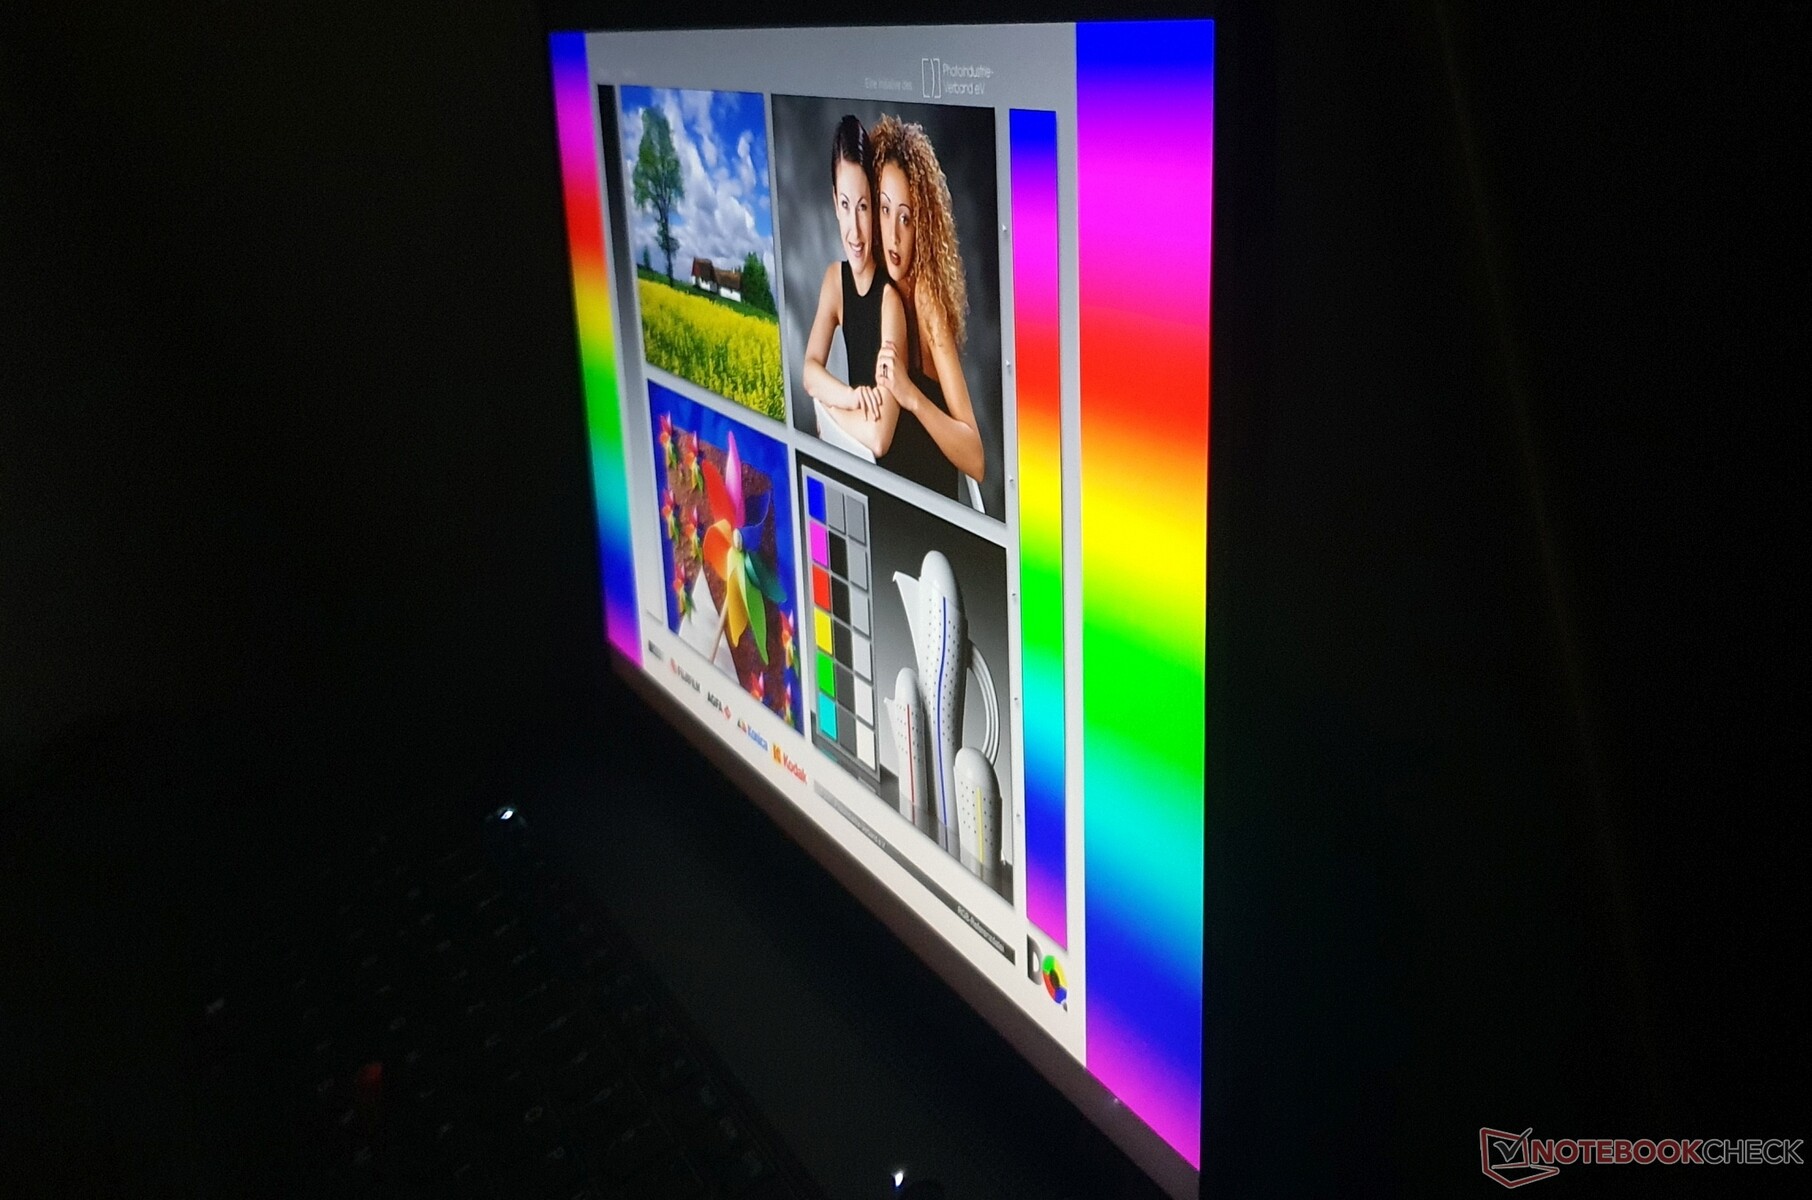
Visor - Visor de baixa potência FHD+ nítido no ThinkPad T16

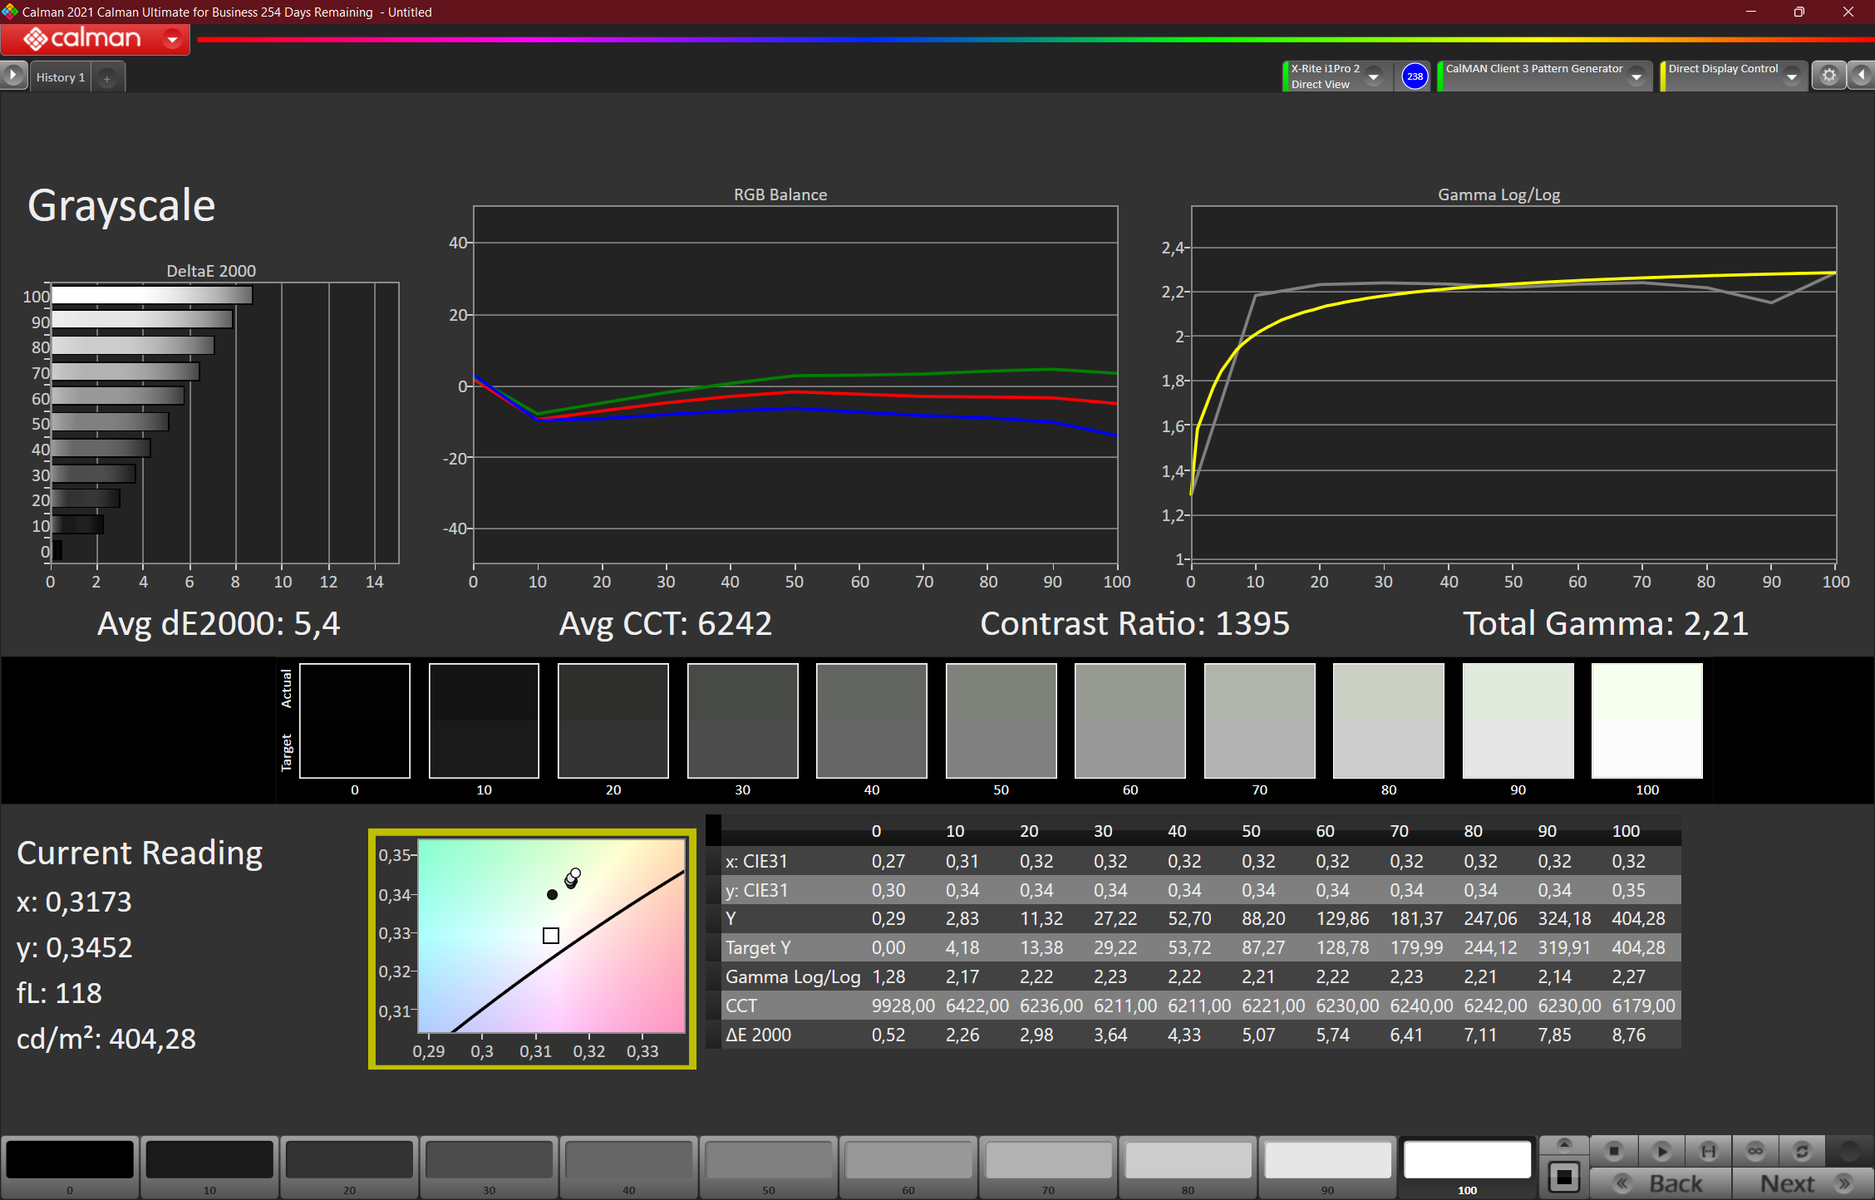
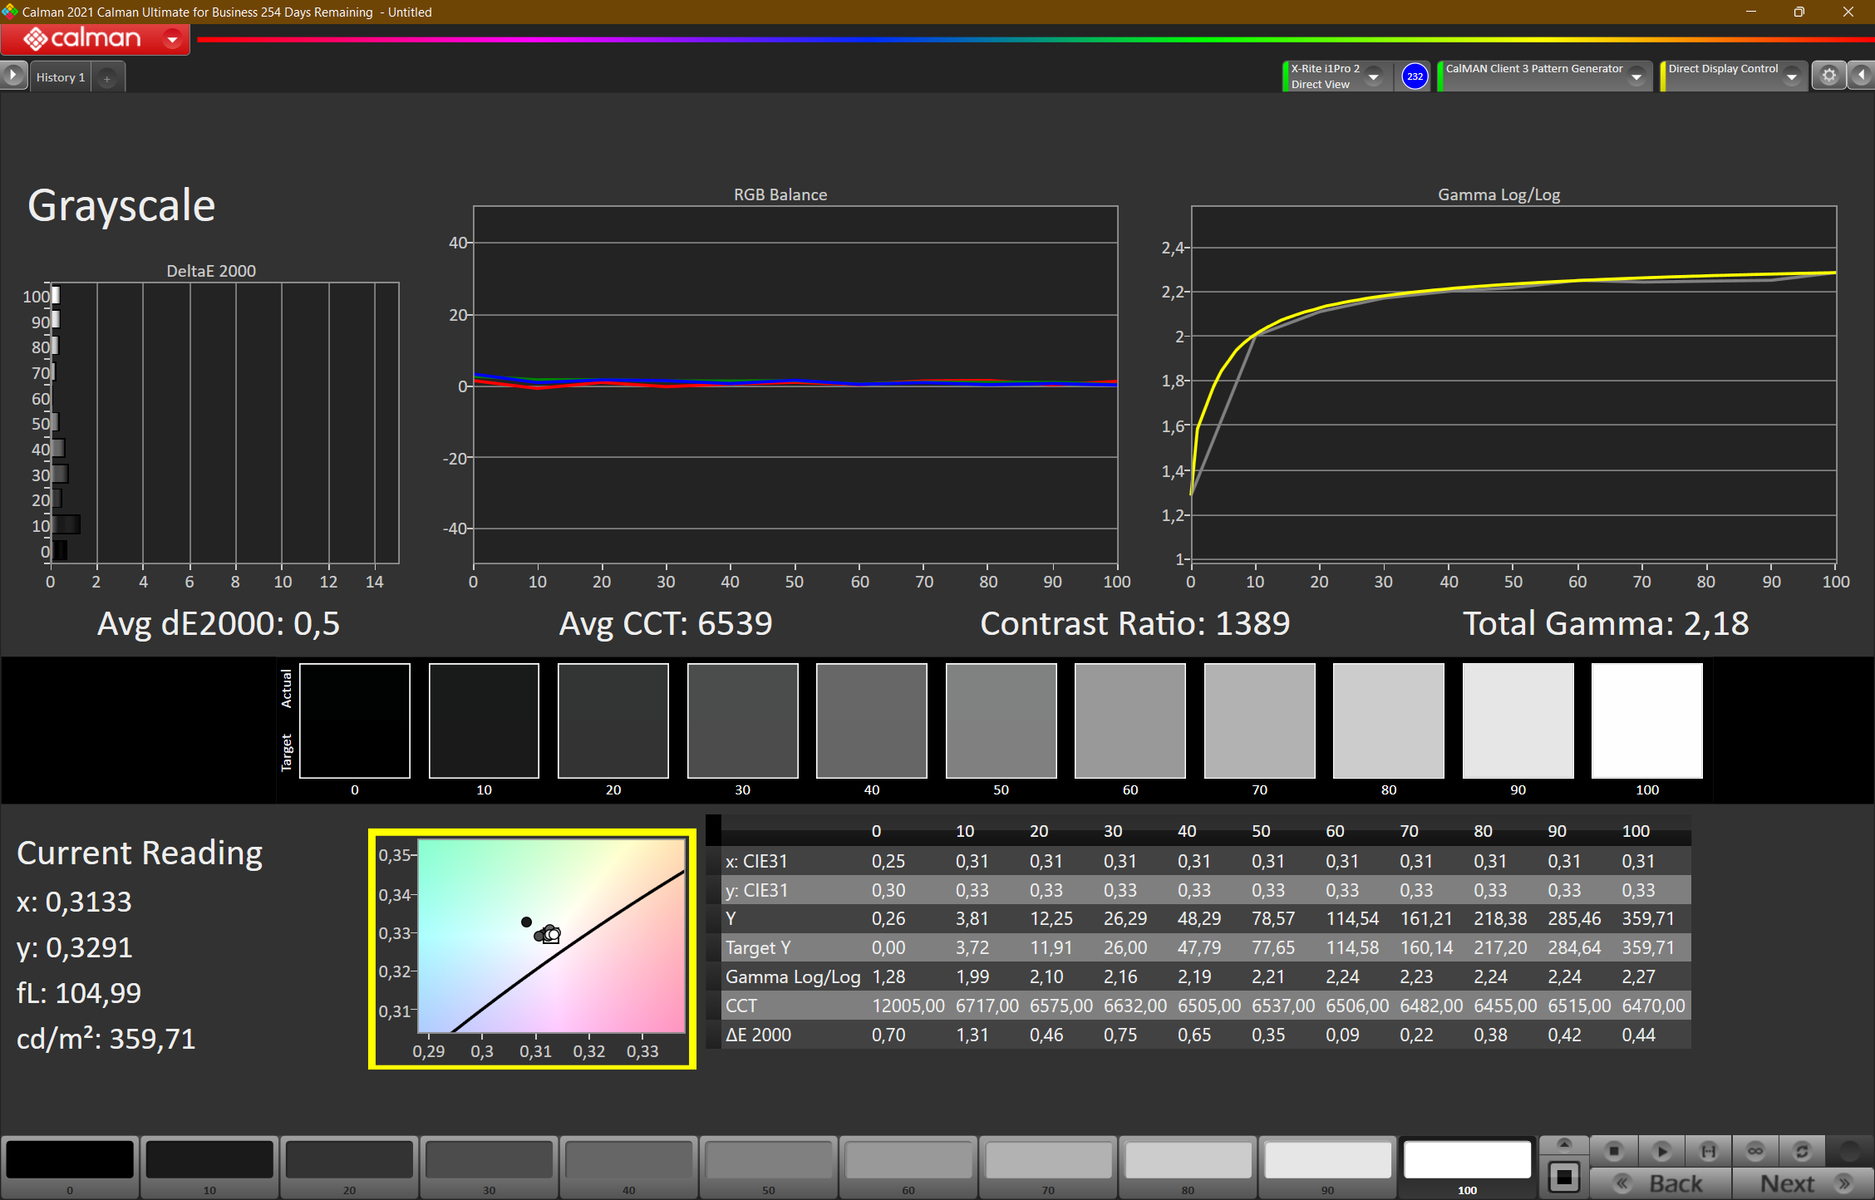
O visor mate de baixa potência no formato 16:10 instalado em nossa amostra de revisão tem uma resolução de 1920x1200 (WUXGA/FHD+) e oferece boa nitidez em 16 polegadas. O brilho de uma boa 390 lêndeas é quase como especificado (400 lêndeas). A relação de contraste (1393:1) e o valor de preto (0,29 lêndeas) também estão em um nível elevado. Como resultado, o conteúdo da imagem preta parece rico e profundo.
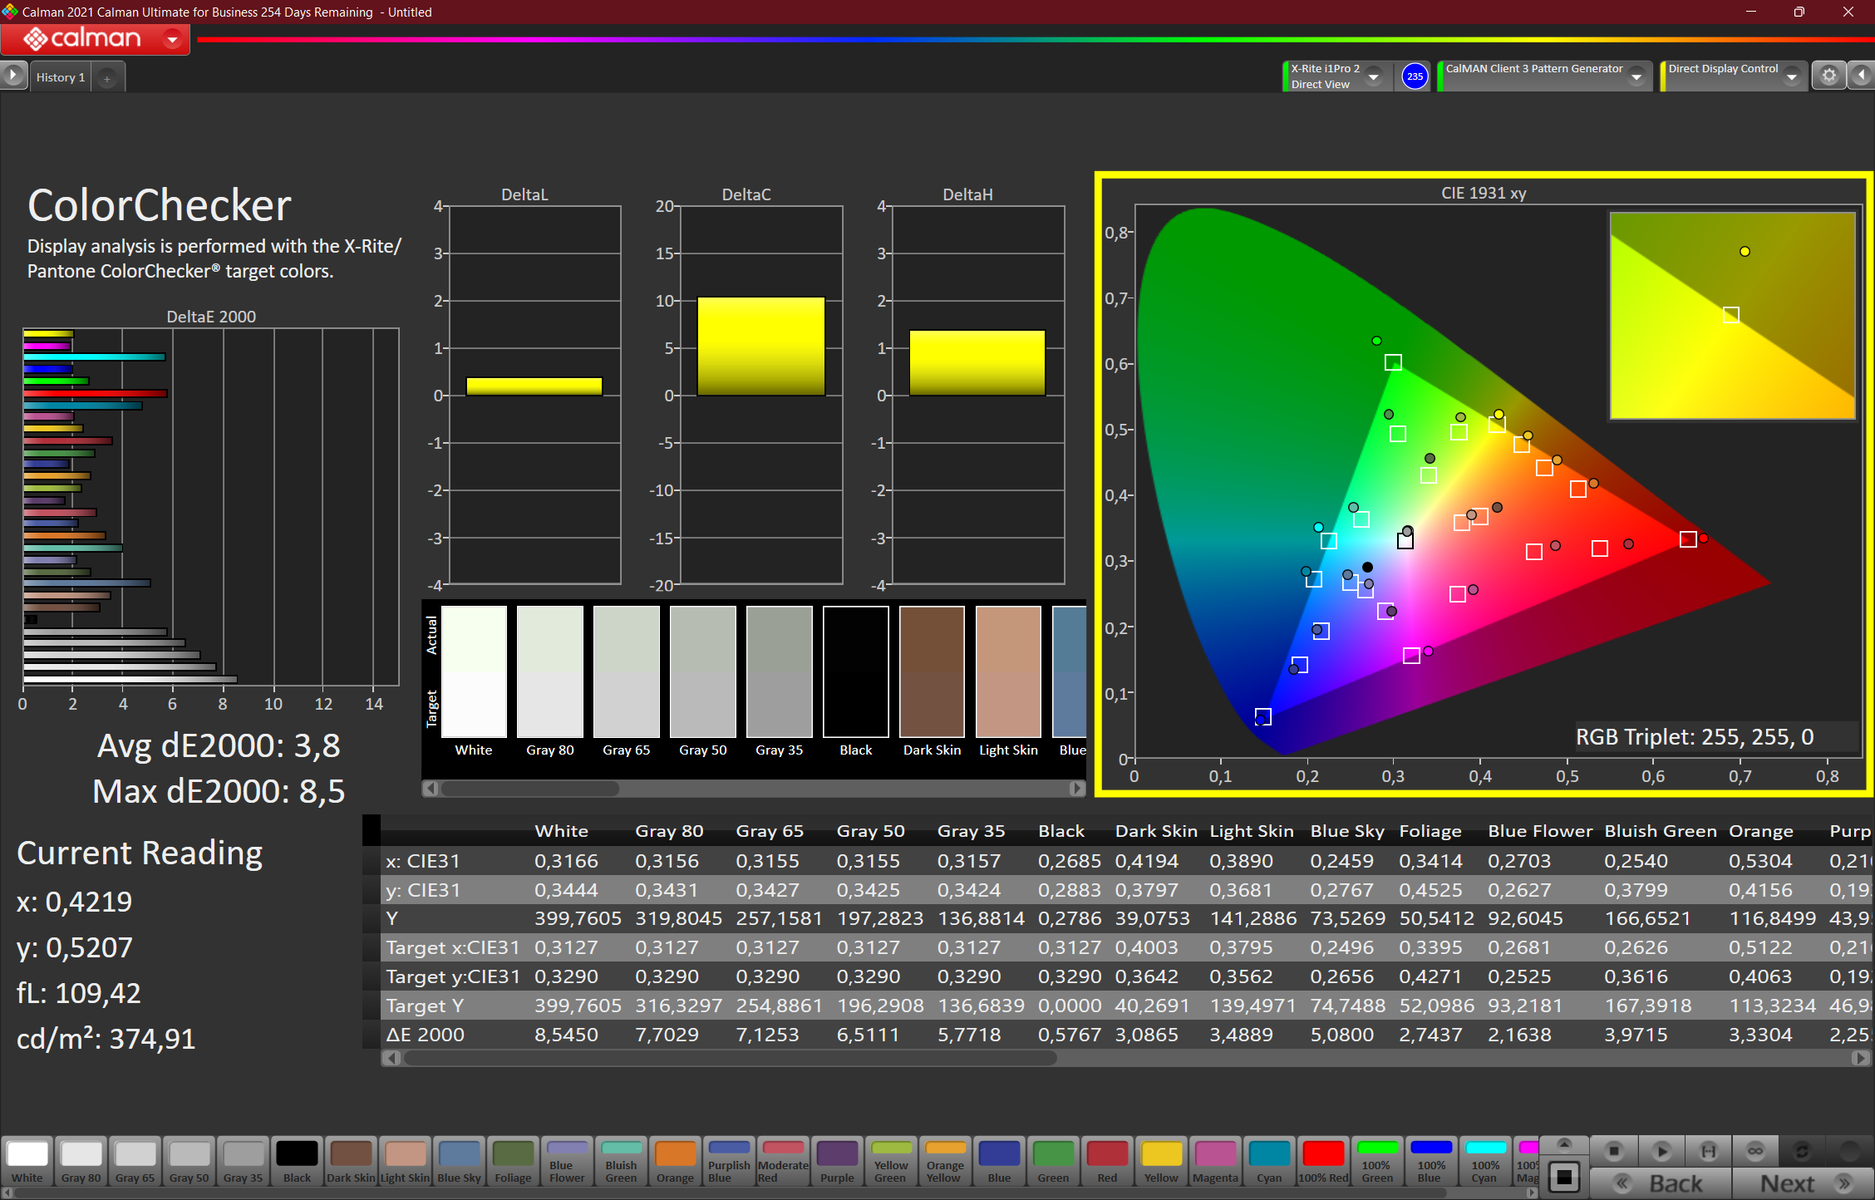
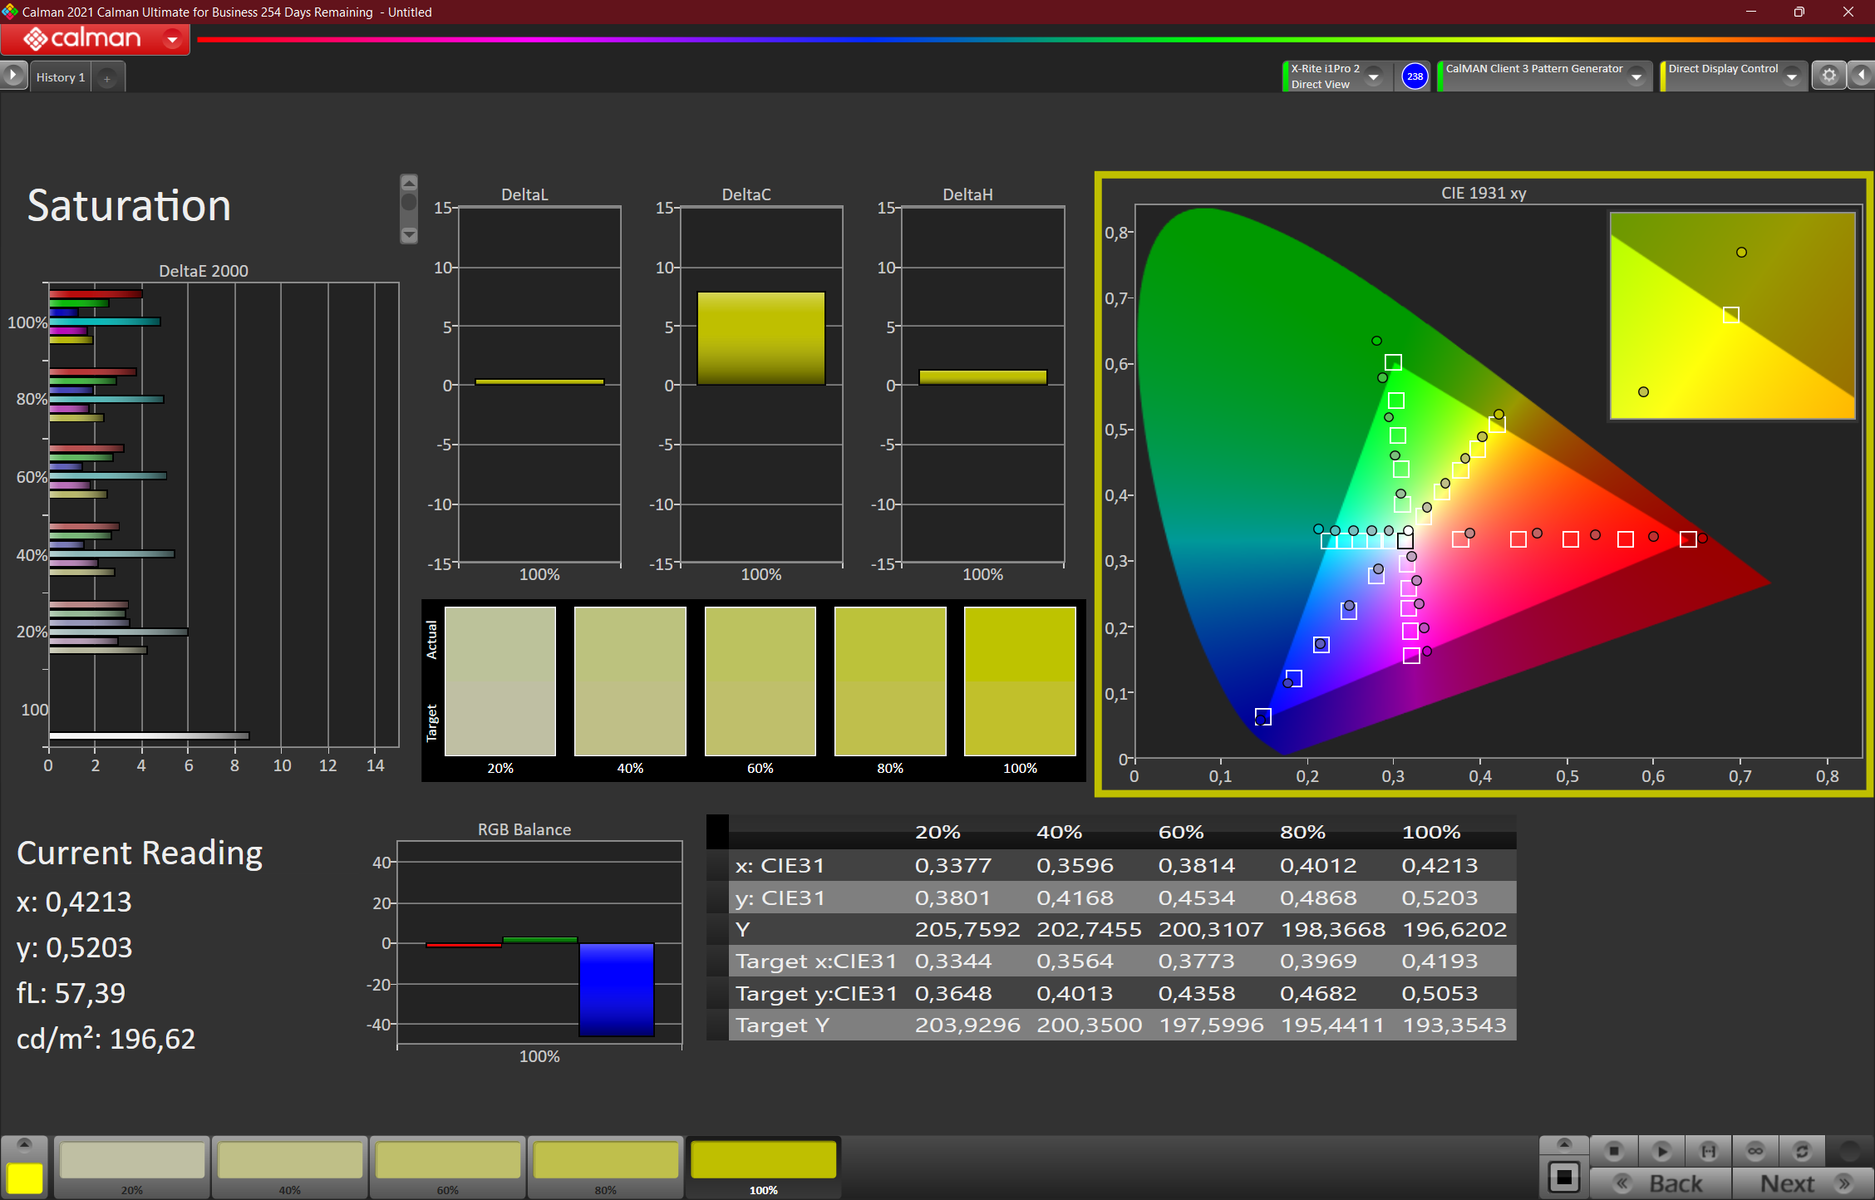
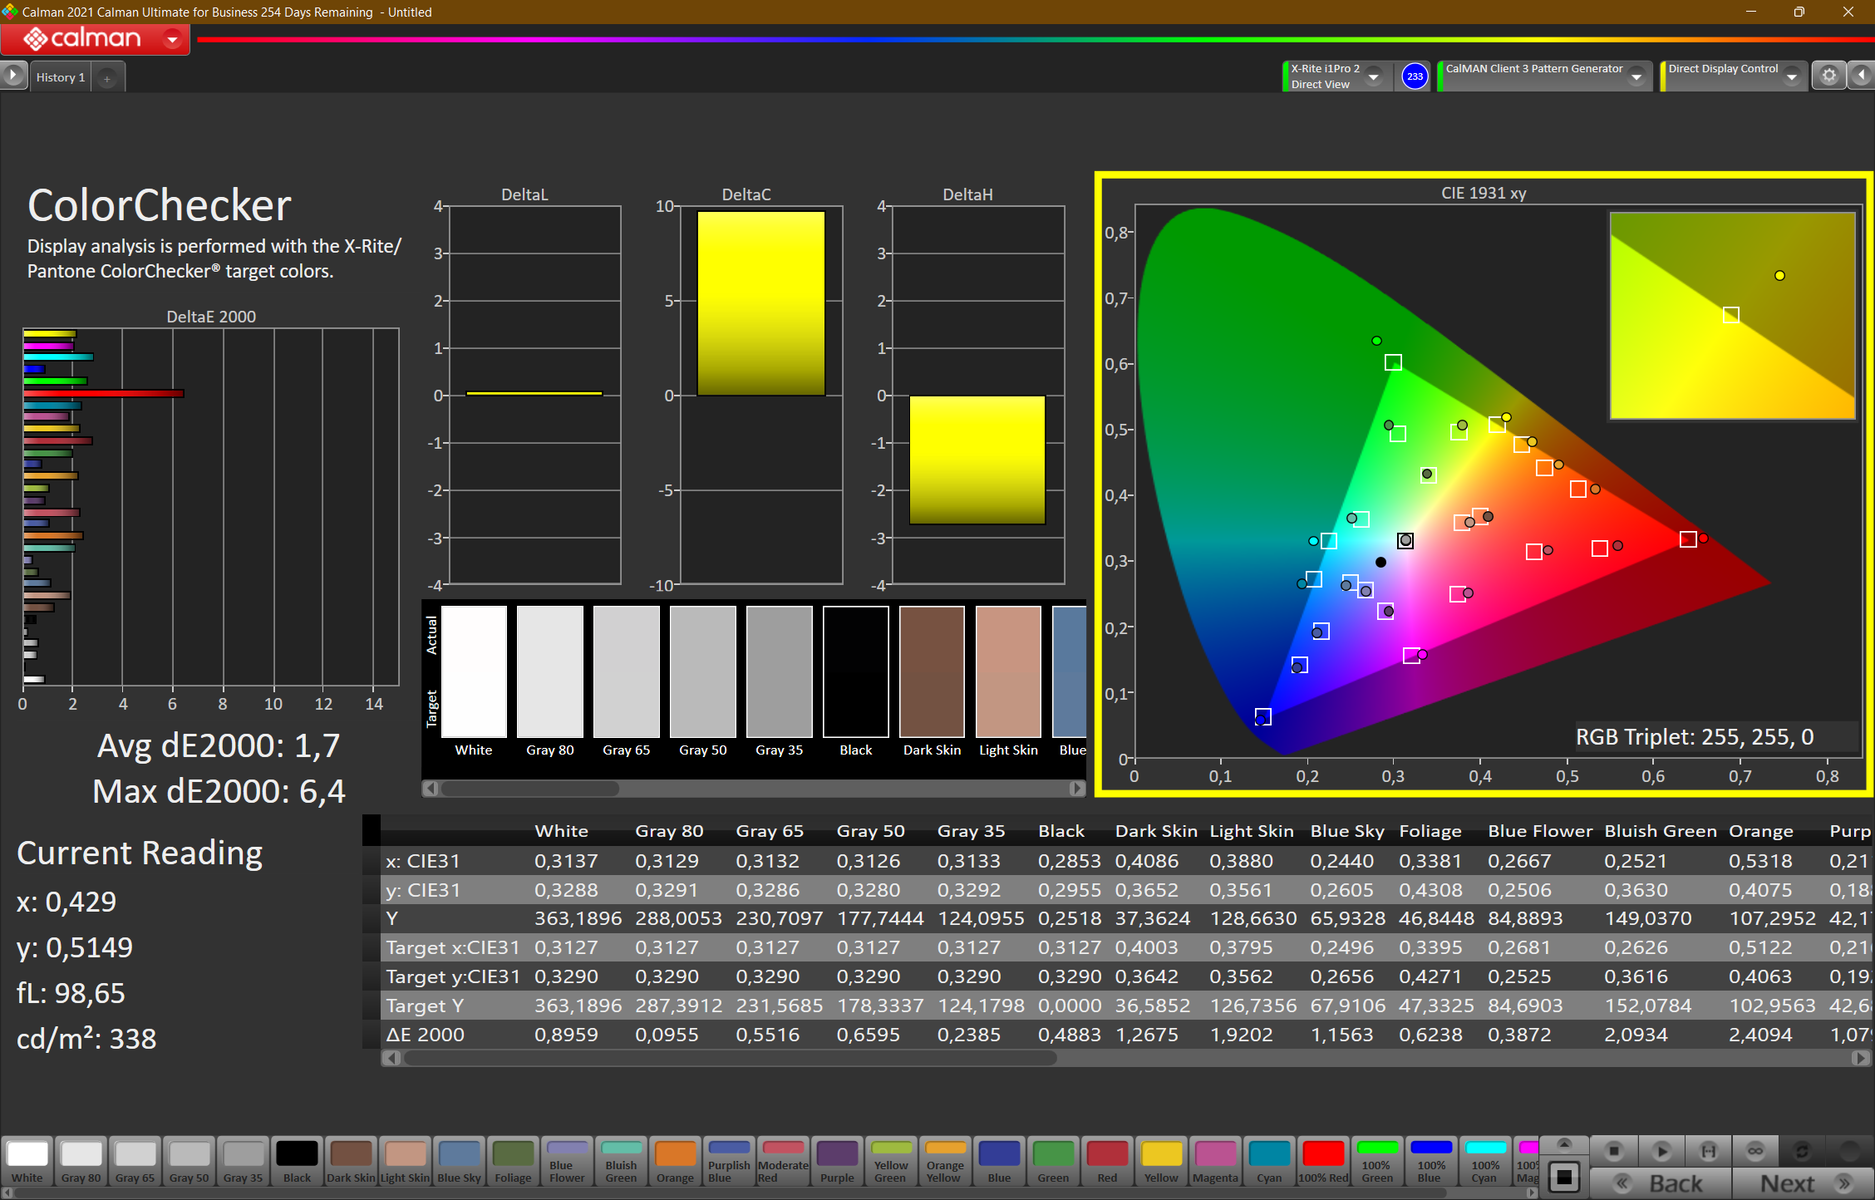
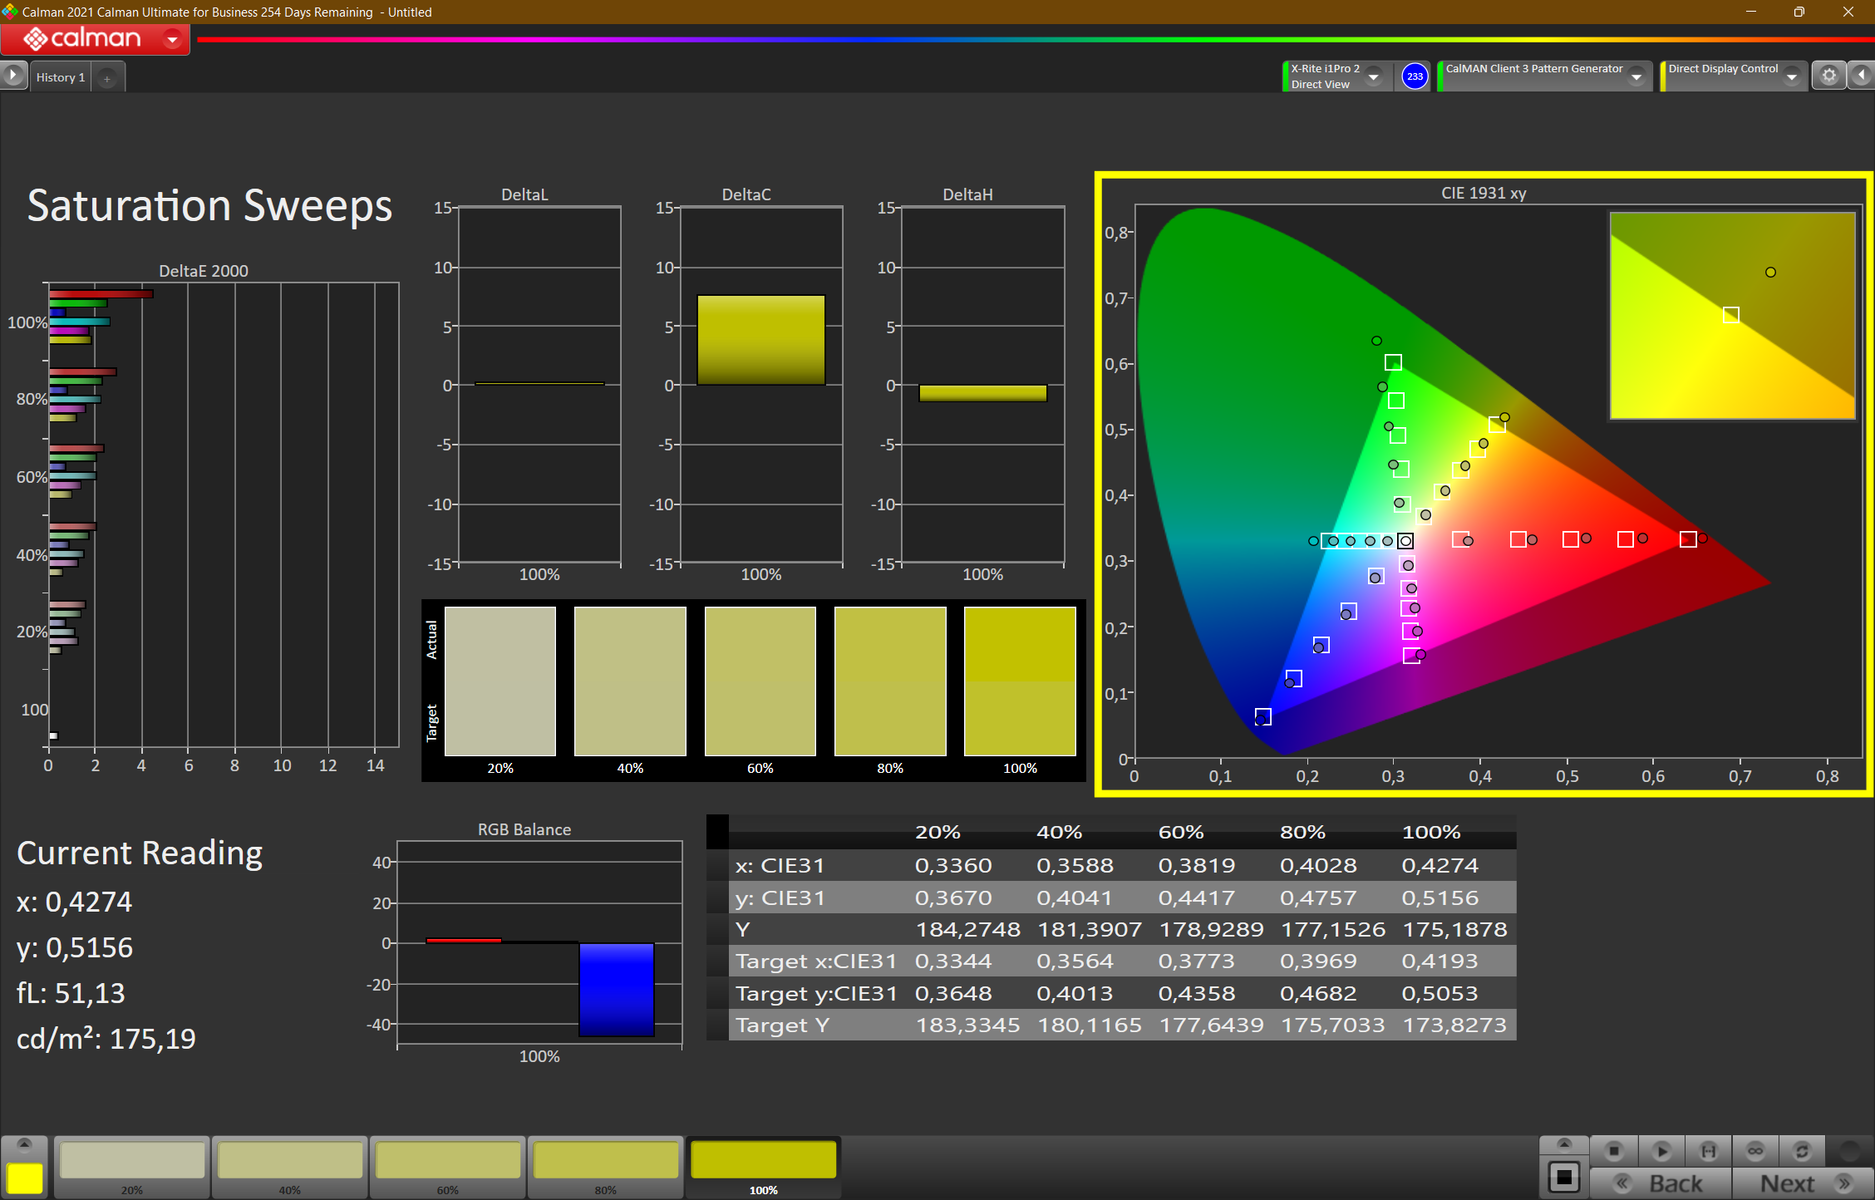
Com 6.300K, o ponto branco está próximo do ótimo de 6.500K. As cores também são relativamente vívidas e, de acordo com nossa calibração, bastante equilibradas. O DeltaE-2000 diminui de 3,9 para um muito bom 1,7 como resultado, embora o vermelho ainda se desvie fortemente.
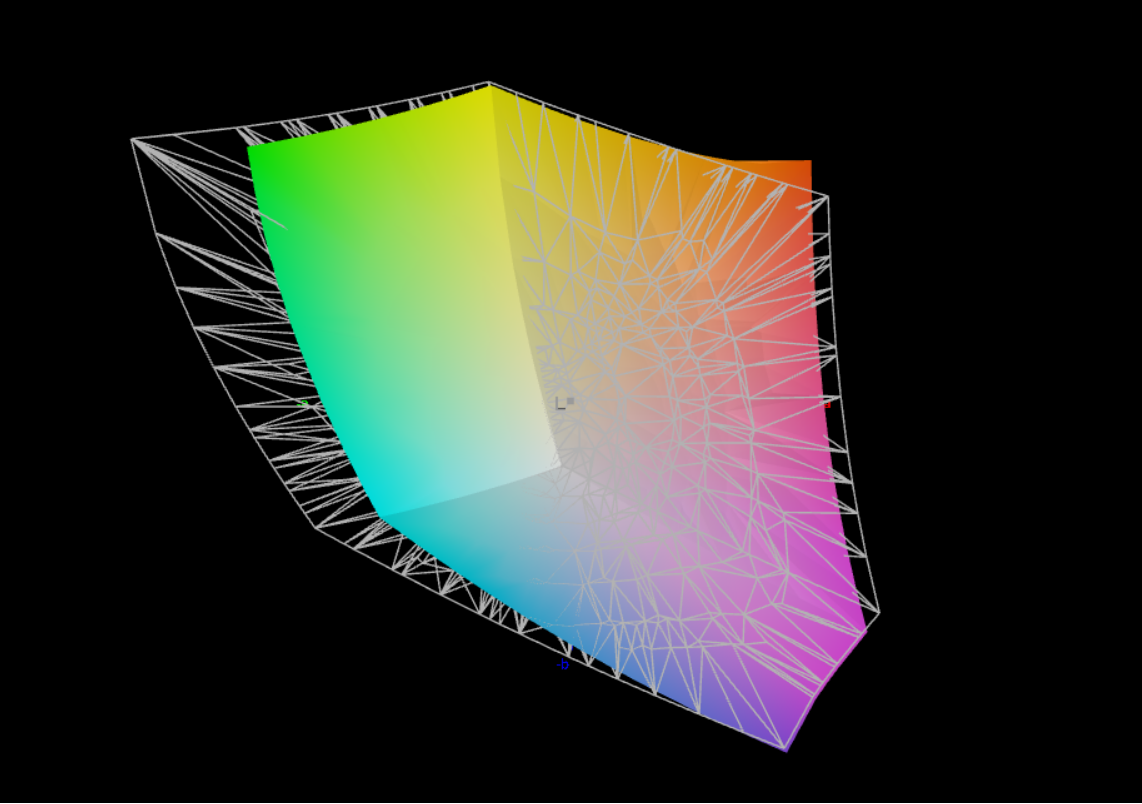
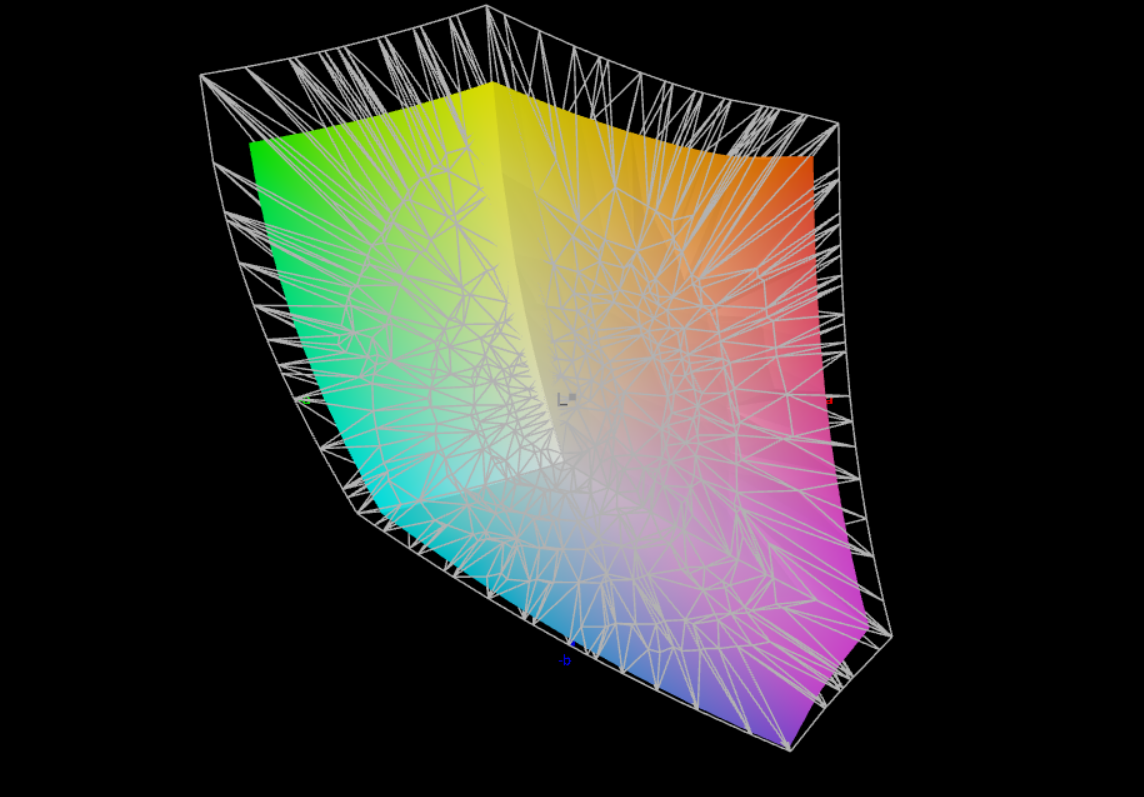
O espaço de cor sRGB é coberto a 100%, o que é suficiente para uma edição de imagem menos exigente. Não foi detectada nenhuma cintilação do PWM. Como sempre, nosso perfil de cor pode ser baixado à direita do gráfico de iluminação. Três displays alternativos são oferecidos, sendo que o painel 2,5K é novo. Infelizmente, uma opção 4K UHD com 100% DCI-P3 não está mais disponível. Em nosso campo de comparação, o painel FHD+ LP tem o melhor desempenho.
- WUXGA (1920x1200) IPS, Touch, Matte, 300 cd/m², 45% NTSC
- WUXGA (1920x1200) IPS, baixa potência, mate, 400 cd/m², 100% sRGB, luz azul baixa
- WUXGA (1920x1200) IPS, matte, touch, PrivacyGuard, 500 cd/m², 100% sRGB
- WQXGA (2.560x1.600) IPS, fosco, baixa potência, 400 cd/m², 100% sRGB, luz azul baixa
| |||||||||||||||||||||||||
iluminação: 80 %
iluminação com acumulador: 404 cd/m²
Contraste: 1393:1 (Preto: 0.29 cd/m²)
ΔE ColorChecker Calman: 3.9 | ∀{0.5-29.43 Ø4.71}
calibrated: 1.7
ΔE Greyscale Calman: 5.4 | ∀{0.09-98 Ø4.96}
80.5% AdobeRGB 1998 (Argyll 3D)
100% sRGB (Argyll 3D)
80.1% Display P3 (Argyll 3D)
Gamma: 2.21
CCT: 6242 K
| Lenovo ThinkPad T16 G1 21BWS00200 B160UAN01.K, IPS, 1920x1200, 16" | Lenovo ThinkPad T15 Gen2-20W5S00100 B156HAN02.1, IPS, 1920x1080, 15.6" | Huawei MateBook D 16 2022 BOE NV160WUM-NH0, IPS, 1920x1200, 16" | Dell Inspiron 16 Plus 7620 BOE NE16N41, IPS, 3072x1920, 16" | HP ZBook Power 15 G8 313S5EA AUOA08B, IPS LED, 1920x1080, 15.6" | HP ProBook 450 G9 6A180EA Chi Mei CMN1512, , 1920x1080, 15.6" | Lenovo ThinkPad E15 G3-20YG003UGE B156HAN02.1, IPS, 1920x1080, 15.6" | Lenovo ThinkPad L15 G2 AMD N156HCA-EAB, IPS LED, 1920x1080, 15.6" | |
|---|---|---|---|---|---|---|---|---|
| Display | -46% | -12% | -7% | -8% | -43% | -46% | -41% | |
| Display P3 Coverage (%) | 80.1 | 40.18 -50% | 66.2 -17% | 70.8 -12% | 70.5 -12% | 42.76 -47% | 40.3 -50% | 43.8 -45% |
| sRGB Coverage (%) | 100 | 60.2 -40% | 96.4 -4% | 99.5 0% | 99 -1% | 63.9 -36% | 60.2 -40% | 65.7 -34% |
| AdobeRGB 1998 Coverage (%) | 80.5 | 41.55 -48% | 68.3 -15% | 73.2 -9% | 71.3 -11% | 44.2 -45% | 41.6 -48% | 45.3 -44% |
| Response Times | -85% | -12% | -53% | -125% | -11% | -71% | -62% | |
| Response Time Grey 50% / Grey 80% * (ms) | 27 ? | 48.8 ? -81% | 30.5 ? -13% | 38 ? -41% | 61 -126% | 28 ? -4% | 44 ? -63% | 40 -48% |
| Response Time Black / White * (ms) | 17 ? | 32 ? -88% | 18.7 ? -10% | 28 ? -65% | 38 ? -124% | 20 ? -18% | 30.4 ? -79% | 30 -76% |
| PWM Frequency (Hz) | ||||||||
| Screen | -39% | 7% | 22% | 25% | -34% | -27% | -18% | |
| Brightness middle (cd/m²) | 404 | 353 -13% | 319 -21% | 288.9 -28% | 393 -3% | 234 -42% | 347 -14% | 298 -26% |
| Brightness (cd/m²) | 391 | 348 -11% | 317 -19% | 276 -29% | 385 -2% | 218 -44% | 329 -16% | 276 -29% |
| Brightness Distribution (%) | 80 | 95 19% | 90 13% | 92 15% | 78 -2% | 85 6% | 93 16% | 86 8% |
| Black Level * (cd/m²) | 0.29 | 0.2 31% | 0.23 21% | 0.26 10% | 0.25 14% | 0.17 41% | 0.25 14% | 0.26 10% |
| Contrast (:1) | 1393 | 1765 27% | 1387 0% | 1111 -20% | 1572 13% | 1376 -1% | 1388 0% | 1146 -18% |
| Colorchecker dE 2000 * | 3.9 | 6.1 -56% | 3.4 13% | 1.88 52% | 1.5 62% | 5.04 -29% | 4.7 -21% | 3.7 5% |
| Colorchecker dE 2000 max. * | 8.5 | 23.5 -176% | 8.1 5% | 4.37 49% | 4.3 49% | 18.04 -112% | 19.4 -128% | 15 -76% |
| Colorchecker dE 2000 calibrated * | 1.7 | 4.9 -188% | 0.8 53% | 0.42 75% | 1.4 18% | 4.13 -143% | 4.4 -159% | 3.5 -106% |
| Greyscale dE 2000 * | 5.4 | 4.6 15% | 5.7 -6% | 1.4 74% | 1.3 76% | 4.43 18% | 1.7 69% | 1.7 69% |
| Gamma | 2.21 100% | 2.26 97% | 2.1 105% | 2.3 96% | 2.26 97% | 2.41 91% | 2.2 100% | 2.21 100% |
| CCT | 6242 104% | 6732 97% | 7433 87% | 6634 98% | 6435 101% | 6350 102% | 6475 100% | 6588 99% |
| Color Space (Percent of AdobeRGB 1998) (%) | 38.2 | |||||||
| Color Space (Percent of sRGB) (%) | 59.8 | |||||||
| Média Total (Programa/Configurações) | -57% /
-47% | -6% /
0% | -13% /
5% | -36% /
-4% | -29% /
-33% | -48% /
-37% | -40% /
-29% |
* ... menor é melhor
Exibir tempos de resposta
| ↔ Tempo de resposta preto para branco | ||
|---|---|---|
| 17 ms ... ascensão ↗ e queda ↘ combinadas | ↗ 8 ms ascensão |  |
| ↘ 9 ms queda | ||
| A tela mostra boas taxas de resposta em nossos testes, mas pode ser muito lenta para jogadores competitivos. Em comparação, todos os dispositivos testados variam de 0.1 (mínimo) a 240 (máximo) ms. » 39 % de todos os dispositivos são melhores. Isso significa que o tempo de resposta medido é melhor que a média de todos os dispositivos testados (19.8 ms). | ||
| ↔ Tempo de resposta 50% cinza a 80% cinza | ||
| 27 ms ... ascensão ↗ e queda ↘ combinadas | ↗ 12 ms ascensão |  |
| ↘ 15 ms queda | ||
| A tela mostra taxas de resposta relativamente lentas em nossos testes e pode ser muito lenta para os jogadores. Em comparação, todos os dispositivos testados variam de 0.165 (mínimo) a 636 (máximo) ms. » 37 % de todos os dispositivos são melhores. Isso significa que o tempo de resposta medido é melhor que a média de todos os dispositivos testados (31 ms). | ||
Cintilação da tela / PWM (modulação por largura de pulso)
| Tela tremeluzindo / PWM não detectado |  | ||
[pwm_comparison] Em comparação: 52 % de todos os dispositivos testados não usam PWM para escurecer a tela. Se PWM foi detectado, uma média de 7757 (mínimo: 5 - máximo: 343500) Hz foi medida. | |||
Ao ar livre, a tela mate é fácil de ler a uma média de 390 lêndeas. Entretanto, você deve evitar a luz direta do sol.


Performance - Limites da Lenovo com estrangulamento artificial
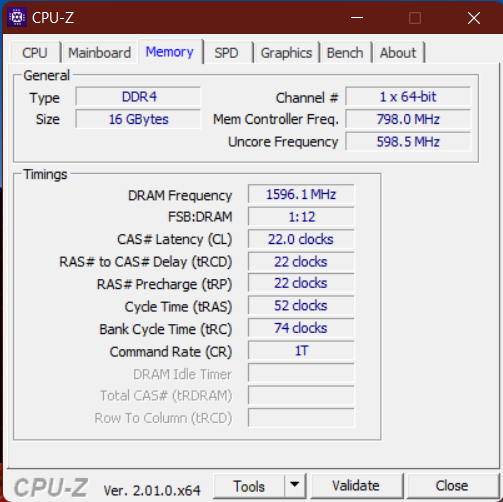
Nosso modelo é equipado com 16 GB de RAM DDR4-3200 soldada (canal único) e é alimentado pela Intel Núcleo i5-1240Pcom uma unidade gráfica integrada. Além disso, há um SSD de 512 GB no padrão PCIe 4.0. O sistema é destinado a tarefas de escritório e outras tarefas comerciais típicas.
Não se destina à edição de vídeo e jogos e só está disponível em configurações alternativas com o GeForce MX550mais RAM (em SODIMM livre) e possivelmente uma CPU mais forte (i7-1280Pcomo também existem modelos com a AMD este ano, vale a pena considerar esta opção. Tentaremos rever também um modelo deste tipo.
Condições de teste
A Lenovo não oferece seus próprios perfis de potência para seus ThinkPads, mas os integra nas configurações de energia do Windows. O modo automático de "resfriamento inteligente" pode ser desativado com "Fn+T". Os benchmarks relacionados ao desempenho foram realizados sob o perfil de desempenho máximo com o modo Automático desativado
Processador
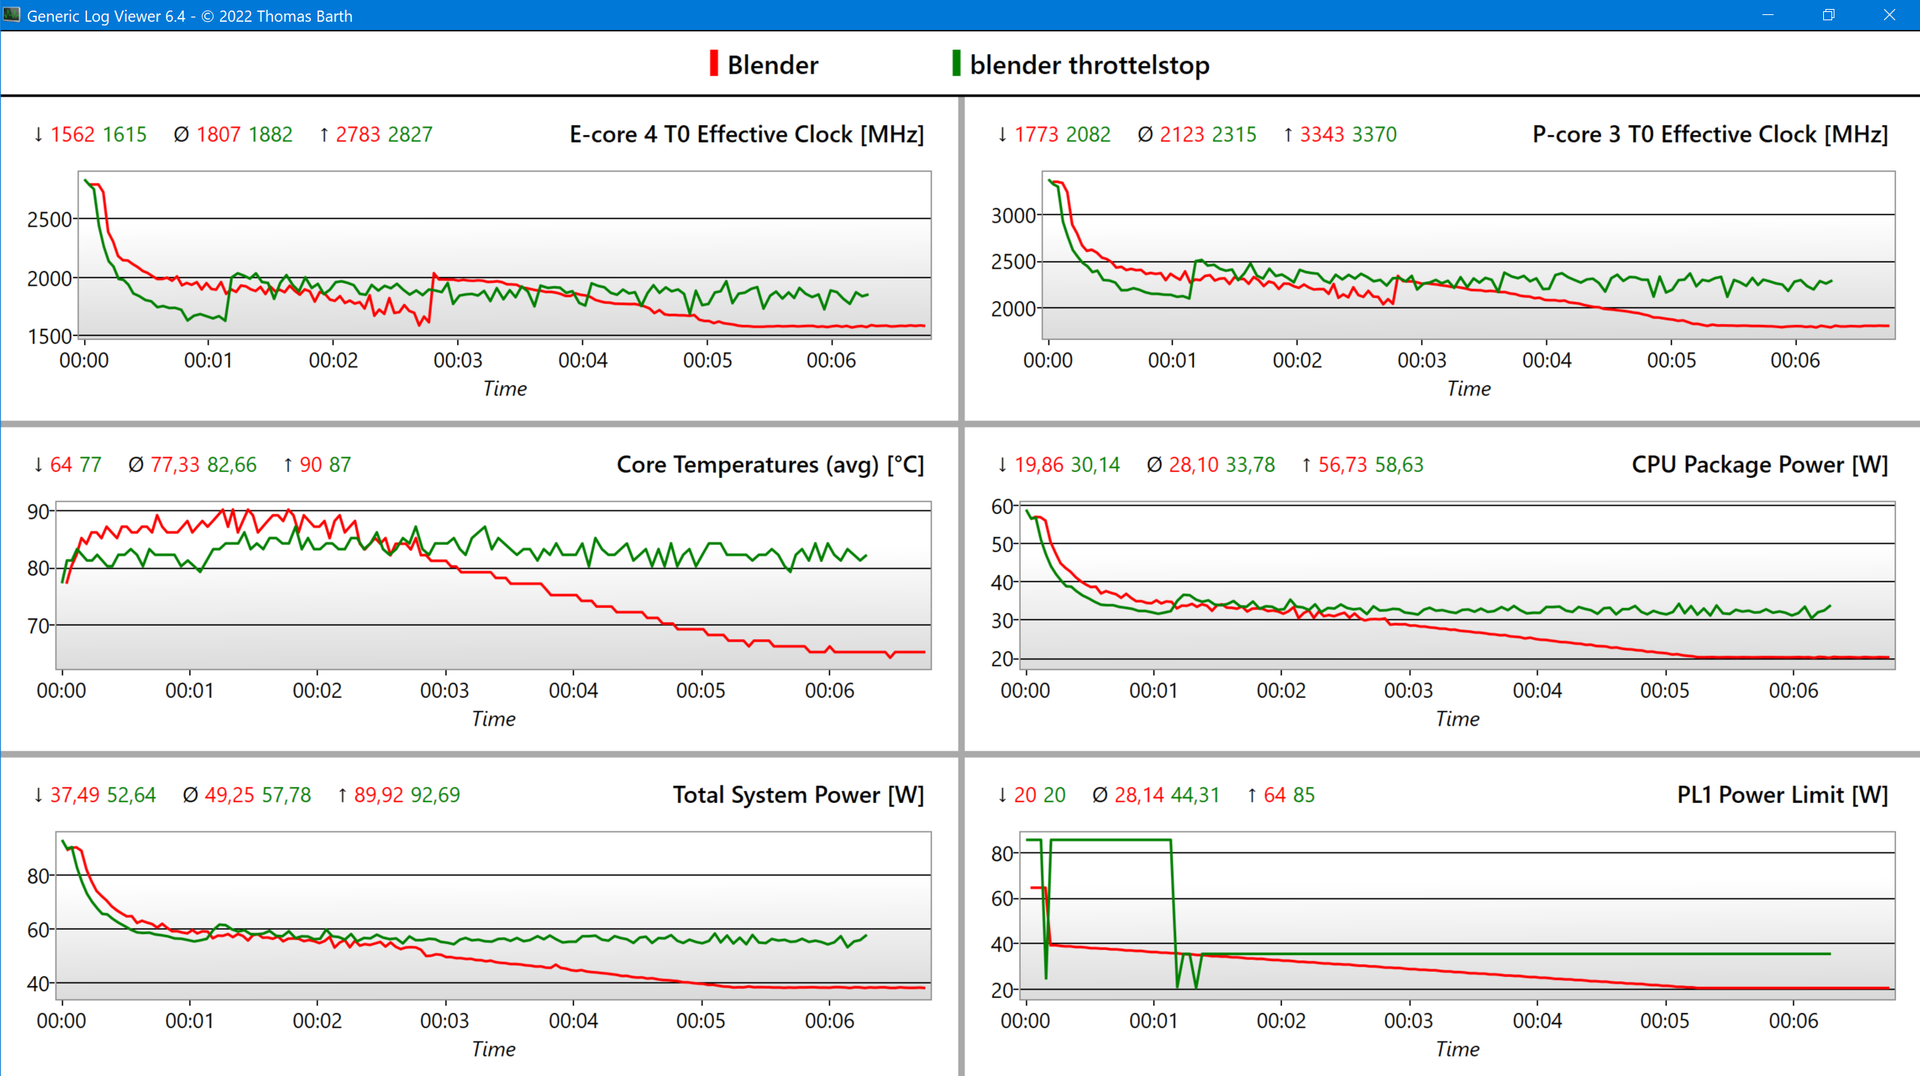
A Intel Núcleo i5-1240P é uma CPU de 12 núcleos com 4 núcleos de desempenho e 8 núcleos de eficiência. O TDP de 28 W está sendo usado pela primeira vez na série T da Lenovo. Entretanto, nossos testes revelam que a Lenovo limita o PL1 a 20 watts, enquanto o turbo curto de 12 segundos (PL2) é de 59 watts.
As temperaturas muito baixas de 63 °C provam que esta abordagem restringe desnecessariamente o desempenho e é apenas o suficiente para alcançar o relógio base de 1,7 GHz. Isto é incompreensível, uma vez que o predecessor funciona constantemente a 35 watts. Conseqüentemente, isto resulta em um desempenho sustentado de apenas 15% acima dopredecessorenquanto o PensePad E15 com a Ryzen do ano passado computa cerca de 50% mais rápido. Por outro lado, o T16 é muito rápido em tarefas que requerem pequenos incrementos.
Se o estrangulamento, que tem sido confirmado por muitas fontes como também ocorre no T14 G3(mesma placa-mãe), não é fixada via atualização BIOS no futuro, a AMD seria provavelmente a melhor escolha aqui, uma vez que os Ryzens podem fornecer resultados muito melhores com pouco poder.
No modo de bateria, a potência é ainda mais limitada a 10 watts, mas o "Max Performance on Battery" pode ser definido na BIOS, de modo que o resultado seja mais ou menos o mesmo novamente. Um total de 30 watts pode ser mantido usando a ferramenta "ThrottleStop", mas não é recomendável sobrepor as configurações escolhidas pelo fabricante.
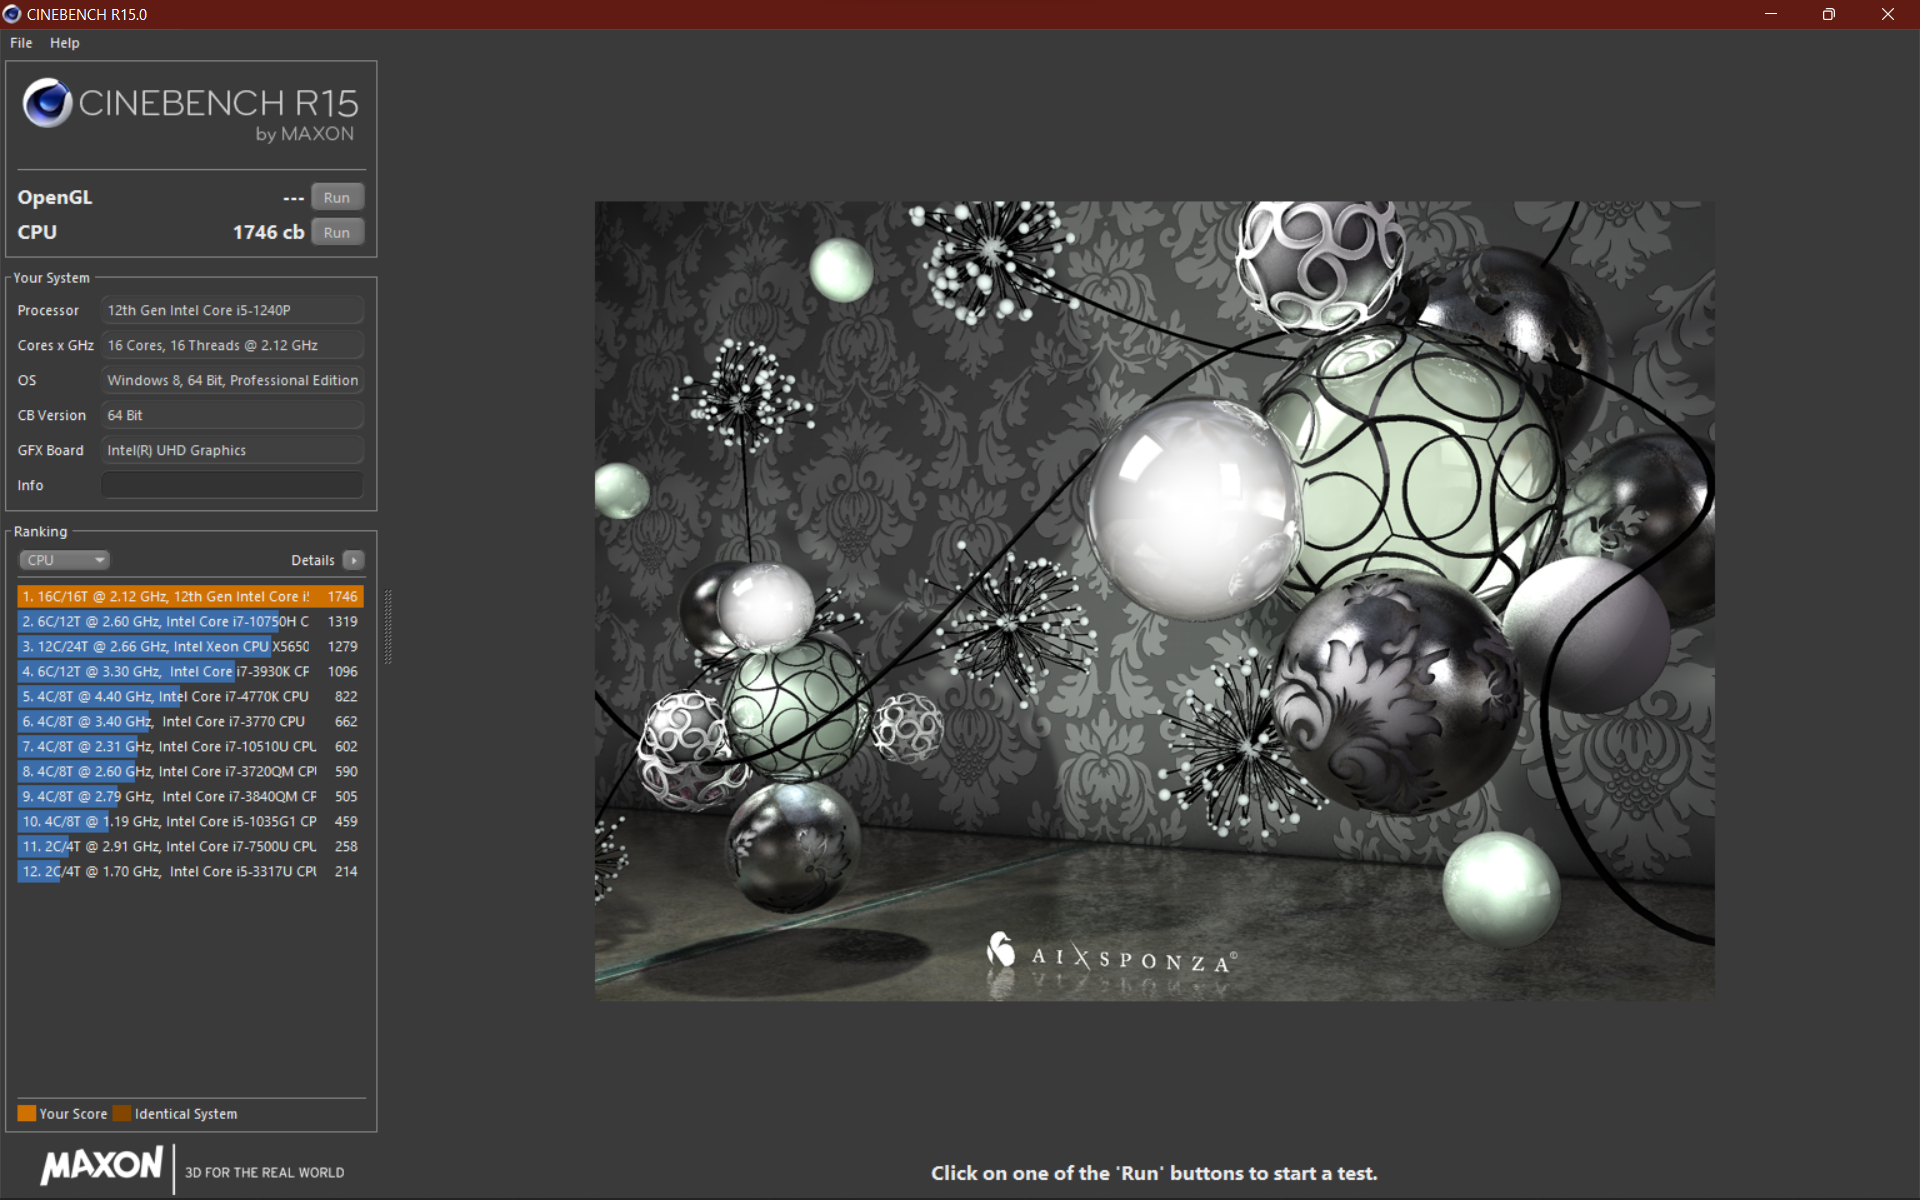
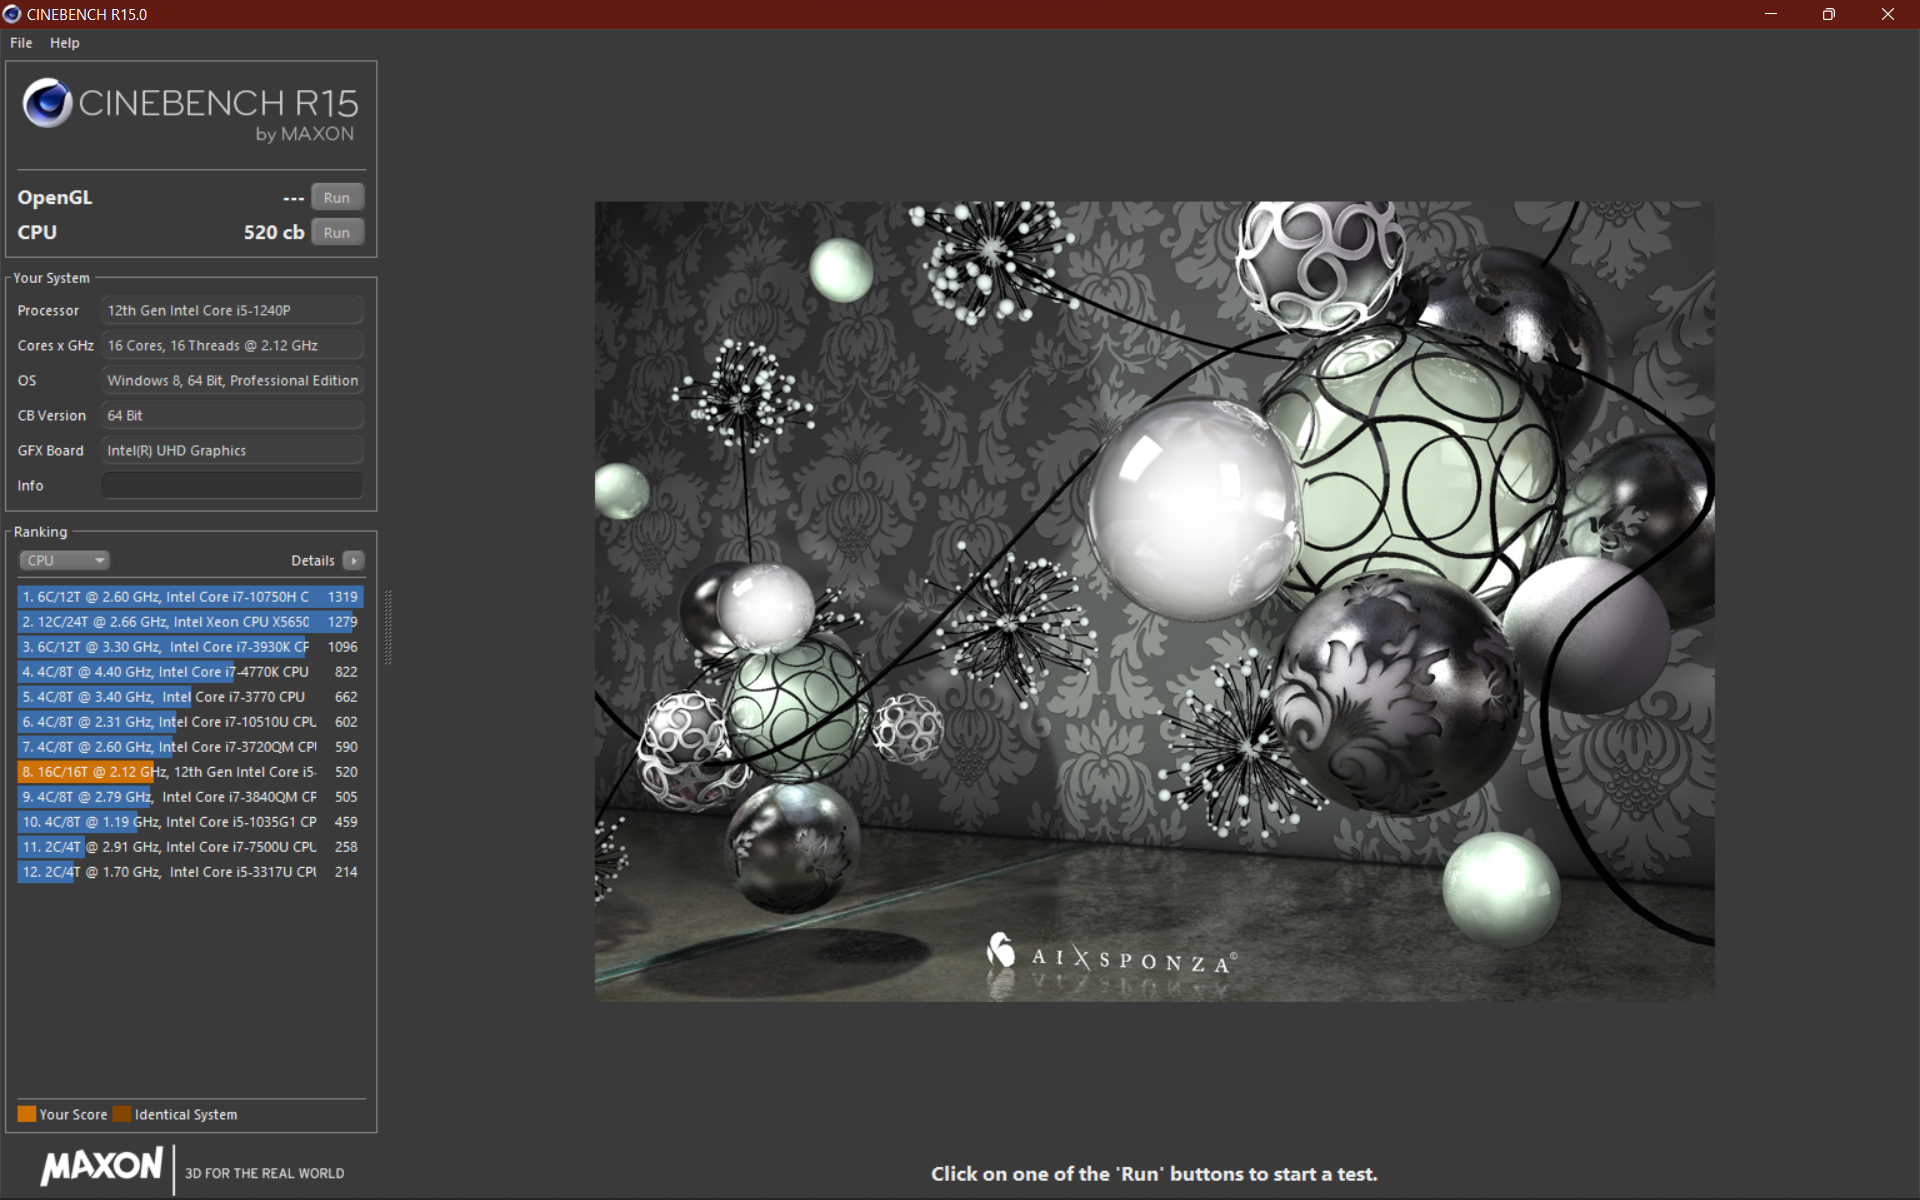
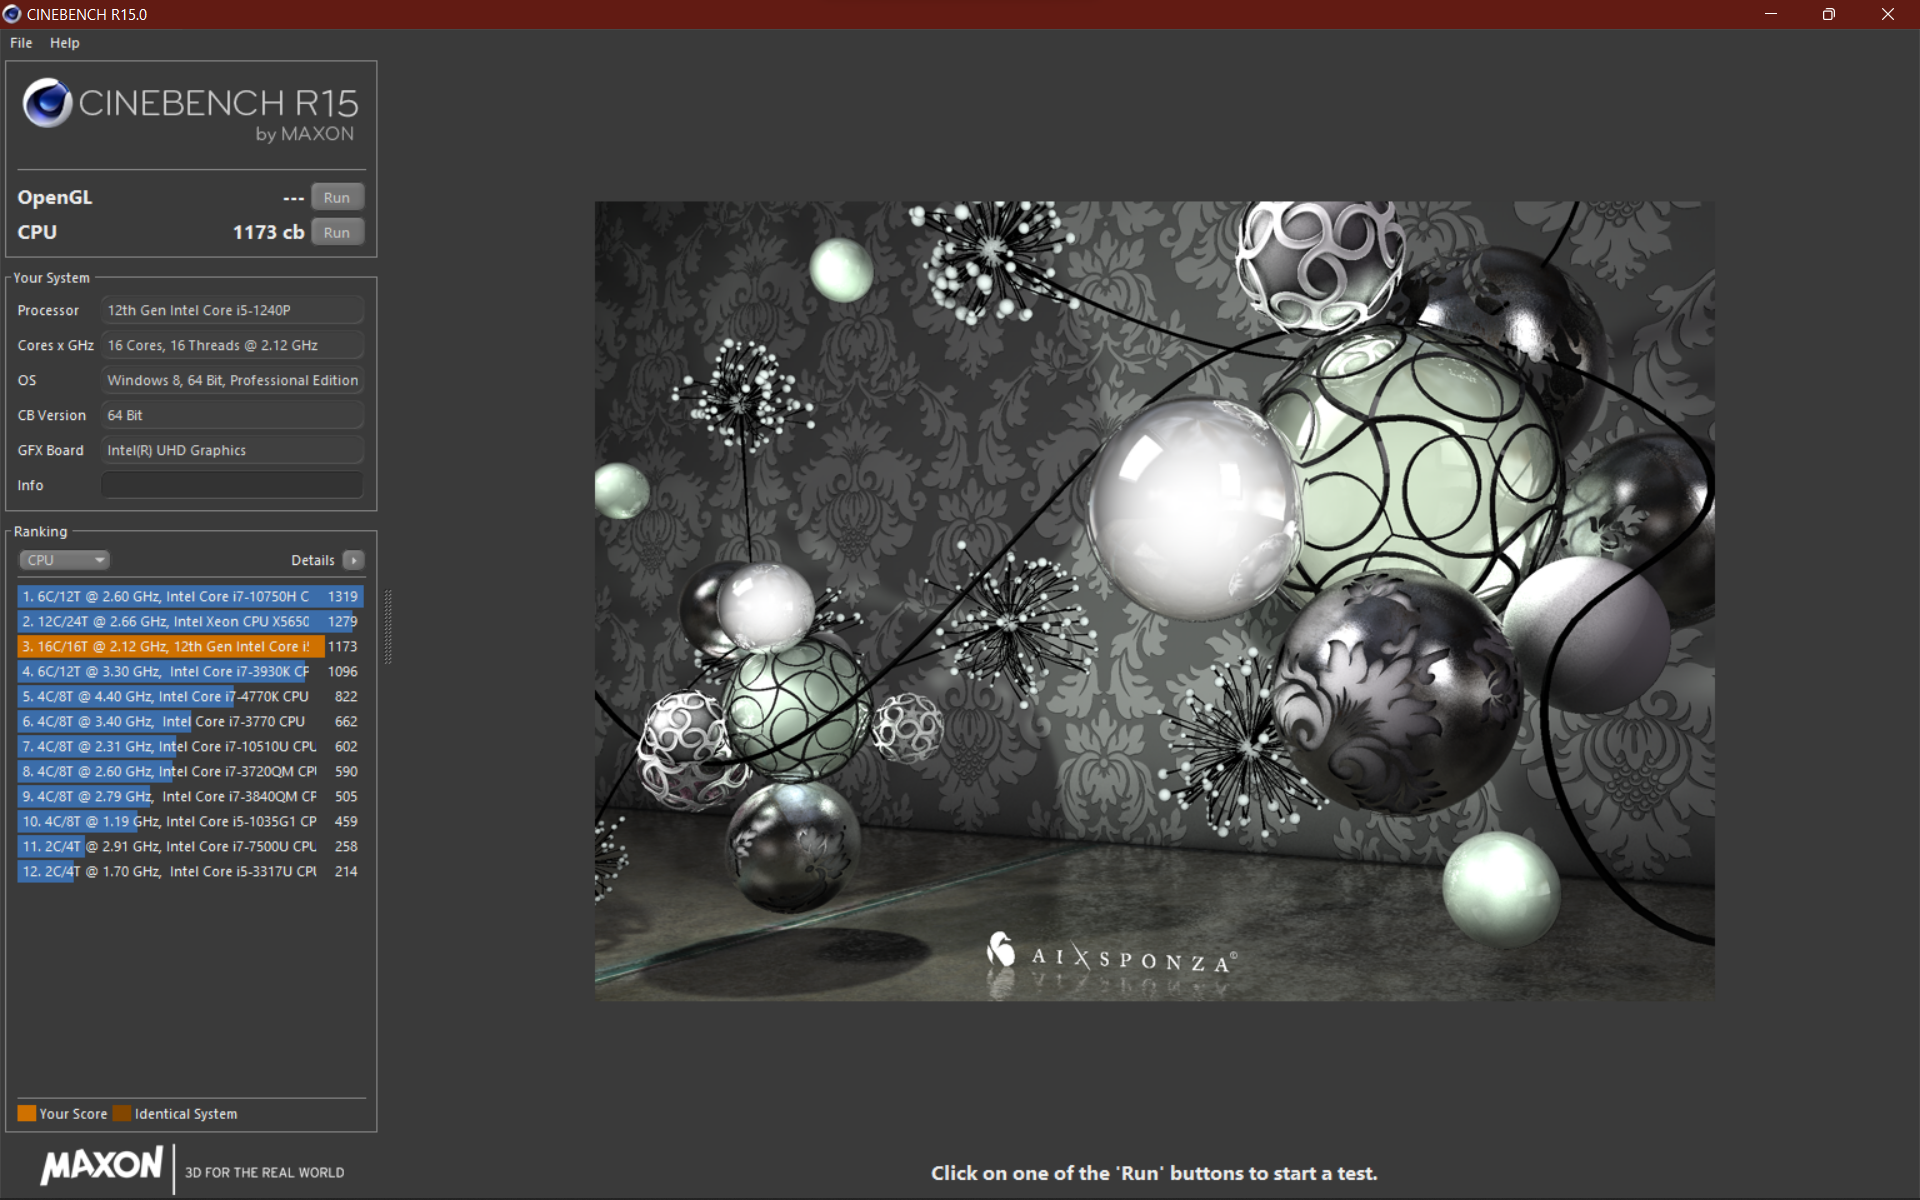

Cinebench R15 Multi Sustained Load
Cinebench R23: Multi Core | Single Core
Cinebench R20: CPU (Multi Core) | CPU (Single Core)
Cinebench R15: CPU Multi 64Bit | CPU Single 64Bit
Blender: v2.79 BMW27 CPU | v3.3 Classroom CPU
7-Zip 18.03: 7z b 4 | 7z b 4 -mmt1
Geekbench 5.5: Multi-Core | Single-Core
HWBOT x265 Benchmark v2.2: 4k Preset
LibreOffice : 20 Documents To PDF
R Benchmark 2.5: Overall mean
V-Ray 5 Benchmark: CPU
V-Ray Benchmark Next 4.10: CPU
| CPU Performance rating | |
| Dell Inspiron 16 Plus 7620 -1! | |
| Huawei MateBook D 16 2022 -1! | |
| Asus Vivobook Pro 16X-M7600QE -2! | |
| Lenovo ThinkPad X1 Extreme G4-20Y5CTO1WW (3050 Ti) -2! | |
| HP ZBook Power 15 G8 313S5EA -2! | |
| Média da turma Office | |
| Lenovo ThinkPad T16 G1 21BWS00200 | |
| Lenovo ThinkPad E15 G3-20YG003UGE -2! | |
| Lenovo ThinkPad L15 G2 AMD -1! | |
| Média Intel Core i5-1240P | |
| Lenovo ThinkPad T15 Gen2-20W5S00100 -4! | |
| HP ProBook 450 G9 6A180EA | |
| Blender / v3.3 Classroom CPU | |
| HP ProBook 450 G9 6A180EA | |
| Média Intel Core i5-1240P (552 - 3047, n=12) | |
| Lenovo ThinkPad T16 G1 21BWS00200 | |
| Média da turma Office (245 - 3219, n=74, últimos 2 anos) | |
| Huawei MateBook D 16 2022 | |
| Dell Inspiron 16 Plus 7620 | |
| V-Ray 5 Benchmark / CPU | |
| Dell Inspiron 16 Plus 7620 | |
| Média da turma Office (5027 - 13919, n=21, últimos 2 anos) | |
| Lenovo ThinkPad L15 G2 AMD | |
| Lenovo ThinkPad T16 G1 21BWS00200 | |
| Média Intel Core i5-1240P (1334 - 7321, n=6) | |
| HP ProBook 450 G9 6A180EA | |
* ... menor é melhor
AIDA64: FP32 Ray-Trace | FPU Julia | CPU SHA3 | CPU Queen | FPU SinJulia | FPU Mandel | CPU AES | CPU ZLib | FP64 Ray-Trace | CPU PhotoWorxx
| Performance rating | |
| Lenovo ThinkPad X1 Extreme G4-20Y5CTO1WW (3050 Ti) | |
| HP ZBook Power 15 G8 313S5EA | |
| Dell Inspiron 16 Plus 7620 | |
| Média da turma Office | |
| Huawei MateBook D 16 2022 | |
| Lenovo ThinkPad E15 G3-20YG003UGE | |
| Lenovo ThinkPad L15 G2 AMD | |
| Lenovo ThinkPad T16 G1 21BWS00200 | |
| Média Intel Core i5-1240P | |
| HP ProBook 450 G9 6A180EA | |
| AIDA64 / FP32 Ray-Trace | |
| HP ZBook Power 15 G8 313S5EA | |
| Lenovo ThinkPad X1 Extreme G4-20Y5CTO1WW (3050 Ti) | |
| Média da turma Office (2083 - 31245, n=82, últimos 2 anos) | |
| Dell Inspiron 16 Plus 7620 | |
| Huawei MateBook D 16 2022 | |
| Lenovo ThinkPad E15 G3-20YG003UGE | |
| Lenovo ThinkPad L15 G2 AMD | |
| Lenovo ThinkPad T16 G1 21BWS00200 | |
| Média Intel Core i5-1240P (2405 - 9694, n=16) | |
| HP ProBook 450 G9 6A180EA | |
| AIDA64 / FP64 Ray-Trace | |
| HP ZBook Power 15 G8 313S5EA | |
| Lenovo ThinkPad X1 Extreme G4-20Y5CTO1WW (3050 Ti) | |
| Média da turma Office (1109 - 17834, n=82, últimos 2 anos) | |
| Dell Inspiron 16 Plus 7620 | |
| Lenovo ThinkPad E15 G3-20YG003UGE | |
| Huawei MateBook D 16 2022 | |
| Lenovo ThinkPad L15 G2 AMD | |
| Lenovo ThinkPad T16 G1 21BWS00200 | |
| Média Intel Core i5-1240P (1154 - 5258, n=16) | |
| HP ProBook 450 G9 6A180EA | |
| AIDA64 / CPU PhotoWorxx | |
| Huawei MateBook D 16 2022 | |
| Média da turma Office (11090 - 65229, n=82, últimos 2 anos) | |
| Dell Inspiron 16 Plus 7620 | |
| Média Intel Core i5-1240P (11873 - 43661, n=16) | |
| Lenovo ThinkPad E15 G3-20YG003UGE | |
| Lenovo ThinkPad X1 Extreme G4-20Y5CTO1WW (3050 Ti) | |
| HP ProBook 450 G9 6A180EA | |
| Lenovo ThinkPad T16 G1 21BWS00200 | |
| HP ZBook Power 15 G8 313S5EA | |
| Lenovo ThinkPad L15 G2 AMD | |
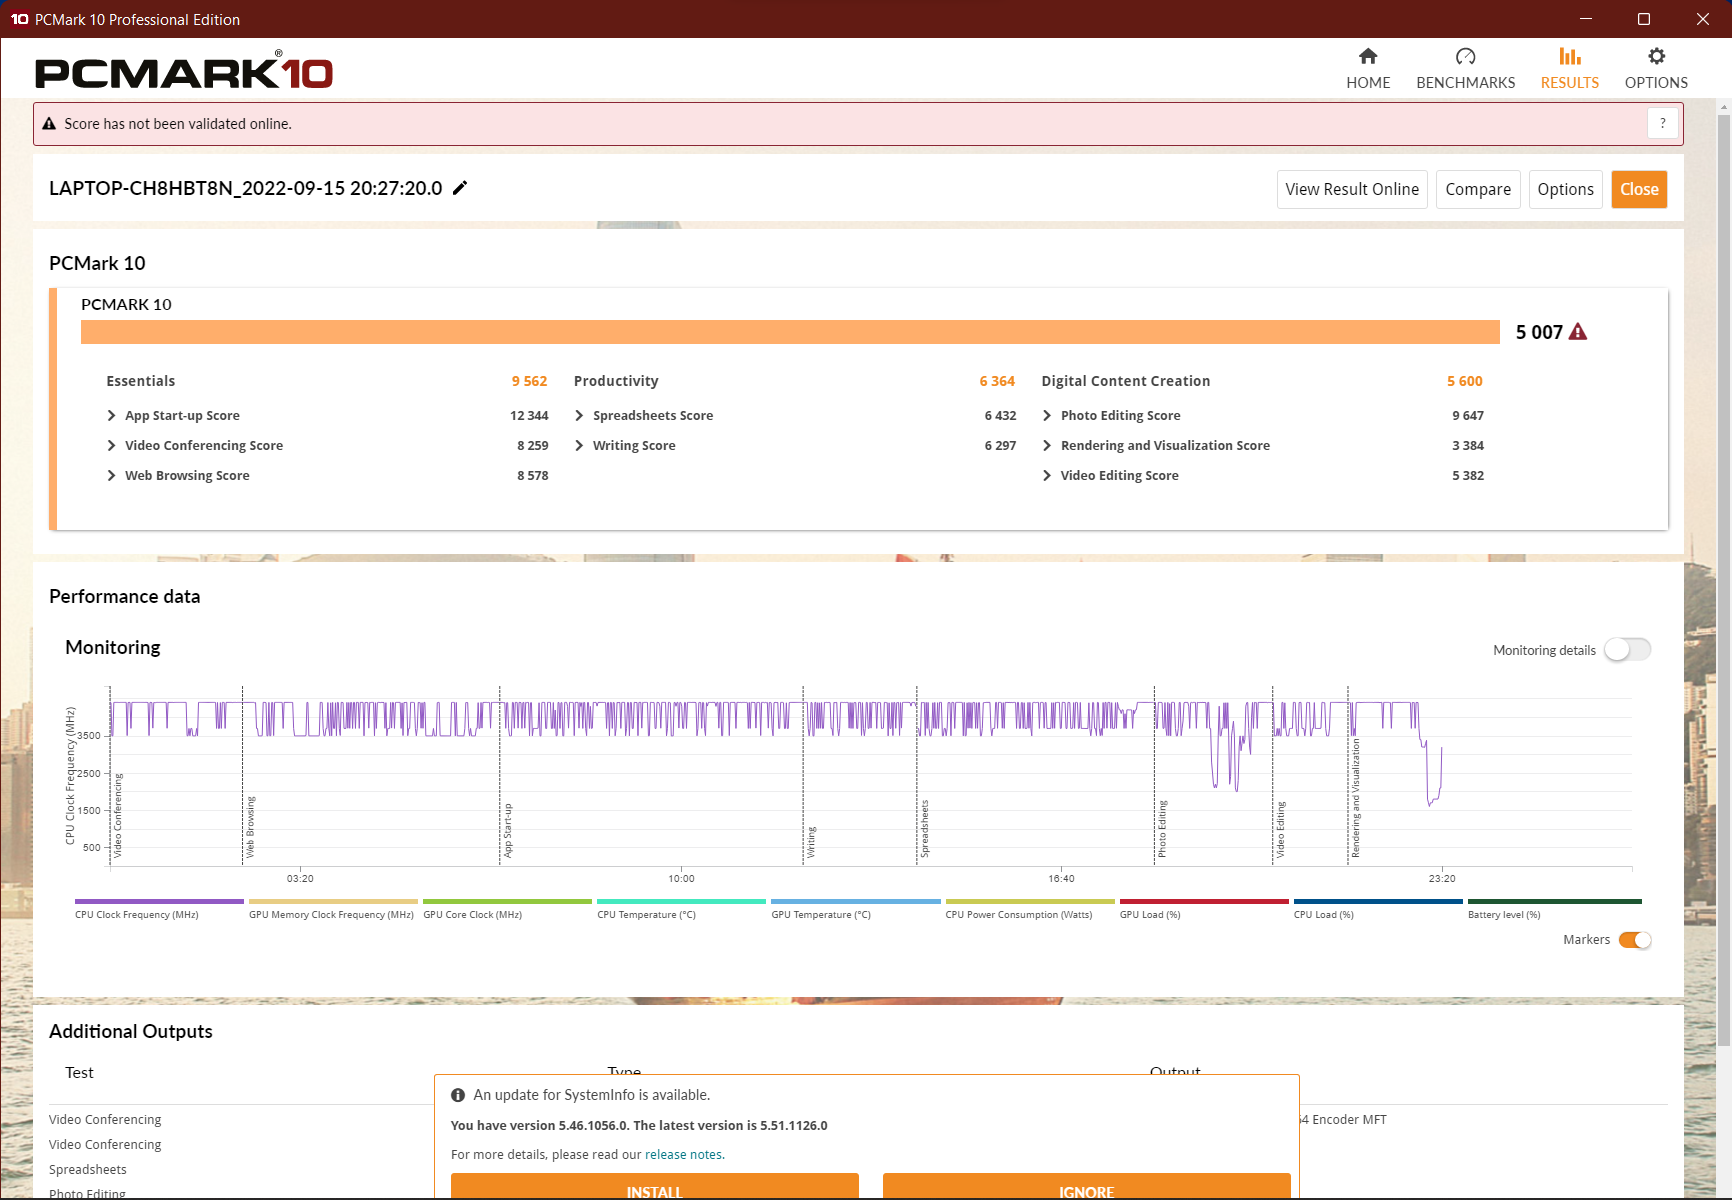
Desempenho do sistema
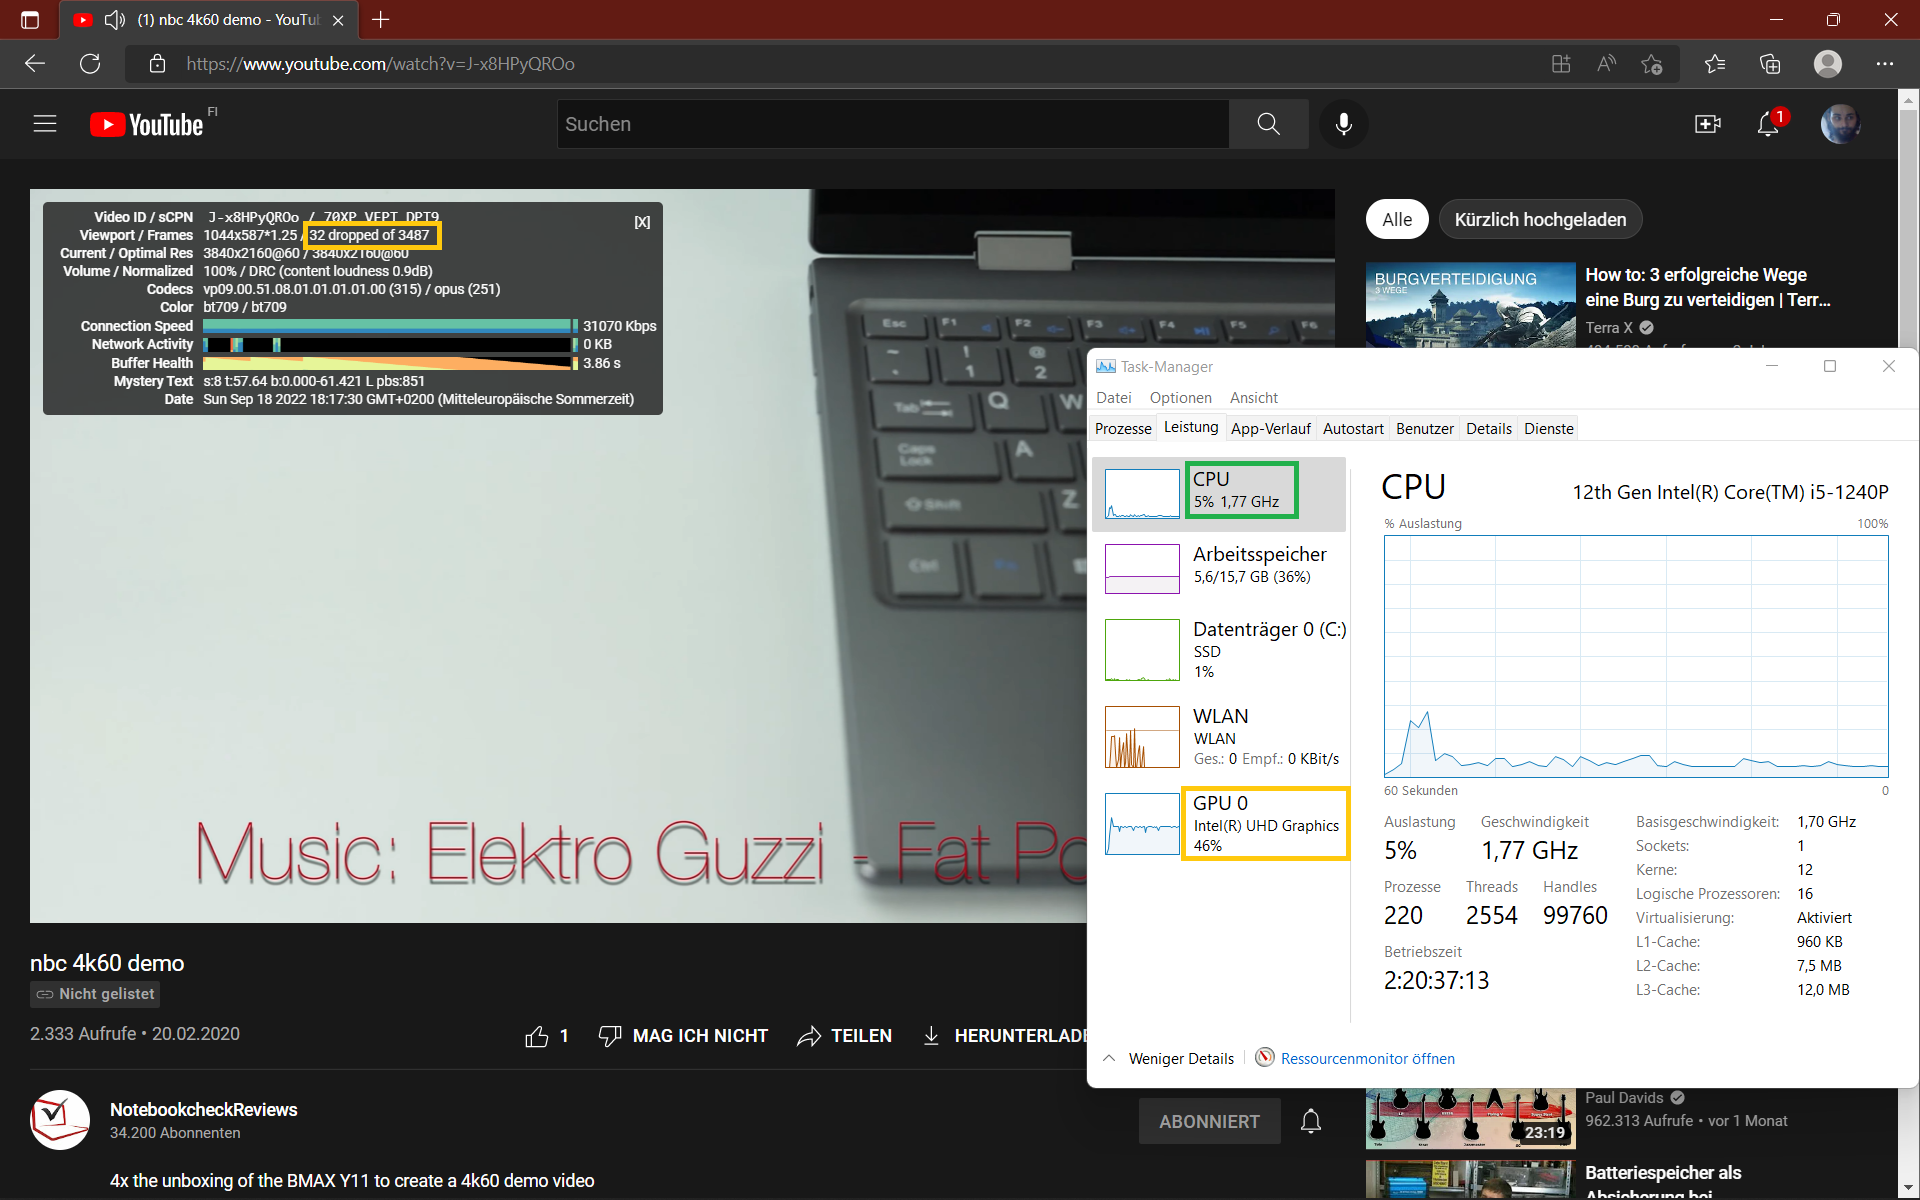
Devido ao forte turbo de curto prazo, o sistema é muito responsivo apesar da RAM de canal único. A navegação na Web durante a reprodução do YouTube 4K não é um problema, mas quedas de quadros ocorrem.
Isto certamente poderia ser corrigido pela inserção de um segundo módulo de RAM, bem como pela melhoria do desempenho geral do sistema. A CPU Alder Lake tem um desempenho muito bom nos benchmarks de navegação na web devido ao turbo, mas o desempenho da PCMark é médio.
CrossMark: Overall | Productivity | Creativity | Responsiveness
Sunspider: 1.0 Total Score
Mozilla Kraken 1.1: Total
Speedometer 2.0: Result 2.0
Octane V2: Total Score
Jetstream 2: 2.0 Total
WebXPRT 3: Overall
WebXPRT 4: Overall
| PCMark 10 / Score | |
| Dell Inspiron 16 Plus 7620 | |
| Média da turma Office (2601 - 9298, n=67, últimos 2 anos) | |
| Lenovo ThinkPad X1 Extreme G4-20Y5CTO1WW (3050 Ti) | |
| Huawei MateBook D 16 2022 | |
| Lenovo ThinkPad L15 G2 AMD | |
| Lenovo ThinkPad E15 G3-20YG003UGE | |
| Lenovo ThinkPad T15 Gen2-20W5S00100 | |
| Média Intel Core i5-1240P, Intel Iris Xe Graphics G7 80EUs (4881 - 5345, n=11) | |
| Lenovo ThinkPad T16 G1 21BWS00200 | |
| HP ZBook Power 15 G8 313S5EA | |
| HP ProBook 450 G9 6A180EA | |
| PCMark 10 / Essentials | |
| Huawei MateBook D 16 2022 | |
| Lenovo ThinkPad X1 Extreme G4-20Y5CTO1WW (3050 Ti) | |
| Dell Inspiron 16 Plus 7620 | |
| Lenovo ThinkPad L15 G2 AMD | |
| Média da turma Office (3245 - 11594, n=67, últimos 2 anos) | |
| Média Intel Core i5-1240P, Intel Iris Xe Graphics G7 80EUs (8890 - 10652, n=11) | |
| Lenovo ThinkPad T16 G1 21BWS00200 | |
| HP ProBook 450 G9 6A180EA | |
| Lenovo ThinkPad E15 G3-20YG003UGE | |
| Lenovo ThinkPad T15 Gen2-20W5S00100 | |
| HP ZBook Power 15 G8 313S5EA | |
| PCMark 10 / Productivity | |
| Média da turma Office (5336 - 17243, n=67, últimos 2 anos) | |
| Lenovo ThinkPad L15 G2 AMD | |
| Dell Inspiron 16 Plus 7620 | |
| Lenovo ThinkPad T15 Gen2-20W5S00100 | |
| Lenovo ThinkPad X1 Extreme G4-20Y5CTO1WW (3050 Ti) | |
| Lenovo ThinkPad E15 G3-20YG003UGE | |
| HP ZBook Power 15 G8 313S5EA | |
| Huawei MateBook D 16 2022 | |
| HP ProBook 450 G9 6A180EA | |
| Média Intel Core i5-1240P, Intel Iris Xe Graphics G7 80EUs (6118 - 7058, n=11) | |
| Lenovo ThinkPad T16 G1 21BWS00200 | |
| PCMark 10 / Digital Content Creation | |
| Dell Inspiron 16 Plus 7620 | |
| Lenovo ThinkPad X1 Extreme G4-20Y5CTO1WW (3050 Ti) | |
| Média da turma Office (2049 - 13541, n=67, últimos 2 anos) | |
| Huawei MateBook D 16 2022 | |
| Média Intel Core i5-1240P, Intel Iris Xe Graphics G7 80EUs (5169 - 6213, n=11) | |
| Lenovo ThinkPad E15 G3-20YG003UGE | |
| Lenovo ThinkPad T16 G1 21BWS00200 | |
| Lenovo ThinkPad T15 Gen2-20W5S00100 | |
| HP ZBook Power 15 G8 313S5EA | |
| Lenovo ThinkPad L15 G2 AMD | |
| HP ProBook 450 G9 6A180EA | |
| CrossMark / Overall | |
| Huawei MateBook D 16 2022 | |
| Dell Inspiron 16 Plus 7620 | |
| Média da turma Office (381 - 2010, n=74, últimos 2 anos) | |
| Média Intel Core i5-1240P, Intel Iris Xe Graphics G7 80EUs (1392 - 1553, n=7) | |
| HP ZBook Power 15 G8 313S5EA | |
| Lenovo ThinkPad T16 G1 21BWS00200 | |
| HP ProBook 450 G9 6A180EA | |
| CrossMark / Productivity | |
| Huawei MateBook D 16 2022 | |
| Dell Inspiron 16 Plus 7620 | |
| HP ZBook Power 15 G8 313S5EA | |
| Média da turma Office (464 - 1880, n=74, últimos 2 anos) | |
| Média Intel Core i5-1240P, Intel Iris Xe Graphics G7 80EUs (1393 - 1524, n=7) | |
| Lenovo ThinkPad T16 G1 21BWS00200 | |
| HP ProBook 450 G9 6A180EA | |
| CrossMark / Creativity | |
| Huawei MateBook D 16 2022 | |
| Dell Inspiron 16 Plus 7620 | |
| Média da turma Office (319 - 2361, n=74, últimos 2 anos) | |
| Média Intel Core i5-1240P, Intel Iris Xe Graphics G7 80EUs (1426 - 1647, n=7) | |
| HP ZBook Power 15 G8 313S5EA | |
| Lenovo ThinkPad T16 G1 21BWS00200 | |
| HP ProBook 450 G9 6A180EA | |
| CrossMark / Responsiveness | |
| Huawei MateBook D 16 2022 | |
| Dell Inspiron 16 Plus 7620 | |
| Média Intel Core i5-1240P, Intel Iris Xe Graphics G7 80EUs (1267 - 1545, n=7) | |
| Lenovo ThinkPad T16 G1 21BWS00200 | |
| Média da turma Office (360 - 1820, n=74, últimos 2 anos) | |
| HP ZBook Power 15 G8 313S5EA | |
| HP ProBook 450 G9 6A180EA | |
| Sunspider / 1.0 Total Score | |
| Lenovo ThinkPad T16 G1 21BWS00200 | |
| Média Intel Core i5-1240P, Intel Iris Xe Graphics G7 80EUs (n=1) | |
| Média da turma Office (87.2 - 111.8, n=2, últimos 2 anos) | |
| HP ProBook 450 G9 6A180EA | |
| Mozilla Kraken 1.1 / Total | |
| Lenovo ThinkPad E15 G3-20YG003UGE | |
| HP ProBook 450 G9 6A180EA | |
| Média Intel Core i5-1240P, Intel Iris Xe Graphics G7 80EUs (575 - 1422, n=12) | |
| HP ZBook Power 15 G8 313S5EA | |
| Lenovo ThinkPad L15 G2 AMD | |
| Lenovo ThinkPad T15 Gen2-20W5S00100 | |
| Lenovo ThinkPad X1 Extreme G4-20Y5CTO1WW (3050 Ti) | |
| Lenovo ThinkPad T16 G1 21BWS00200 | |
| Média da turma Office (391 - 1297, n=77, últimos 2 anos) | |
| Dell Inspiron 16 Plus 7620 | |
| Huawei MateBook D 16 2022 | |
| Speedometer 2.0 / Result 2.0 | |
| Média da turma Office (173 - 640, n=17, últimos 2 anos) | |
| Huawei MateBook D 16 2022 | |
| Média Intel Core i5-1240P, Intel Iris Xe Graphics G7 80EUs (241 - 266, n=3) | |
| Lenovo ThinkPad T16 G1 21BWS00200 | |
| HP ProBook 450 G9 6A180EA | |
| Octane V2 / Total Score | |
| Média da turma Office (49011 - 126830, n=19, últimos 2 anos) | |
| Huawei MateBook D 16 2022 | |
| Lenovo ThinkPad T16 G1 21BWS00200 | |
| Média Intel Core i5-1240P, Intel Iris Xe Graphics G7 80EUs (70915 - 80743, n=5) | |
| HP ProBook 450 G9 6A180EA | |
| HP ZBook Power 15 G8 313S5EA | |
| Jetstream 2 / 2.0 Total | |
| Média da turma Office (126.6 - 483, n=20, últimos 2 anos) | |
| Média Intel Core i5-1240P, Intel Iris Xe Graphics G7 80EUs (203 - 418, n=4) | |
| Dell Inspiron 16 Plus 7620 | |
| Huawei MateBook D 16 2022 | |
| Lenovo ThinkPad T16 G1 21BWS00200 | |
| HP ProBook 450 G9 6A180EA | |
| HP ZBook Power 15 G8 313S5EA | |
| WebXPRT 3 / Overall | |
| Huawei MateBook D 16 2022 | |
| Dell Inspiron 16 Plus 7620 | |
| Média da turma Office (129.9 - 444, n=76, últimos 2 anos) | |
| Lenovo ThinkPad X1 Extreme G4-20Y5CTO1WW (3050 Ti) | |
| HP ZBook Power 15 G8 313S5EA | |
| Lenovo ThinkPad L15 G2 AMD | |
| Lenovo ThinkPad T16 G1 21BWS00200 | |
| Média Intel Core i5-1240P, Intel Iris Xe Graphics G7 80EUs (119.2 - 268, n=11) | |
| Lenovo ThinkPad E15 G3-20YG003UGE | |
| HP ProBook 450 G9 6A180EA | |
| WebXPRT 4 / Overall | |
| Huawei MateBook D 16 2022 | |
| Dell Inspiron 16 Plus 7620 | |
| Média da turma Office (104.2 - 313, n=76, últimos 2 anos) | |
| Lenovo ThinkPad T16 G1 21BWS00200 | |
| Média Intel Core i5-1240P, Intel Iris Xe Graphics G7 80EUs (217 - 231, n=6) | |
| HP ProBook 450 G9 6A180EA | |
* ... menor é melhor
| PCMark 10 Score | 5007 pontos | |
Ajuda | ||
| AIDA64 / Memory Latency | |
| Média Intel Core i5-1240P (85.1 - 188.3, n=11) | |
| Huawei MateBook D 16 2022 | |
| Média da turma Office (7.6 - 162.9, n=75, últimos 2 anos) | |
| Lenovo ThinkPad E15 G3-20YG003UGE | |
| Dell Inspiron 16 Plus 7620 | |
| Lenovo ThinkPad T16 G1 21BWS00200 | |
| Lenovo ThinkPad L15 G2 AMD | |
| Lenovo ThinkPad X1 Extreme G4-20Y5CTO1WW (3050 Ti) | |
| HP ProBook 450 G9 6A180EA | |
| HP ZBook Power 15 G8 313S5EA | |
* ... menor é melhor
Latência do DPC
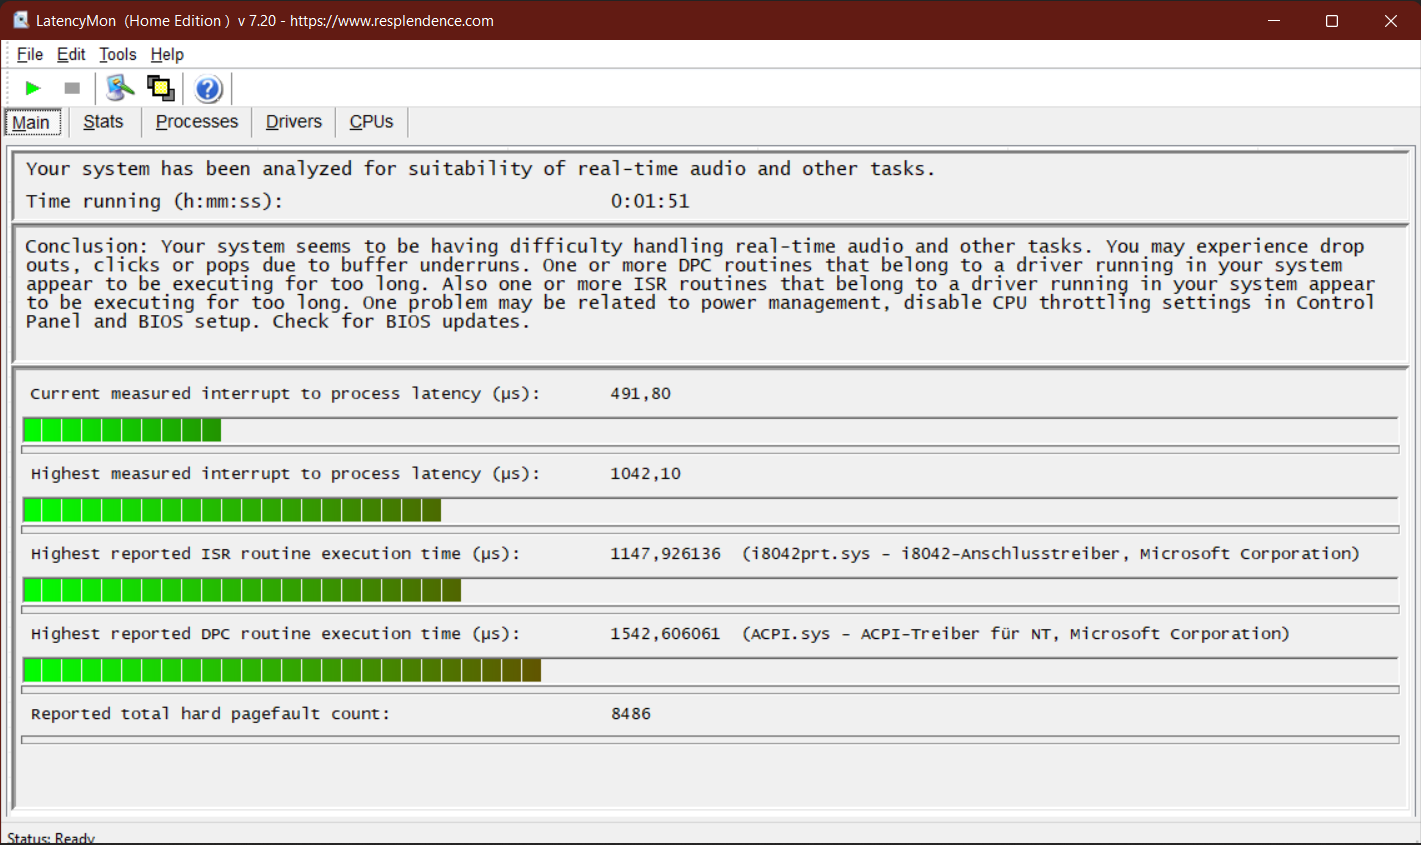
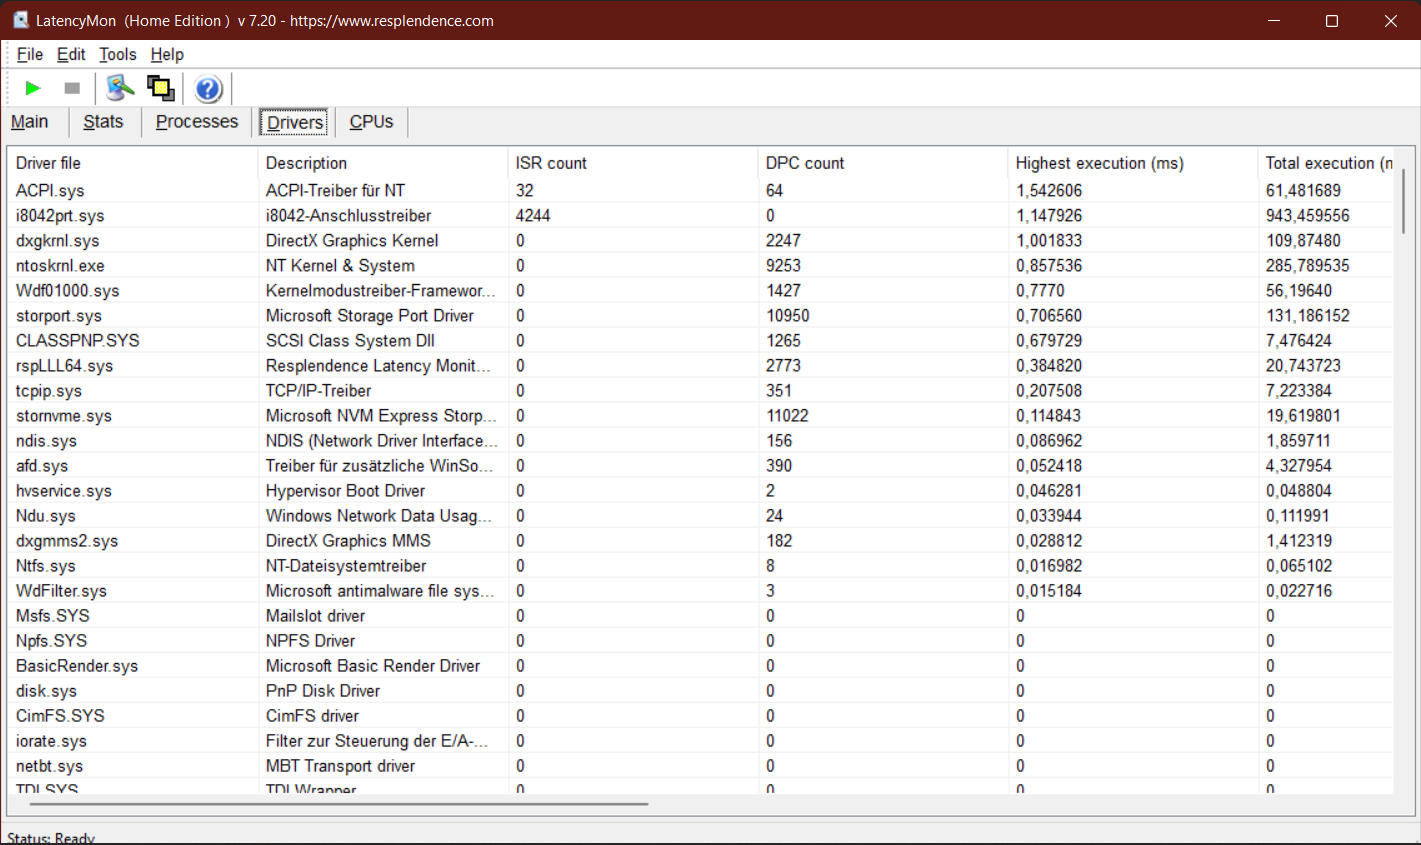
| DPC Latencies / LatencyMon - interrupt to process latency (max), Web, Youtube, Prime95 | |
| HP ProBook 450 G9 6A180EA | |
| Lenovo ThinkPad L15 G2 AMD | |
| Lenovo ThinkPad T16 G1 21BWS00200 | |
| Lenovo ThinkPad T15 Gen2-20W5S00100 | |
| Dell Inspiron 16 Plus 7620 | |
| Lenovo ThinkPad E15 G3-20YG003UGE | |
| Huawei MateBook D 16 2022 | |
| HP ZBook Power 15 G8 313S5EA | |
* ... menor é melhor
Dispositivos de armazenamento
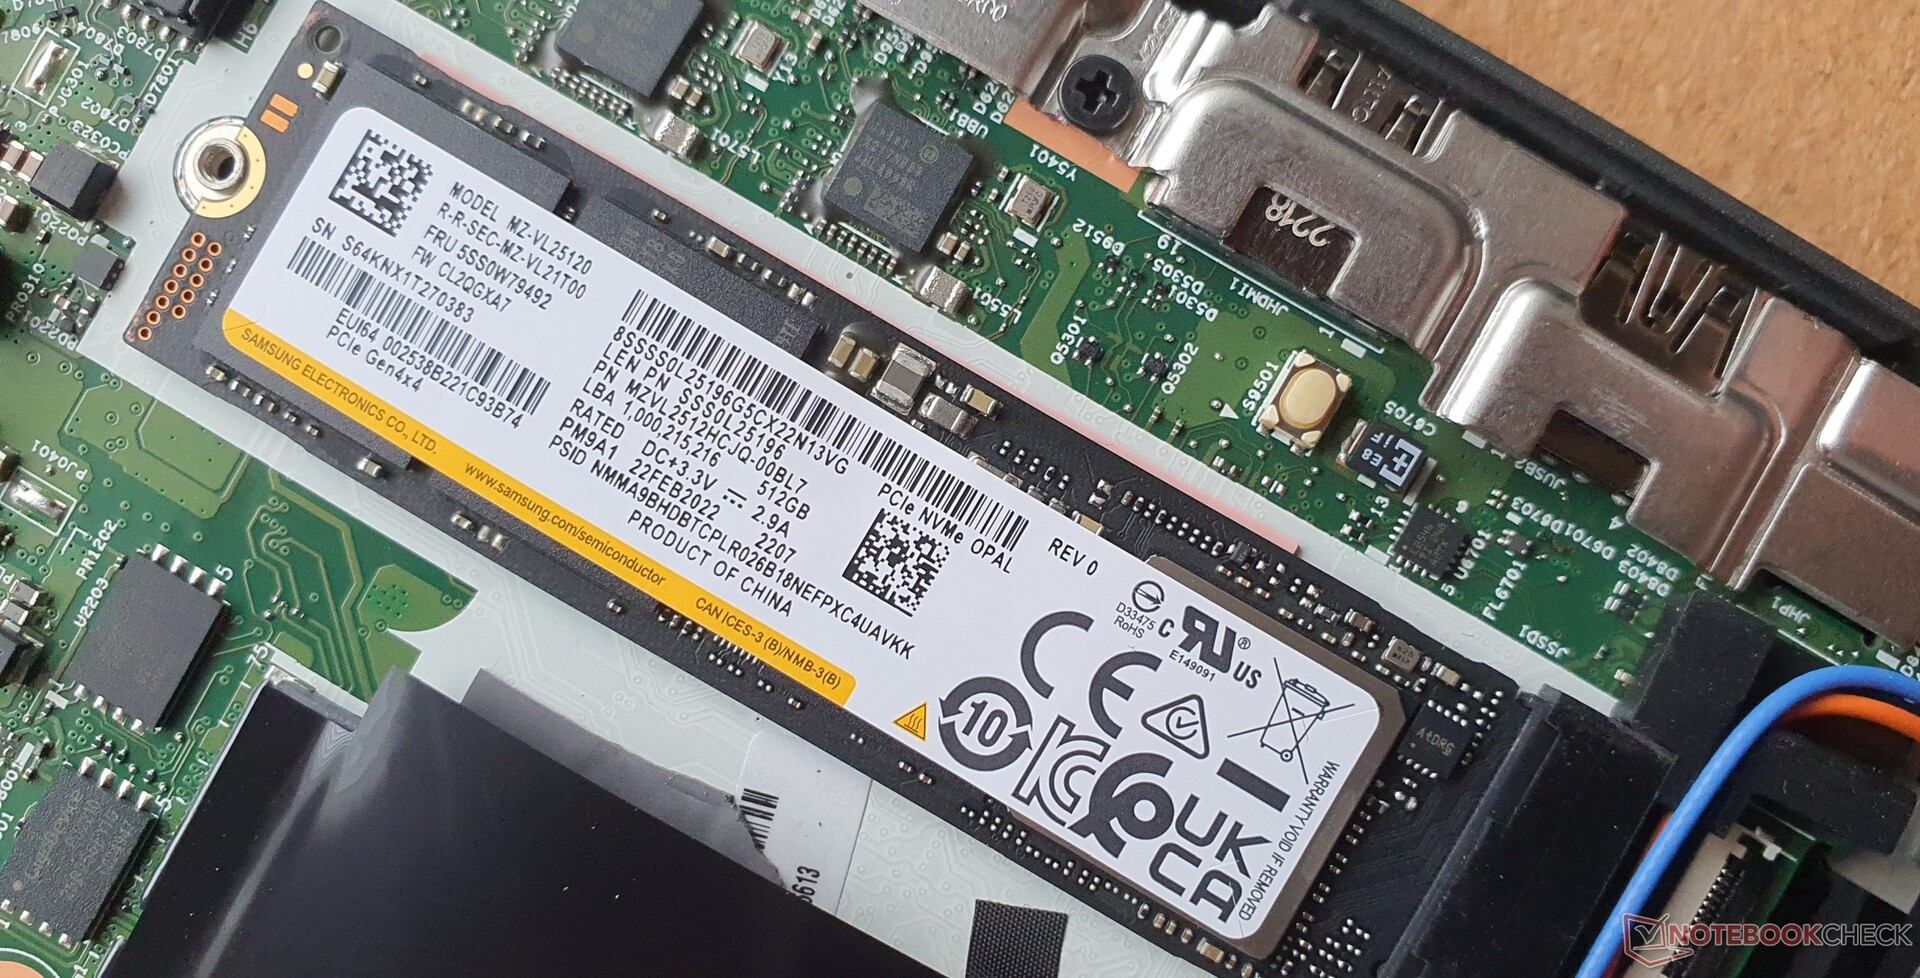
O PM9A1 da Samsungé um SSD PCIe 4.0 e tem uma capacidade de 512 GB. A velocidade é boa, mas as leituras de 4K 16/64 são bastante lentas, e rapidamente caem pela metade no teste de laço de leitura devido ao superaquecimento. O predecessor tinha um SSD mais rápido, e o resto do nosso campo de comparação tem um desempenho semelhante ao da nossa amostra de revisão.
| Lenovo ThinkPad T16 G1 21BWS00200 Samsung PM9A1 MZVL2512HCJQ | Lenovo ThinkPad T15 Gen2-20W5S00100 Samsung PM981a MZVLB1T0HBLR | Lenovo ThinkPad X1 Extreme G4-20Y5CTO1WW (3050 Ti) Samsung PM9A1 MZVL21T0HCLR | HP ZBook Power 15 G8 313S5EA Samsung PM9A1 MZVL2512HCJQ | HP ProBook 450 G9 6A180EA SK Hynix HFM512GD3JX013N | Huawei MateBook D 16 2022 Silicon Motion PCIe-8 SSD | Dell Inspiron 16 Plus 7620 Kioxia BG5 KBG50ZNS512G | Lenovo ThinkPad E15 G3-20YG003UGE SK Hynix PC711 1TB HFS001TDE9X084N | Lenovo ThinkPad L15 G2 AMD SK Hynix HFS512 GDE9X081N | |
|---|---|---|---|---|---|---|---|---|---|
| DiskSpd | 104% | 18% | 60% | -38% | 36% | -15% | 67% | -10% | |
| seq read (MB/s) | 3645 | 2090 -43% | 3285 -10% | 3354.8 -8% | 1914 -47% | 2012 -45% | 2355 -35% | 1624 -55% | 1688 -54% |
| seq write (MB/s) | 2809 | 2270 -19% | 2886 3% | 1353.3 -52% | 1762 -37% | 1438 -49% | 2020 -28% | 1901 -32% | 2072 -26% |
| seq q8 t1 read (MB/s) | 6524 | 3448 -47% | 6641 2% | 6230 -5% | 3463 -47% | 2883 -56% | 2569 -61% | 3269 -50% | 3582 -45% |
| seq q8 t1 write (MB/s) | 4812 | 2945 -39% | 4922 2% | 4757.9 -1% | 2600 -46% | 1911 -60% | 2752 -43% | 3250 -32% | 3072 -36% |
| 4k q1 t1 read (MB/s) | 68.2 | 74.4 9% | 78.4 15% | 51.8 -24% | 52.7 -23% | 43.1 -37% | 62.7 -8% | 57.4 -16% | 46.7 -32% |
| 4k q1 t1 write (MB/s) | 134.8 | 231 71% | 161 19% | 150.2 11% | 112.4 -17% | 273 103% | 162.6 21% | 128 -5% | 123 -9% |
| 4k q32 t16 read (MB/s) | 683 | 2506 267% | 1270 86% | 2187 220% | 328 -52% | 1391 104% | 652 -5% | 2037 198% | 983 44% |
| 4k q32 t16 write (MB/s) | 293 | 2137 629% | 373 27% | 1284.7 338% | 192.2 -34% | 1241 324% | 408 39% | 1833 526% | 521 78% |
| AS SSD | 11% | 28% | 22% | -21% | 11% | -23% | 12% | -8% | |
| Seq Read (MB/s) | 3225 | 2694 -16% | 4588 42% | 4951 54% | 2687 -17% | 2802 -13% | 2693.29 -16% | 2432 -25% | 2721 -16% |
| Seq Write (MB/s) | 1567 | 2370 51% | 1625 4% | 3725 138% | 1476.14 -6% | 1879 20% | 1683.46 7% | 1266 -19% | 1329 -15% |
| 4K Read (MB/s) | 69.7 | 68.4 -2% | 75.2 8% | 52.9 -24% | 60 -14% | 61.03 -12% | 65.01 -7% | 48.88 -30% | 51.5 -26% |
| 4K Write (MB/s) | 170.9 | 208.1 22% | 182.9 7% | 105.35 -38% | 176.81 3% | 248.56 45% | 197.81 16% | 128.4 -25% | 132.5 -22% |
| 4K-64 Read (MB/s) | 720 | 1961 172% | 1318 83% | 2200.26 206% | 696.46 -3% | 1135.53 58% | 855.48 19% | 1805 151% | 932 29% |
| 4K-64 Write (MB/s) | 2682 | 1935 -28% | 3056 14% | 2314.41 -14% | 1624.91 -39% | 1402.68 -48% | 395.8 -85% | 2470 -8% | 1856 -31% |
| Access Time Read * (ms) | 0.059 | 0.032 46% | 0.041 31% | 0.054 8% | 0.04 32% | 0.025 58% | 0.078 -32% | 0.044 25% | 0.038 36% |
| Access Time Write * (ms) | 0.024 | 0.081 -238% | 0.022 8% | 0.04 -67% | 0.028 -17% | 0.016 33% | 0.06 -150% | 0.038 -58% | 0.028 -17% |
| Score Read (Points) | 1112 | 2299 107% | 1852 67% | 2748 147% | 1025 -8% | 1477 33% | 1190 7% | 2097 89% | 1256 13% |
| Score Write (Points) | 3010 | 2380 -21% | 3402 13% | 2792 -7% | 1949 -35% | 1839 -39% | 762 -75% | 2725 -9% | 2122 -30% |
| Score Total (Points) | 4630 | 5846 26% | 6069 31% | 6880 49% | 3457 -25% | 4039 -13% | 2529 -45% | 5837 26% | 3961 -14% |
| Copy ISO MB/s (MB/s) | 1639 | 1287.6 -21% | 863.41 -47% | 1352.52 -17% | 1634.1 0% | 1301 -21% | |||
| Copy Program MB/s (MB/s) | 326.8 | 115.3 -65% | 127.34 -61% | 435.92 33% | 379.46 16% | 554 70% | |||
| Copy Game MB/s (MB/s) | 942.7 | 390.1 -59% | 384.67 -59% | 1058.52 12% | 1174.45 25% | 993 5% | |||
| Média Total (Programa/Configurações) | 58% /
50% | 23% /
24% | 41% /
36% | -30% /
-27% | 24% /
20% | -19% /
-20% | 40% /
32% | -9% /
-9% |
* ... menor é melhor
* ... menor é melhor
Sustained Read Performance: DiskSpd Read Loop, Queue Depth 8
Placa Gráfica
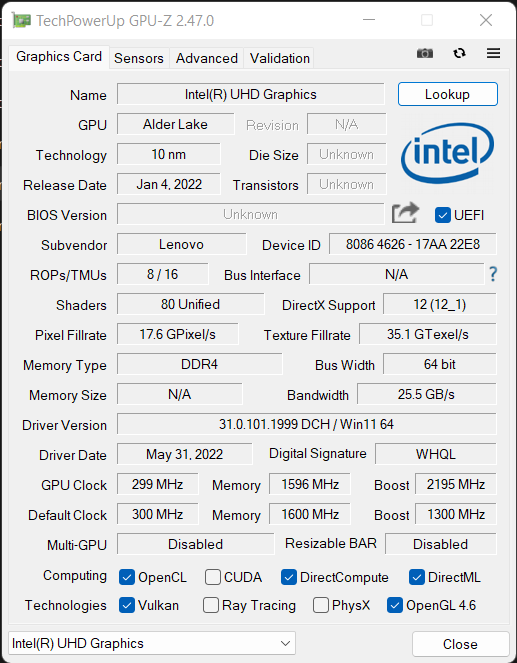
A integraçãoIntel UHD Graphics é tecnicamente um Xe G7 (80 EUs)que está vinculada à RAM de canal único. Assim, seu desempenho é limitado e os baixos níveis de detalhes são a ordem do dia. Como o notebook não é projetado para jogos, isto é tolerável e pode ser melhorado significativamente com um segundo módulo de RAM. O MX450do predecessor também seria uma boa melhoria, enquanto o opcionalmente disponível GeForce MX550 é ainda mais rápido.
O ThinkPad T16 também foi anunciado com um Nvidia opcionalGeForce RTX 2050a EMEA, que nem sequer está listada nas folhas de especificações, mas apenas como uma nota de que não está disponível na região EMEA. No modo de bateria, os fps no The Witcher 3 @Medium settings caem de 32 para 24, o que corresponde a um estrangulamento de 25%. O total de 1.300 MHz cai para ~750 MHz.
| V-Ray 5 Benchmark - GPU CUDA | |
| HP ZBook Power 15 G8 313S5EA | |
| Lenovo ThinkPad T16 G1 21BWS00200 | |
| Média Intel Iris Xe Graphics G7 80EUs (39 - 232, n=14) | |
| HP ProBook 450 G9 6A180EA | |
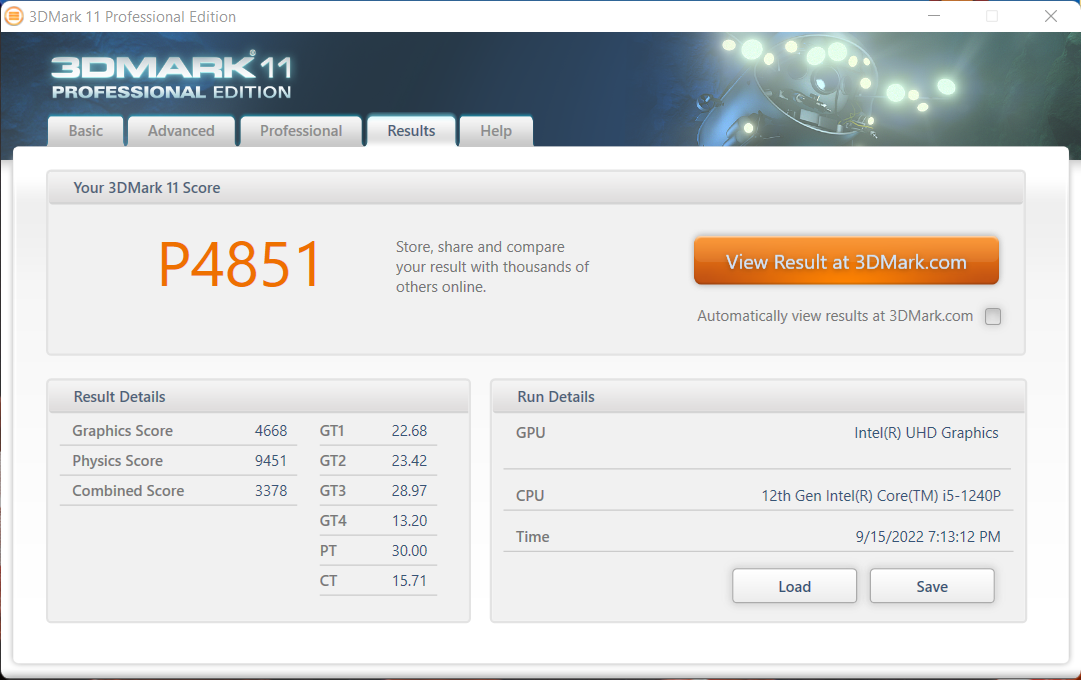
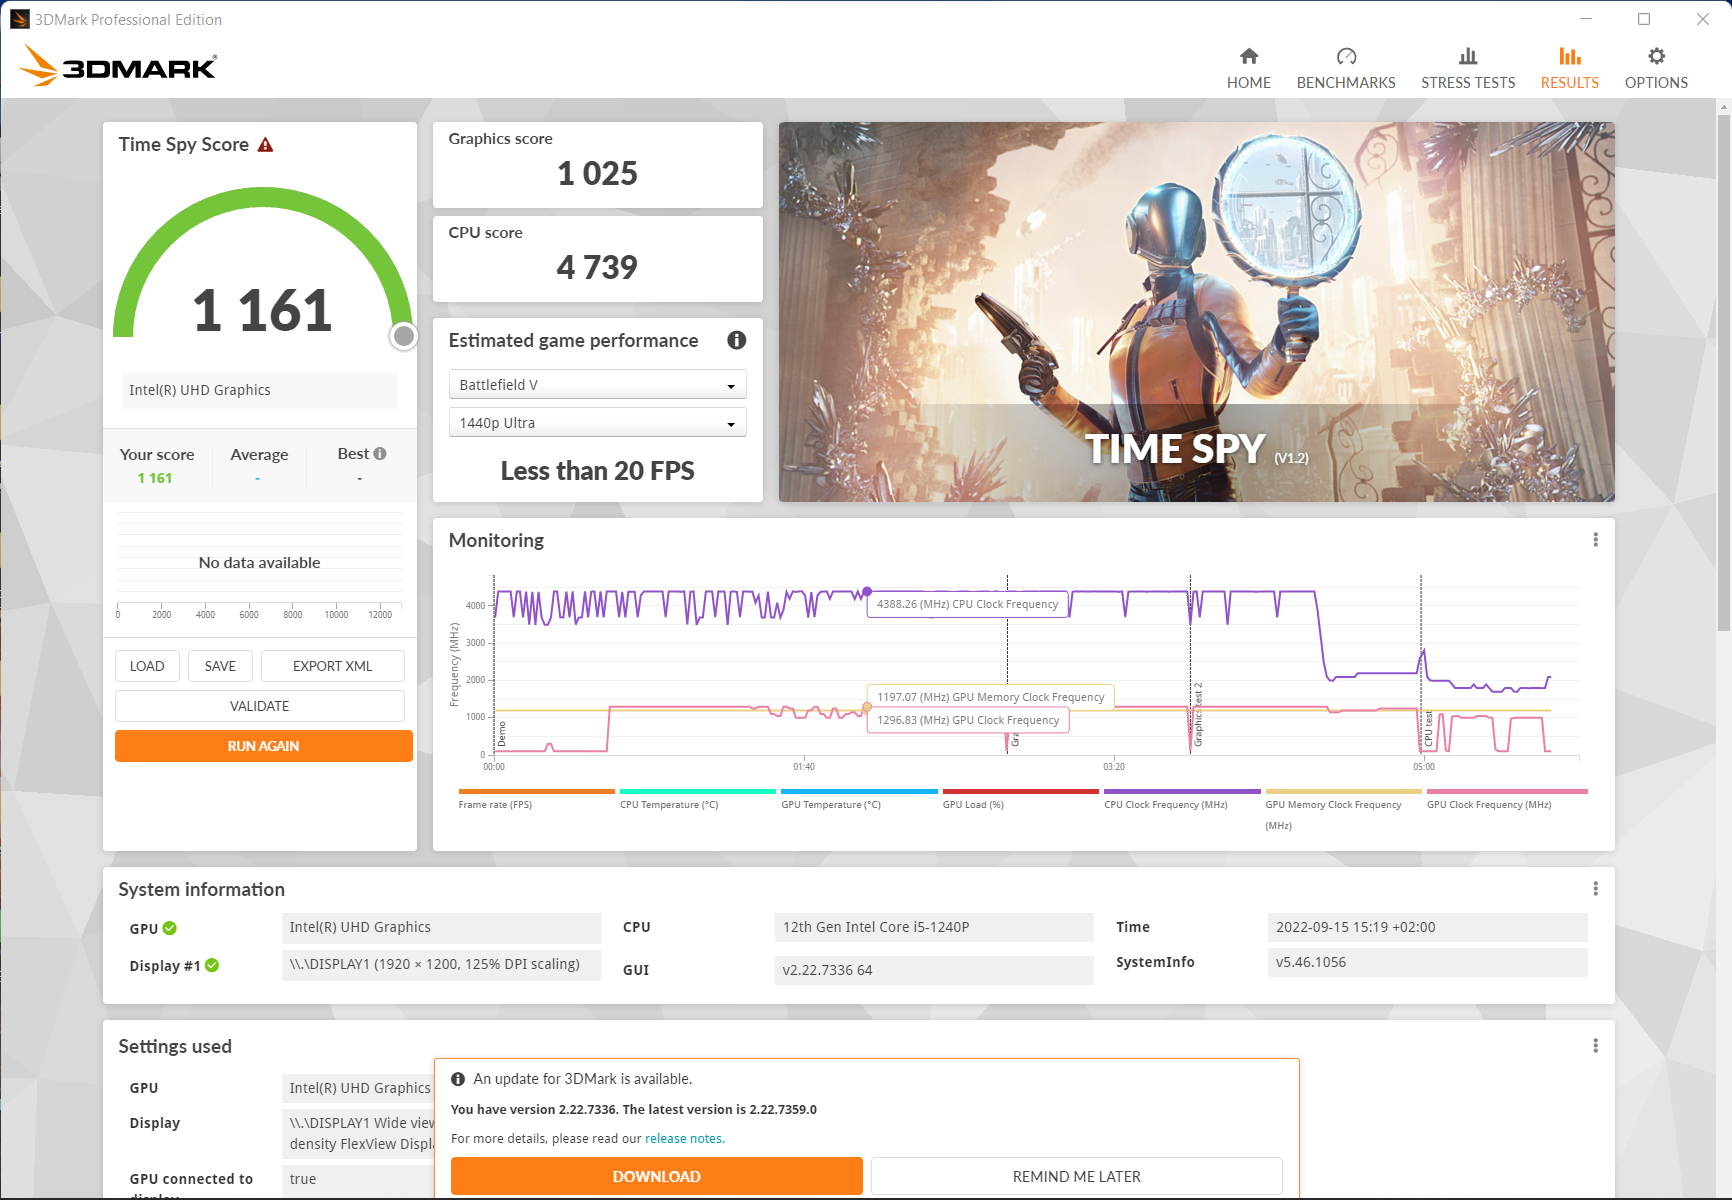
| 3DMark 11 Performance | 4851 pontos | |
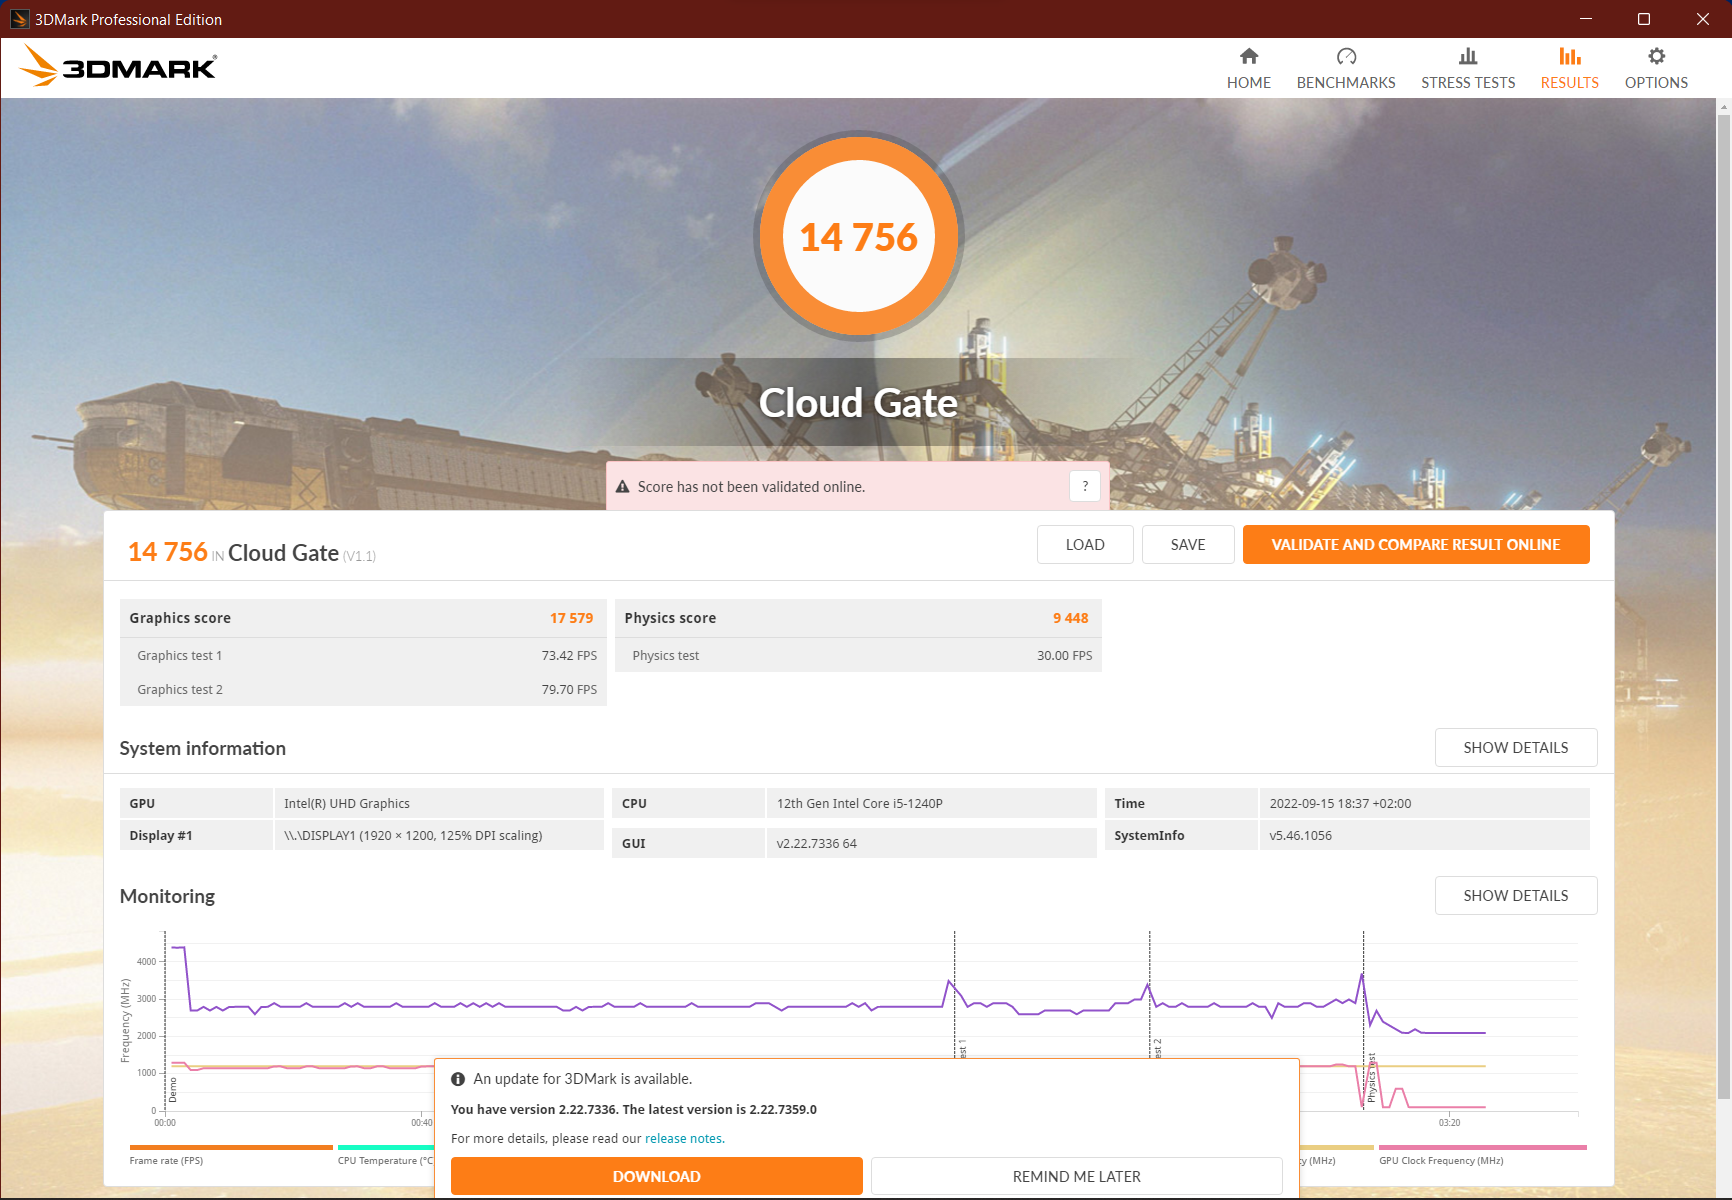
| 3DMark Cloud Gate Standard Score | 14756 pontos | |
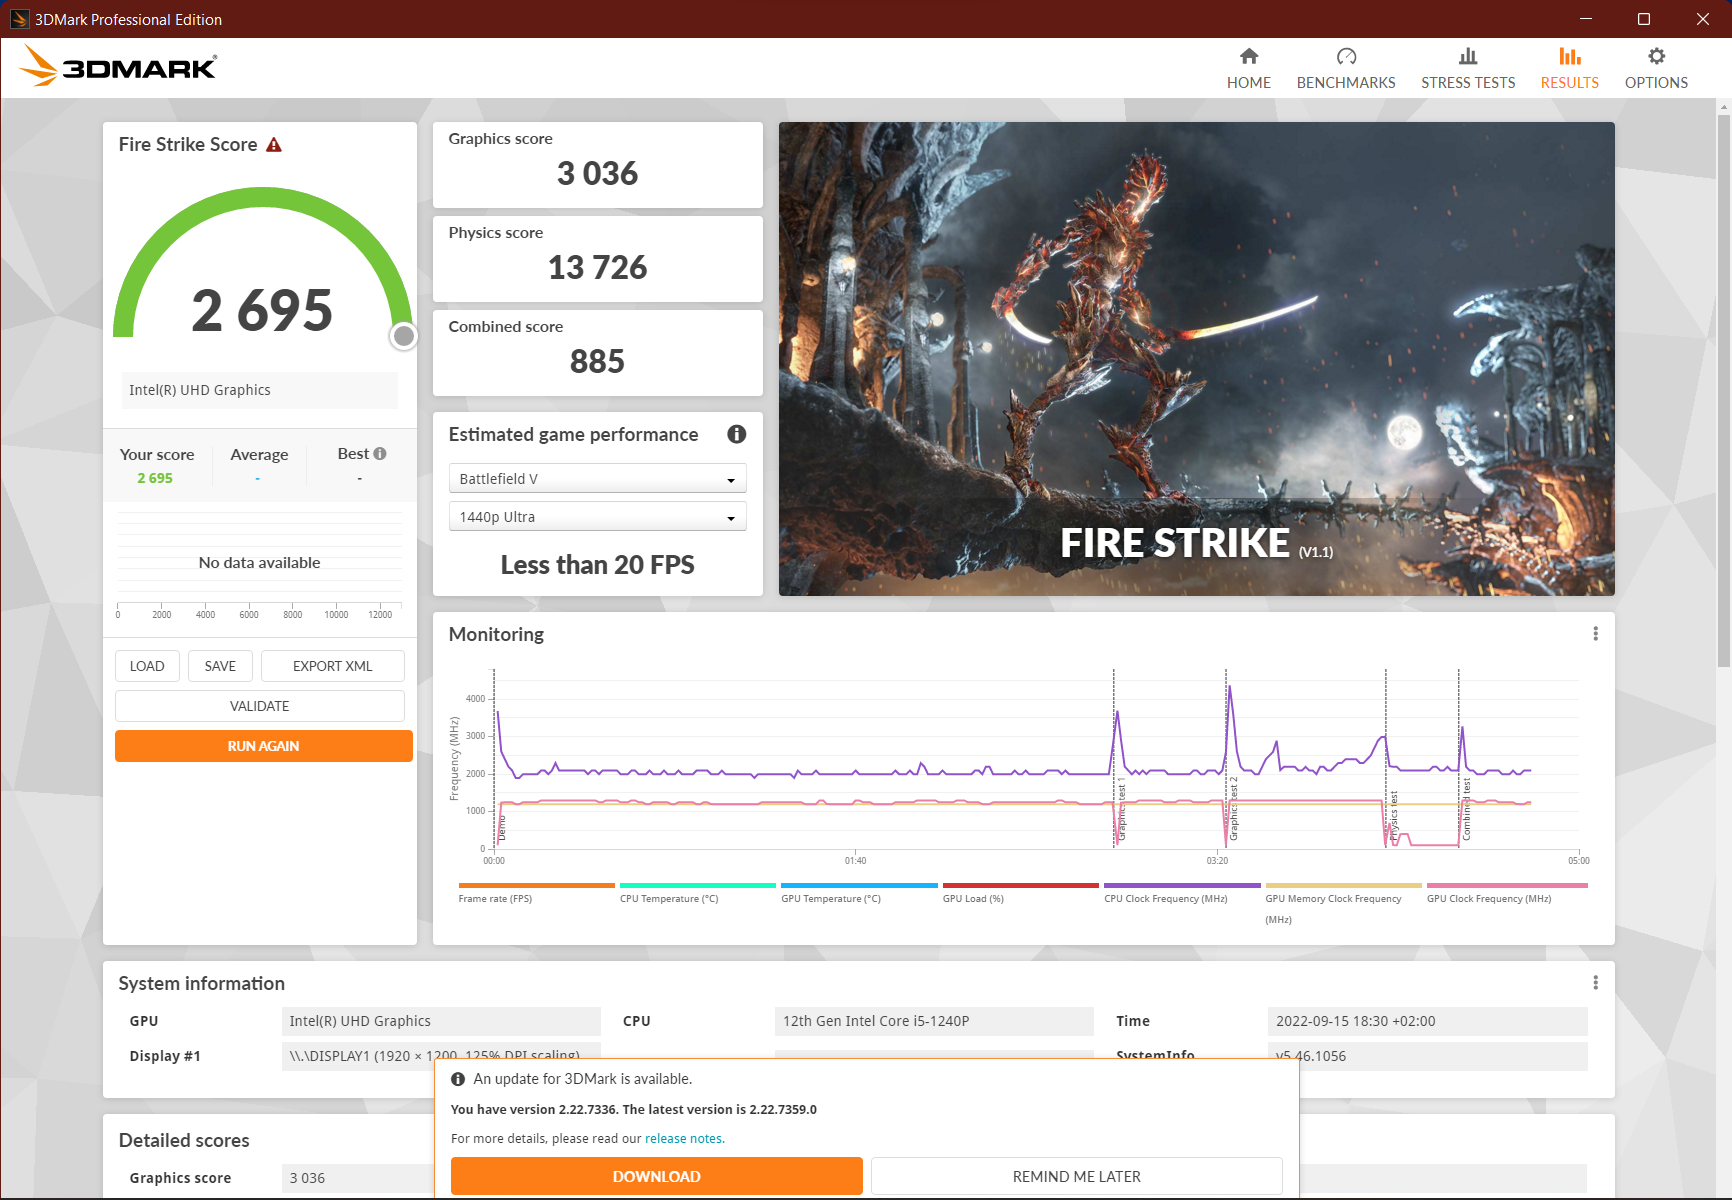
| 3DMark Fire Strike Score | 2695 pontos | |
| 3DMark Time Spy Score | 1161 pontos | |
Ajuda | ||
| Shadow of the Tomb Raider - 1280x720 Lowest Preset | |
| HP ZBook Power 15 G8 313S5EA | |
| Média da turma Office (16 - 105, n=2, últimos 2 anos) | |
| Média Intel Iris Xe Graphics G7 80EUs (31 - 62.8, n=6) | |
| HP ProBook 450 G9 6A180EA | |
| Lenovo ThinkPad T16 G1 21BWS00200 | |
| GRID Legends - 1920x1080 Medium Preset | |
| HP ZBook Power 15 G8 313S5EA | |
| Média Intel Iris Xe Graphics G7 80EUs (25.7 - 39.7, n=4) | |
| HP ProBook 450 G9 6A180EA | |
| Lenovo ThinkPad T16 G1 21BWS00200 | |
Witcher 3 FPS Chart
| baixo | média | alto | ultra | |
|---|---|---|---|---|
| GTA V (2015) | 61.9 | 50.1 | 9.54 | |
| The Witcher 3 (2015) | 50.7 | 32.1 | 15.7 | 8.36 |
| Dota 2 Reborn (2015) | 97.5 | 66.3 | 35.2 | 32.7 |
| Final Fantasy XV Benchmark (2018) | 24.9 | 13.5 | ||
| X-Plane 11.11 (2018) | 42.5 | 29.1 | 26.5 | |
| Far Cry 5 (2018) | 30 | 15 | 14 | 13 |
| Strange Brigade (2018) | 52.7 | 20.3 | 17 | 13.8 |
| Shadow of the Tomb Raider (2018) | 31 | 11 | ||
| GRID Legends (2022) | 36.2 | 25.7 | 21 |
Emissões - Um laptop de 16 polegadas, em sua maioria silencioso, da Lenovo
Ruído
Quando ocioso, o ThinkPad T16 permanece absolutamente silencioso. Mesmo durante as tarefas intensivas de navegação na web e de CPU, o ventilador permanece tão silencioso a uma média de 25 dB(A) que dificilmente se consegue distingui-lo do ruído ambiente.
Somente sob carga combinada, como quando jogando, você percebe que este não é um dispositivo resfriado passivamente - embora o laptop ainda mantenha um perfil baixo a 32 dB(A). No entanto, o ventilador então funciona em tons bastante altos. Pelo menos não há ruídos eletrônicos irritantes.
Apenas o ThinkPad L15 G2 AMD e o HP ProBook 450 G9 são igualmente silenciosos em comparação
Barulho
| Ocioso |
| 23.3 / 23.3 / 23.3 dB |
| Carga |
| 25.1 / 34 dB |
 | ||
30 dB silencioso 40 dB(A) audível 50 dB(A) ruidosamente alto |
||
min: | ||
| Lenovo ThinkPad T16 G1 21BWS00200 Iris Xe G7 80EUs, i5-1240P, Samsung PM9A1 MZVL2512HCJQ | Lenovo ThinkPad T15 Gen2-20W5S00100 GeForce MX450, i7-1165G7, Samsung PM981a MZVLB1T0HBLR | Lenovo ThinkPad E15 G3-20YG003UGE Vega 8, R7 5700U, SK Hynix PC711 1TB HFS001TDE9X084N | Lenovo ThinkPad L15 G2 AMD Vega 7, R5 5600U, SK Hynix HFS512 GDE9X081N | HP ProBook 450 G9 6A180EA Iris Xe G7 96EUs, i7-1255U, SK Hynix HFM512GD3JX013N | HP ZBook Power 15 G8 313S5EA T600 Laptop GPU, i7-11800H, Samsung PM9A1 MZVL2512HCJQ | Dell Inspiron 16 Plus 7620 GeForce RTX 3050 Ti Laptop GPU, i7-12700H, Kioxia BG5 KBG50ZNS512G | Huawei MateBook D 16 2022 Iris Xe G7 96EUs, i7-12700H, Silicon Motion PCIe-8 SSD | Asus Vivobook Pro 16X-M7600QE GeForce RTX 3050 Ti Laptop GPU, R9 5900HX, SK Hynix HFM001TD3JX013N | |
|---|---|---|---|---|---|---|---|---|---|
| Noise | -12% | -10% | -4% | -5% | -33% | -34% | -21% | -27% | |
| desligado / ambiente * (dB) | 23.3 | 24.2 -4% | 23.8 -2% | 24.22 -4% | 25.5 -9% | 25.54 -10% | 23.3 -0% | 24.2 -4% | 26 -12% |
| Idle Minimum * (dB) | 23.3 | 24.2 -4% | 23.8 -2% | 24.22 -4% | 25.5 -9% | 25.54 -10% | 25.7 -10% | 24.2 -4% | 27 -16% |
| Idle Average * (dB) | 23.3 | 24.2 -4% | 23.8 -2% | 24.22 -4% | 25.5 -9% | 25.54 -10% | 26.1 -12% | 25.8 -11% | 27 -16% |
| Idle Maximum * (dB) | 23.3 | 24.2 -4% | 28 -20% | 24.22 -4% | 25.5 -9% | 25.54 -10% | 30.6 -31% | 30.5 -31% | 27.5 -18% |
| Load Average * (dB) | 25.1 | 34.5 -37% | 32.9 -31% | 25.84 -3% | 28 -12% | 48.85 -95% | 46.2 -84% | 39.8 -59% | 41.7 -66% |
| Witcher 3 ultra * (dB) | 32.1 | 37.6 -17% | 46.58 -45% | 49.2 -53% | 39.8 -24% | ||||
| Load Maximum * (dB) | 34 | 37.6 -11% | 35 -3% | 36.02 -6% | 27.7 19% | 50.98 -50% | 49.4 -45% | 39.8 -17% | 45.3 -33% |
* ... menor é melhor
Temperatura
O ThinkPad T16 permanece frio na maioria dos cenários, aquecendo apenas até um grau normal sob carga sustentada. Não se nota muito disto na área do teclado, mas apenas acima dele e mesmo isto não se sente muito quente por muito tempo. A parte de baixo geralmente permanece mais fria, assim você pode usar o ThinkPad T16 no seu colo.
O predecessor direto e também o PensePad E15aquecer consideravelmente mais com um máximo de 55 °C e 60 °C, respectivamente, na parte inferior. O ZBook Power 15 e Vivobook Pro 16Xpor outro lado, permanecem igualmente frios.
(±) A temperatura máxima no lado superior é 45 °C / 113 F, em comparação com a média de 34.3 °C / 94 F , variando de 21.2 a 62.5 °C para a classe Office.
(±) A parte inferior aquece até um máximo de 42.8 °C / 109 F, em comparação com a média de 36.8 °C / 98 F
(+) Em uso inativo, a temperatura média para o lado superior é 30.4 °C / 87 F, em comparação com a média do dispositivo de 29.5 °C / ### class_avg_f### F.
(±) Jogando The Witcher 3, a temperatura média para o lado superior é 35.9 °C / 97 F, em comparação com a média do dispositivo de 29.5 °C / ## #class_avg_f### F.
(+) Os apoios para as mãos e o touchpad estão atingindo a temperatura máxima da pele (33.4 °C / 92.1 F) e, portanto, não estão quentes.
(-) A temperatura média da área do apoio para as mãos de dispositivos semelhantes foi 27.5 °C / 81.5 F (-5.9 °C / -10.6 F).
| Lenovo ThinkPad T16 G1 21BWS00200 Intel Core i5-1240P, Intel Iris Xe Graphics G7 80EUs | Lenovo ThinkPad T15 Gen2-20W5S00100 Intel Core i7-1165G7, NVIDIA GeForce MX450 | Lenovo ThinkPad E15 G3-20YG003UGE AMD Ryzen 7 5700U, AMD Radeon RX Vega 8 (Ryzen 4000/5000) | Lenovo ThinkPad L15 G2 AMD AMD Ryzen 5 5600U, AMD Radeon RX Vega 7 | HP ProBook 450 G9 6A180EA Intel Core i7-1255U, Intel Iris Xe Graphics G7 96EUs | HP ZBook Power 15 G8 313S5EA Intel Core i7-11800H, NVIDIA T600 Laptop GPU | Dell Inspiron 16 Plus 7620 Intel Core i7-12700H, NVIDIA GeForce RTX 3050 Ti Laptop GPU | Huawei MateBook D 16 2022 Intel Core i7-12700H, Intel Iris Xe Graphics G7 96EUs | Asus Vivobook Pro 16X-M7600QE AMD Ryzen 9 5900HX, NVIDIA GeForce RTX 3050 Ti Laptop GPU | |
|---|---|---|---|---|---|---|---|---|---|
| Heat | 8% | -2% | 6% | -1% | 16% | 3% | 5% | 11% | |
| Maximum Upper Side * (°C) | 45 | 42.2 6% | 46.4 -3% | 42.8 5% | 40.5 10% | 41.4 8% | 46 -2% | 41.8 7% | 39.4 12% |
| Maximum Bottom * (°C) | 42.8 | 55.1 -29% | 60.9 -42% | 46 -7% | 47.6 -11% | 41.5 3% | 45.8 -7% | 47.3 -11% | 43.6 -2% |
| Idle Upper Side * (°C) | 33 | 23.8 28% | 26.5 20% | 26.9 18% | 32.6 1% | 23.8 28% | 29.2 12% | 28.3 14% | 27.6 16% |
| Idle Bottom * (°C) | 33.6 | 25.1 25% | 27.5 18% | 31.1 7% | 34.2 -2% | 25 26% | 31 8% | 30.2 10% | 27.5 18% |
* ... menor é melhor
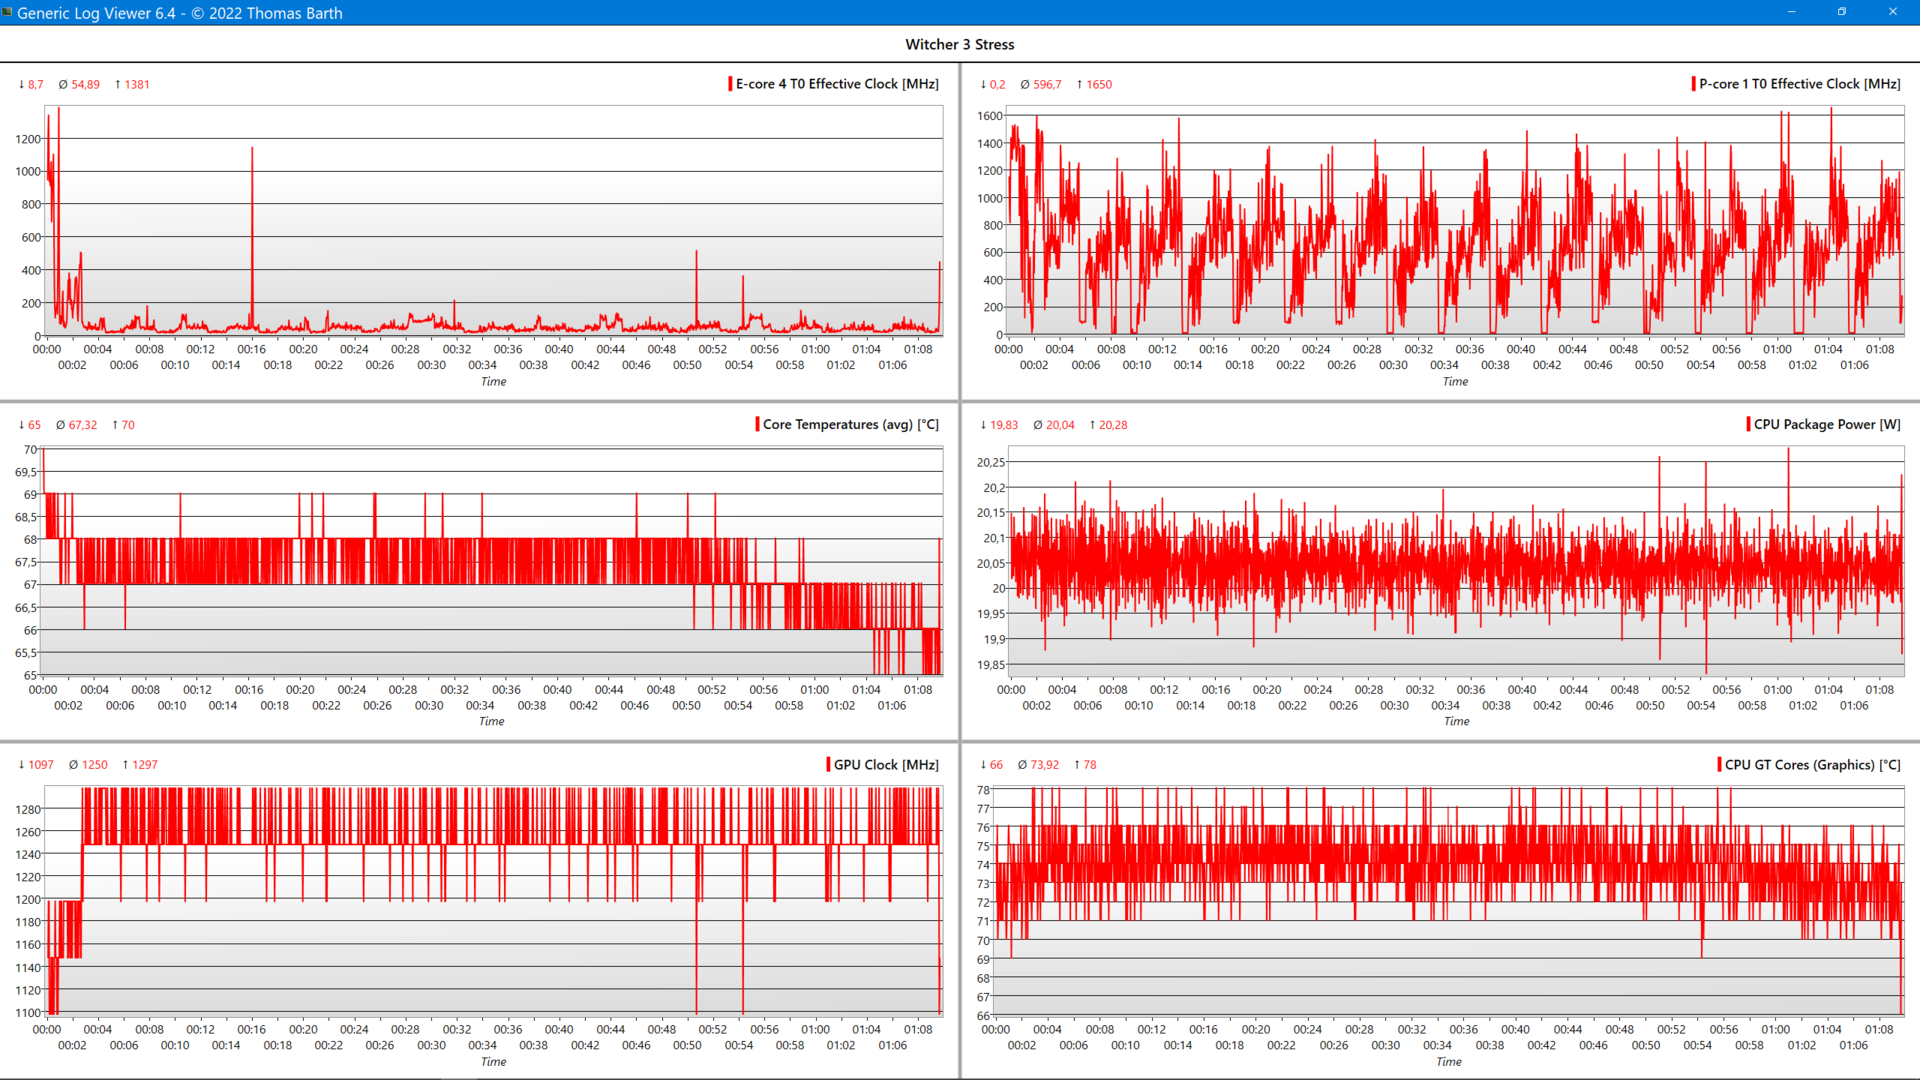
Teste de estresse
Sob carga combinada (Prime95+FurMark), os núcleos P caíram de 2,2 para 1,4 GHz após um curto período - um pouco abaixo do relógio de base de 1,7 GHz. Um dos núcleos (P-Core 0) parece estar desativado a maior parte do tempo (0 MHz). A temperatura cai de uma temperatura inicial de 95 °C para uma estável de 62 °C. O iGPU desce de 1300 MHz para 480 MHz a 61 °C. Mais uma vez, o problema é o limite de potência definido de 20 watts.
Sob pura tensão da CPU, os núcleos P também não atingem seu relógio de base, mas sim o relógio a 1,5 GHz (todos os núcleos ativos). Somente quando o iGPU é estressado, ele consegue 1.118 MHz a 66 °C.
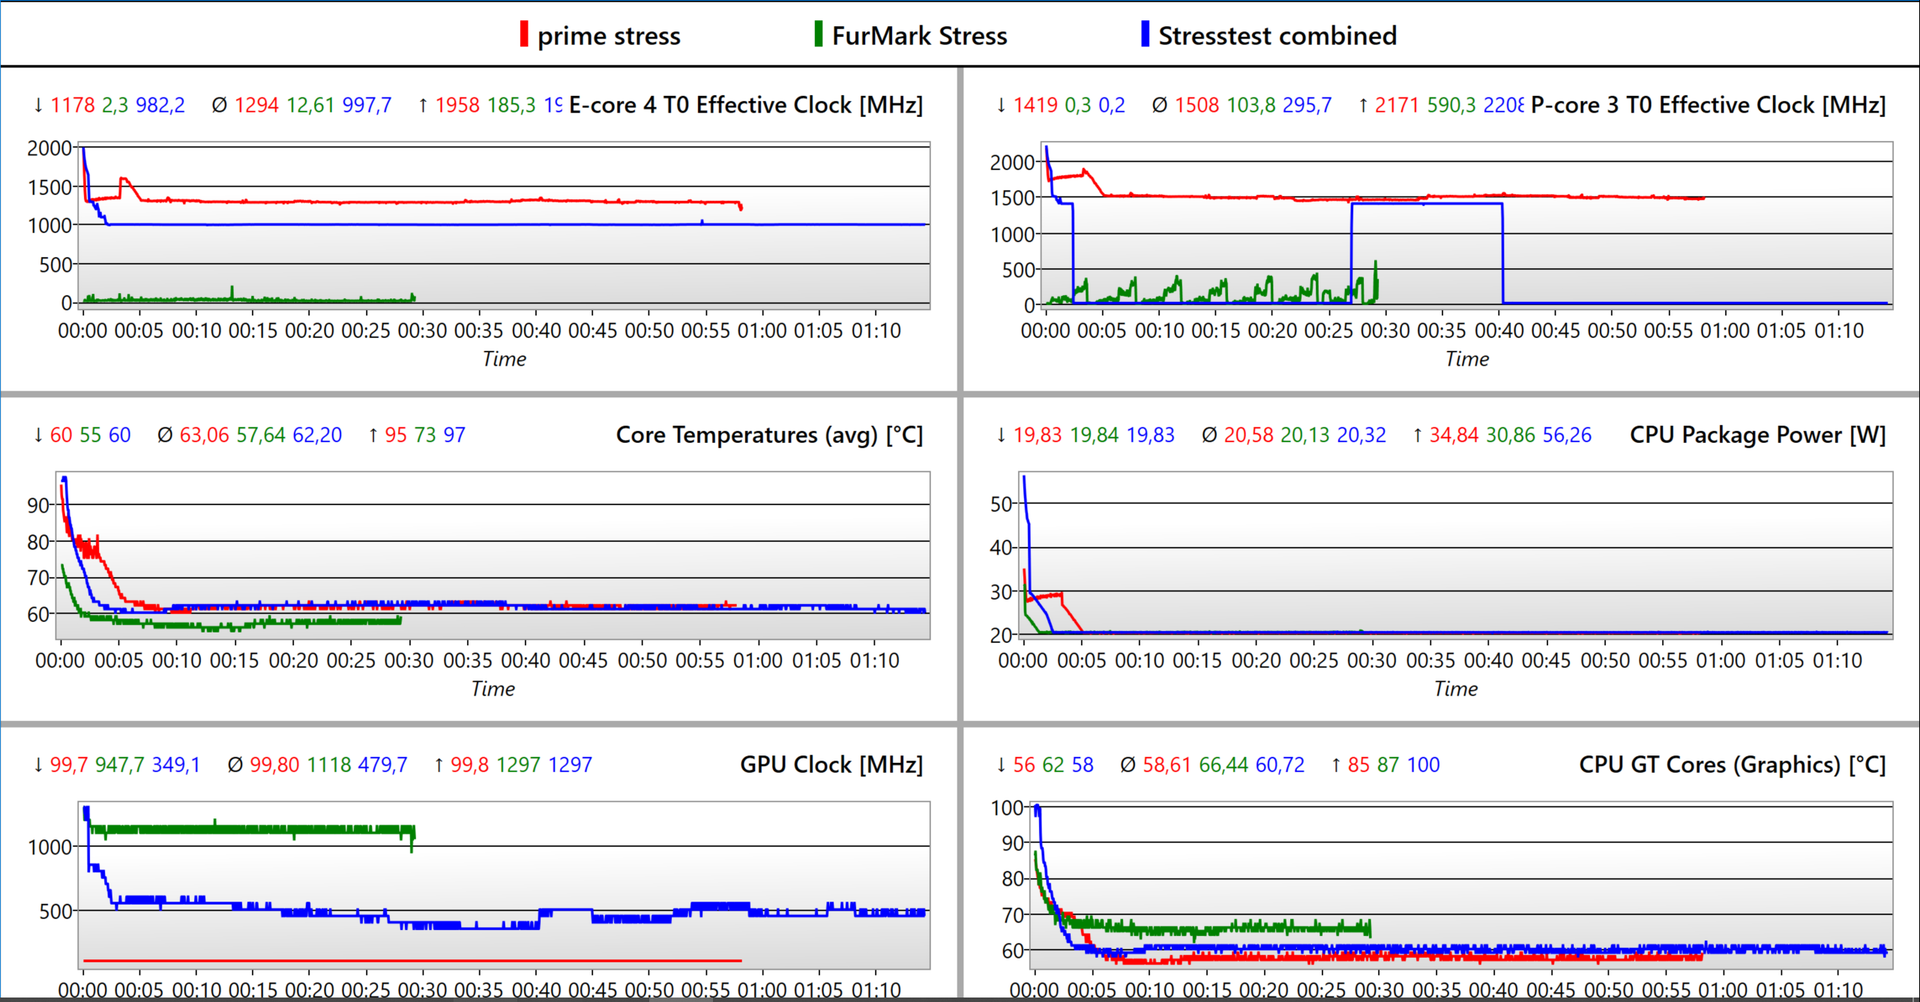
| Relógio CPU P- & E-Cores (GHz) | Relógio GPU (MHz) | Temperatura média da CPU (°C) | Temperatura média da GPU (°C) | |
| System Idle | - | 100 | 34 | 36 |
| Prime95 + FurMark Stress | 1,4 / 1 | 480 | 62 | 61 |
| Prime95 Stress | 1,5 / 1,3 | 100 | 63 | 58 |
| FurMark Stress | 0,1 / 0,01 | 1.120 | 58 | 66 |
| Witcher 3 Estresse | 0,6 / 0,05 | 1.250 | 67 | 74 |
Oradores
Felizmente, os alto-falantes da série T foram melhorados. Os graves ainda estão faltando, mas os médios e agudos estão equilibrados e reproduzidos linearmente.
Isto é aceitável para filmes e vídeos, mas o prazer musical só é possível com um sistema de som externo ou fones de ouvido conectados via conector ou Bluetooth. Com um máximo de 75 dB(A), você pode preencher uma sala de tamanho médio com som.
Lenovo ThinkPad T16 G1 21BWS00200 análise de áudio
(±) | o volume do alto-falante é médio, mas bom (###valor### dB)
Graves 100 - 315Hz
(-) | quase nenhum baixo - em média 20.5% menor que a mediana
(-) | graves não são lineares (15.5% delta para frequência anterior)
Médios 400 - 2.000 Hz
(+) | médios equilibrados - apenas 2.3% longe da mediana
(+) | médios são lineares (4.1% delta para frequência anterior)
Altos 2 - 16 kHz
(+) | agudos equilibrados - apenas 3.2% longe da mediana
(+) | os máximos são lineares (5.5% delta da frequência anterior)
Geral 100 - 16.000 Hz
(±) | a linearidade do som geral é média (17% diferença em relação à mediana)
Comparado com a mesma classe
» 24% de todos os dispositivos testados nesta classe foram melhores, 8% semelhantes, 68% piores
» O melhor teve um delta de 7%, a média foi 21%, o pior foi 53%
Comparado com todos os dispositivos testados
» 31% de todos os dispositivos testados foram melhores, 8% semelhantes, 61% piores
» O melhor teve um delta de 4%, a média foi 23%, o pior foi 134%
Huawei MateBook D 16 2022 análise de áudio
(±) | o volume do alto-falante é médio, mas bom (###valor### dB)
Graves 100 - 315Hz
(-) | quase nenhum baixo - em média 17.7% menor que a mediana
(±) | a linearidade dos graves é média (9.8% delta para a frequência anterior)
Médios 400 - 2.000 Hz
(+) | médios equilibrados - apenas 1.9% longe da mediana
(+) | médios são lineares (5.6% delta para frequência anterior)
Altos 2 - 16 kHz
(+) | agudos equilibrados - apenas 4.4% longe da mediana
(+) | os máximos são lineares (3.1% delta da frequência anterior)
Geral 100 - 16.000 Hz
(±) | a linearidade do som geral é média (16.2% diferença em relação à mediana)
Comparado com a mesma classe
» 41% de todos os dispositivos testados nesta classe foram melhores, 7% semelhantes, 51% piores
» O melhor teve um delta de 5%, a média foi 17%, o pior foi 45%
Comparado com todos os dispositivos testados
» 26% de todos os dispositivos testados foram melhores, 6% semelhantes, 68% piores
» O melhor teve um delta de 4%, a média foi 23%, o pior foi 134%
Gerenciamento de energia - bateria de 14 horas no ThinkPad de 16 polegadas
Consumo de energia
Medimos um baixo consumo de energia ociosa de ~6 watts e um mínimo de 2,9 watts. Nosso campo de comparação, incluindo os derivados AMD, não é compatível com isso. Sob carga, medimos uma média de 27,9 watts - um valor que se deve à CPU asfixiada. A carga combinada (CPU+iGPU) resulta em 42,6 watts.
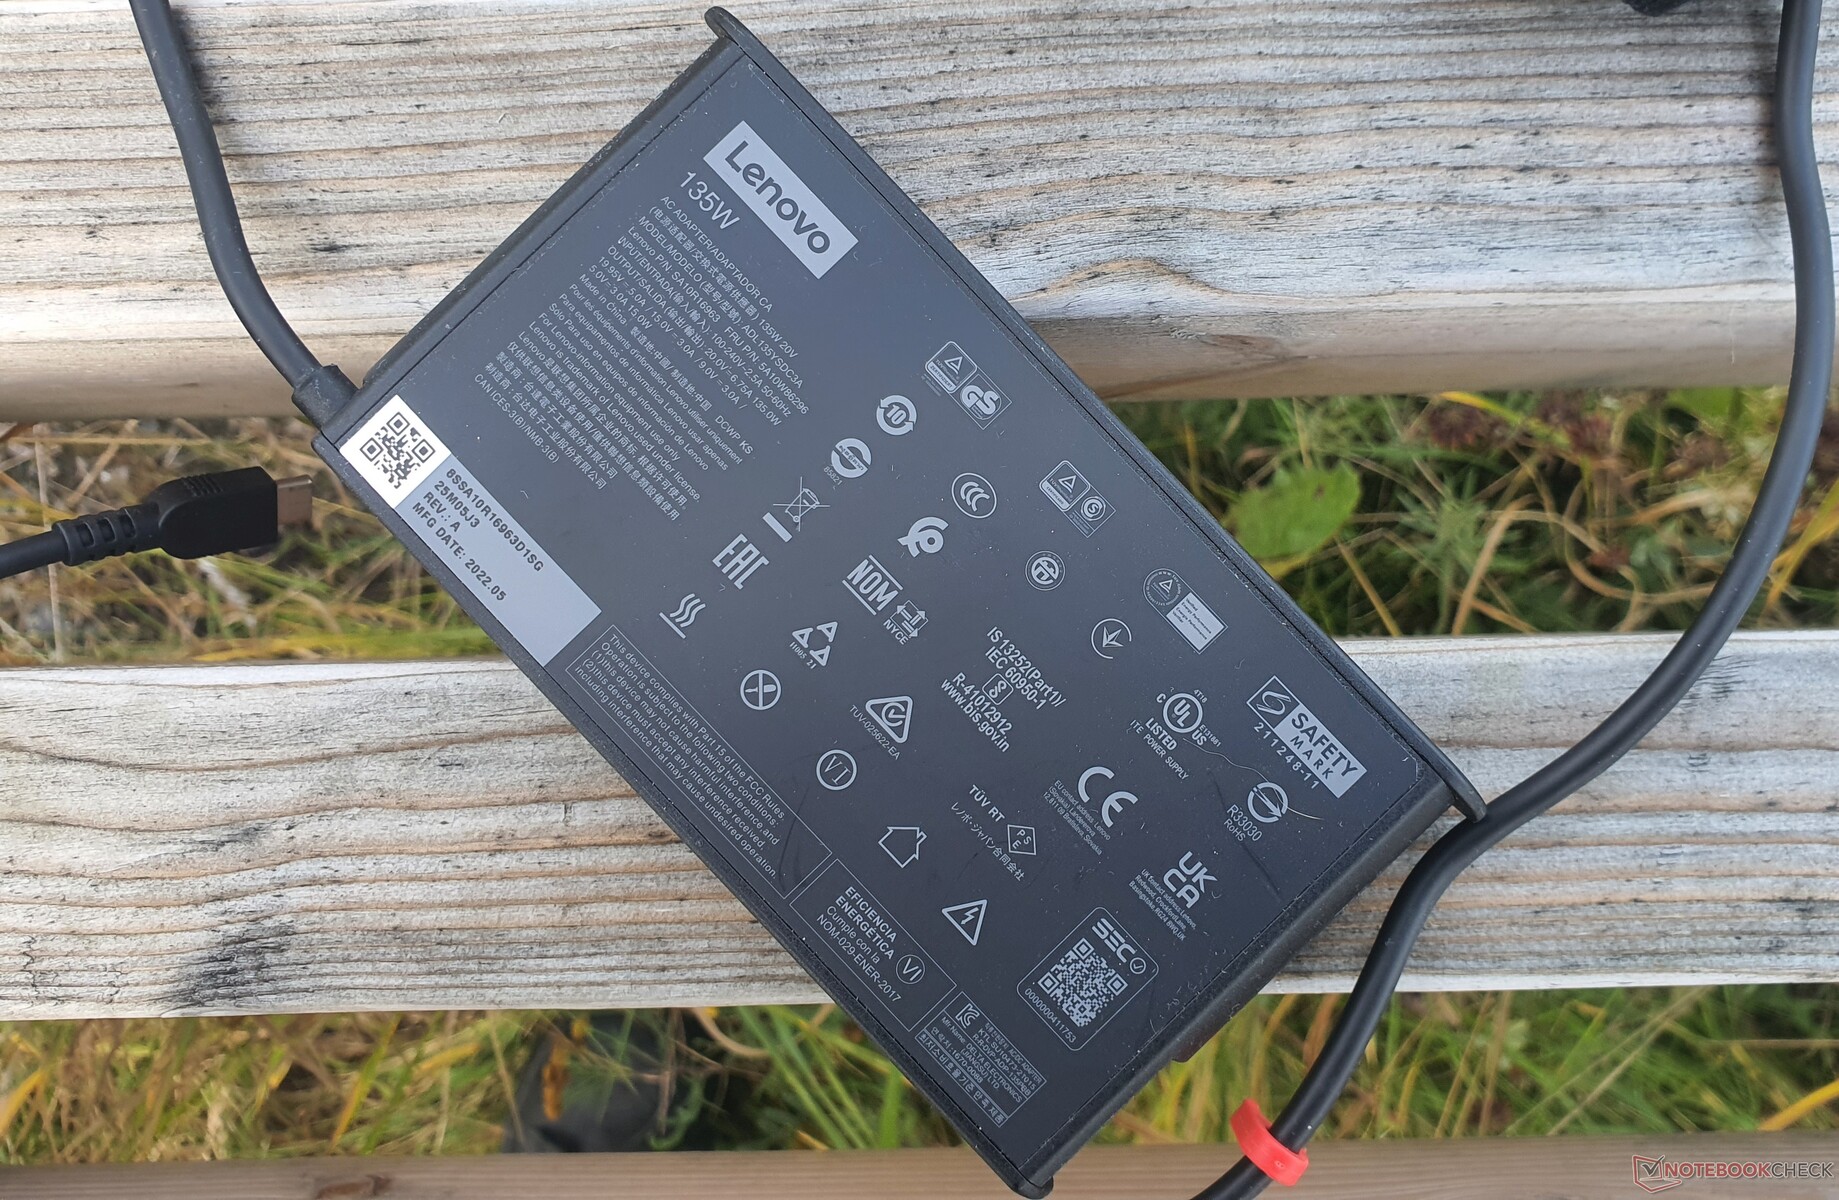
Picos de energia de até 90 watts, causados pelo turbo de curto prazo, podem ser bem absorvidos pelo adaptador de energia de 135 W. Além disso, o adaptador de energia permite que a grande bateria de 86 Wh seja rapidamente carregada a 80% em uma hora. Continua sendo questionável se um adaptador de energia de 100 watts, que seria um pouco mais compacto e é oferecido com a versão AMD, faria o trabalho da mesma forma.
| desligado | |
| Ocioso | |
| Carga |
|
Key:
min: | |
| Lenovo ThinkPad T16 G1 21BWS00200 i5-1240P, Iris Xe G7 80EUs, Samsung PM9A1 MZVL2512HCJQ, IPS, 1920x1200, 16" | Lenovo ThinkPad T15 Gen2-20W5S00100 i7-1165G7, GeForce MX450, Samsung PM981a MZVLB1T0HBLR, IPS, 1920x1080, 15.6" | Lenovo ThinkPad X1 Extreme G4-20Y5CTO1WW (3050 Ti) i7-11800H, GeForce RTX 3050 Ti Laptop GPU, Samsung PM9A1 MZVL21T0HCLR, IPS LED, 3840x2400, 16" | HP ProBook 450 G9 6A180EA i7-1255U, Iris Xe G7 96EUs, SK Hynix HFM512GD3JX013N, , 1920x1080, 15.6" | HP ZBook Power 15 G8 313S5EA i7-11800H, T600 Laptop GPU, Samsung PM9A1 MZVL2512HCJQ, IPS LED, 1920x1080, 15.6" | Huawei MateBook D 16 2022 i7-12700H, Iris Xe G7 96EUs, Silicon Motion PCIe-8 SSD, IPS, 1920x1200, 16" | Dell Inspiron 16 Plus 7620 i7-12700H, GeForce RTX 3050 Ti Laptop GPU, Kioxia BG5 KBG50ZNS512G, IPS, 3072x1920, 16" | Lenovo ThinkPad L15 G2 AMD R5 5600U, Vega 7, SK Hynix HFS512 GDE9X081N, IPS LED, 1920x1080, 15.6" | Média da turma Office | |
|---|---|---|---|---|---|---|---|---|---|
| Power Consumption | -44% | -210% | -8% | -55% | -70% | -151% | -14% | -27% | |
| Idle Minimum * (Watt) | 2.9 | 4.5 -55% | 10.3 -255% | 4.5 -55% | 4.17 -44% | 6.1 -110% | 6.8 -134% | 4.57 -58% | 4.3 ? -48% |
| Idle Average * (Watt) | 6 | 8.8 -47% | 22.06 -268% | 7.3 -22% | 6.32 -5% | 10.6 -77% | 9.6 -60% | 8.2 -37% | 7.35 ? -22% |
| Idle Maximum * (Watt) | 6.9 | 11.6 -68% | 23 -233% | 8.1 -17% | 7.1 -3% | 11.5 -67% | 17 -146% | 9.3 -35% | 8.6 ? -25% |
| Load Average * (Watt) | 27.3 | 60 -120% | 102.57 -276% | 32.8 -20% | 80.41 -195% | 65.5 -140% | 117.5 -330% | 31.9 -17% | 43.9 ? -61% |
| Witcher 3 ultra * (Watt) | 42.6 | 39.2 8% | 106 -149% | 32 25% | 62.3 -46% | 61.2 -44% | 113.1 -165% | 34.5 19% | |
| Load Maximum * (Watt) | 81.53 | 68.5 16% | 147.8 -81% | 47 42% | 110.18 -35% | 68.4 16% | 137.4 -69% | 47.4 42% | 64.5 ? 21% |
* ... menor é melhor
Power consumption Witcher 3 / Stress test
Power consumption with an external monitor
Vida útil da bateria
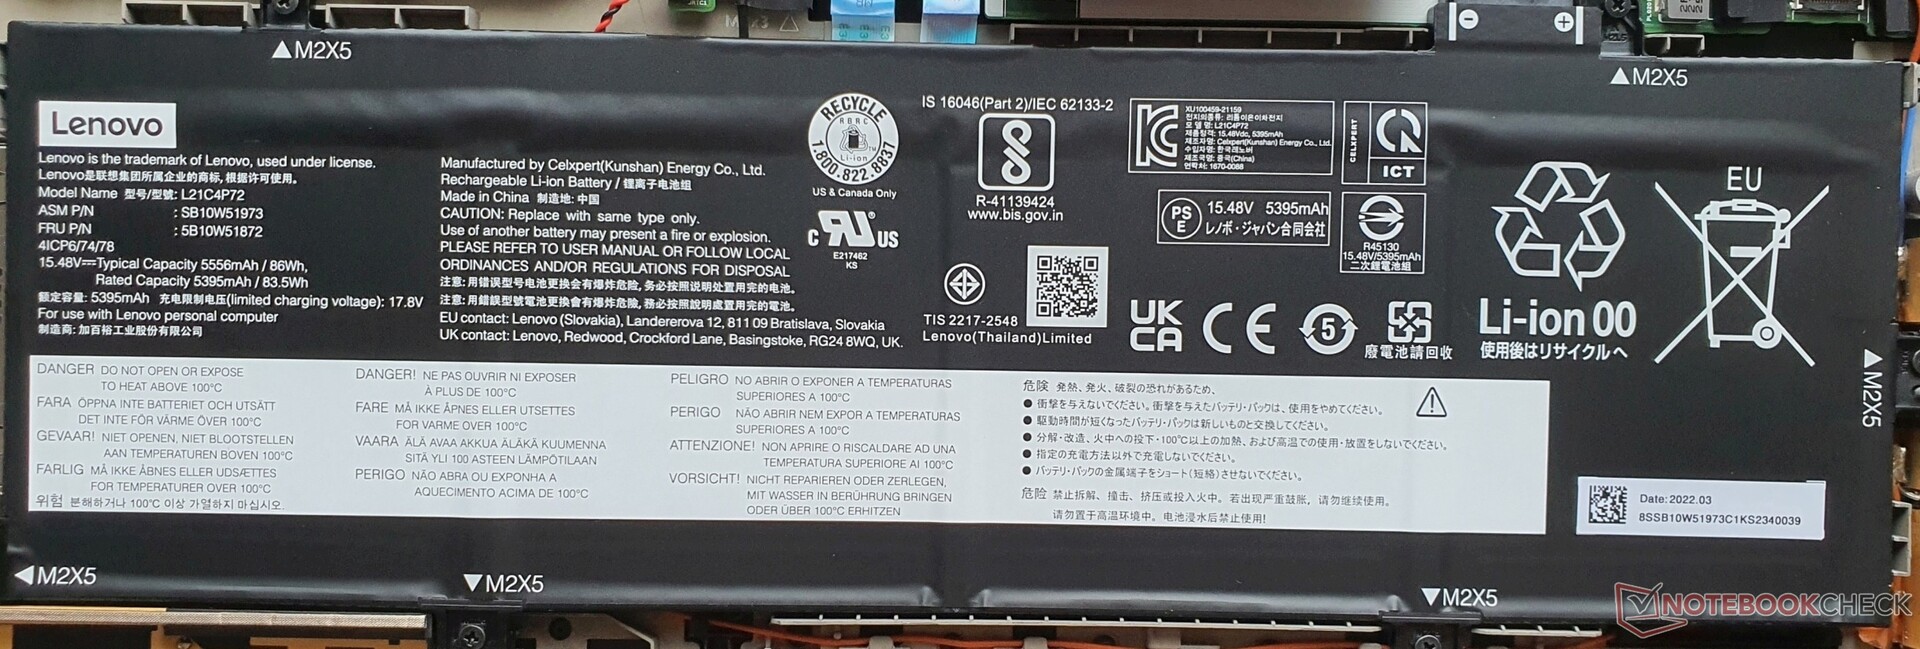
Apesar da grande bateria 86 Wh do nosso modelo, não esperávamos que o teste WLAN durasse mais de 14 horas. Usamos um script que simula a navegação na web com 150 lêndeas fixas, usando o perfil de energia "Balanceado" no Windows. ONúcleo i5-1240P parece ser mais econômico do que o Núcleo i7-1280Pprovavelmente porque este último tem mais P-cores. A tela de baixa potência com resolução FHD+ também tem um efeito positivo, especialmente com brilho total de 390 lêndeas, onde o ThinkPad atinge quase 11 horas.
Uma perspectiva excitante é se uma variante AMD do T16 será capaz de oferecer ainda mais. O tempo de execução de carga total de 3,5 horas é correspondentemente longo devido ao baixo limite de potência de 20 watts.
| Lenovo ThinkPad T16 G1 21BWS00200 i5-1240P, Iris Xe G7 80EUs, 86 Wh | Lenovo ThinkPad T15 Gen2-20W5S00100 i7-1165G7, GeForce MX450, 57 Wh | Lenovo ThinkPad E15 G3-20YG003UGE R7 5700U, Vega 8, 57 Wh | Lenovo ThinkPad L15 G2 AMD R5 5600U, Vega 7, 45 Wh | HP ProBook 450 G9 6A180EA i7-1255U, Iris Xe G7 96EUs, 51 Wh | HP ZBook Power 15 G8 313S5EA i7-11800H, T600 Laptop GPU, 83 Wh | Dell Inspiron 16 Plus 7620 i7-12700H, GeForce RTX 3050 Ti Laptop GPU, 86 Wh | Huawei MateBook D 16 2022 i7-12700H, Iris Xe G7 96EUs, 60 Wh | Asus Vivobook Pro 16X-M7600QE R9 5900HX, GeForce RTX 3050 Ti Laptop GPU, 96 Wh | |
|---|---|---|---|---|---|---|---|---|---|
| Duração da bateria | -44% | -29% | -45% | -17% | -19% | -49% | -50% | -45% | |
| H.264 (h) | 10.4 | 10.1 -3% | |||||||
| WiFi v1.3 (h) | 14.1 | 7.9 -44% | 10 -29% | 7.8 -45% | 10.1 -28% | 12.3 -13% | 9.6 -32% | 7.1 -50% | 11.3 -20% |
| Load (h) | 3.5 | 3.3 -6% | 2.1 -40% | 1.2 -66% | 1.1 -69% | ||||
| Witcher 3 ultra (h) | 2.7 |
Pro
Contra
Veredicto - ThinkPad T16: exibição forte, tempos de execução longos, desempenho estrangulado

O ThinkPad T16 G1 Intel oferece muito: um visor de 16 polegadas, brilhante 16:10 de baixa potência, tempos de funcionamento muito longos da bateria, equipamentos diversos e, em sua maioria, operação silenciosa. Além disso, um design robusto de alto nível
Um redesenho bem sucedido em geral, apesar do menor deslocamento da chave e da falta da opção 4K. A limitação PL1 de 20 watts é um pouco irritante, o que limita desnecessariamente o desempenho de outra forma bom
A Lenovo oferece um notebook comercial sólido com uma vida útil muito longa da bateria, visor brilhante de baixa potência 16:10 e baixas emissões no ThinkPad T16 G1. Entretanto, o estrangulamento da CPU pode ser problemático fora das tarefas do escritório.
Para os usuários empresariais que procuram um dispositivo compacto com muitos imóveis na tela e longos tempos de funcionamento da bateria, o T16 parece ser incomparável em seu bom teclado, características e comportamento silencioso. A revisão a ser lançada em breve do EliteBook 865 G9 da HP é, portanto, uma perspectiva empolgante. Também emocionante será a comparação com a variante AMD do T16, que tem o potencial de oferecer mais desempenho com emissões ainda menores e tempos de execução ainda mais altos, mas isto ainda está por ser visto em uma futura revisão
Aqueles que também precisam da GPU da estação de trabalho devem olhar para a ZBook Power 15. Aqueles que não precisam do melhor dos melhores encontrarão uma melhor relação custo-benefício no PensePad E15 AMDque é mais que o dobro do preço
Preço e Disponibilidade
O laptop Lenovo ThinkPad T16 G1 Intel parece estar amplamente disponível como um laptop livremente configurável através do website oficial da Lenovo. Por exemplo, encontramos o laptop em , nos EUA (a partir de US$1.099,50), o Reino Unido (£1.169,99), Índia (₹97,185), França (1.427,25 euros), Singapura (SG$1.494,58) e Austrália (AU$2.229,00). Esta lista não é exaustiva.
Os preços são a partir de 23.09.22 e estão sujeitos a alterações
Lenovo ThinkPad T16 G1 21BWS00200
- 09/21/2022 v7 (old)
Marvin Gollor
Price comparison

