Lenovo ThinkPad X1 Extreme G5 Laptop revisado - ThinkPad de bandeira com mais potência de CPU
Após receber uma extensa atualização de quarta geração no ano passado para seu carro-chefe Thinkpad X1 Extreme, a Lenovo está agora se concentrando na qualidade interna do novo modelo - o G5 - instalando um novo e melhorado sistema de resfriamento de metal líquido, bem como um processador Intel da 12ª geração atual (Alder Lake H). As placas gráficas continuam sendo da linha de GPUs da Nvidia da série RTX 3000, incluindo uma opção rápida RTX 3080 Ti
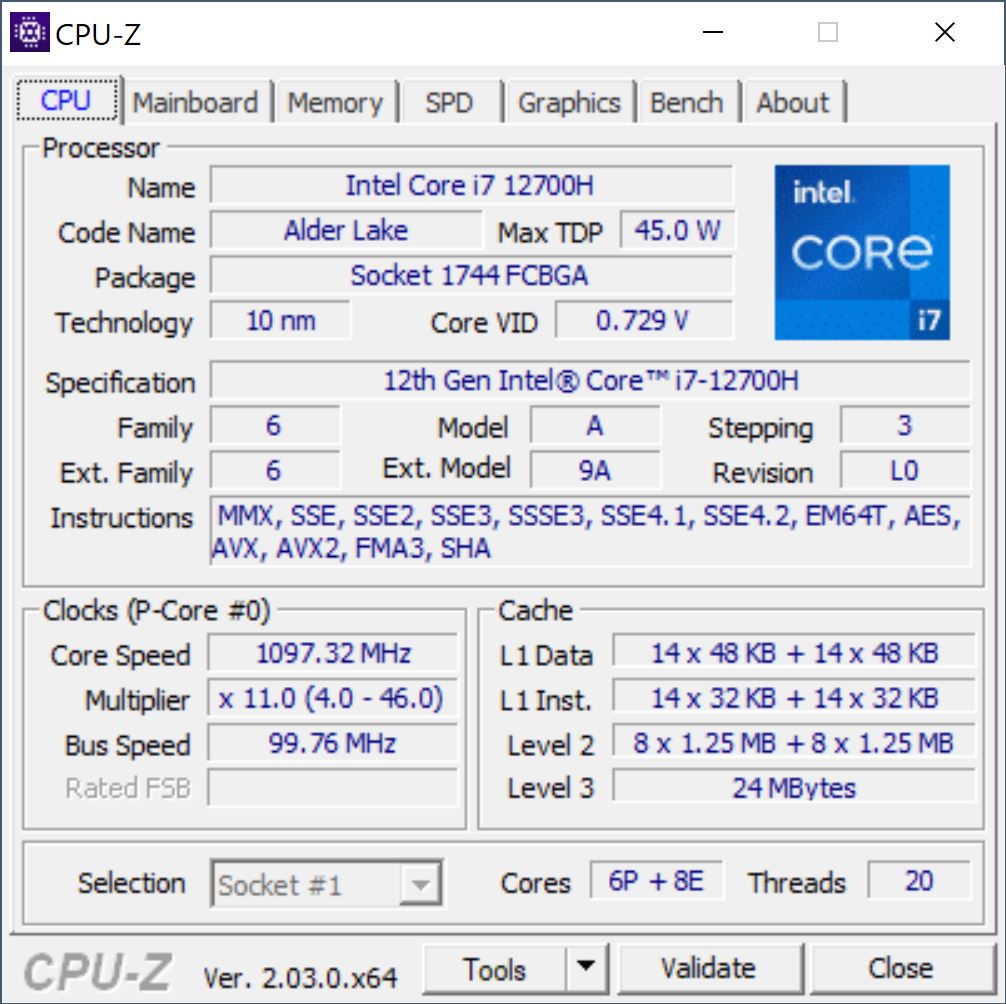
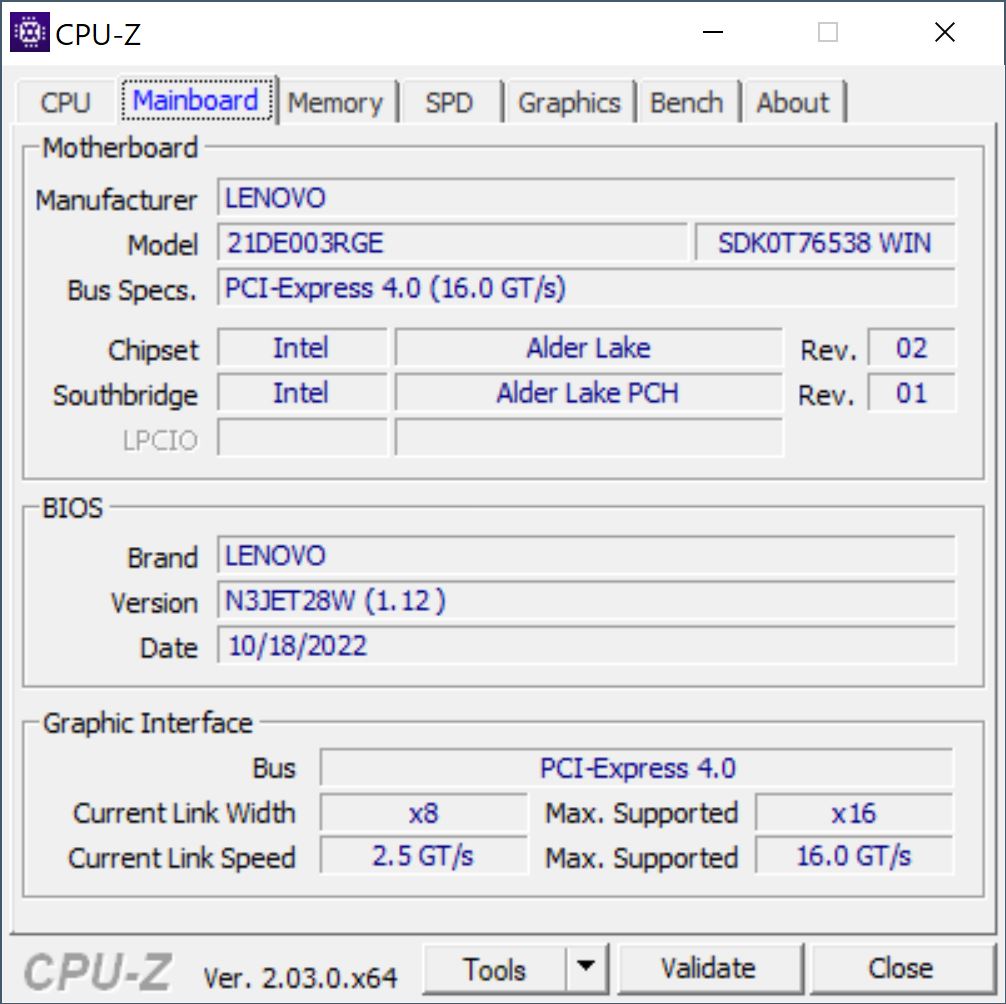
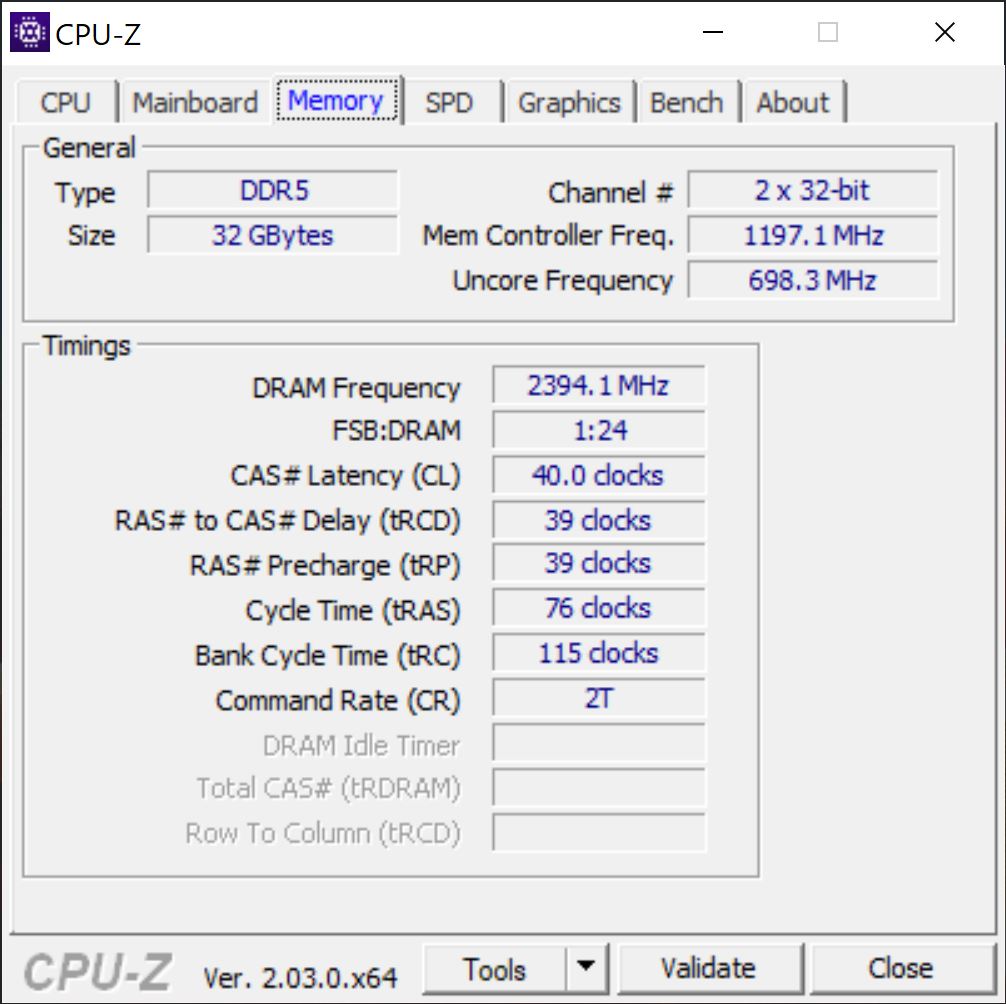
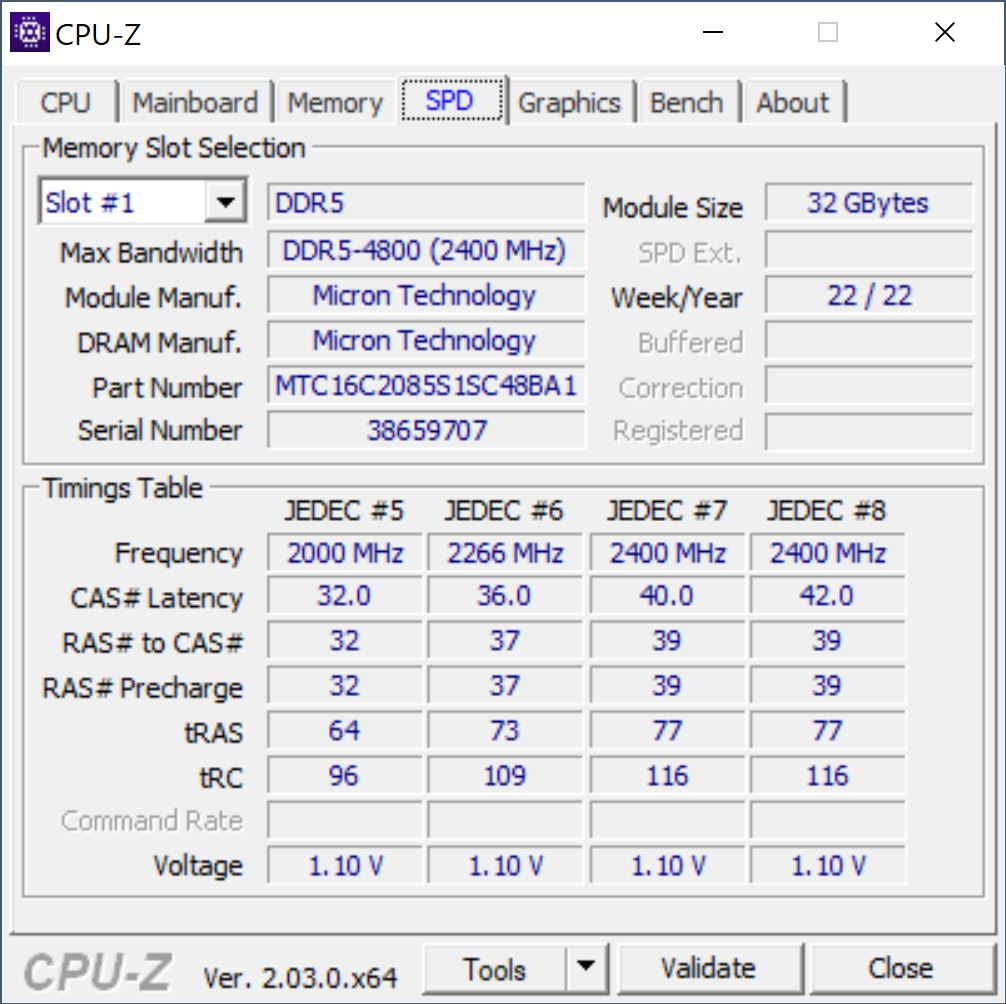
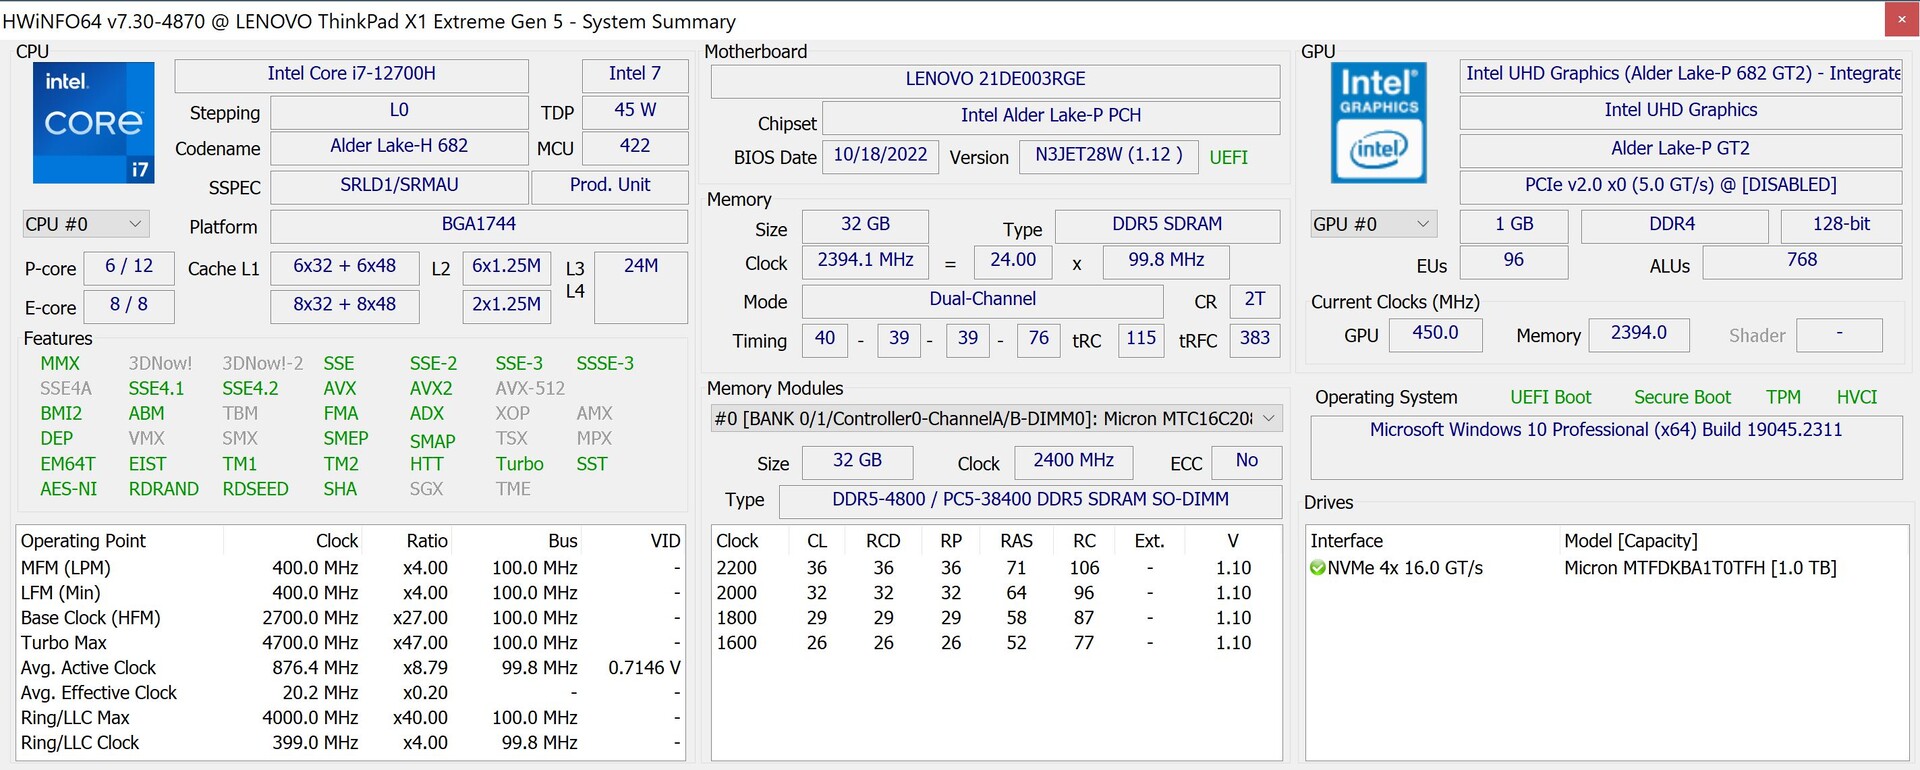
Nosso modelo de revisão, o 21DE003RGE, pode ser obtido por cerca de 3600 dólares americanos e vem com um Intel Core i7-12700H, 32 GB de RAM DDR5-4800, um SSD PCIe 4.0 de 1 TB, uma tela IPS 4K com cobertura total de AdobeRGB, bem como uma GPU dedicada, o GeForce RTX 3060. Nosso modelo foi pré-instalado com o Windows 10 Pro (via direitos de downgrade do Windows 11 Pro). Infelizmente, tivemos alguns problemas de desempenho, incluindo Wi-Fi 6E que não funcionava com Windows 10. Por este motivo, usamos o Windows 11 Pro durante os testes e também recomendamos esta atualização a todos os usuários.
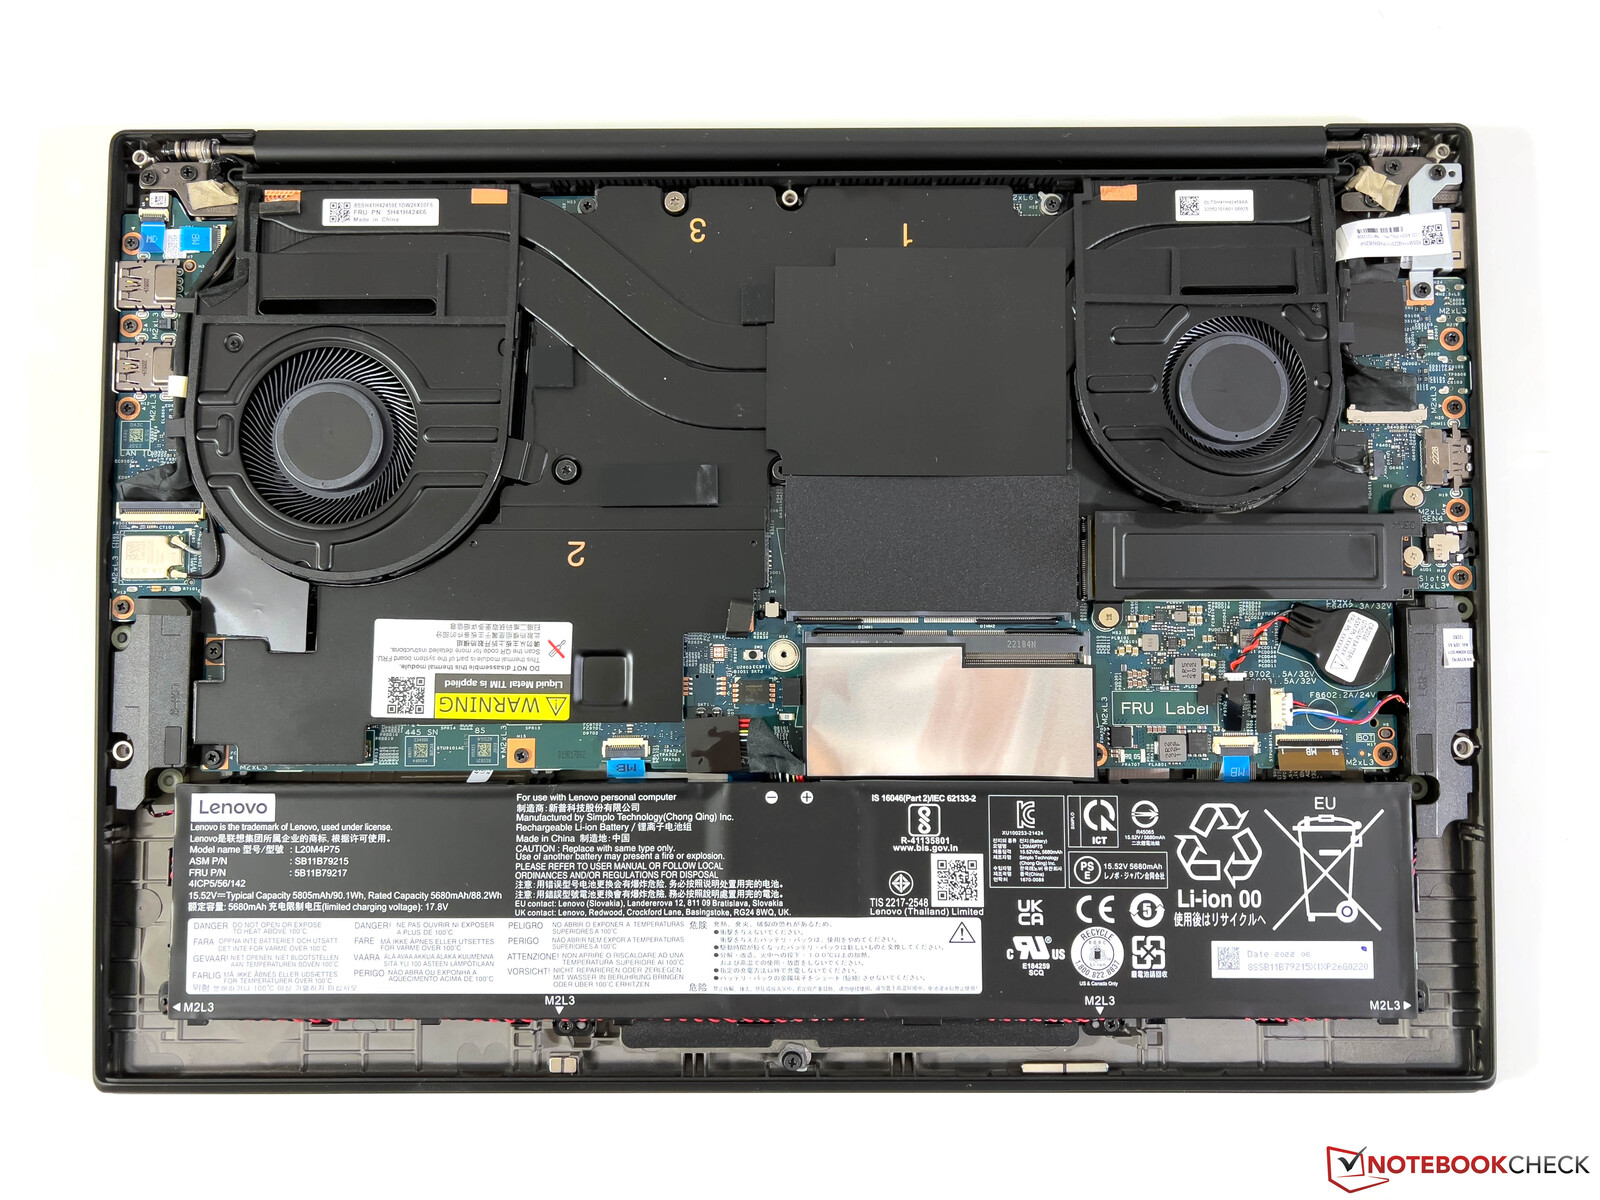
Nota: como no último modelo, o X1 Extreme G5 vem em duas versões básicas. As configurações com o RTX 3050 Ti utilizam refrigeração normal baseada em tubo de calor, razão pela qual há espaço adicional para um segundo M.2 SSD, bem como um módulo WWAN. As configurações com GPUs mais potentes (a partir do RTX 3060) são equipadas com um sistema de resfriamento com câmara de vapor maior, resultando na implementação de apenas um M.2 SSD.
Possíveis concorrentes em comparação
Avaliação | Data | Modelo | Peso | Altura | Size | Resolução | Preço |
|---|---|---|---|---|---|---|---|
| 88.7 % v7 (old) | 12/2022 | Lenovo ThinkPad X1 Extreme G5-21DE003RGE i7-12700H, GeForce RTX 3060 Laptop GPU | 2.1 kg | 17.9 mm | 16.00" | 3840x2400 | |
| 86.9 % v7 (old) | 09/2022 | HP Envy 16 h0112nr i7-12700H, GeForce RTX 3060 Laptop GPU | 2.3 kg | 19.8 mm | 16.00" | 3840x2400 | |
| 87.8 % v7 (old) | 11/2022 | Schenker Vision 16 Pro RTX 3070 Ti i7-12700H, GeForce RTX 3070 Ti Laptop GPU | 1.7 kg | 17.1 mm | 16.00" | 2560x1600 | |
| 89.5 % v7 (old) | 05/2022 | Dell XPS 15 9520 RTX 3050 Ti i7-12700H, GeForce RTX 3050 Ti Laptop GPU | 1.9 kg | 18 mm | 15.60" | 3456x2160 | |
| 93.2 % v7 (old) | 11/2021 | Apple MacBook Pro 16 2021 M1 Pro M1 Pro, M1 Pro 16-Core GPU | 2.2 kg | 16.8 mm | 16.20" | 3456x2234 | |
| 88.8 % v7 (old) | 06/2022 | Dell XPS 17 9720 RTX 3060 i7-12700H, GeForce RTX 3060 Laptop GPU | 2.5 kg | 19.5 mm | 17.00" | 3840x2400 |
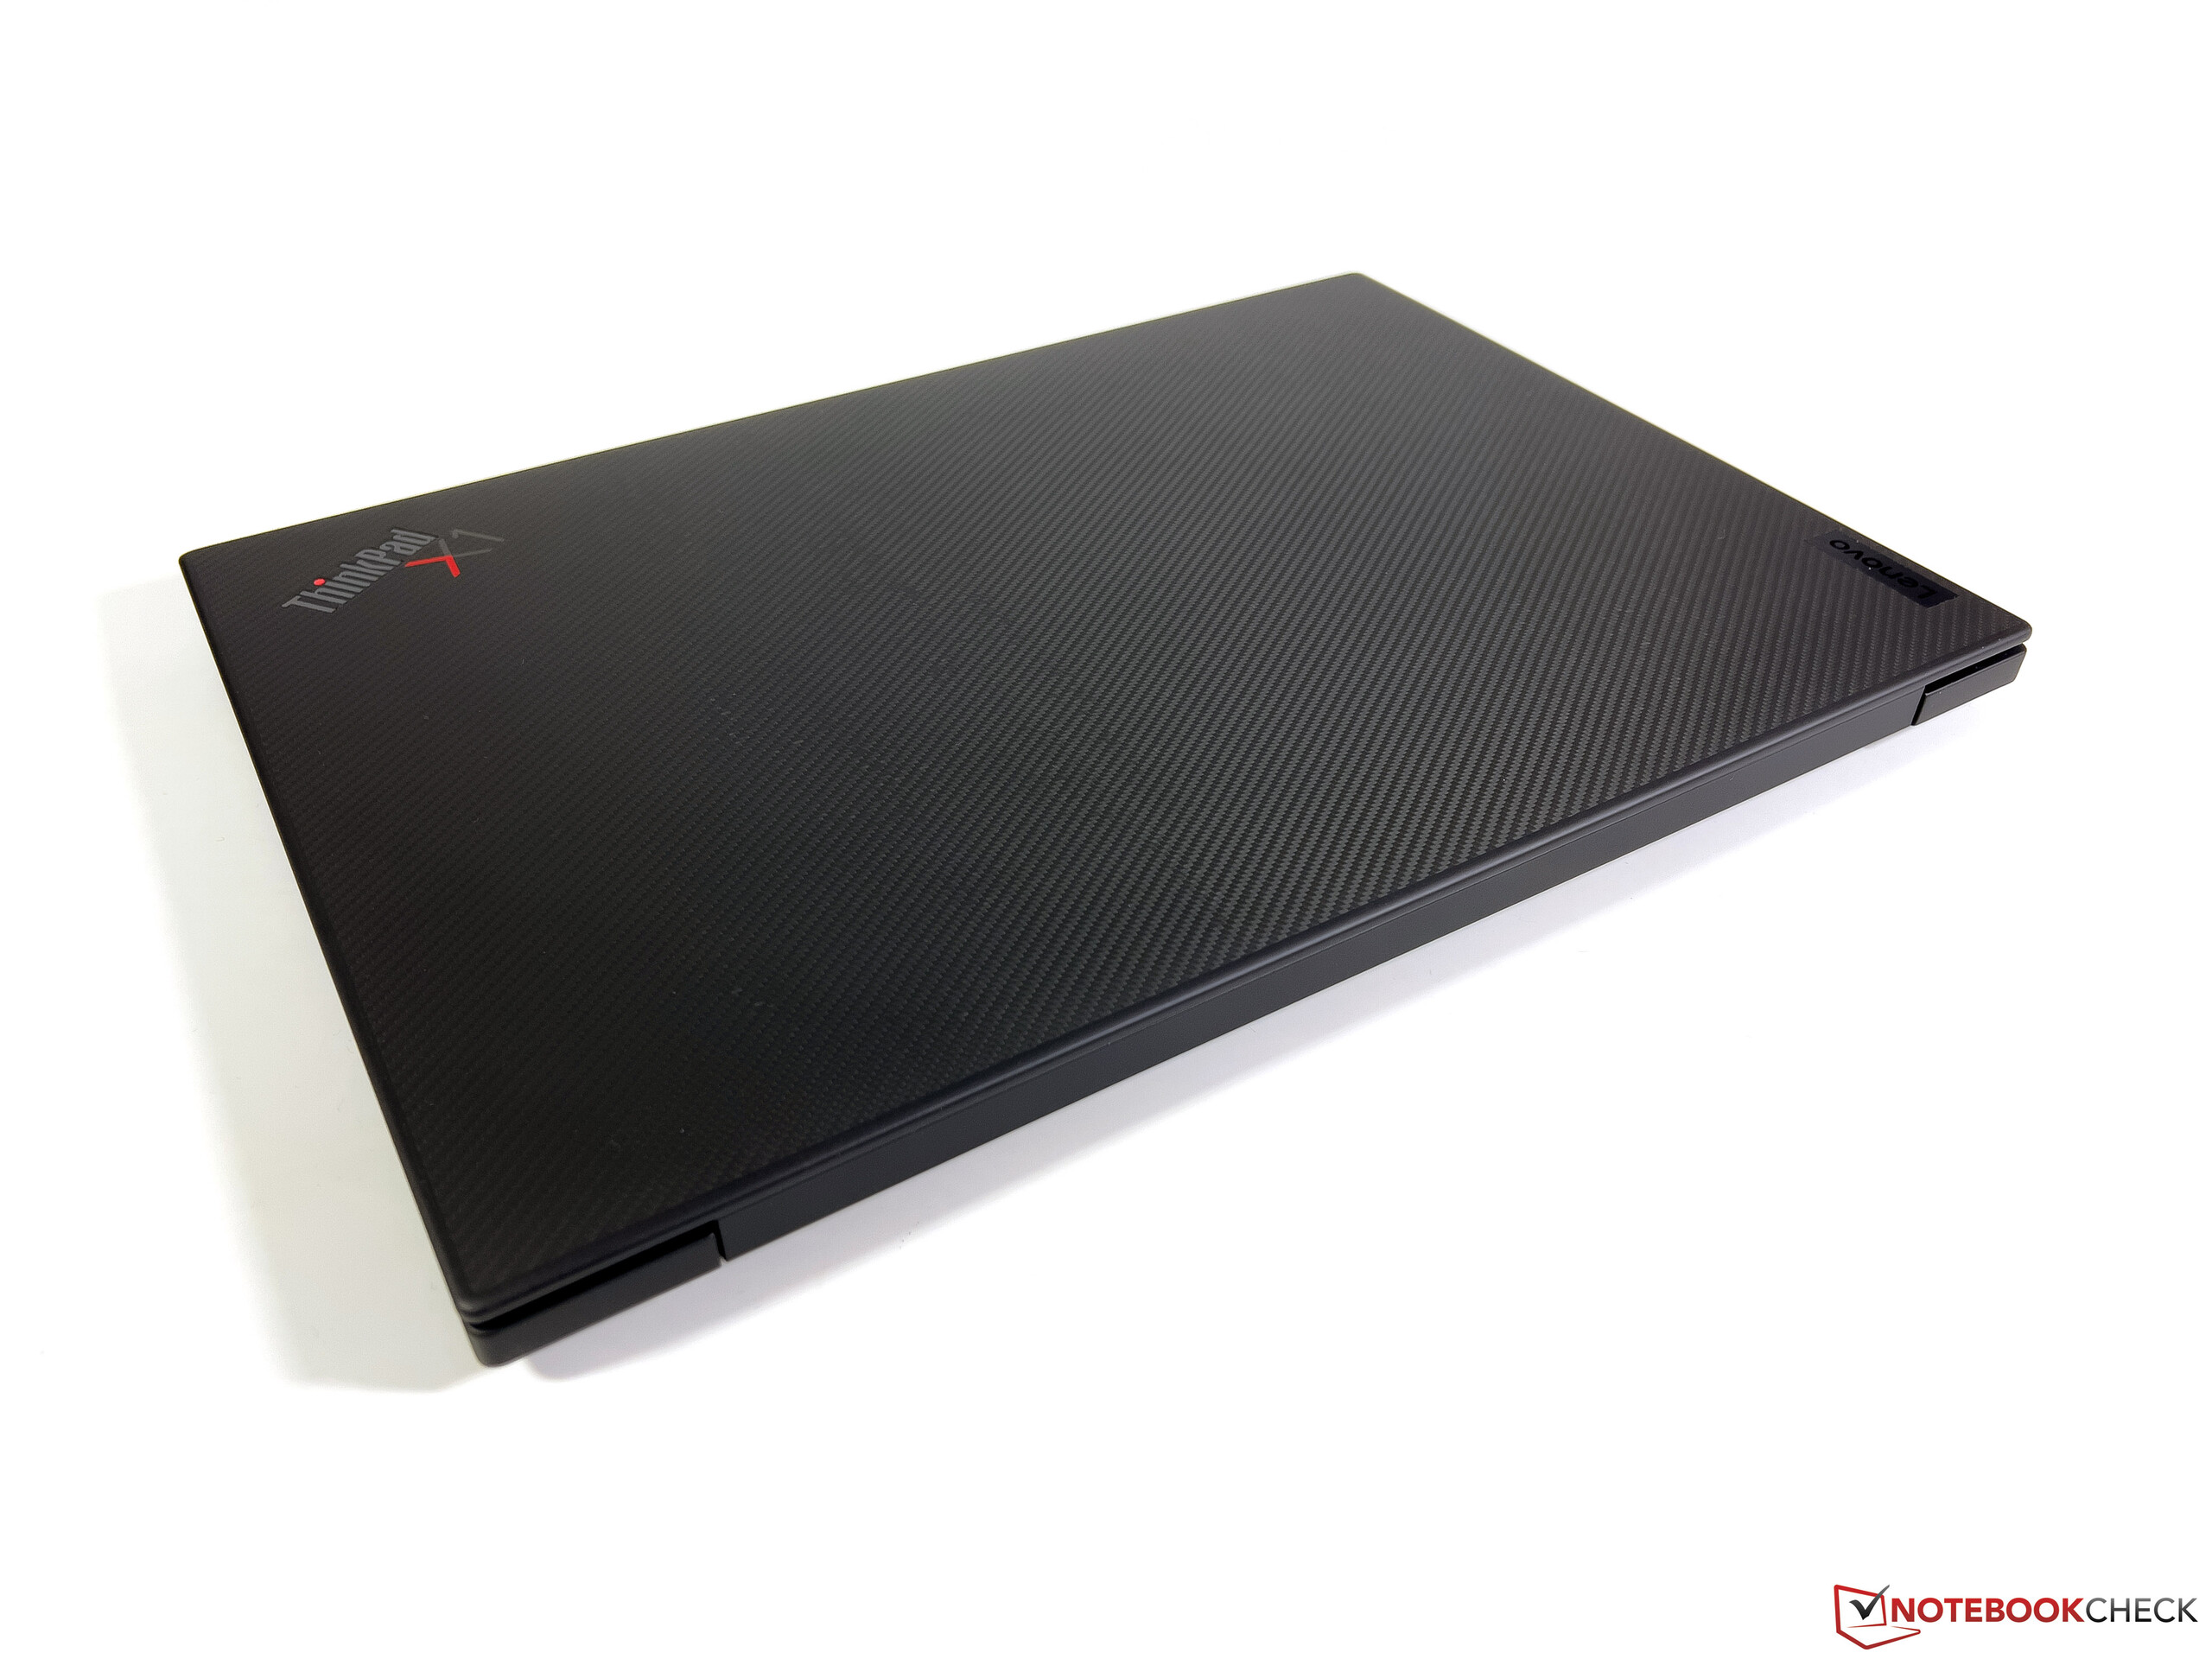
Case - Lenovo vai para fibra de carbono e magnésio
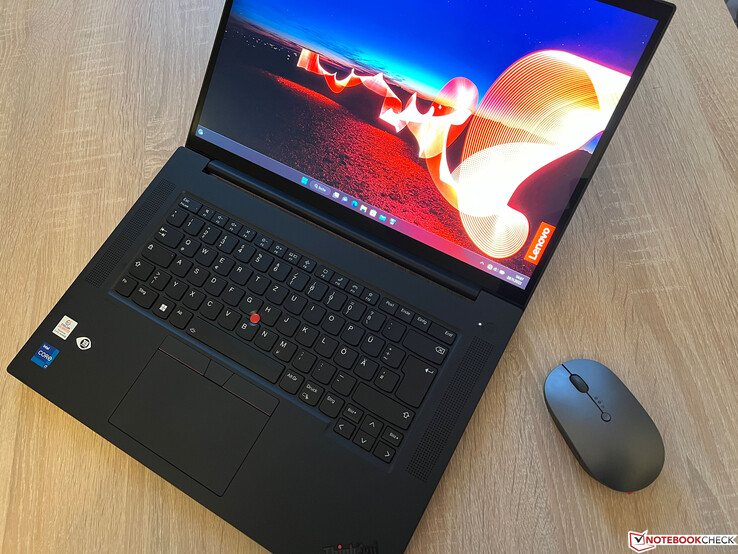
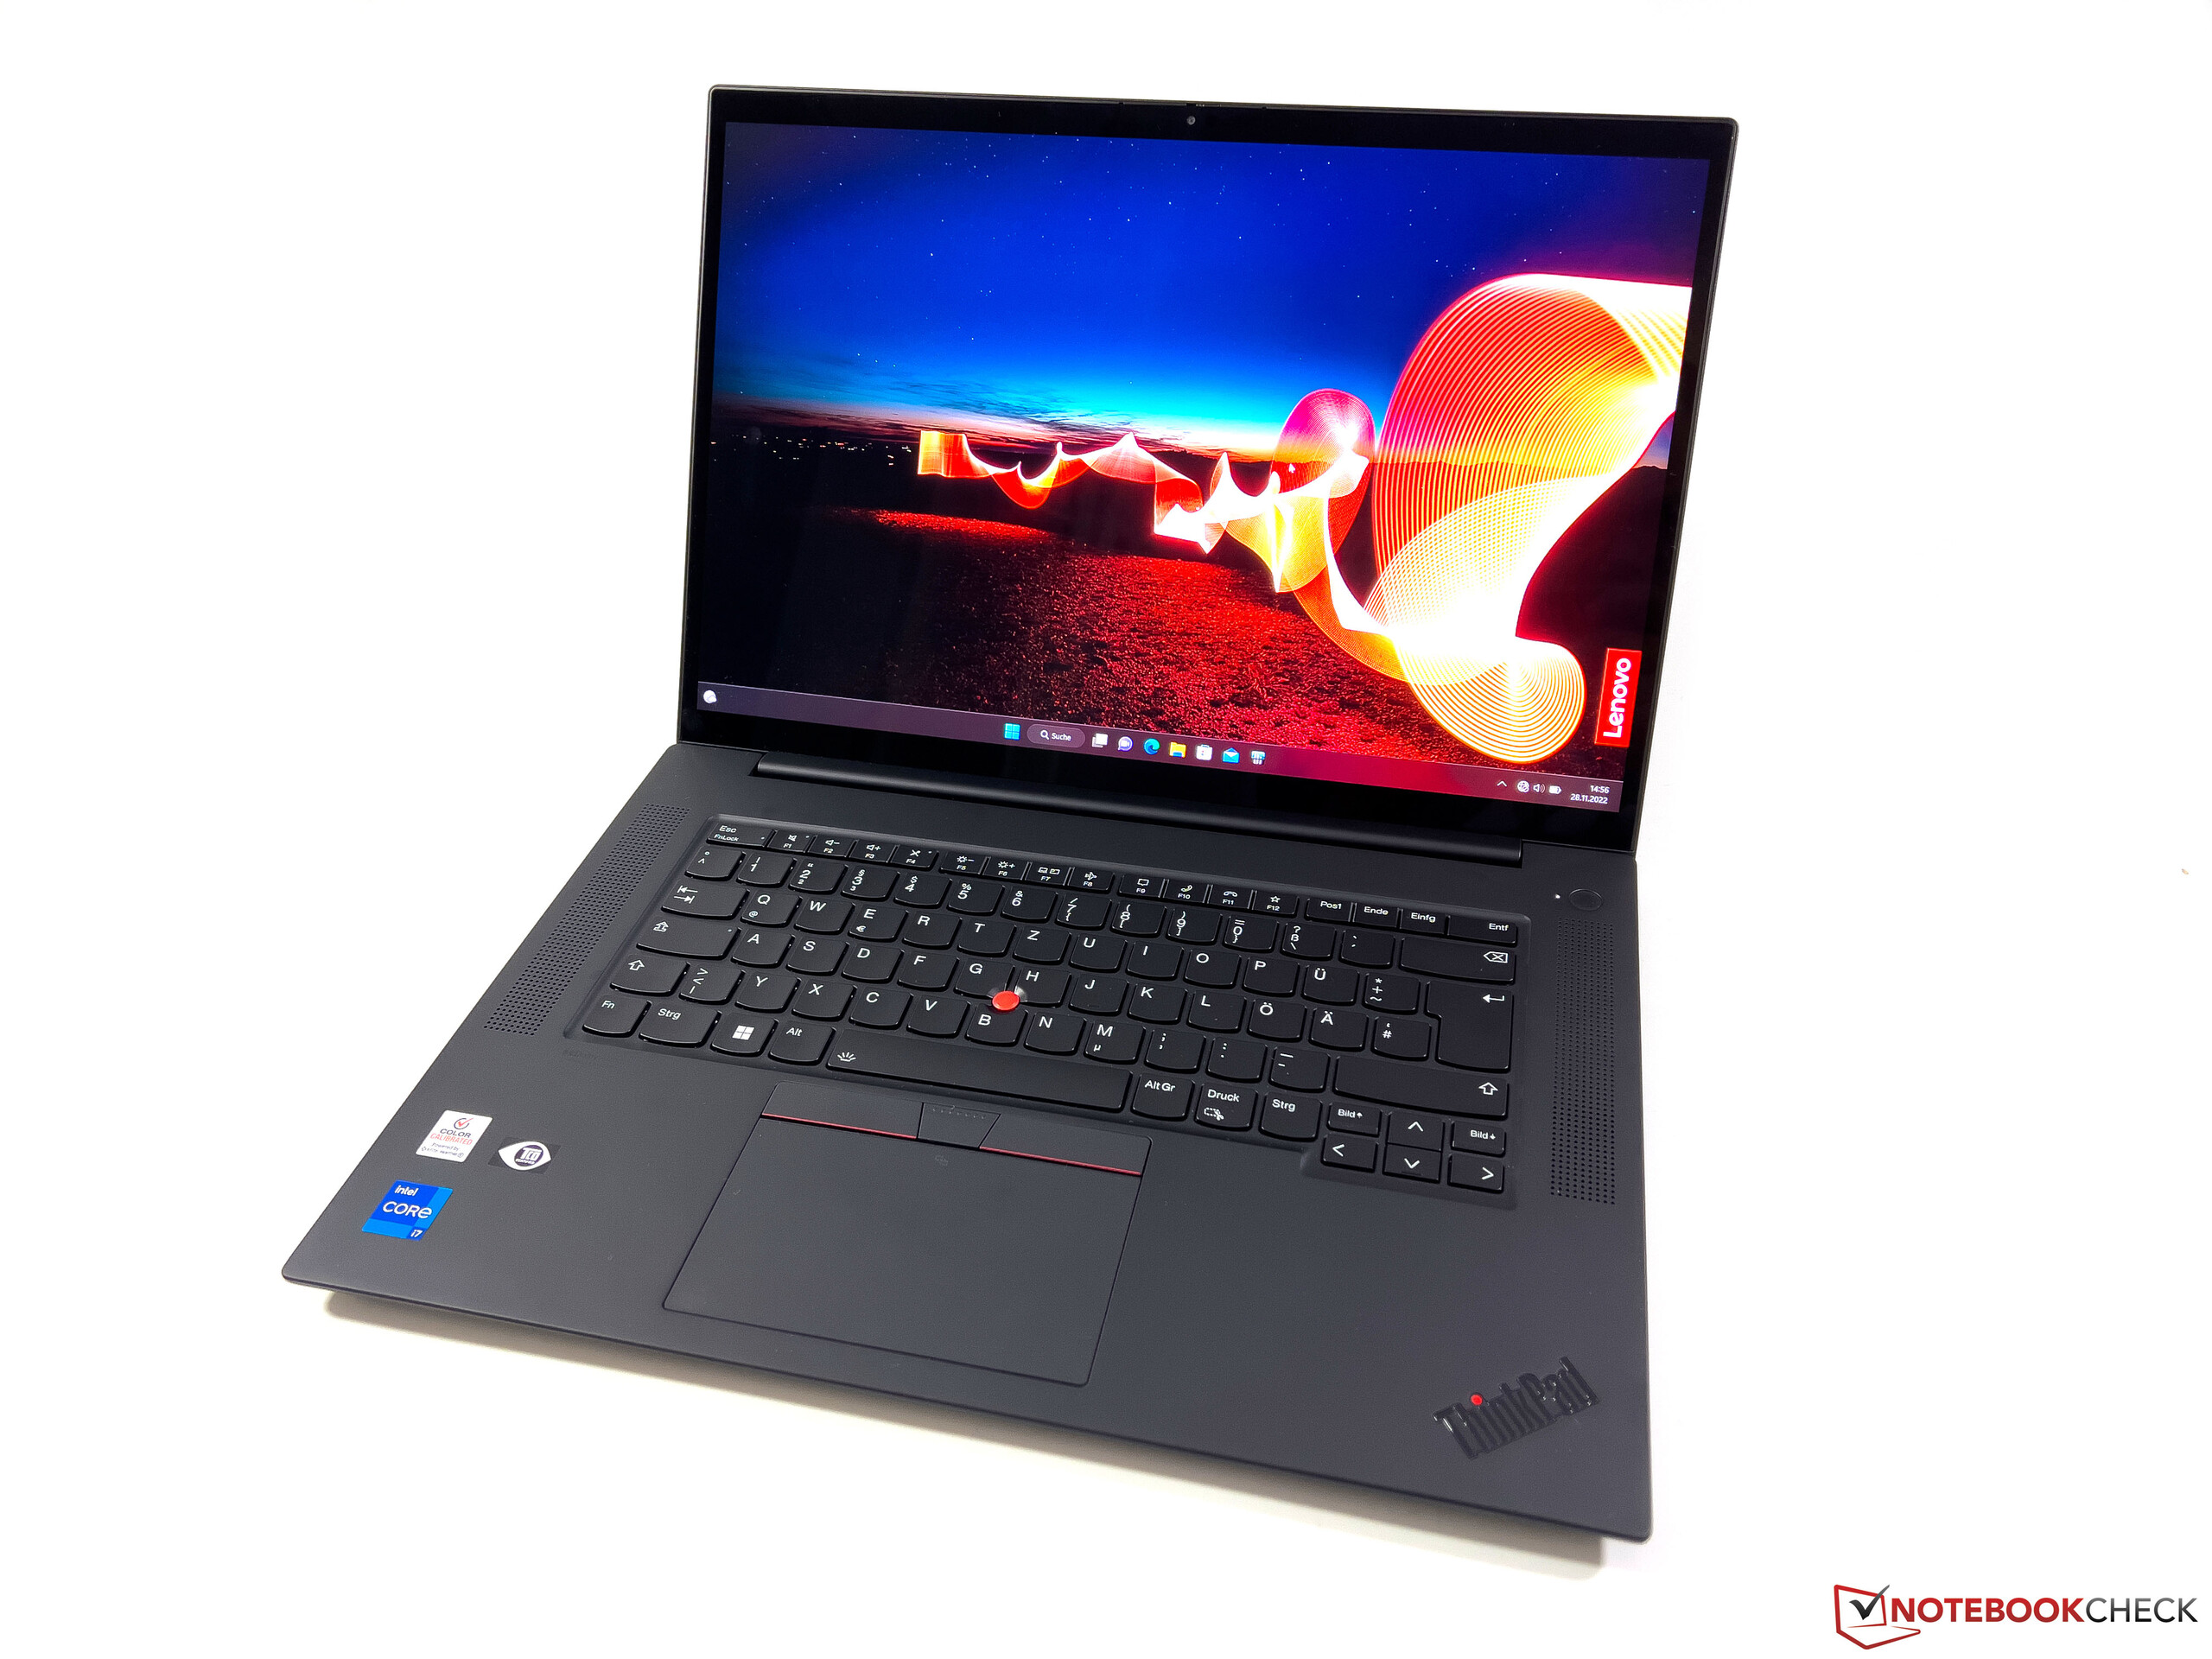
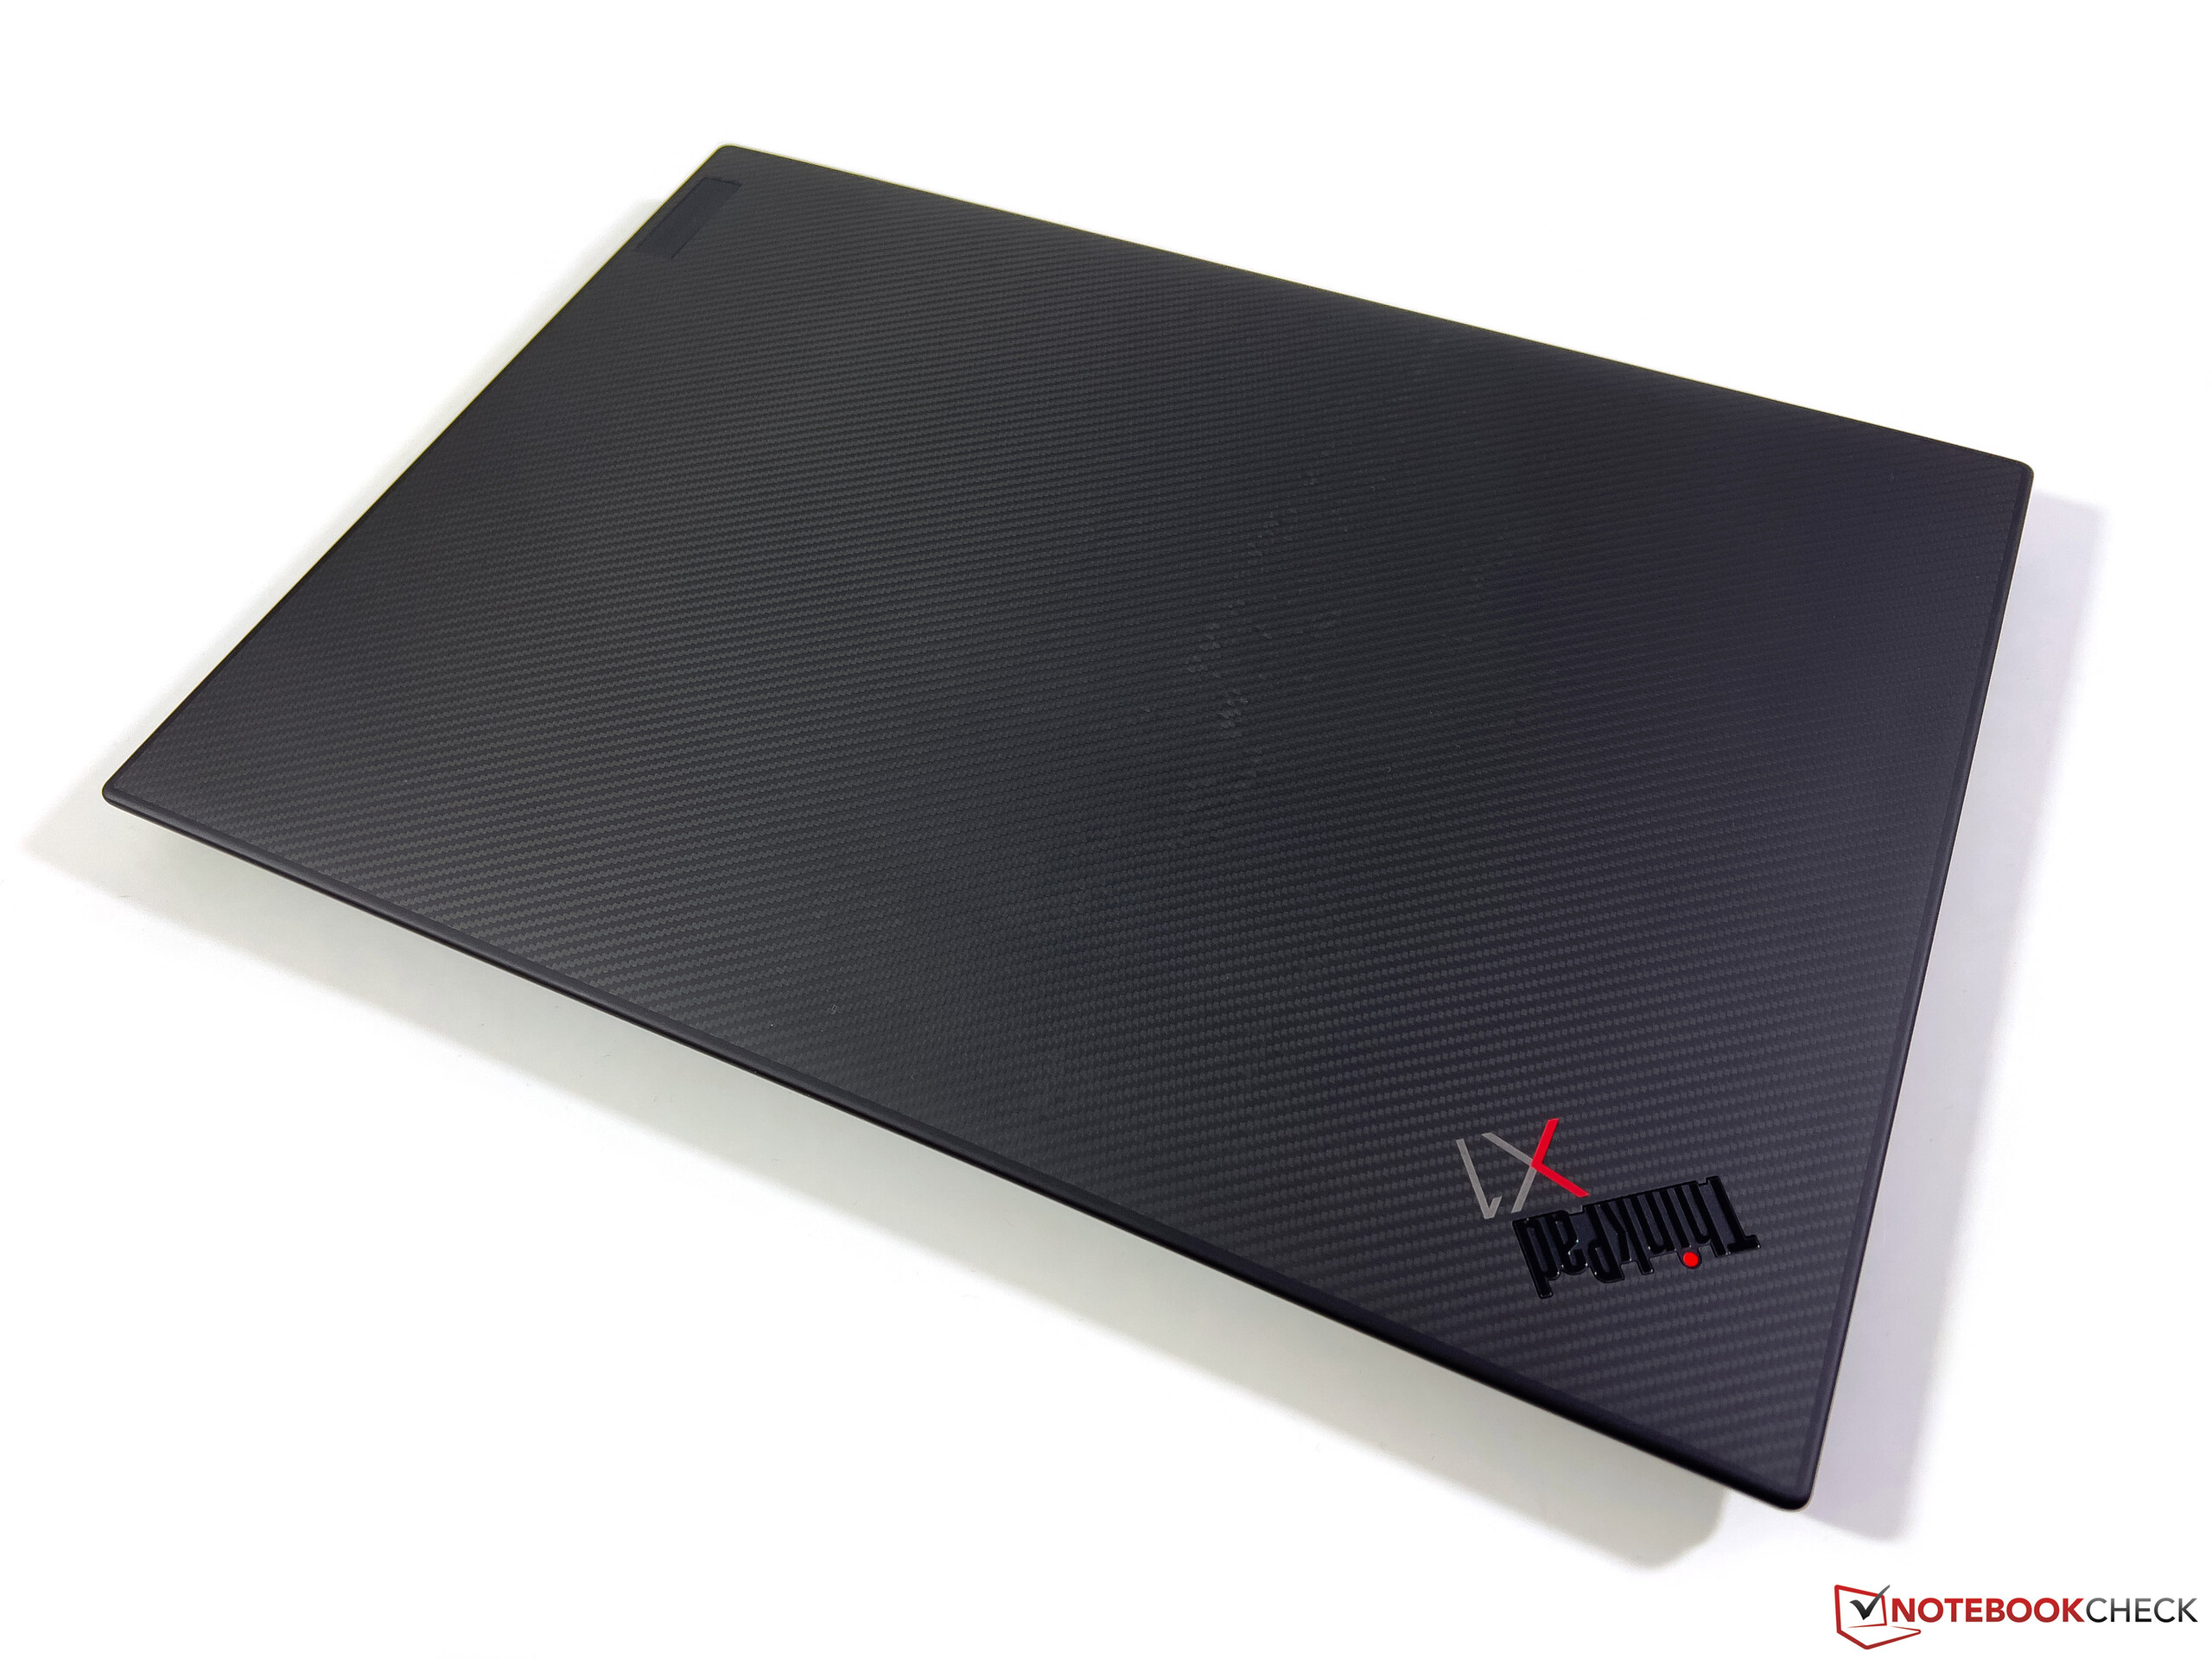
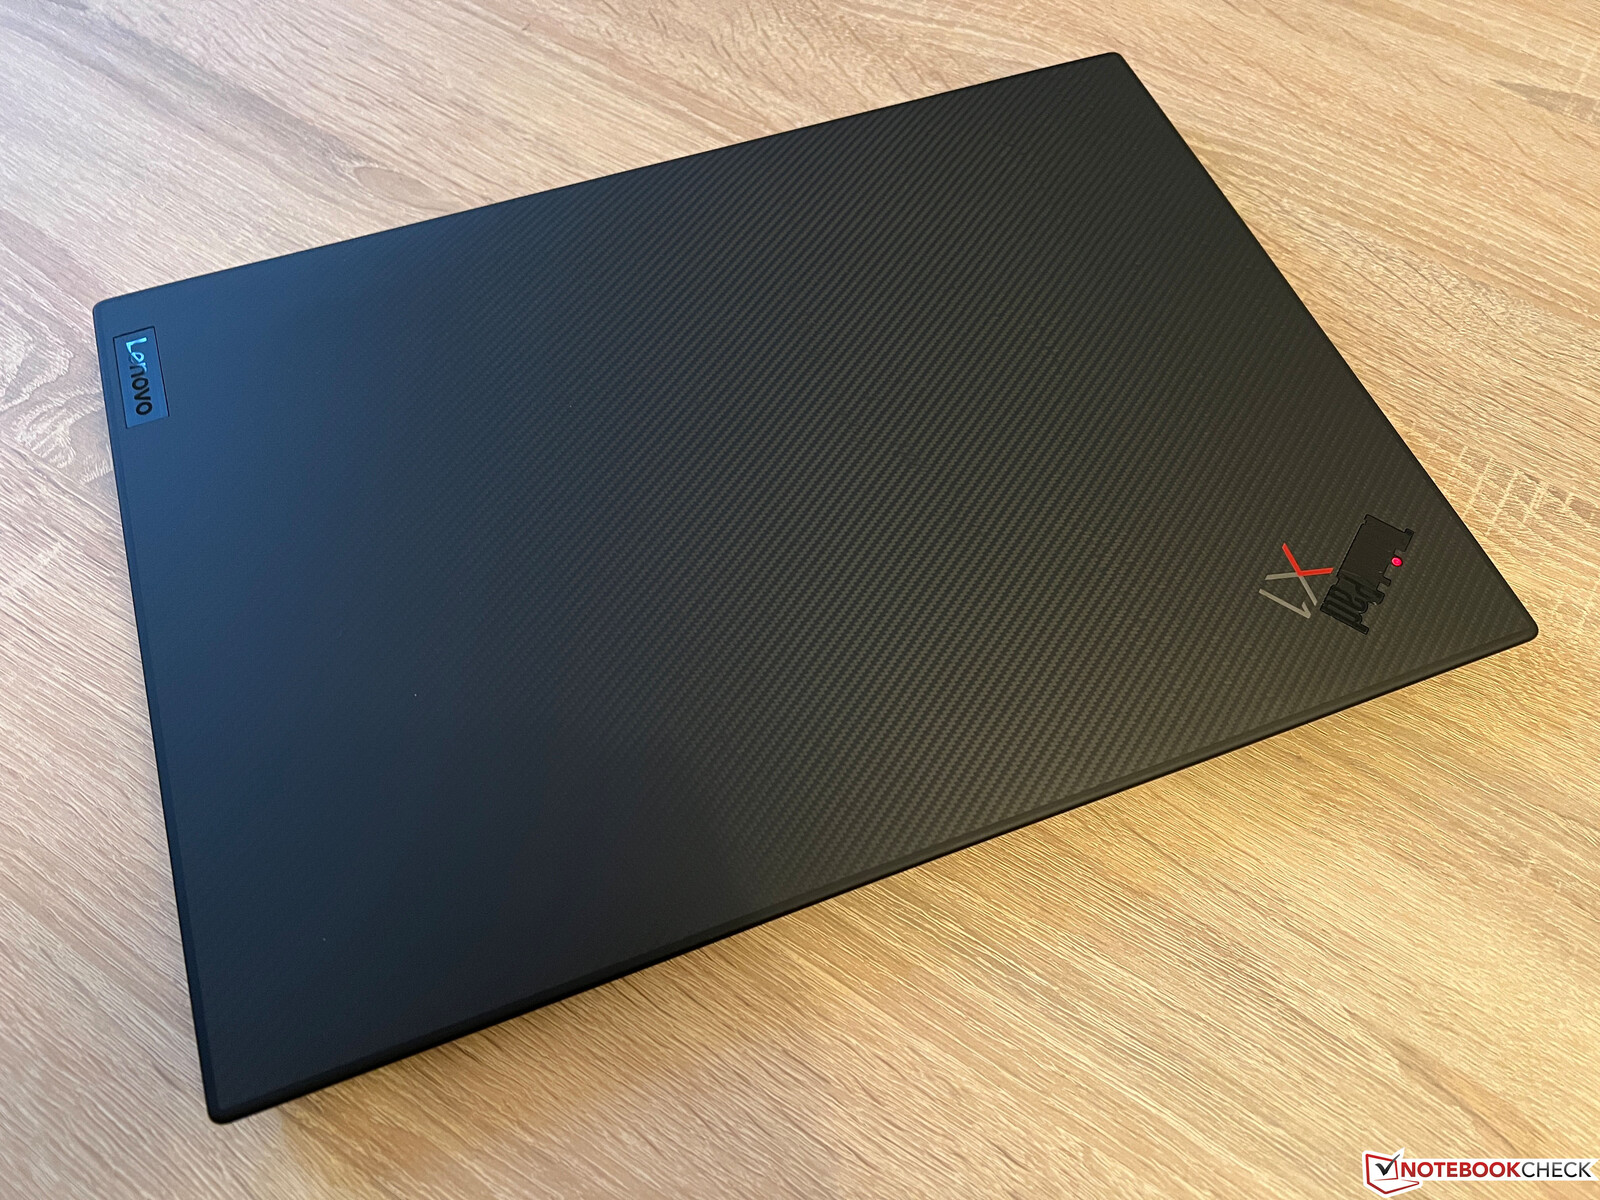
Após o grande redesenho do ano passado, o caso do X1 Extreme G5 permanece inalterado com uma mistura contínua de fibra de carbono e magnésio. Além disso, a tampa do modelo 4K tem um aspecto de fibra de carbono, embora isto seja apenas uma impressão. Caso contrário, o ThinkPad preto parece muito reservado com os acentos coloridos focados no logotipo, bem como o TrackPoint vermelho no meio do teclado
Tanto a unidade base quanto a tampa do display são muito estáveis, o que significa que a flexão do teclado só é possível aplicando muita pressão na área do meio. As dobradiças do display também são maravilhosamente calibradas, pois a tampa do display pode ser facilmente aberta com uma mão, evitando assim quase completamente qualquer movimento de balanço. O ângulo máximo de abertura é de 180 graus.
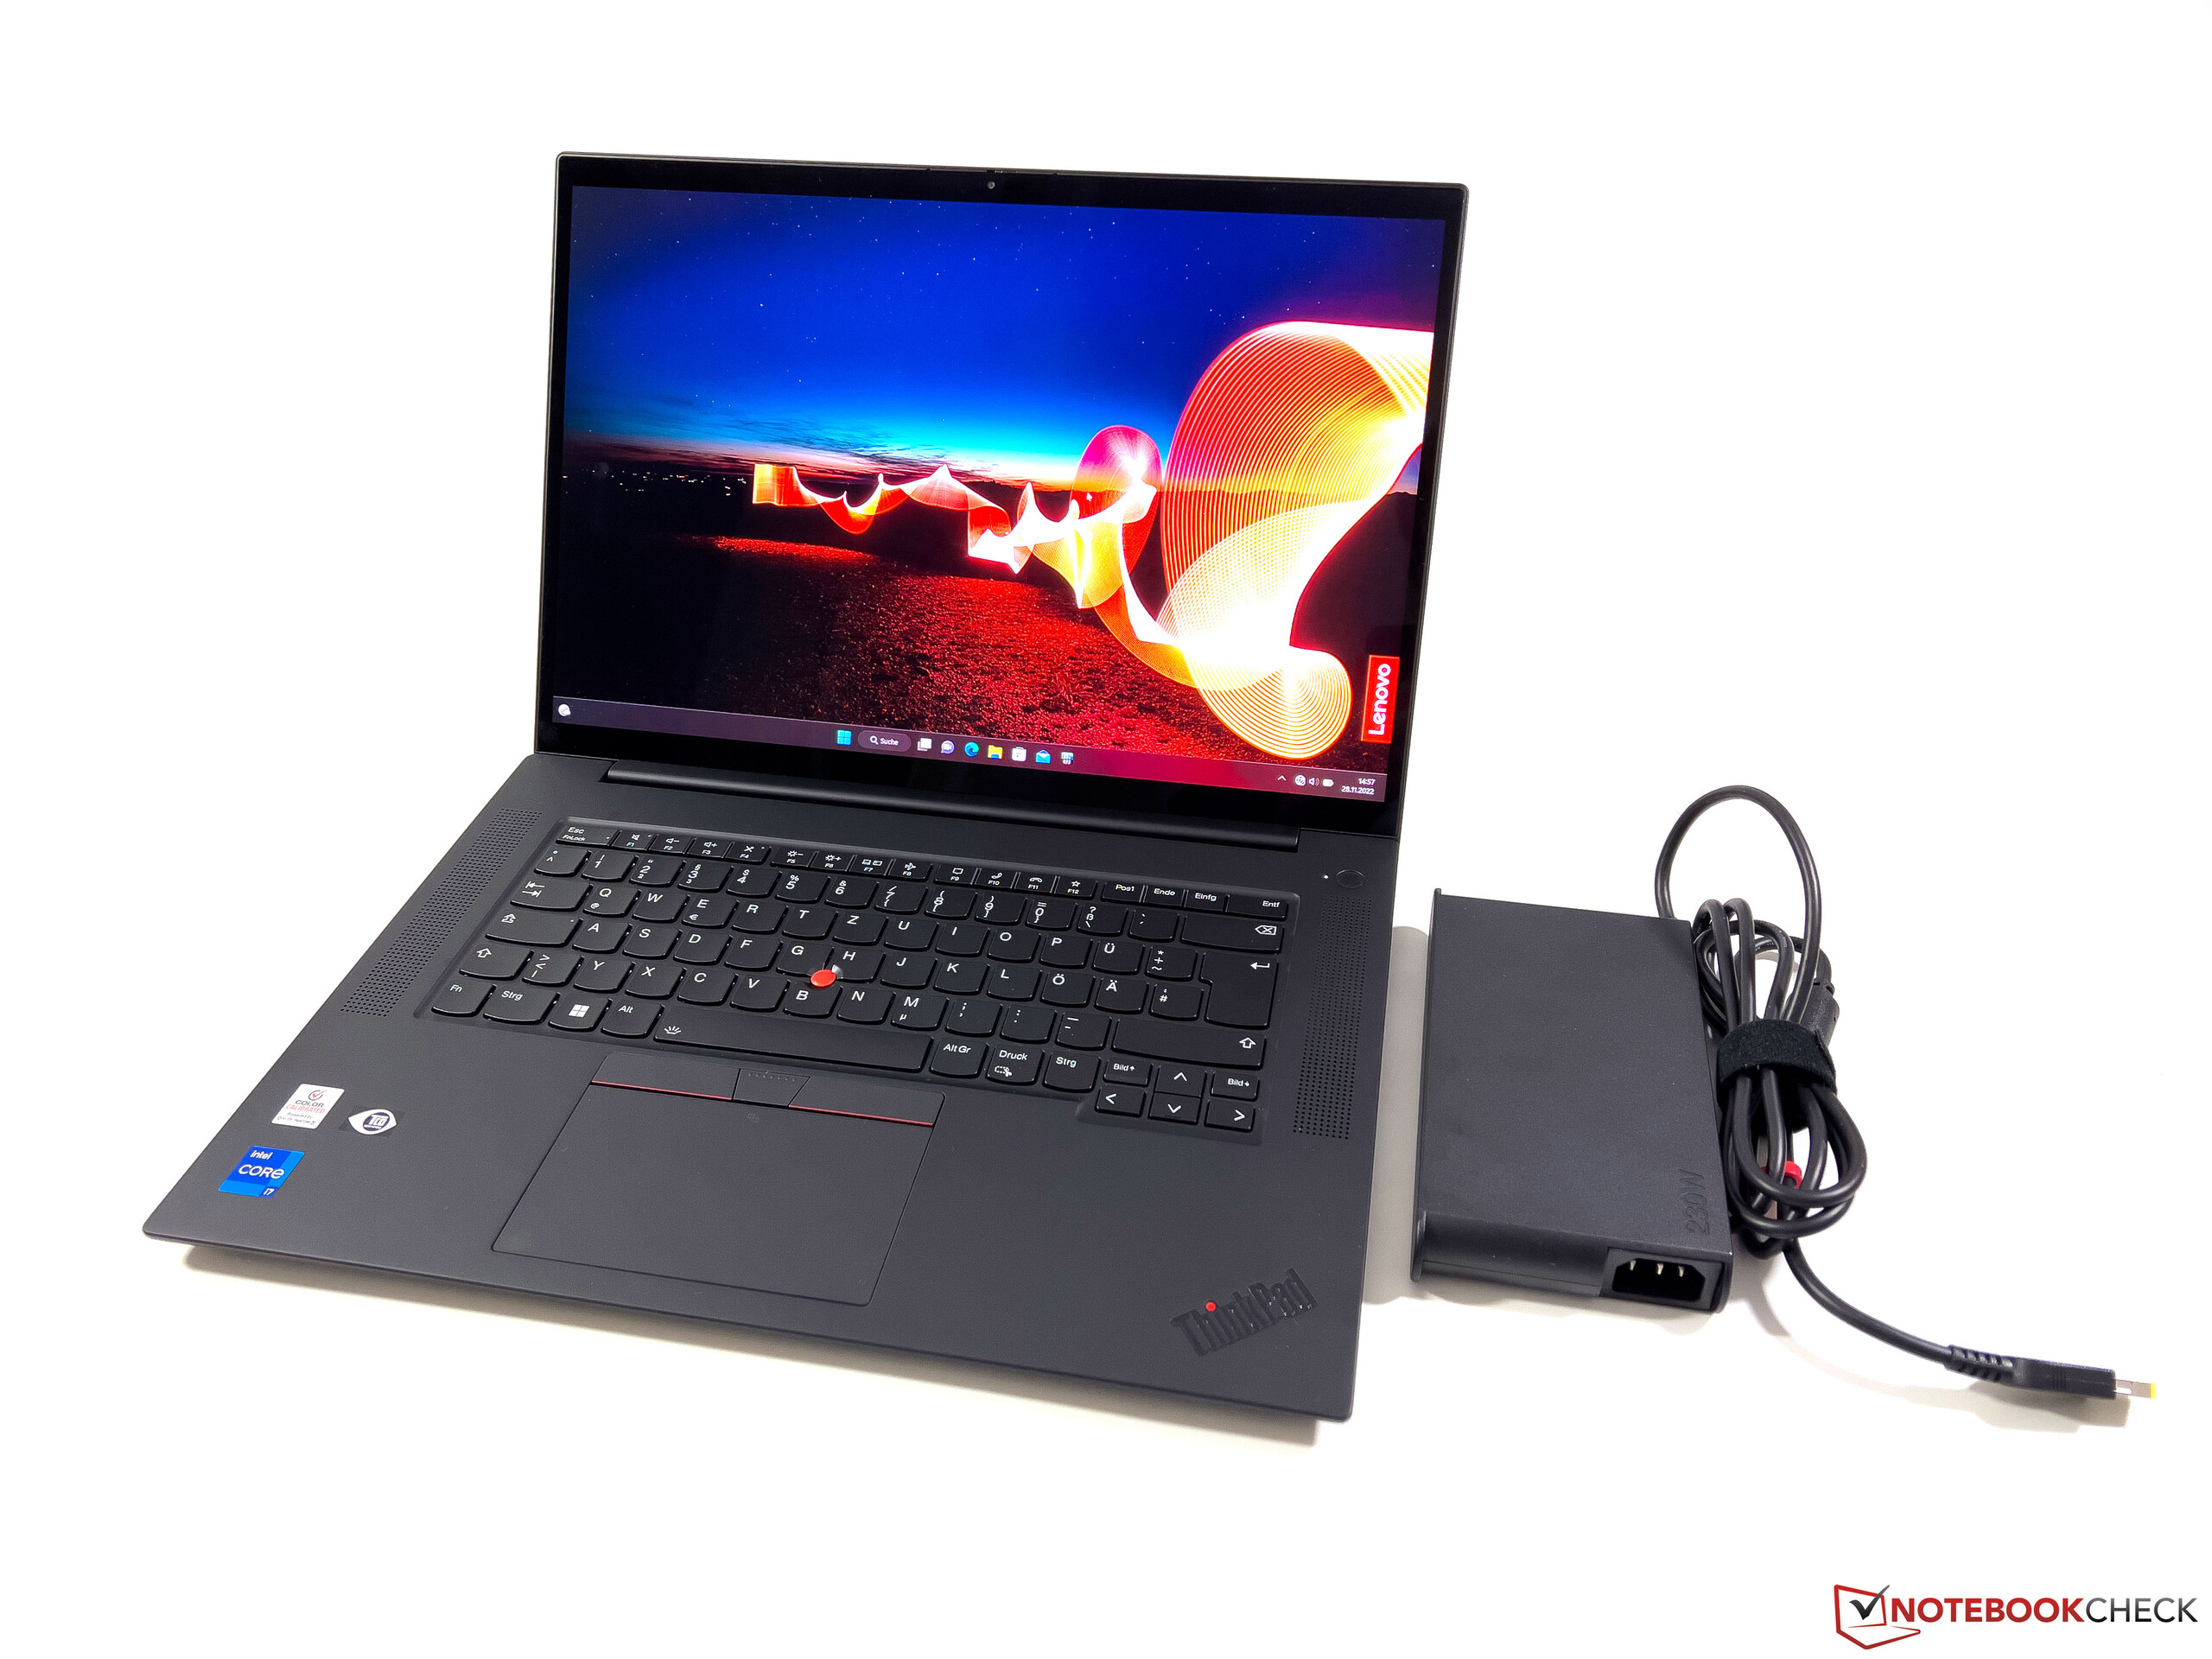
Com apenas 2,1 kg, nosso modelo de revisão fica no meio da embalagem quando comparado com seus concorrentes, pelo que os modelos XPS de 15 e 17 polegadas não devem ser incluídos na comparação. Na categoria de 16 polegadas, apenas oSchenker Vision 16 Proé muito mais leve e o X1 Extreme também tem a maior pegada. Em movimento, outros 880 gramas devem ser adicionados para o fornecimento de energia.
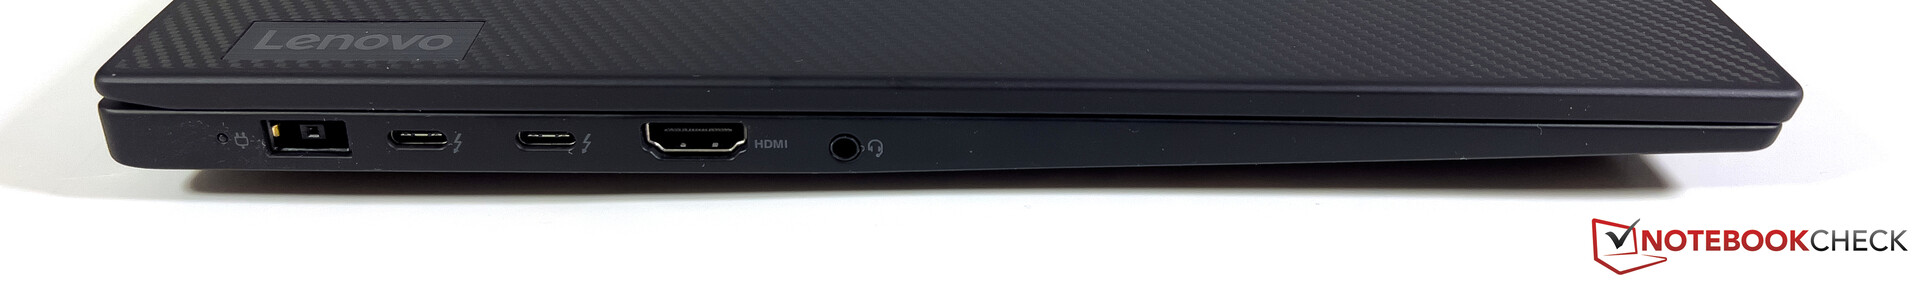
Conectividade - X1 Extreme G5 com TB4 e Wi-Fi 6E
Em termos de conectividade, não há mudanças para o predecessor em nenhum dos lados do dispositivo. Além do Thunderbolt 4 via USB-C, há também portas USB-A regulares. Em movimento, o X1 Extreme G5 pode ser carregado via USB-C, embora, no mínimo, com uma fonte de alimentação de 90 watts. Um total de quatro displays pode ser conectado (1x interno + 3x externo).
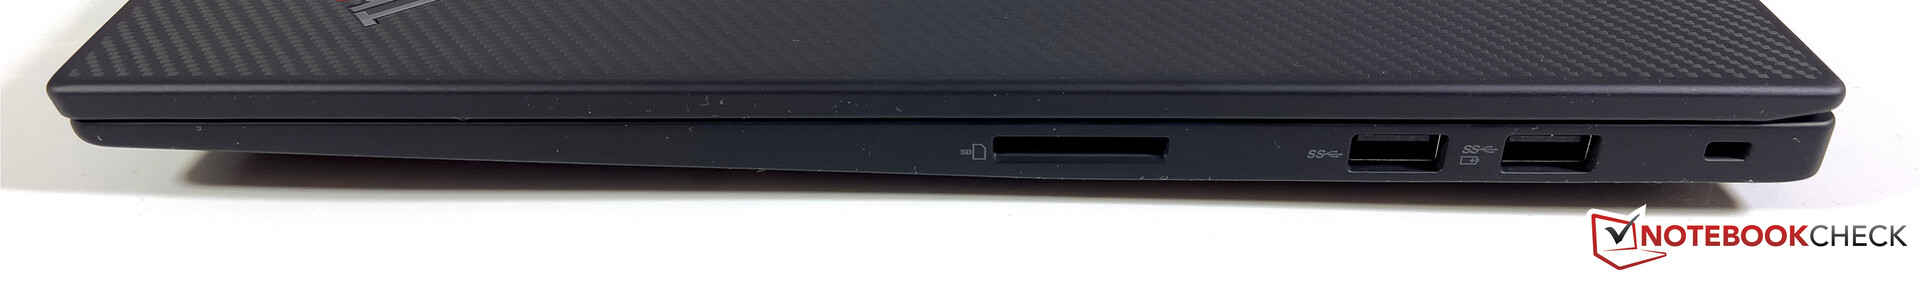
Leitor de cartões SD
No lado direito do dispositivo, o leitor de cartões SD continua a aceitar cartões SD de tamanho completo, mas a uma velocidade reduzida em comparação com o de seu antecessor. Tanto com nossos atuais (Angelbird AV Pro V60) como com nossos cartões de referência anteriores, apenas 80 MB/s é possível. OX1 Extremo G4foi capaz de gerenciar mais de 170 MB/s.
| SD Card Reader | |
| average JPG Copy Test (av. of 3 runs) | |
| Dell XPS 17 9720 RTX 3060 (Toshiba Exceria Pro SDXC 64 GB UHS-II) | |
| Lenovo ThinkPad X1 Extreme G4-20Y5CTO1WW (3050 Ti) (AV Pro V60) | |
| Dell XPS 15 9520 RTX 3050 Ti (Toshiba Exceria Pro SDXC 64 GB UHS-II) | |
| Média da turma Multimedia (23 - 531, n=43, últimos 2 anos) | |
| Apple MacBook Pro 16 2021 M1 Pro (Angelbird AV Pro V60) | |
| Schenker Vision 16 Pro RTX 3070 Ti (AV Pro V60) | |
| Lenovo ThinkPad X1 Extreme G5-21DE003RGE (AV Pro V60) | |
| HP Envy 16 h0112nr (AV Pro SD microSD 128 GB V60) | |
| maximum AS SSD Seq Read Test (1GB) | |
| Dell XPS 17 9720 RTX 3060 (Toshiba Exceria Pro SDXC 64 GB UHS-II) | |
| Média da turma Multimedia (27.9 - 1455, n=42, últimos 2 anos) | |
| Dell XPS 15 9520 RTX 3050 Ti (Toshiba Exceria Pro SDXC 64 GB UHS-II) | |
| Lenovo ThinkPad X1 Extreme G4-20Y5CTO1WW (3050 Ti) (AV Pro V60) | |
| HP Envy 16 h0112nr (AV Pro SD microSD 128 GB V60) | |
| Schenker Vision 16 Pro RTX 3070 Ti (AV Pro V60) | |
| Lenovo ThinkPad X1 Extreme G5-21DE003RGE (AV Pro V60) | |
Comunicação
A Lenovo equipou o X1 Extreme G5 com o módulo AX211 da Intel que suporta o padrão atual Wi-Fi-6E. O Windows 11 é necessário para poder se conectar a redes de 6 GHz. Após a atualização, fomos capazes de nos conectar à rede de 6 GHz do nosso roteador de referência Asus. As taxas de transferência são muito altas e estáveis e o Bluetooth 5.2 também é suportado. As redes com fio só podem ser usadas com um adaptador apropriado via Thunderbolt/USB-C.
O menos potente X1 Extreme G5 com o RTX 3050 Ti e a refrigeração convencional é opcional e também disponível com 5G, mas com o prêmio adicional no configurador chegando a 330 dólares americanos. Além disso, as antenas correspondentes não estão preparadas e também não há nenhum slot Nano SIM enquanto a WWAN não estiver configurada na fábrica.
| Networking | |
| Lenovo ThinkPad X1 Extreme G5-21DE003RGE | |
| iperf3 receive AXE11000 6GHz | |
| iperf3 transmit AXE11000 6GHz | |
| HP Envy 16 h0112nr | |
| iperf3 receive AXE11000 6GHz | |
| iperf3 transmit AXE11000 6GHz | |
| Schenker Vision 16 Pro RTX 3070 Ti | |
| iperf3 receive AXE11000 | |
| iperf3 transmit AXE11000 | |
| Dell XPS 15 9520 RTX 3050 Ti | |
| iperf3 receive AXE11000 | |
| iperf3 transmit AXE11000 | |
| Apple MacBook Pro 16 2021 M1 Pro | |
| iperf3 transmit AX12 | |
| iperf3 receive AX12 | |
| iperf3 receive AXE11000 | |
| iperf3 transmit AXE11000 | |
| Dell XPS 17 9720 RTX 3060 | |
| iperf3 receive AXE11000 | |
| iperf3 transmit AXE11000 | |
Webcam
Nada mudou em relação à webcam 1080p e seu obturador mecânico de privacidade. A qualidade é marginalmente melhor do que os antigos módulos 720p sem realmente produzir resultados convincentes - mesmo sob condições favoráveis de iluminação. Um módulo IR adicional está à mão para reconhecimento facial.


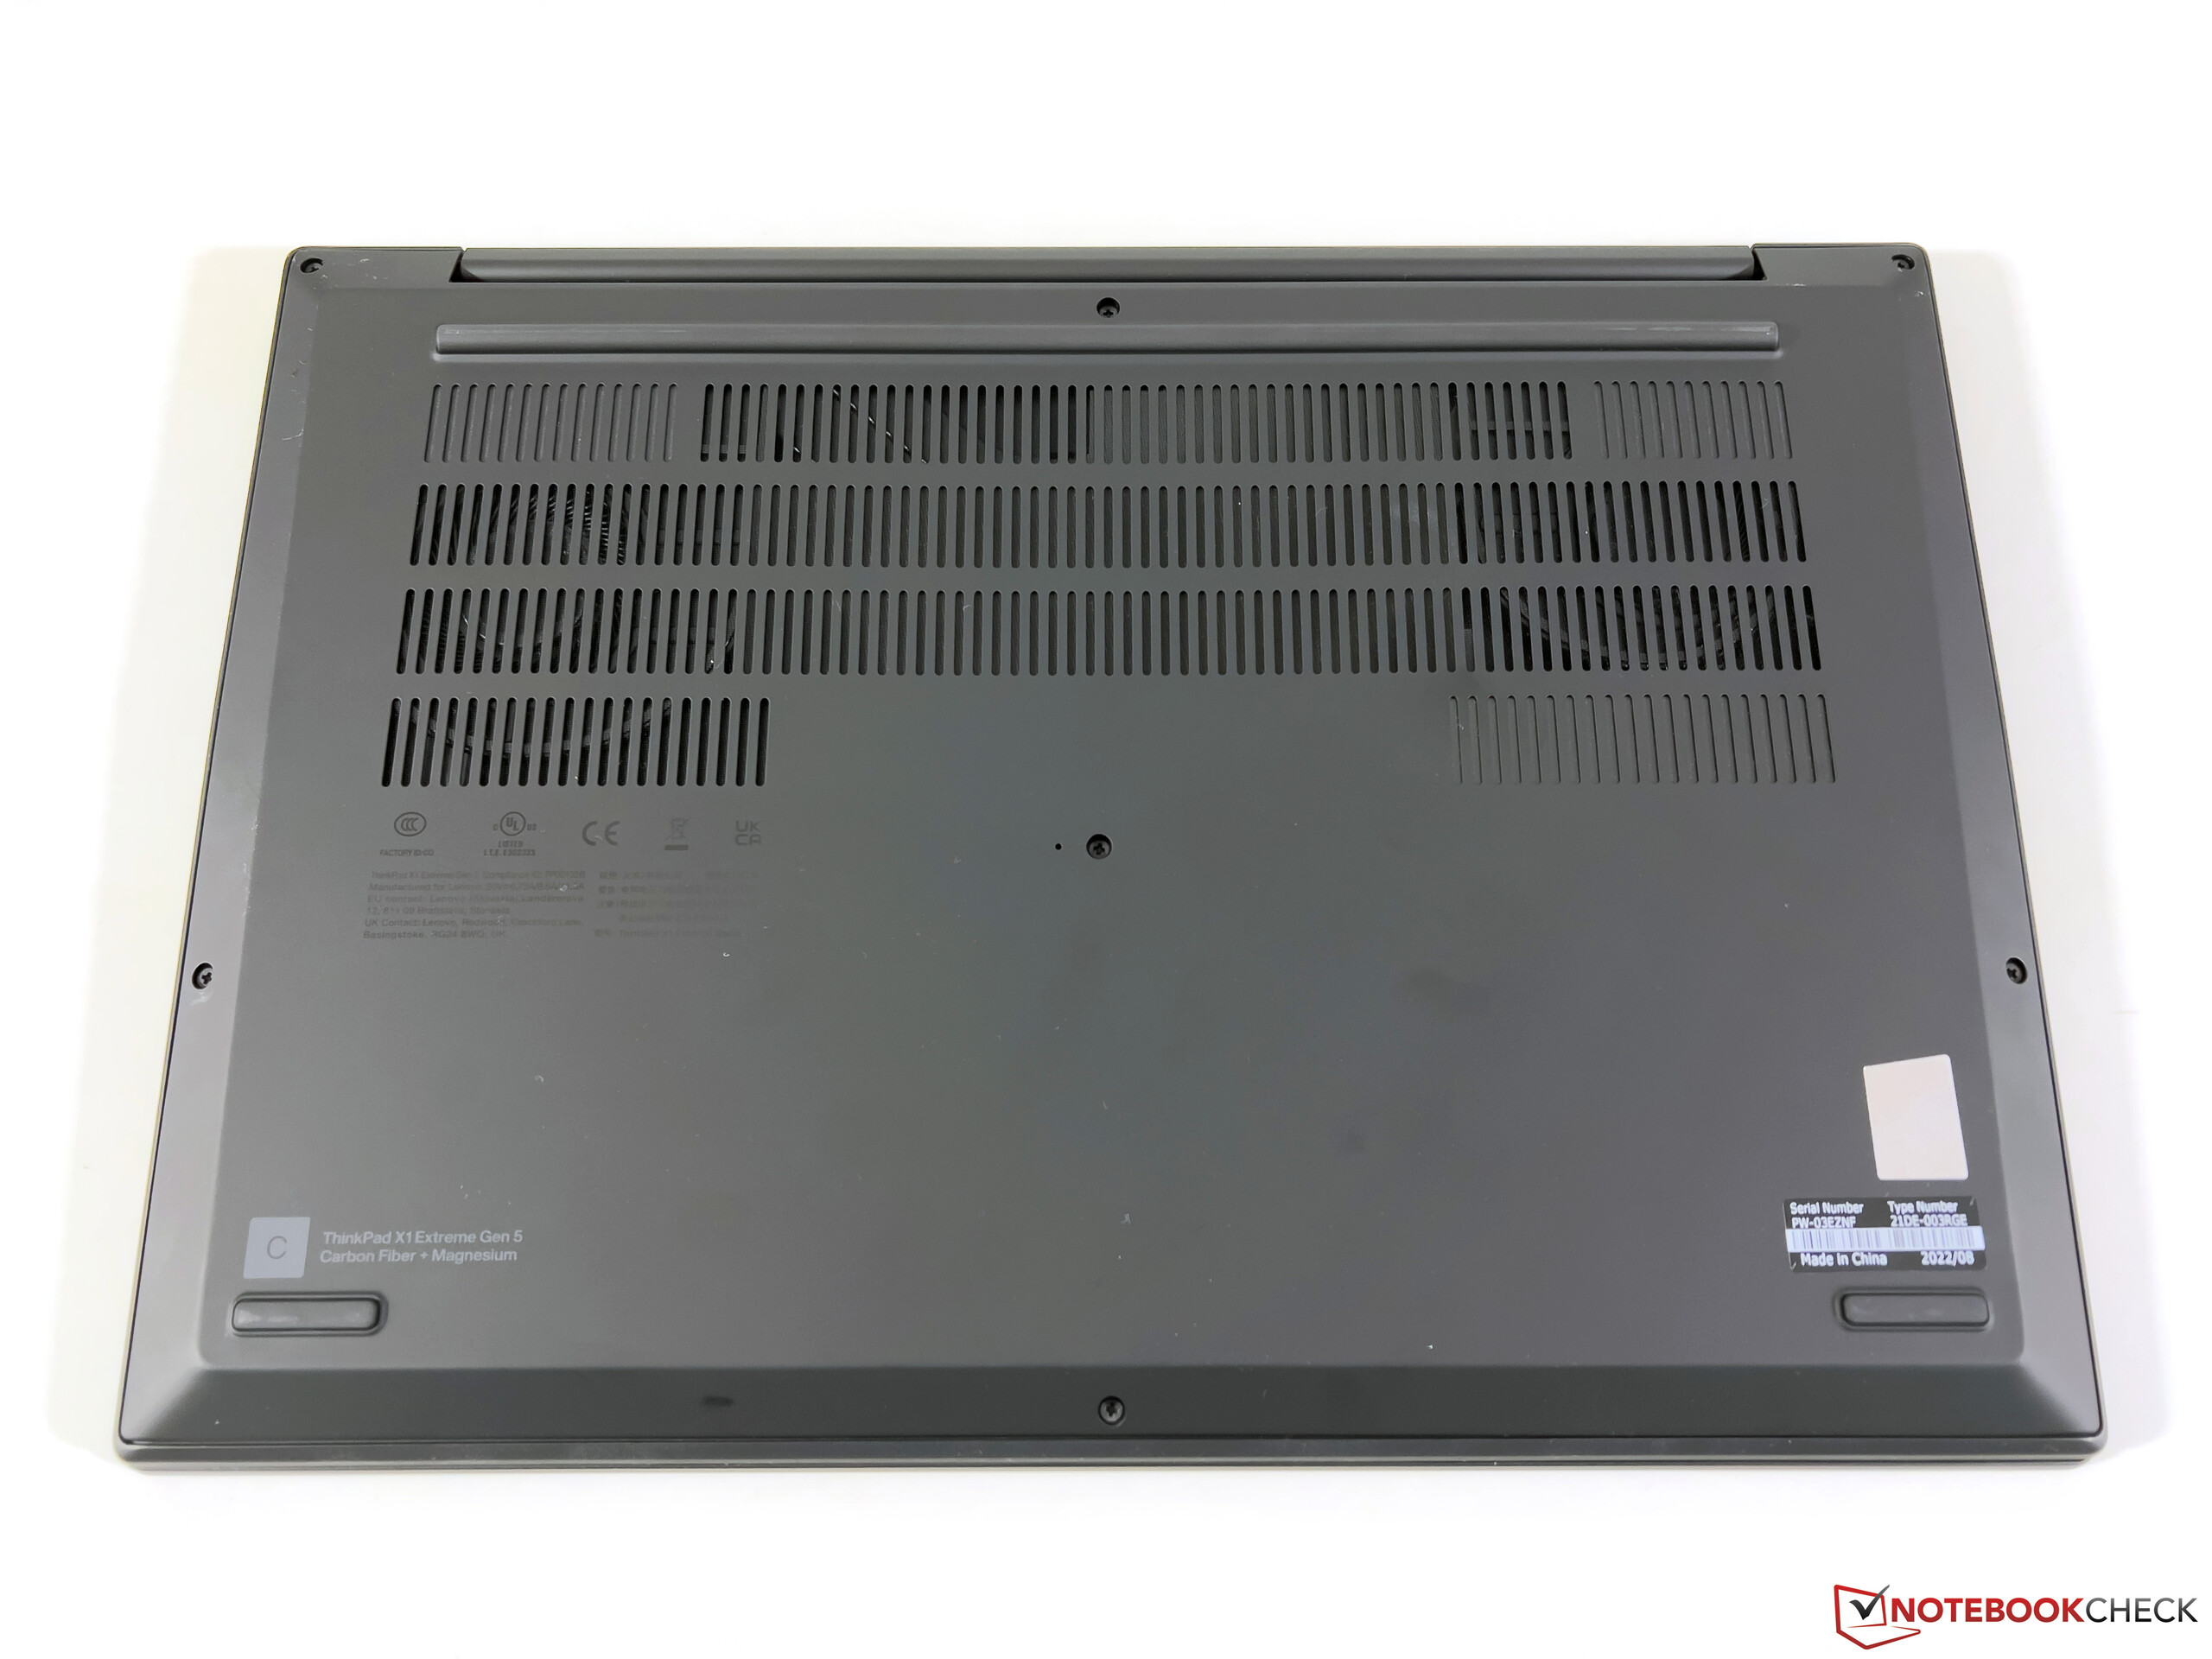
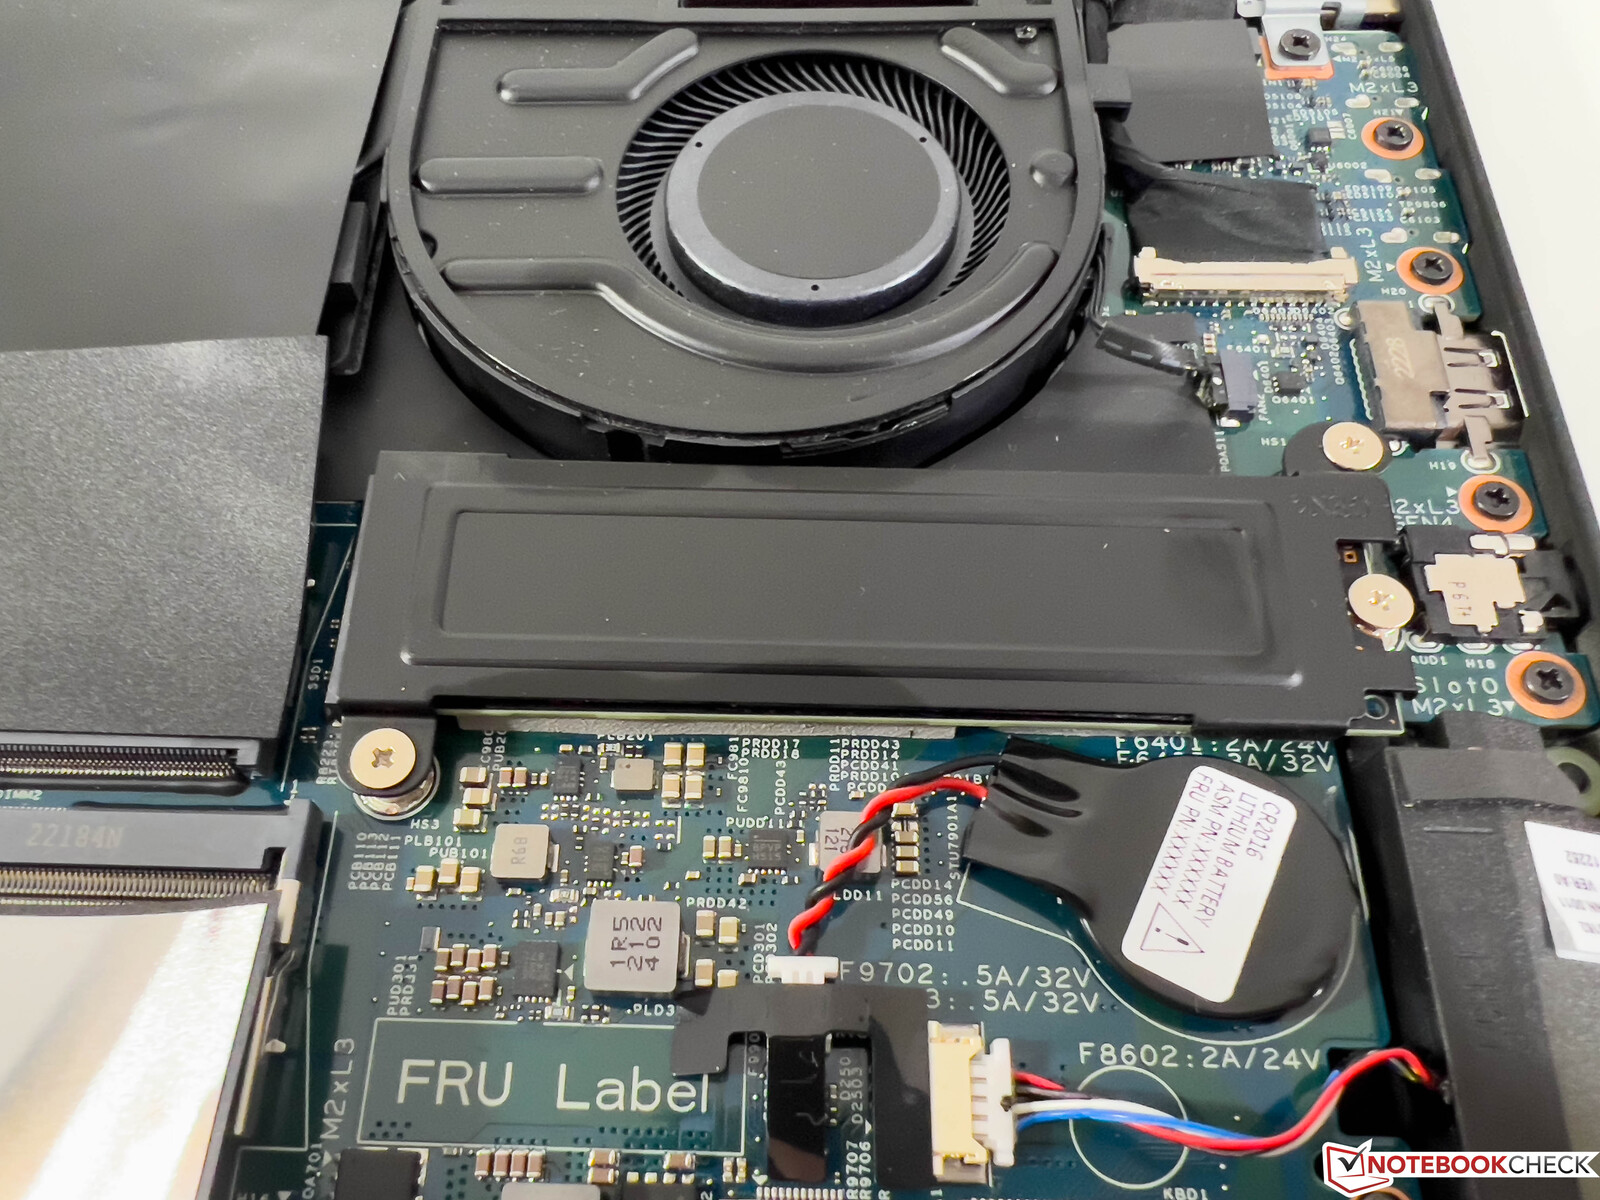
Manutenção
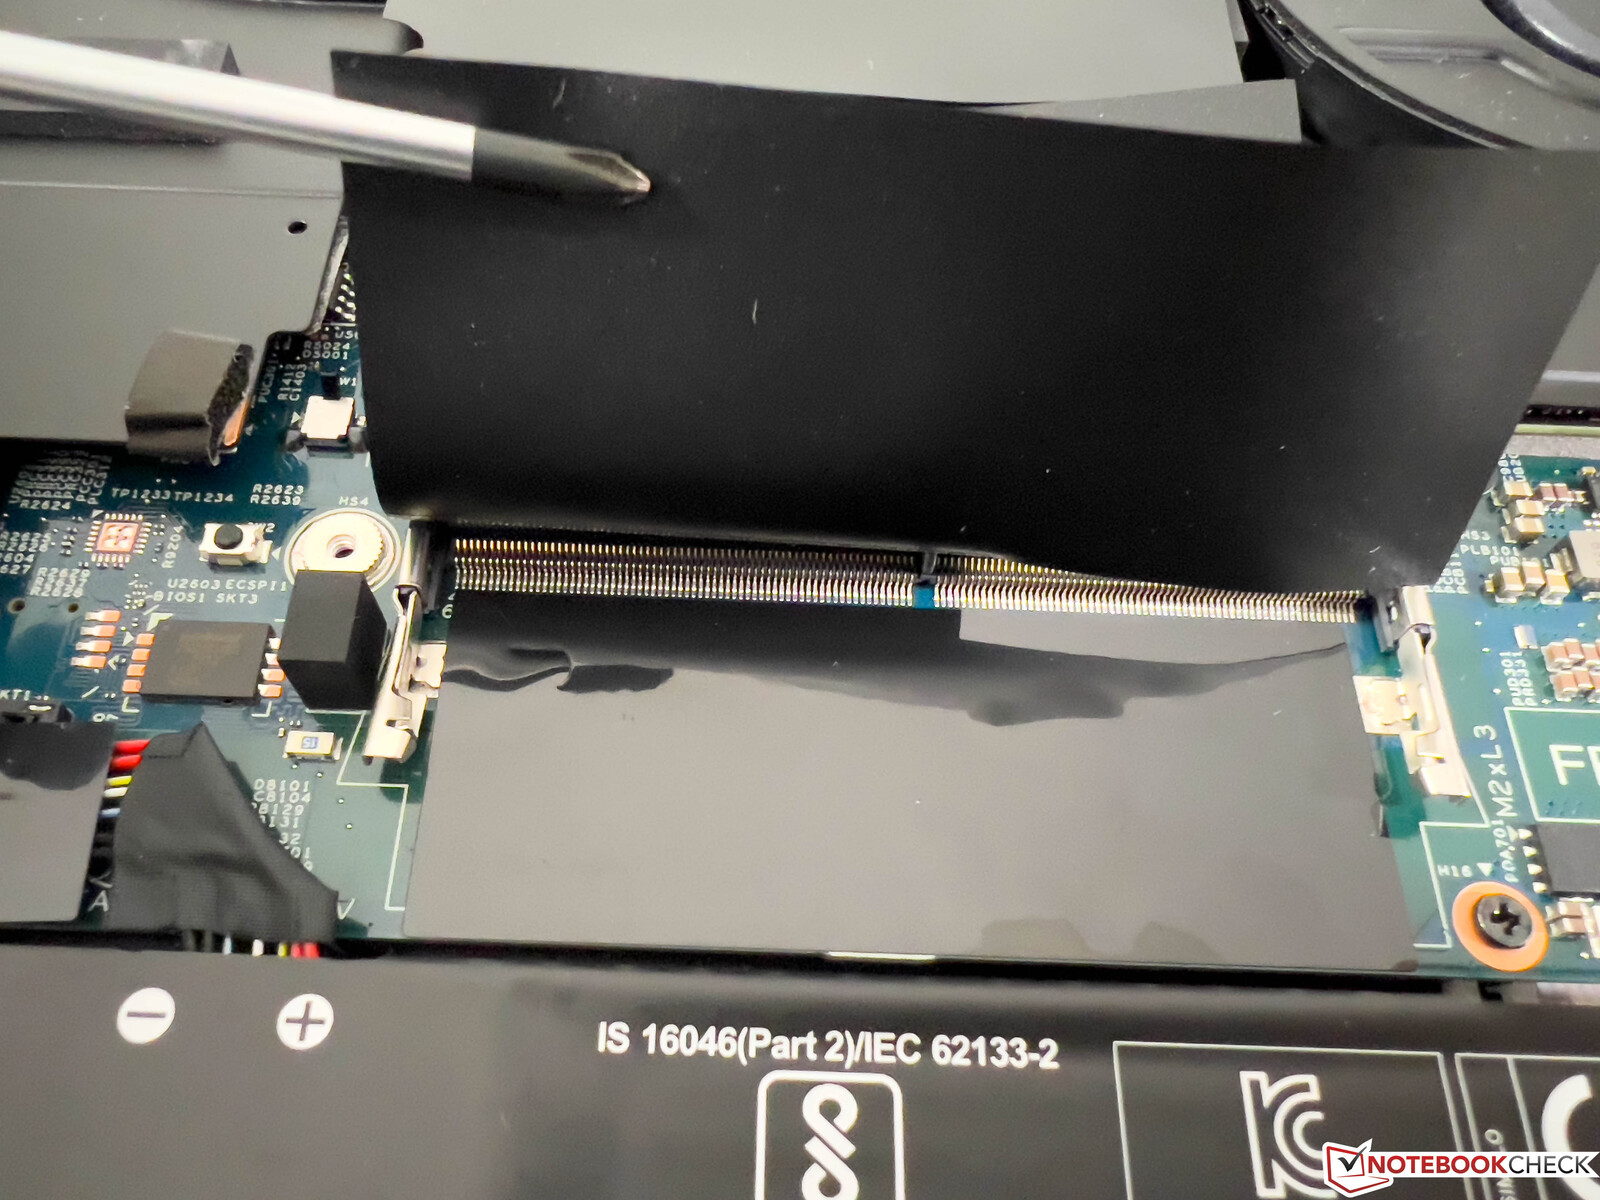
A tampa de base só é fixada com seis parafusos de cabeça cruzada normais (cuidado: só solte e não desaperte completamente) e pode ser removida muito facilmente. No interior você tem acesso aos dois ventiladores, o M.2 2280 SSD e ambos os slots de RAM.
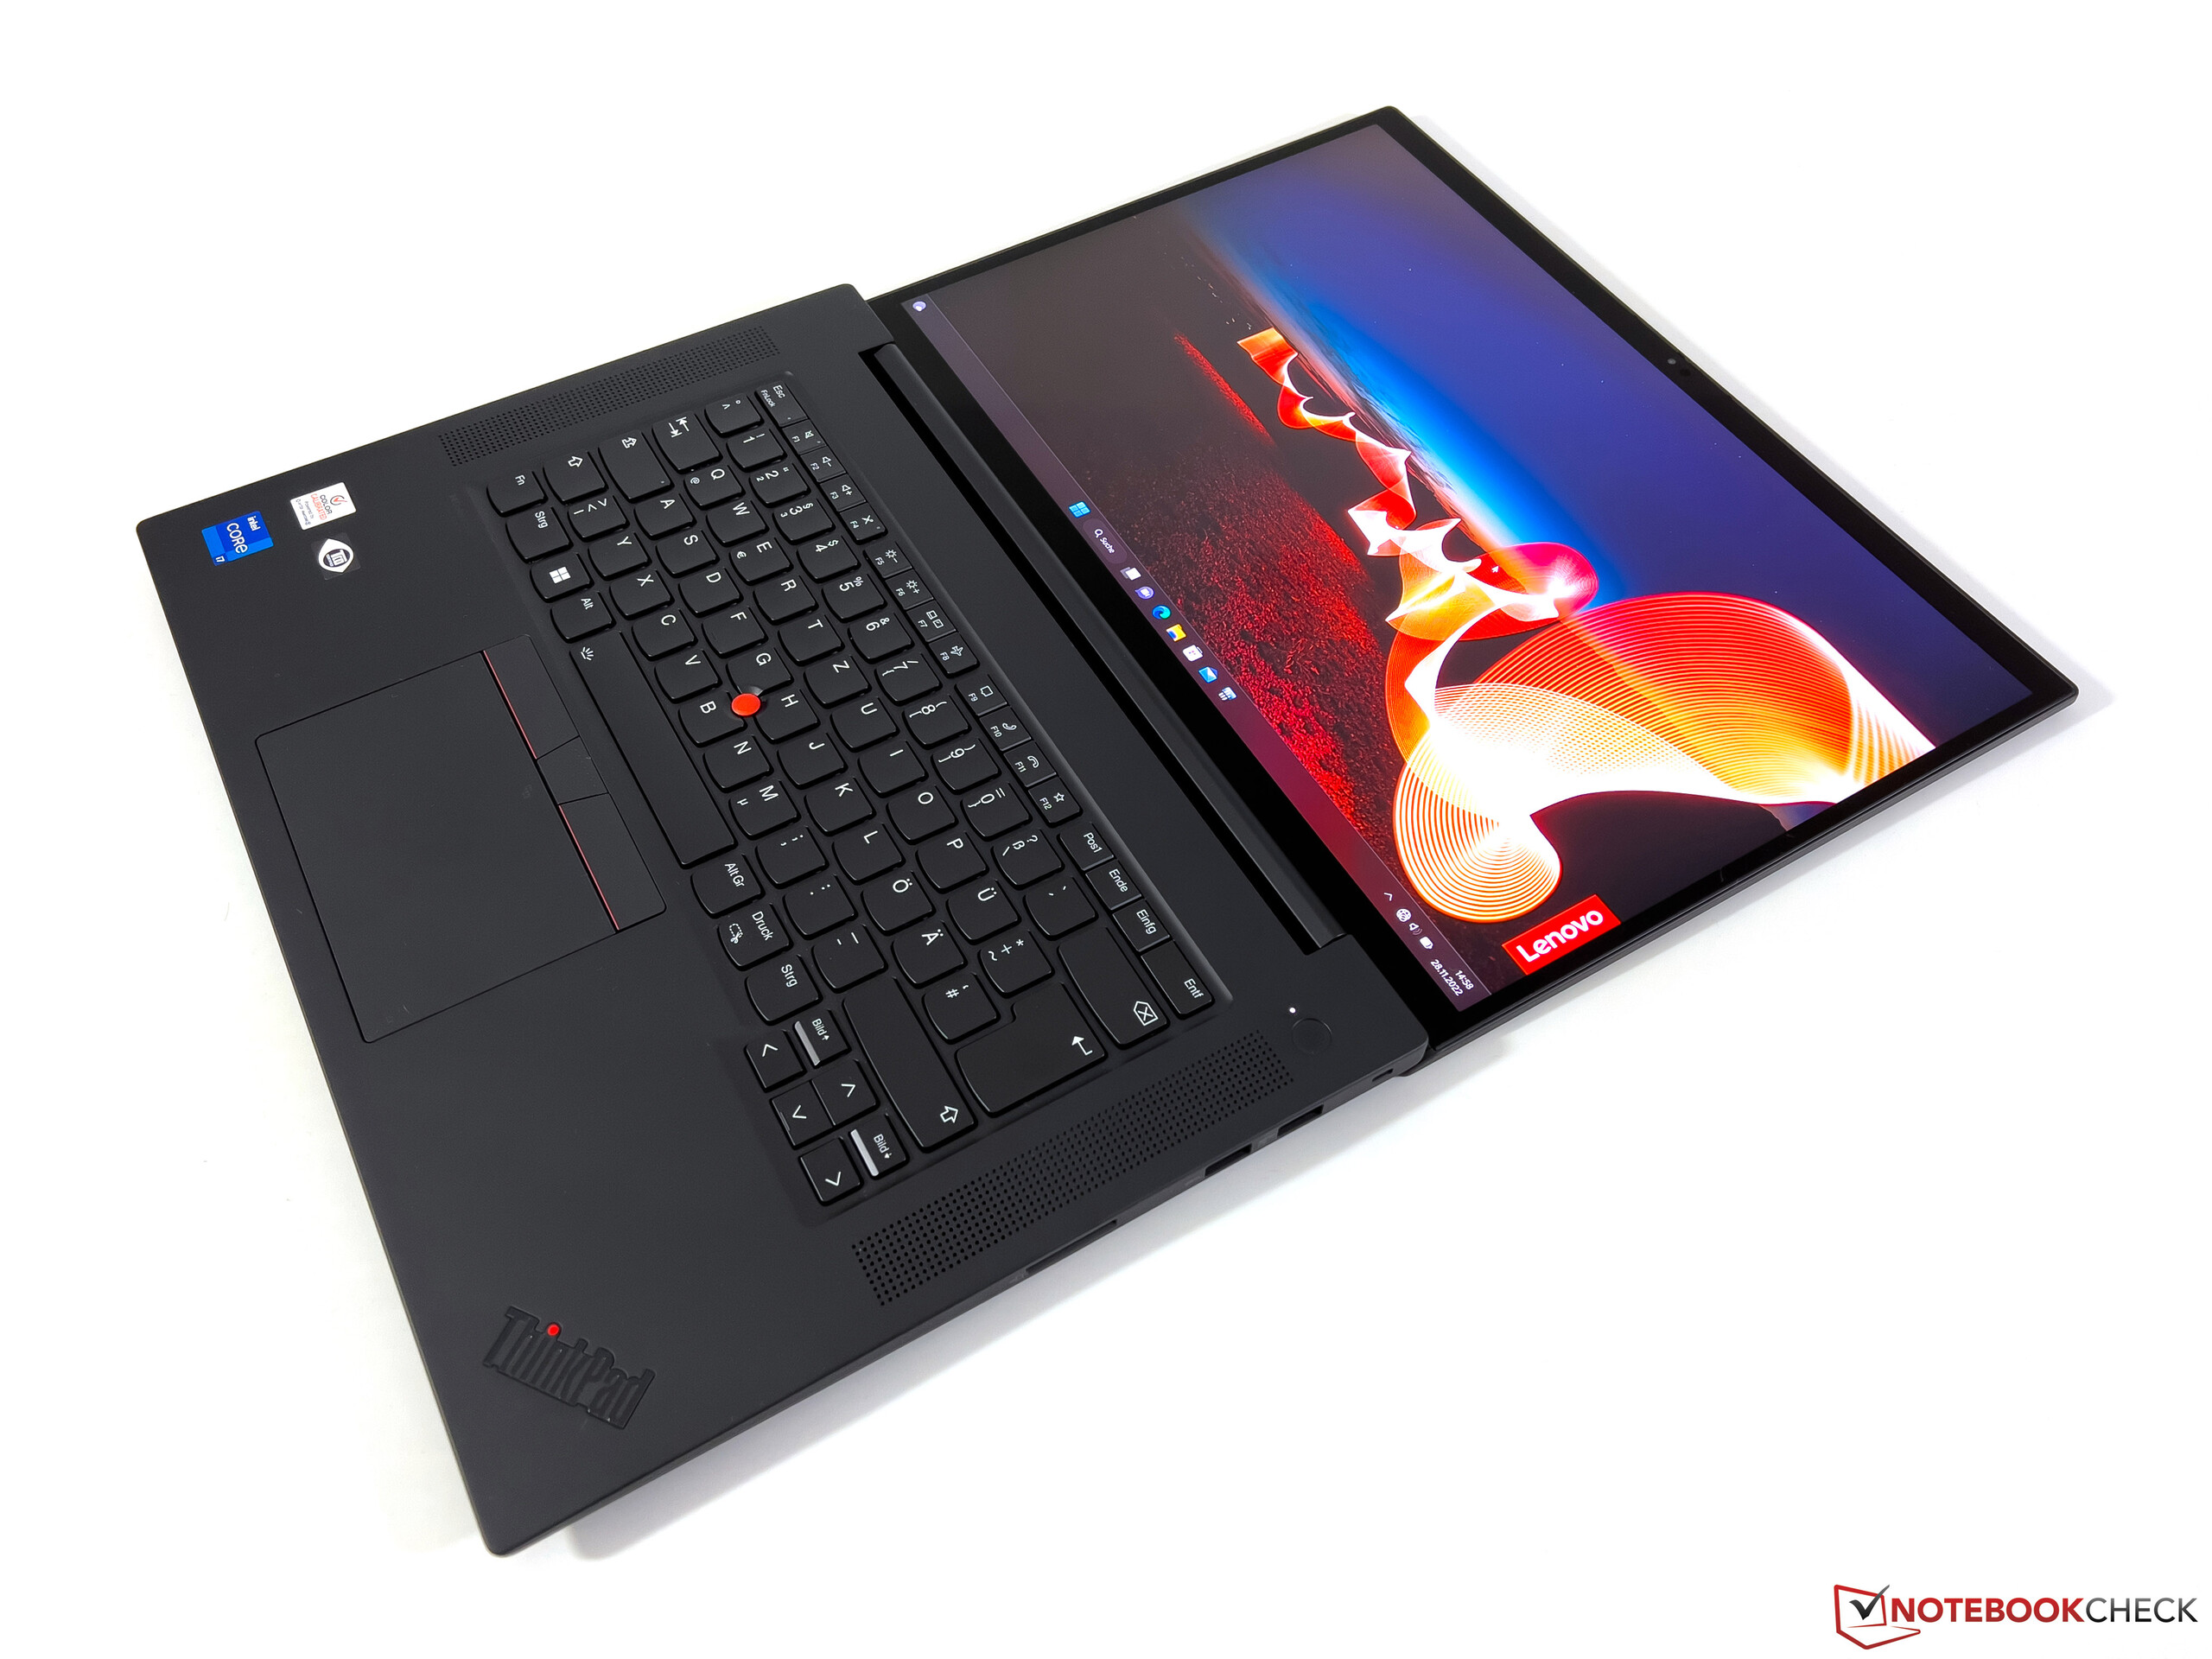
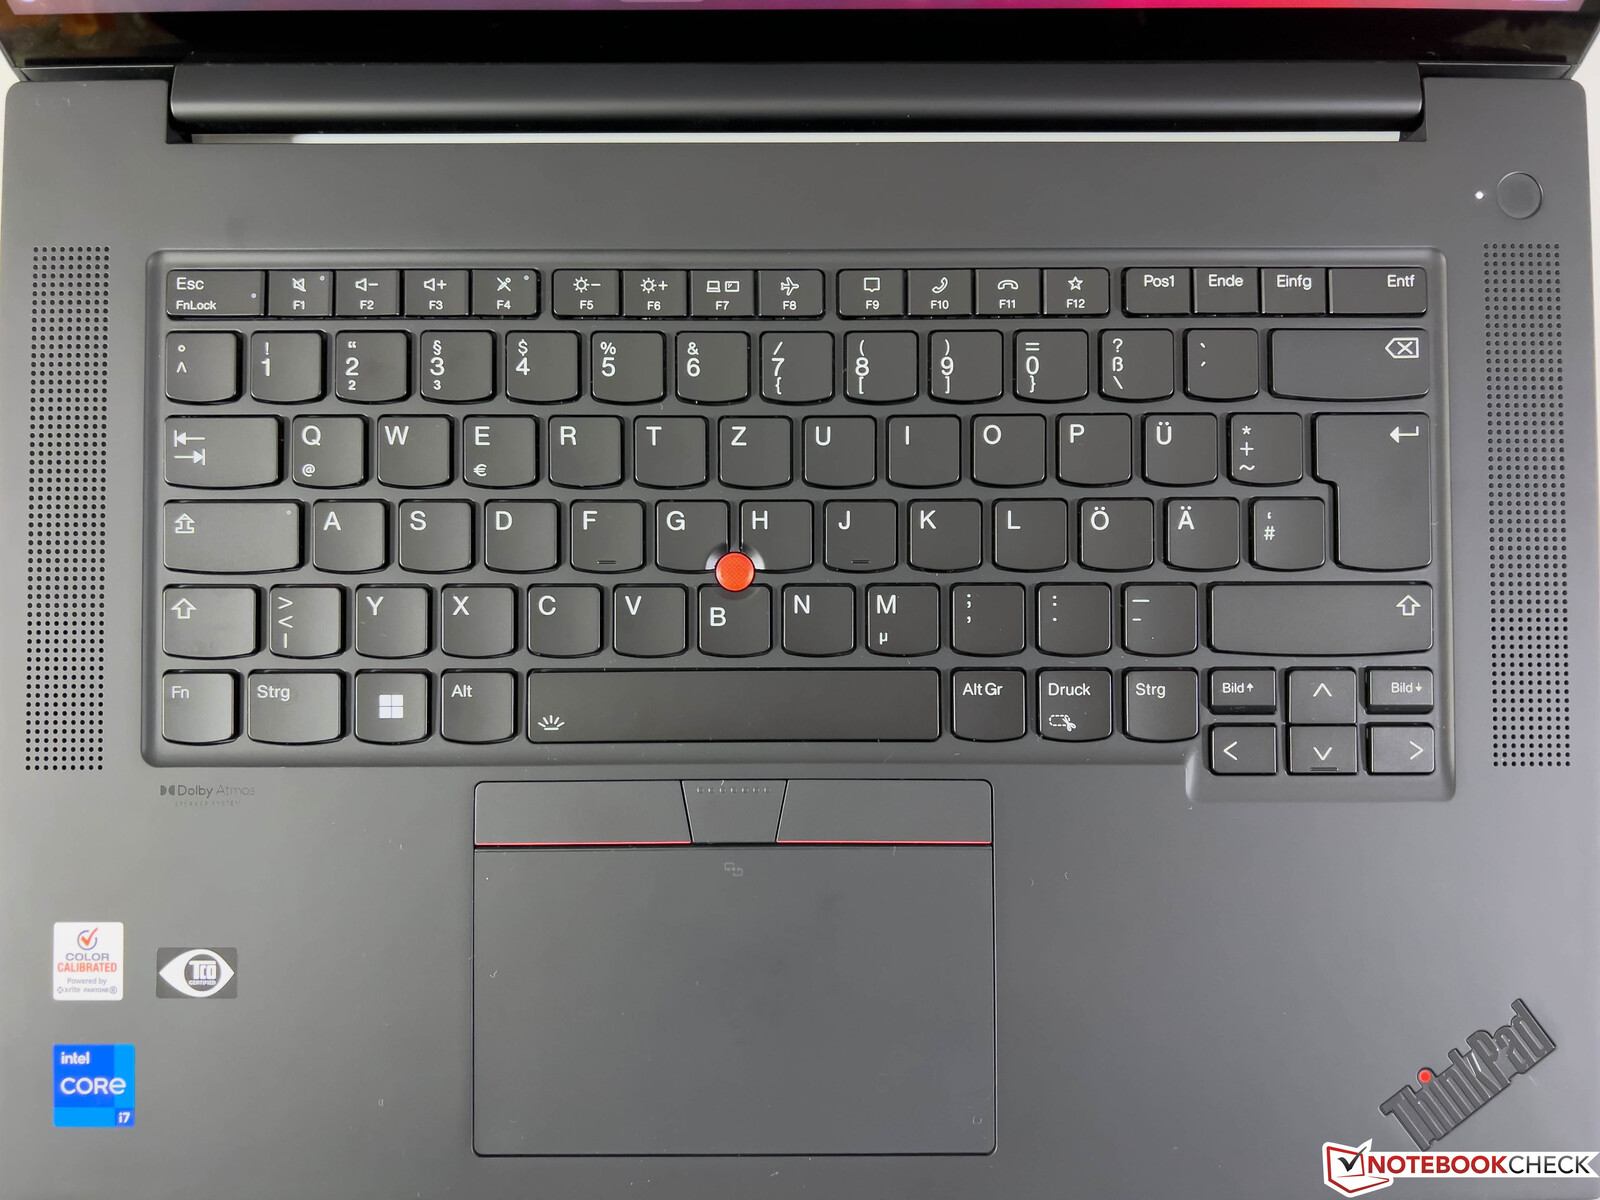
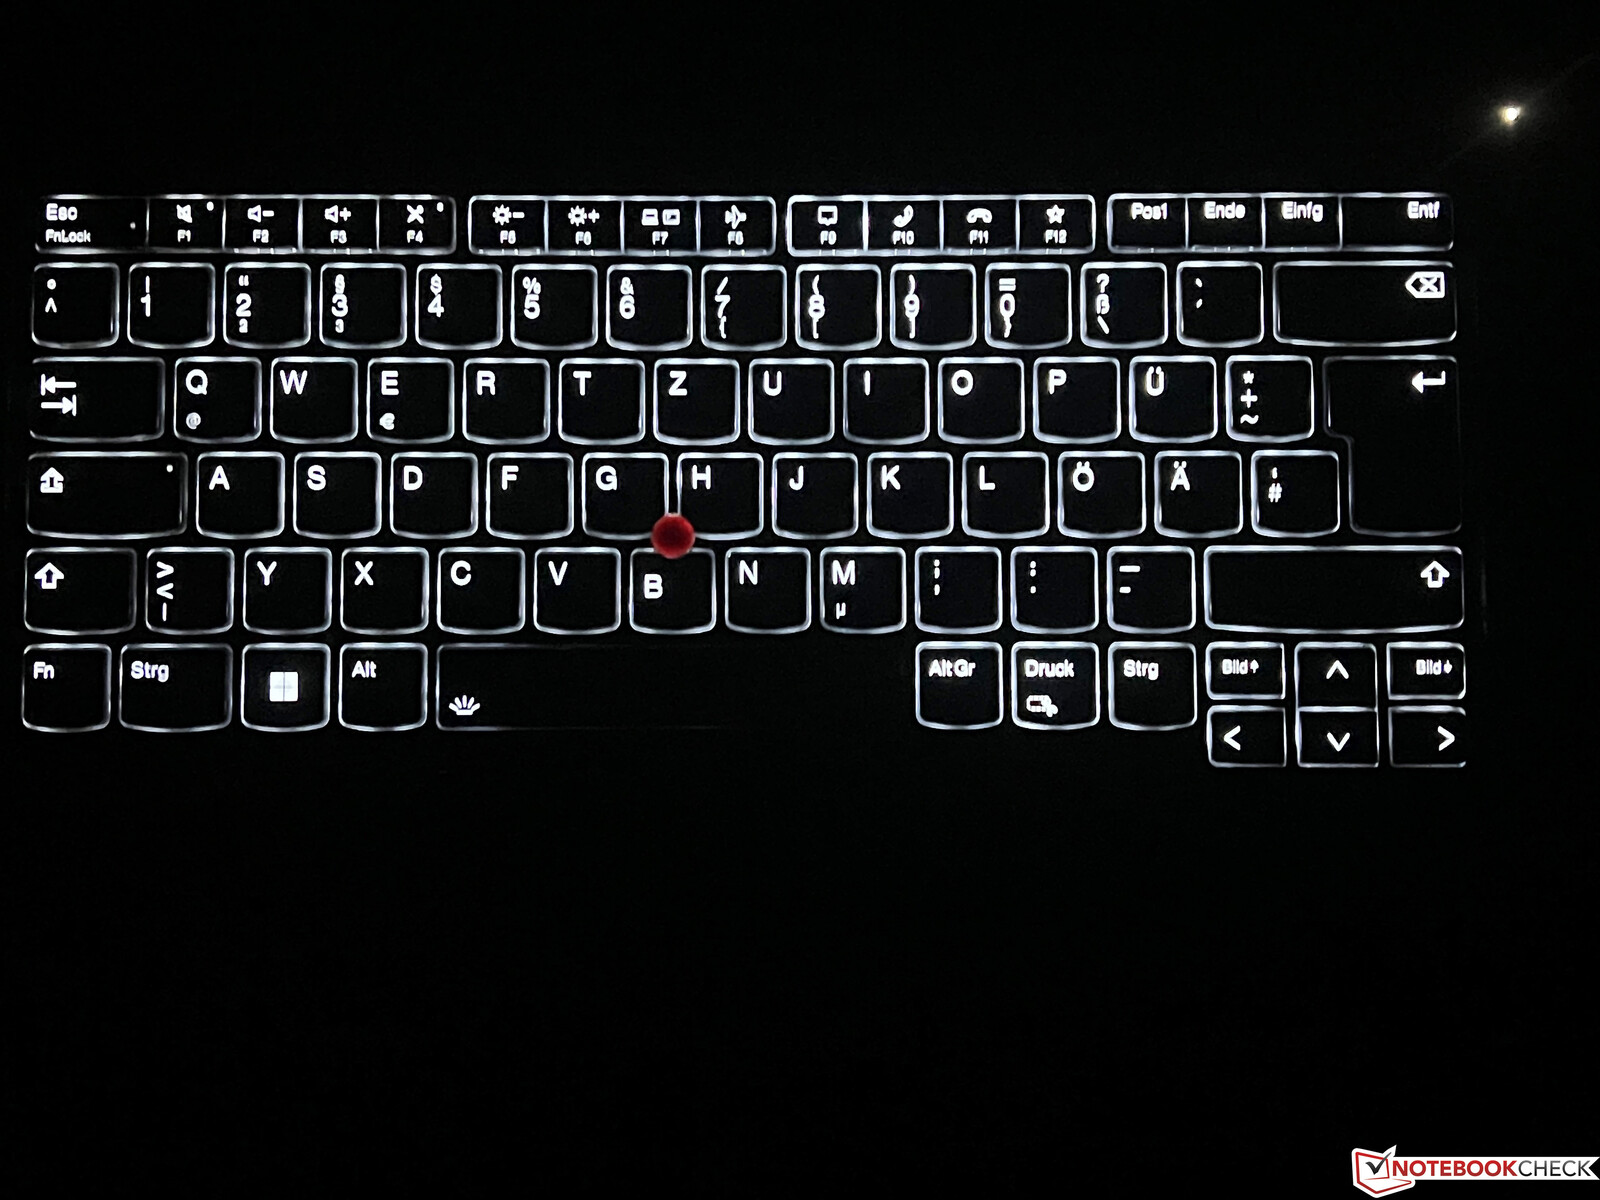
Dispositivos de entrada - ThinkPad de bandeira com chave de 1,5 mm de curso
Com o X1 Extreme G4 do ano passado, a Lenovo passou a usar um teclado com menor deslocamento das teclas e assim piorou notavelmente a qualidade em comparação com os modelos antigos (deslocamento de 1,8 mm). O teclado atual não é ruim, mas nos deixa sem saber por que a Lenovo optou por encurtar o curso da chave com um dispositivo tão grande quanto o X1 Extreme G5. A única vantagem do teclado ThinkPad agora desapareceu. Como de costume, o teclado tem uma luz de fundo branca de dois níveis e o leitor de impressões digitais está integrado no botão de alimentação no lado direito acima do teclado
O trackpad é muito suave ao toque, oferecendo uma boa mecânica, com sons de cliques silenciosos e de alta qualidade. Além disso, há um TrackPoint com teclas dedicadas que pode ser usado para controlar o ponteiro. As teclas planas proporcionam uma resposta boa e silenciosa com controle intuitivo. Além disso, também está disponível uma tela capacitiva sensível ao toque que também suporta a entrada do ponteiro (compatível com a caneta opcional Lenovo Active Pen 2 e Lenovo Pen Pro).
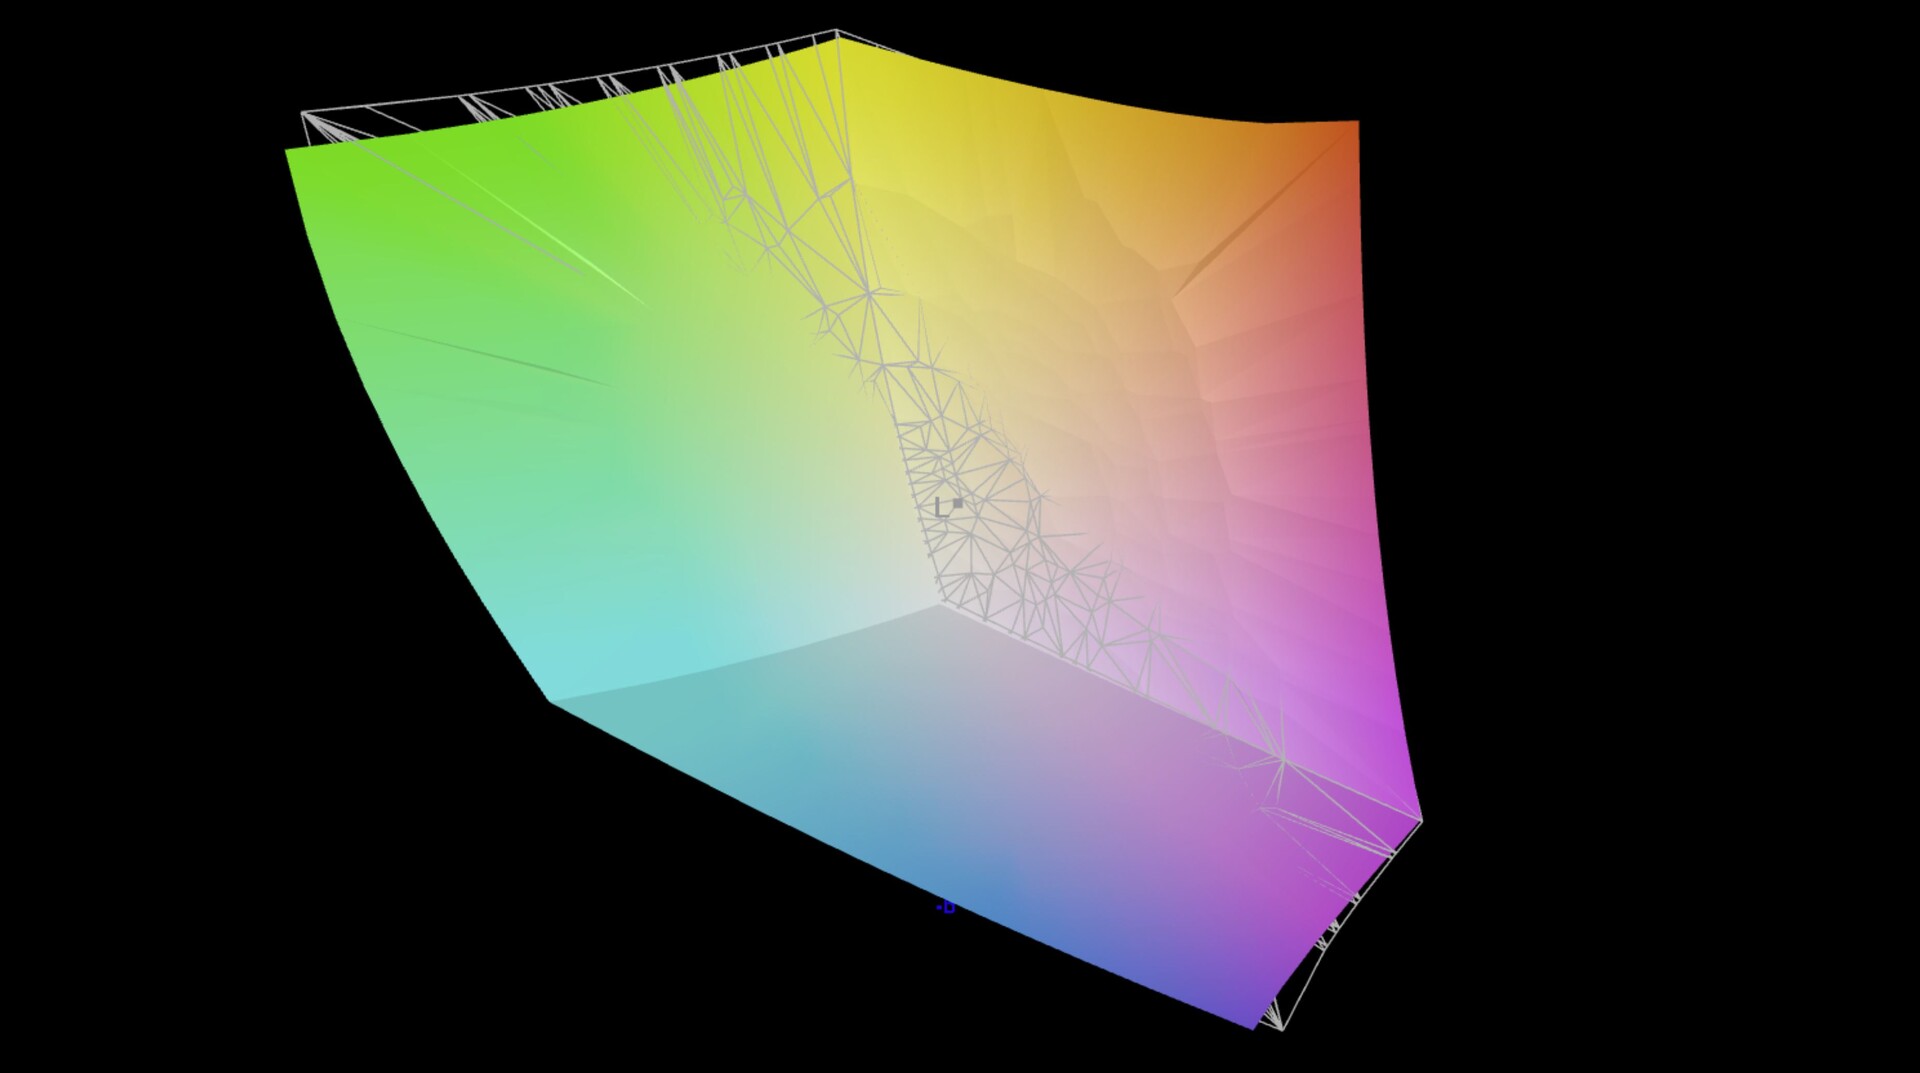
Display - o X1 Extreme ainda vem com AdobeRGB


A Lenovo é um dos poucos fabricantes que ainda oferece displays AdobeRGB. O formato 16:10 (3840 x 2400 pixels), 4K touchscreen é o mesmo de sua antecessora. Uma novidade nesta geração é o painel WQHD mate de 165 Hz, que em breve daremos seus passos no ThinkPad P1 G5. Visto subjetivamente, o painel reflexivo causa uma excelente impressão visual. Embora a Lenovo tenha usado o mesmo painel que seu predecessor, nossos testes revelaram que o brilho do visor é em média de 470 cd/m², o que não só é muito menor desta vez, mas também abaixo da especificação do fabricante de 600 cd/m². Ao mesmo tempo, entretanto, o nível de preto é um pouco melhor, resultando em uma relação de contraste inalterada de pouco menos de 1400:1. Além disso, a tela suporta HDR sem nenhuma indicação de PWM. Além disso, os tempos de resposta são melhores do que os de seu predecessor.
| |||||||||||||||||||||||||
iluminação: 90 %
iluminação com acumulador: 475 cd/m²
Contraste: 1360:1 (Preto: 0.35 cd/m²)
ΔE ColorChecker Calman: 1.9 | ∀{0.5-29.43 Ø4.73}
calibrated: 1.3
ΔE Greyscale Calman: 2.4 | ∀{0.09-98 Ø4.97}
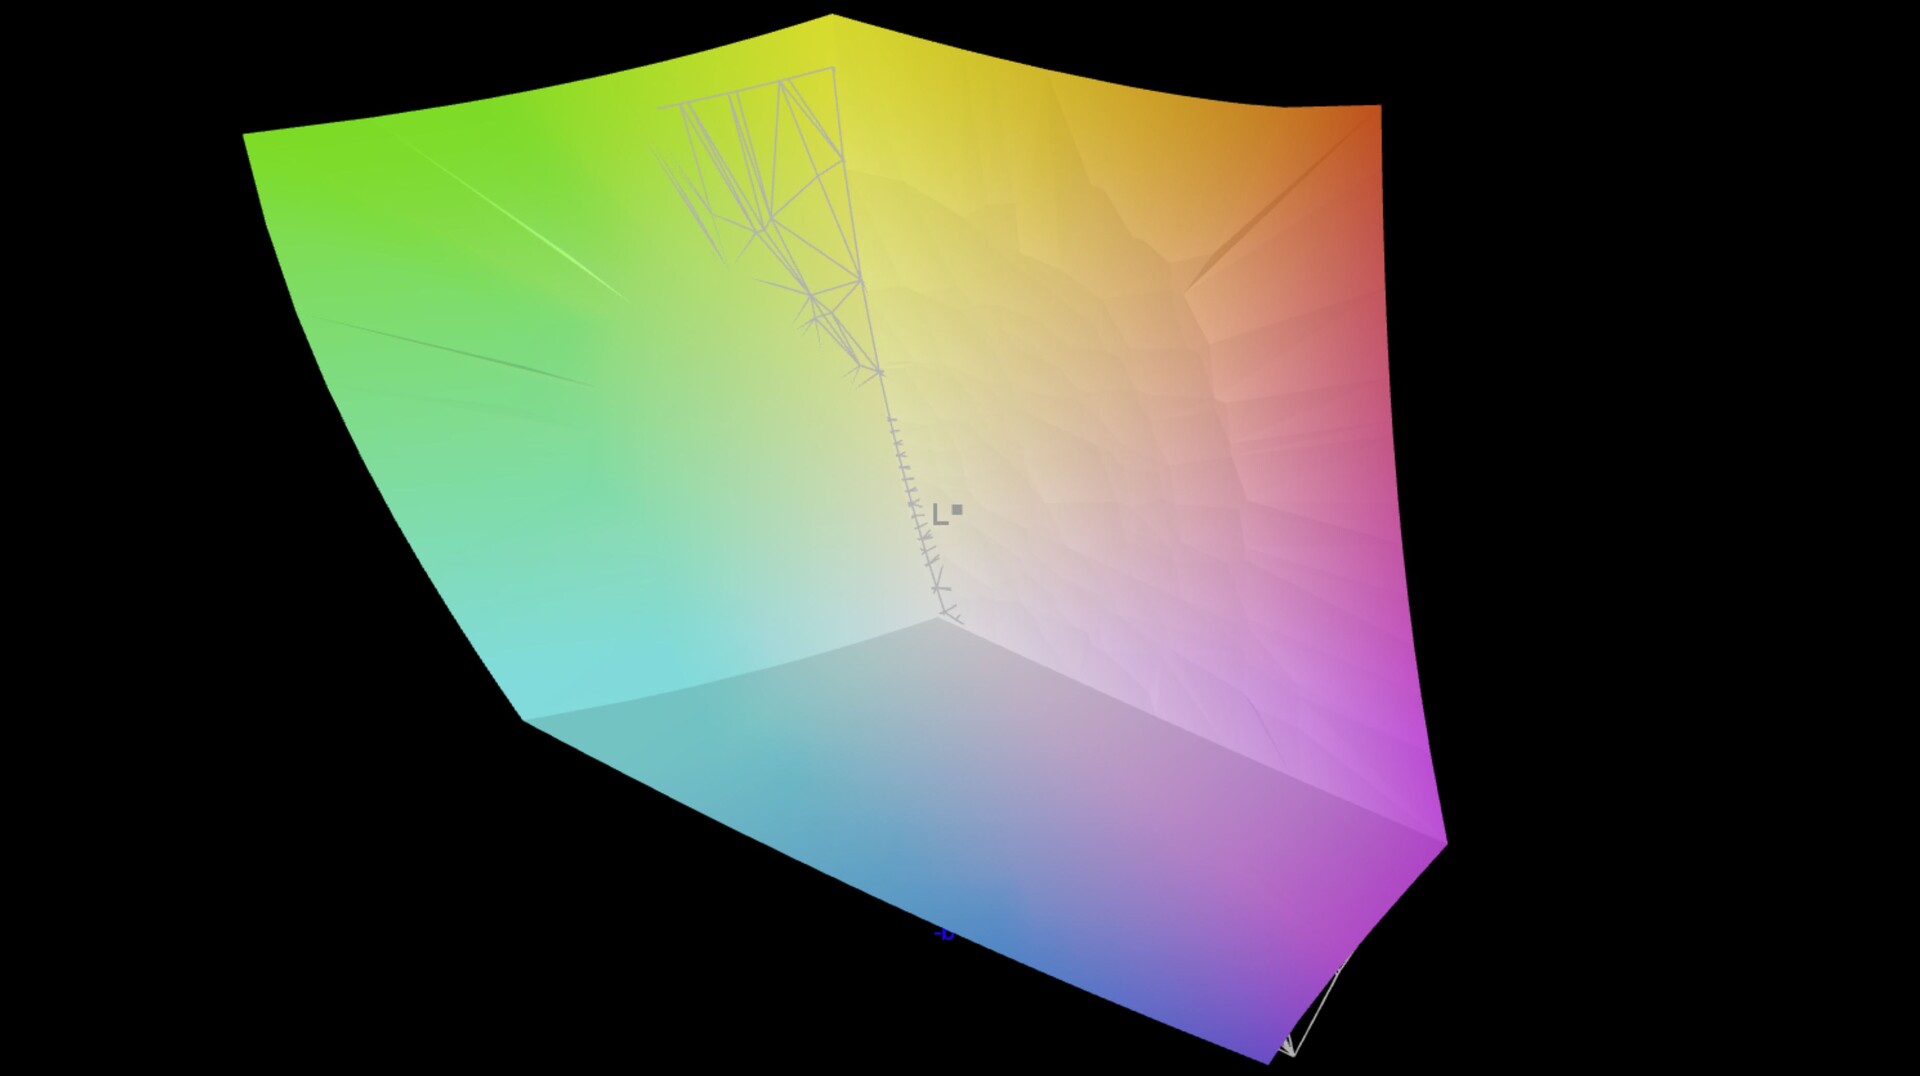
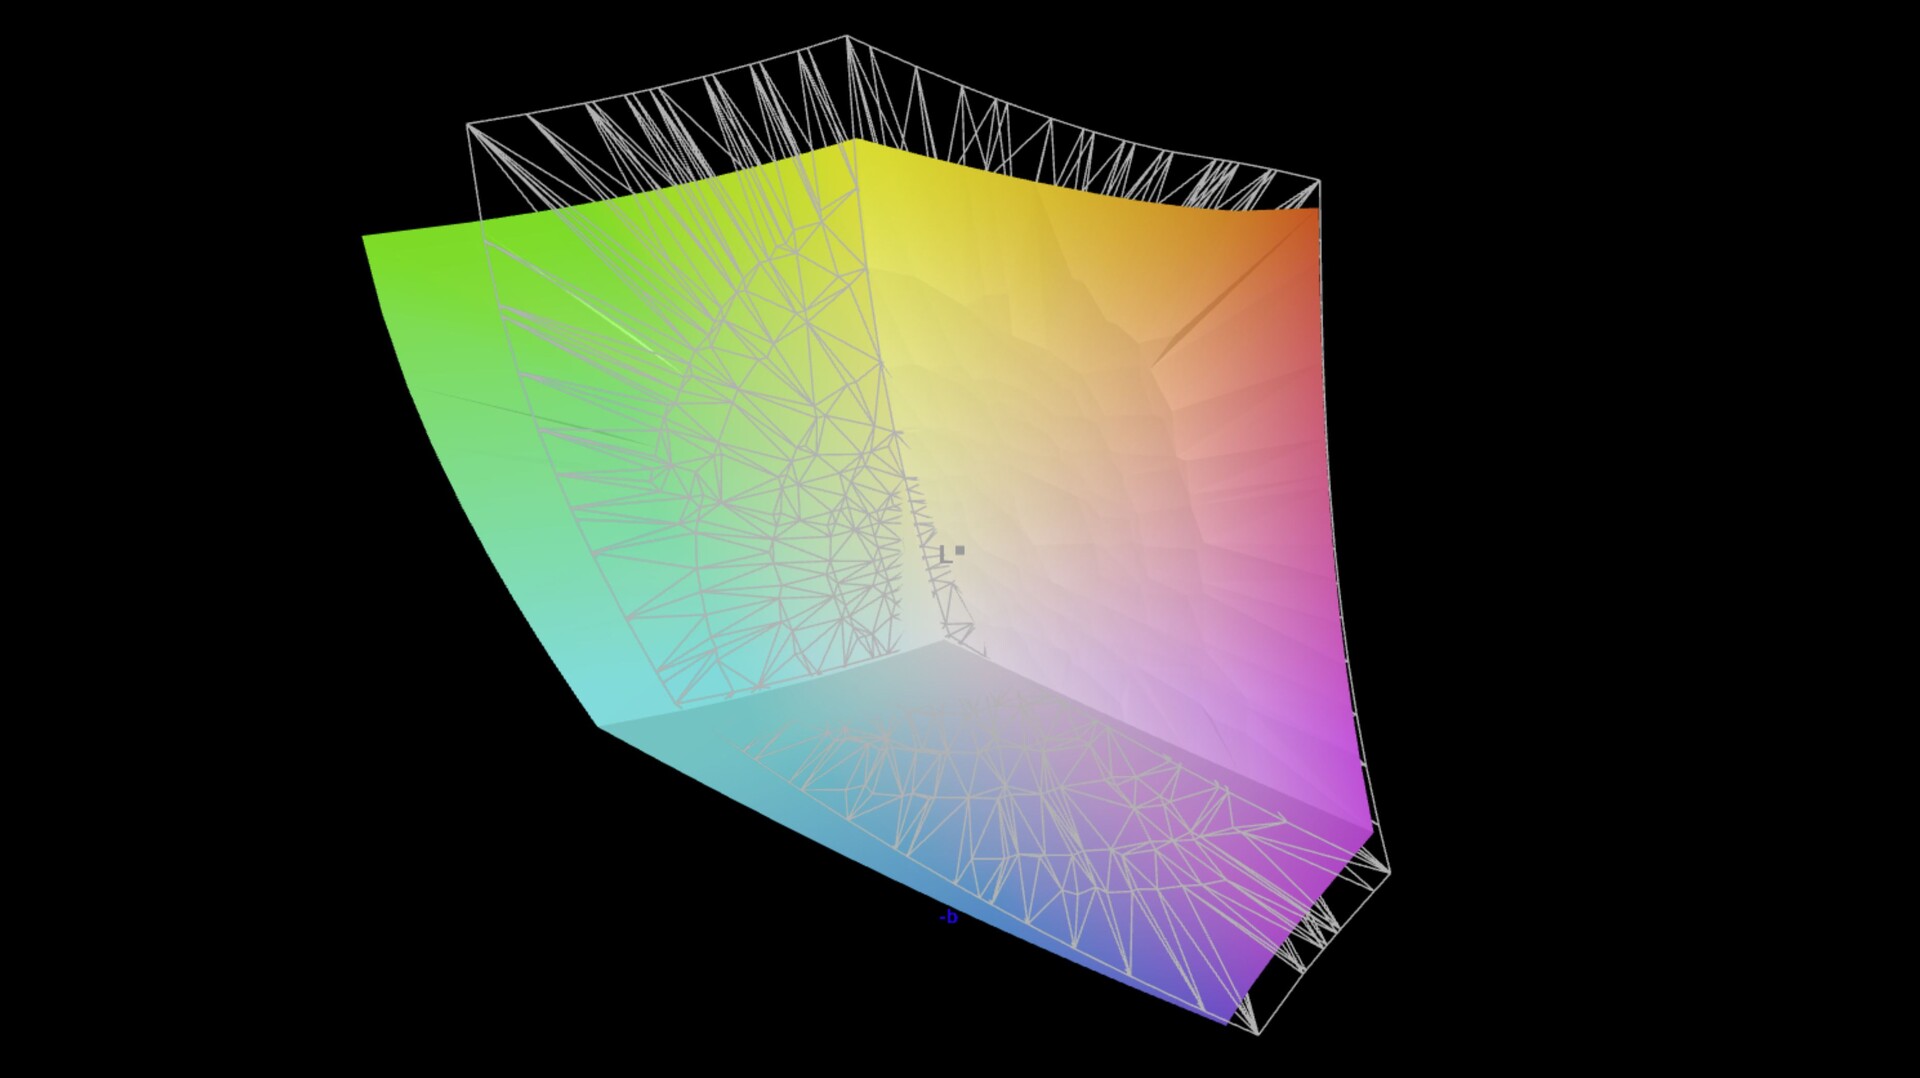
97.7% AdobeRGB 1998 (Argyll 3D)
99.2% sRGB (Argyll 3D)
84.6% Display P3 (Argyll 3D)
Gamma: 2.24
CCT: 6377 K
| Lenovo ThinkPad X1 Extreme G5-21DE003RGE LP160UQ1-SPB1, IPS, 3840x2400, 16" | HP Envy 16 h0112nr Samsung SDC4174, OLED, 3840x2400, 16" | Schenker Vision 16 Pro RTX 3070 Ti N160QDM-NZ1, IPS, 2560x1600, 16" | Dell XPS 15 9520 RTX 3050 Ti Samsung 156XG01, OLED, 3456x2160, 15.6" | Apple MacBook Pro 16 2021 M1 Pro Liquid Retina XDR, Mini-LED, 3456x2234, 16.2" | Dell XPS 17 9720 RTX 3060 Sharp LQ170R1, IPS, 3840x2400, 17" | Lenovo ThinkPad X1 Extreme G4-20Y5CTO1WW (3050 Ti) LP160UQ1-SPB1, IPS LED, 3840x2400, 16" | |
|---|---|---|---|---|---|---|---|
| Display | 3% | -17% | 2% | 3% | -1% | -0% | |
| Display P3 Coverage (%) | 84.6 | 99.3 17% | 68.7 -19% | 97.8 16% | 99.1 17% | 92.9 10% | 84.3 0% |
| sRGB Coverage (%) | 99.2 | 100 1% | 96.7 -3% | 99.9 1% | 100 1% | 100 1% | 98.3 -1% |
| AdobeRGB 1998 Coverage (%) | 97.7 | 88 -10% | 70 -28% | 86 -12% | 88 -10% | 85.3 -13% | 97.8 0% |
| Response Times | 93% | 62% | 93% | -185% | -47% | -75% | |
| Response Time Grey 50% / Grey 80% * (ms) | 46 ? | 2 ? 96% | 14.3 ? 69% | 1.9 ? 96% | 42.8 ? 7% | 51.2 ? -11% | 60 ? -30% |
| Response Time Black / White * (ms) | 19.2 ? | 1.9 ? 90% | 8.6 ? 55% | 1.9 ? 90% | 91.6 ? -377% | 35.2 ? -83% | 42 ? -119% |
| PWM Frequency (Hz) | 240.4 ? | 59.52 ? | 14880 | ||||
| Screen | -3% | -41% | -40% | 247% | -68% | 2% | |
| Brightness middle (cd/m²) | 476 | 328.8 -31% | 364 -24% | 381.4 -20% | 514 8% | 512.7 8% | 639 34% |
| Brightness (cd/m²) | 470 | 332 -29% | 347 -26% | 384 -18% | 497 6% | 463 -1% | 612 30% |
| Brightness Distribution (%) | 90 | 97 8% | 89 -1% | 95 6% | 95 6% | 85 -6% | 84 -7% |
| Black Level * (cd/m²) | 0.35 | 0.3 14% | 0.02 94% | 0.32 9% | 0.47 -34% | ||
| Contrast (:1) | 1360 | 1213 -11% | 25700 1790% | 1602 18% | 1360 0% | ||
| Colorchecker dE 2000 * | 1.9 | 1.53 19% | 3.3 -74% | 4.34 -128% | 1.4 26% | 5.98 -215% | 2.2 -16% |
| Colorchecker dE 2000 max. * | 4.7 | 6.04 -29% | 6.6 -40% | 9.24 -97% | 2.8 40% | 12.09 -157% | 5.3 -13% |
| Colorchecker dE 2000 calibrated * | 1.3 | 2.5 -92% | 1.4 -8% | ||||
| Greyscale dE 2000 * | 2.4 | 1.3 46% | 5.2 -117% | 2 17% | 2.3 4% | 7.2 -200% | 1.7 29% |
| Gamma | 2.24 98% | 2.18 101% | 2.14 103% | 2.13 103% | 2.27 97% | 2.54 87% | 2.31 95% |
| CCT | 6377 102% | 6362 102% | 6331 103% | 6210 105% | 6792 96% | 6914 94% | 6390 102% |
| Média Total (Programa/Configurações) | 31% /
16% | 1% /
-21% | 18% /
-4% | 22% /
124% | -39% /
-49% | -24% /
-10% |
* ... menor é melhor
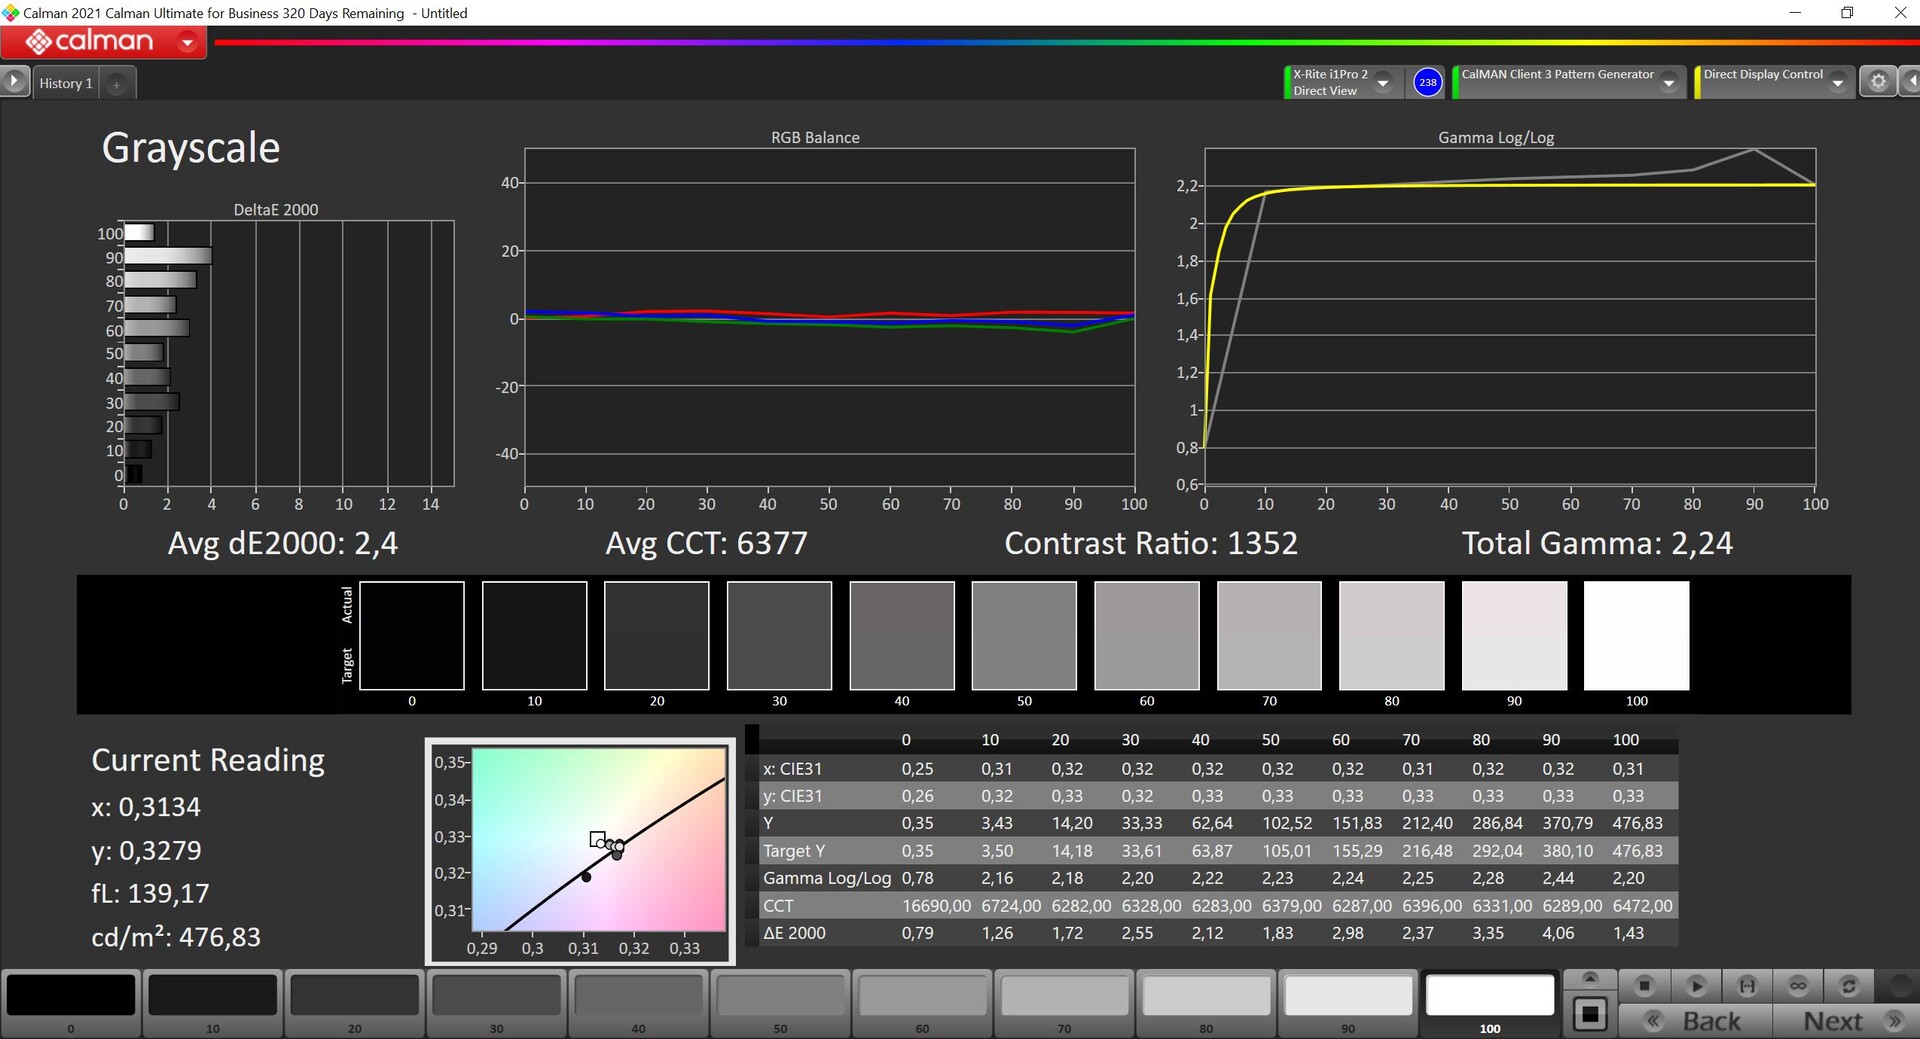
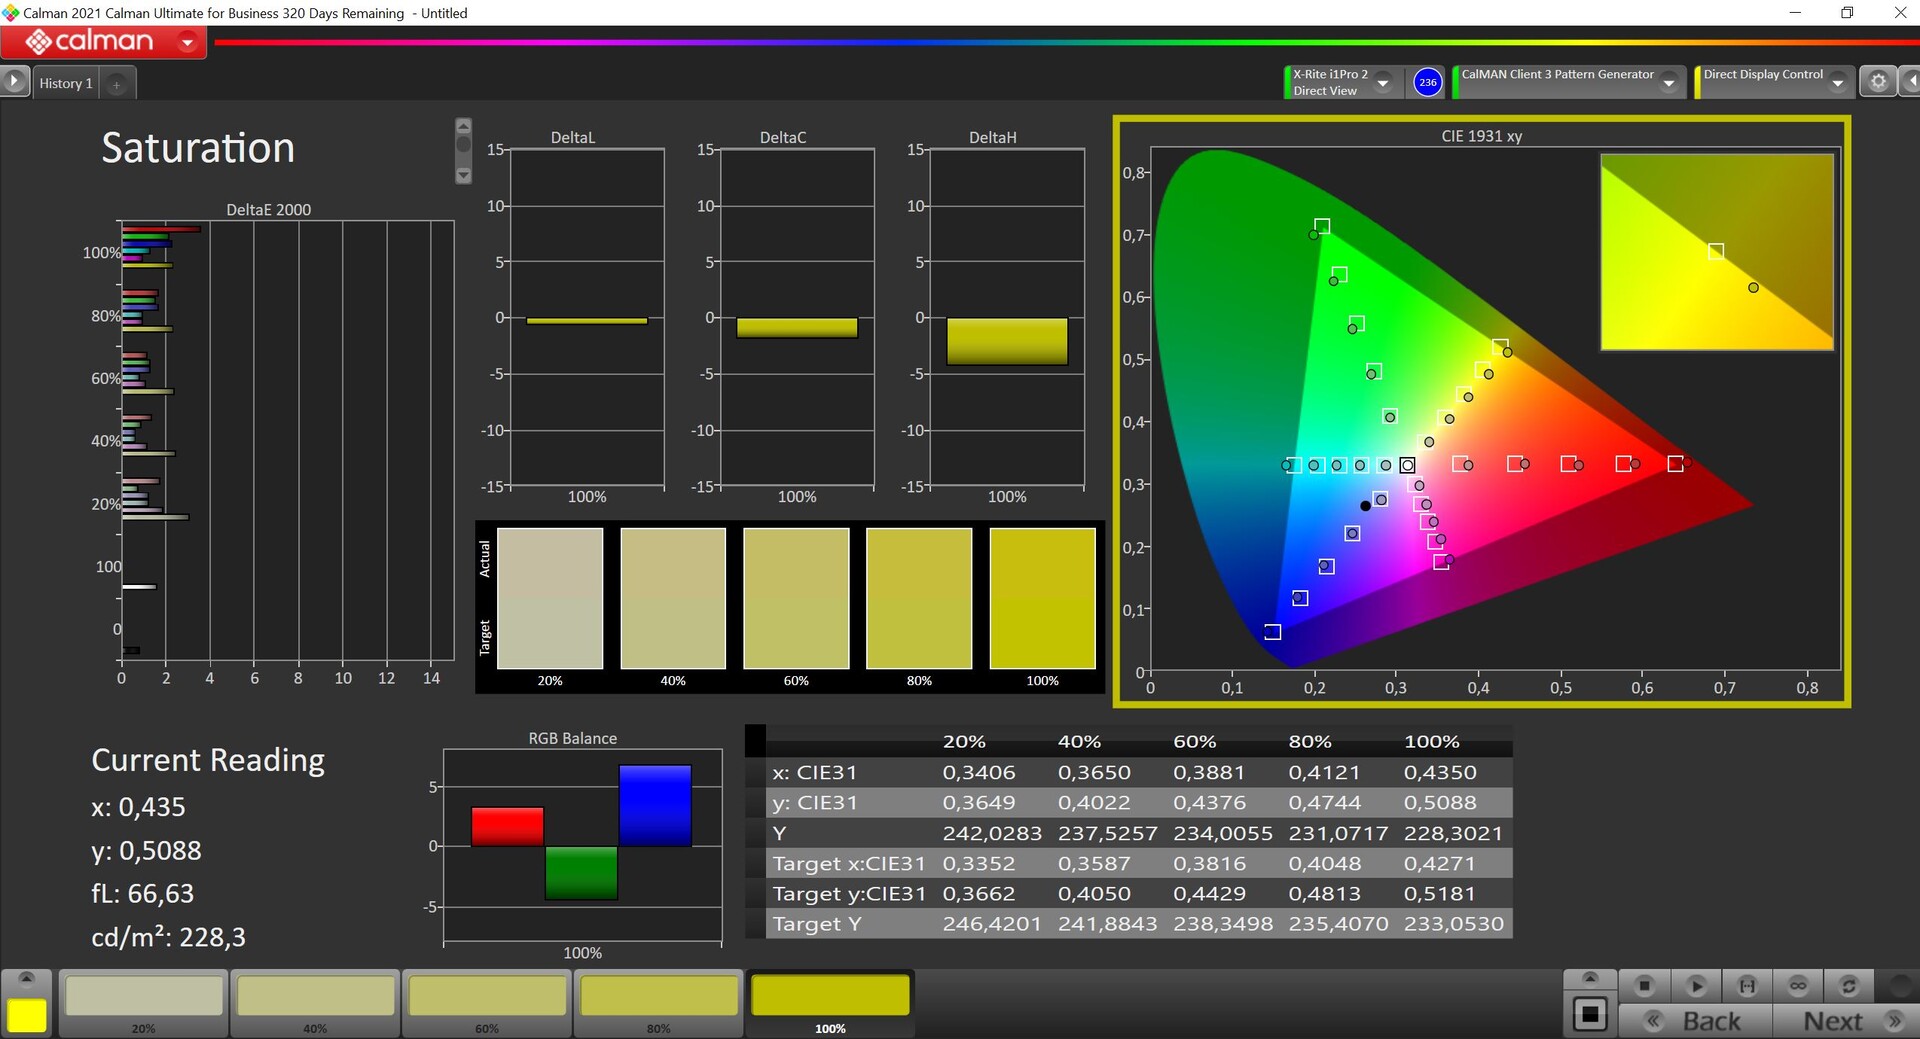
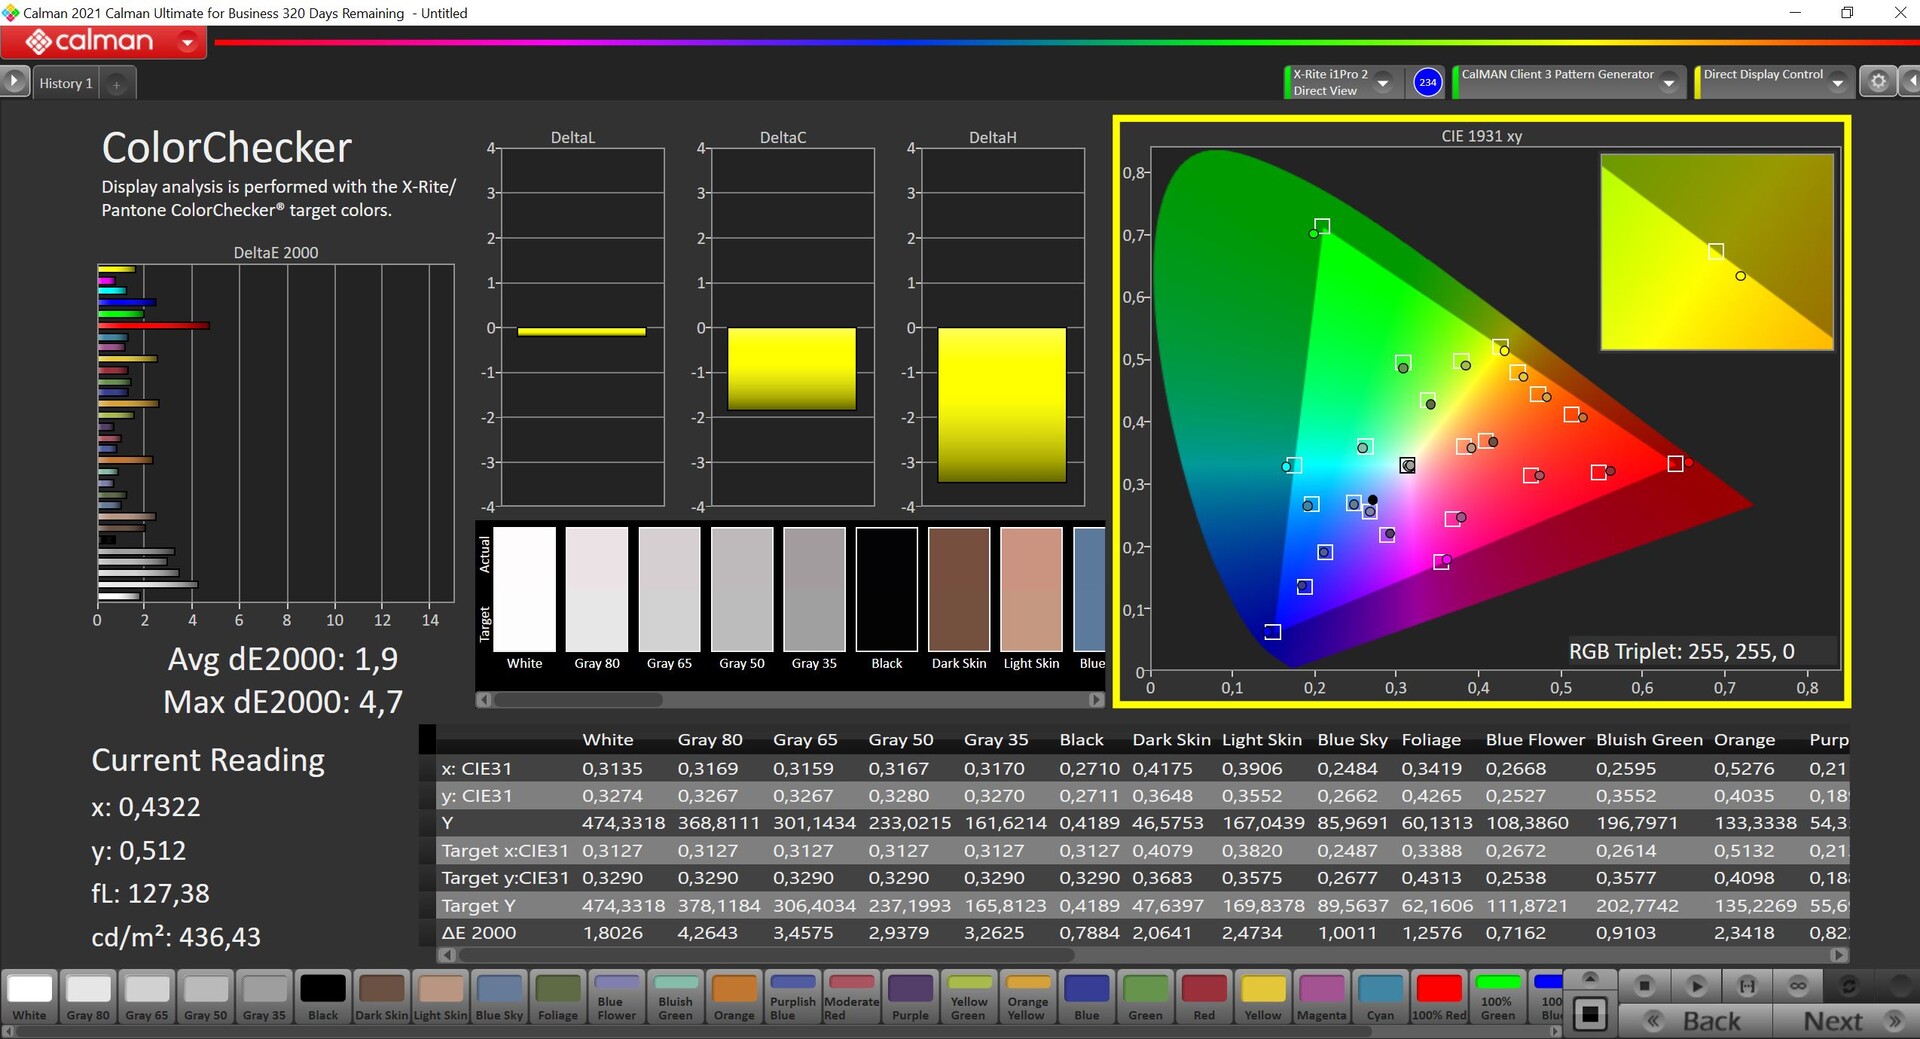

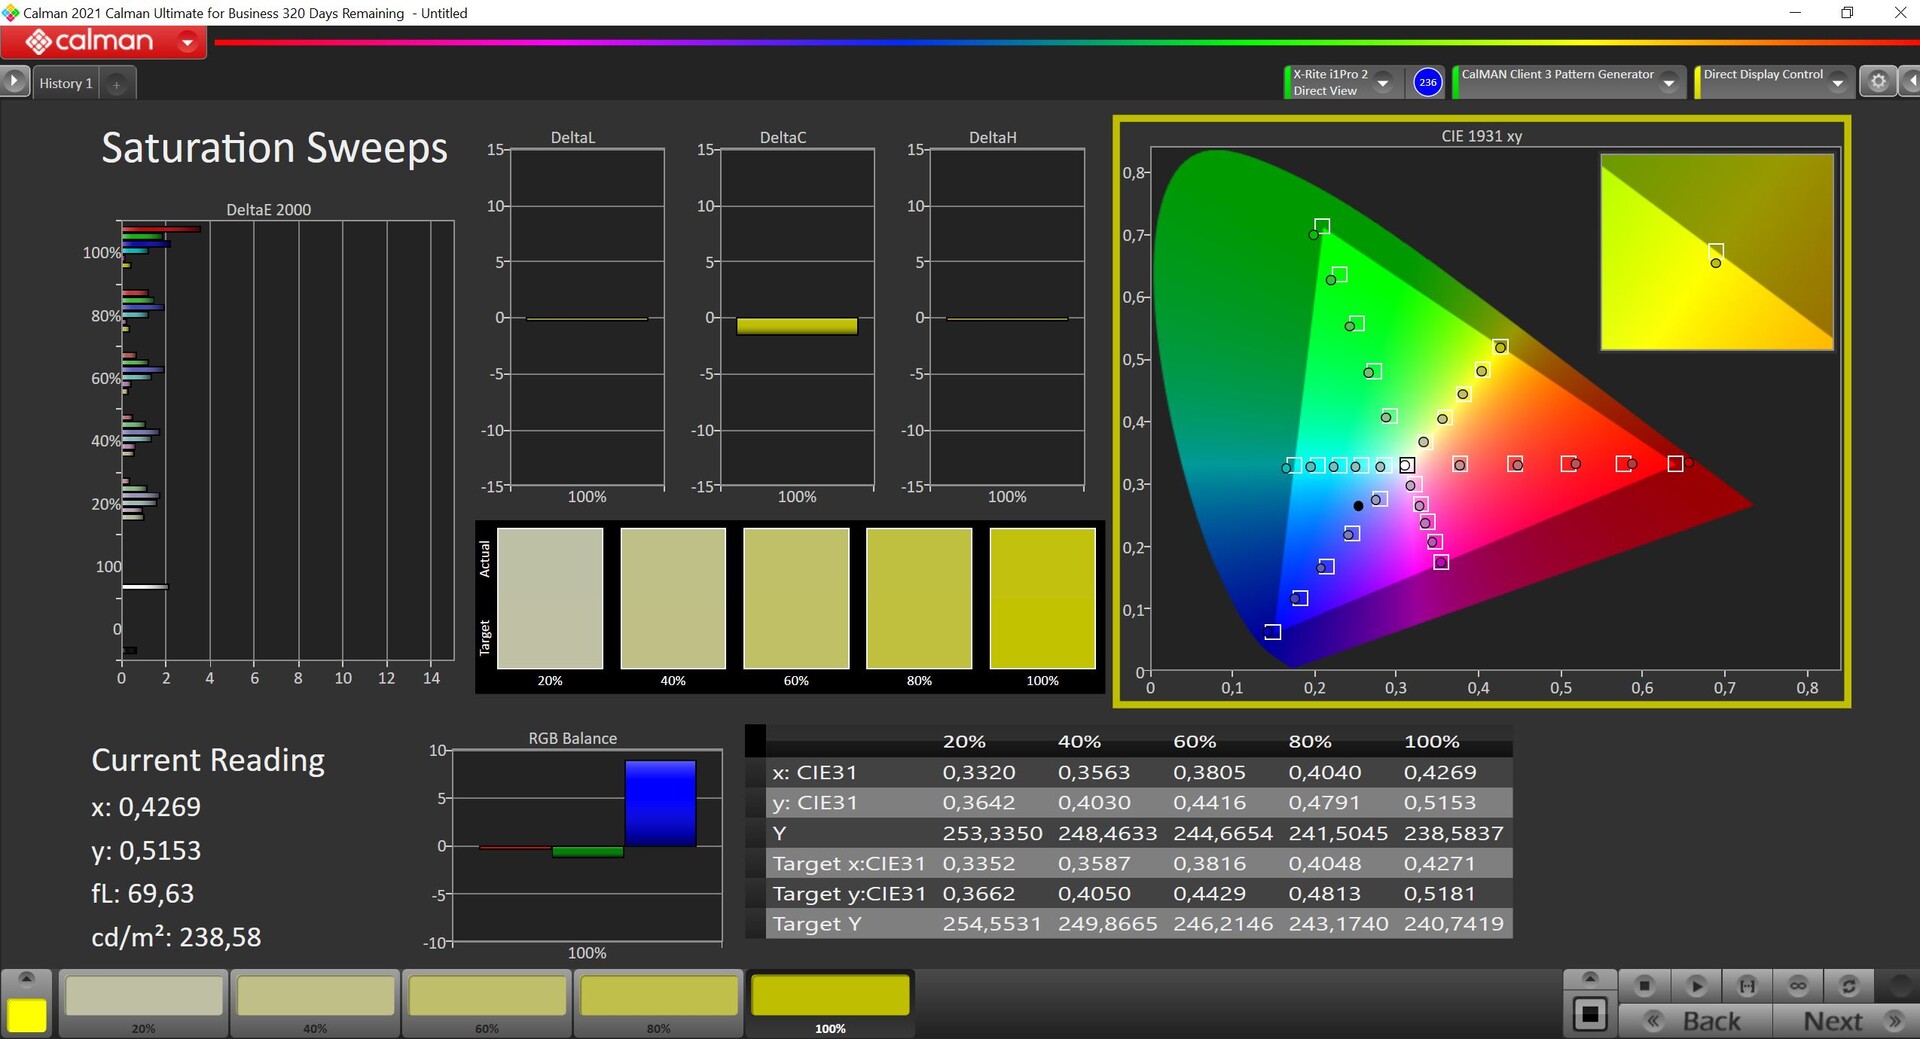
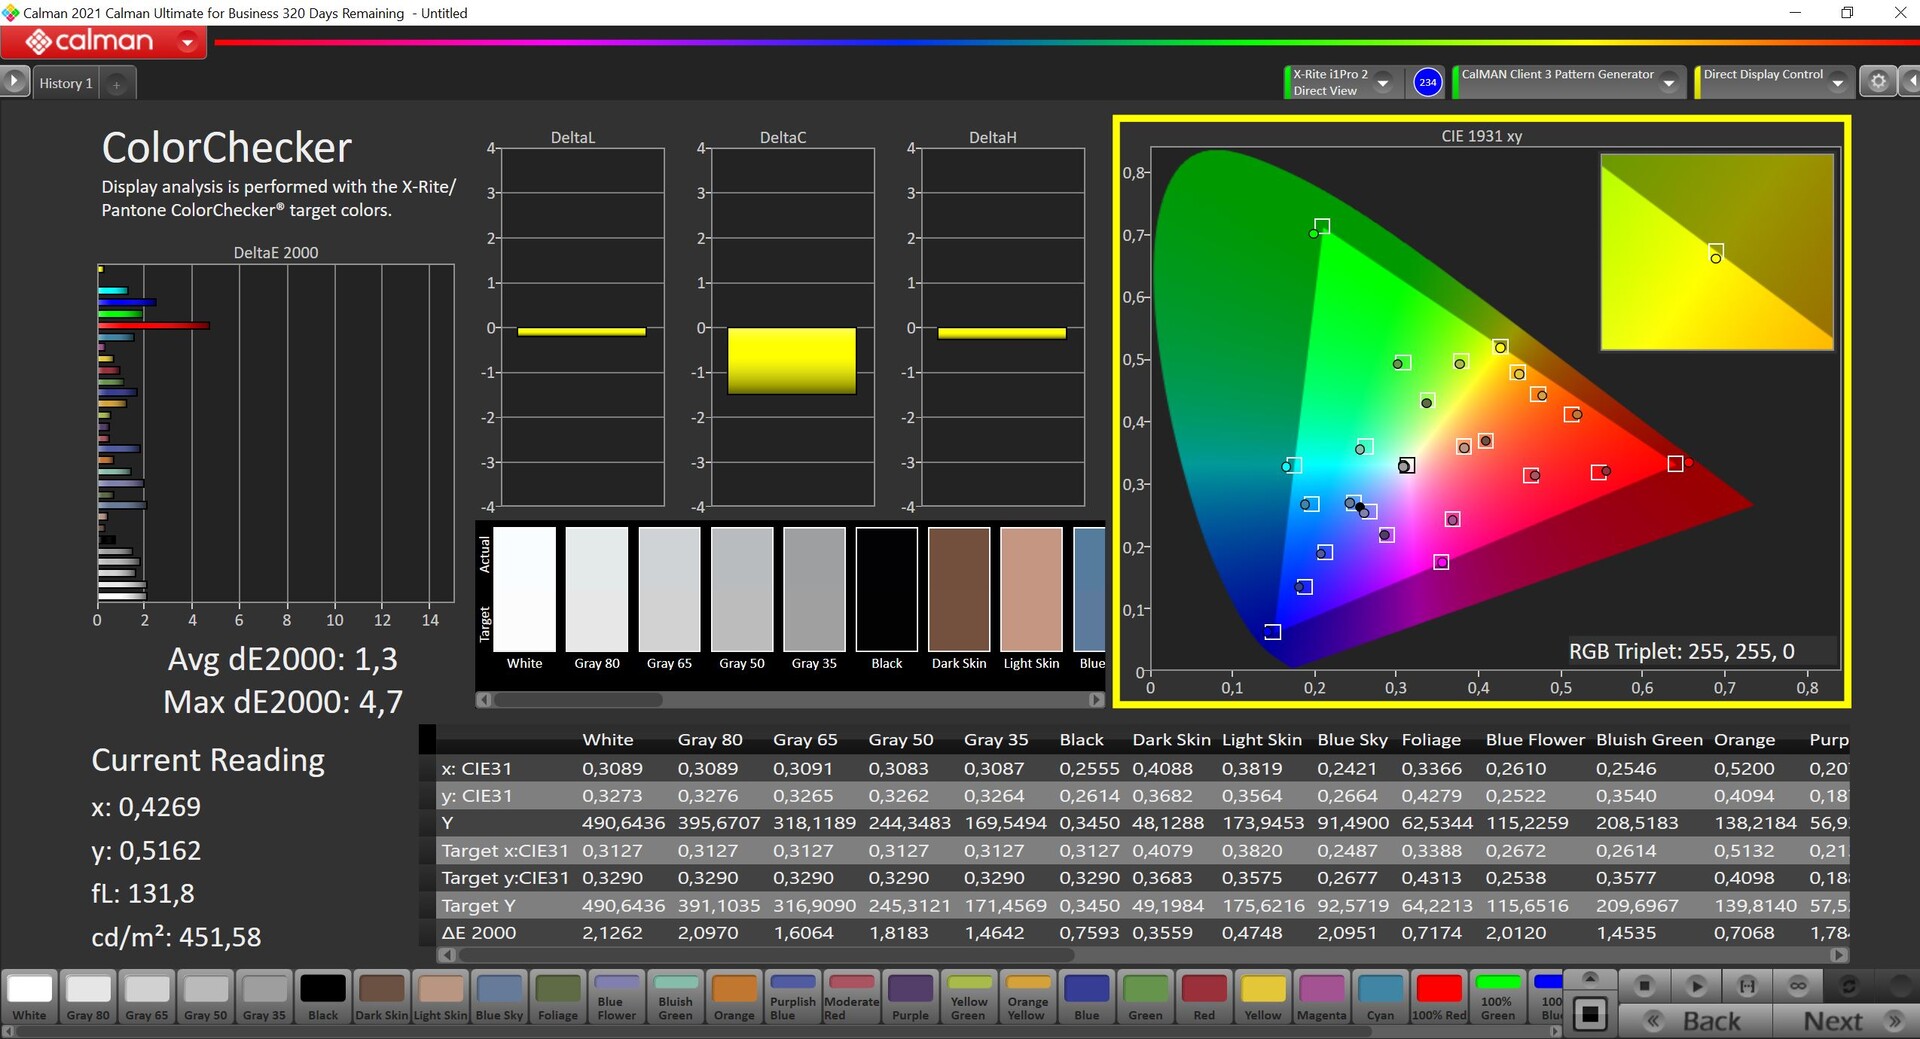
A tela 4K vem com o software X-Rite pré-instalado e oferece vários perfis. Analisamos o display com o software profissional CalMAN-Software (X-Rite i1 Pro 2) utilizando o perfil "Nativo" pré-definido. Não há mudanças indesejadas nas tonalidades de cores em comparação com a referência AdobeRGB, os desvios médios de escala de cinza DeltaE 2000 estão abaixo do valor alvo de 3. Isto também se aplica às cores, com apenas 100% de vermelho mostrando um forte desvio. Conseguimos reduzir isto com nossa própria calibração, mesmo que os outros desvios sejam menores. Portanto, a calibração posterior não é necessária, tornando o painel também muito adequado para a edição de imagens devido a sua cobertura quase 100% AdobeRGB.
Exibir tempos de resposta
| ↔ Tempo de resposta preto para branco | ||
|---|---|---|
| 19.2 ms ... ascensão ↗ e queda ↘ combinadas | ↗ 6 ms ascensão | 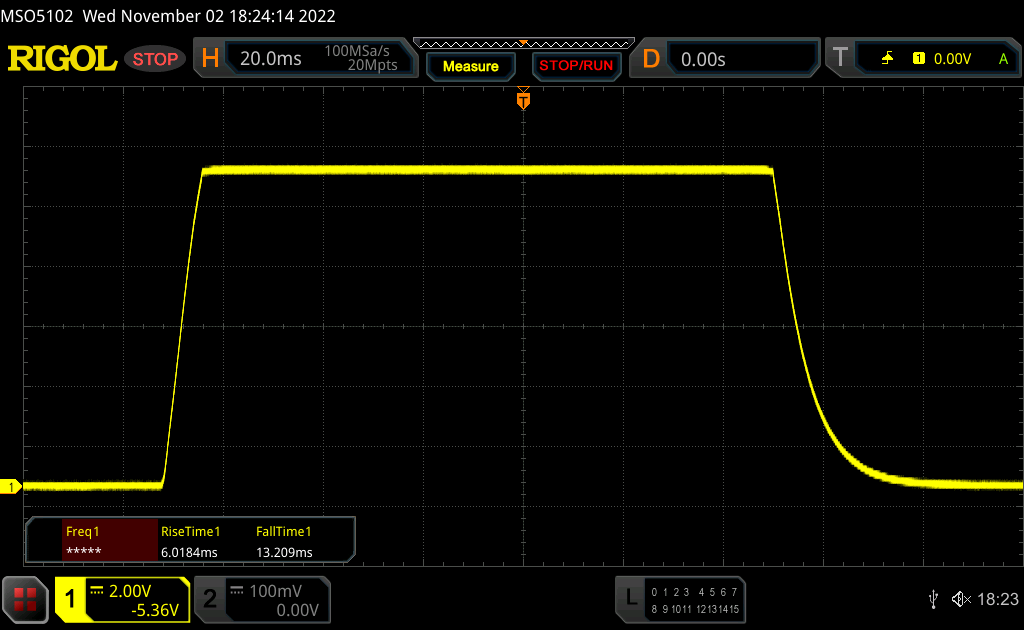 |
| ↘ 13.2 ms queda | ||
| A tela mostra boas taxas de resposta em nossos testes, mas pode ser muito lenta para jogadores competitivos. Em comparação, todos os dispositivos testados variam de 0.1 (mínimo) a 240 (máximo) ms. » 42 % de todos os dispositivos são melhores. Isso significa que o tempo de resposta medido é semelhante à média de todos os dispositivos testados (19.9 ms). | ||
| ↔ Tempo de resposta 50% cinza a 80% cinza | ||
| 46 ms ... ascensão ↗ e queda ↘ combinadas | ↗ 21.2 ms ascensão | 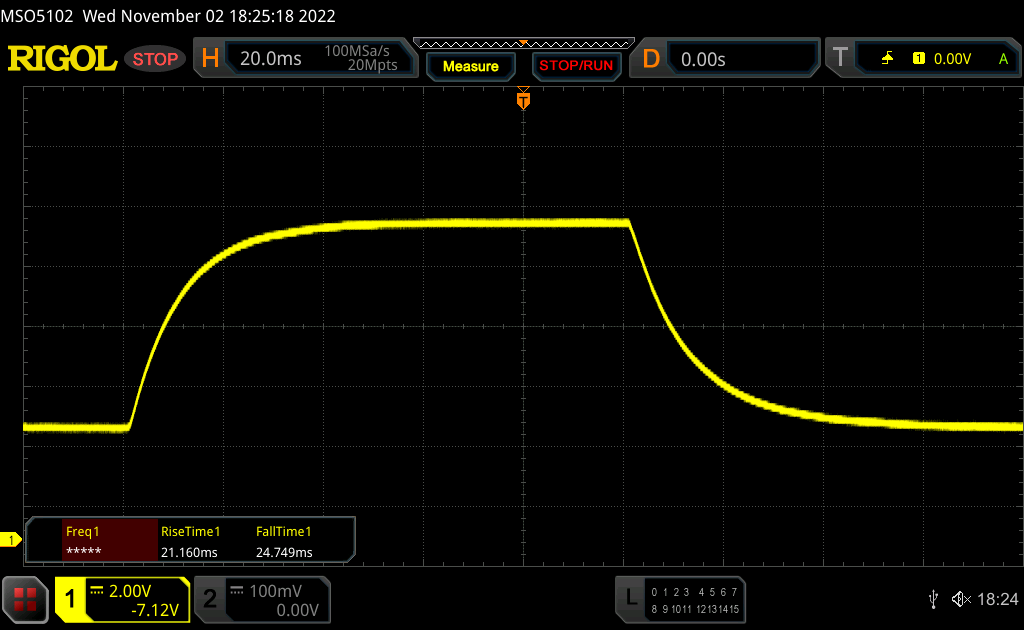 |
| ↘ 24.8 ms queda | ||
| A tela mostra taxas de resposta lentas em nossos testes e será insatisfatória para os jogadores. Em comparação, todos os dispositivos testados variam de 0.165 (mínimo) a 636 (máximo) ms. » 79 % de todos os dispositivos são melhores. Isso significa que o tempo de resposta medido é pior que a média de todos os dispositivos testados (31.1 ms). | ||
Cintilação da tela / PWM (modulação por largura de pulso)
| Tela tremeluzindo / PWM não detectado | 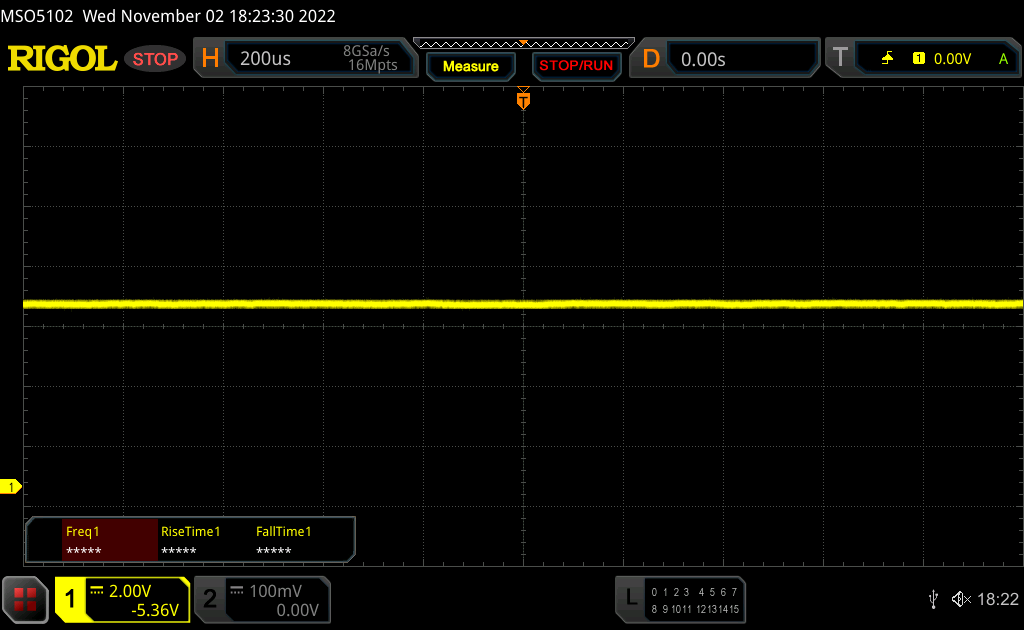 | ||
[pwm_comparison] Em comparação: 52 % de todos os dispositivos testados não usam PWM para escurecer a tela. Se PWM foi detectado, uma média de 7784 (mínimo: 5 - máximo: 343500) Hz foi medida. | |||
Ao ar livre - e especialmente em dias brilhantes - pode ser difícil trabalhar confortavelmente, pois o visor brilhante é inevitavelmente muito reflexivo. X1 Os usuários do Extreme G5 que muitas vezes se encontram trabalhando em movimento ficariam melhor considerando uma configuração com um painel fosco. No entanto, não se pode encontrar nenhuma falha com a estabilidade do ângulo de visão do painel IPS.

Desempenho - X1 Extreme G5 opcionalmente com o RTX 3080 Ti
O ThinkPad X1 Extreme G5 está disponível com uma gama de processadores Intel, incluindo os modelos opcionais vPro. As placas gráficas começam com oGeForce RTX 3050 Tie ir até oRTX 3080 Ti. Para GPUs profissionais, vale a pena dar uma olhada no ThinkPad P1 G5. Nosso dispositivo de revisão veio equipado com um único módulo de RAM (32 GB) e opera somente em modo monocanal.
Condições de teste
Em vez de oferecer perfis de energia adicionais, a Lenovo liga as configurações às configurações de energia regulares do Windows e é muito conveniente na prática. Ao contrário de alguns ThinkPads AMD, não há como ativar ou desativar a função de "resfriamento inteligente".
Processador - Core i7-12700H
ONúcleo i7-12700Hpertence à atual geração Alder Lake da Intel e oferece 6 núcleos de desempenho, bem como 8 núcleos de eficiência. Para uso curto, o processador ThinkPad utiliza 112 watts e 80 watts durante o uso prolongado, razão pela qual os resultados de referência são bons, mesmo sob carga mais longa. Por este motivo, o ThinkPad pertence aos modelos mais rápidos do nosso grupo de comparação. Quando todos os padrões de referência de CPU são levados em consideração, o X1 Extreme G5 está 28 % à frente de seu predecessor com os mais velhos Revisão do laptop Lenovo ThinkPad X1 Extreme Gen 4: Performance flagship com tela 16:10 touchscreenNúcleo i7-11800H. Isto onde as capacidades de resfriamento mais fortes da pasta térmica de metal líquido realmente compensam
O processador ainda usa cerca de 70 watts em modo de bateria, fazendo com que o desempenho nos testes multi-core caia apenas 13%; o desempenho de um único núcleo não é afetado. Benchmarks adicionais da CPU podem ser encontrados em nossa seção técnica.
Cinebench R15 Multi endurance test
Cinebench R23: Multi Core | Single Core
Cinebench R20: CPU (Multi Core) | CPU (Single Core)
Cinebench R15: CPU Multi 64Bit | CPU Single 64Bit
Blender: v2.79 BMW27 CPU
7-Zip 18.03: 7z b 4 | 7z b 4 -mmt1
Geekbench 5.5: Multi-Core | Single-Core
HWBOT x265 Benchmark v2.2: 4k Preset
LibreOffice : 20 Documents To PDF
R Benchmark 2.5: Overall mean
| CPU Performance rating | |
| Lenovo ThinkPad X1 Extreme G5-21DE003RGE | |
| Média da turma Multimedia | |
| Dell XPS 17 9720 RTX 3060 | |
| Média Intel Core i7-12700H | |
| Dell XPS 15 9520 RTX 3050 Ti | |
| HP Envy 16 h0112nr | |
| Schenker Vision 16 Pro RTX 3070 Ti | |
| Apple MacBook Pro 16 2021 M1 Pro -5! | |
| Lenovo ThinkPad X1 Extreme G4-20Y5CTO1WW (3050 Ti) | |
| Cinebench R23 / Multi Core | |
| Lenovo ThinkPad X1 Extreme G5-21DE003RGE | |
| Dell XPS 17 9720 RTX 3060 | |
| Média da turma Multimedia (4861 - 33362, n=81, últimos 2 anos) | |
| Média Intel Core i7-12700H (4032 - 19330, n=64) | |
| Dell XPS 15 9520 RTX 3050 Ti | |
| HP Envy 16 h0112nr | |
| Schenker Vision 16 Pro RTX 3070 Ti | |
| Lenovo ThinkPad X1 Extreme G4-20Y5CTO1WW (3050 Ti) | |
| Apple MacBook Pro 16 2021 M1 Pro | |
| Cinebench R23 / Single Core | |
| Média da turma Multimedia (1128 - 2459, n=73, últimos 2 anos) | |
| Lenovo ThinkPad X1 Extreme G5-21DE003RGE | |
| Schenker Vision 16 Pro RTX 3070 Ti | |
| Dell XPS 15 9520 RTX 3050 Ti | |
| HP Envy 16 h0112nr | |
| Dell XPS 17 9720 RTX 3060 | |
| Média Intel Core i7-12700H (778 - 1826, n=63) | |
| Apple MacBook Pro 16 2021 M1 Pro | |
| Lenovo ThinkPad X1 Extreme G4-20Y5CTO1WW (3050 Ti) | |
| Cinebench R20 / CPU (Multi Core) | |
| Lenovo ThinkPad X1 Extreme G5-21DE003RGE | |
| Dell XPS 17 9720 RTX 3060 | |
| Média da turma Multimedia (1887 - 12912, n=64, últimos 2 anos) | |
| Média Intel Core i7-12700H (1576 - 7407, n=64) | |
| Dell XPS 15 9520 RTX 3050 Ti | |
| HP Envy 16 h0112nr | |
| Schenker Vision 16 Pro RTX 3070 Ti | |
| Lenovo ThinkPad X1 Extreme G4-20Y5CTO1WW (3050 Ti) | |
| Apple MacBook Pro 16 2021 M1 Pro | |
| Cinebench R20 / CPU (Single Core) | |
| Média da turma Multimedia (425 - 853, n=64, últimos 2 anos) | |
| Lenovo ThinkPad X1 Extreme G5-21DE003RGE | |
| Schenker Vision 16 Pro RTX 3070 Ti | |
| HP Envy 16 h0112nr | |
| Dell XPS 15 9520 RTX 3050 Ti | |
| Média Intel Core i7-12700H (300 - 704, n=64) | |
| Dell XPS 17 9720 RTX 3060 | |
| Lenovo ThinkPad X1 Extreme G4-20Y5CTO1WW (3050 Ti) | |
| Apple MacBook Pro 16 2021 M1 Pro | |
| Cinebench R15 / CPU Multi 64Bit | |
| Lenovo ThinkPad X1 Extreme G5-21DE003RGE | |
| Schenker Vision 16 Pro RTX 3070 Ti | |
| Schenker Vision 16 Pro RTX 3070 Ti | |
| Média da turma Multimedia (856 - 5224, n=68, últimos 2 anos) | |
| HP Envy 16 h0112nr | |
| Média Intel Core i7-12700H (1379 - 2916, n=70) | |
| Dell XPS 17 9720 RTX 3060 | |
| Dell XPS 15 9520 RTX 3050 Ti | |
| Lenovo ThinkPad X1 Extreme G4-20Y5CTO1WW (3050 Ti) | |
| Apple MacBook Pro 16 2021 M1 Pro | |
| Cinebench R15 / CPU Single 64Bit | |
| Média da turma Multimedia (184.8 - 326, n=66, últimos 2 anos) | |
| Schenker Vision 16 Pro RTX 3070 Ti | |
| Lenovo ThinkPad X1 Extreme G5-21DE003RGE | |
| HP Envy 16 h0112nr | |
| Dell XPS 17 9720 RTX 3060 | |
| Média Intel Core i7-12700H (113 - 263, n=65) | |
| Dell XPS 15 9520 RTX 3050 Ti | |
| Lenovo ThinkPad X1 Extreme G4-20Y5CTO1WW (3050 Ti) | |
| Apple MacBook Pro 16 2021 M1 Pro | |
| Blender / v2.79 BMW27 CPU | |
| Schenker Vision 16 Pro RTX 3070 Ti | |
| Lenovo ThinkPad X1 Extreme G4-20Y5CTO1WW (3050 Ti) | |
| HP Envy 16 h0112nr | |
| Média da turma Multimedia (100 - 557, n=65, últimos 2 anos) | |
| Dell XPS 15 9520 RTX 3050 Ti | |
| Média Intel Core i7-12700H (168 - 732, n=63) | |
| Dell XPS 17 9720 RTX 3060 | |
| Lenovo ThinkPad X1 Extreme G5-21DE003RGE | |
| Apple MacBook Pro 16 2021 M1 Pro | |
| 7-Zip 18.03 / 7z b 4 | |
| Dell XPS 17 9720 RTX 3060 | |
| Lenovo ThinkPad X1 Extreme G5-21DE003RGE | |
| Dell XPS 15 9520 RTX 3050 Ti | |
| Média Intel Core i7-12700H (22844 - 73067, n=63) | |
| Média da turma Multimedia (29095 - 130368, n=62, últimos 2 anos) | |
| HP Envy 16 h0112nr | |
| Schenker Vision 16 Pro RTX 3070 Ti | |
| Lenovo ThinkPad X1 Extreme G4-20Y5CTO1WW (3050 Ti) | |
| 7-Zip 18.03 / 7z b 4 -mmt1 | |
| Média da turma Multimedia (3666 - 7545, n=63, últimos 2 anos) | |
| Lenovo ThinkPad X1 Extreme G5-21DE003RGE | |
| Schenker Vision 16 Pro RTX 3070 Ti | |
| Dell XPS 15 9520 RTX 3050 Ti | |
| HP Envy 16 h0112nr | |
| Dell XPS 17 9720 RTX 3060 | |
| Média Intel Core i7-12700H (2743 - 5972, n=63) | |
| Lenovo ThinkPad X1 Extreme G4-20Y5CTO1WW (3050 Ti) | |
| Geekbench 5.5 / Multi-Core | |
| Média da turma Multimedia (4652 - 20422, n=62, últimos 2 anos) | |
| HP Envy 16 h0112nr | |
| Apple MacBook Pro 16 2021 M1 Pro | |
| Dell XPS 17 9720 RTX 3060 | |
| Dell XPS 15 9520 RTX 3050 Ti | |
| Lenovo ThinkPad X1 Extreme G5-21DE003RGE | |
| Média Intel Core i7-12700H (5144 - 13745, n=64) | |
| Schenker Vision 16 Pro RTX 3070 Ti | |
| Lenovo ThinkPad X1 Extreme G4-20Y5CTO1WW (3050 Ti) | |
| Geekbench 5.5 / Single-Core | |
| Média da turma Multimedia (805 - 2974, n=62, últimos 2 anos) | |
| Schenker Vision 16 Pro RTX 3070 Ti | |
| Lenovo ThinkPad X1 Extreme G5-21DE003RGE | |
| HP Envy 16 h0112nr | |
| Dell XPS 15 9520 RTX 3050 Ti | |
| Apple MacBook Pro 16 2021 M1 Pro | |
| Média Intel Core i7-12700H (803 - 1851, n=64) | |
| Dell XPS 17 9720 RTX 3060 | |
| Lenovo ThinkPad X1 Extreme G4-20Y5CTO1WW (3050 Ti) | |
| HWBOT x265 Benchmark v2.2 / 4k Preset | |
| Média da turma Multimedia (5.26 - 36.1, n=63, últimos 2 anos) | |
| Lenovo ThinkPad X1 Extreme G5-21DE003RGE | |
| Média Intel Core i7-12700H (4.67 - 21.8, n=64) | |
| Dell XPS 17 9720 RTX 3060 | |
| Dell XPS 15 9520 RTX 3050 Ti | |
| HP Envy 16 h0112nr | |
| Schenker Vision 16 Pro RTX 3070 Ti | |
| Lenovo ThinkPad X1 Extreme G4-20Y5CTO1WW (3050 Ti) | |
| LibreOffice / 20 Documents To PDF | |
| Média da turma Multimedia (23.9 - 146.7, n=64, últimos 2 anos) | |
| Média Intel Core i7-12700H (34.2 - 95.3, n=63) | |
| HP Envy 16 h0112nr | |
| Schenker Vision 16 Pro RTX 3070 Ti | |
| Dell XPS 17 9720 RTX 3060 | |
| Lenovo ThinkPad X1 Extreme G4-20Y5CTO1WW (3050 Ti) | |
| Dell XPS 15 9520 RTX 3050 Ti | |
| Lenovo ThinkPad X1 Extreme G5-21DE003RGE | |
| R Benchmark 2.5 / Overall mean | |
| Lenovo ThinkPad X1 Extreme G4-20Y5CTO1WW (3050 Ti) | |
| Média Intel Core i7-12700H (0.4441 - 1.052, n=63) | |
| Média da turma Multimedia (0.3604 - 0.947, n=63, últimos 2 anos) | |
| Lenovo ThinkPad X1 Extreme G5-21DE003RGE | |
| Dell XPS 17 9720 RTX 3060 | |
| HP Envy 16 h0112nr | |
| Schenker Vision 16 Pro RTX 3070 Ti | |
| Dell XPS 15 9520 RTX 3050 Ti | |
* ... menor é melhor
AIDA64: FP32 Ray-Trace | FPU Julia | CPU SHA3 | CPU Queen | FPU SinJulia | FPU Mandel | CPU AES | CPU ZLib | FP64 Ray-Trace | CPU PhotoWorxx
| Performance rating | |
| Média da turma Multimedia | |
| Lenovo ThinkPad X1 Extreme G5-21DE003RGE | |
| Lenovo ThinkPad X1 Extreme G4-20Y5CTO1WW (3050 Ti) | |
| HP Envy 16 h0112nr | |
| Schenker Vision 16 Pro RTX 3070 Ti | |
| Média Intel Core i7-12700H | |
| Dell XPS 17 9720 RTX 3060 | |
| Dell XPS 15 9520 RTX 3050 Ti | |
| AIDA64 / FP32 Ray-Trace | |
| Média da turma Multimedia (2214 - 50388, n=60, últimos 2 anos) | |
| Lenovo ThinkPad X1 Extreme G5-21DE003RGE | |
| Lenovo ThinkPad X1 Extreme G4-20Y5CTO1WW (3050 Ti) | |
| Schenker Vision 16 Pro RTX 3070 Ti | |
| HP Envy 16 h0112nr | |
| Média Intel Core i7-12700H (2585 - 17957, n=64) | |
| Dell XPS 15 9520 RTX 3050 Ti | |
| Dell XPS 17 9720 RTX 3060 | |
| AIDA64 / FPU Julia | |
| Média da turma Multimedia (12867 - 201874, n=61, últimos 2 anos) | |
| Lenovo ThinkPad X1 Extreme G5-21DE003RGE | |
| Schenker Vision 16 Pro RTX 3070 Ti | |
| Lenovo ThinkPad X1 Extreme G4-20Y5CTO1WW (3050 Ti) | |
| HP Envy 16 h0112nr | |
| Média Intel Core i7-12700H (12439 - 90760, n=64) | |
| Dell XPS 17 9720 RTX 3060 | |
| Dell XPS 15 9520 RTX 3050 Ti | |
| AIDA64 / CPU SHA3 | |
| Lenovo ThinkPad X1 Extreme G4-20Y5CTO1WW (3050 Ti) | |
| Média da turma Multimedia (653 - 8623, n=61, últimos 2 anos) | |
| Lenovo ThinkPad X1 Extreme G5-21DE003RGE | |
| Média Intel Core i7-12700H (833 - 4242, n=64) | |
| Schenker Vision 16 Pro RTX 3070 Ti | |
| HP Envy 16 h0112nr | |
| Dell XPS 15 9520 RTX 3050 Ti | |
| Dell XPS 17 9720 RTX 3060 | |
| AIDA64 / CPU Queen | |
| Lenovo ThinkPad X1 Extreme G5-21DE003RGE | |
| HP Envy 16 h0112nr | |
| Dell XPS 17 9720 RTX 3060 | |
| Dell XPS 15 9520 RTX 3050 Ti | |
| Média Intel Core i7-12700H (57923 - 103202, n=63) | |
| Lenovo ThinkPad X1 Extreme G4-20Y5CTO1WW (3050 Ti) | |
| Schenker Vision 16 Pro RTX 3070 Ti | |
| Média da turma Multimedia (13483 - 181505, n=49, últimos 2 anos) | |
| AIDA64 / FPU SinJulia | |
| Lenovo ThinkPad X1 Extreme G5-21DE003RGE | |
| Lenovo ThinkPad X1 Extreme G4-20Y5CTO1WW (3050 Ti) | |
| Média da turma Multimedia (1240 - 28794, n=61, últimos 2 anos) | |
| Média Intel Core i7-12700H (3249 - 9939, n=64) | |
| Dell XPS 17 9720 RTX 3060 | |
| Dell XPS 15 9520 RTX 3050 Ti | |
| Schenker Vision 16 Pro RTX 3070 Ti | |
| HP Envy 16 h0112nr | |
| AIDA64 / FPU Mandel | |
| Média da turma Multimedia (6395 - 105740, n=60, últimos 2 anos) | |
| Lenovo ThinkPad X1 Extreme G5-21DE003RGE | |
| Lenovo ThinkPad X1 Extreme G4-20Y5CTO1WW (3050 Ti) | |
| Schenker Vision 16 Pro RTX 3070 Ti | |
| HP Envy 16 h0112nr | |
| Média Intel Core i7-12700H (7135 - 44760, n=64) | |
| Dell XPS 15 9520 RTX 3050 Ti | |
| Dell XPS 17 9720 RTX 3060 | |
| AIDA64 / CPU AES | |
| Lenovo ThinkPad X1 Extreme G4-20Y5CTO1WW (3050 Ti) | |
| HP Envy 16 h0112nr | |
| Média Intel Core i7-12700H (31839 - 144360, n=64) | |
| Dell XPS 15 9520 RTX 3050 Ti | |
| Dell XPS 17 9720 RTX 3060 | |
| Lenovo ThinkPad X1 Extreme G5-21DE003RGE | |
| Média da turma Multimedia (13243 - 126790, n=61, últimos 2 anos) | |
| Schenker Vision 16 Pro RTX 3070 Ti | |
| AIDA64 / CPU ZLib | |
| Lenovo ThinkPad X1 Extreme G5-21DE003RGE | |
| Média da turma Multimedia (167.2 - 2022, n=61, últimos 2 anos) | |
| Média Intel Core i7-12700H (305 - 1171, n=64) | |
| Dell XPS 17 9720 RTX 3060 | |
| Schenker Vision 16 Pro RTX 3070 Ti | |
| Dell XPS 15 9520 RTX 3050 Ti | |
| HP Envy 16 h0112nr | |
| Lenovo ThinkPad X1 Extreme G4-20Y5CTO1WW (3050 Ti) | |
| AIDA64 / FP64 Ray-Trace | |
| Média da turma Multimedia (1014 - 26875, n=61, últimos 2 anos) | |
| Lenovo ThinkPad X1 Extreme G5-21DE003RGE | |
| Lenovo ThinkPad X1 Extreme G4-20Y5CTO1WW (3050 Ti) | |
| Schenker Vision 16 Pro RTX 3070 Ti | |
| HP Envy 16 h0112nr | |
| Média Intel Core i7-12700H (1437 - 9692, n=64) | |
| Dell XPS 15 9520 RTX 3050 Ti | |
| Dell XPS 17 9720 RTX 3060 | |
| AIDA64 / CPU PhotoWorxx | |
| Média da turma Multimedia (12860 - 88154, n=61, últimos 2 anos) | |
| Schenker Vision 16 Pro RTX 3070 Ti | |
| Dell XPS 17 9720 RTX 3060 | |
| HP Envy 16 h0112nr | |
| Dell XPS 15 9520 RTX 3050 Ti | |
| Média Intel Core i7-12700H (12863 - 52207, n=64) | |
| Lenovo ThinkPad X1 Extreme G5-21DE003RGE | |
| Lenovo ThinkPad X1 Extreme G4-20Y5CTO1WW (3050 Ti) | |
Desempenho do sistema
O ThinkPad X1 Extreme G5 é basicamente um dispositivo muito rápido e responsivo, mas a ausência de uma configuração de RAM de canal duplo é perceptível, especialmente em testes sintéticos. Embora seja possível atualizar facilmente a RAM, os 32 GB a bordo devem ser mais do que suficientes, mesmo para a maioria dos usuários. Entretanto, uma configuração de fábrica de 2 x 16 GB teria sido uma escolha mais sensata. Como mencionado logo no início, tivemos problemas ocasionais de desempenho com o Windows 10 e, por esta razão, recomendamos uma atualização para o Windows 11 Pro.
CrossMark: Overall | Productivity | Creativity | Responsiveness
| PCMark 10 / Score | |
| Média da turma Multimedia (4325 - 10386, n=58, últimos 2 anos) | |
| HP Envy 16 h0112nr | |
| Dell XPS 17 9720 RTX 3060 | |
| Lenovo ThinkPad X1 Extreme G5-21DE003RGE | |
| Média Intel Core i7-12700H, NVIDIA GeForce RTX 3060 Laptop GPU (5986 - 8156, n=12) | |
| Dell XPS 15 9520 RTX 3050 Ti | |
| Lenovo ThinkPad X1 Extreme G4-20Y5CTO1WW (3050 Ti) | |
| PCMark 10 / Essentials | |
| HP Envy 16 h0112nr | |
| Dell XPS 15 9520 RTX 3050 Ti | |
| Lenovo ThinkPad X1 Extreme G4-20Y5CTO1WW (3050 Ti) | |
| Dell XPS 17 9720 RTX 3060 | |
| Média Intel Core i7-12700H, NVIDIA GeForce RTX 3060 Laptop GPU (9289 - 12144, n=12) | |
| Lenovo ThinkPad X1 Extreme G5-21DE003RGE | |
| Média da turma Multimedia (8025 - 11664, n=57, últimos 2 anos) | |
| PCMark 10 / Productivity | |
| Média da turma Multimedia (7323 - 18233, n=57, últimos 2 anos) | |
| Dell XPS 15 9520 RTX 3050 Ti | |
| Dell XPS 17 9720 RTX 3060 | |
| Lenovo ThinkPad X1 Extreme G5-21DE003RGE | |
| HP Envy 16 h0112nr | |
| Média Intel Core i7-12700H, NVIDIA GeForce RTX 3060 Laptop GPU (6161 - 10362, n=12) | |
| Lenovo ThinkPad X1 Extreme G4-20Y5CTO1WW (3050 Ti) | |
| PCMark 10 / Digital Content Creation | |
| Média Intel Core i7-12700H, NVIDIA GeForce RTX 3060 Laptop GPU (8950 - 12554, n=12) | |
| HP Envy 16 h0112nr | |
| Lenovo ThinkPad X1 Extreme G5-21DE003RGE | |
| Média da turma Multimedia (3651 - 16240, n=57, últimos 2 anos) | |
| Dell XPS 17 9720 RTX 3060 | |
| Dell XPS 15 9520 RTX 3050 Ti | |
| Lenovo ThinkPad X1 Extreme G4-20Y5CTO1WW (3050 Ti) | |
| CrossMark / Overall | |
| Dell XPS 17 9720 RTX 3060 | |
| Dell XPS 15 9520 RTX 3050 Ti | |
| Média da turma Multimedia (866 - 2728, n=67, últimos 2 anos) | |
| HP Envy 16 h0112nr | |
| Média Intel Core i7-12700H, NVIDIA GeForce RTX 3060 Laptop GPU (1649 - 2017, n=11) | |
| Lenovo ThinkPad X1 Extreme G5-21DE003RGE | |
| Schenker Vision 16 Pro RTX 3070 Ti | |
| Apple MacBook Pro 16 2021 M1 Pro | |
| CrossMark / Productivity | |
| Dell XPS 15 9520 RTX 3050 Ti | |
| Dell XPS 17 9720 RTX 3060 | |
| Média da turma Multimedia (931 - 2489, n=67, últimos 2 anos) | |
| HP Envy 16 h0112nr | |
| Média Intel Core i7-12700H, NVIDIA GeForce RTX 3060 Laptop GPU (1536 - 1958, n=11) | |
| Lenovo ThinkPad X1 Extreme G5-21DE003RGE | |
| Schenker Vision 16 Pro RTX 3070 Ti | |
| Apple MacBook Pro 16 2021 M1 Pro | |
| CrossMark / Creativity | |
| Média da turma Multimedia (907 - 3465, n=67, últimos 2 anos) | |
| Dell XPS 17 9720 RTX 3060 | |
| Apple MacBook Pro 16 2021 M1 Pro | |
| HP Envy 16 h0112nr | |
| Dell XPS 15 9520 RTX 3050 Ti | |
| Média Intel Core i7-12700H, NVIDIA GeForce RTX 3060 Laptop GPU (1816 - 2084, n=11) | |
| Lenovo ThinkPad X1 Extreme G5-21DE003RGE | |
| Schenker Vision 16 Pro RTX 3070 Ti | |
| CrossMark / Responsiveness | |
| Dell XPS 15 9520 RTX 3050 Ti | |
| Dell XPS 17 9720 RTX 3060 | |
| Média Intel Core i7-12700H, NVIDIA GeForce RTX 3060 Laptop GPU (1210 - 2207, n=11) | |
| HP Envy 16 h0112nr | |
| Média da turma Multimedia (605 - 2024, n=67, últimos 2 anos) | |
| Lenovo ThinkPad X1 Extreme G5-21DE003RGE | |
| Schenker Vision 16 Pro RTX 3070 Ti | |
| Apple MacBook Pro 16 2021 M1 Pro | |
| PCMark 10 Score | 7243 pontos | |
Ajuda | ||
| AIDA64 / Memory Copy | |
| Média da turma Multimedia (21158 - 132135, n=61, últimos 2 anos) | |
| Schenker Vision 16 Pro RTX 3070 Ti | |
| Dell XPS 17 9720 RTX 3060 | |
| Dell XPS 15 9520 RTX 3050 Ti | |
| HP Envy 16 h0112nr | |
| Média Intel Core i7-12700H (25615 - 80511, n=64) | |
| Lenovo ThinkPad X1 Extreme G4-20Y5CTO1WW (3050 Ti) | |
| Lenovo ThinkPad X1 Extreme G5-21DE003RGE | |
| AIDA64 / Memory Read | |
| Média da turma Multimedia (19699 - 174586, n=61, últimos 2 anos) | |
| Dell XPS 17 9720 RTX 3060 | |
| HP Envy 16 h0112nr | |
| Schenker Vision 16 Pro RTX 3070 Ti | |
| Dell XPS 15 9520 RTX 3050 Ti | |
| Média Intel Core i7-12700H (25586 - 79442, n=64) | |
| Lenovo ThinkPad X1 Extreme G4-20Y5CTO1WW (3050 Ti) | |
| Lenovo ThinkPad X1 Extreme G5-21DE003RGE | |
| AIDA64 / Memory Write | |
| Média da turma Multimedia (17733 - 134998, n=61, últimos 2 anos) | |
| Schenker Vision 16 Pro RTX 3070 Ti | |
| Dell XPS 17 9720 RTX 3060 | |
| HP Envy 16 h0112nr | |
| Dell XPS 15 9520 RTX 3050 Ti | |
| Média Intel Core i7-12700H (23679 - 88660, n=64) | |
| Lenovo ThinkPad X1 Extreme G4-20Y5CTO1WW (3050 Ti) | |
| Lenovo ThinkPad X1 Extreme G5-21DE003RGE | |
| AIDA64 / Memory Latency | |
| Média da turma Multimedia (7 - 535, n=60, últimos 2 anos) | |
| Dell XPS 15 9520 RTX 3050 Ti | |
| Dell XPS 17 9720 RTX 3060 | |
| Schenker Vision 16 Pro RTX 3070 Ti | |
| HP Envy 16 h0112nr | |
| Lenovo ThinkPad X1 Extreme G5-21DE003RGE | |
| Lenovo ThinkPad X1 Extreme G4-20Y5CTO1WW (3050 Ti) | |
| Média Intel Core i7-12700H (76.2 - 133.9, n=62) | |
* ... menor é melhor
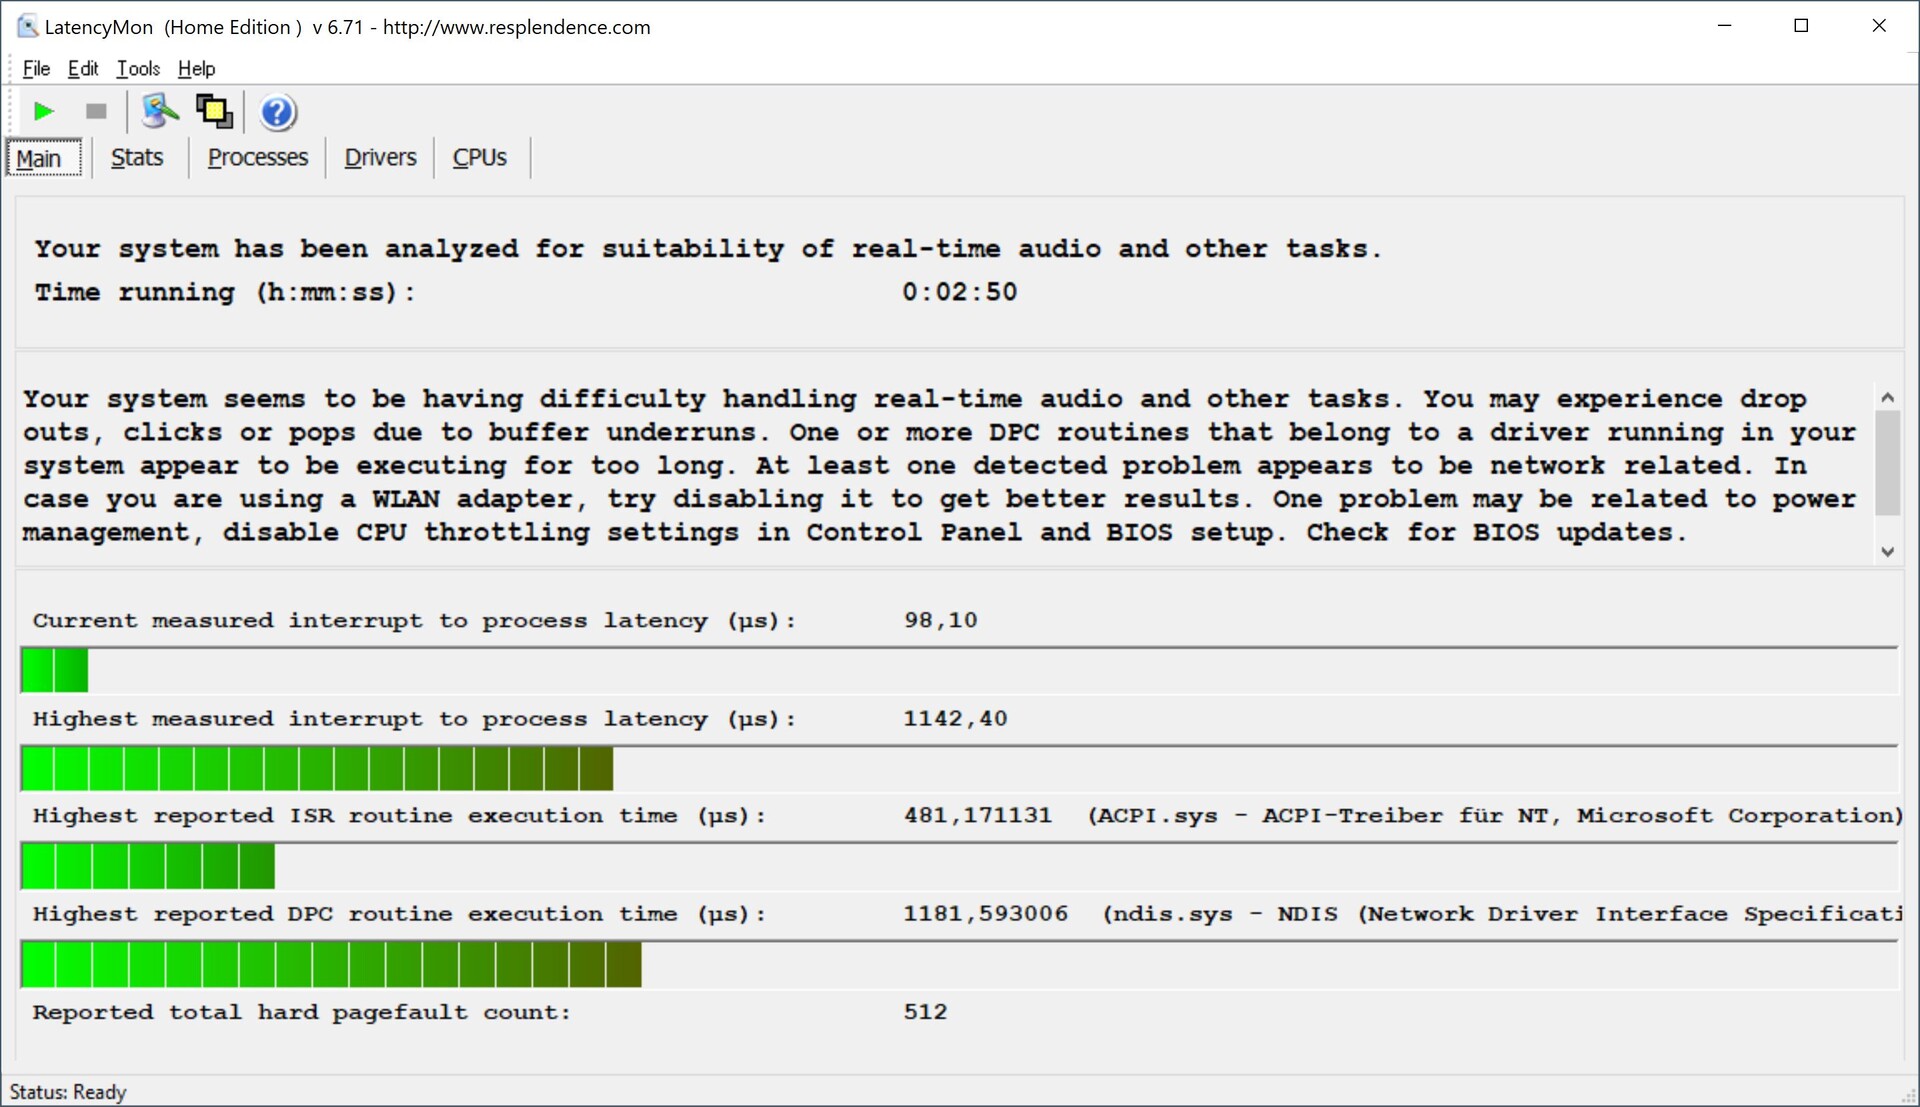
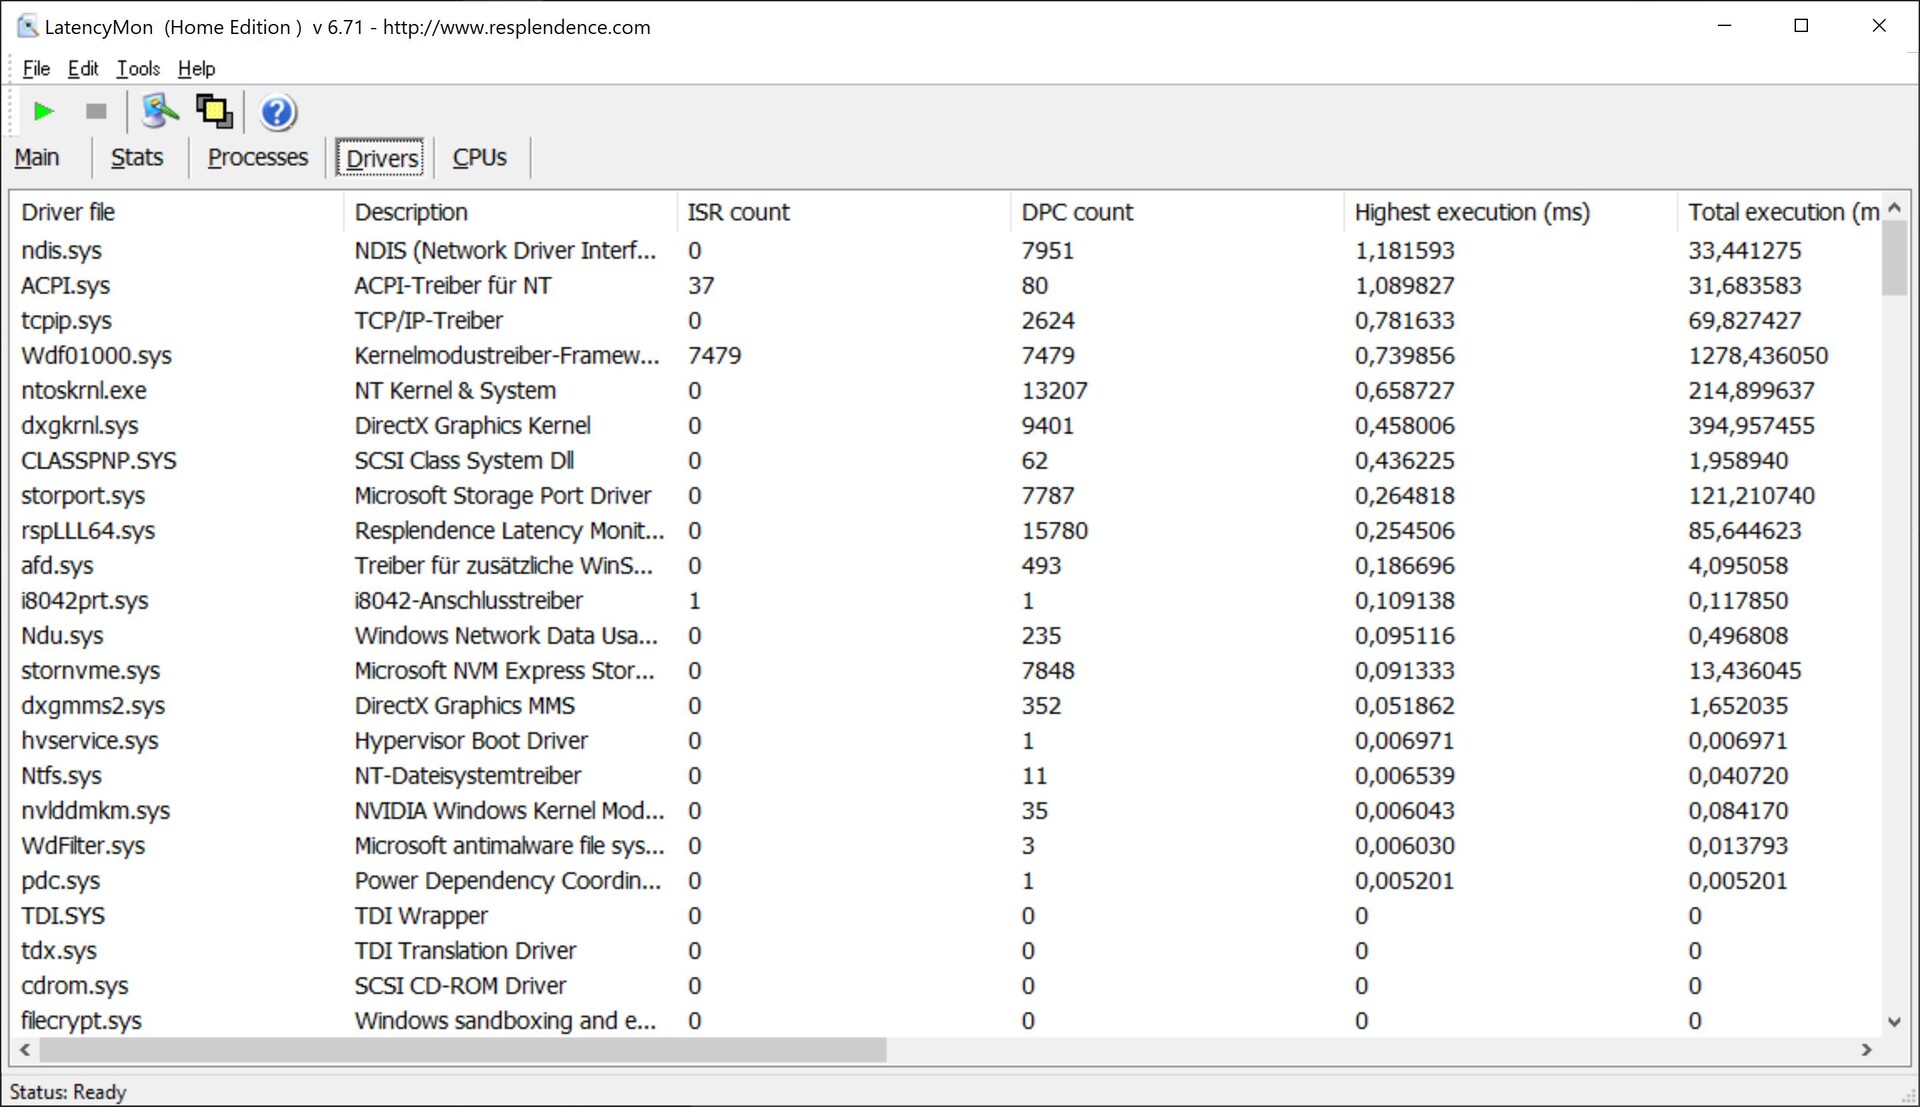
Latências DPC
Em nosso teste de latência padronizado (navegação na Internet, reprodução 4K no YouTube, carga de CPU), o dispositivo de revisão demonstra algumas limitações com a atual versão BIOS e, portanto, é mais adequado para o uso de aplicações de áudio em tempo real.
| DPC Latencies / LatencyMon - interrupt to process latency (max), Web, Youtube, Prime95 | |
| Lenovo ThinkPad X1 Extreme G5-21DE003RGE | |
| Lenovo ThinkPad X1 Extreme G4-20Y5CTO1WW (3050 Ti) | |
| Dell XPS 15 9520 RTX 3050 Ti | |
| HP Envy 16 h0112nr | |
| Schenker Vision 16 Pro RTX 3070 Ti | |
| Dell XPS 17 9720 RTX 3060 | |
* ... menor é melhor
Armazenamento em massa
Em nosso dispositivo de revisão, a Lenovo equipou o X1 Extreme G5 com um rápido SSD PCIe 4.0 da Micron (3400) fornecendo uma capacidade de armazenamento de 1 TB a partir do qual 900 GB estão disponíveis após a primeira instalação. No total, estão disponíveis unidades PCIe 4.0 um pouco mais rápidas, porém, a diferença na prática é insignificante, com o dispositivo também permanecendo completamente estável durante uma carga mais longa. Benchmarks adicionais de SSD podem ser encontrados aqui.Laptop solid state disks (HDD, SSD) benchmarks

* ... menor é melhor
Continuous load read: DiskSpd Read Loop, Queue Depth 8
Placa gráfica
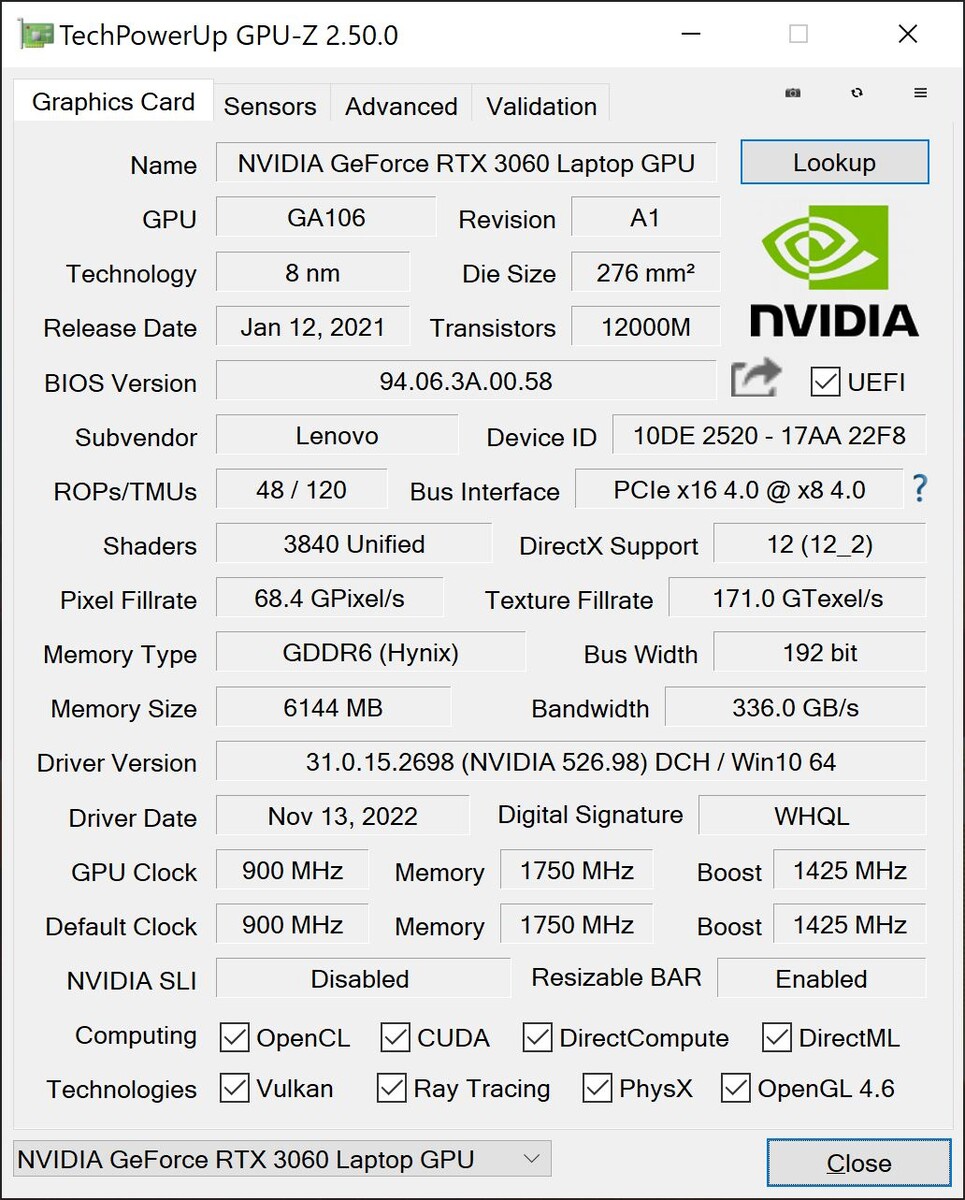
A Lenovo usa a versão de 80 watt doNvidia GeForce RTX 3060. A GPU também pode utilizar um impulso dinâmico de 15 watts, permitindo assim que ela utilize um total de 95 watts. O RTX 3060 fornece 6 GB de GDDR6 VRAM e o sistema pode alternar dinamicamente entre a GPU integrada e dedicada através da tecnologia Optimus. Assumimos que os dois opcionais RTX 3070 Tie RTX 3080 Tias GPUs são as versões mais lentas, pois podem ser usadas com um máximo de 80 e 95 watts, respectivamente
No entanto, os benchmarks mostram rapidamente que o sistema não pode manter 95 watts por muito tempo e a GPU cai rapidamente para 80 watts. Isto explica o leve déficit em comparação com a HP Envy 16que está igualmente equipada com a versão de 90 watts do RTX 3060. Além disso, o ThinkPad não conseguiu alcançar a marca de 91% de aprovação no teste de estresse 3DMark Time Spy. No modo de bateria, há um pequeno déficit de desempenho de aproximadamente 30 %. Benchmarks adicionais da GPU podem ser encontrados aqui.
| 3DMark 11 Performance | 22654 pontos | |
| 3DMark Fire Strike Score | 15945 pontos | |
| 3DMark Time Spy Score | 7111 pontos | |
Ajuda | ||
| Blender / v3.3 Classroom OPTIX/RTX | |
| HP Envy 16 h0112nr | |
| Lenovo ThinkPad X1 Extreme G5-21DE003RGE | |
| Média da turma Multimedia (12 - 105, n=24, últimos 2 anos) | |
| Média NVIDIA GeForce RTX 3060 Laptop GPU (30 - 56, n=15) | |
| Schenker Vision 16 Pro RTX 3070 Ti | |
| Blender / v3.3 Classroom CUDA | |
| HP Envy 16 h0112nr | |
| Lenovo ThinkPad X1 Extreme G5-21DE003RGE | |
| Média da turma Multimedia (20 - 186, n=24, últimos 2 anos) | |
| Média NVIDIA GeForce RTX 3060 Laptop GPU (51 - 89, n=15) | |
| Schenker Vision 16 Pro RTX 3070 Ti | |
| Blender / v3.3 Classroom CPU | |
| HP Envy 16 h0112nr | |
| Schenker Vision 16 Pro RTX 3070 Ti | |
| Média da turma Multimedia (134.5 - 1042, n=68, últimos 2 anos) | |
| Média NVIDIA GeForce RTX 3060 Laptop GPU (291 - 508, n=15) | |
| Lenovo ThinkPad X1 Extreme G5-21DE003RGE | |
* ... menor é melhor
Desempenho nos jogos
Basicamente, o RTX 3060oferece um poder de jogo decente, embora uma queda no desempenho também seja perceptível aqui. A avaliação de nosso loop Witcher 3 demonstra que a placa gráfica só usa um pouco mais de 70 watts assim que o processador é empurrado. A dispendiosa refrigeração da câmara de vapor é um pouco decepcionante. Com seu RTX 3060, o X1 Extreme G5 RTX 3060 se encontra à frente do antigo RTX 3050 Timas por uma margem menor do que a esperada - algo que não é um bom pré-requisito para o modelo mais rápido e mais caro RTX 3070 Ti und RTX 3080 Ti GeForce GPUs.
Geralmente, o RTX 3060 no X1 Extreme G5 oferece desempenho suficiente para configurações de alto, e em alguns casos, máximo detalhe a 1080p e, dependendo do título, até mesmo com resolução QHD. Para resolução nativa de 4K, a GPU é muito fraca. Outros benchmarks de jogos são listados aqui.
| The Witcher 3 - 1920x1080 Ultra Graphics & Postprocessing (HBAO+) | |
| Schenker Vision 16 Pro RTX 3070 Ti | |
| HP Envy 16 h0112nr | |
| Dell XPS 17 9720 RTX 3060 | |
| Lenovo ThinkPad X1 Extreme G5-21DE003RGE | |
| Lenovo ThinkPad X1 Extreme G4-20Y5CTO1WW (3050 Ti) | |
| Média da turma Multimedia (11 - 121, n=13, últimos 2 anos) | |
| Dell XPS 15 9520 RTX 3050 Ti | |
| Final Fantasy XV Benchmark - 1920x1080 High Quality | |
| Schenker Vision 16 Pro RTX 3070 Ti | |
| HP Envy 16 h0112nr | |
| Dell XPS 17 9720 RTX 3060 | |
| Lenovo ThinkPad X1 Extreme G5-21DE003RGE | |
| Média da turma Multimedia (7.61 - 144.4, n=66, últimos 2 anos) | |
| Dell XPS 15 9520 RTX 3050 Ti | |
Witcher 3 FPS diagram
| baixo | média | alto | ultra | QHD | 4K | |
|---|---|---|---|---|---|---|
| GTA V (2015) | 182.6 | 176.9 | 146.8 | 72 | 52 | 42.8 |
| The Witcher 3 (2015) | 313 | 210 | 126 | 60.5 | 26 | |
| Dota 2 Reborn (2015) | 169.6 | 150.7 | 143.2 | 133.4 | 66.1 | |
| Final Fantasy XV Benchmark (2018) | 123.2 | 70.4 | 55 | 41.1 | 22.9 | |
| X-Plane 11.11 (2018) | 135.1 | 110.1 | 91.6 | 58.5 | ||
| Far Cry 5 (2018) | 148 | 106 | 98 | 92 | 58 | 32 |
| Strange Brigade (2018) | 357 | 154.9 | 115.6 | 102.2 | 75.4 | 40 |
| F1 2021 (2021) | 263 | 163.7 | 128.9 | 76.2 | 47.5 | 25.9 |
| Cyberpunk 2077 1.6 (2022) | 80 | 68 | 48 | 40 | 23 | 11 |
| F1 22 (2022) | 144.2 | 135.2 | 112.9 | 36.6 | 22.8 | 10.6 |
Emissões - ventiladores mais silenciosos no modelo G5
Emissões sonoras
As configurações com o GeForce RTX 3060 ou mais rápido vêm com o resfriamento da câmara de vapor da Lenovo. Ambos os ventiladores são normalmente desligados durante o uso ocioso e são geralmente silenciosos ou muito silenciosos com baixa carga. Entretanto, assim que mais é exigido do processador e/ou da placa gráfica, ambos os ventiladores atingem sua velocidade máxima que corresponde a um nível de ruído de 45,5 dB(A). Conseguimos determinar esta medida tanto durante os jogos quanto em nossos testes de estresse. Ao conseguir isto, o novo X1 Extreme G5 é visivelmente mais silencioso do que oModelo G4 com seu RTX 3050 Ti resfriamento convencional
Ventiladores mais silenciosos são, naturalmente, sempre bem-vindos, mas teríamos pelo menos preferido um desempenho mais estável do GPU combinado com ventiladores ligeiramente mais ruidosos usando a configuração de perfil de energia mais rápida. Não fomos capazes de detectar qualquer outro ruído eletrônico.
Barulho
| Ocioso |
| 23.2 / 23.2 / 23.2 dB |
| Carga |
| 45.5 / 45.5 dB |
 | ||
30 dB silencioso 40 dB(A) audível 50 dB(A) ruidosamente alto |
||
min: | ||
| Lenovo ThinkPad X1 Extreme G5-21DE003RGE GeForce RTX 3060 Laptop GPU, i7-12700H, Micron 3400 1TB MTFDKBA1T0TFH | HP Envy 16 h0112nr GeForce RTX 3060 Laptop GPU, i7-12700H, Micron 3400 1TB MTFDKBA1T0TFH | Schenker Vision 16 Pro RTX 3070 Ti GeForce RTX 3070 Ti Laptop GPU, i7-12700H, Samsung SSD 980 Pro 1TB MZ-V8P1T0BW | Dell XPS 15 9520 RTX 3050 Ti GeForce RTX 3050 Ti Laptop GPU, i7-12700H, WDC PC SN810 512GB | Apple MacBook Pro 16 2021 M1 Pro M1 Pro 16-Core GPU, M1 Pro, Apple SSD AP1024R | Dell XPS 17 9720 RTX 3060 GeForce RTX 3060 Laptop GPU, i7-12700H, Samsung PM9A1 MZVL21T0HCLR | Lenovo ThinkPad X1 Extreme G4-20Y5CTO1WW (3050 Ti) GeForce RTX 3050 Ti Laptop GPU, i7-11800H, Samsung PM9A1 MZVL21T0HCLR | |
|---|---|---|---|---|---|---|---|
| Noise | -6% | -3% | 8% | 6% | -3% | -4% | |
| desligado / ambiente * (dB) | 23.2 | 22.8 2% | 22.9 1% | 22.8 2% | 24.7 -6% | 23.8 -3% | 23.52 -1% |
| Idle Minimum * (dB) | 23.2 | 22.9 1% | 24.3 -5% | 22.9 1% | 24.7 -6% | 24.1 -4% | 23.52 -1% |
| Idle Average * (dB) | 23.2 | 22.9 1% | 24.3 -5% | 22.9 1% | 24.7 -6% | 24.1 -4% | 23.52 -1% |
| Idle Maximum * (dB) | 23.2 | 30.5 -31% | 24.3 -5% | 22.9 1% | 24.7 -6% | 24.1 -4% | 23.52 -1% |
| Load Average * (dB) | 45.5 | 41.4 9% | 38.5 15% | 30.9 32% | 26.1 43% | 43.2 5% | 42.9 6% |
| Witcher 3 ultra * (dB) | 45.5 | 51.1 -12% | 51 -12% | 37.8 17% | 48 -5% | 52.5 -15% | |
| Load Maximum * (dB) | 45.5 | 51.4 -13% | 51 -12% | 44.7 2% | 37.4 18% | 48 -5% | 52.45 -15% |
* ... menor é melhor
Temperatura

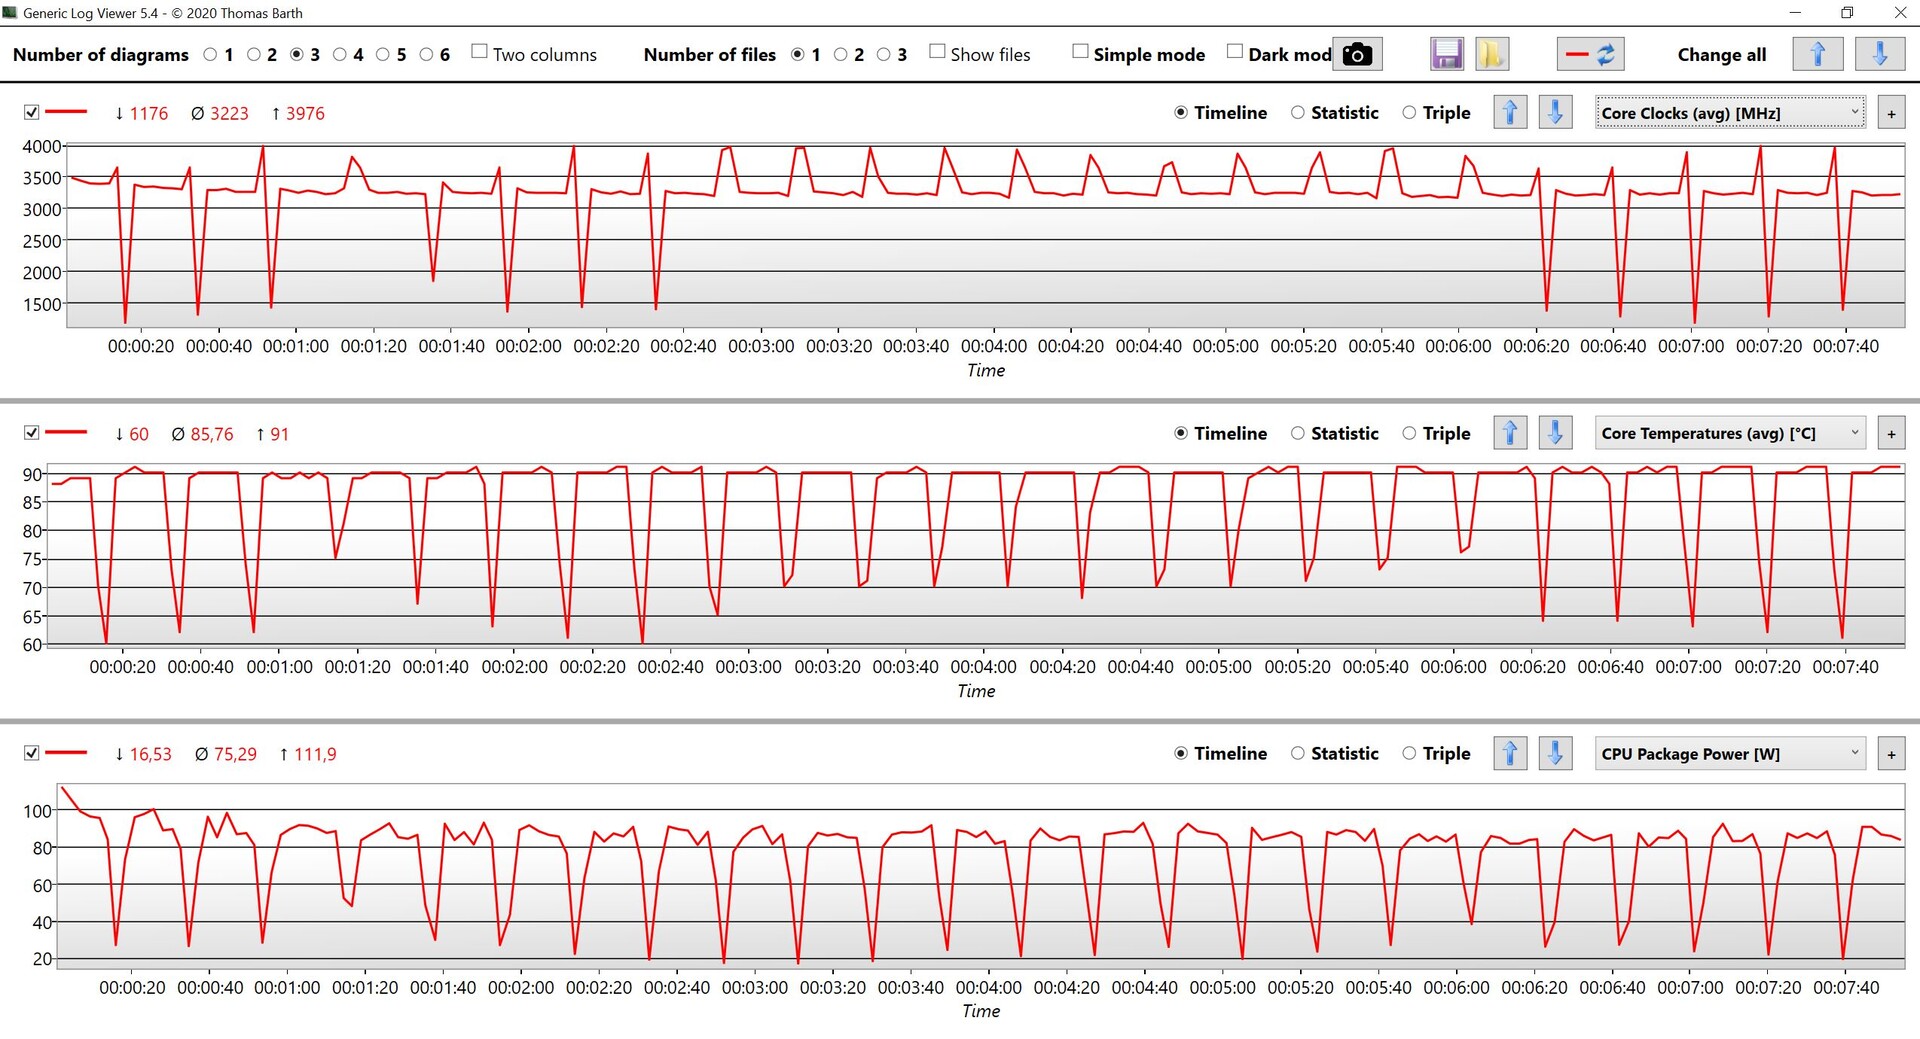
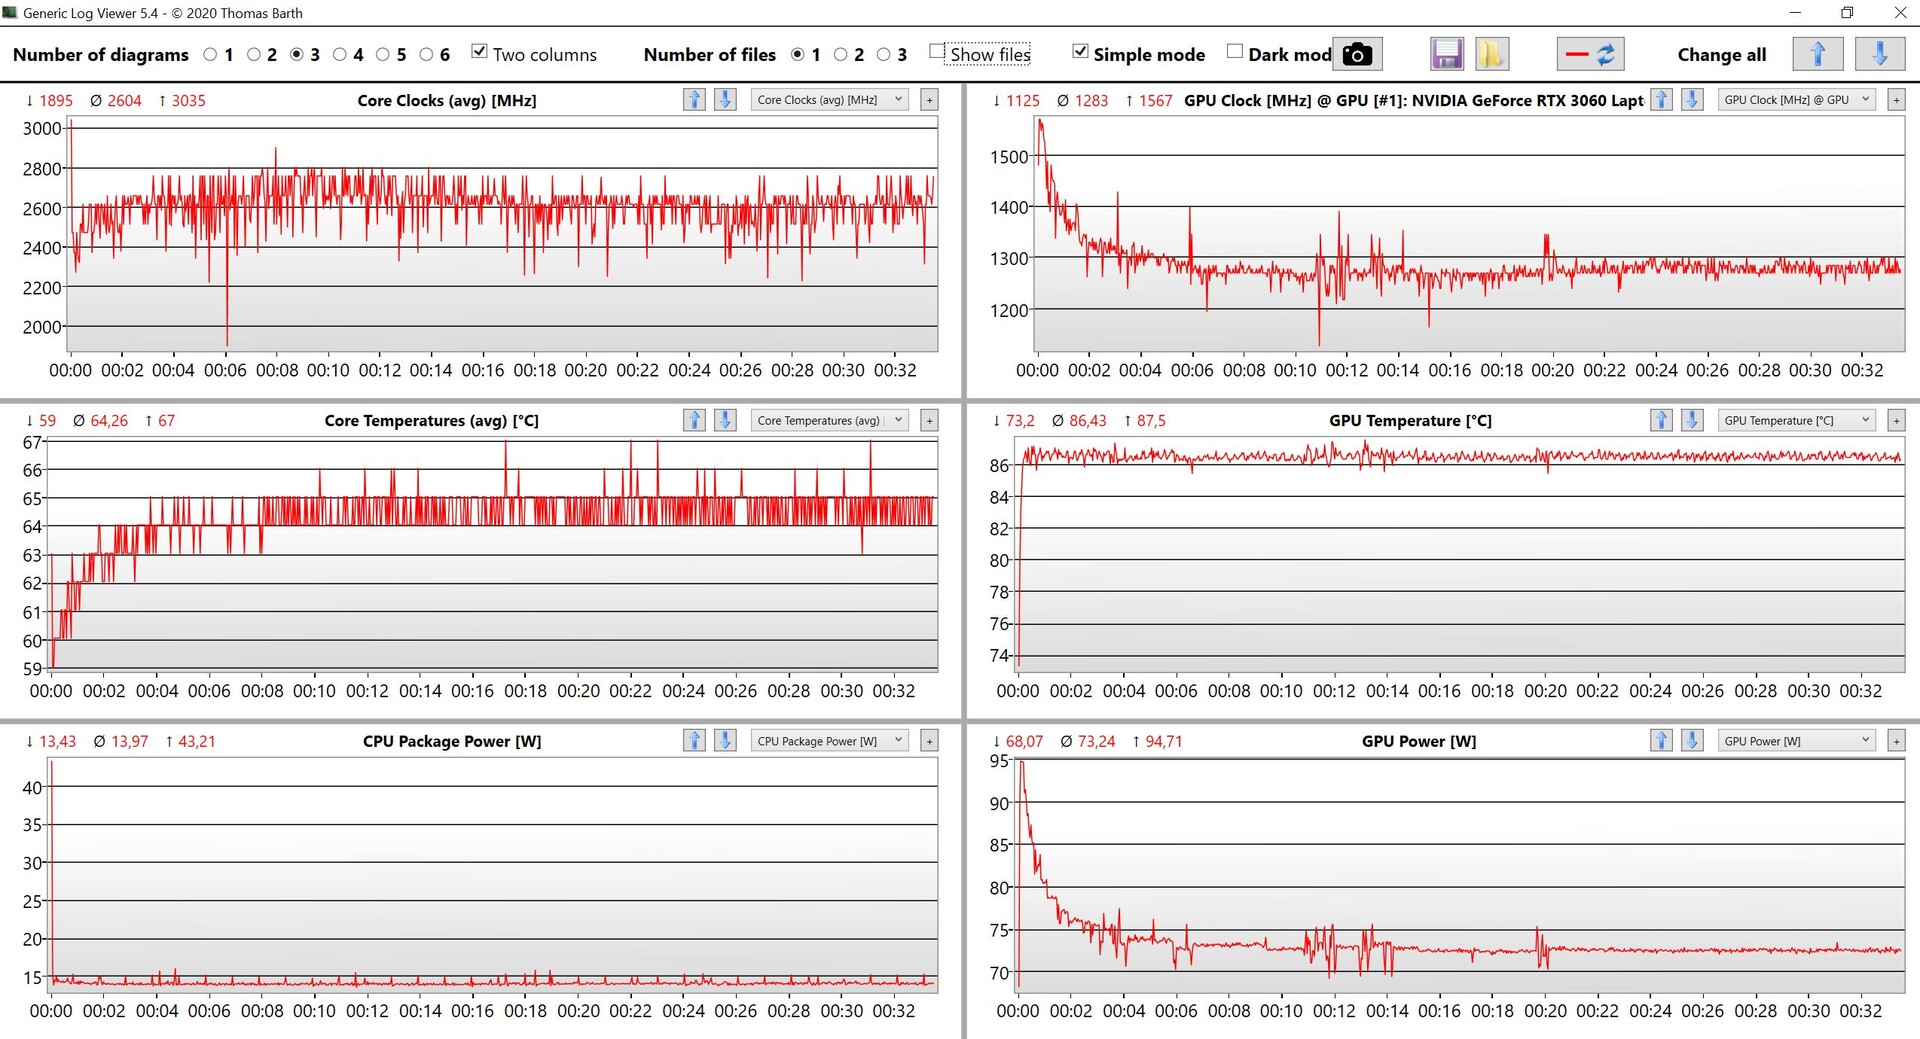
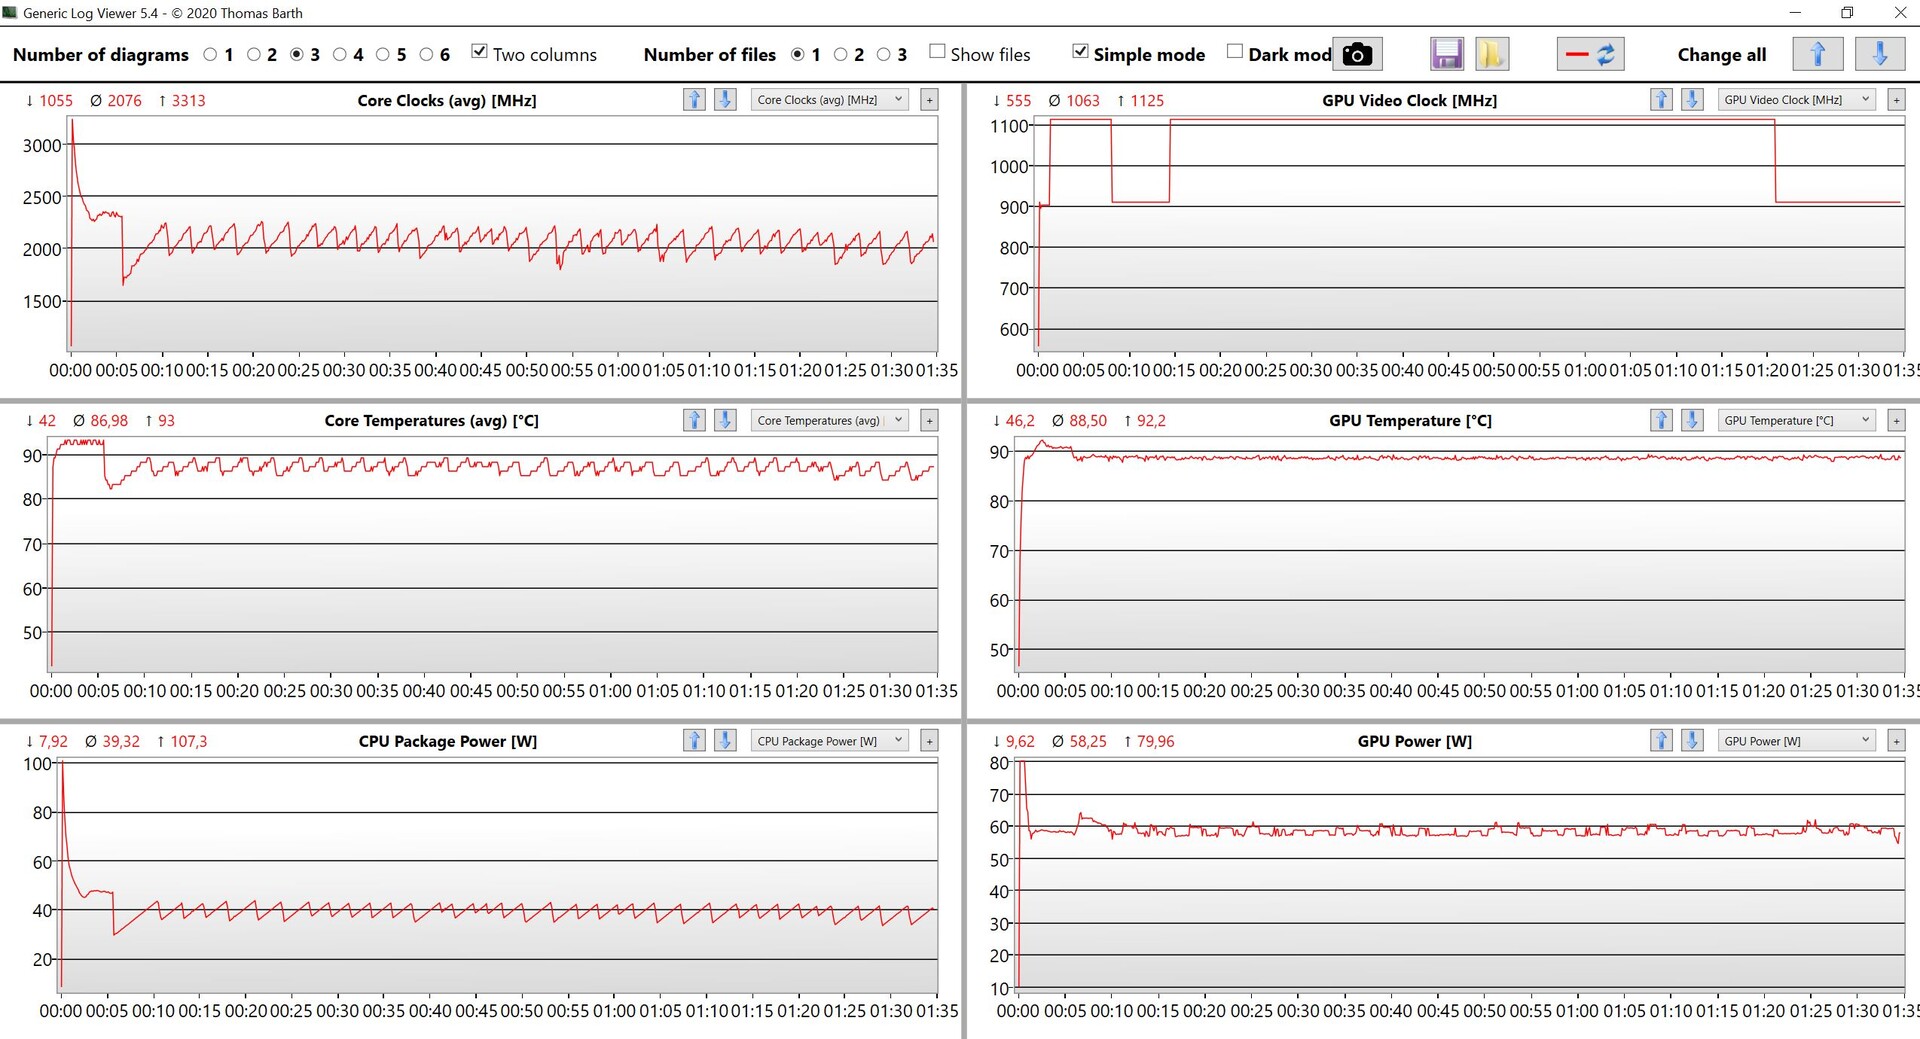
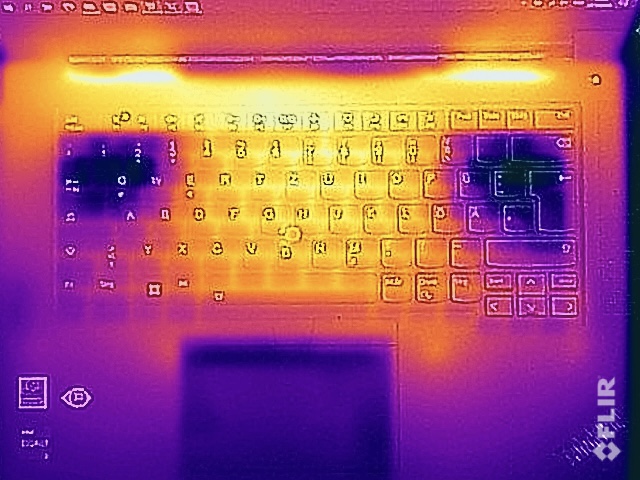
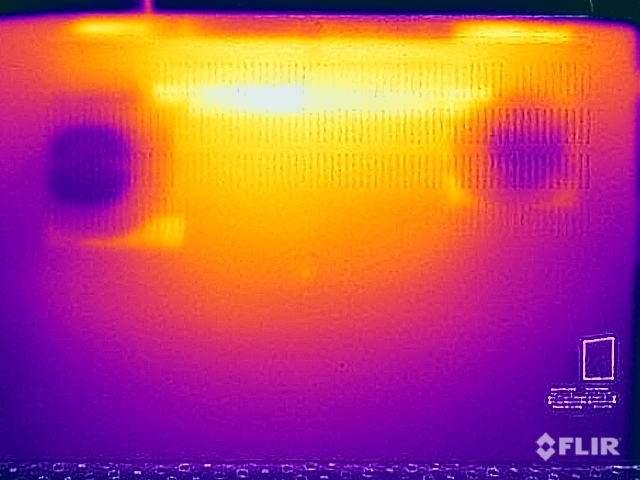
Recentemente, a Lenovo tem usado uma pasta térmica de metal líquido na CPU que já tem tido um efeito positivo no desempenho da CPU. Entretanto, as coisas aquecem sob carga e estão relacionadas com os ventiladores mais lentos. Tanto durante os jogos quanto no teste de estresse, medimos mais de 55 °C na parte inferior e 50 °C na parte superior da unidade base, respectivamente. Sob carga, é insensato ter o dispositivo colocado no colo do usuário e também é de se esperar dedos quentes ao digitar. Entretanto, não há problemas de temperatura durante as tarefas diárias.
Nos testes de estresse, a CPU e a GPU se nivelam rapidamente a 40 e 60 watts, respectivamente, o que significa que o sistema é capaz de resfriar um total de 100 watts. A 90 °C, ambos os componentes ficam rapidamente muito quentes. Na conclusão dos testes de estresse não houve queda de desempenho.
(-) A temperatura máxima no lado superior é 52 °C / 126 F, em comparação com a média de 36.8 °C / 98 F , variando de 21 a 71 °C para a classe Multimedia.
(-) A parte inferior aquece até um máximo de 56.4 °C / 134 F, em comparação com a média de 39.1 °C / 102 F
(+) Em uso inativo, a temperatura média para o lado superior é 25.6 °C / 78 F, em comparação com a média do dispositivo de 31.3 °C / ### class_avg_f### F.
(-) Jogando The Witcher 3, a temperatura média para o lado superior é 41.1 °C / 106 F, em comparação com a média do dispositivo de 31.3 °C / ## #class_avg_f### F.
(±) Os apoios para as mãos e o touchpad podem ficar muito quentes ao toque, com um máximo de 36.1 °C / 97 F.
(-) A temperatura média da área do apoio para as mãos de dispositivos semelhantes foi 28.7 °C / 83.7 F (-7.4 °C / -13.3 F).
| Lenovo ThinkPad X1 Extreme G5-21DE003RGE Intel Core i7-12700H, NVIDIA GeForce RTX 3060 Laptop GPU | HP Envy 16 h0112nr Intel Core i7-12700H, NVIDIA GeForce RTX 3060 Laptop GPU | Schenker Vision 16 Pro RTX 3070 Ti Intel Core i7-12700H, NVIDIA GeForce RTX 3070 Ti Laptop GPU | Dell XPS 15 9520 RTX 3050 Ti Intel Core i7-12700H, NVIDIA GeForce RTX 3050 Ti Laptop GPU | Apple MacBook Pro 16 2021 M1 Pro Apple M1 Pro, Apple M1 Pro 16-Core GPU | Dell XPS 17 9720 RTX 3060 Intel Core i7-12700H, NVIDIA GeForce RTX 3060 Laptop GPU | Lenovo ThinkPad X1 Extreme G4-20Y5CTO1WW (3050 Ti) Intel Core i7-11800H, NVIDIA GeForce RTX 3050 Ti Laptop GPU | |
|---|---|---|---|---|---|---|---|
| Heat | -3% | 5% | -6% | 18% | -8% | -1% | |
| Maximum Upper Side * (°C) | 52 | 45.2 13% | 50.8 2% | 51.4 1% | 41 21% | 51.8 -0% | 49 6% |
| Maximum Bottom * (°C) | 56.4 | 44 22% | 46.3 18% | 51 10% | 39 31% | 44.2 22% | 44.4 21% |
| Idle Upper Side * (°C) | 26.4 | 33.6 -27% | 27.2 -3% | 30 -14% | 24 9% | 34.8 -32% | 32.1 -22% |
| Idle Bottom * (°C) | 27.2 | 32.6 -20% | 26.6 2% | 33 -21% | 24 12% | 33.2 -22% | 29.8 -10% |
* ... menor é melhor
Oradores
A Lenovo continua a equipar o dispositivo com dois alto-falantes estéreo que não só são capazes de produzir 20 watts, mas também produzem um som decente. No entanto, o resultado simplesmente não é tão alto ou perfurante quanto os concorrentes que possuem mais módulos, como oMacBook Pro 16com seis alto-falantes, ou o XPS 17com quatro.
Lenovo ThinkPad X1 Extreme G5-21DE003RGE análise de áudio
(±) | o volume do alto-falante é médio, mas bom (###valor### dB)
Graves 100 - 315Hz
(±) | graves reduzidos - em média 11.5% menor que a mediana
(±) | a linearidade dos graves é média (10.6% delta para a frequência anterior)
Médios 400 - 2.000 Hz
(±) | médios mais altos - em média 6.1% maior que a mediana
(+) | médios são lineares (4.6% delta para frequência anterior)
Altos 2 - 16 kHz
(+) | agudos equilibrados - apenas 3.4% longe da mediana
(+) | os máximos são lineares (4.2% delta da frequência anterior)
Geral 100 - 16.000 Hz
(+) | o som geral é linear (14.5% diferença em relação à mediana)
Comparado com a mesma classe
» 34% de todos os dispositivos testados nesta classe foram melhores, 4% semelhantes, 61% piores
» O melhor teve um delta de 5%, a média foi 17%, o pior foi 45%
Comparado com todos os dispositivos testados
» 18% de todos os dispositivos testados foram melhores, 4% semelhantes, 78% piores
» O melhor teve um delta de 4%, a média foi 24%, o pior foi 134%
Apple MacBook Pro 16 2021 M1 Pro análise de áudio
(+) | os alto-falantes podem tocar relativamente alto (###valor### dB)
Graves 100 - 315Hz
(+) | bons graves - apenas 3.8% longe da mediana
(+) | o baixo é linear (5.2% delta para a frequência anterior)
Médios 400 - 2.000 Hz
(+) | médios equilibrados - apenas 1.3% longe da mediana
(+) | médios são lineares (2.1% delta para frequência anterior)
Altos 2 - 16 kHz
(+) | agudos equilibrados - apenas 1.9% longe da mediana
(+) | os máximos são lineares (2.7% delta da frequência anterior)
Geral 100 - 16.000 Hz
(+) | o som geral é linear (4.6% diferença em relação à mediana)
Comparado com a mesma classe
» 0% de todos os dispositivos testados nesta classe foram melhores, 0% semelhantes, 100% piores
» O melhor teve um delta de 5%, a média foi 17%, o pior foi 45%
Comparado com todos os dispositivos testados
» 0% de todos os dispositivos testados foram melhores, 0% semelhantes, 100% piores
» O melhor teve um delta de 4%, a média foi 24%, o pior foi 134%
Gestão de energia - um painel de 4K faminto de energia
Consumo de energia
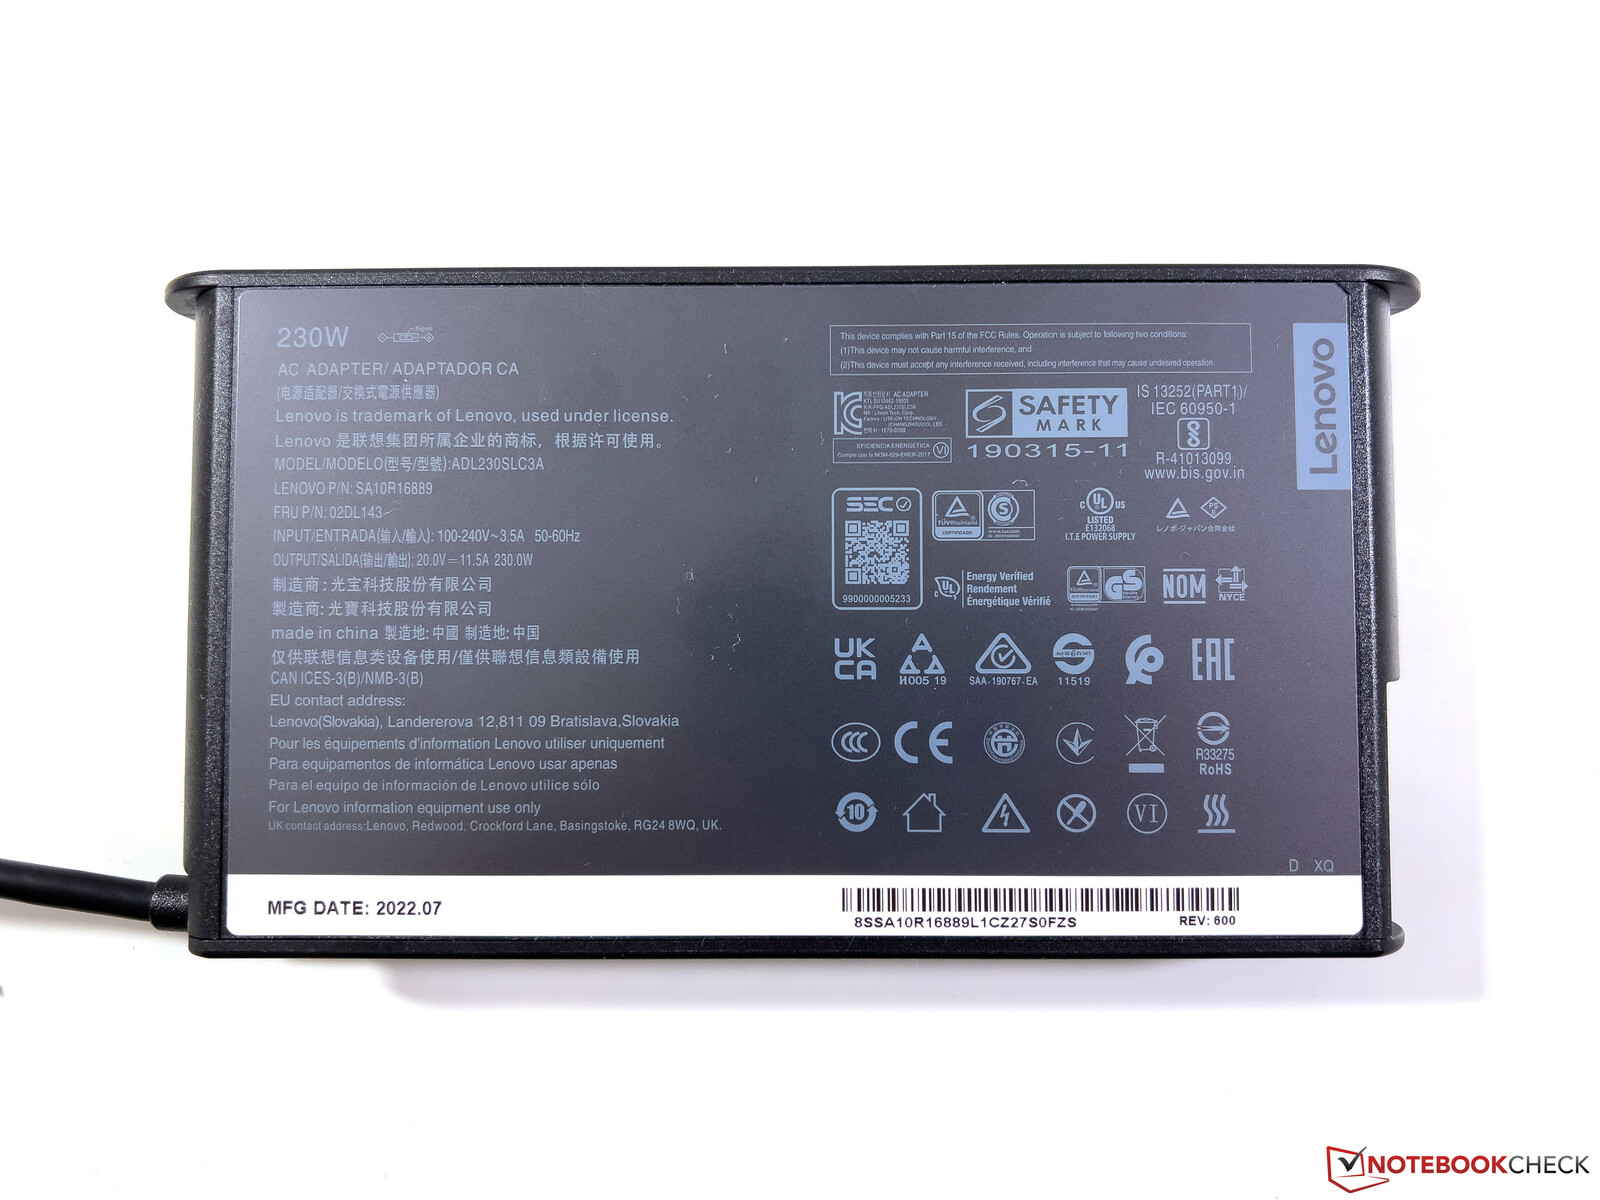
Como esperado, nossa análise energética não descobriu nenhuma surpresa. O painel 4K continua a consumir muita energia, medindo até 23 watts em uso ocioso. Sob carga, vimos brevemente 226 watts, após os quais o consumo se estabilizou rapidamente em 156 watts. Durante os jogos, o dispositivo consome 130 watts, o que significa que a fonte de alimentação de 230 watts fornecida é mais do que suficiente e é até mesmo capaz de carregar o dispositivo sob carga. Com 1,3 watts, o consumo em modo de espera é um pouco alto.
| desligado | |
| Ocioso | |
| Carga |
|
Key:
min: | |
| Lenovo ThinkPad X1 Extreme G5-21DE003RGE i7-12700H, GeForce RTX 3060 Laptop GPU, Micron 3400 1TB MTFDKBA1T0TFH, IPS, 3840x2400, 16" | HP Envy 16 h0112nr i7-12700H, GeForce RTX 3060 Laptop GPU, Micron 3400 1TB MTFDKBA1T0TFH, OLED, 3840x2400, 16" | Schenker Vision 16 Pro RTX 3070 Ti i7-12700H, GeForce RTX 3070 Ti Laptop GPU, Samsung SSD 980 Pro 1TB MZ-V8P1T0BW, IPS, 2560x1600, 16" | Dell XPS 15 9520 RTX 3050 Ti i7-12700H, GeForce RTX 3050 Ti Laptop GPU, WDC PC SN810 512GB, OLED, 3456x2160, 15.6" | Apple MacBook Pro 16 2021 M1 Pro M1 Pro, M1 Pro 16-Core GPU, Apple SSD AP1024R, Mini-LED, 3456x2234, 16.2" | Dell XPS 17 9720 RTX 3060 i7-12700H, GeForce RTX 3060 Laptop GPU, Samsung PM9A1 MZVL21T0HCLR, IPS, 3840x2400, 17" | Lenovo ThinkPad X1 Extreme G4-20Y5CTO1WW (3050 Ti) i7-11800H, GeForce RTX 3050 Ti Laptop GPU, Samsung PM9A1 MZVL21T0HCLR, IPS LED, 3840x2400, 16" | Média NVIDIA GeForce RTX 3060 Laptop GPU | Média da turma Multimedia | |
|---|---|---|---|---|---|---|---|---|---|
| Power Consumption | 11% | 22% | 45% | 49% | 22% | 16% | 17% | 51% | |
| Idle Minimum * (Watt) | 11.8 | 10 15% | 9 24% | 5.5 53% | 5 58% | 5.9 50% | 10.3 13% | 10.4 ? 12% | 5.71 ? 52% |
| Idle Average * (Watt) | 22.4 | 10.9 51% | 13.3 41% | 7.2 68% | 15.1 33% | 15.8 29% | 22.06 2% | 14.5 ? 35% | 10.1 ? 55% |
| Idle Maximum * (Watt) | 23.1 | 27.8 -20% | 14.3 38% | 16 31% | 15.5 33% | 26.7 -16% | 23 -0% | 21.4 ? 7% | 12.4 ? 46% |
| Load Average * (Watt) | 138 | 116.4 16% | 107 22% | 91.8 33% | 54 61% | 117.4 15% | 102.57 26% | 109.3 ? 21% | 65 ? 53% |
| Witcher 3 ultra * (Watt) | 129.9 | 133.7 -3% | 155.2 -19% | 74.6 43% | 114.8 12% | 106 18% | |||
| Load Maximum * (Watt) | 225.6 | 209.8 7% | 172 24% | 134.7 40% | 90 60% | 136.6 39% | 147.8 34% | 206 ? 9% | 112.2 ? 50% |
* ... menor é melhor
Energy consumption Witcher 3 / stress test
Energy consumption with an external monitor
Duração da bateria
Nada mudou em relação à bateria de 90 watt/hora e os tempos de funcionamento são geralmente comparáveis a sua predecessor que também testamos com um painel de 4K. Com 150 cd/m² de brilho (representando 56% do brilho máximo), o teste de vídeo funcionou por mais de 7 horas e o teste Wi-Fi por cerca de 6,5 horas. Com a luminosidade máxima, foi possível um tempo de execução de apenas 4,5 horas.
Uma carga completa leva 100 minutos, sendo que 35 % da carga é alcançada após apenas 14 minutos e 80 % está disponível após aproximadamente 52 minutos.
| Lenovo ThinkPad X1 Extreme G5-21DE003RGE i7-12700H, GeForce RTX 3060 Laptop GPU, 90 Wh | HP Envy 16 h0112nr i7-12700H, GeForce RTX 3060 Laptop GPU, 83 Wh | Schenker Vision 16 Pro RTX 3070 Ti i7-12700H, GeForce RTX 3070 Ti Laptop GPU, 80 Wh | Dell XPS 15 9520 RTX 3050 Ti i7-12700H, GeForce RTX 3050 Ti Laptop GPU, 86 Wh | Apple MacBook Pro 16 2021 M1 Pro M1 Pro, M1 Pro 16-Core GPU, 99.6 Wh | Dell XPS 17 9720 RTX 3060 i7-12700H, GeForce RTX 3060 Laptop GPU, 97 Wh | Lenovo ThinkPad X1 Extreme G4-20Y5CTO1WW (3050 Ti) i7-11800H, GeForce RTX 3050 Ti Laptop GPU, 90 Wh | Média da turma Multimedia | |
|---|---|---|---|---|---|---|---|---|
| Duração da bateria | 6% | -17% | 60% | 146% | -6% | -13% | 68% | |
| H.264 (h) | 7.3 | 6.1 -16% | 17.5 140% | 6.7 -8% | 16.4 ? 125% | |||
| WiFi v1.3 (h) | 6.7 | 7.9 18% | 6 -10% | 8.8 31% | 16.9 152% | 8.7 30% | 6.6 -1% | 12 ? 79% |
| Load (h) | 1.7 | 1.6 -6% | 1.3 -24% | 3.2 88% | 1 -41% | 1.2 -29% | 1.675 ? -1% |
Pro
Contra
Veredicto - Um ThinkPad com potência adicional de CPU

Mesmo que nada tenha parecido mudar por fora, a Lenovo conseguiu introduzir algumas inovações interessantes a sua 5ª geração ThinkPad X1 Extreme. Em comparação com o modelo antigo, o processador agora consome consideravelmente mais energia. Juntamente com o novo processador Alder Lake, isto contribui para um aumento tangível no desempenho. É aqui que o uso de pasta térmica de metal líquido realmente compensa. De modo geral, o resfriamento da câmara de vapor faz um bom trabalho e embora os ventiladores permaneçam relativamente silenciosos, o desempenho gráfico é inconsistente
O ThinkPad ainda vem com o Windows 10 Pro, o que nos deixou com alguns problemas de desempenho. O Wi-Fi 6E é suportado apenas pelo Windows 11 e é uma das razões pelas quais recomendamos uma atualização. Um modem opcional 5G também está disponível, mas o módulo WWAN deve ser encomendado ex works caso contrário, nem as antenas necessárias nem o slot do cartão SIM estão preparados. Além disso, ainda existe uma limitação de que um módulo WWAN (assim como um segundo SSD M.2) esteja disponível apenas em modelos equipados com um RTX 3050 Tique utilizam o resfriamento convencional. A configuração de um canal de RAM é um tanto infeliz, pois 32 GB são suficientes para a maioria dos usuários e dois módulos de 16 GB teriam sido sem dúvida a melhor escolha
Com o ThinkPad X1 Extreme G5, a Lenovo melhora principalmente o poder de processamento e oferece conectividade opcional 5G com desempenho gráfico permanecendo um pouco instável.
Mais uma vez, sentimos a necessidade de criticar a qualidade do teclado. Até os modelos G3, o teclado X1 Extreme pertencia ao melhor que o setor móvel tinha para oferecer. Ele continua nos intrigando quanto ao motivo pelo qual a Lenovo achou necessário reduzir o curso das teclas de um dispositivo relativamente grosso como o X1 Extreme (afinal de contas, não estamos lidando com oX1 NanoouX1 Carbonoaqui).
A Lenovo ainda é um dos poucos fabricantes que oferece um painel com cobertura completa AdobeRGB, já que até mesmo a HP vem usando seus painéis DramColor P3 há algum tempo. Visto subjetivamente, a qualidade da imagem é muito boa sem sofrer com problemas de PWM. Entretanto, o consumo de energia é muito alto e os reflexos ao ar livre podem ser um problema. Em breve testaremos o novo painel WQHD de 165 Hz encontrado na estação de trabalho ThinkPad P1 G5
O X1 Extreme G5 tem muita conclusão, especialmente quando se considera o alto preço. Isto começa com o maravilhoso MacBook Pro 16com seu mini display LED, bem como os recém-chegados, como oSchenker Vision 16 Proque oferece mais potência em um fator de forma menor e mais leve. No entanto, nenhum dos dois dispositivos pode ter melhor duração da bateria. HP's Inveja 16 é um pouco mais pesado e espesso, mas oferece um desempenho mais estável da GPU. Atualmente, a Dell não atualizou seu XPS 16, deixando os compradores potenciais a escolher entre o XPS 15e 17.
Preço e disponibilidade
O ThinkPad X1 Extreme pode ser configurado em Lenovos Online-Store a partir de 2189 dólares. Nossa configuração de revisão está disponível online a partir de 3643 dólares americanos na Amazon.
Lenovo ThinkPad X1 Extreme G5-21DE003RGE
- 12/05/2022 v7 (old)
Andreas Osthoff
Price comparison

