Lenovo ThinkPad X1 Nano Gen 2 revisão: O menor laptop X1 já fabricado
")
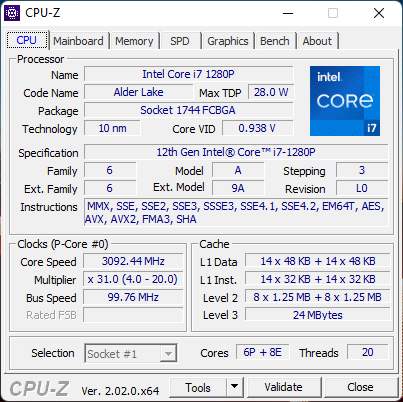
Uma das maiores reclamações sobre o ThinkPad X1 Nano Gen 1 foi seu processador lento. Enquanto a maioria dos outros sub-portáteis estavam rodando em CPUs de 28 W Core i5-1135G7 ou i7-1165G7 11º gen, o Nano Gen 1 ficou preso com as 15 W i7-1160G7. O modelo pode ter sido super leve, mas deu a sensação de que o baixo peso teve um impacto direto nos níveis de desempenho. O novo ThinkPad X1 Nano Gen 2 aborda esta questão trocando o i7-1160G7 por um 12º gen 28 W i7-1280P vPro, o que deve tornar o X1 Nano Gen 2 um dos laptops comerciais mais rápidos de 13,0 polegadas, pelo menos em papel.
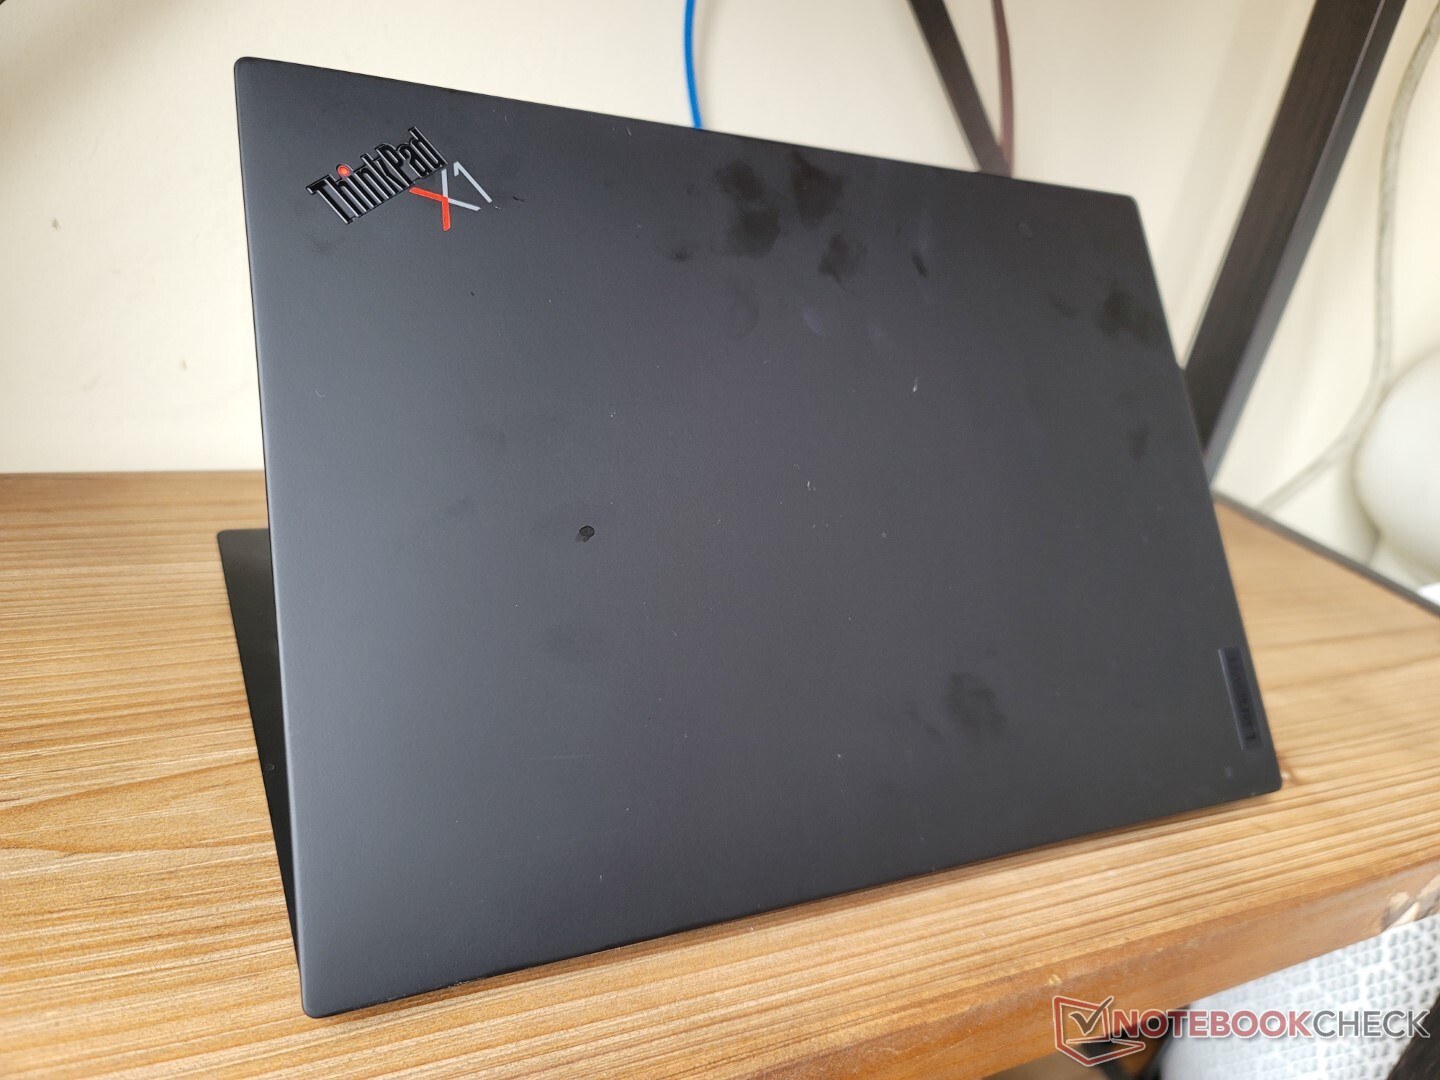
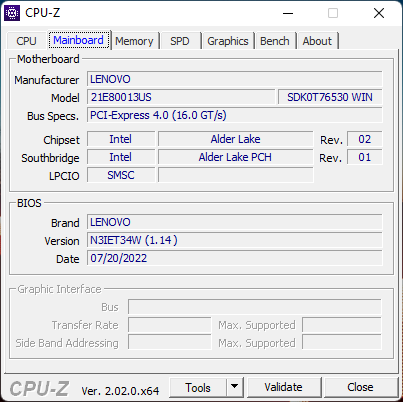
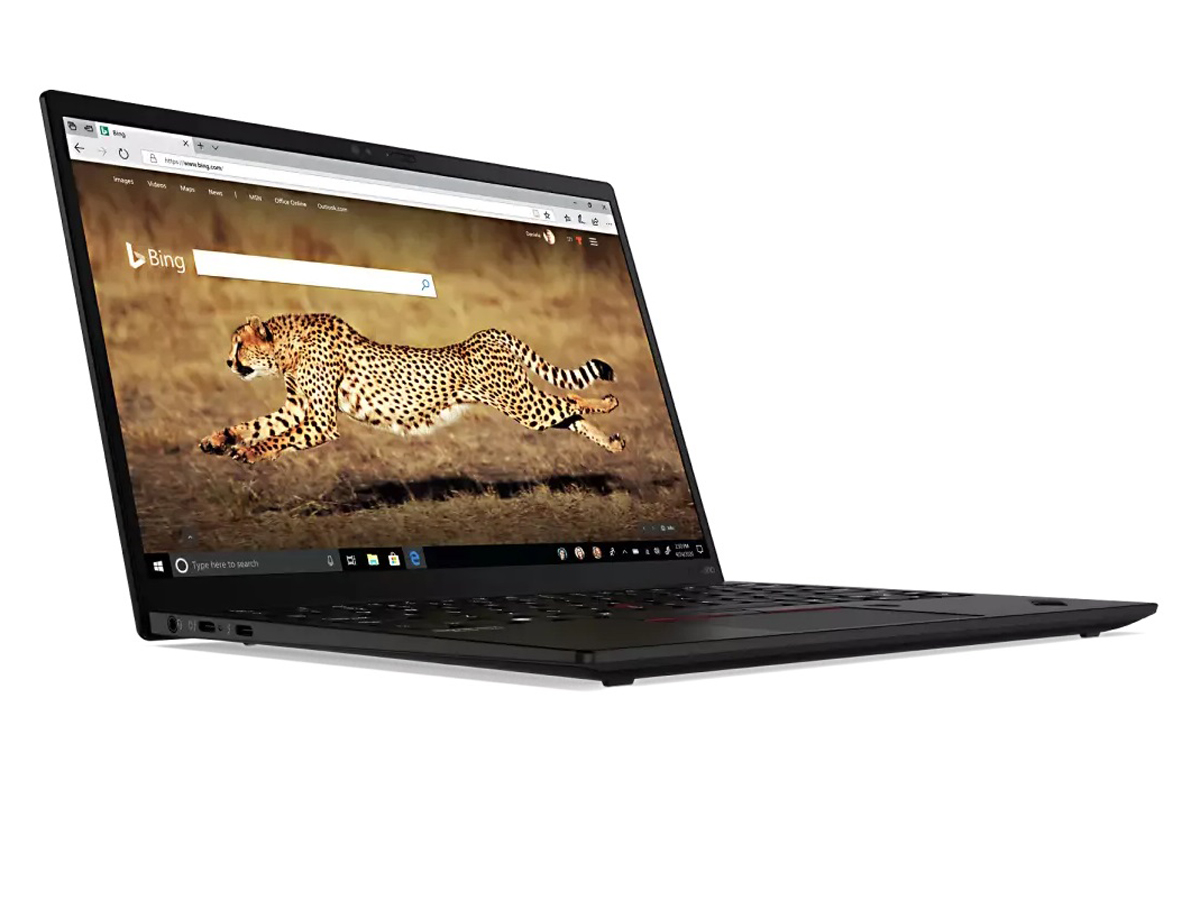
Além da atualização da CPU, o modelo Gen 2 traz algumas outras mudanças, incluindo uma webcam de resolução mais alta, Wi-Fi mais rápido e suporte a WAN 5G. O design exterior é idêntico ao modelo Gen 1 de 2021 e, portanto, recomendamos verificar nossa revisão existente para saber mais sobre as características físicas do laptop
.Os concorrentes neste espaço incluem outros laptops comerciais super leves de 13 polegadas como o HP Elite Dragonfly G3, Dell Latitude 13 7330, série LG Gram, ou o Dynabook Portege X30L.
Mais análises da Lenovo
Possíveis concorrentes em comparação
Avaliação | Data | Modelo | Peso | Altura | Size | Resolução | Preço |
|---|---|---|---|---|---|---|---|
| 88.9 % v7 (old) | 09/2022 | Lenovo ThinkPad X1 Nano Gen 2 Core i7-1280P i7-1280P, Iris Xe G7 96EUs | 958 g | 14.4 mm | 13.00" | 2160x1350 | |
| 89.8 % v7 (old) | 02/2021 | Lenovo ThinkPad X1 Nano-20UN002UGE i7-1160G7, Iris Xe G7 96EUs | 946 g | 16 mm | 13.00" | 2160x1350 | |
| 91 % v7 (old) | 08/2022 | HP Elite Dragonfly G3 i7-1265U, Iris Xe G7 96EUs | 1.2 kg | 16.3 mm | 13.50" | 1920x1280 | |
| 89 % v7 (old) | 07/2022 | Dell Latitude 13 7330 i7-1265U, Iris Xe G7 96EUs | 1 kg | 16.96 mm | 13.30" | 1920x1080 | |
| 85.1 % v7 (old) | 07/2022 | Framework Laptop 13.5 12th Gen Intel i7-1260P, Iris Xe G7 96EUs | 1.3 kg | 15.85 mm | 13.50" | 2256x1504 | |
| 87.8 % v7 (old) | 03/2021 | Huawei MateBook X Pro 2021 i7-1165G7, Iris Xe G7 96EUs | 1.3 kg | 14.6 mm | 13.90" | 3000x2000 |
Caso
Comunicação
O módulo WLAN foi atualizado do Intel AX201 para o AX211 para suporte a Wi-Fi 6E. Não tivemos problemas de conectividade quando acoplado à nossa rede de 6 GHz
LTE 5G Cat 20 ou 4G CAT 9 são upgrades opcionais da WWAN. Haverá um slot Nano-SIM se configurado com o recurso.
| Networking | |
| iperf3 transmit AX12 | |
| Lenovo ThinkPad X1 Nano-20UN002UGE | |
| Huawei MateBook X Pro 2021 | |
| iperf3 receive AX12 | |
| Huawei MateBook X Pro 2021 | |
| Lenovo ThinkPad X1 Nano-20UN002UGE | |
| iperf3 receive AXE11000 6GHz | |
| Framework Laptop 13.5 12th Gen Intel | |
| Lenovo ThinkPad X1 Nano Gen 2 Core i7-1280P | |
| HP Elite Dragonfly G3 | |
| Dell Latitude 13 7330 | |
| iperf3 transmit AXE11000 6GHz | |
| Dell Latitude 13 7330 | |
| Framework Laptop 13.5 12th Gen Intel | |
| HP Elite Dragonfly G3 | |
| Lenovo ThinkPad X1 Nano Gen 2 Core i7-1280P | |
Webcam
A Dell atualizou a webcam de 720p no modelo Gen 1 para 1080p para a versão Gen 2 deste ano. A imagem não é tão lamacenta como resultado, mas as cores permanecem subparciais
Tanto o infravermelho como um obturador físico da webcam vêm como padrão para privacidade.


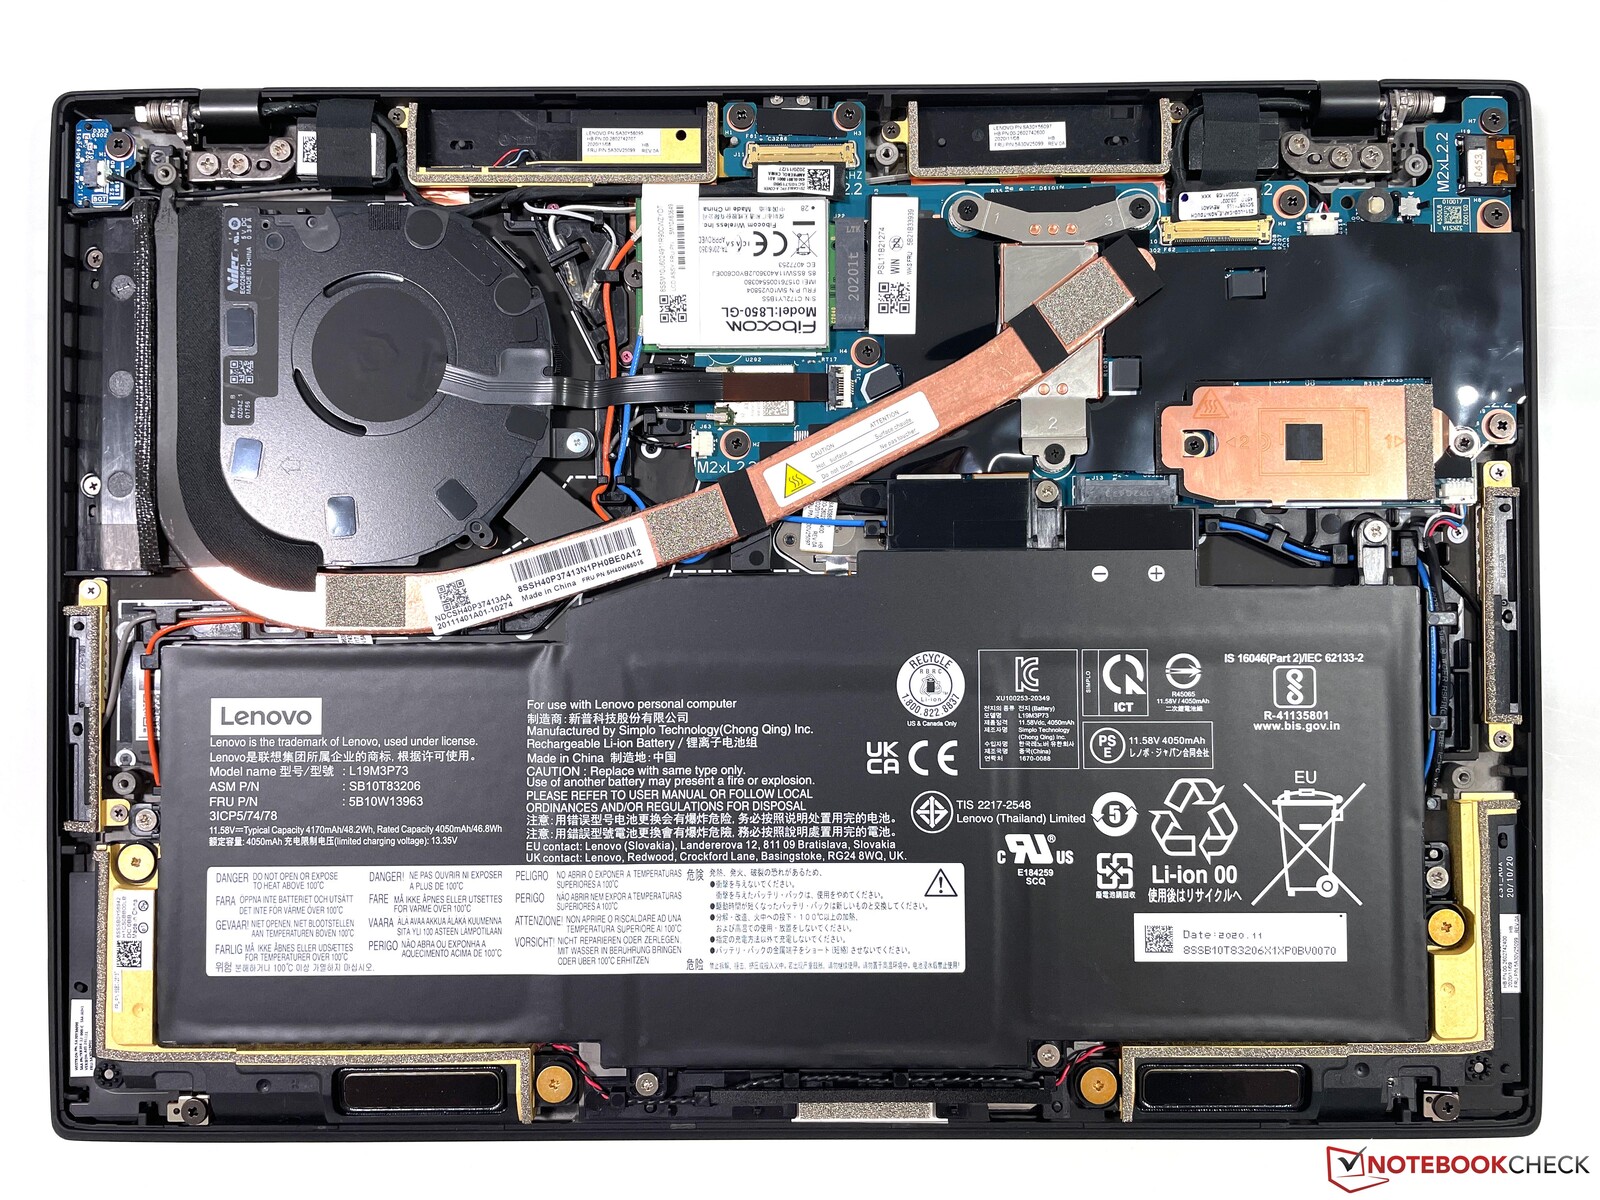
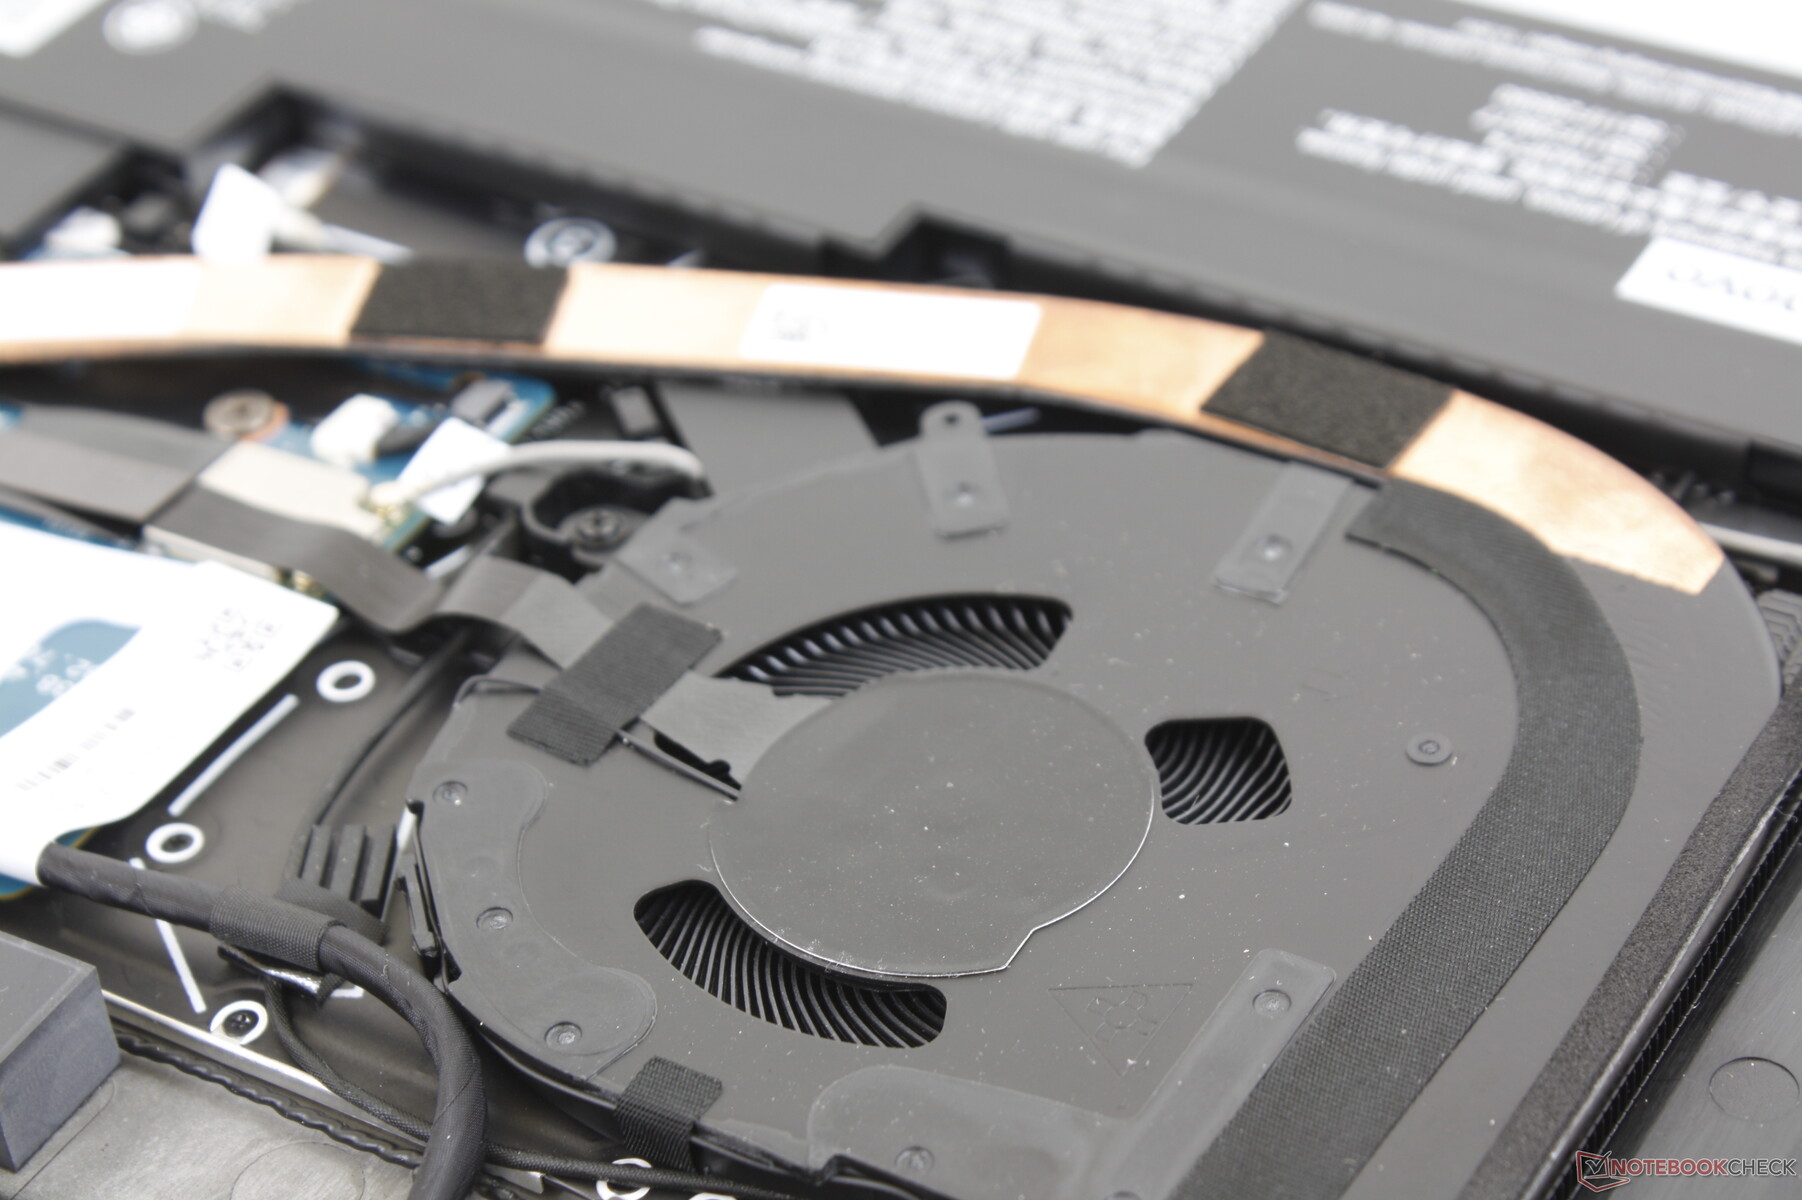
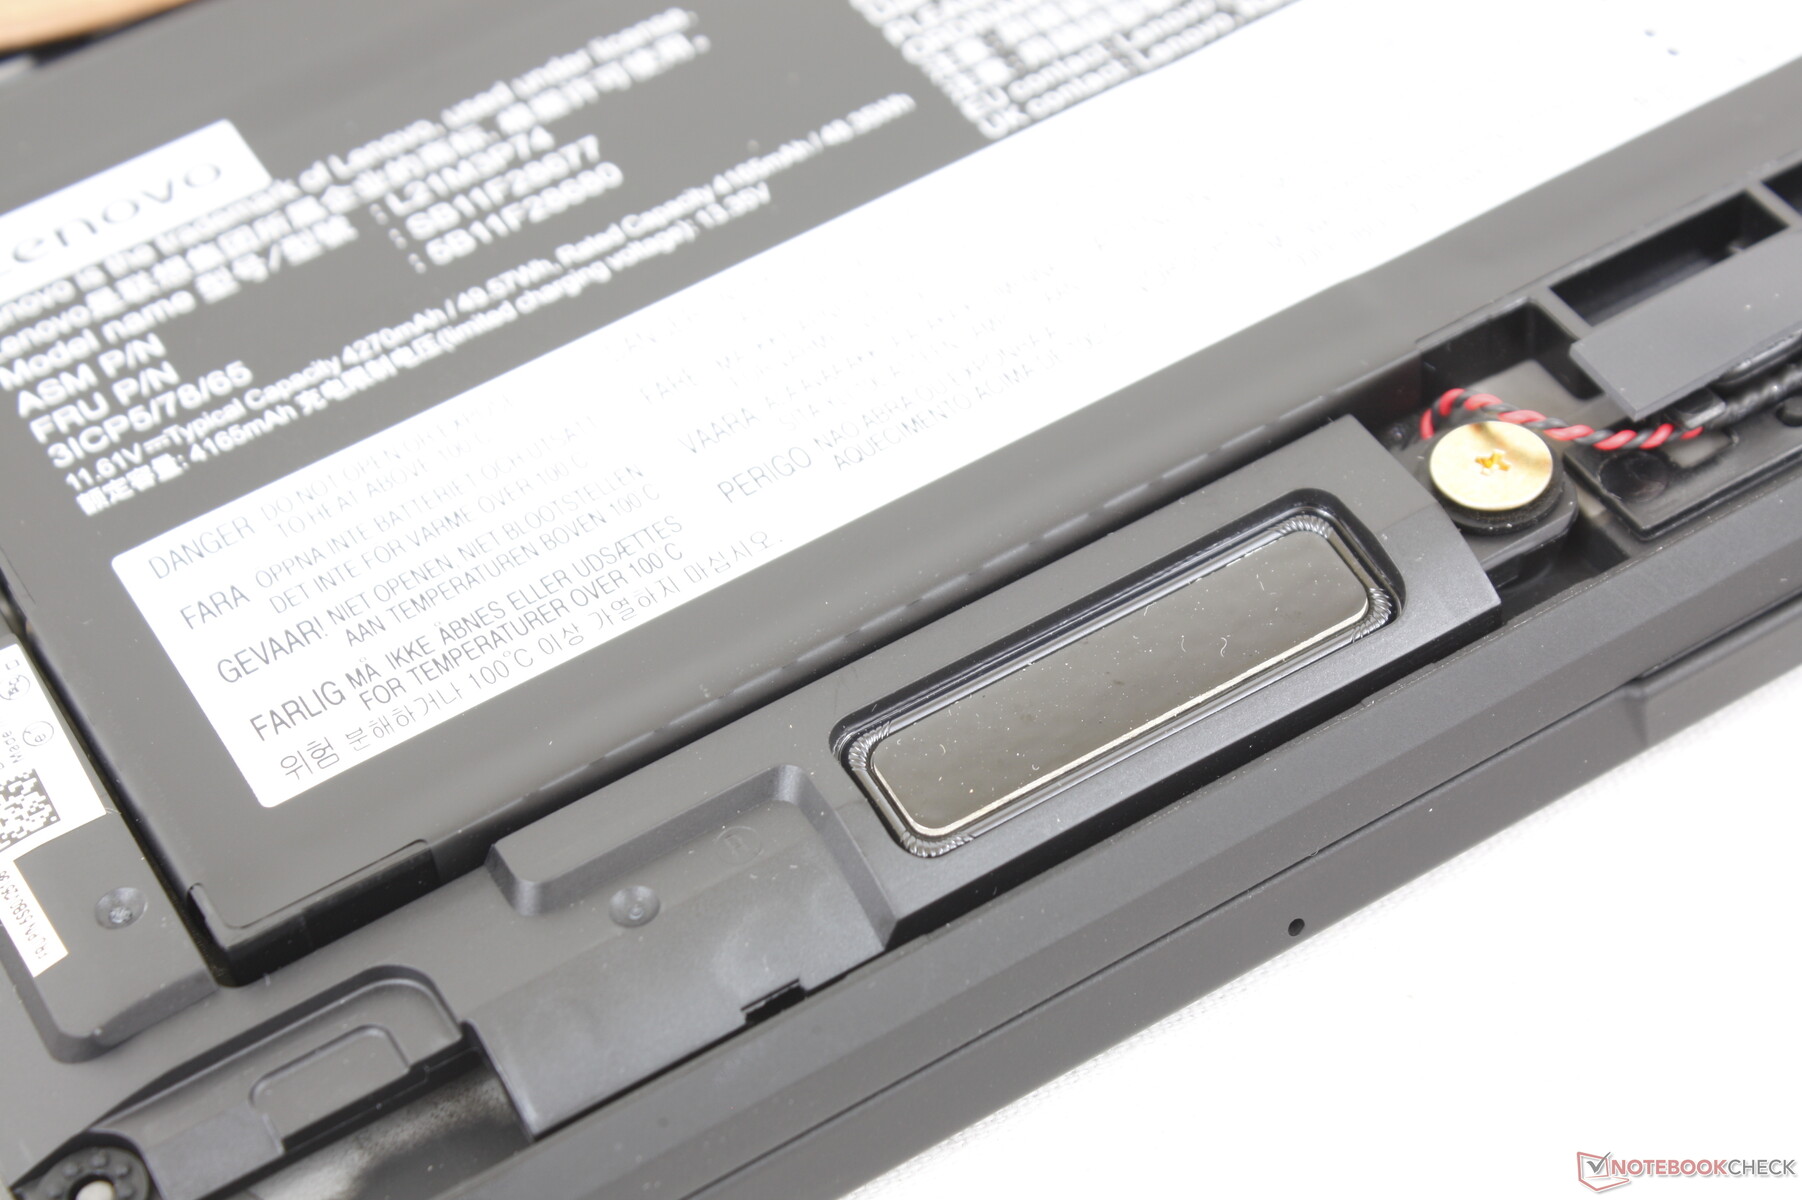
Manutenção
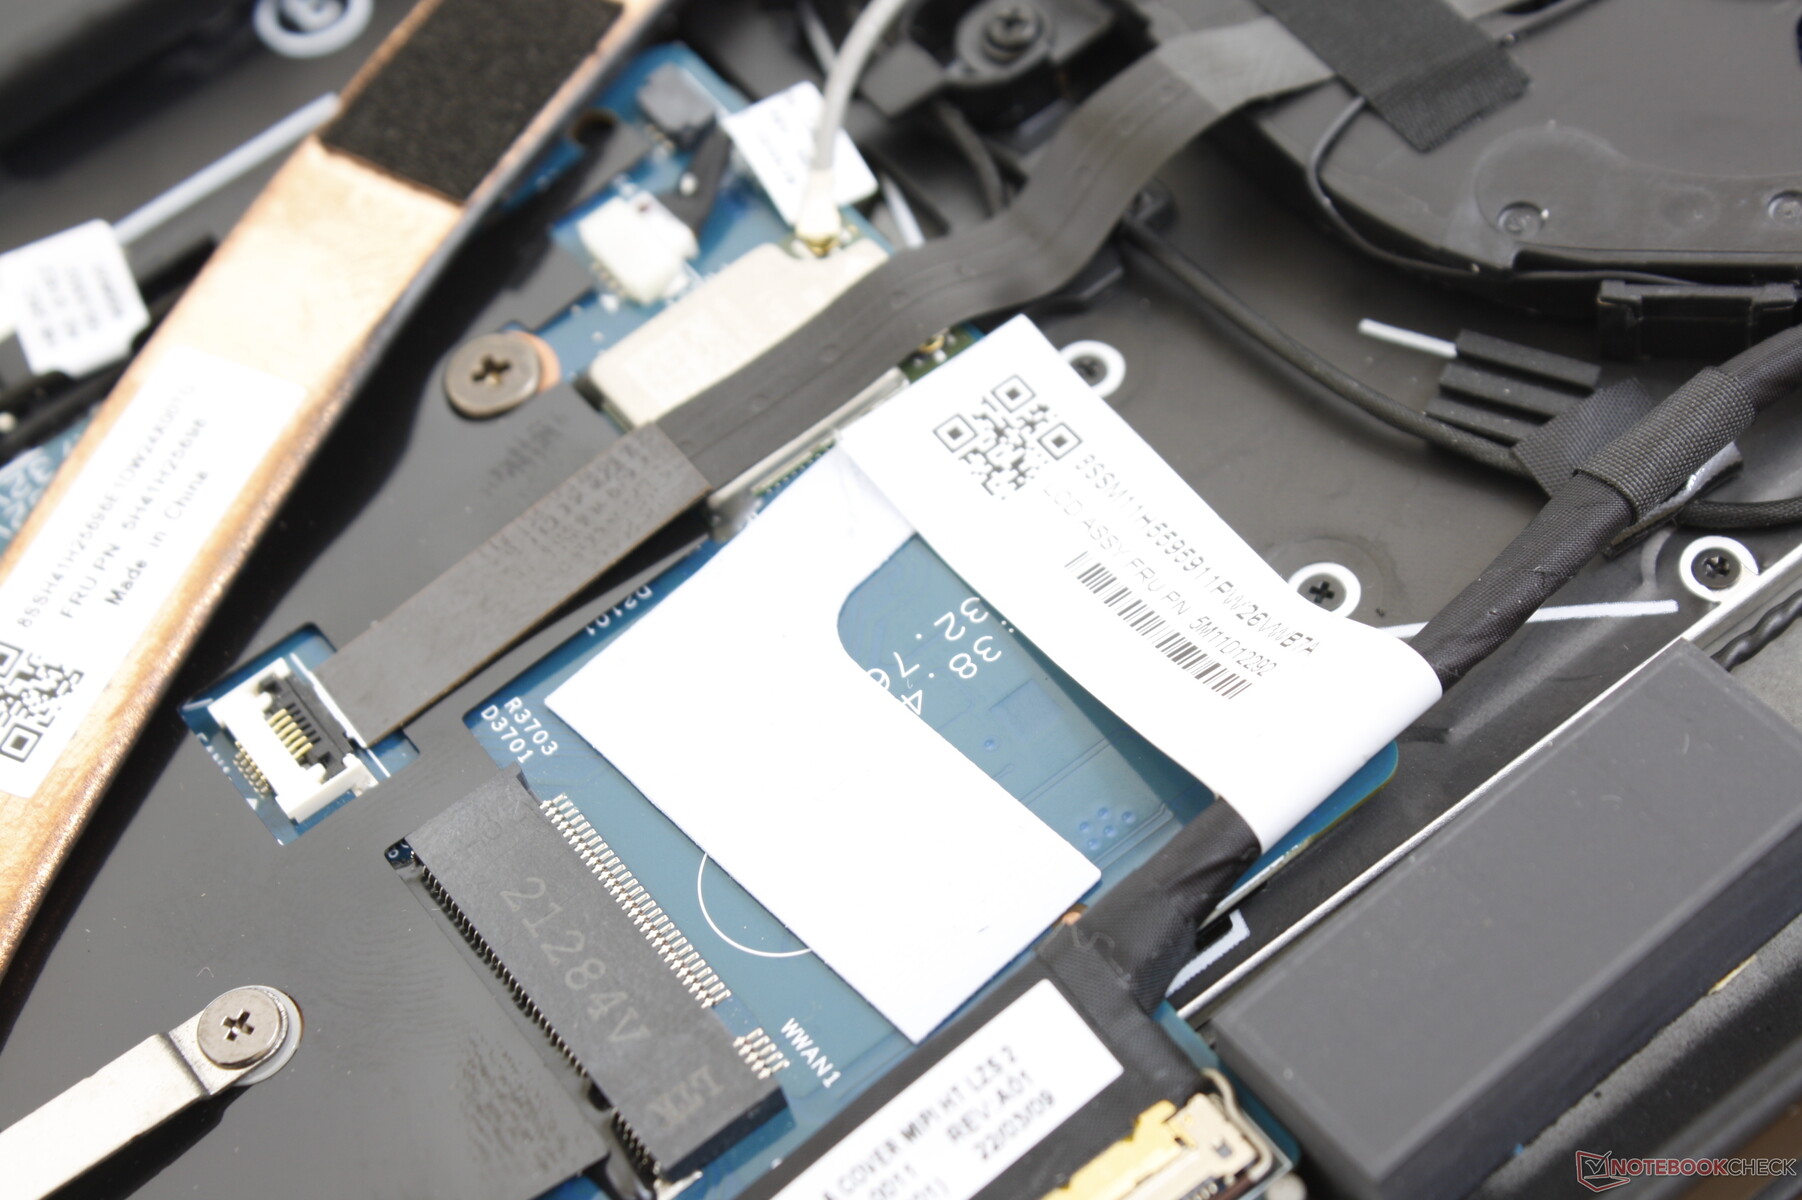
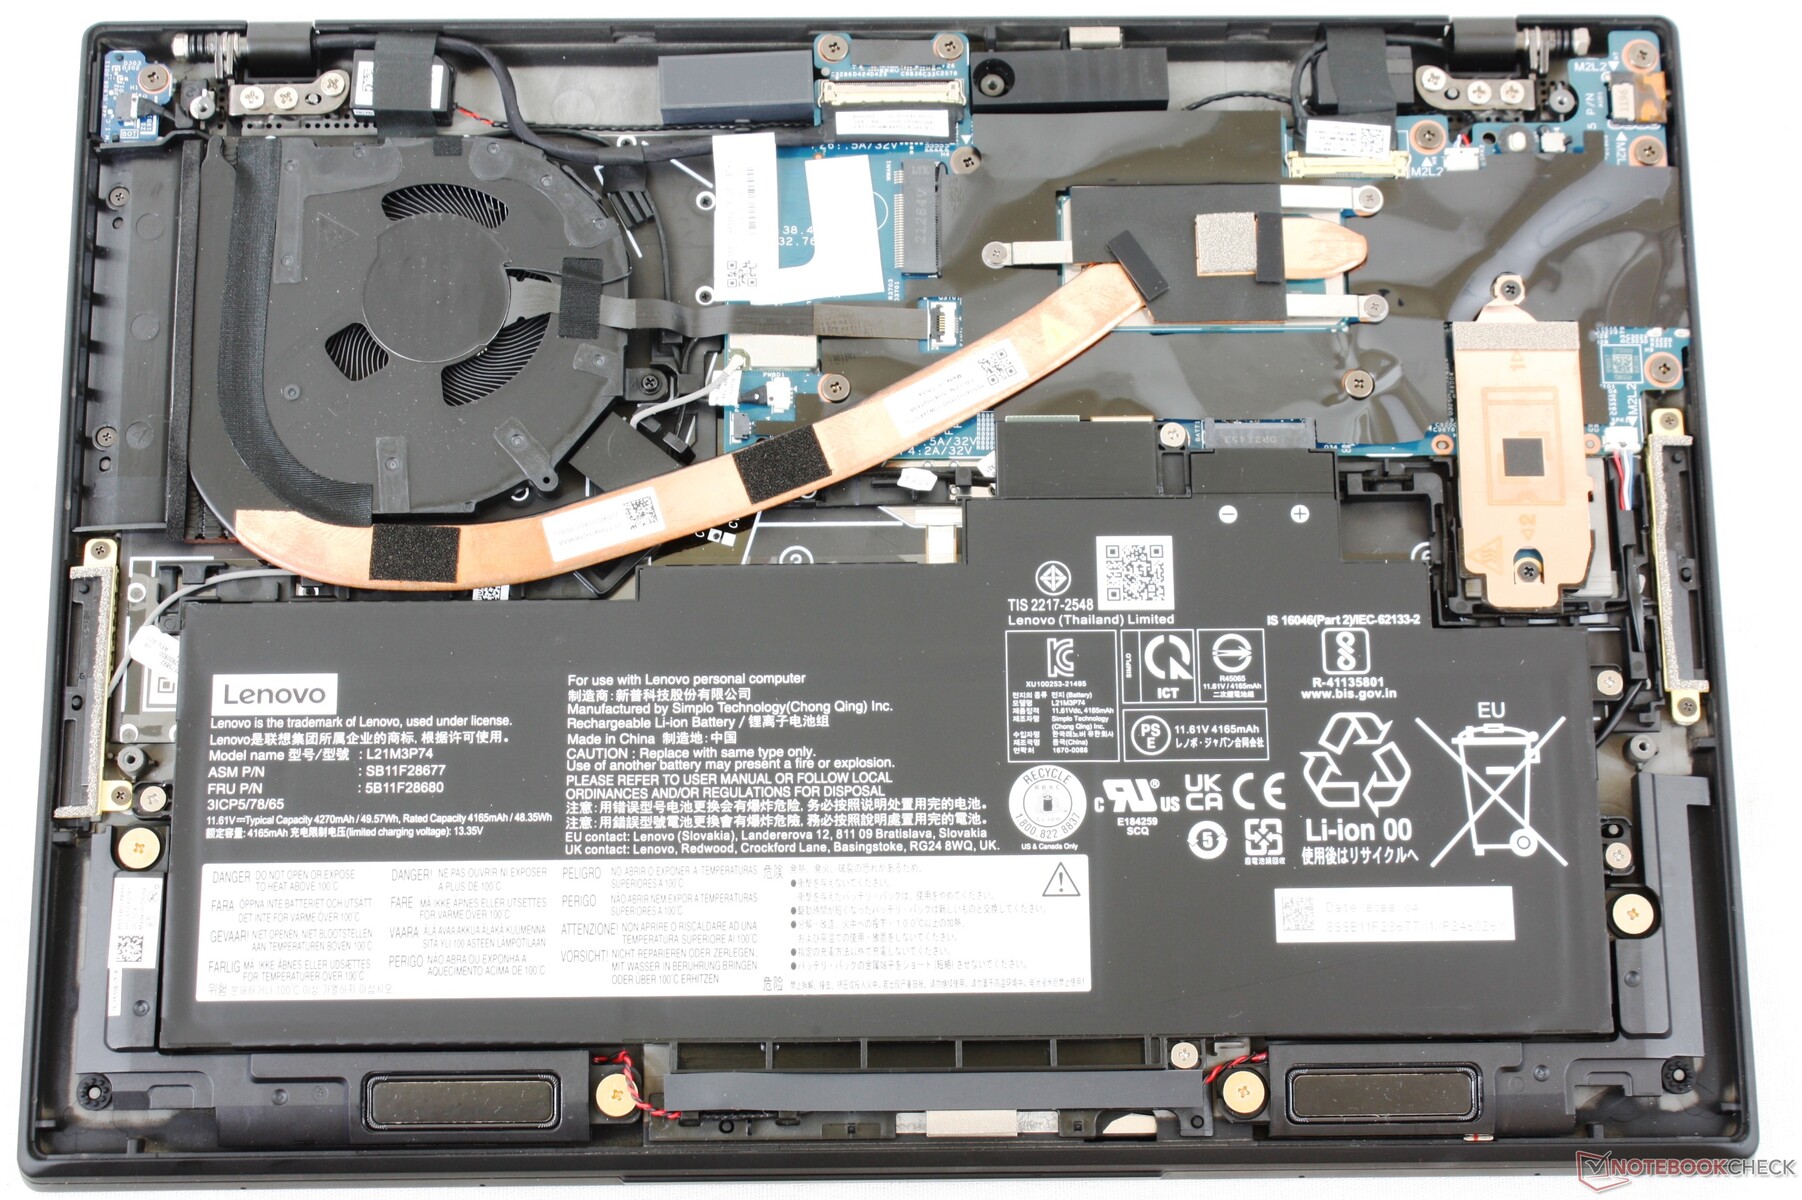
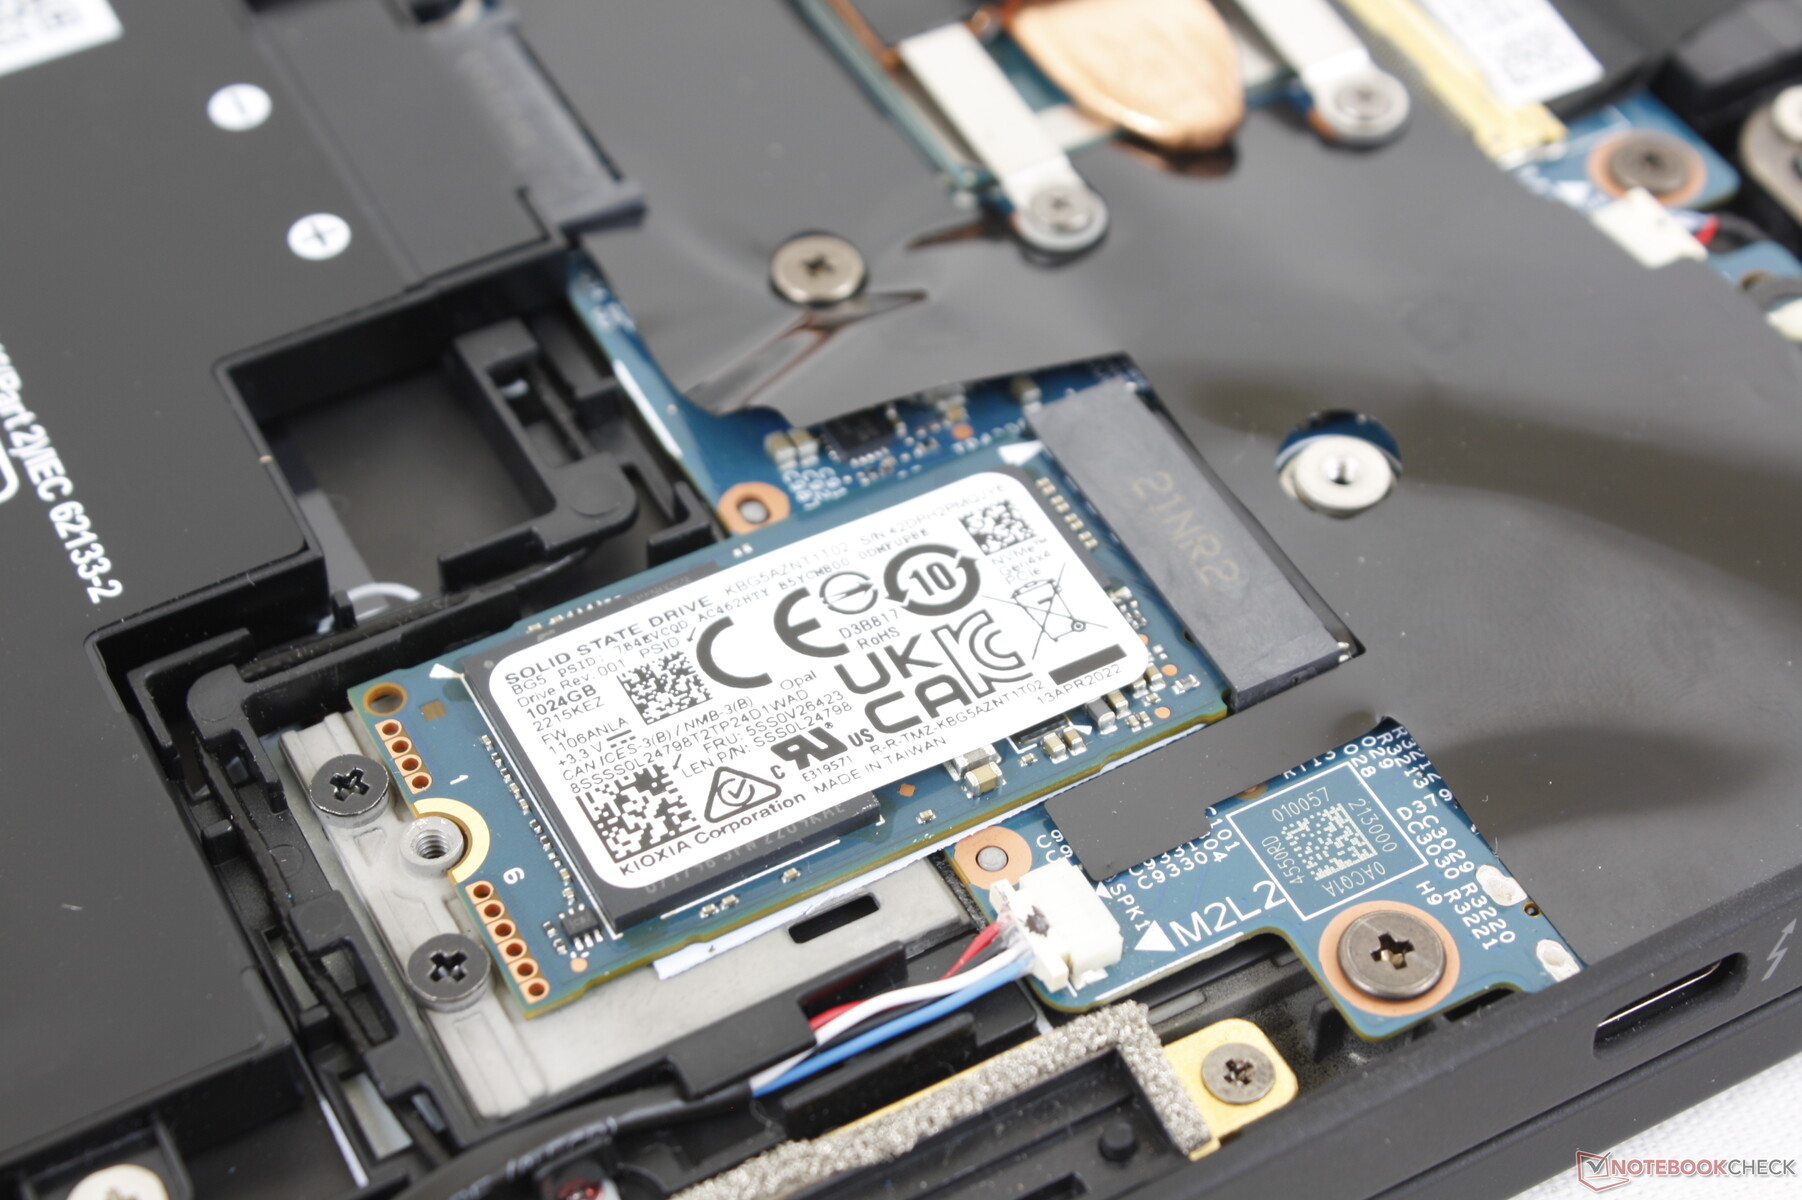
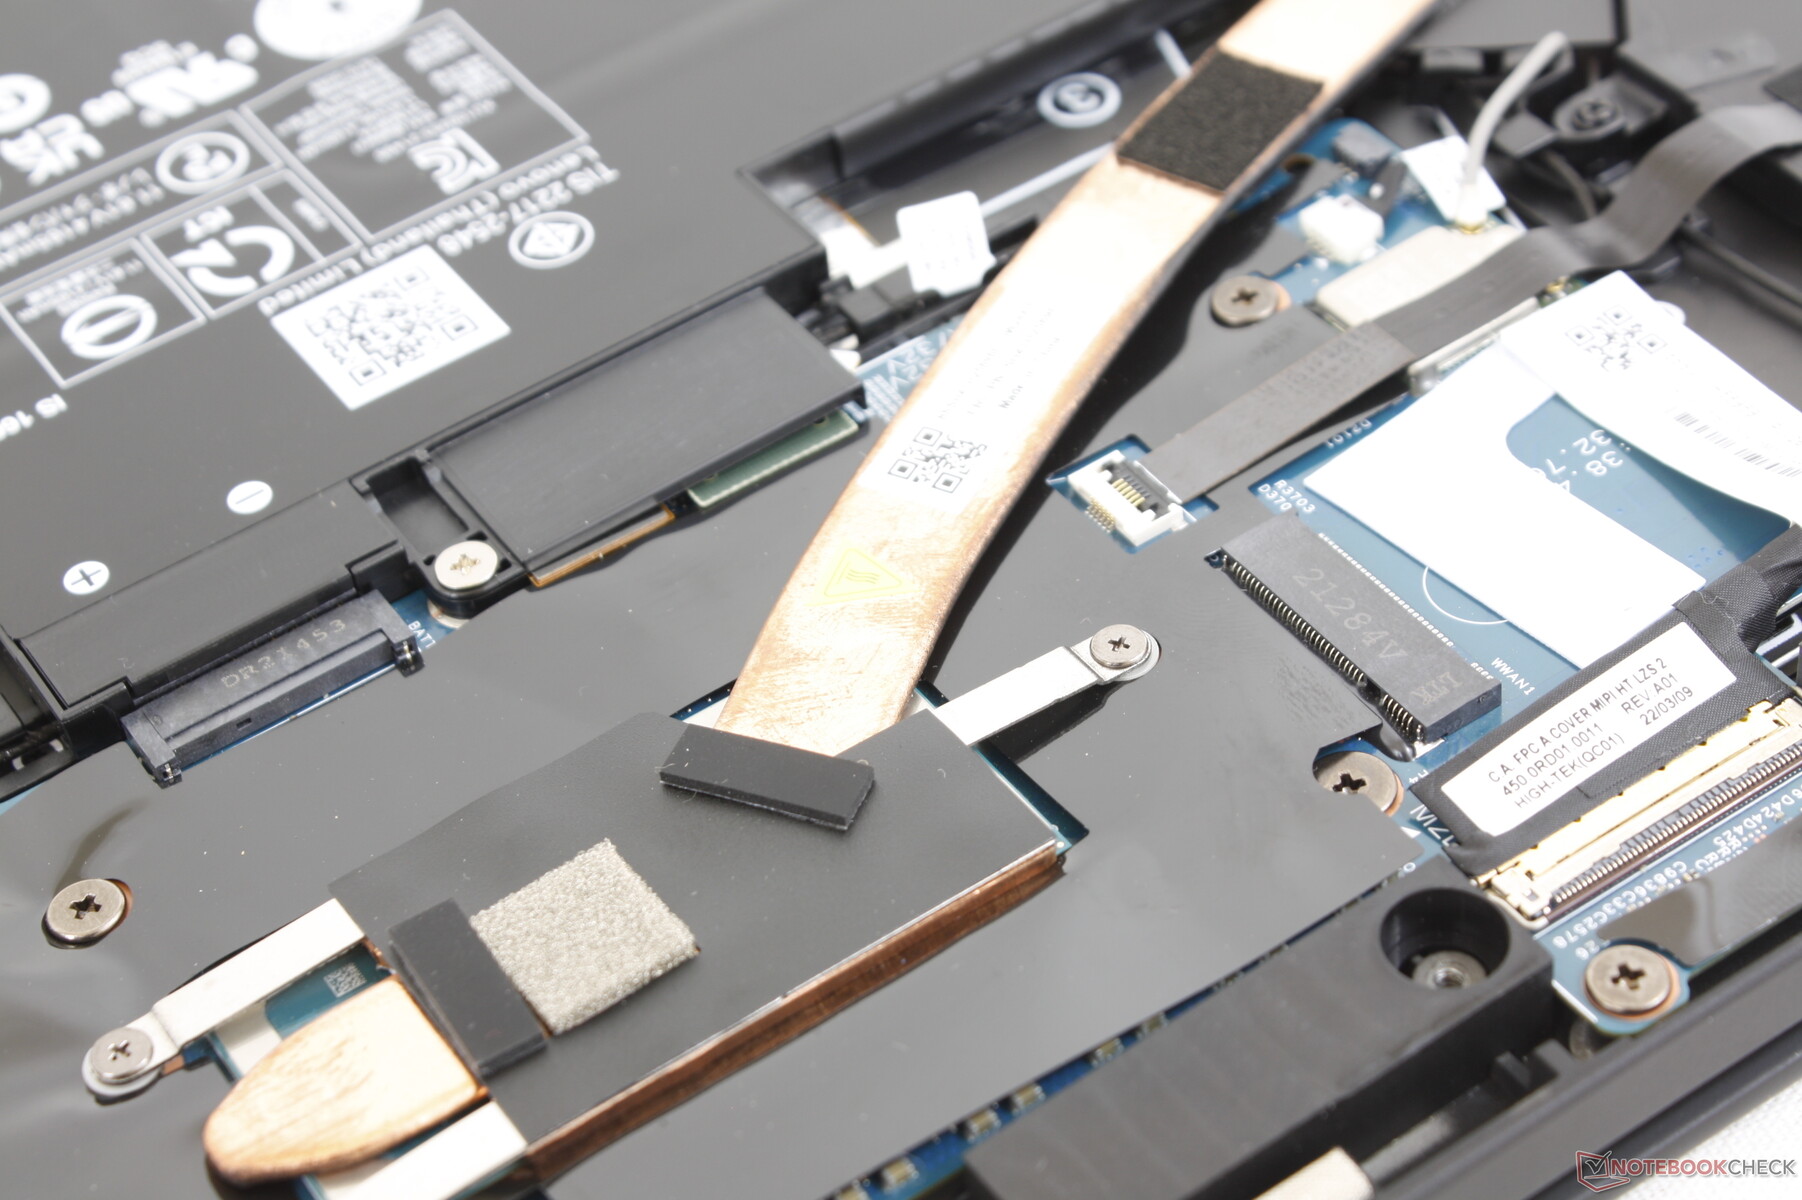
O painel inferior se solta facilmente com apenas uma chave de fenda Philips. Os internos são em sua maioria os mesmos do modelo Gen 1, exceto pelo reposicionado M.2 2242 SSD e outros ajustes menores como mostrado pelas imagens abaixo.
Acessórios e Garantia
Não há extras na caixa além do adaptador AC e da papelada. Aplica-se uma garantia limitada de fabricante de um ano, o que é decepcionante considerando o alto preço inicial do modelo. Uma cobertura de 3 anos deveria ter sido padrão.
Mostrar
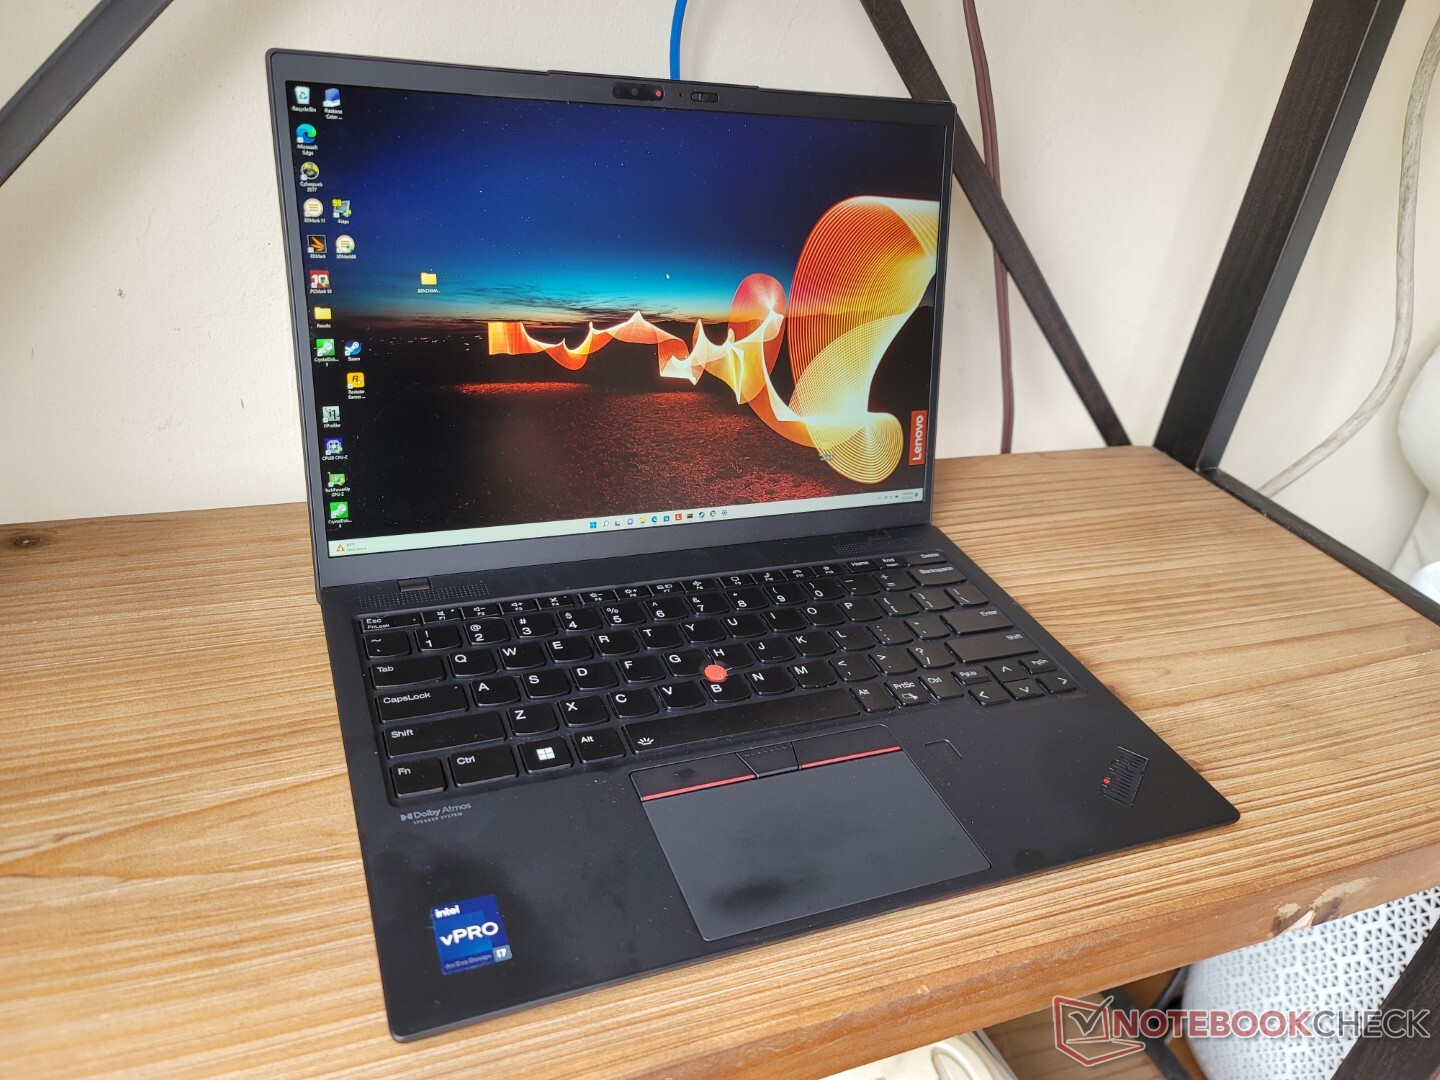
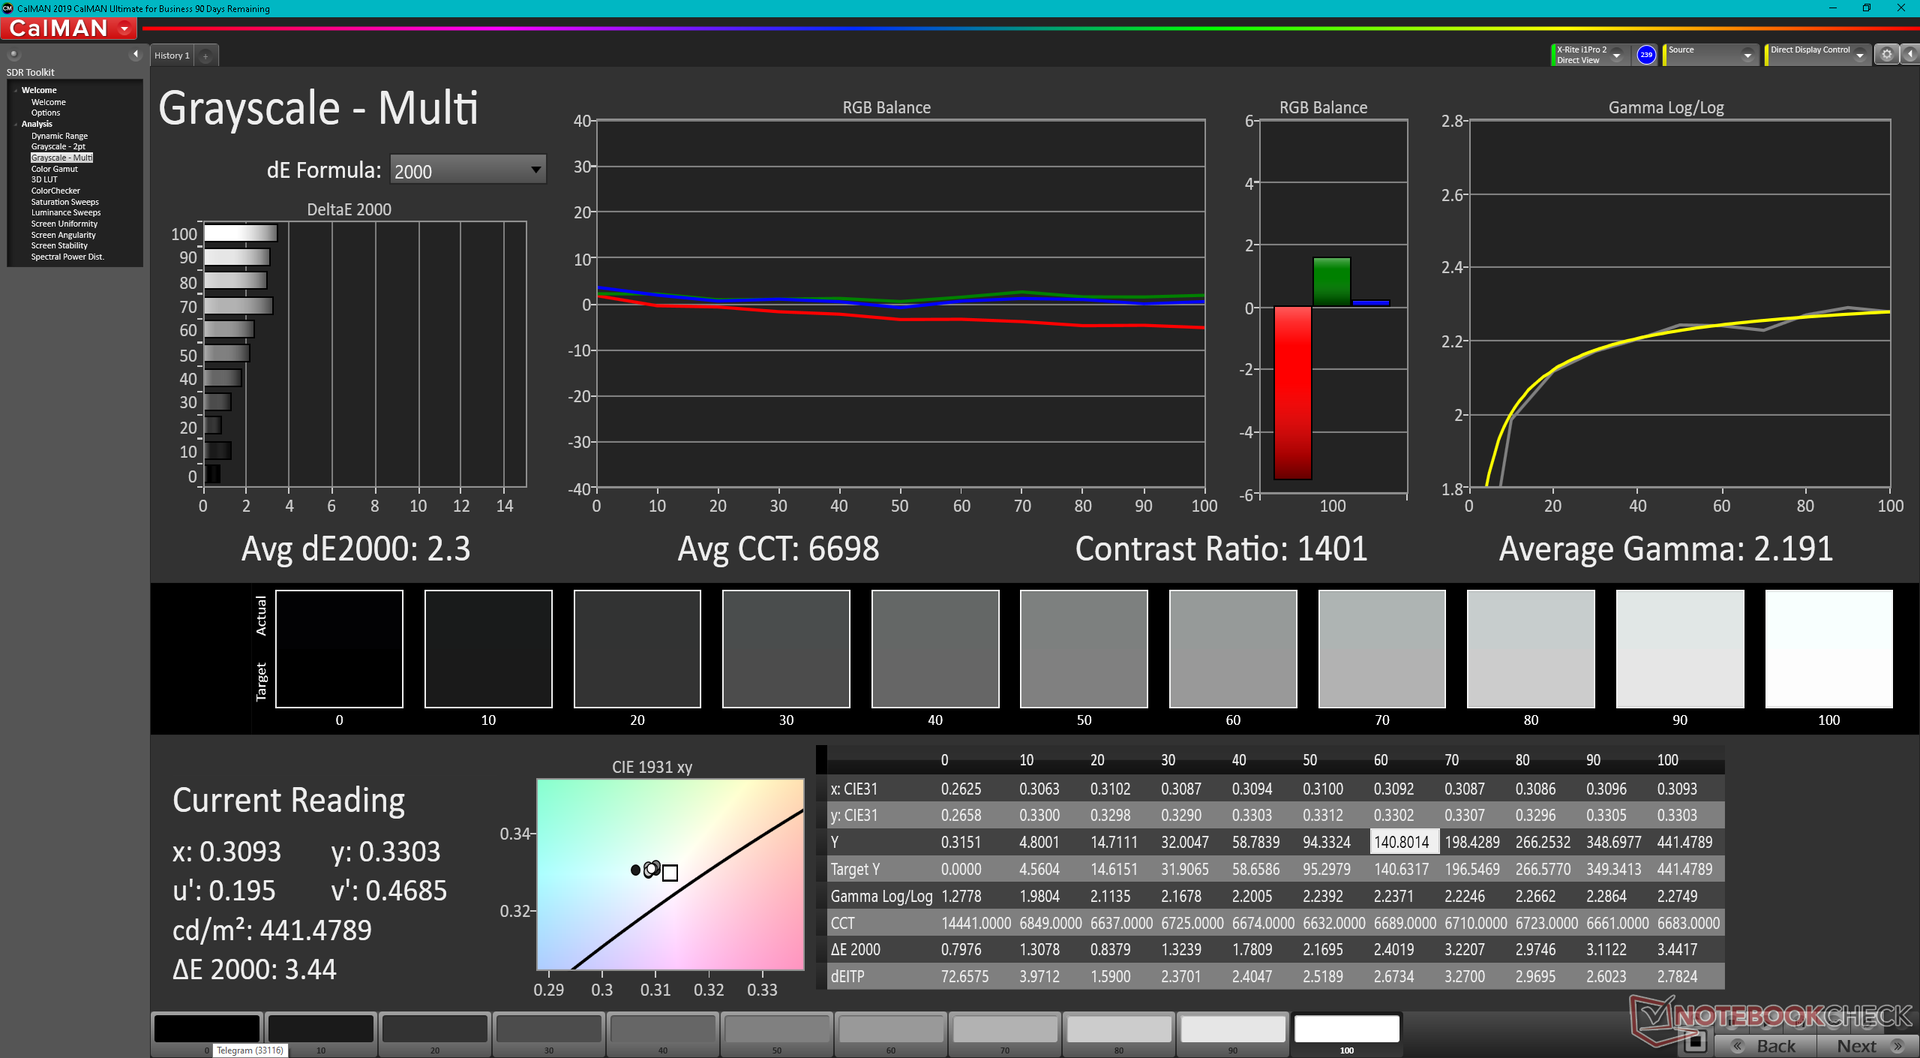
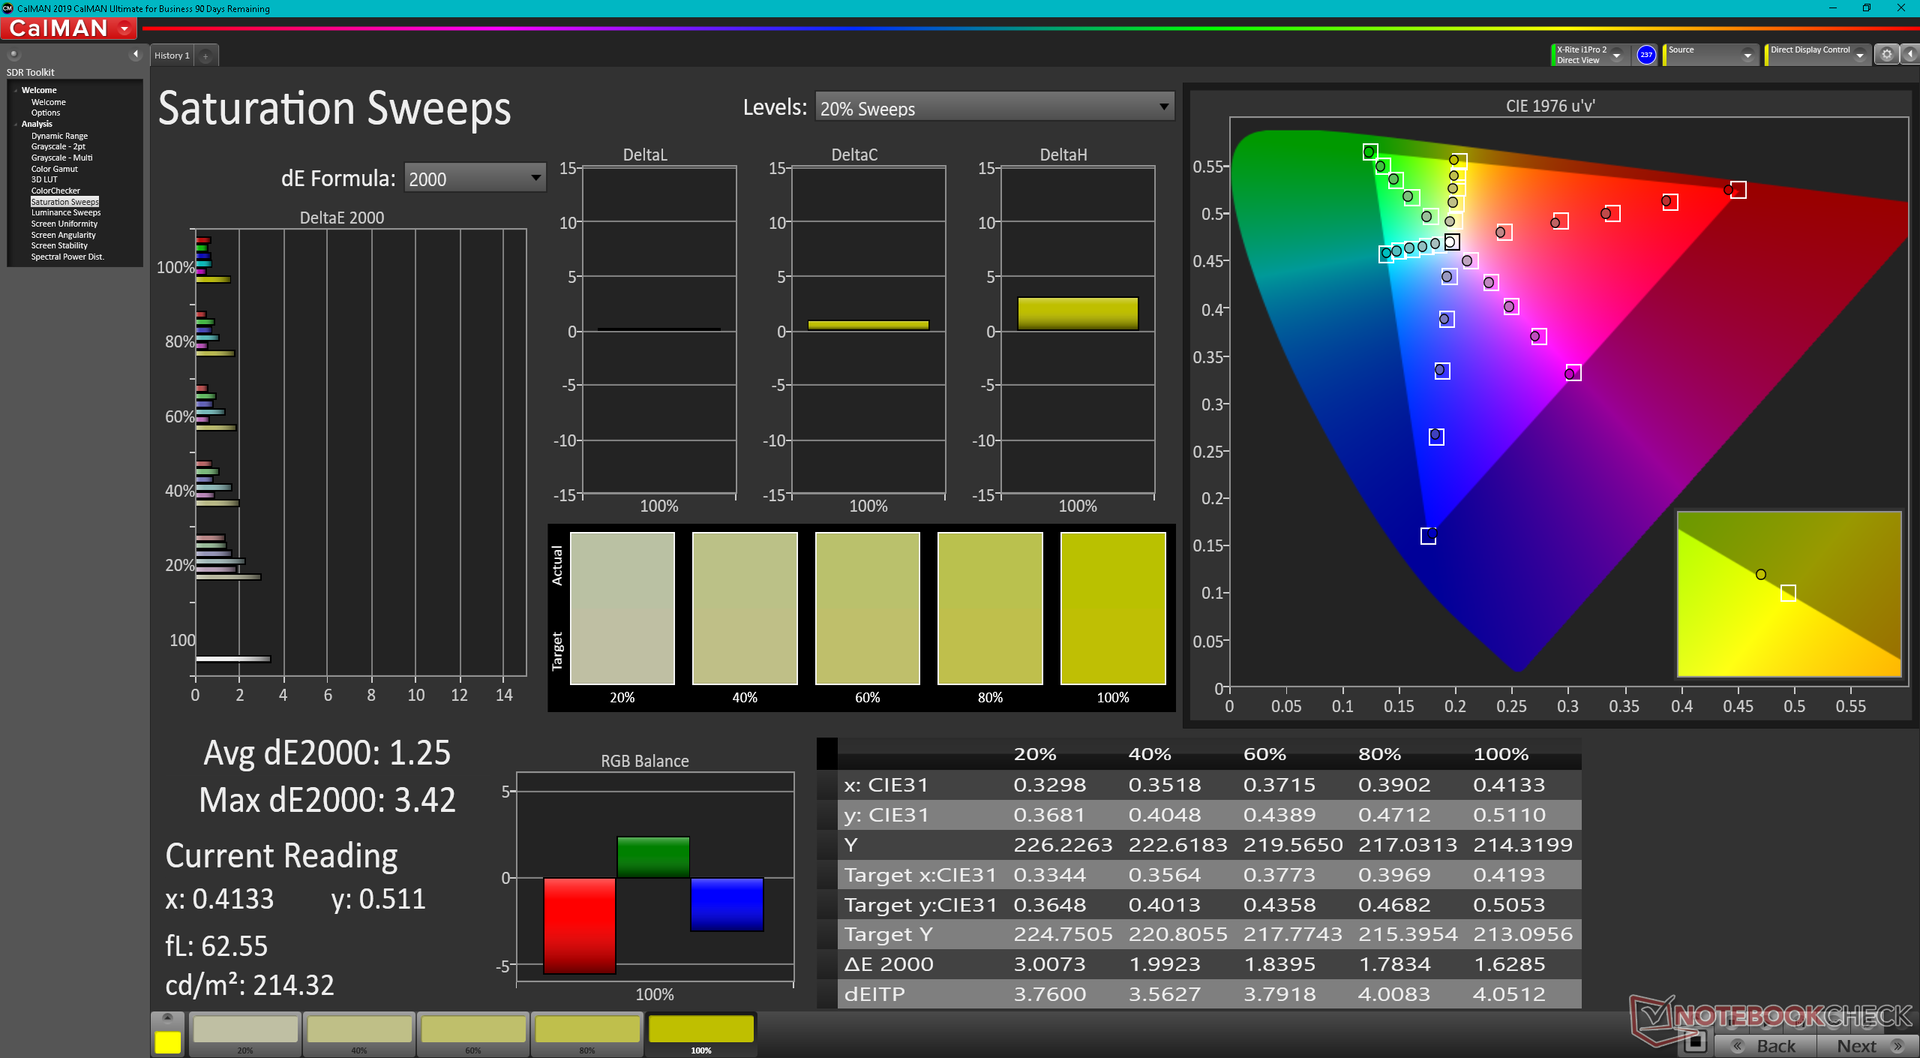
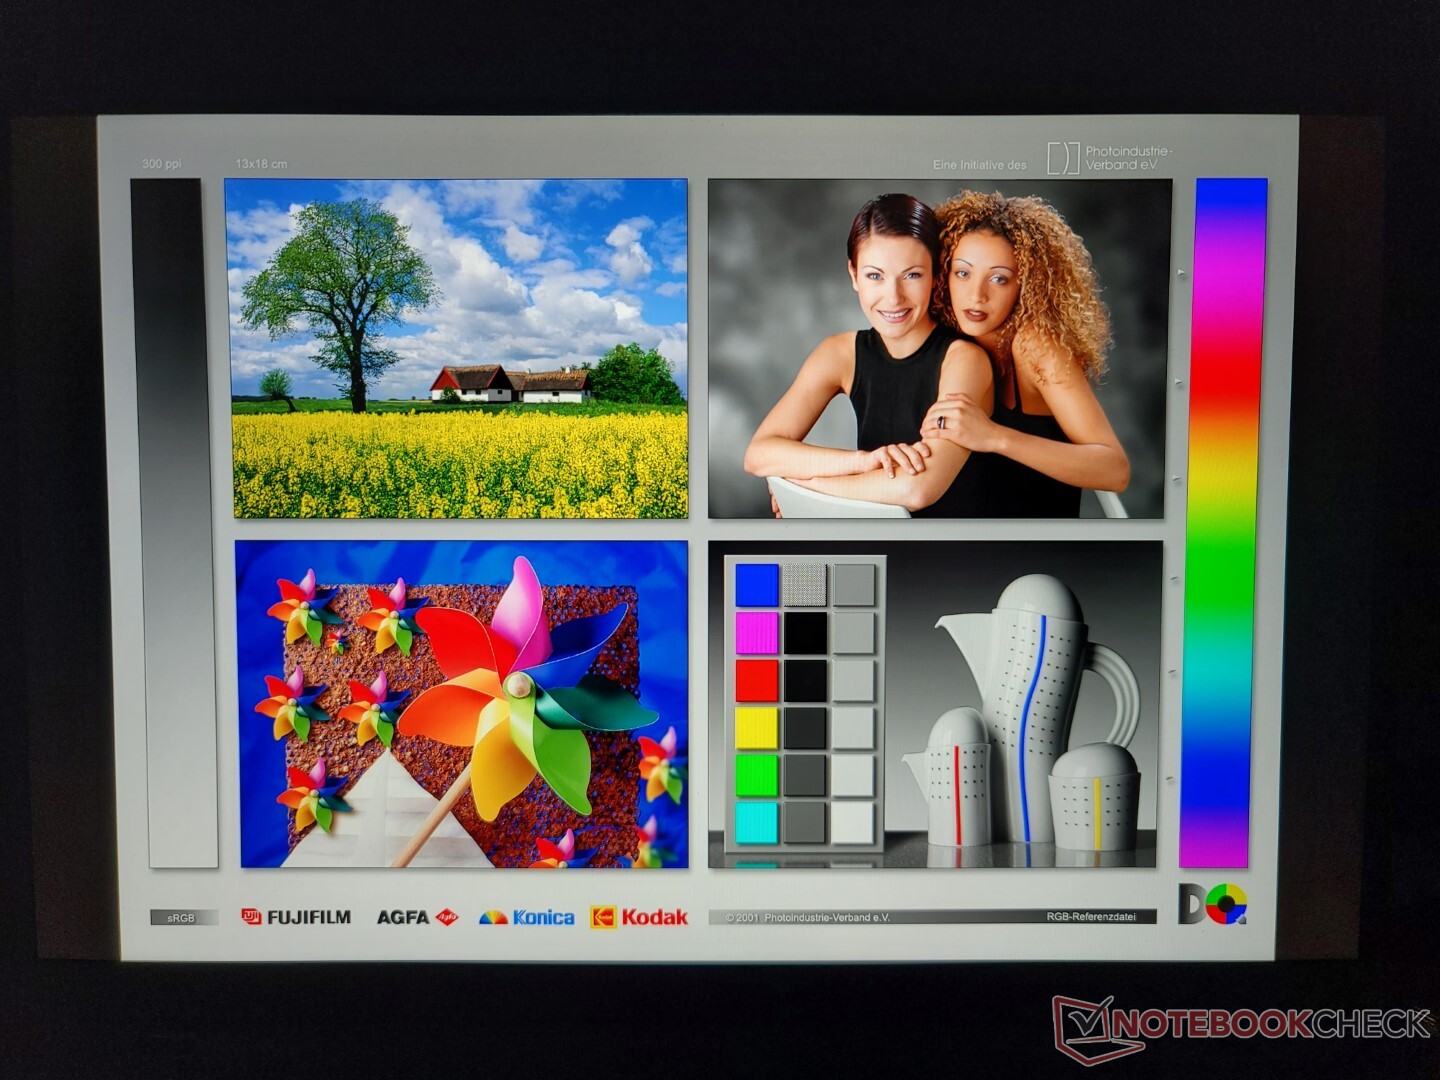
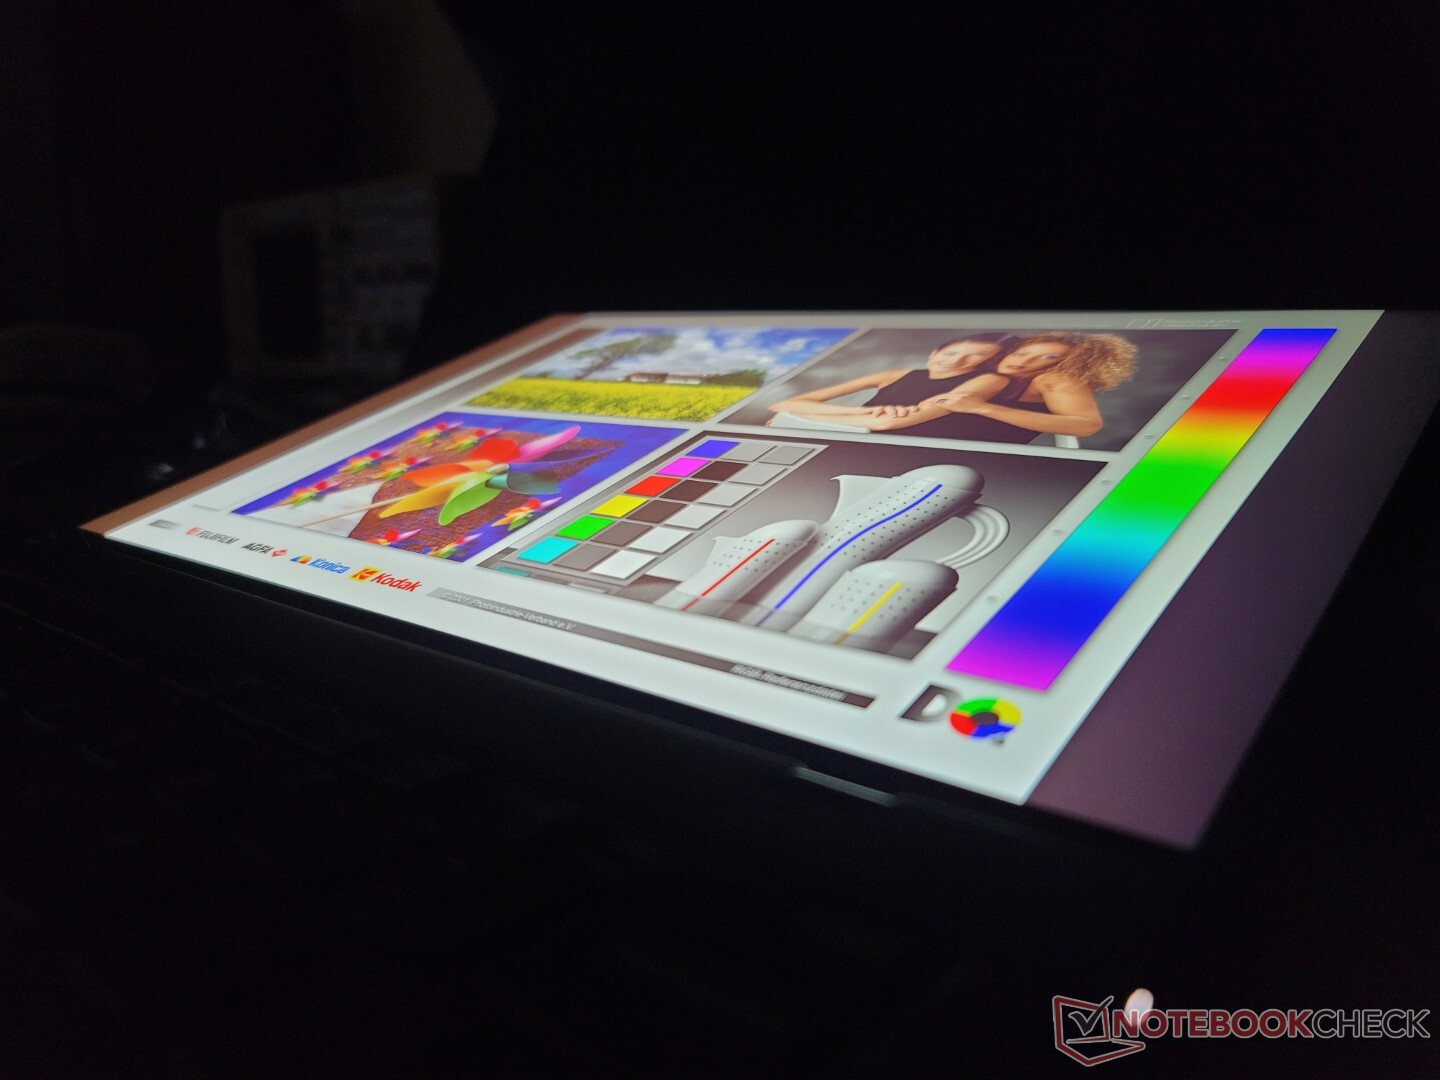
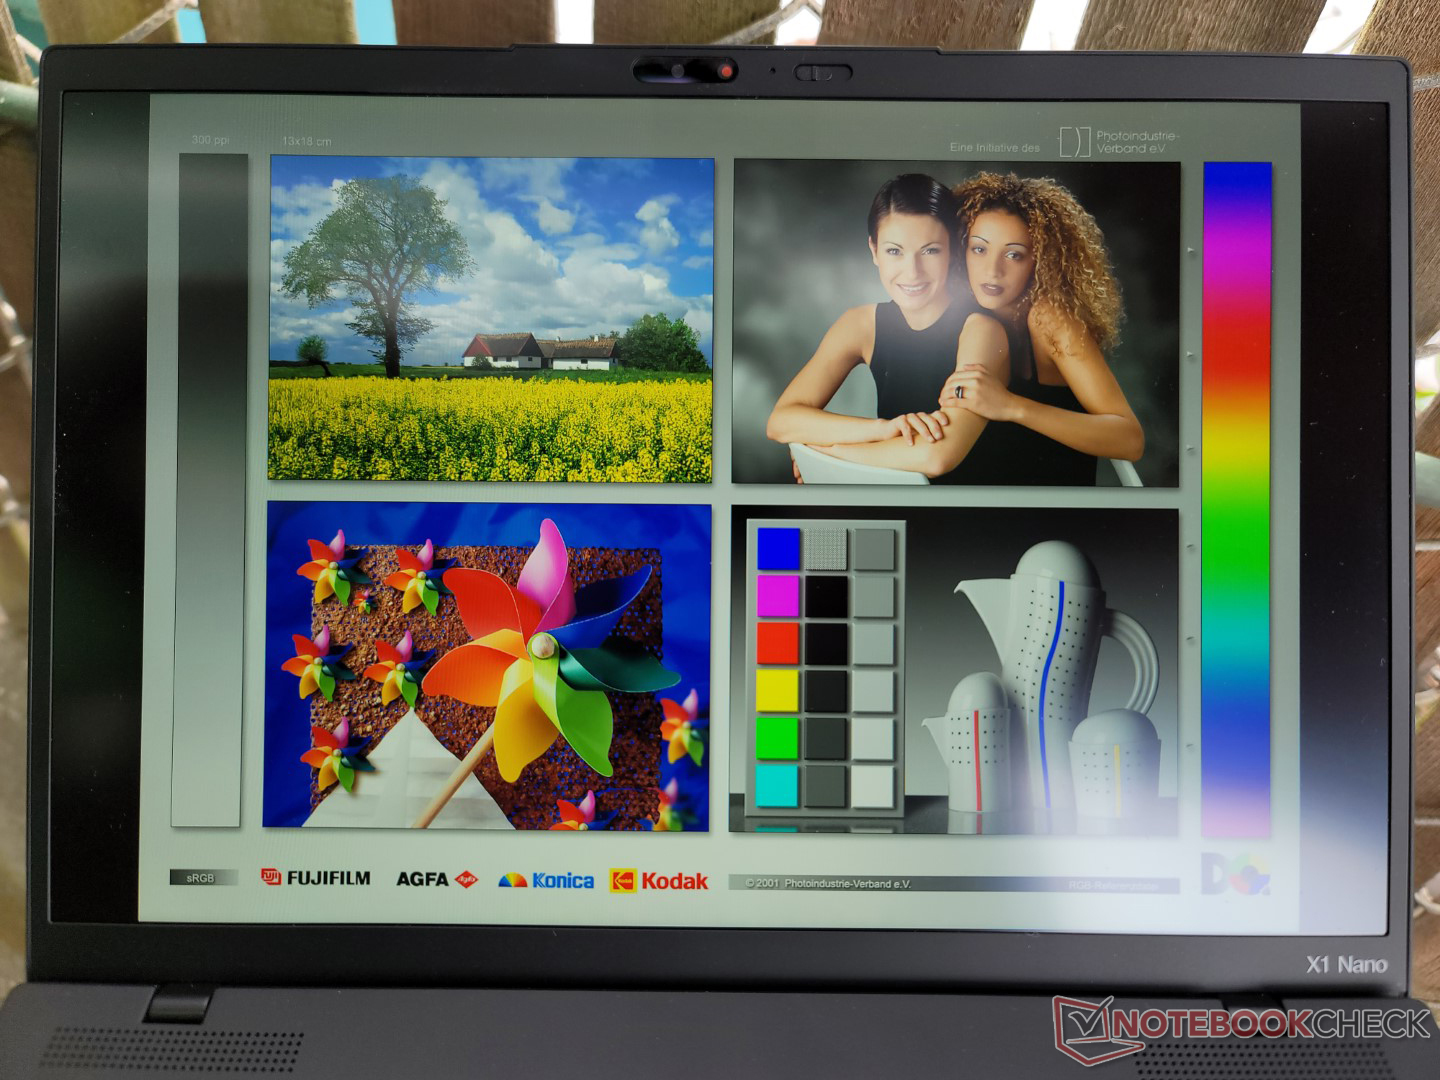
Nossa unidade de teste Gen 2 utiliza um painel IPS diferente daquele encontrado na versão Gen 1 original (P101ZFZ-BH2 vs. MND007ZA1-2). No entanto, seus atributos principais permanecem quase idênticos para essencialmente a mesma experiência de visualização. Os usuários ainda estão recebendo um painel de 450-nit com cobertura total de sRGB e relação de contraste >1000:1. Os tempos de resposta preto-branco e cinza-cinza poderiam ser melhores, mas isto não é um problema para a navegação ou cargas de trabalho do tipo escritório.


| |||||||||||||||||||||||||
iluminação: 94 %
iluminação com acumulador: 469.6 cd/m²
Contraste: 1269:1 (Preto: 0.37 cd/m²)
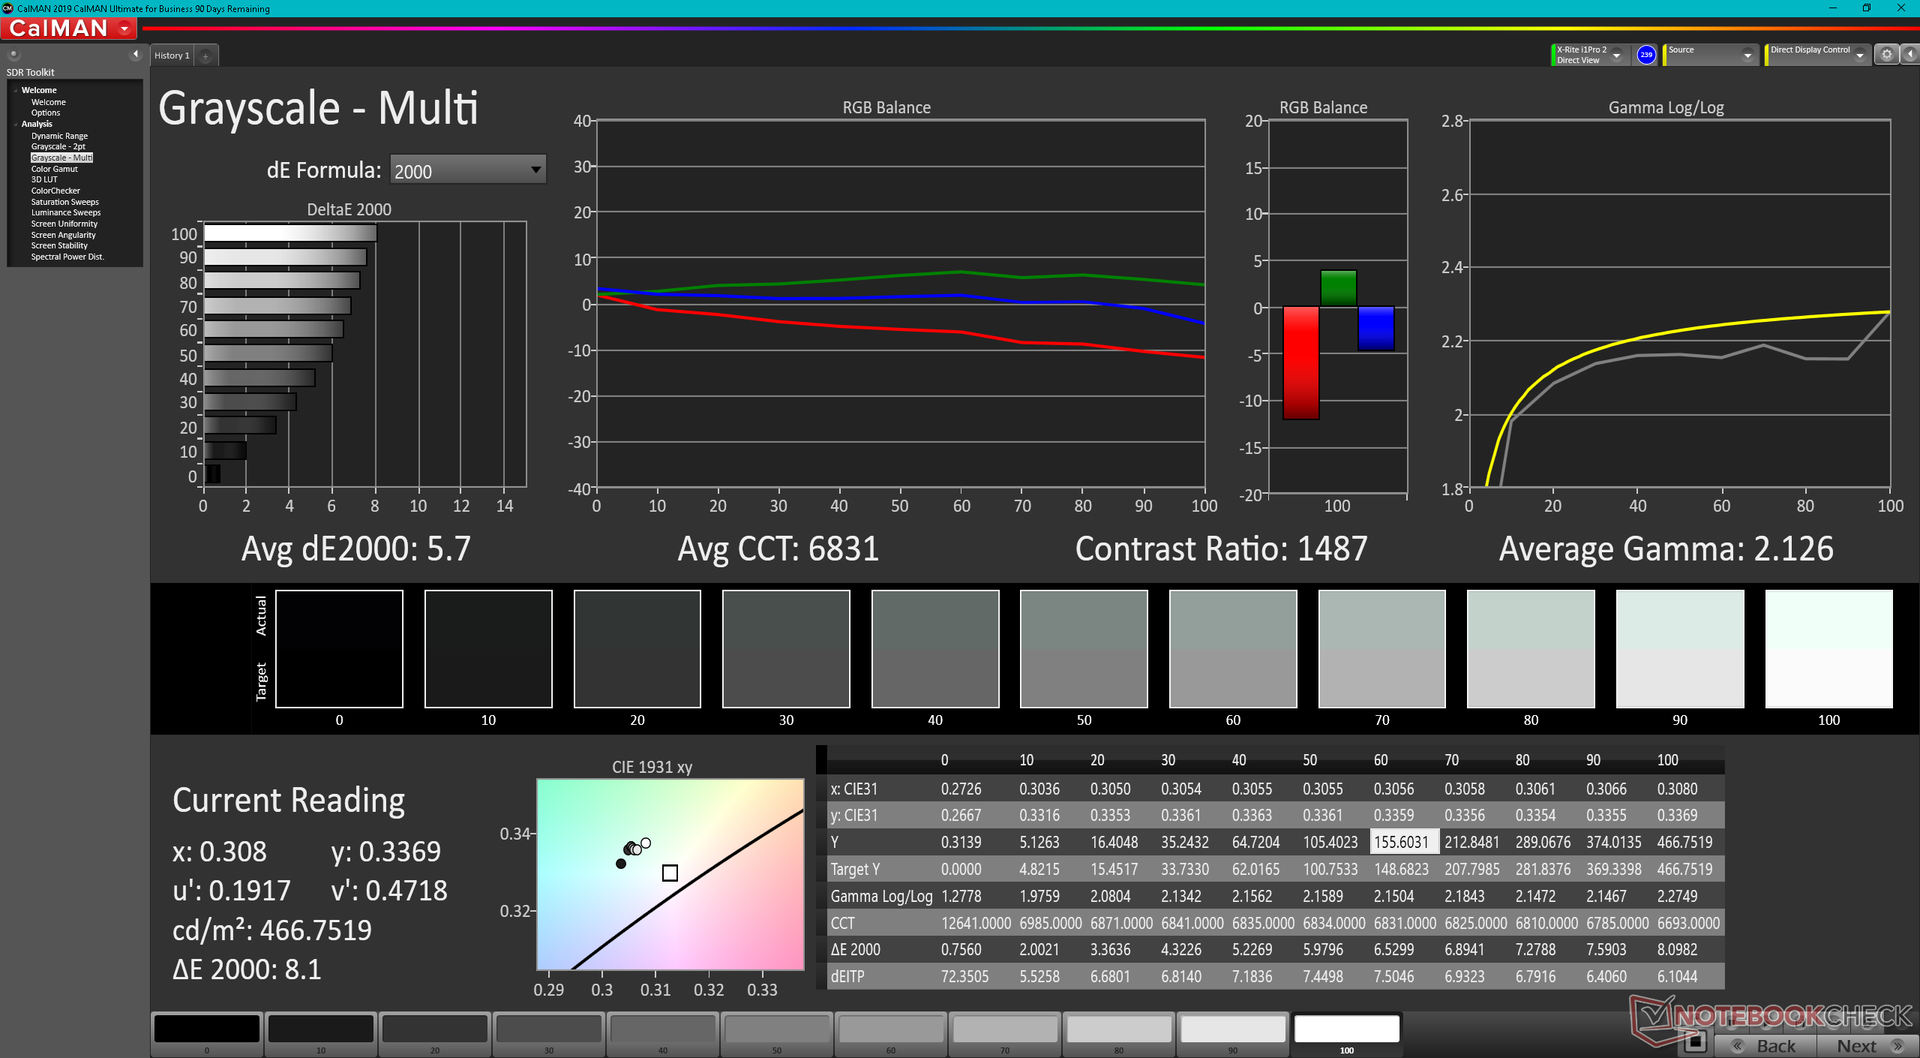
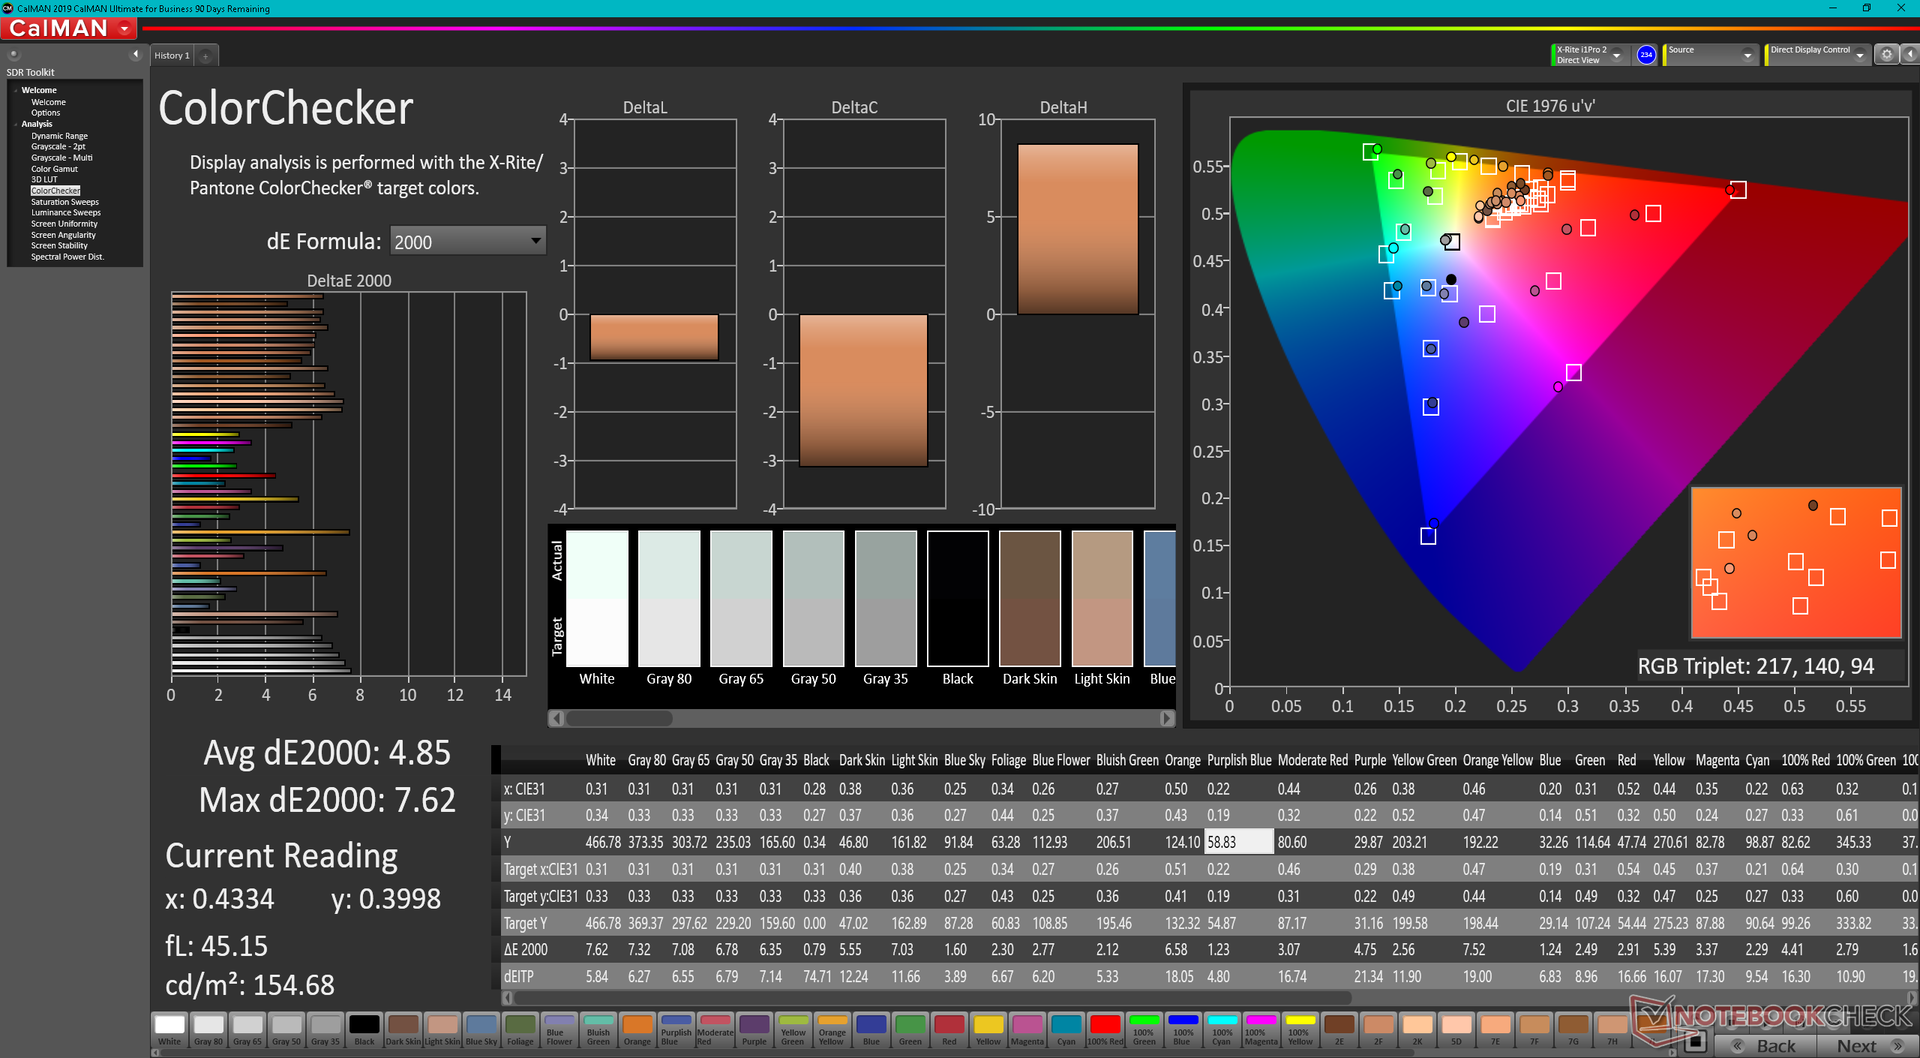
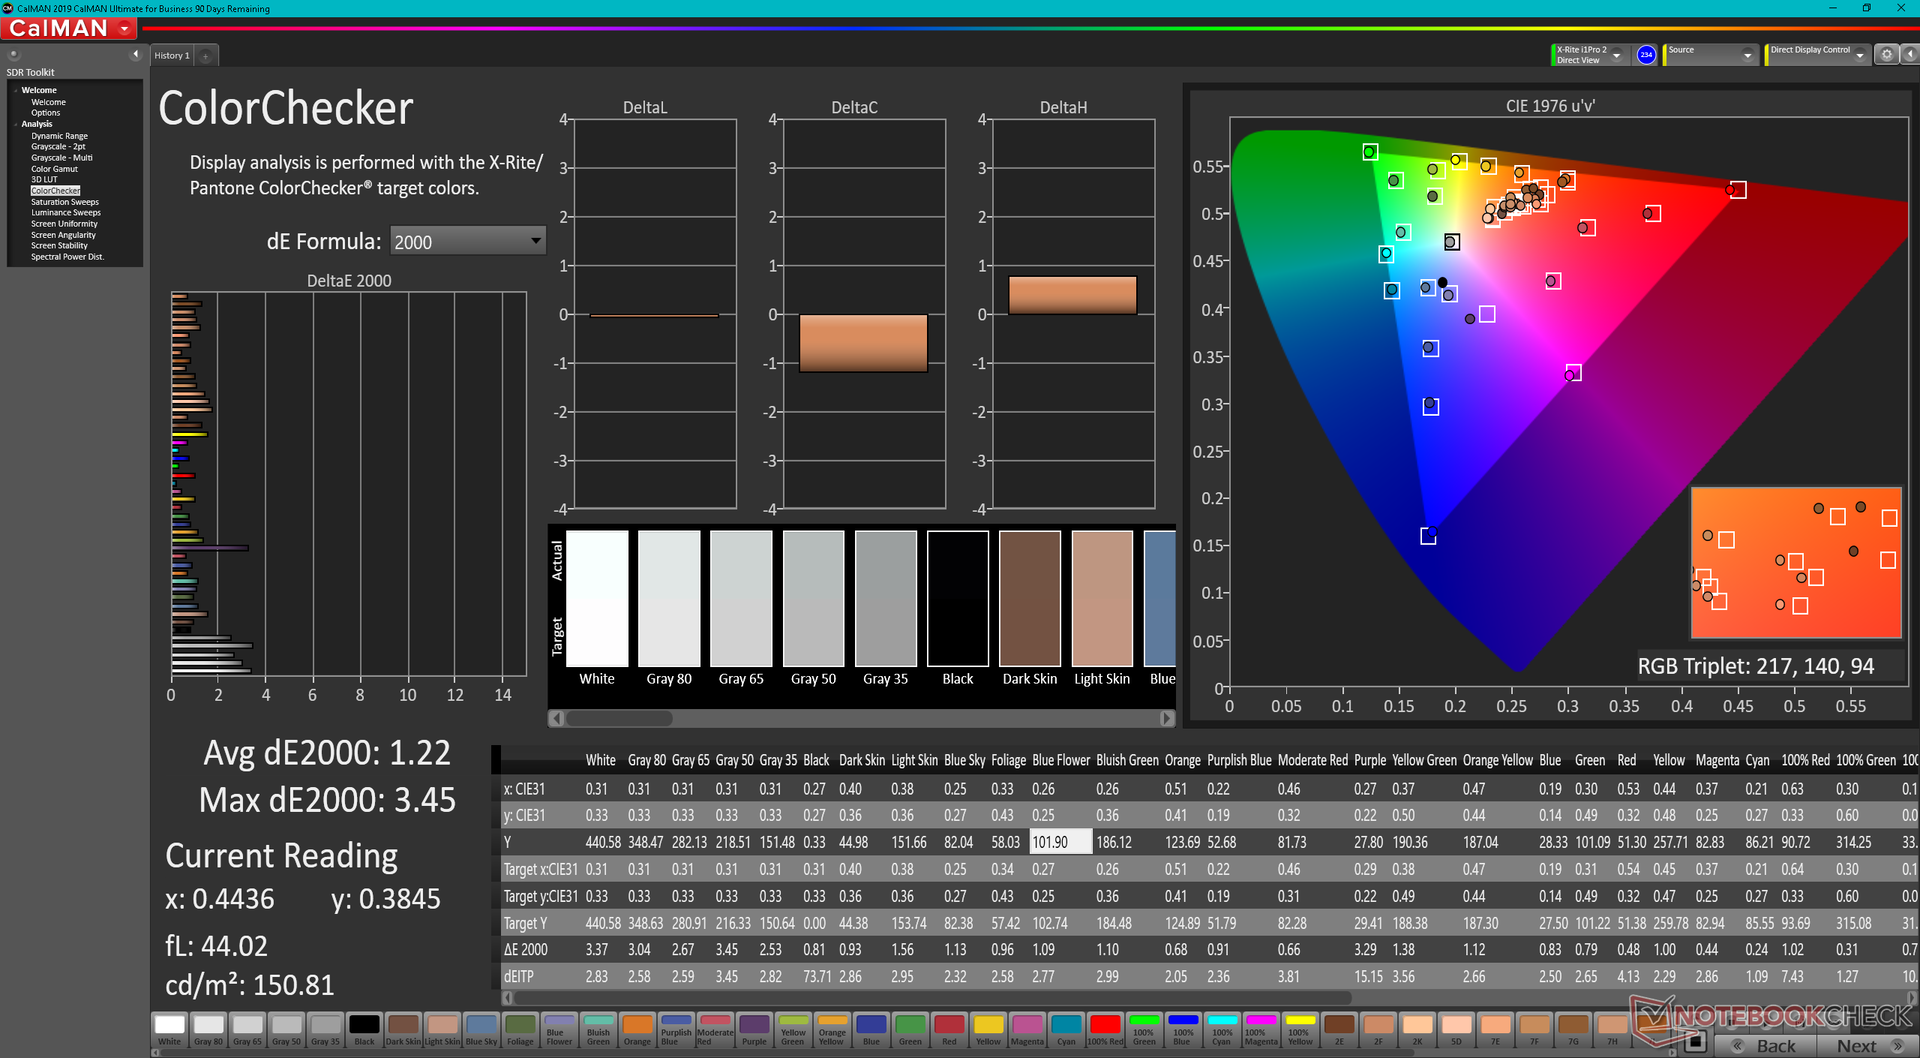
ΔE ColorChecker Calman: 4.85 | ∀{0.5-29.43 Ø4.71}
calibrated: 1.22
ΔE Greyscale Calman: 5.7 | ∀{0.09-98 Ø4.96}
68.3% AdobeRGB 1998 (Argyll 3D)
96.1% sRGB (Argyll 3D)
66.2% Display P3 (Argyll 3D)
Gamma: 2.13
CCT: 6931 K
| Lenovo ThinkPad X1 Nano Gen 2 Core i7-1280P P101ZFZ-BH2, IPS, 2160x1350, 13" | Lenovo ThinkPad X1 Nano-20UN002UGE MND007ZA1-2, IPS, 2160x1350, 13" | HP Elite Dragonfly G3 Chi Mei CMN13C0, IPS, 1920x1280, 13.5" | Dell Latitude 13 7330 LG Philips 133WF9, IPS, 1920x1080, 13.3" | Framework Laptop 13.5 12th Gen Intel BOE CQ NE135FBM-N41, IPS, 2256x1504, 13.5" | Huawei MateBook X Pro 2021 TIANMA XM, IPS, 3000x2000, 13.9" | |
|---|---|---|---|---|---|---|
| Display | 5% | 2% | -1% | 4% | -2% | |
| Display P3 Coverage (%) | 66.2 | 70.4 6% | 68 3% | 66.1 0% | 69.9 6% | 64.9 -2% |
| sRGB Coverage (%) | 96.1 | 99.9 4% | 98.3 2% | 93.5 -3% | 99.4 3% | 94.4 -2% |
| AdobeRGB 1998 Coverage (%) | 68.3 | 72 5% | 69.9 2% | 68.2 0% | 71.1 4% | 66.3 -3% |
| Response Times | -8% | -28% | -14% | 7% | 6% | |
| Response Time Grey 50% / Grey 80% * (ms) | 43.6 ? | 46.8 ? -7% | 50.8 ? -17% | 48.4 ? -11% | 34.7 ? 20% | 37.6 ? 14% |
| Response Time Black / White * (ms) | 25.6 ? | 28 ? -9% | 35.2 ? -38% | 29.6 ? -16% | 27.5 ? -7% | 26.4 ? -3% |
| PWM Frequency (Hz) | ||||||
| Screen | 29% | 19% | 24% | 13% | 26% | |
| Brightness middle (cd/m²) | 469.6 | 460 -2% | 387.2 -18% | 460.1 -2% | 449.6 -4% | 502 7% |
| Brightness (cd/m²) | 460 | 434 -6% | 360 -22% | 445 -3% | 431 -6% | 474 3% |
| Brightness Distribution (%) | 94 | 92 -2% | 80 -15% | 89 -5% | 90 -4% | 89 -5% |
| Black Level * (cd/m²) | 0.37 | 0.27 27% | 0.26 30% | 0.31 16% | 0.31 16% | 0.33 11% |
| Contrast (:1) | 1269 | 1704 34% | 1489 17% | 1484 17% | 1450 14% | 1521 20% |
| Colorchecker dE 2000 * | 4.85 | 1.1 77% | 2.36 51% | 2.42 50% | 2.76 43% | 1.35 72% |
| Colorchecker dE 2000 max. * | 7.62 | 4.5 41% | 4.79 37% | 3.97 48% | 7.96 -4% | 3.67 52% |
| Colorchecker dE 2000 calibrated * | 1.22 | 1 18% | 0.63 48% | 0.77 37% | 0.58 52% | 1.2 2% |
| Greyscale dE 2000 * | 5.7 | 1.6 72% | 3 47% | 2.3 60% | 5.2 9% | 1.7 70% |
| Gamma | 2.13 103% | 2.2 100% | 2.17 101% | 2.23 99% | 2.23 99% | 2.24 98% |
| CCT | 6931 94% | 6475 100% | 6137 106% | 6262 104% | 6475 100% | 6440 101% |
| Color Space (Percent of AdobeRGB 1998) (%) | 65.7 | 61.1 | ||||
| Color Space (Percent of sRGB) (%) | 99.9 | 94.3 | ||||
| Média Total (Programa/Configurações) | 9% /
18% | -2% /
9% | 3% /
13% | 8% /
10% | 10% /
17% |
* ... menor é melhor
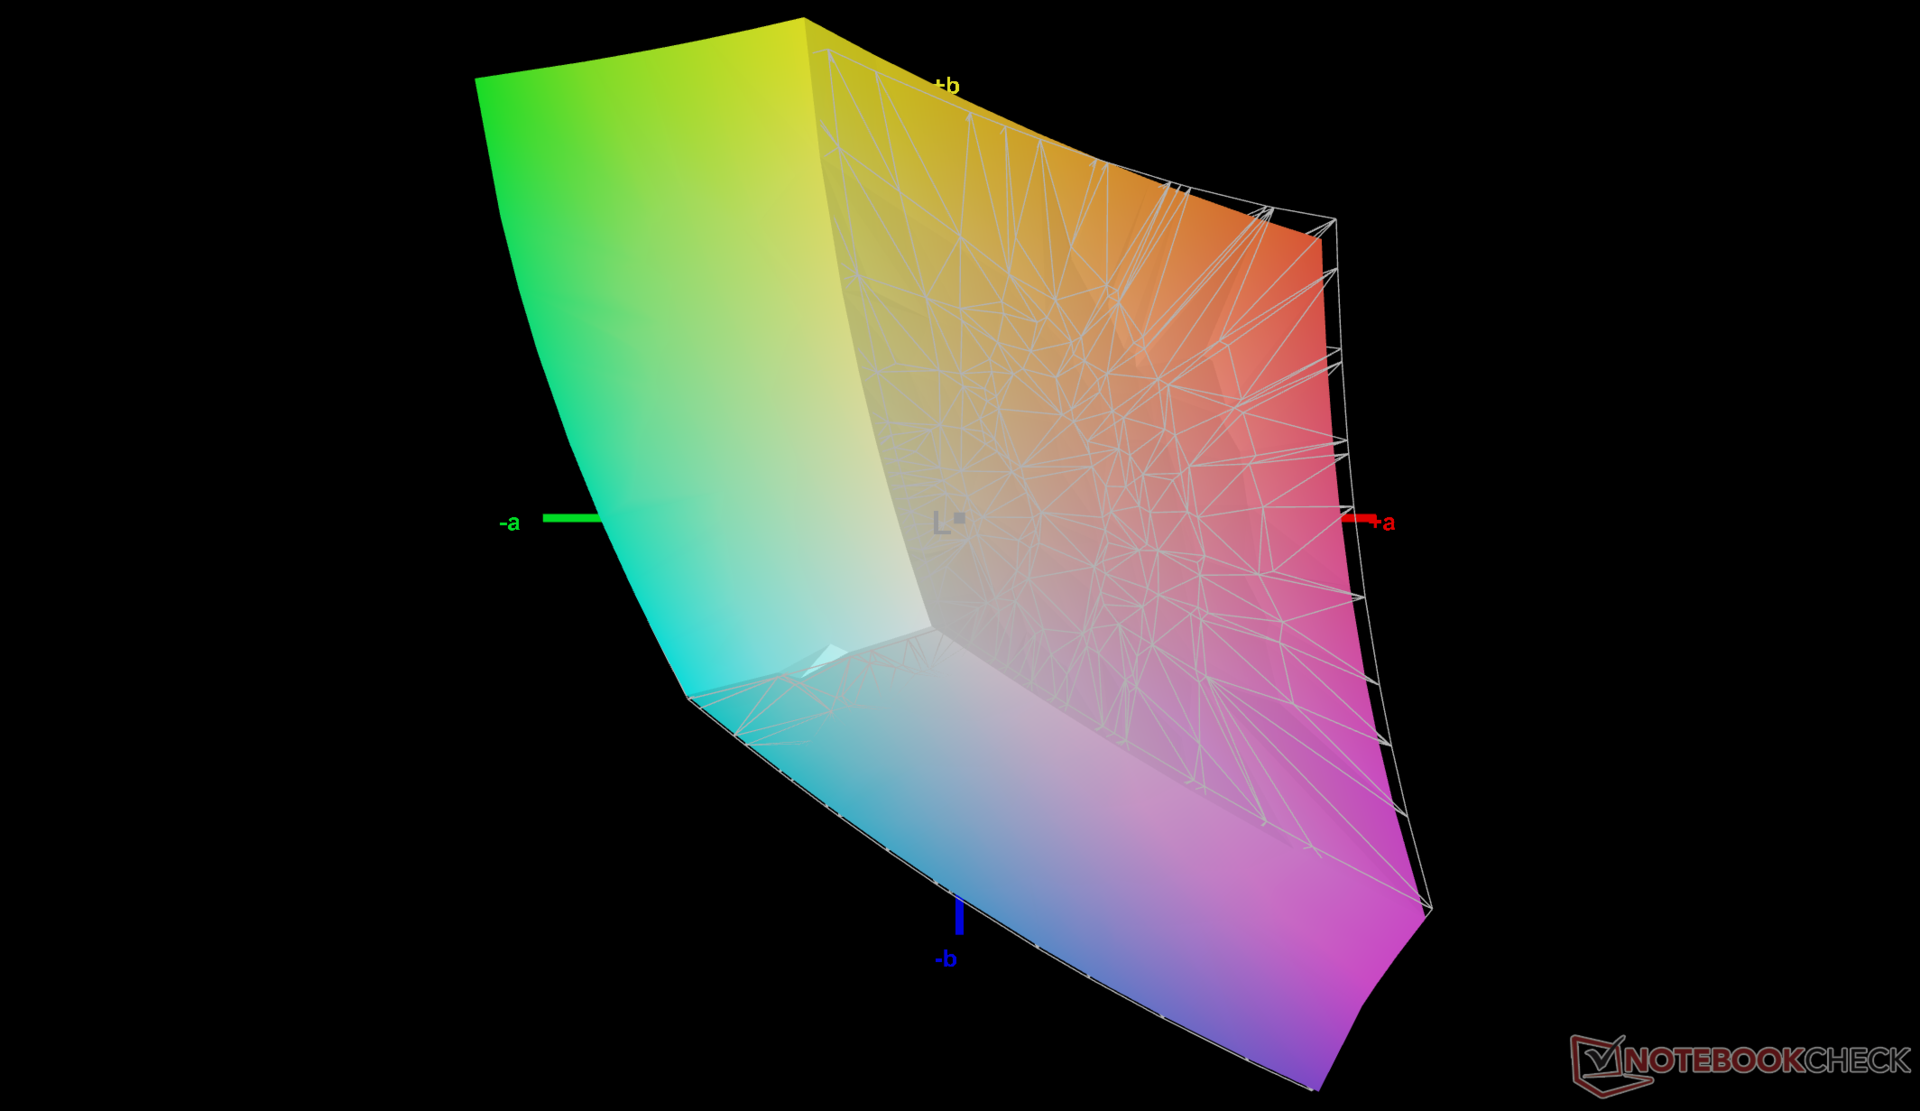
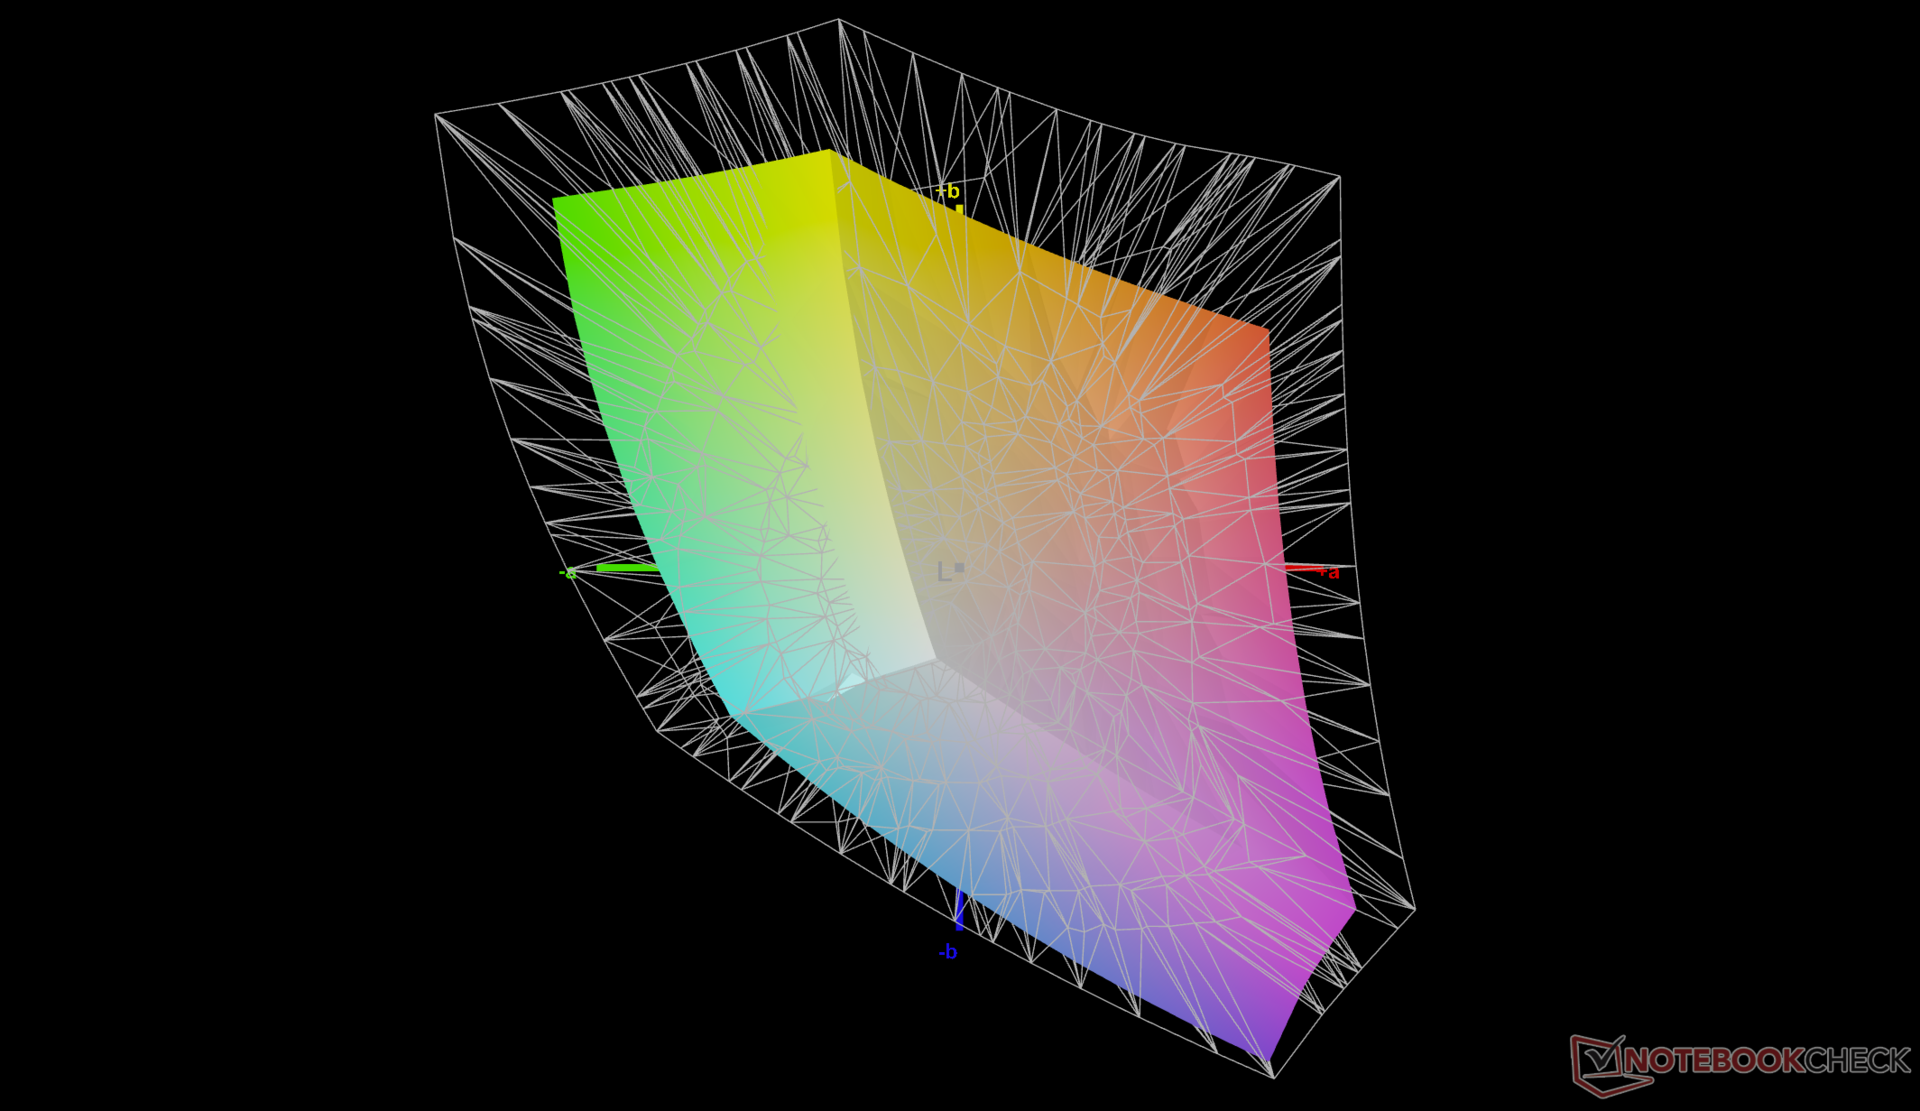
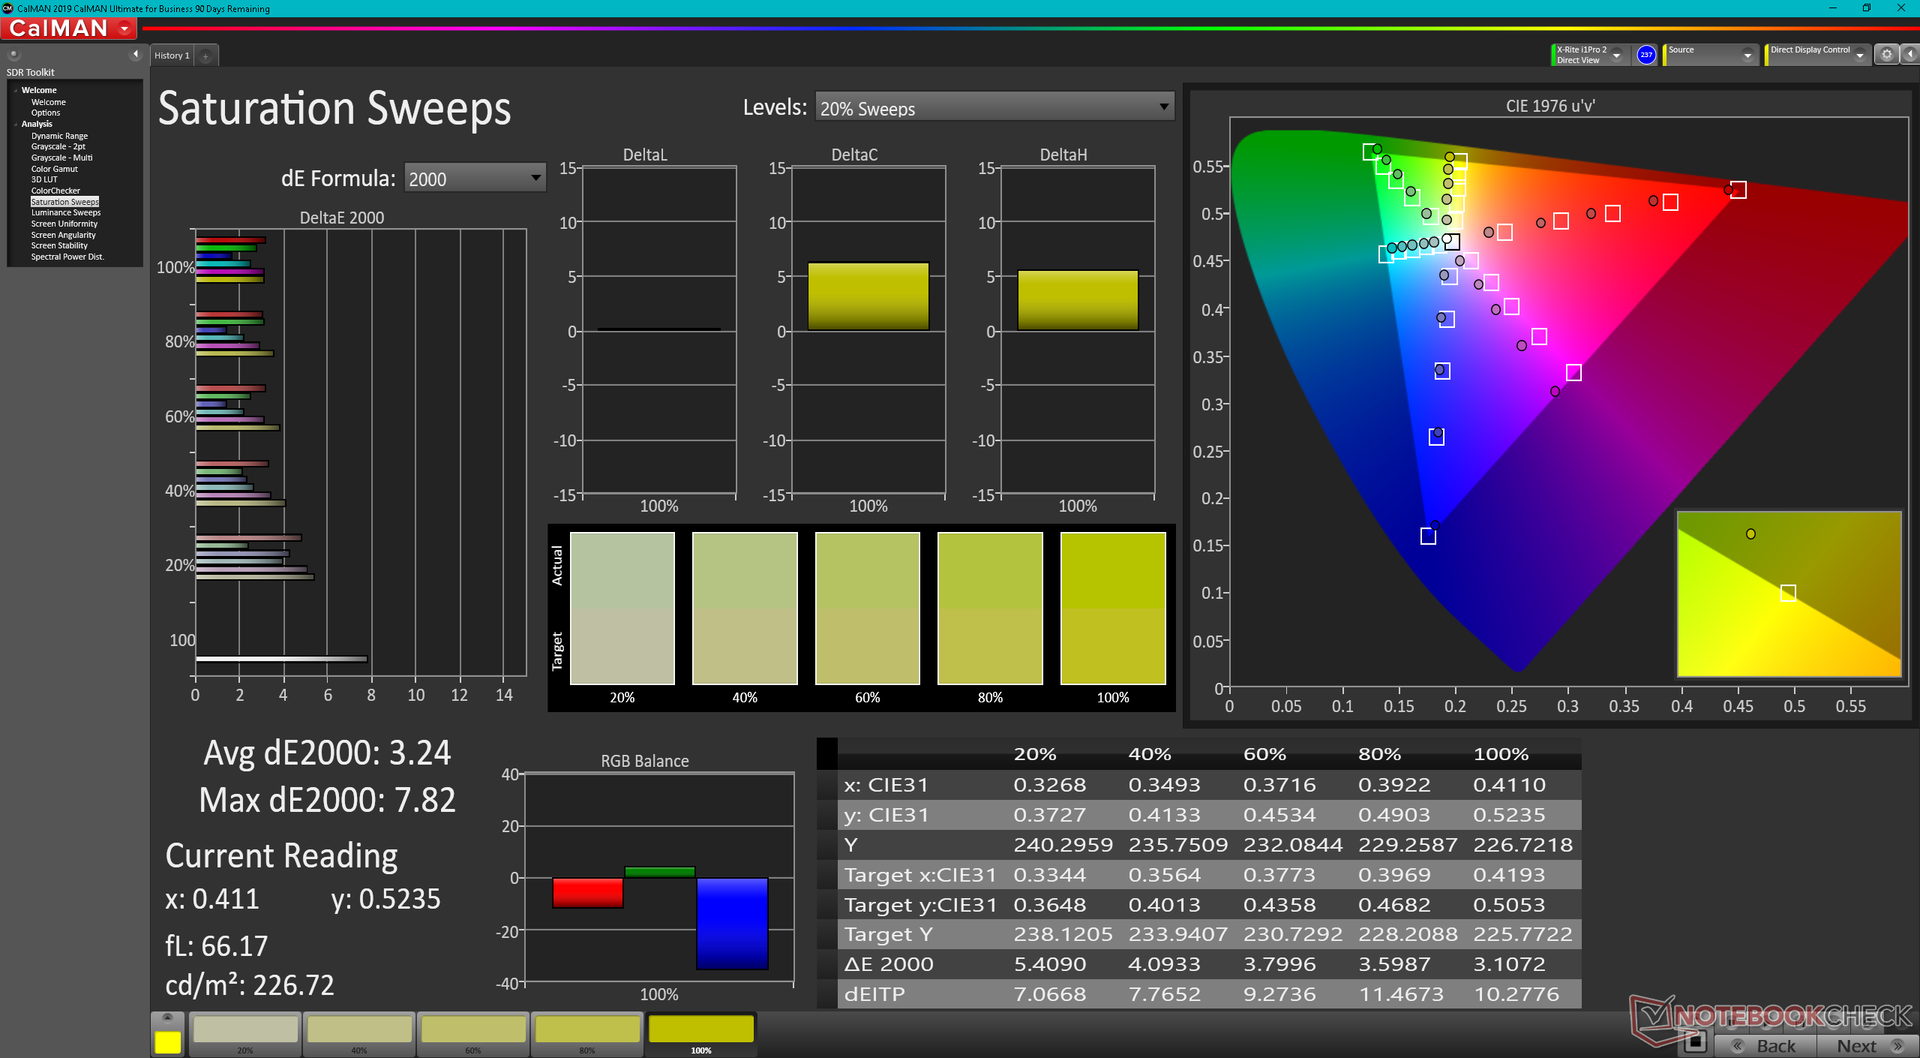
O painel não está bem calibrado fora da caixa. Calibrá-lo nós mesmos melhoraria muito os valores médios de escala de cinza e deltaE de cor de 5,7 e 4,85 para apenas 2,3 e 1,22, respectivamente. Recomendamos uma calibração do usuário final para melhor explorar toda a cobertura sRGB do painel.
Exibir tempos de resposta
| ↔ Tempo de resposta preto para branco | ||
|---|---|---|
| 25.6 ms ... ascensão ↗ e queda ↘ combinadas | ↗ 13.2 ms ascensão | 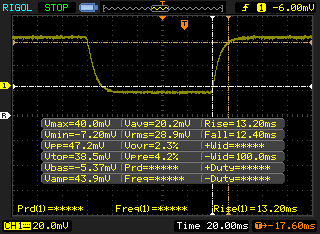 |
| ↘ 12.4 ms queda | ||
| A tela mostra taxas de resposta relativamente lentas em nossos testes e pode ser muito lenta para os jogadores. Em comparação, todos os dispositivos testados variam de 0.1 (mínimo) a 240 (máximo) ms. » 61 % de todos os dispositivos são melhores. Isso significa que o tempo de resposta medido é pior que a média de todos os dispositivos testados (19.8 ms). | ||
| ↔ Tempo de resposta 50% cinza a 80% cinza | ||
| 43.6 ms ... ascensão ↗ e queda ↘ combinadas | ↗ 22 ms ascensão | 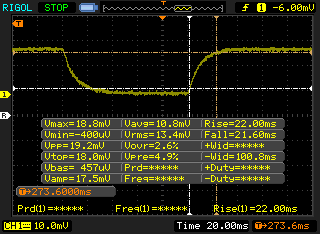 |
| ↘ 21.6 ms queda | ||
| A tela mostra taxas de resposta lentas em nossos testes e será insatisfatória para os jogadores. Em comparação, todos os dispositivos testados variam de 0.165 (mínimo) a 636 (máximo) ms. » 73 % de todos os dispositivos são melhores. Isso significa que o tempo de resposta medido é pior que a média de todos os dispositivos testados (31 ms). | ||
Cintilação da tela / PWM (modulação por largura de pulso)
| Tela tremeluzindo / PWM não detectado | 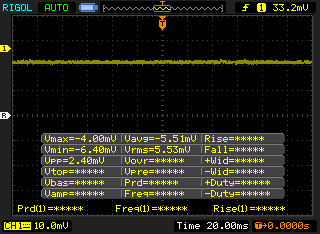 | ||
[pwm_comparison] Em comparação: 52 % de todos os dispositivos testados não usam PWM para escurecer a tela. Se PWM foi detectado, uma média de 7754 (mínimo: 5 - máximo: 343500) Hz foi medida. | |||
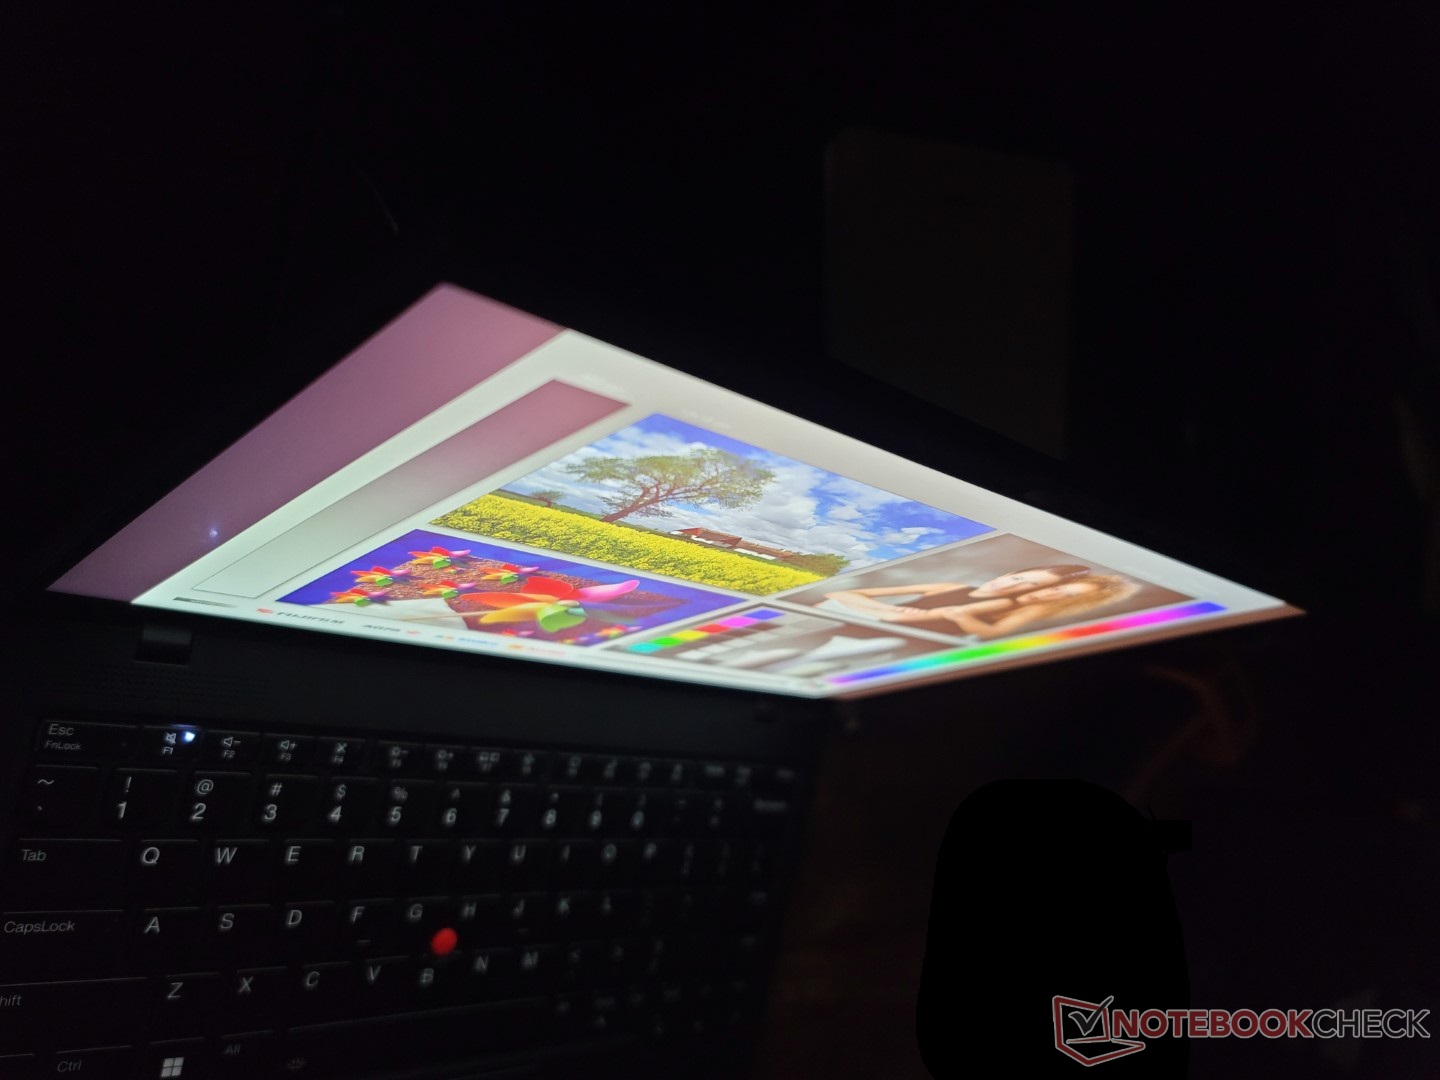
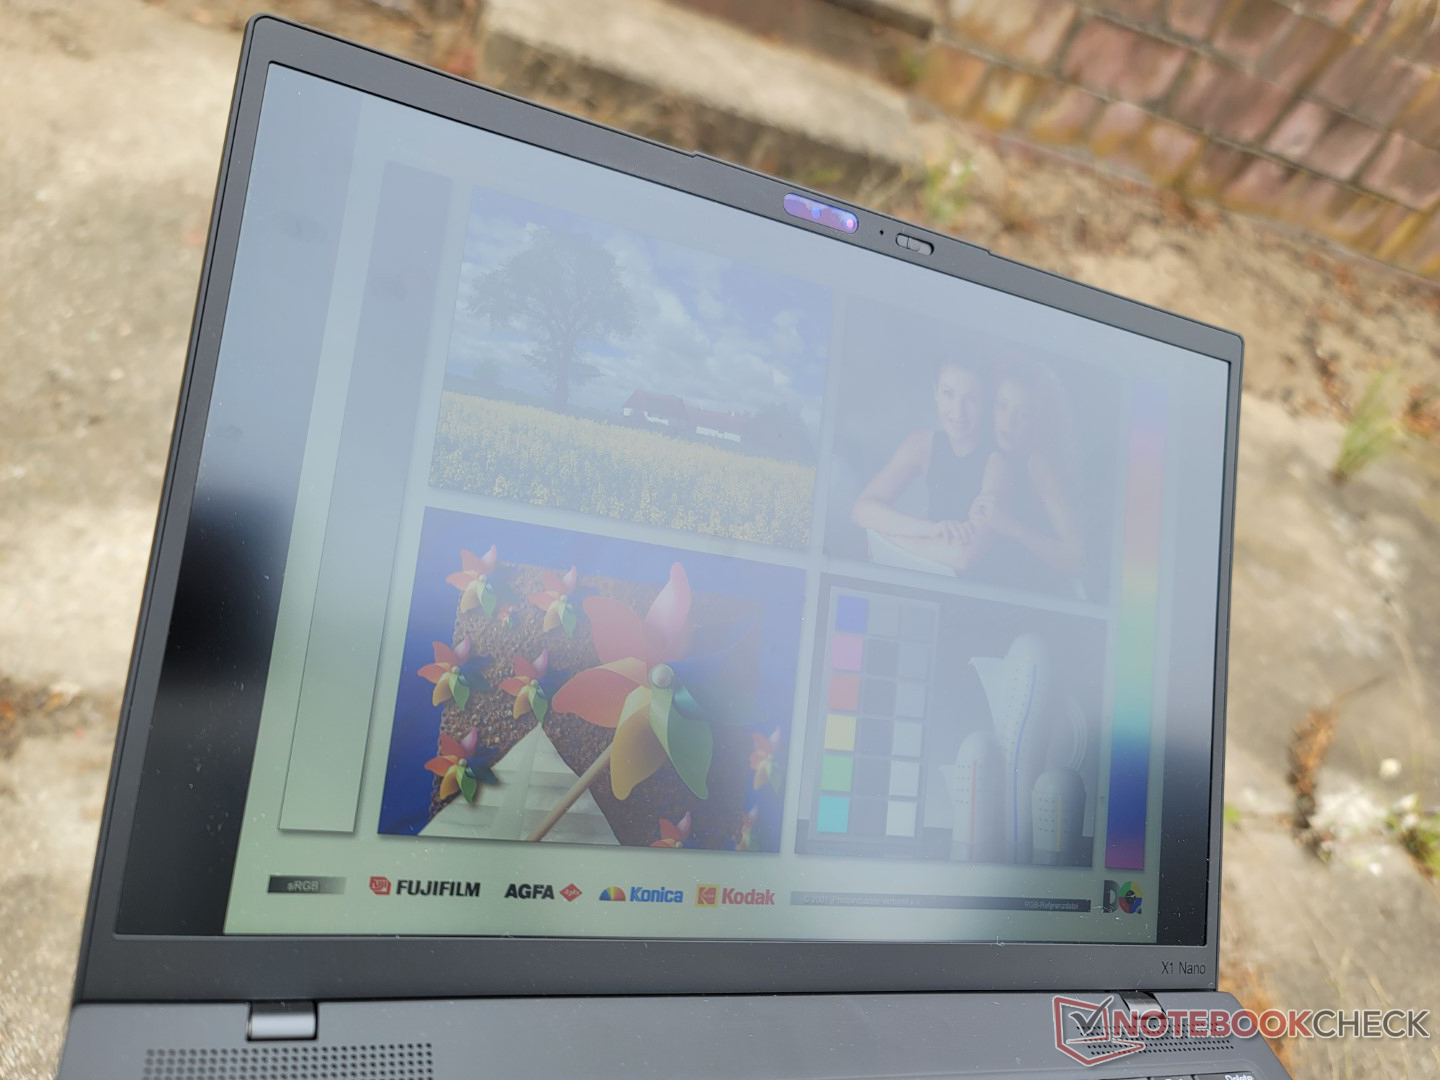
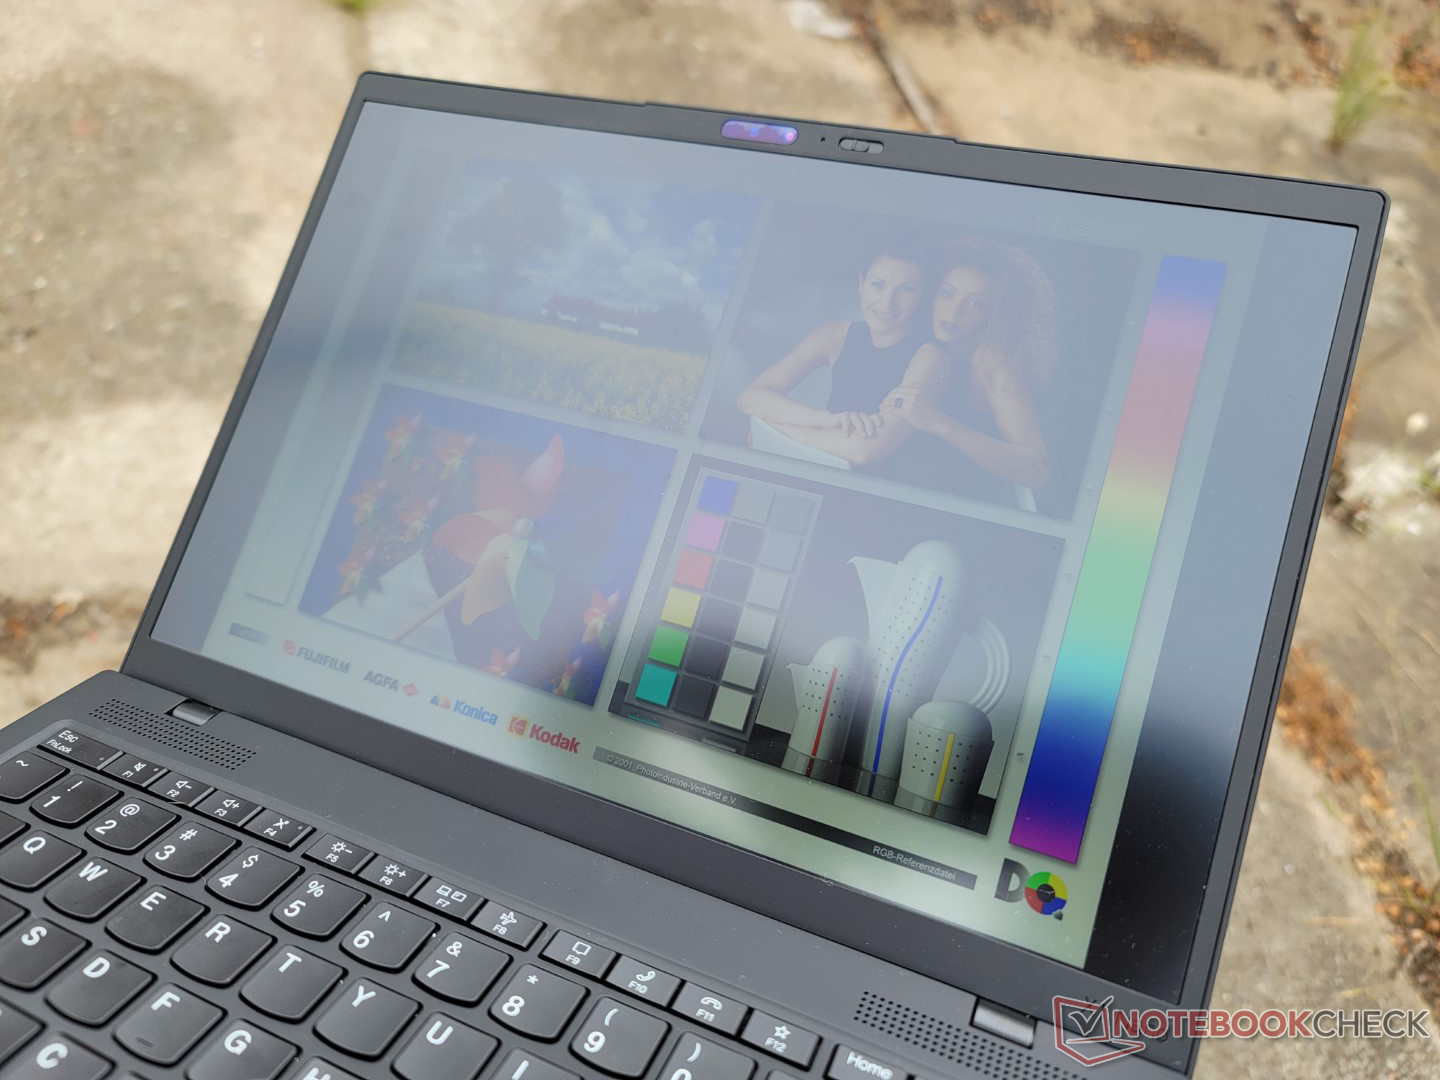
A visibilidade ao ar livre e os ângulos de visão permanecem em sua maioria iguais aos do modelo Gen 1, pois a Lenovo não aumentou o brilho ou o contraste da tela do modelo deste ano.
Desempenho
Condições de teste
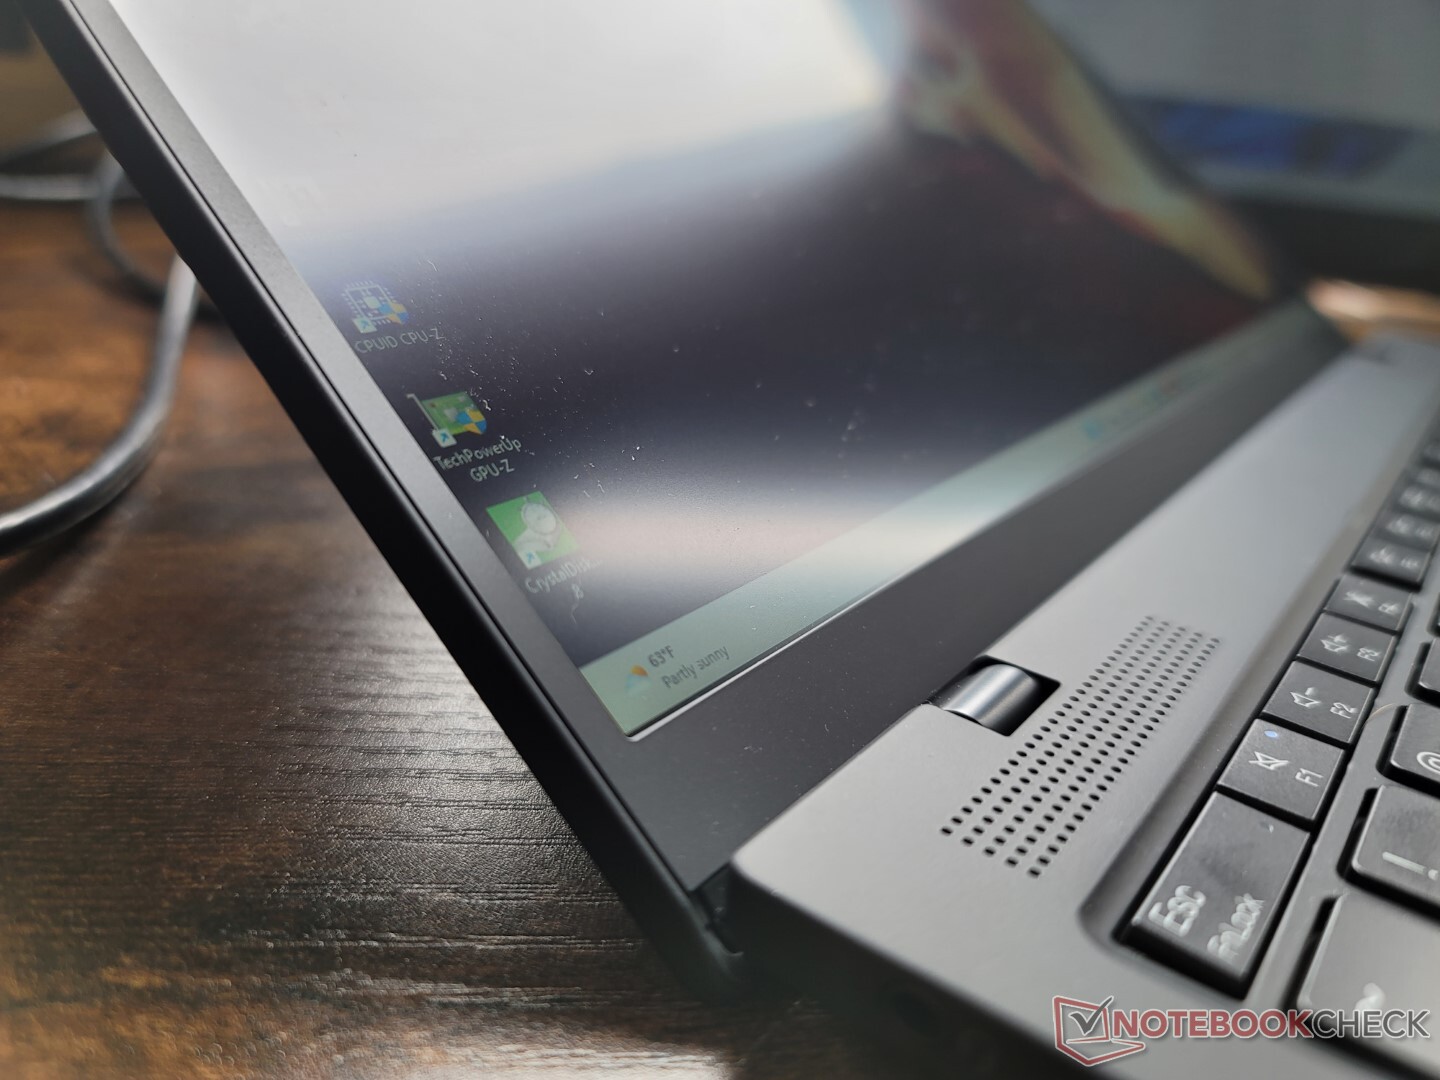
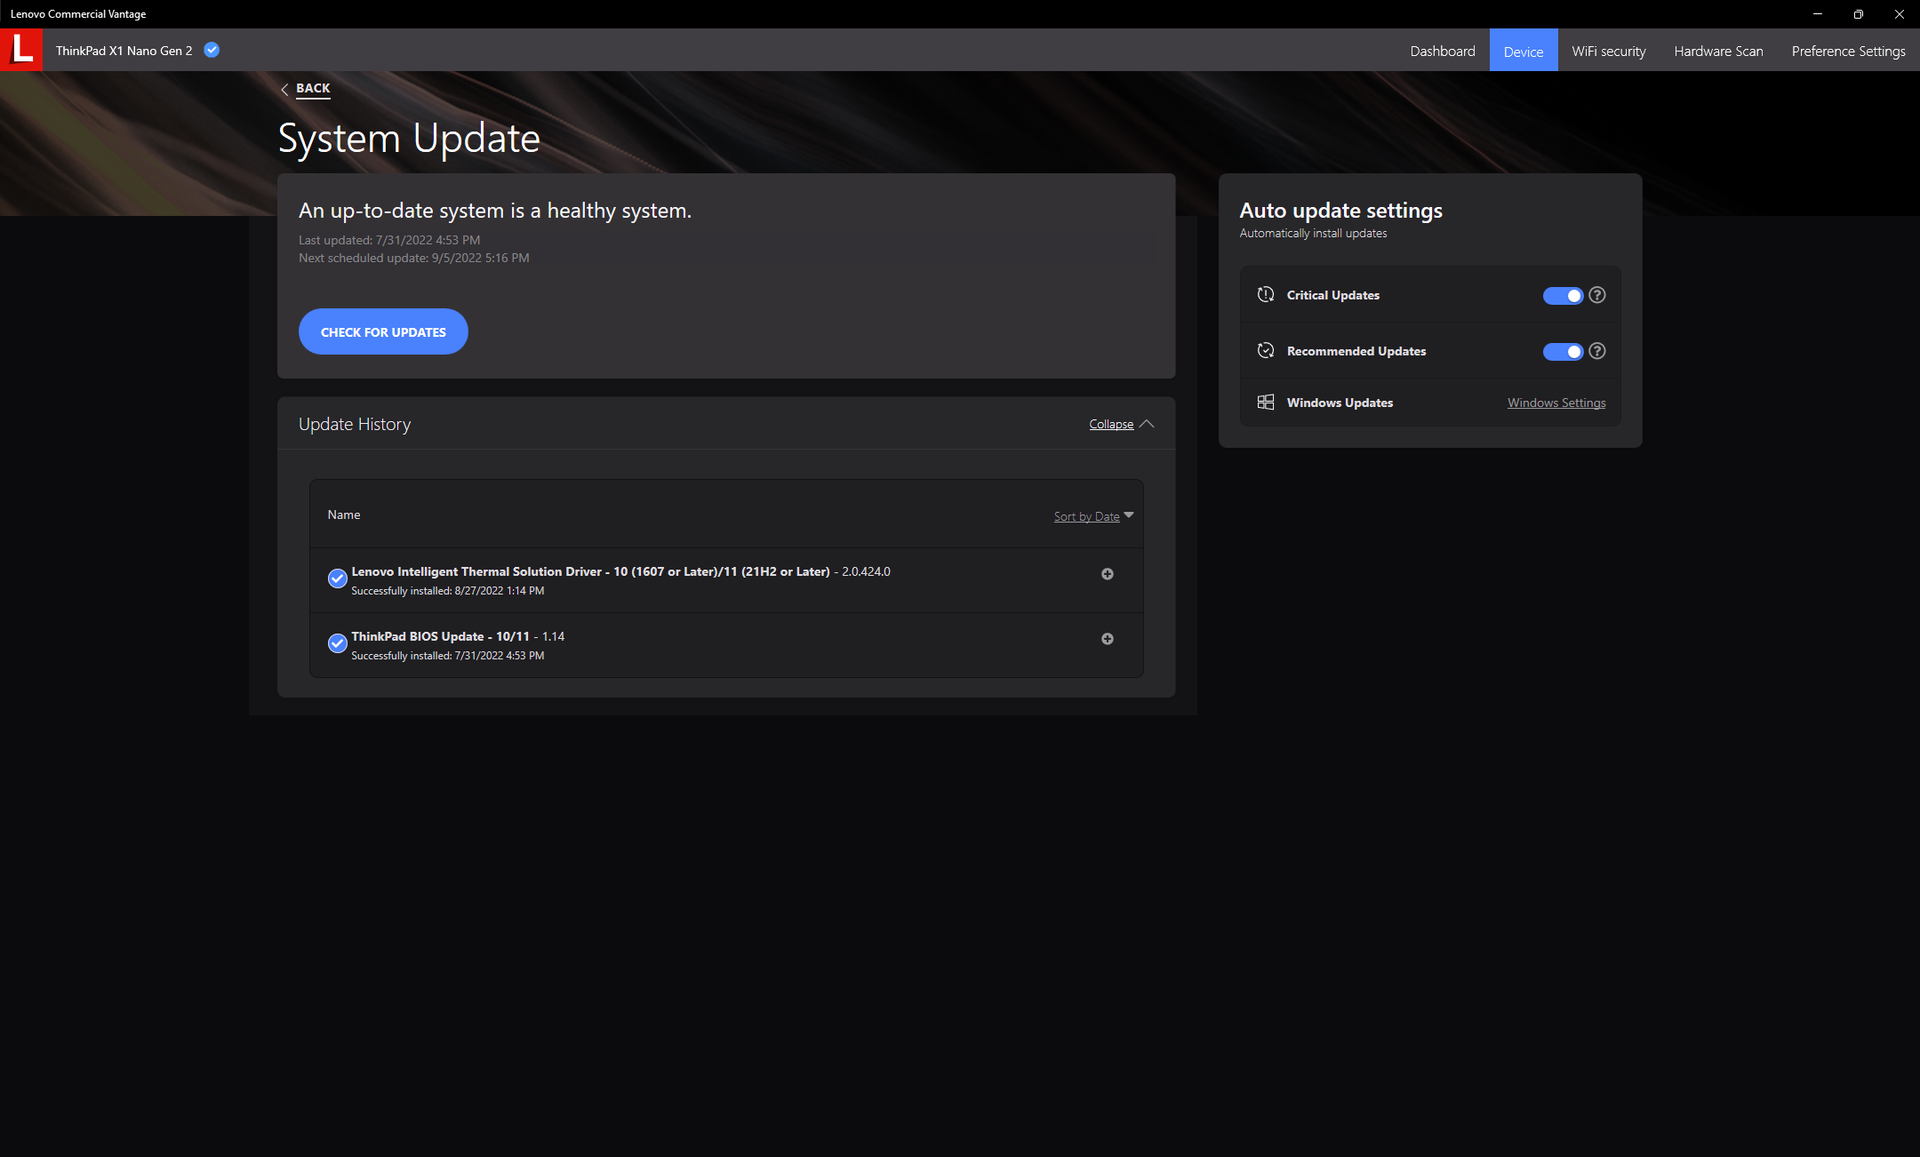
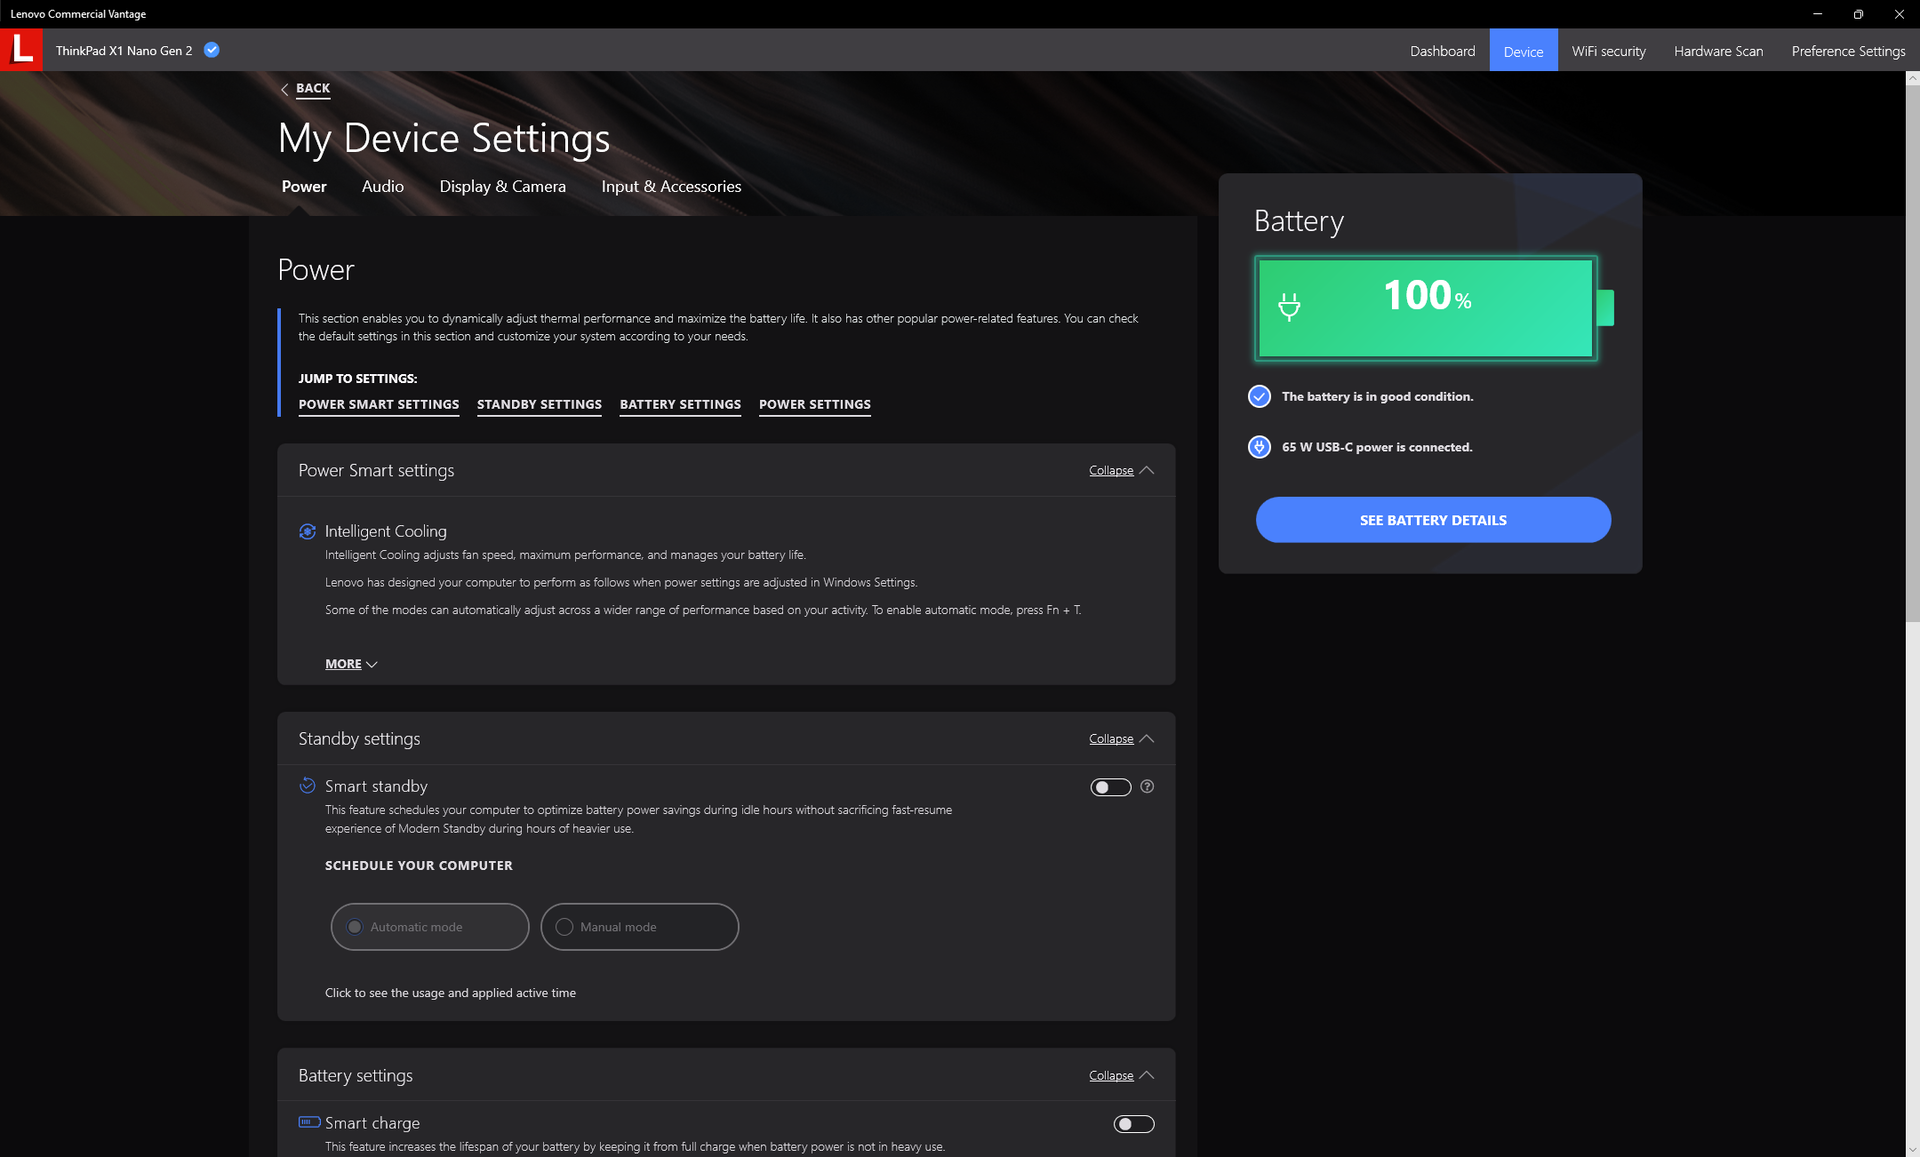
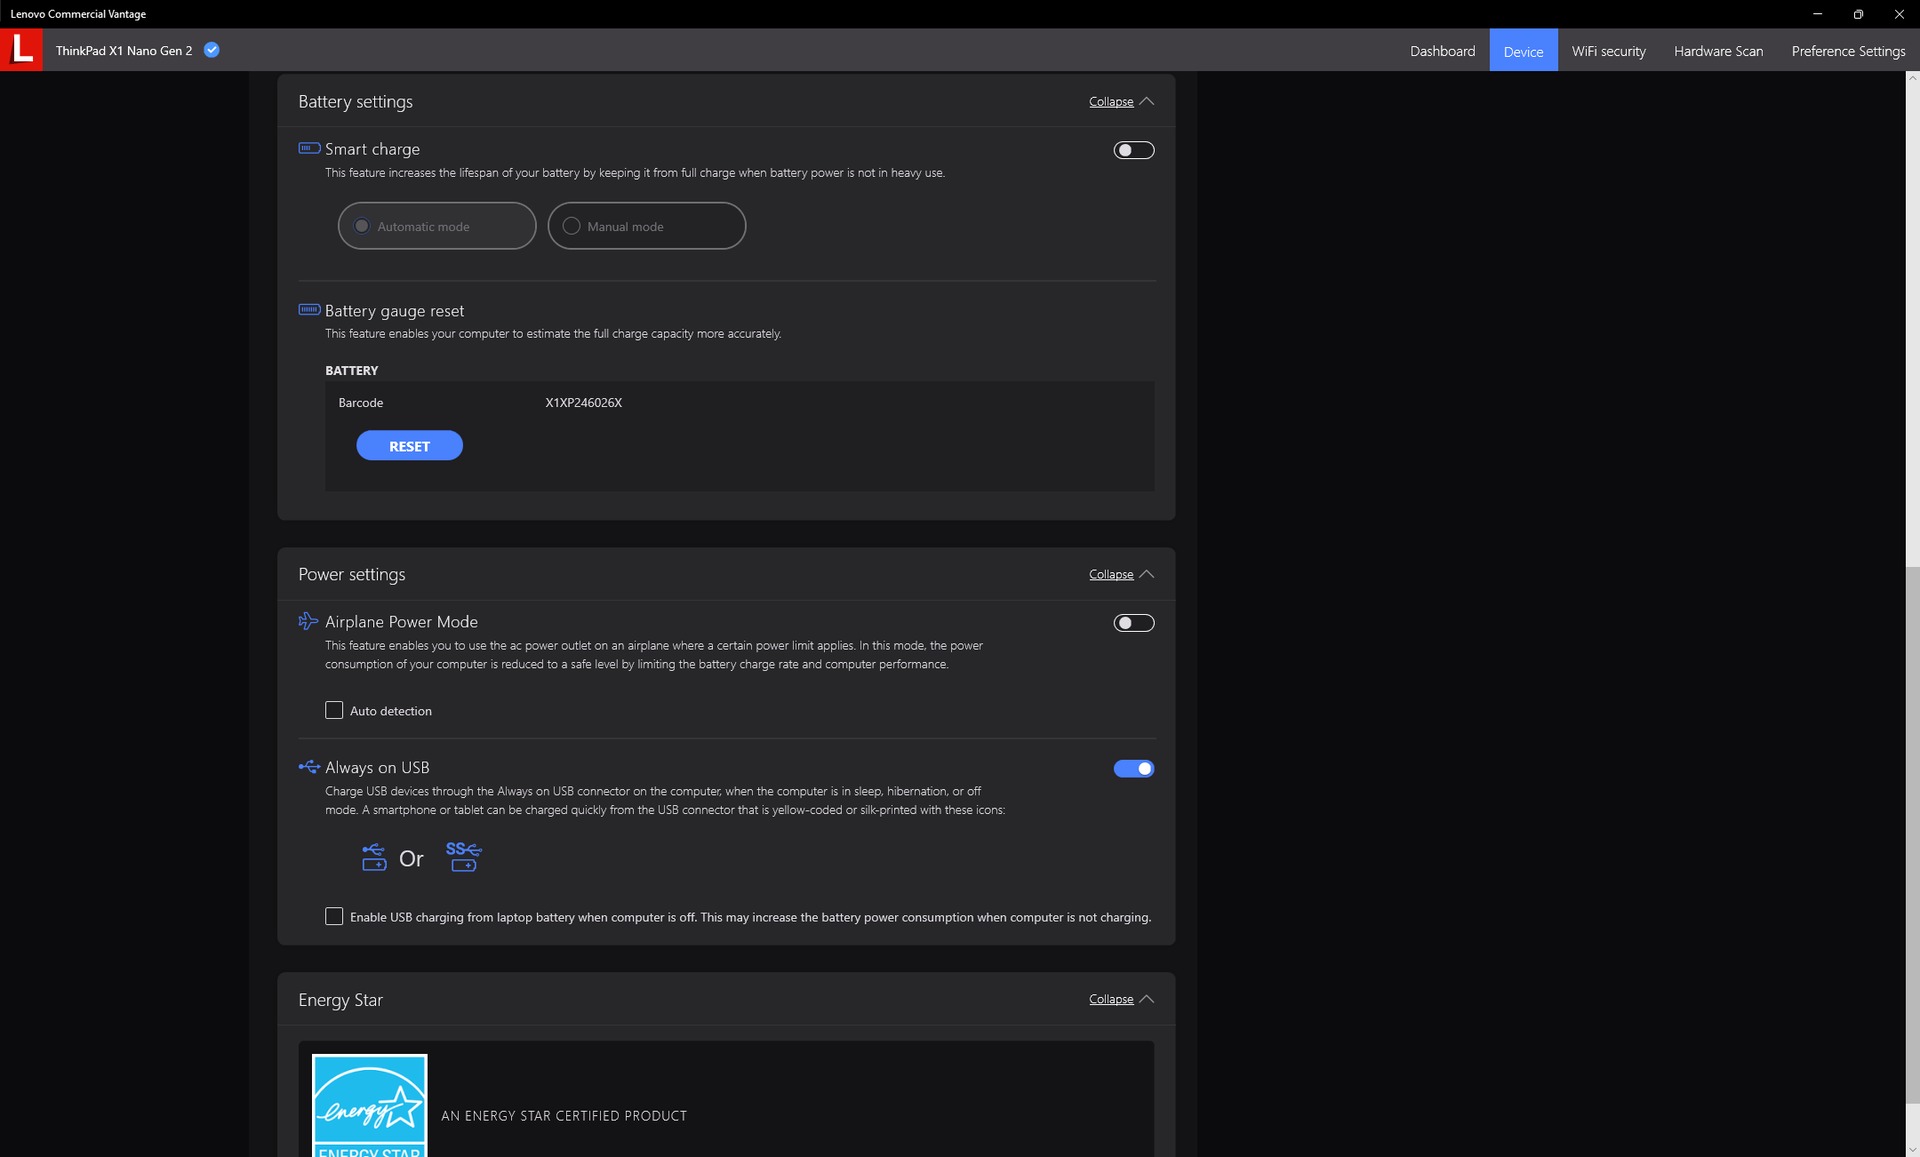
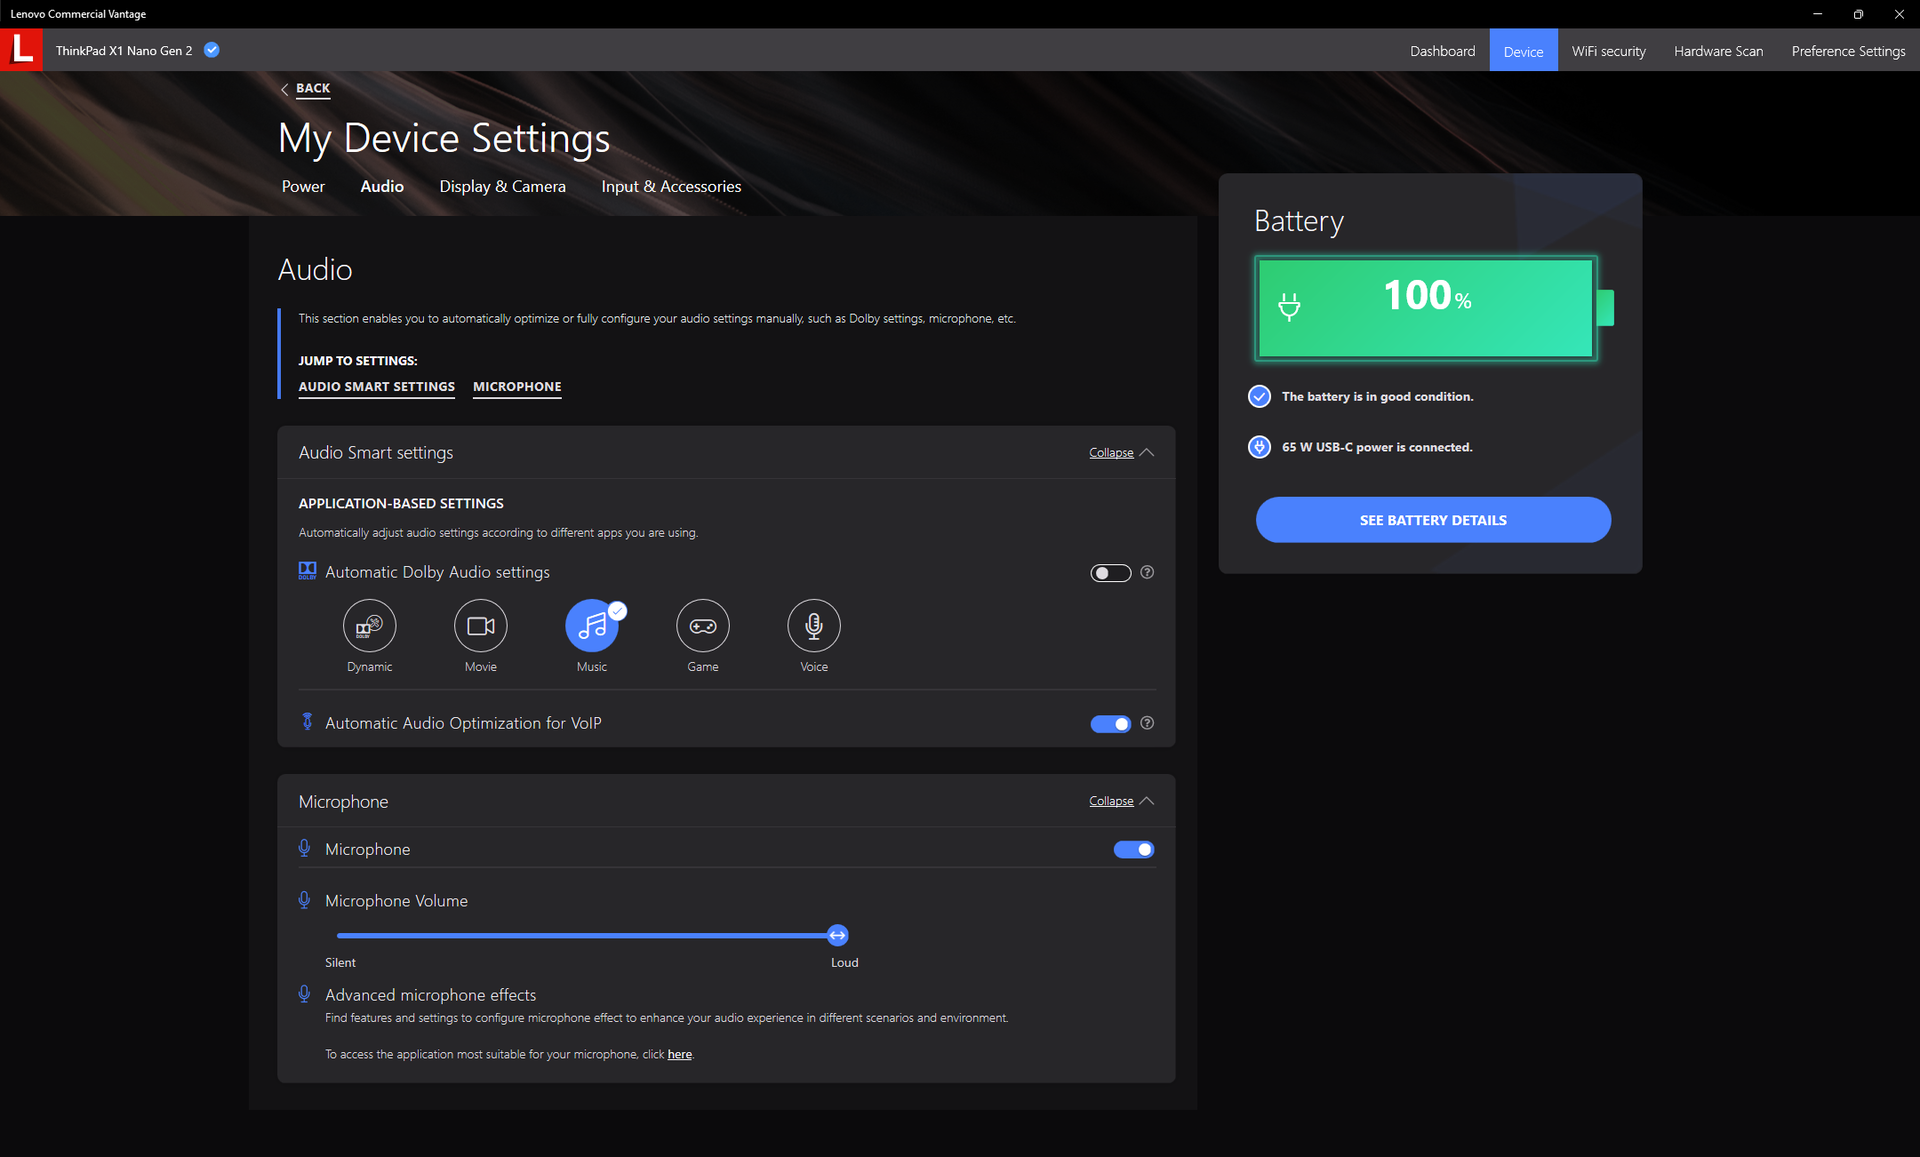
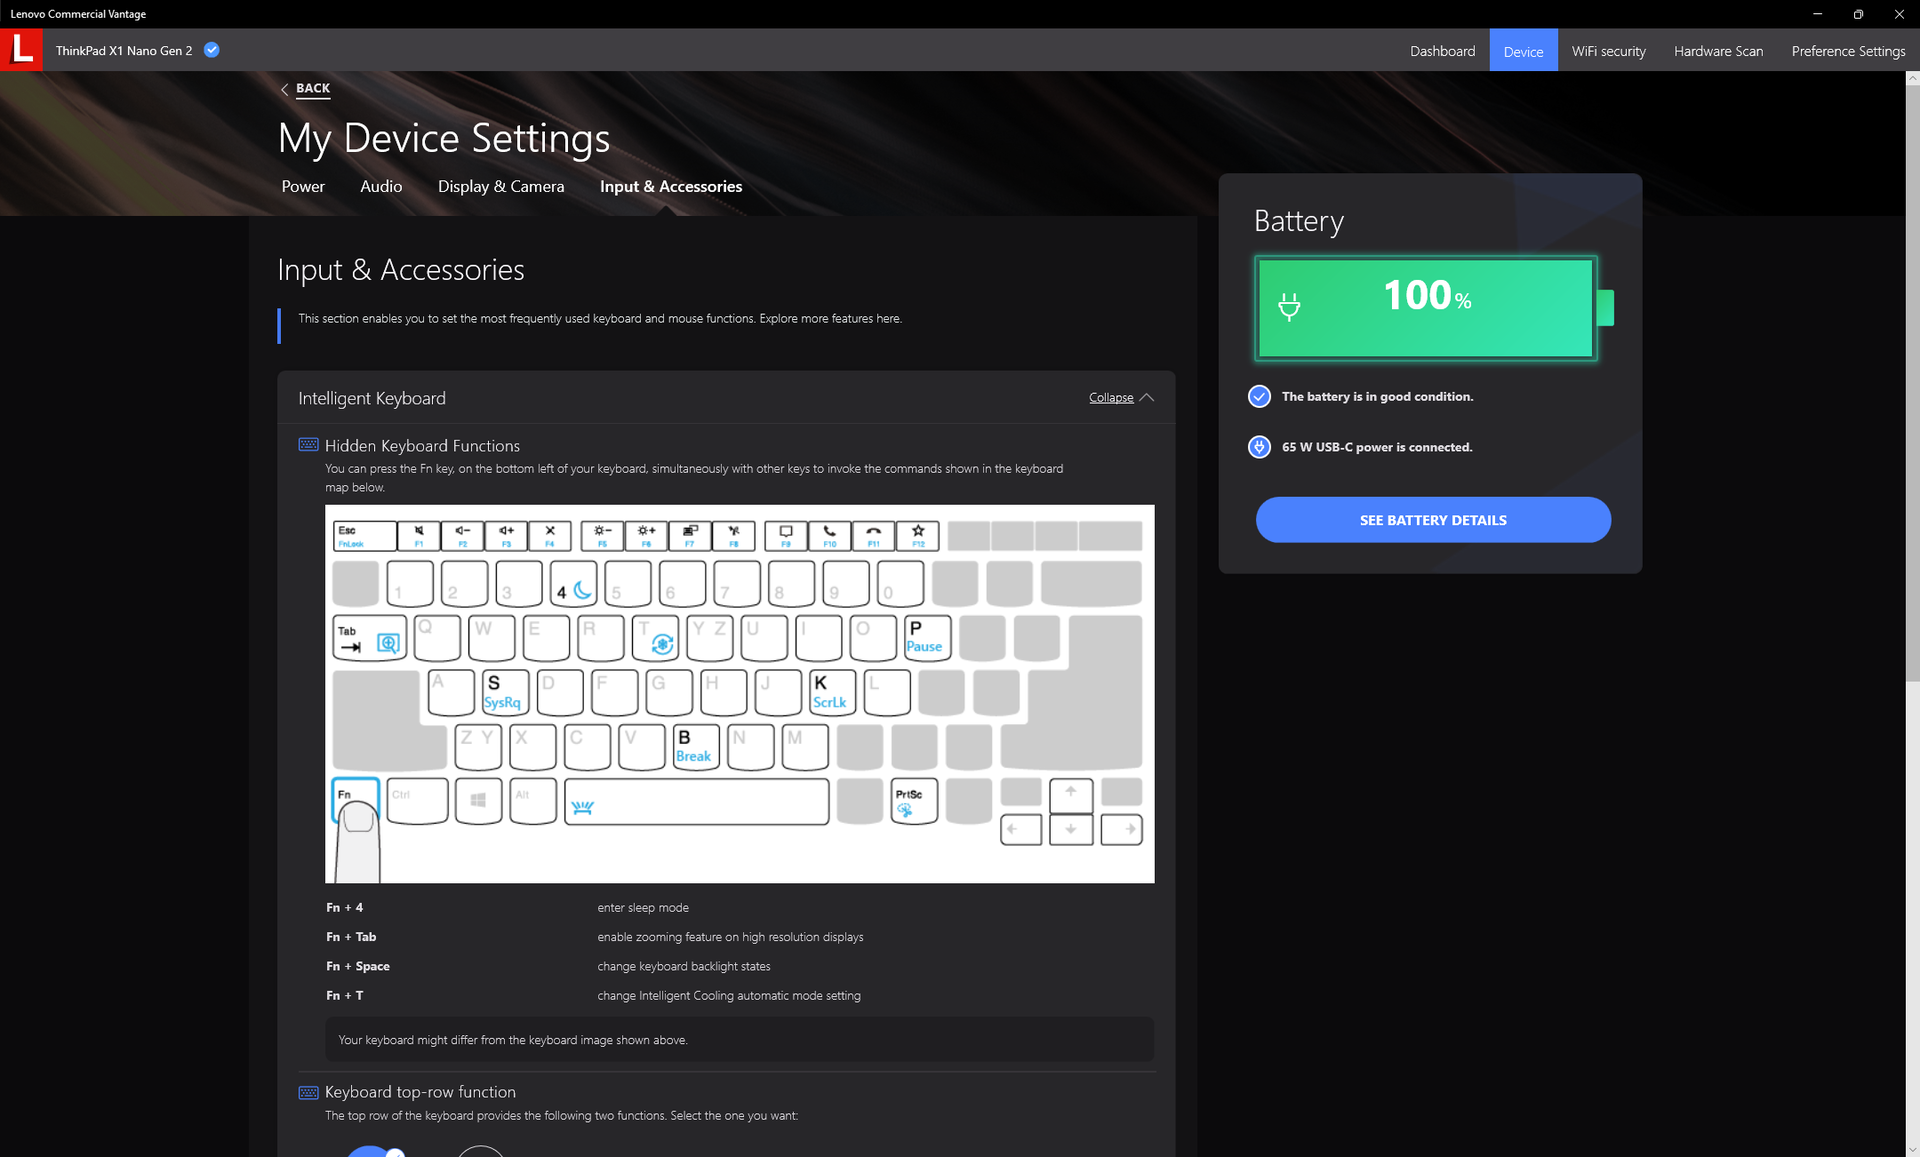
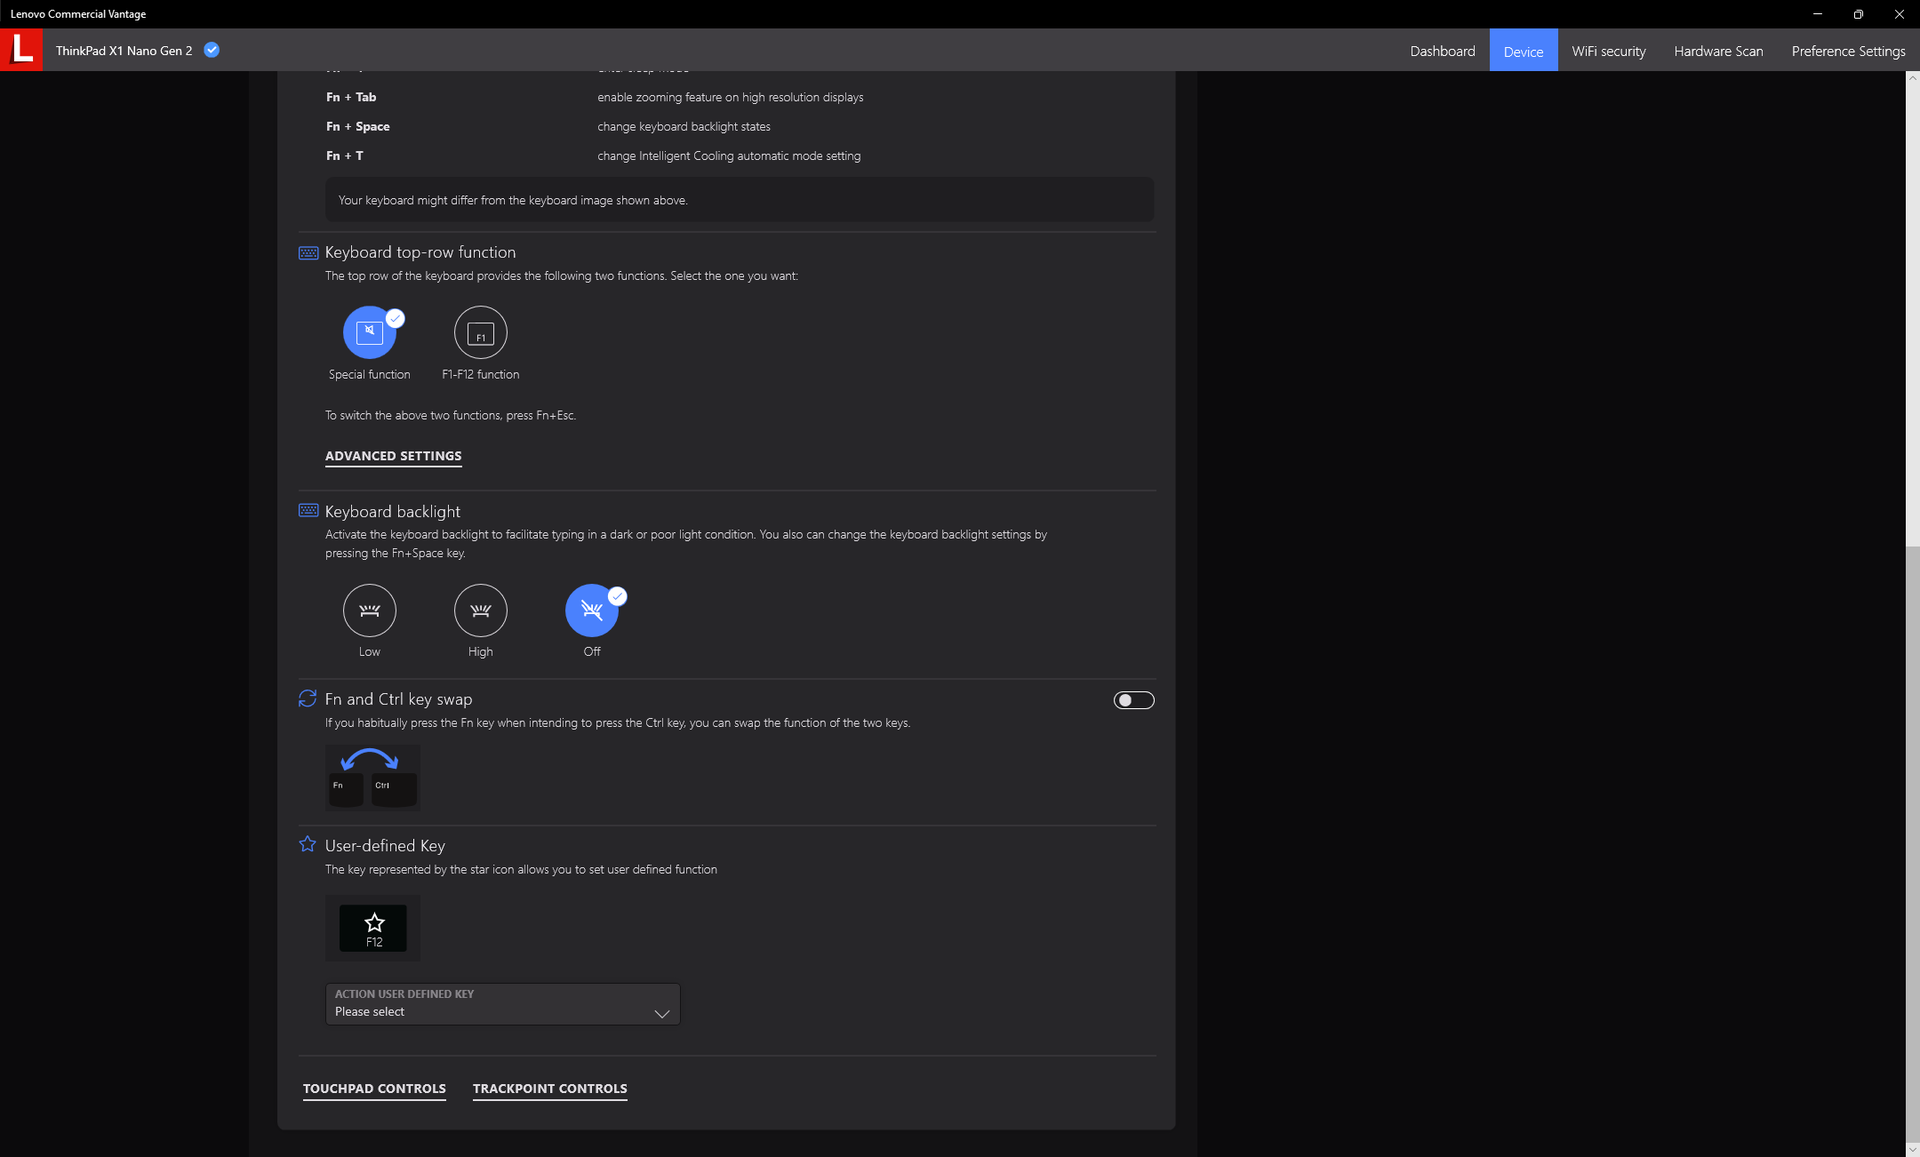
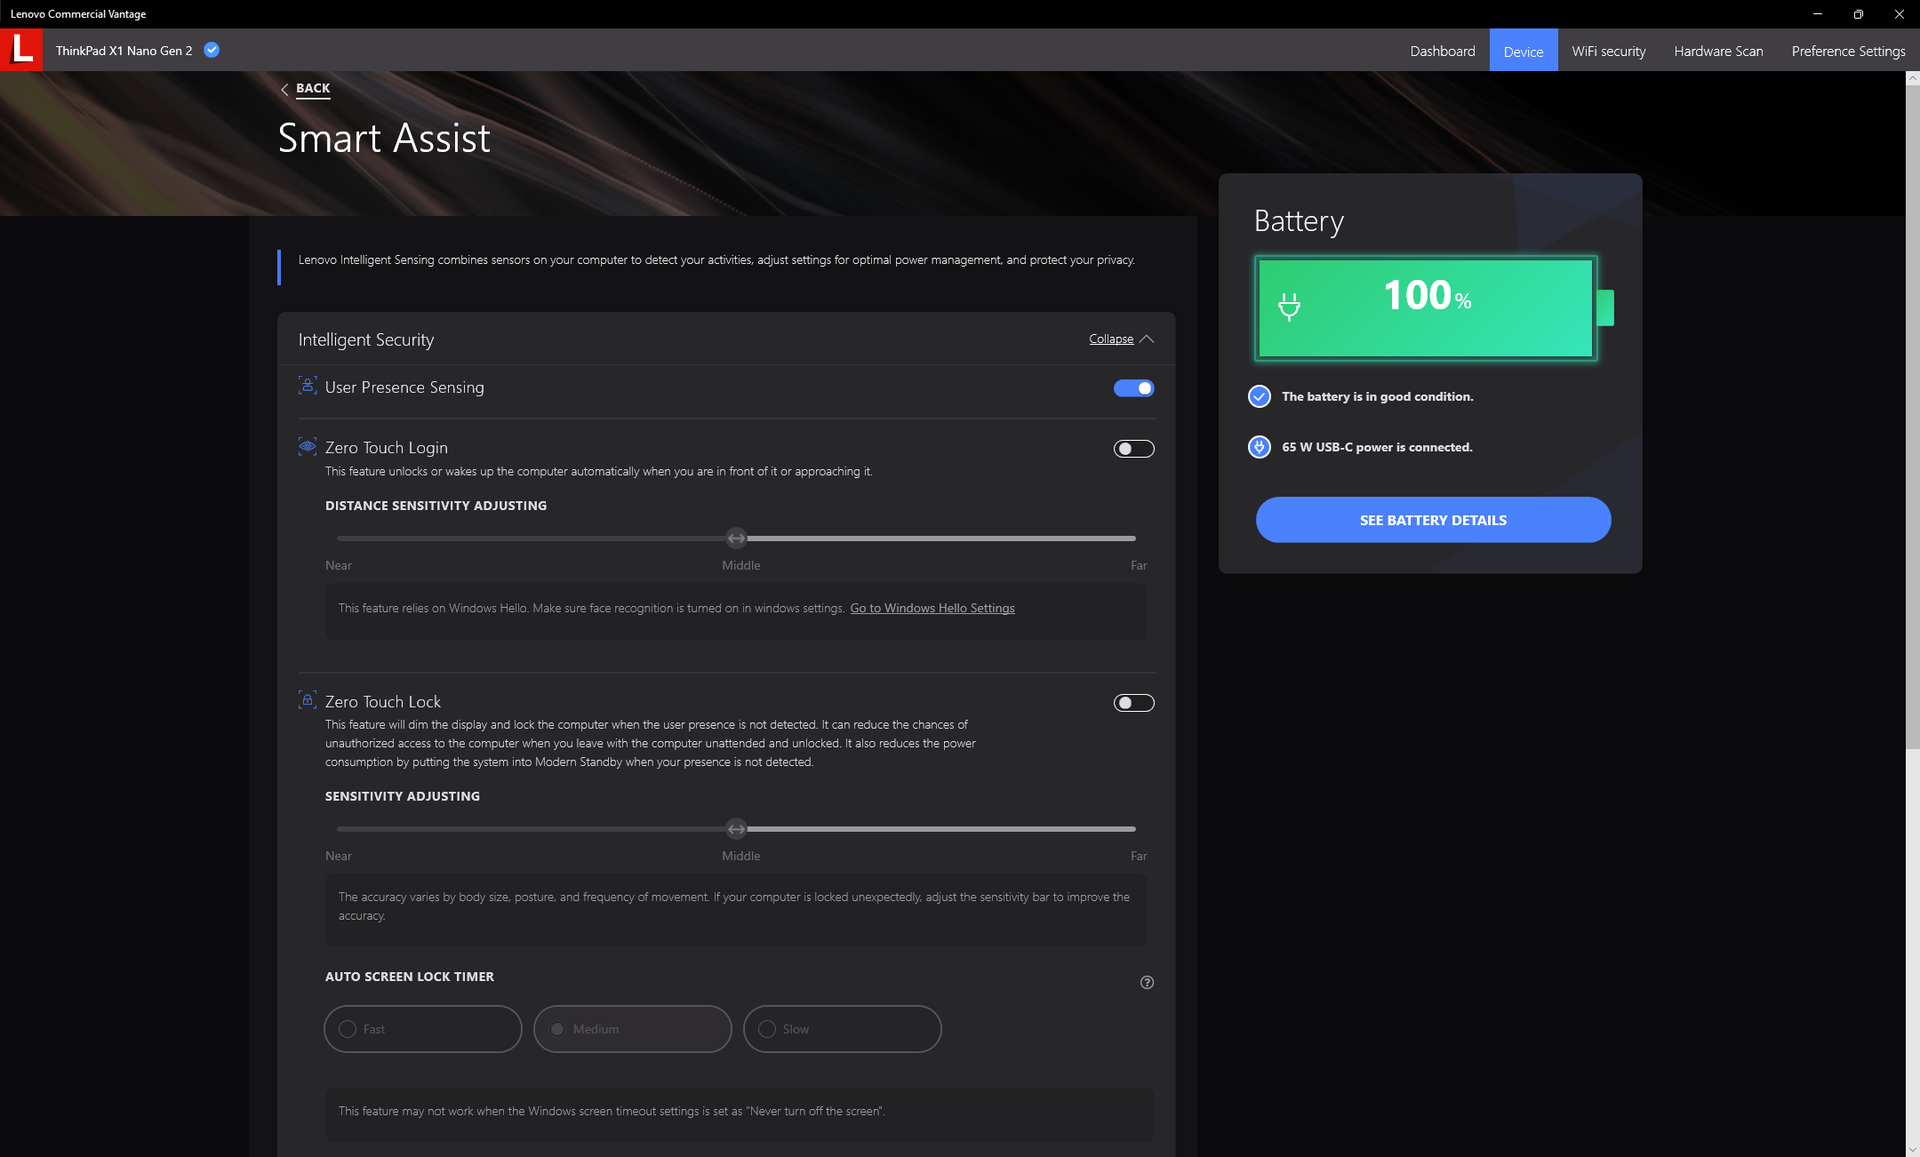
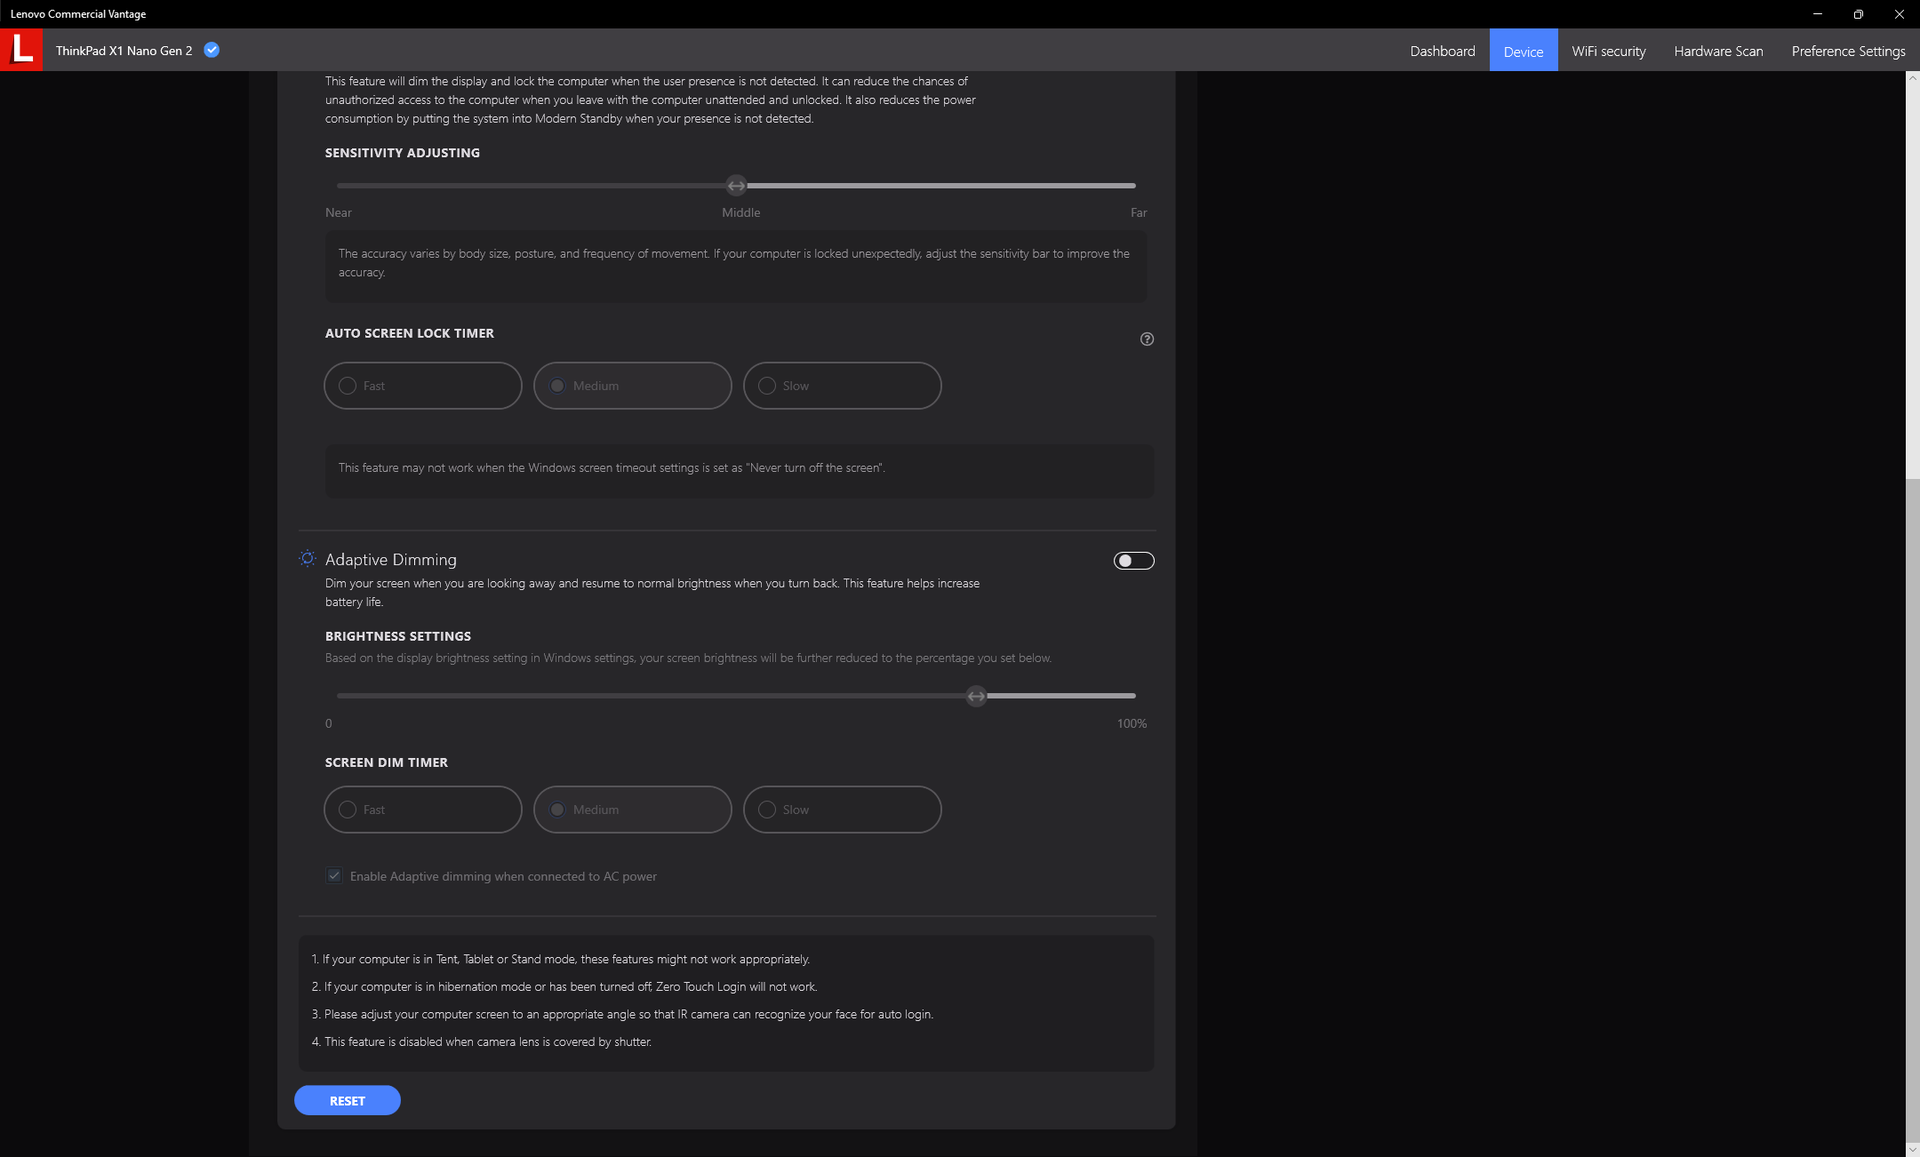
Ajustamos nossa unidade para o modo "Melhor desempenho" via Windows antes de executar qualquer benchmarks de desempenho abaixo. É recomendado que os usuários se familiarizem com o software Vantage pré-instalado, já que muitas atualizações de software e recursos específicos do Lenovo, como o Sensor de Presença do Usuário, são alternados aqui, como mostram as capturas de tela abaixo.
Processador
O desempenho da CPU é um saco misto. A alta pontuação inicial inicial do CineBench R15 multi-tarefa de 2118 pontos é excelente, mas isto cai drasticamente para 1485 pontos após a próxima corrida consecutiva para representar a sustentabilidade do Turbo Boost e um estrangulamento mais acentuado do que a maioria dos outros laptops. De fato, o desempenho multi-tarefa pode cair em até 48% quando estressado, como mostra nosso teste de loop do CineBench R15 xT abaixo. O Estrutura Laptop com o supostamente mais lento Núcleo i7-1260P é capaz de superar nosso i7-1280P por períodos mais longos. Em outras palavras, os usuários podem aproveitar a curta explosão inicial de velocidade da i7-1280P na Lenovo antes que ela caia de um penhasco.
Apesar de seu desempenho um tanto decepcionante, nossa CPU i7-1280P na X1 Nano Gen 2 ainda é handily mais rápida do que a Núcleo i7-1160G7 no X1 Nano Gen 1 em cerca de 80%, mesmo depois de contabilizar quaisquer problemas de estrangulamento.
Cinebench R15 Multi Loop
Cinebench R23: Multi Core | Single Core
Cinebench R15: CPU Multi 64Bit | CPU Single 64Bit
Blender: v2.79 BMW27 CPU
7-Zip 18.03: 7z b 4 | 7z b 4 -mmt1
Geekbench 5.5: Multi-Core | Single-Core
HWBOT x265 Benchmark v2.2: 4k Preset
LibreOffice : 20 Documents To PDF
R Benchmark 2.5: Overall mean
| Cinebench R20 / CPU (Multi Core) | |
| Média Intel Core i7-1280P (3283 - 5415, n=8) | |
| Asus Zenbook S 13 OLED | |
| Framework Laptop 13.5 12th Gen Intel | |
| Lenovo ThinkPad Z13 21D2CTO1WW | |
| Lenovo ThinkPad X1 Nano Gen 2 Core i7-1280P | |
| HP Spectre x360 13.5 14t-ef000 | |
| Lenovo Yoga 6 13ALC6 | |
| HP Elite Dragonfly G3 | |
| Dynabook Portégé X30L-K-139 | |
| Lenovo ThinkPad X1 Nano-20UN002UGE | |
| Lenovo Yoga Slim 7-14IIL05 | |
| Dell Inspiron 13 7306-6TYH5 | |
| Lenovo ThinkPad X1 Titanium Yoga G1 20QB0016GE | |
| Cinebench R20 / CPU (Single Core) | |
| Framework Laptop 13.5 12th Gen Intel | |
| HP Spectre x360 13.5 14t-ef000 | |
| Média Intel Core i7-1280P (615 - 701, n=8) | |
| Lenovo ThinkPad X1 Nano Gen 2 Core i7-1280P | |
| HP Elite Dragonfly G3 | |
| Dynabook Portégé X30L-K-139 | |
| Dell Inspiron 13 7306-6TYH5 | |
| Lenovo ThinkPad Z13 21D2CTO1WW | |
| Asus Zenbook S 13 OLED | |
| Lenovo ThinkPad X1 Nano-20UN002UGE | |
| Lenovo Yoga 6 13ALC6 | |
| Lenovo Yoga Slim 7-14IIL05 | |
| Lenovo ThinkPad X1 Titanium Yoga G1 20QB0016GE | |
| Cinebench R23 / Multi Core | |
| Média Intel Core i7-1280P (8632 - 14803, n=8) | |
| Asus Zenbook S 13 OLED | |
| Framework Laptop 13.5 12th Gen Intel | |
| Lenovo ThinkPad Z13 21D2CTO1WW | |
| Lenovo ThinkPad X1 Nano Gen 2 Core i7-1280P | |
| HP Spectre x360 13.5 14t-ef000 | |
| Lenovo Yoga 6 13ALC6 | |
| HP Elite Dragonfly G3 | |
| Dynabook Portégé X30L-K-139 | |
| Lenovo ThinkPad X1 Nano-20UN002UGE | |
| Dell Inspiron 13 7306-6TYH5 | |
| Lenovo ThinkPad X1 Titanium Yoga G1 20QB0016GE | |
| Cinebench R23 / Single Core | |
| HP Spectre x360 13.5 14t-ef000 | |
| Lenovo ThinkPad X1 Nano Gen 2 Core i7-1280P | |
| Média Intel Core i7-1280P (1609 - 1787, n=7) | |
| Framework Laptop 13.5 12th Gen Intel | |
| HP Elite Dragonfly G3 | |
| Asus Zenbook S 13 OLED | |
| Dell Inspiron 13 7306-6TYH5 | |
| Lenovo ThinkPad Z13 21D2CTO1WW | |
| Dynabook Portégé X30L-K-139 | |
| Lenovo Yoga 6 13ALC6 | |
| Lenovo ThinkPad X1 Titanium Yoga G1 20QB0016GE | |
| Cinebench R15 / CPU Multi 64Bit | |
| Média Intel Core i7-1280P (1905 - 2332, n=7) | |
| Lenovo ThinkPad X1 Nano Gen 2 Core i7-1280P | |
| Asus Zenbook S 13 OLED | |
| Framework Laptop 13.5 12th Gen Intel | |
| Lenovo ThinkPad Z13 21D2CTO1WW | |
| HP Spectre x360 13.5 14t-ef000 | |
| HP Elite Dragonfly G3 | |
| Lenovo Yoga 6 13ALC6 | |
| Dynabook Portégé X30L-K-139 | |
| Lenovo ThinkPad X1 Nano-20UN002UGE | |
| Dell Inspiron 13 7306-6TYH5 | |
| Dell Inspiron 13 7306-6TYH5 | |
| Lenovo Yoga Slim 7-14IIL05 | |
| Lenovo ThinkPad X1 Titanium Yoga G1 20QB0016GE | |
| Cinebench R15 / CPU Single 64Bit | |
| Framework Laptop 13.5 12th Gen Intel | |
| HP Spectre x360 13.5 14t-ef000 | |
| Lenovo ThinkPad X1 Nano Gen 2 Core i7-1280P | |
| Asus Zenbook S 13 OLED | |
| Média Intel Core i7-1280P (203 - 258, n=7) | |
| Lenovo ThinkPad Z13 21D2CTO1WW | |
| Dell Inspiron 13 7306-6TYH5 | |
| Dell Inspiron 13 7306-6TYH5 | |
| HP Elite Dragonfly G3 | |
| Lenovo ThinkPad X1 Nano-20UN002UGE | |
| Lenovo Yoga 6 13ALC6 | |
| Lenovo Yoga Slim 7-14IIL05 | |
| Lenovo ThinkPad X1 Titanium Yoga G1 20QB0016GE | |
| Dynabook Portégé X30L-K-139 | |
| Blender / v2.79 BMW27 CPU | |
| Lenovo ThinkPad X1 Titanium Yoga G1 20QB0016GE | |
| Lenovo Yoga Slim 7-14IIL05 | |
| Dell Inspiron 13 7306-6TYH5 | |
| Lenovo ThinkPad X1 Nano-20UN002UGE | |
| Dynabook Portégé X30L-K-139 | |
| HP Elite Dragonfly G3 | |
| Lenovo ThinkPad Z13 21D2CTO1WW | |
| HP Spectre x360 13.5 14t-ef000 | |
| Lenovo Yoga 6 13ALC6 | |
| Asus Zenbook S 13 OLED | |
| Framework Laptop 13.5 12th Gen Intel | |
| Lenovo ThinkPad X1 Nano Gen 2 Core i7-1280P | |
| Média Intel Core i7-1280P (259 - 309, n=7) | |
| 7-Zip 18.03 / 7z b 4 | |
| Média Intel Core i7-1280P (45292 - 53710, n=7) | |
| Asus Zenbook S 13 OLED | |
| Lenovo ThinkPad X1 Nano Gen 2 Core i7-1280P | |
| Framework Laptop 13.5 12th Gen Intel | |
| Lenovo Yoga 6 13ALC6 | |
| HP Spectre x360 13.5 14t-ef000 | |
| Lenovo ThinkPad Z13 21D2CTO1WW | |
| HP Elite Dragonfly G3 | |
| Dynabook Portégé X30L-K-139 | |
| Lenovo ThinkPad X1 Nano-20UN002UGE | |
| Dell Inspiron 13 7306-6TYH5 | |
| Lenovo Yoga Slim 7-14IIL05 | |
| Lenovo ThinkPad X1 Titanium Yoga G1 20QB0016GE | |
| 7-Zip 18.03 / 7z b 4 -mmt1 | |
| Framework Laptop 13.5 12th Gen Intel | |
| Lenovo ThinkPad X1 Nano Gen 2 Core i7-1280P | |
| Média Intel Core i7-1280P (4995 - 5874, n=7) | |
| HP Spectre x360 13.5 14t-ef000 | |
| Asus Zenbook S 13 OLED | |
| Lenovo ThinkPad Z13 21D2CTO1WW | |
| Dell Inspiron 13 7306-6TYH5 | |
| HP Elite Dragonfly G3 | |
| Lenovo ThinkPad X1 Nano-20UN002UGE | |
| Lenovo Yoga 6 13ALC6 | |
| Dynabook Portégé X30L-K-139 | |
| Lenovo Yoga Slim 7-14IIL05 | |
| Lenovo ThinkPad X1 Titanium Yoga G1 20QB0016GE | |
| Geekbench 5.5 / Multi-Core | |
| Média Intel Core i7-1280P (9623 - 11811, n=7) | |
| Lenovo ThinkPad X1 Nano Gen 2 Core i7-1280P | |
| Framework Laptop 13.5 12th Gen Intel | |
| HP Spectre x360 13.5 14t-ef000 | |
| HP Elite Dragonfly G3 | |
| Asus Zenbook S 13 OLED | |
| Dynabook Portégé X30L-K-139 | |
| Lenovo ThinkPad Z13 21D2CTO1WW | |
| Dell Inspiron 13 7306-6TYH5 | |
| Lenovo ThinkPad X1 Nano-20UN002UGE | |
| Lenovo Yoga Slim 7-14IIL05 | |
| Lenovo ThinkPad X1 Titanium Yoga G1 20QB0016GE | |
| Geekbench 5.5 / Single-Core | |
| Lenovo ThinkPad X1 Nano Gen 2 Core i7-1280P | |
| Framework Laptop 13.5 12th Gen Intel | |
| HP Spectre x360 13.5 14t-ef000 | |
| Média Intel Core i7-1280P (1571 - 1802, n=7) | |
| Dynabook Portégé X30L-K-139 | |
| Dell Inspiron 13 7306-6TYH5 | |
| HP Elite Dragonfly G3 | |
| Asus Zenbook S 13 OLED | |
| Lenovo ThinkPad Z13 21D2CTO1WW | |
| Lenovo ThinkPad X1 Nano-20UN002UGE | |
| Lenovo ThinkPad X1 Titanium Yoga G1 20QB0016GE | |
| Lenovo Yoga Slim 7-14IIL05 | |
| HWBOT x265 Benchmark v2.2 / 4k Preset | |
| Asus Zenbook S 13 OLED | |
| Média Intel Core i7-1280P (9.62 - 14.5, n=5) | |
| Framework Laptop 13.5 12th Gen Intel | |
| HP Spectre x360 13.5 14t-ef000 | |
| Lenovo ThinkPad X1 Nano Gen 2 Core i7-1280P | |
| Lenovo Yoga 6 13ALC6 | |
| Lenovo ThinkPad Z13 21D2CTO1WW | |
| HP Elite Dragonfly G3 | |
| Dynabook Portégé X30L-K-139 | |
| Lenovo ThinkPad X1 Nano-20UN002UGE | |
| Dell Inspiron 13 7306-6TYH5 | |
| Lenovo Yoga Slim 7-14IIL05 | |
| Lenovo ThinkPad X1 Titanium Yoga G1 20QB0016GE | |
| LibreOffice / 20 Documents To PDF | |
| Lenovo Yoga 6 13ALC6 | |
| HP Elite Dragonfly G3 | |
| Lenovo ThinkPad Z13 21D2CTO1WW | |
| Lenovo Yoga Slim 7-14IIL05 | |
| Asus Zenbook S 13 OLED | |
| Lenovo ThinkPad X1 Nano-20UN002UGE | |
| Lenovo ThinkPad X1 Titanium Yoga G1 20QB0016GE | |
| Média Intel Core i7-1280P (41 - 61.6, n=8) | |
| Dynabook Portégé X30L-K-139 | |
| Dell Inspiron 13 7306-6TYH5 | |
| Lenovo ThinkPad X1 Nano Gen 2 Core i7-1280P | |
| HP Spectre x360 13.5 14t-ef000 | |
| Framework Laptop 13.5 12th Gen Intel | |
| R Benchmark 2.5 / Overall mean | |
| Lenovo ThinkPad X1 Titanium Yoga G1 20QB0016GE | |
| Lenovo Yoga Slim 7-14IIL05 | |
| Lenovo ThinkPad X1 Nano-20UN002UGE | |
| Lenovo Yoga 6 13ALC6 | |
| Dell Inspiron 13 7306-6TYH5 | |
| Lenovo ThinkPad Z13 21D2CTO1WW | |
| Dynabook Portégé X30L-K-139 | |
| HP Elite Dragonfly G3 | |
| Asus Zenbook S 13 OLED | |
| HP Spectre x360 13.5 14t-ef000 | |
| Média Intel Core i7-1280P (0.4505 - 0.512, n=7) | |
| Lenovo ThinkPad X1 Nano Gen 2 Core i7-1280P | |
| Framework Laptop 13.5 12th Gen Intel | |
Cinebench R23: Multi Core | Single Core
Cinebench R15: CPU Multi 64Bit | CPU Single 64Bit
Blender: v2.79 BMW27 CPU
7-Zip 18.03: 7z b 4 | 7z b 4 -mmt1
Geekbench 5.5: Multi-Core | Single-Core
HWBOT x265 Benchmark v2.2: 4k Preset
LibreOffice : 20 Documents To PDF
R Benchmark 2.5: Overall mean
* ... menor é melhor
AIDA64: FP32 Ray-Trace | FPU Julia | CPU SHA3 | CPU Queen | FPU SinJulia | FPU Mandel | CPU AES | CPU ZLib | FP64 Ray-Trace | CPU PhotoWorxx
| AIDA64 / FP32 Ray-Trace | |
| Média Intel Core i7-1280P (7466 - 13068, n=6) | |
| Lenovo ThinkPad X1 Nano Gen 2 Core i7-1280P | |
| Lenovo ThinkPad X1 Nano-20UN002UGE | |
| Dell Latitude 13 7330 | |
| HP Elite Dragonfly G3 | |
| Framework Laptop 13.5 12th Gen Intel | |
| Huawei MateBook X Pro 2021 | |
| AIDA64 / FPU SinJulia | |
| Média Intel Core i7-1280P (5880 - 8571, n=6) | |
| Framework Laptop 13.5 12th Gen Intel | |
| Lenovo ThinkPad X1 Nano Gen 2 Core i7-1280P | |
| Dell Latitude 13 7330 | |
| HP Elite Dragonfly G3 | |
| Lenovo ThinkPad X1 Nano-20UN002UGE | |
| Huawei MateBook X Pro 2021 | |
| AIDA64 / FP64 Ray-Trace | |
| Média Intel Core i7-1280P (4006 - 7184, n=6) | |
| Lenovo ThinkPad X1 Nano Gen 2 Core i7-1280P | |
| Lenovo ThinkPad X1 Nano-20UN002UGE | |
| Dell Latitude 13 7330 | |
| HP Elite Dragonfly G3 | |
| Framework Laptop 13.5 12th Gen Intel | |
| Huawei MateBook X Pro 2021 | |
| AIDA64 / CPU PhotoWorxx | |
| Média Intel Core i7-1280P (36663 - 48416, n=6) | |
| Huawei MateBook X Pro 2021 | |
| Lenovo ThinkPad X1 Nano Gen 2 Core i7-1280P | |
| HP Elite Dragonfly G3 | |
| Lenovo ThinkPad X1 Nano-20UN002UGE | |
| Framework Laptop 13.5 12th Gen Intel | |
| Dell Latitude 13 7330 | |
Desempenho do sistema
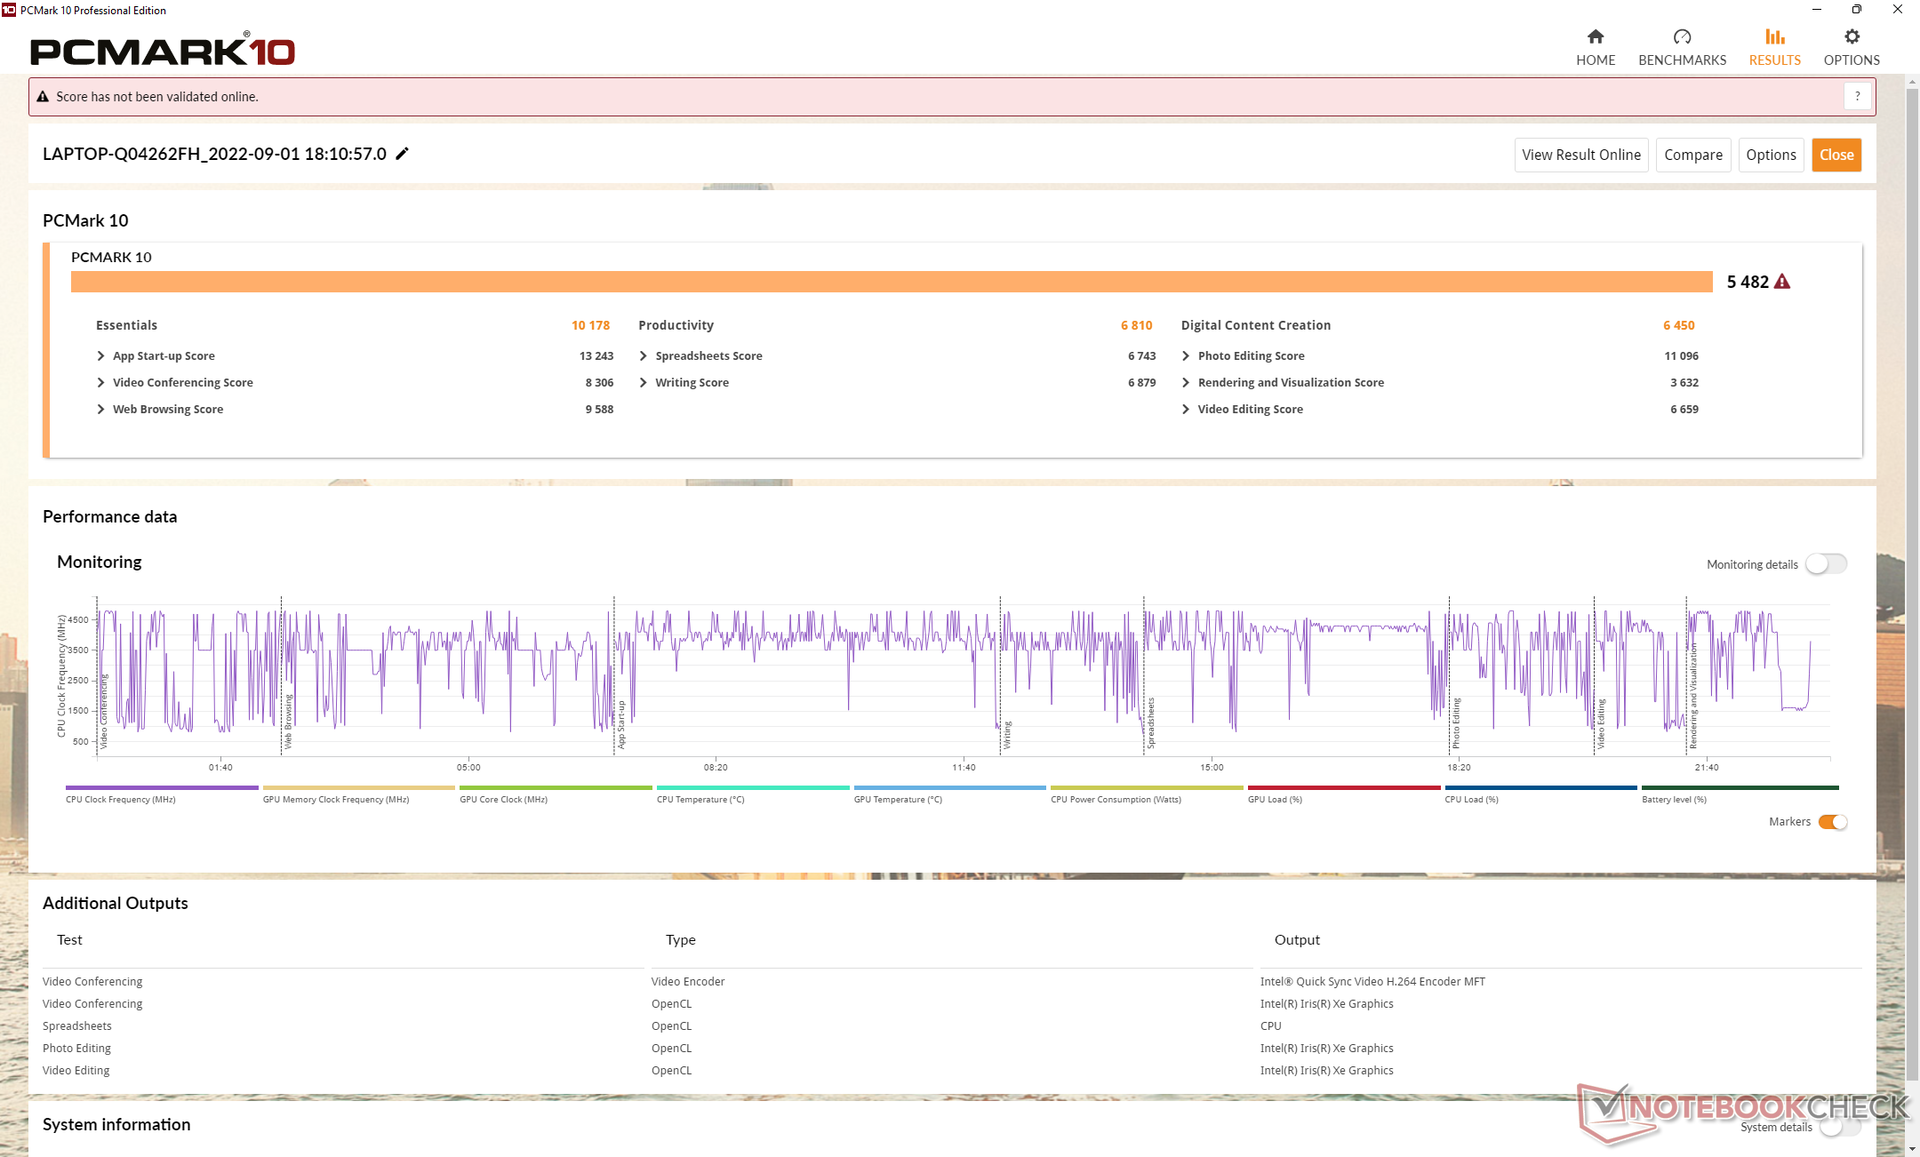
Os resultados da PCMark 10 são consistentemente mais altos do que o modelo Gen 1 e a maioria dos outros laptops de 13,0 polegadas devido à CPU Core da série P. A diferença é mais ampla no sub-teste de Criação de Conteúdo Digital.
CrossMark: Overall | Productivity | Creativity | Responsiveness
| PCMark 10 / Score | |
| Framework Laptop 13.5 12th Gen Intel | |
| Média Intel Core i7-1280P, Intel Iris Xe Graphics G7 96EUs (5410 - 5994, n=4) | |
| Lenovo ThinkPad X1 Nano Gen 2 Core i7-1280P | |
| Dell Latitude 13 7330 | |
| Huawei MateBook X Pro 2021 | |
| HP Elite Dragonfly G3 | |
| Lenovo ThinkPad X1 Nano-20UN002UGE | |
| PCMark 10 / Essentials | |
| Framework Laptop 13.5 12th Gen Intel | |
| Dell Latitude 13 7330 | |
| Média Intel Core i7-1280P, Intel Iris Xe Graphics G7 96EUs (9719 - 10920, n=4) | |
| Huawei MateBook X Pro 2021 | |
| Lenovo ThinkPad X1 Nano Gen 2 Core i7-1280P | |
| Lenovo ThinkPad X1 Nano-20UN002UGE | |
| HP Elite Dragonfly G3 | |
| PCMark 10 / Productivity | |
| Framework Laptop 13.5 12th Gen Intel | |
| Dell Latitude 13 7330 | |
| Média Intel Core i7-1280P, Intel Iris Xe Graphics G7 96EUs (6301 - 7453, n=4) | |
| Lenovo ThinkPad X1 Nano Gen 2 Core i7-1280P | |
| Huawei MateBook X Pro 2021 | |
| Lenovo ThinkPad X1 Nano-20UN002UGE | |
| HP Elite Dragonfly G3 | |
| PCMark 10 / Digital Content Creation | |
| Média Intel Core i7-1280P, Intel Iris Xe Graphics G7 96EUs (6450 - 7180, n=4) | |
| Framework Laptop 13.5 12th Gen Intel | |
| Lenovo ThinkPad X1 Nano Gen 2 Core i7-1280P | |
| HP Elite Dragonfly G3 | |
| Dell Latitude 13 7330 | |
| Huawei MateBook X Pro 2021 | |
| Lenovo ThinkPad X1 Nano-20UN002UGE | |
| CrossMark / Overall | |
| Média Intel Core i7-1280P, Intel Iris Xe Graphics G7 96EUs (1677 - 1773, n=4) | |
| Lenovo ThinkPad X1 Nano Gen 2 Core i7-1280P | |
| Framework Laptop 13.5 12th Gen Intel | |
| Dell Latitude 13 7330 | |
| HP Elite Dragonfly G3 | |
| CrossMark / Productivity | |
| Média Intel Core i7-1280P, Intel Iris Xe Graphics G7 96EUs (1585 - 1709, n=4) | |
| Framework Laptop 13.5 12th Gen Intel | |
| Lenovo ThinkPad X1 Nano Gen 2 Core i7-1280P | |
| Dell Latitude 13 7330 | |
| HP Elite Dragonfly G3 | |
| CrossMark / Creativity | |
| Lenovo ThinkPad X1 Nano Gen 2 Core i7-1280P | |
| Média Intel Core i7-1280P, Intel Iris Xe Graphics G7 96EUs (1849 - 1928, n=4) | |
| Framework Laptop 13.5 12th Gen Intel | |
| HP Elite Dragonfly G3 | |
| Dell Latitude 13 7330 | |
| CrossMark / Responsiveness | |
| Média Intel Core i7-1280P, Intel Iris Xe Graphics G7 96EUs (1394 - 1746, n=4) | |
| Framework Laptop 13.5 12th Gen Intel | |
| Lenovo ThinkPad X1 Nano Gen 2 Core i7-1280P | |
| Dell Latitude 13 7330 | |
| HP Elite Dragonfly G3 | |
| PCMark 10 Score | 5482 pontos | |
Ajuda | ||
| AIDA64 / Memory Write | |
| Huawei MateBook X Pro 2021 | |
| Lenovo ThinkPad X1 Nano Gen 2 Core i7-1280P | |
| Média Intel Core i7-1280P (58729 - 68247, n=6) | |
| HP Elite Dragonfly G3 | |
| Lenovo ThinkPad X1 Nano-20UN002UGE | |
| Framework Laptop 13.5 12th Gen Intel | |
| Dell Latitude 13 7330 | |
| AIDA64 / Memory Latency | |
| Média Intel Core i7-1280P (93.1 - 153.3, n=6) | |
| HP Elite Dragonfly G3 | |
| Lenovo ThinkPad X1 Nano-20UN002UGE | |
| Lenovo ThinkPad X1 Nano Gen 2 Core i7-1280P | |
| Huawei MateBook X Pro 2021 | |
| Framework Laptop 13.5 12th Gen Intel | |
| Dell Latitude 13 7330 | |
* ... menor é melhor
Latência do DPC
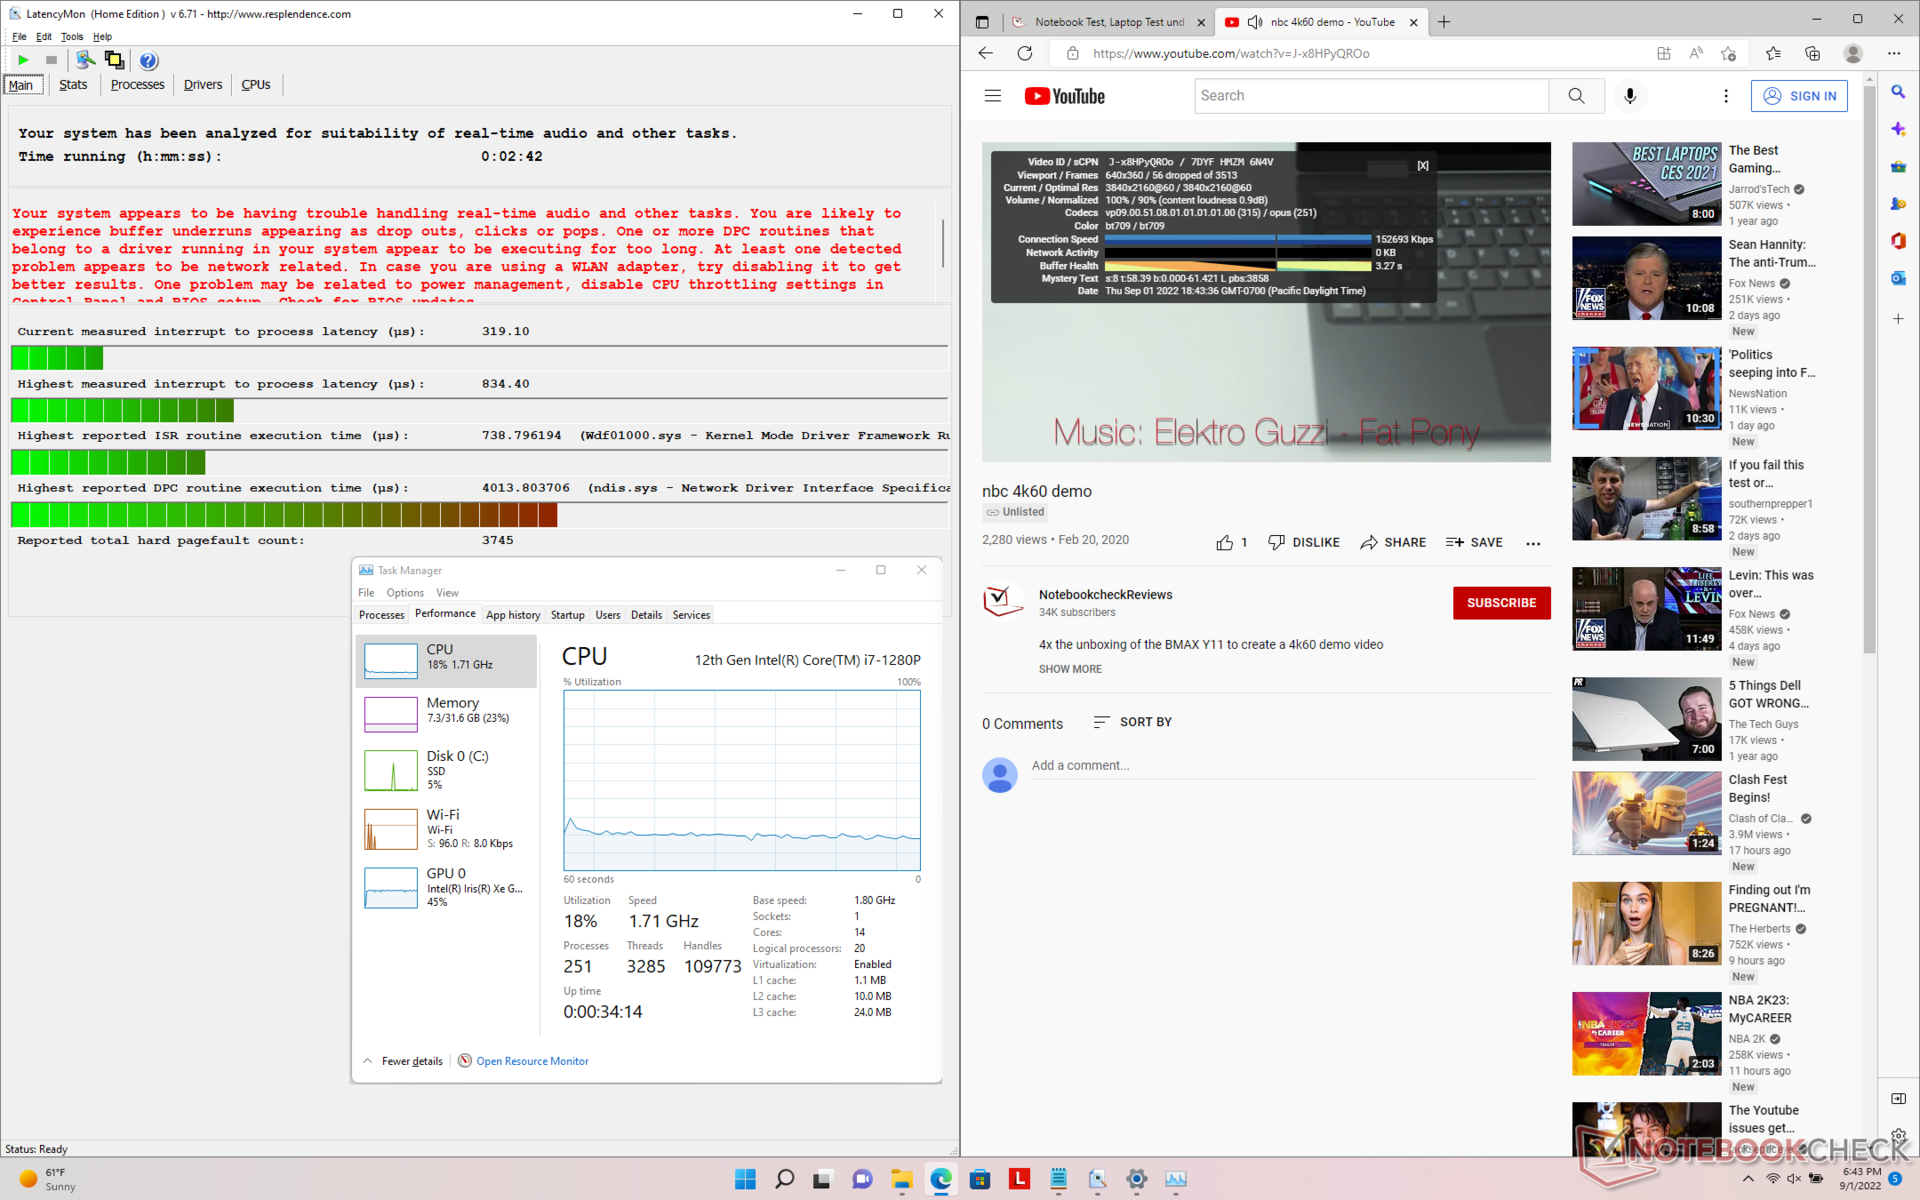
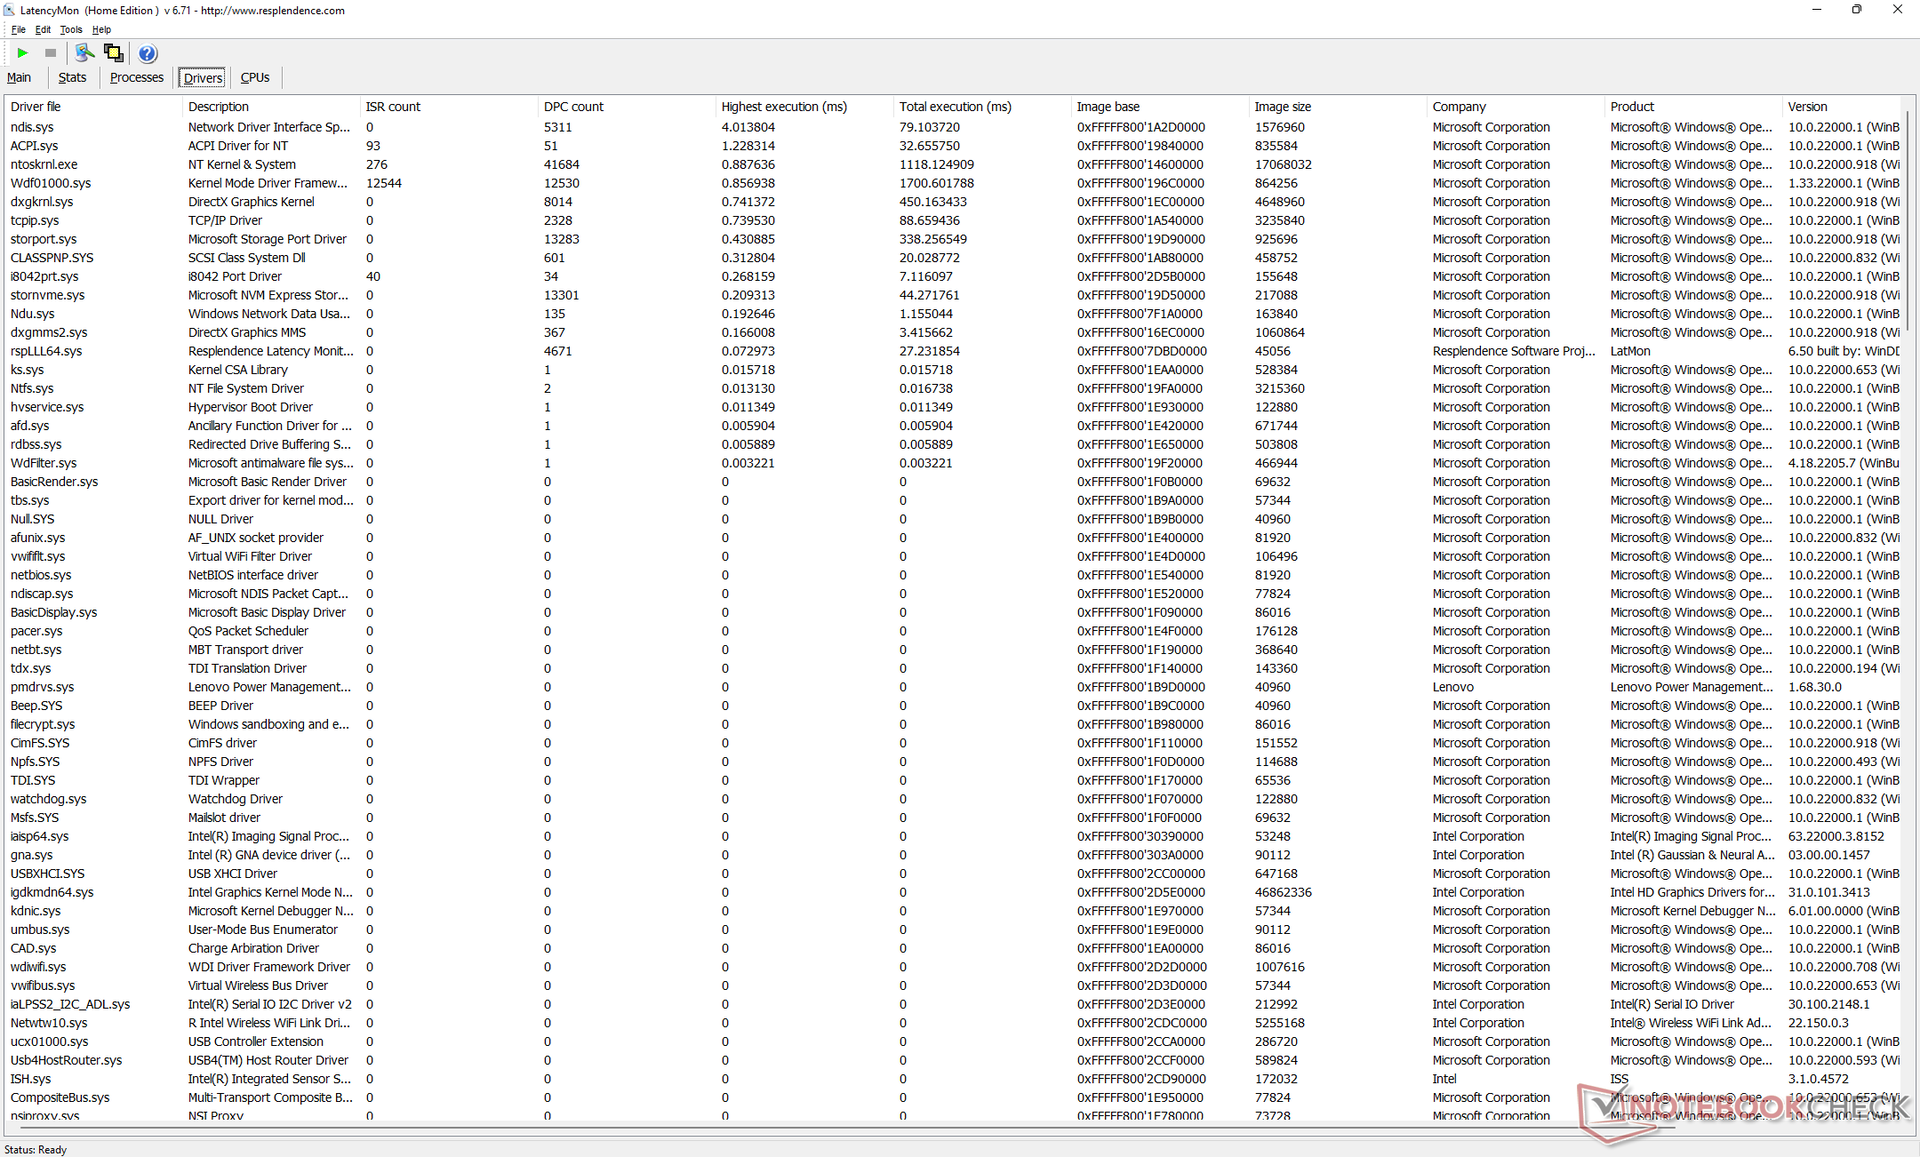
LatencyMon revela problemas de DPC ao abrir várias abas do navegador em nossa página inicial. a reprodução de vídeo de 4K a 60 FPS poderia ter sido melhor, assim como somos capazes de gravar 56 quadros perdidos durante nosso teste de vídeo de minutos mesmo quando nos últimos drivers gráficos a partir desta data de publicação.
| DPC Latencies / LatencyMon - interrupt to process latency (max), Web, Youtube, Prime95 | |
| Lenovo ThinkPad X1 Nano-20UN002UGE | |
| Huawei MateBook X Pro 2021 | |
| Framework Laptop 13.5 12th Gen Intel | |
| Lenovo ThinkPad X1 Nano Gen 2 Core i7-1280P | |
| Dell Latitude 13 7330 | |
| HP Elite Dragonfly G3 | |
* ... menor é melhor
Dispositivos de armazenamento
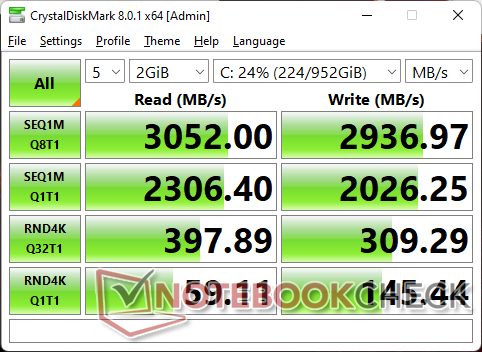
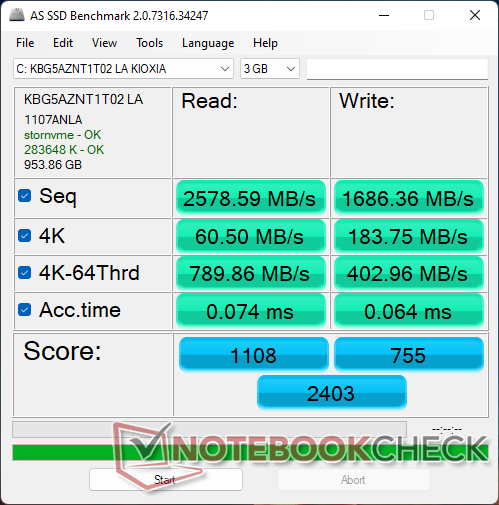
Nossa unidade de teste vem equipada com o Kioxia KBG5AZNT1T02 PCIe3 NVMe SSD para taxas máximas de leitura sustentada de até 2700 MB/s. É decepcionante que não existam opções de PCIe4 no checkout considerando o alto preço do ThinkPad X1 Nano, mas pelo menos o modelo vem com uma placa de cobre sobre o SSD para ajudar na dissipação de calor
Tenha em mente que as unidades 2280 M.2 de comprimento total não são suportadas.

* ... menor é melhor
Disk Throttling: DiskSpd Read Loop, Queue Depth 8
Desempenho da GPU
O desempenho gráfico é decente apesar da forte aceleração do desempenho da CPU mencionada acima. as pontuações 3DMark estão onde deveriam estar em relação a outros laptops com o mesmo Iris Xe 96 EUs GPU, mas o estrangulamento faz efeito quando se correm jogos reais. Por exemplo, as taxas de quadros quando ociosos em Witcher 3 nos ajustes mais baixos de 768p pode chegar a 106 FPS durante o início do teste antes de cair rapidamente para apenas 80 FPS alguns minutos depois, como mostra nosso gráfico abaixo
O desempenho geral dos gráficos ainda é mais rápido que no modelo Gen 1 do ano passado em cerca de 30% antes de contabilizar qualquer estrangulamento de desempenho.
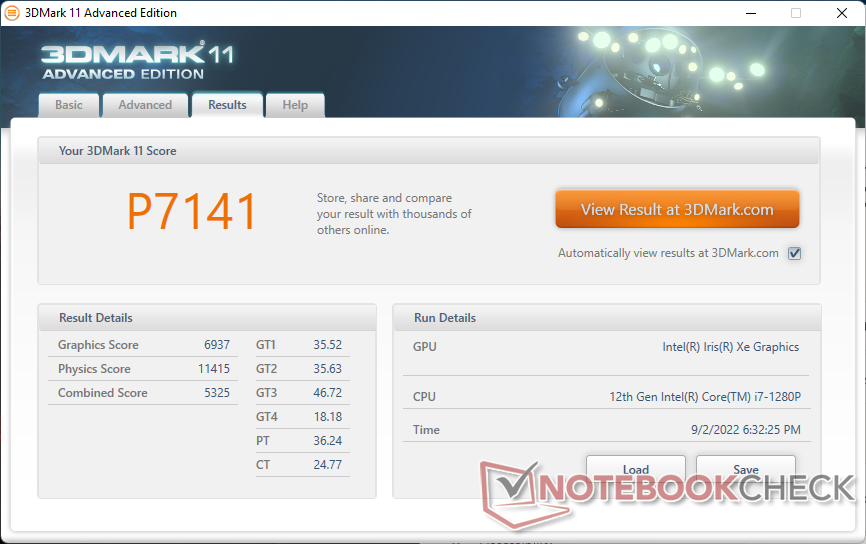
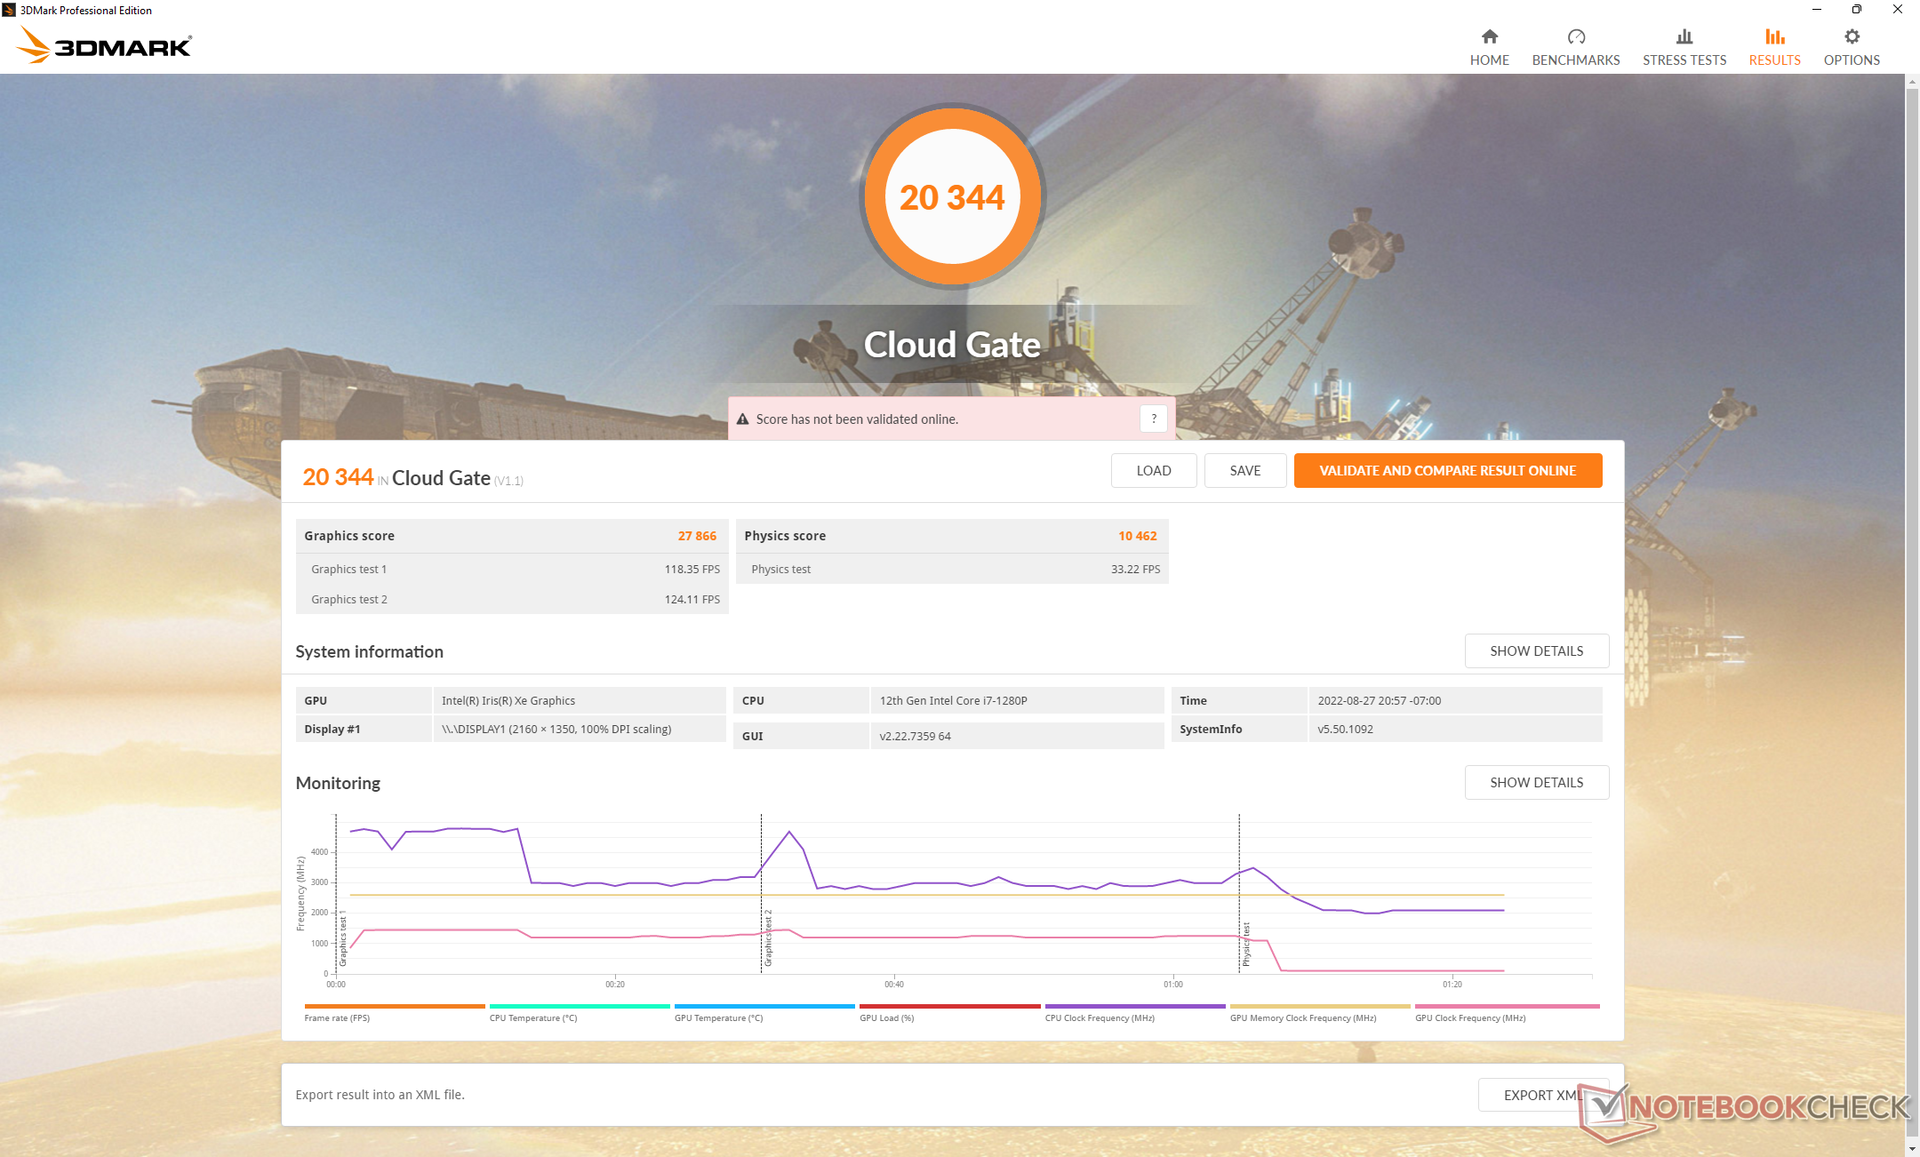
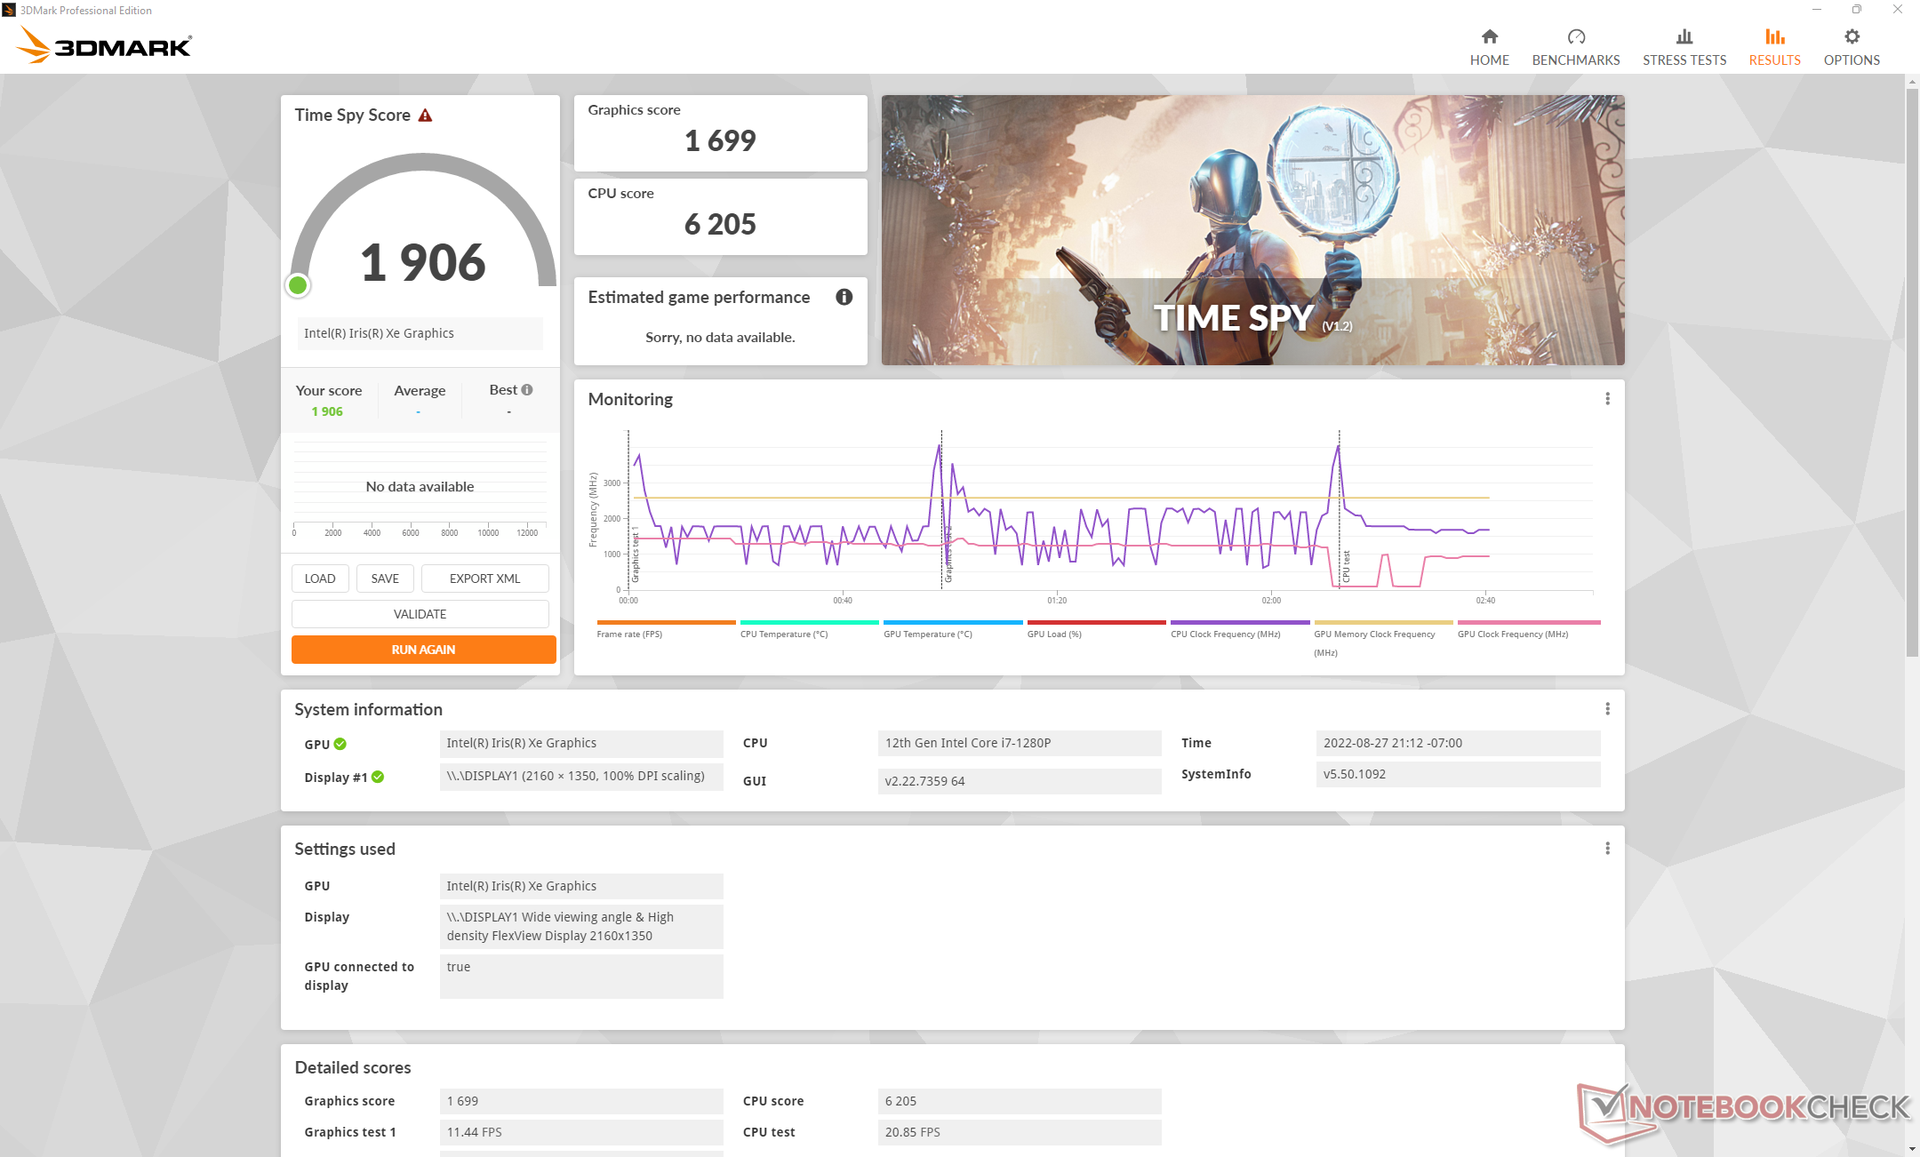
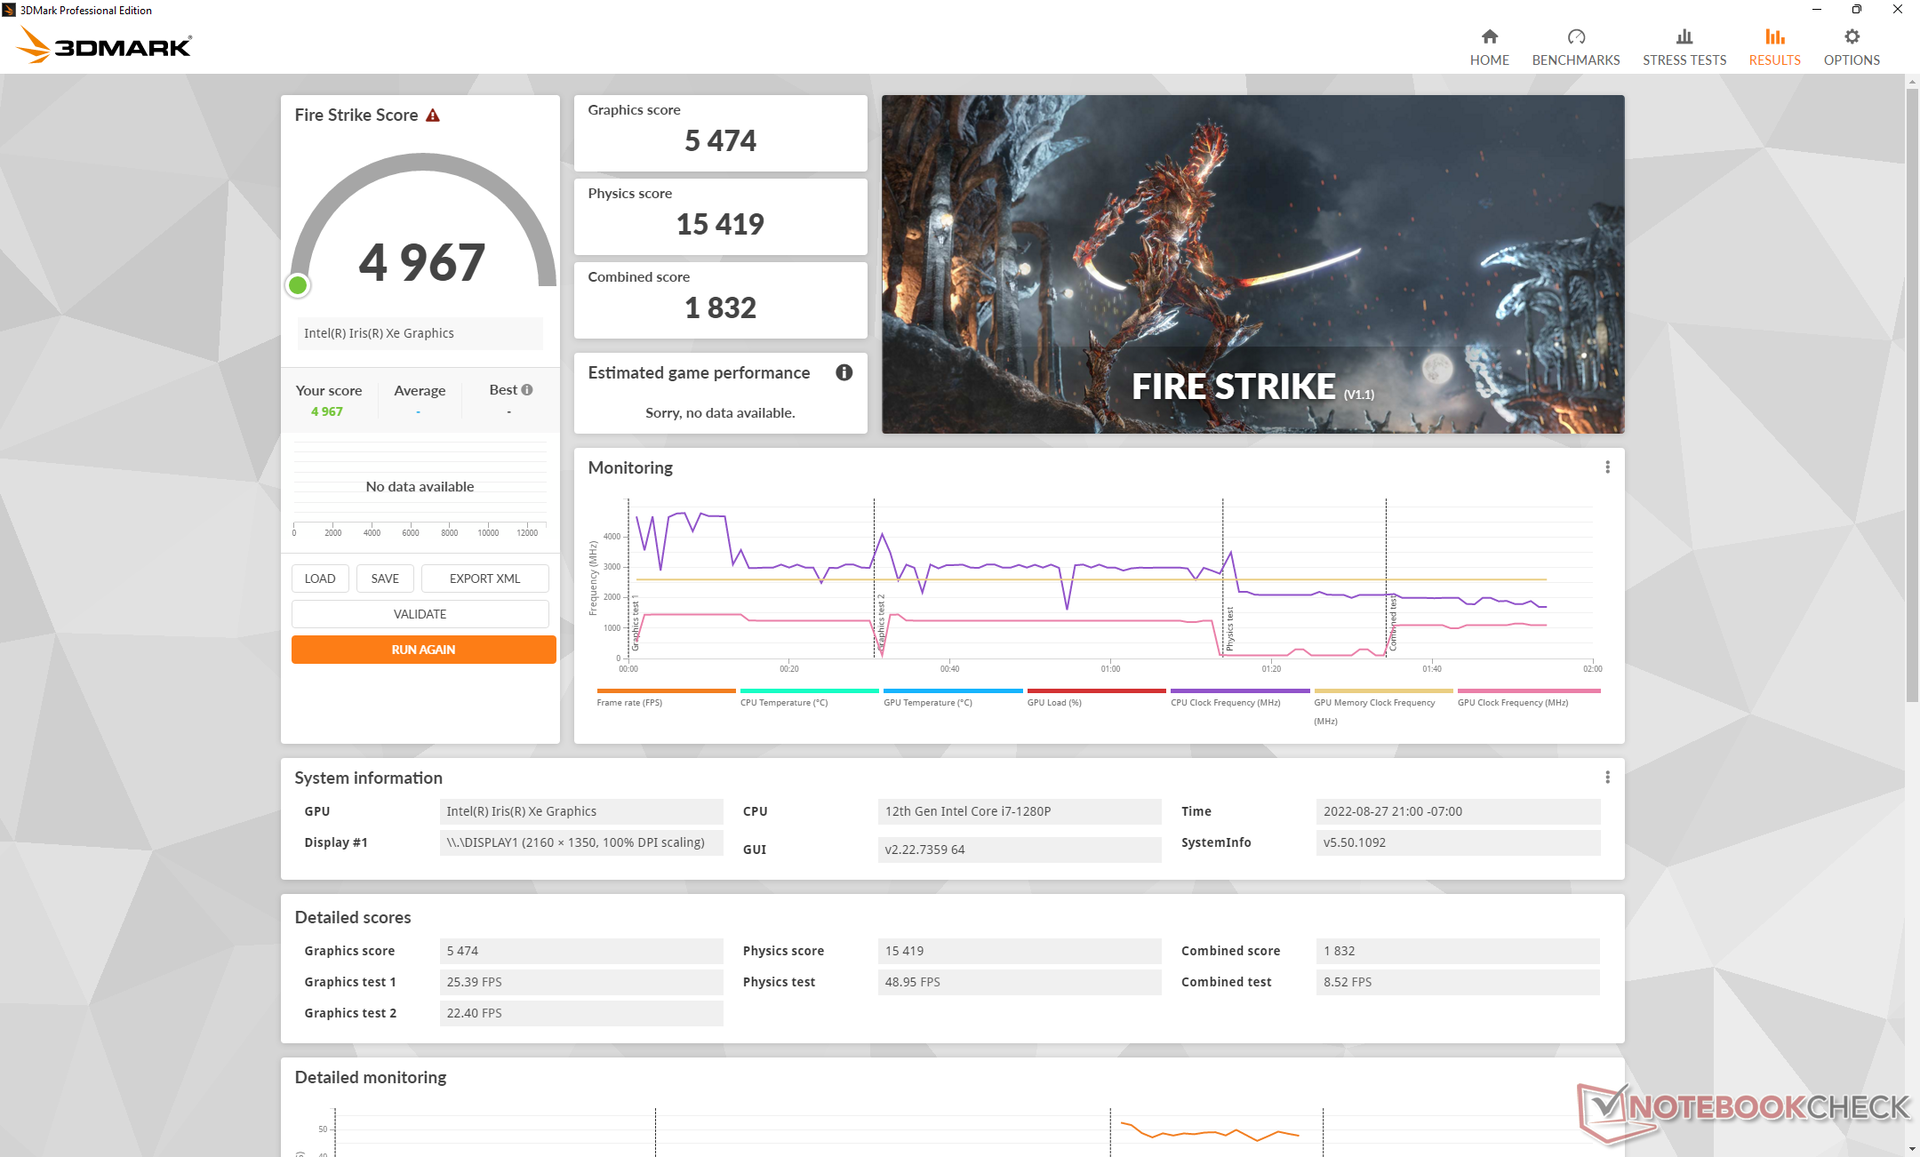
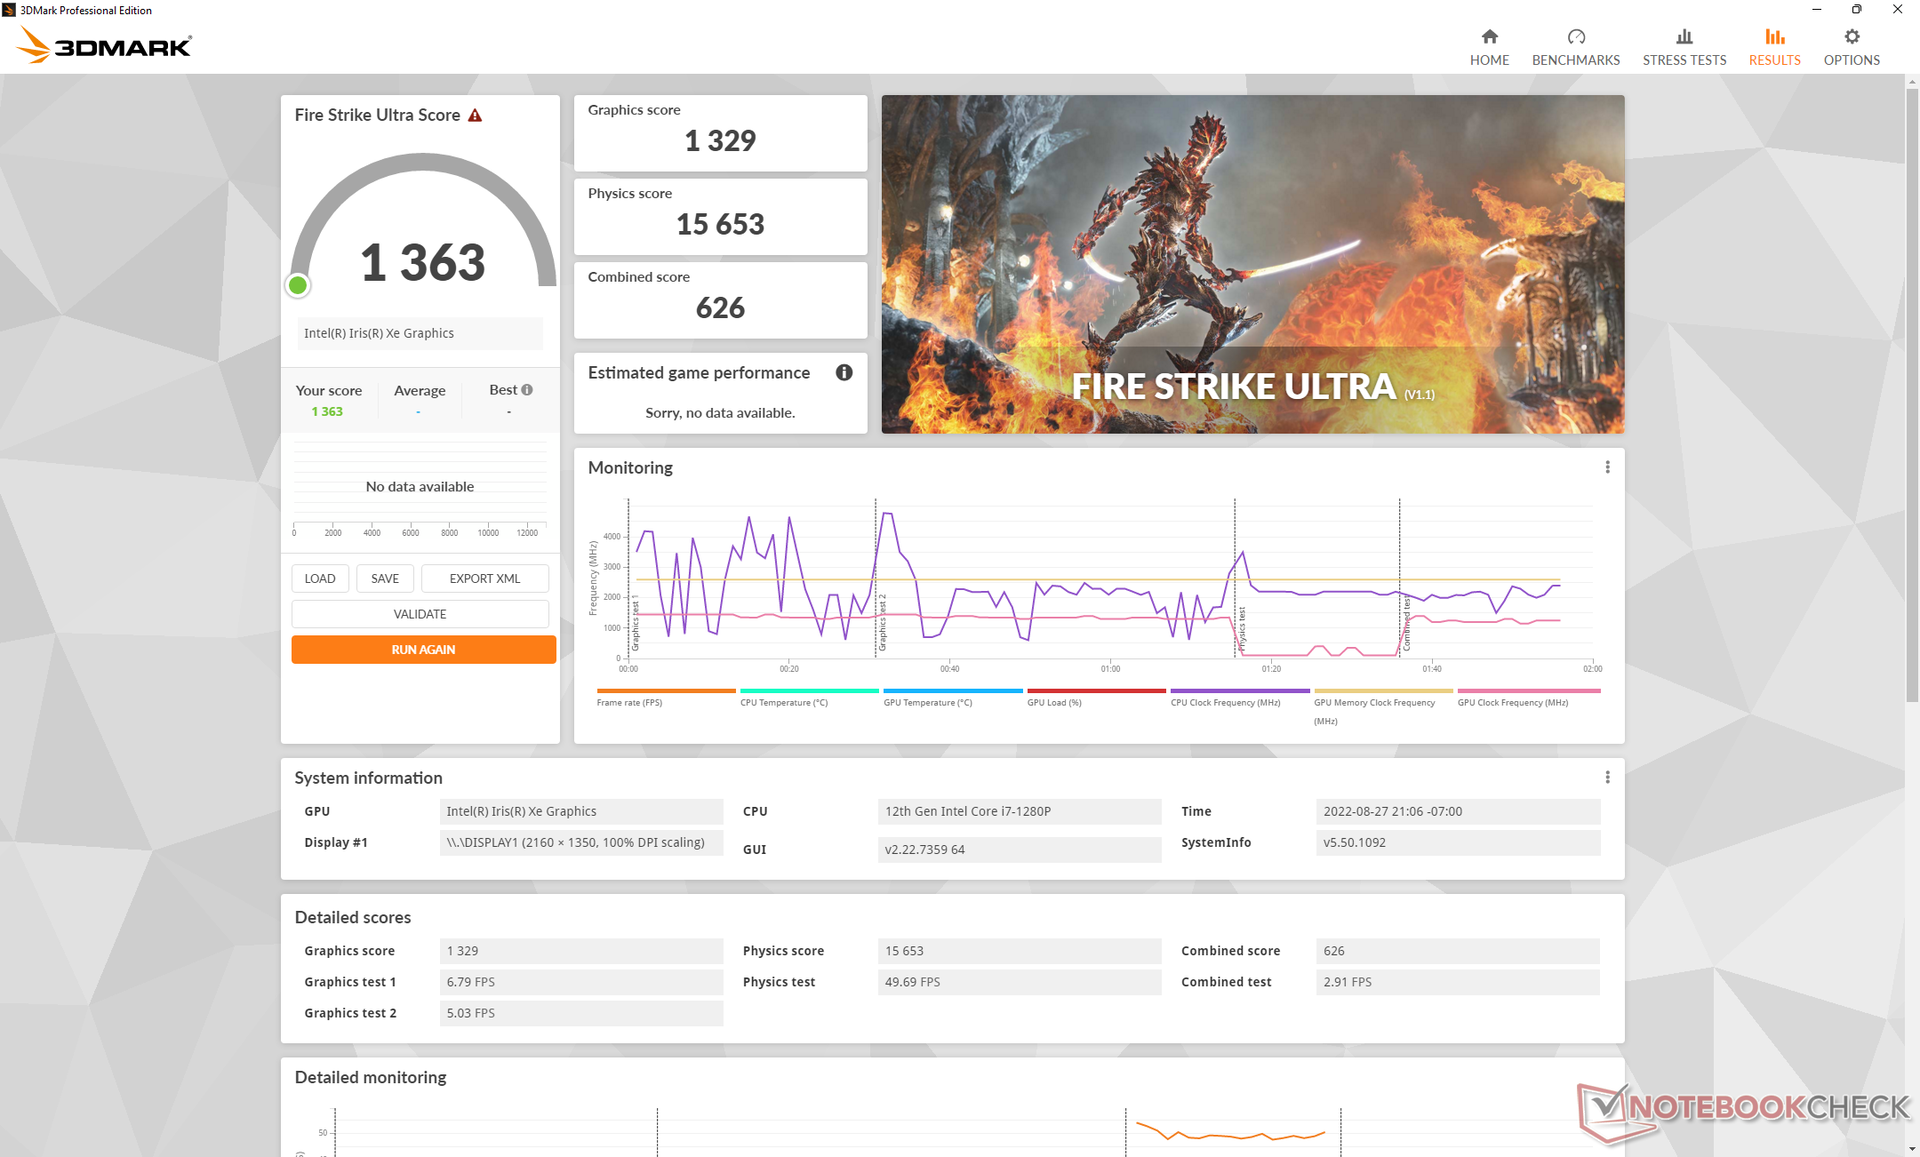
| 3DMark 11 Performance | 7141 pontos | |
| 3DMark Cloud Gate Standard Score | 20344 pontos | |
| 3DMark Fire Strike Score | 4967 pontos | |
| 3DMark Time Spy Score | 1906 pontos | |
Ajuda | ||
Witcher 3 FPS Chart
| baixo | média | alto | ultra | |
|---|---|---|---|---|
| GTA V (2015) | 97.2 | 82.3 | 21.9 | 9.84 |
| The Witcher 3 (2015) | 107.2 | 67.3 | 35 | 15.1 |
| Dota 2 Reborn (2015) | 106.1 | 76 | 55.6 | 49 |
| Final Fantasy XV Benchmark (2018) | 35.8 | 20.7 | 20.7 | |
| X-Plane 11.11 (2018) | 38.8 | 39.9 | 35.4 | |
| Strange Brigade (2018) | 88.1 | 41 | 32 | 25.1 |
| Cyberpunk 2077 1.6 (2022) | 18.3 | 16.1 | 12.3 | 9.5 |
Emissões
Ruído do sistema
O ruído dos ventiladores está ligado aos três perfis de potência da Lenovo Vantage: Refrigeração silenciosa, balanceada ou inteligente, e melhor desempenho. O sistema é mais silencioso do que o esperado, mesmo quando no perfil padrão de Refrigeração Inteligente. Ao executar a primeira cena de referência do 3DMark 06, por exemplo, o ventilador interno permaneceria muito silencioso em toda a cena, muito parecido com o que observamos no Libélula G3 ouMateBook X Pro em condições semelhantes. Quando ajustado para Melhor Desempenho, no entanto, espere que o ventilador pulsar com mais freqüência a até 40 dB(A) quando estiver executando cargas mais altas como jogos. Caso contrário, recomendamos que se mantenha a refrigeração inteligente para a maioria dos cenários.
Vale a pena notar que nossa unidade de teste exibiria ruído eletrônico ou choradeira da bobina quando ociosa na mesa de trabalho. O ruído desapareceria temporariamente ao rodar o 3DMark 06, o que explica por que nossas medições de ruído ao rodar o benchmark é inferior à nossa medição de ruído quando ocioso na área de trabalho (23,9 vs. 23,3 dB(A)).
Barulho
| Ocioso |
| 23.9 / 23.9 / 23.9 dB |
| Carga |
| 23.3 / 40.9 dB |
 | ||
30 dB silencioso 40 dB(A) audível 50 dB(A) ruidosamente alto |
||
min: | ||
| Lenovo ThinkPad X1 Nano Gen 2 Core i7-1280P Iris Xe G7 96EUs, i7-1280P, Kioxia BG5 KBG5AZNT1T02 | Lenovo ThinkPad X1 Nano-20UN002UGE Iris Xe G7 96EUs, i7-1160G7, WDC PC SN530 SDBPNPZ-512G | HP Elite Dragonfly G3 Iris Xe G7 96EUs, i7-1265U, Micron 3400 MTFDKBA512TFH 512GB | Dell Latitude 13 7330 Iris Xe G7 96EUs, i7-1265U, Toshiba KBG40ZNS512G NVMe | Framework Laptop 13.5 12th Gen Intel Iris Xe G7 96EUs, i7-1260P, WDC PC SN730 SDBPNTY-512G | Huawei MateBook X Pro 2021 Iris Xe G7 96EUs, i7-1165G7, Samsung PM981a MZVLB1T0HBLR | |
|---|---|---|---|---|---|---|
| Noise | -11% | 6% | -8% | -18% | -3% | |
| desligado / ambiente * (dB) | 23.3 | 24.9 -7% | 22.8 2% | 23.4 -0% | 22.8 2% | 25.4 -9% |
| Idle Minimum * (dB) | 23.9 | 24.9 -4% | 23.2 3% | 23.4 2% | 23 4% | 25.6 -7% |
| Idle Average * (dB) | 23.9 | 26.3 -10% | 23.2 3% | 23.4 2% | 23 4% | 25.6 -7% |
| Idle Maximum * (dB) | 23.9 | 31.8 -33% | 23.2 3% | 23.4 2% | 23 4% | 25.6 -7% |
| Load Average * (dB) | 23.3 | 34.3 -47% | 25.1 -8% | 37.8 -62% | 47.3 -103% | 28.7 -23% |
| Witcher 3 ultra * (dB) | 40.9 | 34.3 16% | 32 22% | 39.2 4% | 47.3 -16% | 32 22% |
| Load Maximum * (dB) | 40.9 | 37.5 8% | 35.2 14% | 43 -5% | 49.8 -22% | 38.2 7% |
* ... menor é melhor
Temperatura
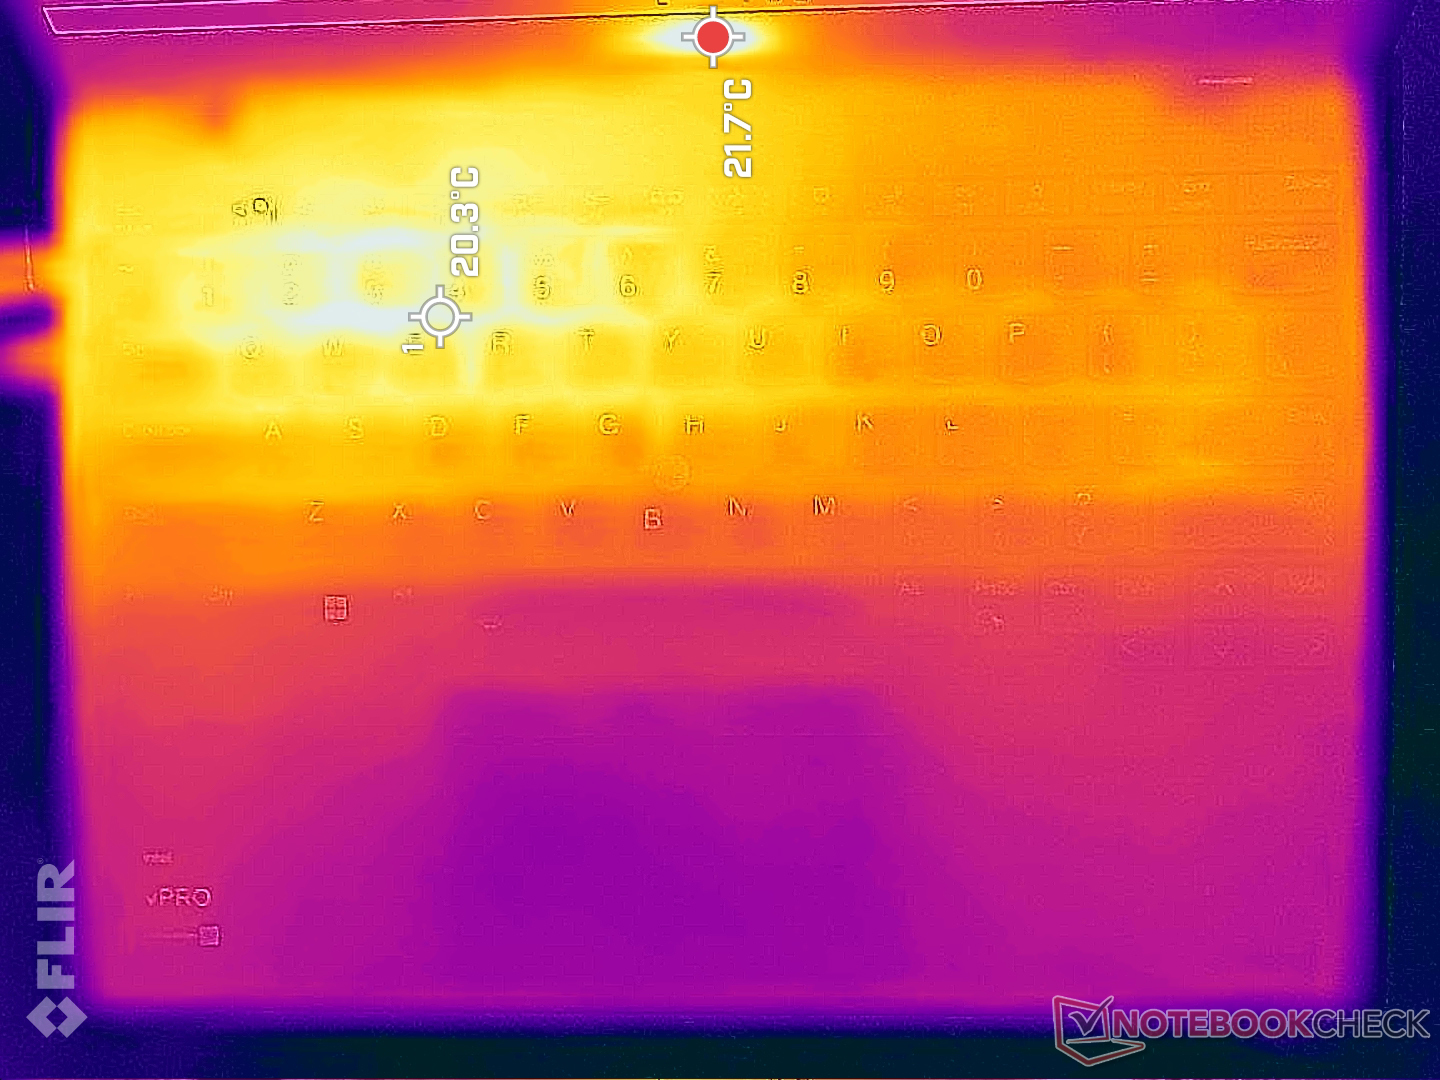
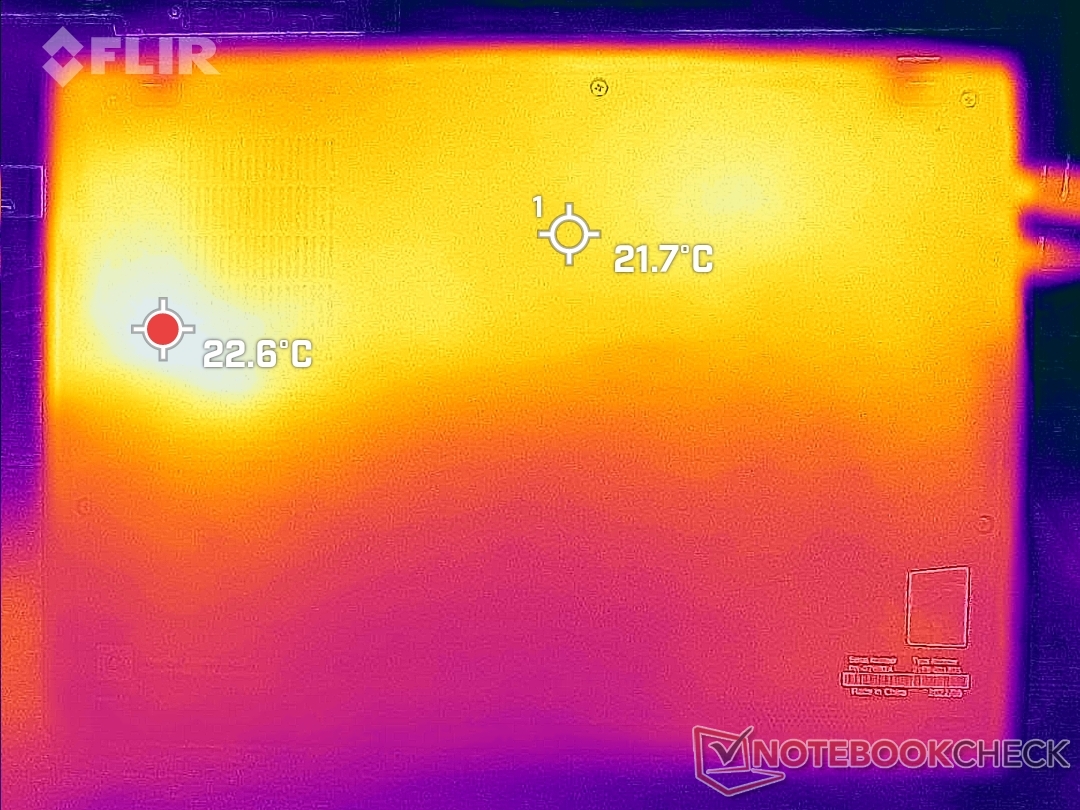
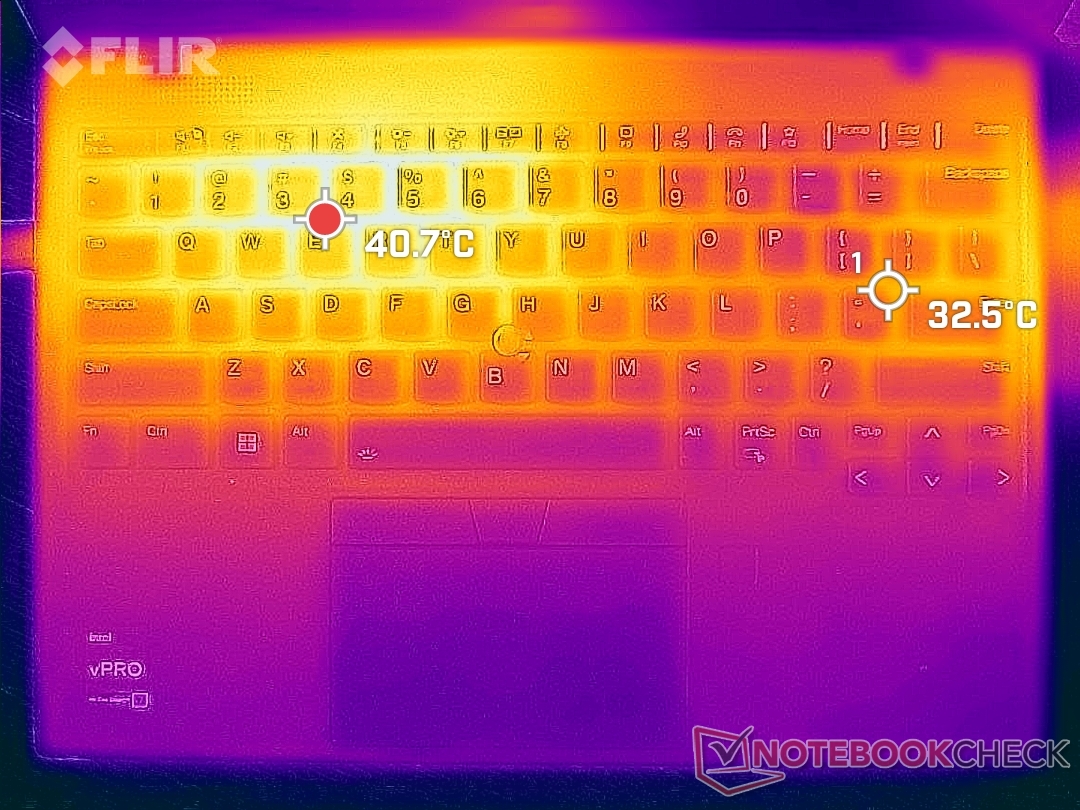
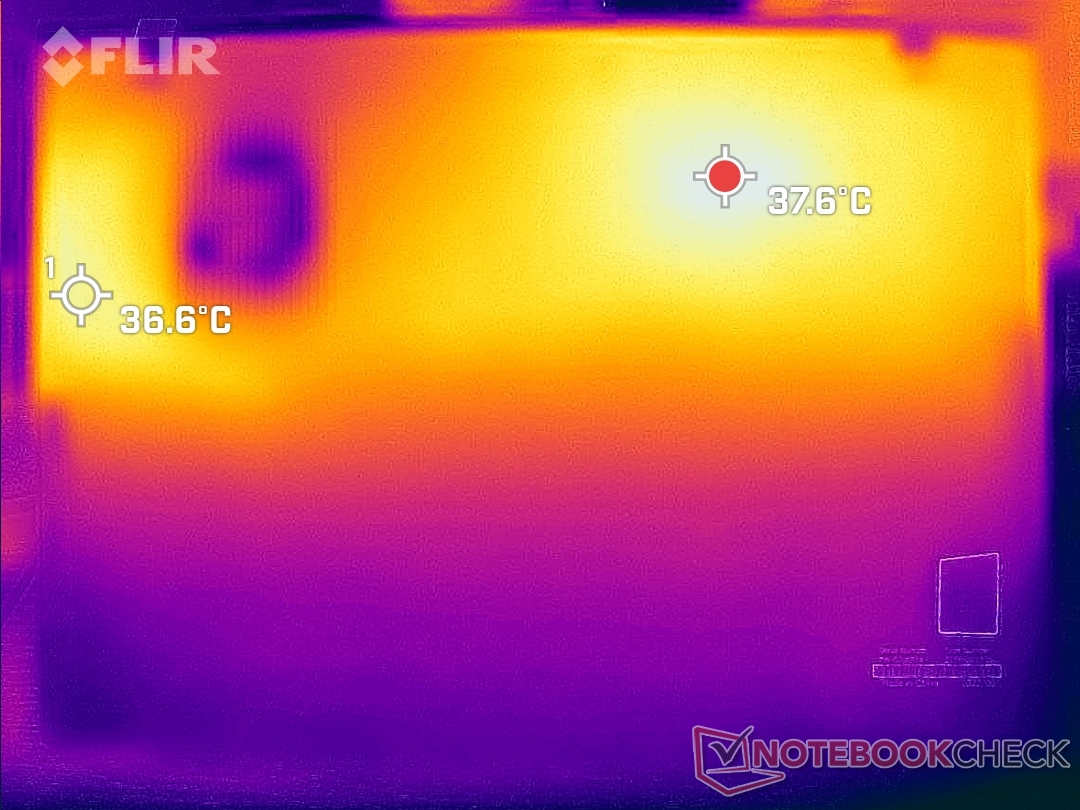
As temperaturas superficiais não são mais quentes em nossa mais nova unidade Gen 2 quando comparada à Gen 1. Na verdade, o ponto quente no fundo é mais frio a apenas 40 C em comparação com 48 C no modelo do ano passado, possivelmente devido ao acentuado estrangulamento de desempenho mencionado acima. Espere que a metade esquerda do teclado esteja sempre mais quente do que a metade direita, como mostram os mapas de temperatura abaixo, já que a CPU está posicionada no lado esquerdo do chassi.
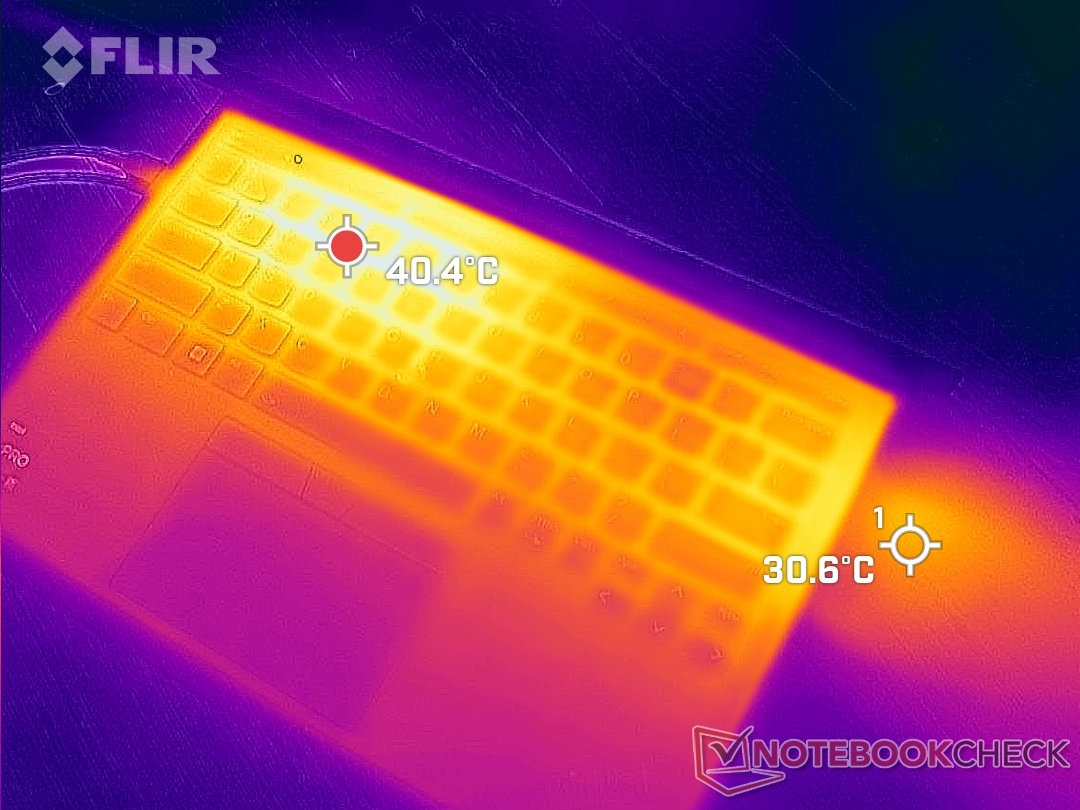
(±) A temperatura máxima no lado superior é 42.4 °C / 108 F, em comparação com a média de 35.9 °C / 97 F , variando de 21.4 a 59 °C para a classe Subnotebook.
(±) A parte inferior aquece até um máximo de 40.2 °C / 104 F, em comparação com a média de 39.2 °C / 103 F
(+) Em uso inativo, a temperatura média para o lado superior é 25.3 °C / 78 F, em comparação com a média do dispositivo de 30.8 °C / ### class_avg_f### F.
(+) Os apoios para as mãos e o touchpad são mais frios que a temperatura da pele, com um máximo de 30.2 °C / 86.4 F e, portanto, são frios ao toque.
(±) A temperatura média da área do apoio para as mãos de dispositivos semelhantes foi 28.2 °C / 82.8 F (-2 °C / -3.6 F).
| Lenovo ThinkPad X1 Nano Gen 2 Core i7-1280P Intel Core i7-1280P, Intel Iris Xe Graphics G7 96EUs | Lenovo ThinkPad X1 Nano-20UN002UGE Intel Core i7-1160G7, Intel Iris Xe Graphics G7 96EUs | HP Elite Dragonfly G3 Intel Core i7-1265U, Intel Iris Xe Graphics G7 96EUs | Dell Latitude 13 7330 Intel Core i7-1265U, Intel Iris Xe Graphics G7 96EUs | Framework Laptop 13.5 12th Gen Intel Intel Core i7-1260P, Intel Iris Xe Graphics G7 96EUs | Huawei MateBook X Pro 2021 Intel Core i7-1165G7, Intel Iris Xe Graphics G7 96EUs | |
|---|---|---|---|---|---|---|
| Heat | 1% | 2% | 8% | 4% | -7% | |
| Maximum Upper Side * (°C) | 42.4 | 42.2 -0% | 39 8% | 38.6 9% | 36.8 13% | 42.2 -0% |
| Maximum Bottom * (°C) | 40.2 | 47.5 -18% | 42.2 -5% | 42 -4% | 42.4 -5% | 40.4 -0% |
| Idle Upper Side * (°C) | 27.8 | 24.3 13% | 26.8 4% | 23.8 14% | 24.2 13% | 31.2 -12% |
| Idle Bottom * (°C) | 27.8 | 25.3 9% | 28.2 -1% | 24.6 12% | 29 -4% | 32.2 -16% |
* ... menor é melhor
Teste de estresse
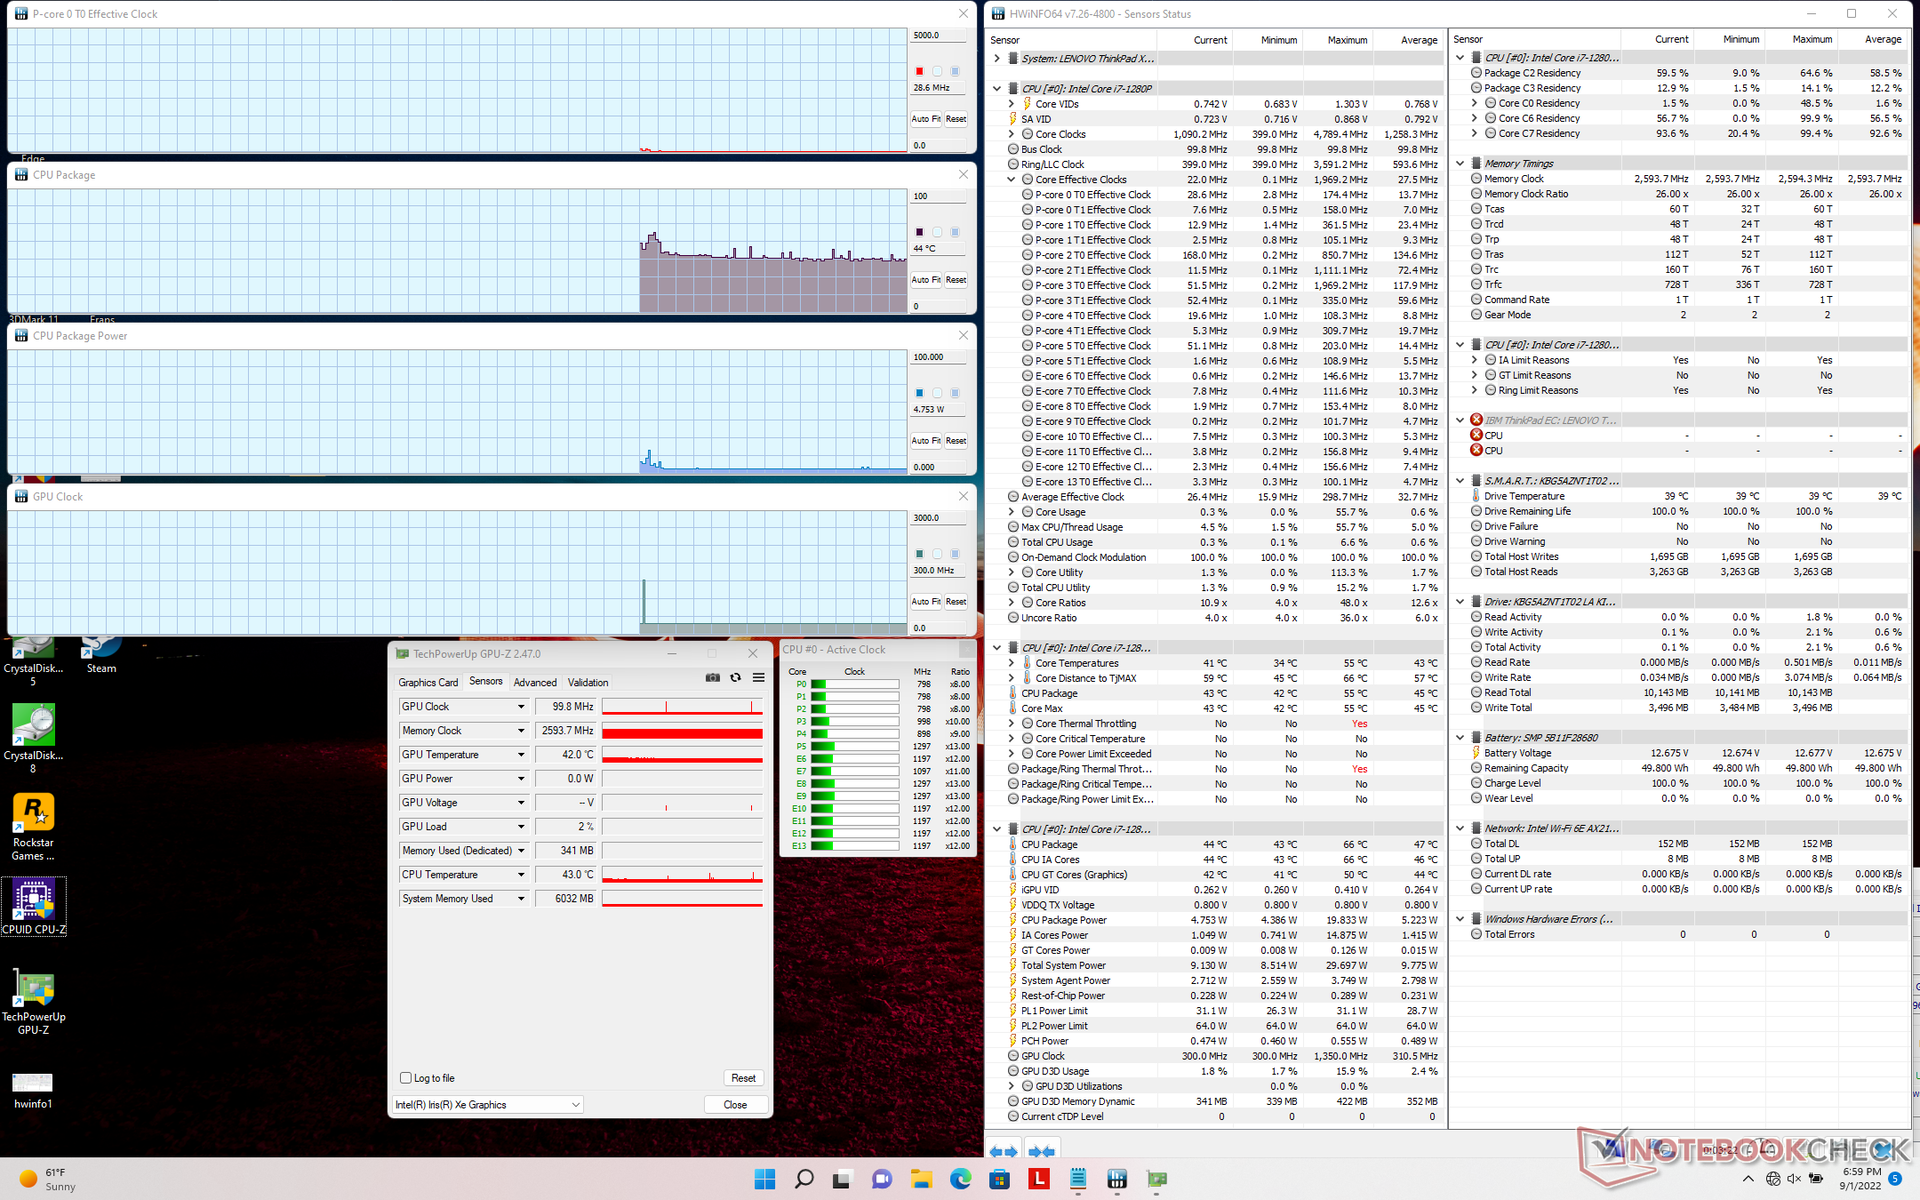
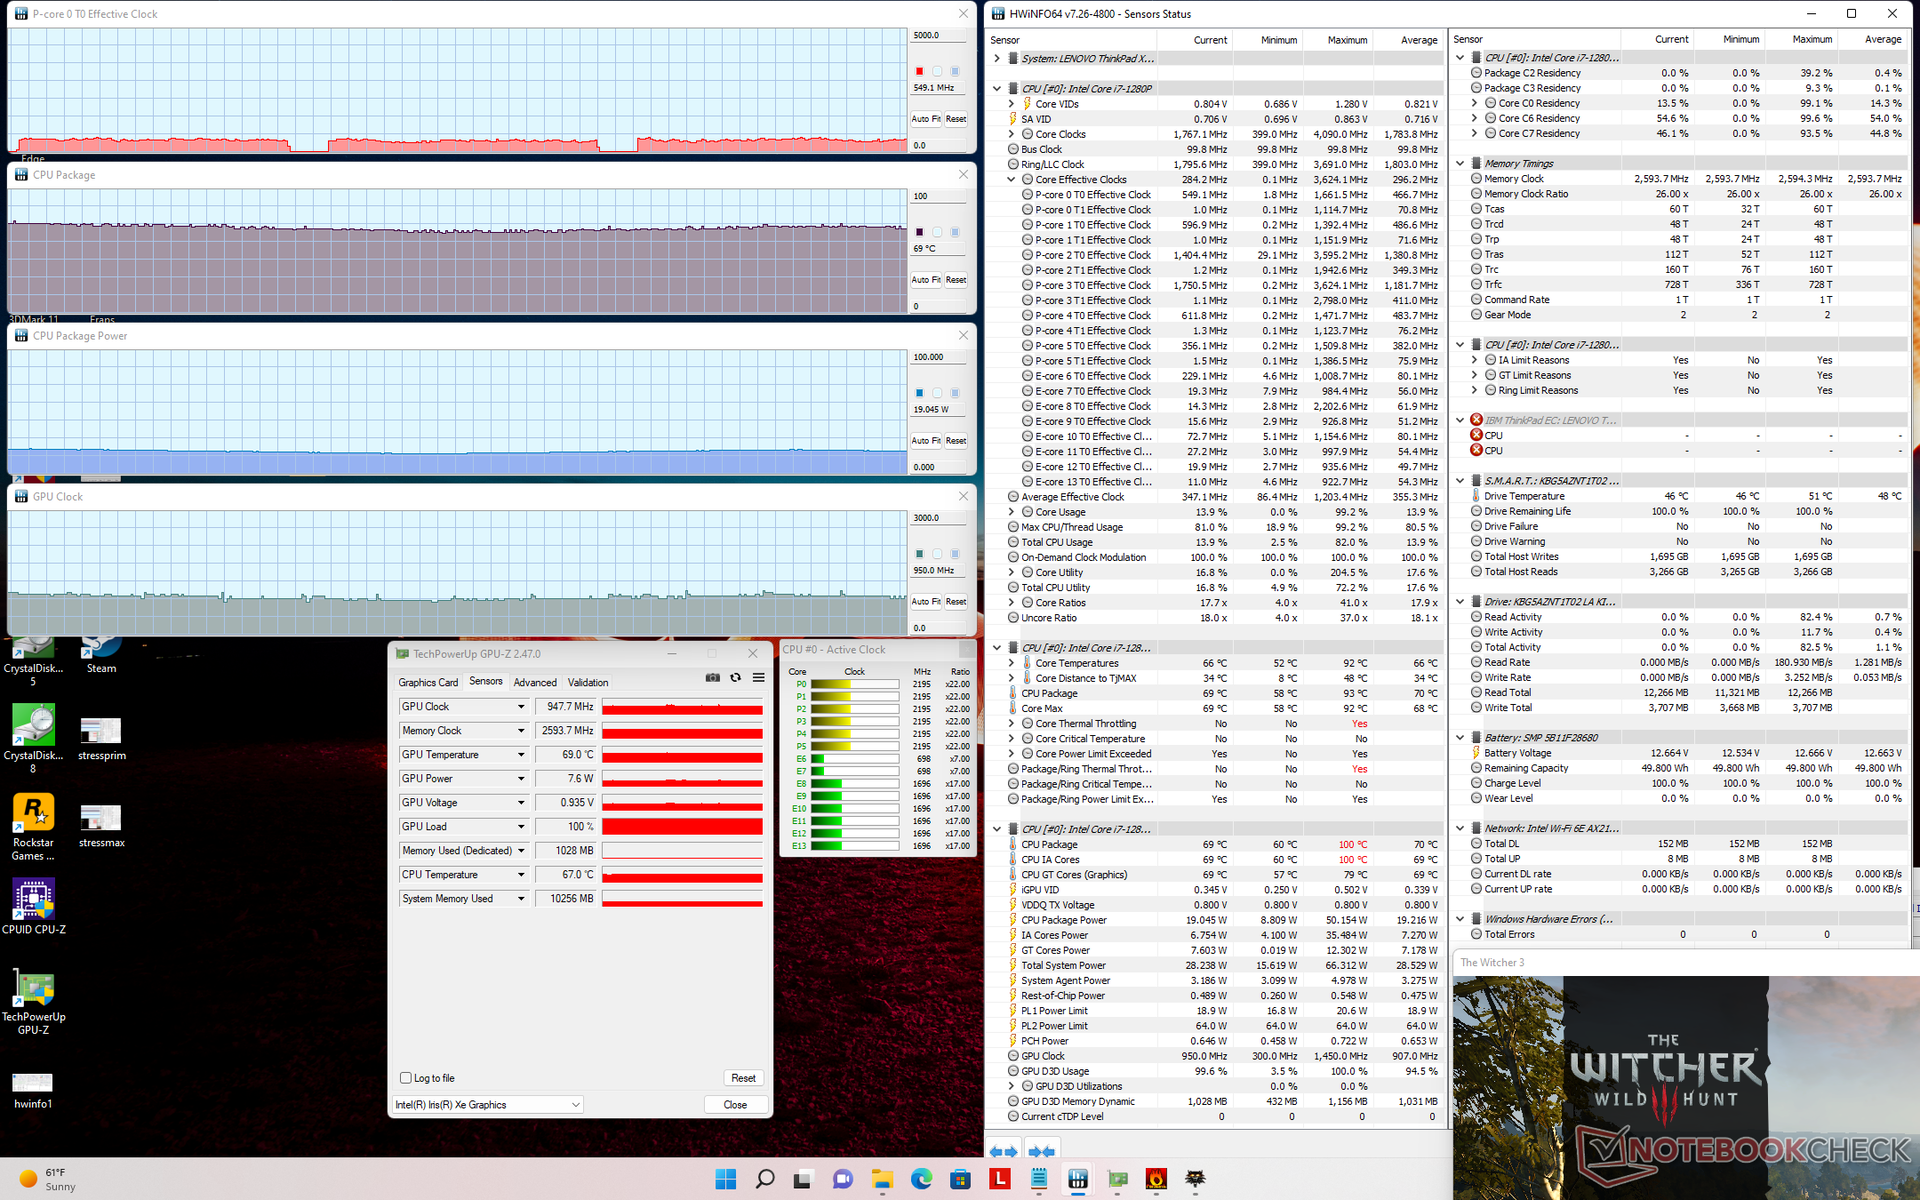
Quando estressado sob Prime95, as taxas de clock da CPU e o consumo de energia da placa aumentariam para 3 GHz e 64 W, respectivamente. Entretanto, a temperatura também aumentaria para um alarmante 97 C e, portanto, este Turbo Boost máximo duraria apenas alguns segundos, no máximo, antes que as taxas de clock e o consumo de energia da placa caíssem para apenas 1,3 GHz e 23 W, respectivamente, para uma temperatura central um pouco mais fria de 85 C. Executando este mesmo teste com o maior e mais pesado Estrutura Laptop equipado com a CPU i7-1260P resultaria em taxas de relógio estáveis mais altas de cerca de 2,5 GHz em comparação.
Taxas de relógio GPU e temperatura quando em funcionamento Witcher 3 se estabilizariam em 948 MHz e 69 C, respectivamente, em comparação com 1396 MHz e 83 C na estrutura acima mencionada.
O desempenho não é reduzido se a bateria estiver ligada. Um teste 3DMark 11 com baterias retornaria as pontuações Física e Gráfica de 13122 e 6668 pontos, respectivamente, em comparação com 11415 e 6937 pontos quando em rede elétrica.
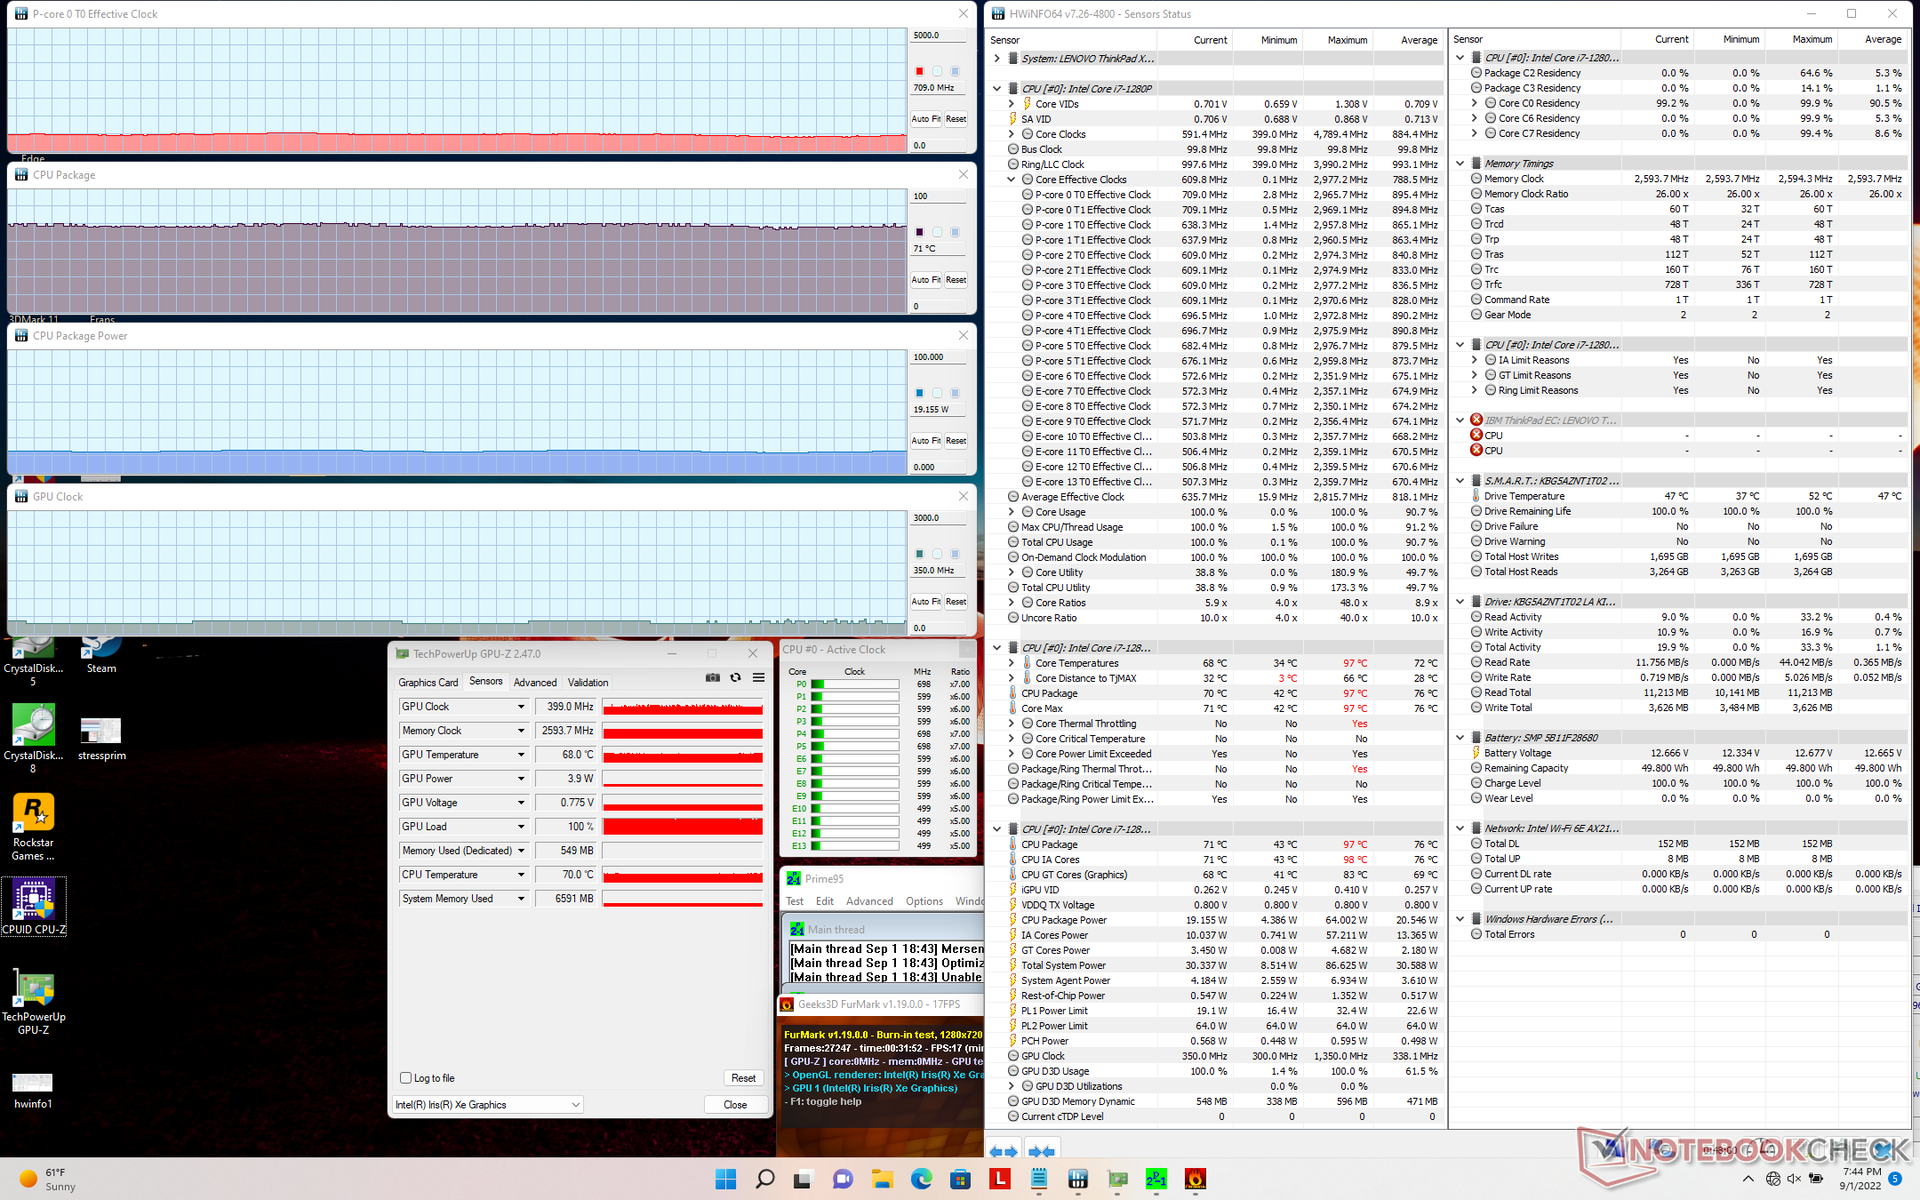
| Relógio CPU (GHz) | Relógio GPU (MHz) | Temperatura média da CPU (°C) | |
| System Idle | -- | -- | 44 |
| Prime95 Stress | 1.3 | -- | 85 |
| Prime95 + FurMark Stress | 0.7 | 399 | 71 |
| Witcher 3 Estresse | ~0.5 | 948 | 69 |
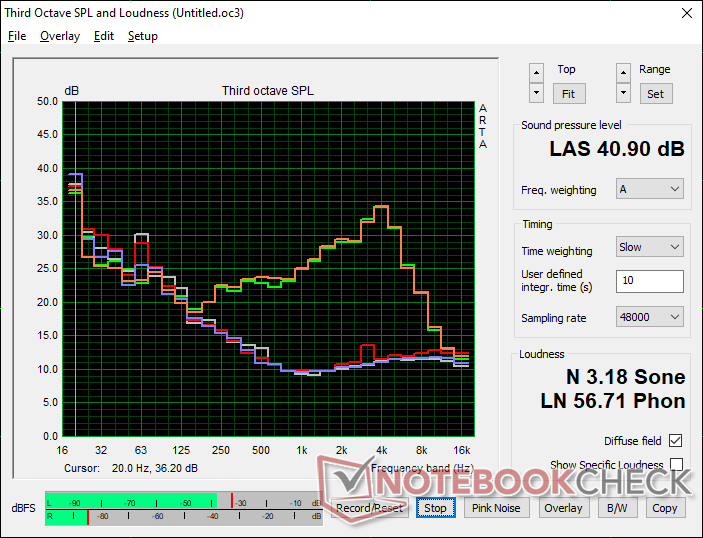
Oradores
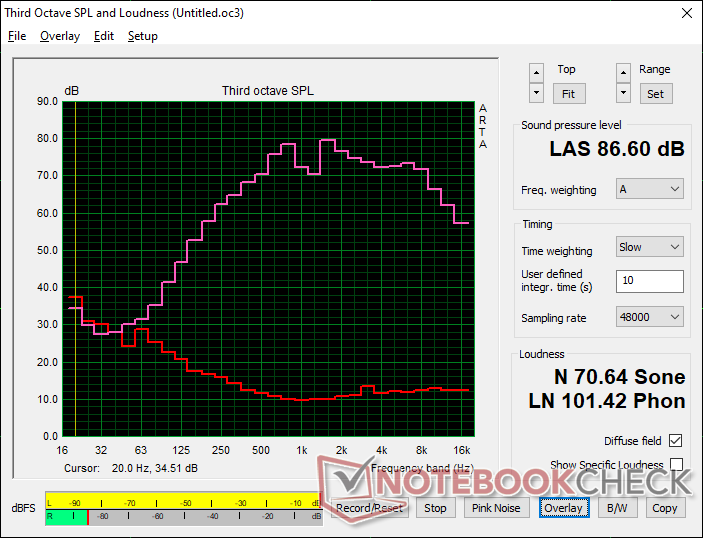
Lenovo ThinkPad X1 Nano Gen 2 Core i7-1280P análise de áudio
(+) | os alto-falantes podem tocar relativamente alto (###valor### dB)
Graves 100 - 315Hz
(-) | quase nenhum baixo - em média 16.3% menor que a mediana
(±) | a linearidade dos graves é média (8.4% delta para a frequência anterior)
Médios 400 - 2.000 Hz
(+) | médios equilibrados - apenas 4% longe da mediana
(±) | a linearidade dos médios é média (7.3% delta para frequência anterior)
Altos 2 - 16 kHz
(+) | agudos equilibrados - apenas 2.7% longe da mediana
(+) | os máximos são lineares (3% delta da frequência anterior)
Geral 100 - 16.000 Hz
(+) | o som geral é linear (12.8% diferença em relação à mediana)
Comparado com a mesma classe
» 19% de todos os dispositivos testados nesta classe foram melhores, 4% semelhantes, 76% piores
» O melhor teve um delta de 5%, a média foi 18%, o pior foi 53%
Comparado com todos os dispositivos testados
» 12% de todos os dispositivos testados foram melhores, 3% semelhantes, 85% piores
» O melhor teve um delta de 4%, a média foi 23%, o pior foi 134%
Apple MacBook Pro 16 2021 M1 Pro análise de áudio
(+) | os alto-falantes podem tocar relativamente alto (###valor### dB)
Graves 100 - 315Hz
(+) | bons graves - apenas 3.8% longe da mediana
(+) | o baixo é linear (5.2% delta para a frequência anterior)
Médios 400 - 2.000 Hz
(+) | médios equilibrados - apenas 1.3% longe da mediana
(+) | médios são lineares (2.1% delta para frequência anterior)
Altos 2 - 16 kHz
(+) | agudos equilibrados - apenas 1.9% longe da mediana
(+) | os máximos são lineares (2.7% delta da frequência anterior)
Geral 100 - 16.000 Hz
(+) | o som geral é linear (4.6% diferença em relação à mediana)
Comparado com a mesma classe
» 0% de todos os dispositivos testados nesta classe foram melhores, 0% semelhantes, 100% piores
» O melhor teve um delta de 5%, a média foi 17%, o pior foi 45%
Comparado com todos os dispositivos testados
» 0% de todos os dispositivos testados foram melhores, 0% semelhantes, 100% piores
» O melhor teve um delta de 4%, a média foi 23%, o pior foi 134%
Gestão de energia
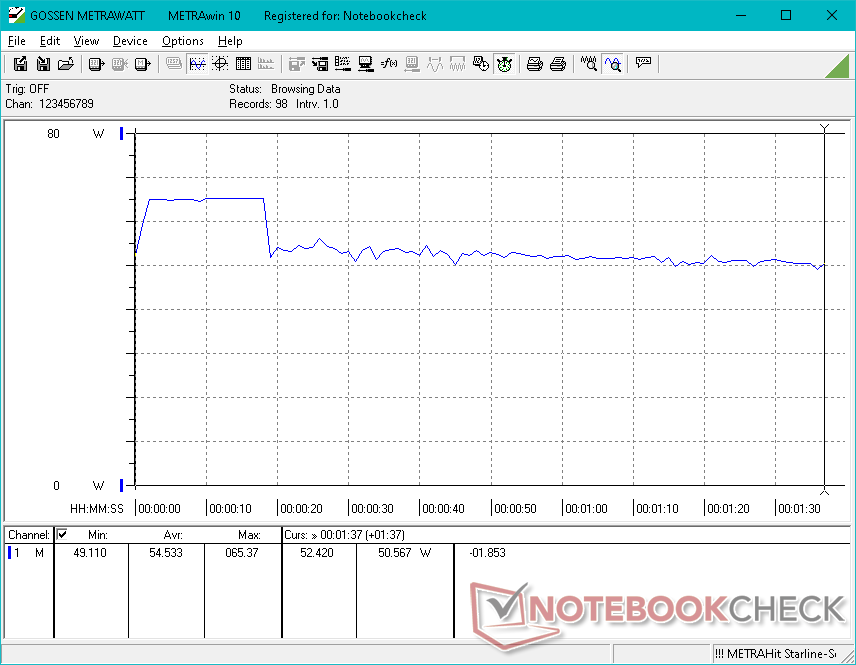
Consumo de energia
O sistema é geralmente mais exigente do que outros sub-portáteis de 13 polegadas, pois é um dos poucos com uma CPU Core P-series. Simplesmente ocioso no desktop desenha entre 3 W e 15 W enquanto que o Libélula HP G3, Latitude 7330ou o ThinkPad X1 Nano original seria o melhor em apenas 7 W ou 9 W sob condições similares
O consumo de energia diferencia o balão ainda mais quando a carga é mais exigente. 3DMark 06 ou Witcher 3por exemplo, exigiria que entre 44 W e 55 W fosse significativamente mais do que o HP, Dell ou X1 Nano original acima mencionado. A CPU Core i7-1280P pode ser mais rápida, mas certamente vem com um custo
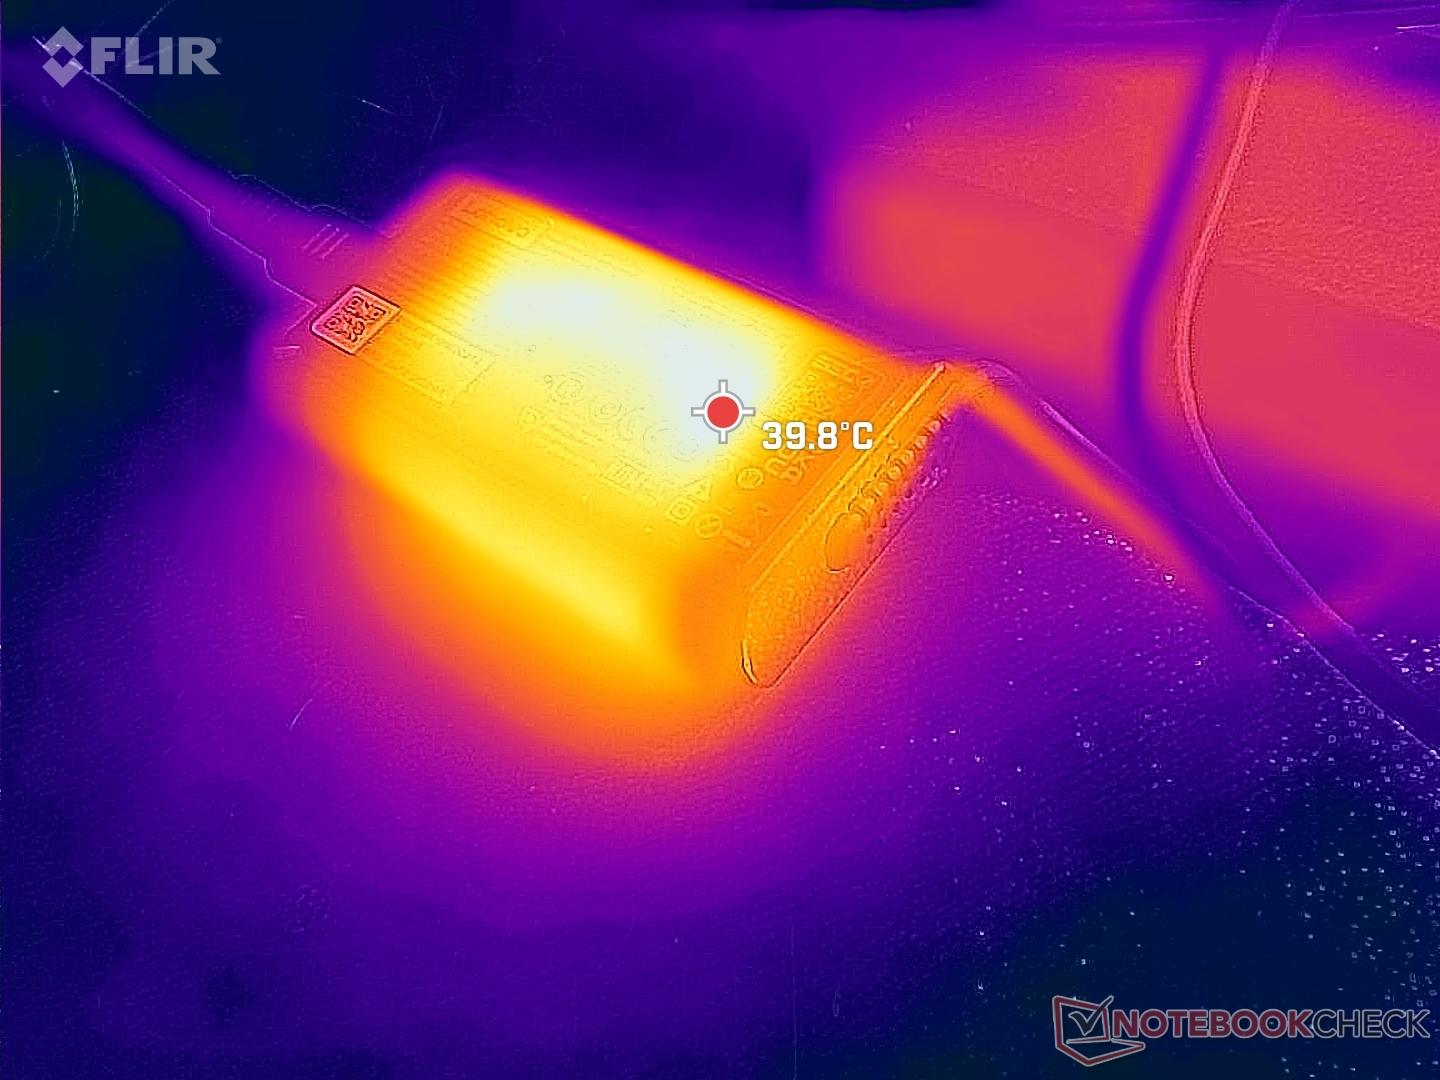
Somos capazes de registrar um consumo máximo temporário de 65,4 W do pequeno (~8,7 x 5,2 x 2,2 cm) adaptador de CA de 65 W antes de acionar o acelerador, como mostrado por nossas capturas de tela abaixo.
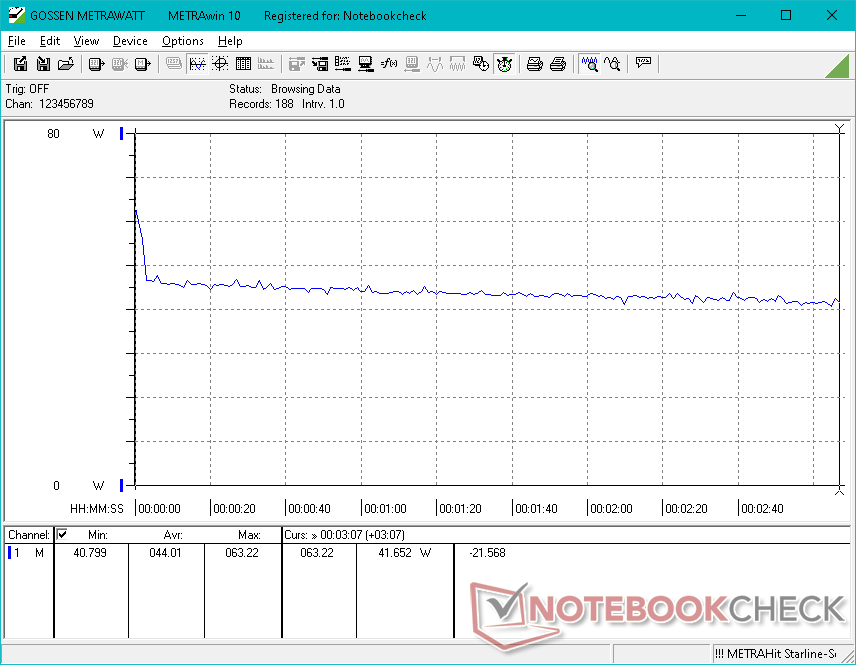
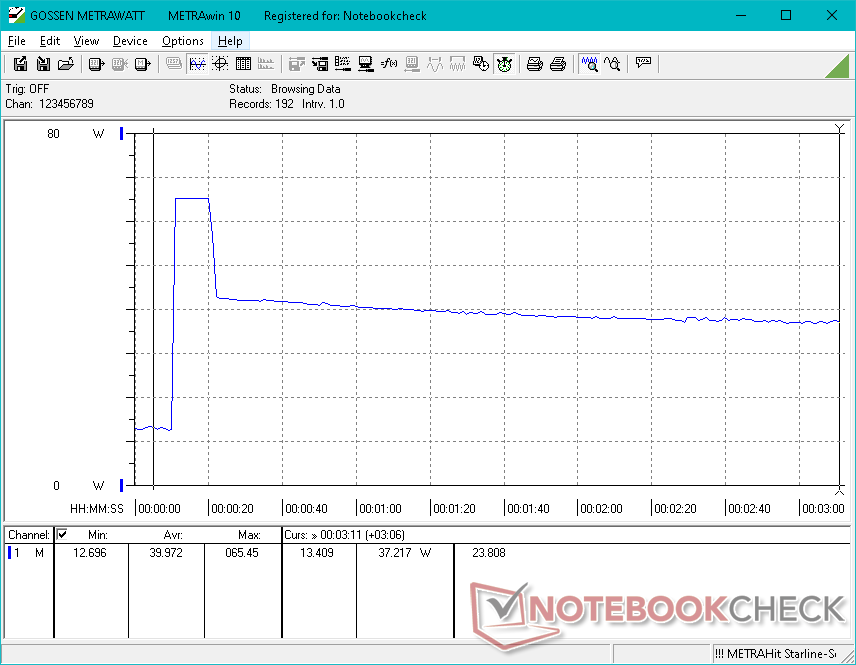
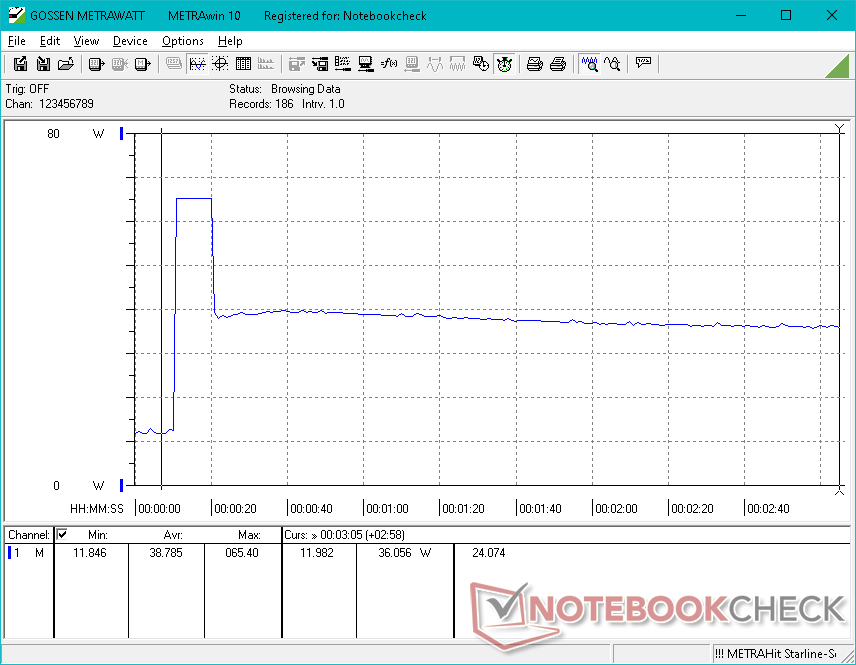
| desligado | |
| Ocioso | |
| Carga |
|
Key:
min: | |
| Lenovo ThinkPad X1 Nano Gen 2 Core i7-1280P i7-1280P, Iris Xe G7 96EUs, Kioxia BG5 KBG5AZNT1T02, IPS, 2160x1350, 13" | Lenovo ThinkPad X1 Nano-20UN002UGE i7-1160G7, Iris Xe G7 96EUs, WDC PC SN530 SDBPNPZ-512G, IPS, 2160x1350, 13" | HP Elite Dragonfly G3 i7-1265U, Iris Xe G7 96EUs, Micron 3400 MTFDKBA512TFH 512GB, IPS, 1920x1280, 13.5" | Dell Latitude 13 7330 i7-1265U, Iris Xe G7 96EUs, Toshiba KBG40ZNS512G NVMe, IPS, 1920x1080, 13.3" | Framework Laptop 13.5 12th Gen Intel i7-1260P, Iris Xe G7 96EUs, WDC PC SN730 SDBPNTY-512G, IPS, 2256x1504, 13.5" | Huawei MateBook X Pro 2021 i7-1165G7, Iris Xe G7 96EUs, Samsung PM981a MZVLB1T0HBLR, IPS, 3000x2000, 13.9" | |
|---|---|---|---|---|---|---|
| Power Consumption | 25% | 16% | 21% | -11% | -11% | |
| Idle Minimum * (Watt) | 3.4 | 3.3 3% | 3.4 -0% | 2.8 18% | 5.3 -56% | 6.7 -97% |
| Idle Average * (Watt) | 6.5 | 5.7 12% | 5.6 14% | 4.8 26% | 8.4 -29% | 10 -54% |
| Idle Maximum * (Watt) | 14.4 | 9.1 37% | 8.4 42% | 7.3 49% | 11.2 22% | 10.3 28% |
| Load Average * (Watt) | 54.5 | 29.6 46% | 40.8 25% | 48.1 12% | 57.4 -5% | 35.7 34% |
| Witcher 3 ultra * (Watt) | 44 | 27.7 37% | 35.5 19% | 35.4 20% | 46.7 -6% | 32.7 26% |
| Load Maximum * (Watt) | 65.4 | 55.1 16% | 68.4 -5% | 63.6 3% | 61.2 6% | 67.6 -3% |
* ... menor é melhor
Power Consumption Witcher 3 / Stresstest
Power Consumption external Monitor
Vida útil da bateria
Os tempos de execução são muito menores do que no modelo do ano passado em quase metade (!) mesmo quando no perfil de potência Balanceado provavelmente devido à CPU mais exigente da série Core P. Com apenas 5 horas de uso da WLAN no mundo real, o X1 Nano Gen 2 não vai durar quase tanto tempo quanto a maioria dos outros sub-portáteis.
| Lenovo ThinkPad X1 Nano Gen 2 Core i7-1280P i7-1280P, Iris Xe G7 96EUs, 49.5 Wh | Lenovo ThinkPad X1 Nano-20UN002UGE i7-1160G7, Iris Xe G7 96EUs, 48.2 Wh | HP Elite Dragonfly G3 i7-1265U, Iris Xe G7 96EUs, 68 Wh | Dell Latitude 13 7330 i7-1265U, Iris Xe G7 96EUs, 41 Wh | Framework Laptop 13.5 12th Gen Intel i7-1260P, Iris Xe G7 96EUs, 55 Wh | Huawei MateBook X Pro 2021 i7-1165G7, Iris Xe G7 96EUs, 56 Wh | |
|---|---|---|---|---|---|---|
| Duração da bateria | 94% | 131% | 63% | 47% | 106% | |
| WiFi v1.3 (h) | 5.1 | 9.9 94% | 11.8 131% | 8.3 63% | 7.5 47% | 10.5 106% |
| H.264 (h) | 15.4 | |||||
| Load (h) | 1.6 | 3.5 | 1.4 | 3 | ||
| Reader / Idle (h) | 37.8 | 21.9 | 19.5 |
Pro
Contra
Veredicto - Um Sprinter leve, mas não um corredor de maratona
O ThinkPad X1 Nano Gen 2 é o exemplo perfeito do que acontece quando você troca uma CPU de 15 W por uma CPU de 28 W em um laptop originalmente projetado para rodar uma CPU de 15 W. Você vai ver um desempenho mais rápido, mas esse aumento de desempenho será apenas em curtos intervalos devido às limitações da solução de resfriamento. O sistema está, portanto, no seu melhor, onde pequenas rajadas de alto desempenho podem ser úteis, como ao lançar aplicações, a edição ocasional de imagens ou o descompacte de pequenos arquivos. No entanto, se você pretende usar o laptop para cargas de trabalho intensas de CPU por períodos de tempo maiores, então a CPU aqui pode não ser tão rápida quanto você espera. Tenha em mente que esta é uma desvantagem comum na maioria dos laptops, se não em todos os superleves (<1 kg), até agora como o Libélula G3, Latitude 7330ou LG Gram.
Outro aspecto importante a considerar é que a vida útil da bateria foi significativamente reduzida uma vez que a capacidade da bateria permanece essencialmente inalterada, apesar da CPU mais nova e mais exigente em termos de energia. Talvez seja necessário estar mais atento ao carregamento quando se viaja como resultado.
O ThinkPad X1 Nano Gen 2 é inegavelmente mais rápido do que o modelo Gen 1 original, mas vem com o custo de tempos de funcionamento mais curtos e potencial estrangulamento do desempenho.
Apesar da limitada sustentabilidade do Turbo Boost da CPU, o X1 Nano Gen 2 ainda é um sistema muito mais rápido do que o antigo modelo Gen 1 sem a necessidade de alterar nada no chassi, na tela ou no peso. Os usuários que procuram maximizar o desempenho do processador podem querer considerar laptops mais pesados com soluções de resfriamento mais fortes, como o Série ThinkPad T ao invés disso.
Preço e Disponibilidade
O ThinkPad X1 Nano Gen 2 está agora amplamente disponível através de revendedores como Amazon e Newegg por $1700 USD se configurado com o display Core i5 e FHD até $2300 USD se configurado com o display Core i7 e 2K. Alternativas, os usuários podem adquirir diretamente da Lenovo.
Lenovo ThinkPad X1 Nano Gen 2 Core i7-1280P
- 09/04/2022 v7 (old)
Allen Ngo
Price comparison

