2022 HP Envy 16 laptop review: Para multimídia, gamers, criadores e todos os que estão entre
A Envy 16 substitui a do ano passado 15.inveja de 6 polegadas 15 mudando para um novo formato de 16 polegadas ao lado das últimas CPUs Intel do 12º gênero e das opções gráficas discretas Nvidia e Intel. Ao contrário da série mais barata Pavilion, a série Envy é o lar de modelos prosumer mais sofisticados com desempenho geralmente mais alto, menos plásticos e melhor qualidade de construção
Nossa configuração específica é uma SKU high-end com o Core i7-12700H, GeForce RTX 3060, e 2400p OLED touchscreen por aproximadamente $1700 USD. Outras configurações estão disponíveis com o Core i5-12500H mais lento, i9-12900H mais rápido, gráficos Intel Arc A370M, ou tela IPS 1600p variando de $1180 a $2380 USD
As alternativas para o Envy 16 incluem outros laptops profissionais de alta qualidade como o Série Dell XPS 15, MacBook Pro 16,Huawei MateBook 16sou oLG Gram 16.
Mais revisões da HP:
Possíveis concorrentes em comparação
Avaliação | Data | Modelo | Peso | Altura | Size | Resolução | Preço |
|---|---|---|---|---|---|---|---|
| 86.9 % v7 (old) | 09/2022 | HP Envy 16 h0112nr i7-12700H, GeForce RTX 3060 Laptop GPU | 2.3 kg | 19.8 mm | 16.00" | 3840x2400 | |
| 88.4 % v7 (old) | 09/2022 | Lenovo ThinkBook 16 G4+ IAP i7-12700H, GeForce RTX 2050 Mobile | 1.8 kg | 16.5 mm | 16.00" | 2560x1600 | |
| 83.7 % v7 (old) | 06/2022 | MSI Creator Z16P B12UHST i9-12900H, GeForce RTX 3080 Ti Laptop GPU | 2.4 kg | 20.4 mm | 16.00" | 2560x1600 | |
| 82.6 % v7 (old) | 11/2021 | Dell Inspiron 16 Plus 7610-MHJ8F i7-11800H, UHD Graphics Xe 32EUs (Tiger Lake-H) | 2 kg | 19 mm | 16.00" | 3072x1920 | |
| 93.2 % v7 (old) | 11/2021 | Apple MacBook Pro 16 2021 M1 Pro M1 Pro, M1 Pro 16-Core GPU | 2.2 kg | 16.8 mm | 16.20" | 3456x2234 | |
| 86.4 % v7 (old) | 07/2022 | Huawei MateBook 16s i7 i7-12700H, Iris Xe G7 96EUs | 2 kg | 17.8 mm | 16.00" | 2520x1680 |
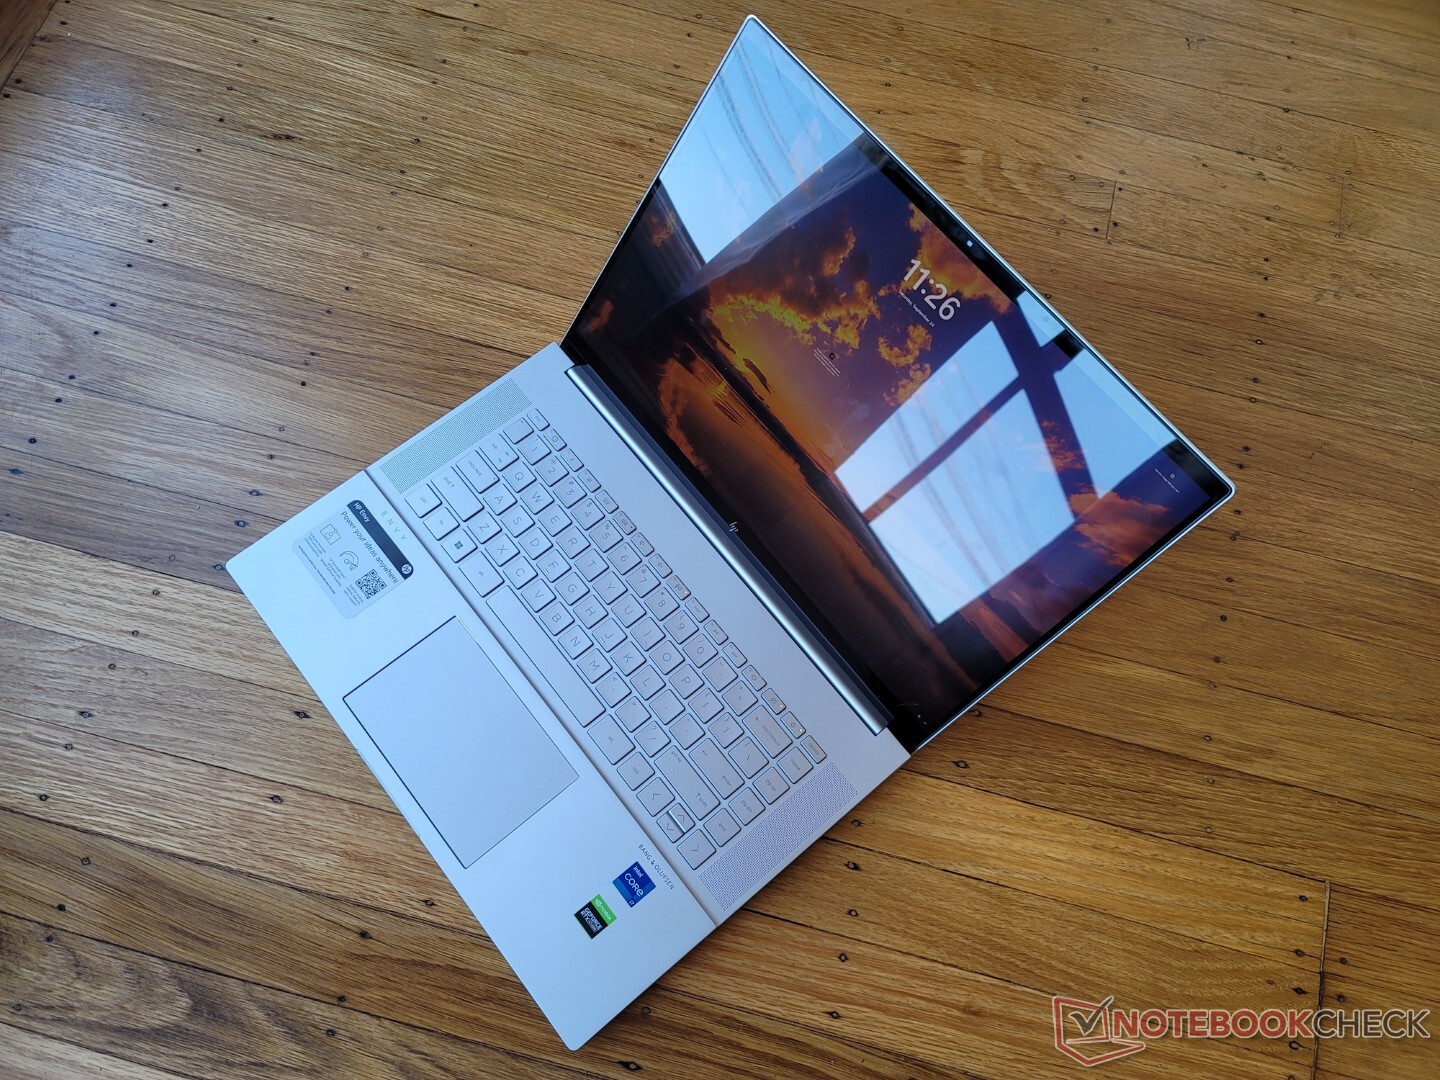
Estojo - Mesmas Cores com Muitos Ajustes
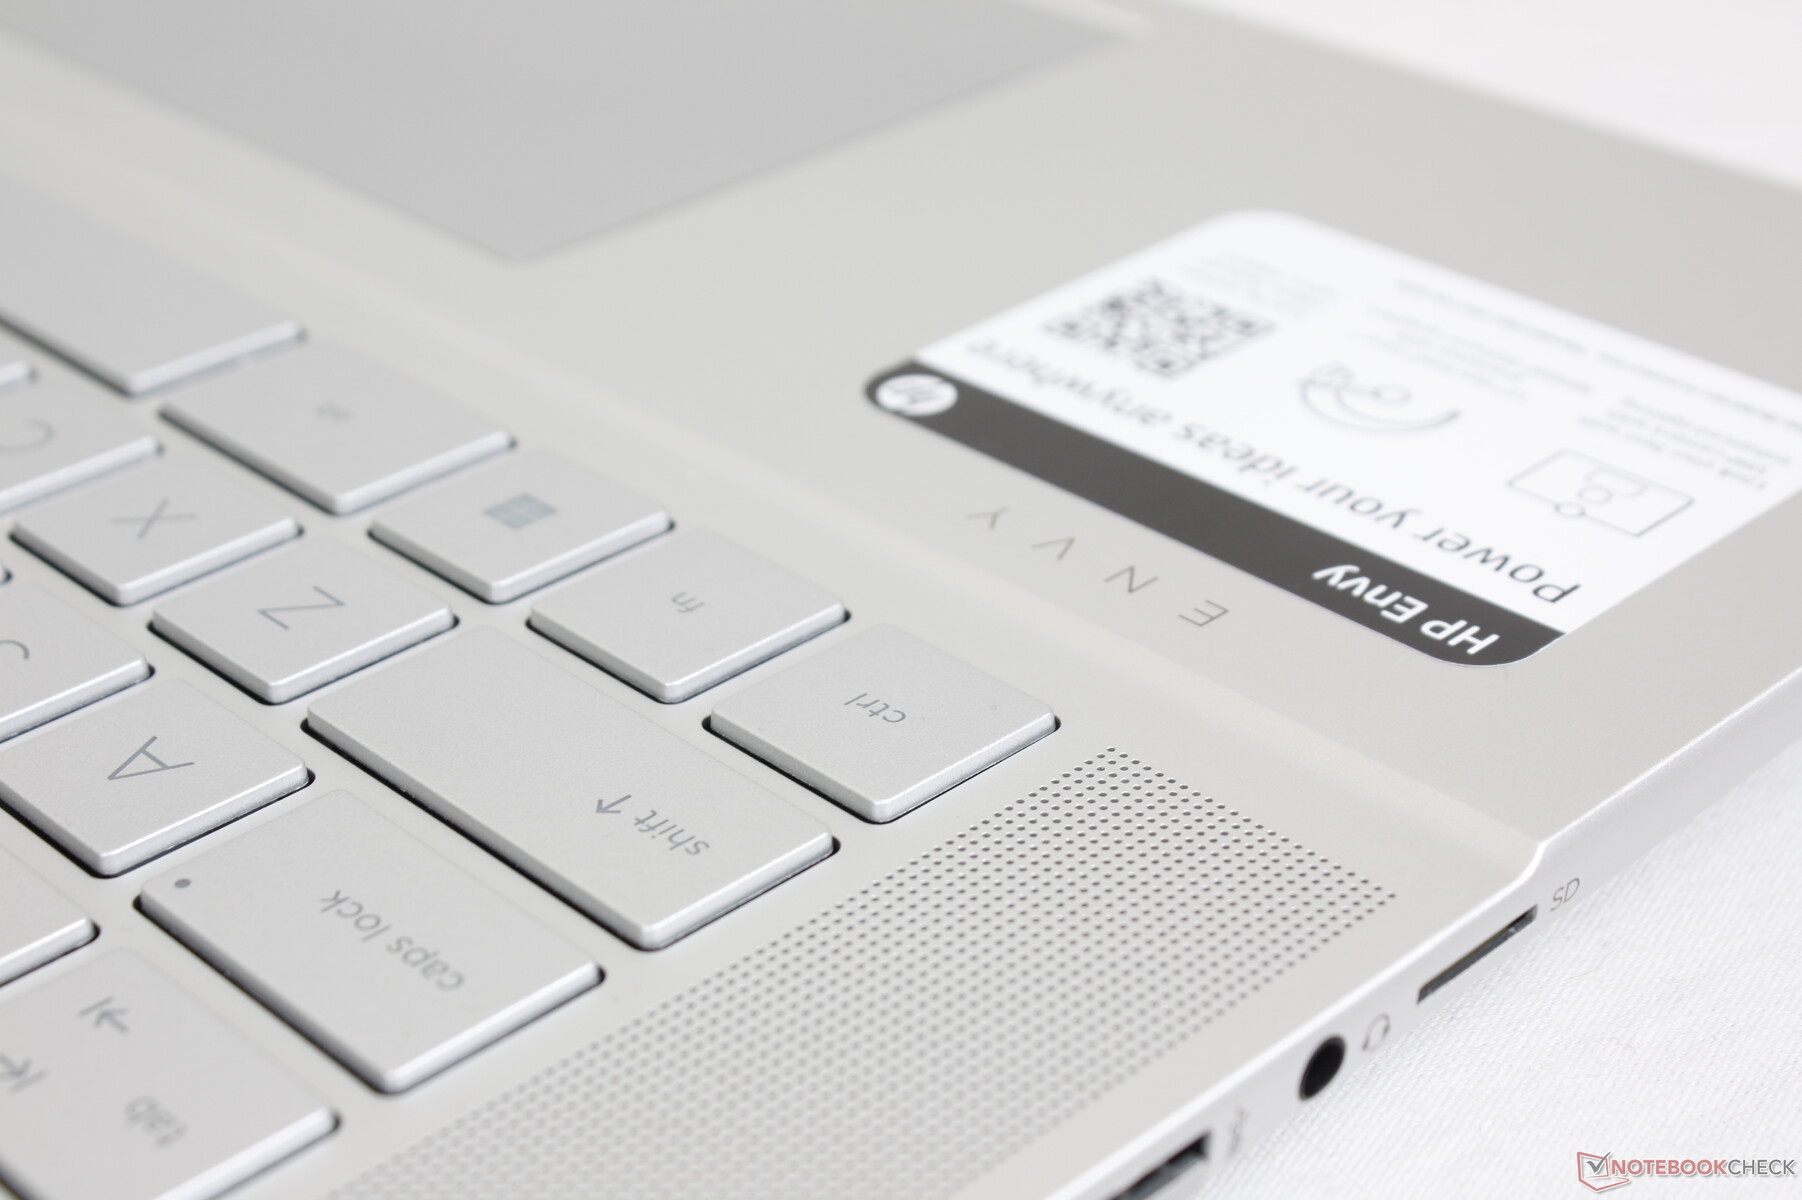
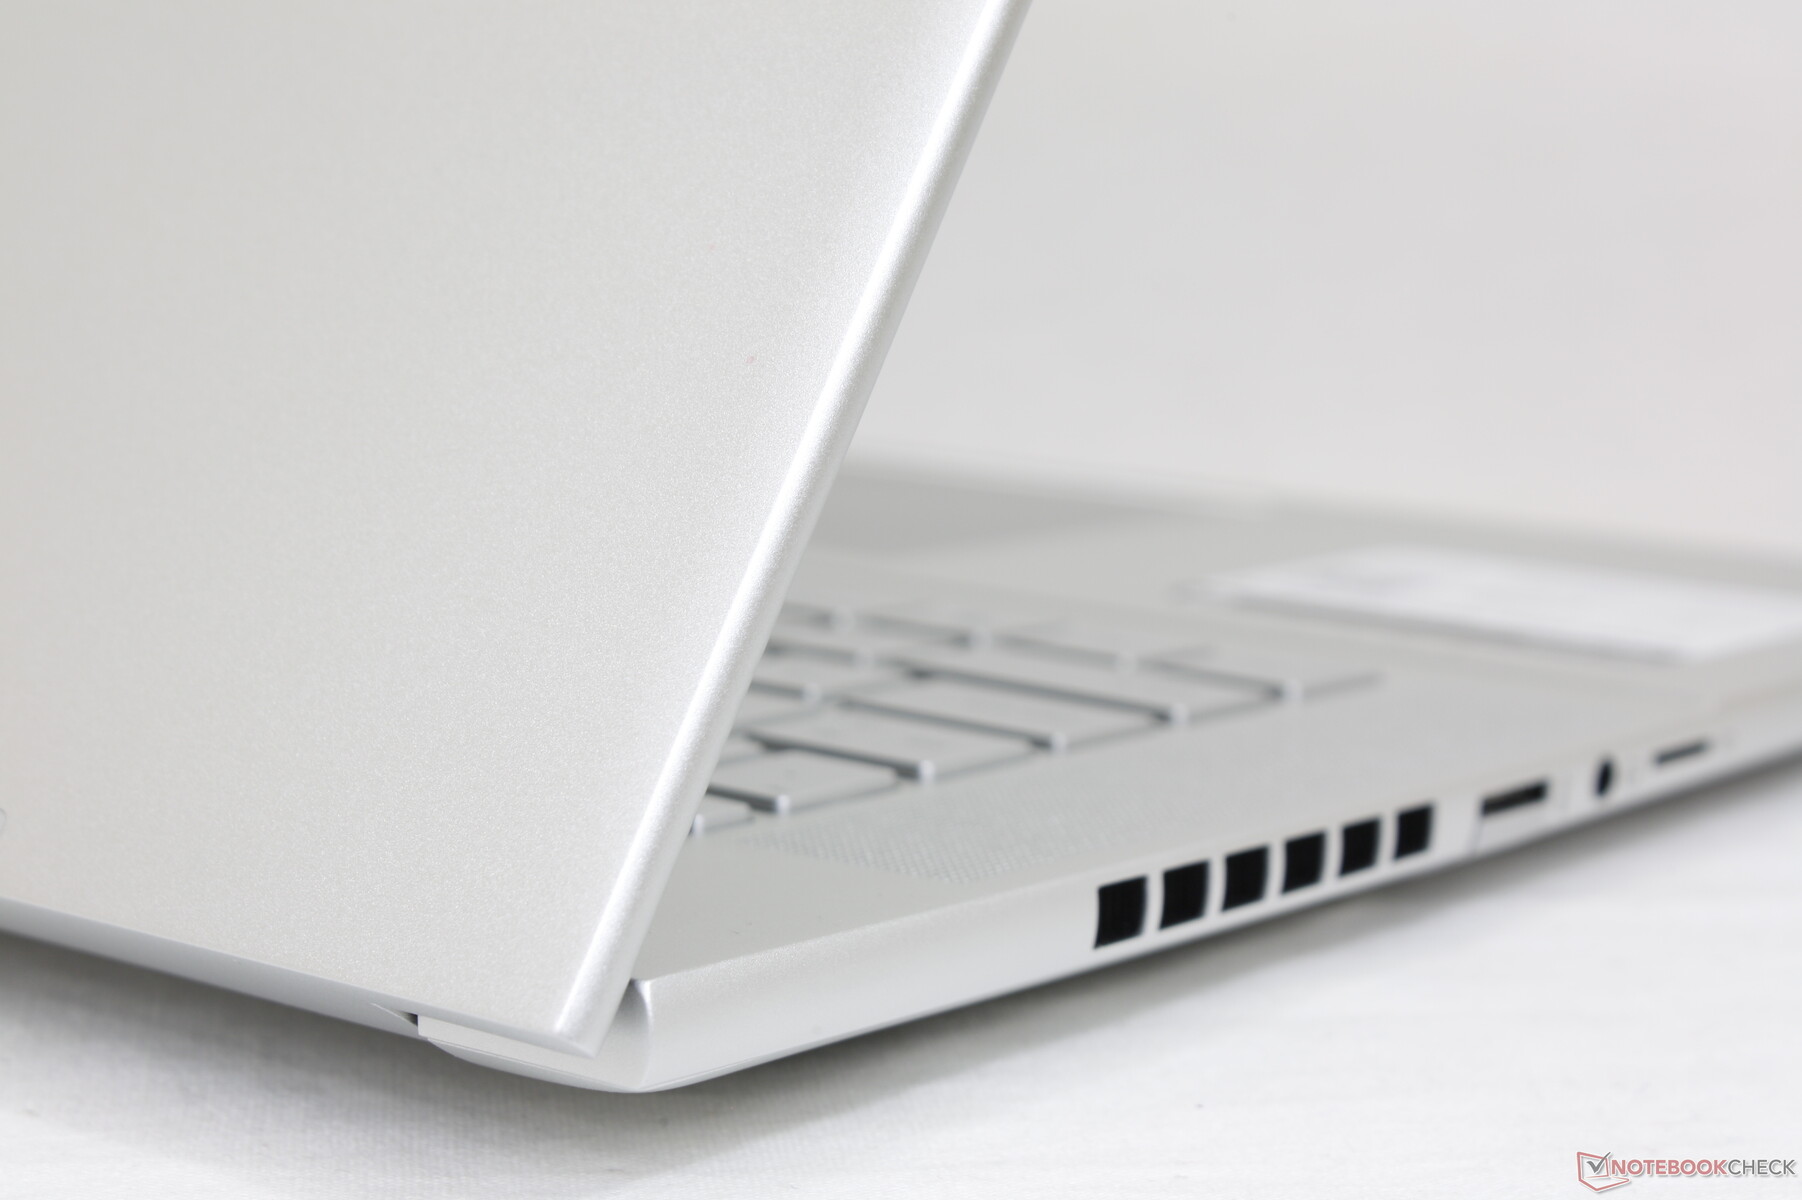
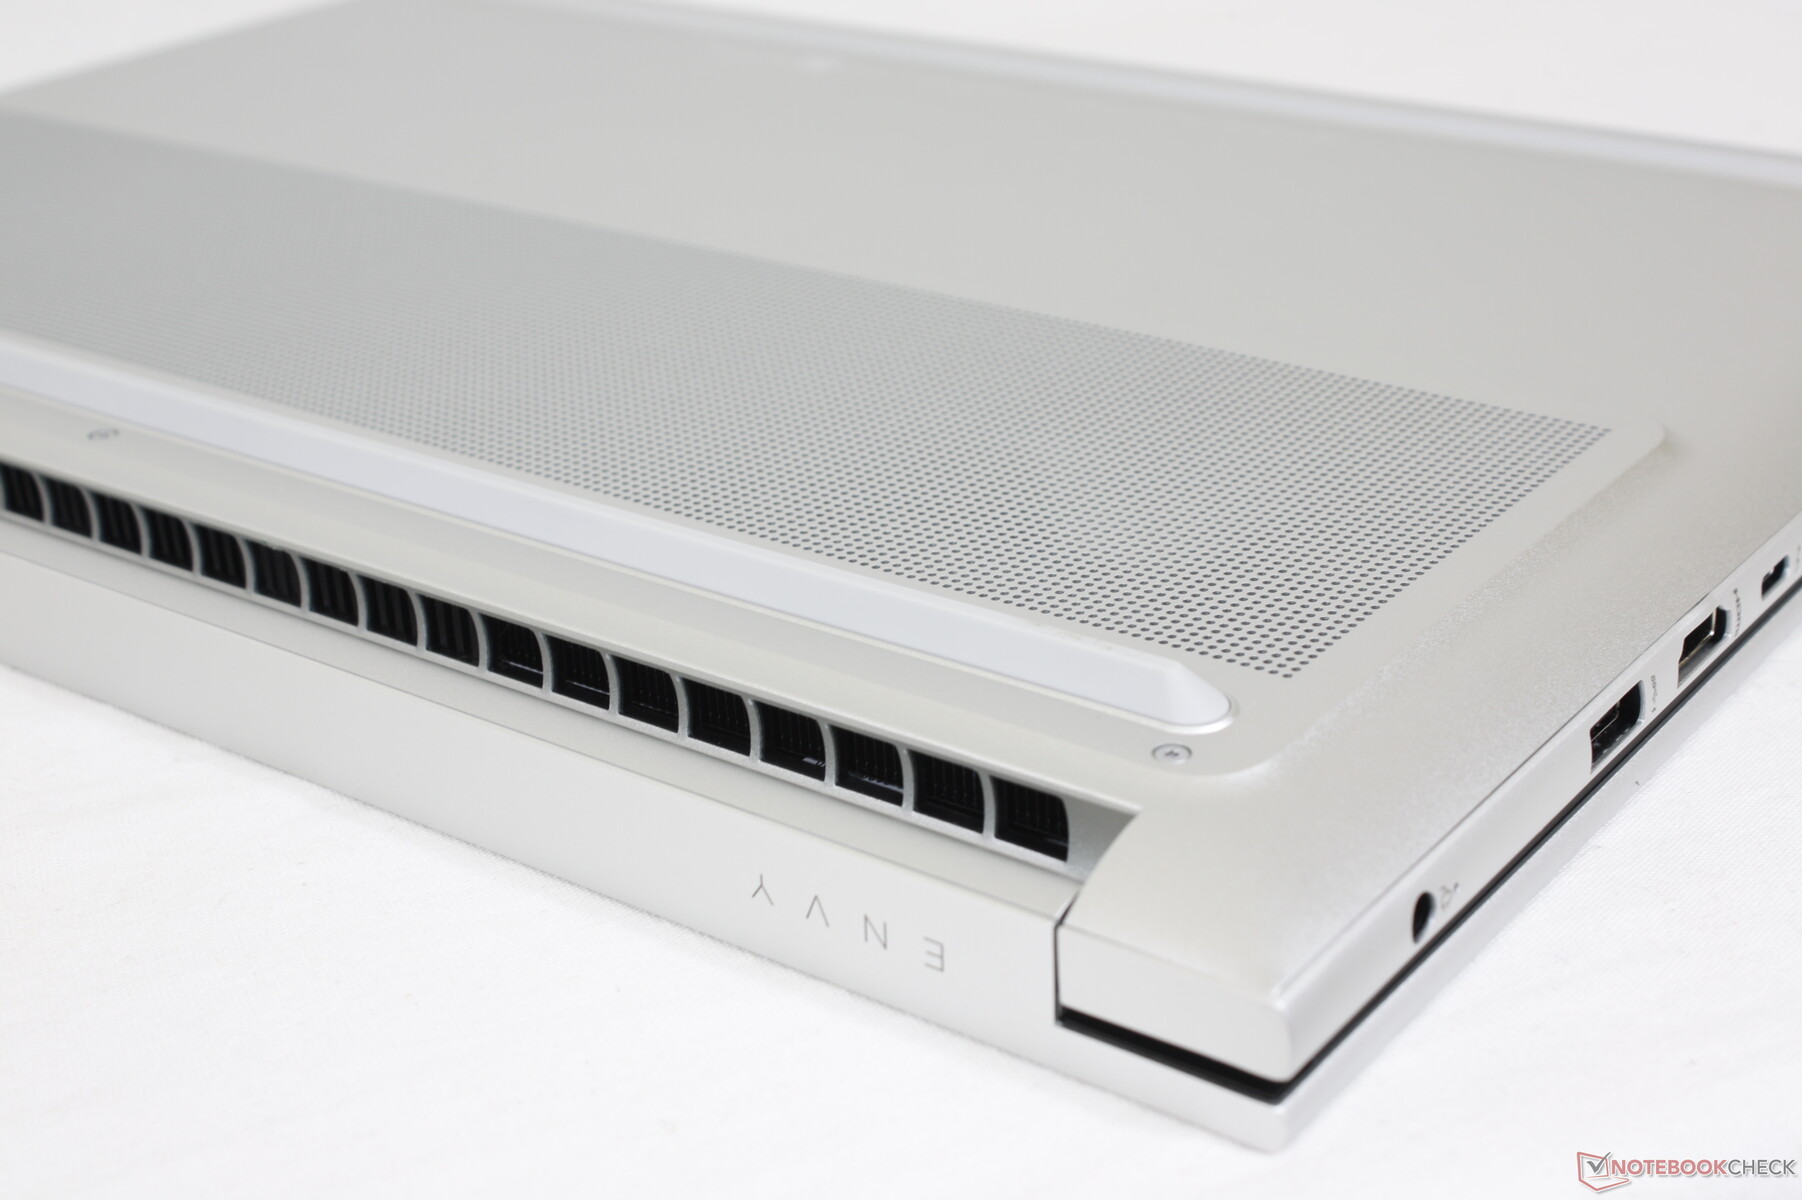
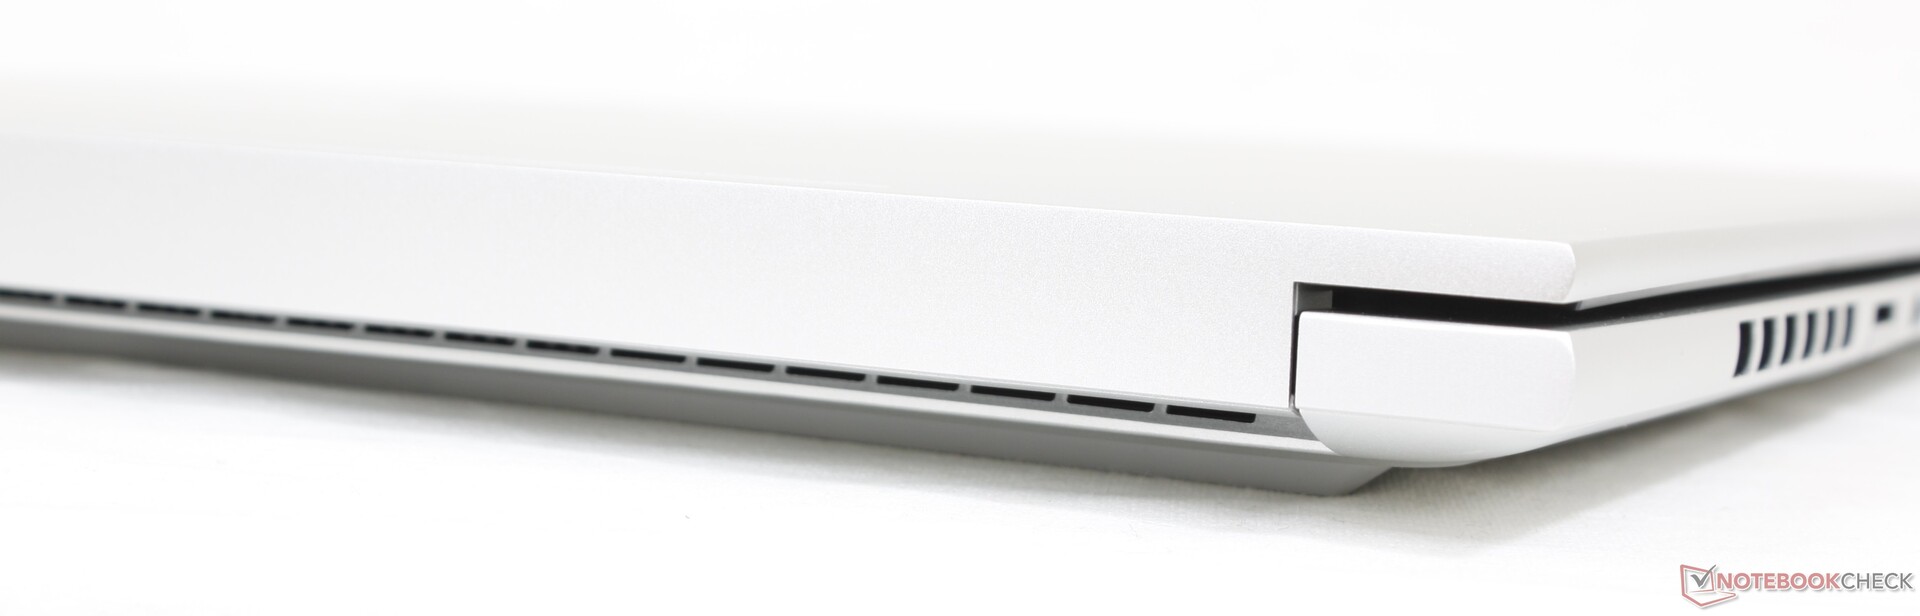
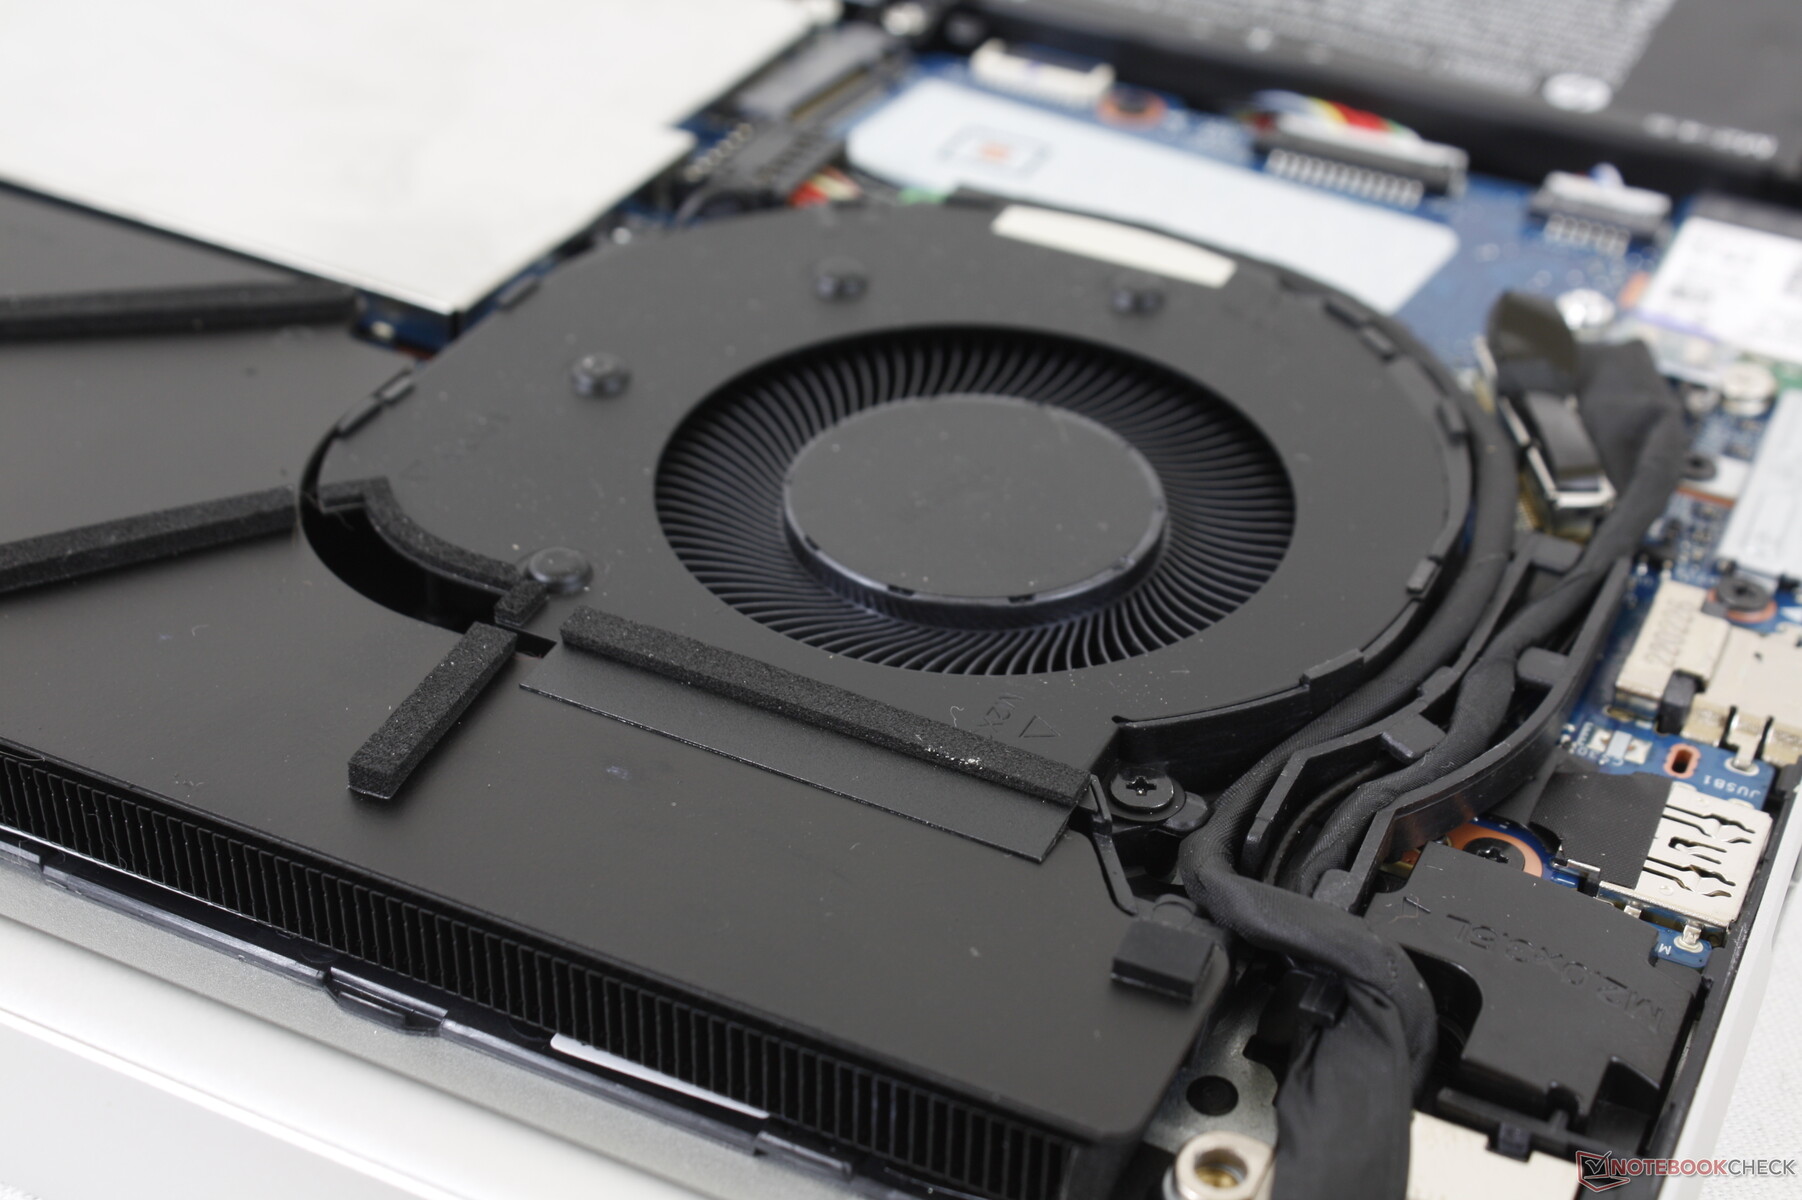
O Envy 16 pode parecer-se com o Envy 15 à primeira vista por causa de seus esquemas de cores semelhantes, mas na verdade há numerosas mudanças tanto por dentro como por fora. Mais notavelmente, o Envy 16 é mais arredondado ao longo de suas bordas e cantos, ao contrário do desenho mais nítido e liso do Envy 15. Enquanto isso, a parte de ventilação do painel inferior é levantada em vez de plana, como mostram as imagens abaixo. O deck de apoio de palma e as grelhas dos alto-falantes também foram redesenhados. Algumas destas mudanças parecem ser superficiais, enquanto outras devem melhorar a capacidade de resfriamento do modelo.
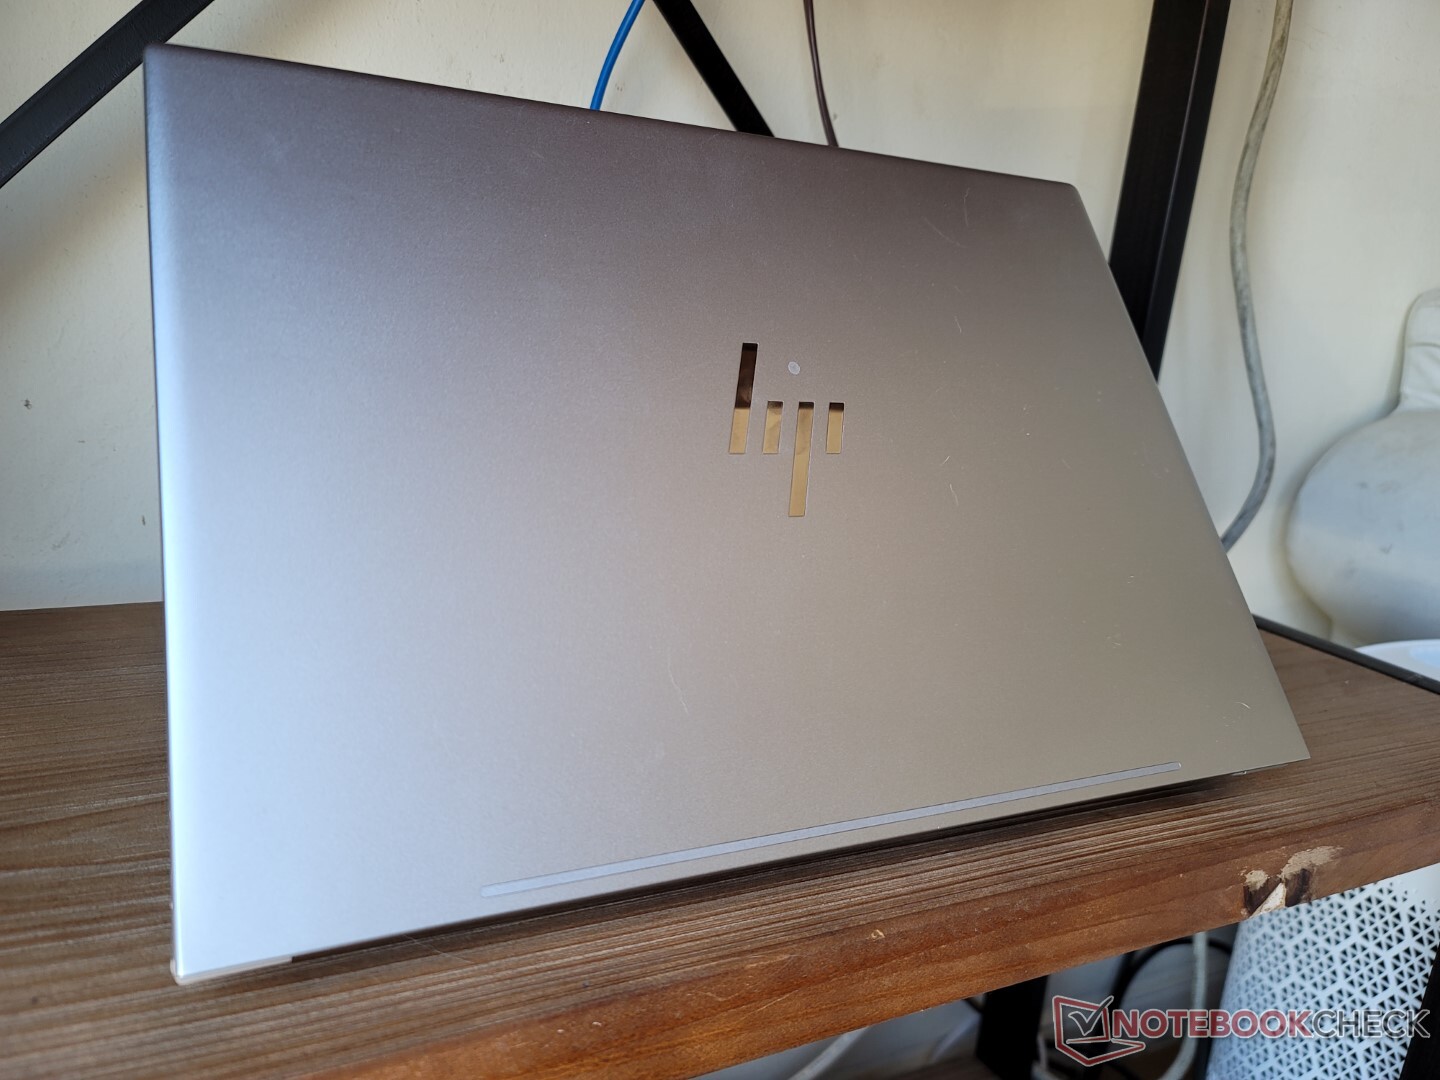
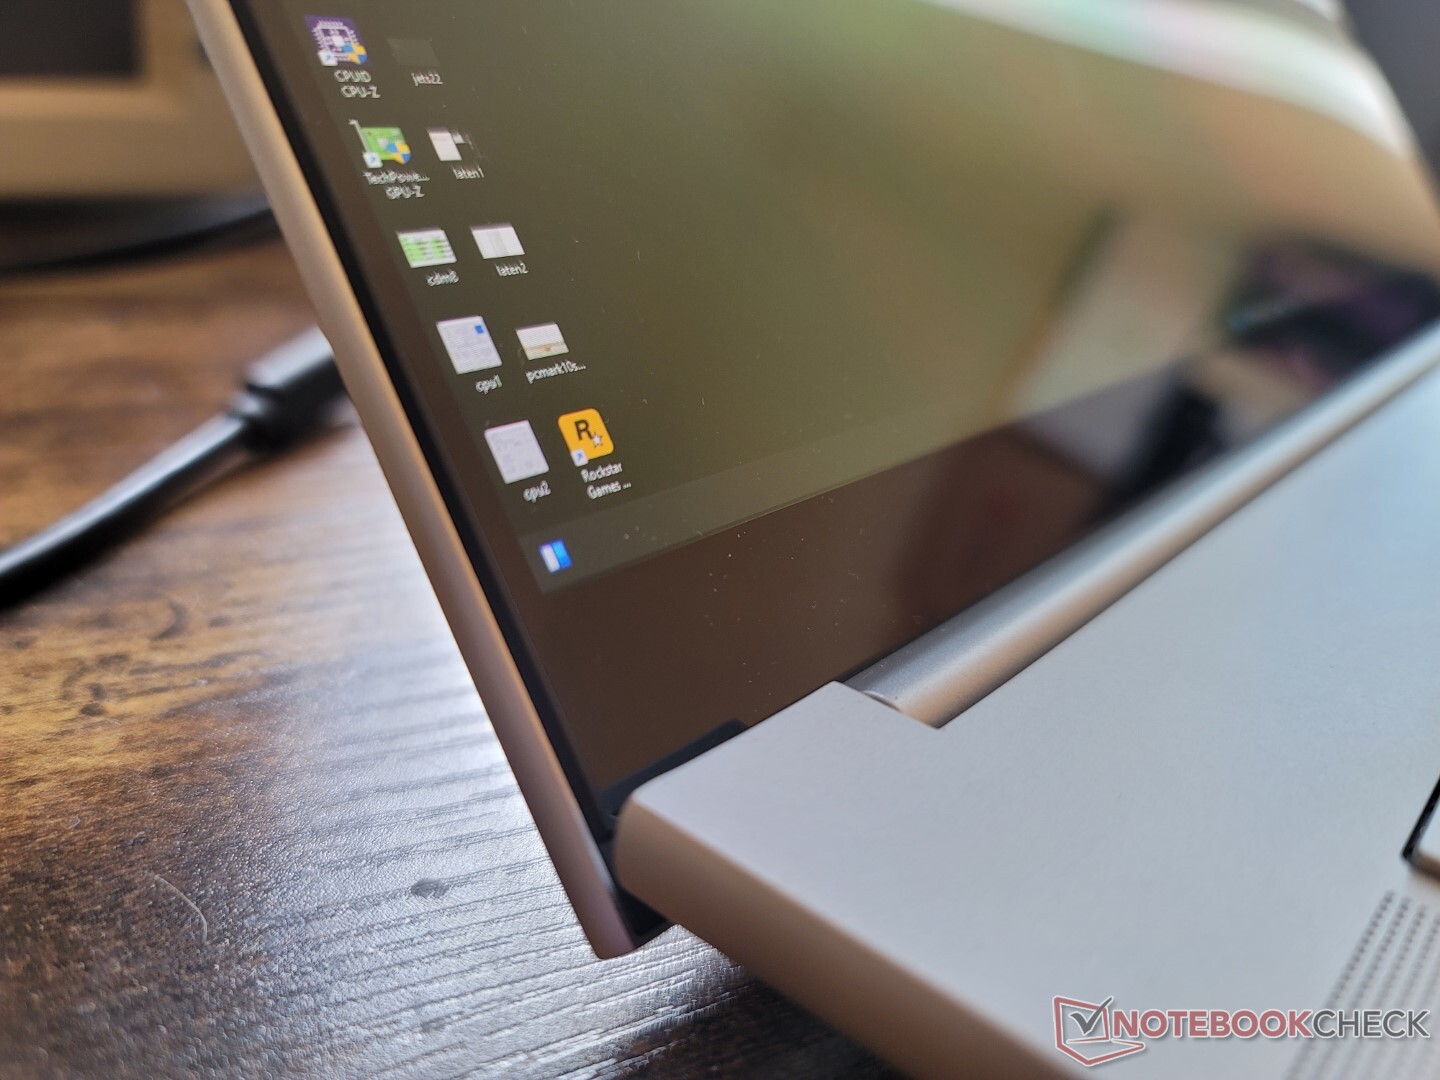
A qualidade do chassi permanece tão forte quanto o 2020 Envy 15 apesar do aumento do tamanho. A base exibe apenas pequenas torções e deformações e a tampa é bastante rígida por causa do vidro borda a borda e do suporte de alumínio. As dobradiças poderiam ter sido mais rígidas, no entanto, pois os teeters da tampa ao ajustar os ângulos são mais rígidos do que na ZenBook Pro série ou Lâmina Razer 15.
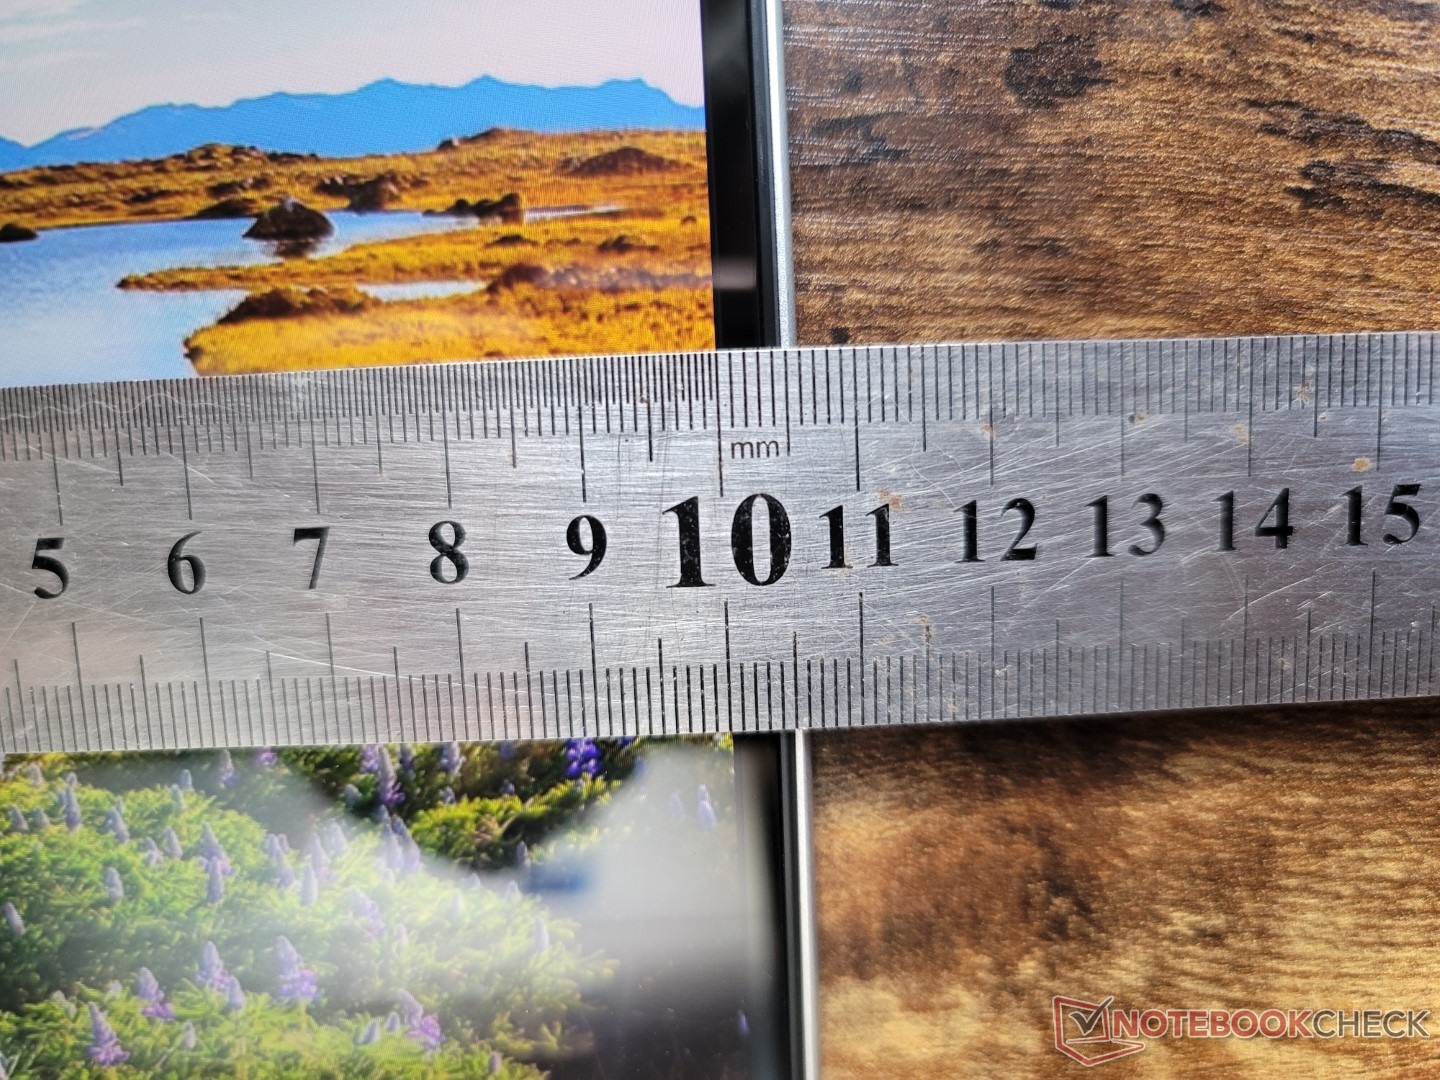
O modelo 2022 é mais grosso, mais pesado e maior do que o modelo 2020, como mostra o gráfico de comparação abaixo. O tamanho maior talvez não seja inesperado dado o salto de um fator de forma de 15,6 polegadas para um fator de forma de 16 polegadas. Mesmo assim, o HP ainda é ligeiramente maior e mais pesado que muitos laptops multimídia concorrentes de 16 polegadas, incluindo o MacBook Pro 16, Huawei MateBook 16s, ouDell Inspiron 16 Plus 7610.
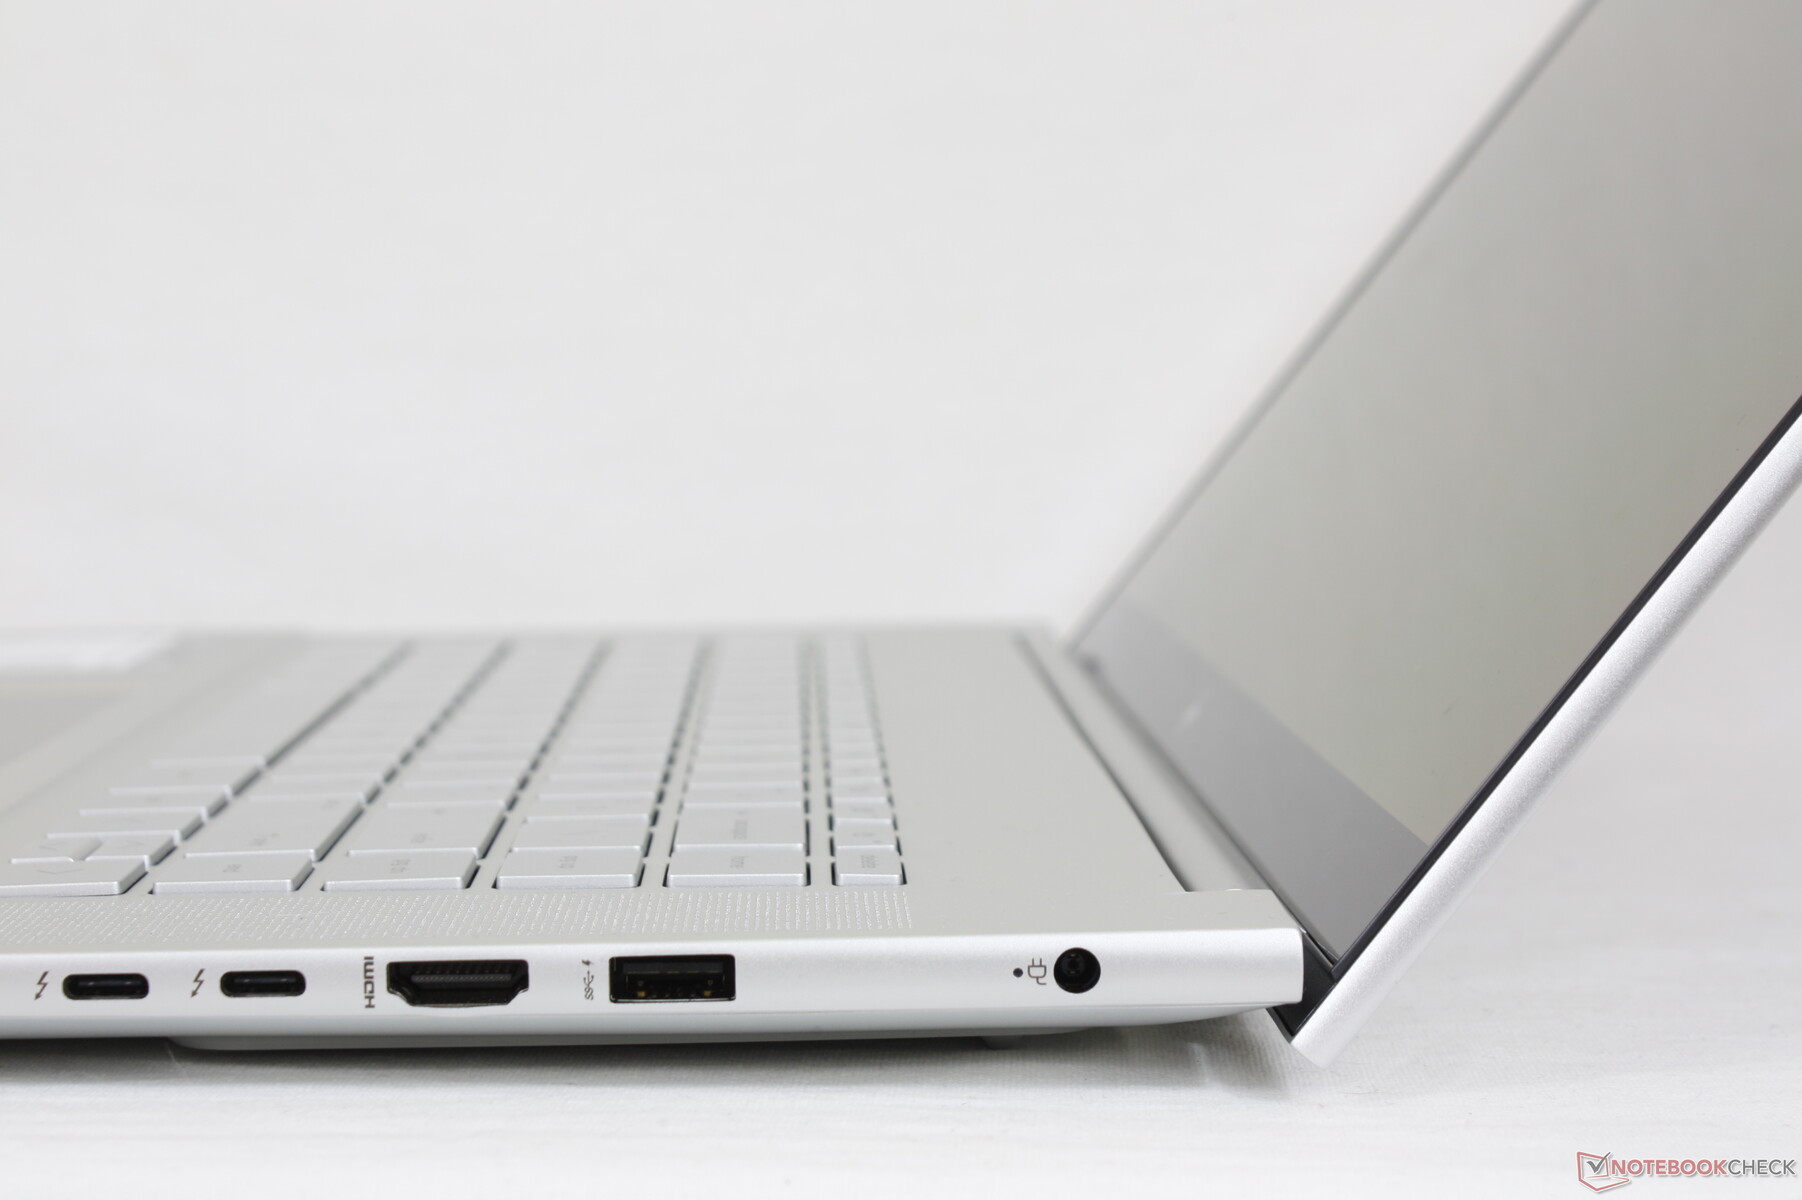
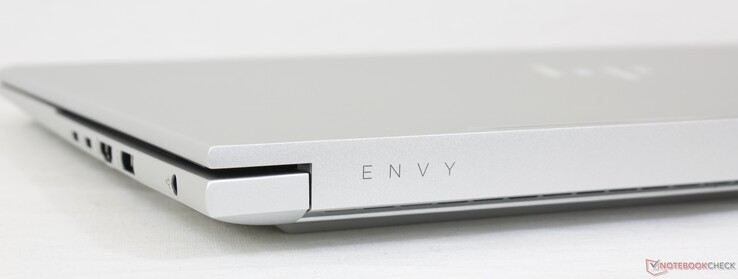
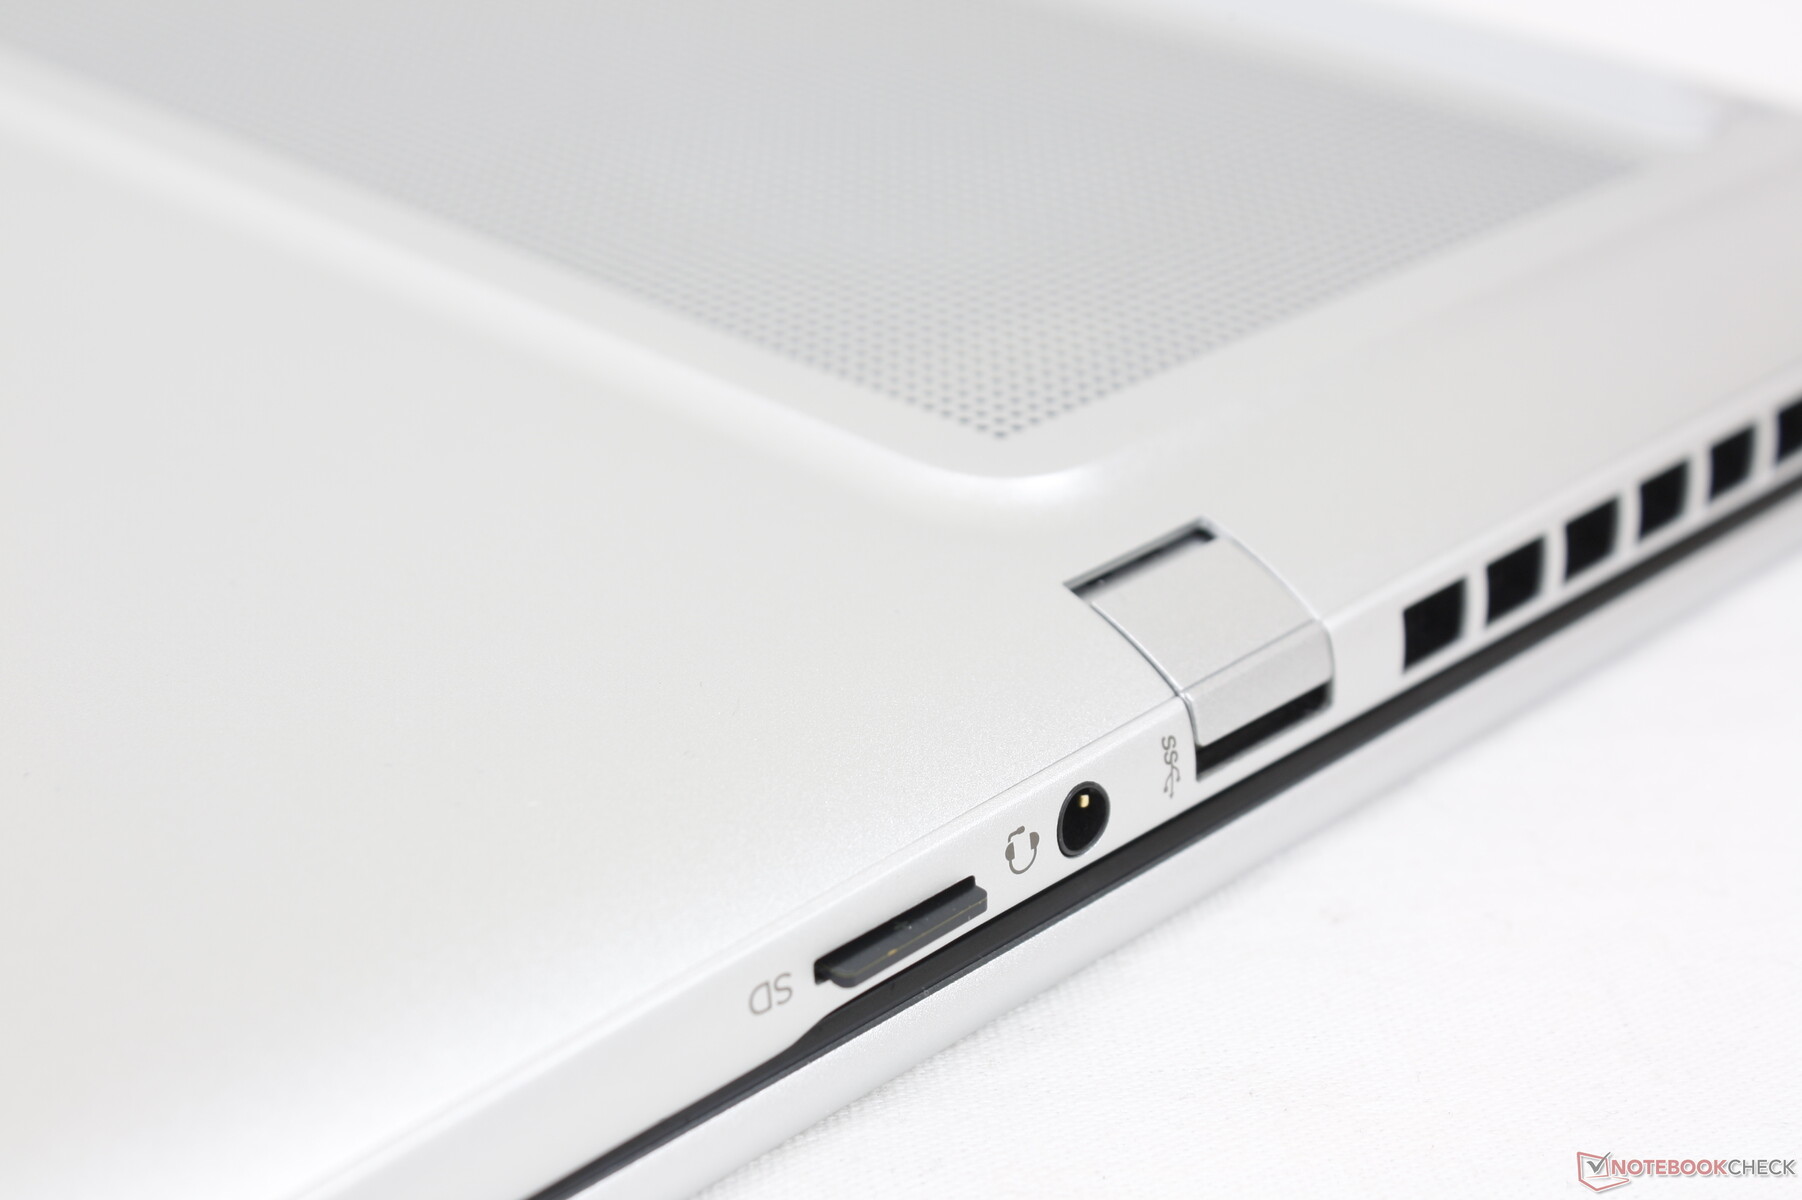
Conectividade - Thunderbolt 4 Support Standard
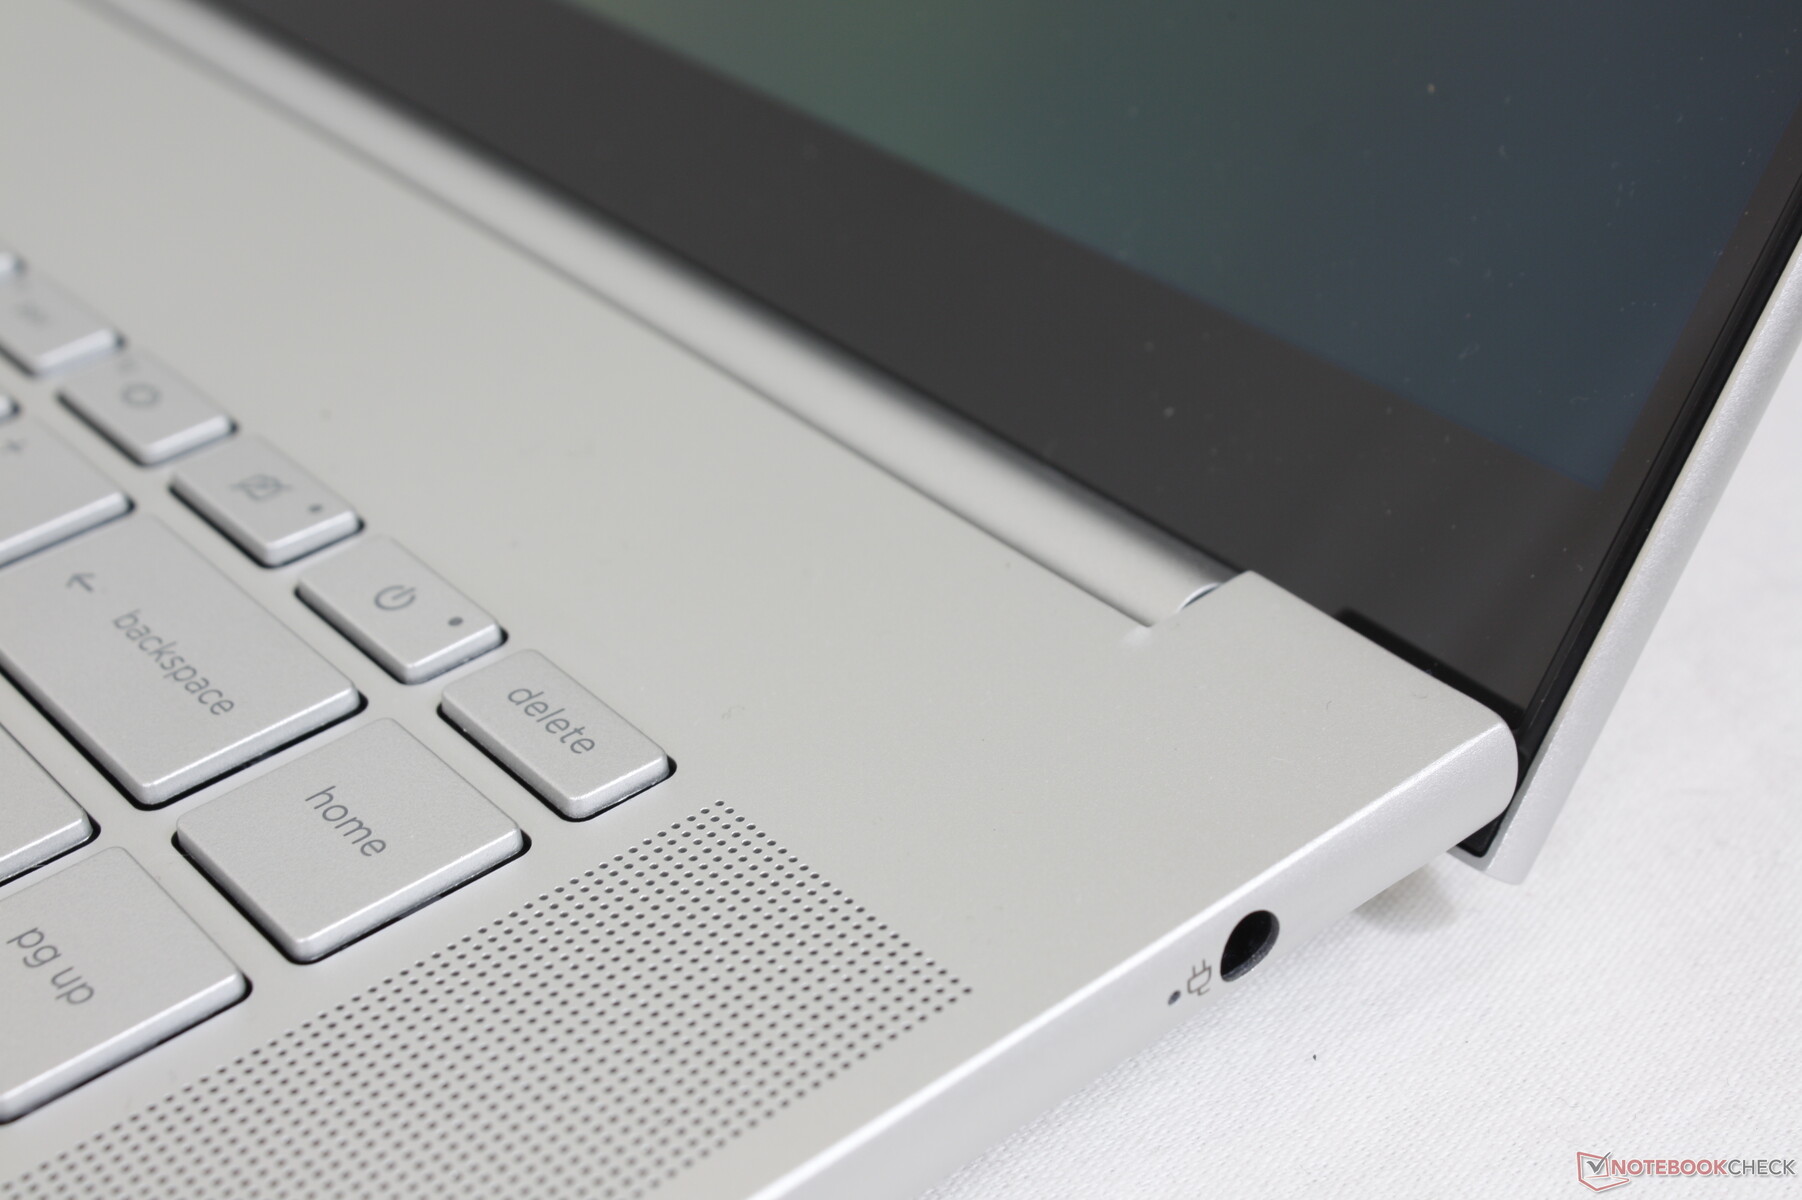
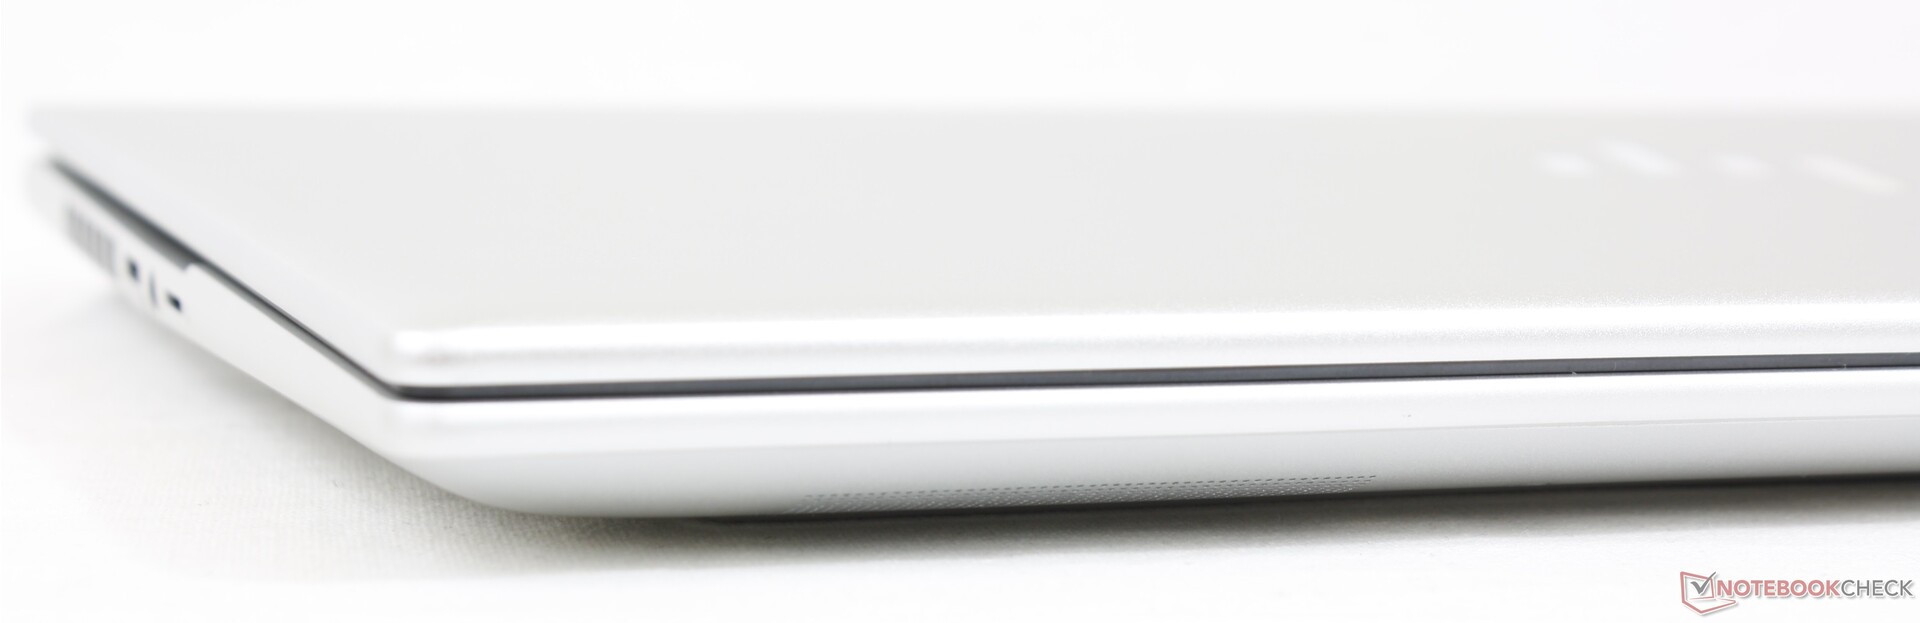
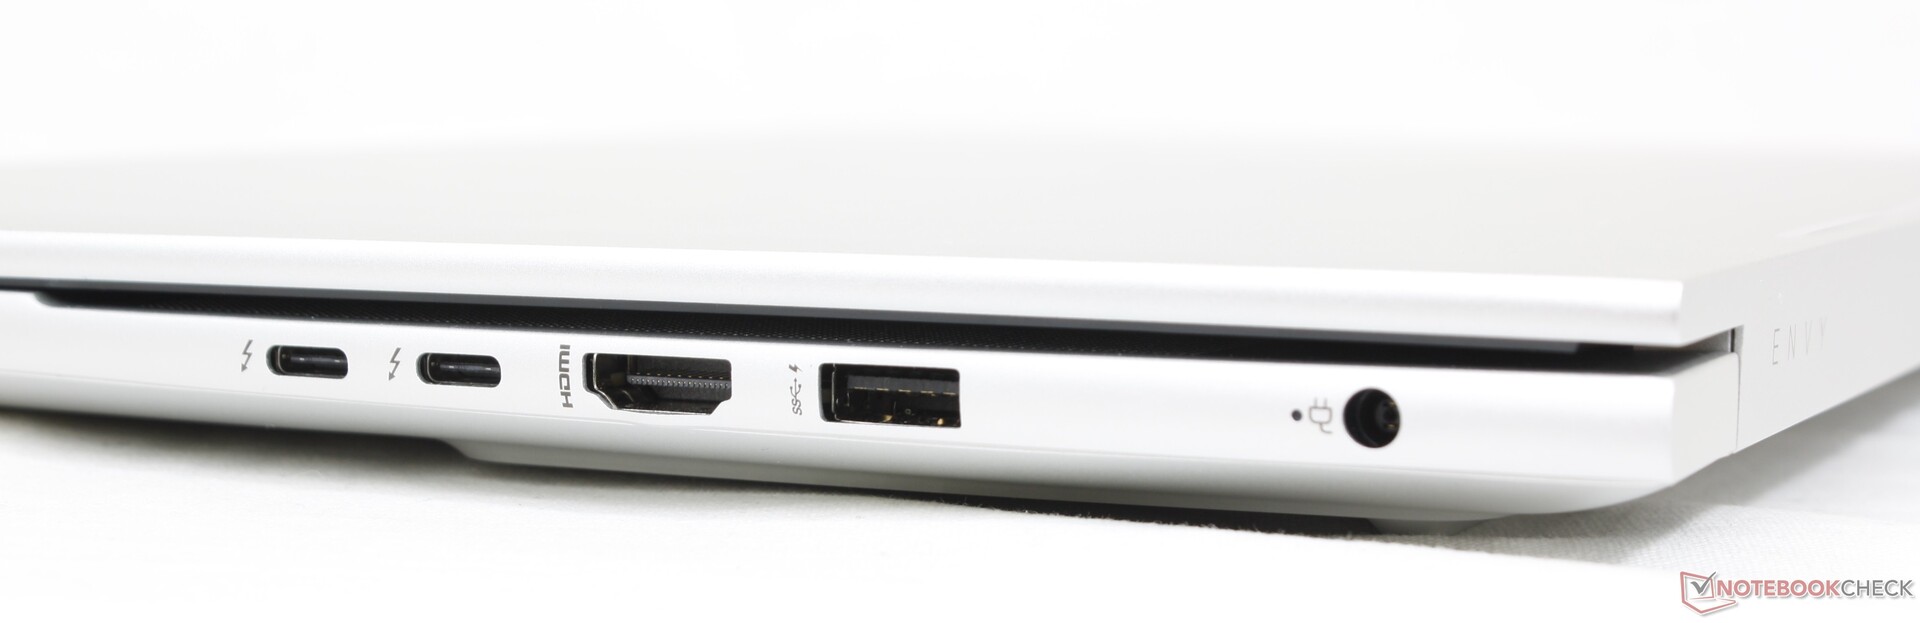
Todos os portos da Inveja 2020 15 retornaram nesta revisão de 2022, embora reordenados. A maioria dos portos estão agora ao longo da borda direita do chassi, em vez da esquerda para melhor ou pior. Ainda não há, irritantemente, nenhum slot de fechadura Kensington.
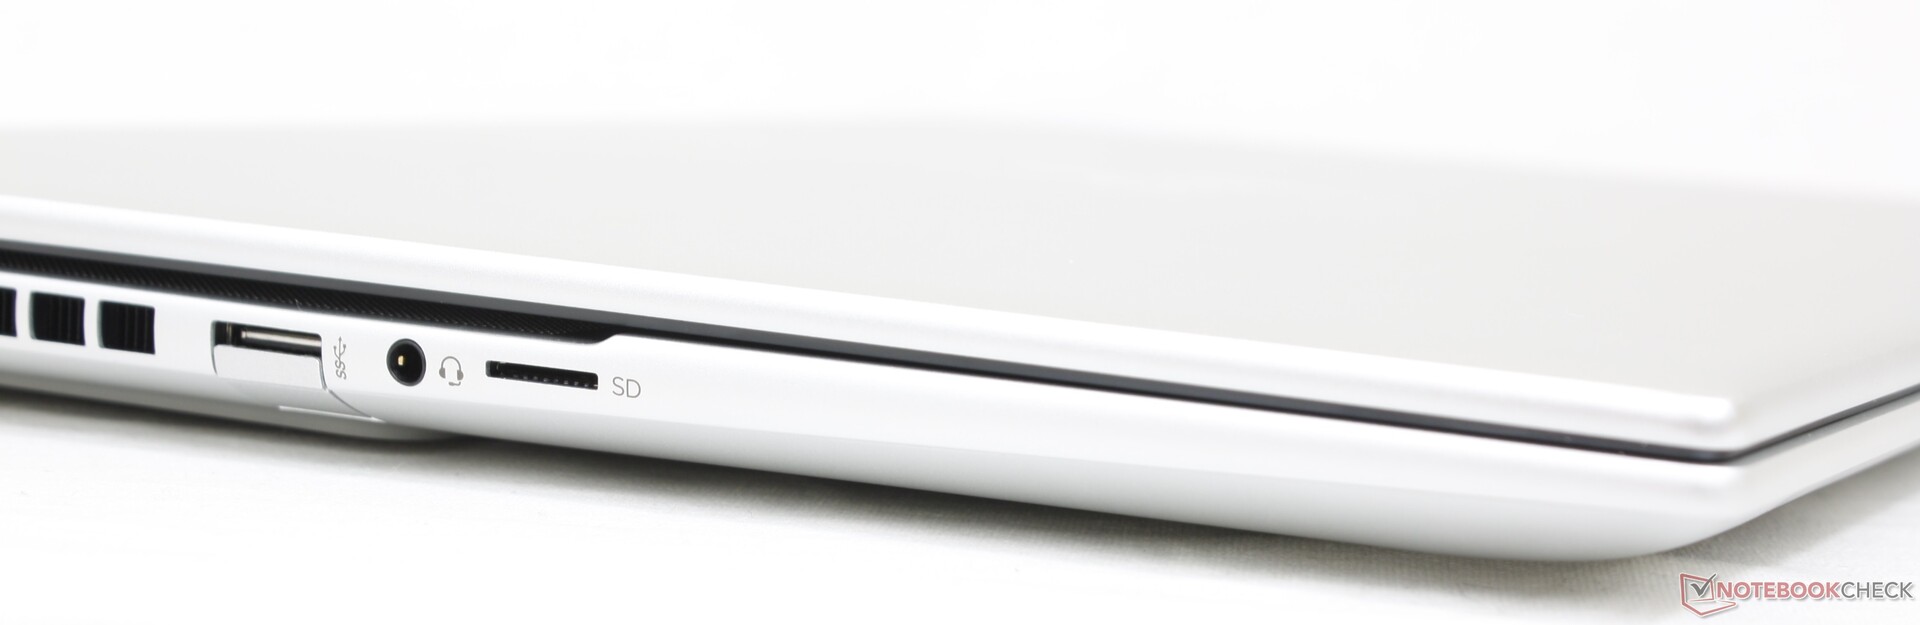
Leitor de cartões SD
As taxas de transferência do leitor integrado MicroSD são médias. A transferência de 1 GB de fotos de nossa placa de teste UHS-II para a área de trabalho leva cerca de 17 segundos.
| SD Card Reader | |
| average JPG Copy Test (av. of 3 runs) | |
| Apple MacBook Pro 16 2021 M1 Pro (Angelbird AV Pro V60) | |
| Lenovo ThinkBook 16 G4+ IAP (Angelbird AV Pro V60) | |
| MSI Creator Z16P B12UHST (AV PRO microSD 128 GB V60) | |
| HP Envy 16 h0112nr (AV Pro SD microSD 128 GB V60) | |
| Dell Inspiron 16 Plus 7610-MHJ8F (AV Pro SD microSD 128 GB V60) | |
| maximum AS SSD Seq Read Test (1GB) | |
| Lenovo ThinkBook 16 G4+ IAP (Angelbird AV Pro V60) | |
| HP Envy 16 h0112nr (AV Pro SD microSD 128 GB V60) | |
| Dell Inspiron 16 Plus 7610-MHJ8F (AV Pro SD microSD 128 GB V60) | |
Comunicação
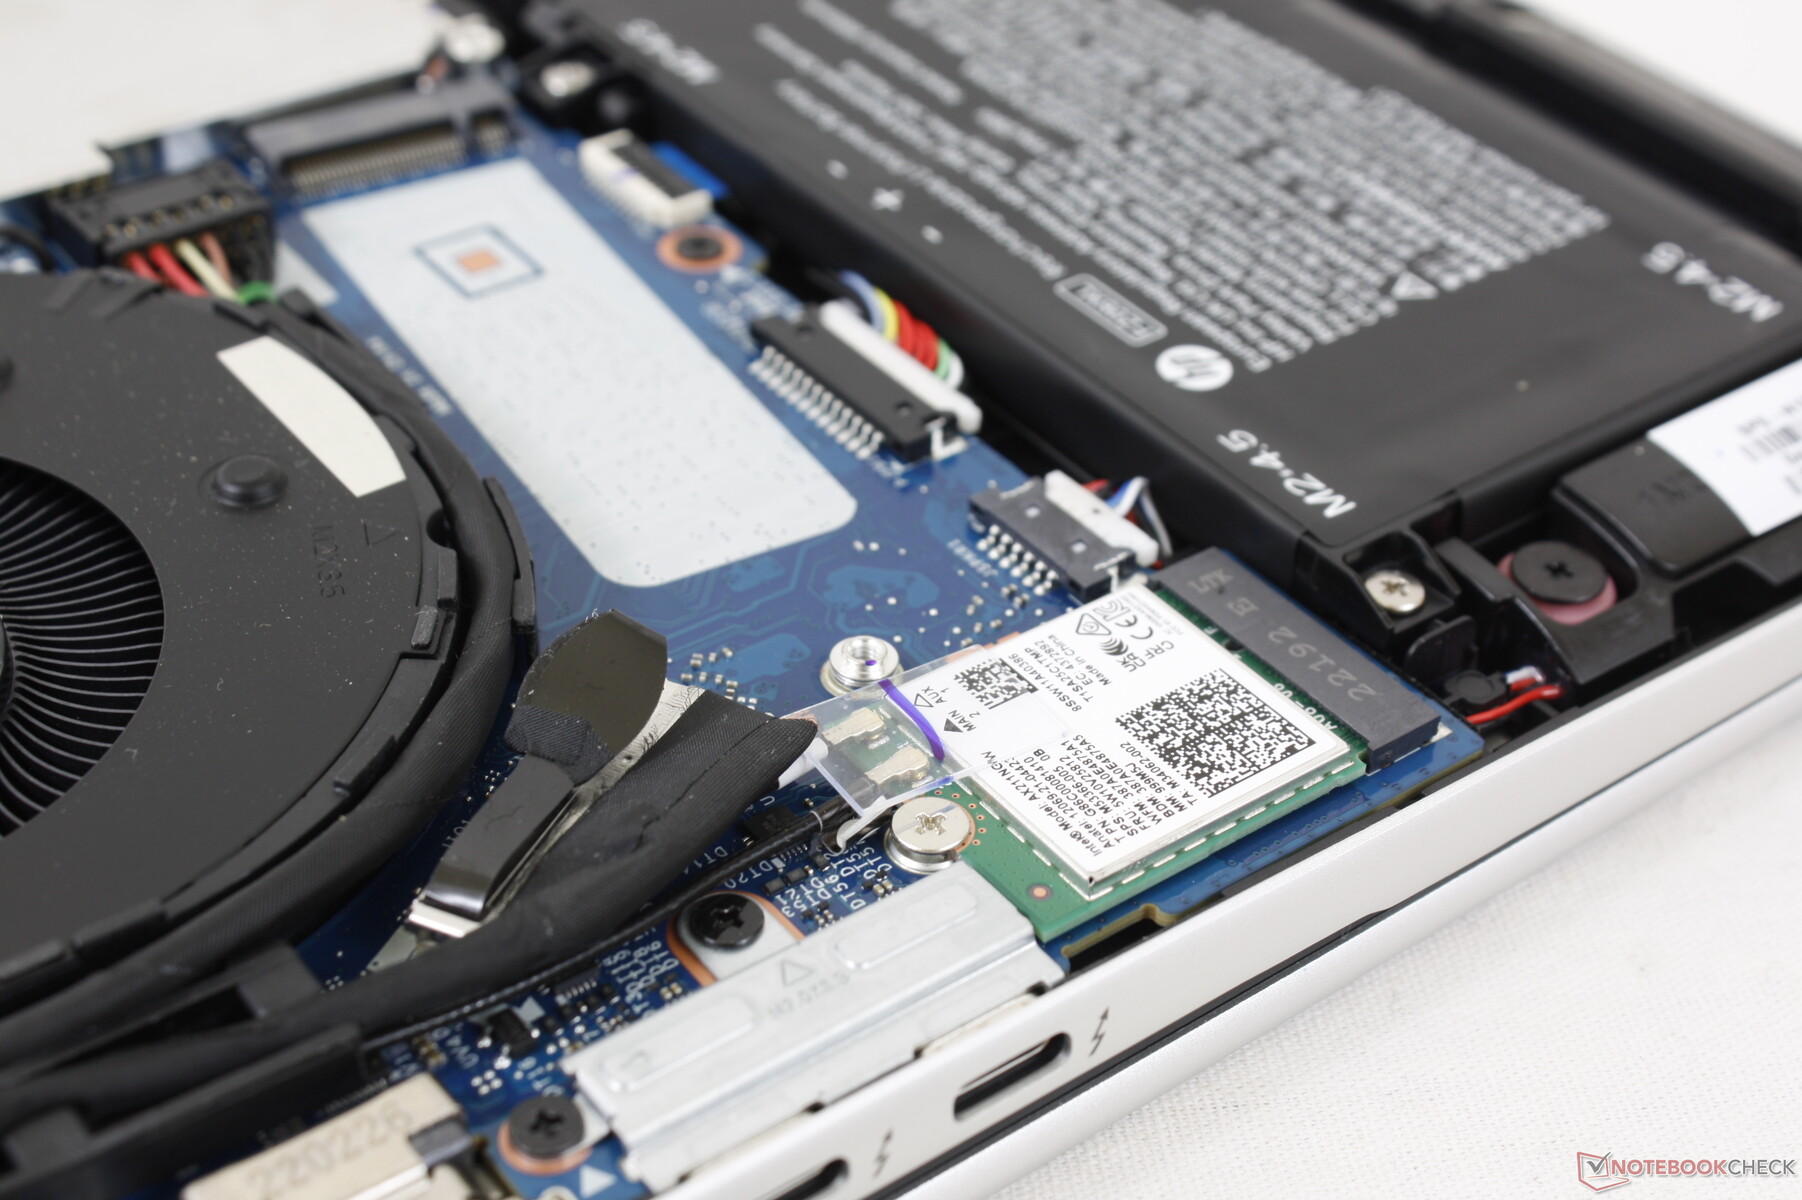
Um Intel AX211 vem como padrão para conectividade Wi-Fi 6E e Bluetooth 5.2. Não tivemos problemas de confiabilidade quando emparelhados com nossa rede de 6 GHz.
| Networking | |
| iperf3 transmit AX12 | |
| Dell Inspiron 16 Plus 7610-MHJ8F | |
| Apple MacBook Pro 16 2021 M1 Pro | |
| iperf3 receive AX12 | |
| Dell Inspiron 16 Plus 7610-MHJ8F | |
| Apple MacBook Pro 16 2021 M1 Pro | |
| iperf3 receive AXE11000 6GHz | |
| Huawei MateBook 16s i7 | |
| HP Envy 16 h0112nr | |
| iperf3 receive AXE11000 | |
| MSI Creator Z16P B12UHST | |
| Lenovo ThinkBook 16 G4+ IAP | |
| Apple MacBook Pro 16 2021 M1 Pro | |
| iperf3 transmit AXE11000 6GHz | |
| Huawei MateBook 16s i7 | |
| HP Envy 16 h0112nr | |
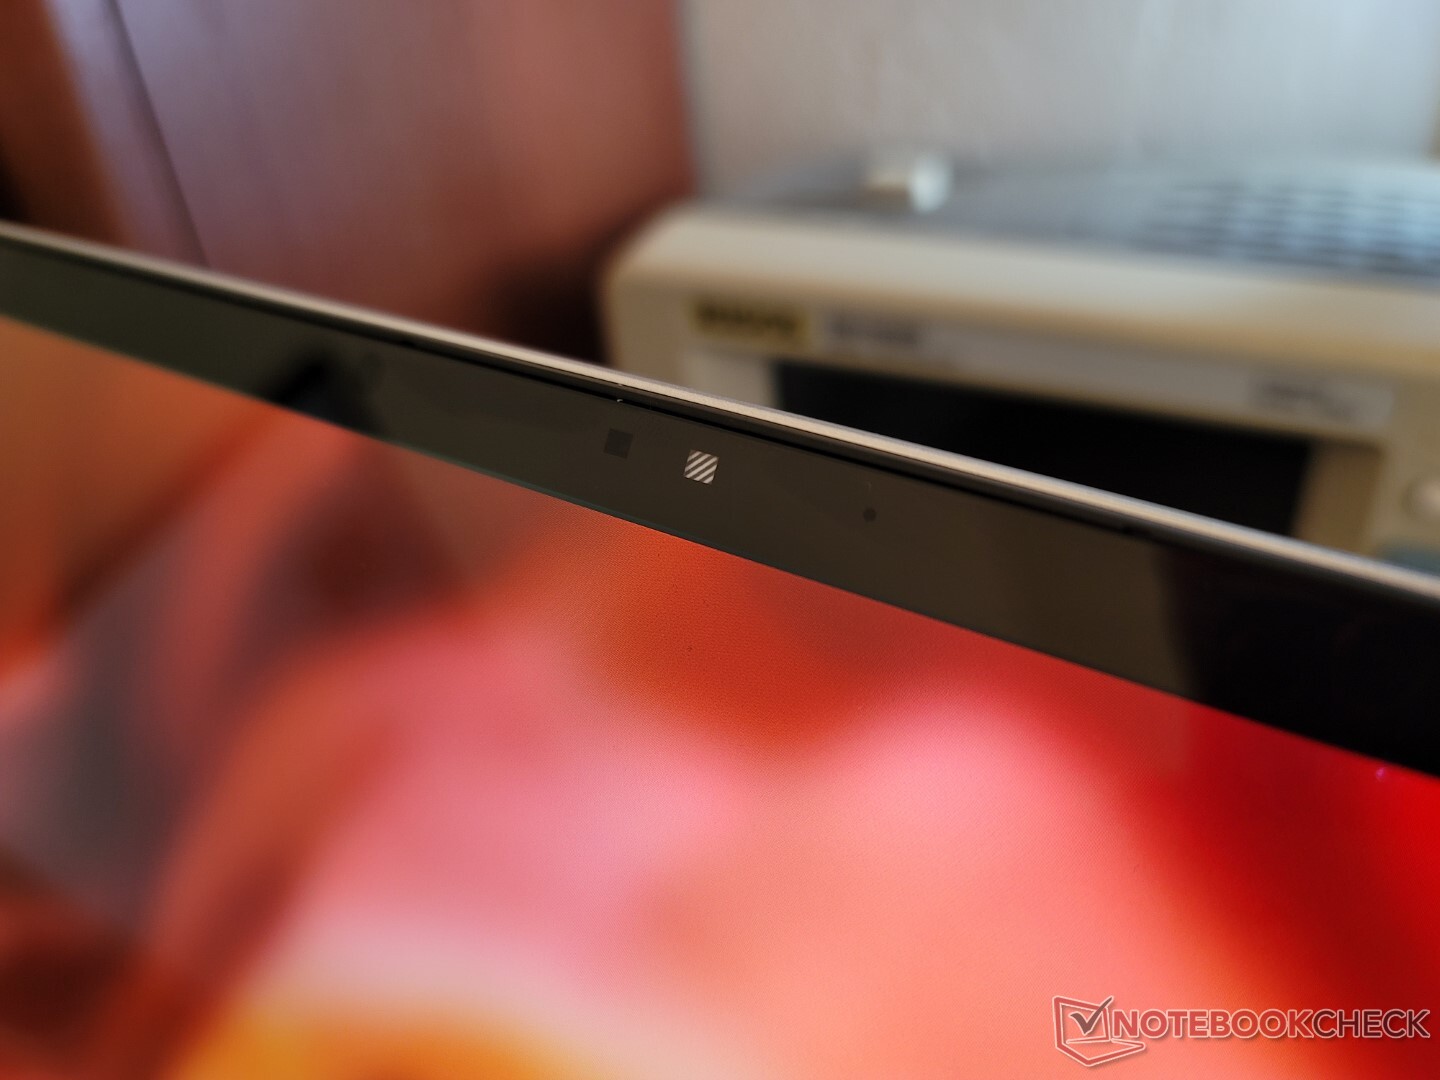
Webcam - 5 MP!
O sistema integra uma câmera de 5 MP semelhante à mais recente Spectre e modelos EliteBook. A qualidade da imagem é visivelmente mais nítida do que na maioria dos outros laptops onde webcams de 1 MP e 2 MP ainda são a norma.
Um obturador de webcam vem como padrão, assim como o suporte de RI para o Hello.


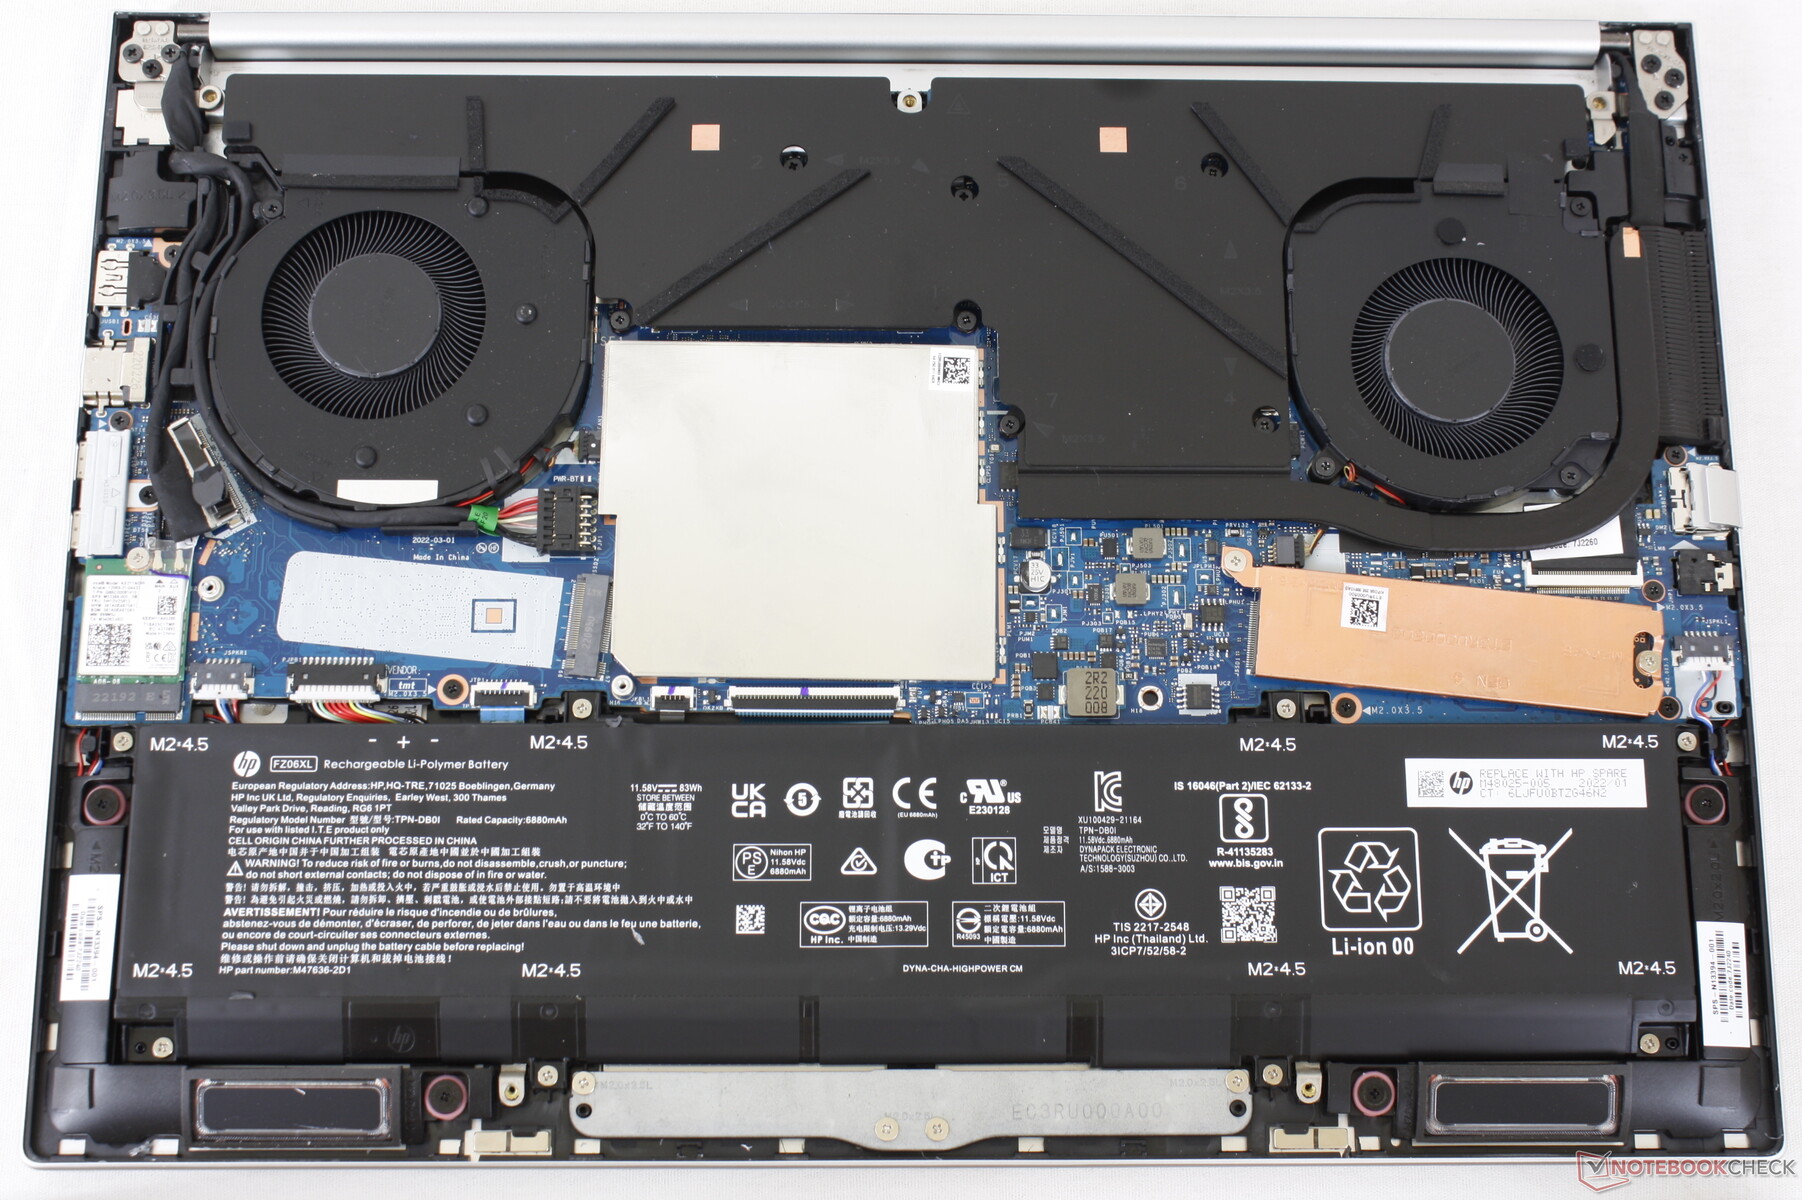
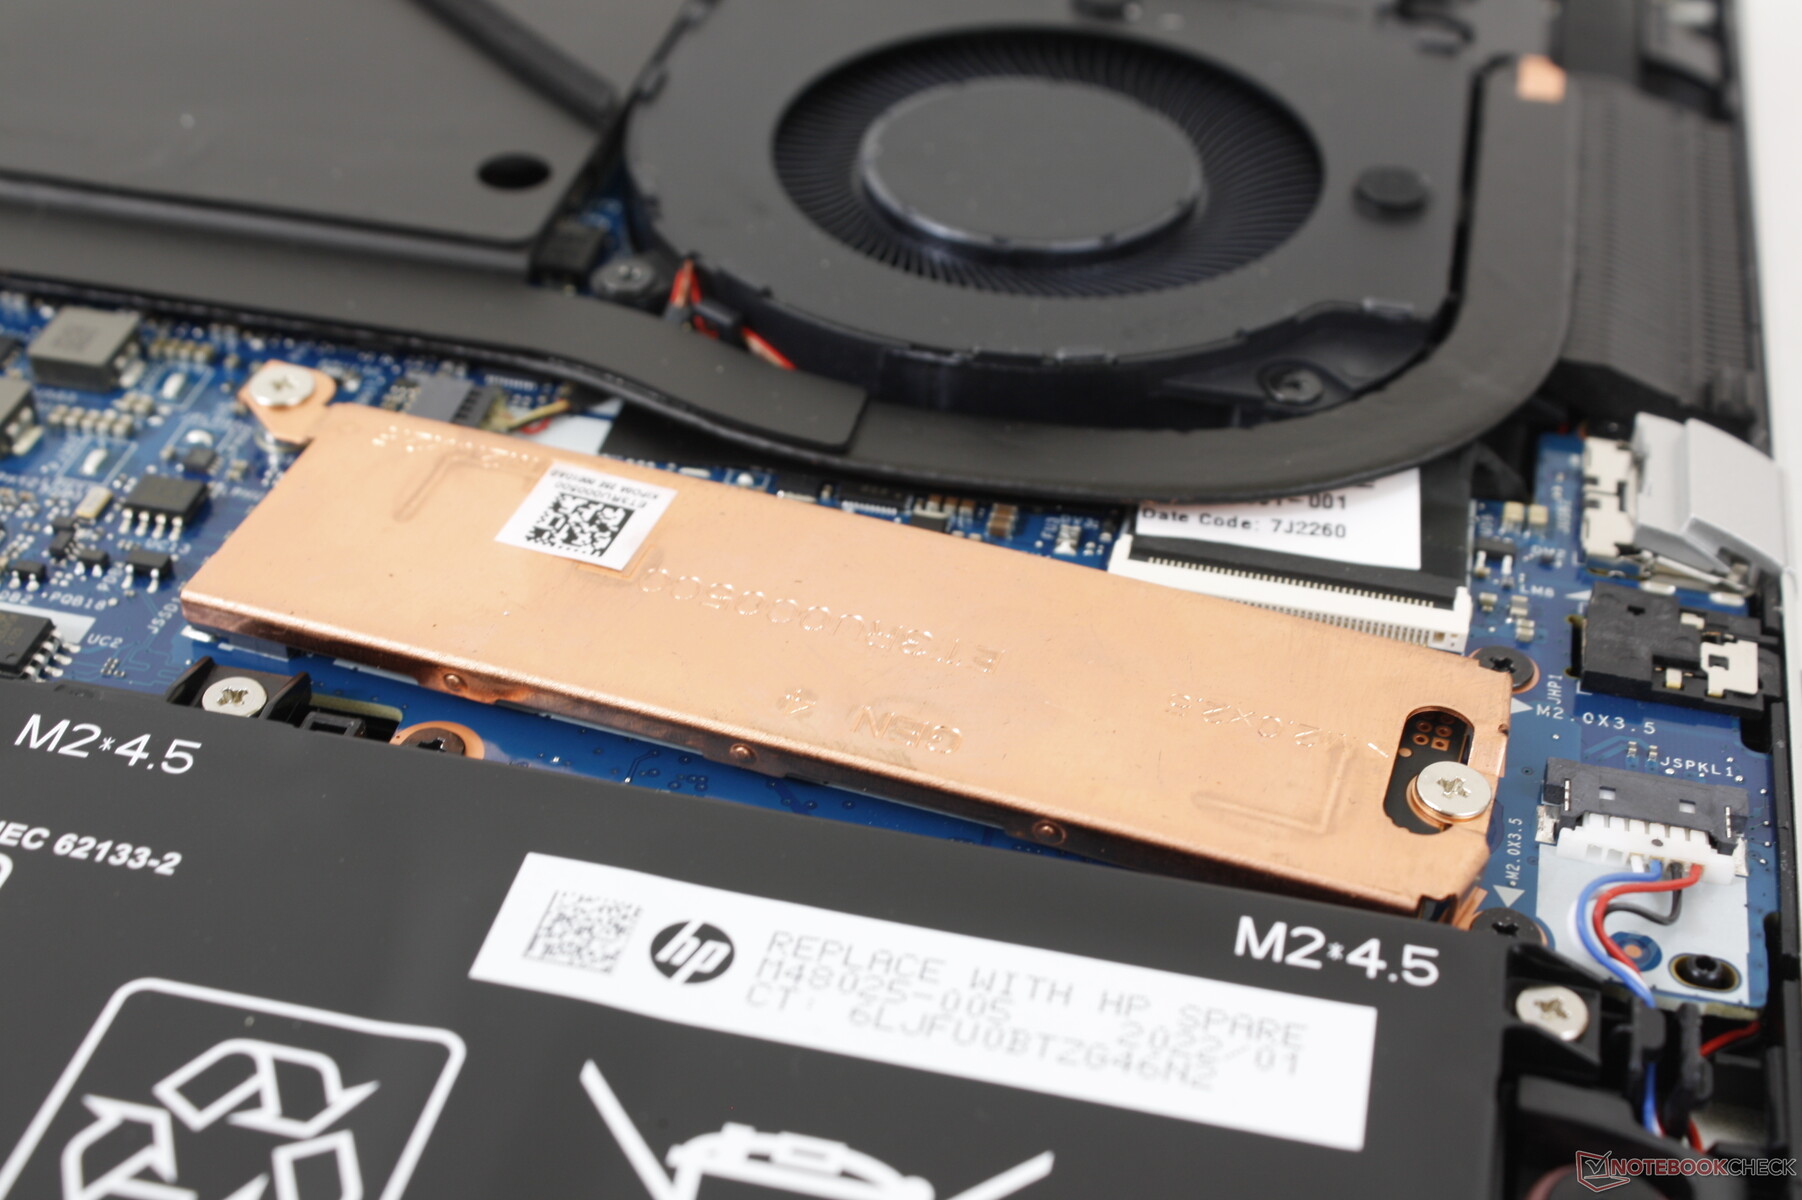
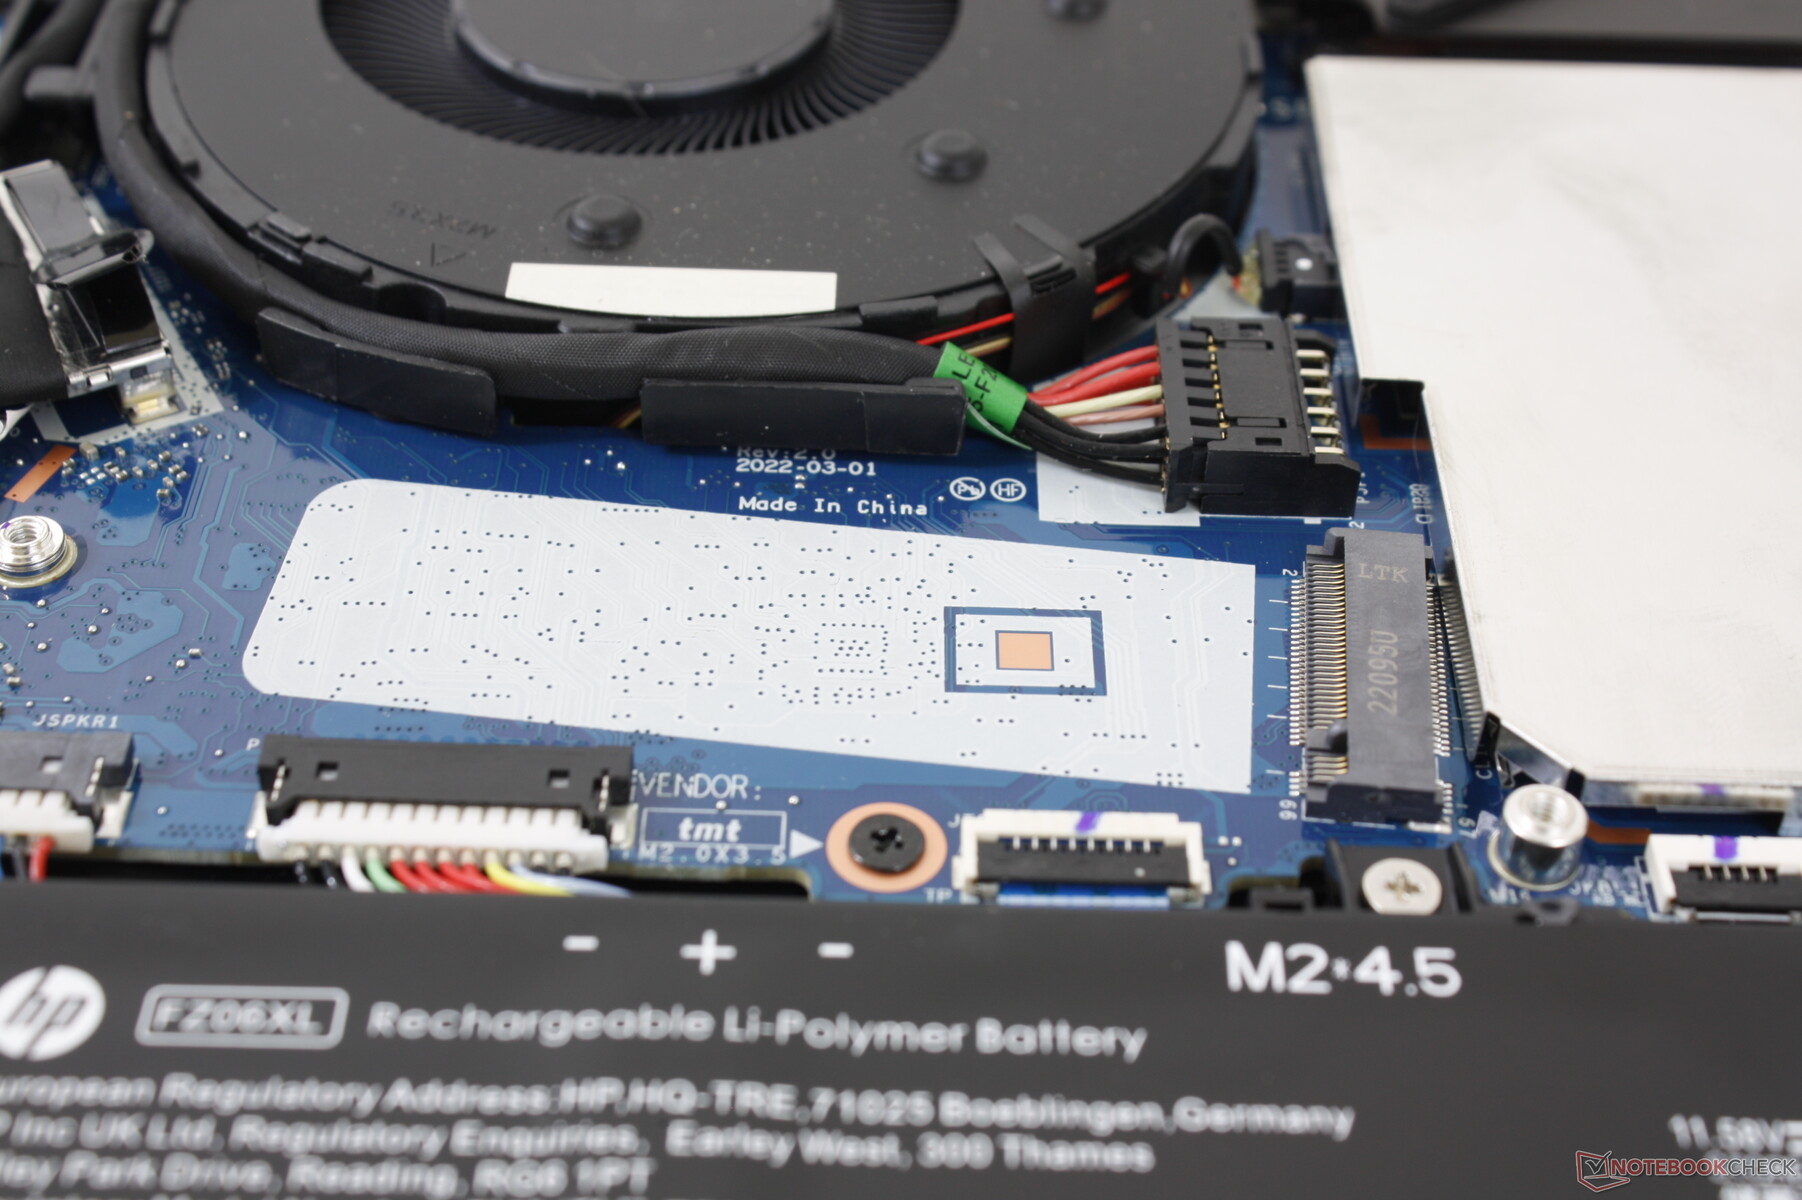
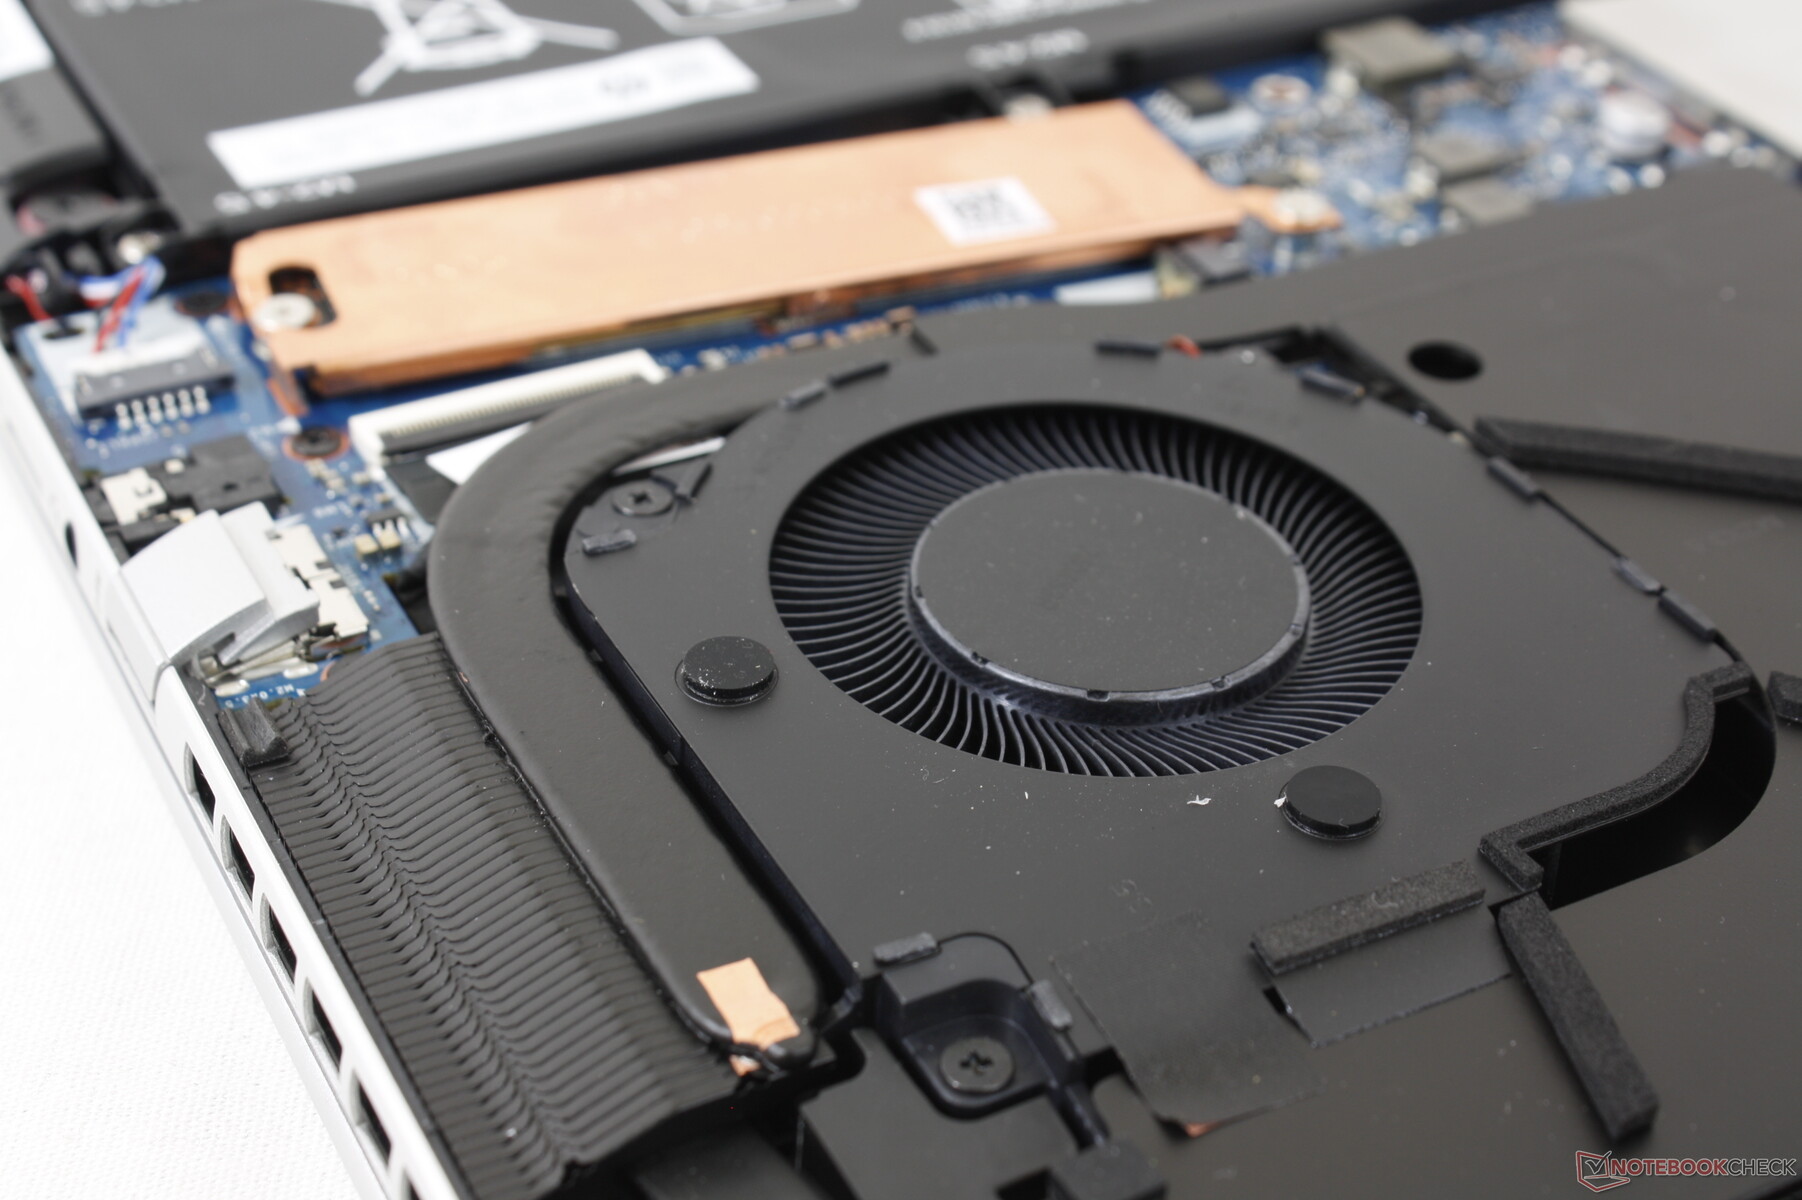
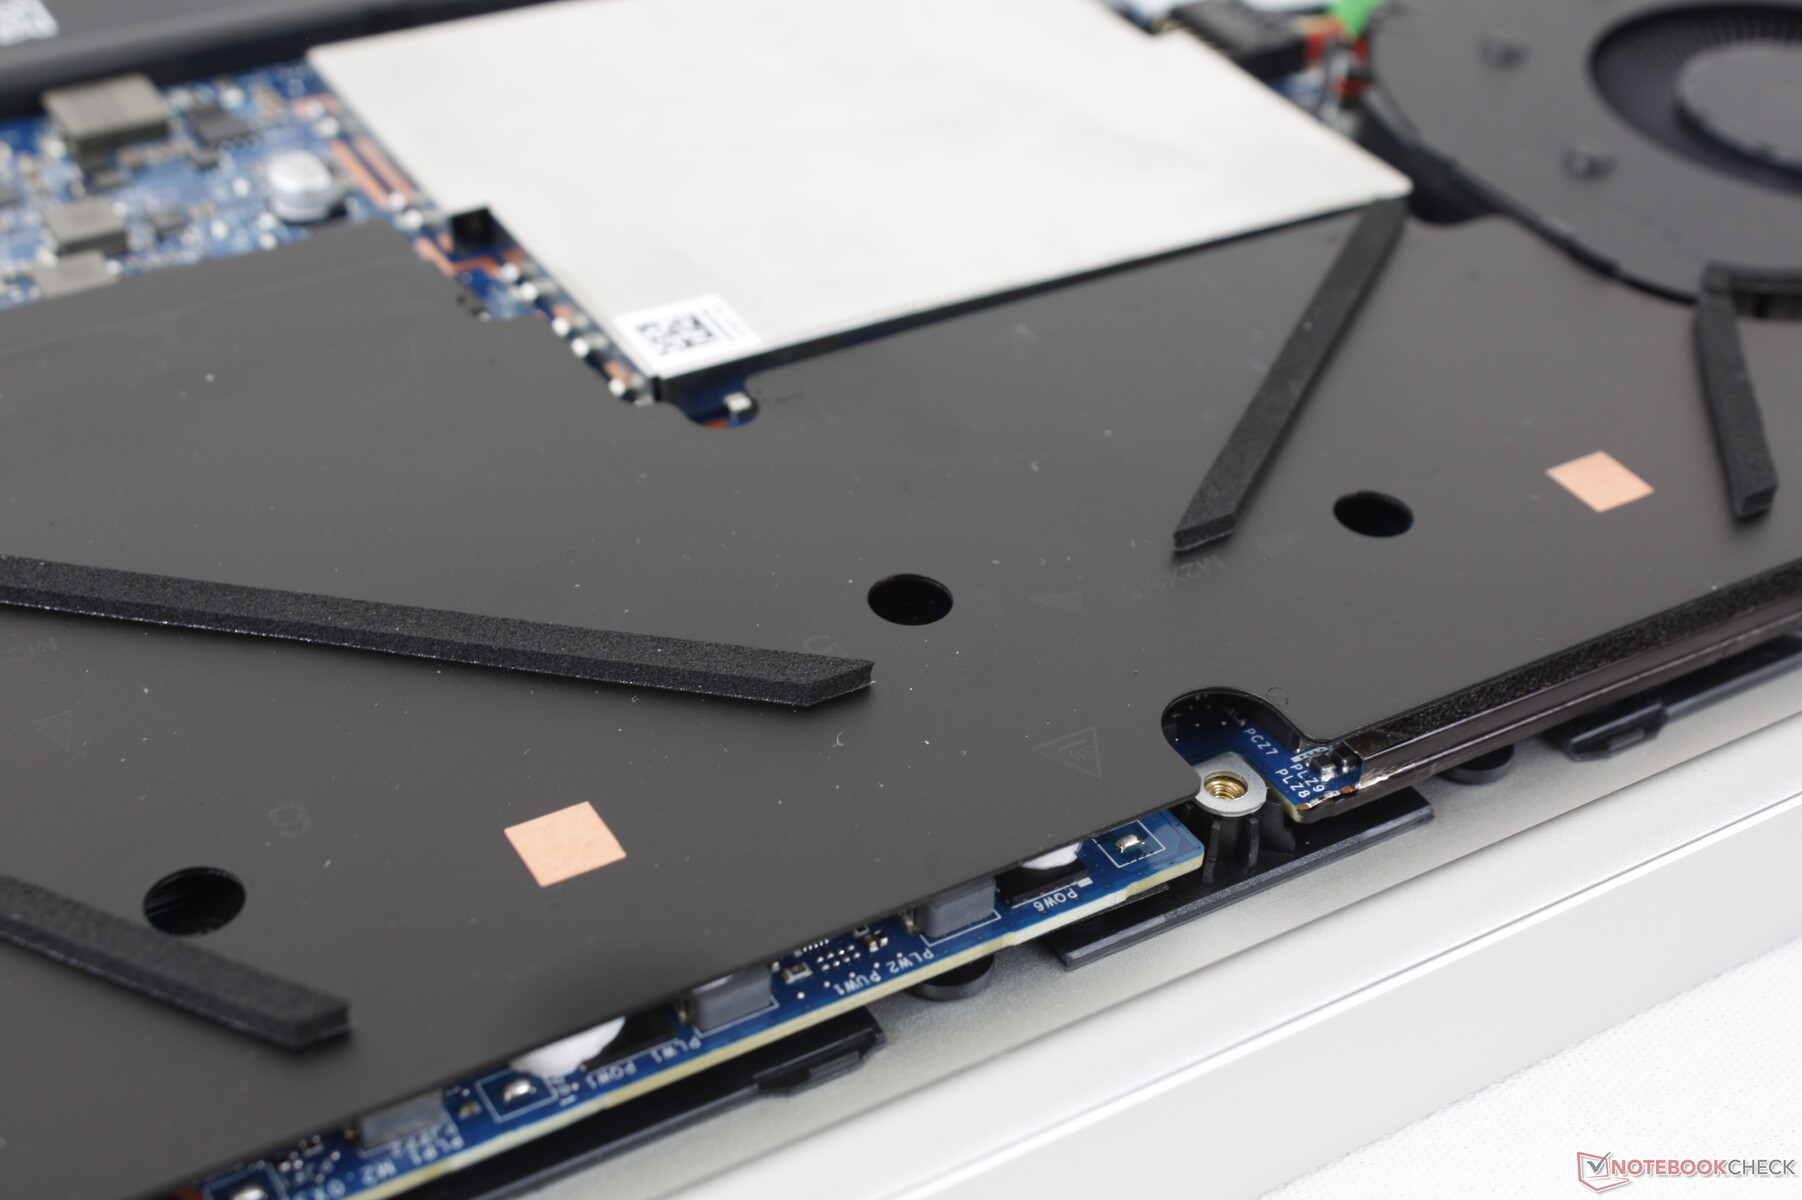
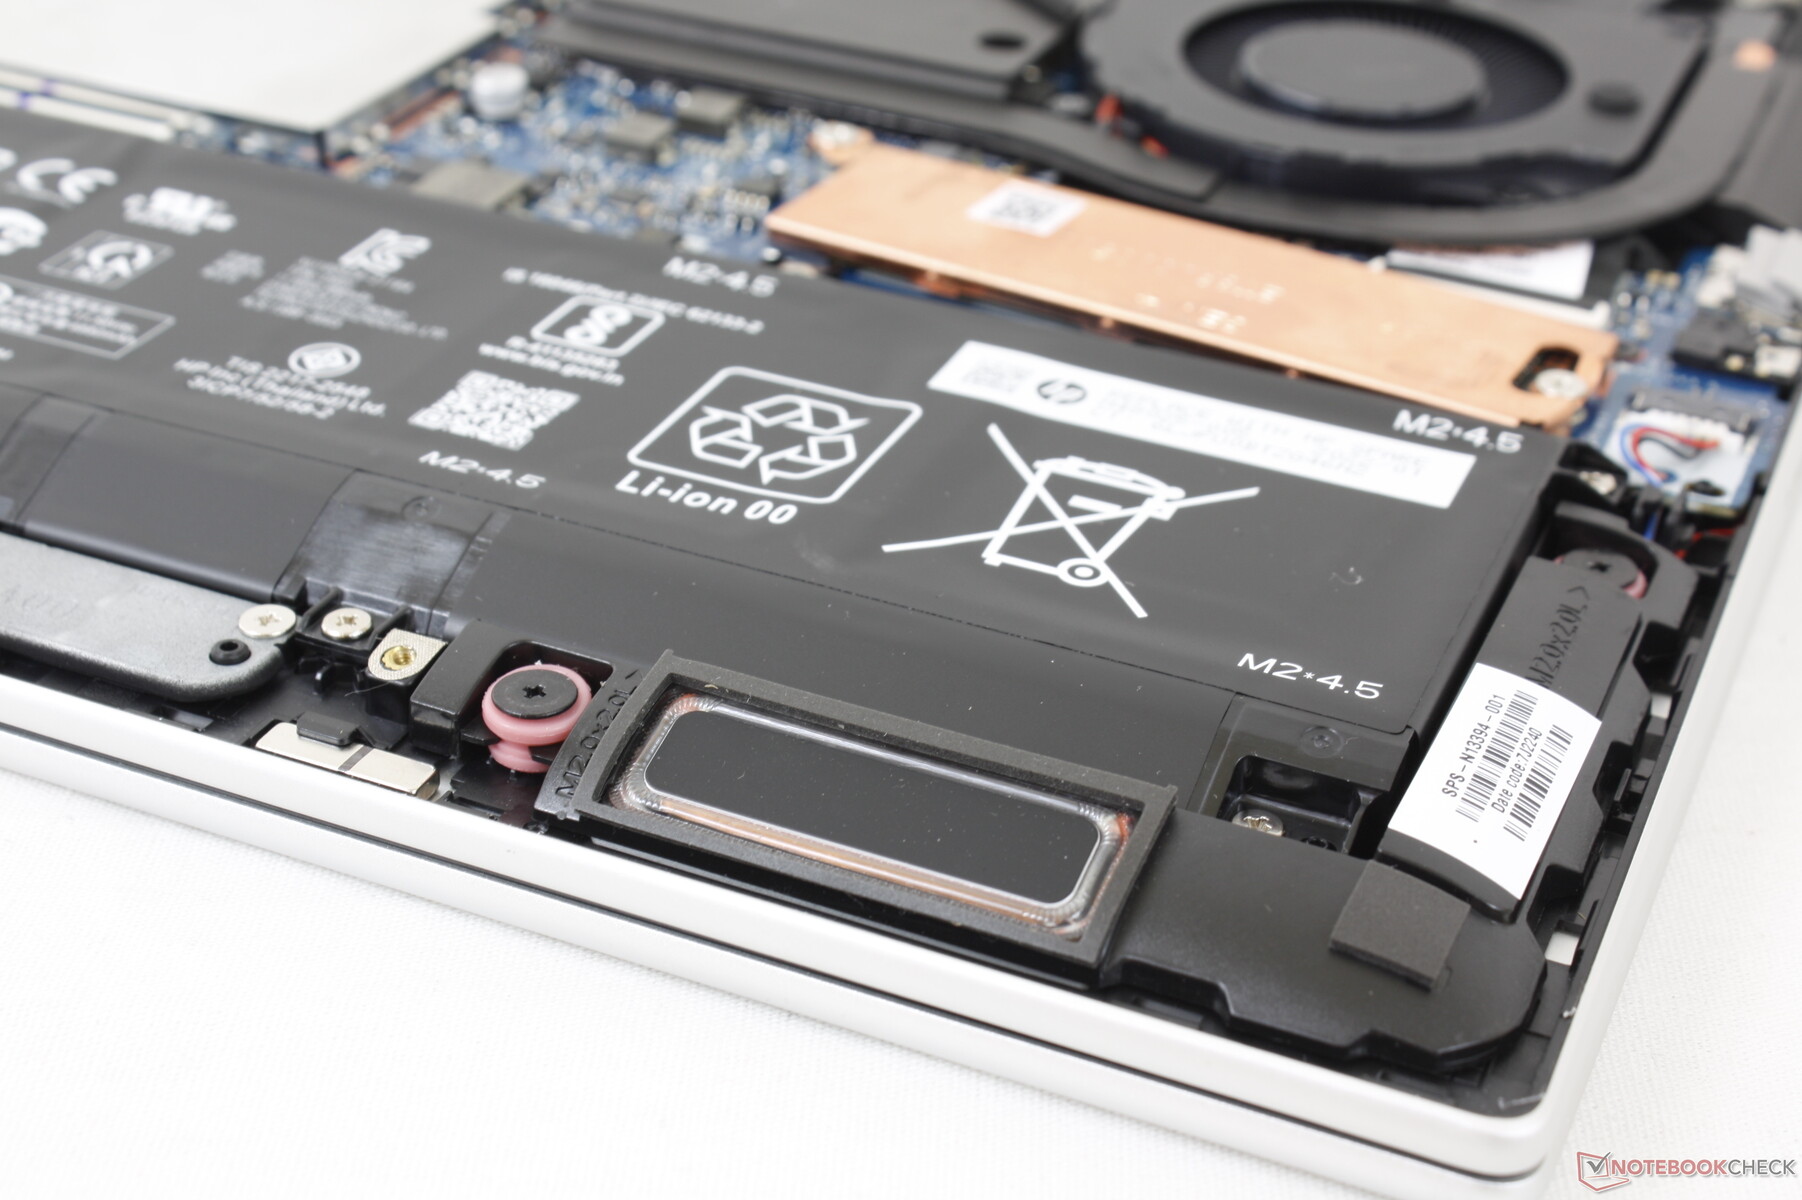
Manutenção
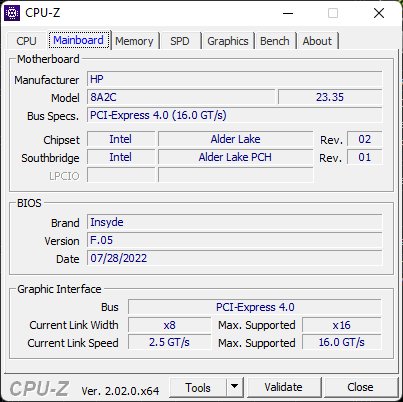
O painel inferior é fixado por apenas 5 parafusos Torx para facilitar a manutenção. Na verdade, a HP tem um vídeo muito útil no YouTube https://www.youtube.com/watch?v=XsdWDioHyQo sobre como desmontar o laptop passo a passo. Os usuários podem acessar os 2x slots SODIMM, 2x slots de armazenamento, e o módulo WLAN uma vez dentro.
Acessórios e Garantia
Não há extras na caixa de varejo além do adaptador AC e da papelada. A habitual garantia limitada de um ano aplica-se se comprada nos EUA.
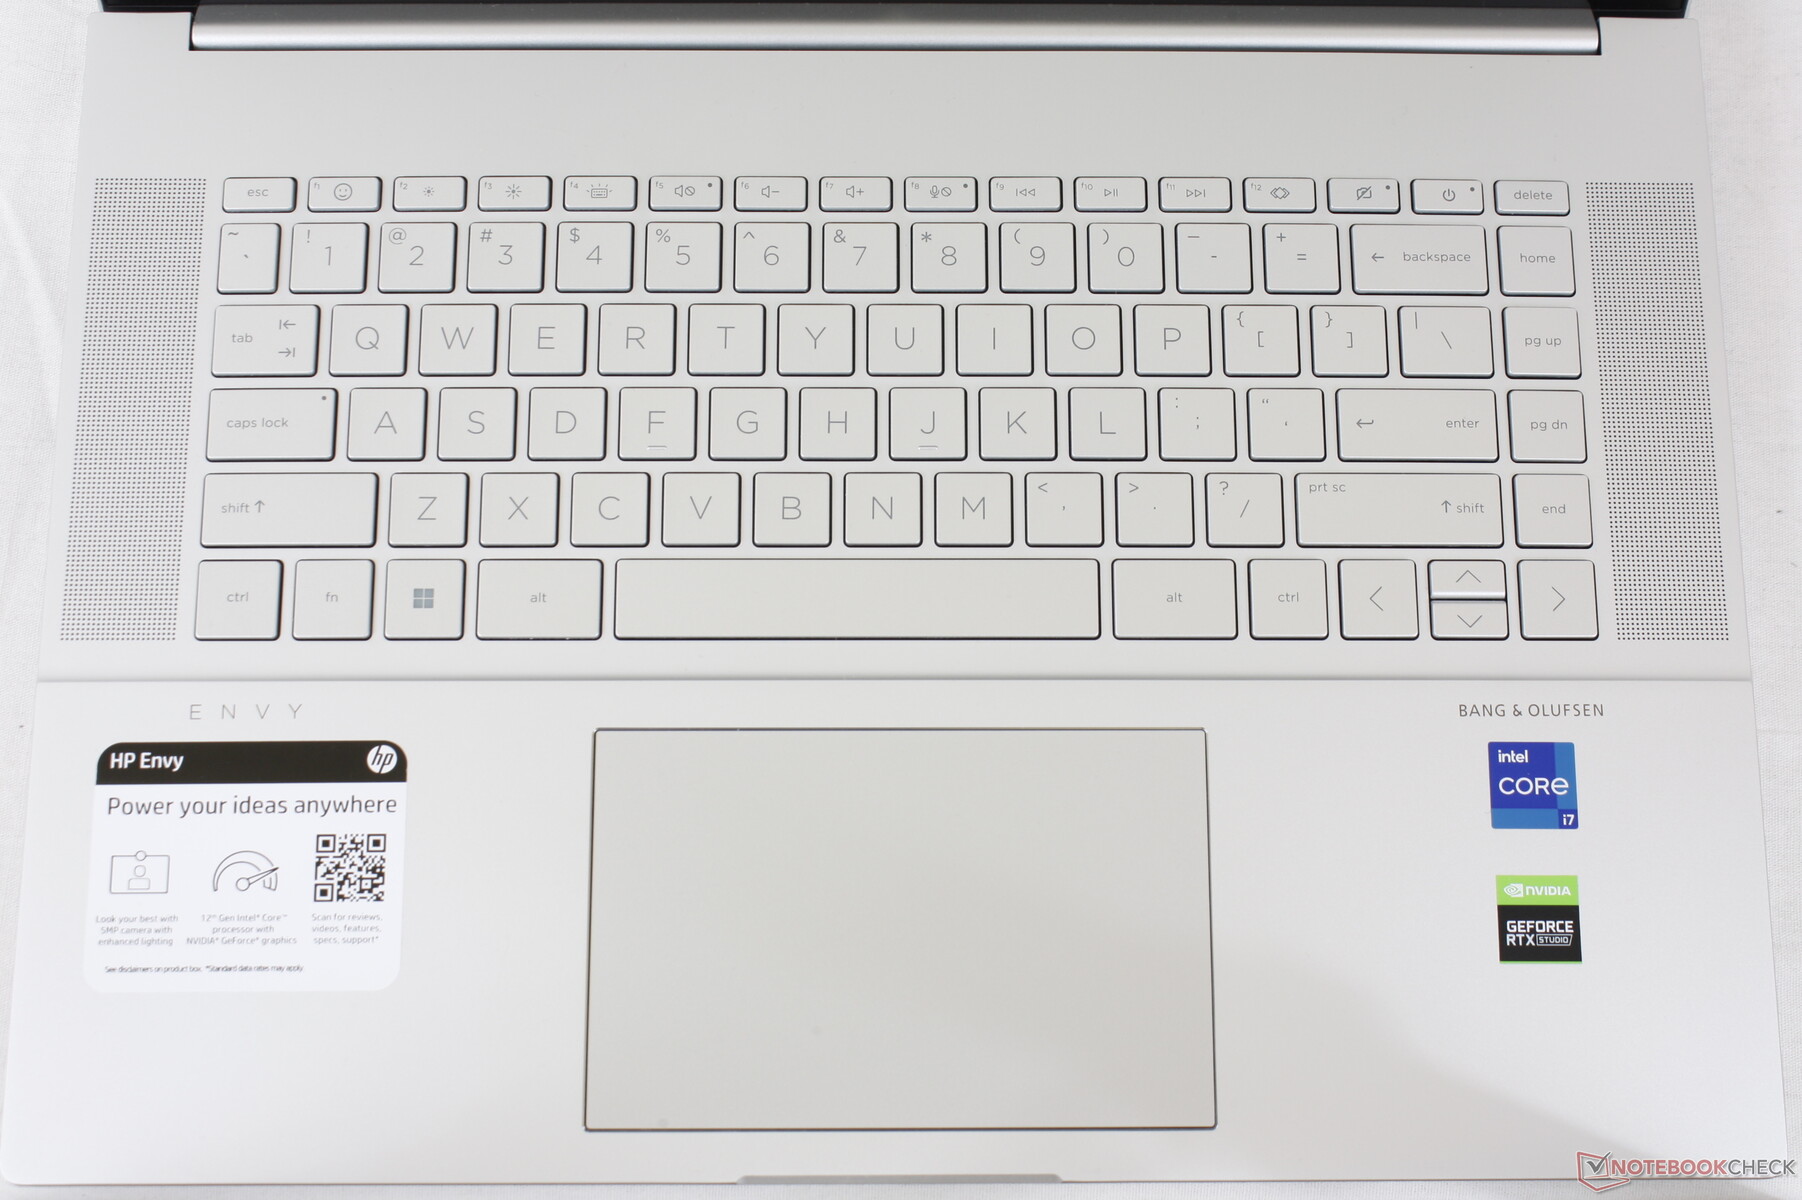
Dispositivos de Entrada - Touchpad Maior, Teclado Familiar
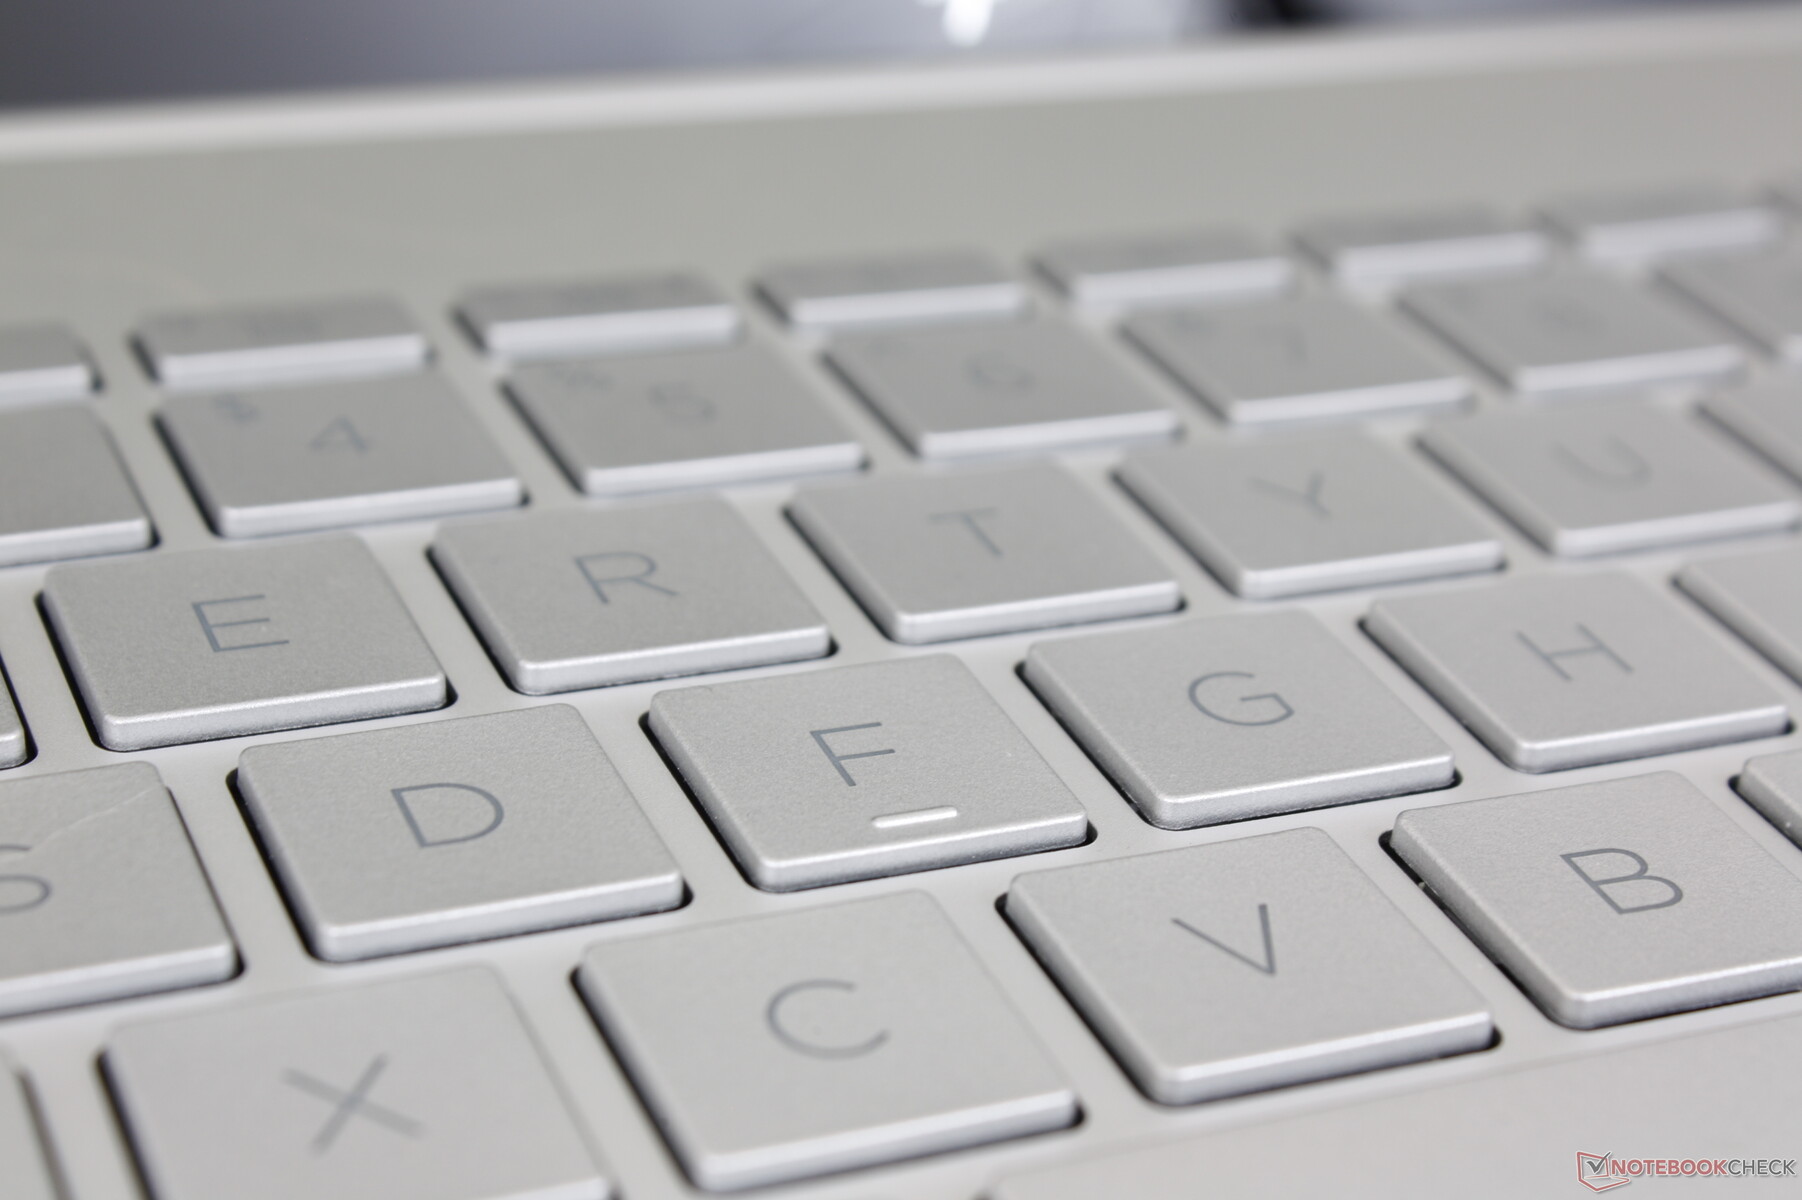
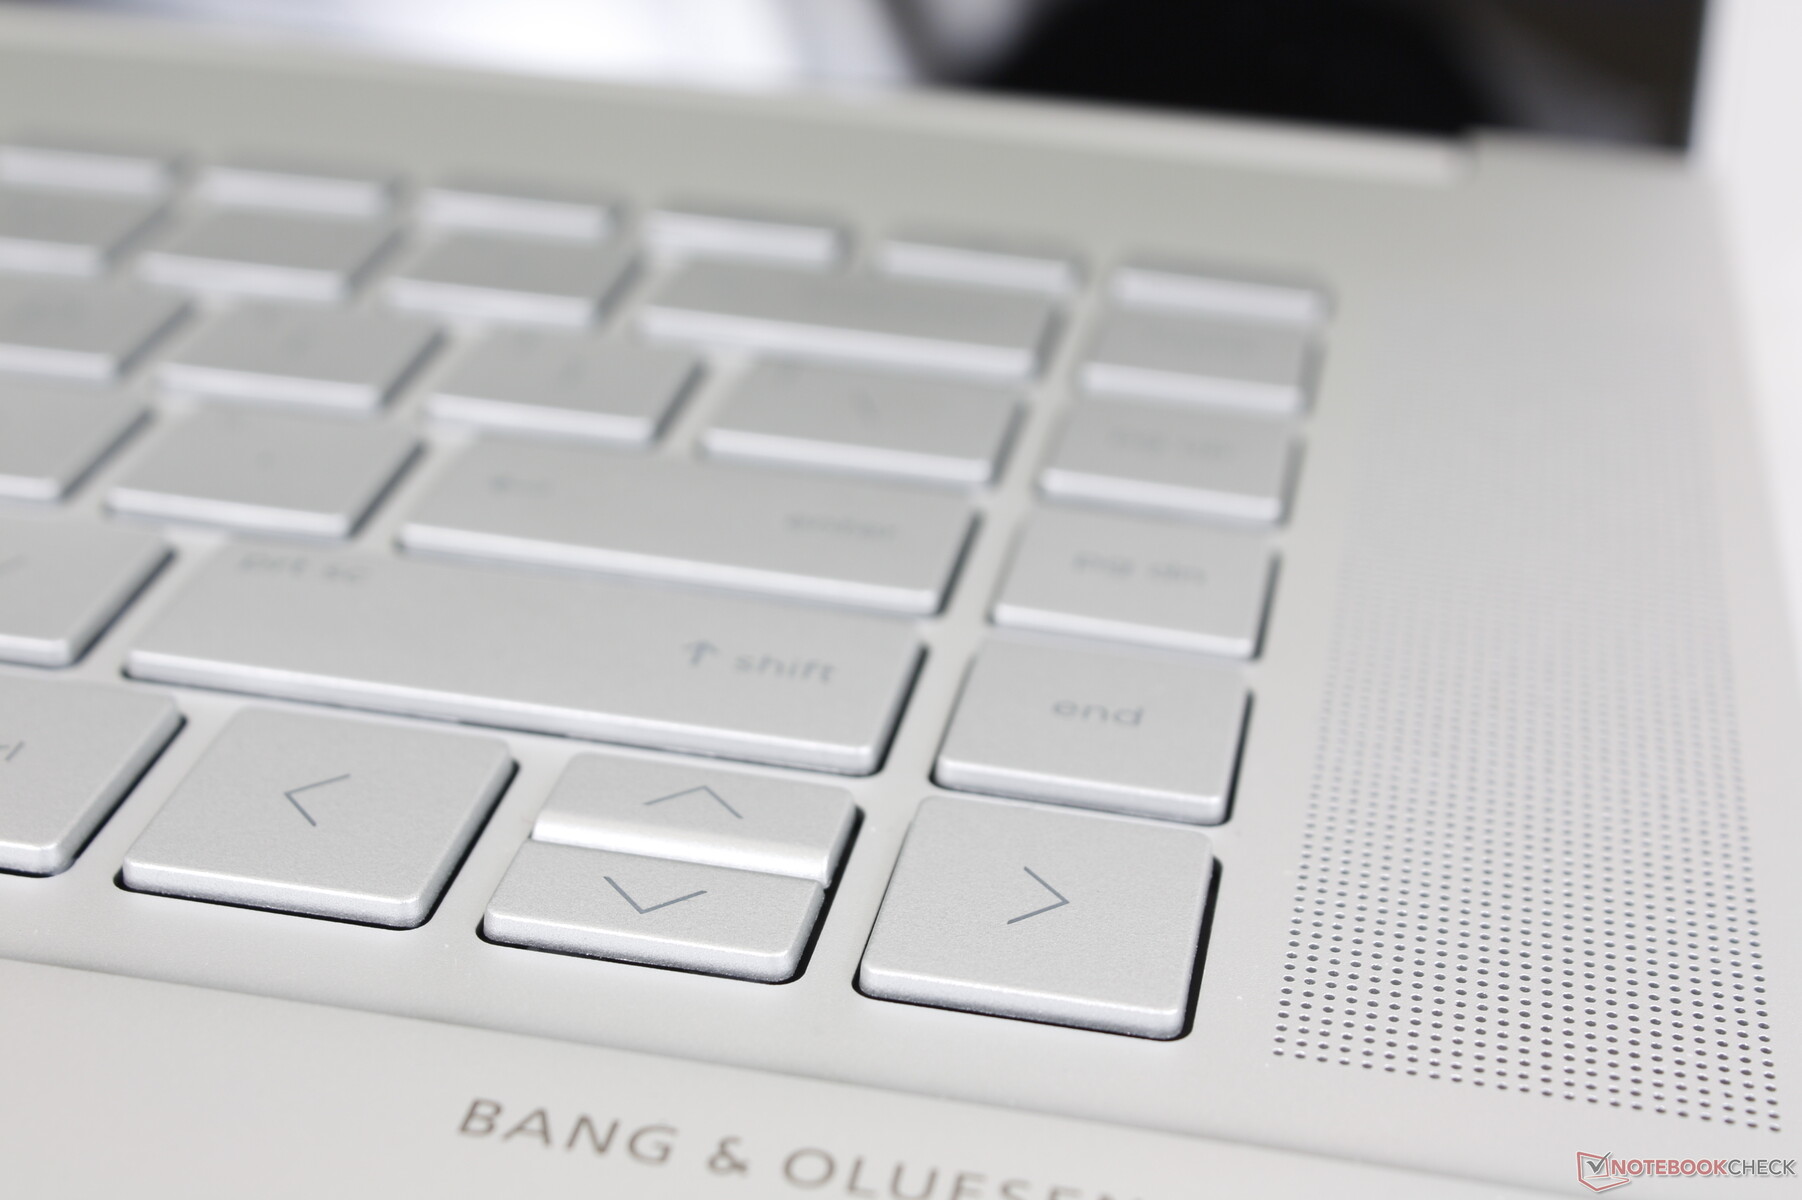
Teclado
A HP não fez nenhuma alteração no feedback ou na sensação do teclado quando comparado com a inveja 2020 15. Por um lado, os usuários habituados aos teclados Envy não terão nenhum problema, mas por outro lado, teríamos preferido uma experiência de digitação mais próxima das teclas mais firmes e satisfatórias de um Spectre 15 ou EliteBook modelo
Há duas pequenas mudanças superficiais que vale a pena mencionar. A função secundária da chave F12 foi agora alterada para uma função 'System Event Utility' que é essencialmente uma chave de lançamento rápido para o HP Command Center, Omen Gaming Hub, myHP, e HP Palette. Em segundo lugar, a função secundária da tecla F1 agora lança um popup para selecionar emojis e GIFs muito parecidos com no mais recente Pavilion.
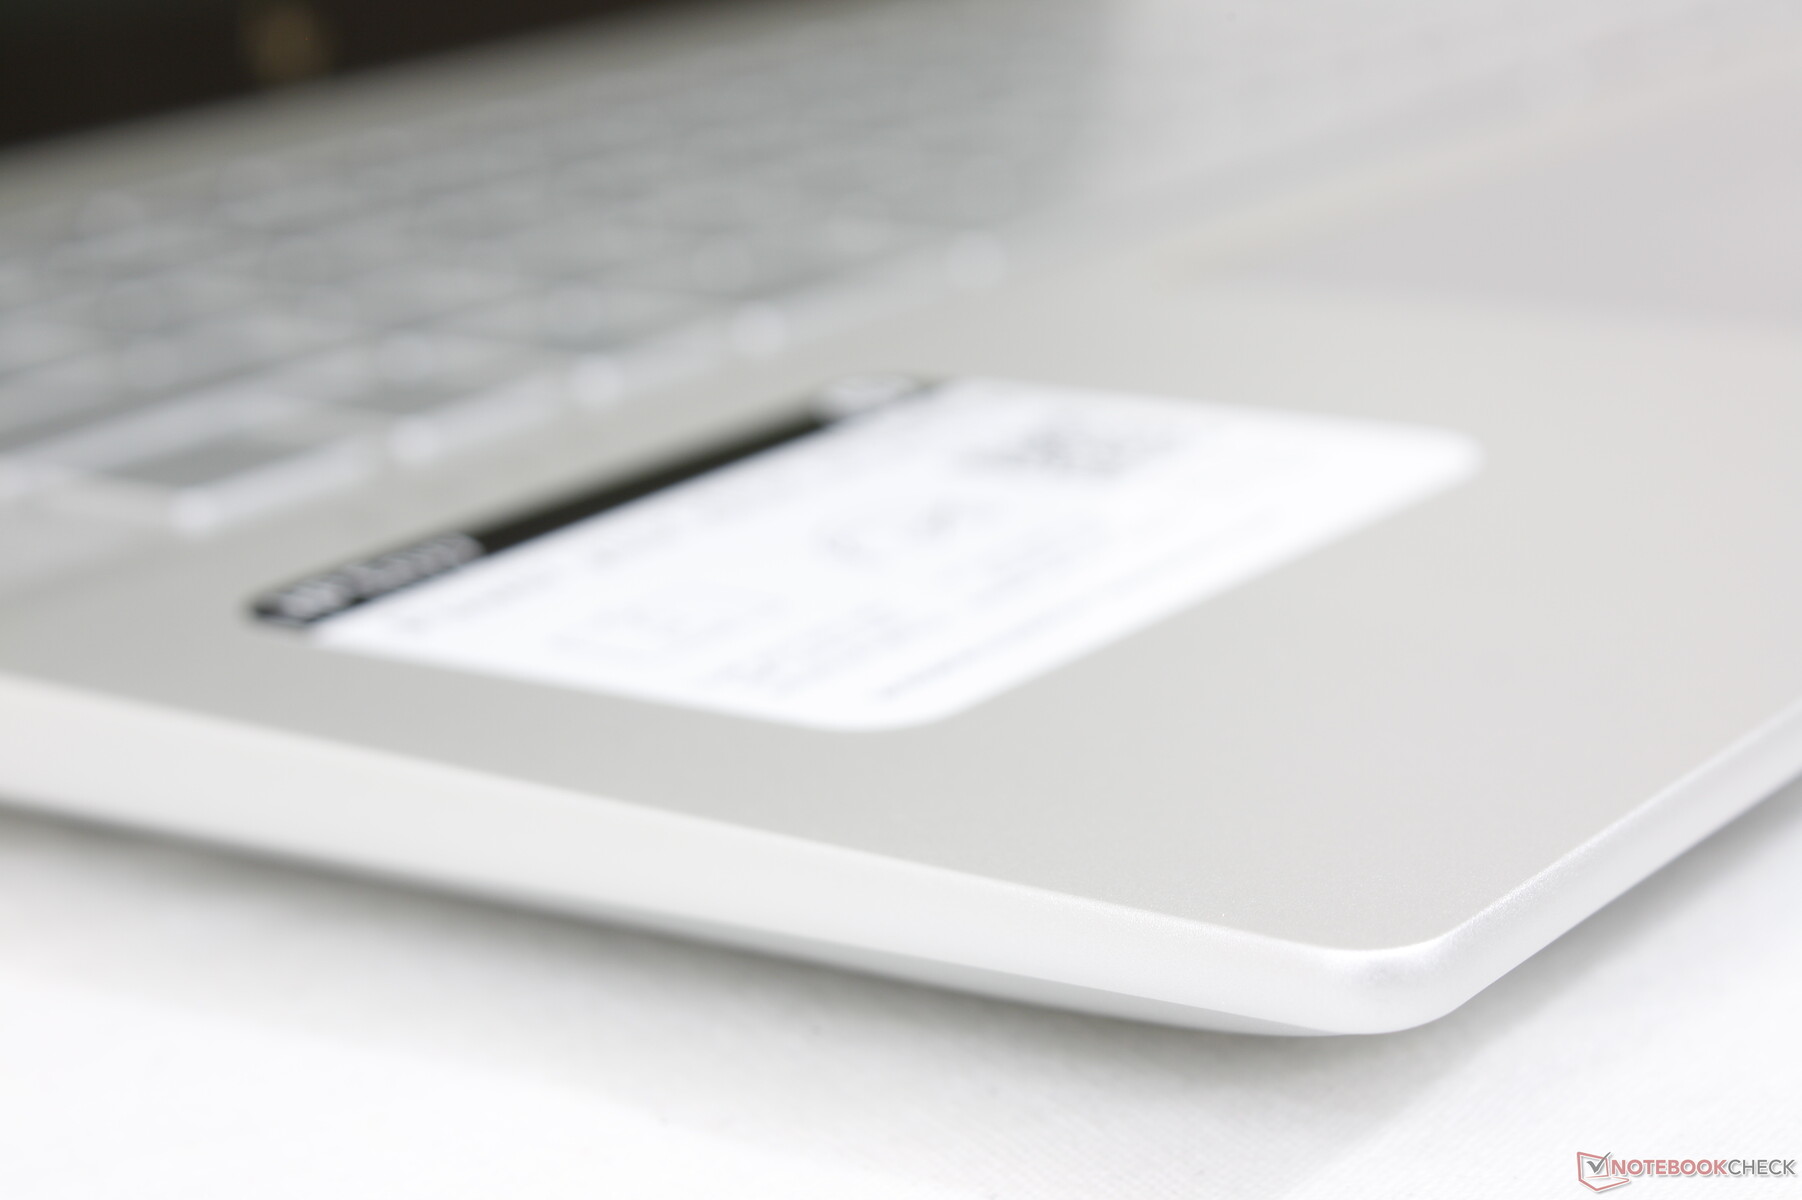
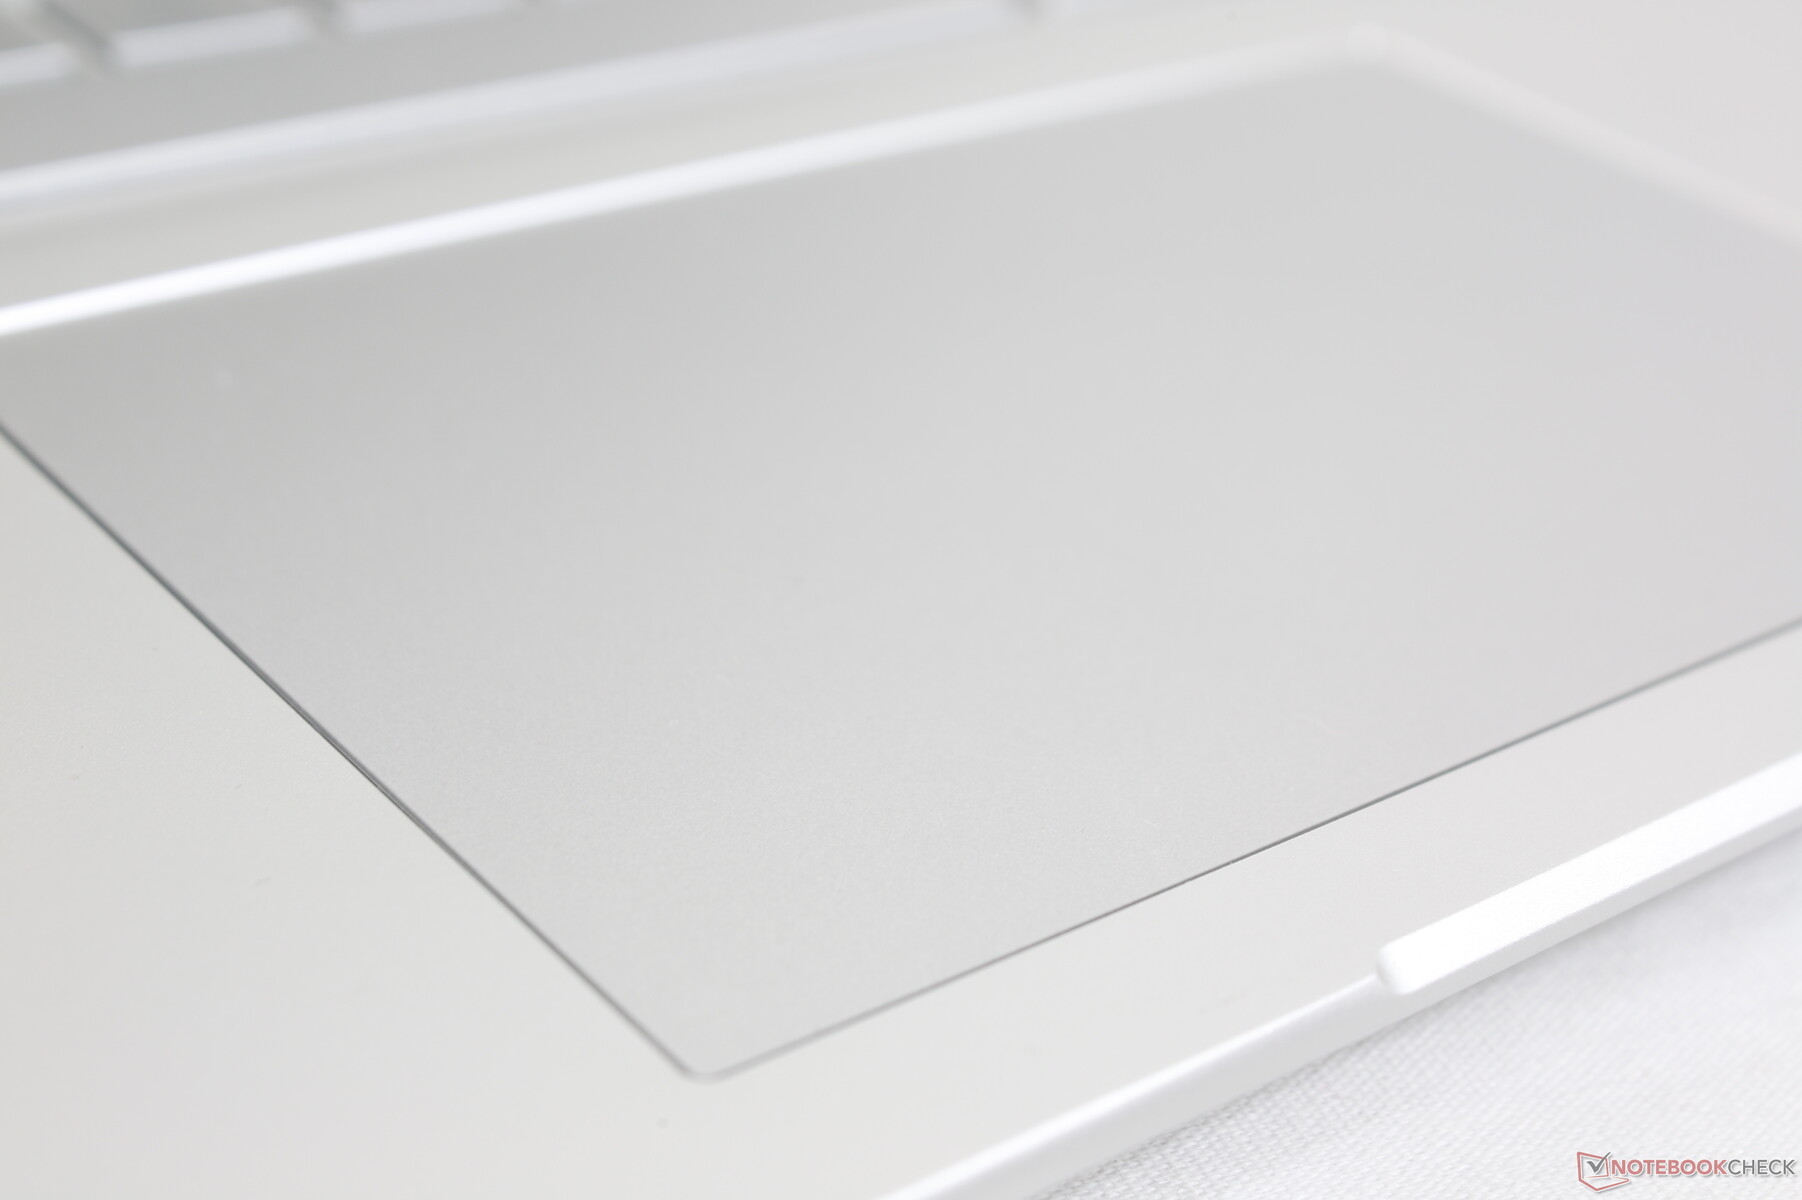
Touchpad
O clickpad é maior que o clickpad da inveja 15 de saída (12,5 x 8 cm vs. 11,5 x 7,5 cm). A superfície é lisa e quase sem textura com apenas uma mínima aderência se deslizando a velocidades mais lentas para cliques mais precisos. Enquanto isso, o feedback ao clicar no clickpad é relativamente suave e silencioso para uma sensação esponjosa. Um clique mais forte e mais satisfatório teria tornado o clickpad mais fácil de usar.
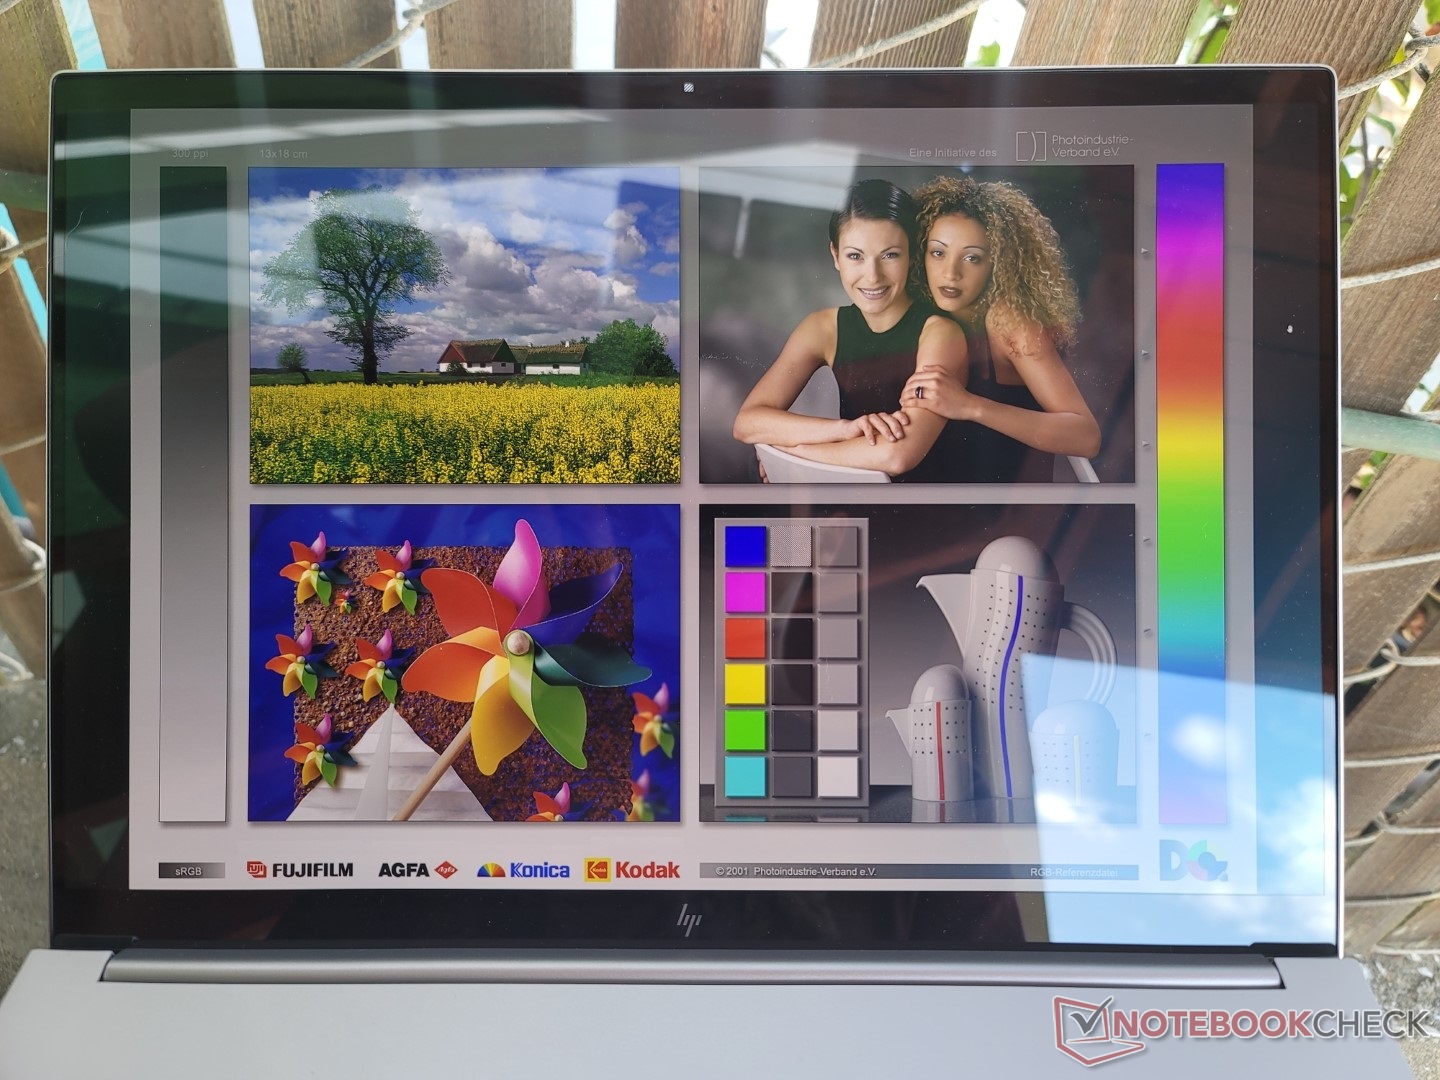
Visor - IPS ou OLED?
Há duas opções de exibição disponíveis
- 2560 x 1600, 120 Hz, IPS, 100% sRGB
- 3840 x 2400, 60 Hz, OLED, 100% P3
Nossas medidas abaixo refletem apenas a opção OLED. Suas principais vantagens incluem as cores mais profundas, a relação de contraste preto-passo e tempos de resposta significativamente mais rápidos de preto-branco e cinza-cinza em relação ao IPS, ao custo de maior consumo de energia e cintilação da tela que pode afetar um pequeno subconjunto de usuários.
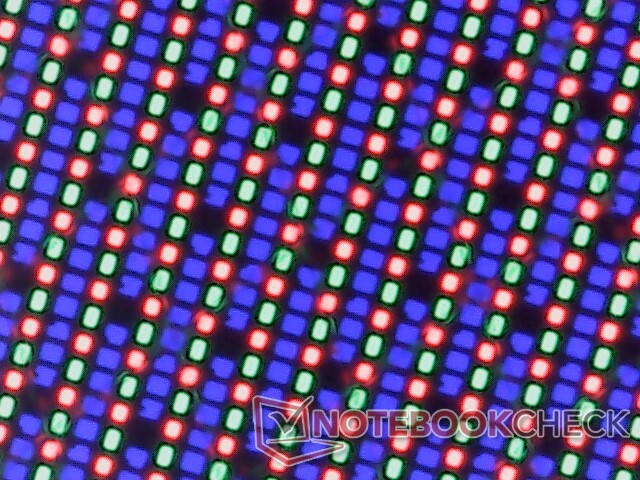
A qualidade da imagem é nítida, mas com grãos de cor perceptíveis que se tornam mais aparentes quando se exibem cores brancas em configurações de alta luminosidade. A opção IPS pode ser preferível para aqueles que não precisam de cores P3, pois a taxa de atualização de 120 Hz oferece uma experiência muito mais suave.
| |||||||||||||||||||||||||
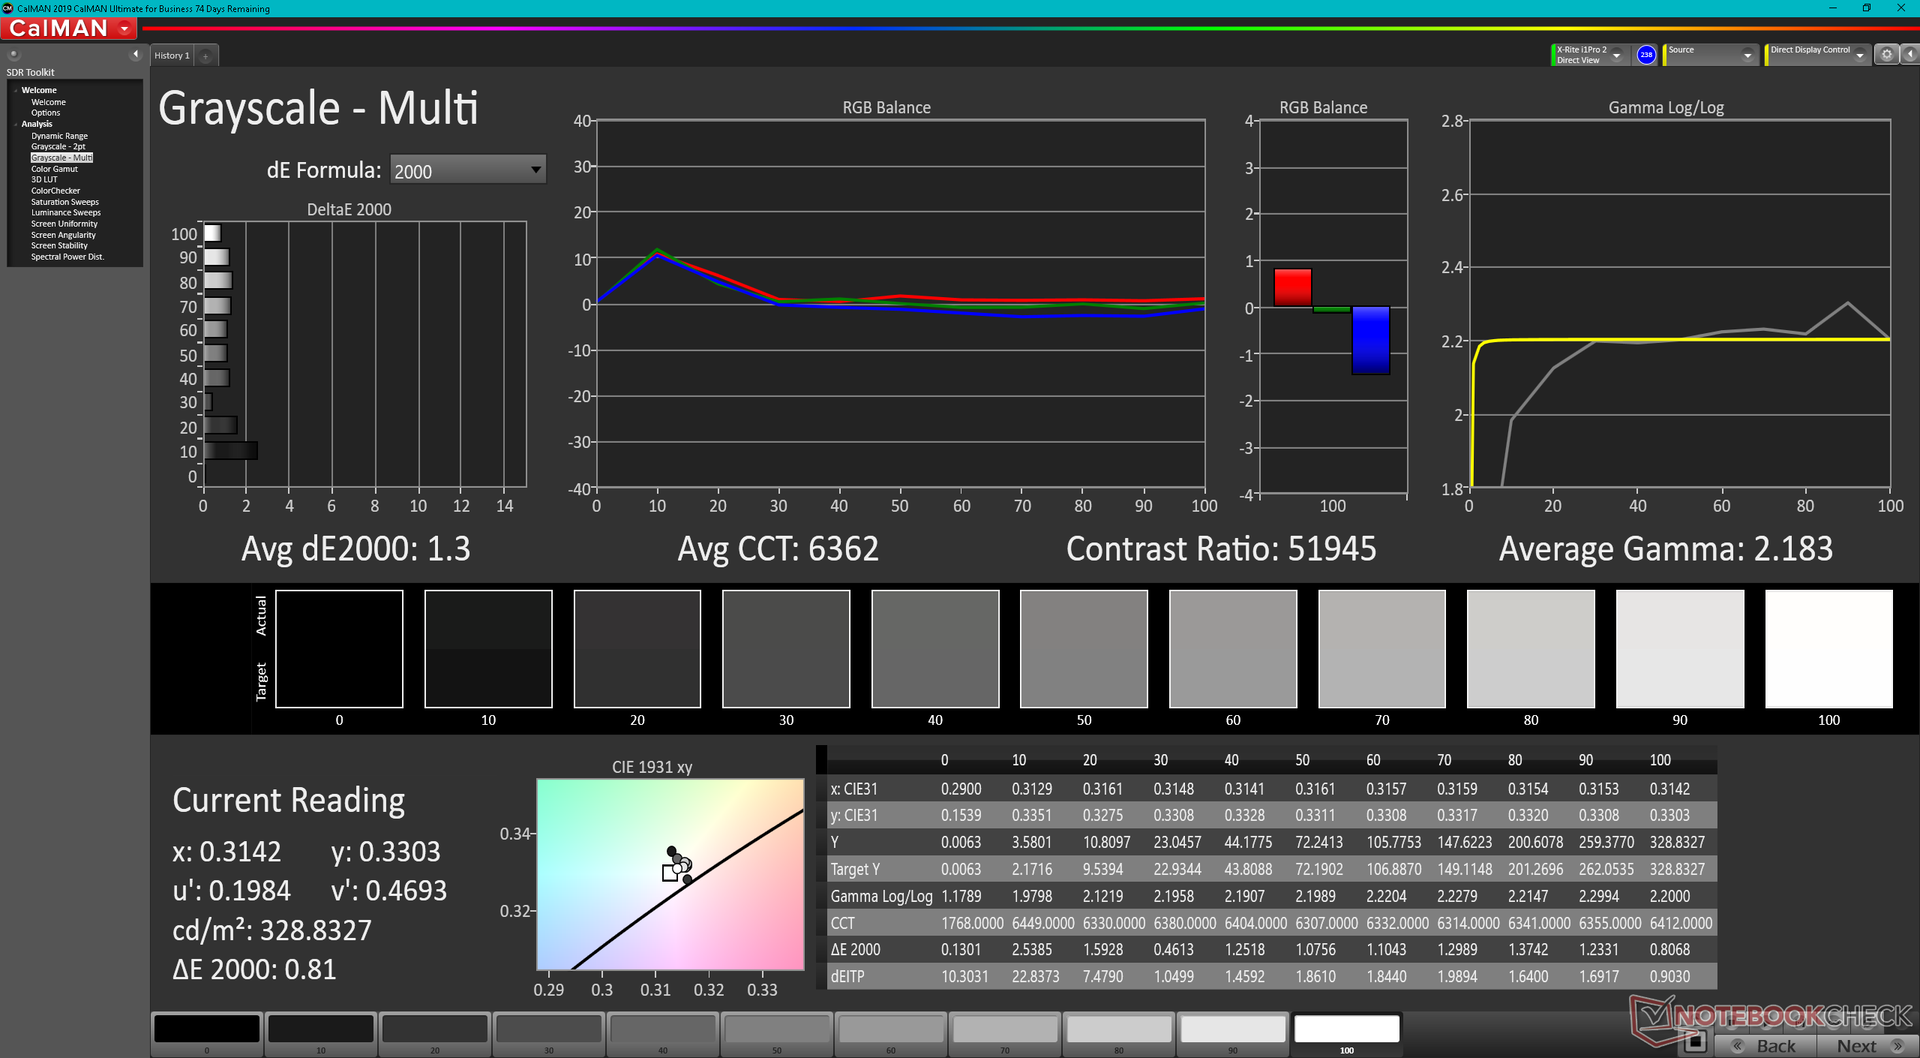
iluminação: 97 %
iluminação com acumulador: 328.8 cd/m²
Contraste: ∞:1 (Preto: 0 cd/m²)
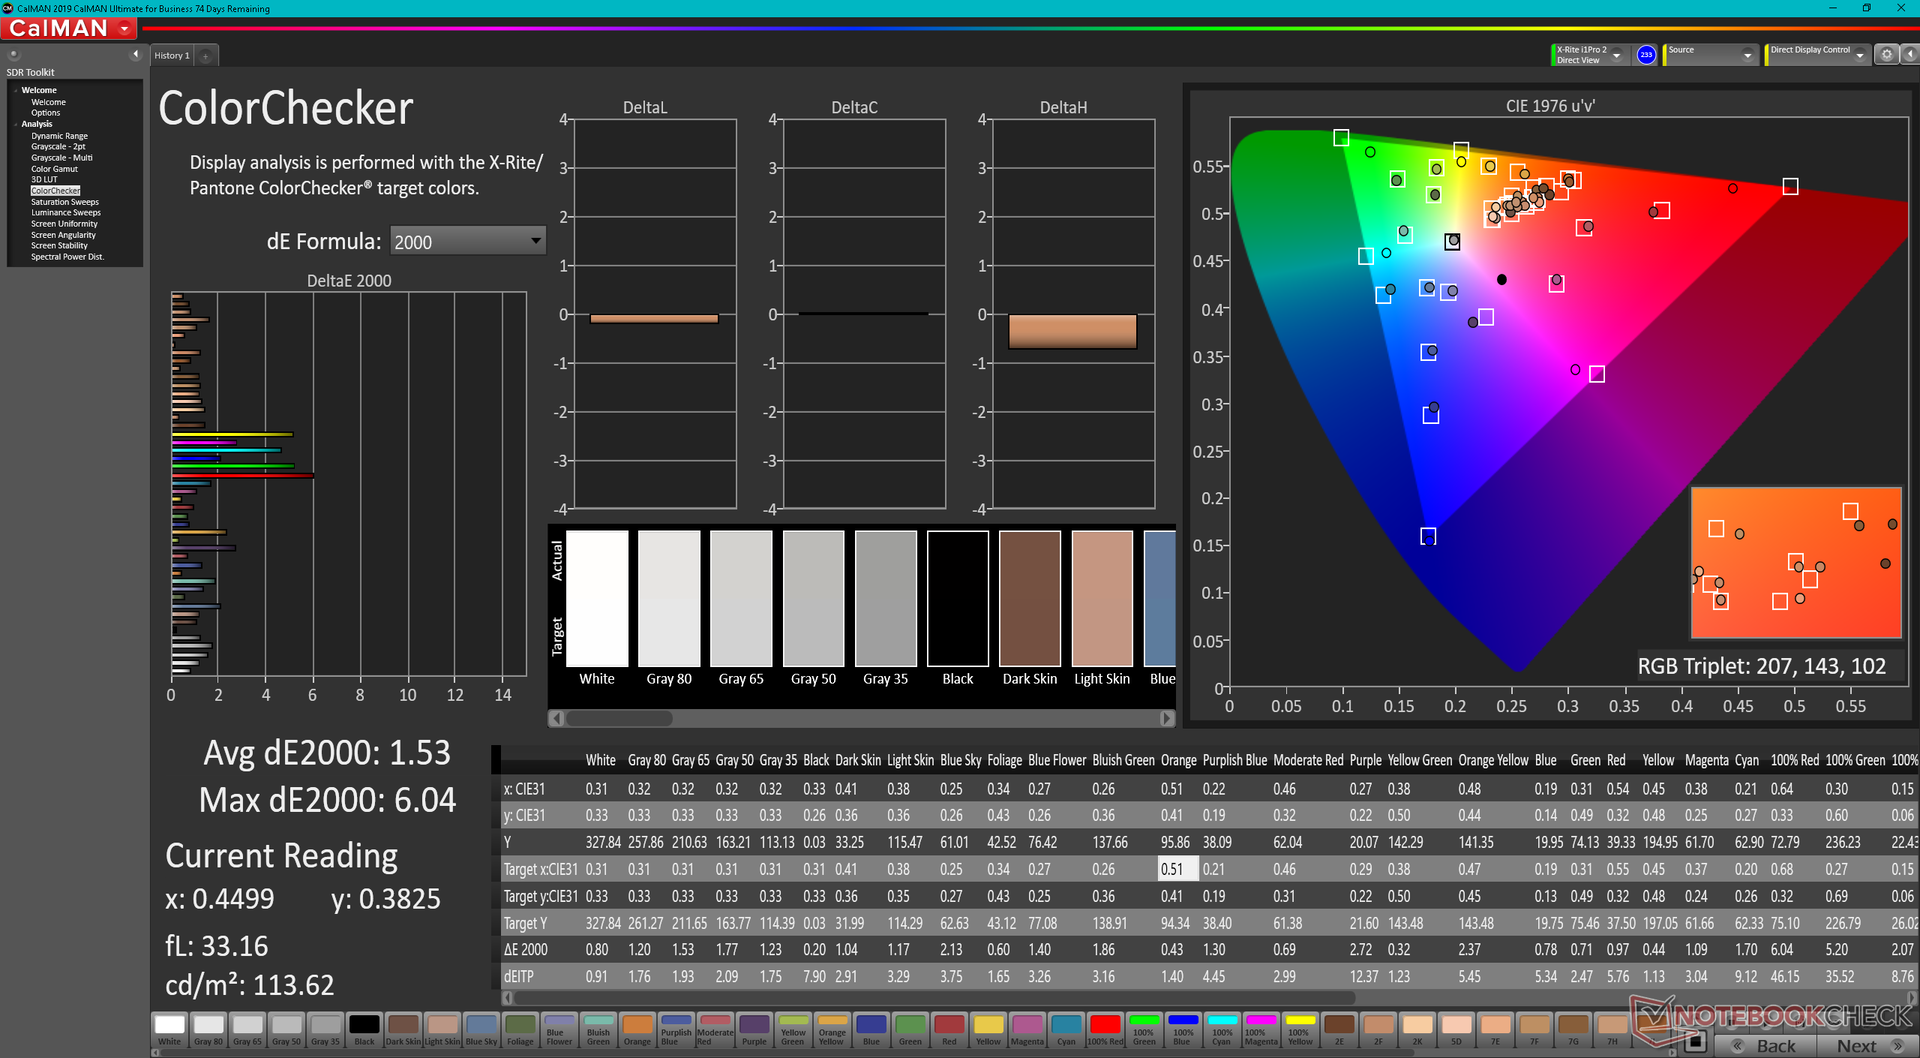
ΔE ColorChecker Calman: 1.53 | ∀{0.5-29.43 Ø4.71}
ΔE Greyscale Calman: 1.3 | ∀{0.09-98 Ø4.96}
88% AdobeRGB 1998 (Argyll 3D)
100% sRGB (Argyll 3D)
99.3% Display P3 (Argyll 3D)
Gamma: 2.18
CCT: 6362 K
| HP Envy 16 h0112nr Samsung SDC4174, OLED, 3840x2400, 16" | Lenovo ThinkBook 16 G4+ IAP LEN160WQXGA, IPS, 2560x1600, 16" | MSI Creator Z16P B12UHST AUOD298, IPS True Pixel (~100% DCI-P3), 2560x1600, 16" | Dell Inspiron 16 Plus 7610-MHJ8F AU Optronics B160QAN, AUO9F91, IPS, 3072x1920, 16" | Apple MacBook Pro 16 2021 M1 Pro Liquid Retina XDR, Mini-LED, 3456x2234, 16.2" | Huawei MateBook 16s i7 BOE XS TV160DKT-NH0, IPS, 2520x1680, 16" | |
|---|---|---|---|---|---|---|
| Display | -17% | -1% | -13% | 0% | -21% | |
| Display P3 Coverage (%) | 99.3 | 69.6 -30% | 97.6 -2% | 75 -24% | 99.1 0% | 64.5 -35% |
| sRGB Coverage (%) | 100 | 97.5 -2% | 99.9 0% | 100 0% | 100 0% | 96.7 -3% |
| AdobeRGB 1998 Coverage (%) | 88 | 71.7 -19% | 86.8 -1% | 76 -14% | 88 0% | 66.6 -24% |
| Response Times | -1160% | -391% | -2092% | -3381% | -1403% | |
| Response Time Grey 50% / Grey 80% * (ms) | 2 ? | 32.7 ? -1535% | 12.9 ? -545% | 54 ? -2600% | 42.8 ? -2040% | 35.7 ? -1685% |
| Response Time Black / White * (ms) | 1.9 ? | 16.8 ? -784% | 6.4 ? -237% | 32 ? -1584% | 91.6 ? -4721% | 23.2 ? -1121% |
| PWM Frequency (Hz) | 240.4 ? | 14880 | ||||
| Screen | -36% | -17% | -37% | 15% | 13% | |
| Brightness middle (cd/m²) | 328.8 | 371 13% | 428 30% | 290 -12% | 514 56% | 311 -5% |
| Brightness (cd/m²) | 332 | 357 8% | 394 19% | 285 -14% | 497 50% | 319 -4% |
| Brightness Distribution (%) | 97 | 91 -6% | 86 -11% | 88 -9% | 95 -2% | 91 -6% |
| Black Level * (cd/m²) | 0.23 | 0.42 | 0.21 | 0.02 | 0.17 | |
| Colorchecker dE 2000 * | 1.53 | 2.6 -70% | 1.67 -9% | 2.57 -68% | 1.4 8% | 1 35% |
| Colorchecker dE 2000 max. * | 6.04 | 4.4 27% | 5.71 5% | 4.78 21% | 2.8 54% | 1.7 72% |
| Greyscale dE 2000 * | 1.3 | 3.7 -185% | 3.1 -138% | 3.14 -142% | 2.3 -77% | 1.5 -15% |
| Gamma | 2.18 101% | 2.32 95% | 2.195 100% | 2.34 94% | 2.27 97% | 2.15 102% |
| CCT | 6362 102% | 7271 89% | 6498 100% | 6408 101% | 6792 96% | 6432 101% |
| Contrast (:1) | 1613 | 1019 | 1381 | 25700 | 1829 | |
| Colorchecker dE 2000 calibrated * | 1.3 | 0.71 | 1.89 | 0.8 | ||
| Média Total (Programa/Configurações) | -404% /
-235% | -136% /
-81% | -714% /
-404% | -1122% /
-607% | -470% /
-254% |
* ... menor é melhor
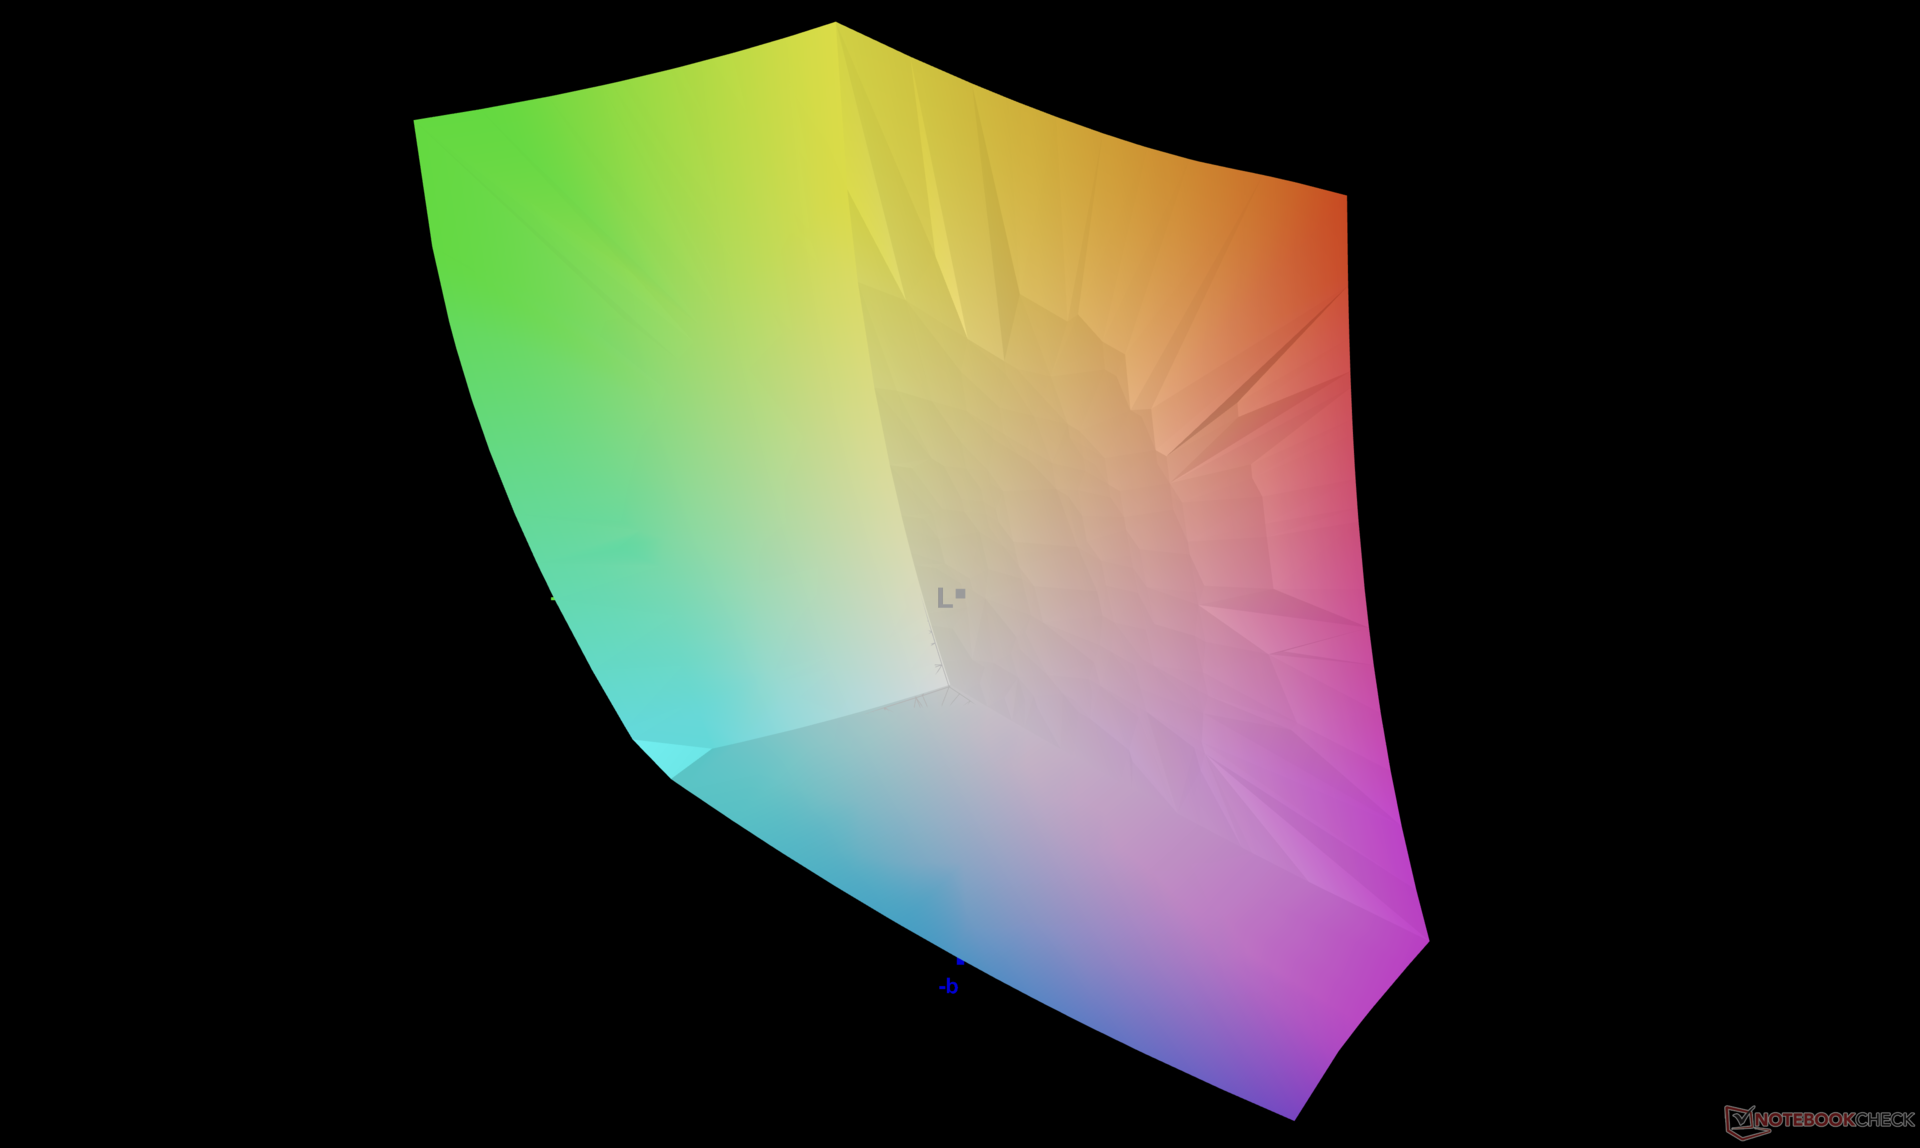
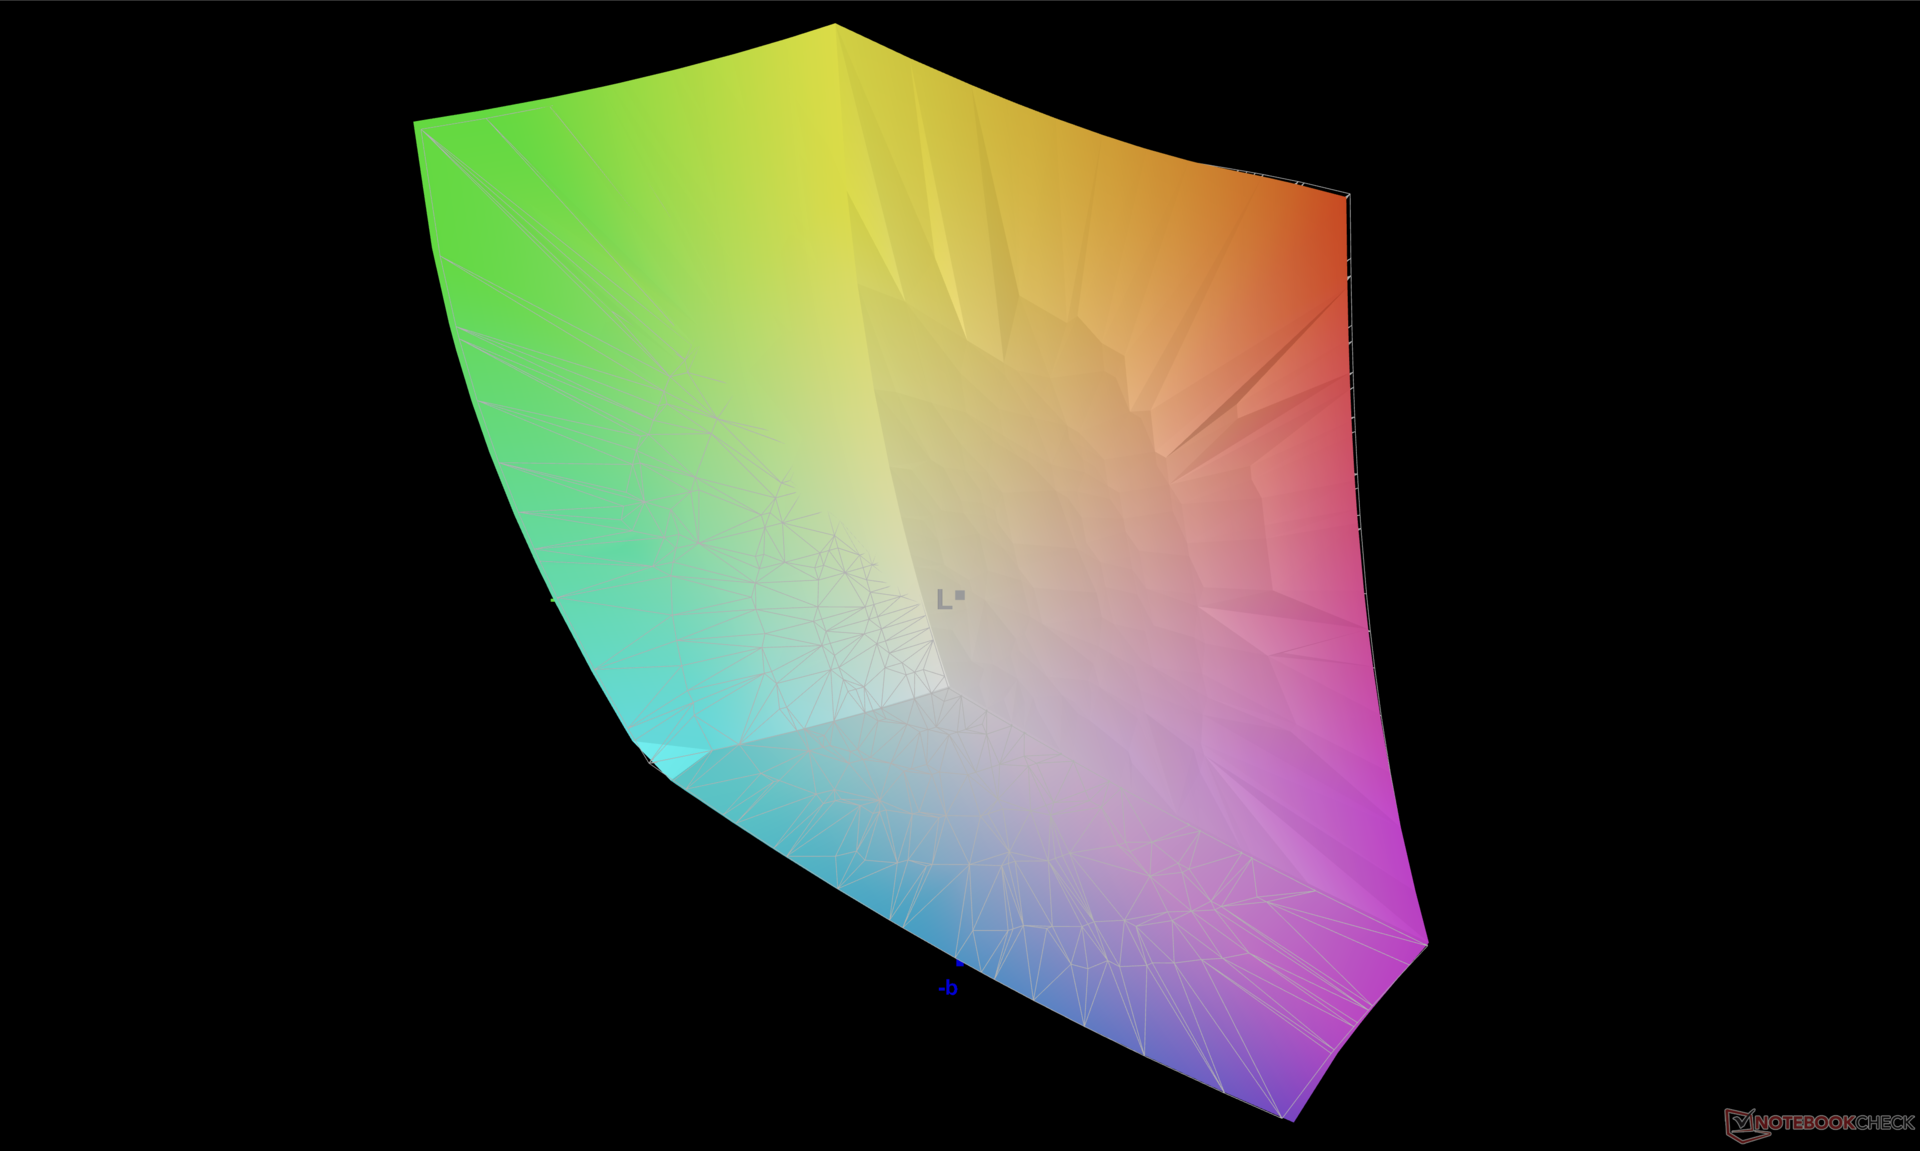
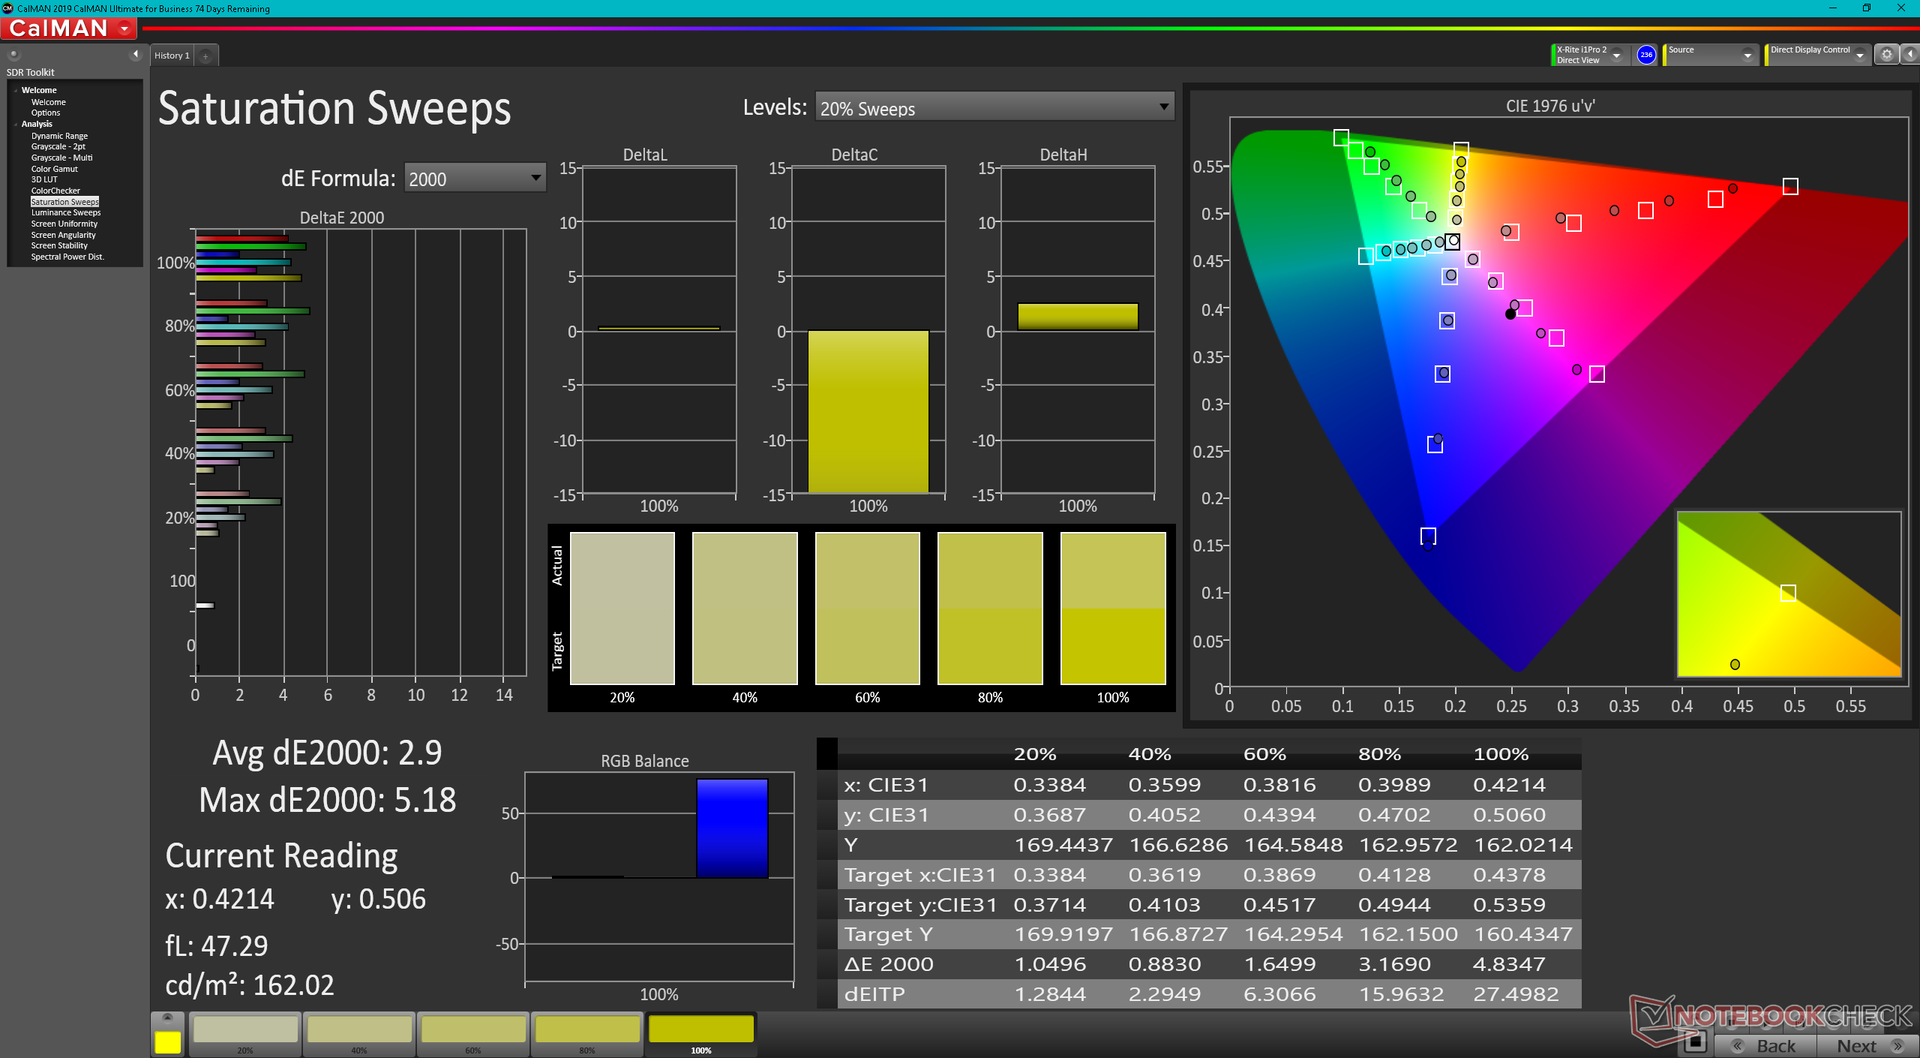
O painel é calibrado fora da caixa em relação ao padrão P3 com valores médios de escala de cinza e cor DeltaE de apenas 1,3 e 1,53, respectivamente. As cores parecem ser mais imprecisas a níveis de saturação mais altos do que a níveis de saturação mais baixos.
Exibir tempos de resposta
| ↔ Tempo de resposta preto para branco | ||
|---|---|---|
| 1.9 ms ... ascensão ↗ e queda ↘ combinadas | ↗ 0.8 ms ascensão | 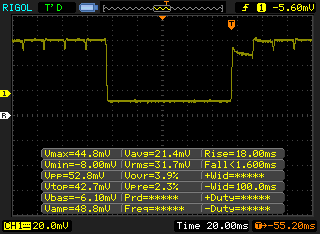 |
| ↘ 1.1 ms queda | ||
| A tela mostra taxas de resposta muito rápidas em nossos testes e deve ser muito adequada para jogos em ritmo acelerado. Em comparação, todos os dispositivos testados variam de 0.1 (mínimo) a 240 (máximo) ms. » 11 % de todos os dispositivos são melhores. Isso significa que o tempo de resposta medido é melhor que a média de todos os dispositivos testados (19.8 ms). | ||
| ↔ Tempo de resposta 50% cinza a 80% cinza | ||
| 2 ms ... ascensão ↗ e queda ↘ combinadas | ↗ 1 ms ascensão | 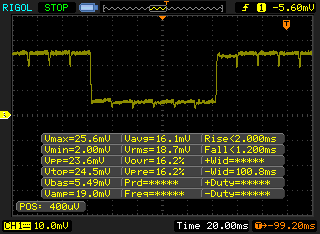 |
| ↘ 1 ms queda | ||
| A tela mostra taxas de resposta muito rápidas em nossos testes e deve ser muito adequada para jogos em ritmo acelerado. Em comparação, todos os dispositivos testados variam de 0.165 (mínimo) a 636 (máximo) ms. » 10 % de todos os dispositivos são melhores. Isso significa que o tempo de resposta medido é melhor que a média de todos os dispositivos testados (31 ms). | ||
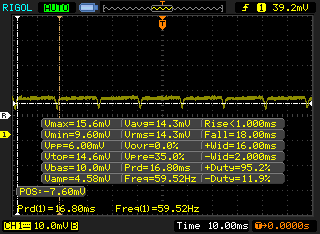
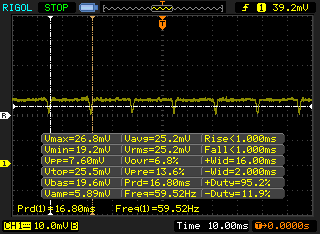
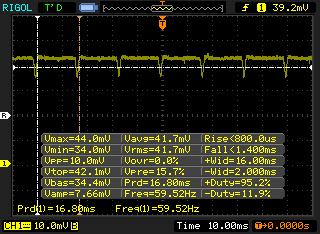
Cintilação da tela / PWM (modulação por largura de pulso)
| Tela tremeluzindo/PWM detectado | 240.4 Hz | ≤ 100 % configuração de brilho | 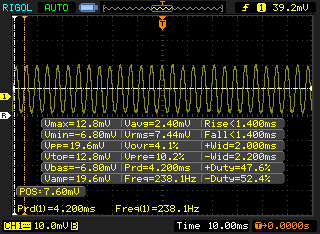 |
A luz de fundo da tela pisca em 240.4 Hz (pior caso, por exemplo, utilizando PWM) Cintilação detectada em uma configuração de brilho de 100 % e abaixo. Não deve haver cintilação ou PWM acima desta configuração de brilho. A frequência de 240.4 Hz é relativamente baixa, portanto, usuários sensíveis provavelmente notarão cintilação e sentirão fadiga ocular na configuração de brilho indicada e abaixo. [pwm_comparison] Em comparação: 52 % de todos os dispositivos testados não usam PWM para escurecer a tela. Se PWM foi detectado, uma média de 7757 (mínimo: 5 - máximo: 343500) Hz foi medida. | |||
A modulação cintilante ou de largura de pulso está presente em todos os níveis de luminosidade, como nos painéis OLED para os mais recentes Asus VivoBook ou computadores portáteis ZenBook. A freqüência é de 240,4 Hz de 0 a 40% de brilho e 60 Hz de 41% a 100% de brilho.


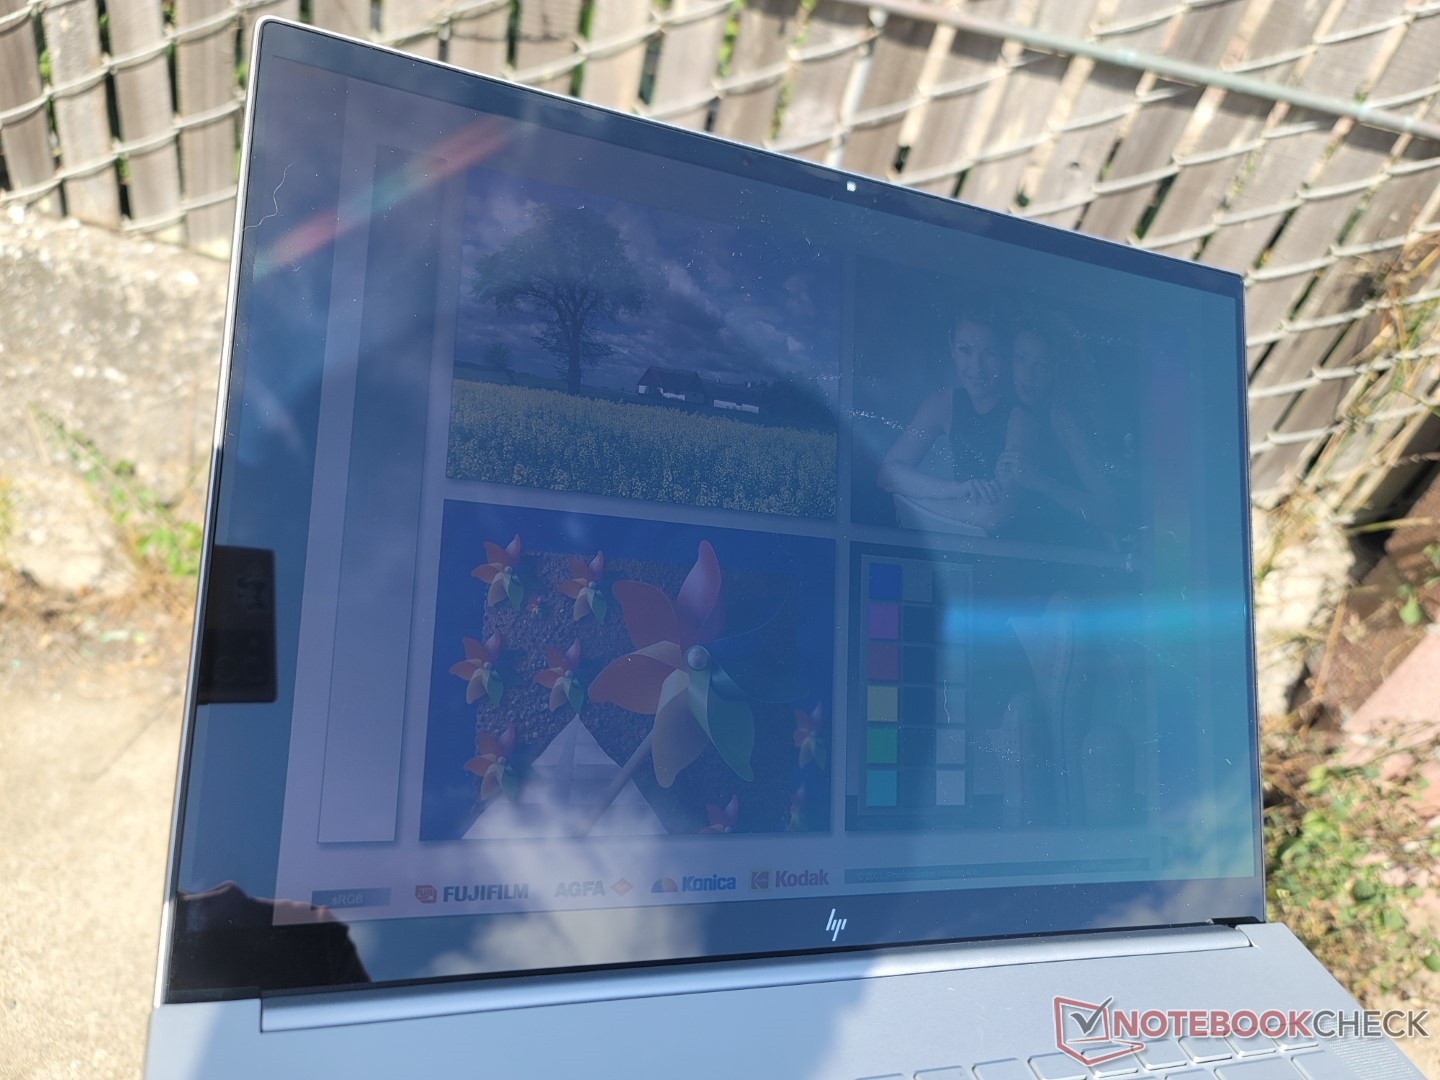
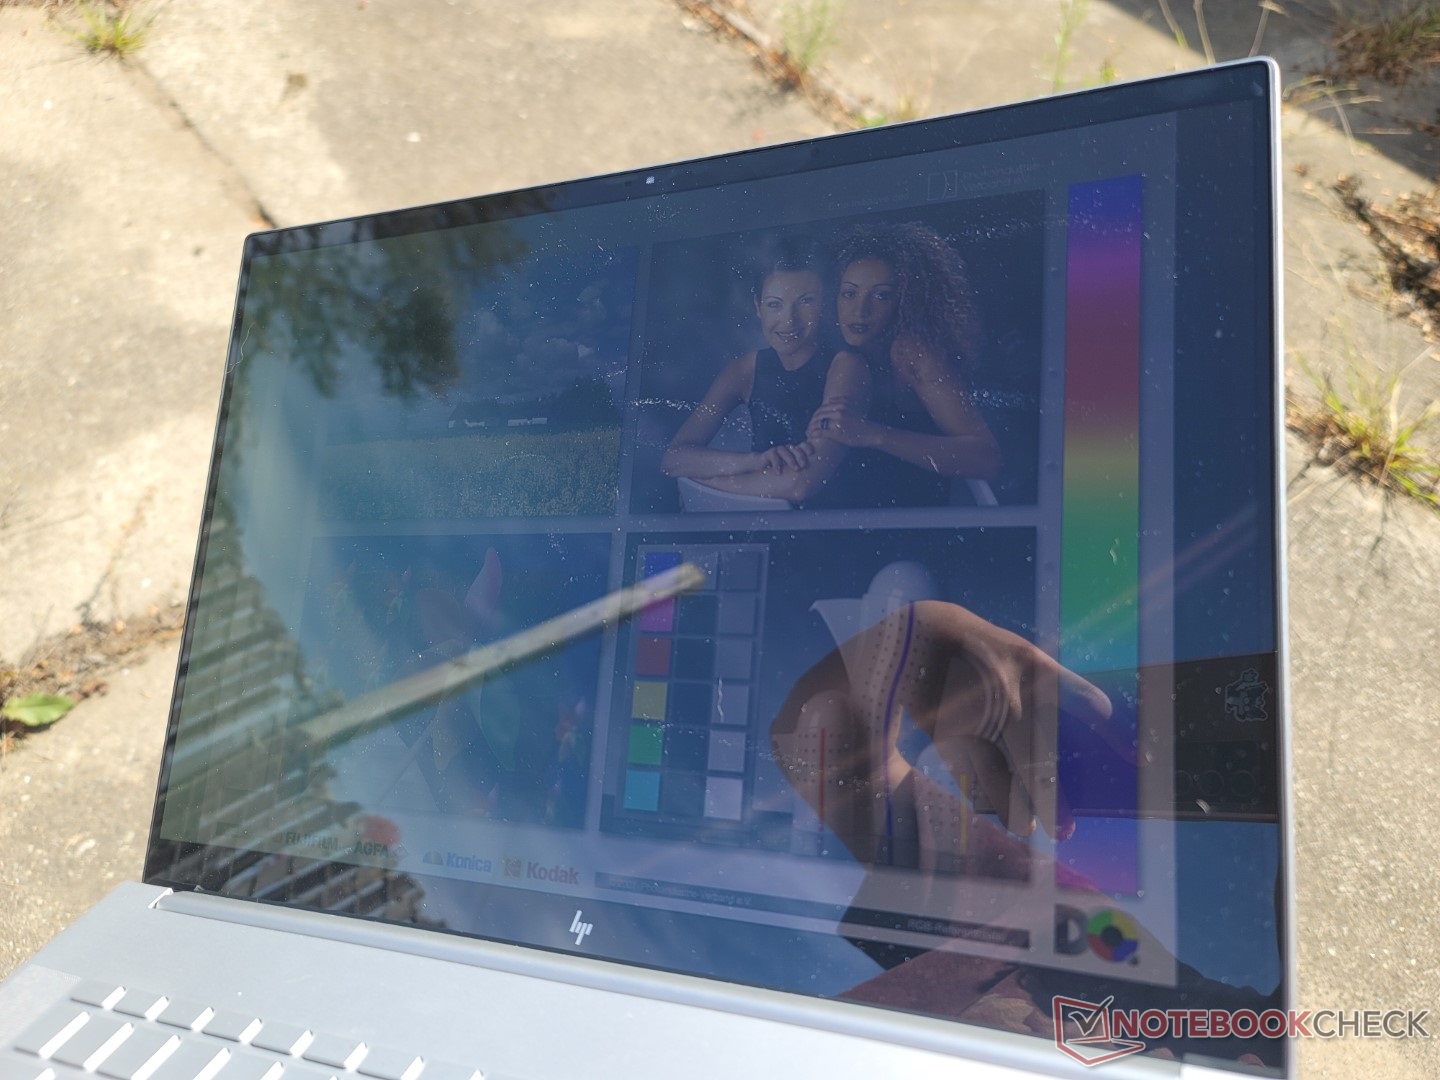
O ofuscamento é inevitável na maioria das condições externas. A tela brilhante não é tão brilhante quanto a tela do MacBook Pro 16. A um pouco acima de 320 lêndeas no máximo, este é um dos painéis OLED mais brilhantes do mercado.
Desempenho - Intel 12th Gen Core H
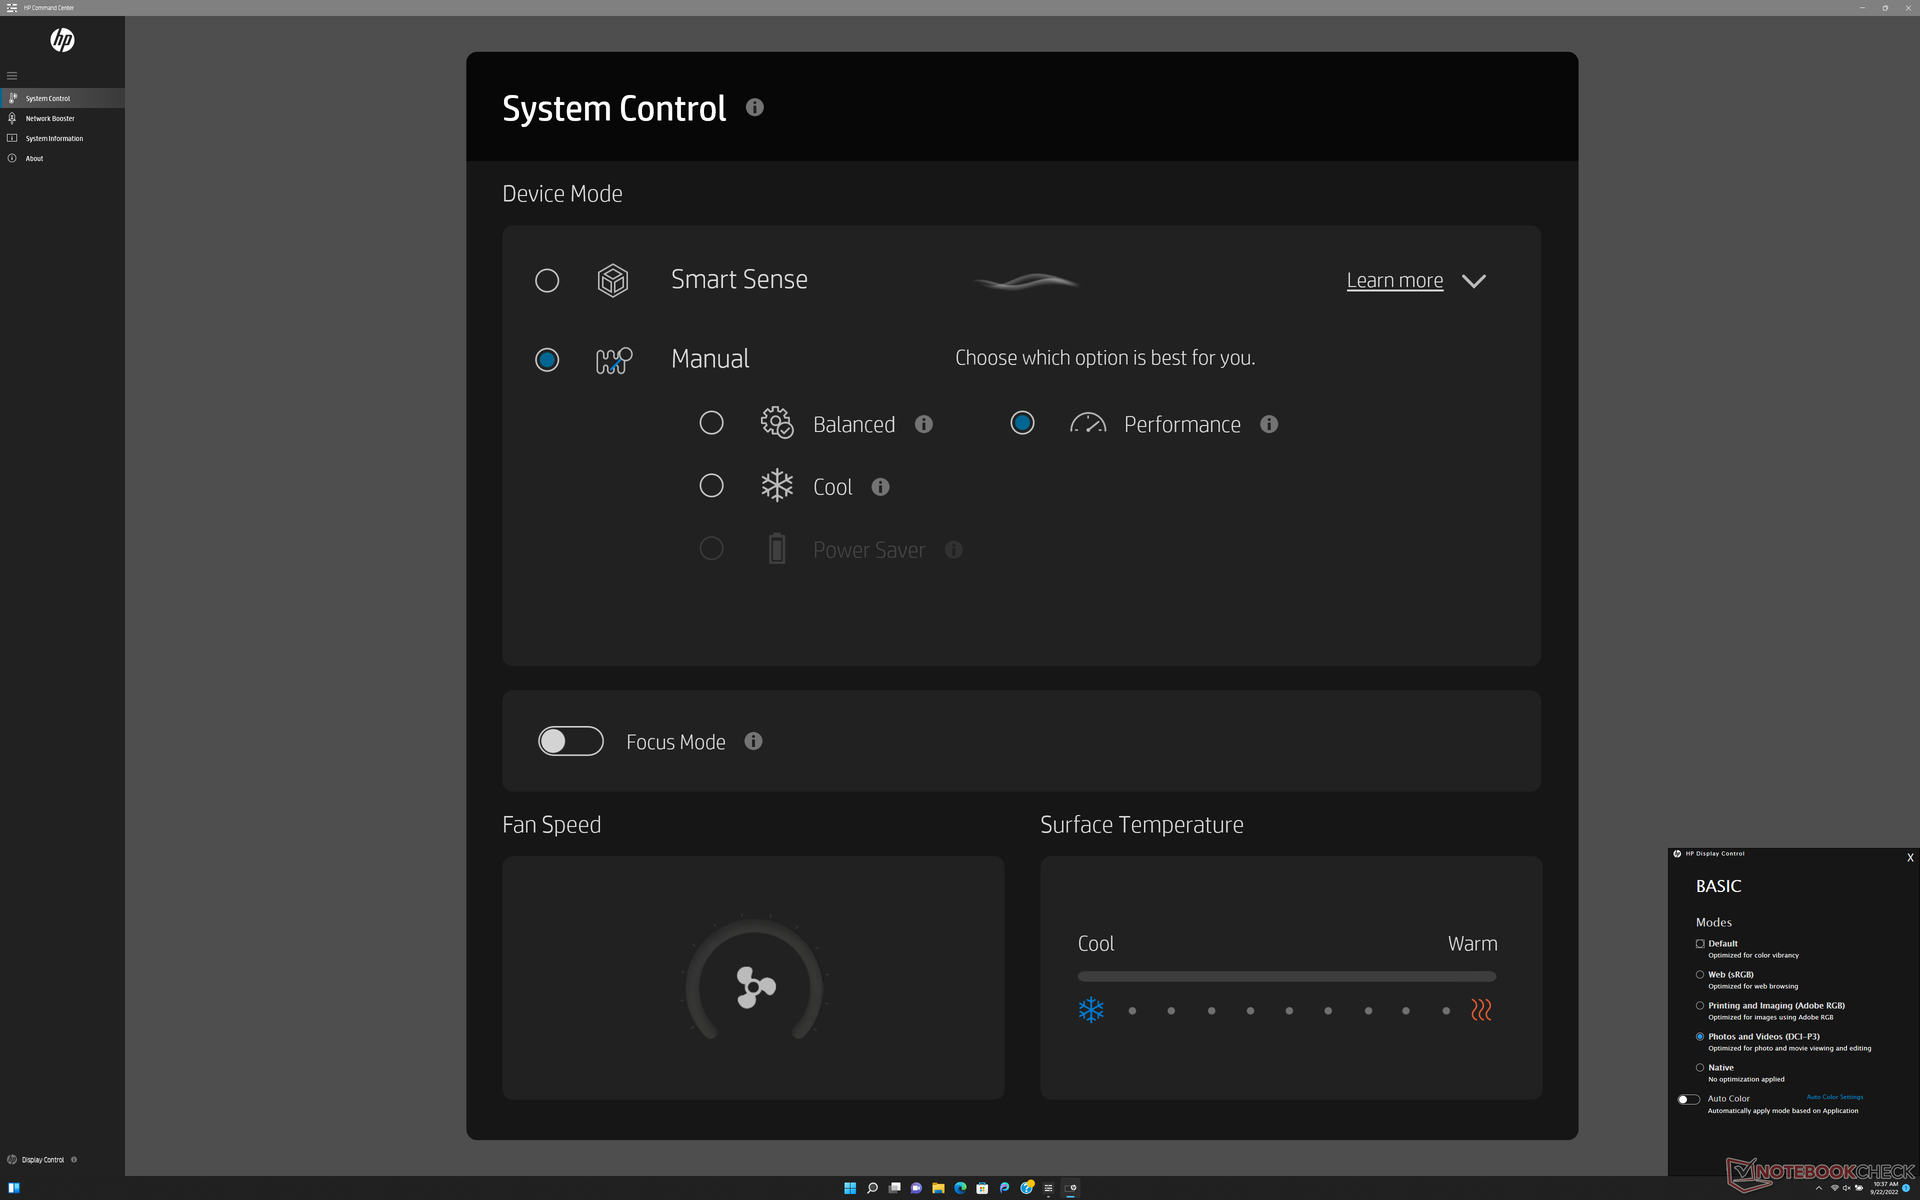
Condições de teste
Configuramos nossa unidade para o modo Performance através do Windows e do software HP Command Center antes de executar quaisquer benchmarks abaixo. O Centro de Comando HP é o centro de controle de perfis de potência e cores de exibição, conforme mostrado pela captura de tela abaixo.
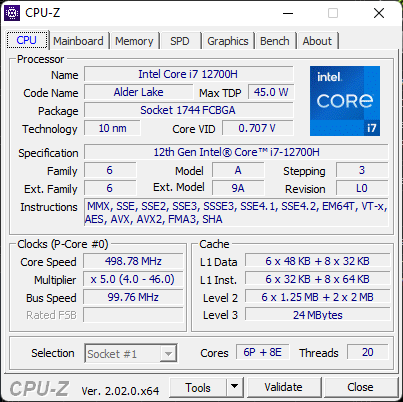
Processador
O desempenho multi-linhas é cerca de 15% mais lento do que a média dos laptops em nosso banco de dados equipados com o mesmo Núcleo i7-12700H CPU. A Lenovo Legion Slim 7 16, por exemplo, é capaz de executar o mesmo processador mais rapidamente mesmo depois de contabilizar qualquer estrangulamento. No entanto, o desempenho ainda é significativamente melhor que o da 10ª geração.Núcleo i7-10750H na inveja 2020 15 em cerca de 60%
Atualização para a Núcleo i9-12900H Espera-se que a SKU aumente o desempenho multi-tarefa em até 30 a 40% em relação à nossa SKU Core i7-12700H.
Cinebench R15 Multi Loop
Cinebench R23: Multi Core | Single Core
Cinebench R15: CPU Multi 64Bit | CPU Single 64Bit
Blender: v2.79 BMW27 CPU
7-Zip 18.03: 7z b 4 | 7z b 4 -mmt1
Geekbench 5.5: Multi-Core | Single-Core
HWBOT x265 Benchmark v2.2: 4k Preset
LibreOffice : 20 Documents To PDF
R Benchmark 2.5: Overall mean
Cinebench R23: Multi Core | Single Core
Cinebench R15: CPU Multi 64Bit | CPU Single 64Bit
Blender: v2.79 BMW27 CPU
7-Zip 18.03: 7z b 4 | 7z b 4 -mmt1
Geekbench 5.5: Multi-Core | Single-Core
HWBOT x265 Benchmark v2.2: 4k Preset
LibreOffice : 20 Documents To PDF
R Benchmark 2.5: Overall mean
* ... menor é melhor
AIDA64: FP32 Ray-Trace | FPU Julia | CPU SHA3 | CPU Queen | FPU SinJulia | FPU Mandel | CPU AES | CPU ZLib | FP64 Ray-Trace | CPU PhotoWorxx
| Performance rating | |
| Lenovo ThinkBook 16 G4+ IAP | |
| HP Envy 16 h0112nr | |
| MSI Creator Z16P B12UHST | |
| Média Intel Core i7-12700H | |
| Dell Inspiron 16 Plus 7610-MHJ8F | |
| Huawei MateBook 16s i7 | |
| AIDA64 / FP32 Ray-Trace | |
| Lenovo ThinkBook 16 G4+ IAP | |
| HP Envy 16 h0112nr | |
| Média Intel Core i7-12700H (2585 - 17957, n=64) | |
| Dell Inspiron 16 Plus 7610-MHJ8F | |
| MSI Creator Z16P B12UHST | |
| Huawei MateBook 16s i7 | |
| AIDA64 / FPU Julia | |
| Lenovo ThinkBook 16 G4+ IAP | |
| HP Envy 16 h0112nr | |
| Dell Inspiron 16 Plus 7610-MHJ8F | |
| Média Intel Core i7-12700H (12439 - 90760, n=64) | |
| MSI Creator Z16P B12UHST | |
| Huawei MateBook 16s i7 | |
| AIDA64 / CPU SHA3 | |
| Dell Inspiron 16 Plus 7610-MHJ8F | |
| Lenovo ThinkBook 16 G4+ IAP | |
| Média Intel Core i7-12700H (833 - 4242, n=64) | |
| MSI Creator Z16P B12UHST | |
| HP Envy 16 h0112nr | |
| Huawei MateBook 16s i7 | |
| AIDA64 / CPU Queen | |
| MSI Creator Z16P B12UHST | |
| Lenovo ThinkBook 16 G4+ IAP | |
| HP Envy 16 h0112nr | |
| Média Intel Core i7-12700H (57923 - 103202, n=63) | |
| Huawei MateBook 16s i7 | |
| Dell Inspiron 16 Plus 7610-MHJ8F | |
| AIDA64 / FPU SinJulia | |
| MSI Creator Z16P B12UHST | |
| Lenovo ThinkBook 16 G4+ IAP | |
| Média Intel Core i7-12700H (3249 - 9939, n=64) | |
| Dell Inspiron 16 Plus 7610-MHJ8F | |
| HP Envy 16 h0112nr | |
| Huawei MateBook 16s i7 | |
| AIDA64 / FPU Mandel | |
| Lenovo ThinkBook 16 G4+ IAP | |
| Dell Inspiron 16 Plus 7610-MHJ8F | |
| HP Envy 16 h0112nr | |
| Média Intel Core i7-12700H (7135 - 44760, n=64) | |
| MSI Creator Z16P B12UHST | |
| Huawei MateBook 16s i7 | |
| AIDA64 / CPU AES | |
| Dell Inspiron 16 Plus 7610-MHJ8F | |
| HP Envy 16 h0112nr | |
| MSI Creator Z16P B12UHST | |
| Média Intel Core i7-12700H (31839 - 144360, n=64) | |
| Lenovo ThinkBook 16 G4+ IAP | |
| Huawei MateBook 16s i7 | |
| AIDA64 / CPU ZLib | |
| MSI Creator Z16P B12UHST | |
| Lenovo ThinkBook 16 G4+ IAP | |
| Média Intel Core i7-12700H (305 - 1171, n=64) | |
| HP Envy 16 h0112nr | |
| Dell Inspiron 16 Plus 7610-MHJ8F | |
| Huawei MateBook 16s i7 | |
| AIDA64 / FP64 Ray-Trace | |
| Lenovo ThinkBook 16 G4+ IAP | |
| HP Envy 16 h0112nr | |
| Média Intel Core i7-12700H (1437 - 9692, n=64) | |
| Dell Inspiron 16 Plus 7610-MHJ8F | |
| MSI Creator Z16P B12UHST | |
| Huawei MateBook 16s i7 | |
| AIDA64 / CPU PhotoWorxx | |
| Huawei MateBook 16s i7 | |
| MSI Creator Z16P B12UHST | |
| Lenovo ThinkBook 16 G4+ IAP | |
| HP Envy 16 h0112nr | |
| Média Intel Core i7-12700H (12863 - 52207, n=64) | |
| Dell Inspiron 16 Plus 7610-MHJ8F | |
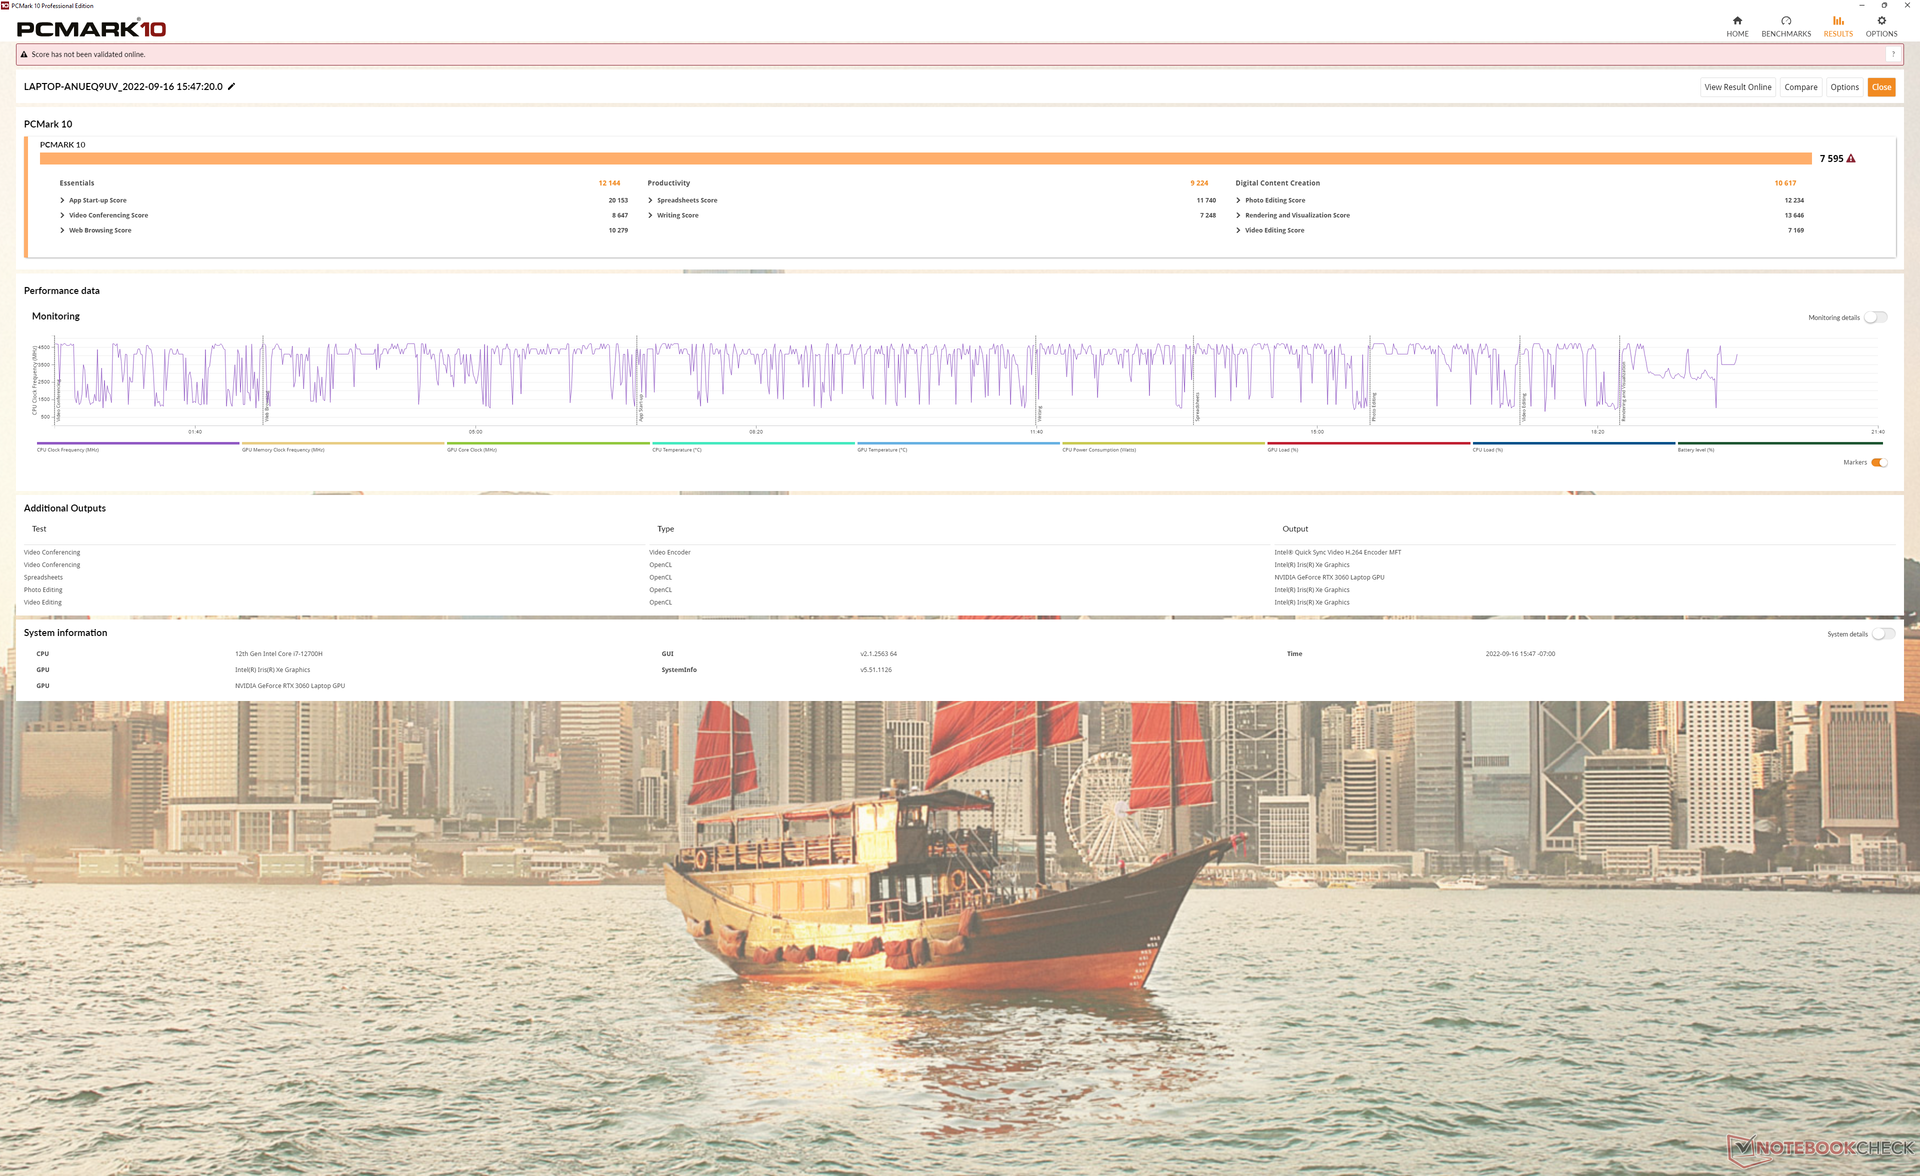
Desempenho do sistema
Os resultados da PCMark estão consistentemente à frente da inveja 2020 15 por amplas margens. Suspeitamos que o afastamento da Intel Optane desempenhou um grande papel no aumento da pontuação.
CrossMark: Overall | Productivity | Creativity | Responsiveness
| PCMark 10 / Score | |
| MSI Creator Z16P B12UHST | |
| HP Envy 16 h0112nr | |
| Média Intel Core i7-12700H, NVIDIA GeForce RTX 3060 Laptop GPU (5986 - 8156, n=12) | |
| Huawei MateBook 16s i7 | |
| HP Envy 15-ep0098nr | |
| Dell Inspiron 16 Plus 7610-MHJ8F | |
| PCMark 10 / Essentials | |
| HP Envy 16 h0112nr | |
| Huawei MateBook 16s i7 | |
| MSI Creator Z16P B12UHST | |
| Média Intel Core i7-12700H, NVIDIA GeForce RTX 3060 Laptop GPU (9289 - 12144, n=12) | |
| Dell Inspiron 16 Plus 7610-MHJ8F | |
| HP Envy 15-ep0098nr | |
| PCMark 10 / Productivity | |
| MSI Creator Z16P B12UHST | |
| HP Envy 16 h0112nr | |
| Média Intel Core i7-12700H, NVIDIA GeForce RTX 3060 Laptop GPU (6161 - 10362, n=12) | |
| Huawei MateBook 16s i7 | |
| HP Envy 15-ep0098nr | |
| Dell Inspiron 16 Plus 7610-MHJ8F | |
| PCMark 10 / Digital Content Creation | |
| MSI Creator Z16P B12UHST | |
| Média Intel Core i7-12700H, NVIDIA GeForce RTX 3060 Laptop GPU (8950 - 12554, n=12) | |
| HP Envy 16 h0112nr | |
| Huawei MateBook 16s i7 | |
| HP Envy 15-ep0098nr | |
| Dell Inspiron 16 Plus 7610-MHJ8F | |
| CrossMark / Overall | |
| Huawei MateBook 16s i7 | |
| HP Envy 16 h0112nr | |
| Média Intel Core i7-12700H, NVIDIA GeForce RTX 3060 Laptop GPU (1649 - 2017, n=11) | |
| Lenovo ThinkBook 16 G4+ IAP | |
| Apple MacBook Pro 16 2021 M1 Pro | |
| CrossMark / Productivity | |
| Huawei MateBook 16s i7 | |
| HP Envy 16 h0112nr | |
| Média Intel Core i7-12700H, NVIDIA GeForce RTX 3060 Laptop GPU (1536 - 1958, n=11) | |
| Lenovo ThinkBook 16 G4+ IAP | |
| Apple MacBook Pro 16 2021 M1 Pro | |
| CrossMark / Creativity | |
| Apple MacBook Pro 16 2021 M1 Pro | |
| HP Envy 16 h0112nr | |
| Huawei MateBook 16s i7 | |
| Lenovo ThinkBook 16 G4+ IAP | |
| Média Intel Core i7-12700H, NVIDIA GeForce RTX 3060 Laptop GPU (1816 - 2084, n=11) | |
| CrossMark / Responsiveness | |
| Huawei MateBook 16s i7 | |
| Média Intel Core i7-12700H, NVIDIA GeForce RTX 3060 Laptop GPU (1210 - 2207, n=11) | |
| HP Envy 16 h0112nr | |
| Lenovo ThinkBook 16 G4+ IAP | |
| Apple MacBook Pro 16 2021 M1 Pro | |
| PCMark 10 Score | 7595 pontos | |
Ajuda | ||
| AIDA64 / Memory Copy | |
| Huawei MateBook 16s i7 | |
| Lenovo ThinkBook 16 G4+ IAP | |
| MSI Creator Z16P B12UHST | |
| HP Envy 16 h0112nr | |
| Média Intel Core i7-12700H (25615 - 80511, n=64) | |
| Dell Inspiron 16 Plus 7610-MHJ8F | |
| AIDA64 / Memory Read | |
| Lenovo ThinkBook 16 G4+ IAP | |
| Huawei MateBook 16s i7 | |
| MSI Creator Z16P B12UHST | |
| HP Envy 16 h0112nr | |
| Média Intel Core i7-12700H (25586 - 79442, n=64) | |
| Dell Inspiron 16 Plus 7610-MHJ8F | |
| AIDA64 / Memory Write | |
| MSI Creator Z16P B12UHST | |
| Huawei MateBook 16s i7 | |
| HP Envy 16 h0112nr | |
| Lenovo ThinkBook 16 G4+ IAP | |
| Média Intel Core i7-12700H (23679 - 88660, n=64) | |
| Dell Inspiron 16 Plus 7610-MHJ8F | |
| AIDA64 / Memory Latency | |
| Lenovo ThinkBook 16 G4+ IAP | |
| Huawei MateBook 16s i7 | |
| Dell Inspiron 16 Plus 7610-MHJ8F | |
| MSI Creator Z16P B12UHST | |
| HP Envy 16 h0112nr | |
| Média Intel Core i7-12700H (76.2 - 133.9, n=62) | |
* ... menor é melhor
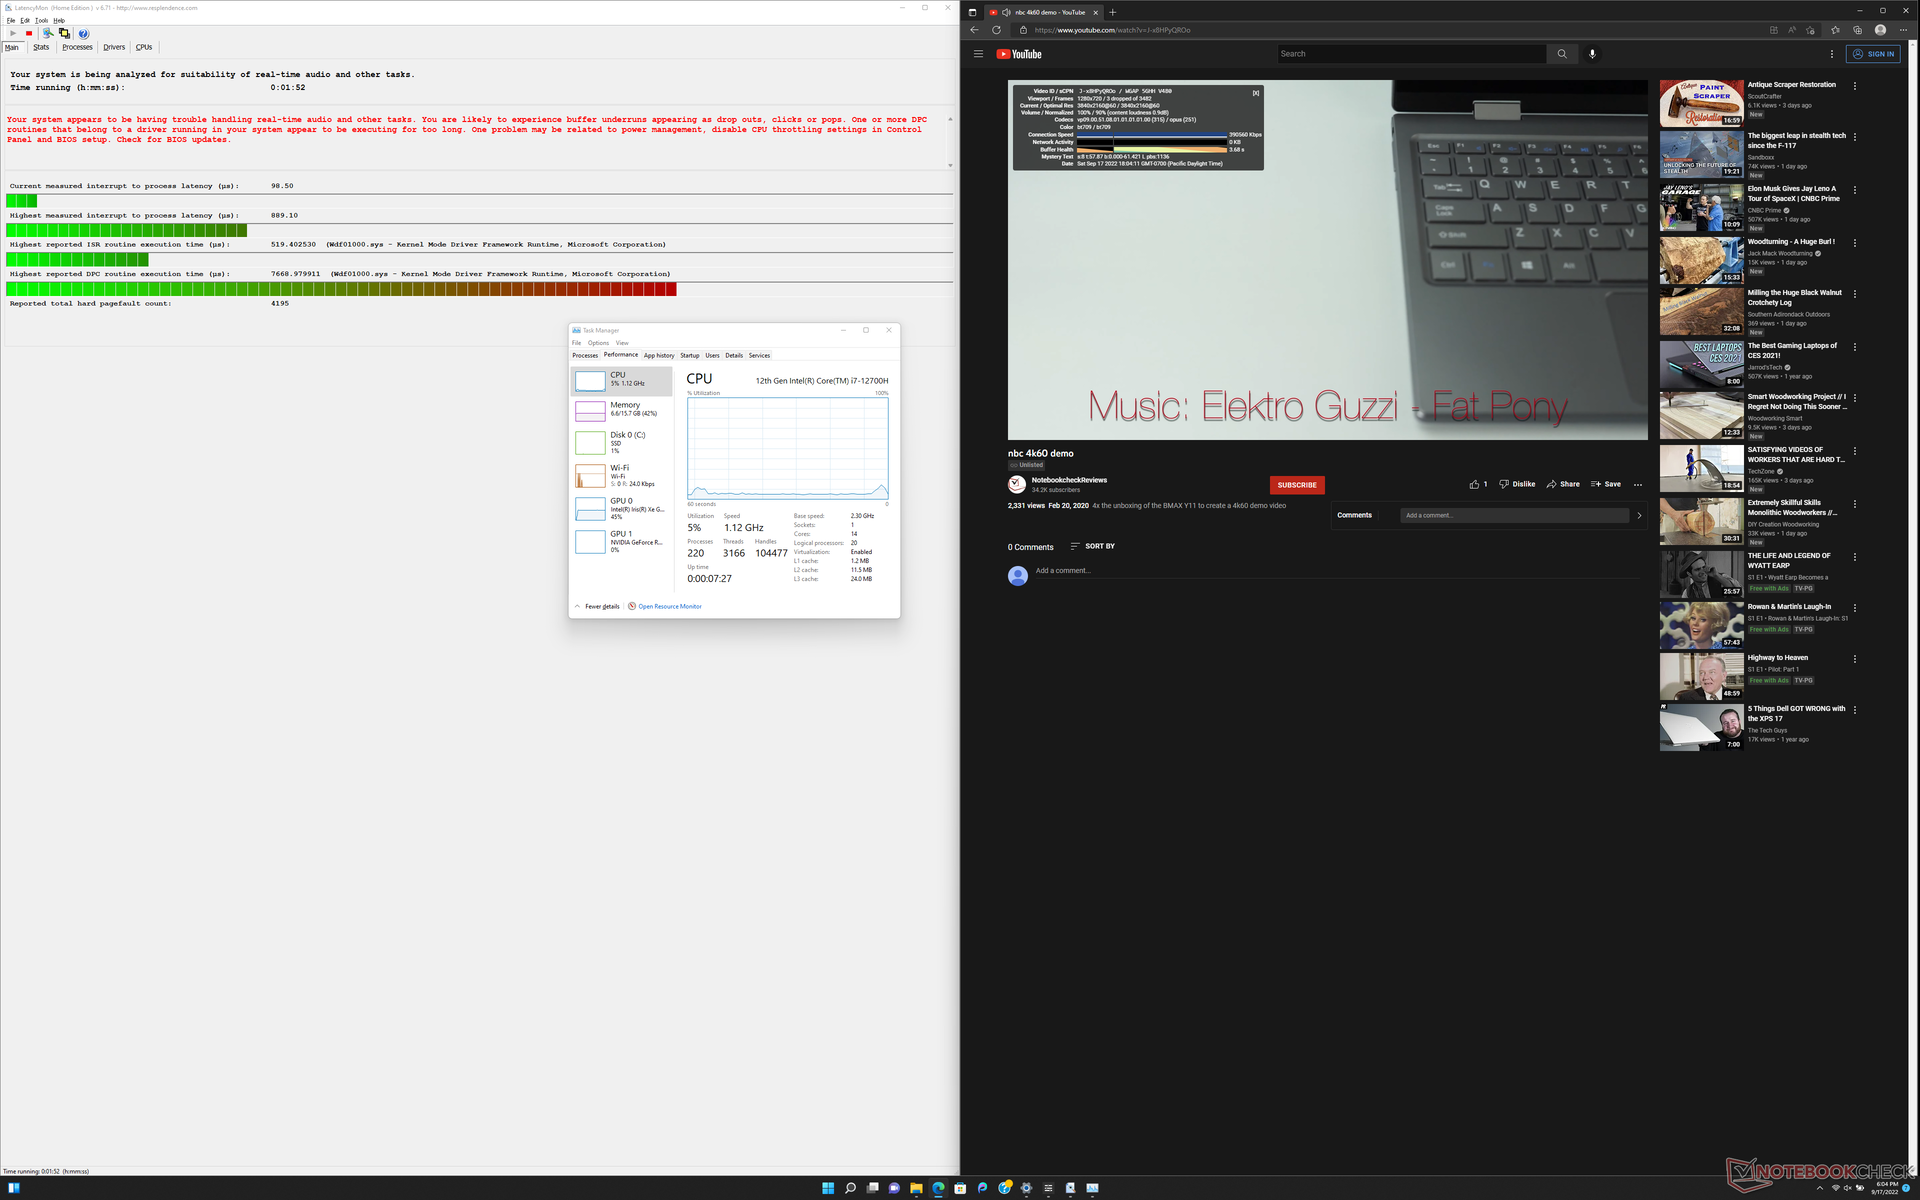
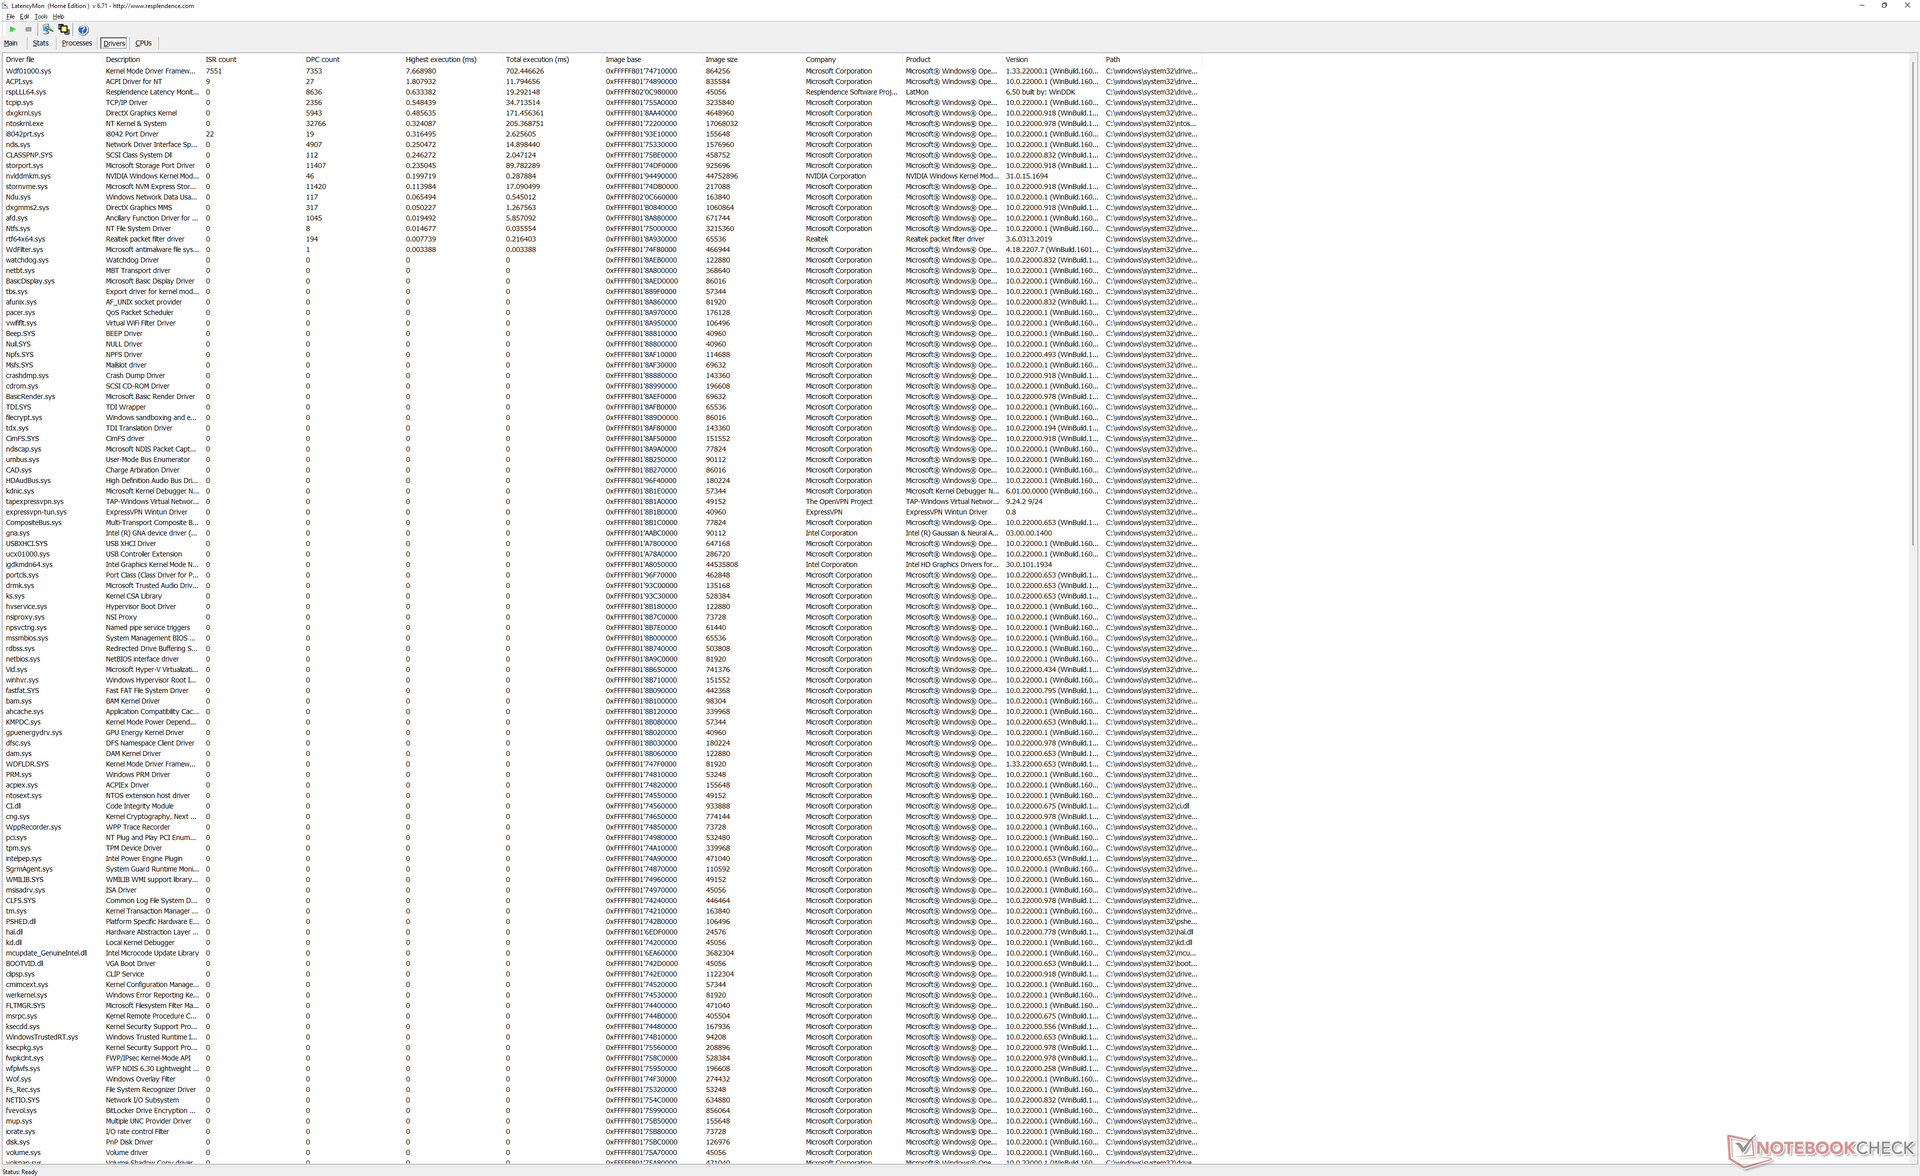
Latência do DPC
LatencyMon revela problemas de DPC ao abrir várias abas do navegador em nossa página inicial. a reprodução do vídeo de 4K a 60 FPS é imperfeita, assim como 3 quadros descartados durante nosso vídeo de teste de minutos.
| DPC Latencies / LatencyMon - interrupt to process latency (max), Web, Youtube, Prime95 | |
| Lenovo ThinkBook 16 G4+ IAP | |
| HP Envy 16 h0112nr | |
| MSI Creator Z16P B12UHST | |
* ... menor é melhor
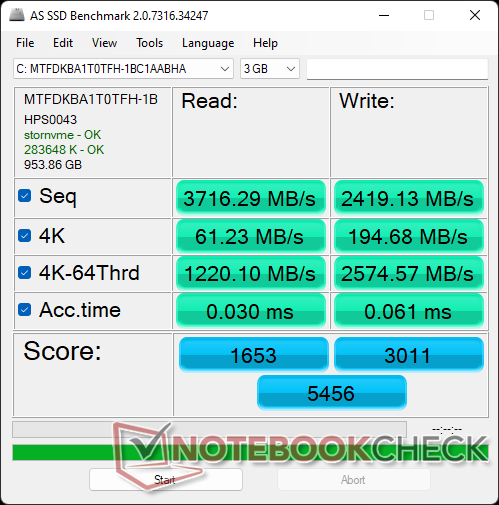
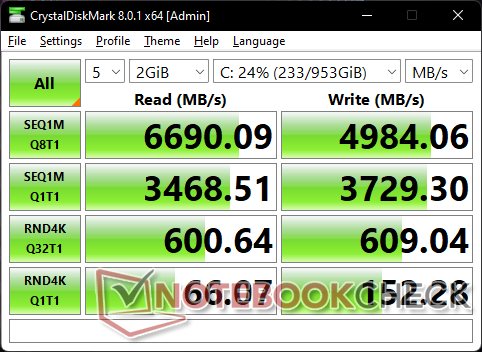
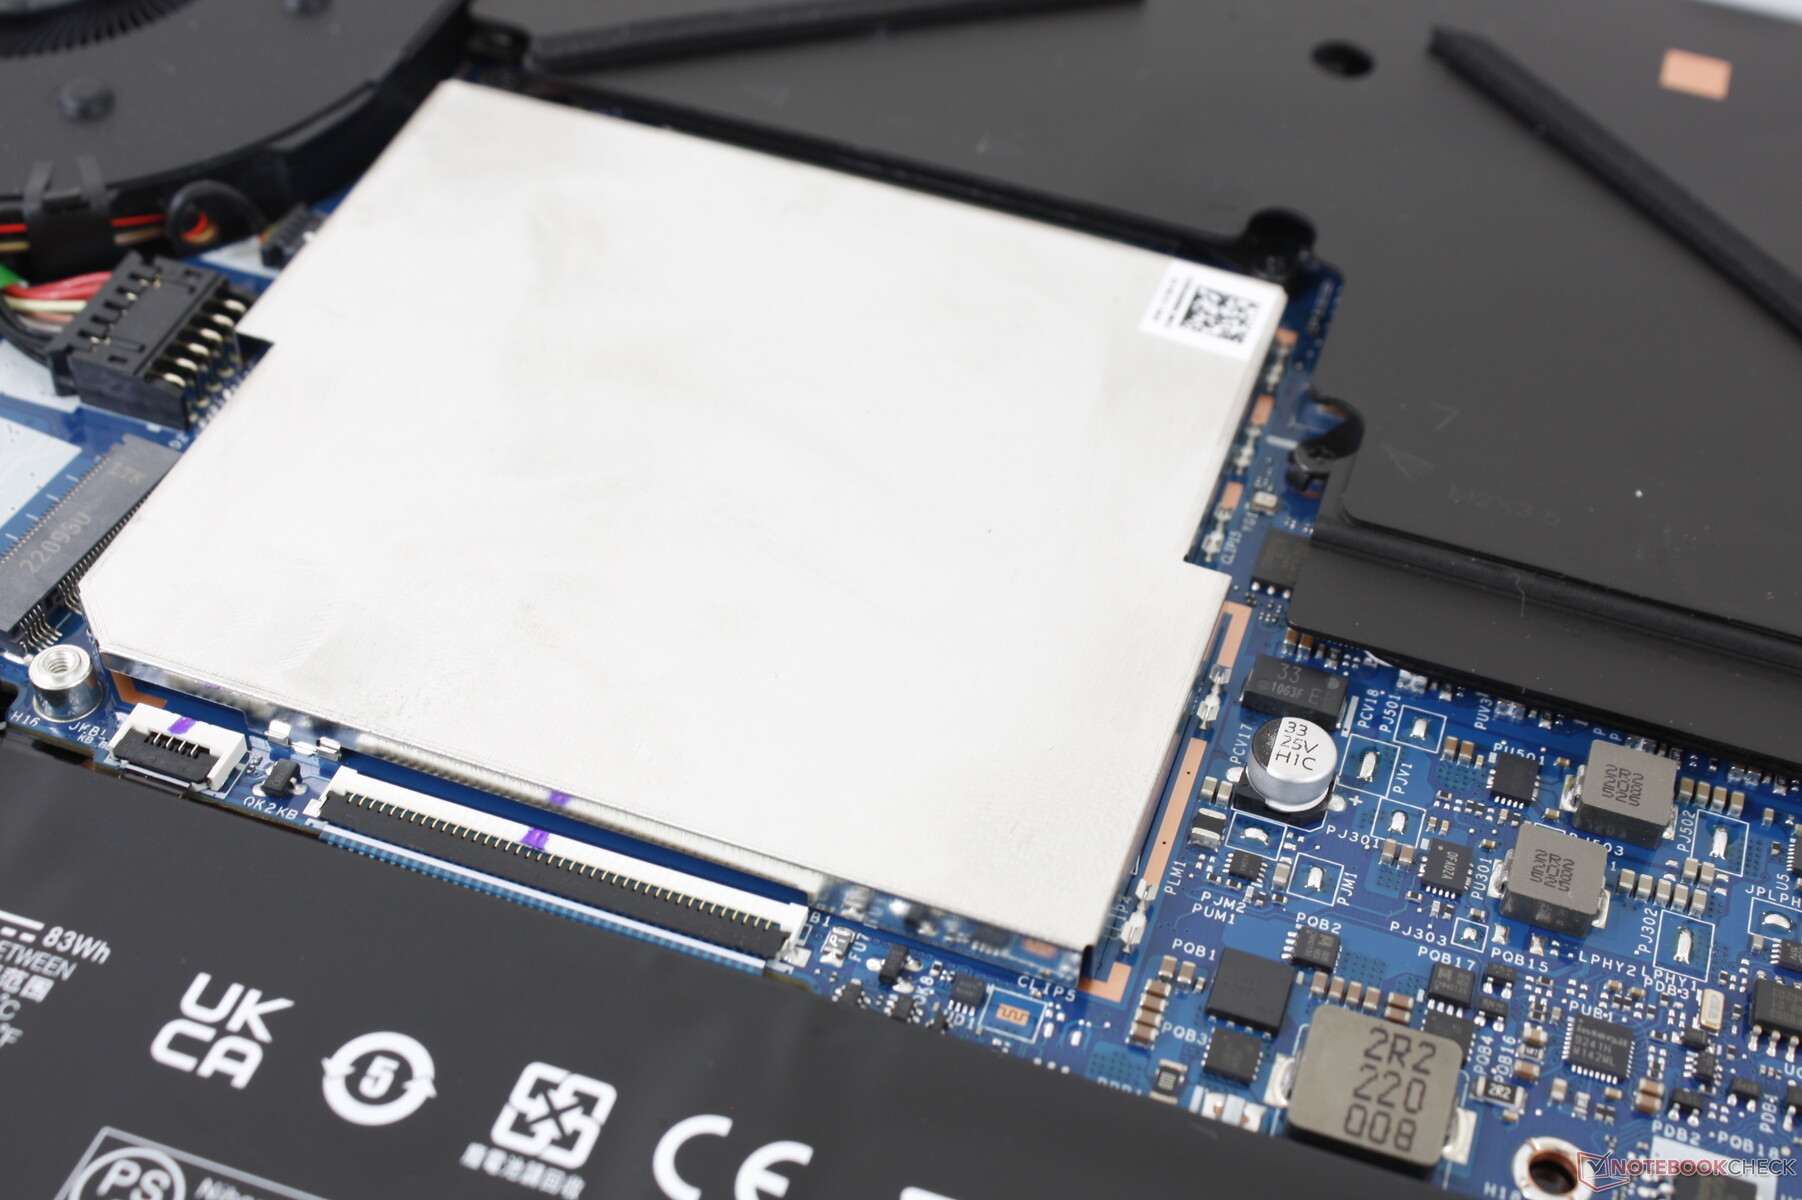
Dispositivos de armazenamento - Suporte RAID 0
Nossa unidade de teste é enviada com o mesmoMicron 3400 PCIe4 x4 NVMe SSD como encontrado em muitos outros sistemas high-end, incluindo o MSI Stealth GS77 ou HP Spectre x360 13,5. A unidade não apresenta problemas de estrangulamento em nossa unidade de teste, mas as taxas de gravação não são tão rápidas como na série concorrente Samsung PM9A1.
A HP inclui apenas uma tampa SSD, apesar de ter dois slots SSD. Se você planeja instalar um segundo drive, então há uma boa chance de que ele possa funcionar em temperaturas mais quentes.

| Drive Performance rating - Percent | |
| MSI Creator Z16P B12UHST | |
| HP Envy 16 h0112nr | |
| Huawei MateBook 16s i7 | |
| Lenovo ThinkBook 16 G4+ IAP | |
| Dell Inspiron 16 Plus 7610-MHJ8F -1! | |
* ... menor é melhor
Disk Throttling: DiskSpd Read Loop, Queue Depth 8
GPU Performance - 95 W TGP GeForce RTX 3060
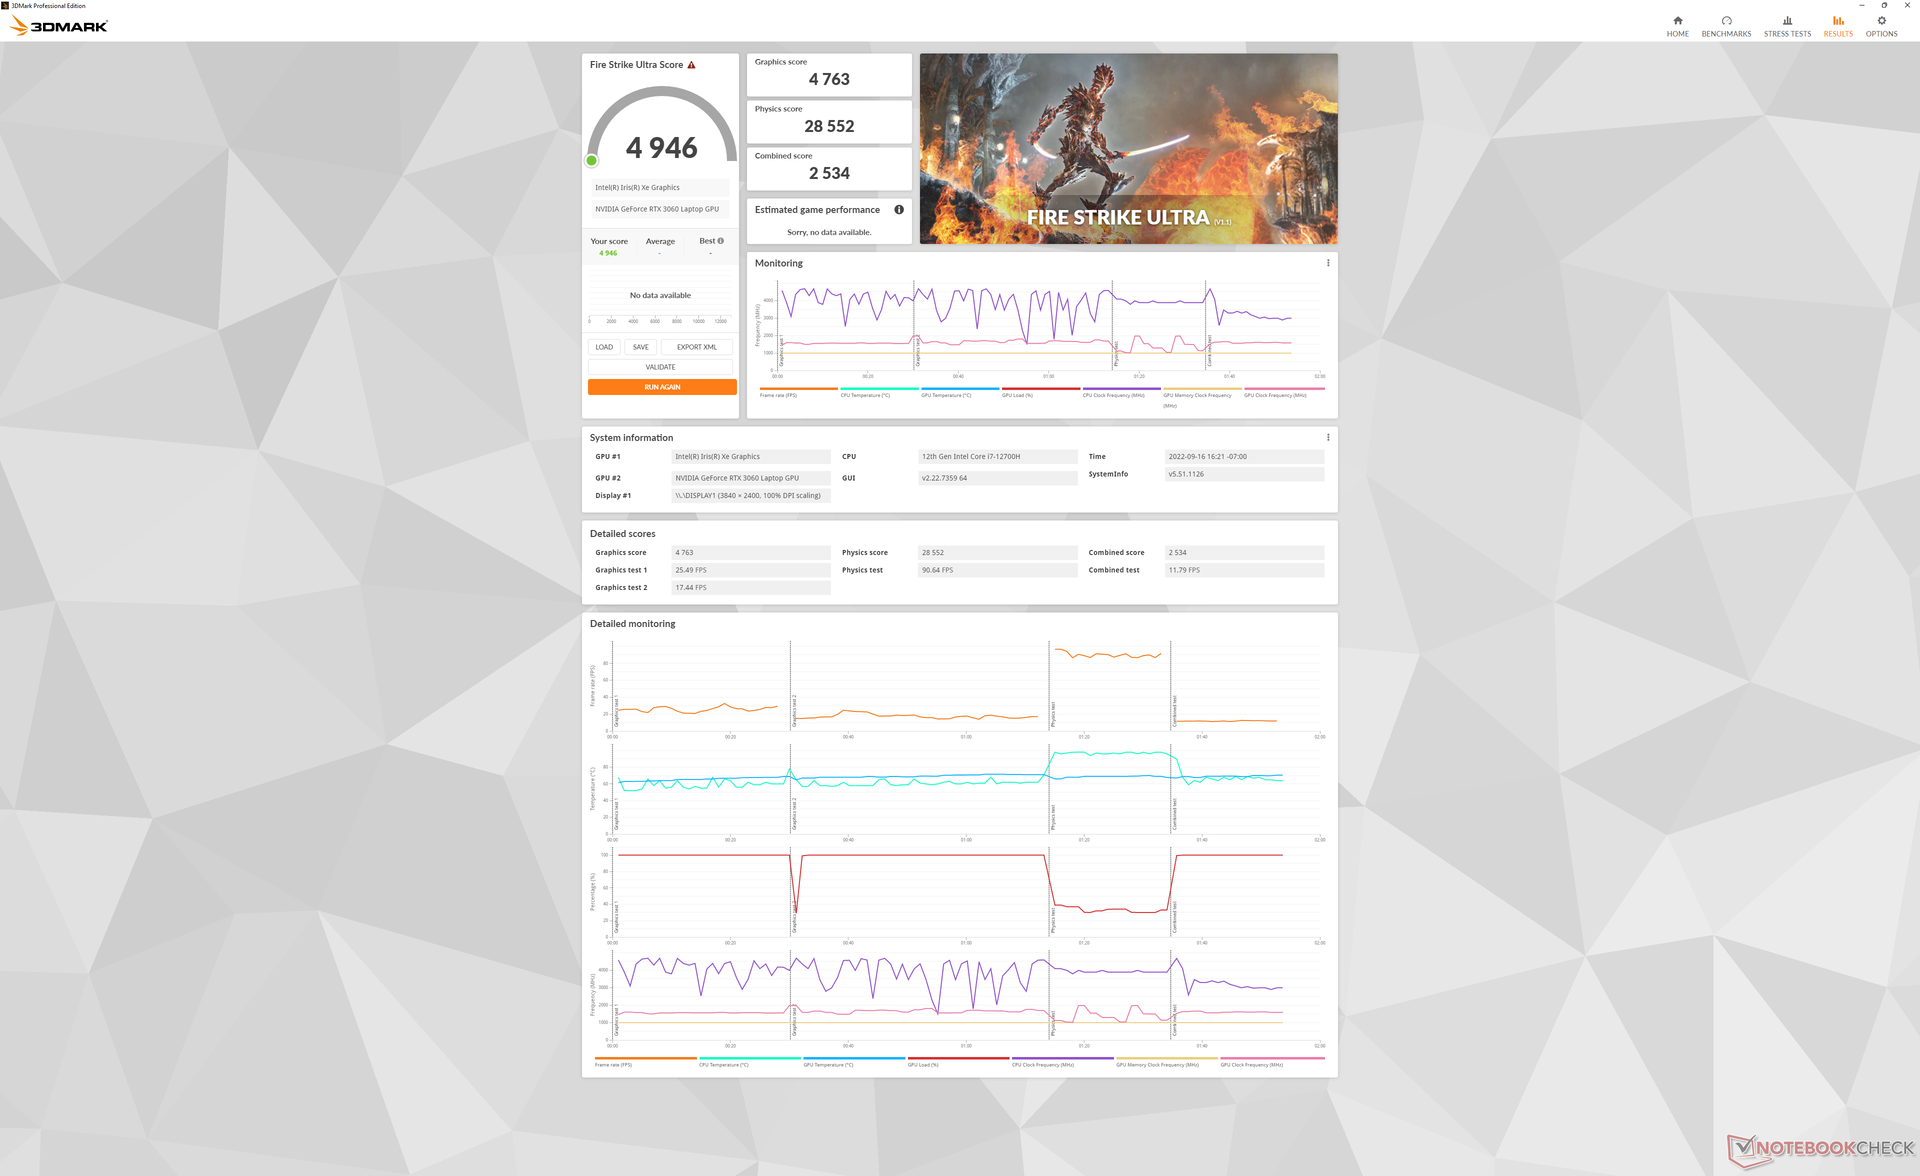
O desempenho gráfico é cerca de 5% mais lento do que a média do laptop em nosso banco de dados equipado com o mesmo GeForce RTX 3060. O déficit é pequeno o suficiente para que os usuários provavelmente não percebam.
Atualização a partir do menor Arco A370M para a opção GeForce RTX 3060 irá colocar os usuários na rede mais de 2x o desempenho gráfico bruto.
A execução no modo Balanceado ao invés do modo Performance reduz o desempenho gráfico em 6% para ventiladores muito mais silenciosos, conforme detalhado em nossa seção Ruído do Sistema.
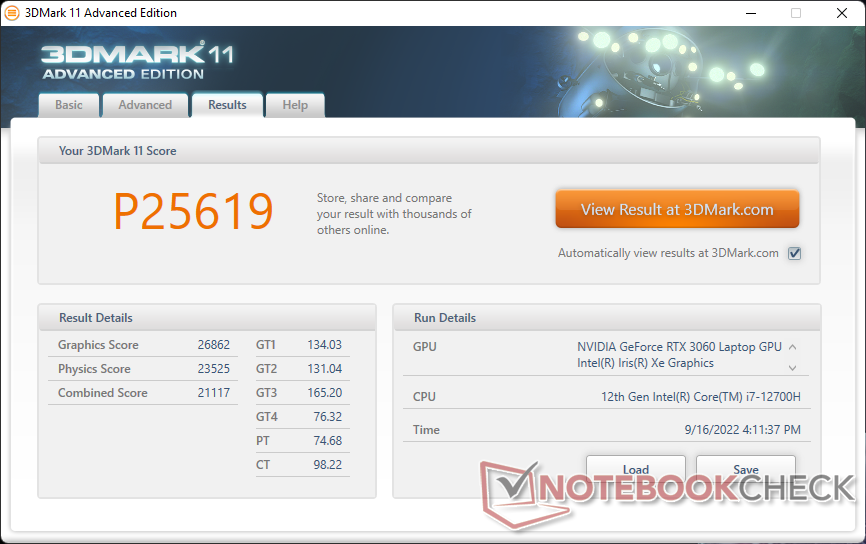
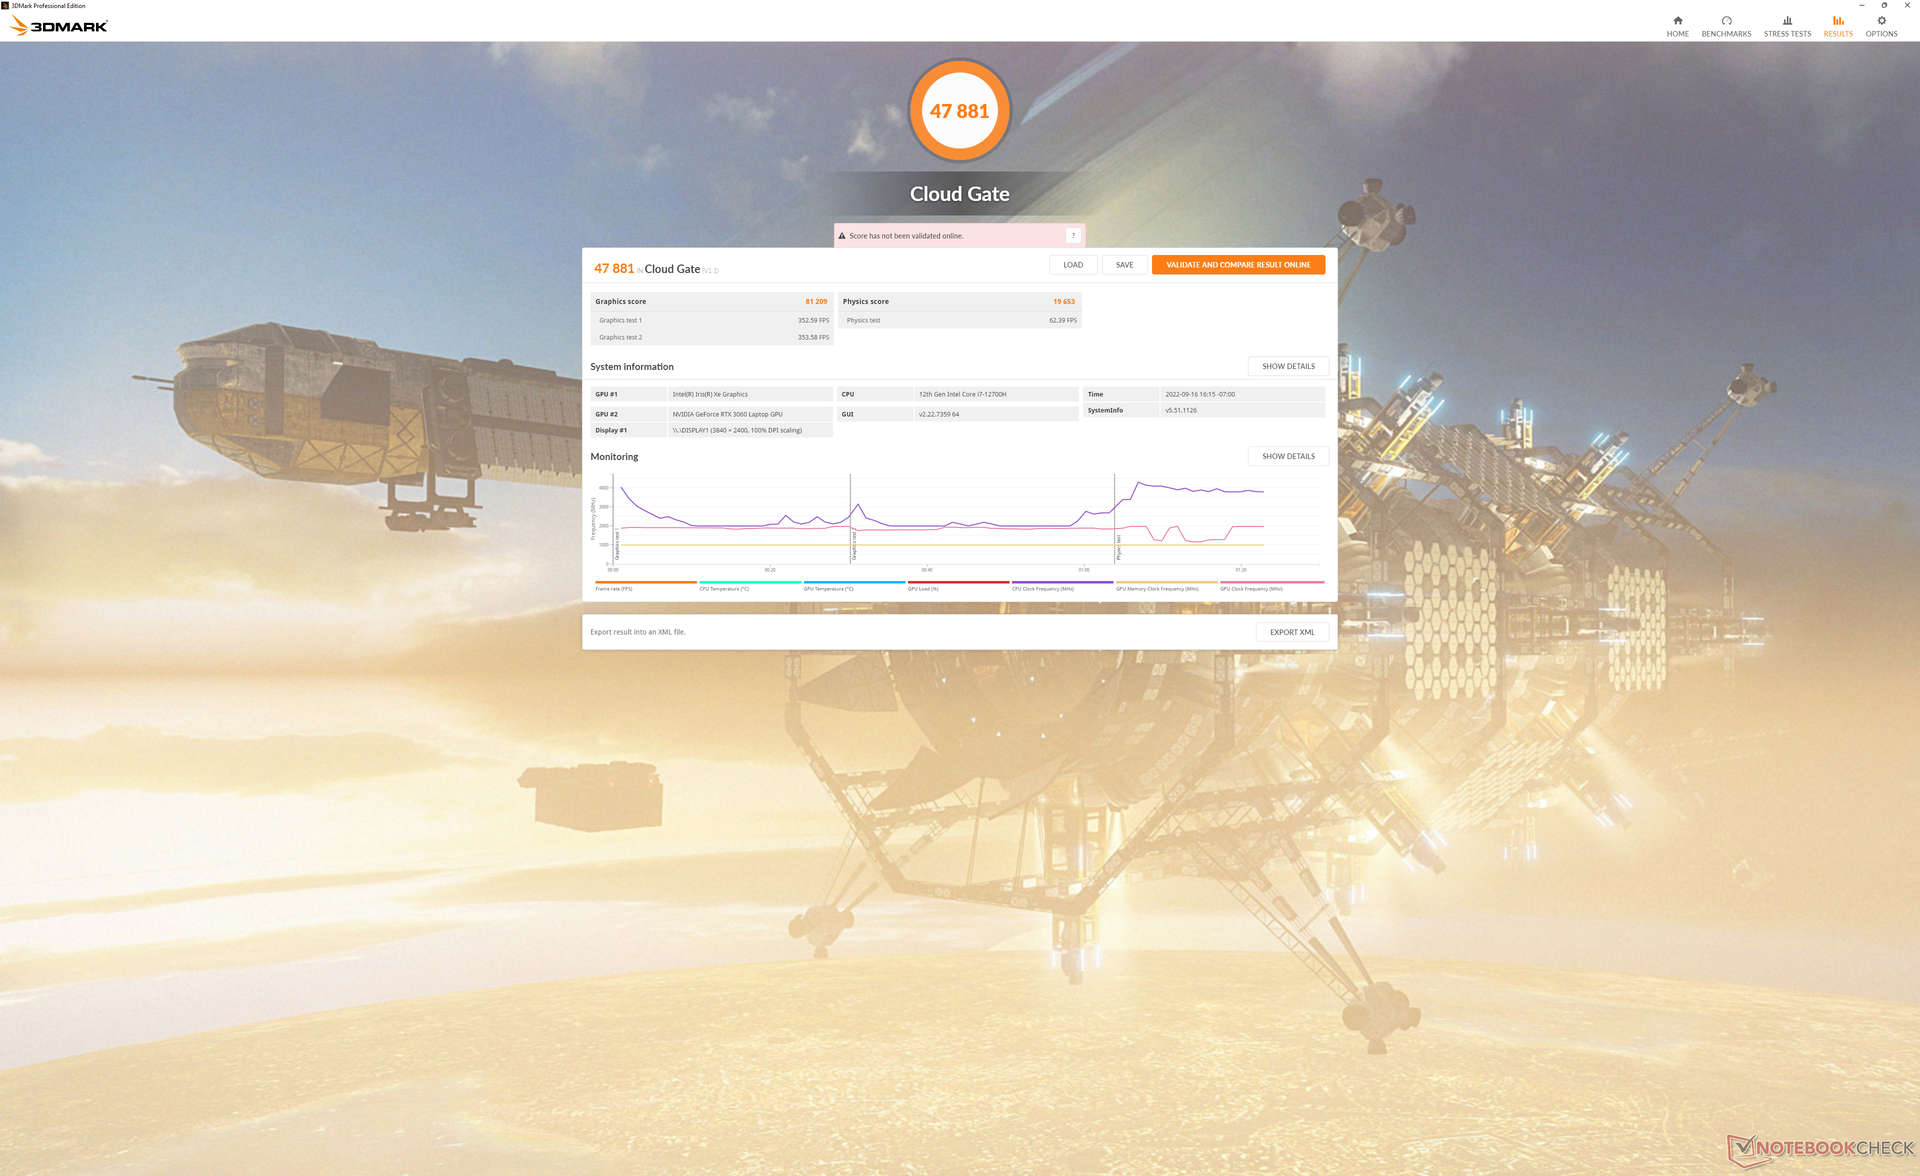

| 3DMark 11 Performance | 25619 pontos | |
| 3DMark Cloud Gate Standard Score | 47881 pontos | |
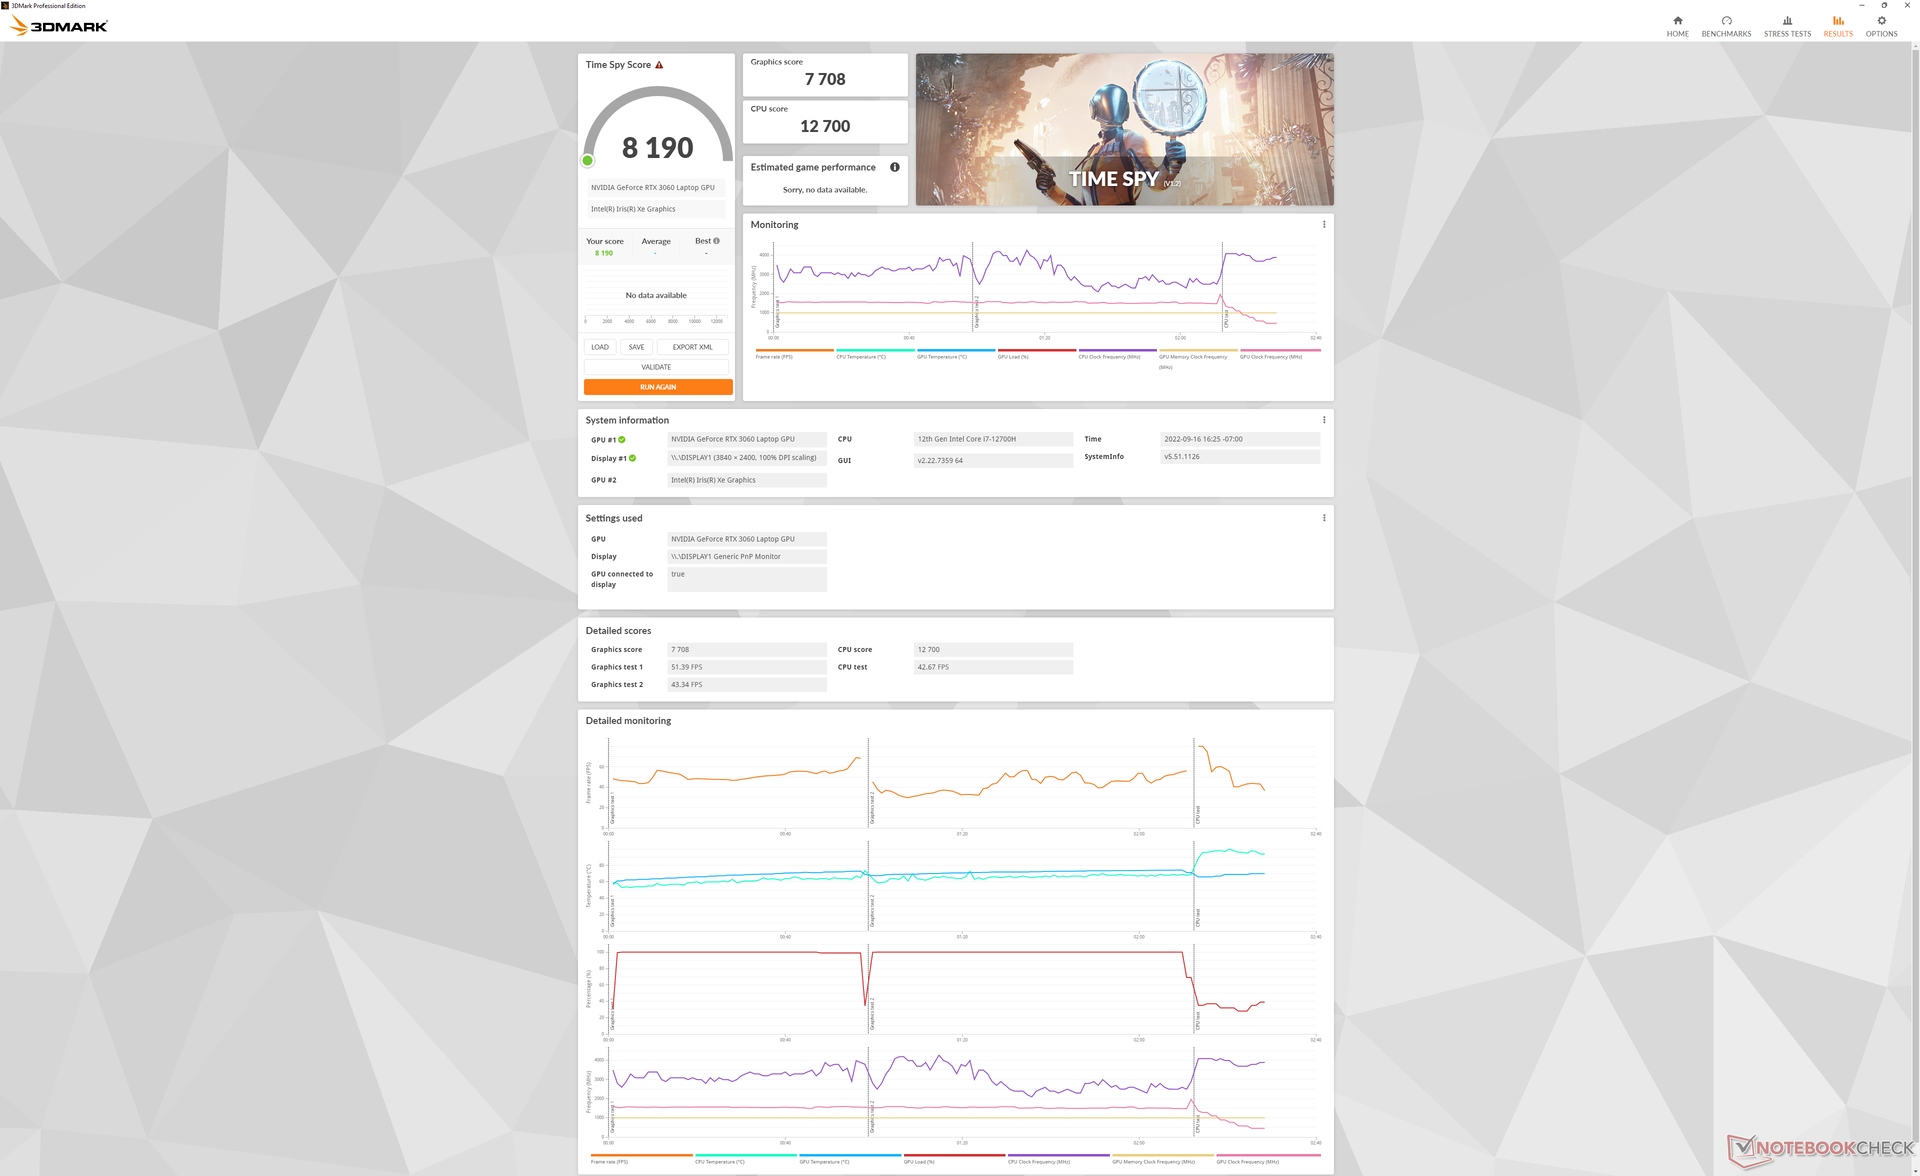
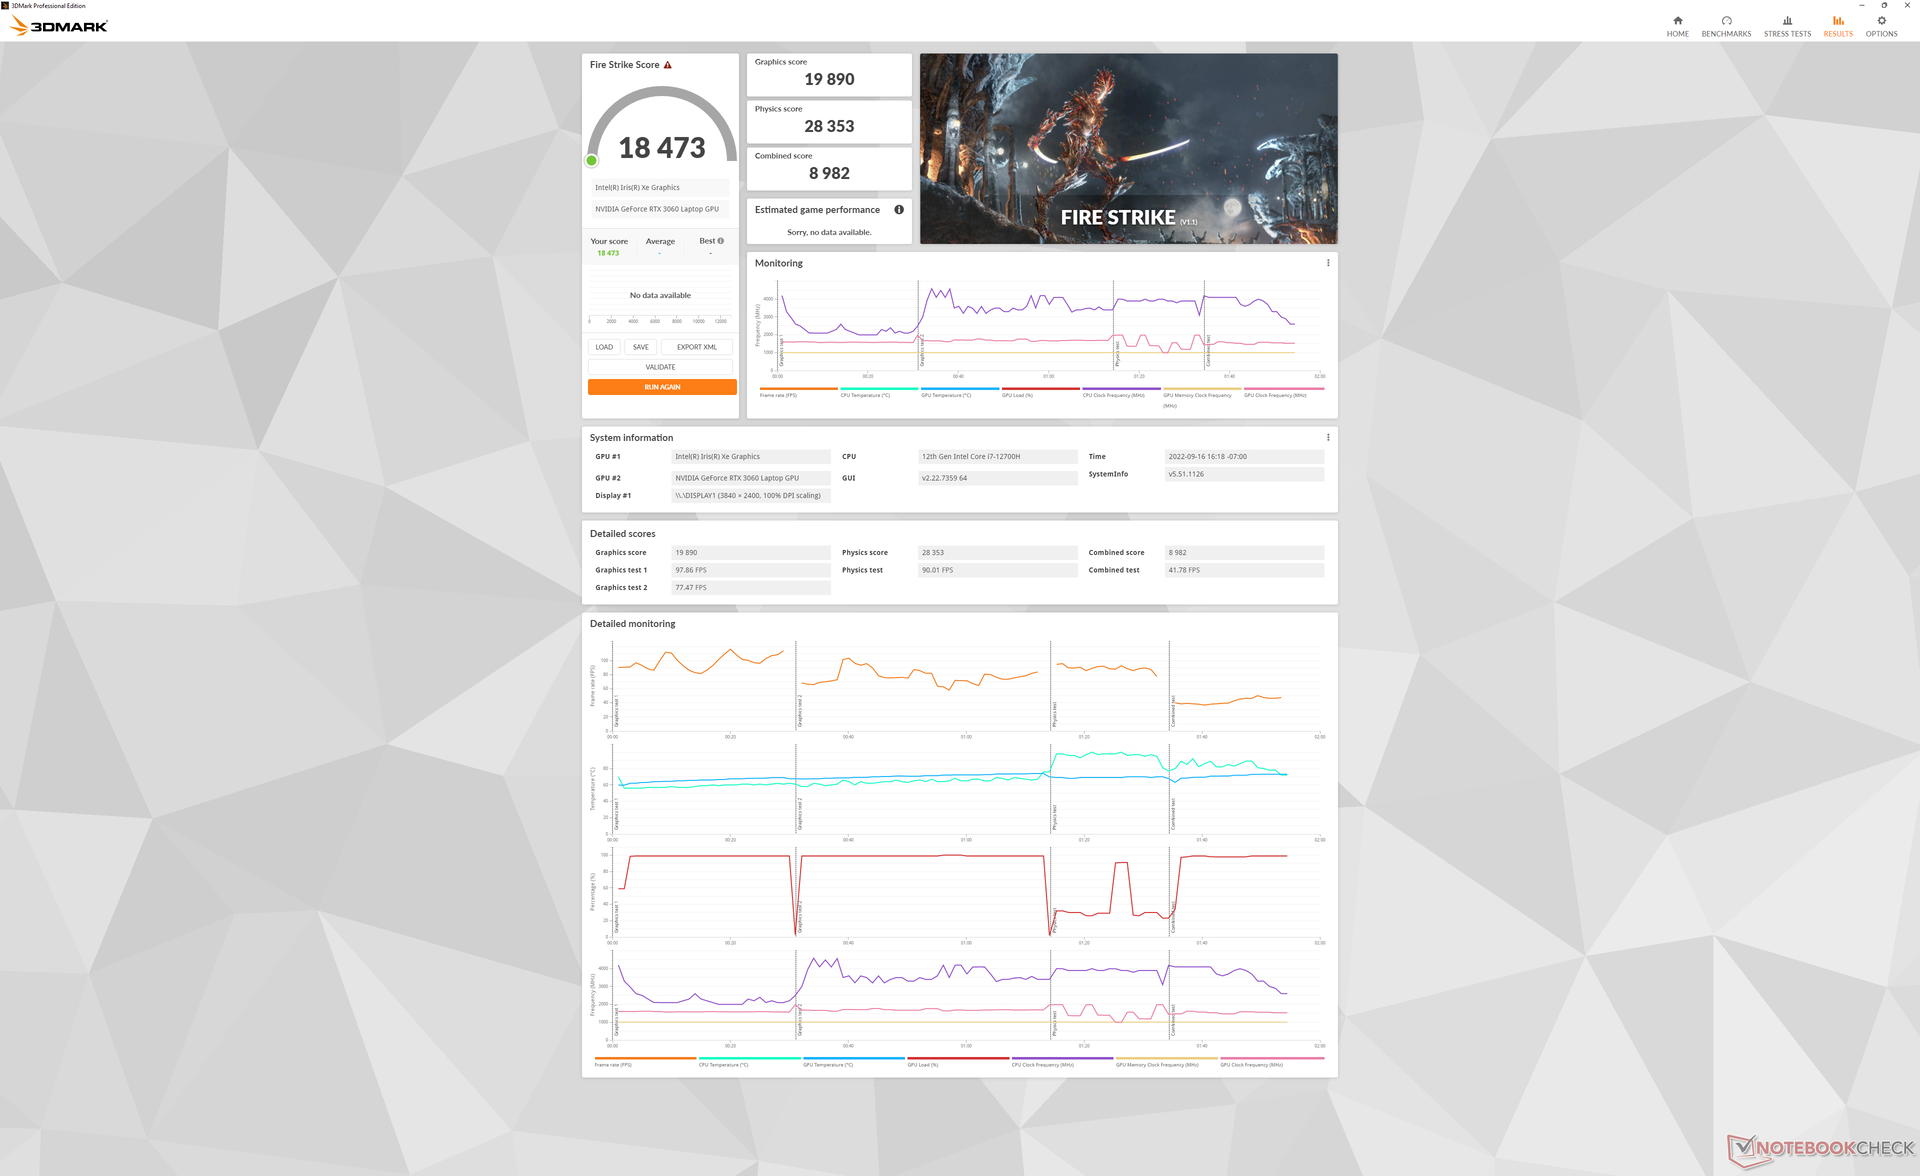
| 3DMark Fire Strike Score | 17118 pontos | |
| 3DMark Time Spy Score | 8190 pontos | |
Ajuda | ||
Witcher 3 FPS Chart
| baixo | média | alto | ultra | QHD | 4K | |
|---|---|---|---|---|---|---|
| GTA V (2015) | 185.6 | 181.2 | 174.1 | 103.3 | 76.7 | |
| The Witcher 3 (2015) | 402.3 | 264 | 161.2 | 82.8 | 55.1 | |
| Dota 2 Reborn (2015) | 180.6 | 164.8 | 149.1 | 139 | 46.9 | |
| Final Fantasy XV Benchmark (2018) | 177.2 | 111.7 | 83.9 | 62 | 34.6 | |
| X-Plane 11.11 (2018) | 140.3 | 127 | 103 | 60.5 | ||
| Strange Brigade (2018) | 418 | 202 | 162 | 140.4 | 103.5 | |
| Cyberpunk 2077 1.6 (2022) | 115.7 | 94.4 | 72.3 | 59.5 | 17.9 |
Emissões
Ruído do sistema - Tão alto quanto muitos laptops para jogos
O ruído do ventilador tende a pulsar se definido para o perfil de potência balanceado ou superior. Espere que os ventiladores variem entre 30 e 34 dB(A) contra um fundo silencioso de 22,8 dB(A) ao navegar na web ou ao reproduzir vídeo. Outros laptops de 16 polegadas como oHuawei MateBook 16s ou MacBook Pro 16 são capazes de permanecer mais silenciosos por mais tempo do que os 16 Envy.
Os ventiladores podem ser tão barulhentos quanto 41 dB(A) ao rodar o 3DMark 06 comparado a apenas 26 dB(A) e 34 dB(A) no já mencionado Apple e Huawei, respectivamente
O ruído dos ventiladores torna-se ainda mais alto a pouco mais de 51 dB(A) ao rodar Witcher 3 no modo Performance. Isto cairia significativamente para 41,6 dB(A) se rodando em modo Balanceado, mas o desempenho gráfico seria cerca de 5 a 10% mais lento, como mencionado acima. Em geral, este é um laptop bem alto se você quiser explorar seu desempenho.
Barulho
| Ocioso |
| 22.9 / 22.9 / 30.5 dB |
| Carga |
| 41.4 / 51.4 dB |
 | ||
30 dB silencioso 40 dB(A) audível 50 dB(A) ruidosamente alto |
||
min: | ||
| HP Envy 16 h0112nr GeForce RTX 3060 Laptop GPU, i7-12700H, Micron 3400 1TB MTFDKBA1T0TFH | Lenovo ThinkBook 16 G4+ IAP GeForce RTX 2050 Mobile, i7-12700H, Micron 2450 1TB MTFDKCD1T0TFK | MSI Creator Z16P B12UHST GeForce RTX 3080 Ti Laptop GPU, i9-12900H, Samsung PM9A1 MZVL22T0HBLB | Dell Inspiron 16 Plus 7610-MHJ8F UHD Graphics Xe 32EUs (Tiger Lake-H), i7-11800H, OM3PDP3-AD NVMe KDI 512GB | Apple MacBook Pro 16 2021 M1 Pro M1 Pro 16-Core GPU, M1 Pro, Apple SSD AP1024R | Huawei MateBook 16s i7 Iris Xe G7 96EUs, i7-12700H, Silicon Motion PCIe-8 SSD | |
|---|---|---|---|---|---|---|
| Noise | 1% | -5% | -1% | 10% | 9% | |
| desligado / ambiente * (dB) | 22.8 | 24.2 -6% | 26 -14% | 26.3 -15% | 24.7 -8% | 24 -5% |
| Idle Minimum * (dB) | 22.9 | 24.2 -6% | 27 -18% | 26.3 -15% | 24.7 -8% | 24 -5% |
| Idle Average * (dB) | 22.9 | 24.2 -6% | 29 -27% | 26.3 -15% | 24.7 -8% | 25.2 -10% |
| Idle Maximum * (dB) | 30.5 | 24.2 21% | 31 -2% | 24.7 19% | 27.2 11% | |
| Load Average * (dB) | 41.4 | 47 -14% | 43 -4% | 33 20% | 26.1 37% | 34.8 16% |
| Witcher 3 ultra * (dB) | 51.1 | 47 8% | 43 16% | 44 14% | 34.8 32% | |
| Load Maximum * (dB) | 51.4 | 47 9% | 46 11% | 49.2 4% | 37.4 27% | 39 24% |
* ... menor é melhor
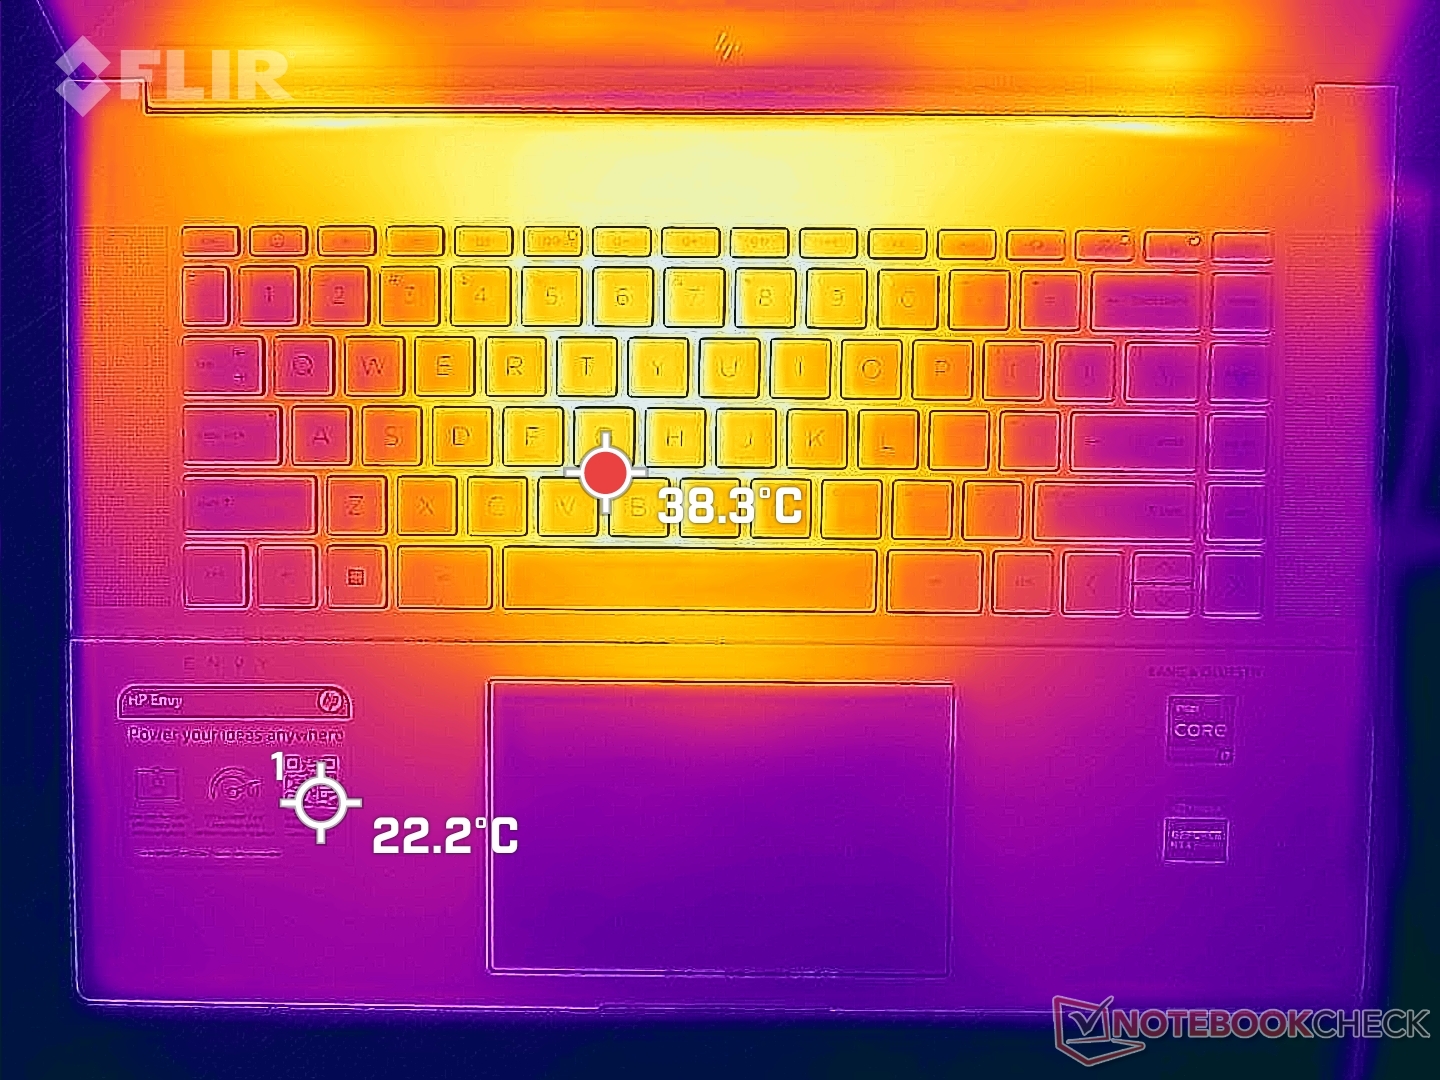
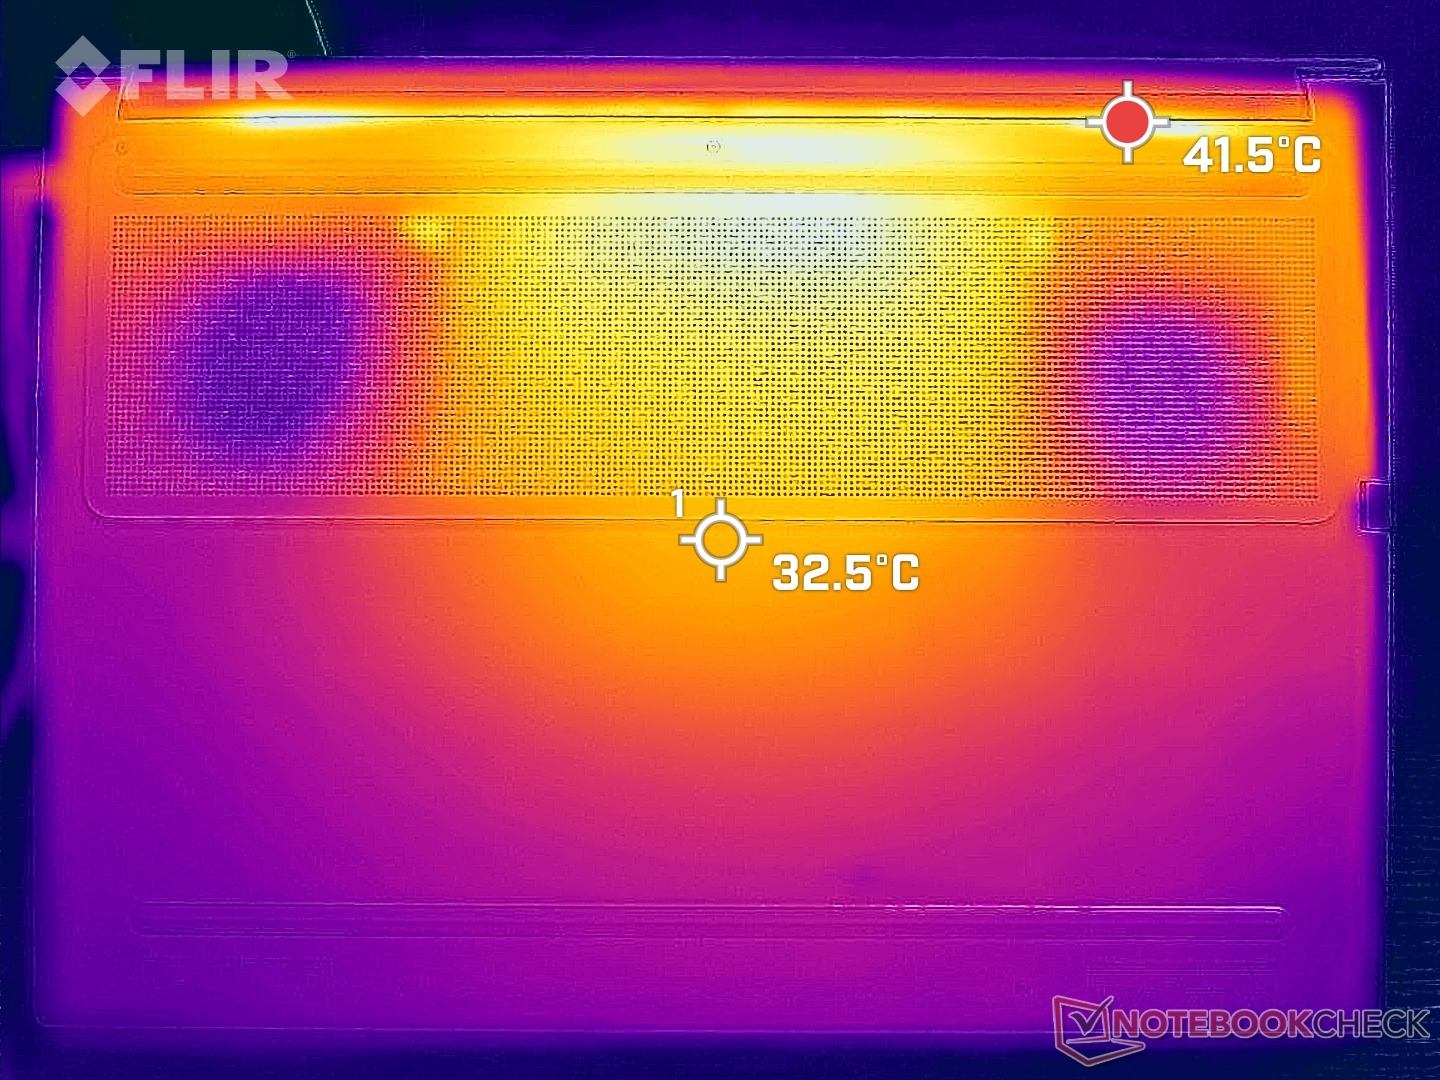
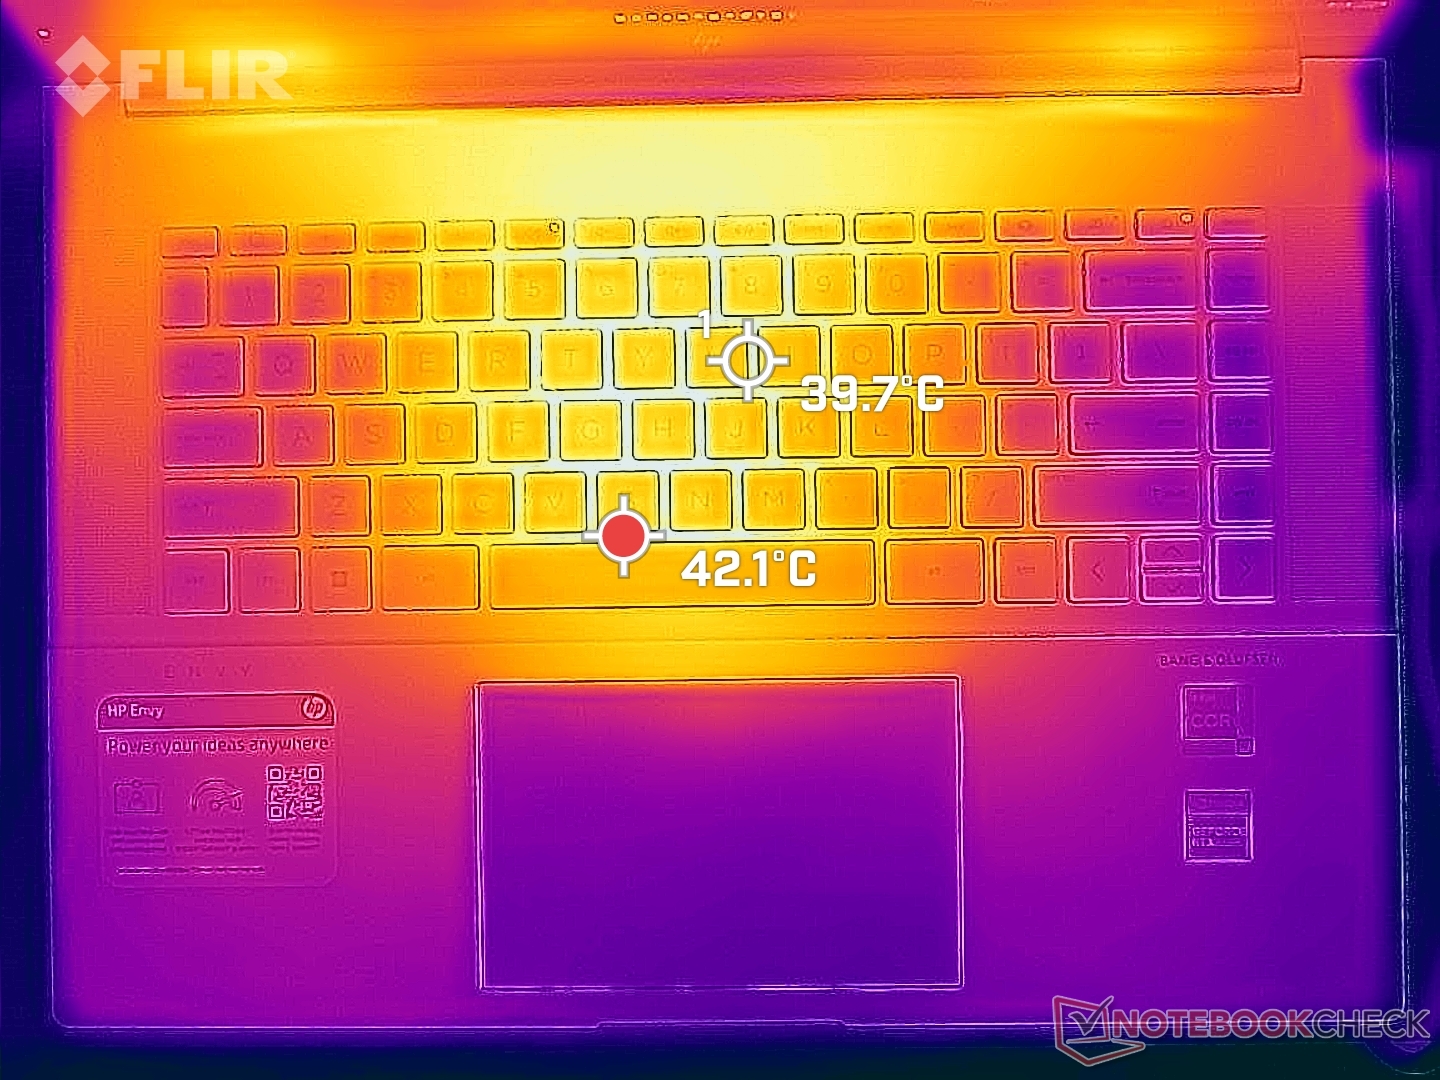
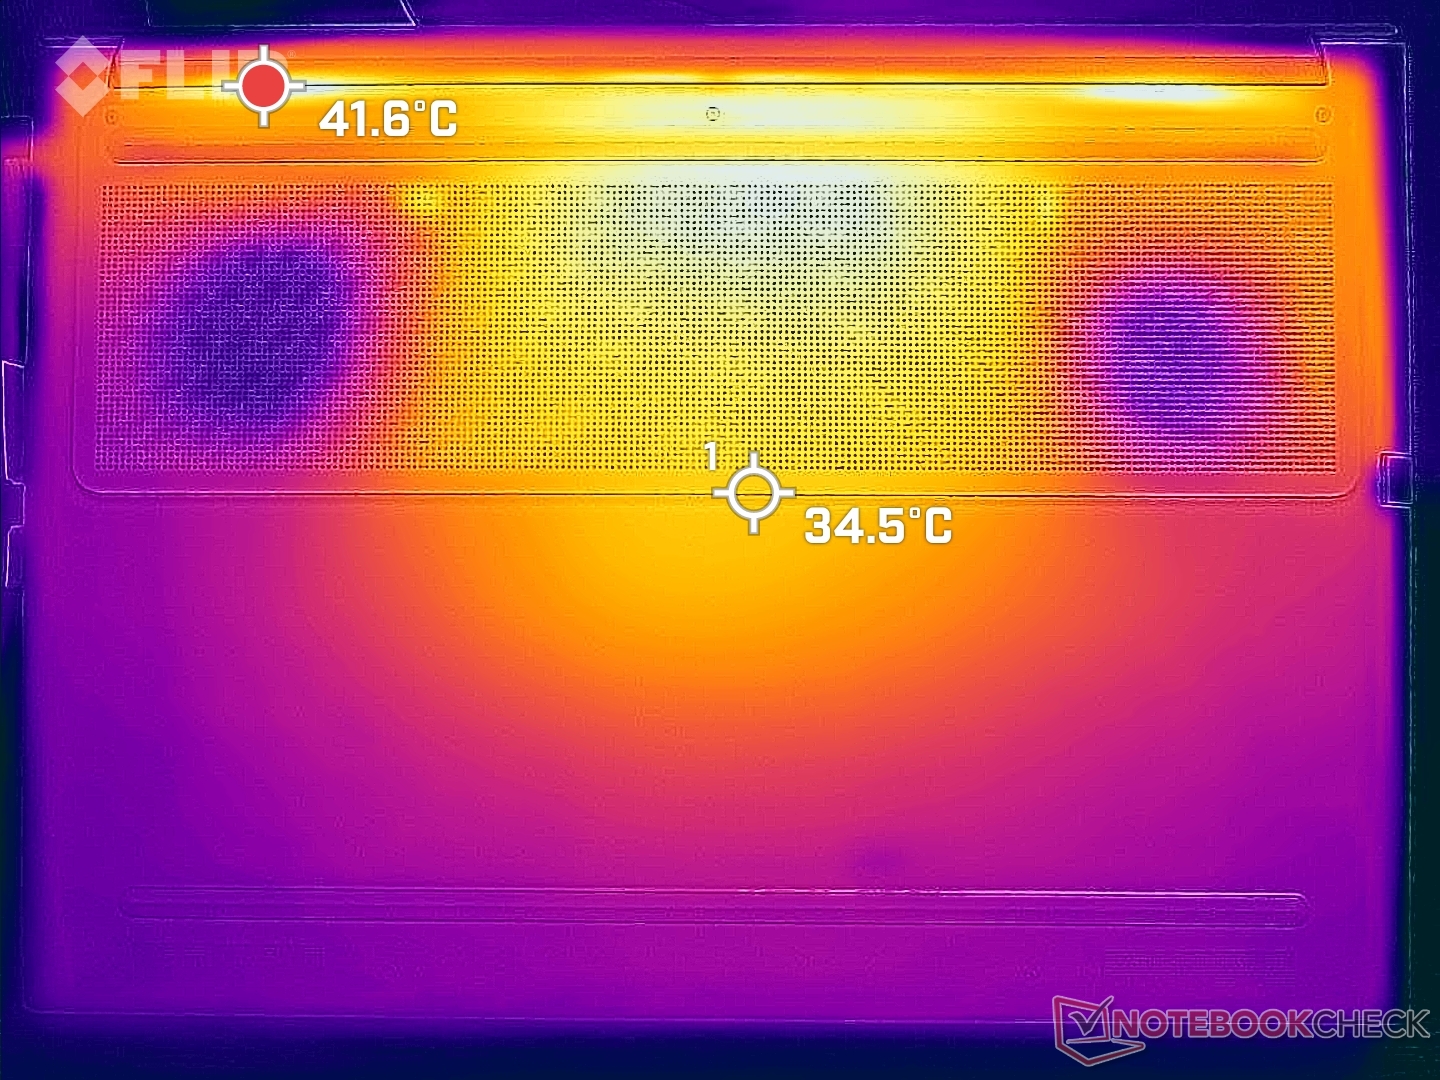
Temperatura
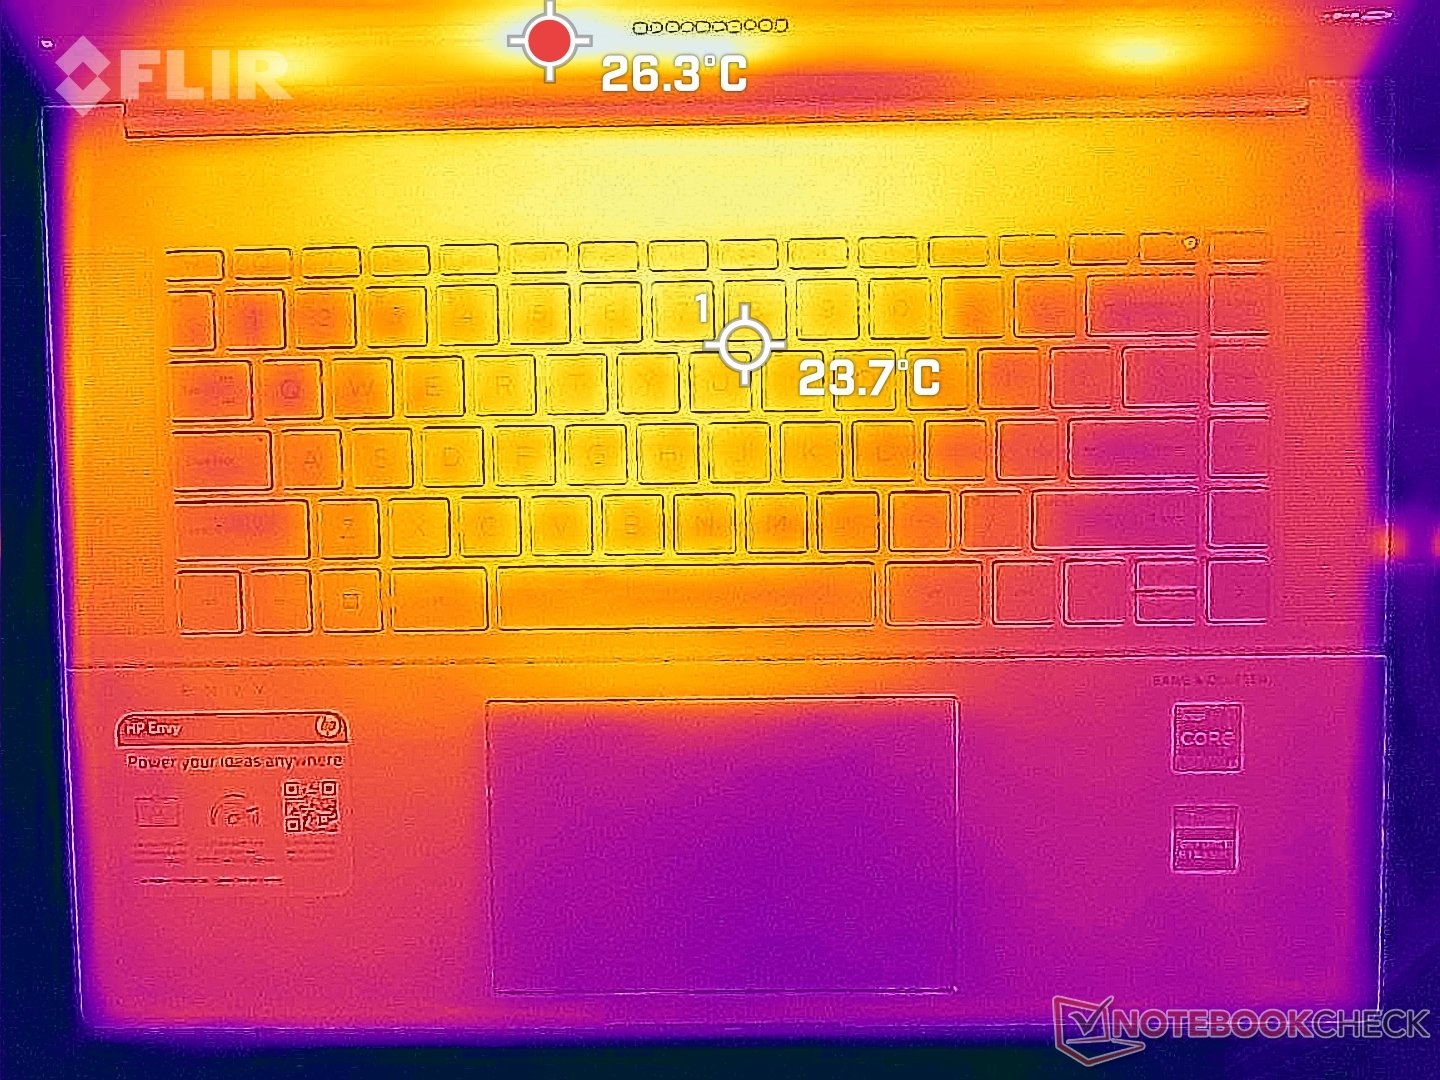
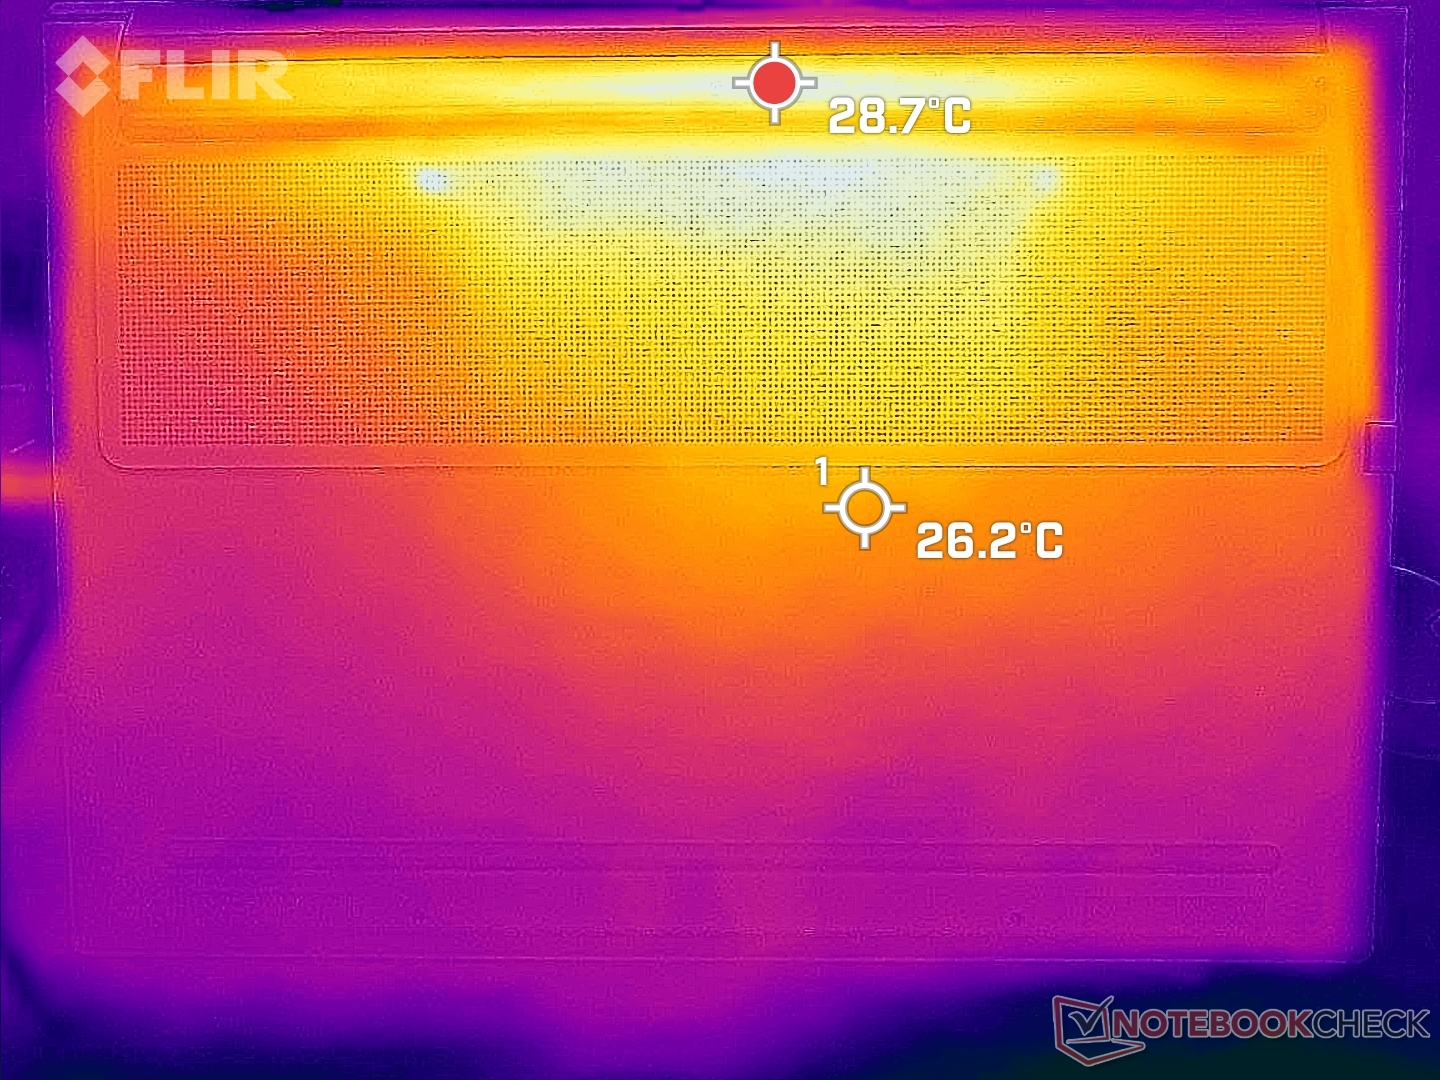
As temperaturas de superfície são bastante quentes mesmo quando ociosas na área de trabalho, sem aplicações em execução. Os pontos quentes sob estas condições podem chegar a 33 C tanto na parte superior quanto na inferior, em comparação com apenas 26 C na ThinkBook 16 G4. Se a carga for alta, estas mesmas áreas podem alcançar mais de 45 C. Os descansos da palma permanecem relativamente frios, mas o fundo pode ser desconfortável para a pele.
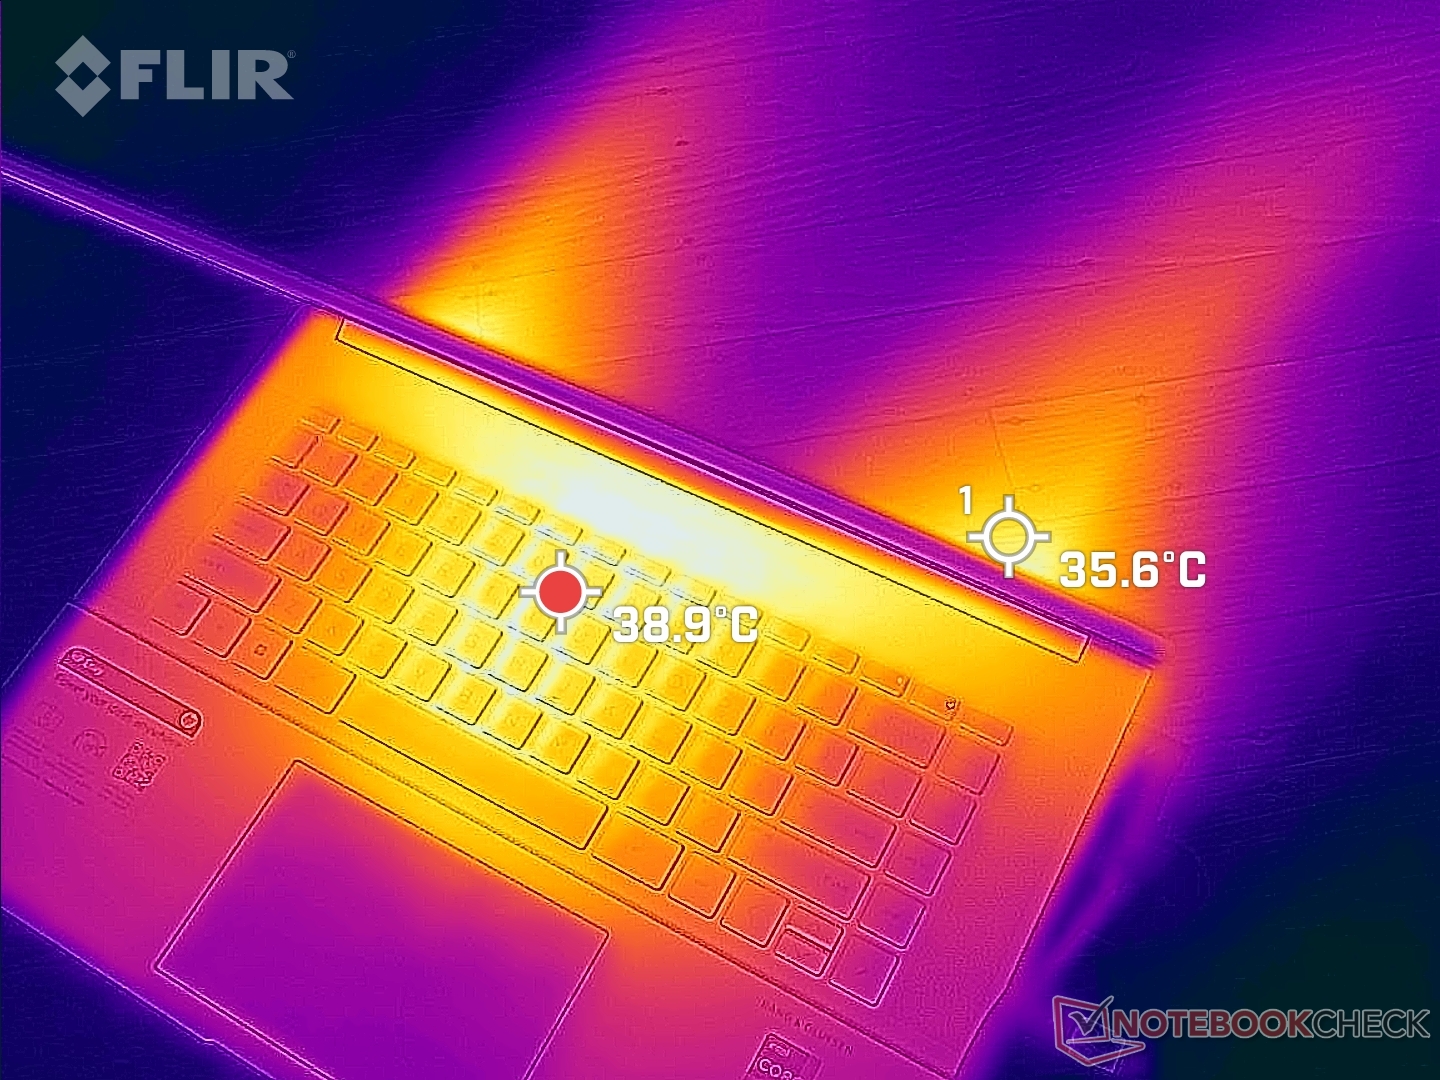
(-) A temperatura máxima no lado superior é 45.2 °C / 113 F, em comparação com a média de 36.8 °C / 98 F , variando de 21 a 71 °C para a classe Multimedia.
(±) A parte inferior aquece até um máximo de 44 °C / 111 F, em comparação com a média de 39.1 °C / 102 F
(+) Em uso inativo, a temperatura média para o lado superior é 31 °C / 88 F, em comparação com a média do dispositivo de 31.3 °C / ### class_avg_f### F.
(±) Jogando The Witcher 3, a temperatura média para o lado superior é 33.6 °C / 92 F, em comparação com a média do dispositivo de 31.3 °C / ## #class_avg_f### F.
(+) Os apoios para as mãos e o touchpad são mais frios que a temperatura da pele, com um máximo de 29.8 °C / 85.6 F e, portanto, são frios ao toque.
(±) A temperatura média da área do apoio para as mãos de dispositivos semelhantes foi 28.7 °C / 83.7 F (-1.1 °C / -1.9 F).
| HP Envy 16 h0112nr Intel Core i7-12700H, NVIDIA GeForce RTX 3060 Laptop GPU | Lenovo ThinkBook 16 G4+ IAP Intel Core i7-12700H, NVIDIA GeForce RTX 2050 Mobile | MSI Creator Z16P B12UHST Intel Core i9-12900H, NVIDIA GeForce RTX 3080 Ti Laptop GPU | Dell Inspiron 16 Plus 7610-MHJ8F Intel Core i7-11800H, Intel UHD Graphics Xe 32EUs (Tiger Lake-H) | Apple MacBook Pro 16 2021 M1 Pro Apple M1 Pro, Apple M1 Pro 16-Core GPU | Huawei MateBook 16s i7 Intel Core i7-12700H, Intel Iris Xe Graphics G7 96EUs | |
|---|---|---|---|---|---|---|
| Heat | 8% | -20% | 4% | 19% | 5% | |
| Maximum Upper Side * (°C) | 45.2 | 42.9 5% | 67 -48% | 43.4 4% | 41 9% | 40.9 10% |
| Maximum Bottom * (°C) | 44 | 50.6 -15% | 69 -57% | 45.1 -3% | 39 11% | 48.3 -10% |
| Idle Upper Side * (°C) | 33.6 | 26 23% | 29 14% | 30.6 9% | 24 29% | 29.2 13% |
| Idle Bottom * (°C) | 32.6 | 26.5 19% | 29 11% | 31.1 5% | 24 26% | 30.4 7% |
* ... menor é melhor
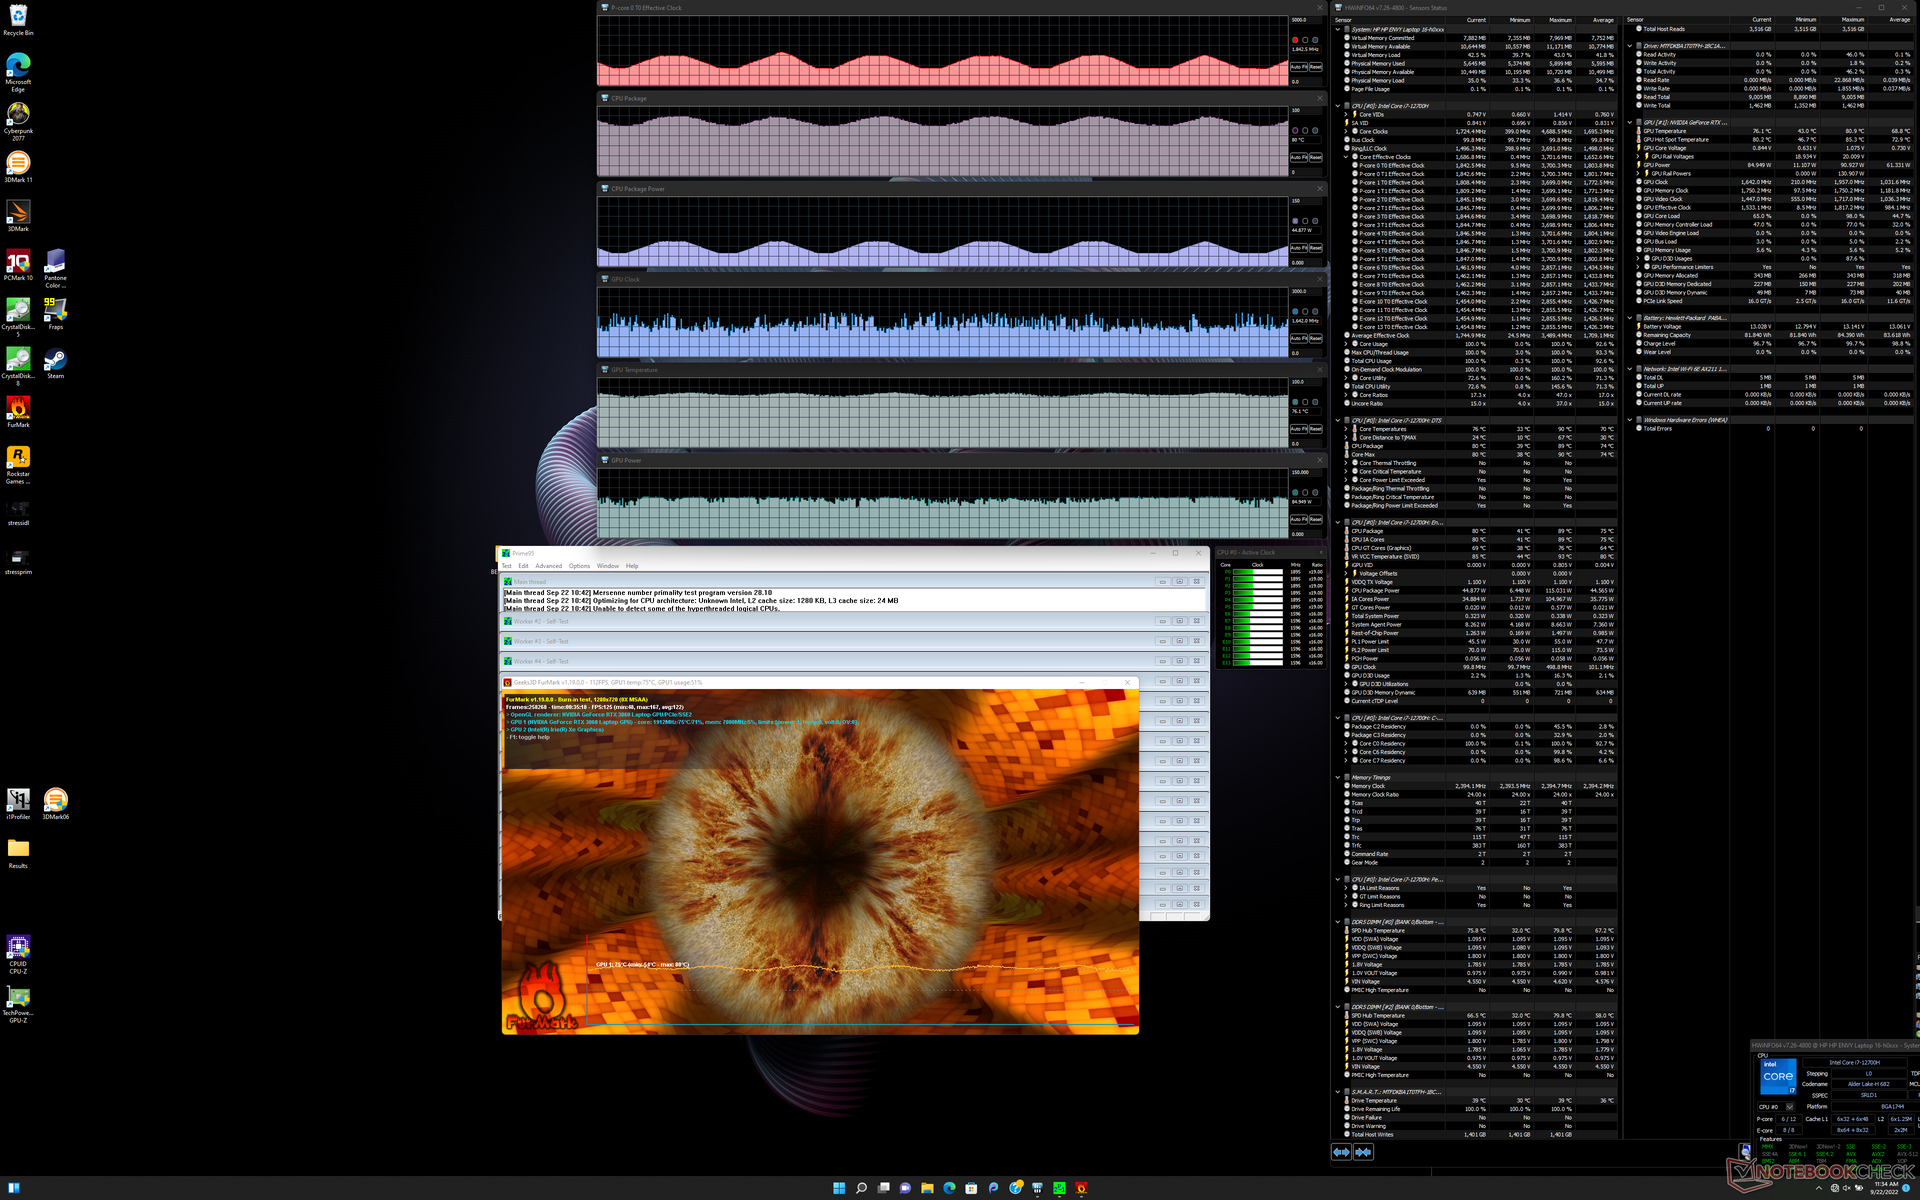
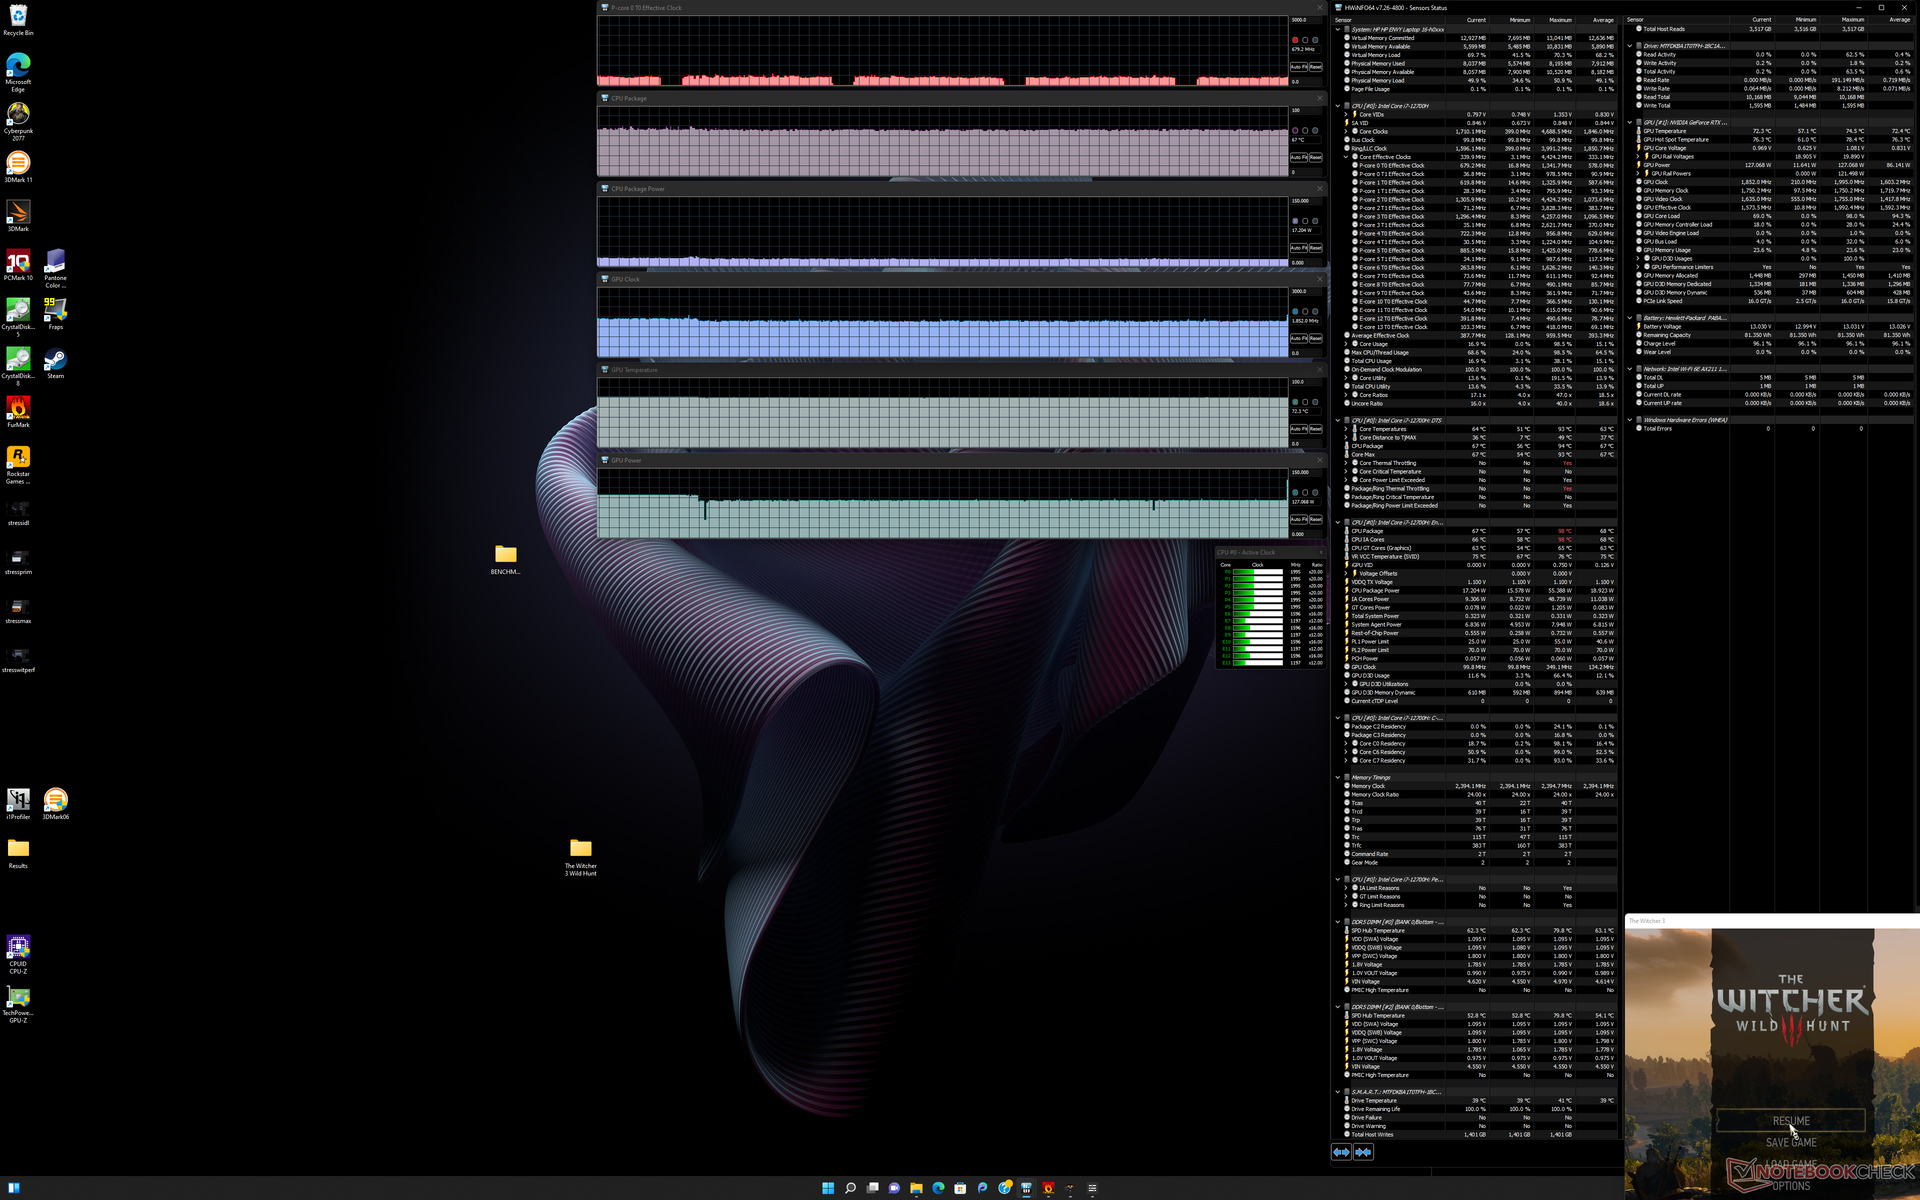
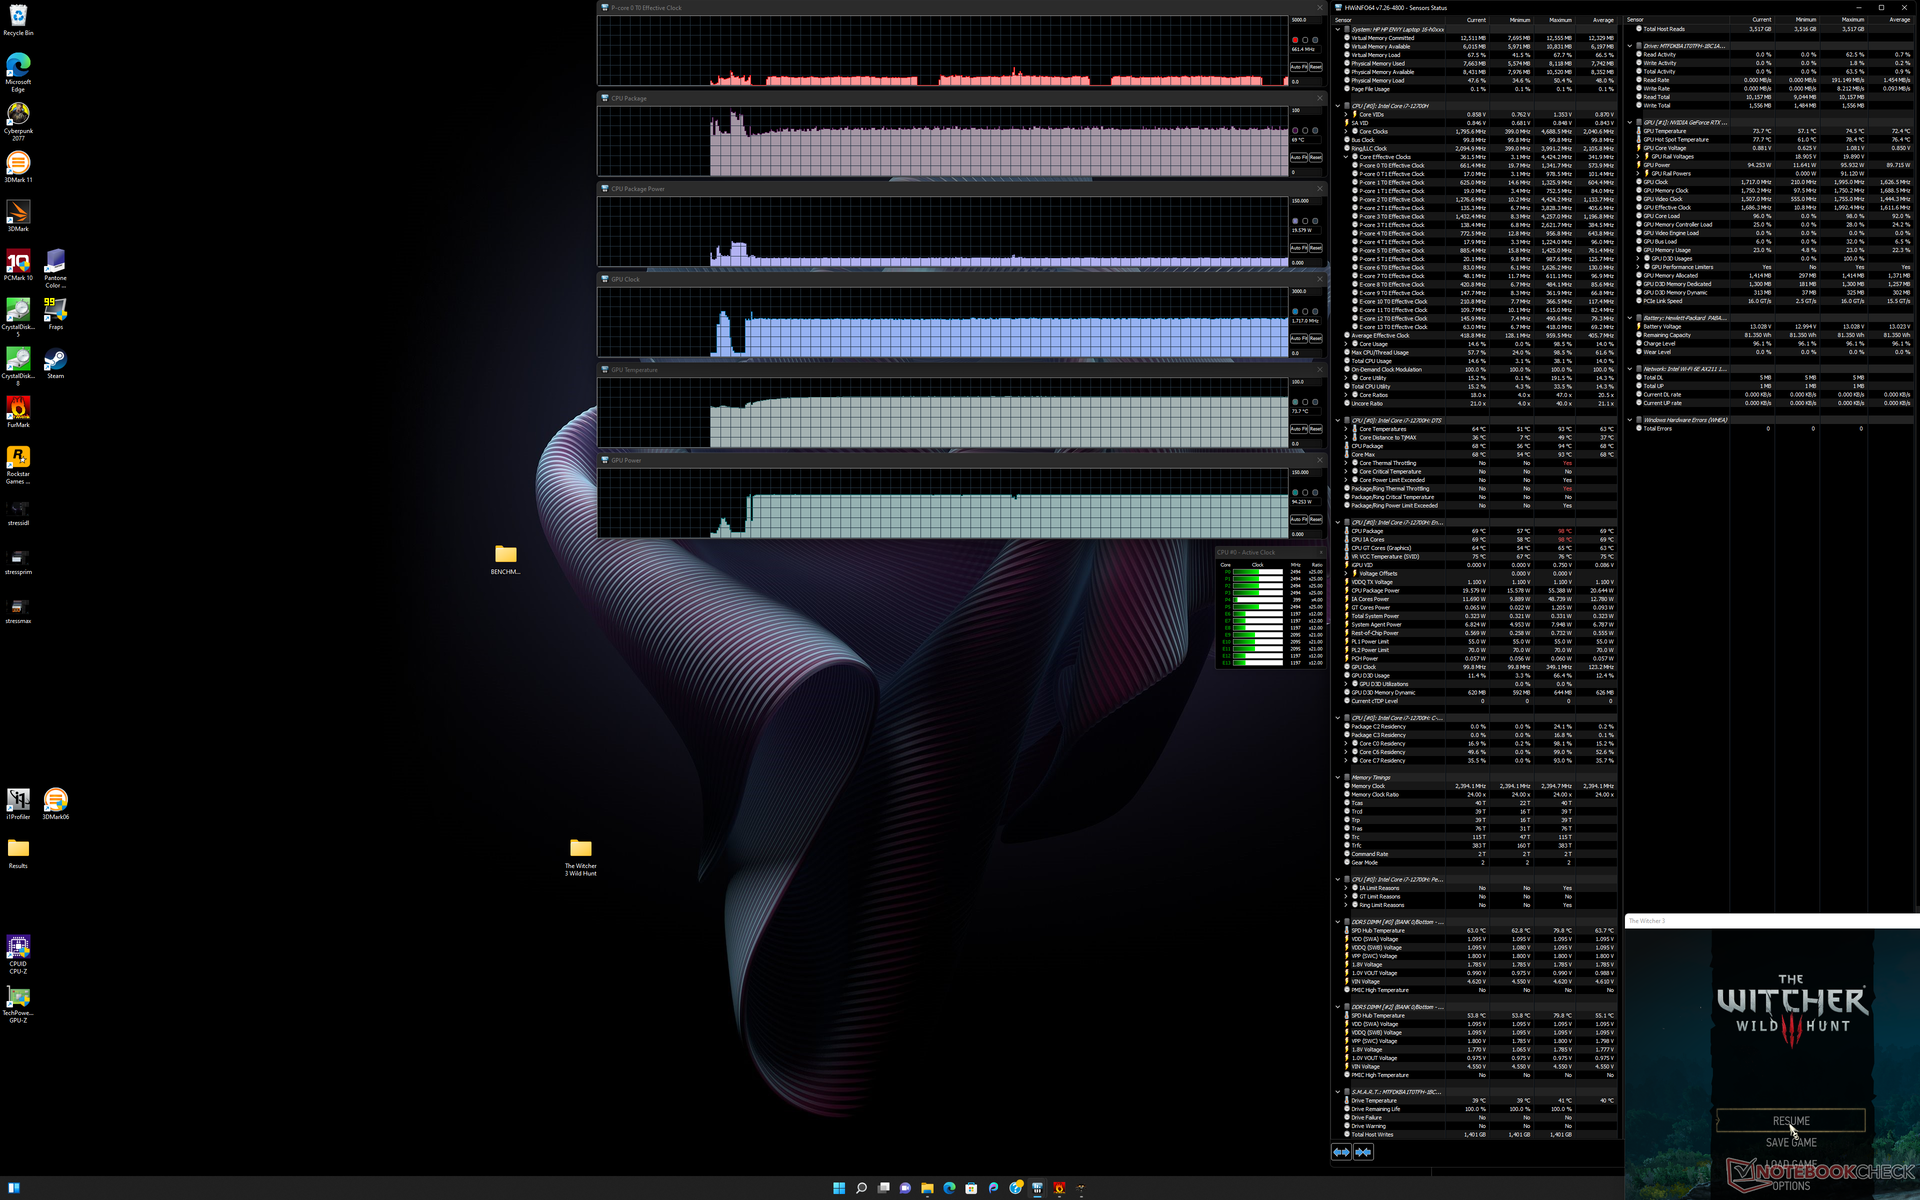
Teste de estresse - Turbo Boost limitado
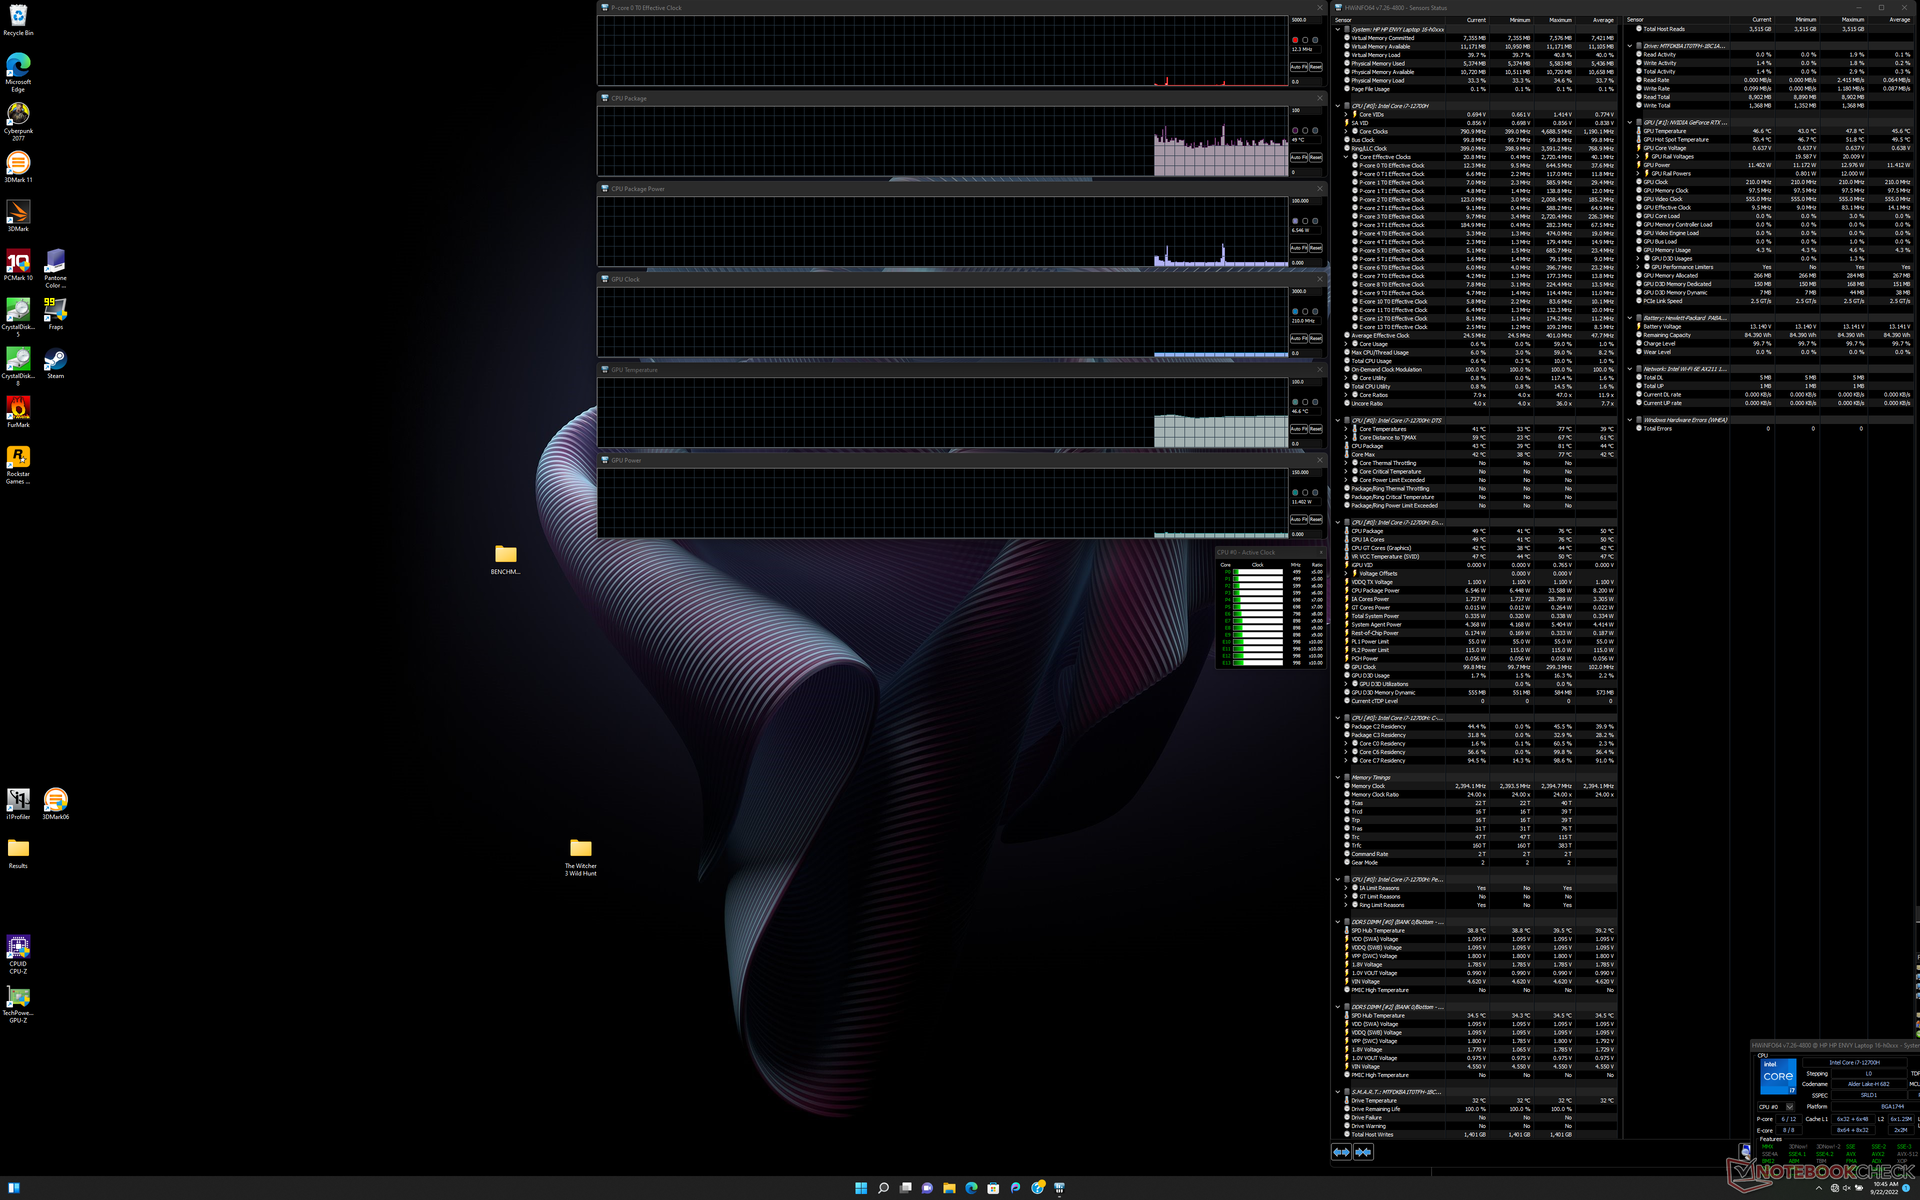
A execução do Prime95 faz com que as taxas de clock da CPU, temperatura e consumo de energia da placa atinjam 3,7 GHz, 80 C e 115 W, respectivamente, durando cerca de 15 segundos. Depois disso, a CPU cairia e se estabilizaria em 2,1 a 2,2 GHz, 66 C, e 55 W, respectivamente. Em comparação, este mesmo teste foi realizado no MSI GS77 com a mesma CPU Core i7-12700H resultaria em taxas de relógio estáveis mais altas e temperaturas core de 2,7 - 3,0 GHz e 96 C, respectivamente. A HP pode estar tomando a rota mais segura com seu Envy 16, ao funcionar com taxas de relógio Turbo Boost mais lentas, a fim de manter as temperaturas mais baixas.
As taxas de clock GPU, temperatura e consumo de energia da placa estabilizariam em 1717 MHz, 74 C, e 94 W, respectivamente, quando em funcionamento Witcher 3 no modo Performance. Isto cai para 1542 MHz, 72 C e 80 W se, em vez disso, o jogo for executado no modo Equilibrado. Os usuários terão que suportar o máximo ruído do ventilador do sistema se quiserem explorar ao máximo a GPU.
Funcionando com bateria limita o desempenho. Um teste Fire Strike em baterias retornaria pontuações de Física e Gráficos de 17295 e 10572 pontos, respectivamente, em comparação com 28353 e 19890 pontos quando em rede elétrica.
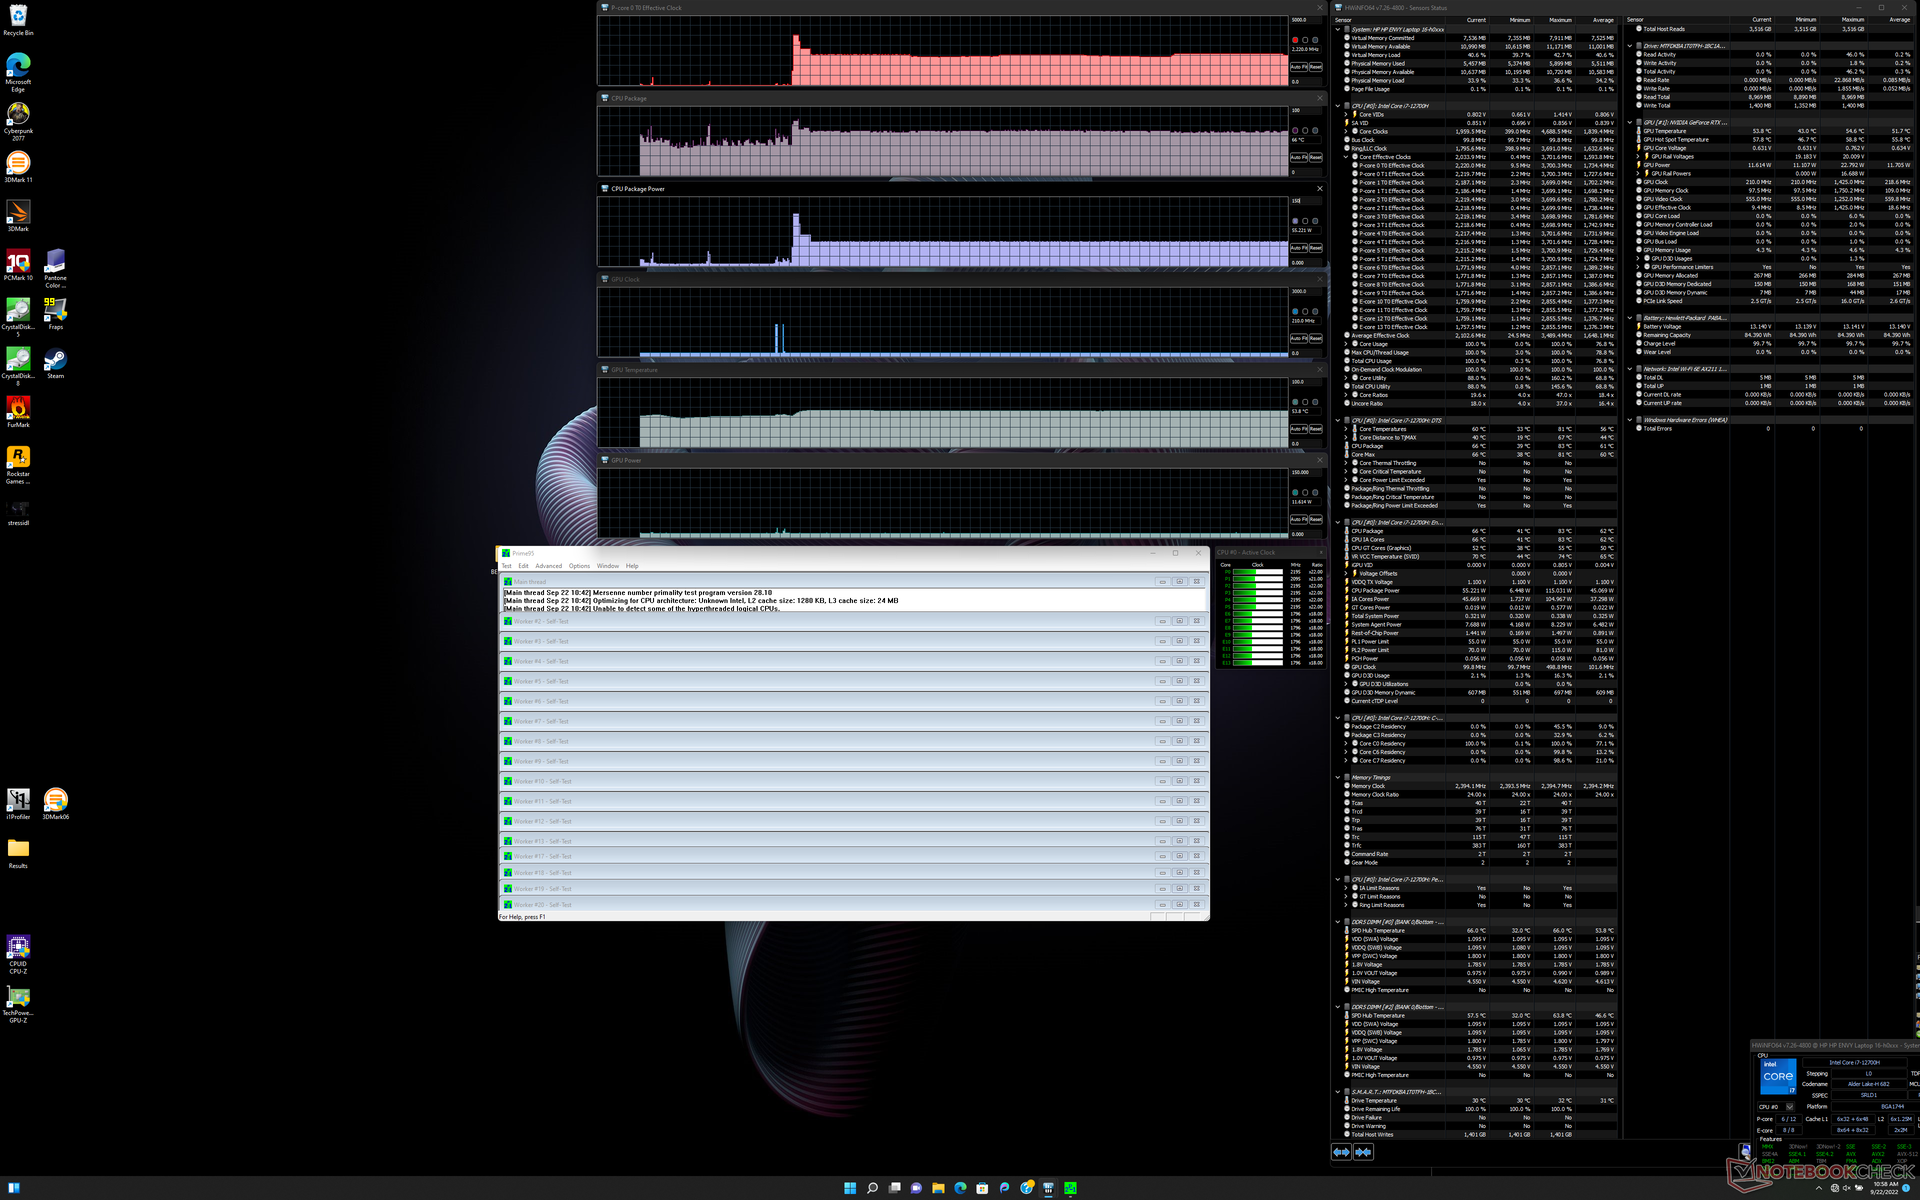
| Relógio CPU (GHz) | Relógio GPU (MHz) | Temperatura média da CPU (°C) | Temperatura média da GPU (°C) | |
| System Idle | -- | -- | 49 | 47 |
| Prime95 Stress | 2.1 - 2.2 | -- | 66 | 54 |
| Prime95 + FurMark Stress | 1.2 - 2.2 | ~1642 | 74 - 87 | 76 |
| Witcher 3 Stress (modo equilibrado) | 0.67 | 1542 | 67 | 72 |
| Witcher 3 Estresse (modo de desempenho) | 0.67 | 1717 | 69 | 74 |
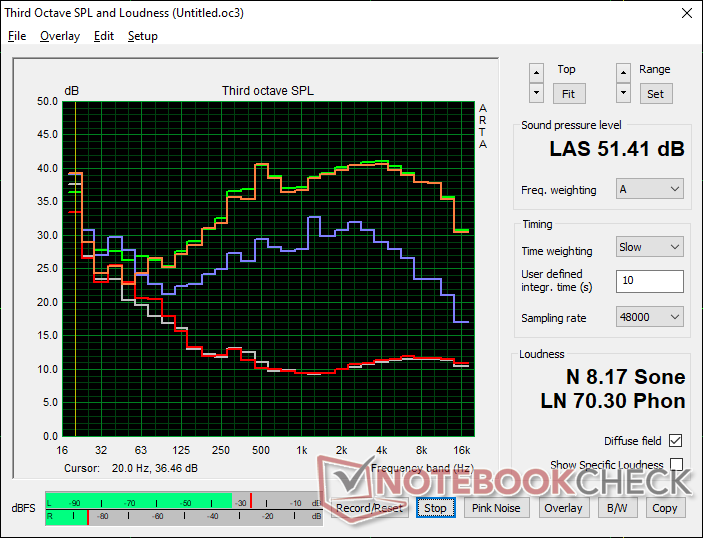
Oradores
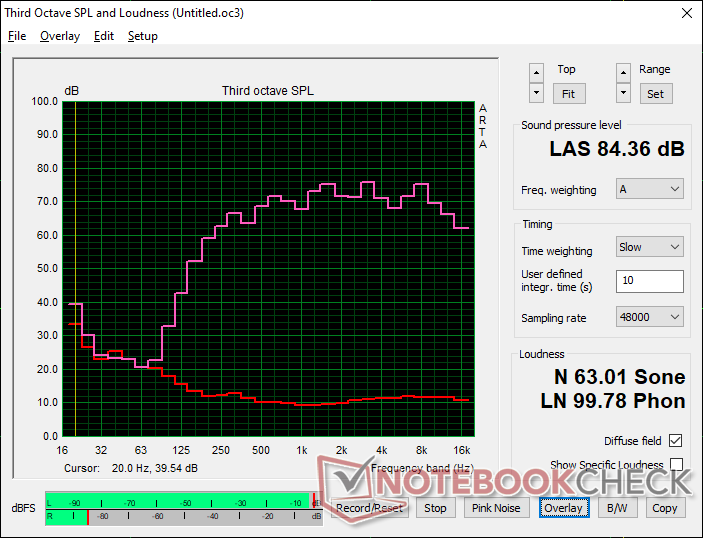
HP Envy 16 h0112nr análise de áudio
(+) | os alto-falantes podem tocar relativamente alto (###valor### dB)
Graves 100 - 315Hz
(-) | quase nenhum baixo - em média 15.9% menor que a mediana
(±) | a linearidade dos graves é média (12.8% delta para a frequência anterior)
Médios 400 - 2.000 Hz
(+) | médios equilibrados - apenas 3.1% longe da mediana
(+) | médios são lineares (5.5% delta para frequência anterior)
Altos 2 - 16 kHz
(+) | agudos equilibrados - apenas 3.4% longe da mediana
(+) | os máximos são lineares (6.3% delta da frequência anterior)
Geral 100 - 16.000 Hz
(+) | o som geral é linear (12.1% diferença em relação à mediana)
Comparado com a mesma classe
» 22% de todos os dispositivos testados nesta classe foram melhores, 3% semelhantes, 76% piores
» O melhor teve um delta de 5%, a média foi 17%, o pior foi 45%
Comparado com todos os dispositivos testados
» 10% de todos os dispositivos testados foram melhores, 2% semelhantes, 88% piores
» O melhor teve um delta de 4%, a média foi 23%, o pior foi 134%
Apple MacBook Pro 16 2021 M1 Pro análise de áudio
(+) | os alto-falantes podem tocar relativamente alto (###valor### dB)
Graves 100 - 315Hz
(+) | bons graves - apenas 3.8% longe da mediana
(+) | o baixo é linear (5.2% delta para a frequência anterior)
Médios 400 - 2.000 Hz
(+) | médios equilibrados - apenas 1.3% longe da mediana
(+) | médios são lineares (2.1% delta para frequência anterior)
Altos 2 - 16 kHz
(+) | agudos equilibrados - apenas 1.9% longe da mediana
(+) | os máximos são lineares (2.7% delta da frequência anterior)
Geral 100 - 16.000 Hz
(+) | o som geral é linear (4.6% diferença em relação à mediana)
Comparado com a mesma classe
» 0% de todos os dispositivos testados nesta classe foram melhores, 0% semelhantes, 100% piores
» O melhor teve um delta de 5%, a média foi 17%, o pior foi 45%
Comparado com todos os dispositivos testados
» 0% de todos os dispositivos testados foram melhores, 0% semelhantes, 100% piores
» O melhor teve um delta de 4%, a média foi 23%, o pior foi 134%
Gestão de energia
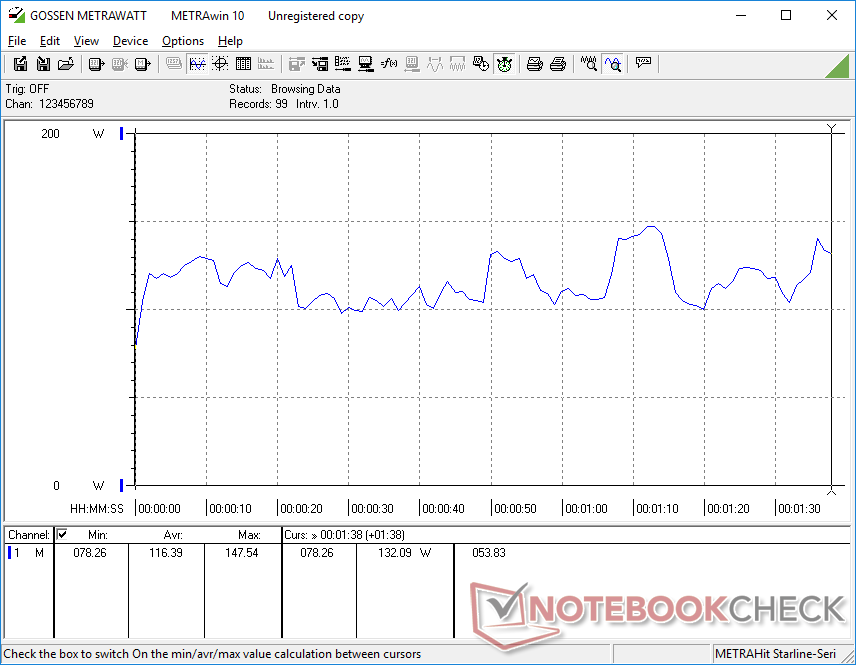
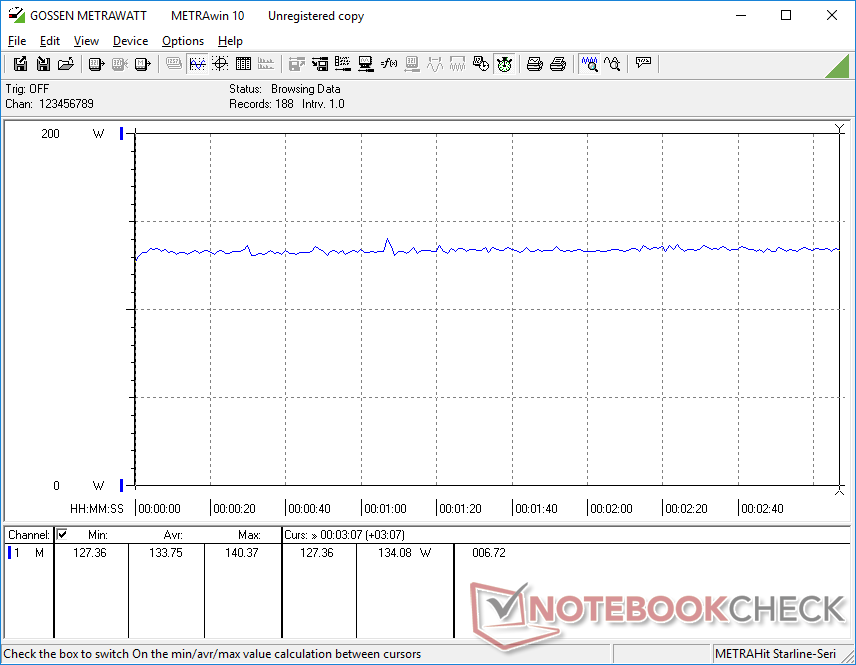
Consumo de energia
O Idling no desktop desenha entre 10 W e 28 W dependendo do nível de brilho, perfil de potência e configuração Optimus em comparação com apenas 9 W a 18 W na inveja 2020 15 devido ao painel OLED mais exigente e CPU do 12º gênero. Tenha em mente que certas cores exigirão mais potência do que outras em um painel OLED como detalhado aqui.
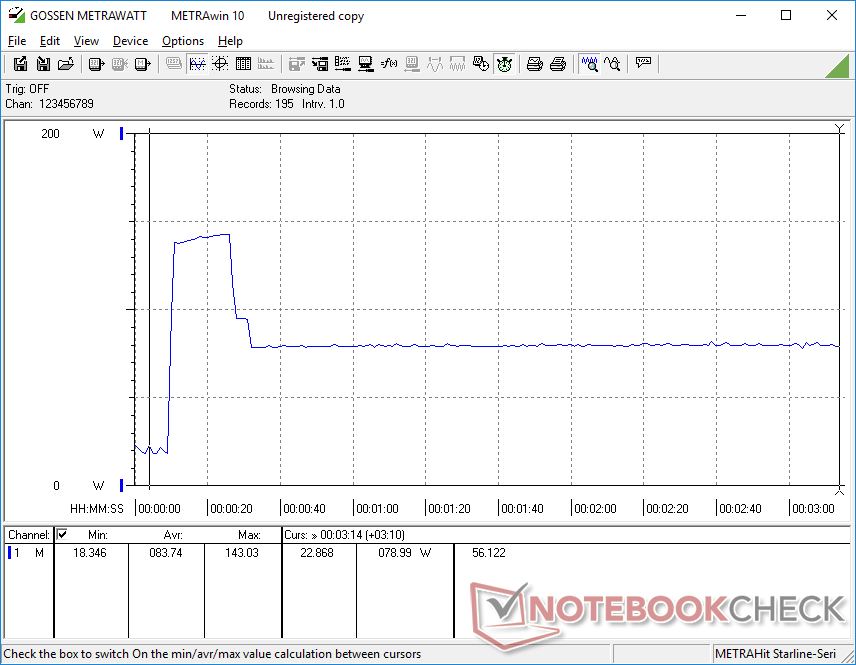
O consumo de energia quando o jogo é alto, em torno de 134 W, para ser comparável aoMSI Creator Z16P com a CPU mais rápida Core i9-12900H e GPU RTX 3080 Ti ou Lenovo Legion Slim 7 16 com a mesma CPU Core i7 e GPU. Quando comparado com a Envy 15 de 2020, entretanto, o consumo é apenas cerca de 7% maior quando se joga, apesar da performance gráfica 20 a 30% mais rápida para uma performance maior por watt.
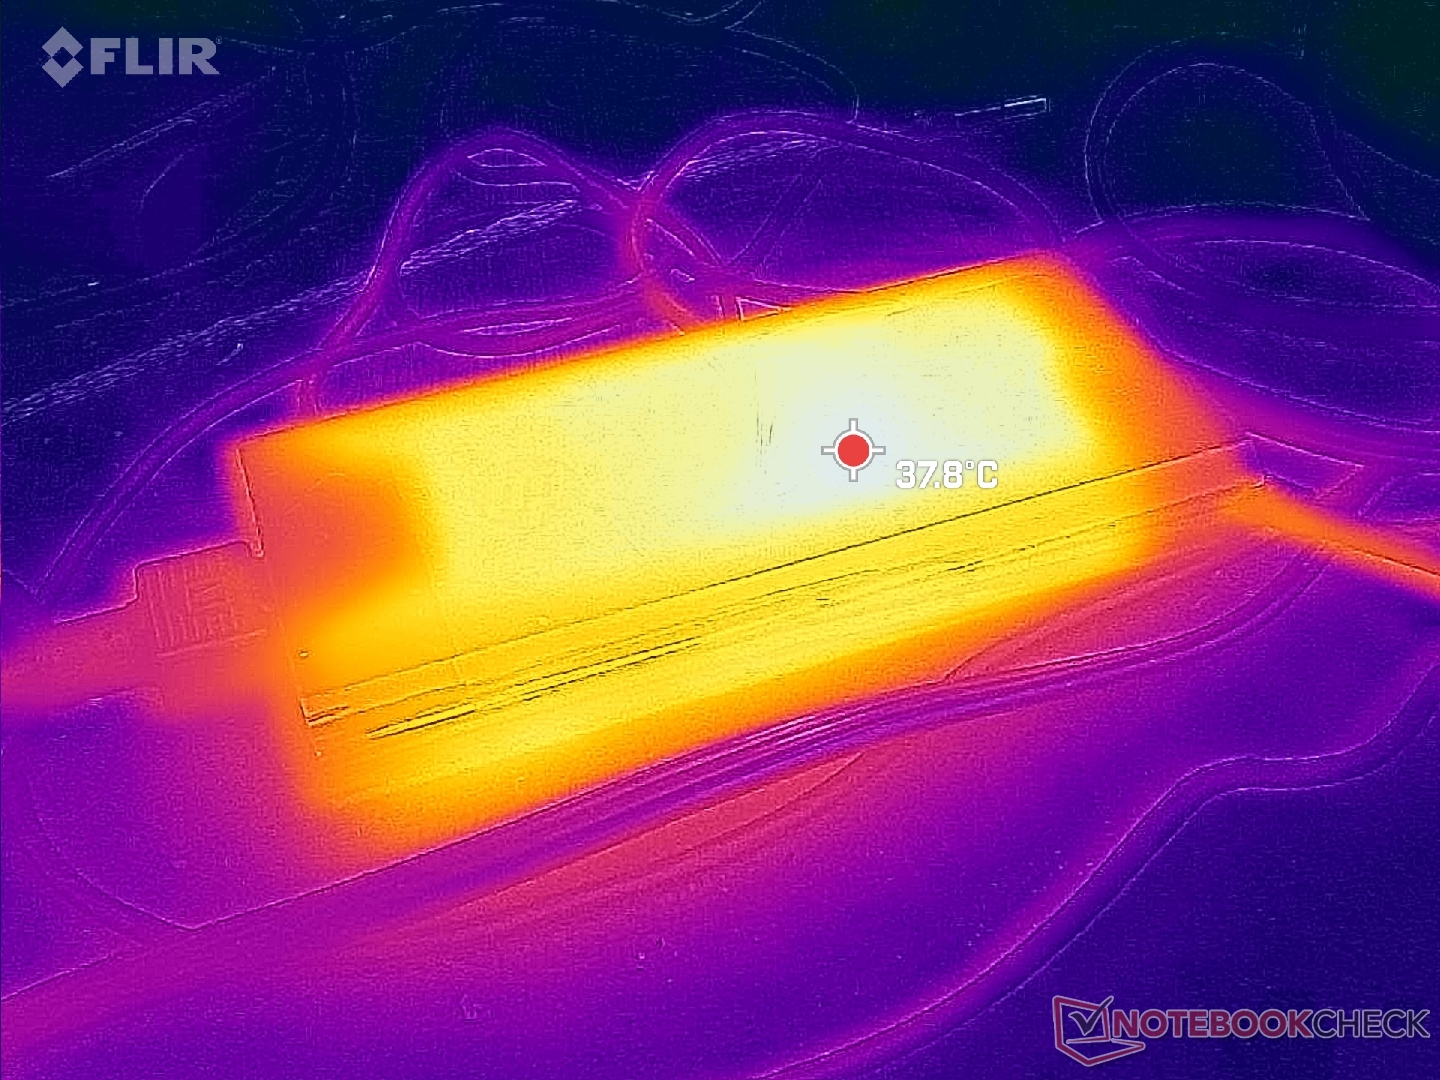
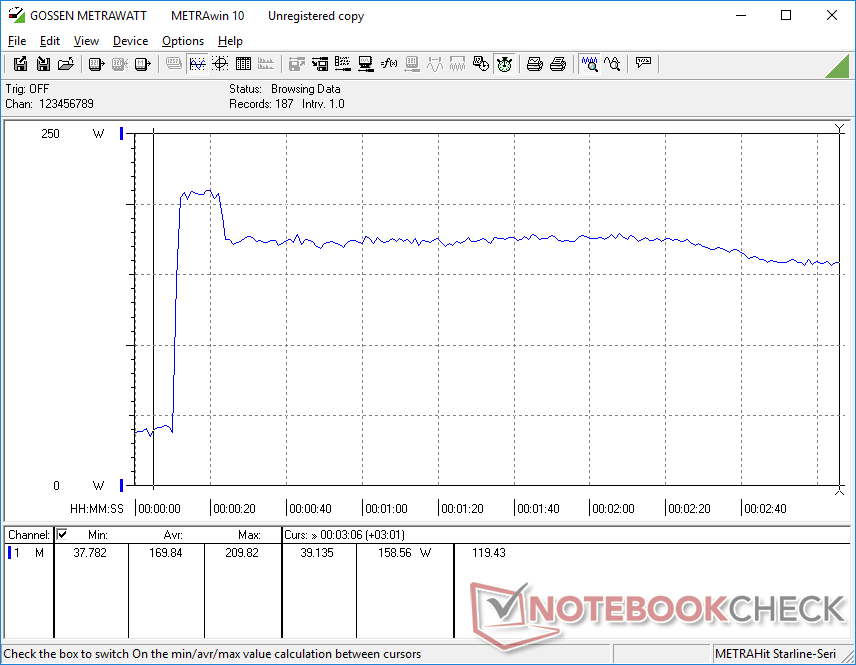
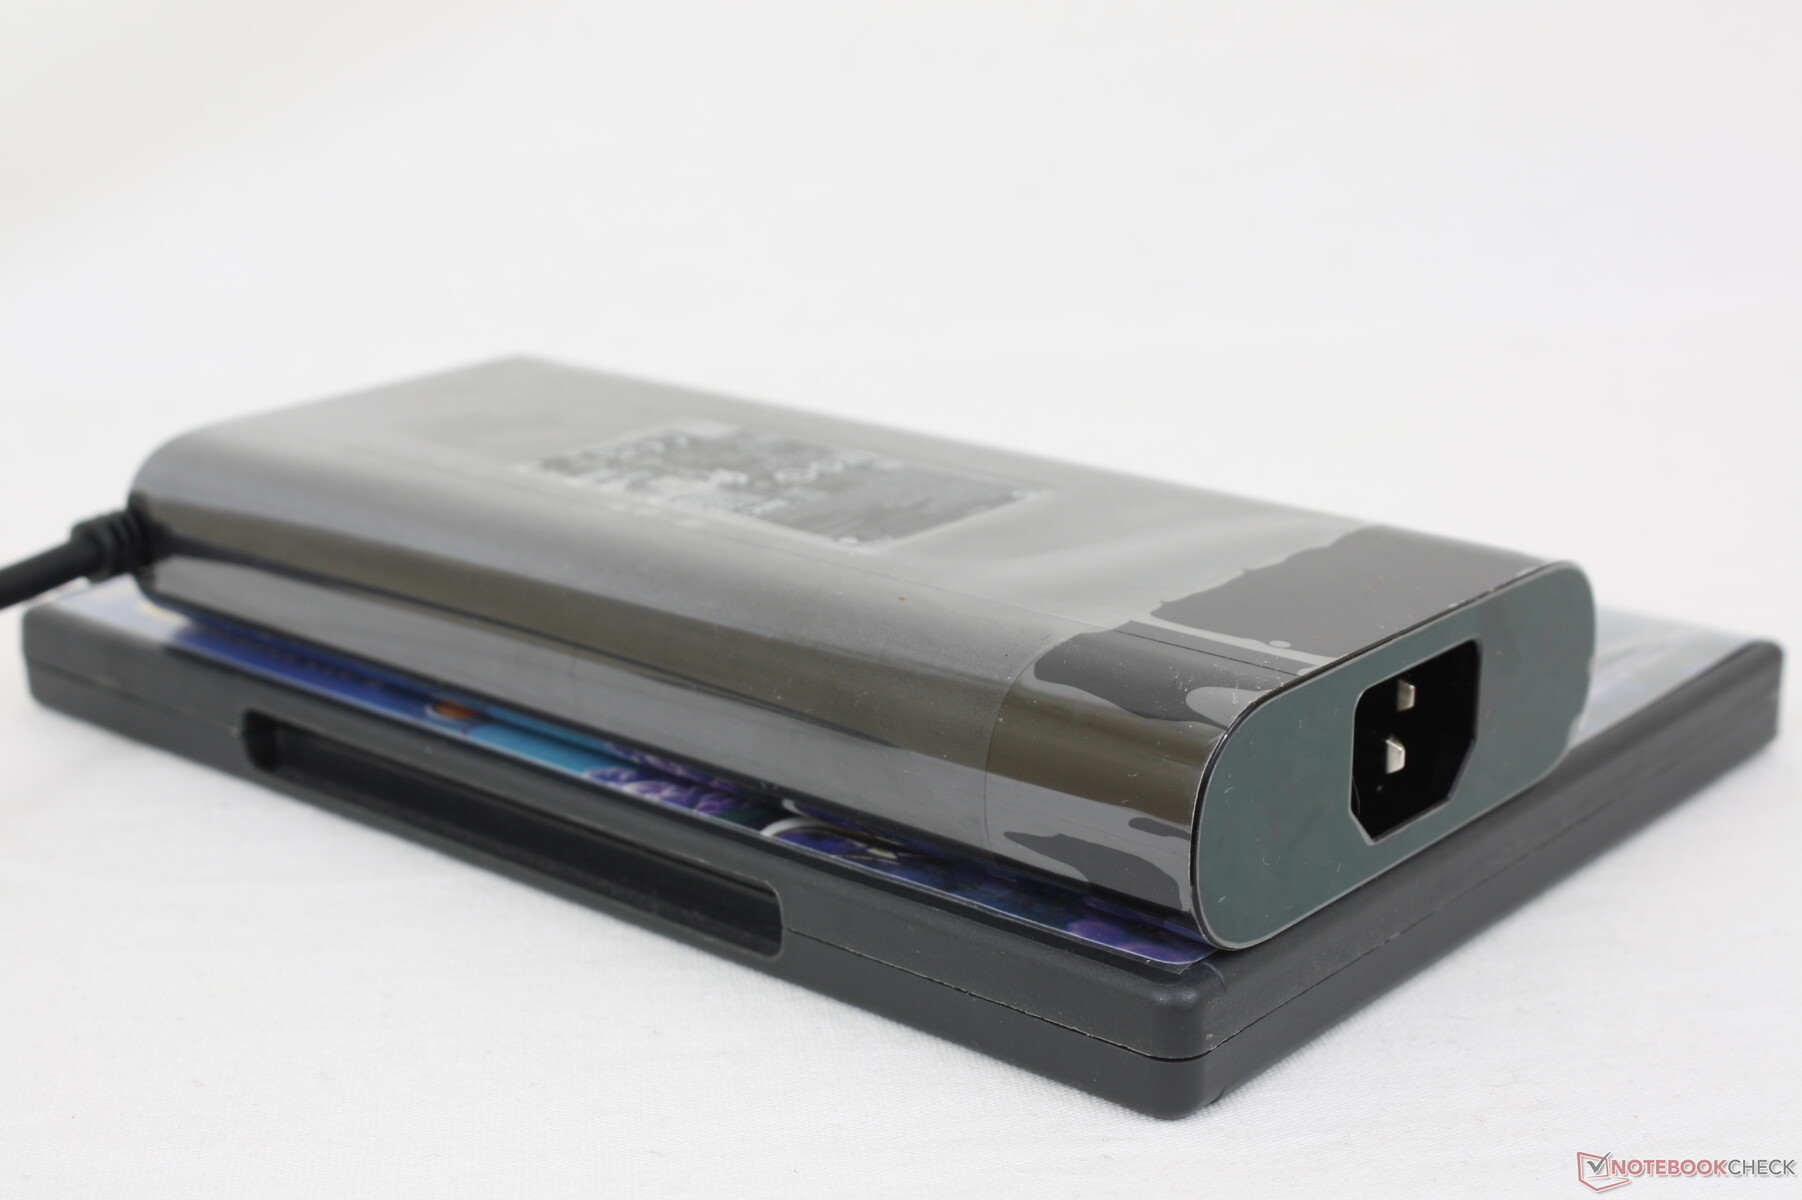
Somos capazes de medir um consumo máximo temporário de 209,8 W do adaptador AC de tamanho médio (~16,5 x 7,8 x 2,5 cm) 200 W quando a CPU e a GPU estão cada uma com 100% de utilização. O consumo se estabiliza em torno de 160 W se houver cargas extremas.
| desligado | |
| Ocioso | |
| Carga |
|
Key:
min: | |
| HP Envy 16 h0112nr i7-12700H, GeForce RTX 3060 Laptop GPU, Micron 3400 1TB MTFDKBA1T0TFH, OLED, 3840x2400, 16" | Lenovo ThinkBook 16 G4+ IAP i7-12700H, GeForce RTX 2050 Mobile, Micron 2450 1TB MTFDKCD1T0TFK, IPS, 2560x1600, 16" | MSI Creator Z16P B12UHST i9-12900H, GeForce RTX 3080 Ti Laptop GPU, Samsung PM9A1 MZVL22T0HBLB, IPS True Pixel (~100% DCI-P3), 2560x1600, 16" | Dell Inspiron 16 Plus 7610-MHJ8F i7-11800H, UHD Graphics Xe 32EUs (Tiger Lake-H), OM3PDP3-AD NVMe KDI 512GB, IPS, 3072x1920, 16" | Apple MacBook Pro 16 2021 M1 Pro M1 Pro, M1 Pro 16-Core GPU, Apple SSD AP1024R, Mini-LED, 3456x2234, 16.2" | Huawei MateBook 16s i7 i7-12700H, Iris Xe G7 96EUs, Silicon Motion PCIe-8 SSD, IPS, 2520x1680, 16" | |
|---|---|---|---|---|---|---|
| Power Consumption | 36% | -11% | 50% | 33% | 35% | |
| Idle Minimum * (Watt) | 10 | 5 50% | 11 -10% | 5.4 46% | 5 50% | 6.8 32% |
| Idle Average * (Watt) | 10.9 | 11.2 -3% | 17 -56% | 9.8 10% | 15.1 -39% | 13.2 -21% |
| Idle Maximum * (Watt) | 27.8 | 11.6 58% | 26 6% | 14 50% | 15.5 44% | 13.8 50% |
| Load Average * (Watt) | 116.4 | 89.3 23% | 124 -7% | 44 62% | 54 54% | 75.2 35% |
| Witcher 3 ultra * (Watt) | 133.7 | 83 38% | 133.5 -0% | 44 67% | 56.1 58% | |
| Load Maximum * (Watt) | 209.8 | 102 51% | 212 -1% | 76.8 63% | 90 57% | 90.6 57% |
* ... menor é melhor
Power Consumption Witcher 3 / Stresstest
Power Consumption external Monitor
Vida útil da bateria
O tempo de execução da WLAN é comparável ao MateBook 16s i7 ou ThinkBook 16 G4+ IAP em cerca de 8 horas. A capacidade da bateria permanece idêntica à da inveja 2020 15, apesar da mudança para uma tela de tamanho maior.
O carregamento do vazio ao cheio com o adaptador de barril incluído leva aproximadamente 1,5 horas. O sistema não pode ser recarregado via USB-C, apesar do que as especificações oficiais possam exigir. Quando um carregador USB-C de 100 W é conectado, o sistema simplesmente daria um aviso para usar um carregador de maior capacidade em seu lugar. Fizemos contato com a HP para esclarecimento e atualizaremos esta seção de acordo.
| HP Envy 16 h0112nr i7-12700H, GeForce RTX 3060 Laptop GPU, 83 Wh | Lenovo ThinkBook 16 G4+ IAP i7-12700H, GeForce RTX 2050 Mobile, 71 Wh | MSI Creator Z16P B12UHST i9-12900H, GeForce RTX 3080 Ti Laptop GPU, 90 Wh | Dell Inspiron 16 Plus 7610-MHJ8F i7-11800H, UHD Graphics Xe 32EUs (Tiger Lake-H), 86 Wh | Apple MacBook Pro 16 2021 M1 Pro M1 Pro, M1 Pro 16-Core GPU, 99.6 Wh | Huawei MateBook 16s i7 i7-12700H, Iris Xe G7 96EUs, 84 Wh | |
|---|---|---|---|---|---|---|
| Duração da bateria | -1% | -36% | 67% | 114% | 11% | |
| Reader / Idle (h) | 17.8 | 22.5 26% | ||||
| WiFi v1.3 (h) | 7.9 | 8.2 4% | 5.2 -34% | 9.5 20% | 16.9 114% | 8.1 3% |
| Load (h) | 1.6 | 1.5 -6% | 1 -37% | 4.1 156% | 1.9 19% | |
| H.264 (h) | 12.6 | 5.8 | 17.5 | 9.3 | ||
| WiFi (h) | 9.5 |
Pro
Contra
Veredicto - Como um orçamento MacBook Pro 16
A Envy 16 é mais rápida que a Envy 15 mais antiga, é claro, mas alguns dos inconvenientes que mencionamos na Envy 15 ainda não foram resolvidos. Os ventiladores barulhentos, sem fechadura Kensington, clickpad esponjoso e dobradiças relativamente fracas são um passo abaixo de alternativas como a MacBook Pro 16 ou Dell Inspiron 16 Plus. O sistema é também um dos maiores e mais pesados laptops de 16 polegadas do mercado, o que pode deter os viajantes e estudantes.
O HP Envy 16 é quase $1000 mais barato do que o MacBook Pro 16 básico, ao mesmo tempo em que oferece características e cores de desempenho competitivas. No entanto, é um sistema bastante barulhento e pesado.
Os usuários que não são adiados pelo peso acharão o Envy 16 um sistema versátil com o desempenho, tamanho de tela e cores adequadas para fins de jogos e edição. Apreciamos especialmente como é simples adicionar mais armazenamento ou RAM, se necessário. Entretanto, se suas tarefas não requerem muita potência, então, opções muito mais leves de 16 polegadas devem ser consideradas como a LG Gram 16 ou Huawei MateBook 16s.
Preço e Disponibilidade
O Envy 16 está agora disponível nos principais varejistas, incluindo Newegg, Best Buy, Costco, Micro Center, e HP.com em várias configurações. Nossa configuração específica pode ser encontrada em Micro Center por $1700 USD, enquanto as SKUs Intel Arc A370M podem ser encontradas em outros lugares.
HP Envy 16 h0112nr
- 09/24/2022 v7 (old)
Allen Ngo
Price comparison

