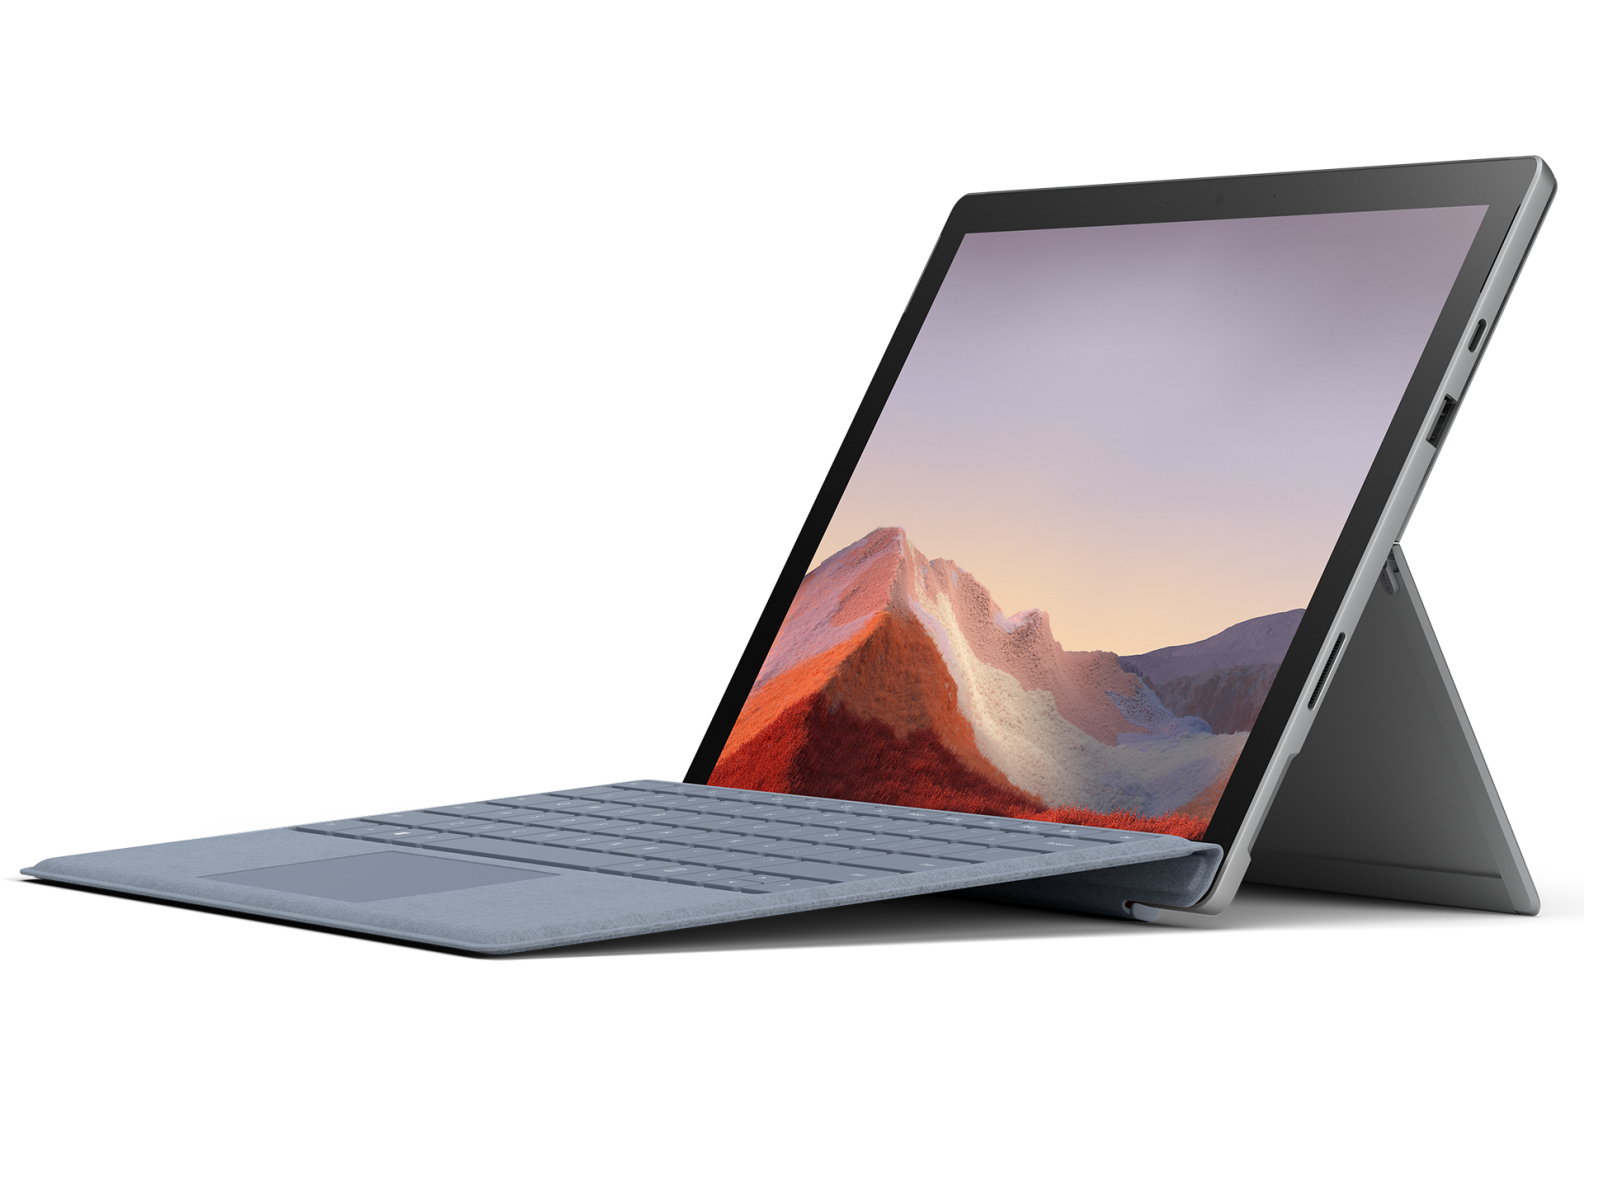
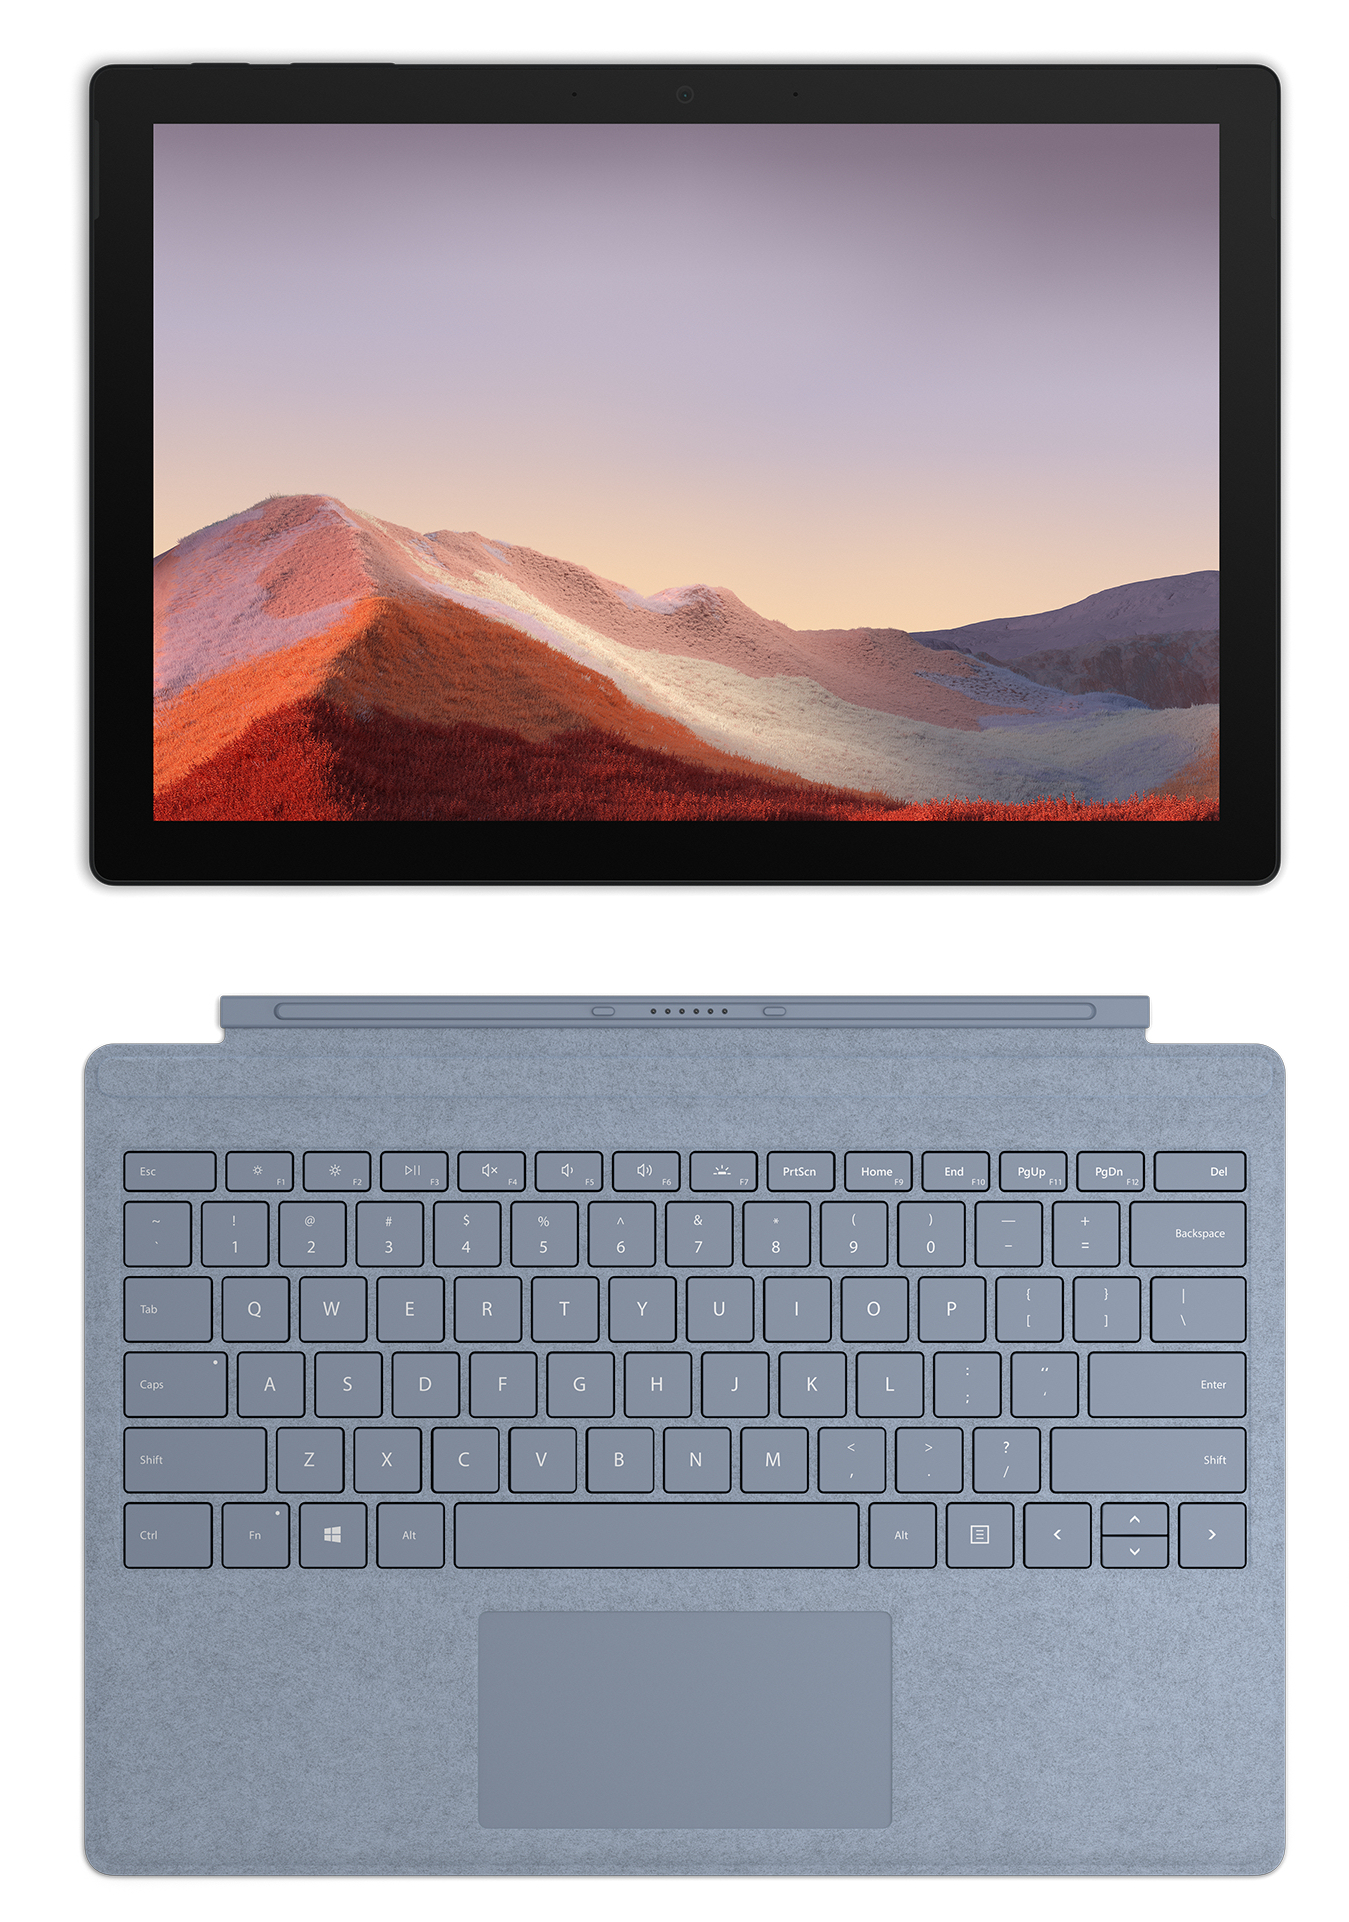
Microsoft Surface Pro 7 Plus em revisão: Tiger Lake fornece um aumento de desempenho

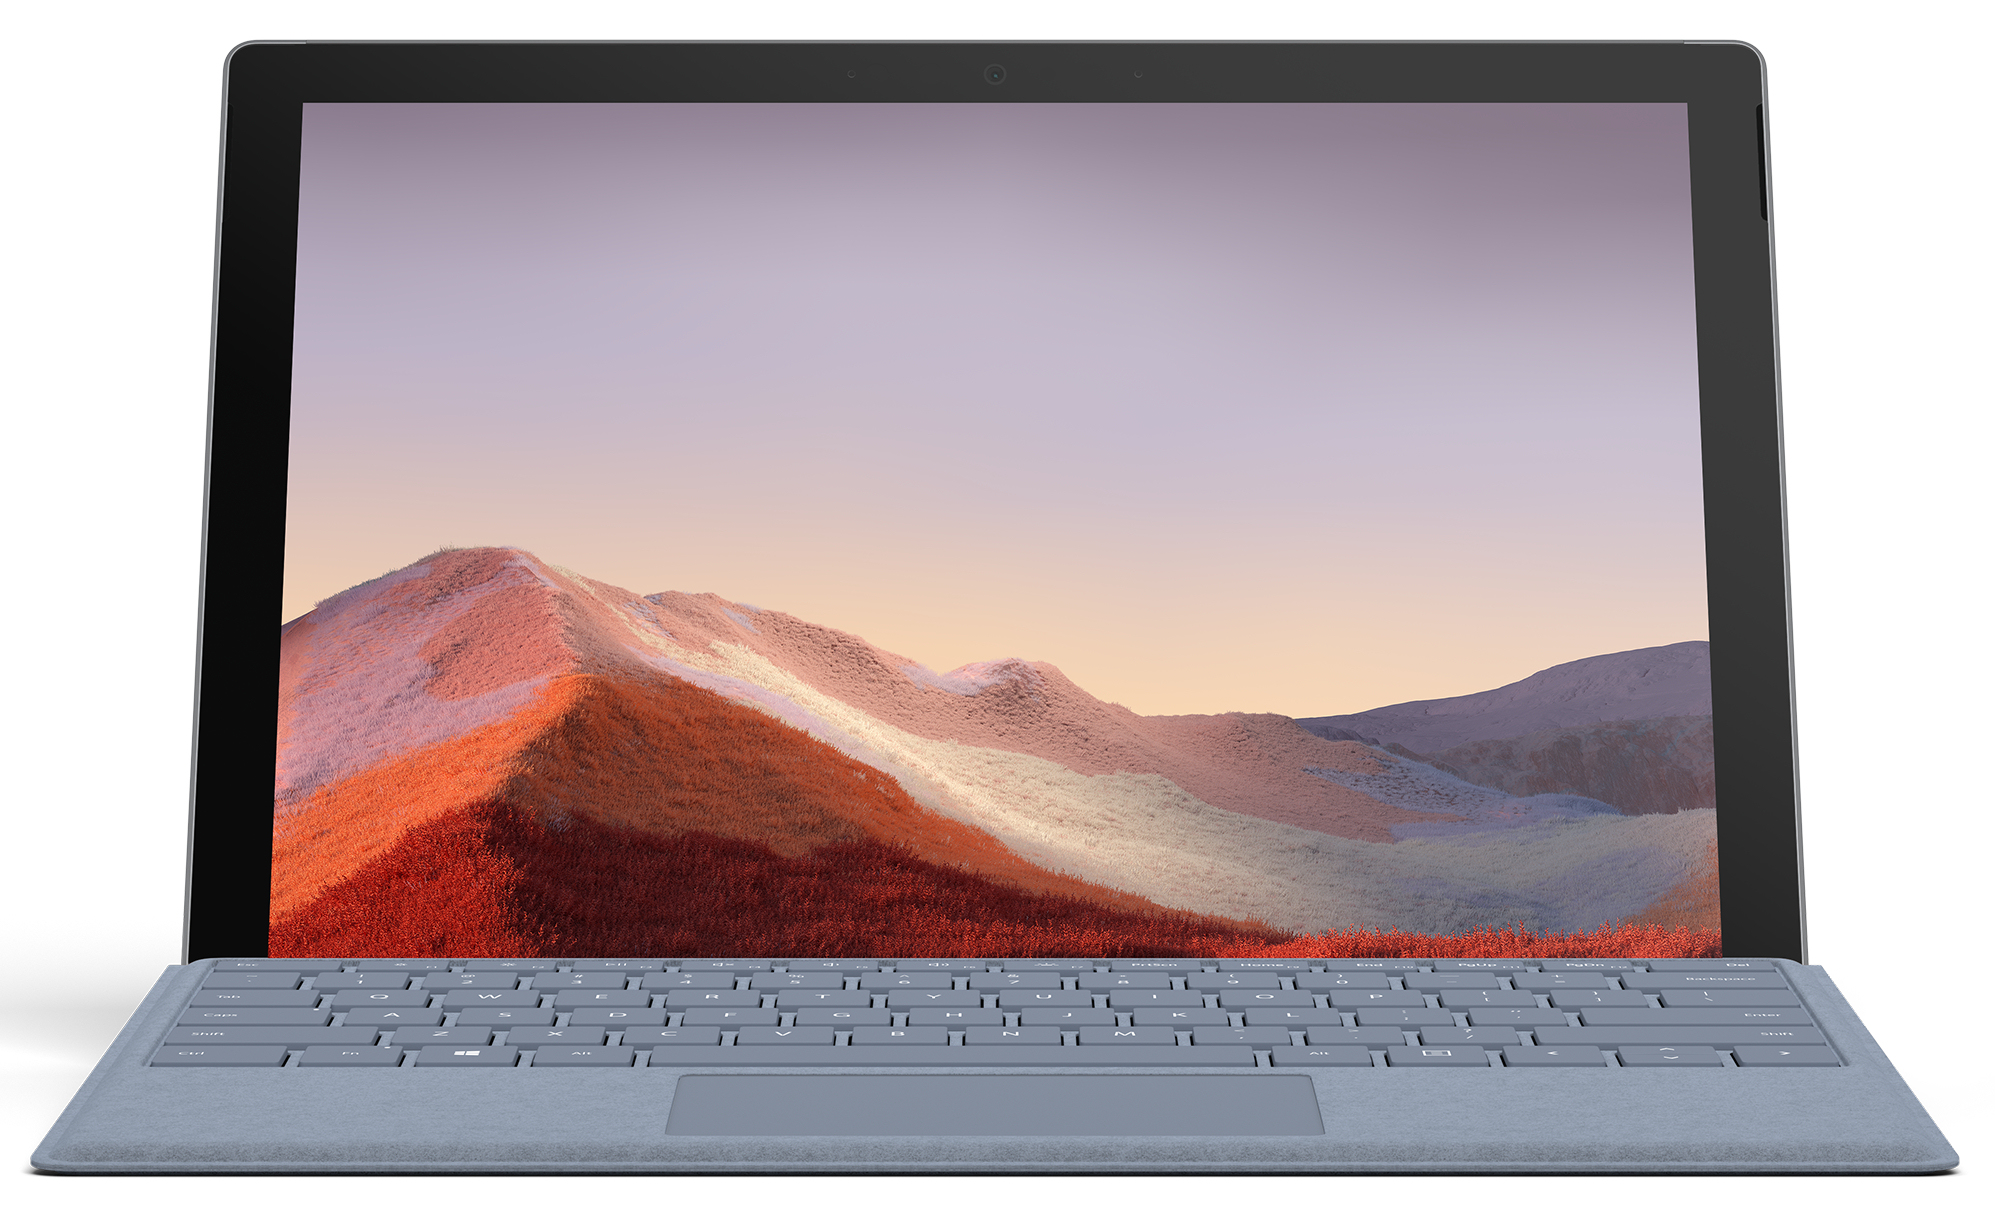
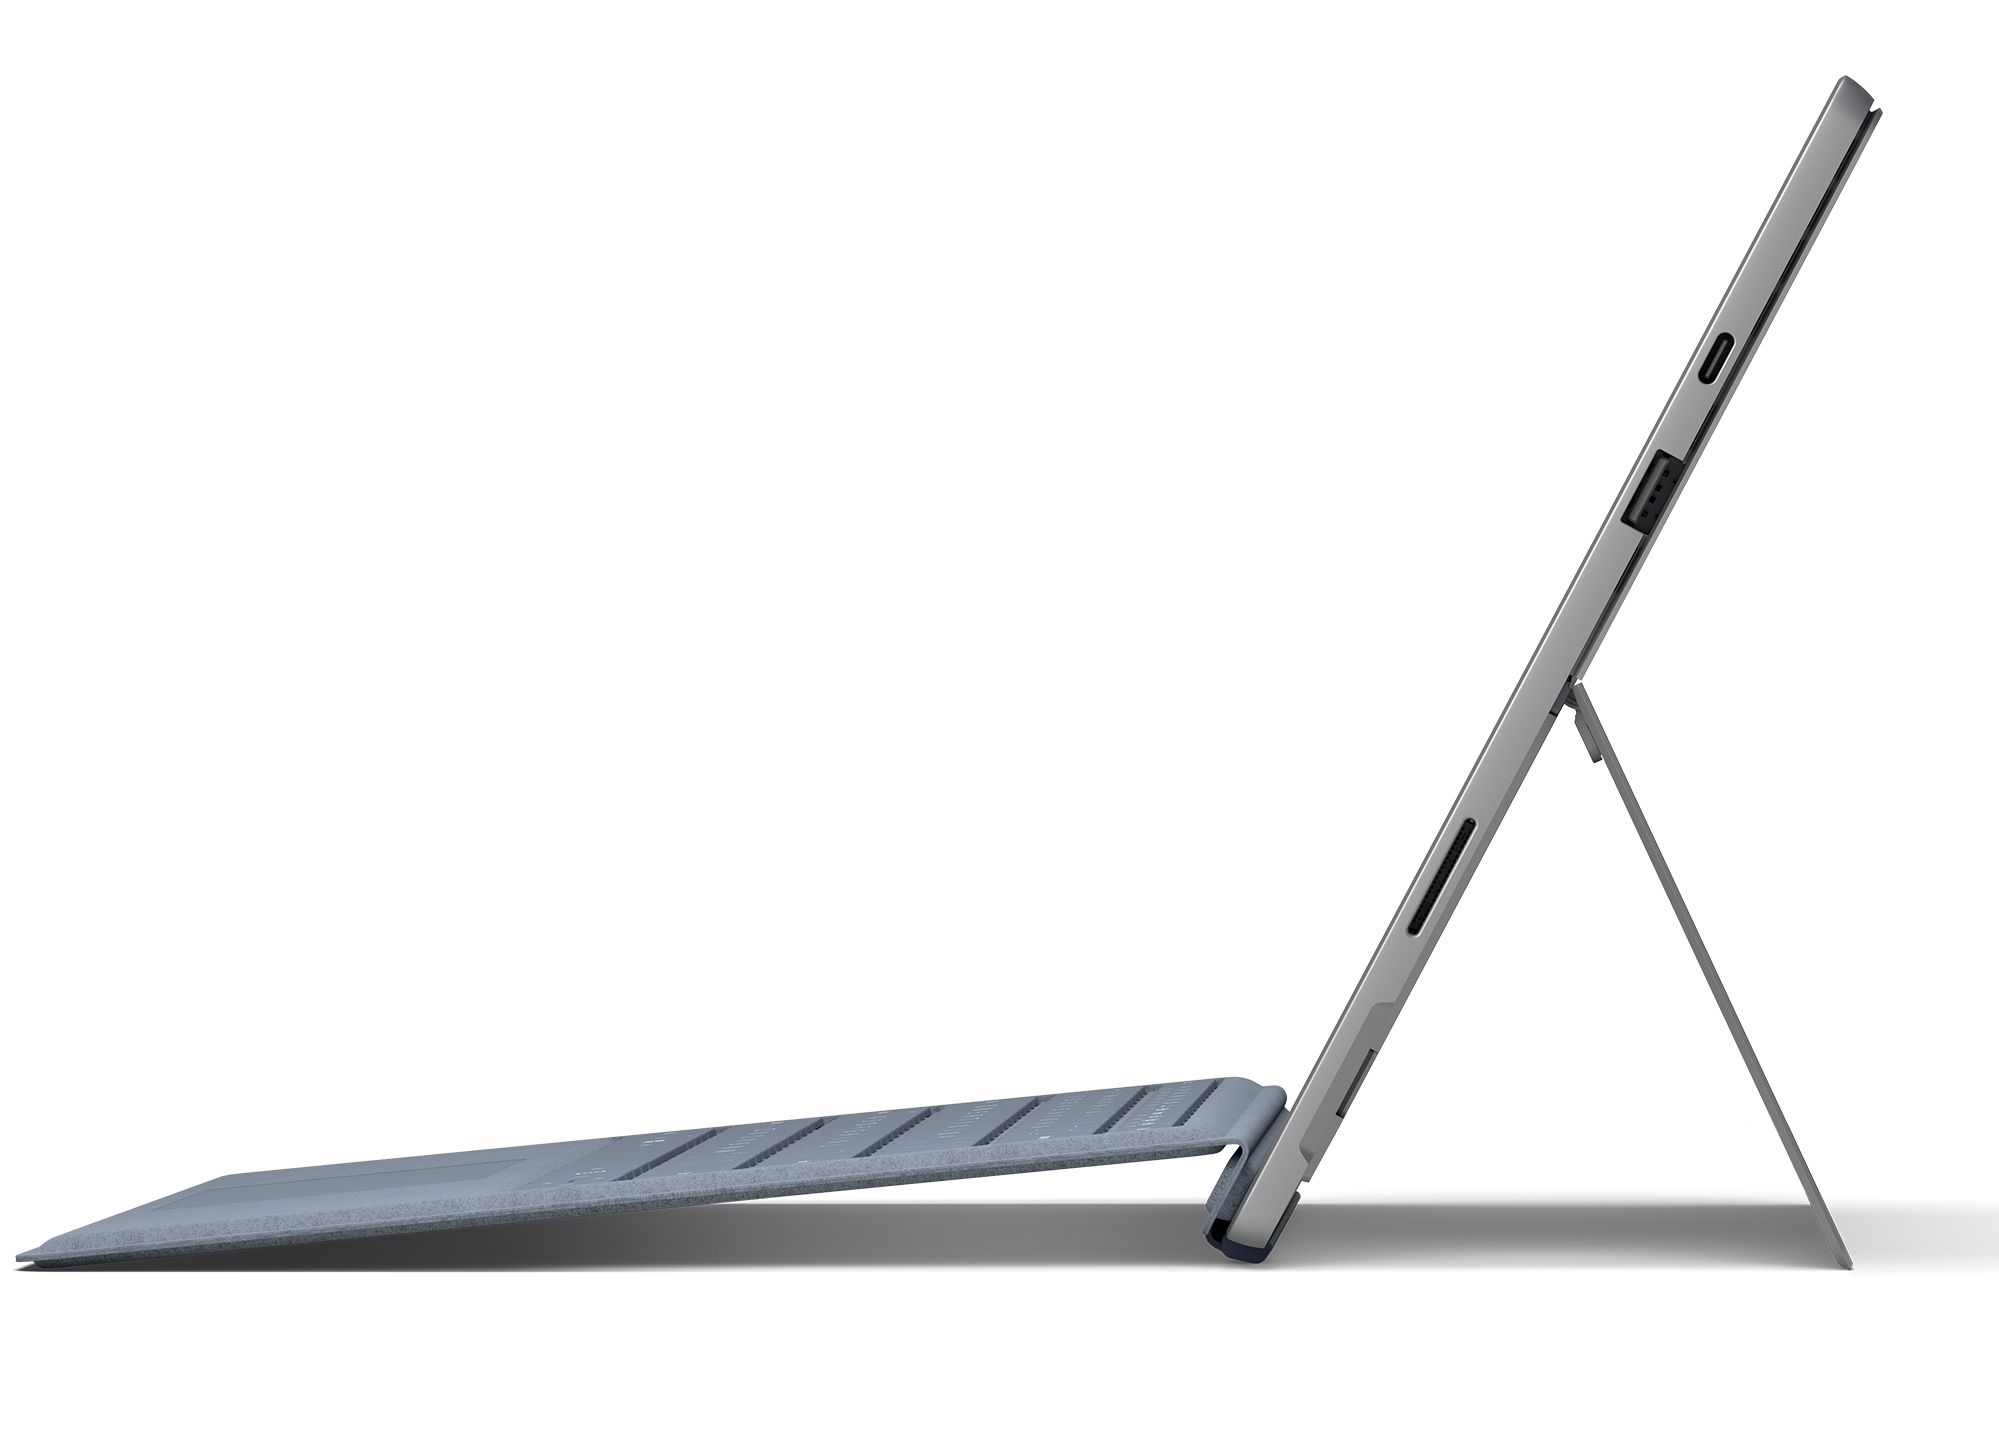
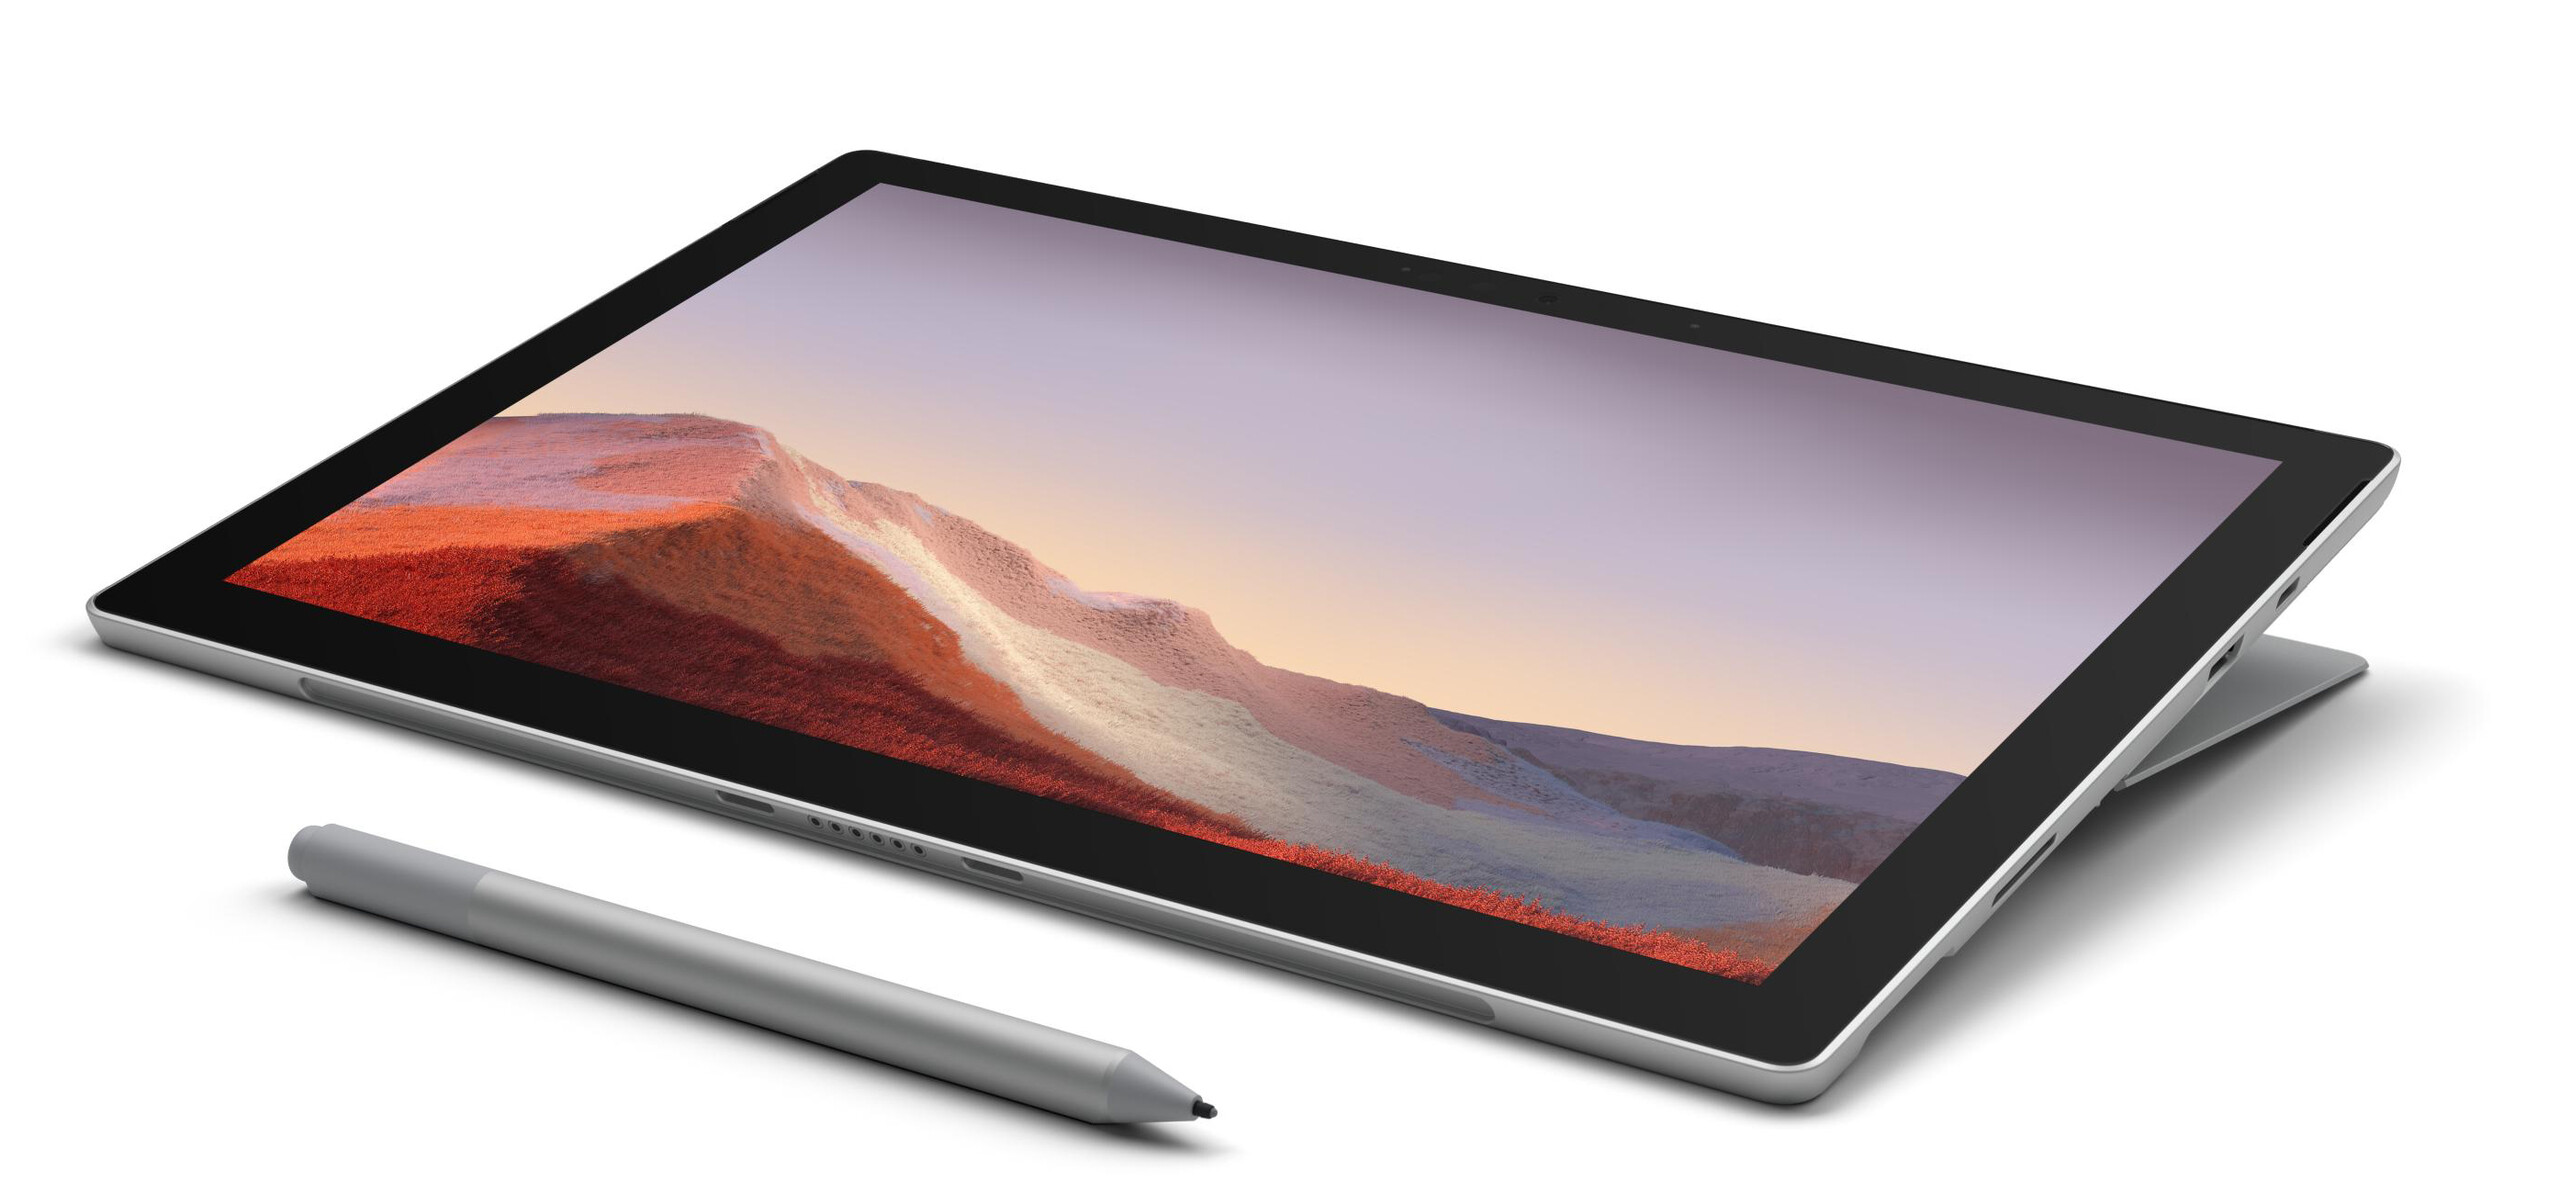
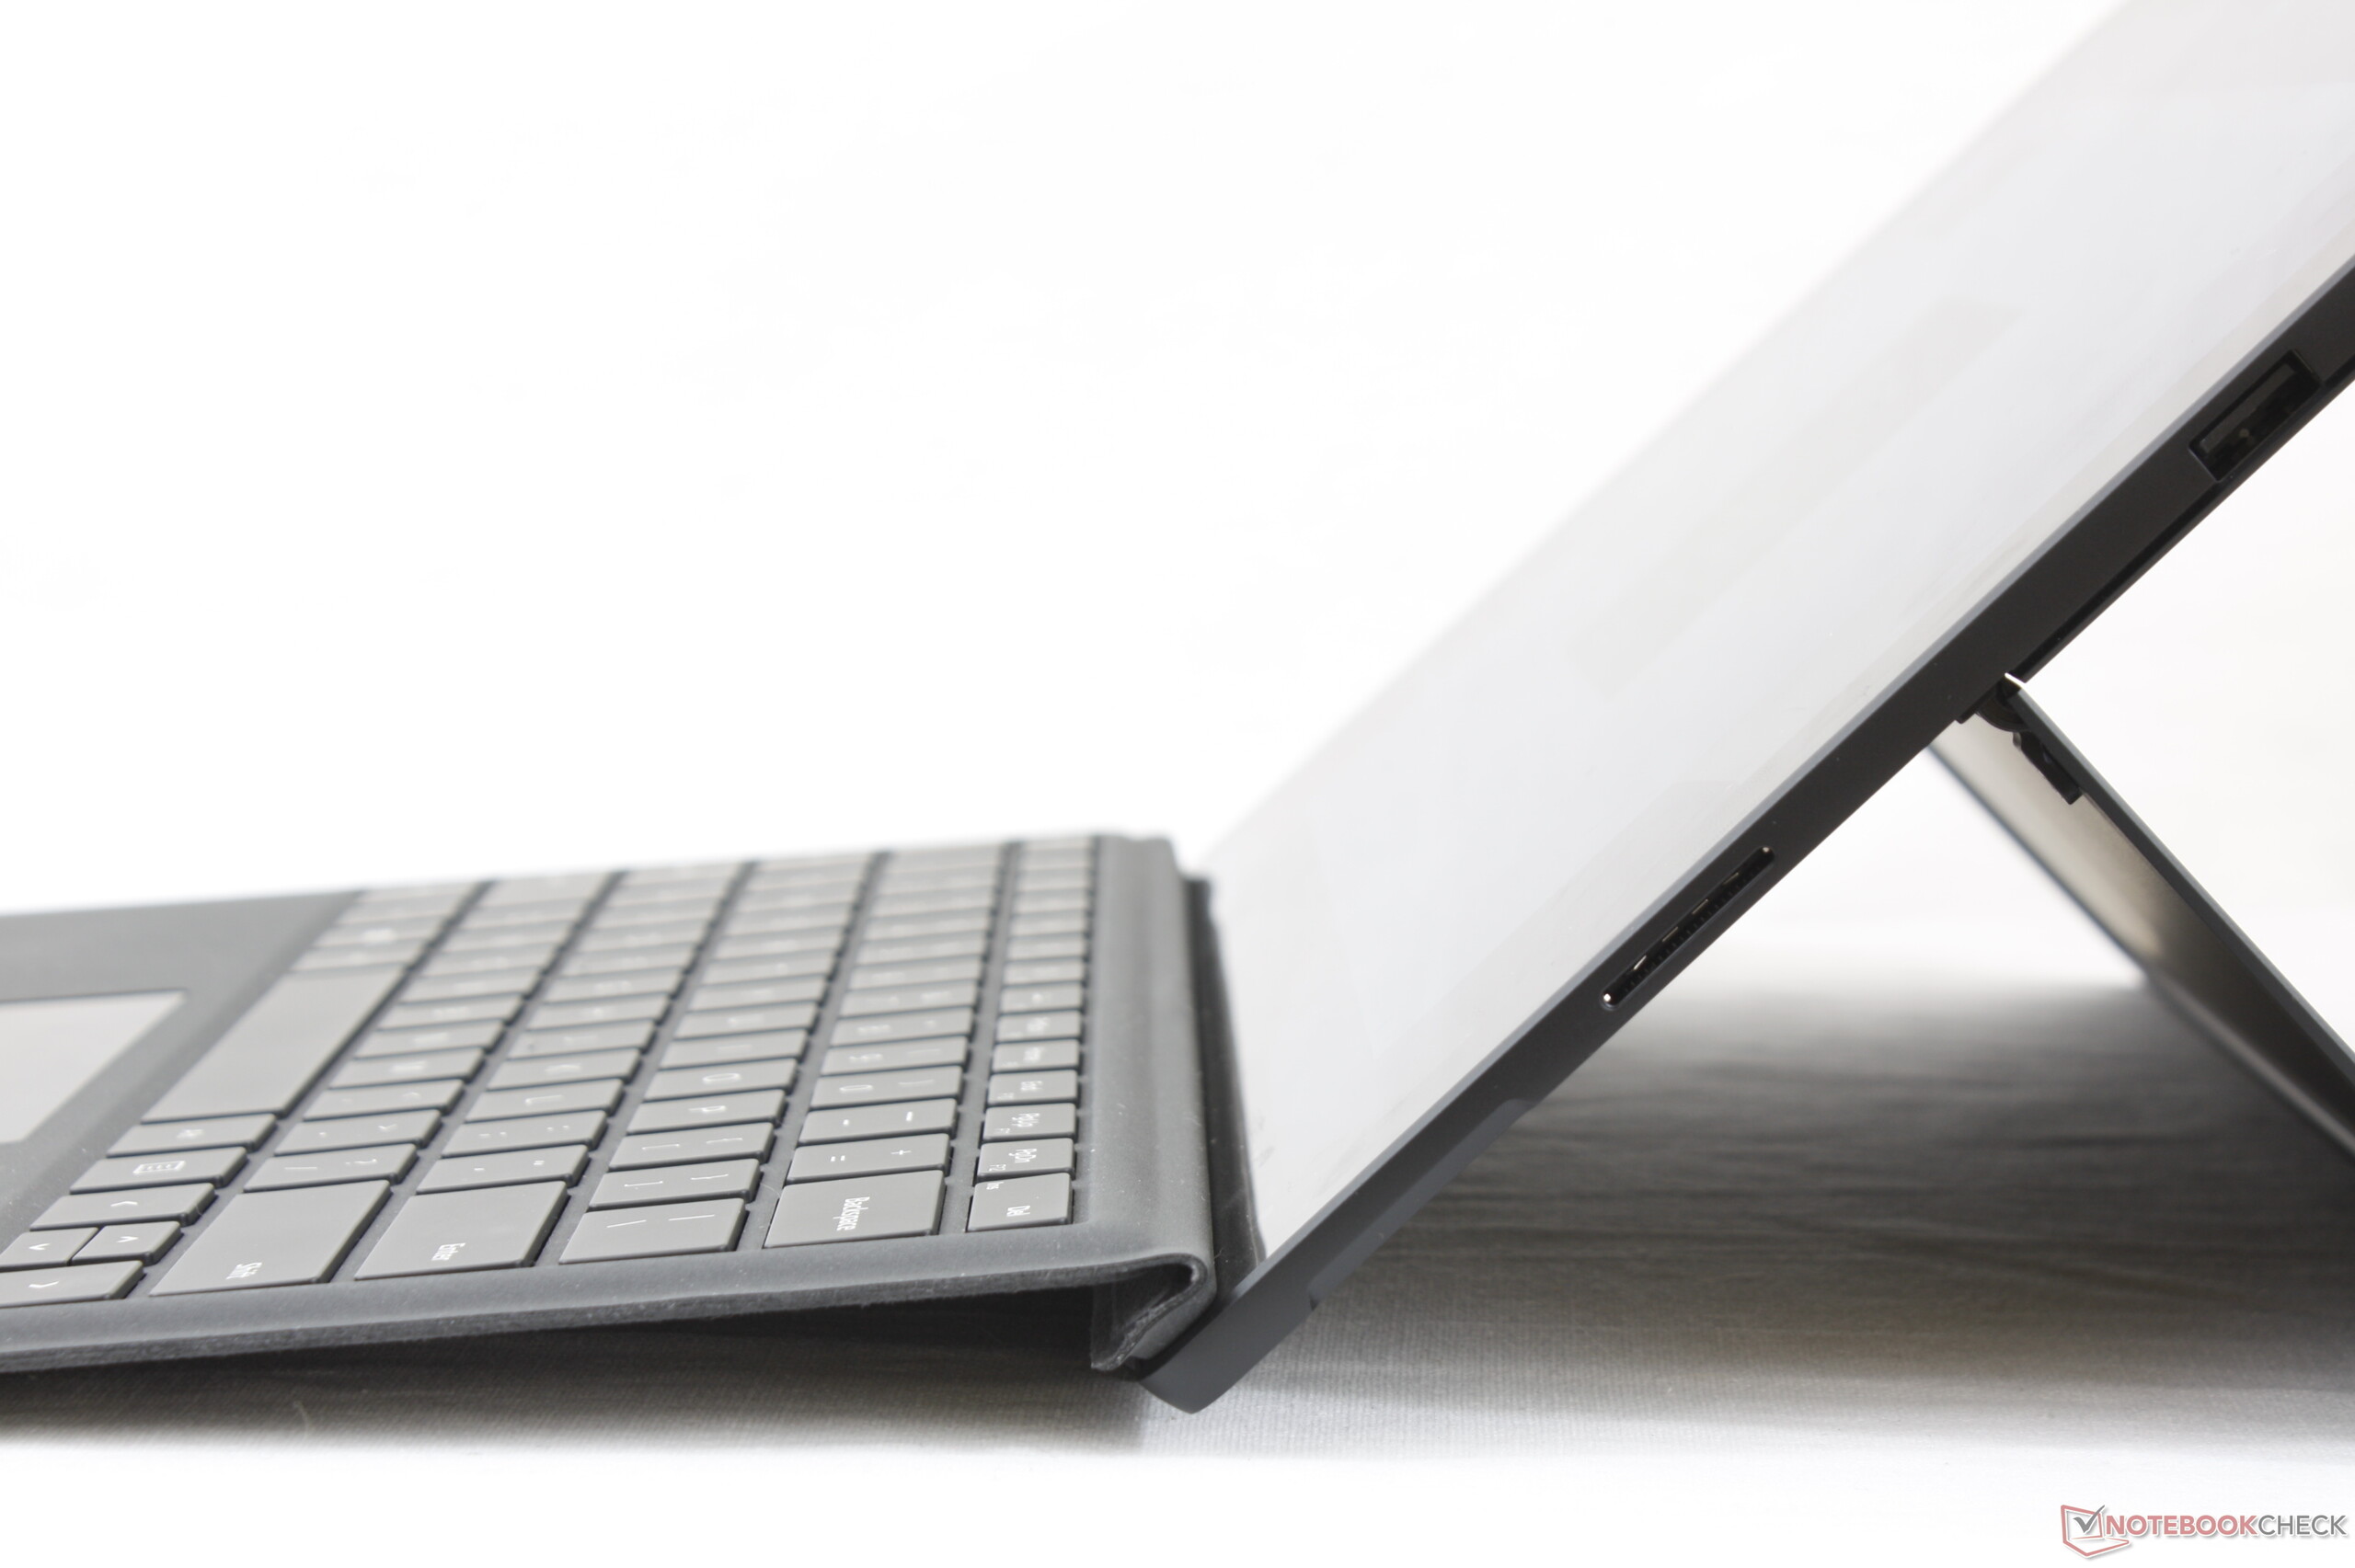
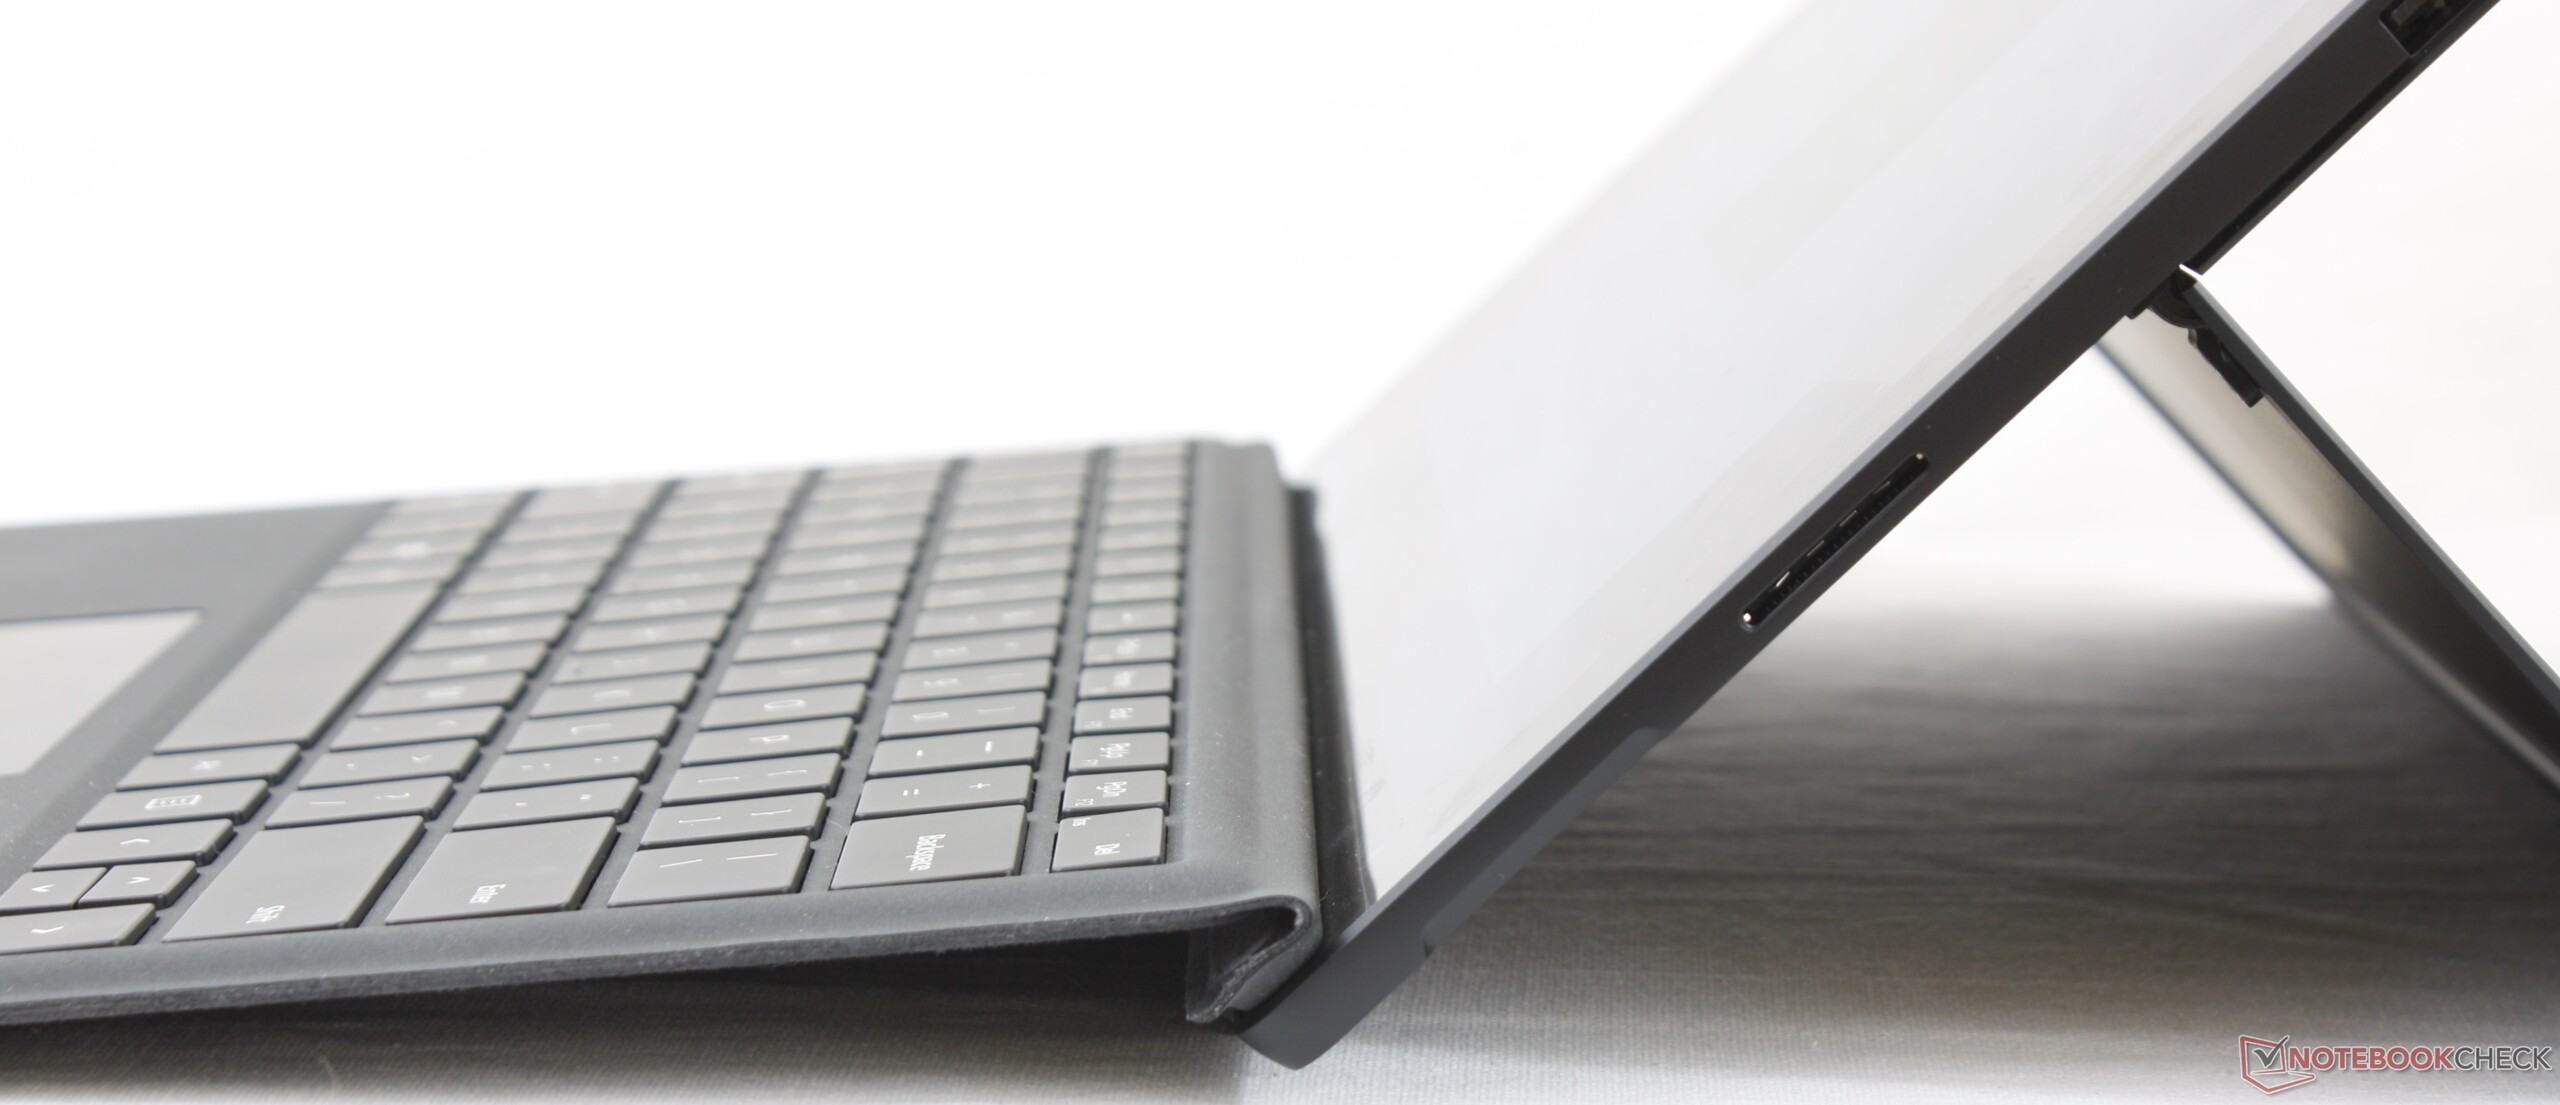
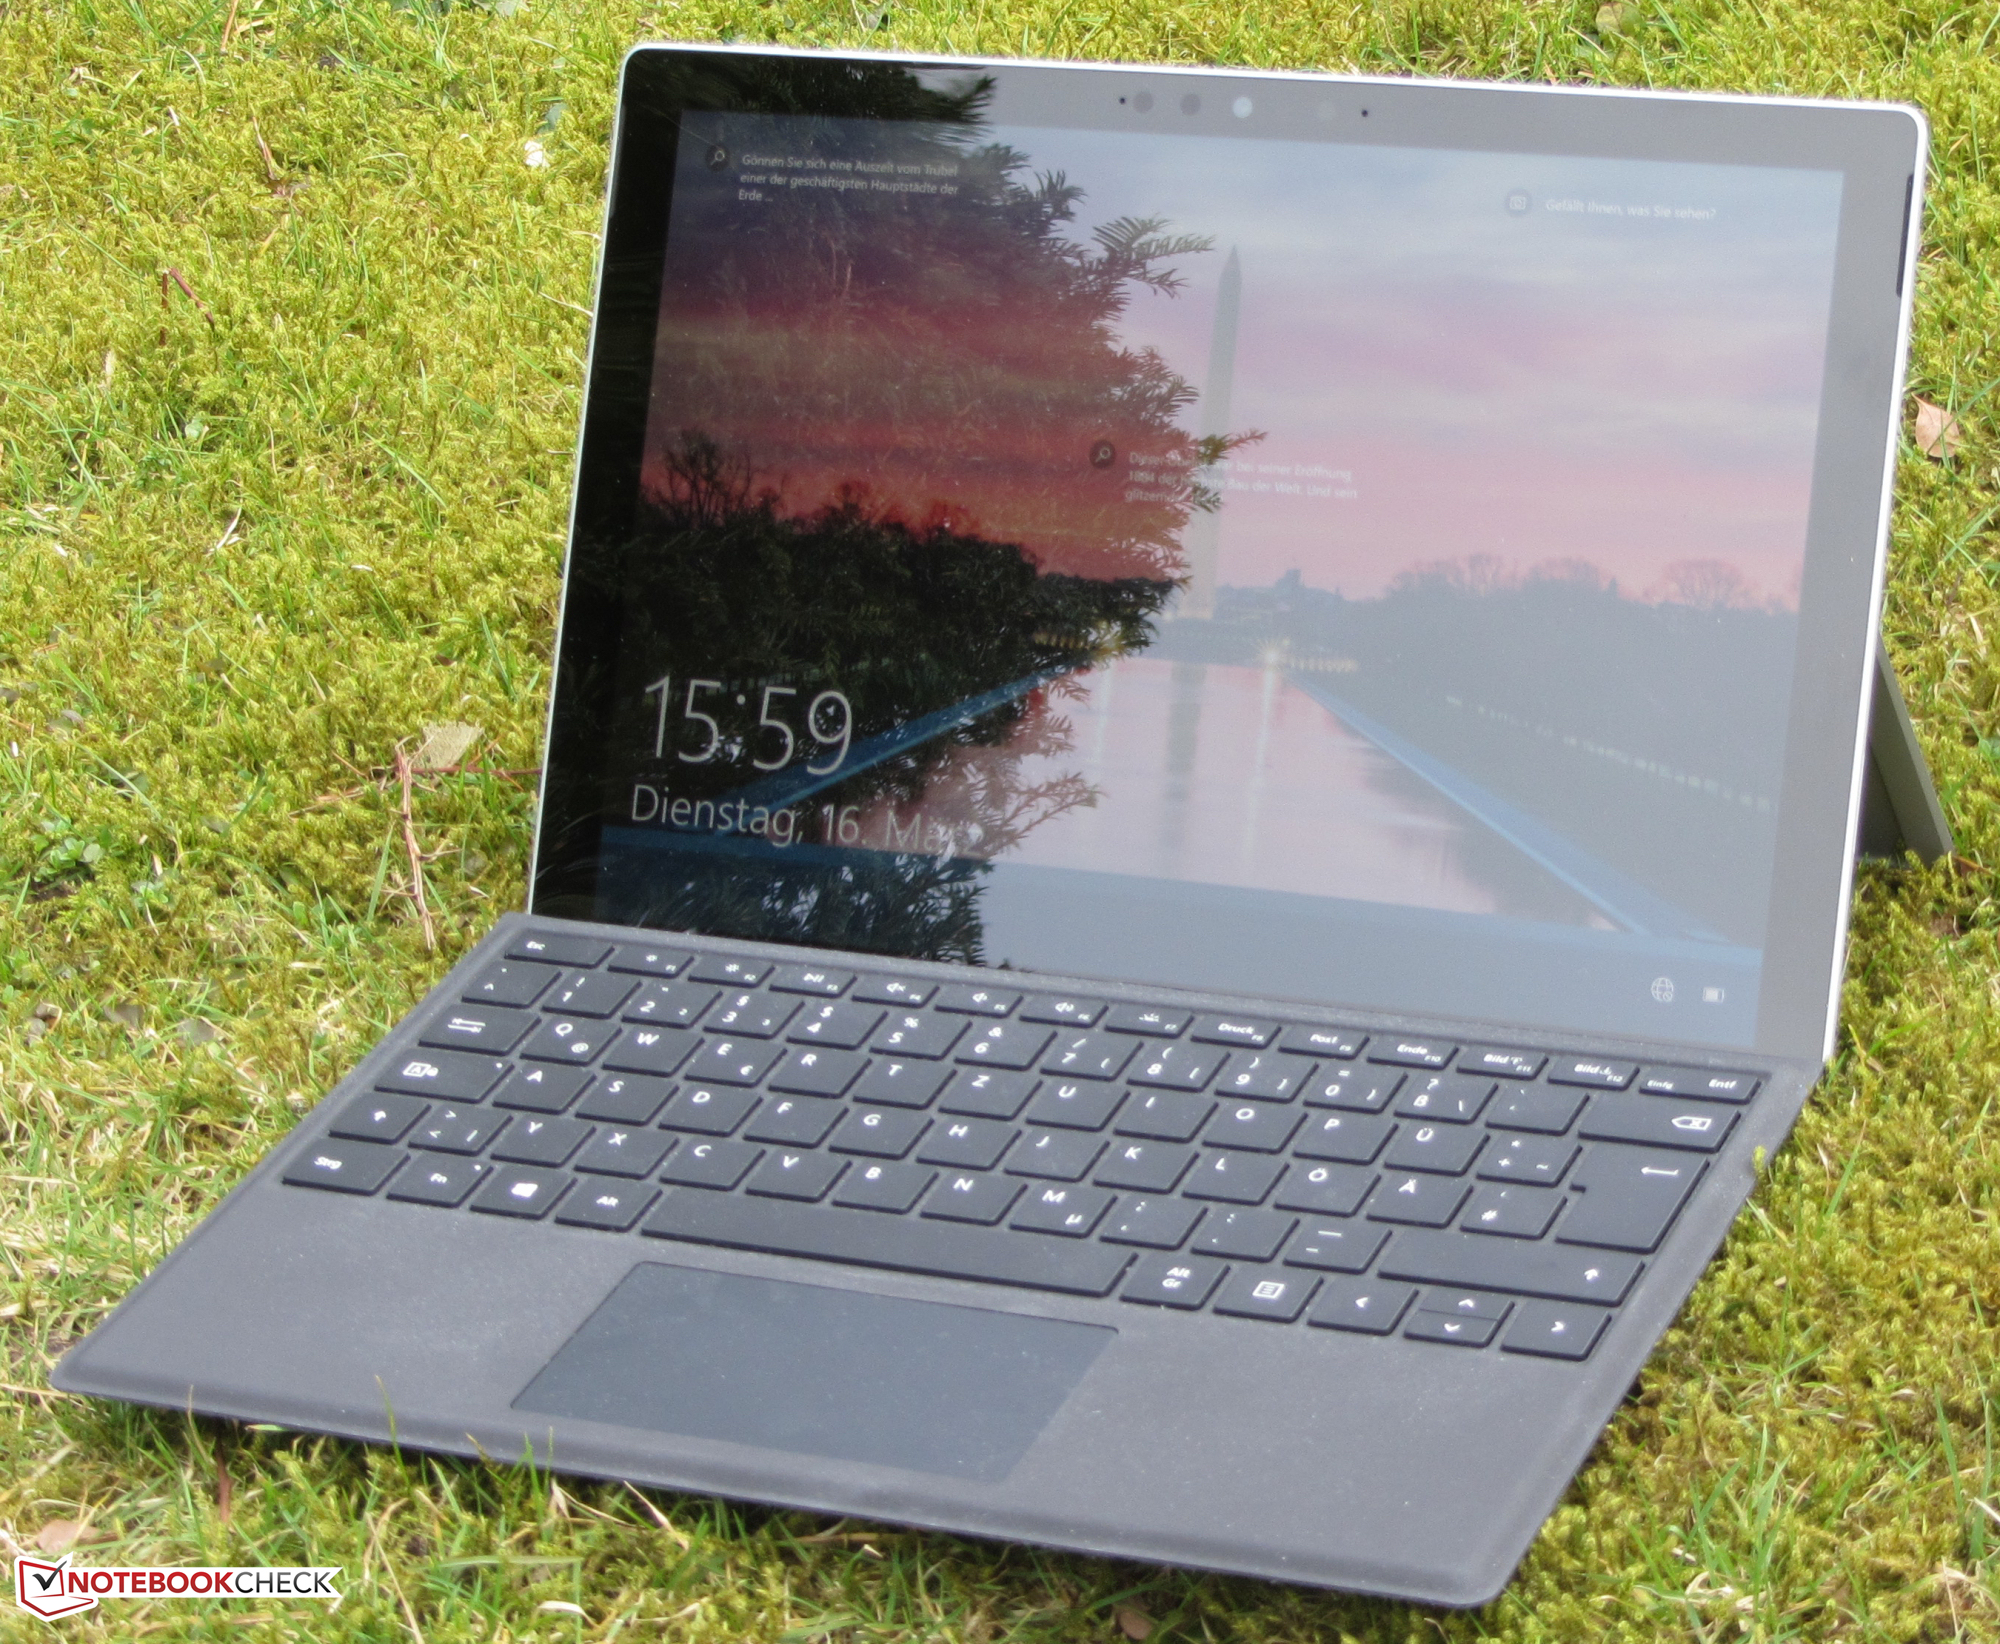
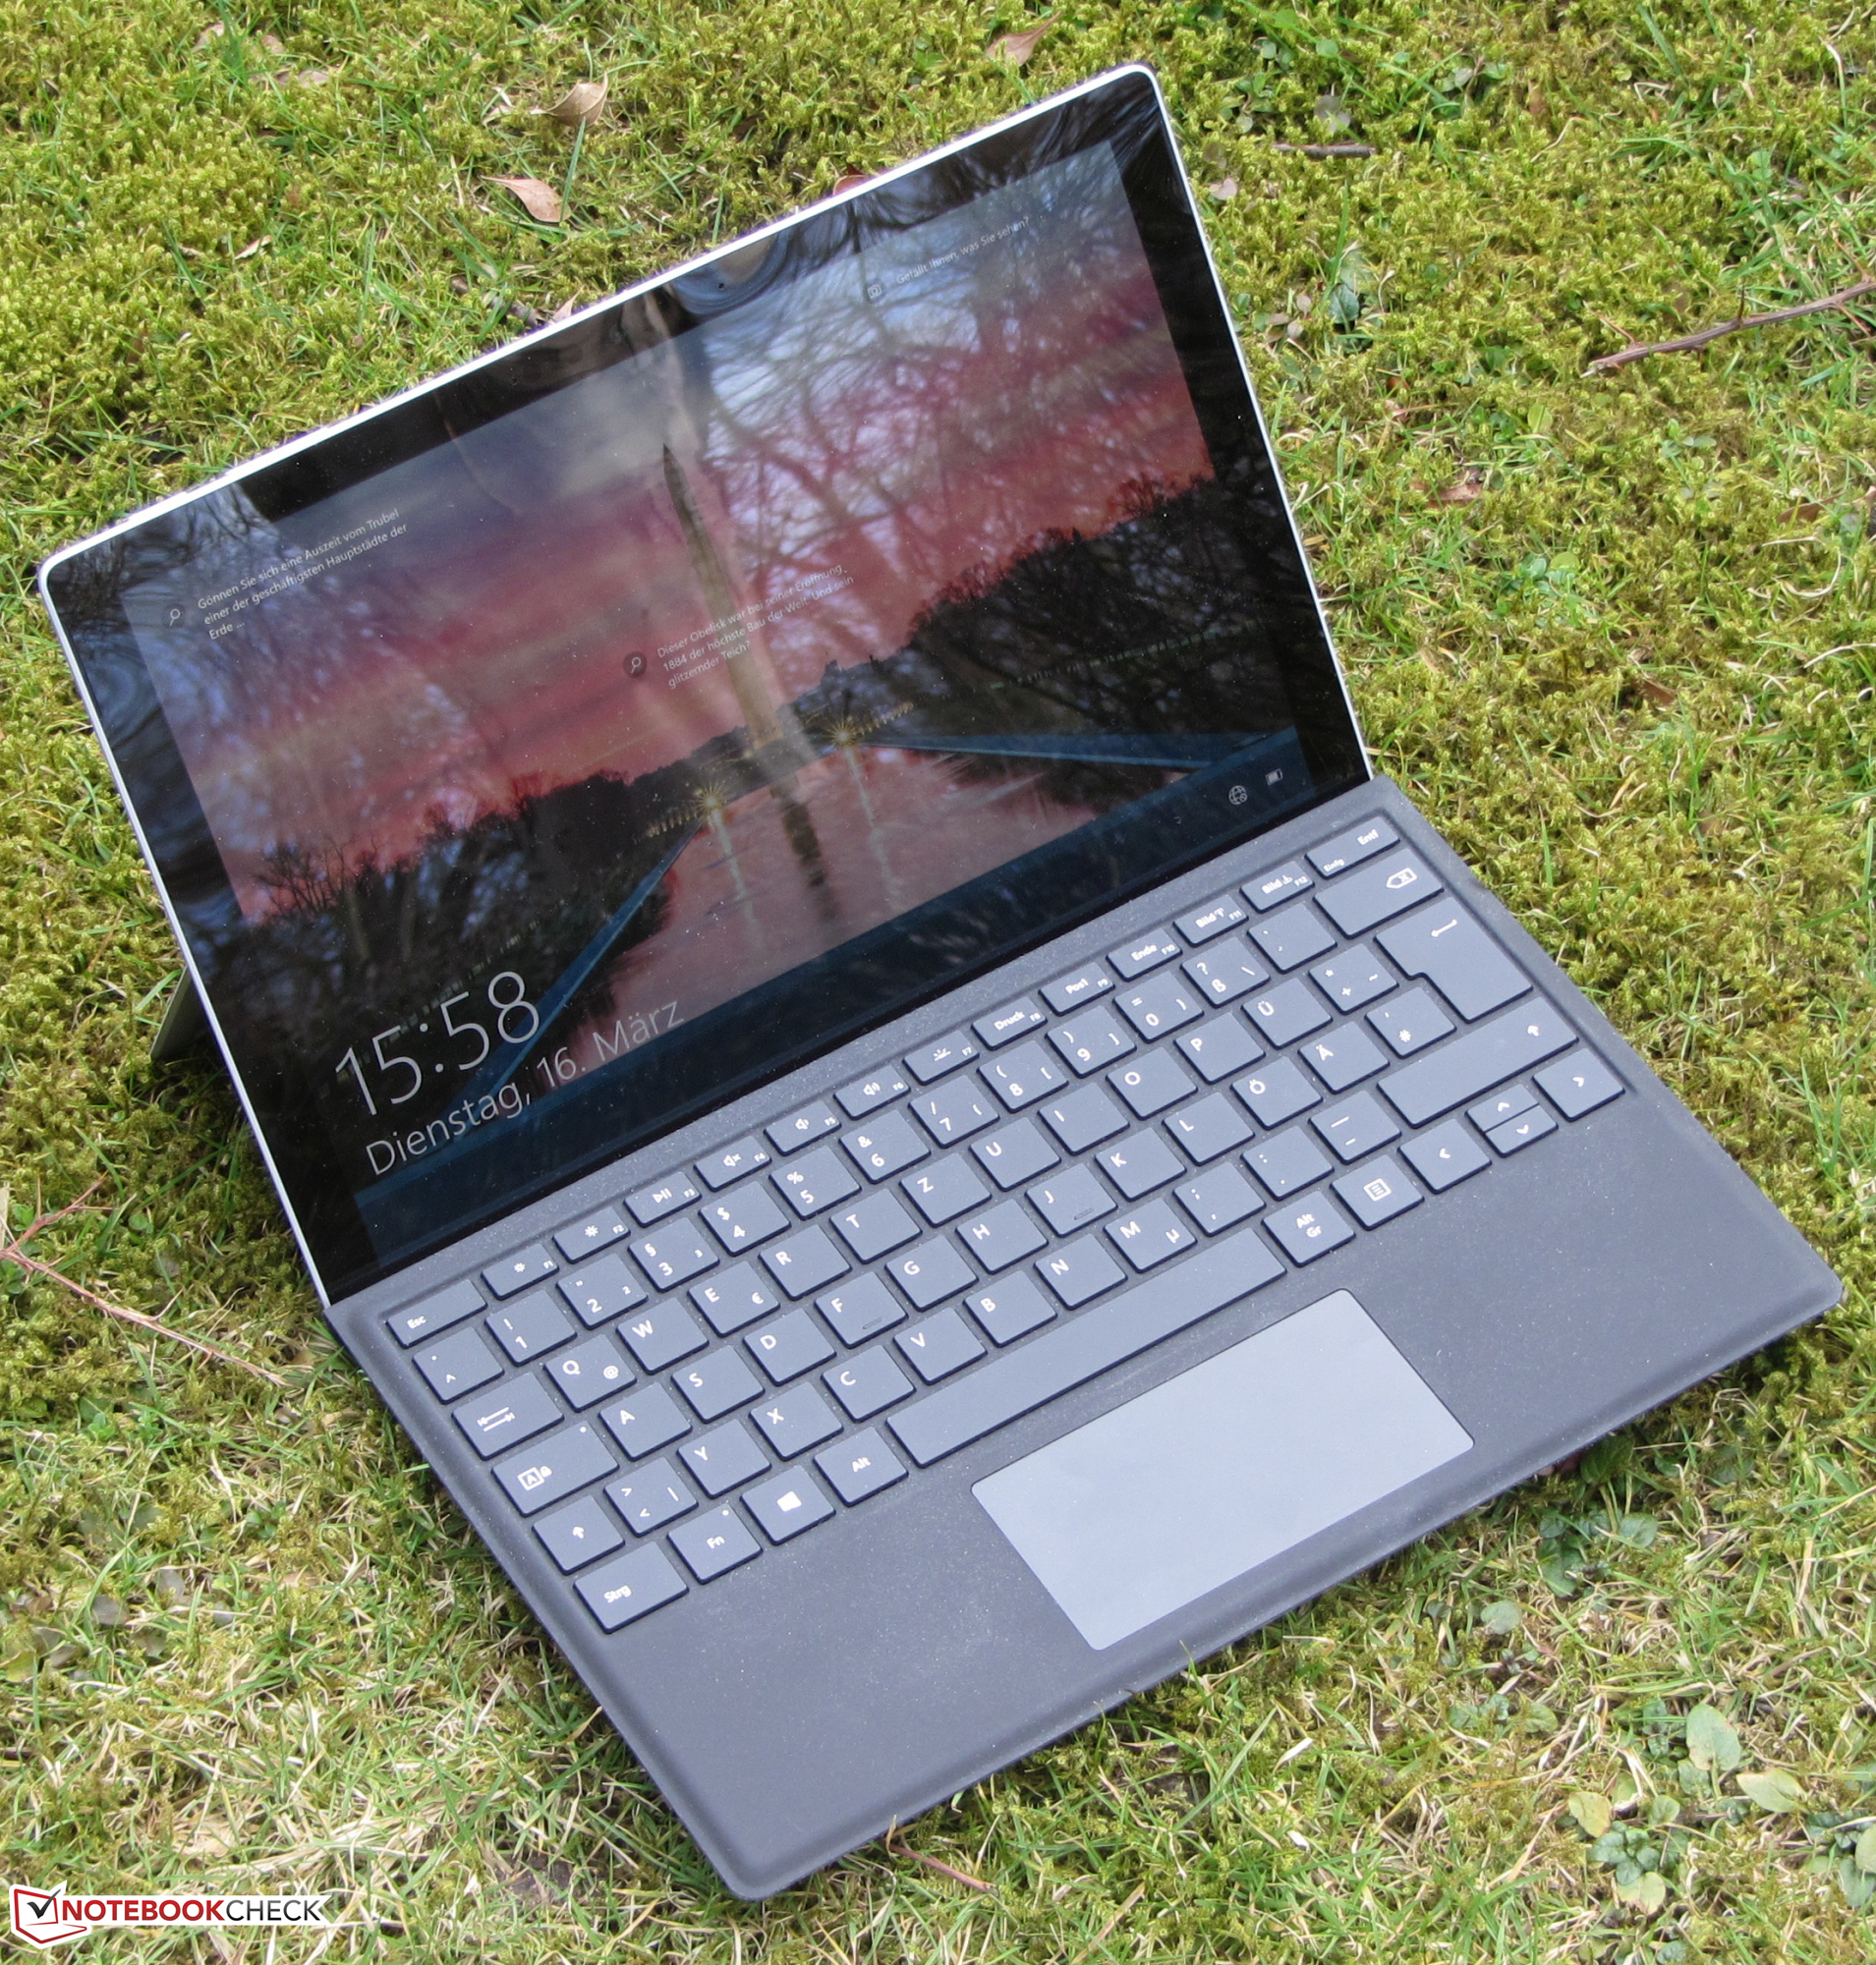
O Surface Pro 7 está disponível desde 2019. Portanto, a Microsoft considera que chegou o momento de introduzir algumas atualizações. Dentro, agora há Tiger Lake ao invés de Ice Lake processadores, o SSD pode ser substituído, a capacidade da bateria aumentou um pouco, e um modem LTE está disponível opcionalmente - este último apenas em combinação com um processador Core i5. Externamente, praticamente nada mudou em comparação com os modelos regulares Surface Pro 7. O Surface Pro 7 Plus concorre com o Dell Latitude 12 7210e oLenovo Yoga Duet 7.
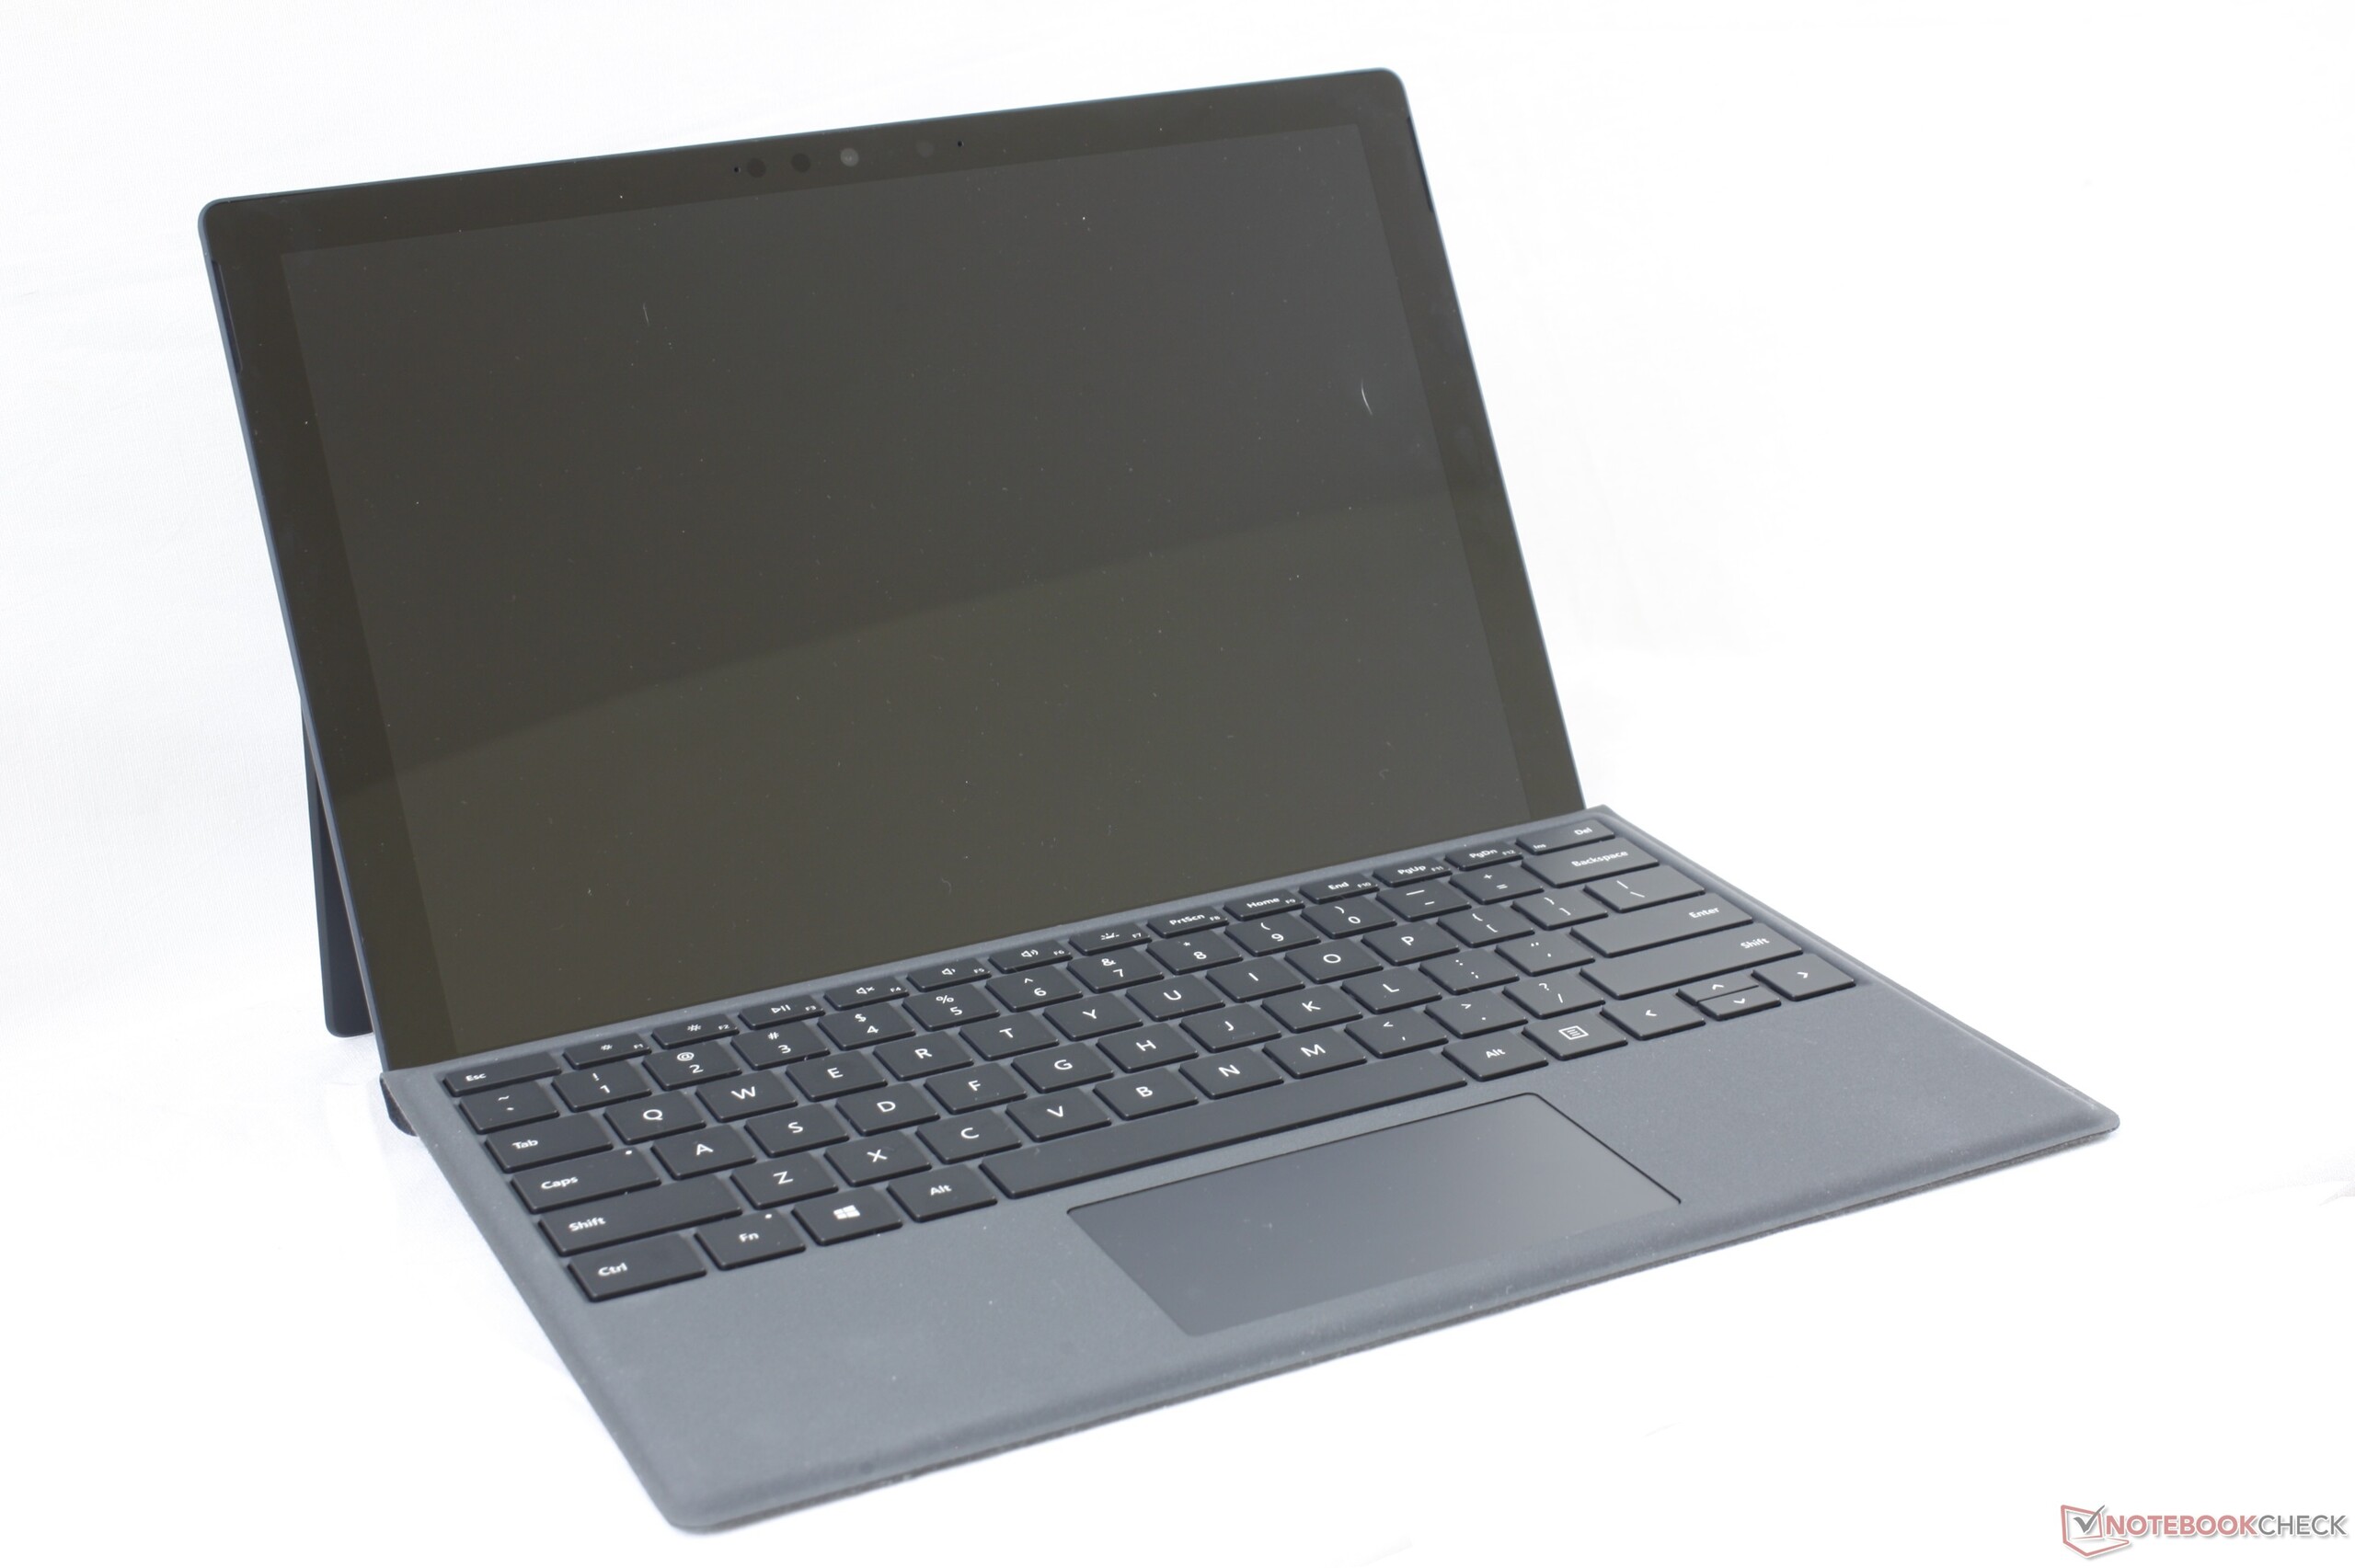
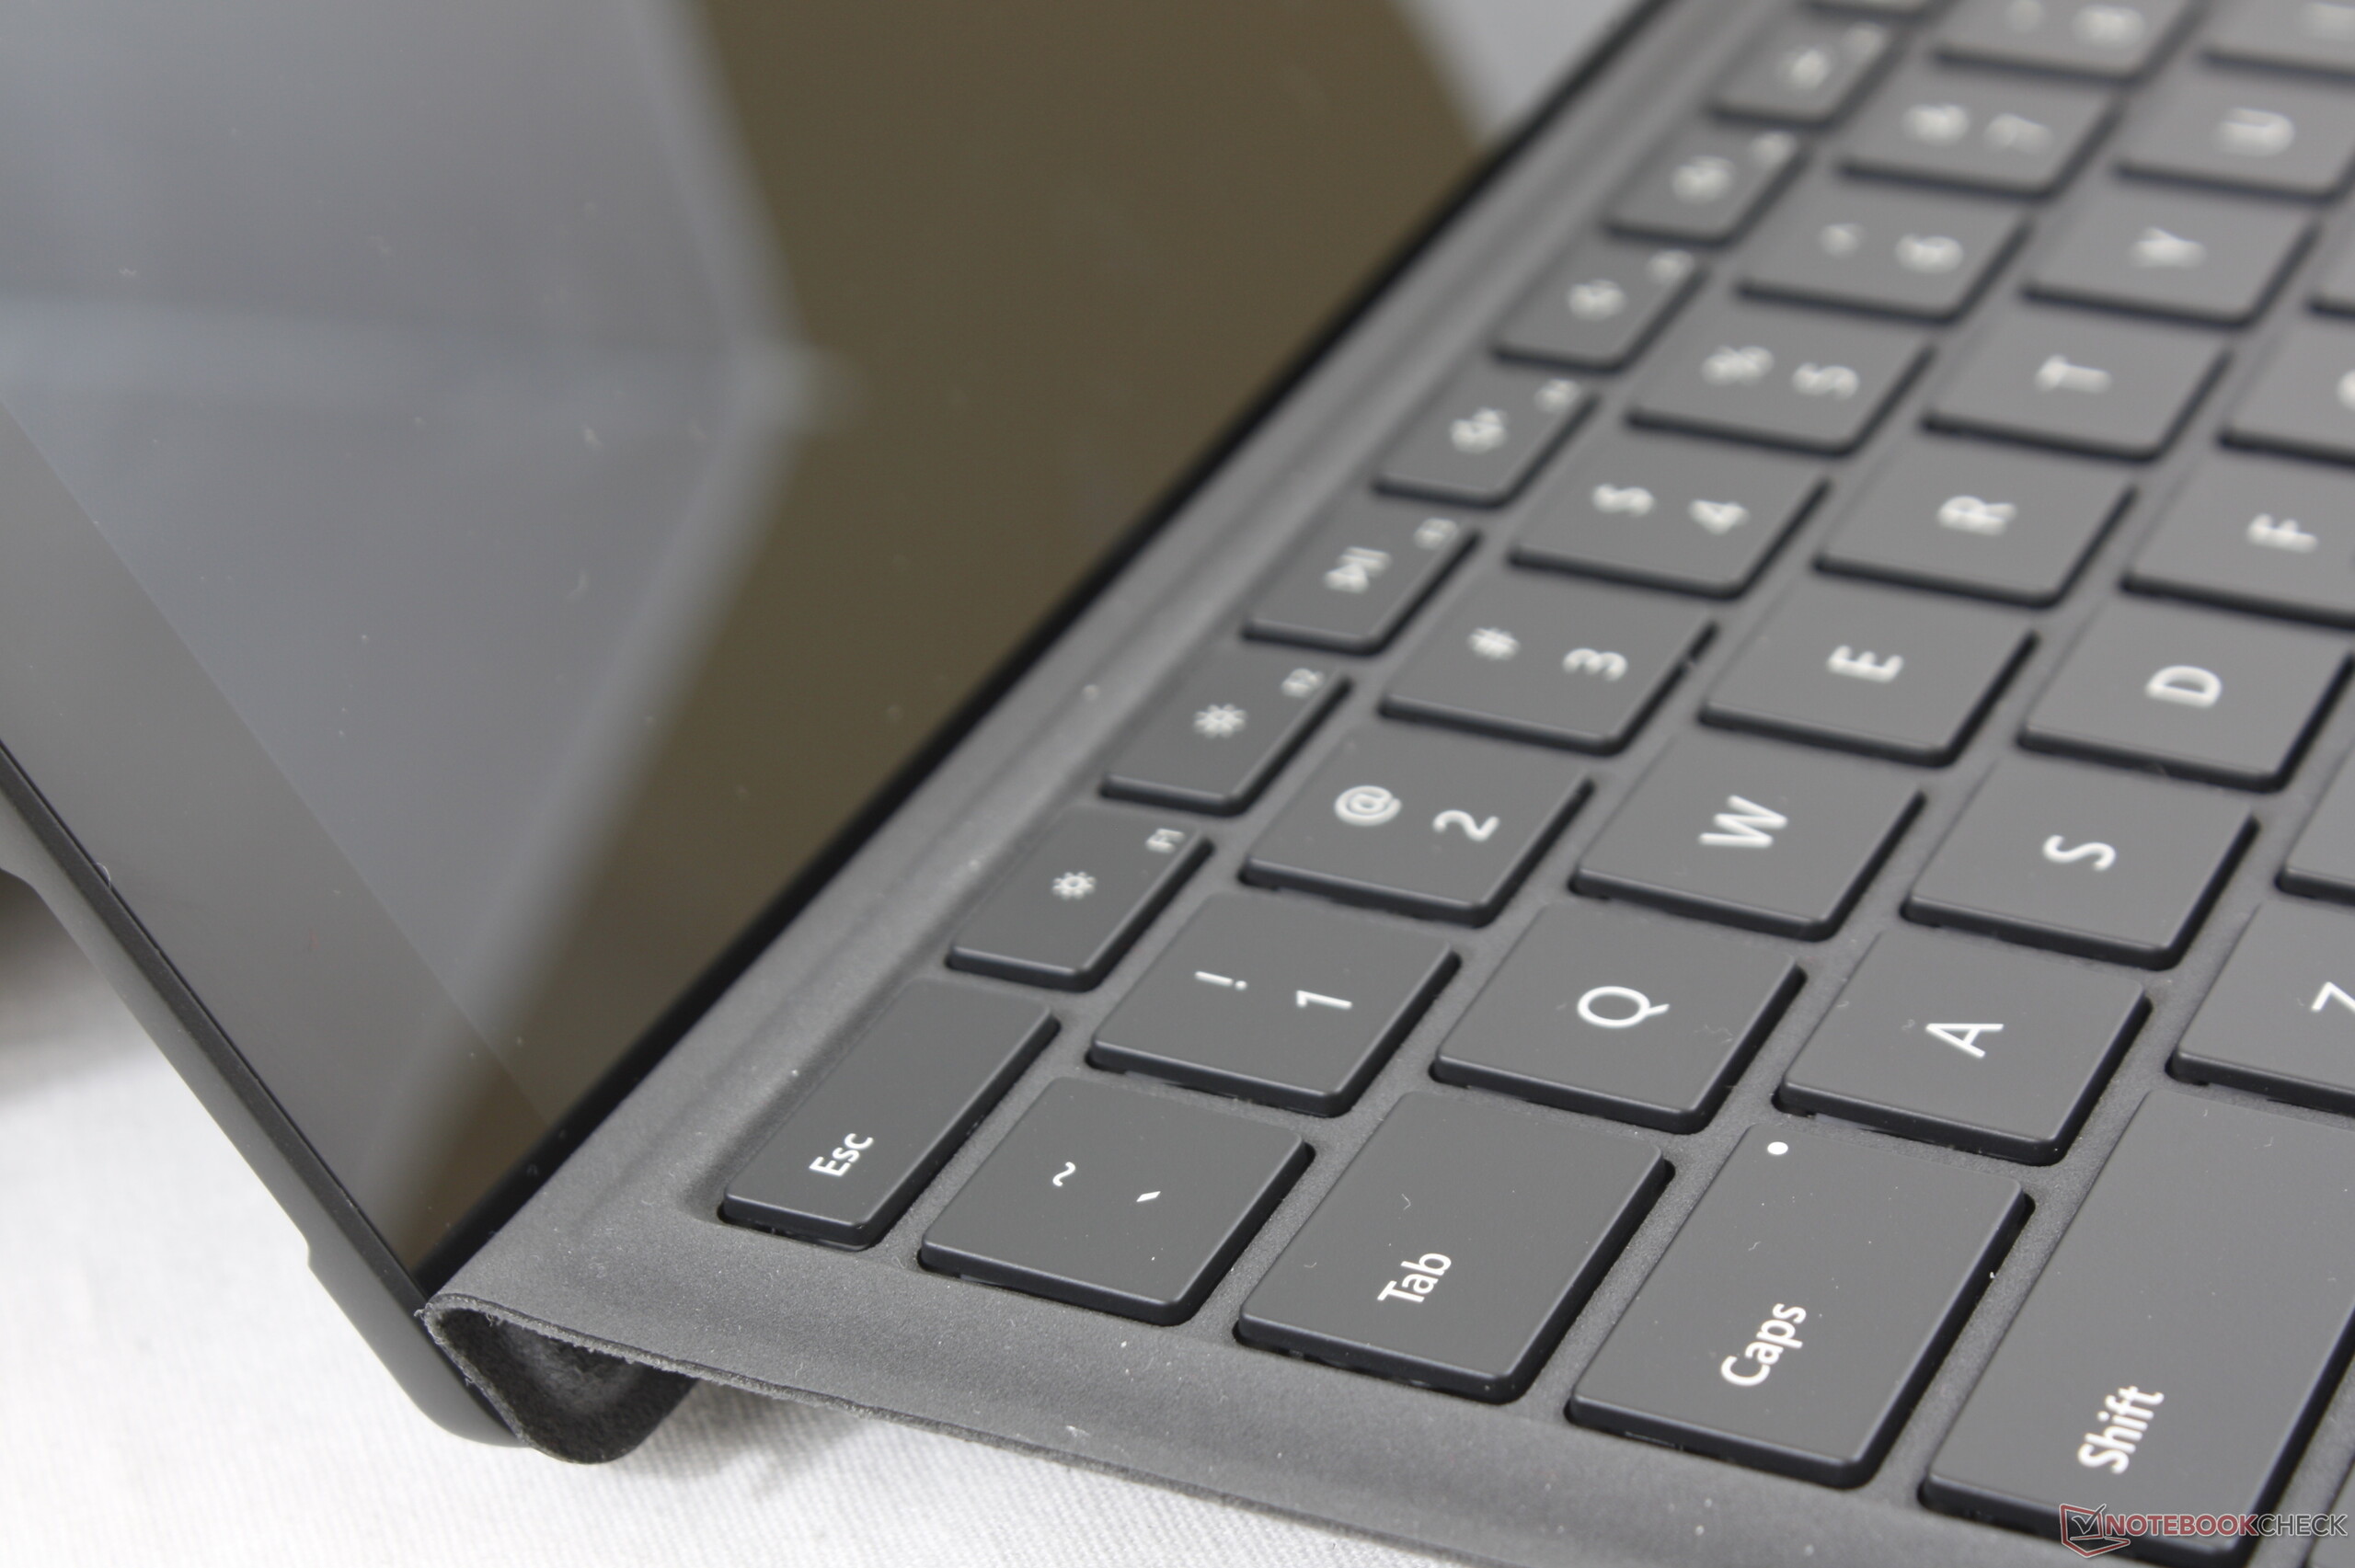
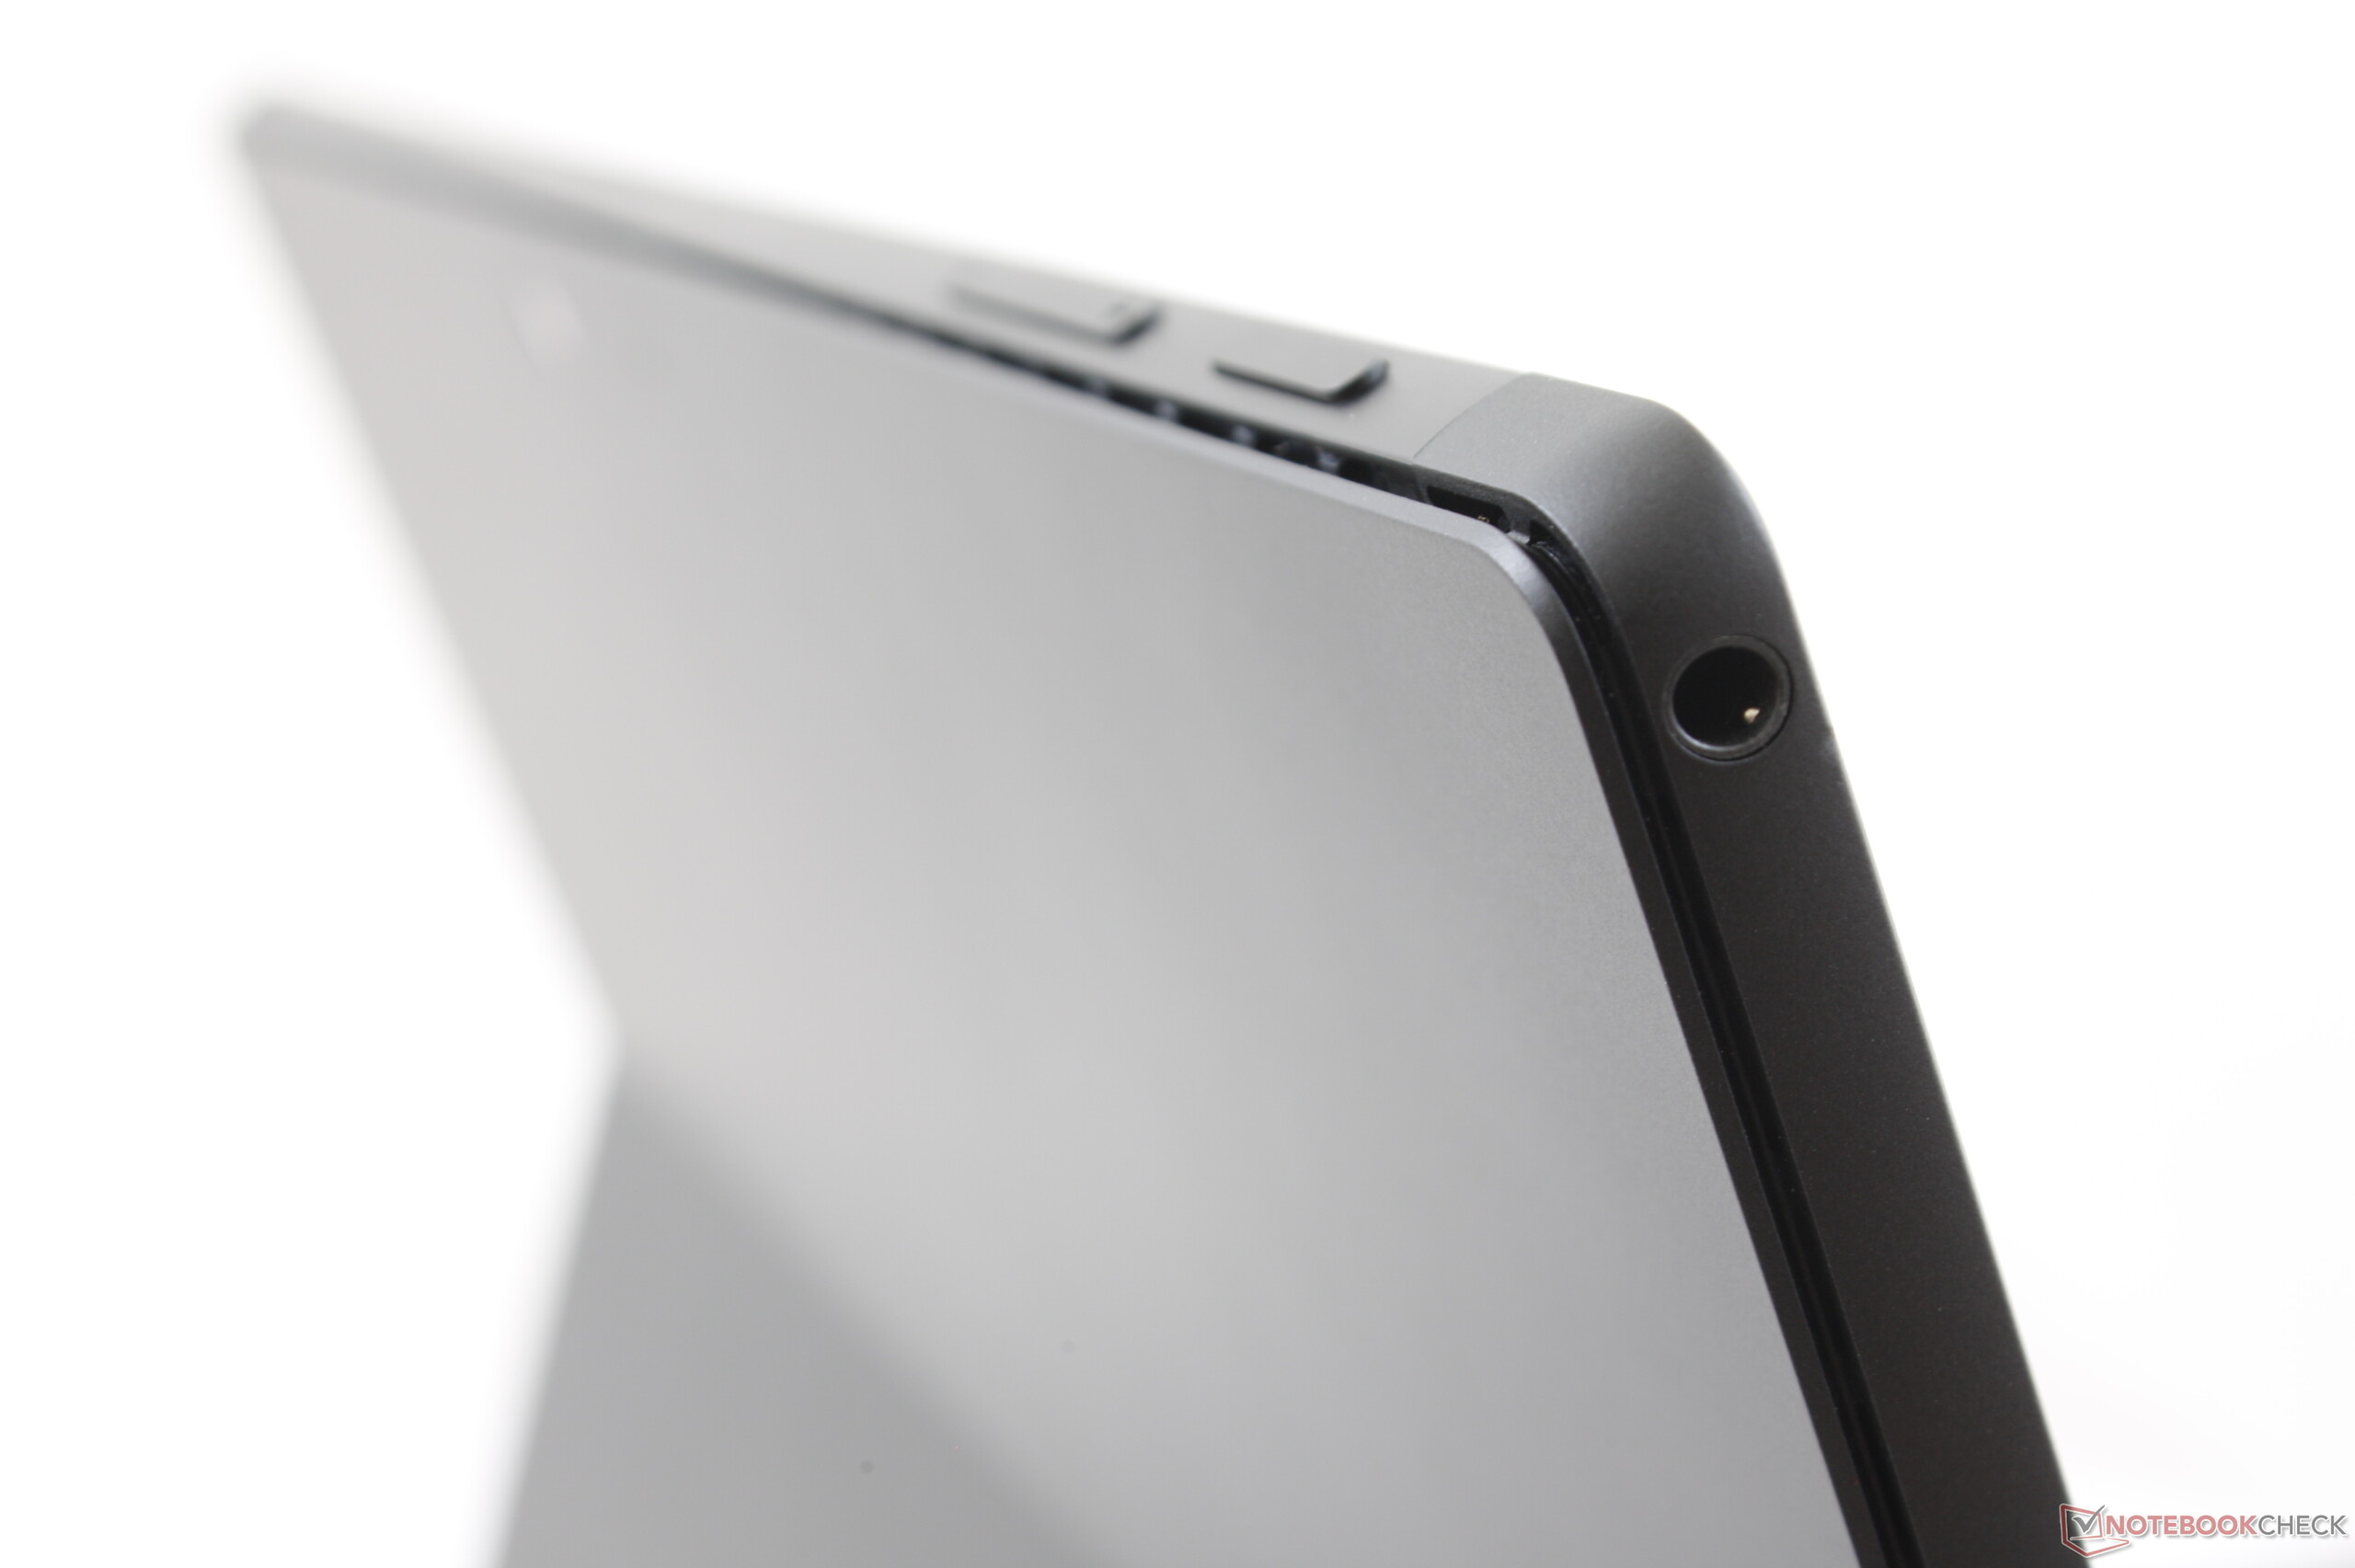
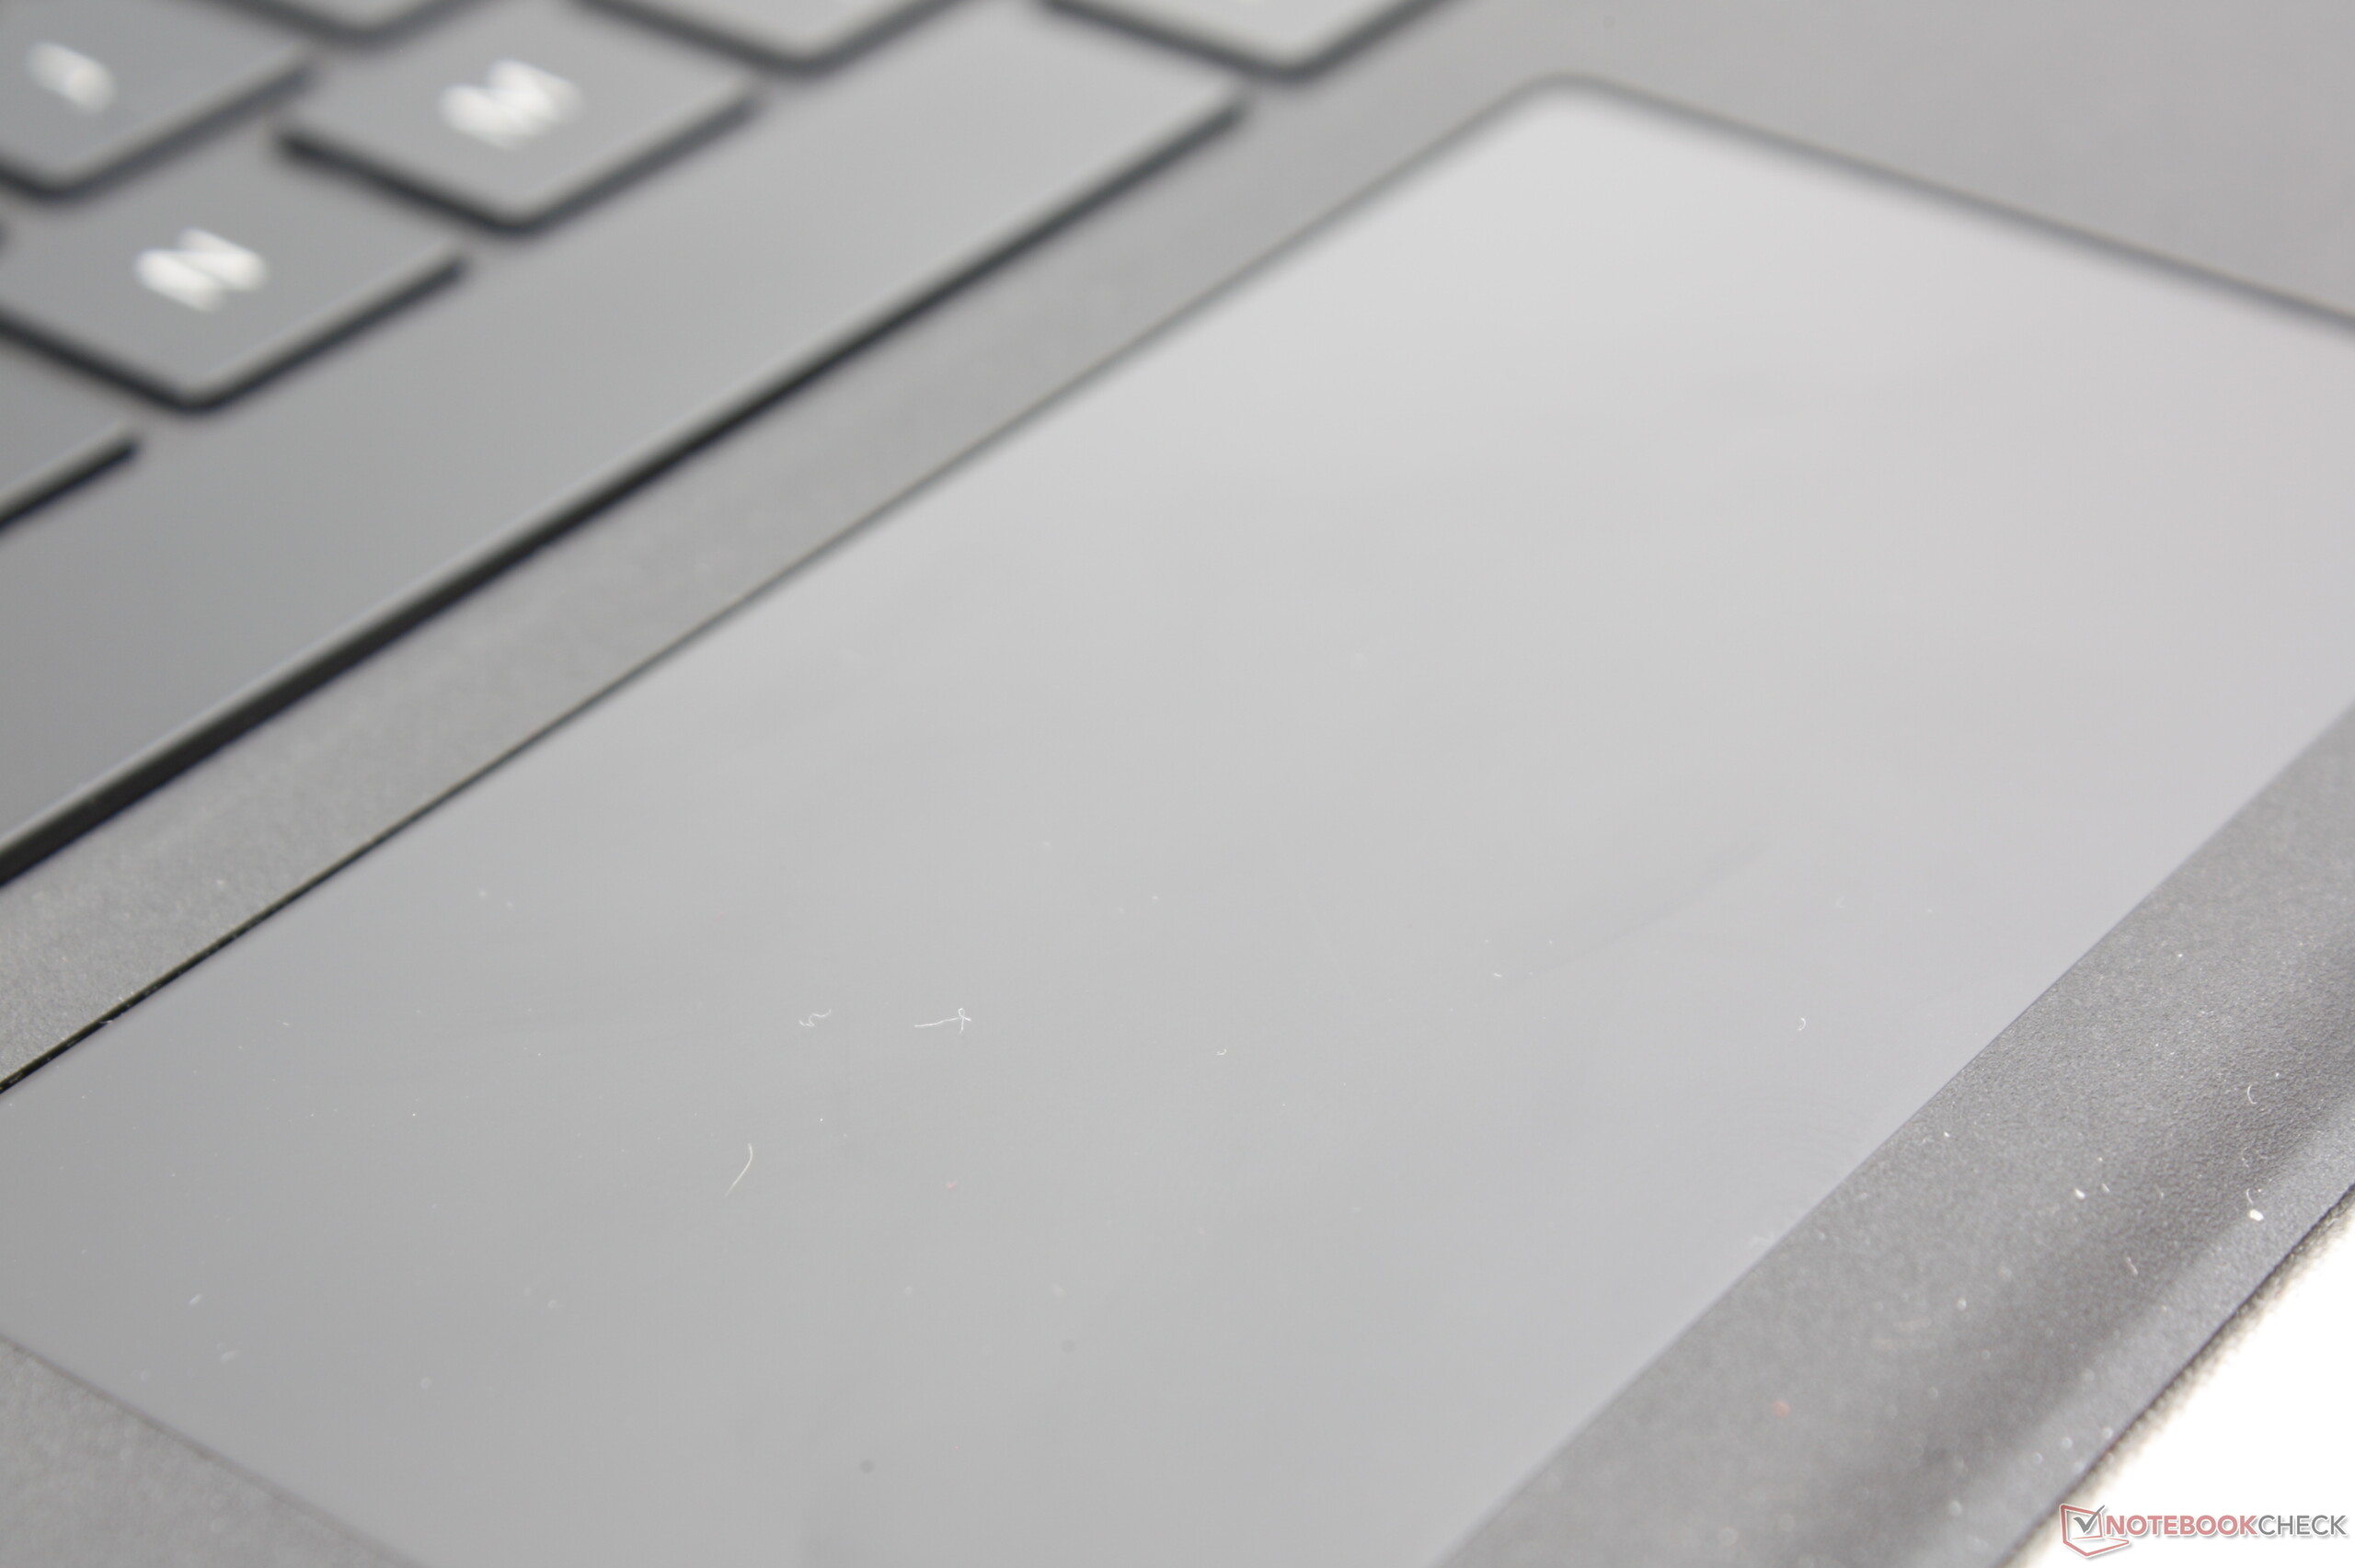
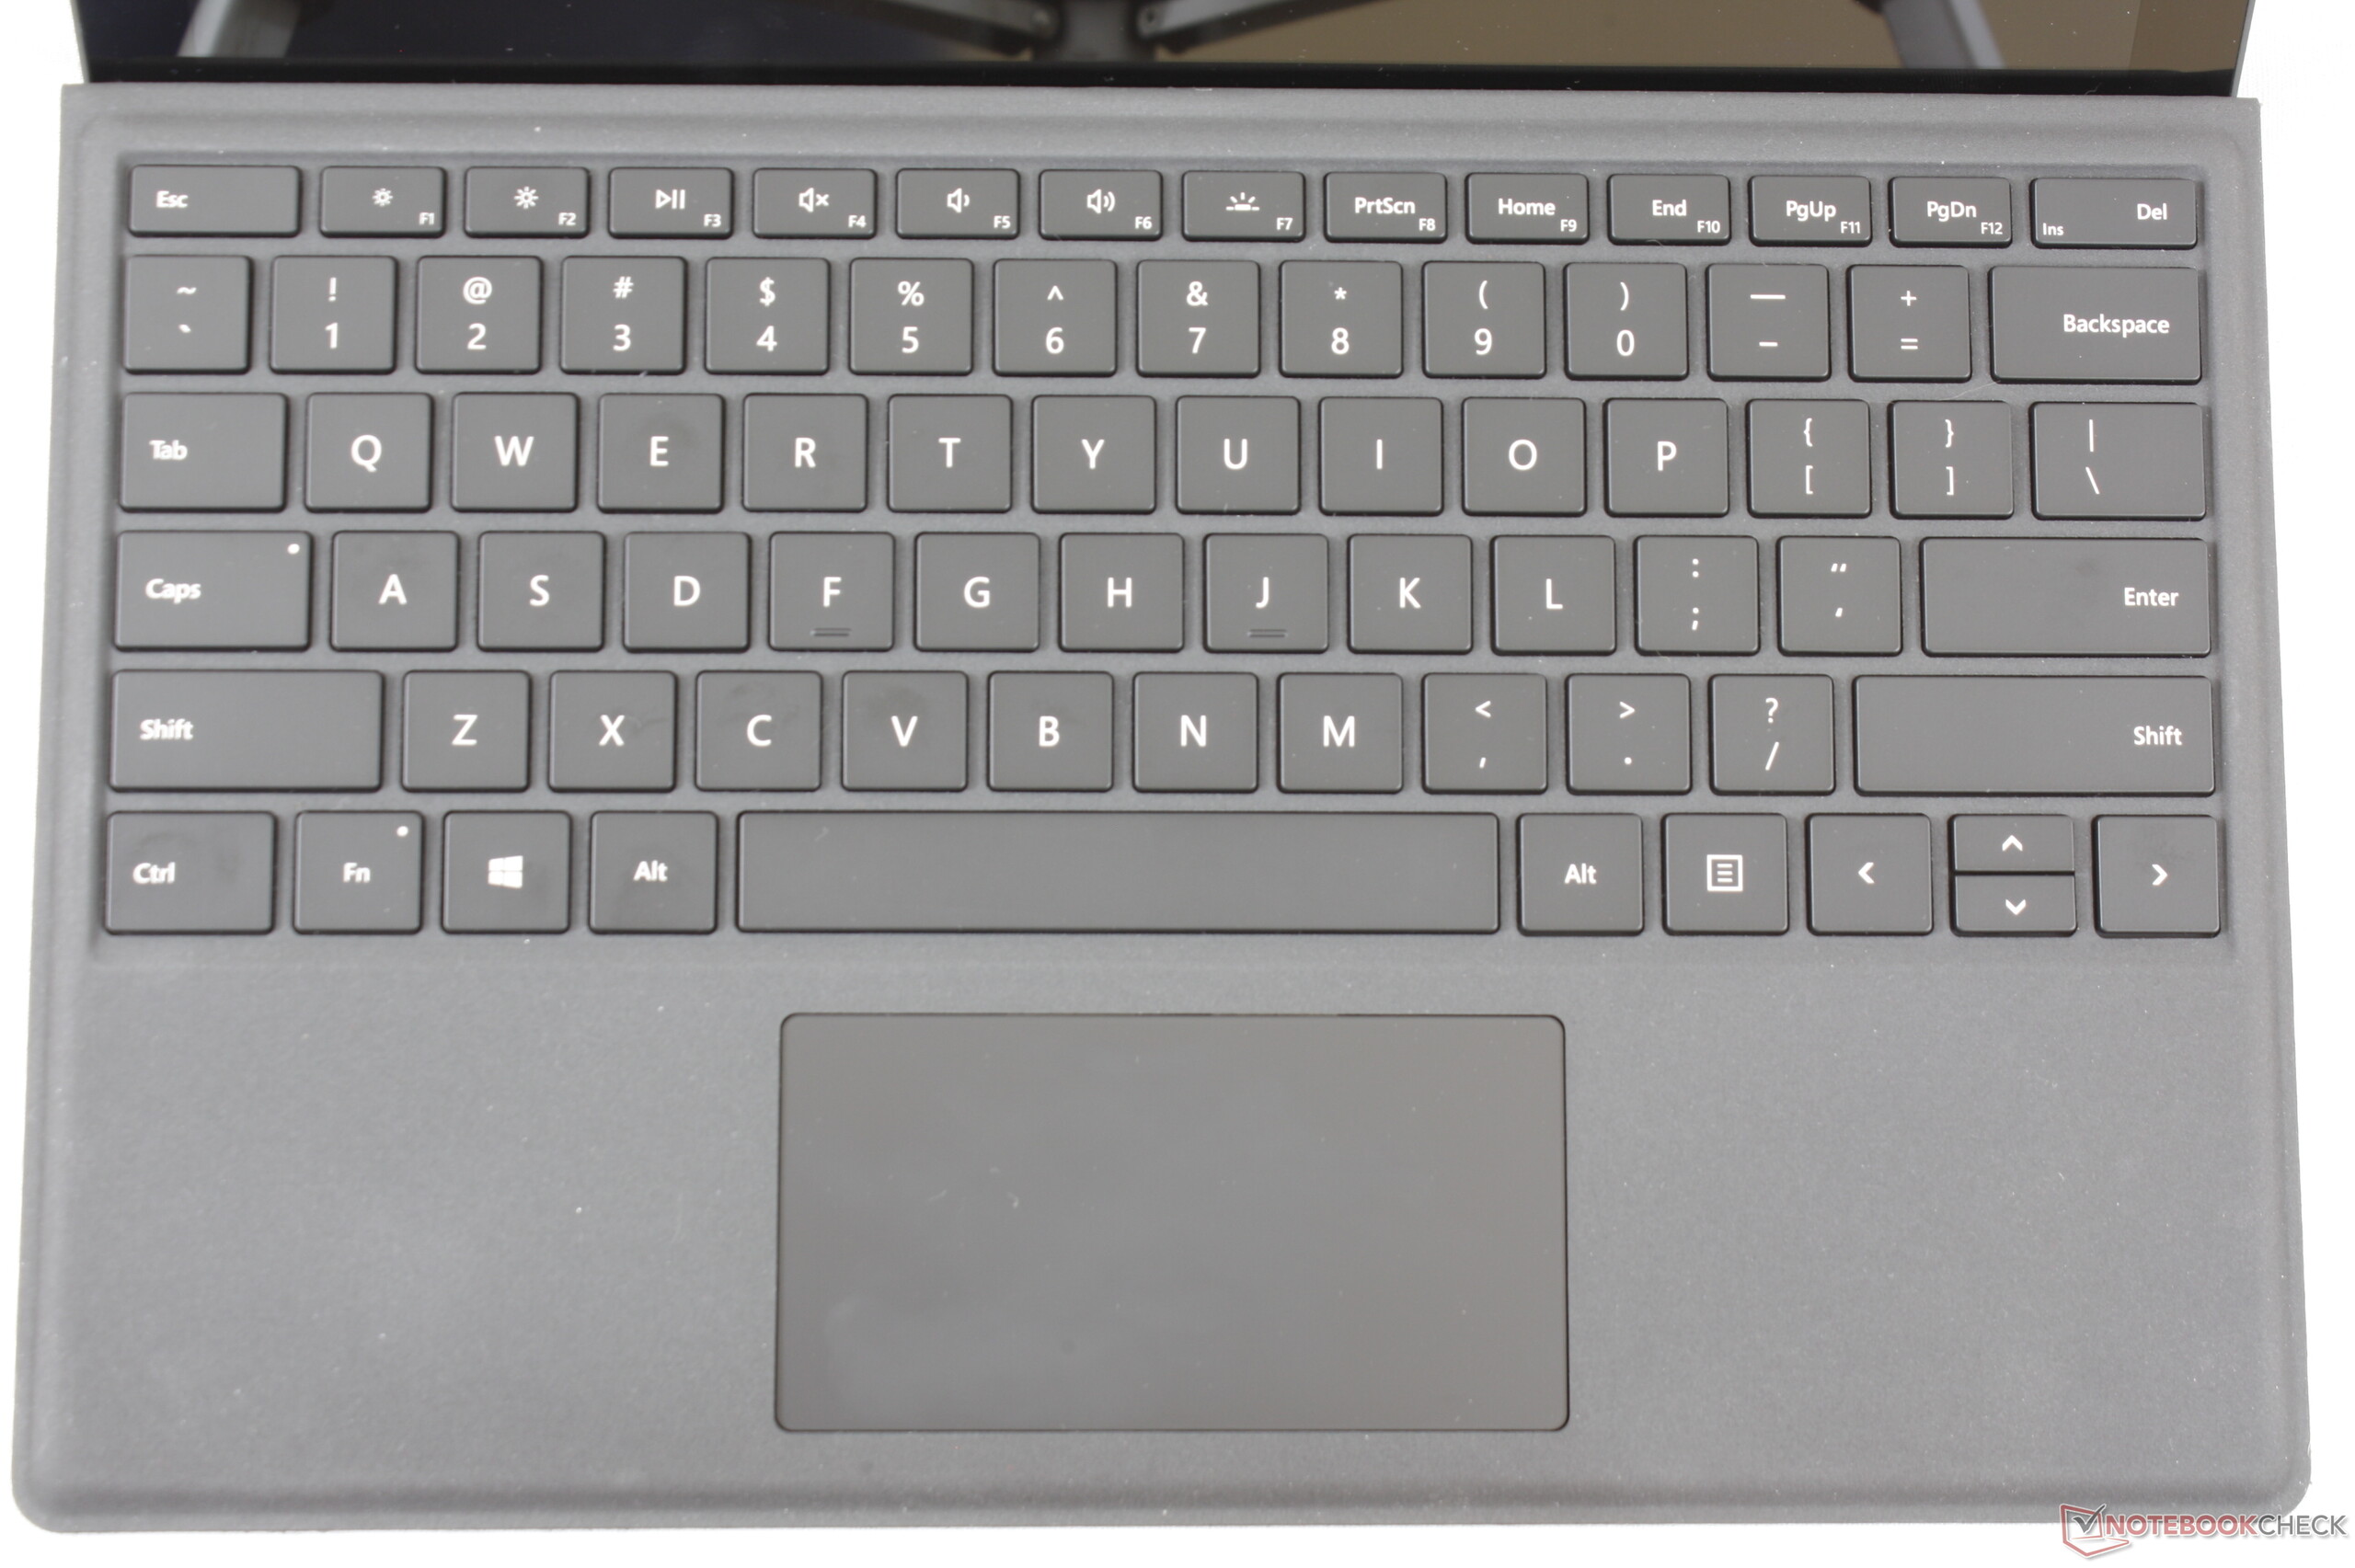
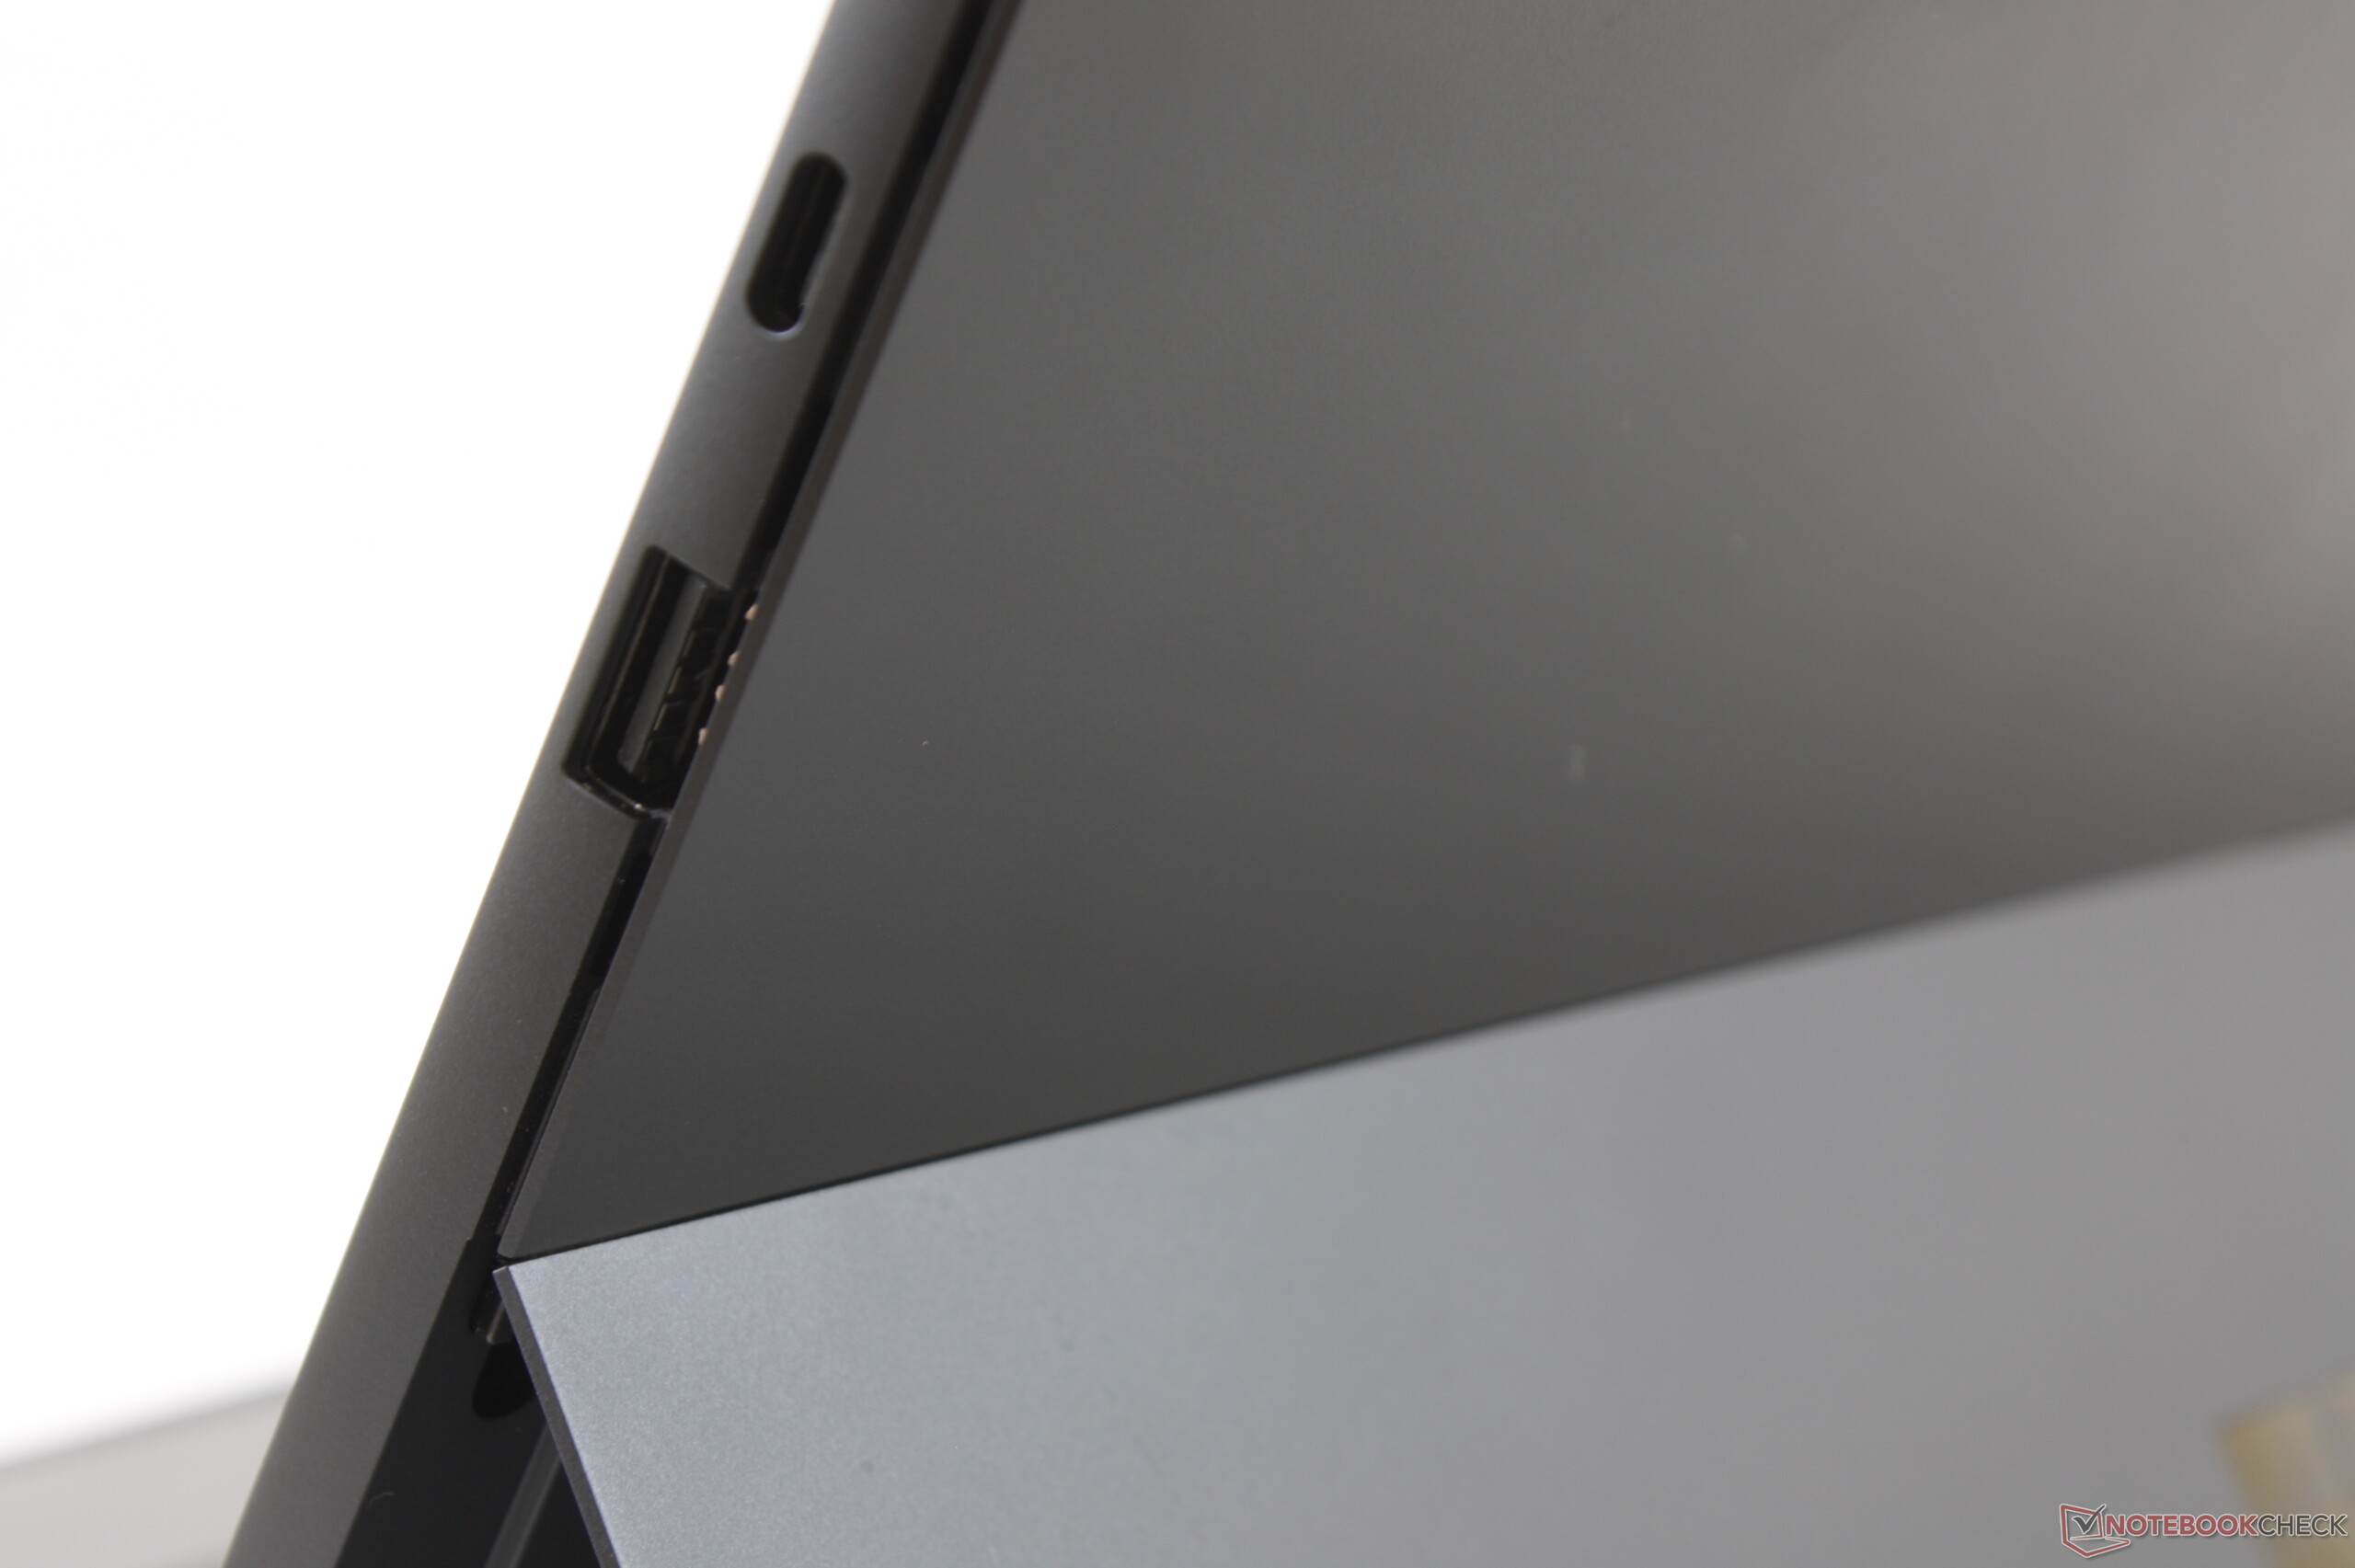
Como já revisamos dois modelos do Surface Pro 7, não iremos mais longe no caso, conectividade, dispositivos de entrada e alto-falantes nesta revisão. As informações correspondentes podem ser encontradas na seção revisão do Core i5 Surface Pro 7
Possible contenders in comparison
Avaliação | Data | Modelo | Peso | Altura | Size | Resolução | Preço |
|---|---|---|---|---|---|---|---|
| 88.5 % v7 (old) | 03/2021 | Microsoft Surface Pro 7 Plus i5-1135G7, Iris Xe G7 80EUs | 796 g | 8.5 mm | 12.30" | 2736x1824 | |
| 87.1 % v7 (old) | 11/2020 | Lenovo Yoga Duet 7 13IML05-82AS000WGE i5-10210U, UHD Graphics 620 | 1.2 kg | 9.2 mm | 13.00" | 2160x1350 | |
| 89.5 % v7 (old) | 03/2021 | Dell Latitude 12 7210 2-in-1 i7-10610U, UHD Graphics 620 | 850 g | 9.35 mm | 12.30" | 1920x1280 |
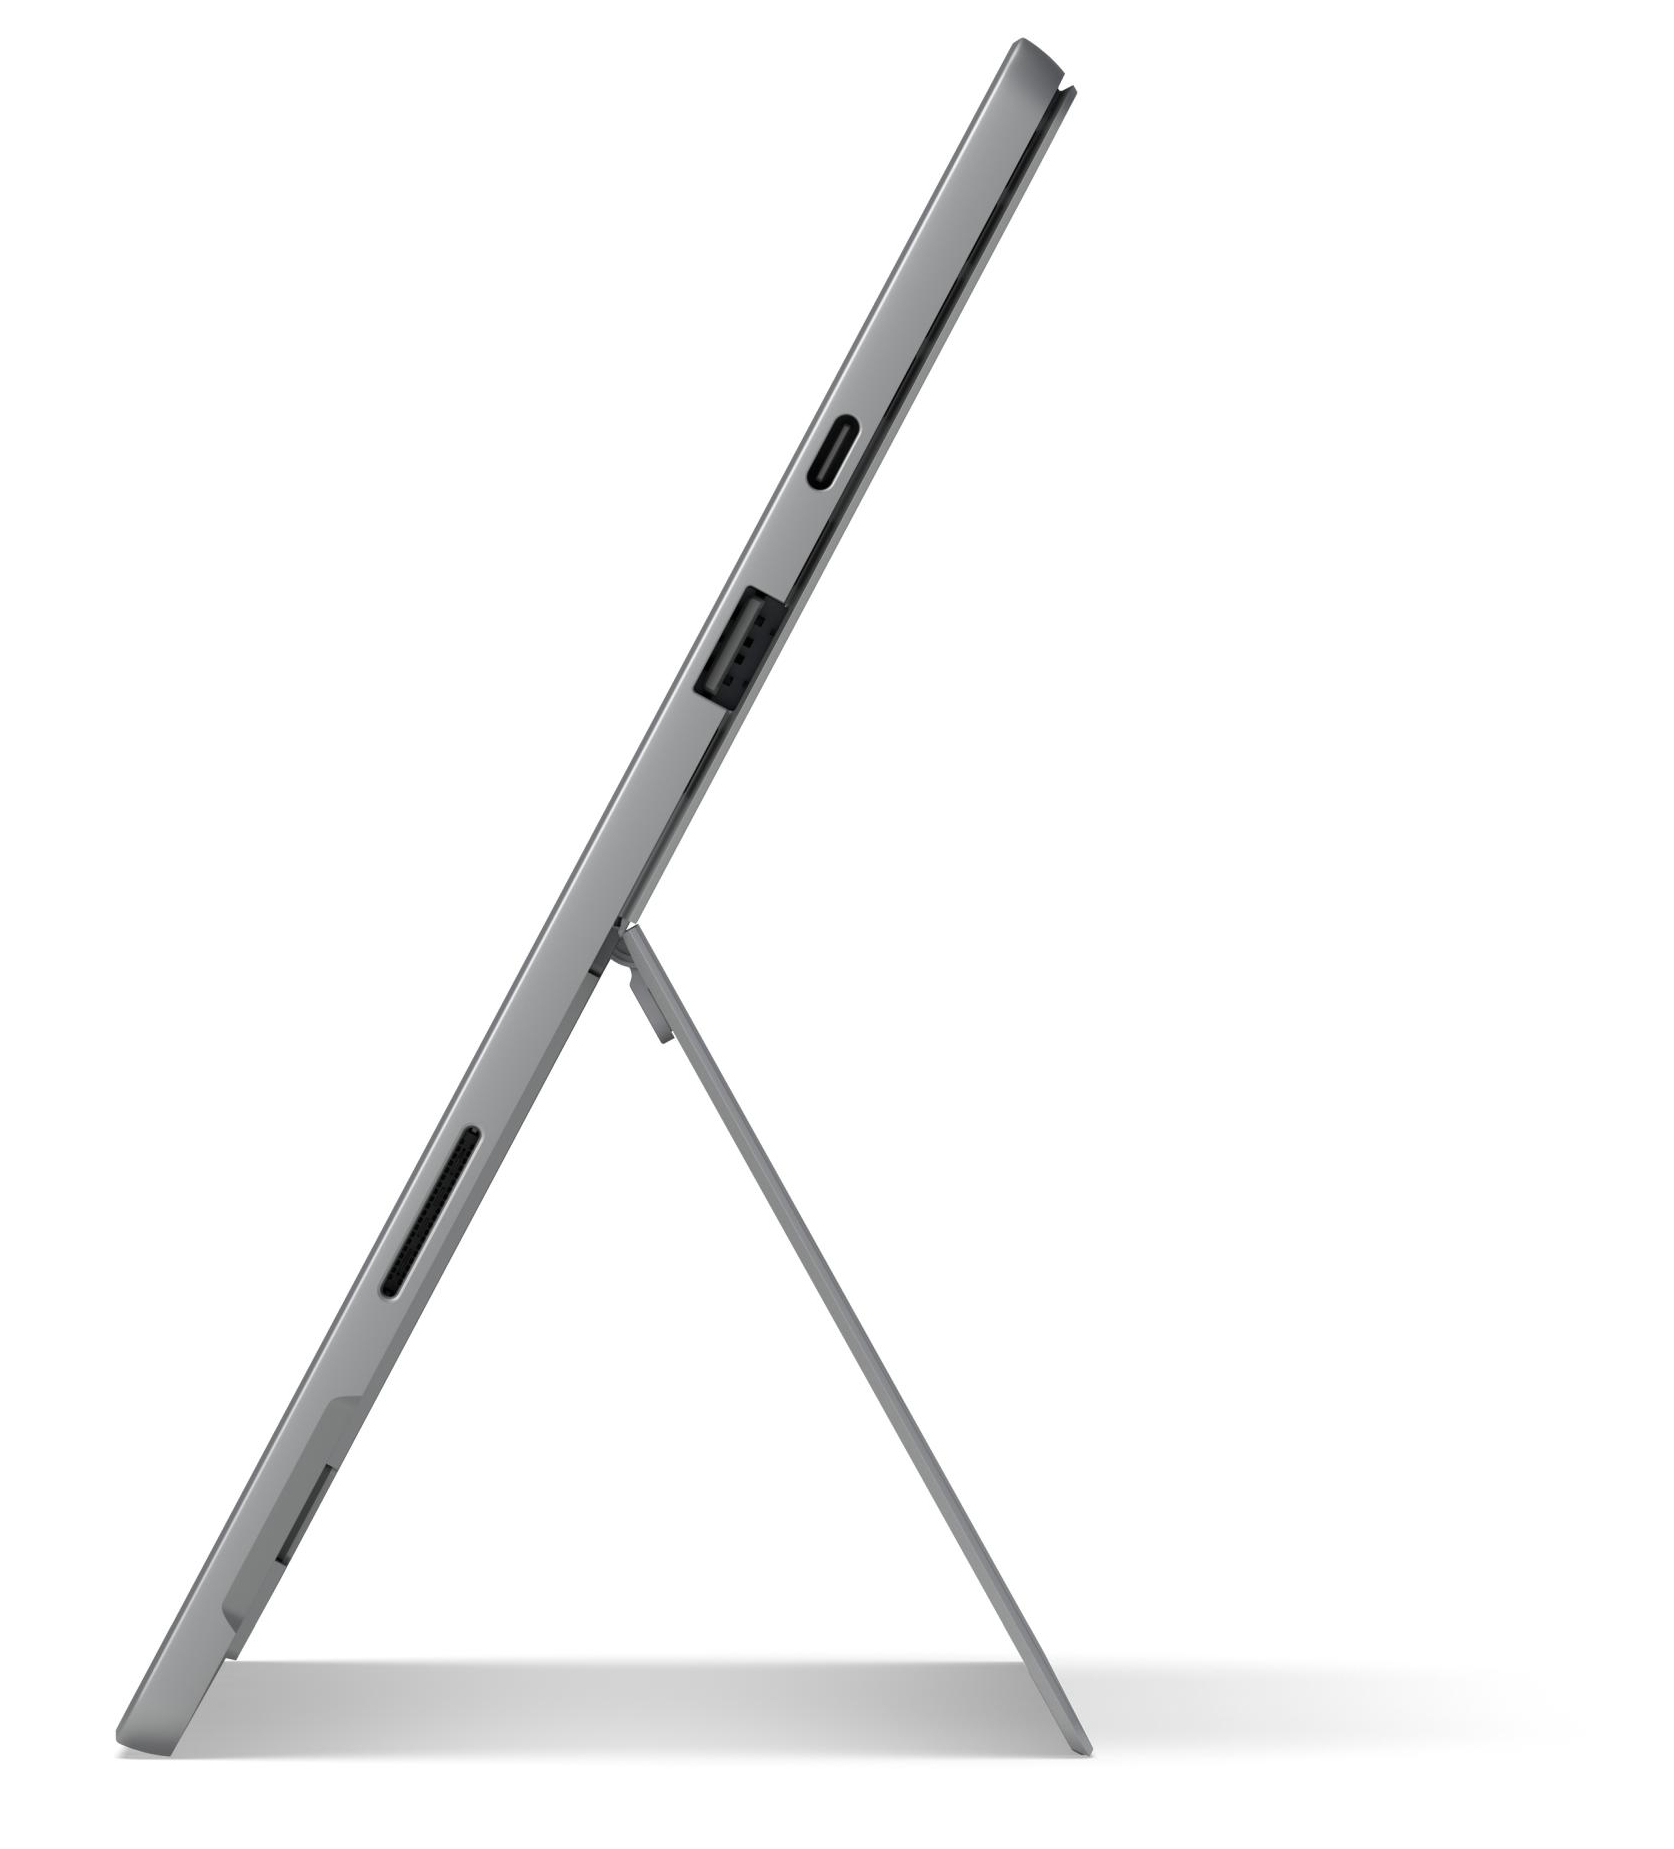
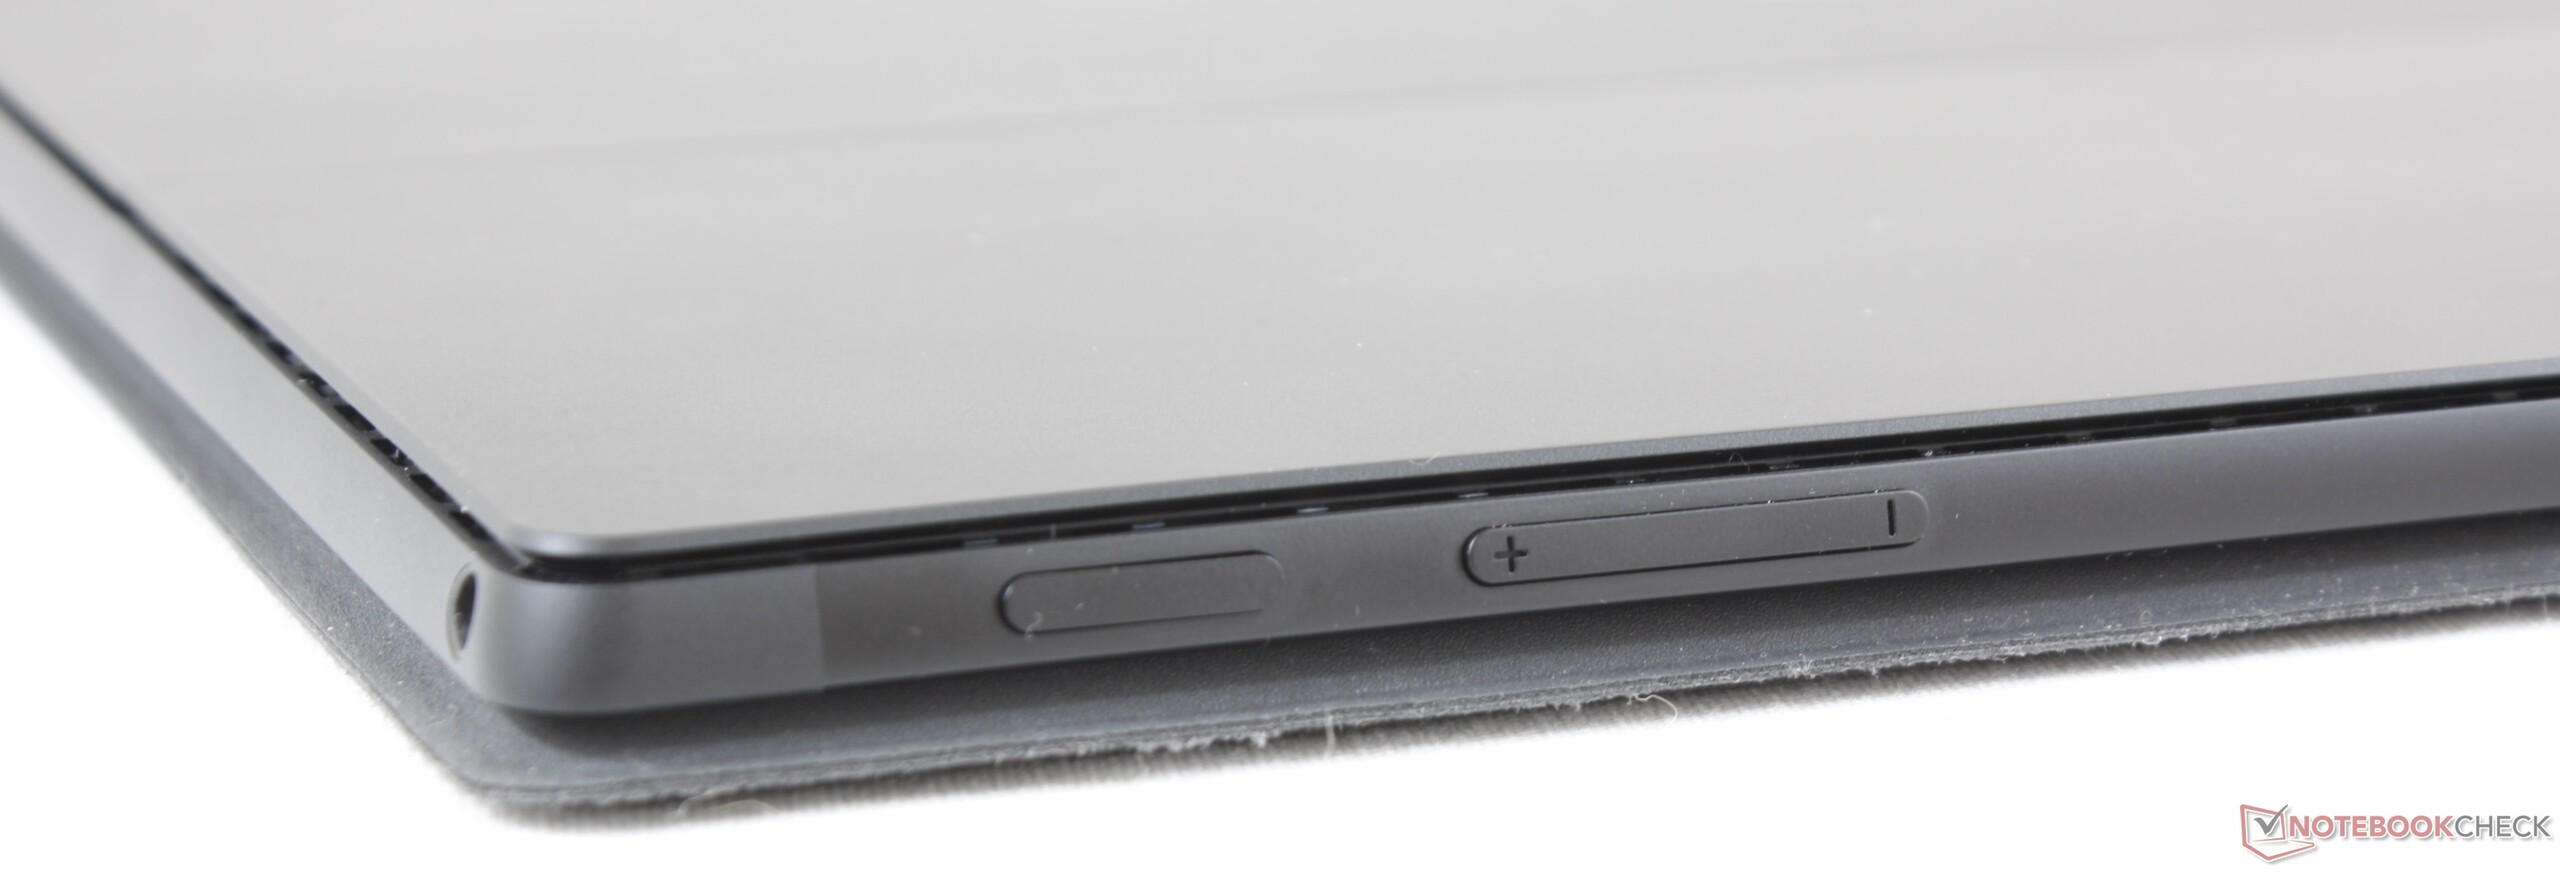
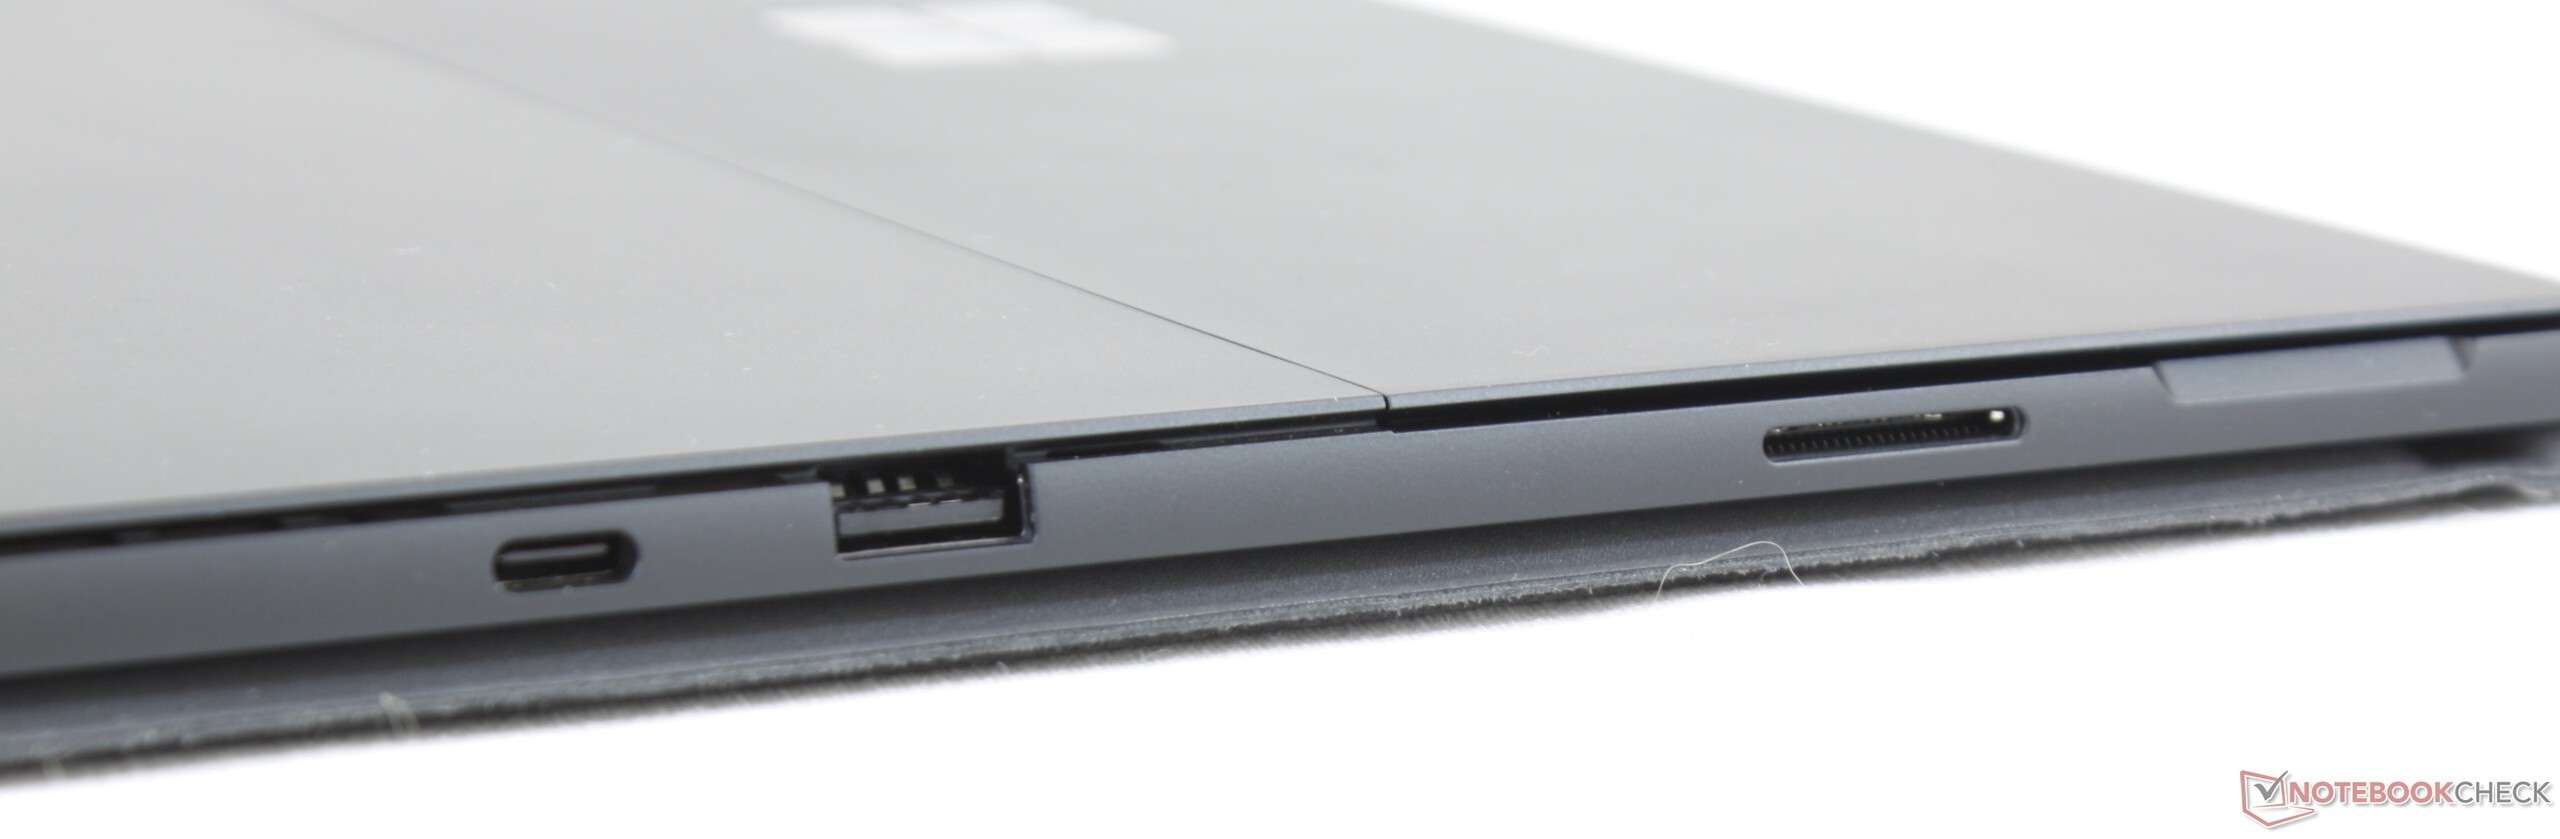
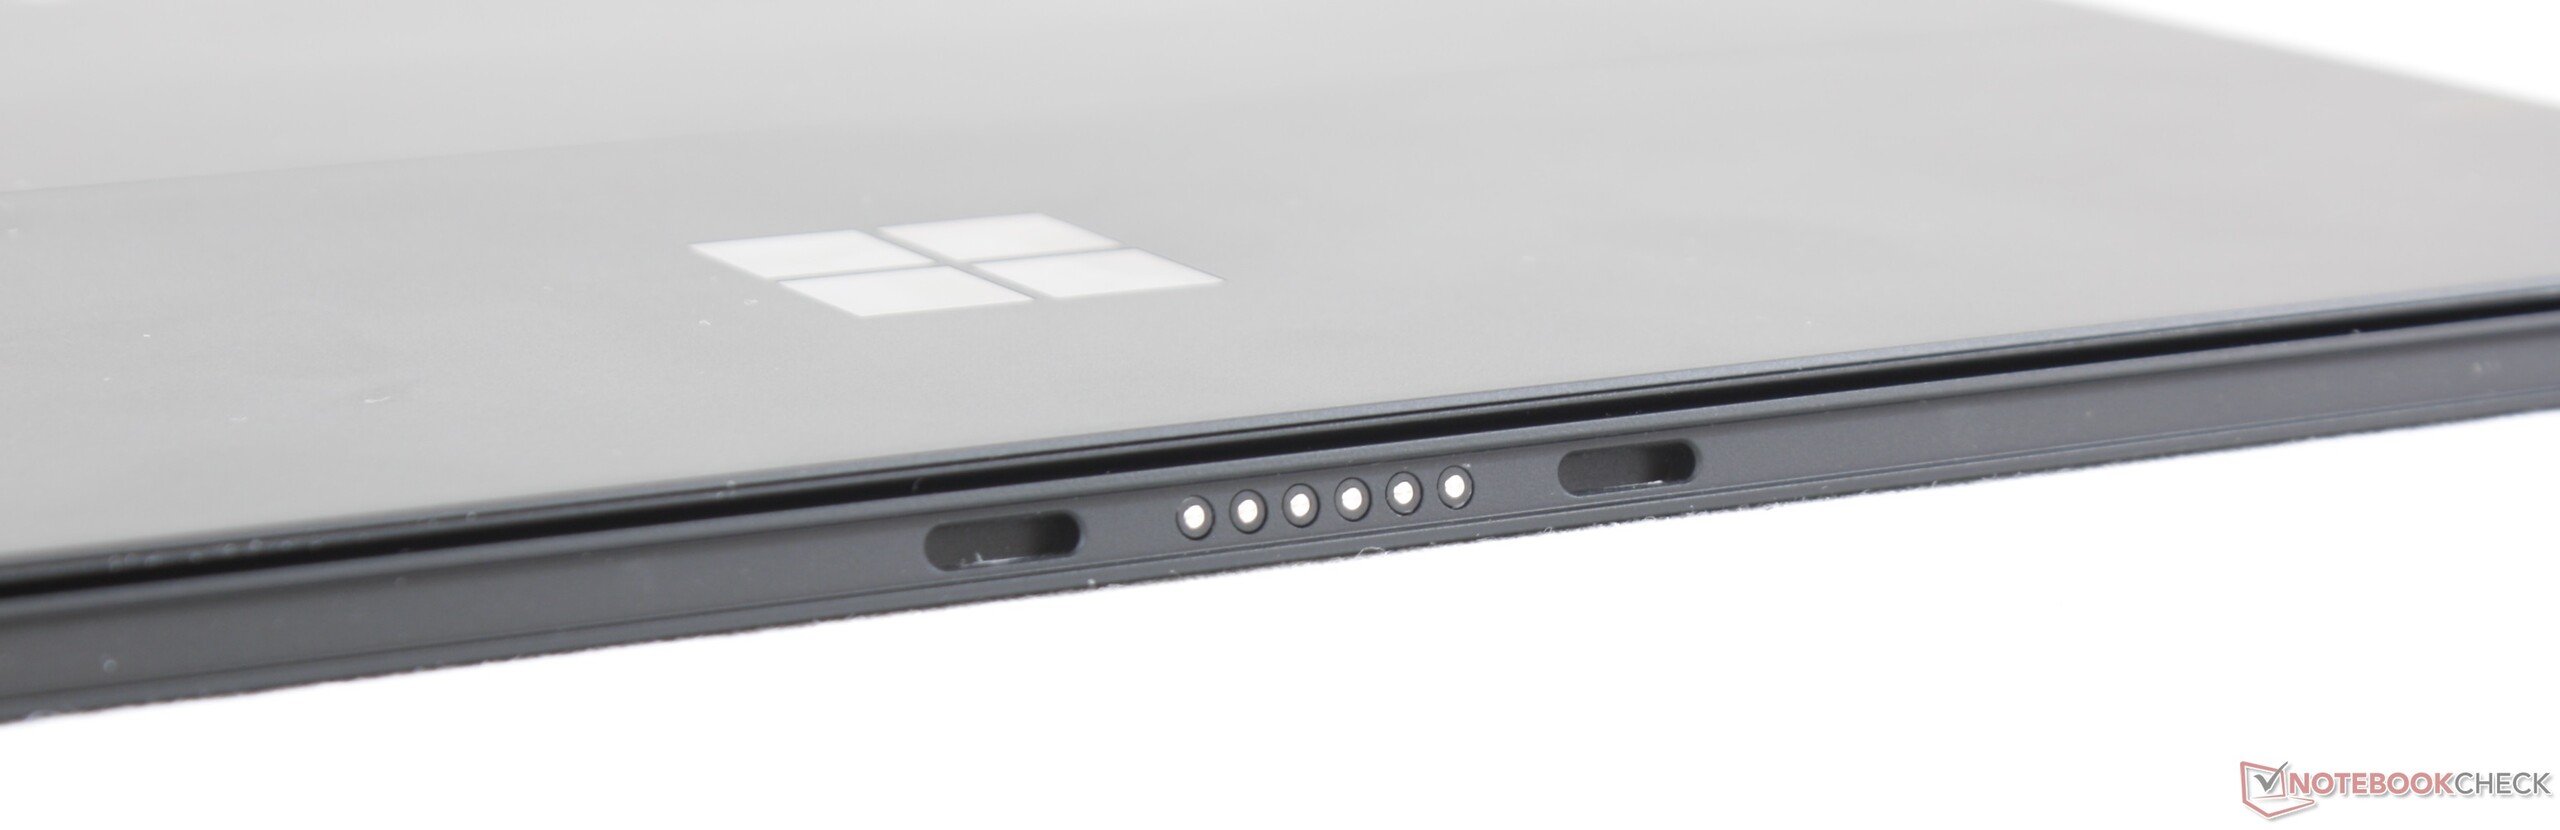
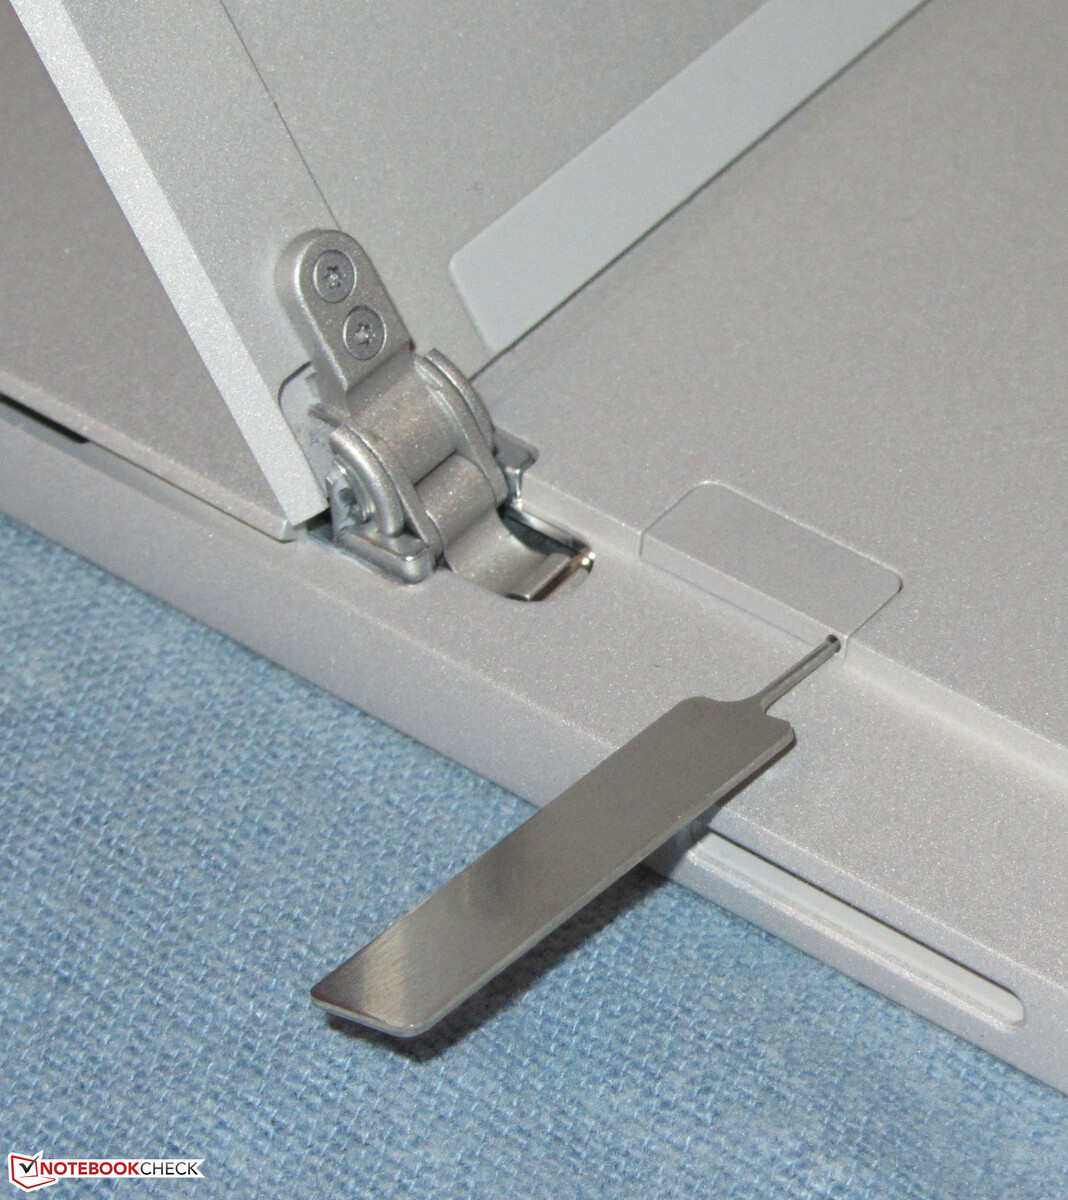
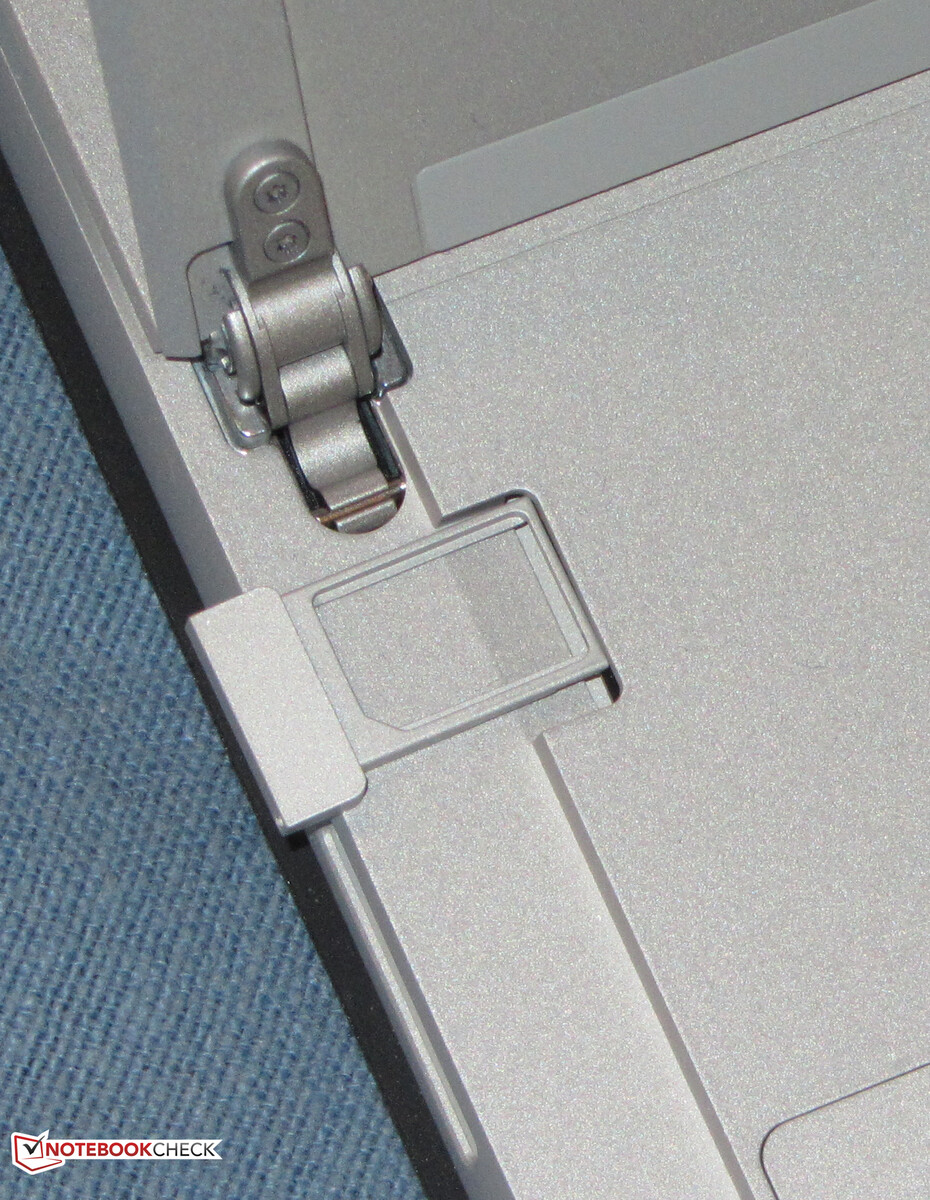
Conectividade - Um modem LTE é opcional agora
Snapdragon X20
A Microsoft instala o modem Qualcomm Snapdragon X20 na superfície. O slot do cartão SIM está atrás do estande. O leitor de cartão de memória teve que ser removido. Além disso, o modem LTE só está disponível em combinação com um processador Core i5


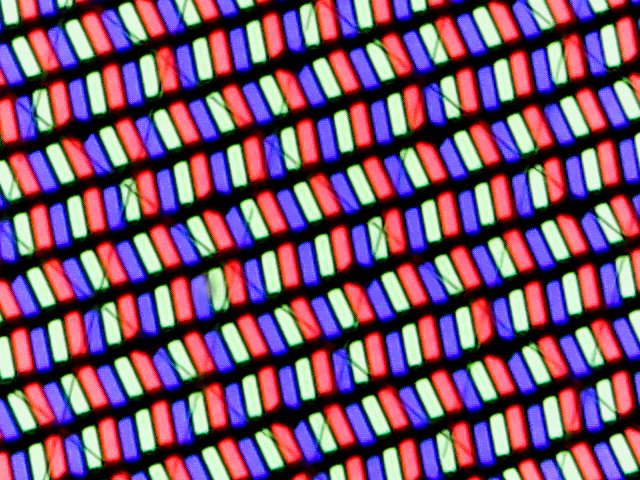
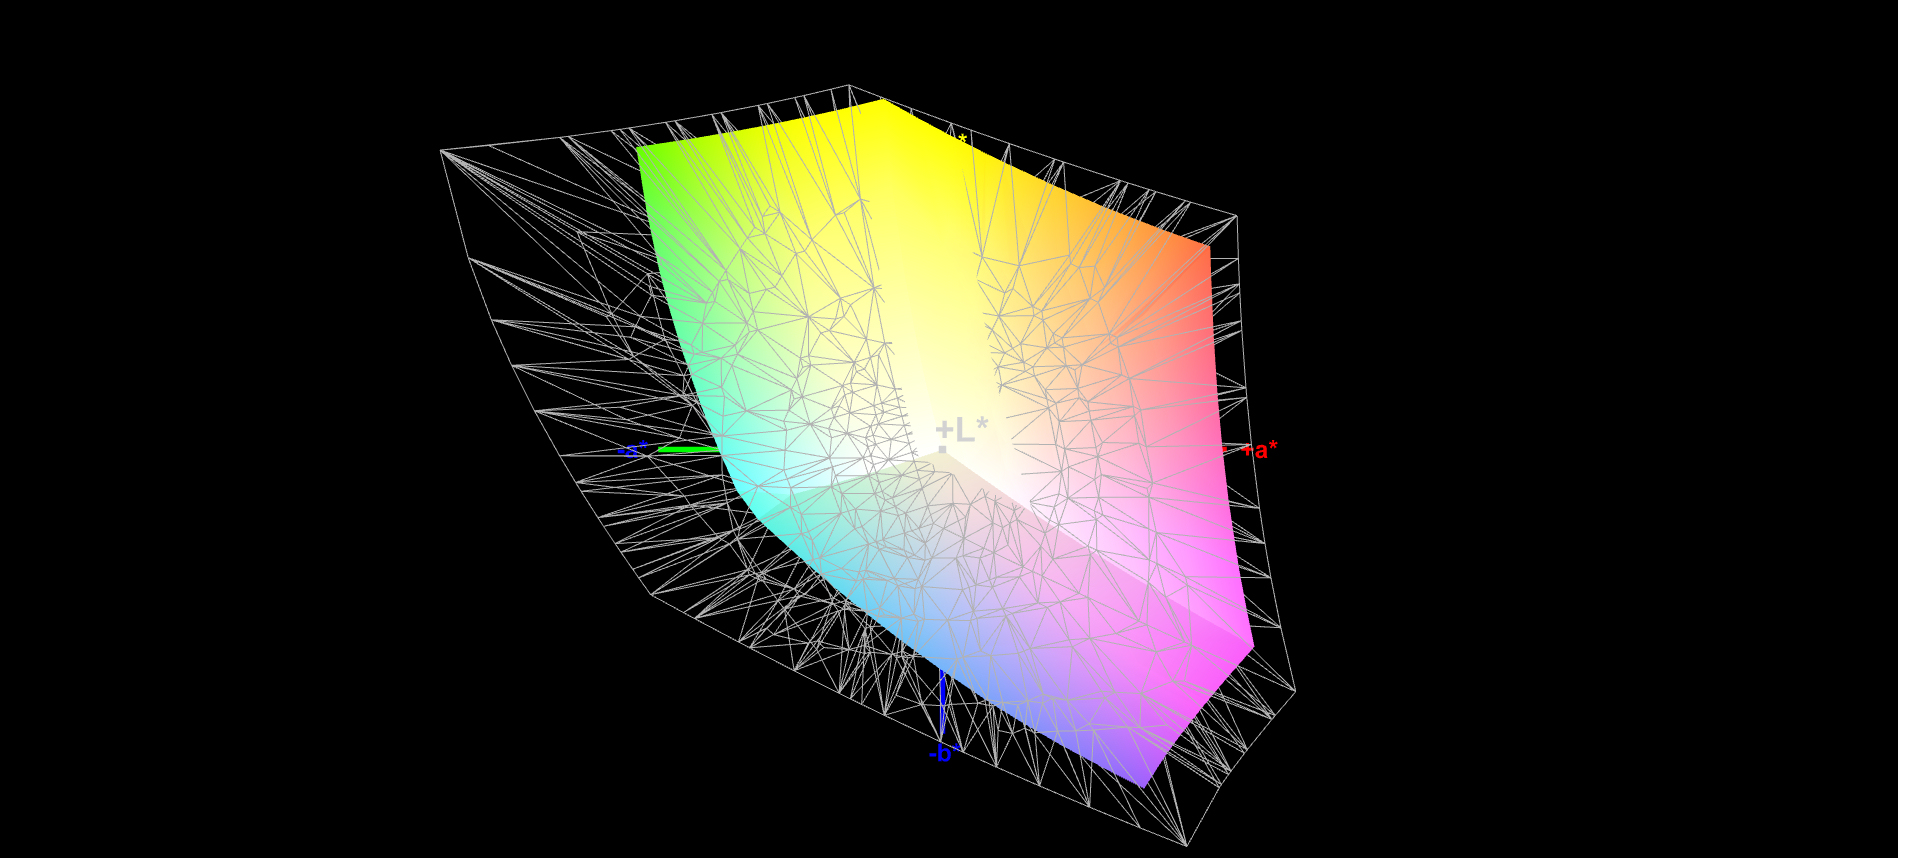
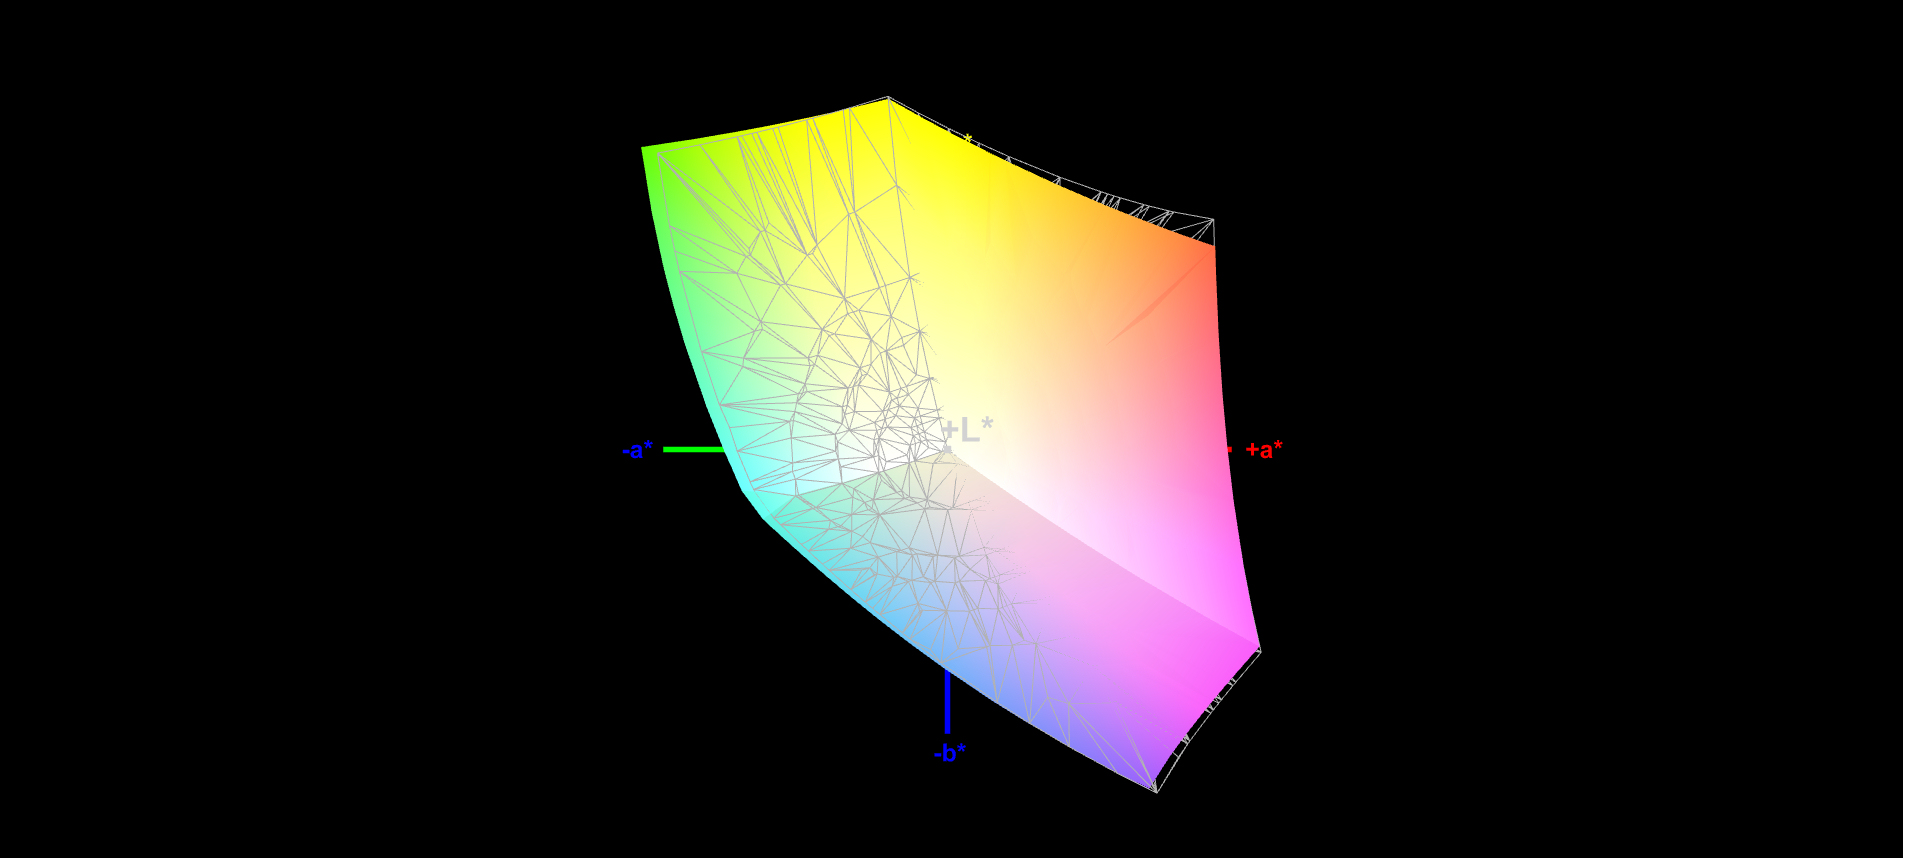
Display - IPS no formato 3:2
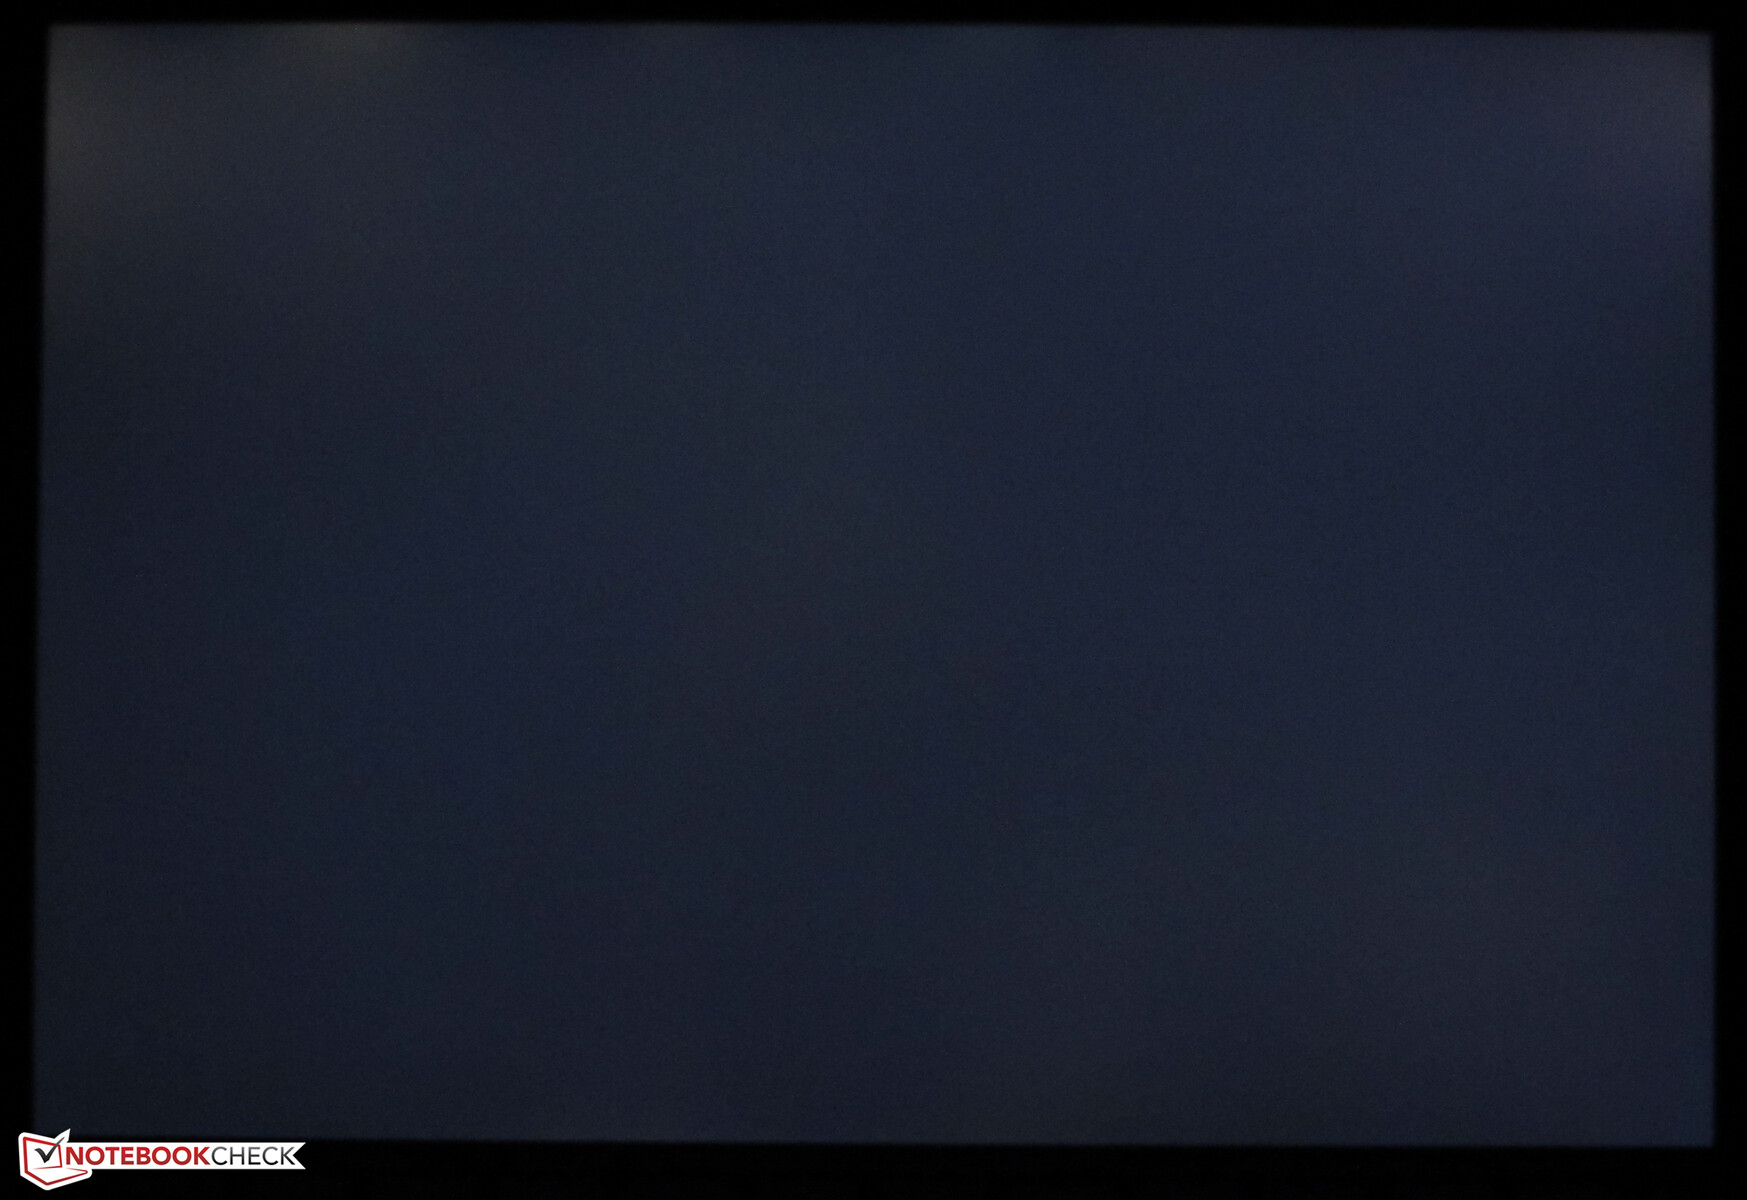
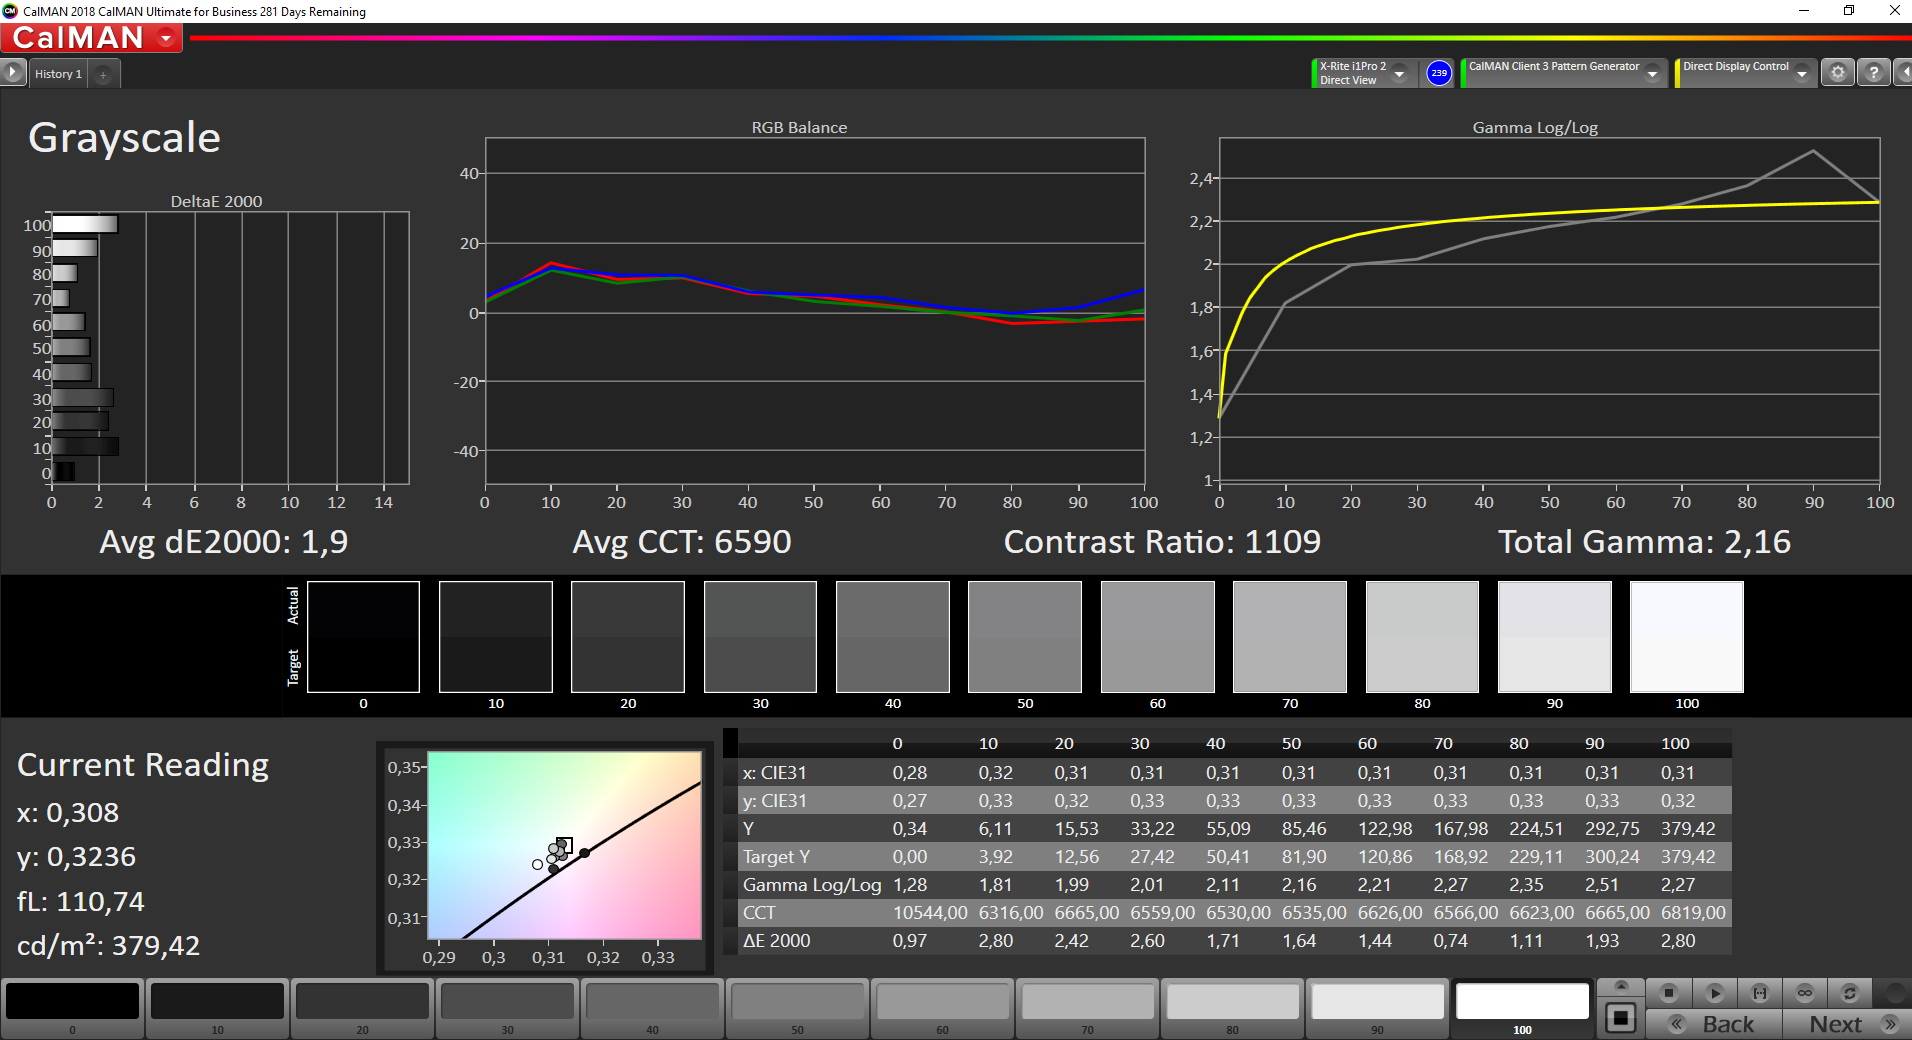
A tela tátil de 12,3 polegadas tem uma resolução nativa de 2736x1824 pixels. Brilho (425,4 cd/m²) e contraste (1.200:1) são bons. Além disso, a tela cintila a uma freqüência de 199,2 Hz com níveis de brilho de 57% (equivalente a cerca de 119 cd/m²) e abaixo. Devido à baixa freqüência, os usuários sensíveis podem ter dores de cabeça e/ou problemas oculares
| |||||||||||||||||||||||||
iluminação: 85 %
iluminação com acumulador: 407 cd/m²
Contraste: 1200:1 (Preto: 0.34 cd/m²)
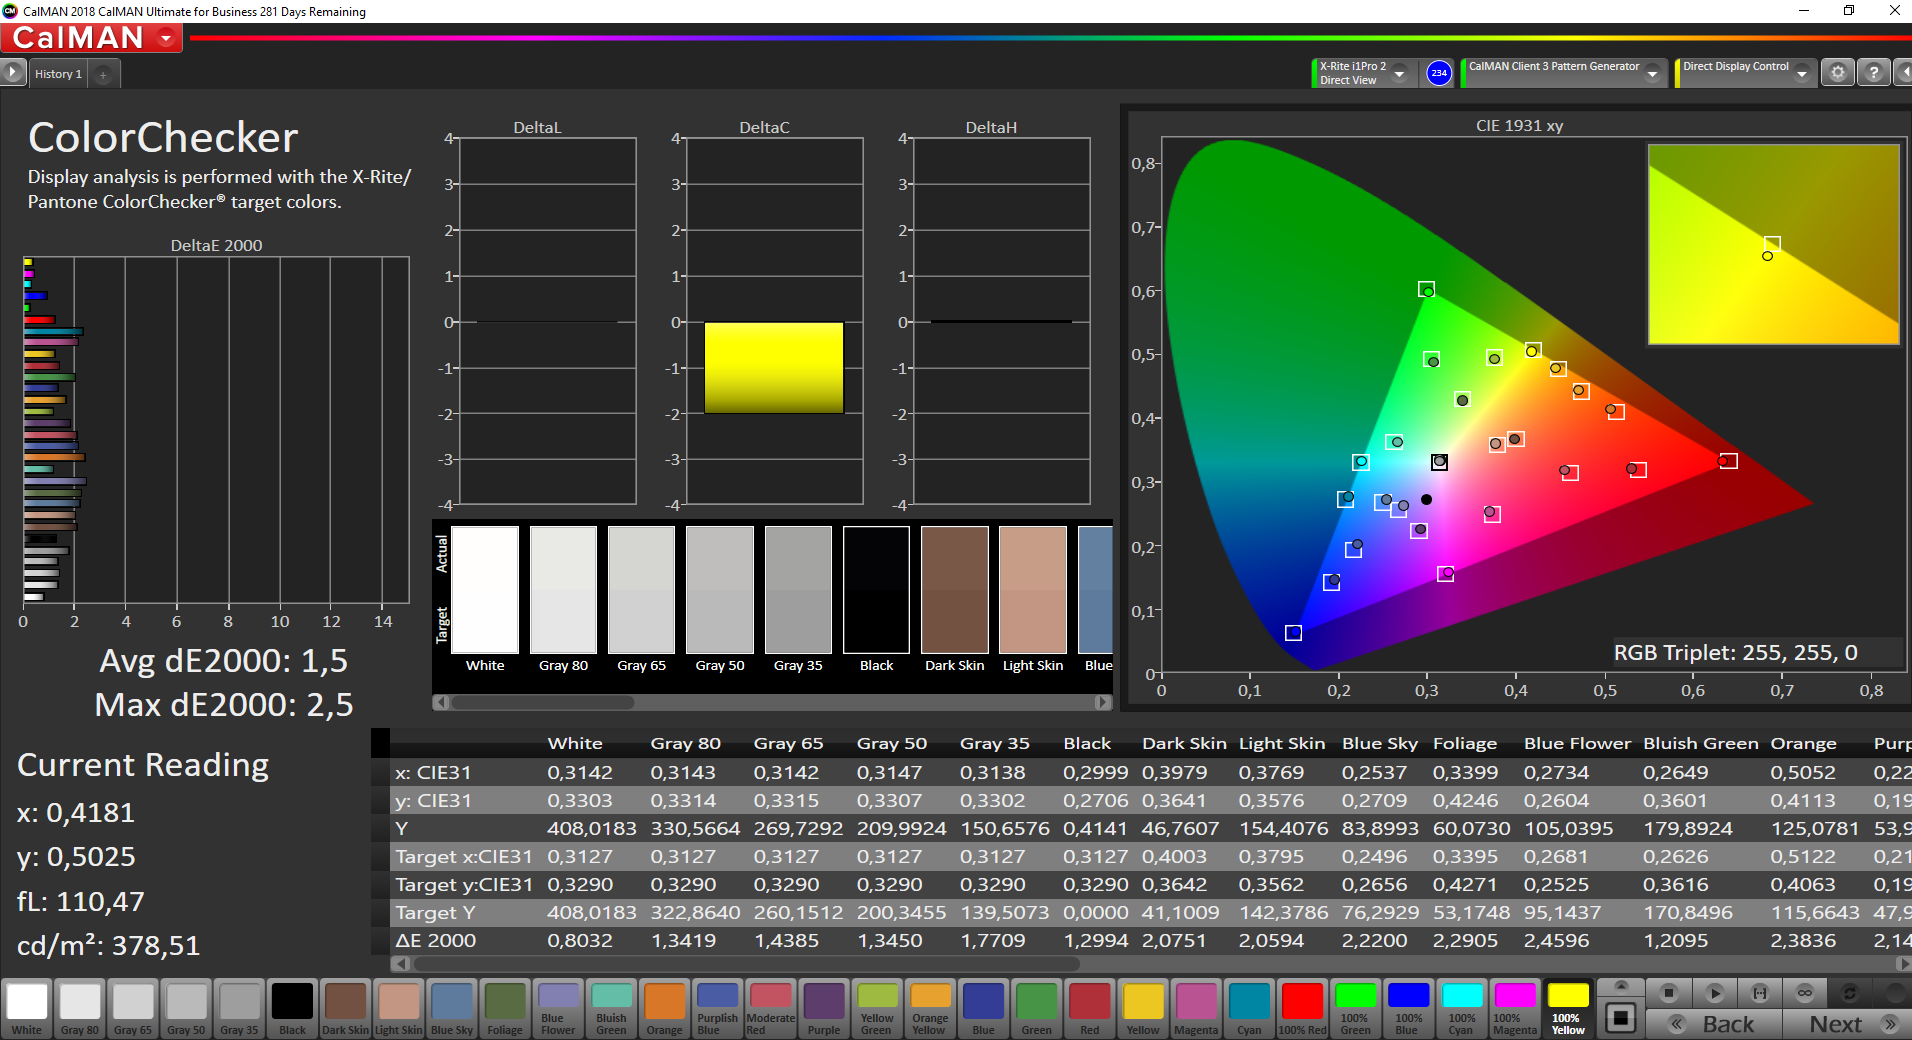
ΔE ColorChecker Calman: 1.5 | ∀{0.5-29.43 Ø4.73}
calibrated: 1.4
ΔE Greyscale Calman: 1.6 | ∀{0.09-98 Ø4.97}
96.8% sRGB (Argyll 1.6.3 3D)
63.7% AdobeRGB 1998 (Argyll 1.6.3 3D)
69.1% AdobeRGB 1998 (Argyll 3D)
96.7% sRGB (Argyll 3D)
66.9% Display P3 (Argyll 3D)
Gamma: 2.05
CCT: 6432 K
| Microsoft Surface Pro 7 Plus LG Philips LP123WQ332684, IPS, 2736x1824, 12.3" | Lenovo Yoga Duet 7 13IML05-82AS000WGE CSOT T3 LEN8290, IPS, 2160x1350, 13" | Dell Latitude 12 7210 2-in-1 Sharp LQ123N1, IPS, 1920x1280, 12.3" | Microsoft Surface Pro 7 LG Philips LP123WQ112604, IPS, 2736x1824, 12.3" | Microsoft Surface Pro 7 Core i5-1035G4 LG Philips LP123WQ112604, IPS, 2736x1824, 12.3" | |
|---|---|---|---|---|---|
| Display | 3% | 0% | -4% | -2% | |
| Display P3 Coverage (%) | 66.9 | 68.9 3% | 67.9 1% | 63.7 -5% | 66 -1% |
| sRGB Coverage (%) | 96.7 | 98.2 2% | 96.8 0% | 95.8 -1% | 93.8 -3% |
| AdobeRGB 1998 Coverage (%) | 69.1 | 71.1 3% | 68.8 0% | 65.7 -5% | 66.9 -3% |
| Response Times | 5% | 48% | 19% | 26% | |
| Response Time Grey 50% / Grey 80% * (ms) | 50.8 ? | 58 ? -14% | 29 ? 43% | 40 ? 21% | 34.8 ? 31% |
| Response Time Black / White * (ms) | 33.6 ? | 26 ? 23% | 16 ? 52% | 28 ? 17% | 26.4 ? 21% |
| PWM Frequency (Hz) | 199.2 ? | 1250 ? | 250 ? | 21550 ? | |
| Screen | -65% | -13% | -6% | -74% | |
| Brightness middle (cd/m²) | 408 | 450 10% | 380 -7% | 435 7% | 480.4 18% |
| Brightness (cd/m²) | 425 | 411 -3% | 378 -11% | 422 -1% | 485 14% |
| Brightness Distribution (%) | 85 | 83 -2% | 86 1% | 90 6% | 91 7% |
| Black Level * (cd/m²) | 0.34 | 0.22 35% | 0.31 9% | 0.32 6% | 0.48 -41% |
| Contrast (:1) | 1200 | 2045 70% | 1226 2% | 1359 13% | 1001 -17% |
| Colorchecker dE 2000 * | 1.5 | 4.15 -177% | 2.28 -52% | 1.18 21% | 5 -233% |
| Colorchecker dE 2000 max. * | 2.5 | 11.49 -360% | 3.93 -57% | 2.27 9% | 7.72 -209% |
| Colorchecker dE 2000 calibrated * | 1.4 | 1.09 22% | 0.97 31% | 3.49 -149% | 2.44 -74% |
| Greyscale dE 2000 * | 1.6 | 6.66 -316% | 2.56 -60% | 1.12 30% | 5.9 -269% |
| Gamma | 2.05 107% | 2.42 91% | 2.32 95% | 2.3 96% | 2.38 92% |
| CCT | 6432 101% | 6043 108% | 6130 106% | 6502 100% | 7805 83% |
| Color Space (Percent of AdobeRGB 1998) (%) | 63.7 | 65 2% | 63 -1% | 60 -6% | 60.3 -5% |
| Color Space (Percent of sRGB) (%) | 96.8 | 98 1% | 97 0% | 96 -1% | 93.2 -4% |
| Média Total (Programa/Configurações) | -19% /
-44% | 12% /
-3% | 3% /
-2% | -17% /
-48% |
* ... menor é melhor
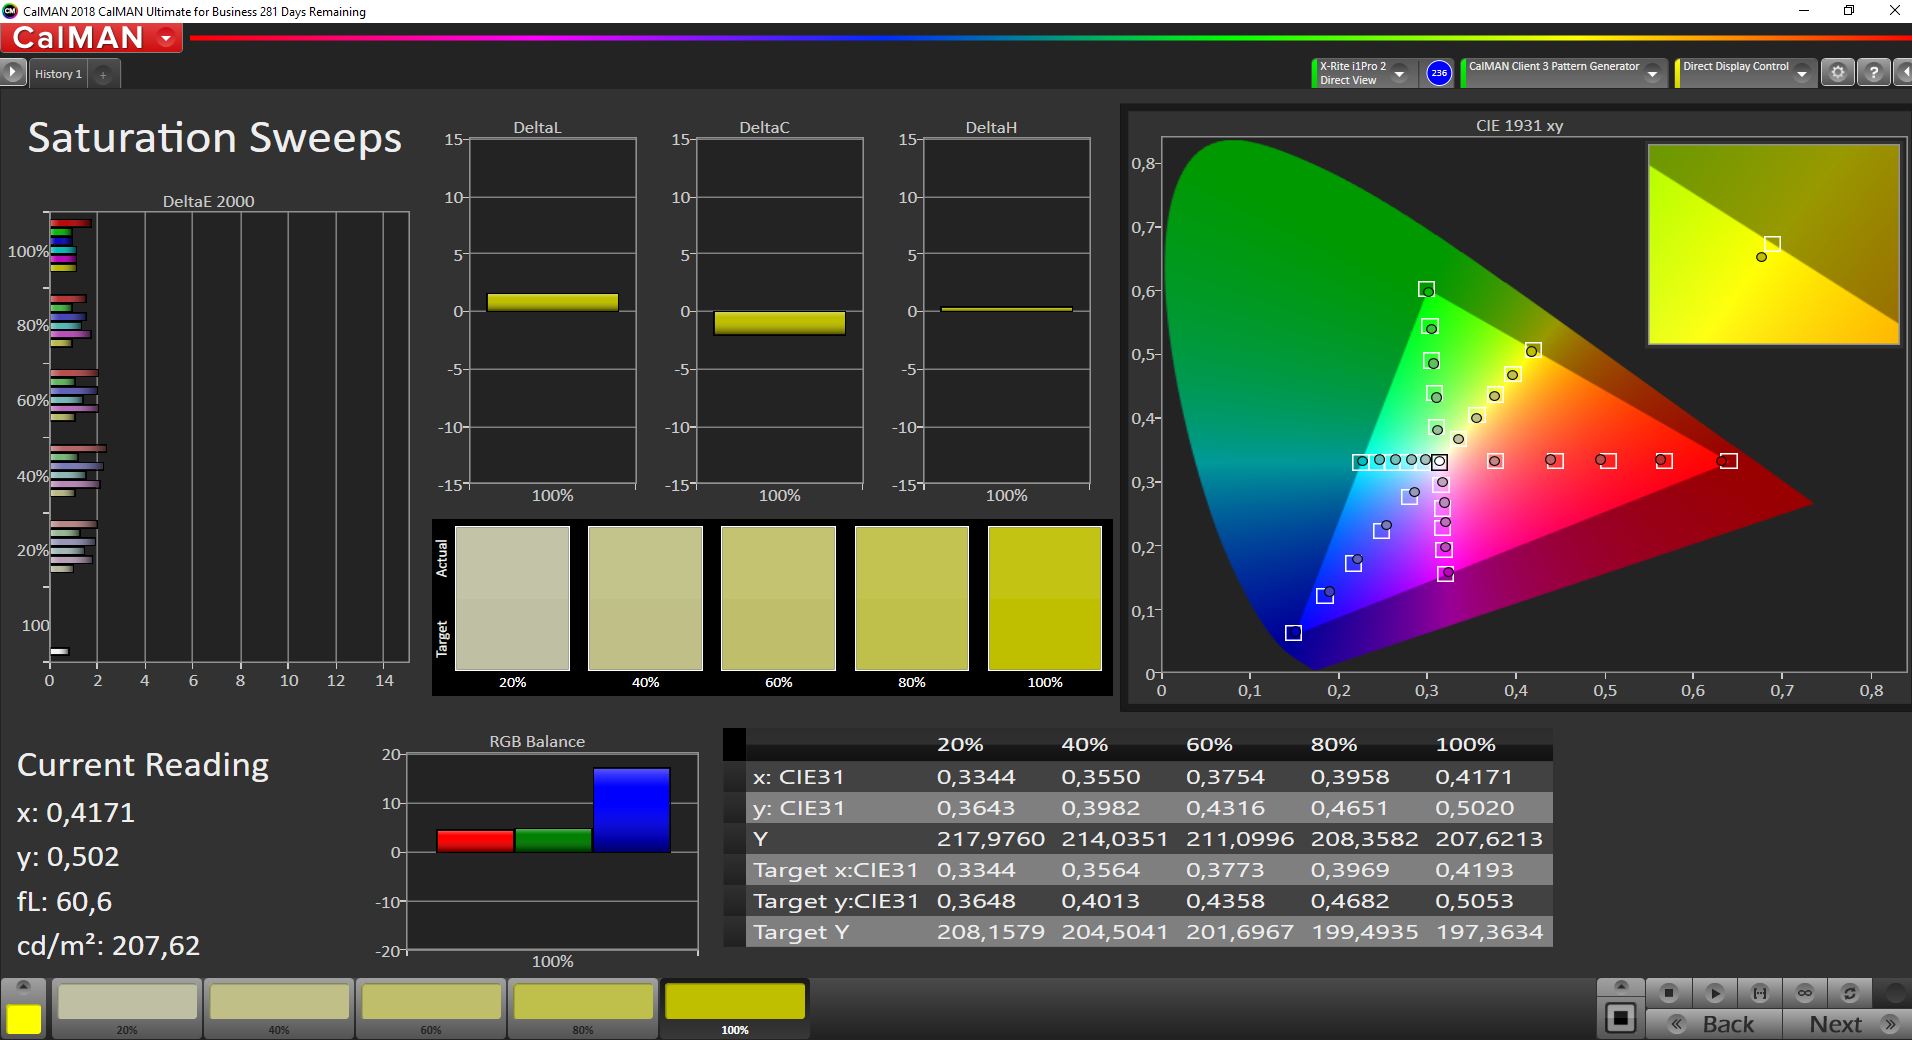
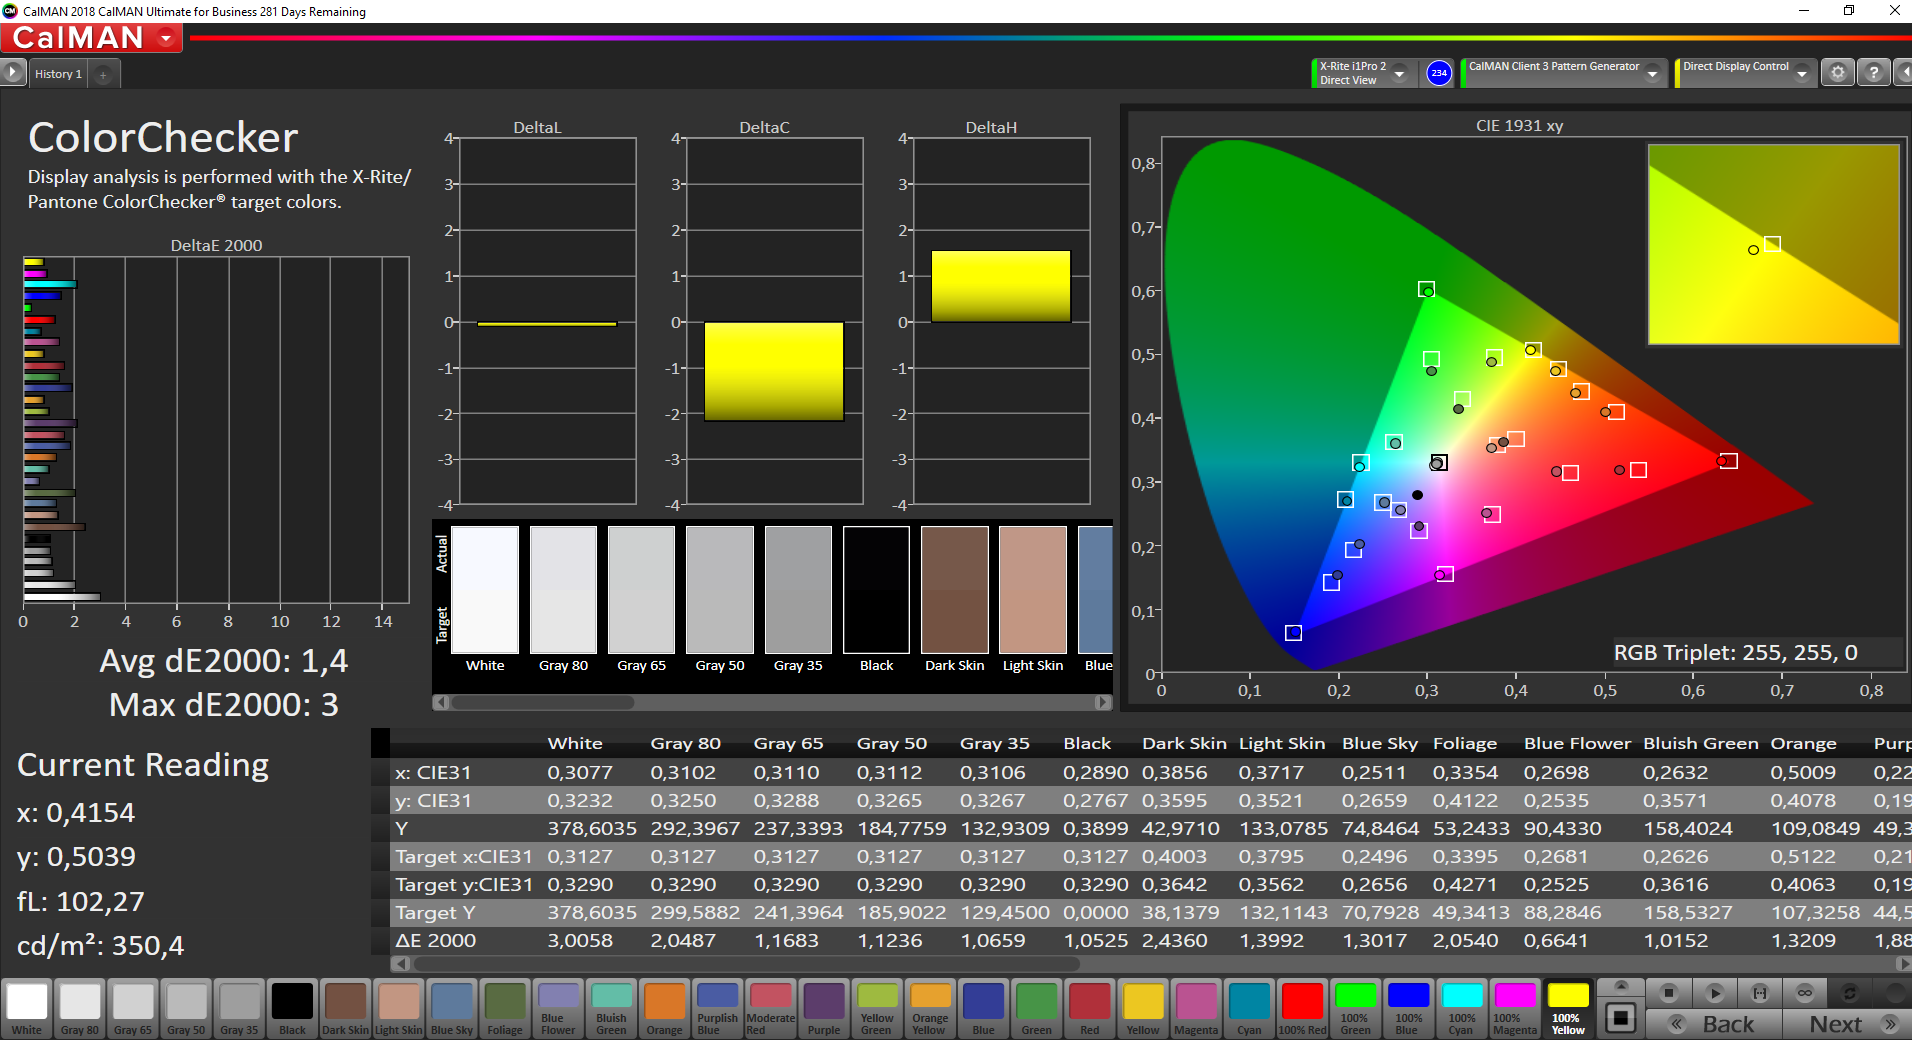
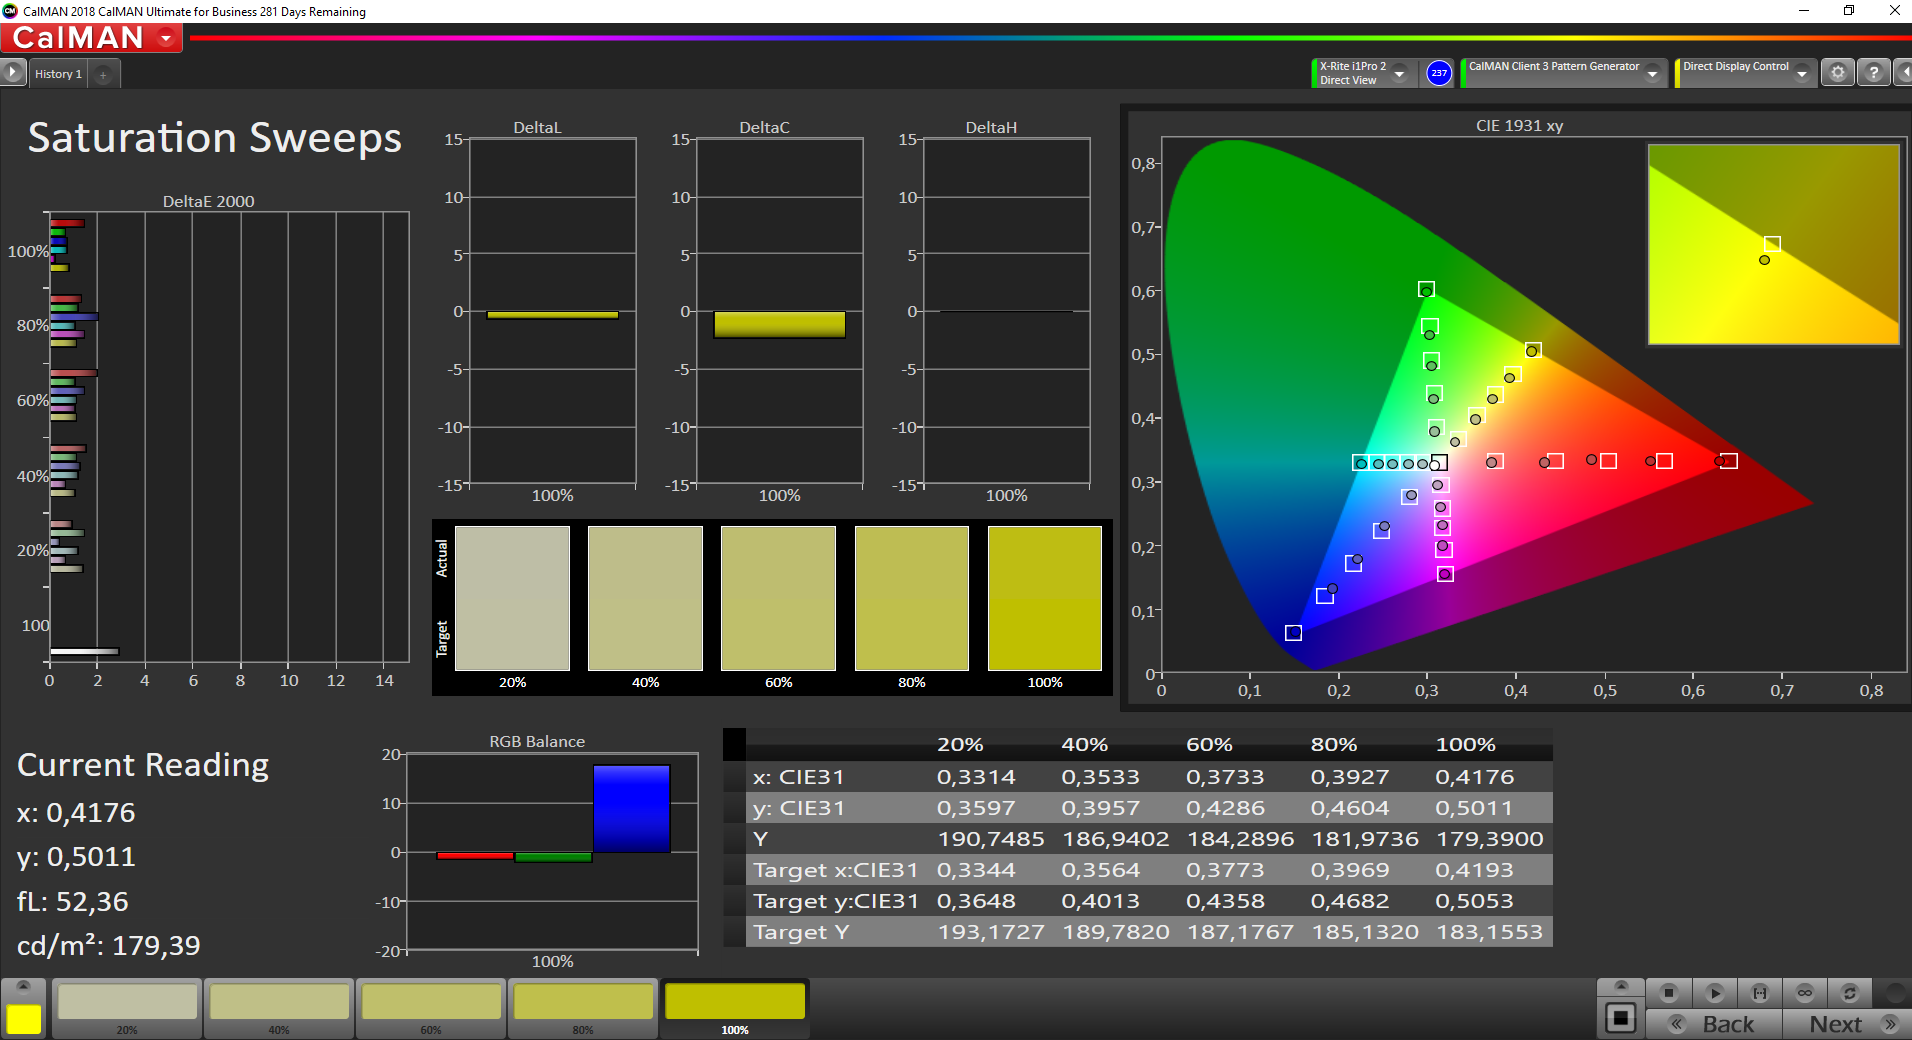
O visor mostra uma boa reprodução de cores fora da caixa e atinge o alvo (Delta E menos de 3) com um desvio de cor de 1,5. O mostrador também não sofre de uma coloração azul. Além disso, a calibração proporciona ligeiras melhorias: O desvio de cor cai para 1,4, e as escalas de cinza são exibidas de forma mais equilibrada. O display não consegue reproduzir completamente os espaços de cor AdobeRGB (63,7%) e sRGB (96,8%)

Exibir tempos de resposta
| ↔ Tempo de resposta preto para branco | ||
|---|---|---|
| 33.6 ms ... ascensão ↗ e queda ↘ combinadas | ↗ 18.8 ms ascensão | 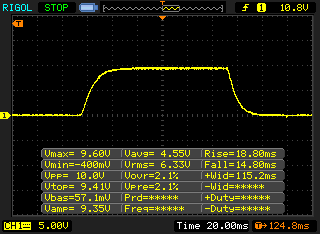 |
| ↘ 14.8 ms queda | ||
| A tela mostra taxas de resposta lentas em nossos testes e será insatisfatória para os jogadores. Em comparação, todos os dispositivos testados variam de 0.1 (mínimo) a 240 (máximo) ms. » 90 % de todos os dispositivos são melhores. Isso significa que o tempo de resposta medido é pior que a média de todos os dispositivos testados (19.9 ms). | ||
| ↔ Tempo de resposta 50% cinza a 80% cinza | ||
| 50.8 ms ... ascensão ↗ e queda ↘ combinadas | ↗ 25.2 ms ascensão | 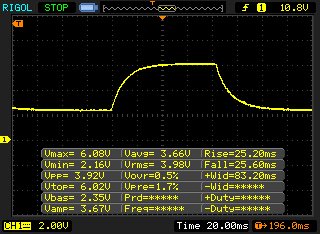 |
| ↘ 25.6 ms queda | ||
| A tela mostra taxas de resposta lentas em nossos testes e será insatisfatória para os jogadores. Em comparação, todos os dispositivos testados variam de 0.165 (mínimo) a 636 (máximo) ms. » 87 % de todos os dispositivos são melhores. Isso significa que o tempo de resposta medido é pior que a média de todos os dispositivos testados (31.1 ms). | ||
Cintilação da tela / PWM (modulação por largura de pulso)
| Tela tremeluzindo/PWM detectado | 199.2 Hz | ≤ 57 % configuração de brilho | 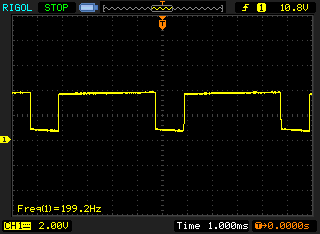 |
| ≤ 119 brilho cd/m² | |||
A luz de fundo da tela pisca em 199.2 Hz (pior caso, por exemplo, utilizando PWM) Cintilação detectada em uma configuração de brilho de 57 % (119 cd/m²) e abaixo. Não deve haver cintilação ou PWM acima desta configuração de brilho. A frequência de 199.2 Hz é relativamente baixa, portanto, usuários sensíveis provavelmente notarão cintilação e sentirão fadiga ocular na configuração de brilho indicada e abaixo. A cintilação ocorre em configurações de brilho relativamente baixas, portanto, o uso prolongado nesta configuração de brilho ou inferior pode causar fadiga ocular. [pwm_comparison] Em comparação: 52 % de todos os dispositivos testados não usam PWM para escurecer a tela. Se PWM foi detectado, uma média de 7798 (mínimo: 5 - máximo: 343500) Hz foi medida. | |||
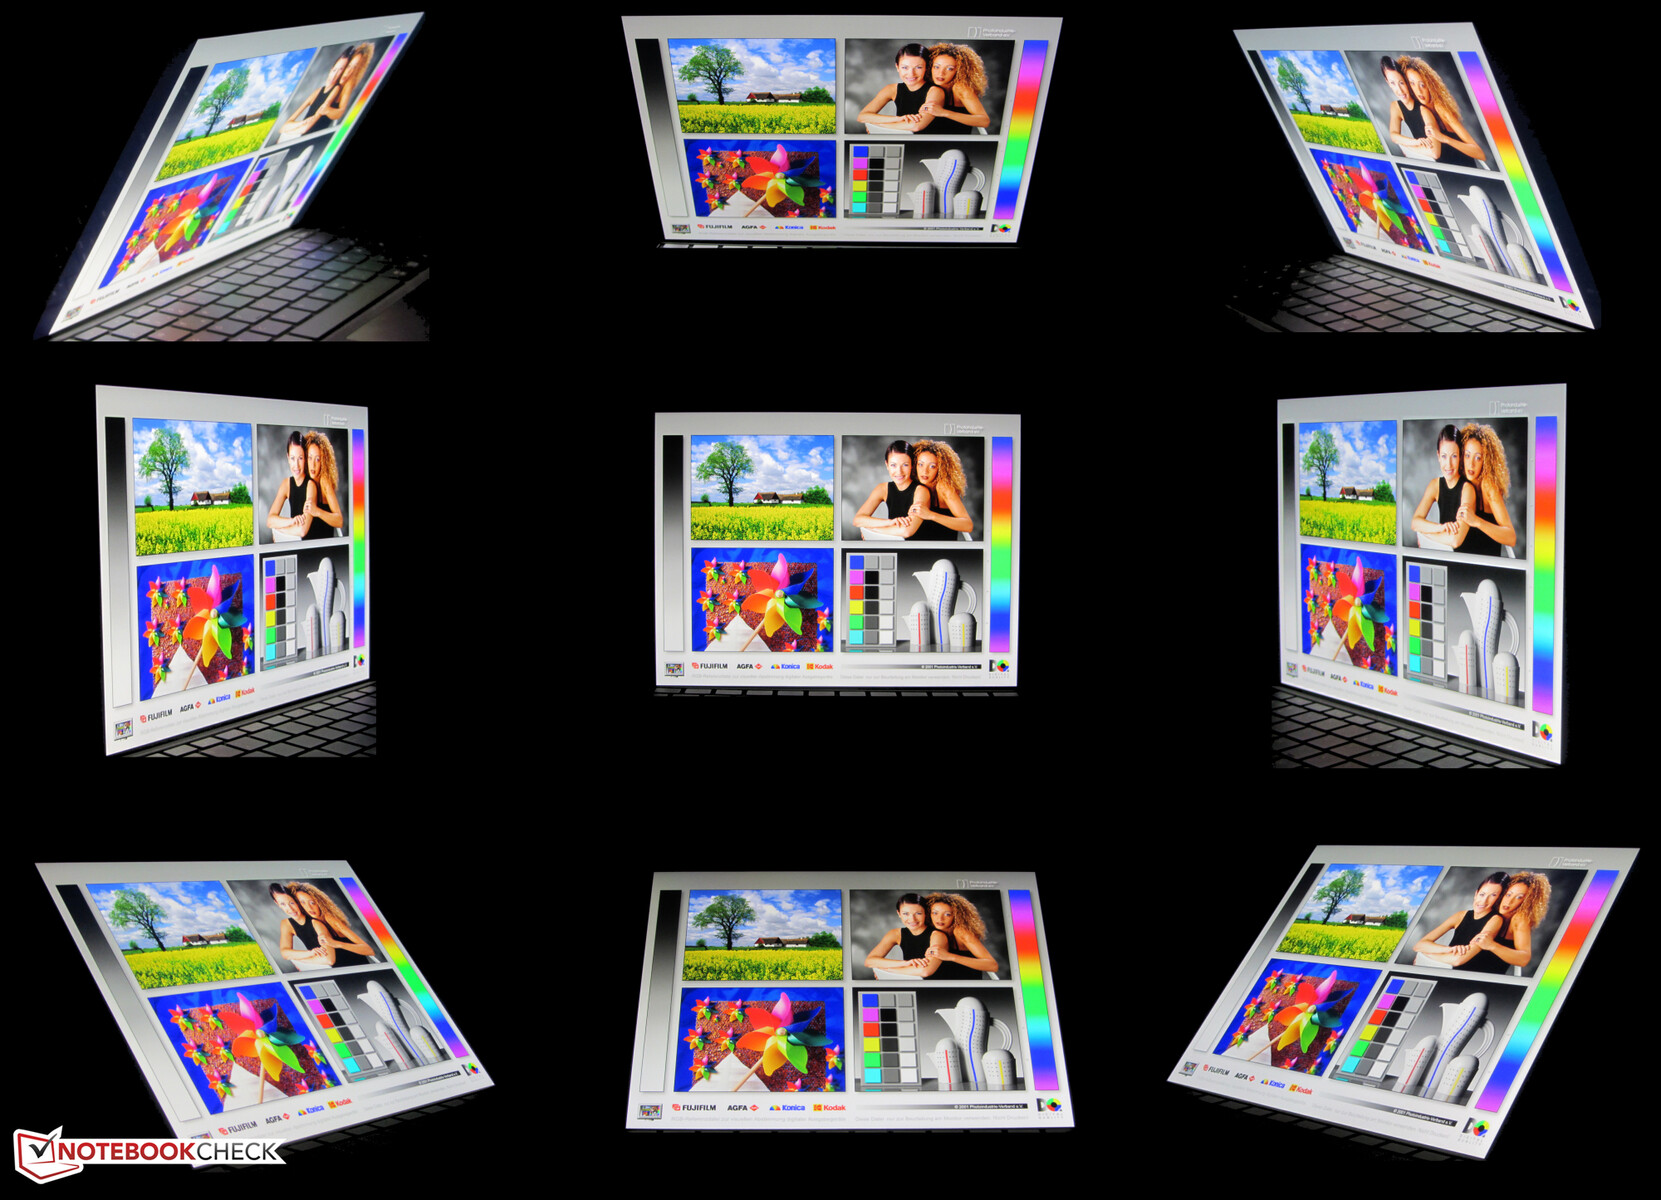
O painel IPS estável em ângulo de visão pode ser lido a partir de qualquer posição. Ele oferece brilho suficiente para ser visto também ao ar livre. No entanto, a superfície brilhante do visor muitas vezes obstrui a legibilidade
Desempenho - Mais desempenho graças a Tiger Lake
O Surface Pro 7 Plus da Microsoft é um dispositivo 2-em-1 de 12,3 polegadas para empresas e escolas que oferece poder computacional suficiente para aplicações de escritório e Internet. Uma variedade de configurações está disponível
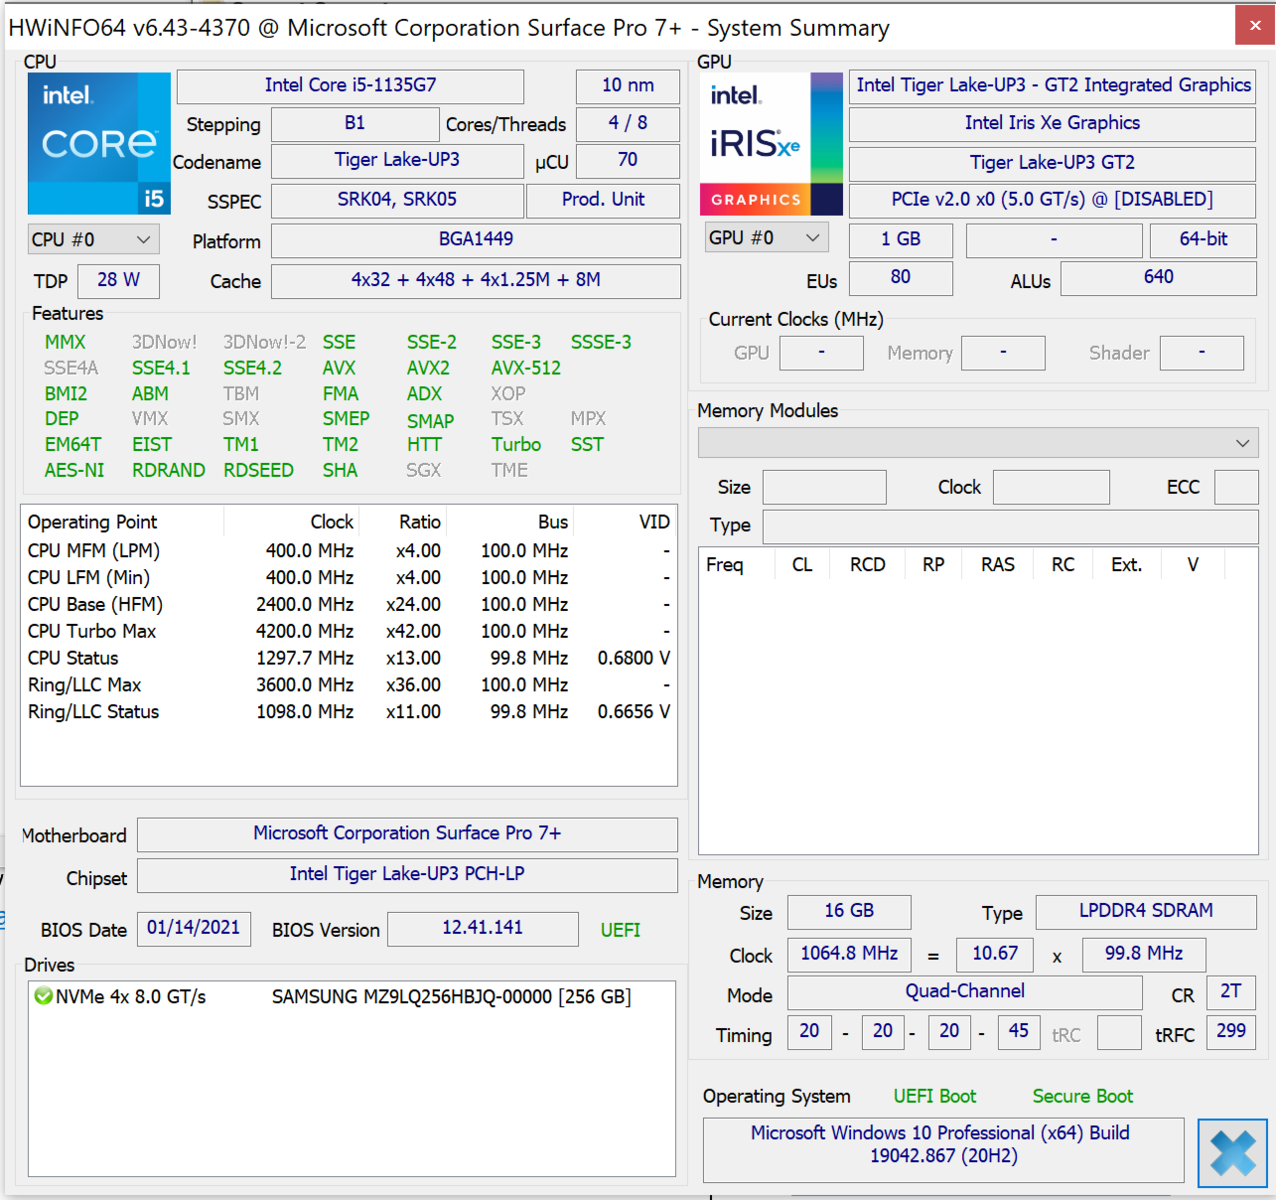
Processador
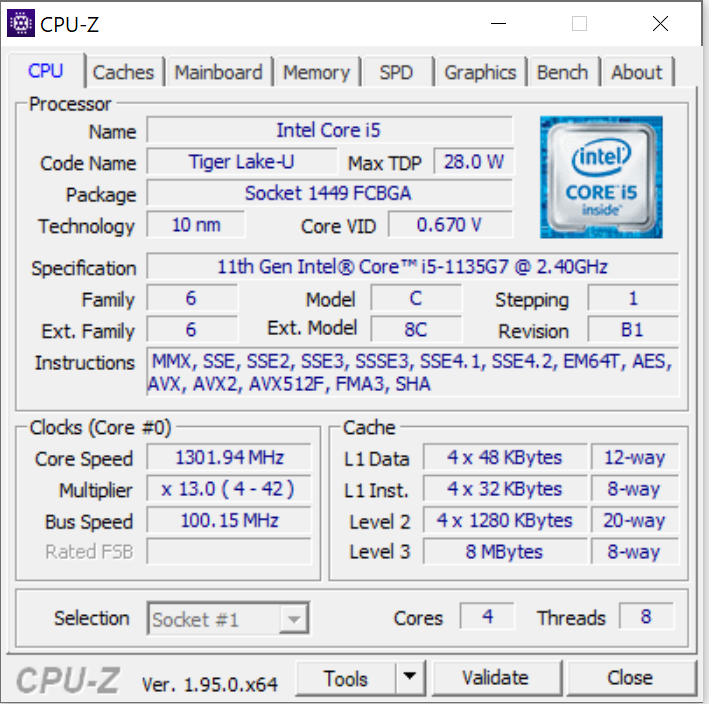
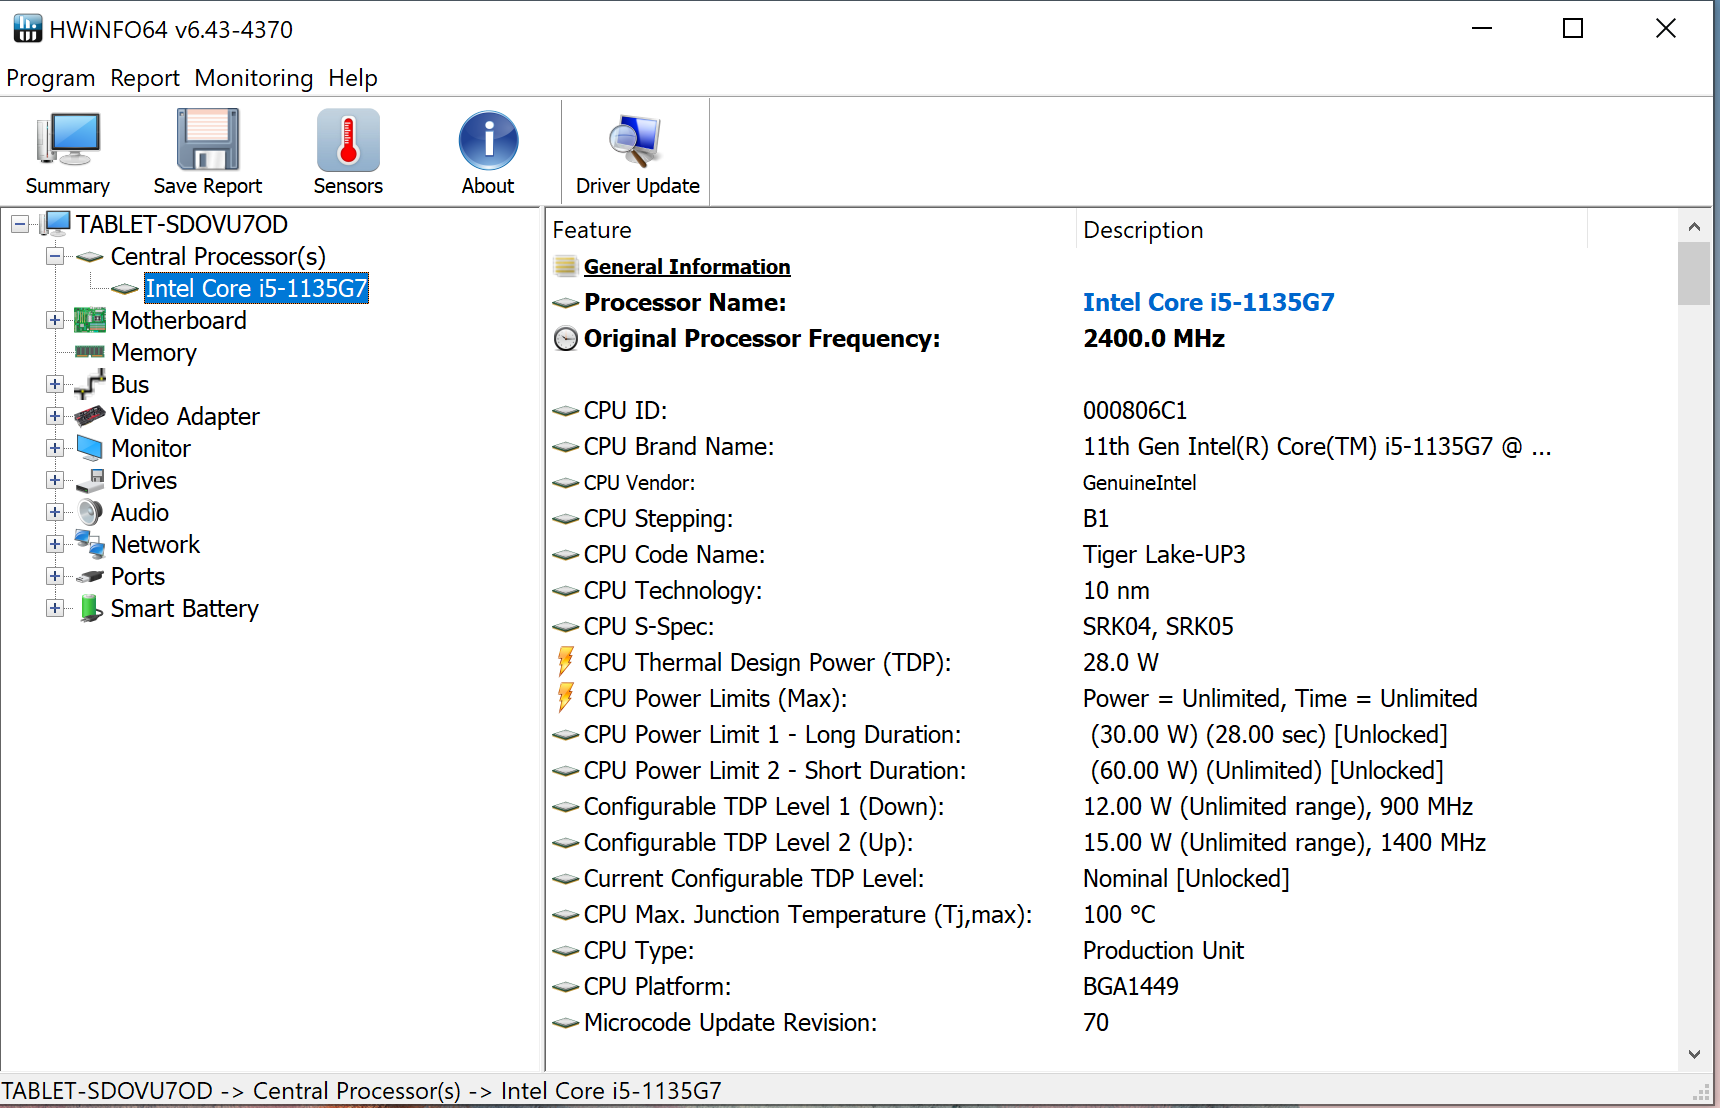
A Microsoft optou por Tiger Lake CPUs para o modelo Plus do Surface Pro 7. Nossa amostra de revisão está equipada com um processador Corei5-1135G7 quad-core
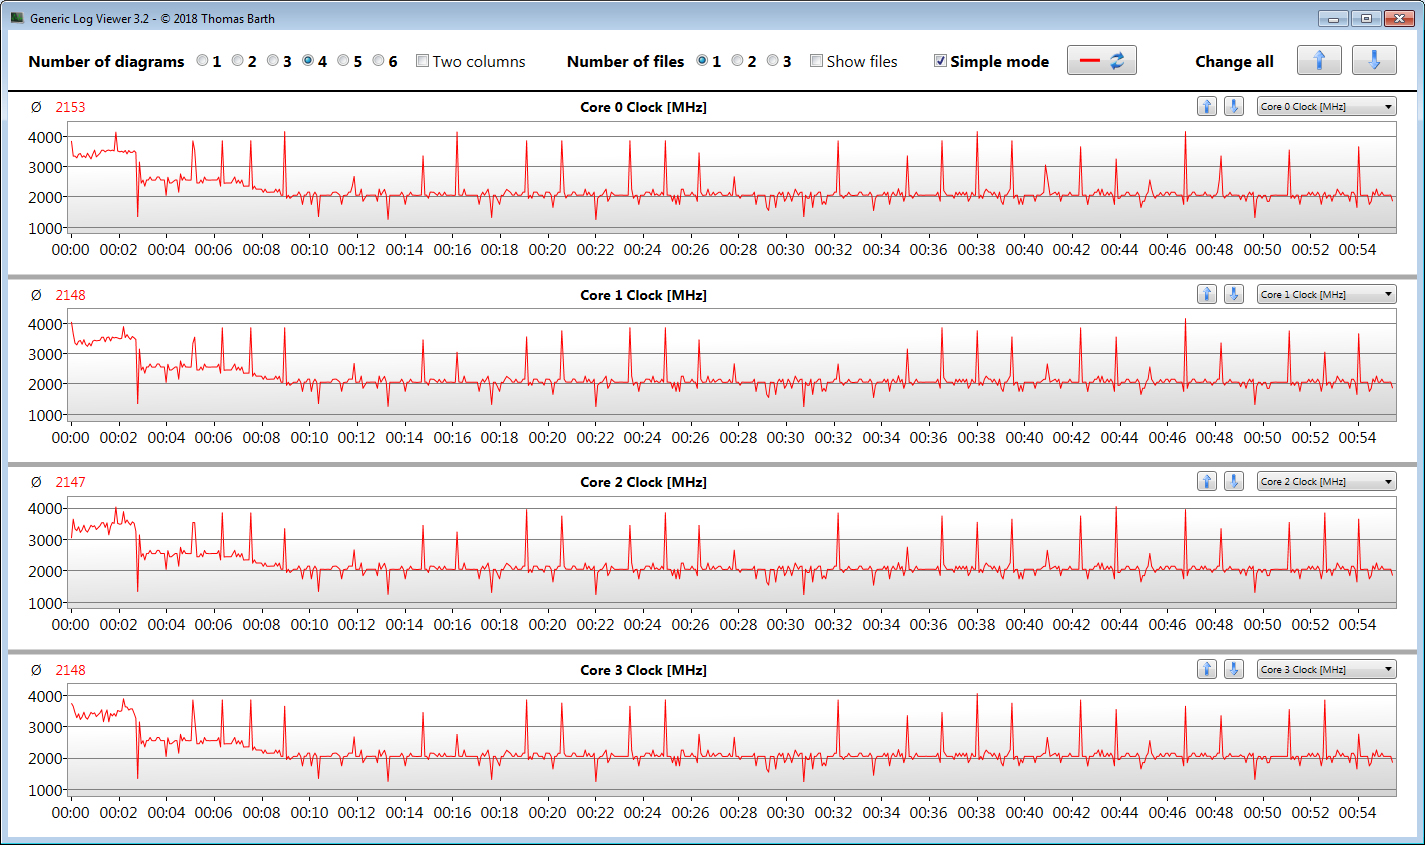
que funciona a uma velocidade de relógio de base de 2,4 GHz. Um aumento para 3,8 GHz (todos os núcleos) ou 4,2 GHz (um núcleo) é possível via Turbo. Suporta hiper-Threading (dois fios por núcleo).Os testes multithread dos benchmarks Cinebench são executados em 3 a 3,5 GHz, enquanto os testes single-thread são executados em 3,1 a 4,1 GHz. Na potência da bateria, as taxas de relógio são de 2,4 a 2,8 GHz (multifios) e 1,5 a 2,5 GHz (mono-fios), respectivamente.
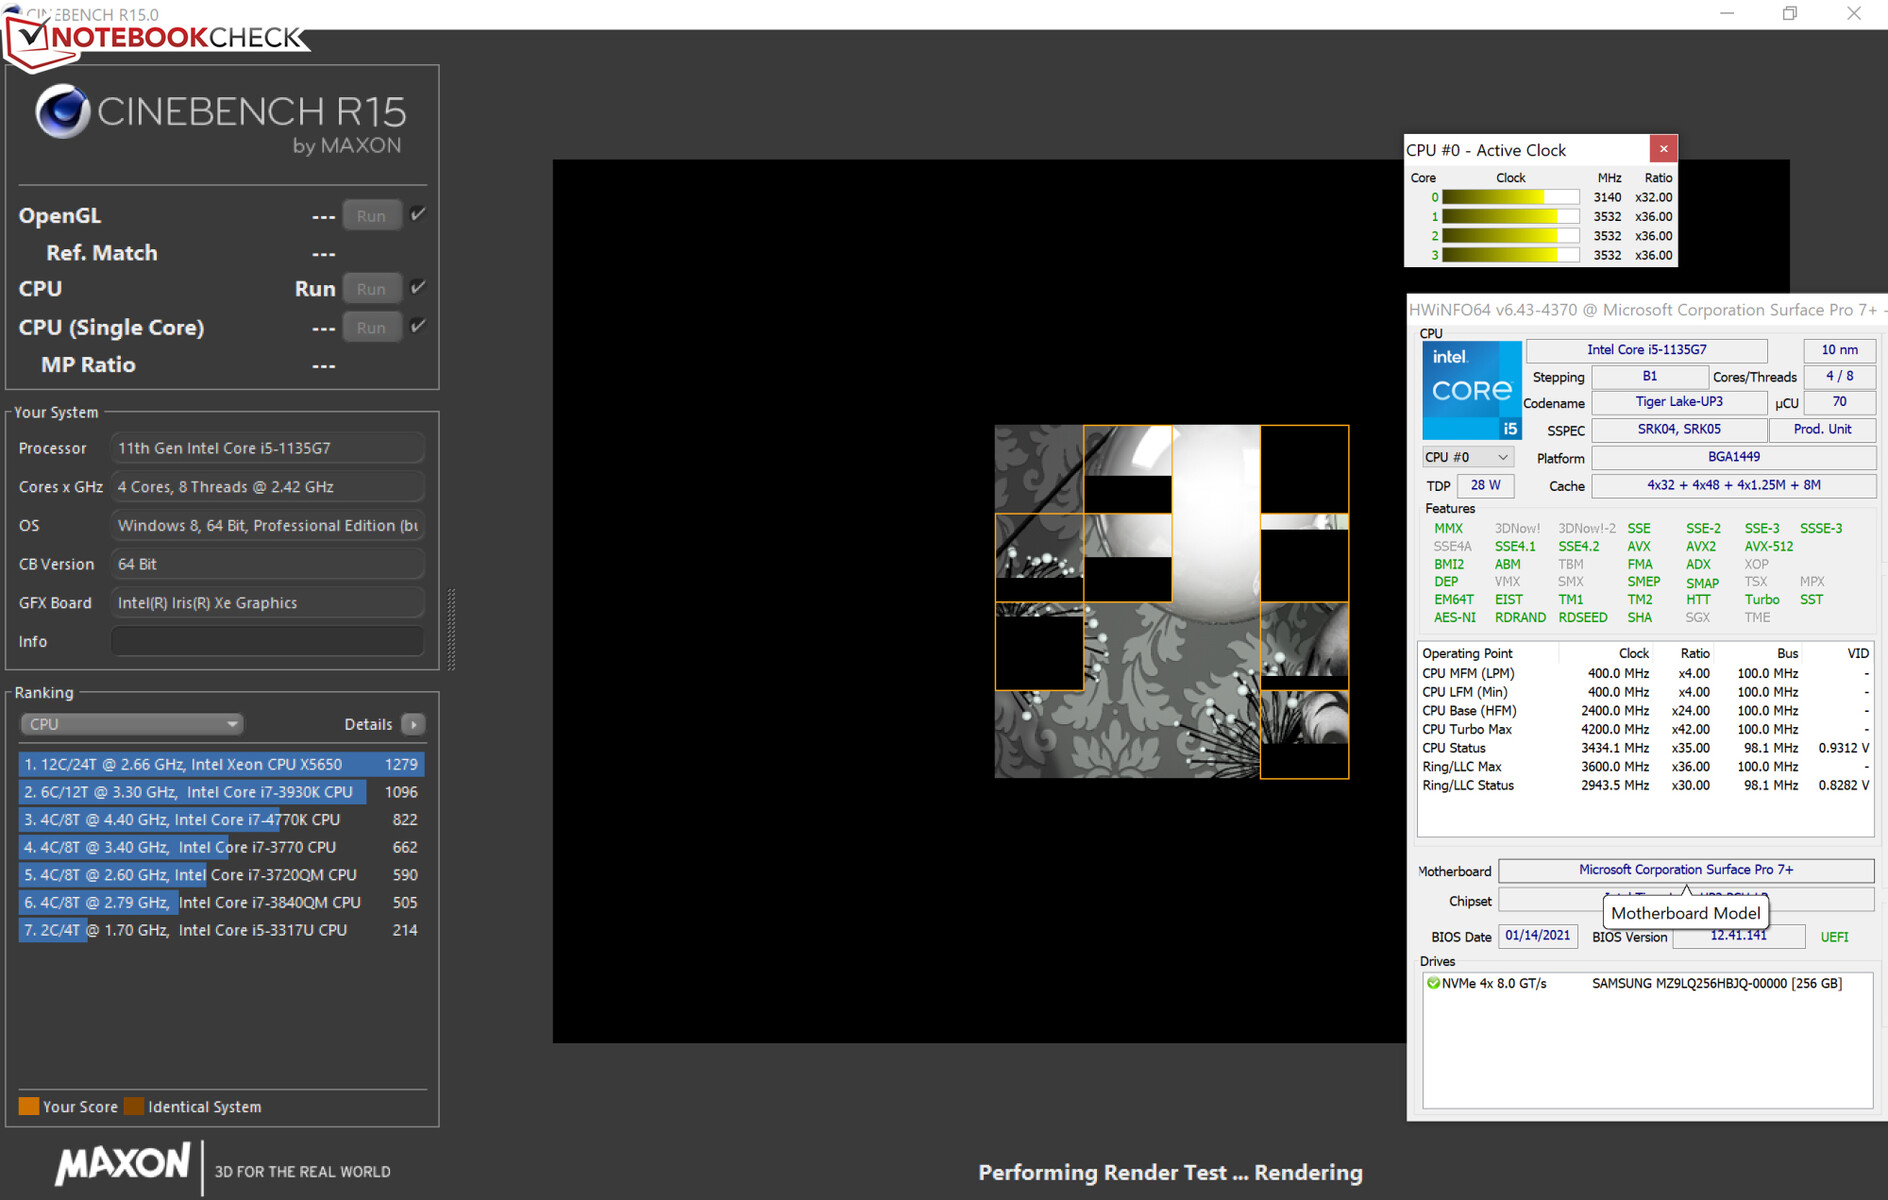
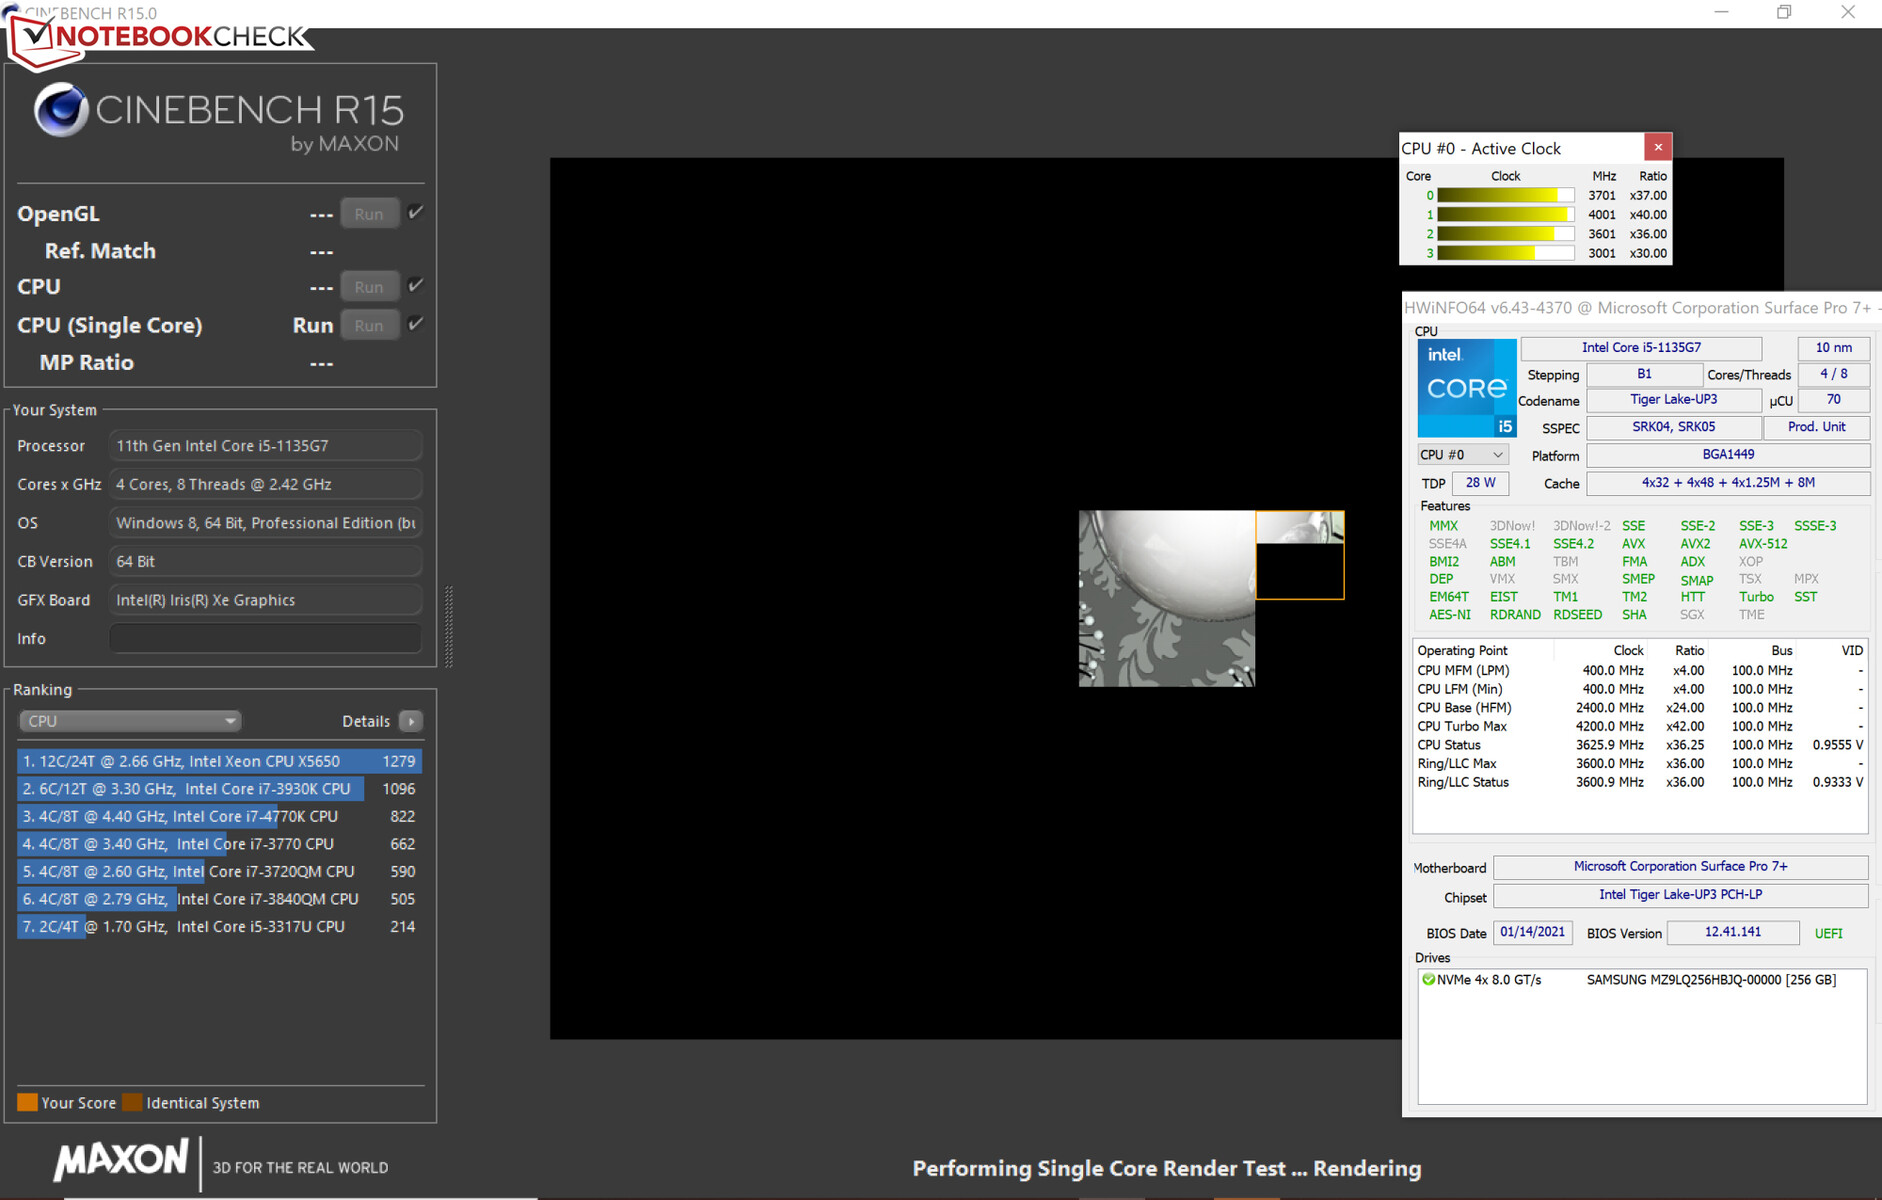
Verificamos se a CPU Turbo é utilizada de forma consistente quando conectada, executando o teste multithread do benchmark Cinebench R15 em um loop contínuo por pelo menos 30 minutos. As taxas de relógio além de 3 GHz só são alcançadas nos primeiros três minutos do teste. No curso seguinte, a CPU tem que ser estrangulada e cair abaixo de sua velocidade de relógio de base - o resfriamento passivo se torna perceptível aqui.
No total, os resultados de referência são bons. O processador Tiger Lake responde a picos de carga curtos com muita potência de computação e supera o desempenho do processador Ice Lake Core i5 no Surface Pro 7. Entretanto, o desempenho é colocado de joelhos sob carga prolongada
* ... menor é melhor
Desempenho do sistema
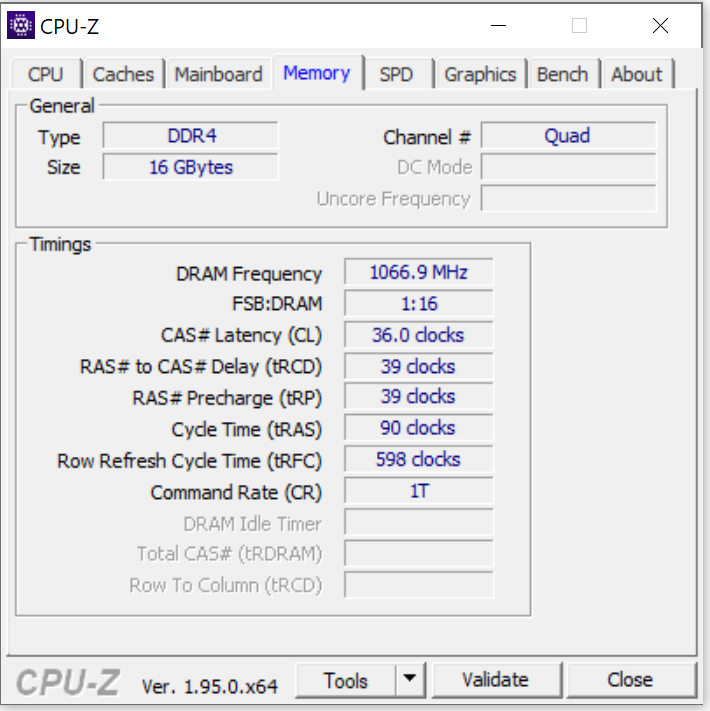
O sistema suave e rápido não causou nenhum problema. Ele oferece poder computacional mais do que suficiente para aplicações de escritório e Internet. Isto é complementado por bons resultados PCMark. A RAM de 12,3 polegadas (16 GB, LPDDR4X, a bordo) funciona em modo de canal duplo. A expansão da memória não é possível.
| PCMark 8 Home Score Accelerated v2 | 3472 pontos | |
| PCMark 8 Creative Score Accelerated v2 | 4157 pontos | |
| PCMark 8 Work Score Accelerated v2 | 2473 pontos | |
| PCMark 10 Score | 4026 pontos | |
Ajuda | ||
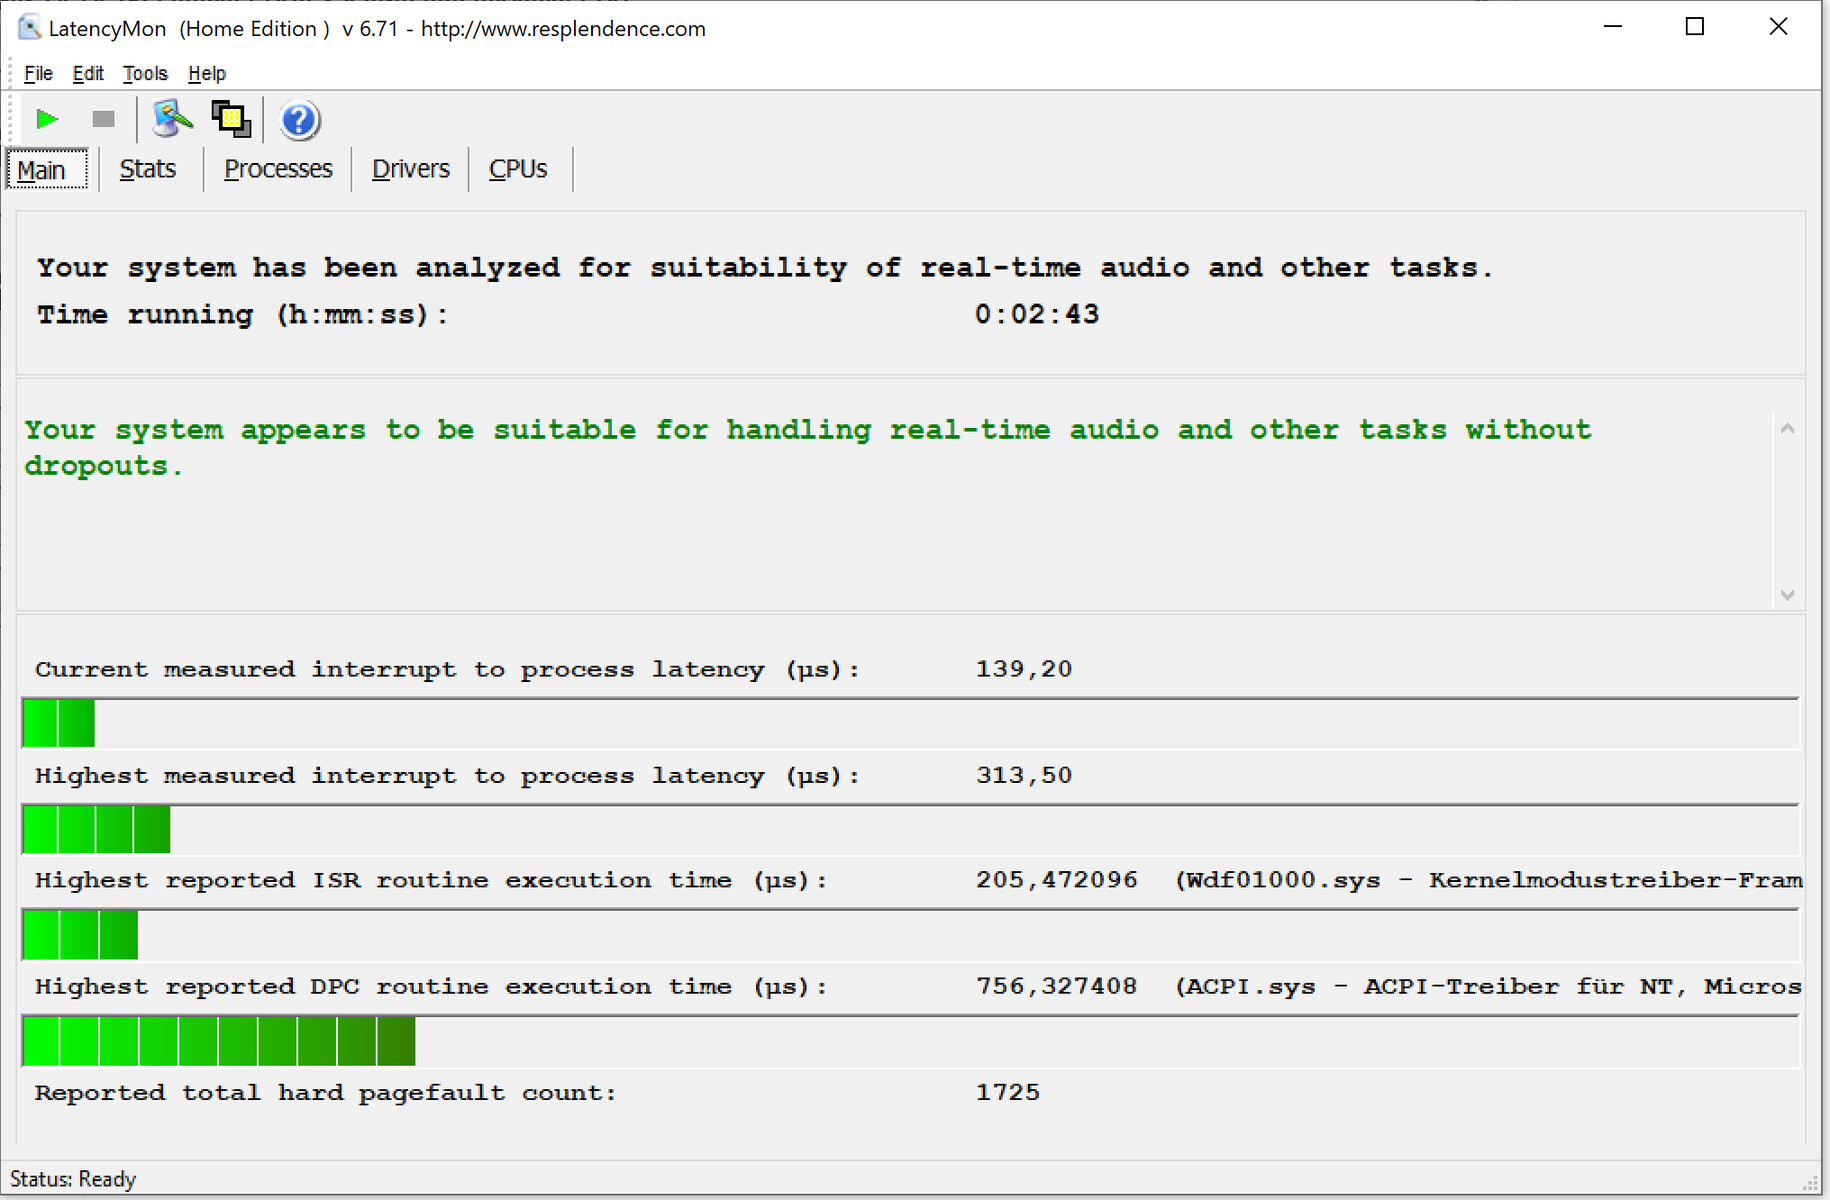
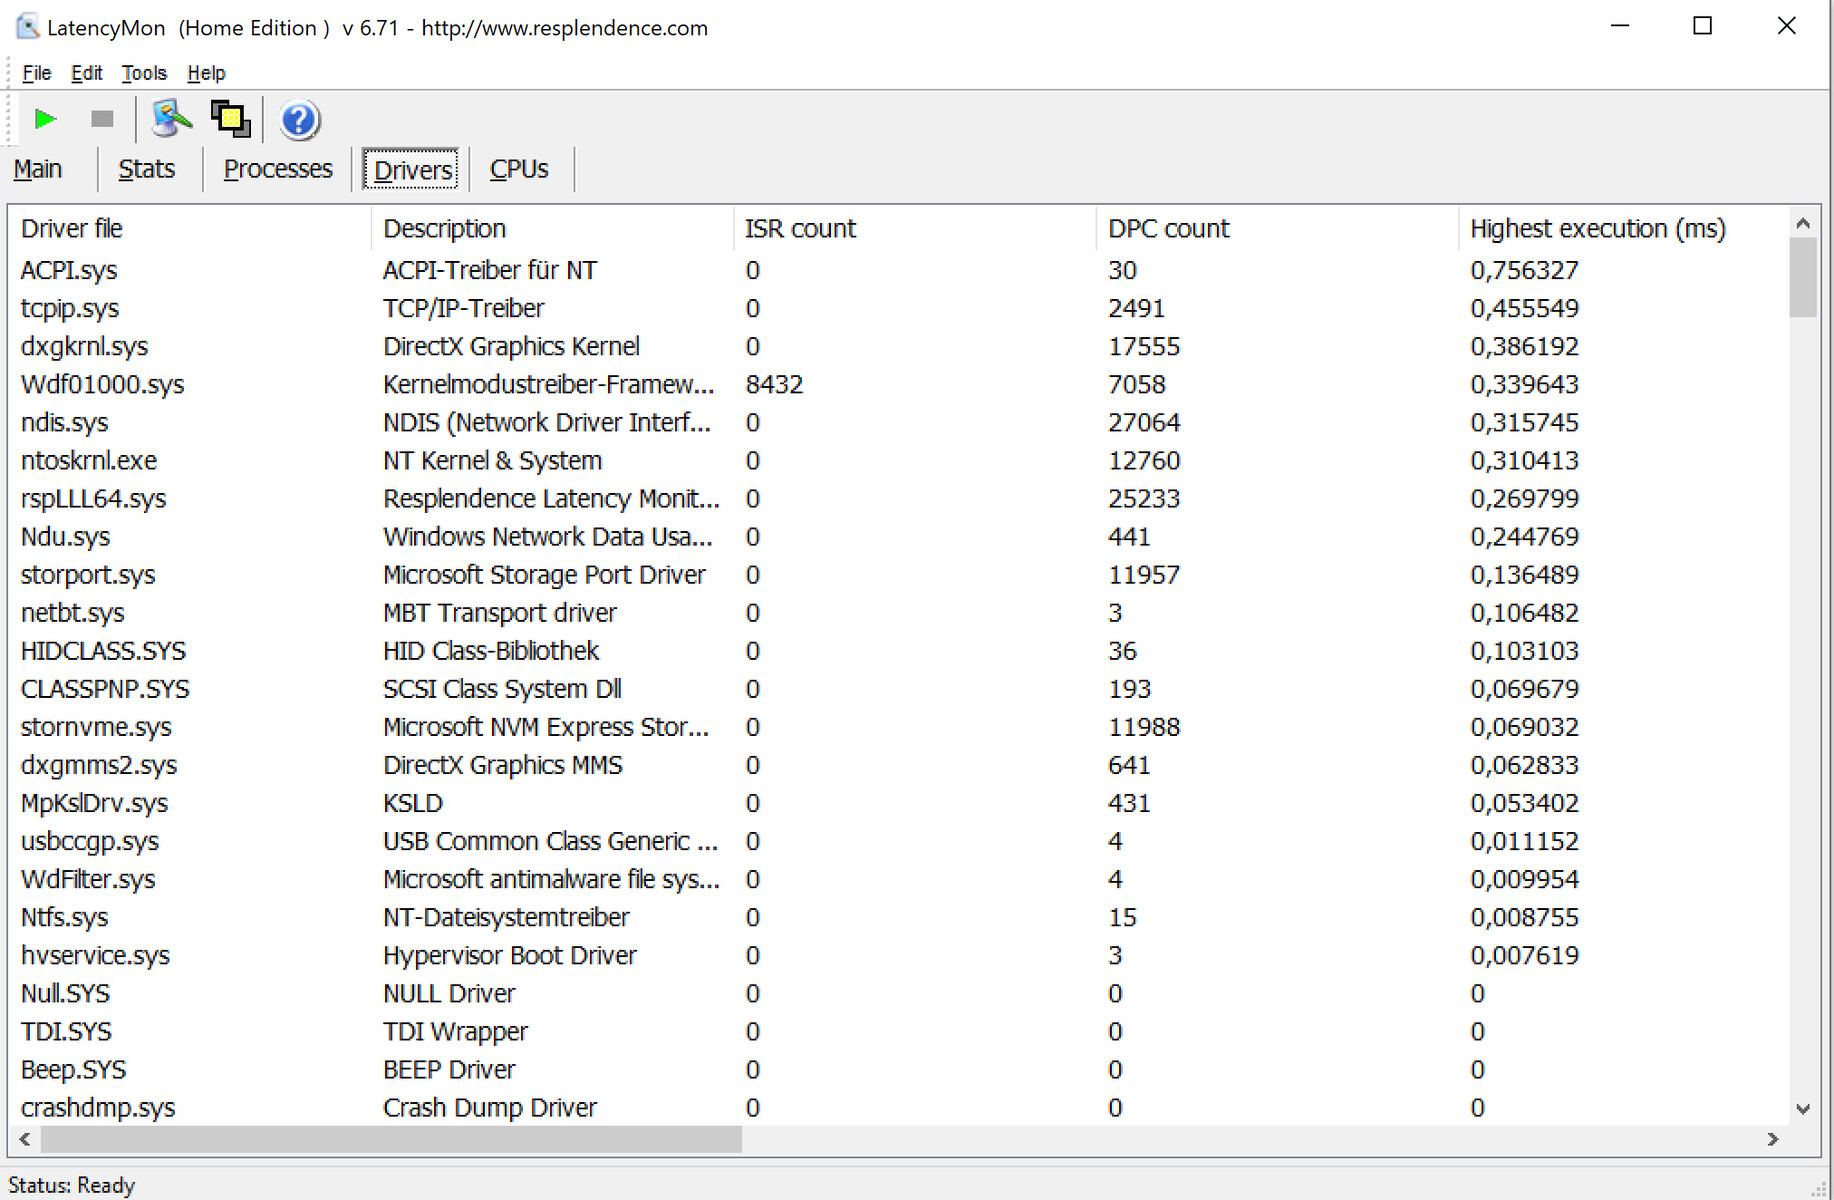
Latências DPC
Em nosso teste de monitor de latência padronizado (navegação na web, reprodução de vídeo 4K, Prime95 de alta carga), não observamos nenhum problema com as latências DPC. O sistema parece ser adequado para edição de vídeo e áudio em tempo real
| DPC Latencies / LatencyMon - interrupt to process latency (max), Web, Youtube, Prime95 | |
| Lenovo Yoga Duet 7 13IML05-82AS000WGE | |
| Dell Latitude 12 7210 2-in-1 | |
| Microsoft Surface Pro 7 Plus | |
* ... menor é melhor
Armazenamento
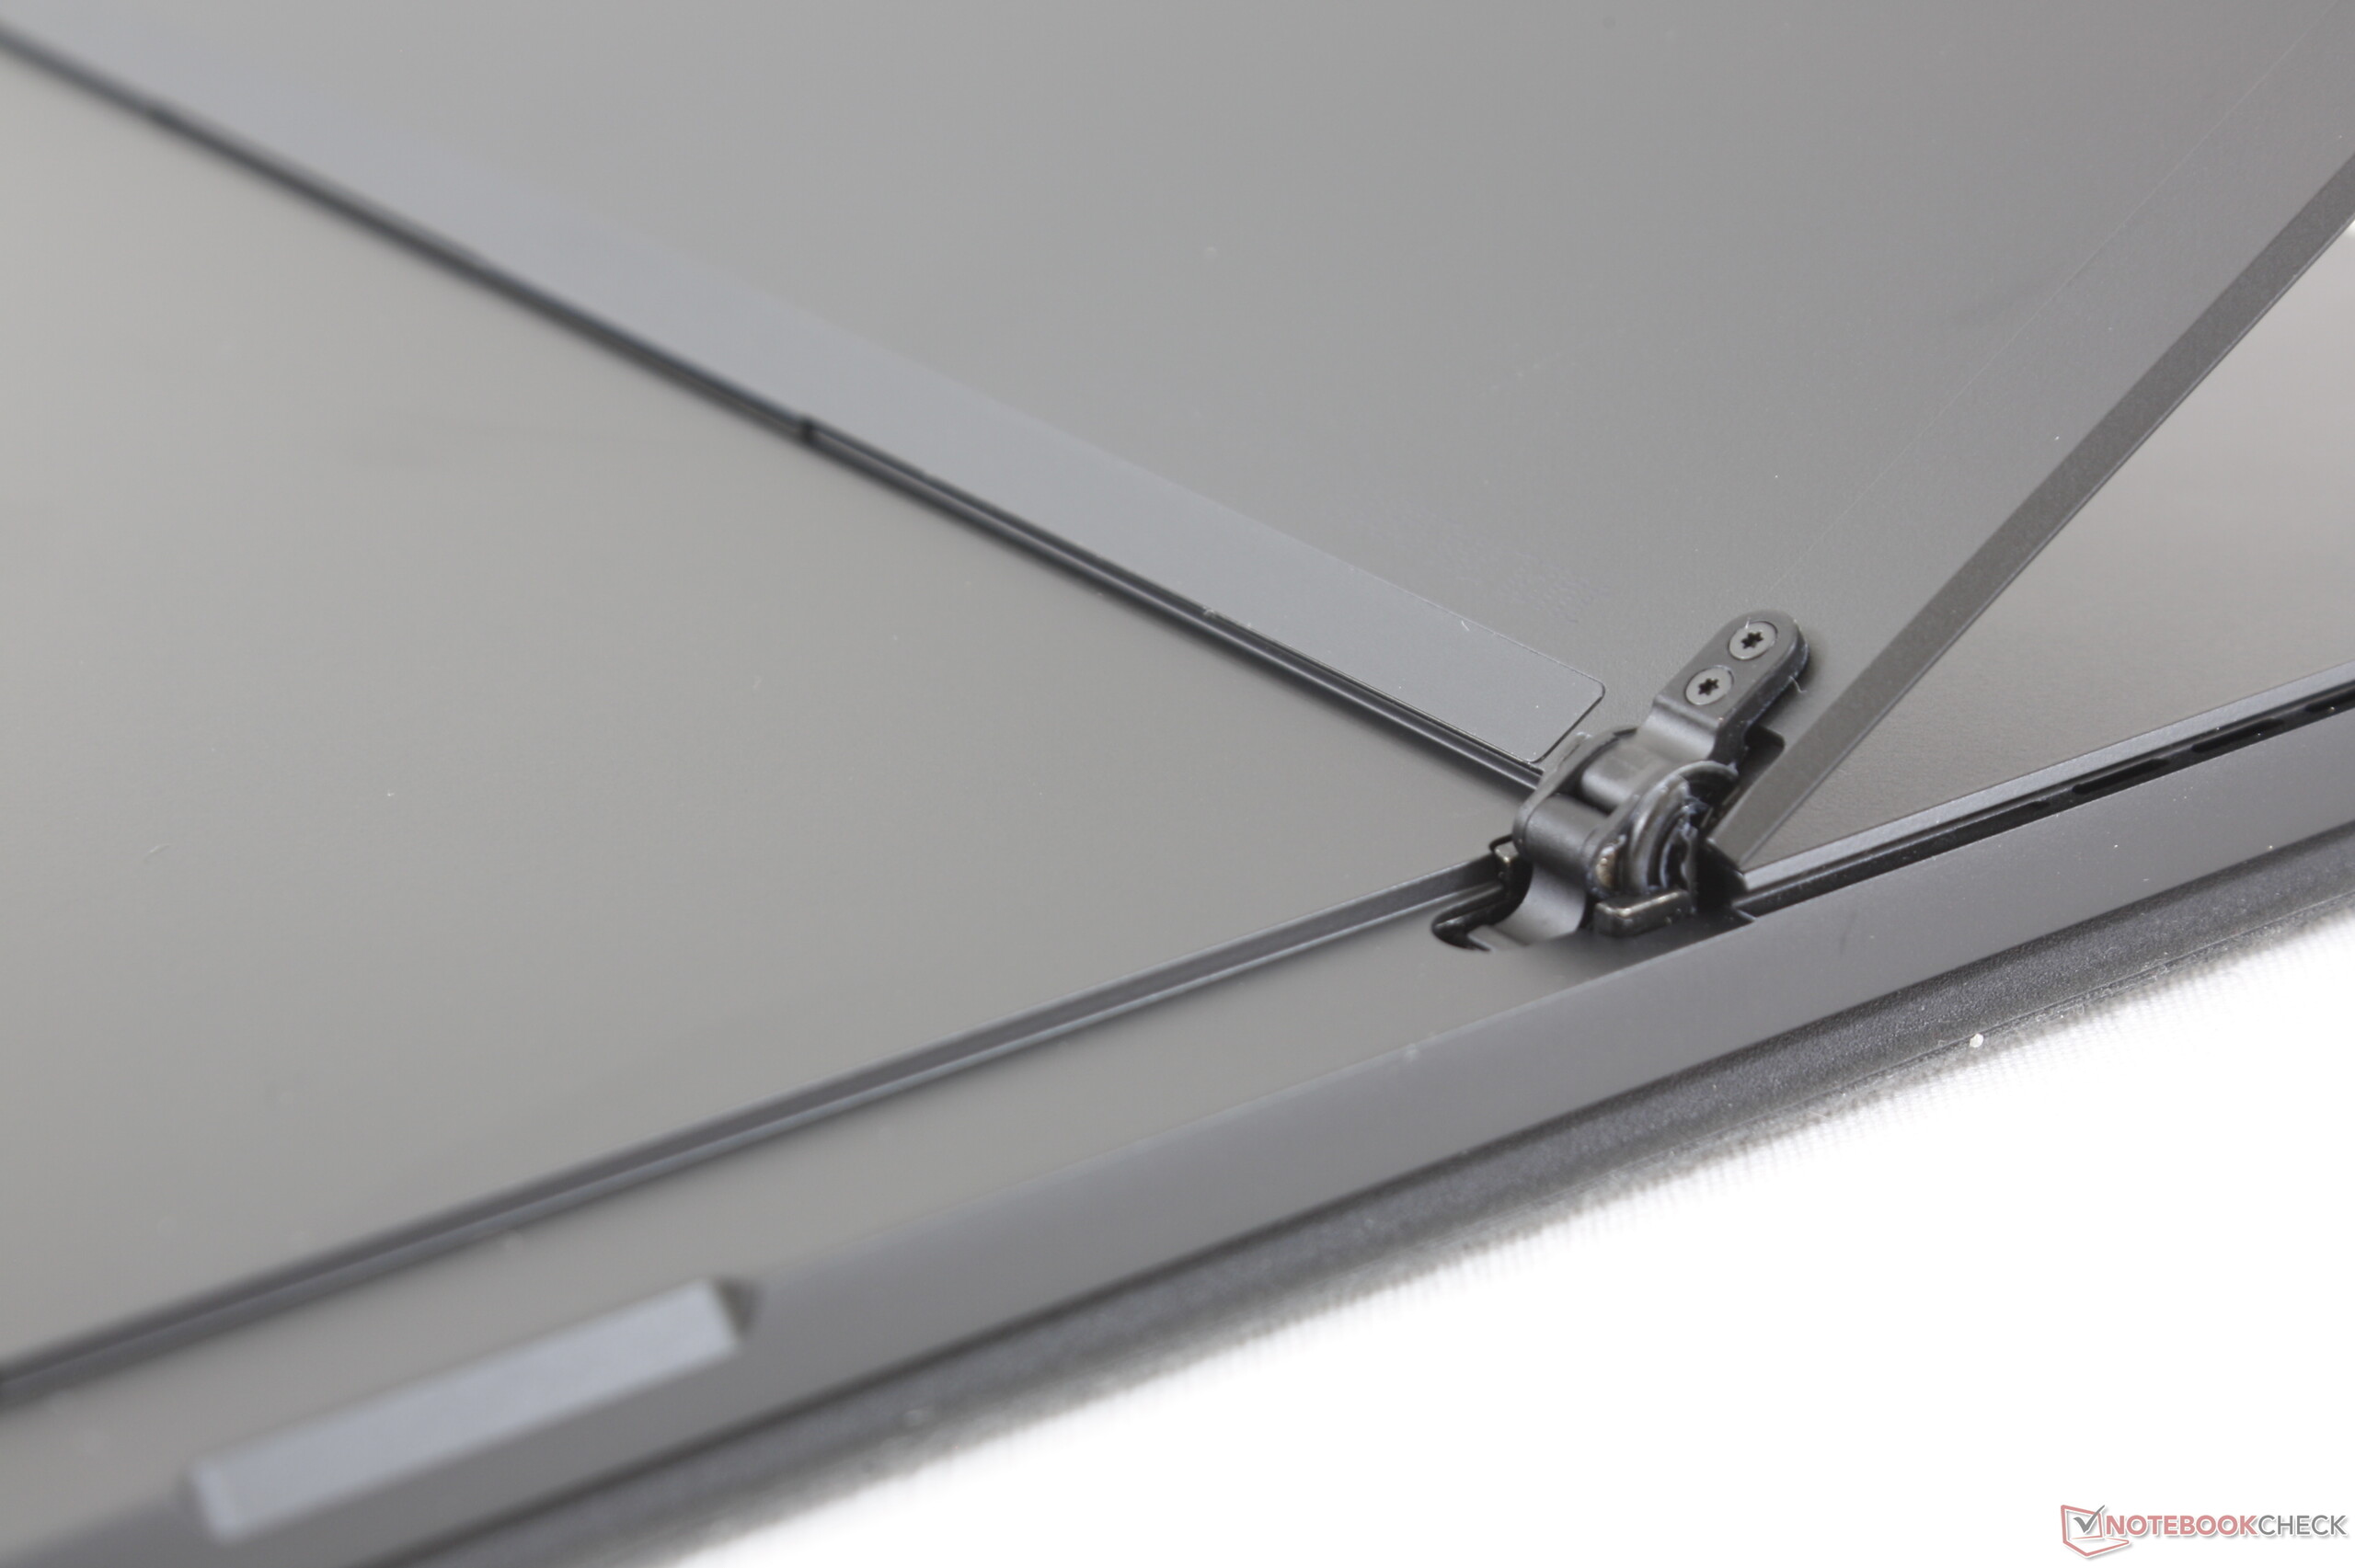
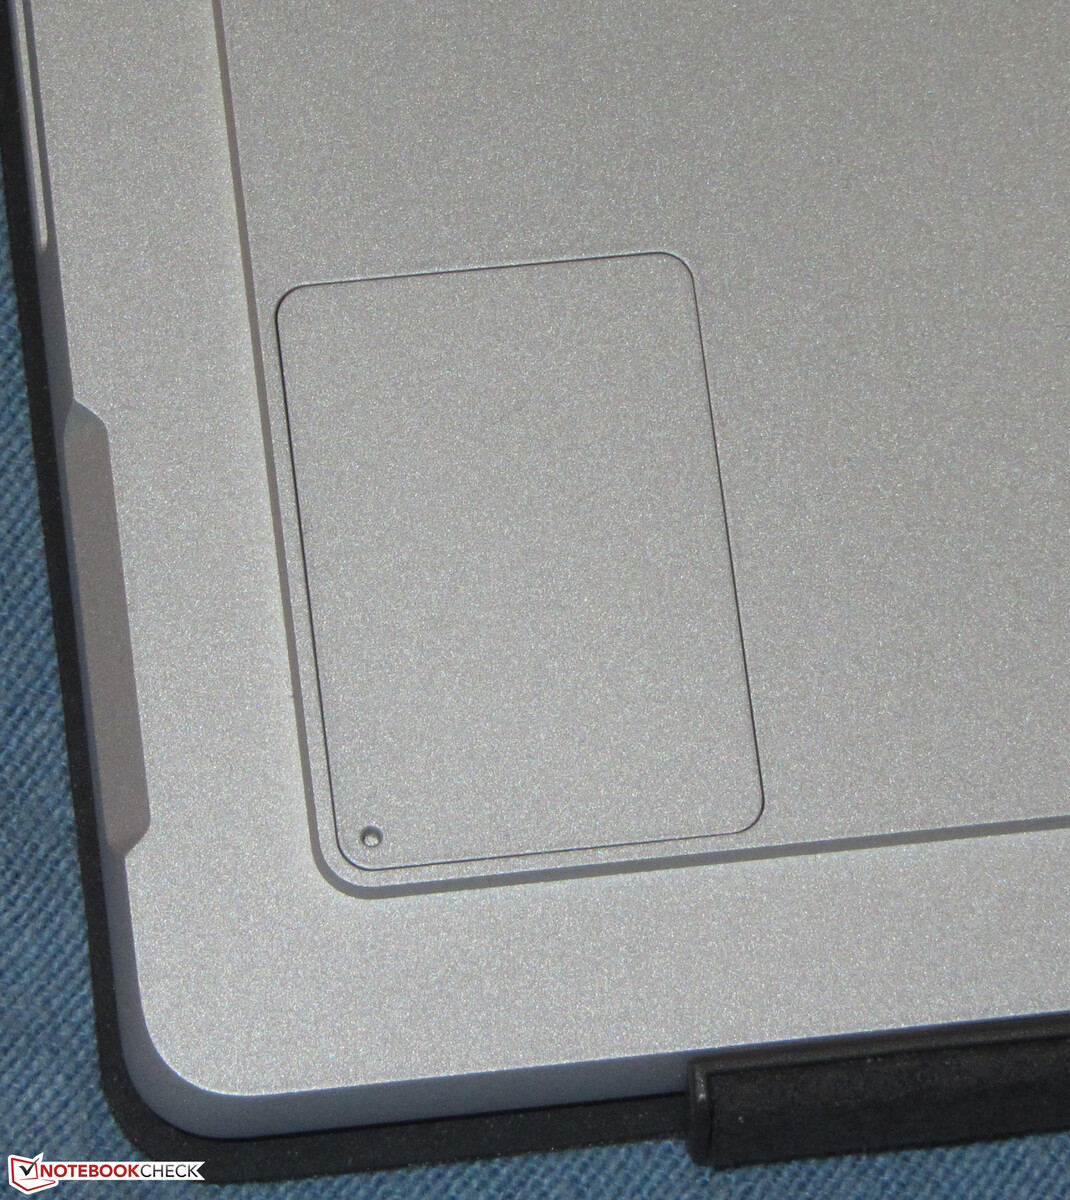
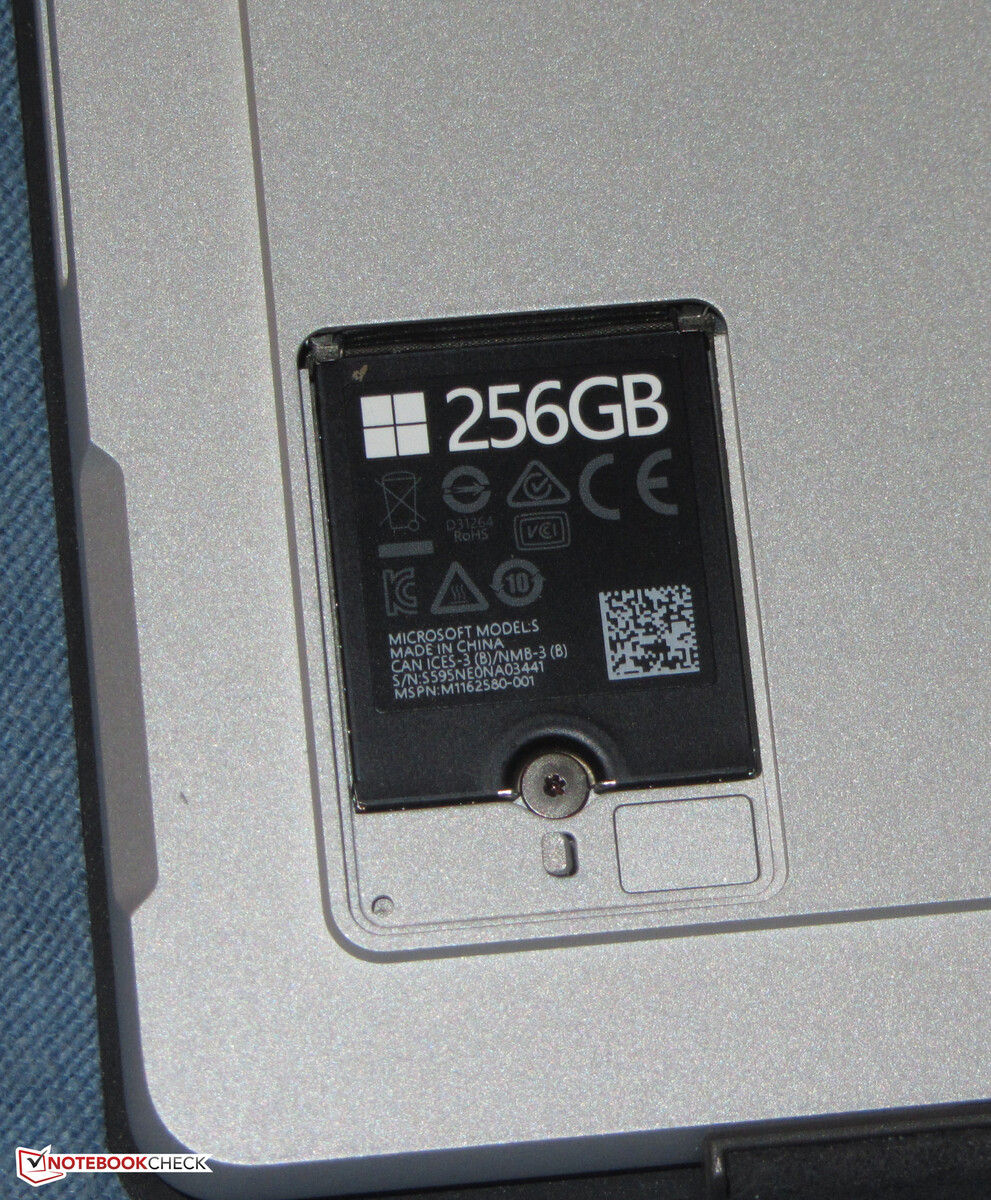
Um SSD NVMe de 256 GB (M.2-2230) da Samsung serve como unidade do sistema, e oferece boas taxas de transferência. No entanto, não é um dos melhores modelos de SSD. A substituição do SSD pode ser feita facilmente graças a uma pequena escotilha de manutenção, mas a gama de SSDs no formato M.2-2230 é (ainda) limitada. A escotilha é mantida magneticamente e pode ser aberta usando a ferramenta SIM incluída ou equipamento similar

| Microsoft Surface Pro 7 Plus Samsung PM991 MZ9LQ256HBJQ | Lenovo Yoga Duet 7 13IML05-82AS000WGE Lenovo UMIS RPJTJ256MEE1OWX | Dell Latitude 12 7210 2-in-1 WDC PC SN530 SDBPTPZ-512G | Microsoft Surface Pro 7 Toshiba KBG40ZNS256G NVMe | Microsoft Surface Pro 7 Core i5-1035G4 Toshiba BG4 KBG40ZPZ256G | Média Samsung PM991 MZ9LQ256HBJQ | |
|---|---|---|---|---|---|---|
| CrystalDiskMark 5.2 / 6 | 11% | 25% | 29% | 16% | -10% | |
| Write 4K (MB/s) | 165.3 | 118 -29% | 182.7 11% | 131.3 -21% | 118.5 -28% | 122.1 ? -26% |
| Read 4K (MB/s) | 42.95 | 53 23% | 51.4 20% | 52.4 22% | 54.1 26% | 35.4 ? -18% |
| Write Seq (MB/s) | 955 | 1208 26% | 1303 36% | 1613 69% | 1166 22% | 849 ? -11% |
| Read Seq (MB/s) | 867 | 1625 87% | 1450 67% | 1613 86% | 1676 93% | 854 ? -1% |
| Write 4K Q32T1 (MB/s) | 423.5 | 431 2% | 342.9 -19% | 411.6 -3% | 330.5 -22% | 394 ? -7% |
| Read 4K Q32T1 (MB/s) | 479.2 | 356 -26% | 523 9% | 415.6 -13% | 393.1 -18% | 398 ? -17% |
| Write Seq Q32T1 (MB/s) | 1060 | 1278 21% | 1776 68% | 2340 121% | 1569 48% | 1059 ? 0% |
| Read Seq Q32T1 (MB/s) | 2251 | 1949 -13% | 2378 6% | 1568 -30% | 2390 6% | 2254 ? 0% |
| Write 4K Q8T8 (MB/s) | 410.9 | |||||
| Read 4K Q8T8 (MB/s) | 1033 | |||||
| AS SSD | -9% | 32% | -31% | -169% | -1% | |
| Seq Read (MB/s) | 1725 | 1629 -6% | 2185 27% | 1881 9% | 1590 -8% | 1706 ? -1% |
| Seq Write (MB/s) | 931 | 694 -25% | 1731 86% | 703 -24% | 714 -23% | 803 ? -14% |
| 4K Read (MB/s) | 50.1 | 47.87 -4% | 46.28 -8% | 52.3 4% | 50.7 1% | 45.1 ? -10% |
| 4K Write (MB/s) | 136.9 | 107 -22% | 161.6 18% | 154.1 13% | 109.4 -20% | 123.6 ? -10% |
| 4K-64 Read (MB/s) | 870 | 411 -53% | 1021 17% | 1048 20% | 924 6% | 773 ? -11% |
| 4K-64 Write (MB/s) | 762 | 377 -51% | 1125 48% | 703 -8% | 294.6 -61% | 721 ? -5% |
| Access Time Read * (ms) | 0.279 | 0.068 76% | 0.069 75% | 0.069 75% | 0.066 76% | 0.229 ? 18% |
| Access Time Write * (ms) | 0.028 | 0.035 -25% | 0.046 -64% | 0.221 -689% | 0.697 -2389% | 0.0315 ? -13% |
| Score Read (Points) | 1093 | 614 -44% | 1286 18% | 1288 18% | 1133 4% | 989 ? -10% |
| Score Write (Points) | 992 | 550 -45% | 1460 47% | 927 -7% | 475 -52% | 925 ? -7% |
| Score Total (Points) | 2616 | 1441 -45% | 3389 30% | 2826 8% | 2157 -18% | 2386 ? -9% |
| Copy ISO MB/s (MB/s) | 1174 | 1074 -9% | 1555 32% | 1160 -1% | 1177 0% | 1085 ? -8% |
| Copy Program MB/s (MB/s) | 262.8 | 532 102% | 468.5 78% | 454.7 73% | 406 54% | 389 ? 48% |
| Copy Game MB/s (MB/s) | 562 | 730 30% | 841 50% | 991 76% | 923 64% | 687 ? 22% |
| Média Total (Programa/Configurações) | 1% /
-1% | 29% /
30% | -1% /
-9% | -77% /
-102% | -6% /
-4% |
* ... menor é melhor
Continuous load read: DiskSpd Read Loop, Queue Depth 8
Placa gráfica
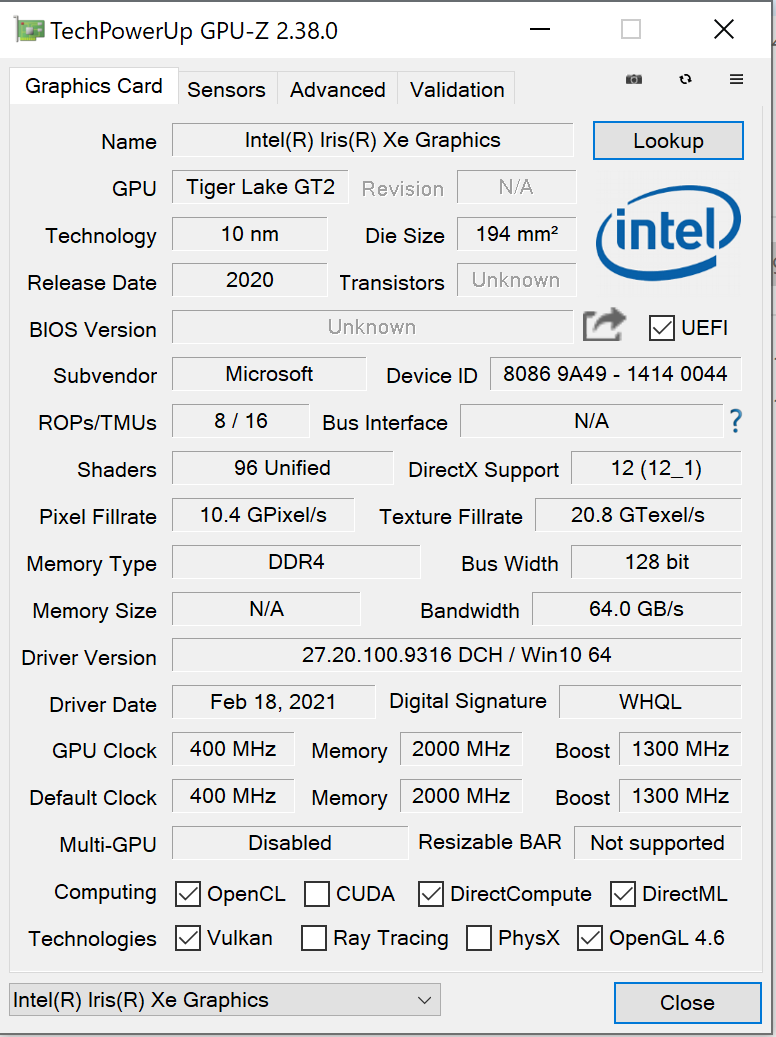
AGPU integrada da Intel IrisXe Graphics G7 80EUs é responsável pela saída de gráficos. Ela suporta DirectX 12 e atinge uma velocidade de clock operacional de até 1.300 MHz. Witcher 3O teste mostra que a GPU Tiger Lake pode trabalhar em velocidade máxima por cerca de sete minutos. Depois disso, o resfriamento passivo tem seu custo.
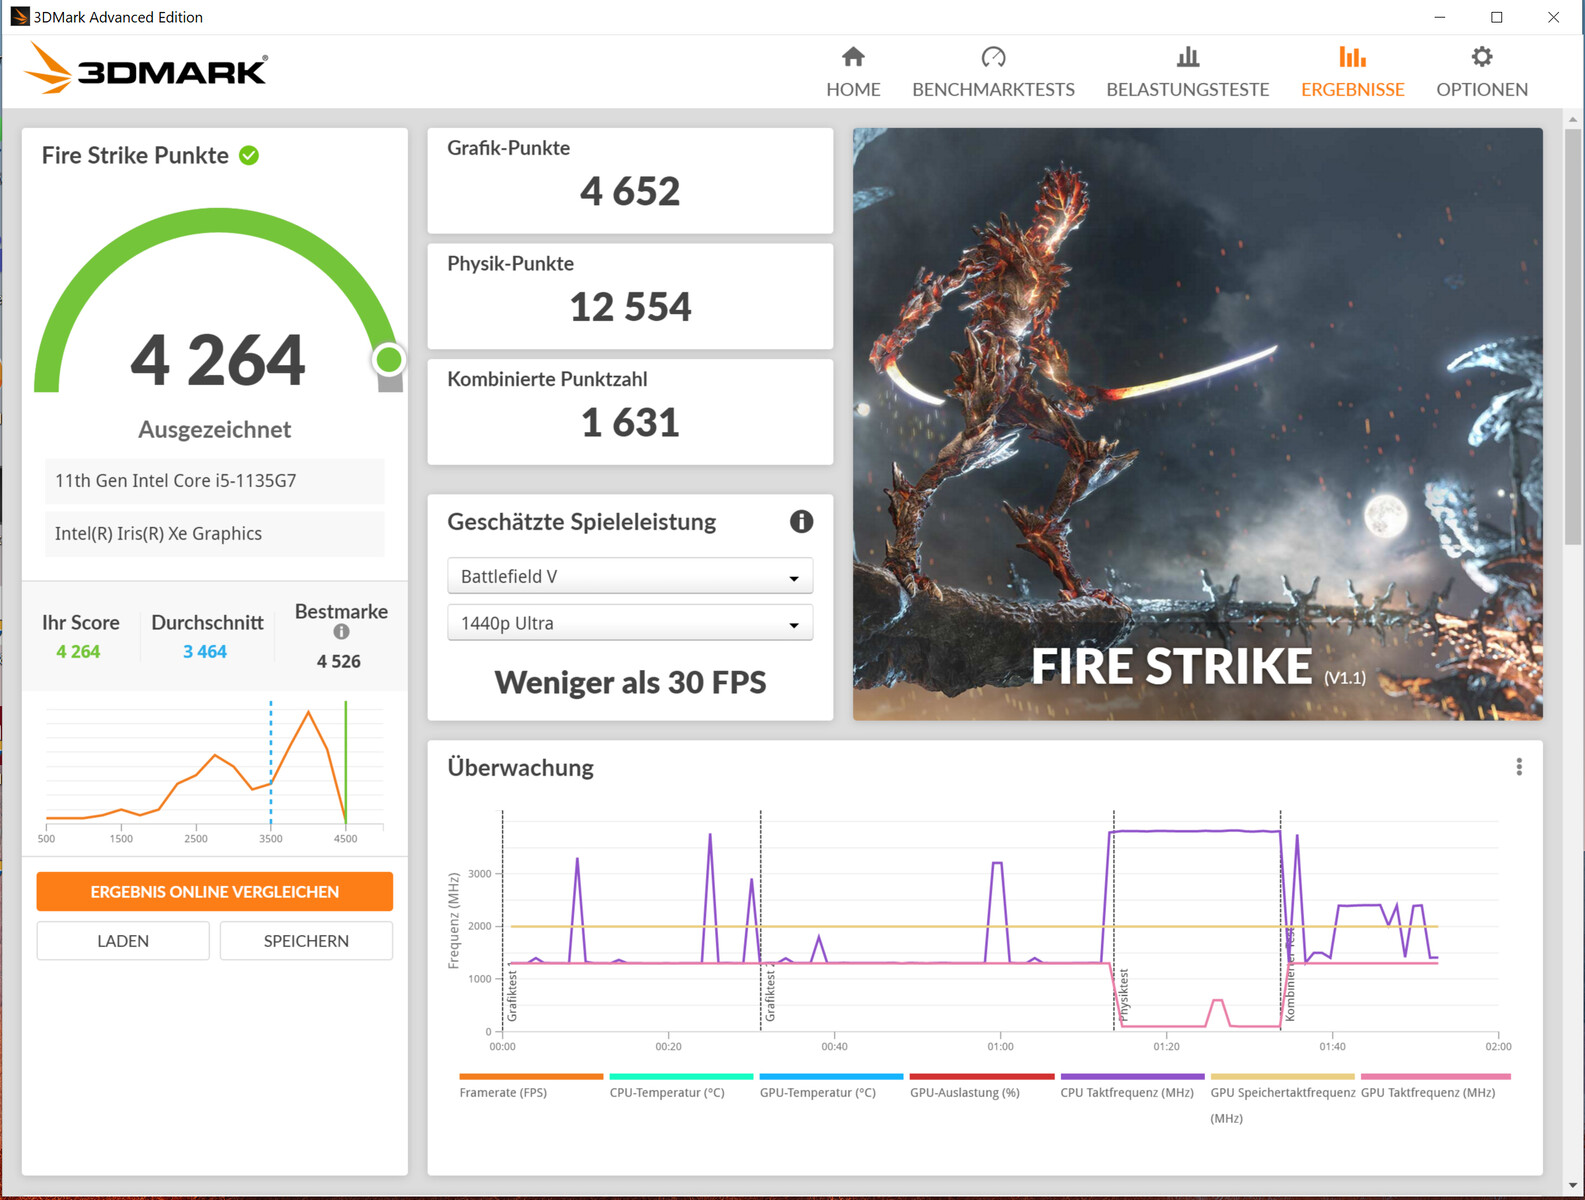
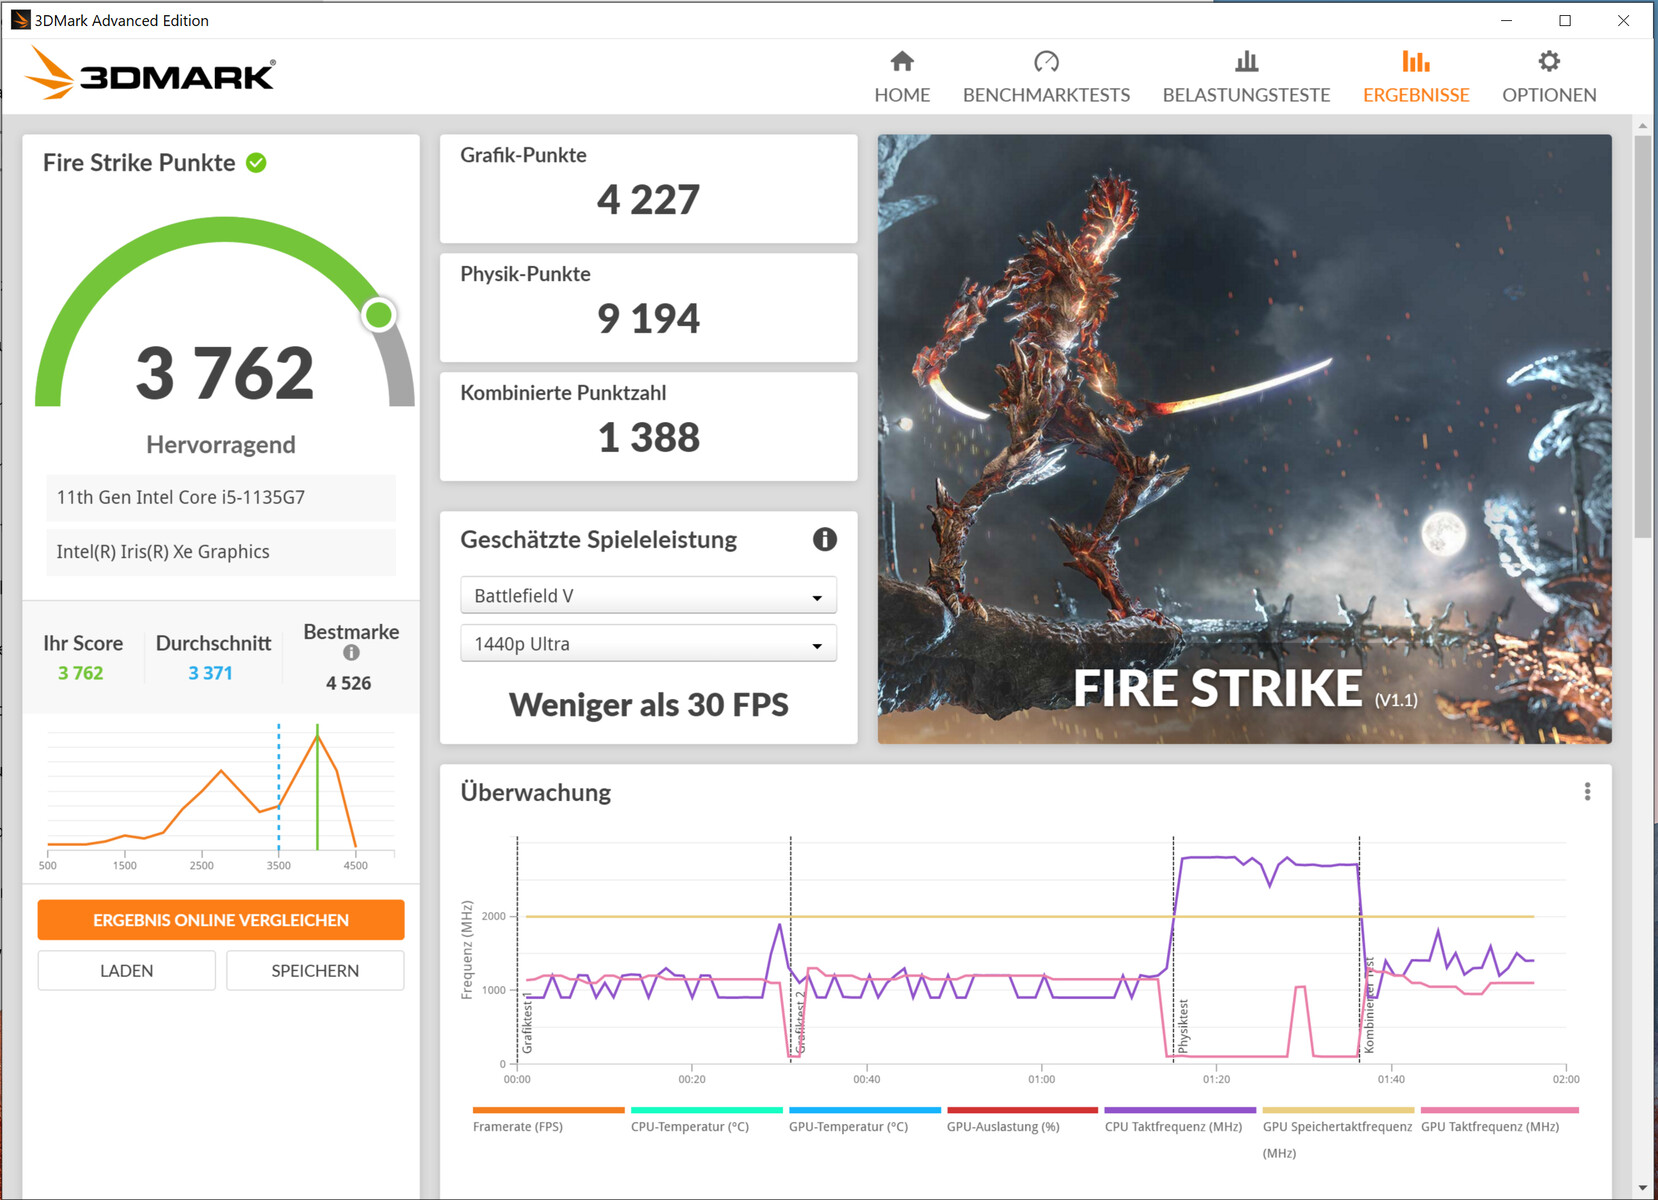
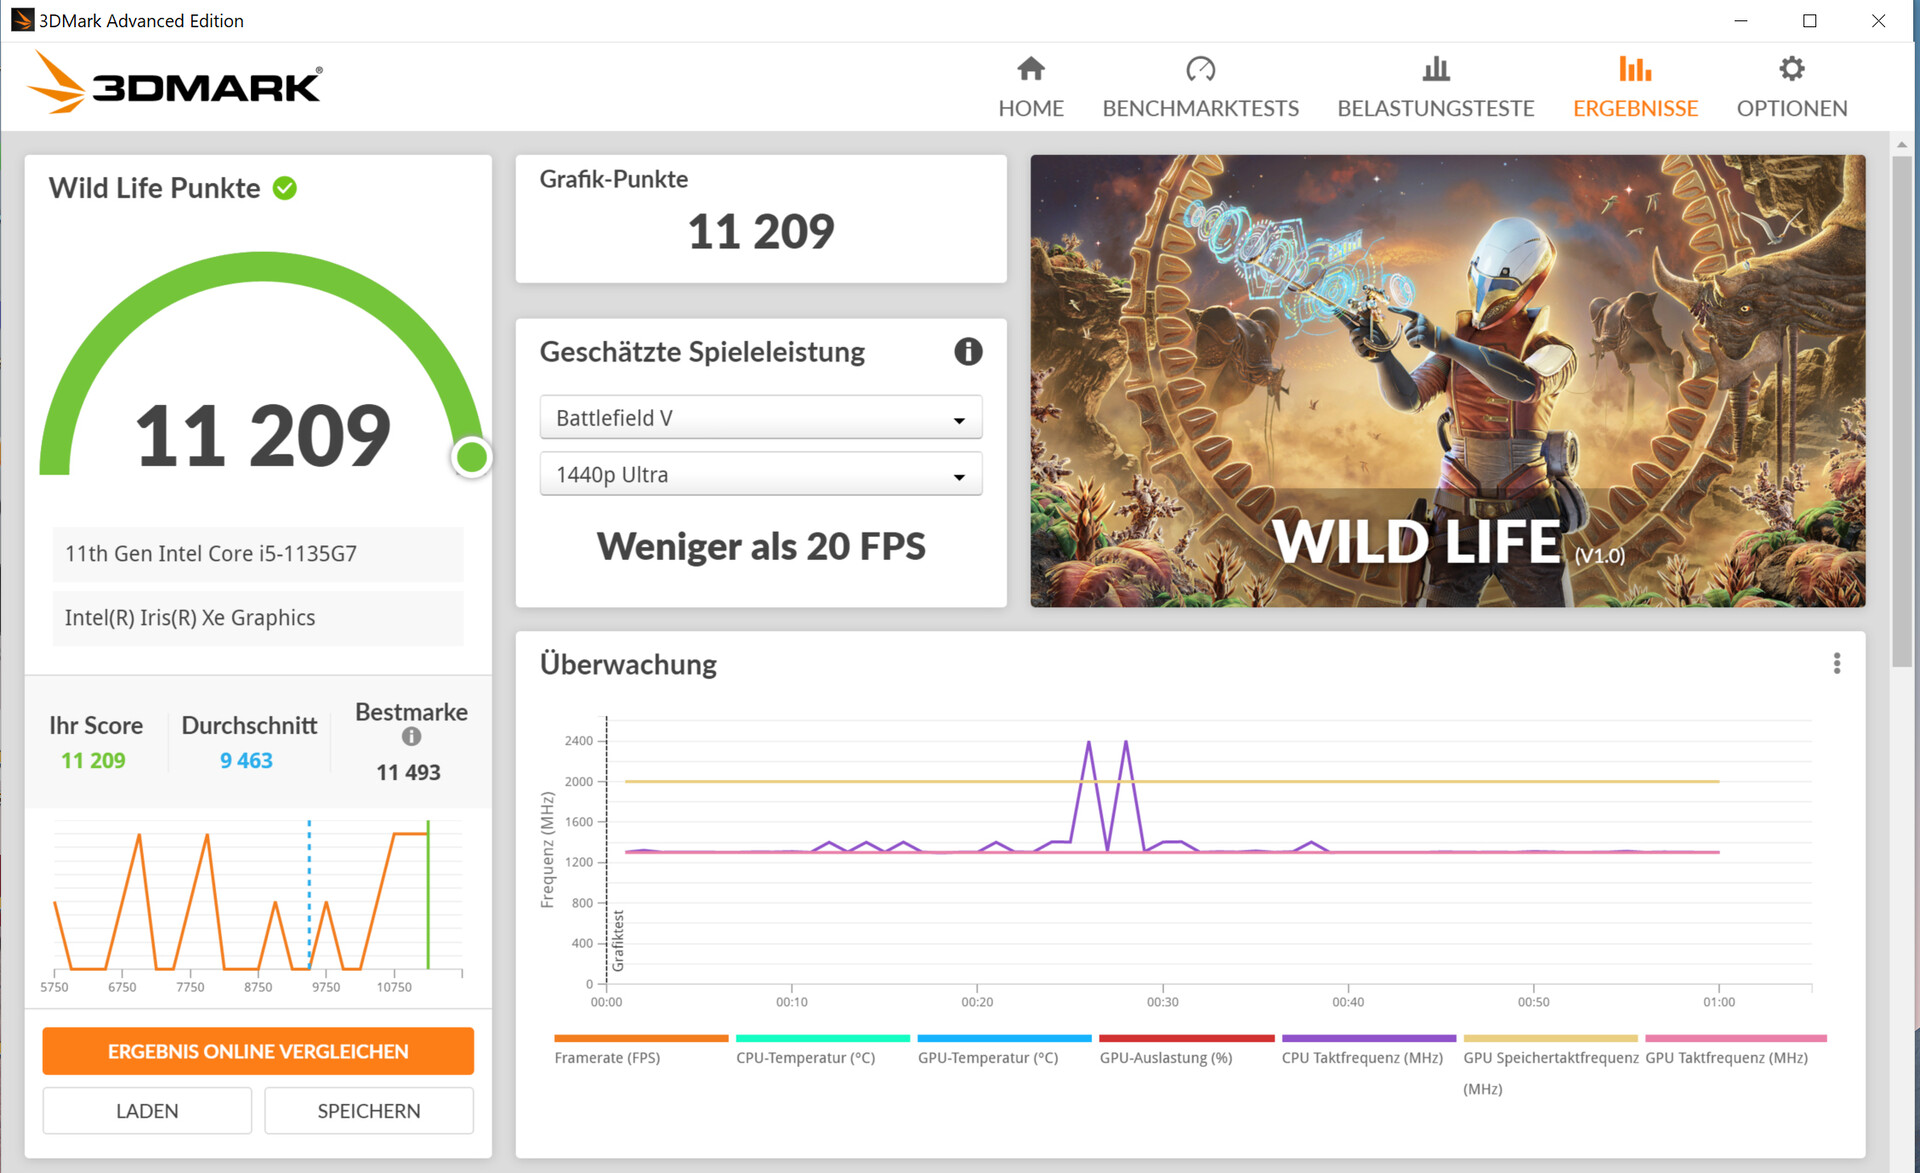
Os resultados do 3DMark estão entre os melhores valores que determinamos para a GPU instalada aqui até o momento. Em comparação com os modelos Ice Lake Surface Pro 7, há um aumento significativo na performance gráfica
| 3DMark 11 Performance | 6343 pontos | |
| 3DMark Ice Storm Standard Score | 81444 pontos | |
| 3DMark Cloud Gate Standard Score | 17777 pontos | |
| 3DMark Fire Strike Score | 4264 pontos | |
| 3DMark Time Spy Score | 1537 pontos | |
Ajuda | ||
| GFXBench (DX / GLBenchmark) 2.7 | |
| 1920x1080 T-Rex Offscreen | |
| Média da turma Convertible (83 - 495, n=3, últimos 2 anos) | |
| Microsoft Surface Pro 7 Plus | |
| Média Intel Iris Xe Graphics G7 80EUs (220 - 257, n=3) | |
| T-Rex Onscreen | |
| Média da turma Convertible (n=1últimos 2 anos) | |
| Microsoft Surface Pro 7 Plus | |
| Média Intel Iris Xe Graphics G7 80EUs (55 - 236, n=3) | |
| GFXBench 3.0 | |
| 1920x1080 1080p Manhattan Offscreen | |
| Microsoft Surface Pro 7 Plus | |
| Média da turma Convertible (48 - 290, n=3, últimos 2 anos) | |
| Média Intel Iris Xe Graphics G7 80EUs (101.5 - 170.4, n=3) | |
| on screen Manhattan Onscreen OGL | |
| Média da turma Convertible (n=1últimos 2 anos) | |
| Microsoft Surface Pro 7 Plus | |
| Média Intel Iris Xe Graphics G7 80EUs (44 - 100.4, n=3) | |
| GFXBench 3.1 | |
| 1920x1080 Manhattan ES 3.1 Offscreen | |
| Média da turma Convertible (34 - 229, n=3, últimos 2 anos) | |
| Microsoft Surface Pro 7 Plus | |
| Média Intel Iris Xe Graphics G7 80EUs (69 - 108.6, n=3) | |
| on screen Manhattan ES 3.1 Onscreen | |
| Média da turma Convertible (n=1últimos 2 anos) | |
| Média Intel Iris Xe Graphics G7 80EUs (46.5 - 69.4, n=3) | |
| Microsoft Surface Pro 7 Plus | |
| Unigine Heaven 2.1 - 1280x1024 high, Tesselation (normal), DirectX11 AA:off AF:1x | |
| Microsoft Surface Pro 7 Plus | |
| Média Intel Iris Xe Graphics G7 80EUs (n=1) | |
| Unigine Heaven 3.0 | |
| 1920x1080 OpenGL, Normal Tessellation, High Shaders AA:Off AF:Off | |
| Microsoft Surface Pro 7 Plus | |
| Média Intel Iris Xe Graphics G7 80EUs (n=1) | |
| 1920x1080 DX 11, Normal Tessellation, High Shaders AA:Off AF:Off | |
| Microsoft Surface Pro 7 Plus | |
| Média Intel Iris Xe Graphics G7 80EUs (n=1) | |
| Unigine Superposition | |
| 1920x1080 1080p High | |
| Média da turma Convertible (1450 - 2770, n=2, últimos 2 anos) | |
| Média Intel Iris Xe Graphics G7 80EUs (1907 - 2216, n=2) | |
| Microsoft Surface Pro 7 Plus | |
| 1280x720 720p Low | |
| Média da turma Convertible (4558 - 9507, n=2, últimos 2 anos) | |
| Média Intel Iris Xe Graphics G7 80EUs (6057 - 6928, n=2) | |
| Microsoft Surface Pro 7 Plus | |
| Unigine Valley 1.0 | |
| 1920x1080 Extreme HD DirectX AA:x8 | |
| Média da turma Convertible (21.5 - 53.5, n=2, últimos 2 anos) | |
| Microsoft Surface Pro 7 Plus | |
| Média Intel Iris Xe Graphics G7 80EUs (14.6 - 17.4, n=4) | |
| 1920x1080 Extreme HD Preset OpenGL AA:x8 | |
| Média da turma Convertible (19.3 - 51.7, n=2, últimos 2 anos) | |
| Microsoft Surface Pro 7 Plus | |
| Média Intel Iris Xe Graphics G7 80EUs (14.1 - 18.8, n=4) | |
Desempenho do jogo
O Surface Pro 7 Plus não é um dispositivo de jogo. No entanto: A combinação CPU-GPU instalada é geralmente capaz de trazer muitos dos jogos em nosso banco de dados sem problemas para a tela - com baixas resoluções e configurações de baixa qualidade.
Como a CPU e a GPU são aceleradas após alguns minutos, as taxas de quadros caem como resultado. Portanto, recomendamos títulos que não têm requisitos de hardware excessivamente altos e ainda funcionam suavemente mesmo em velocidades de relógio mais baixas.
| The Witcher 3 - 1024x768 Low Graphics & Postprocessing | |
| Média da turma Convertible (22 - 141.5, n=6, últimos 2 anos) | |
| Microsoft Surface Pro 7 Plus | |
| Média Intel Iris Xe Graphics G7 80EUs (30.2 - 97.4, n=101) | |
| Microsoft Surface Pro 7 Core i5-1035G4 | |
| Lenovo Yoga Duet 7 13IML05-82AS000WGE | |
| Shadow of the Tomb Raider - 1280x720 Lowest Preset | |
| Média da turma Convertible (24 - 180, n=2, últimos 2 anos) | |
| Média Intel Iris Xe Graphics G7 80EUs (31 - 62.8, n=6) | |
| Microsoft Surface Pro 7 Plus | |
| Microsoft Surface Pro 7 | |
| Microsoft Surface Pro 7 Core i5-1035G4 | |
| F1 2020 - 1280x720 Ultra Low Preset | |
| Microsoft Surface Pro 7 Plus | |
| Média Intel Iris Xe Graphics G7 80EUs (45 - 76.6, n=10) | |
| Serious Sam 4 - 1280x720 Lowest (DX12) | |
| Microsoft Surface Pro 7 Plus | |
| Média Intel Iris Xe Graphics G7 80EUs (n=1) | |
| Hitman 3 - 1280x720 Minimum Settings | |
| Microsoft Surface Pro 7 Plus | |
| Média Intel Iris Xe Graphics G7 80EUs (56.3 - 82.3, n=2) | |
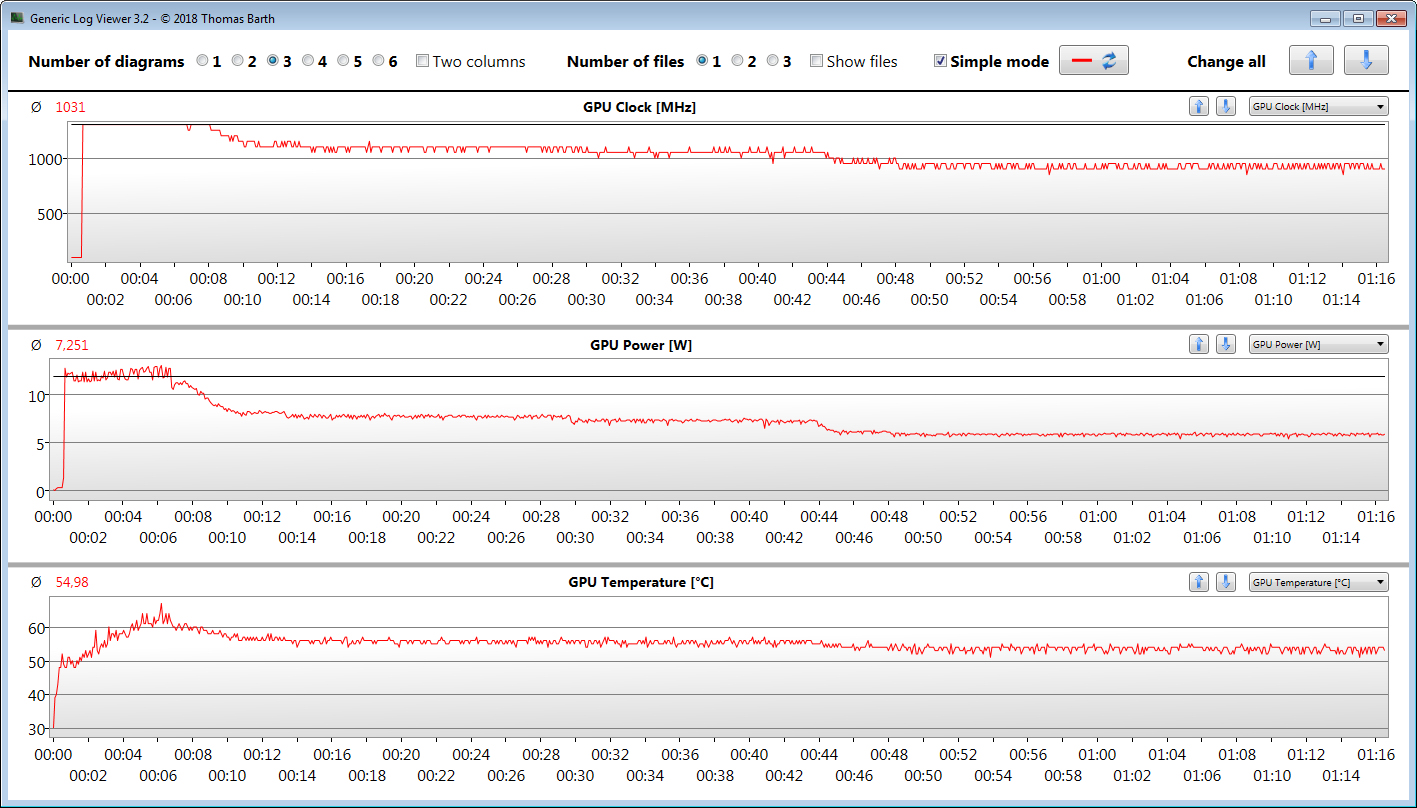
A fim de verificar se as taxas de quadros permanecem em grande parte constantes durante um longo período de tempo, deixamos o jogo O Witcher 3 funcionar por cerca de 60 minutos com resolução Full HD e ajustes de qualidade máxima. O personagem não é movido. A velocidade do relógio da GPU é acelerada de 1.300 MHz para cerca de 1.000 MHz após aproximadamente sete minutos. Conseqüentemente, há uma queda nas taxas de quadros.
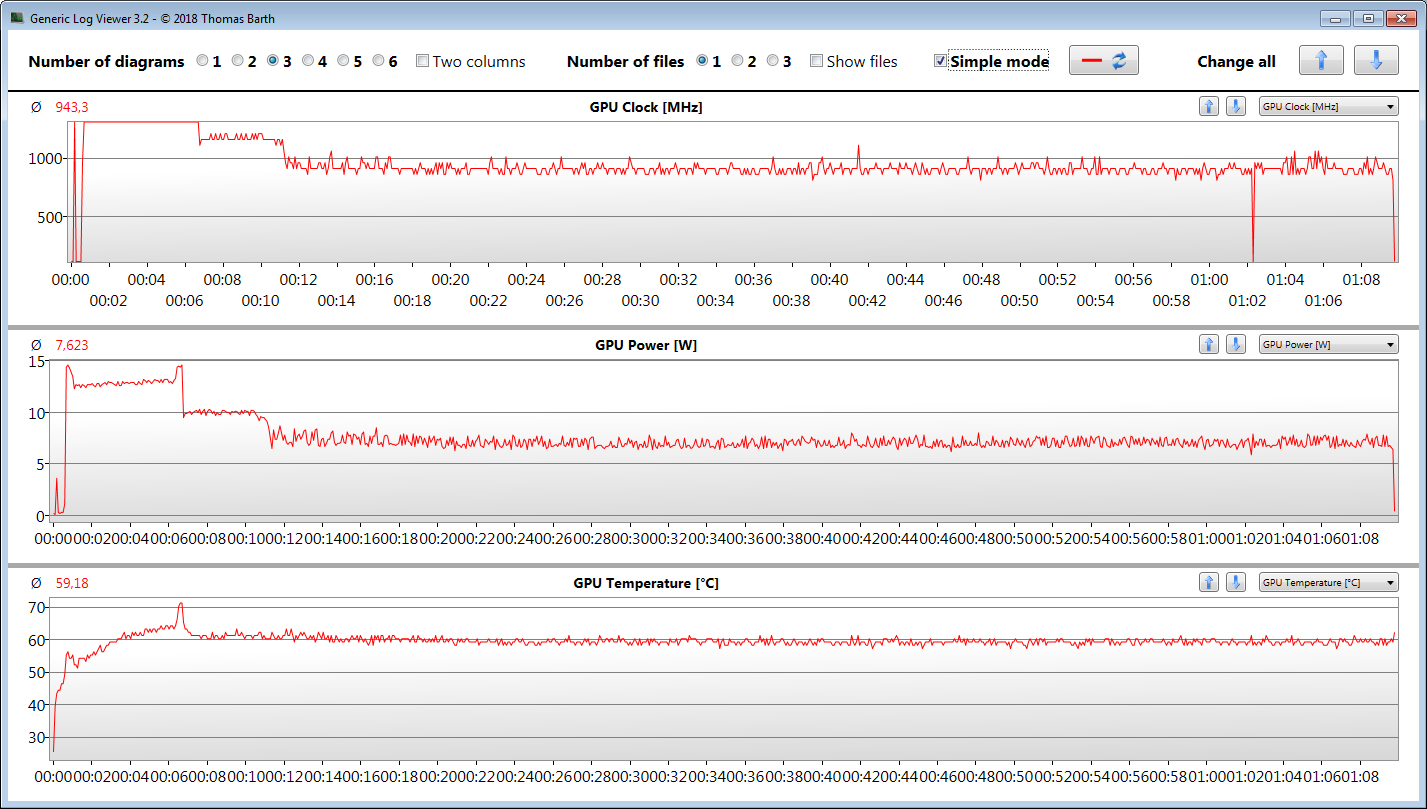
Uma vez que nenhuma taxa de quadros jogáveis é atingida, repetimos nosso teste Witcher 3em configurações mínimas. O mesmo comportamento é visto, mas as taxas de quadros ainda estão dentro de uma faixa jogável, mesmo depois que o estrangulamento ocorre
| baixo | média | alto | ultra | |
|---|---|---|---|---|
| The Witcher 3 (2015) | 81.9 | 55.8 | 29 | 13.5 |
| Dota 2 Reborn (2015) | 80.4 | 60.5 | 38.7 | 36.8 |
| X-Plane 11.11 (2018) | 37.4 | 29.9 | 27.7 | |
| Far Cry 5 (2018) | 54 | 23 | 21 | 19 |
| Shadow of the Tomb Raider (2018) | 37 | 17 | 14 | 9 |
| Battlefield V (2018) | 51.7 | 25.8 | 23.3 | 22.6 |
| Apex Legends (2019) | 82 | 37.7 | 28.2 | 25.3 |
| Metro Exodus (2019) | 28 | 13.7 | 10.5 | 8.7 |
| Control (2019) | 57.9 | 17.3 | 11.6 | |
| Borderlands 3 (2019) | 46.6 | 20.6 | 12.6 | 9.34 |
| Red Dead Redemption 2 (2019) | 49.2 | 22.7 | 12.9 | |
| F1 2020 (2020) | 76.6 | 38.7 | 26.8 | 17.5 |
| Death Stranding (2020) | 42.2 | 23.4 | 20.7 | 19.8 |
| Crysis Remastered (2020) | 54.9 | 24.9 | 8.49 | |
| Serious Sam 4 (2020) | 99.4 | 14.6 | 10.1 | 6.67 |
| Assassin´s Creed Valhalla (2020) | 31 | 19 | 16 | |
| Yakuza Like a Dragon (2020) | 32.5 | 16.3 | 14.6 | 12.4 |
| Immortals Fenyx Rising (2020) | 36 | 22 | 19 | 17 |
| Cyberpunk 2077 1.0 (2020) | 23.8 | 10.5 | ||
| Hitman 3 (2021) | 82.3 | 35.2 | 28.5 | 23.9 |
Emissões - O dispositivo 2-em-1 da Microsoft é resfriado de forma passiva
Emissões sonoras
O dispositivo não possui ventilador e não tem acionamento mecânico. No entanto, não é completamente silencioso. Ocasionalmente, um som de chocalhar eletrônico pode ser ouvido vindo de dentro
Temperatura
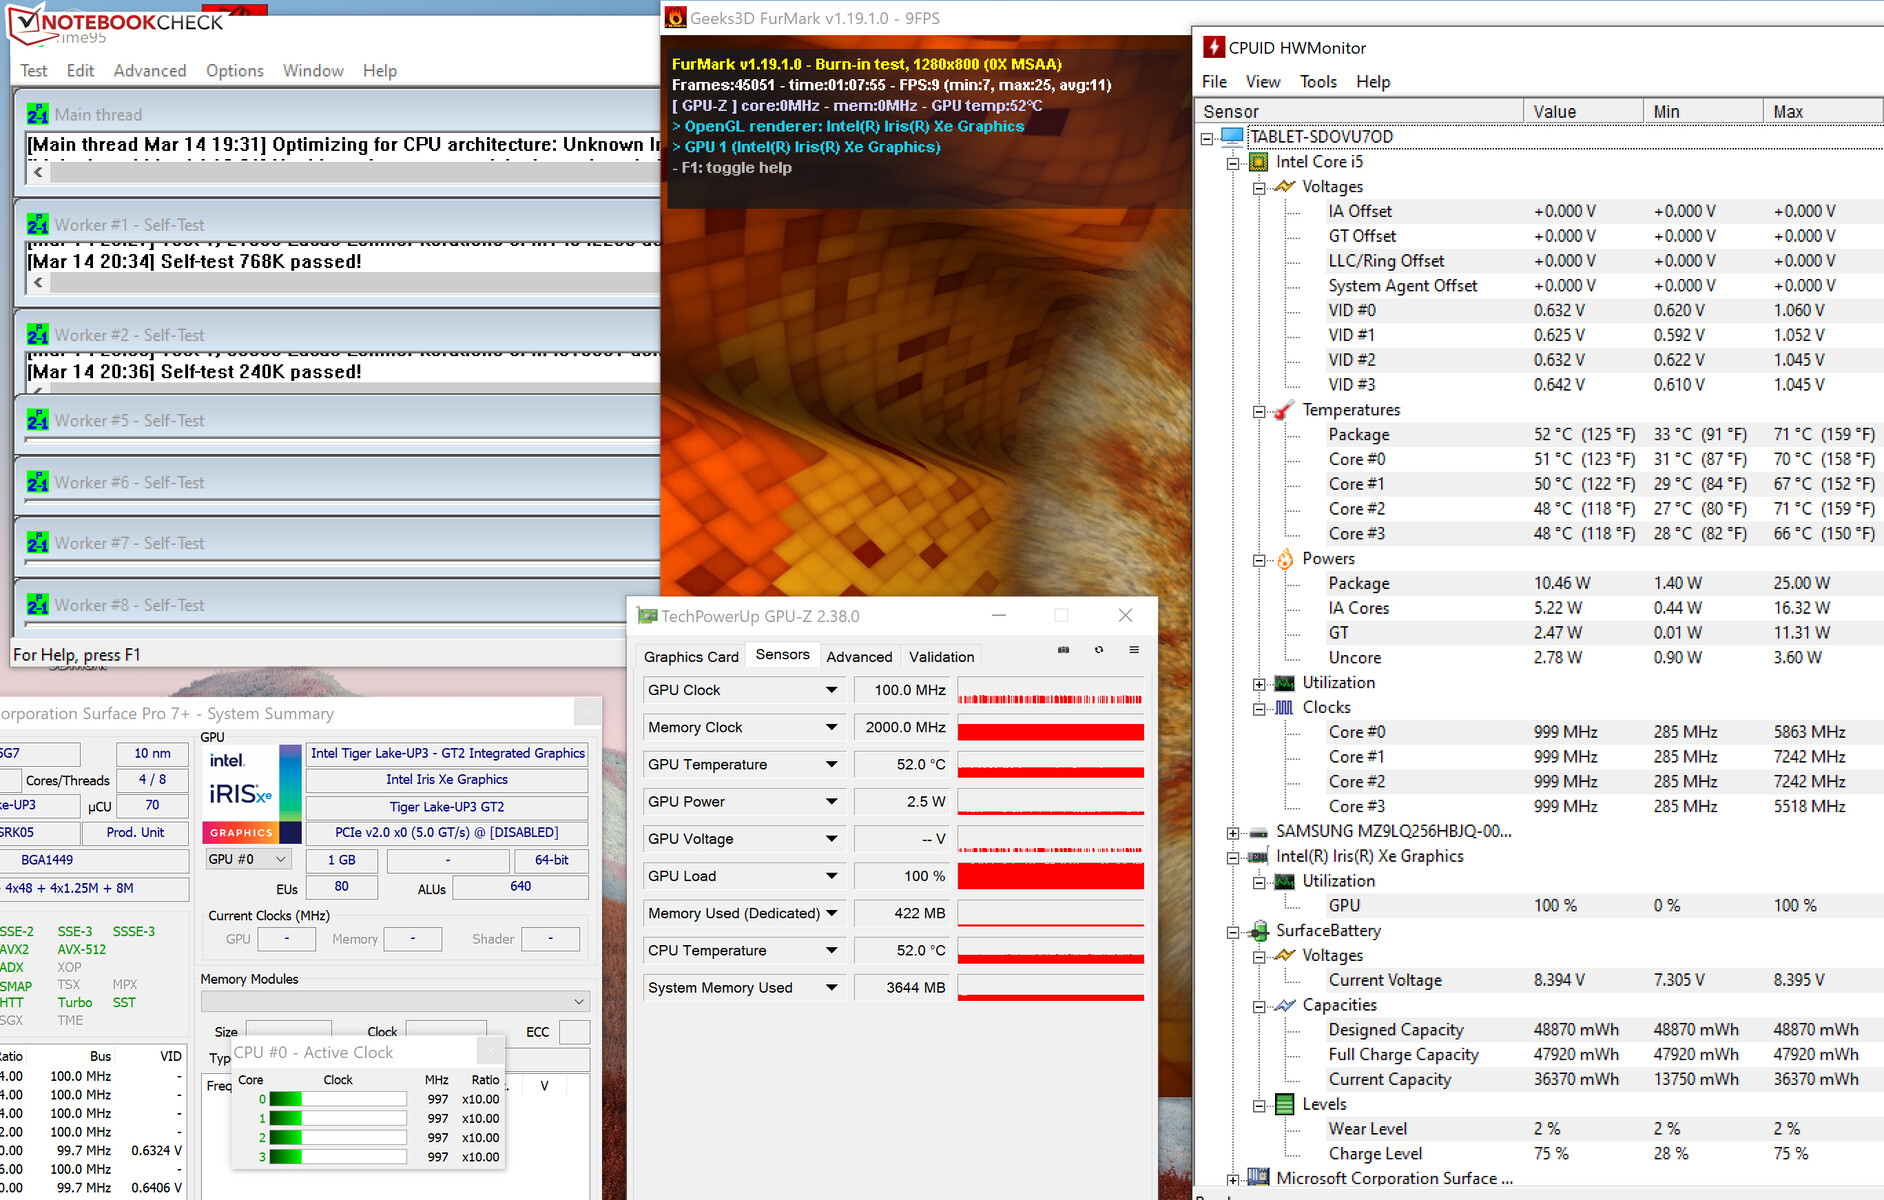
Nos primeiros minutos de nosso teste de estresse (Prime95 e FurMark funcionam por pelo menos uma hora), a CPU e a GPU funcionam em 900 a 2.000 MHz e 700 a 750 MHz, respectivamente. No decorrer do teste, as velocidades caem para 900 a 1.000 MHz (CPU) e 100 MHz (GPU). O teste de estresse representa um cenário extremo, no entanto. Utilizamos este teste para verificar se o sistema permanece estável mesmo sob carga total.
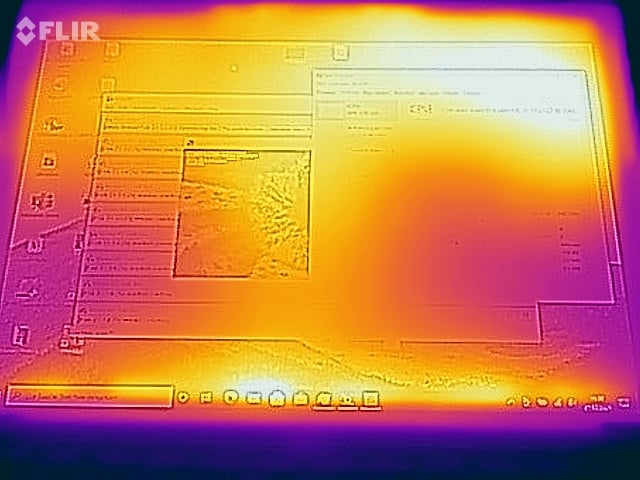
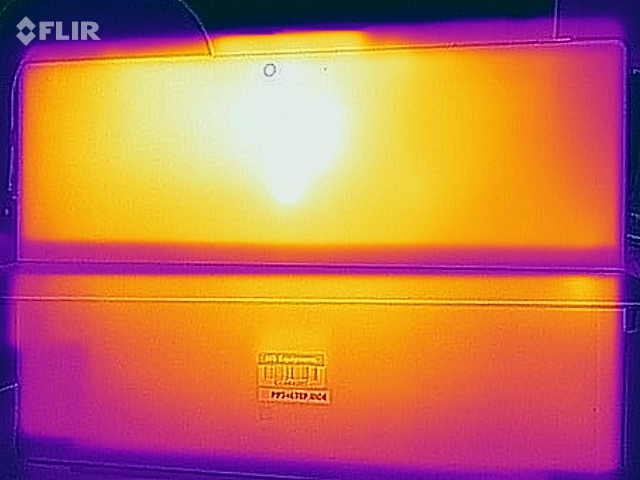
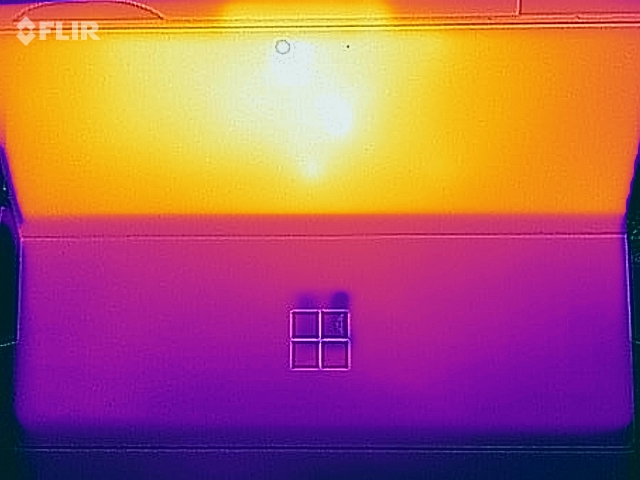
Não é surpreendente que a superfície se aqueça visivelmente sob carga. Afinal de contas, o dispositivo é resfriado passivamente. Durante o teste de esforço, registramos temperaturas na faixa inferior a média de 40 °C (~104 °F) em vários pontos de medição. Além disso, as taxas estão dentro da faixa verde no uso diário
(±) A temperatura máxima no lado superior é 42.9 °C / 109 F, em comparação com a média de 35.4 °C / 96 F , variando de 19.6 a 60 °C para a classe Convertible.
(±) A parte inferior aquece até um máximo de 44.8 °C / 113 F, em comparação com a média de 36.9 °C / 98 F
(+) Em uso inativo, a temperatura média para o lado superior é 25.3 °C / 78 F, em comparação com a média do dispositivo de 30.3 °C / ### class_avg_f### F.
(-) Os apoios para as mãos e o touchpad podem ficar muito quentes ao toque, com um máximo de 41.1 °C / 106 F.
(-) A temperatura média da área do apoio para as mãos de dispositivos semelhantes foi 28 °C / 82.4 F (-13.1 °C / -23.6 F).
| Microsoft Surface Pro 7 Plus i5-1135G7, Iris Xe G7 80EUs | Lenovo Yoga Duet 7 13IML05-82AS000WGE i5-10210U, UHD Graphics 620 | Dell Latitude 12 7210 2-in-1 i7-10610U, UHD Graphics 620 | Microsoft Surface Pro 7 i7-1065G7, Iris Plus Graphics G7 (Ice Lake 64 EU) | Microsoft Surface Pro 7 Core i5-1035G4 i5-1035G4, Iris Plus Graphics G4 (Ice Lake 48 EU) | Média Intel Iris Xe Graphics G7 80EUs | Média da turma Convertible | |
|---|---|---|---|---|---|---|---|
| Heat | 16% | 12% | -2% | -12% | -1% | -1% | |
| Maximum Upper Side * (°C) | 42.9 | 33.6 22% | 37.5 13% | 40.1 7% | 43.6 -2% | 40.5 ? 6% | 42 ? 2% |
| Maximum Bottom * (°C) | 44.8 | 33.9 24% | 36.2 19% | 41 8% | 47.8 -7% | 43.7 ? 2% | 43.7 ? 2% |
| Idle Upper Side * (°C) | 28.8 | 24.8 14% | 25.7 11% | 31.7 -10% | 32 -11% | 27.9 ? 3% | 27.7 ? 4% |
| Idle Bottom * (°C) | 25.8 | 25.4 2% | 24.3 6% | 28.8 -12% | 32.4 -26% | 29.2 ? -13% | 28.5 ? -10% |
* ... menor é melhor
Oradores
Microsoft Surface Pro 7 Plus análise de áudio
(±) | o volume do alto-falante é médio, mas bom (###valor### dB)
Graves 100 - 315Hz
(±) | graves reduzidos - em média 14.7% menor que a mediana
(±) | a linearidade dos graves é média (10.2% delta para a frequência anterior)
Médios 400 - 2.000 Hz
(+) | médios equilibrados - apenas 4.9% longe da mediana
(+) | médios são lineares (6.1% delta para frequência anterior)
Altos 2 - 16 kHz
(+) | agudos equilibrados - apenas 4.1% longe da mediana
(±) | a linearidade dos máximos é média (9% delta para frequência anterior)
Geral 100 - 16.000 Hz
(±) | a linearidade do som geral é média (17.4% diferença em relação à mediana)
Comparado com a mesma classe
» 33% de todos os dispositivos testados nesta classe foram melhores, 8% semelhantes, 59% piores
» O melhor teve um delta de 6%, a média foi 20%, o pior foi 57%
Comparado com todos os dispositivos testados
» 33% de todos os dispositivos testados foram melhores, 8% semelhantes, 59% piores
» O melhor teve um delta de 4%, a média foi 24%, o pior foi 134%
Consumo de energia - O Surface Pro Plus proporciona uma boa duração da bateria
Consumo de energia
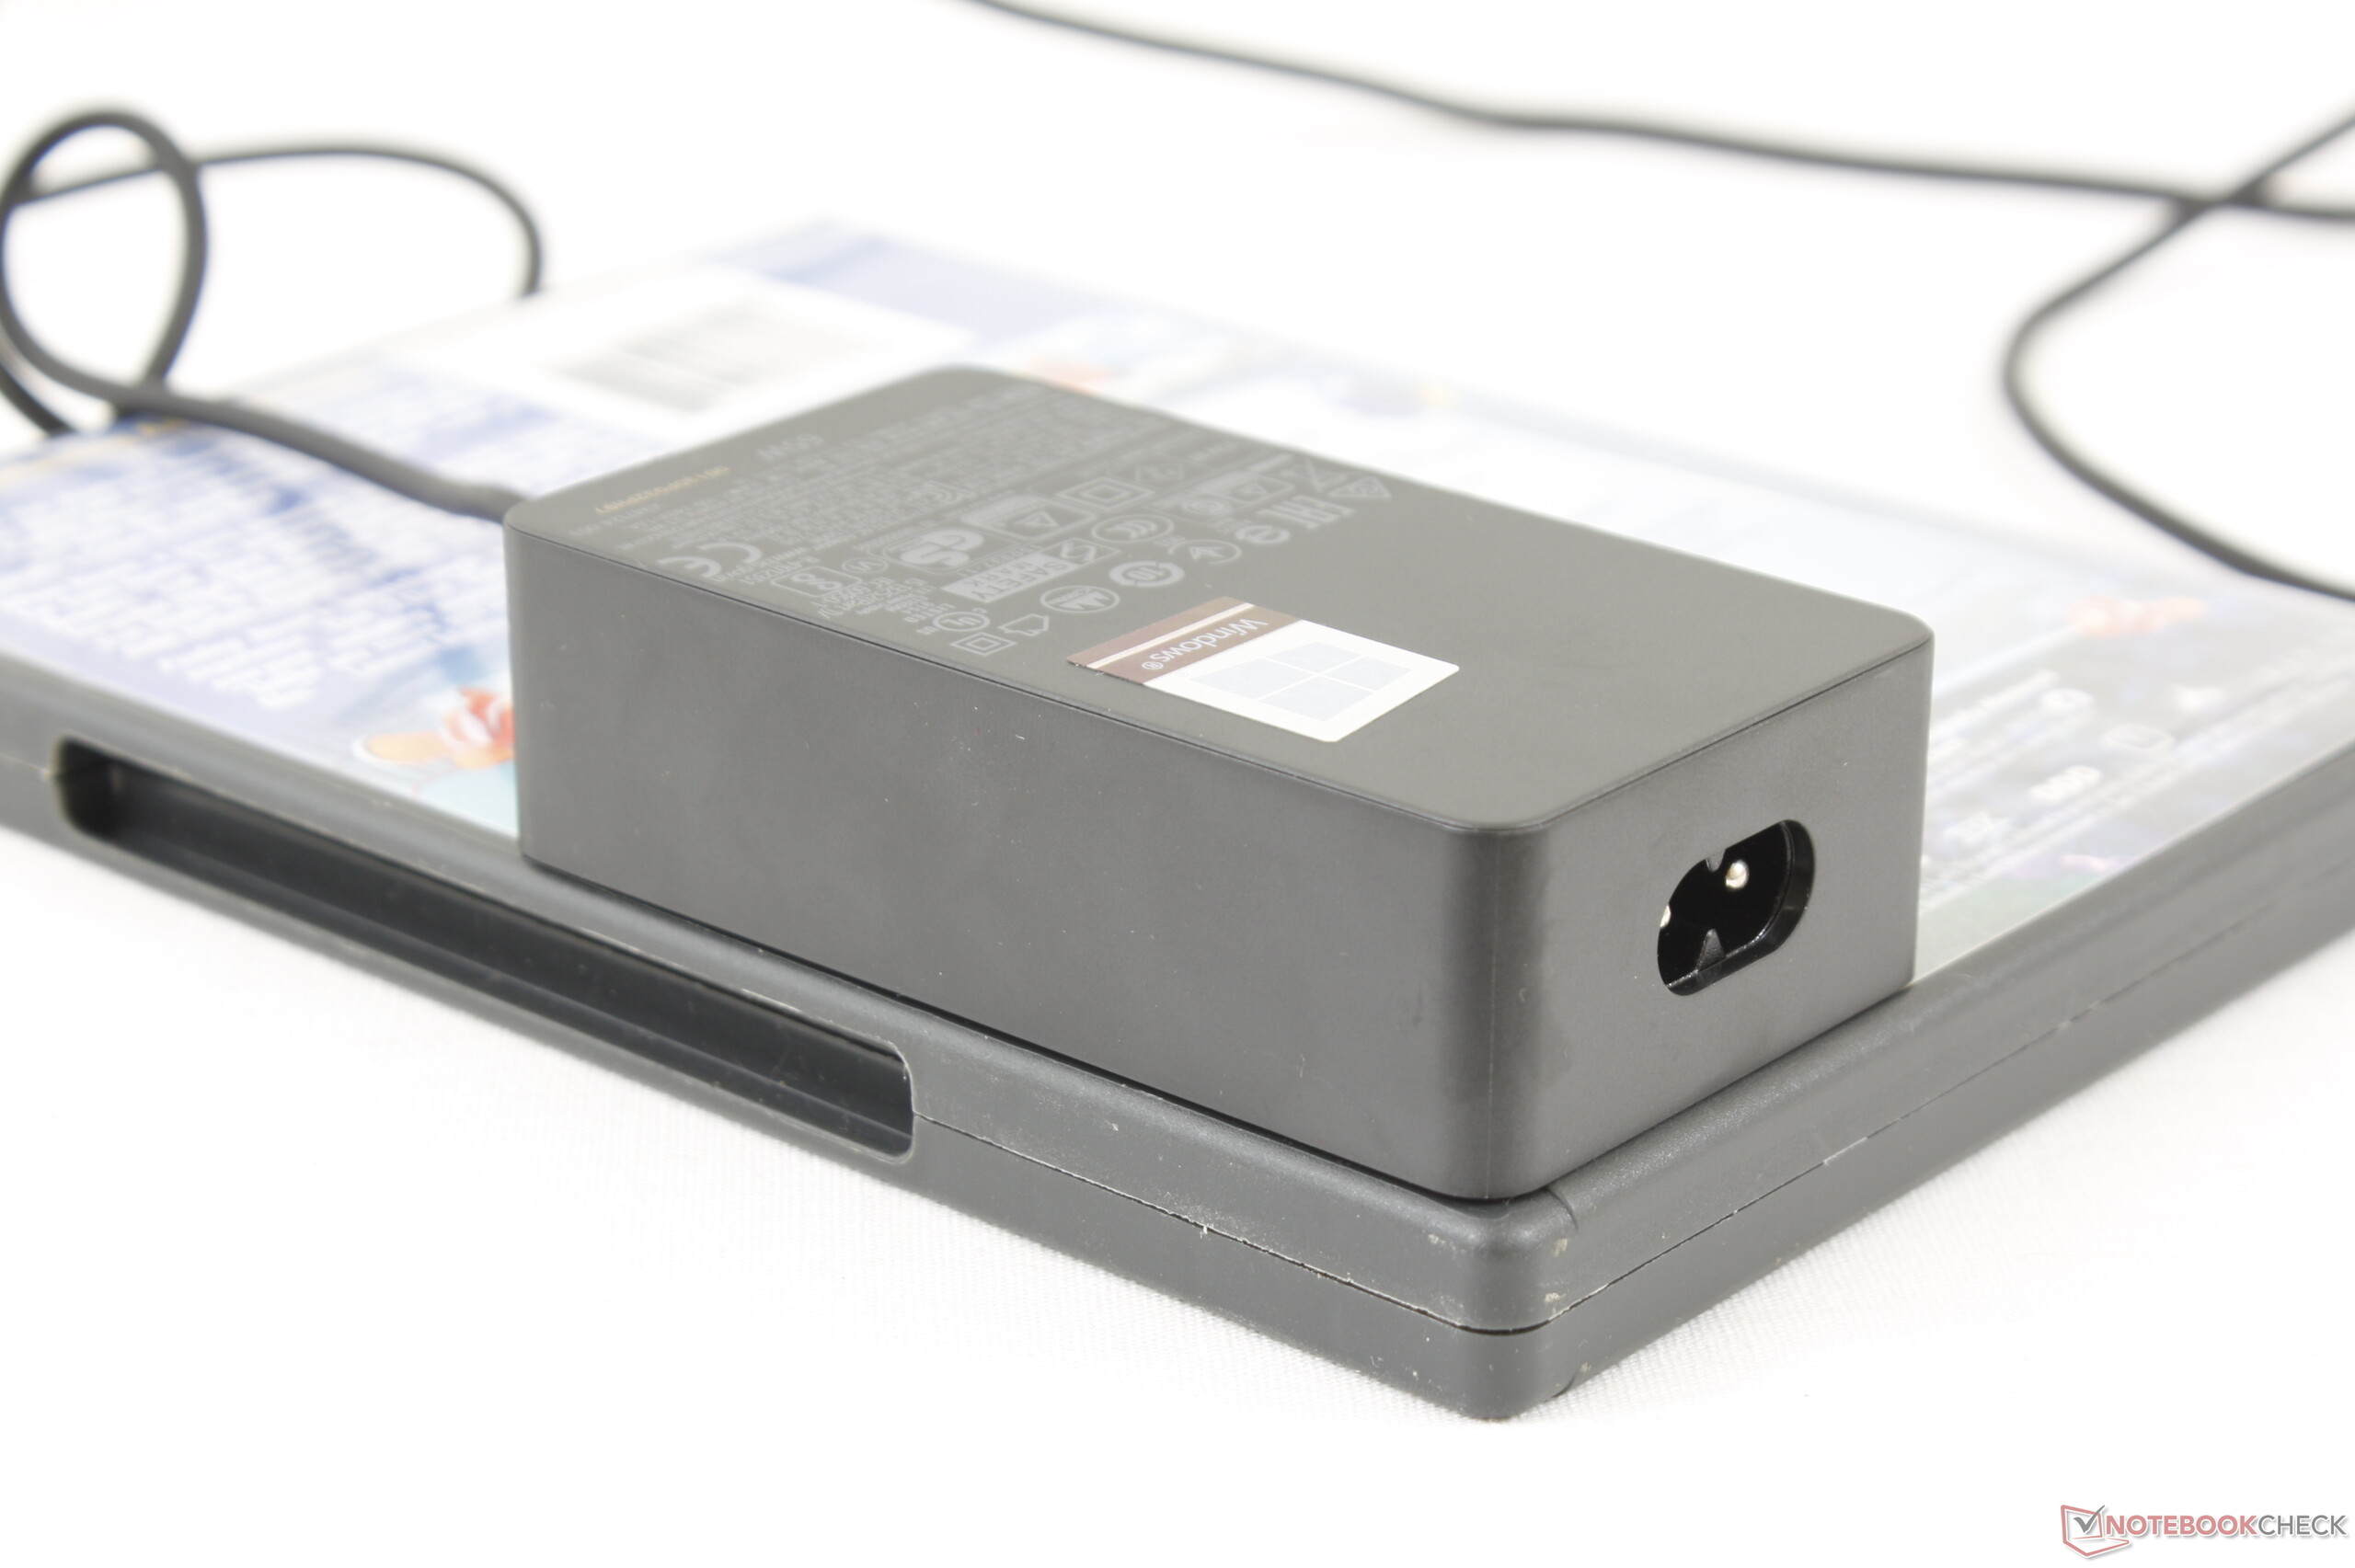
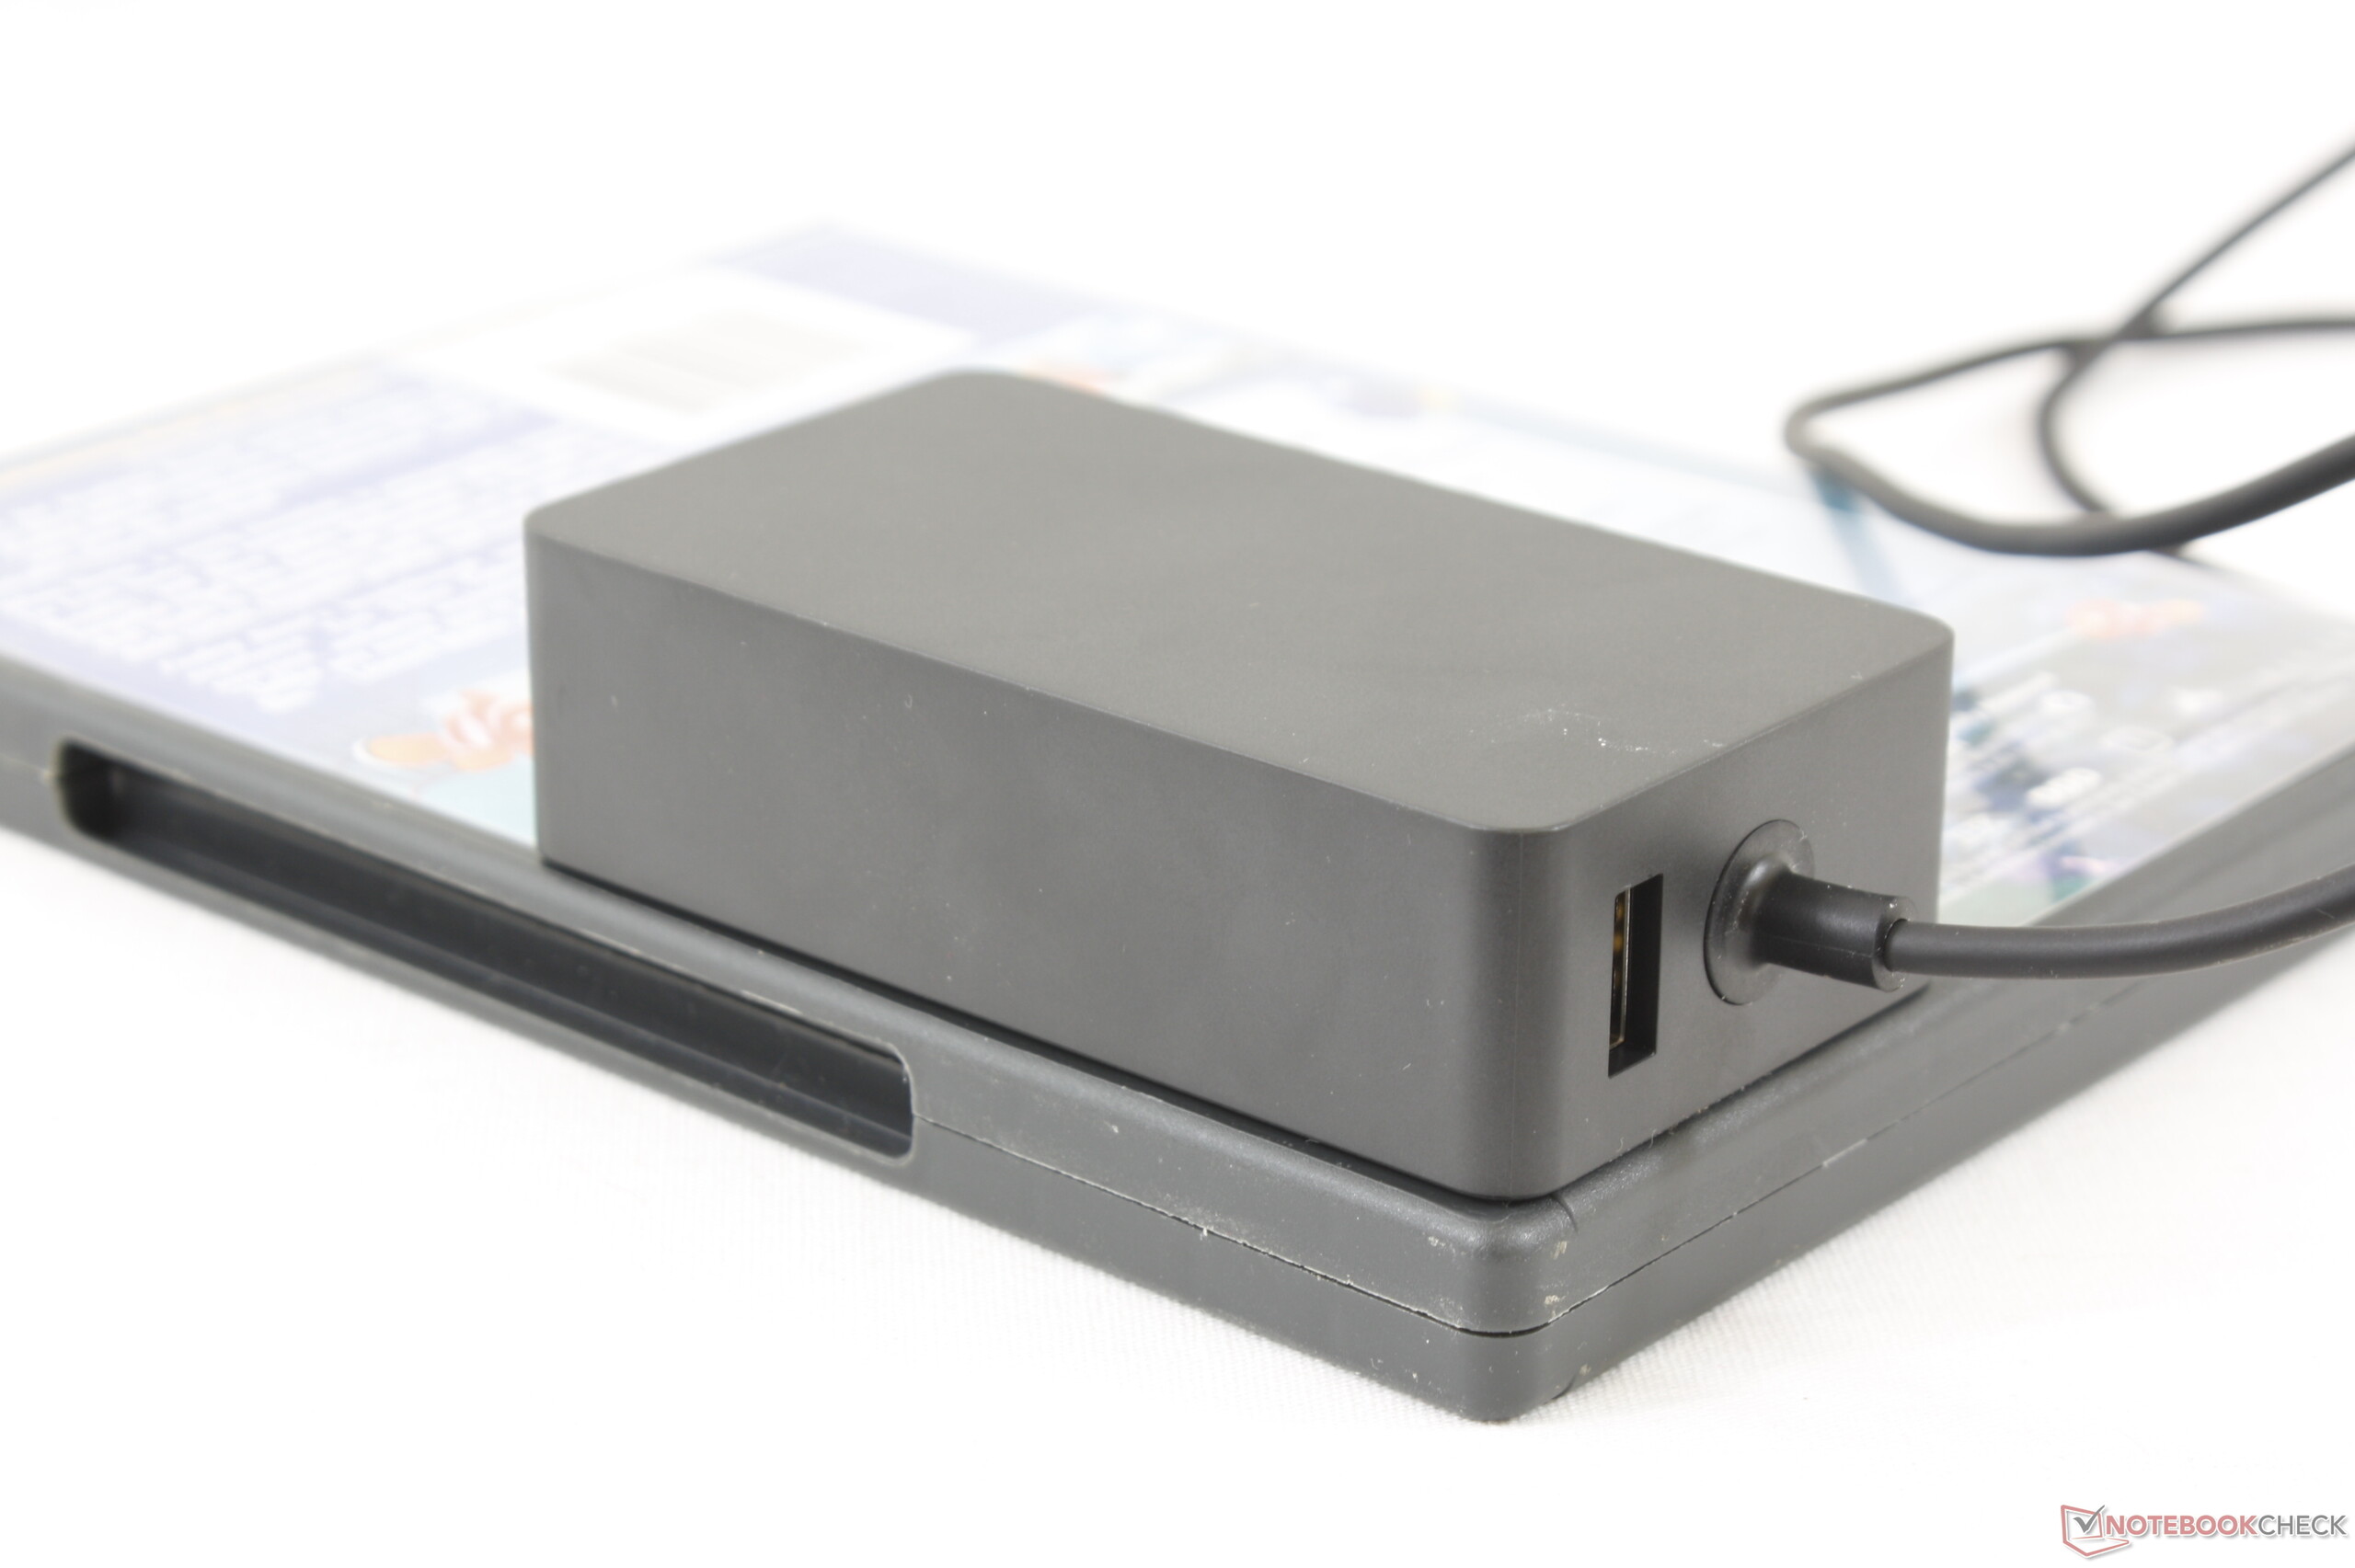
O dispositivo não revela nenhum problema em termos de consumo de energia. O consumo de energia está no mesmo nível dos modelos Ice Lake Surface Pro 7. Além disso, a saída do adaptador de energia USB tipo C incluído é de 65 watts
| desligado | |
| Ocioso | |
| Carga |
|
Key:
min: | |
| Microsoft Surface Pro 7 Plus i5-1135G7, Iris Xe G7 80EUs | Lenovo Yoga Duet 7 13IML05-82AS000WGE i5-10210U, UHD Graphics 620 | Dell Latitude 12 7210 2-in-1 i7-10610U, UHD Graphics 620 | Microsoft Surface Pro 7 i7-1065G7, Iris Plus Graphics G7 (Ice Lake 64 EU) | Microsoft Surface Pro 7 Core i5-1035G4 i5-1035G4, Iris Plus Graphics G4 (Ice Lake 48 EU) | Média Intel Iris Xe Graphics G7 80EUs | Média da turma Convertible | |
|---|---|---|---|---|---|---|---|
| Power Consumption | 42% | 32% | 5% | 4% | 12% | 9% | |
| Idle Minimum * (Watt) | 5.5 | 3.1 44% | 3.2 42% | 4.4 20% | 4.5 18% | 4.49 ? 18% | 4.29 ? 22% |
| Idle Average * (Watt) | 9.1 | 5.7 37% | 5.3 42% | 8.7 4% | 9.2 -1% | 7.4 ? 19% | 7.08 ? 22% |
| Idle Maximum * (Watt) | 10.8 | 8.7 19% | 8.4 22% | 9.6 11% | 9.6 11% | 9.26 ? 14% | 8.68 ? 20% |
| Load Average * (Watt) | 39.2 | 20.5 48% | 27 31% | 44 -12% | 42 -7% | 36.6 ? 7% | 44 ? -12% |
| Load Maximum * (Watt) | 62.5 | 22.6 64% | 46.9 25% | 61 2% | 63.5 -2% | 61.7 ? 1% | 67.3 ? -8% |
* ... menor é melhor
Duração da bateria
A Microsoft promete uma duração máxima da bateria de 15 horas - conseguimos determinar um tempo máximo de funcionamento ocioso de 13:36 horas. O teste Wi-Fi (acesso a websites através de um roteiro) e o teste de vídeo (o curta-metragem Big Buck Bunny (H.264, Full HD) rodando em loop) são completados pelo dispositivo após 8:03 horas e 10:50 horas, respectivamente. Durante os testes, os recursos de economia de energia do 2-em-1 são desativados, e o brilho da tela é ajustado para cerca de 150 cd/m². Os módulos sem fio também são desativados durante o teste de vídeo
| Microsoft Surface Pro 7 Plus i5-1135G7, Iris Xe G7 80EUs, 48.9 Wh | Lenovo Yoga Duet 7 13IML05-82AS000WGE i5-10210U, UHD Graphics 620, 39 Wh | Dell Latitude 12 7210 2-in-1 i7-10610U, UHD Graphics 620, 38 Wh | Microsoft Surface Pro 7 i7-1065G7, Iris Plus Graphics G7 (Ice Lake 64 EU), 45 Wh | Microsoft Surface Pro 7 Core i5-1035G4 i5-1035G4, Iris Plus Graphics G4 (Ice Lake 48 EU), 45 Wh | Média da turma Convertible | |
|---|---|---|---|---|---|---|
| Duração da bateria | -21% | 6% | -21% | 12% | 35% | |
| Reader / Idle (h) | 13.6 | 12.8 -6% | 22.8 68% | 11.5 -15% | 22.3 64% | 27.7 ? 104% |
| H.264 (h) | 10.8 | 8.2 -24% | 11.3 5% | 6.7 -38% | 15.3 ? 42% | |
| WiFi v1.3 (h) | 8.1 | 8.7 7% | 8.2 1% | 9.8 21% | 10 23% | 11.9 ? 47% |
| Load (h) | 3.9 | 1.6 -59% | 1.9 -51% | 1.9 -51% | 1.9 -51% | 1.779 ? -54% |
Pro
Contra
Veredicto
O Surface Pro 7 Plus é a variante 2-em-1 mais bem arredondada em comparação com o Surface Pro 7. A plataforma Tiger Lake utilizada oferece mais desempenho geral em comparação com Ice Lake - o desempenho da GPU aumenta significativamente mais do que o desempenho da CPU. Uma pequena escotilha de manutenção permite uma fácil substituição do SSD. O dispositivo também pode ser conectado ao mundo externo via LTE.
Ainda não está claro se muitos usuários serão capazes de adquirir o Surface Pro 7 Plus. Por enquanto, ele só será vendido para empresas e escolas.
A capacidade ligeiramente aumentada da bateria (48,9 Wh vs. 45 Wh) não tem realmente um impacto. O Surface Pro 7 Plus atinge tempos de execução reais de 8 a 11 horas e, como resultado, está aproximadamente no mesmo nível das taxas do Surface Pro 7. A porta USB-C embutida (DisplayPort, Power Delivery) ainda funciona de acordo com o padrão USB 3.2 Gen. 1. A oportunidade de atualizar para Thunderbolt 4/USB 4 foi perdida aqui.
Alguns pontos fracos da Superfície regular foram levados adiante: Apesar de ser resfriado passivamente, o dispositivo 2-em-1 da Microsoft não é completamente silencioso. Ocasionalmente, um chocalhar eletrônico pode ser ouvido de dentro. A tela sensível ao toque cintila a uma freqüência de 199,2 Hz com níveis de brilho de 57% (corresponde a cerca de 119 cd/m²) e abaixo.
Embora a superfície seja destinada a empresas e escolas, falta-lhe um leitor de impressões digitais. Se necessário, um teclado equipado de forma correspondente (Microsoft Surface Pro Type Cover com ID de impressão digital) tem que ser usado aqui. Finalmente, o período de garantia de um ano não é apropriado para um dispositivo nesta faixa de preço.
Preço e disponibilidade
O Microsoft Store tem o Surface Pro 7 Plus listado a preços a partir de US$899,99. Há várias configurações disponíveis, bem como um "Business Essentials Bundle" que inclui a Cobertura do Tipo e o Plano de Proteção de sua escolha. O pacote começa em torno de US$1.100.
Microsoft Surface Pro 7 Plus
- 03/19/2021 v7 (old)
Sascha Mölck
Price comparison

