Notebookcheck Logo

NVIDIA GeForce RTX 3080 Ti Revisão da Edição dos Fundadores: Desempenho do RTX 3090 por menos, mas ainda uma proposta de baixo valor

Ti(e)-ing com o 3090. A NVIDIA GeForce RTX 3080 Ti chega como uma atualização de meio ciclo para suplantar a RTX 3080 como a GPU de jogos mais rápida da empresa nove meses depois que a empresa introduziu pela primeira vez a arquitetura Ampere. O RTX 3080 Ti esportiva uma variante ligeiramente reduzida da GPU GA102 que é encontrada no RTX 3090 com metade da VRAM. Levamos o RTX 3080 Ti FE para um test drive e avaliamos como este cartão de US$1.199 se empilha contra o RTX 3080 e o AMD Radeon RX 6900 XT.

A NVIDIA lançou o GeForce RTX 3080 Ti durante a Computex 2021 no mês passado ao lado do RTX 3070 Ti. O RTX 3080 Ti é uma versão ligeiramente reduzida do "BFGPU" RTX 3090 e é mais uma atualização de meio de ciclo do que qualquer coisa revolucionária. Essencialmente, estamos olhando para um chip Ampere GA102 melhor acondicionado do que o RTX 3080.

O RTX 3080 Ti agora suplanta o RTX 3080 como a principal GPU de jogos da NVIDIA. Ele chega em um momento em que a disponibilidade da GPU ainda é uma preocupação, com a maioria das cartas vendendo rapidamente e com uma margem significativa acima do MSRP. O RTX 3080 Ti também pode ser visto como a riposta da NVIDIA para uma AMD ressurgente, que parece ter recuperado seu mojo com o lançamento das GPUs RDNA 2. O Radeon RX 6900 XT está a uma distância impressionante do RTX 3090 em vários títulos, o que significa que os gamers não precisam olhar apenas para a NVIDIA para uma experiência de jogo emblemática, desde que a performance de ray-tracing não seja o principal critério de compra

Embora posicionado entre o RTX 3080 e o RTX 3090, o RTX 3080 Ti inclina-se mais para os níveis de desempenho do RTX 3090 e tem um preço de US$ 1.199 MSRP a condizer. Embora seja US$300 a menos que o MSRP do RTX 3090 (US$1.499), também é US$500 mais caro que o RTX 3080 (US$699). Na Índia, a RTX 3080 Ti Founders Edition (FE) para o varejo ₹1,22.000.

Nesta revisão, colocamos a RTX 3080 Ti Founders Edition em seus passos e vemos como esta atualização de meio de ciclo é um bom augúrio para os jogadores que procuram comprar uma nova GPU.

Comparação do RTX 3080 Ti com outras GPUs NVIDIA

Especificação RTX3090 FE RTX3080 Ti FE RTX3080 FE RTX3070 FE RTX3060 Ti FE Titan RTX RTX2080 Ti TITANX Pascal
Chip GA102 GA102 GA102 GA104 GA104 TU102 TU102 GP102
Processo FinFET 8 nm 8nm 8 nm 8 nm 8 nm 8 nm 12 nm 12 nm
CUDA cores 10,496 10,240 8,704 5,888 4,864 4,608 4,352 3,584
Textureunits 328 320 272 184 152 288 272 224
Núcleos Tensores 328 3ª G. 3203ª G. 272 3ª G. 184 3ª G. 152 3ª G. 576 2ª G. 544 2ª G. -
RTcores 82 80 68 46 38 72 68 -
Relógio base GPU 1,395 MHz 1,365 MHz 1,440 MHz 1,500 MHz 1,410 MHz 1,350 MHz 1,350 MHz 1,417 MHz
Relógio de impulso GPU 1,695 MHz 1,665 MHz 1,710 MHz 1,750 MHz 1,665 MHz 1,770 MHz 1,545 MHz 1,531 MHz
Memorybus 384-bit 384-bit 320-bit 256-bit 256-bit 384-bit 352-bit 384-bit
Largura de banda de memória 936 GB/s 912GB/s 760 GB/s 448 GB/s 448 GB/s 672 GB/s 616 GB/s 480.4 GB/s
Memória de vídeo 24 GB GDDR6X 12GB GDDR6X 10 GB GDDR6X 8 GB GDDR6 8 GB GDDR6 24 GB GDDR6 11 GB GDDR6 12 GB GDDR5X
Consumo de energia elétrica350 W 350W 320 W 220 W 200 W 280 W 250 W 250 W 250 W

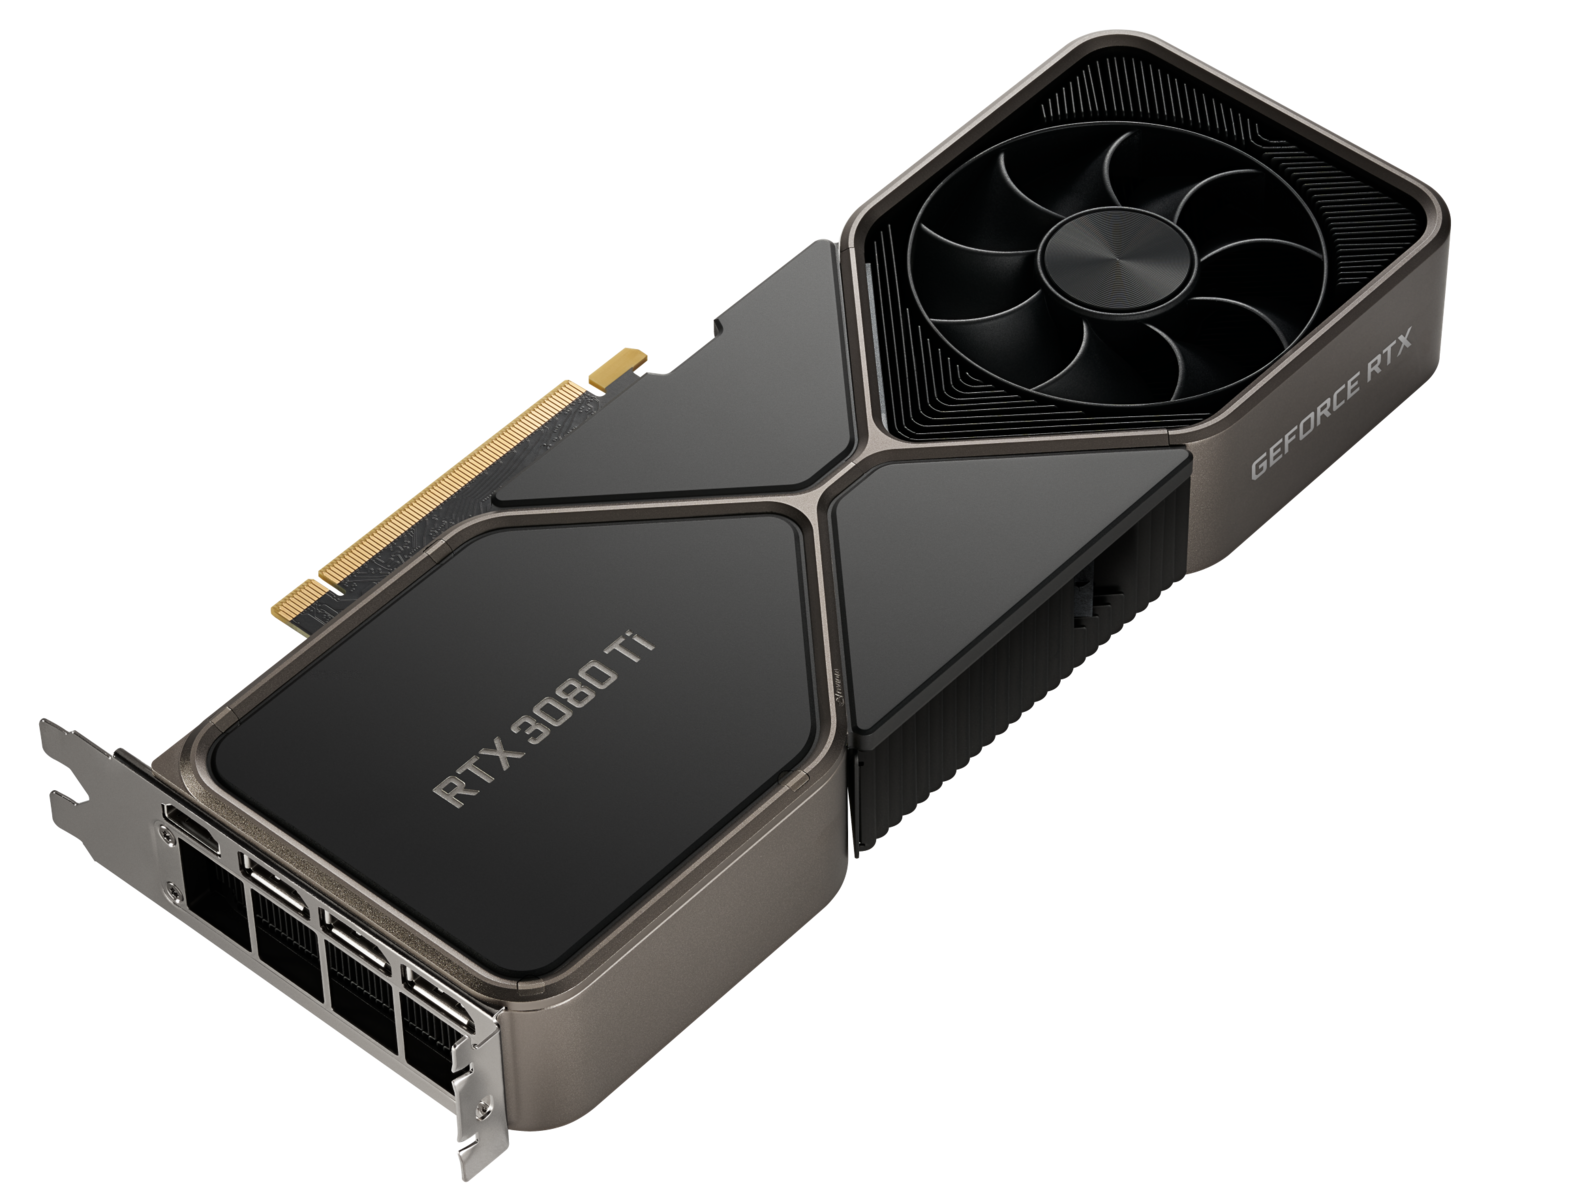
Um tour pela NVIDIA GeForce RTX 3080 Ti FE

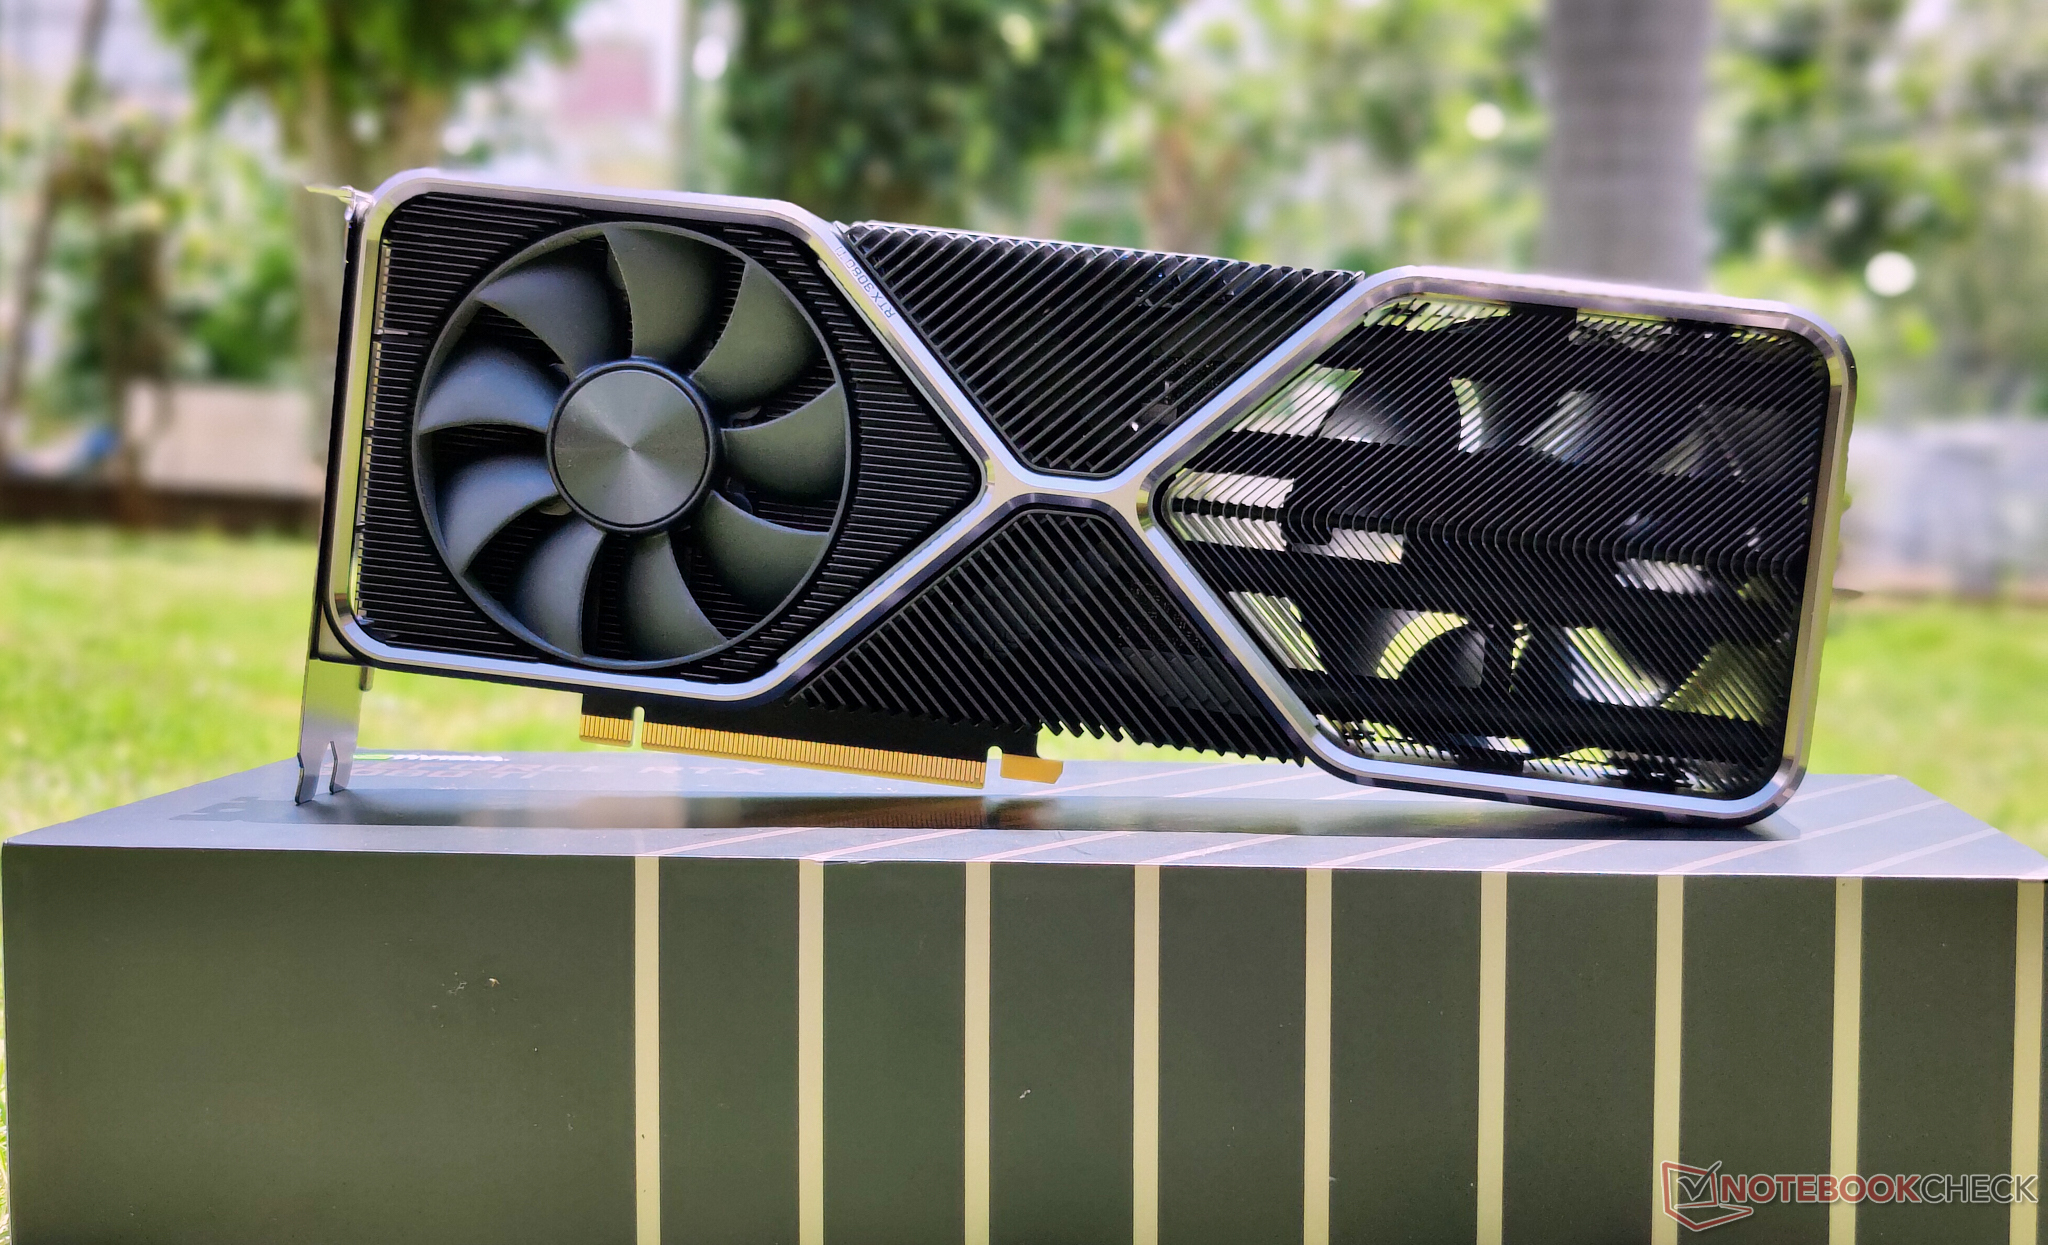
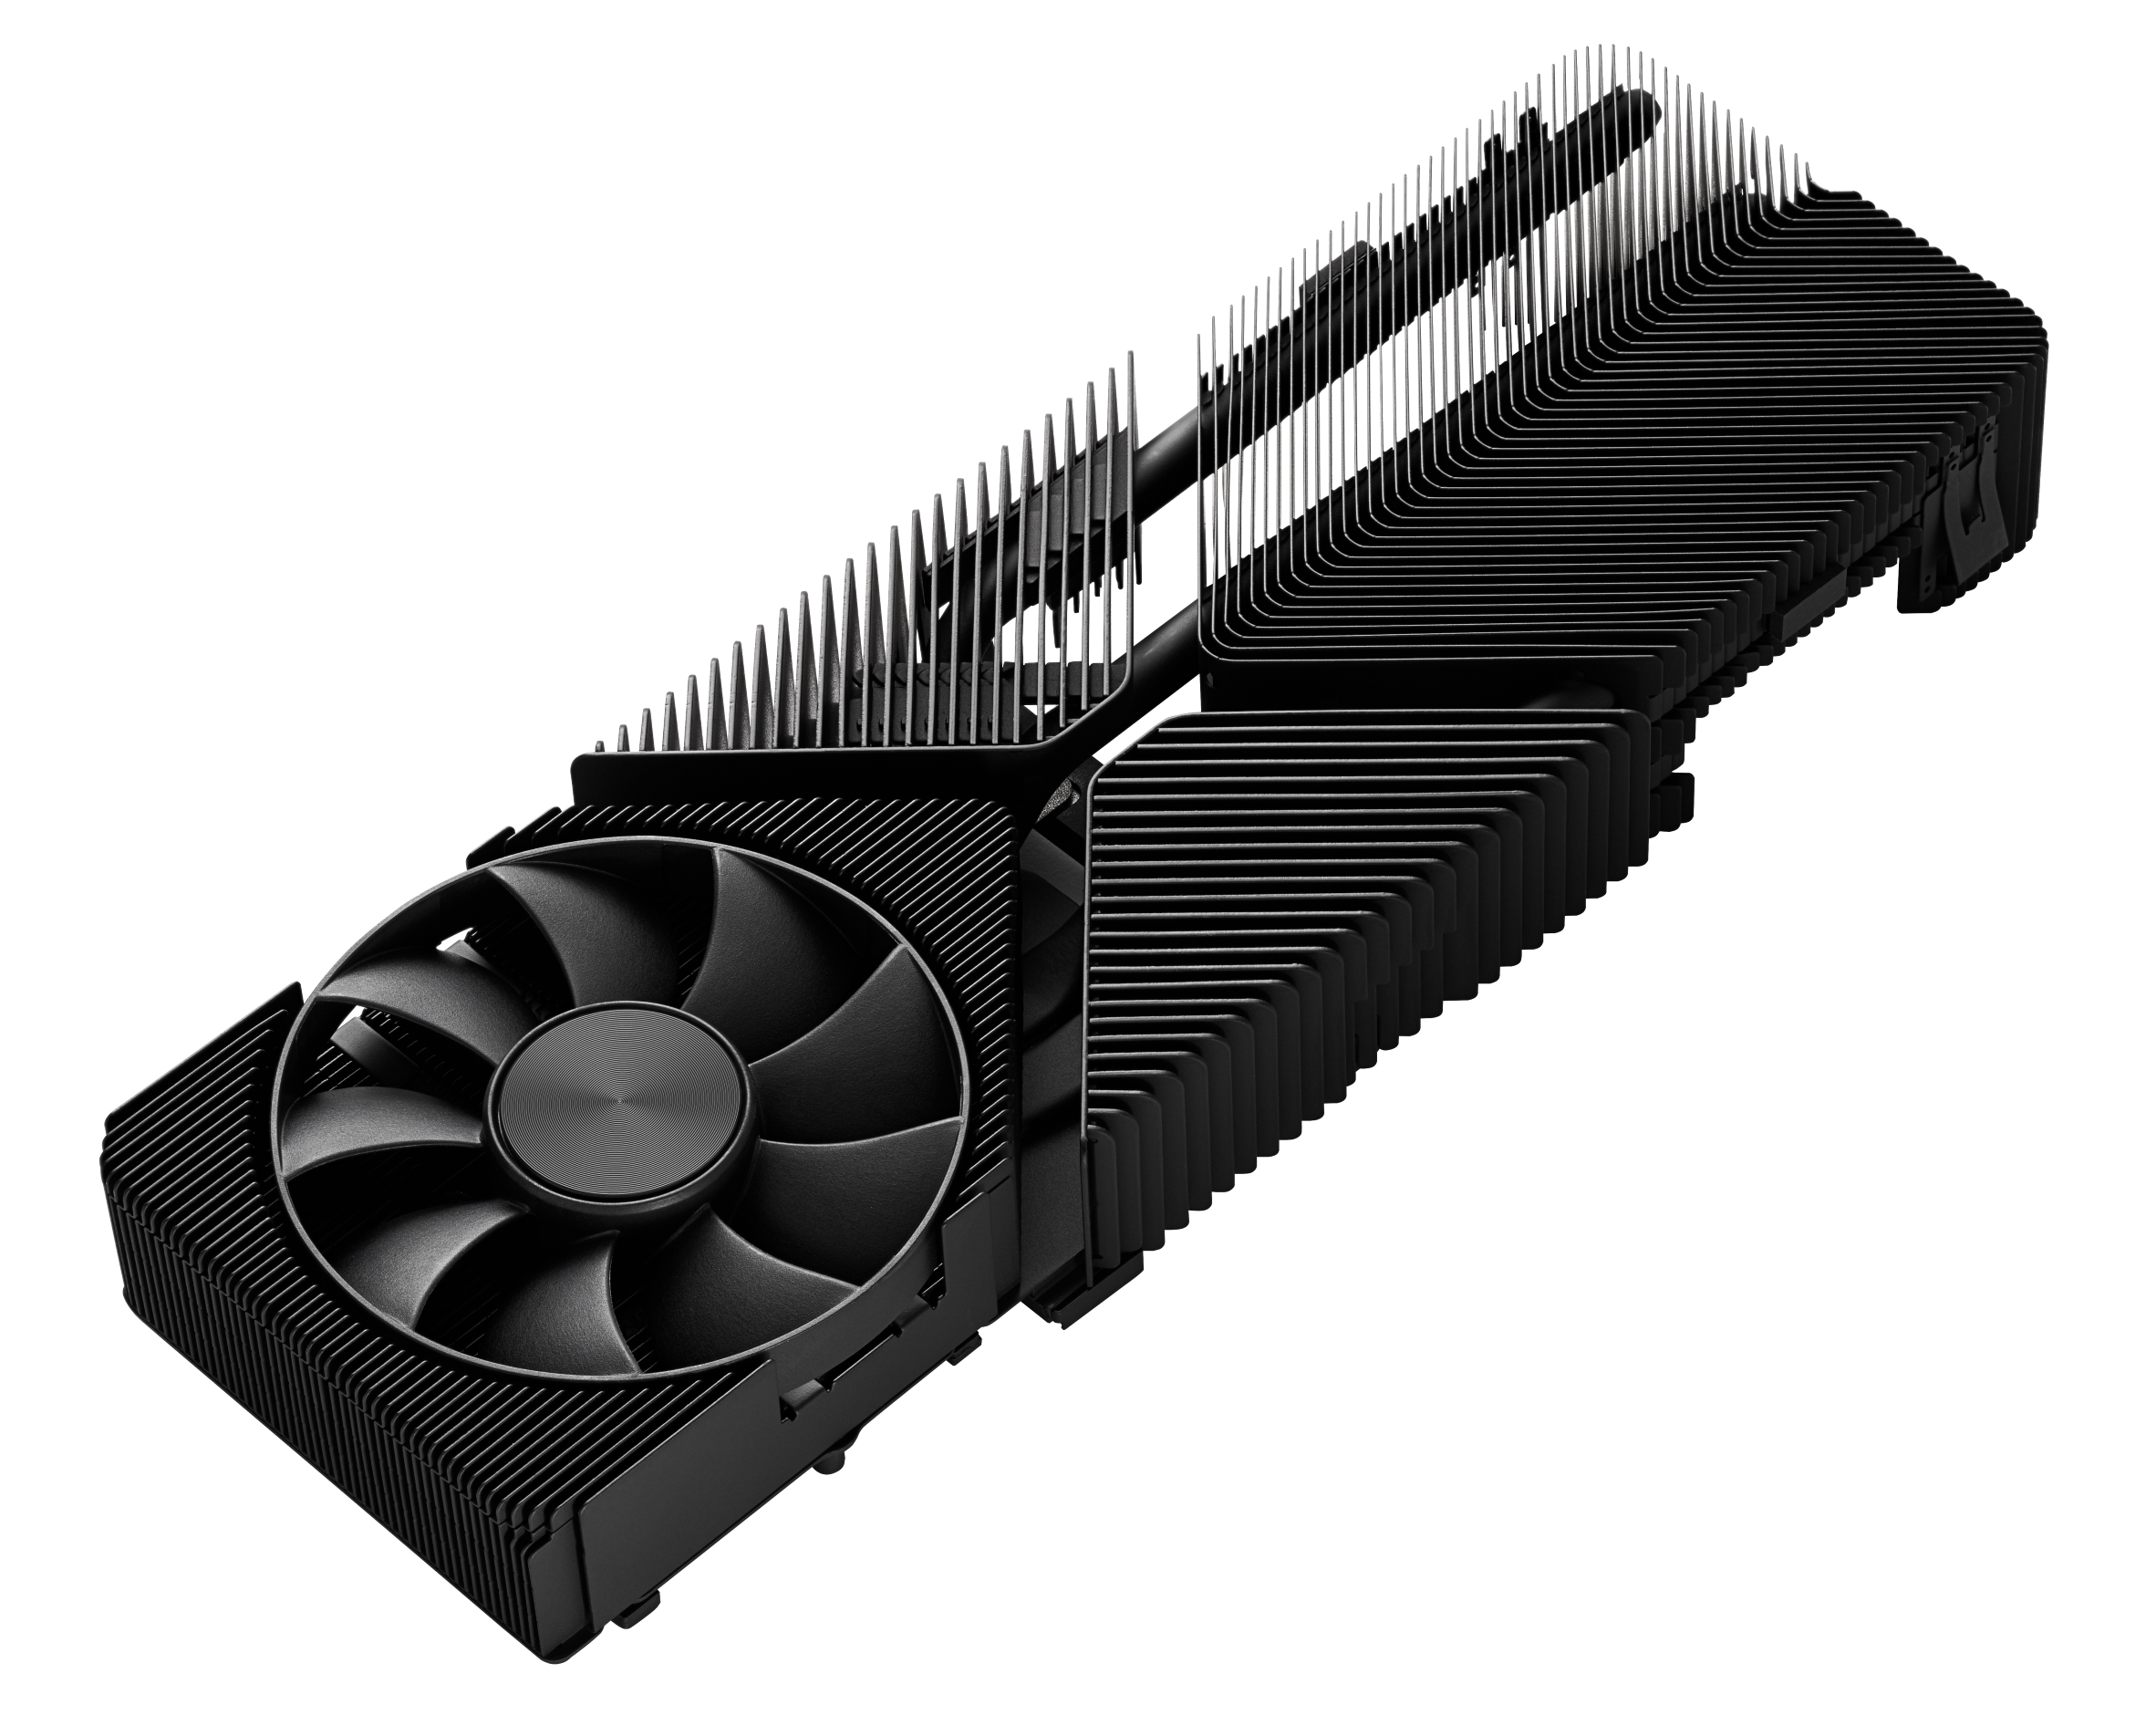
Em termos de design, não há diferença entre as Edições dos Fundadores do RTX 3080 e do RTX 3080 Ti em termos de aparência, exceto pelo novo nome SKU. Apesar de ter especificações quase-RTX 3090, a NVIDIA optou por manter o design de 2 slots do RTX 3080.

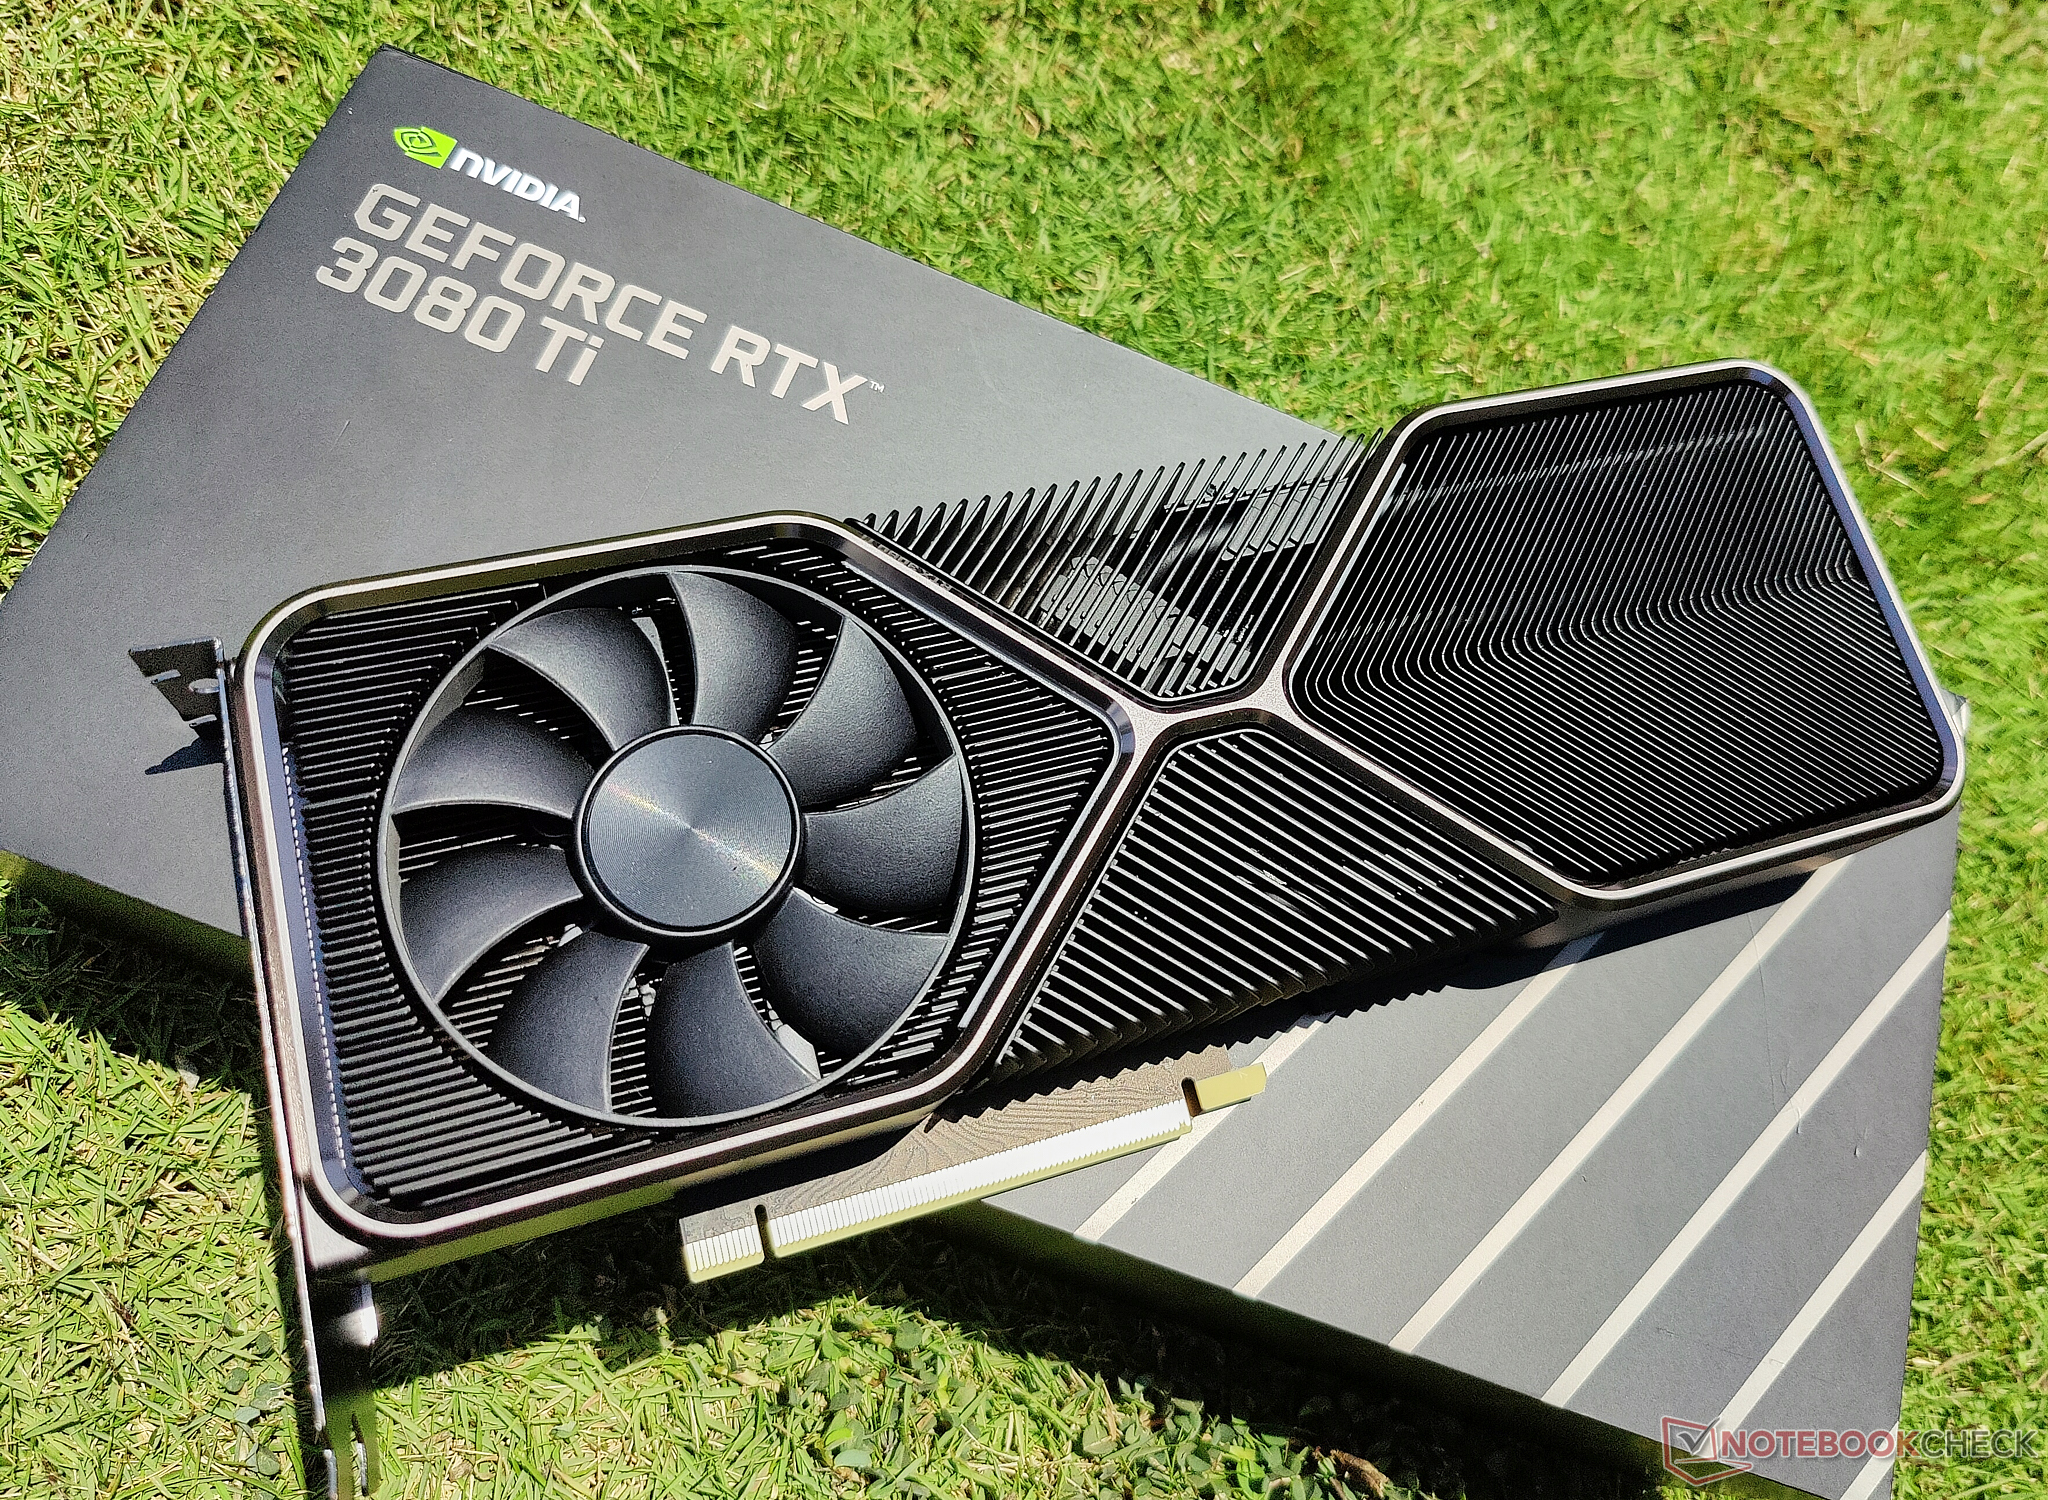
Embora isto seja bom para a estética do caso, não é exatamente um bom presságio para os níveis de resfriamento e ruído do ventilador, como veremos a seguir. Os ventiladores duplos de 9 lâminas de 85 mm fazem um trabalho decente para manter a placa um pouco fria, e a placa traseira de metal ajuda na melhor dissipação de calor para o ambiente. A solução térmica é capaz - suficiente, mas não parece estar na mesma liga que a do RTX 3090.

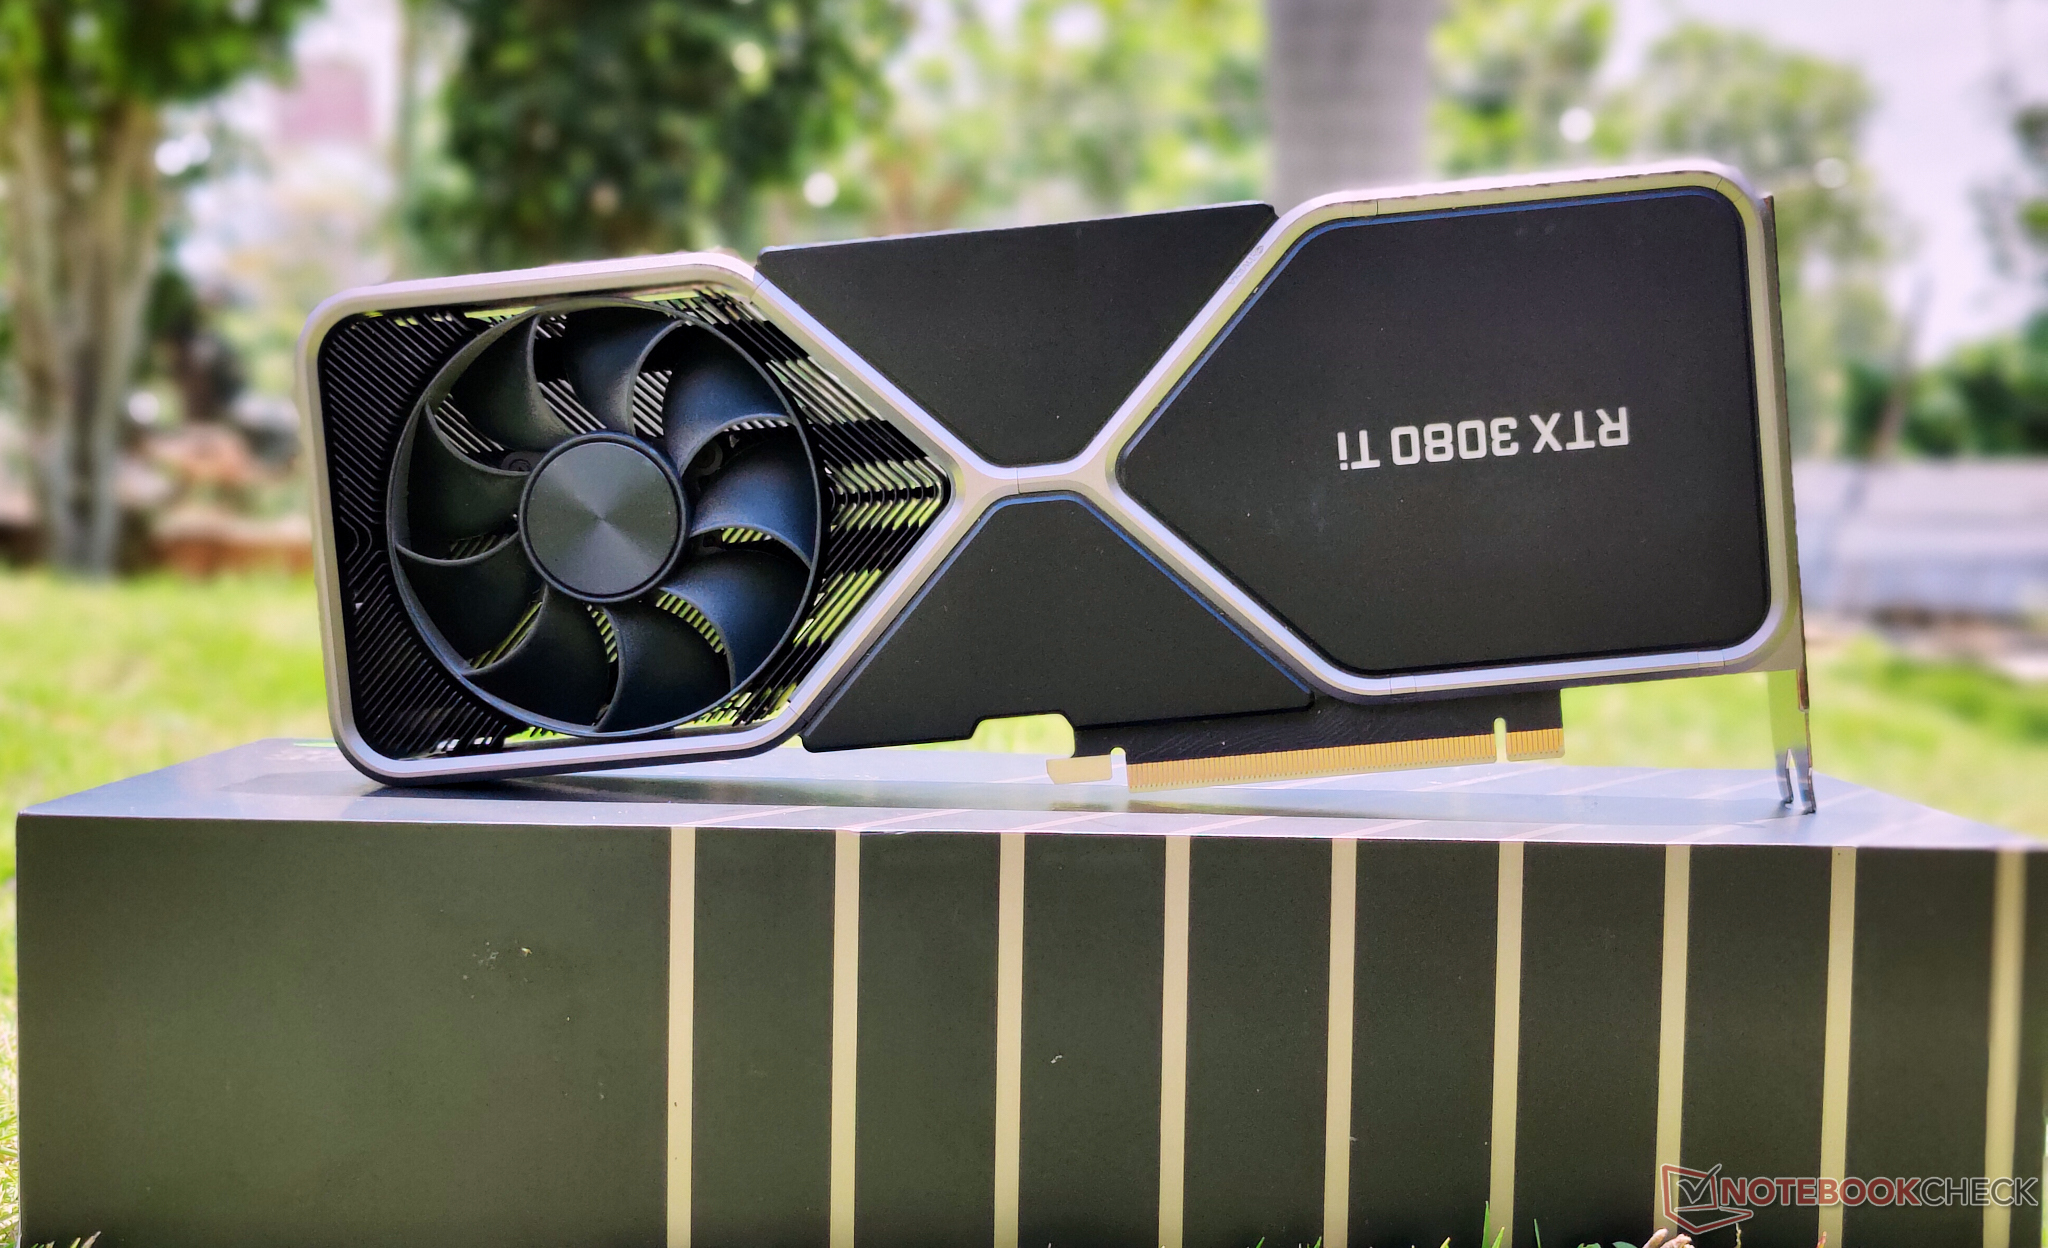
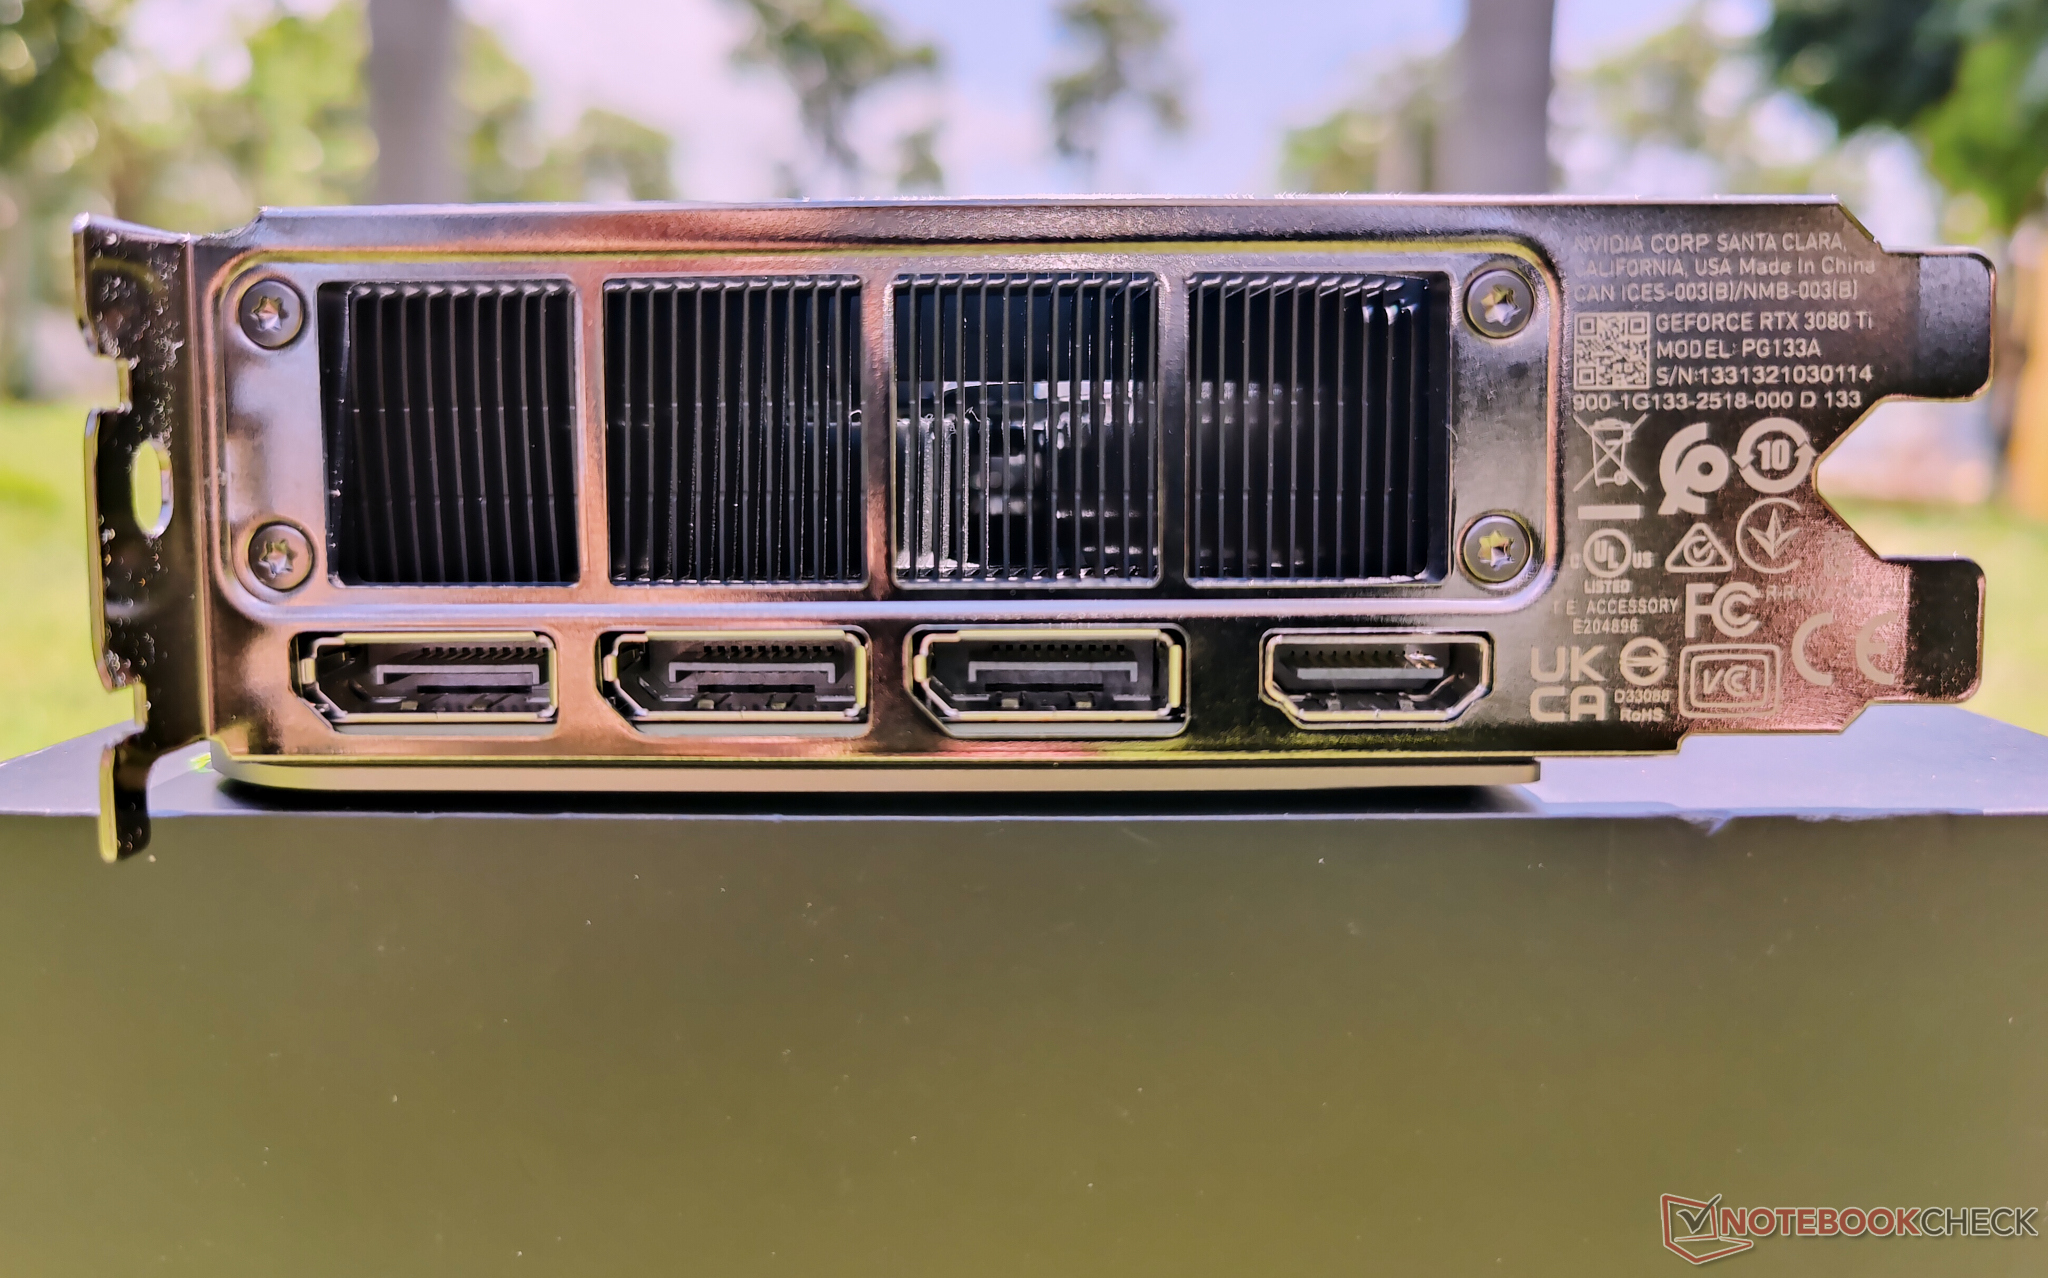
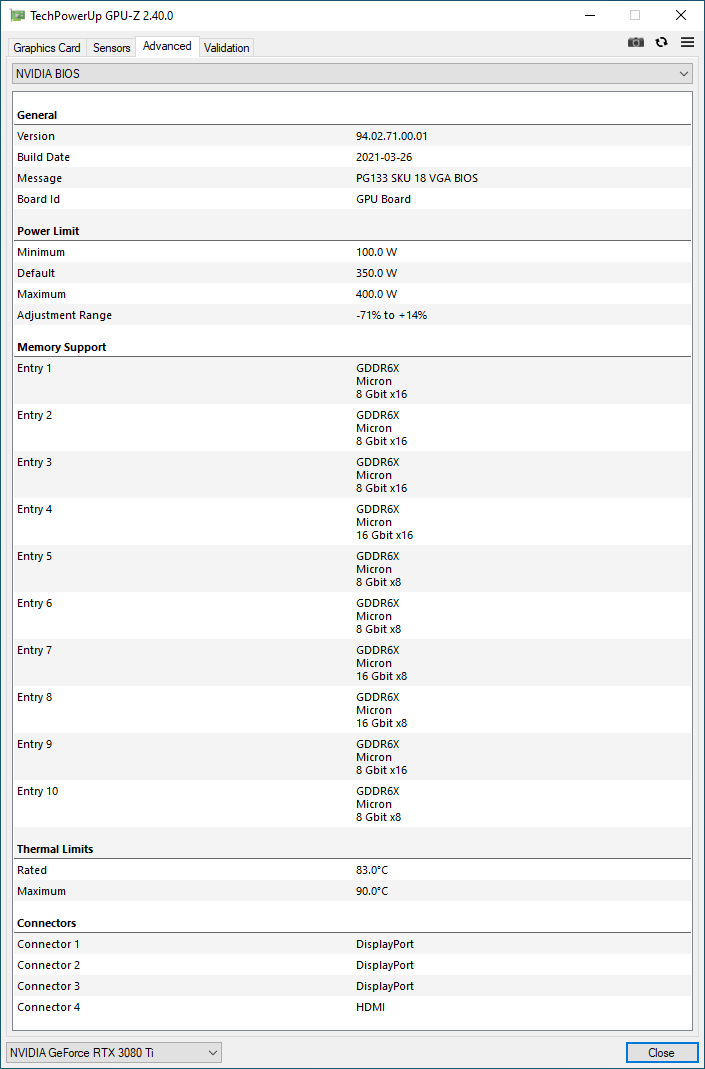
Como é a marca registrada dos cartões Ampere FE, podemos ver o conector de alimentação Molex MicroFit 3.0 de 12 pinos no centro superior; há um conector duplo de 8 pinos para 12 pinos fornecido na caixa. As opções de conectividade são a tarifa padrão e incluem uma saída HDMI 2.1 e três saídas DisplayPort 1.4a. DisplayPort 1.4a permite que o RTX 3080 Ti acione dois displays de 8K 60 Hz com um único cabo cada um sem quebrar muito suor enquanto o HDMI 2.1 permite uma saída de 4K 144 Hz e 8K 30 Hz.

Como é o caso da maioria dos cartões FE, o logotipo GeForce RTX brilha em branco e não pode ser controlado pelo software RGB. Entretanto, é possível controlar parte da iluminação da estrutura interna através do Corsair iCUE ou outros aplicativos RGB de terceiros.

A NVIDIA oferece uma garantia padrão de três anos em todos os cartões das Edições Fundadoras GeForce.

RTX 3080 Ti FE PCB - Frente. (Fonte de imagem: NVIDIA)
RTX 3080 Ti FE PCB - Voltar. (Fonte de imagem: NVIDIA)
Sistema de resfriamento RTX 3080 Ti FE. (Fonte de imagem: NVIDIA)

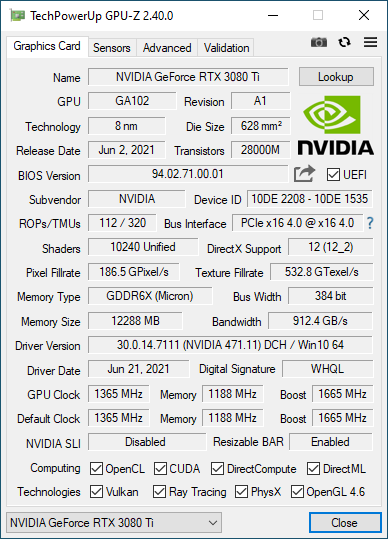
O RTX 3080 Ti FE oferece um relógio de base de 1.365 MHz e um impulso de 1.665 MHz. Há espaço para atingir um impulso além deste valor, embora não o tenhamos conseguido ultrapassar a marca dos 2.000 MHz, como o RTX 3090. O RTX 3080 Ti é avaliado em um TGP de 350 W. É possível aumentar a meta de potência em mais 14% para cerca de 400 W, mas tivemos problemas de estabilidade durante os testes de estresse.

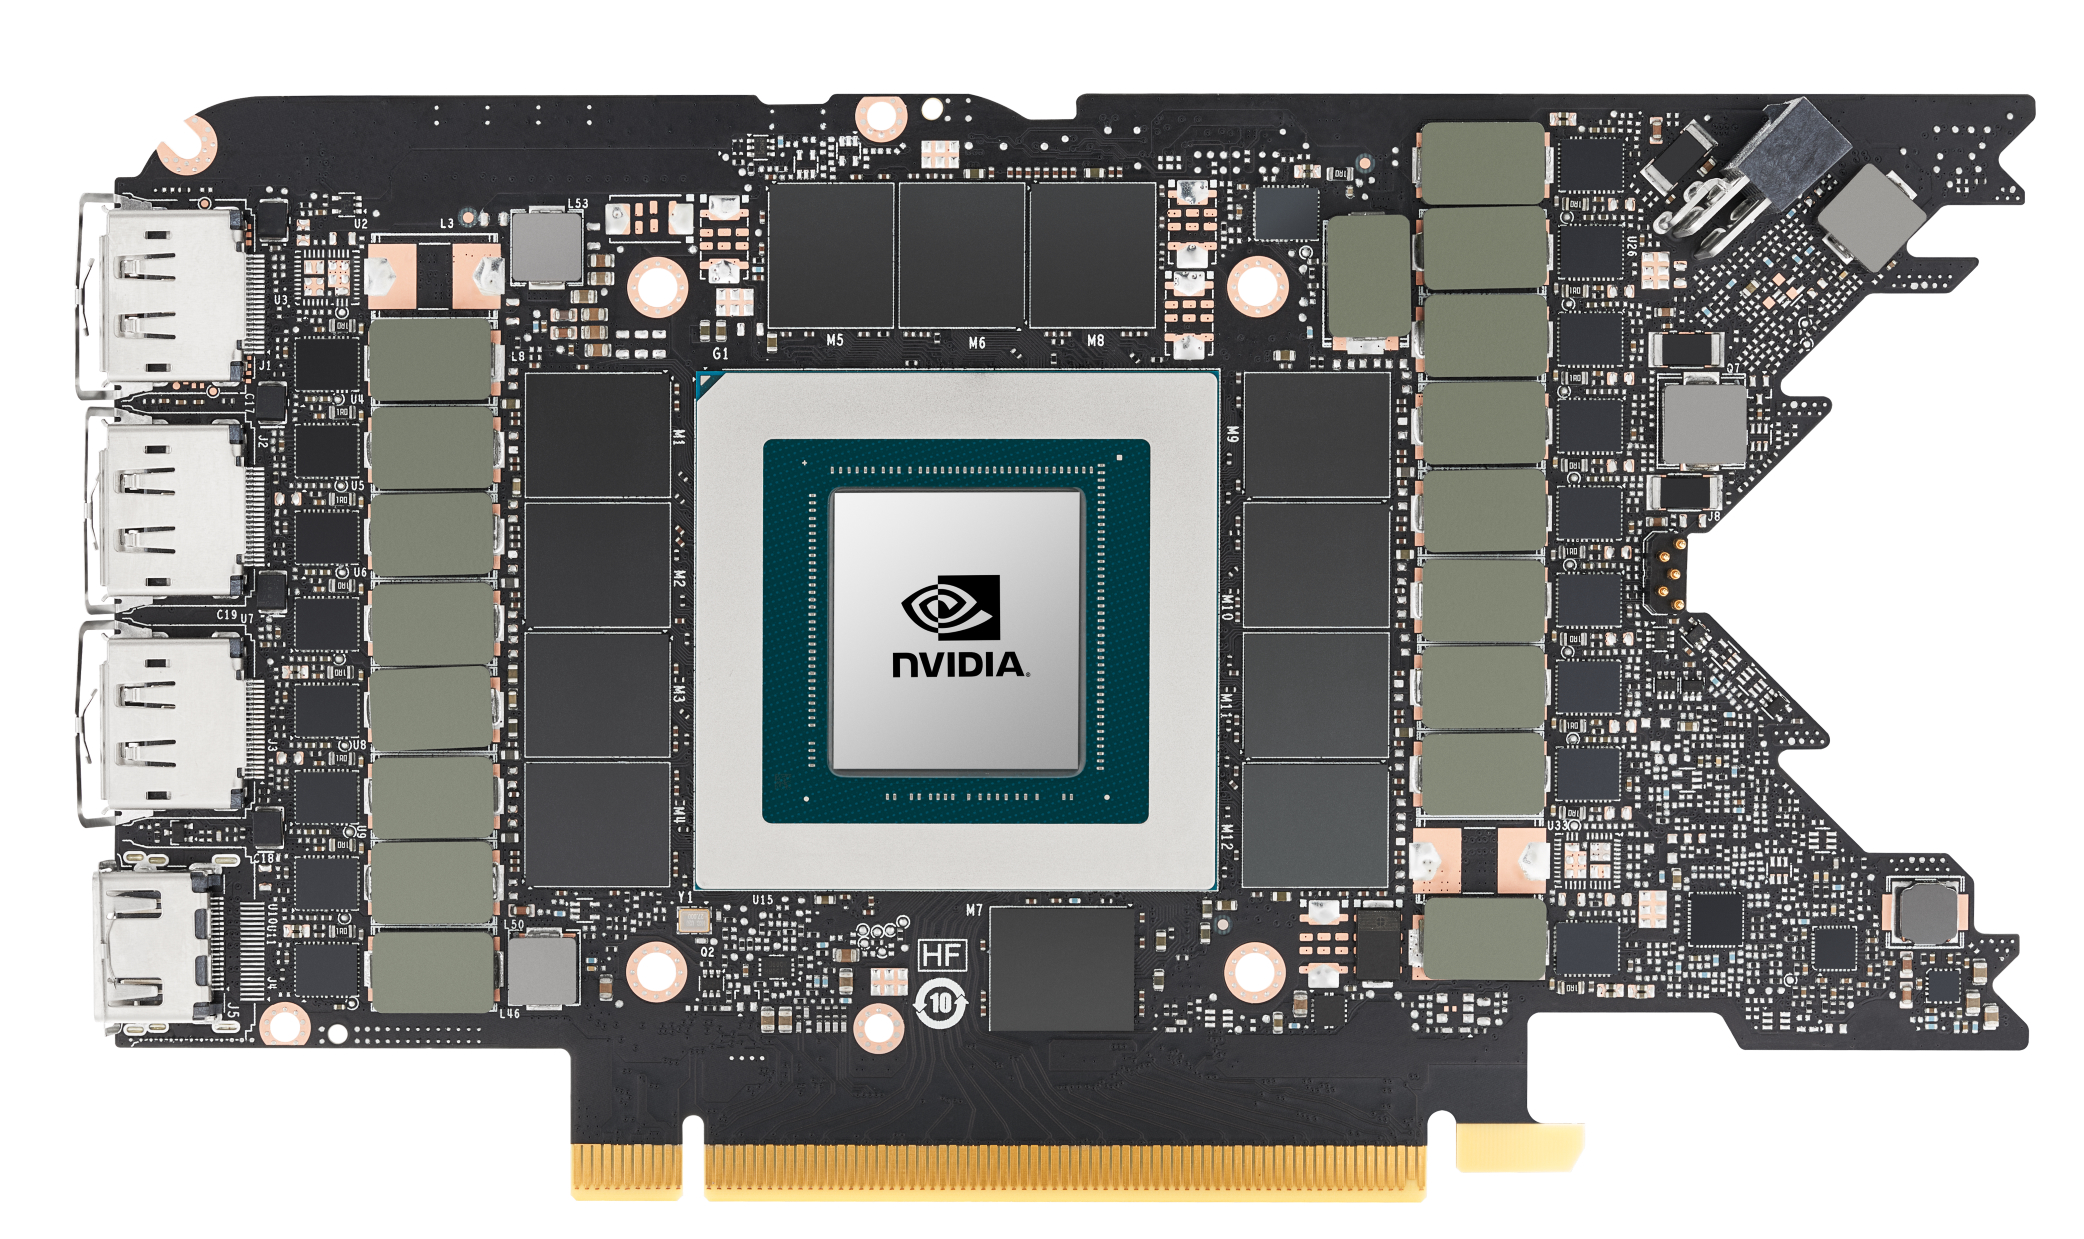
O RTX 3080 Ti FE maximiza o barramento de 384 bits da memória GDDR6X, que permite apenas duas capacidades VRAM - 12 GB e 24 GB. A NVIDIA reservou a oferta de 24 GB para o RTX 3090 com o objetivo de atrair profissionais criativos que também jogam, com o RTX 3080 Ti tendo que competir com 12 GB. Enquanto o cartão parece ter apenas 2 GB extras de VRAM em comparação com o RTX 3080, estamos olhando para um aumento de 20% na largura de banda de memória a 912 GB/s que deve augurar muito bem para lidar com texturas pesadas no jogo, pelo menos na atual safra de títulos AAA.

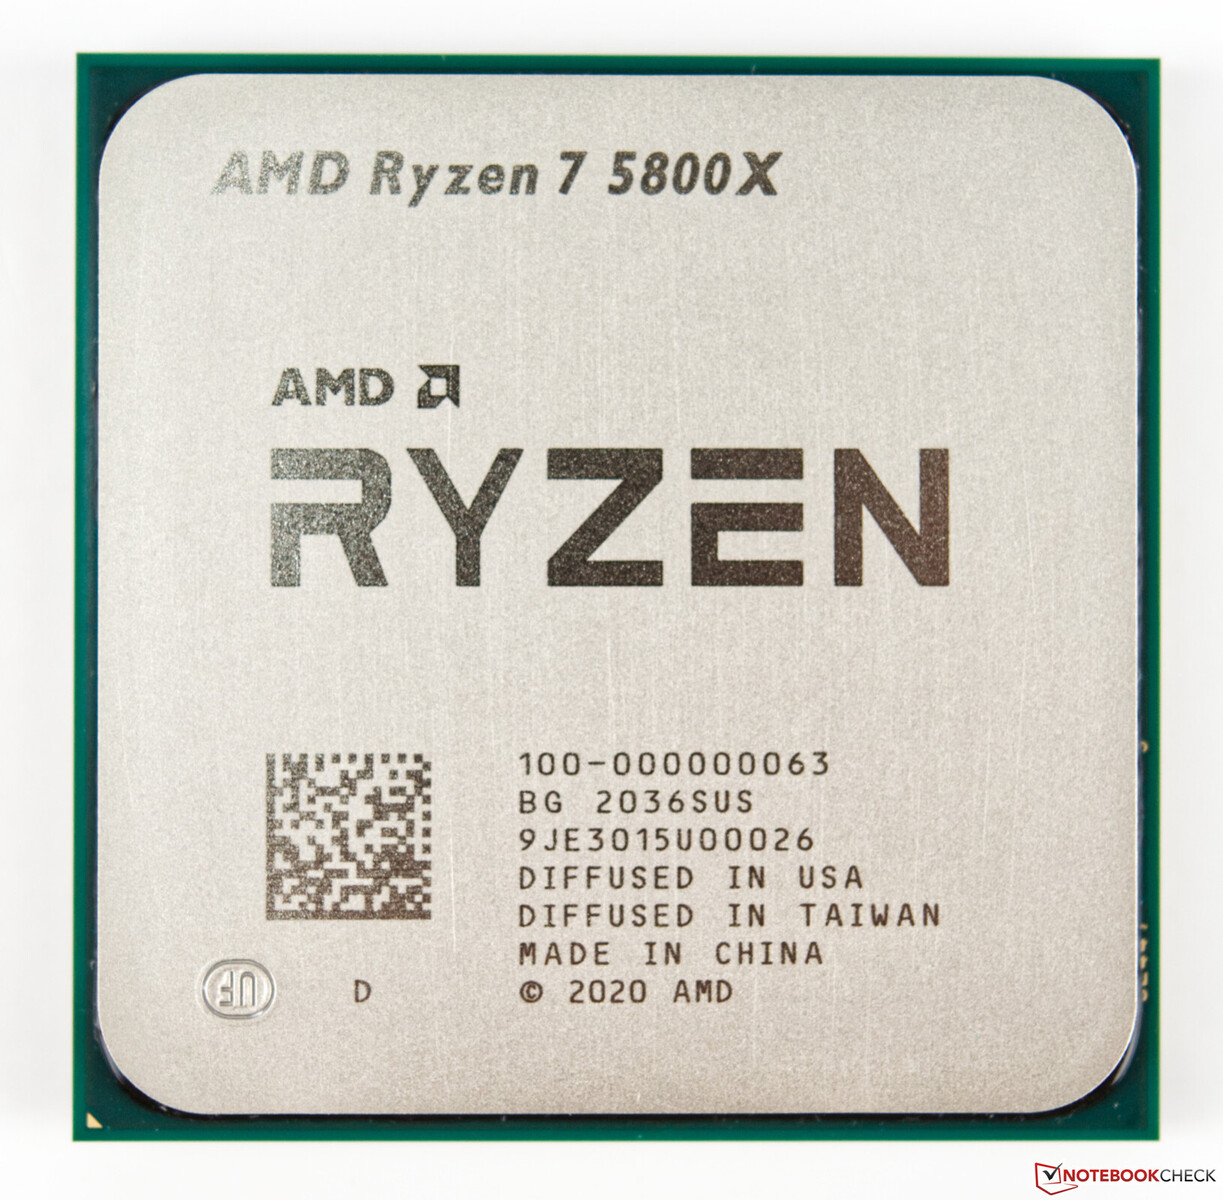
O banco de testes - Baseado na plataforma AMD Ryzen 7 5800X e X570

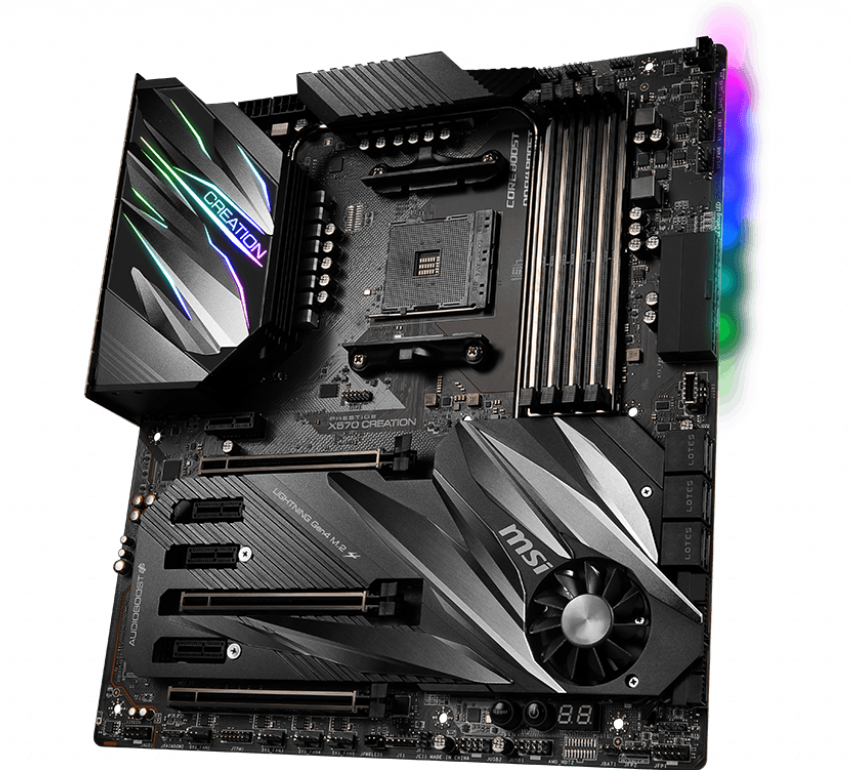
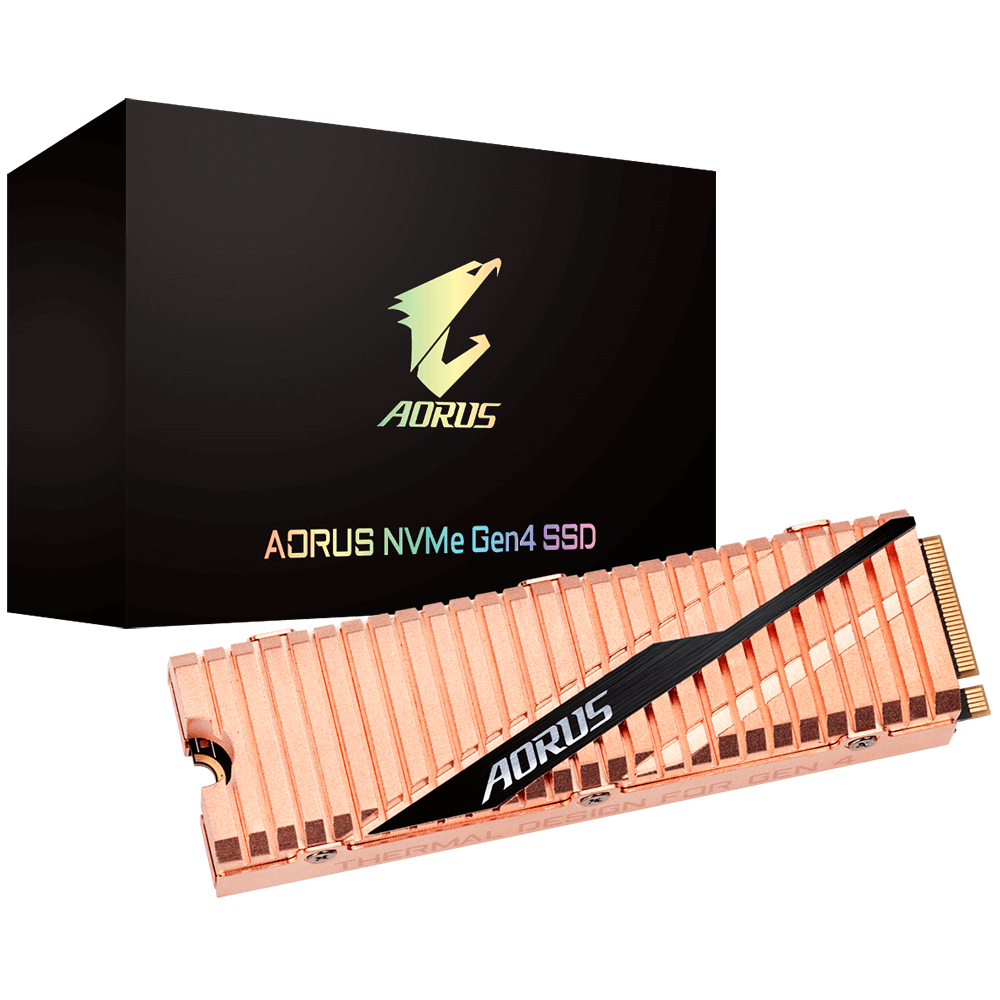
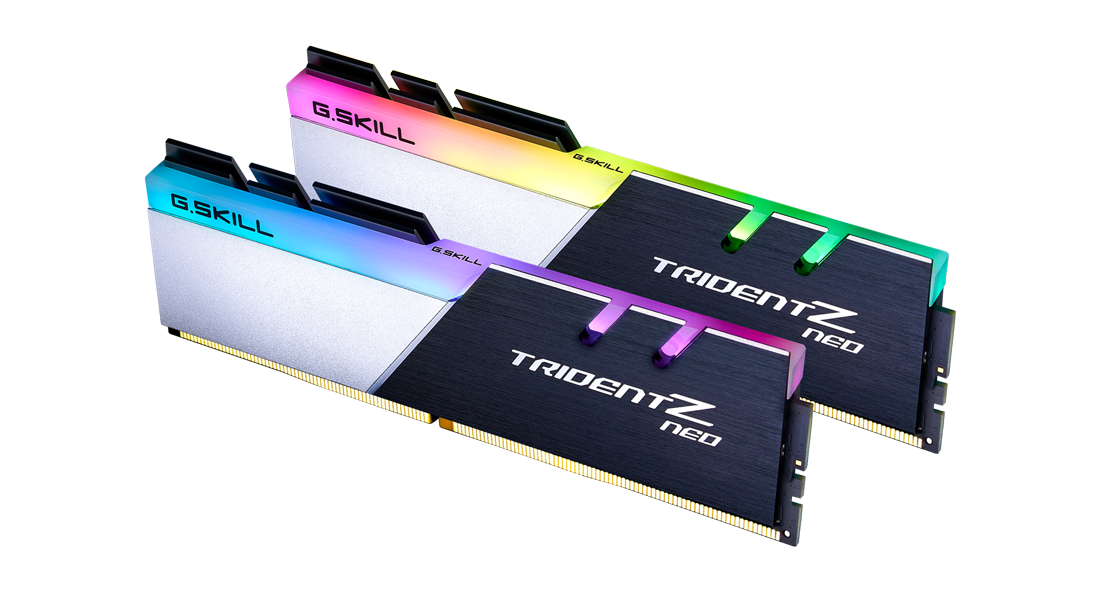
Usamos umAMD Ryzen 7 5800Xcomo o processador de sua escolha. O Ryzen 7 5800X foi emparelhado com uma placa-mãe de criação MSI Prestige X570, 32 GB (16 GB x2) de G.SKILL Trident Z Neo DDR4-3200 RAM (timings 16-19-19-39), e um Gigabyte Aorus NVMe Gen4 1 TB SSD

O Windows 10 21H1 com as últimas atualizações cumulativas (Build 19043.1081) foi instalado no Aorus NVMe Gen4 PCIe SSD enquanto dois SSDs MX500 SATA Crucial de 1 TB foram usados para executar benchmarks e jogos. Resizable BAR foi habilitado no UEFI, o que pode proporcionar uma ligeira melhoria de desempenho em títulos selecionados.

Cooling the Ryzen 7 5800X foi um refrigerador Corsair iCUE H115i Elite Capellix AIO. A construção foi alojada em uma caixa iCUE 4000X RGB Corsair com um Thermaltake Toughpower 850 W 80 Plus Gold como a fonte de energia de escolha. Todos os testes foram realizados com o estojo fechado para representar o uso típico.

Uma TV inteligente OnePlus Série U 55U1 rodando a 4K 60 Hz no Modo Jogo foi conectada ao RTX 3080 Ti via HDMI. A saída de cores foi ajustada para RGB total de 32 bits no painel de controle da NVIDIA e a escala da área de trabalho do Windows foi ajustada para 100%.

Gostaríamos de agradecer à AMD por facilitar a CPU Ryzen 7 5800X, Corsair para o resfriador iCUE Elite Capellix AIO e caixa iCUE 4000X, e OnePlus para a TV U série 55U1 4K

CPU AMD Ryzen 7 5800X
MSI Prestige X570 Criação da placa-mãe. (Fonte da imagem: MSI)
Gigabyte Aorus NVMe Gen4 SSD. (Fonte da imagem: Gigabyte)
G.SKILL Trident Z Neo DDR4-3600 RAM. (Fonte da imagem: G.SKILL)

Benchmarks sintéticos - No mesmo nível do RTX 3090

A NVIDIA RTX 3080 Ti apresenta uma imagem interessante quando se trata de resultados de referência - tanto no mundo sintético como no mundo real. Para todos os efeitos, estamos de fato olhando para um RTX 3090 aqui. O RTX 3080 Ti é apenas dois multiprocessadores de streaming (SMs) a menos do RTX 3090 e, em sua maioria, isto parece ter pouco ou nenhum impacto na maioria dos benchmarks. Vemos que o RTX 3080 Ti tem um desempenho melhor que o RTX 3090 em um punhado de testes, provavelmente porque o software e os drivers poderiam ter melhorado com o tempo.

No 3DMark, o RDNA 2 da AMD RX 6800 XT e o RX 6900 XT têm uma vantagem perceptível em todos os testes gráficos Fire Strike, embora o RTX 3080 Ti se ligue mais ou menos ao RTX 3090 em Time Spy Graphics. Em comparação com o RTX 3080, o RTX 3080 Ti pode ser em qualquer lugar entre 13% e 17% mais rápido em Fire Strike Gráficos, dependendo da resolução, sendo apenas 9% melhor em Time Spy Gráficos.

Como esperado, as placas NVIDIA facilmente aceitam seus rivais RDNA 2 no benchmark Port Royal ray-tracing com o RTX 3080 Ti no mesmo nível do RTX 3090 e cerca de 13% e 34% mais rápido que o RTX 3080 e Radeon RX 6900 XT, respectivamente.

A diferença de desempenho entre o RTX 3080 Ti e o RTX 3090 parece aumentar um pouco na Unigine, particularmente nas versões OpenGL dos benchmarks Heaven and Valley. A superposição mostra que o RTX 3090 e o RTX 3080 Ti estão ao mesmo nível um do outro. A única exceção aqui é vista no componente Baixo 720p do teste, onde o RTX 3080 Ti está quase 25% à frente do RTX 3090 provavelmente porque esta resolução é mais vinculada à CPU. Em geral, vemos que o RTX 3080 Ti é cerca de 14% mais rápido do que o RTX 3080 médio nas resoluções 1080p e acima.

Observe que desta vez utilizamos uma CPU diferente, a Ryzen 7 5800X, o que pode impactar alguns dos resultados de referência sintética.

3DMark
2560x1440 Time Spy Graphics
Average NVIDIA GeForce RTX 3090
  (18685 - 20433, n=17)
19266 Points +1%
NVIDIA GeForce RTX 3080 Ti Founders Edition
NVIDIA GeForce RTX 3080 Ti, R7 5800X
19081 Points
Nvidia GeForce RTX 3090 Founders Edition
NVIDIA GeForce RTX 3090, R9 5900X
18685 Points -2%
AMD Radeon RX 6900 XT
AMD Radeon RX 6900 XT, R9 5950X
18210 Points -5%
AMD Radeon RX 6800 XT
AMD Radeon RX 6800 XT, R9 5950X
17603 Points -8%
Average NVIDIA GeForce RTX 3080
  (17467 - 17604, n=2)
17536 Points -8%
ASUS GeForce RTX 3080 ROG STRIX OC GAMING
NVIDIA GeForce RTX 3080, R9 5900X
17467 Points -8%
AMD Ryzen 9 5900X
NVIDIA Titan RTX, R9 5900X
15283 Points -20%
Average NVIDIA Titan RTX
  (14216 - 15283, n=29)
14884 Points -22%
Average NVIDIA GeForce RTX 2080 Ti (Desktop)
  (13744 - 14645, n=4)
14283 Points -25%
KFA2 GeForce RTX 2080 Ti EX
NVIDIA GeForce RTX 2080 Ti (Desktop), R9 3900X
13744 Points -28%
MSI GeForce RTX 3070 Gaming X Trio
NVIDIA GeForce RTX 3070, R9 5900X
13579 Points -29%
Average NVIDIA GeForce RTX 3070
  (11043 - 13579, n=7)
12616 Points -34%
Nvidia GeForce RTX 2080 Super
NVIDIA GeForce RTX 2080 Super (Desktop), R7 2700X
11477 Points -40%
Average NVIDIA GeForce RTX 2080 Super (Desktop)
  (11313 - 11542, n=4)
11439 Points -40%
1920x1080 Fire Strike Graphics
AMD Radeon RX 6900 XT
AMD Radeon RX 6900 XT, R9 5950X
50587 Points +10%
AMD Radeon RX 6800 XT
AMD Radeon RX 6800 XT, R9 5950X
49735 Points +9%
Average NVIDIA GeForce RTX 3090
  (41298 - 49282, n=17)
46856 Points +2%
NVIDIA GeForce RTX 3080 Ti Founders Edition
NVIDIA GeForce RTX 3080 Ti, R7 5800X
45785 Points
Nvidia GeForce RTX 3090 Founders Edition
NVIDIA GeForce RTX 3090, R9 5900X
41298 Points -10%
ASUS GeForce RTX 3080 ROG STRIX OC GAMING
NVIDIA GeForce RTX 3080, R9 5900X
40910 Points -11%
Average NVIDIA GeForce RTX 3080
  (37604 - 40910, n=2)
39257 Points -14%
Average NVIDIA Titan RTX
  (33377 - 40910, n=30)
36062 Points -21%
AMD Ryzen 9 5900X
NVIDIA Titan RTX, R9 5900X
34722 Points -24%
Average NVIDIA GeForce RTX 2080 Ti (Desktop)
  (32081 - 35851, n=4)
34141 Points -25%
KFA2 GeForce RTX 2080 Ti EX
NVIDIA GeForce RTX 2080 Ti (Desktop), R9 3900X
32081 Points -30%
MSI GeForce RTX 3070 Gaming X Trio
NVIDIA GeForce RTX 3070, R9 5900X
31096 Points -32%
Average NVIDIA GeForce RTX 3070
  (20357 - 33270, n=7)
28949 Points -37%
Average NVIDIA GeForce RTX 2080 Super (Desktop)
  (26824 - 28968, n=4)
27647 Points -40%
Nvidia GeForce RTX 2080 Super
NVIDIA GeForce RTX 2080 Super (Desktop), R7 2700X
27075 Points -41%
3840x2160 Fire Strike Ultra Graphics
AMD Radeon RX 6900 XT
AMD Radeon RX 6900 XT, R9 5950X
13370 Points +11%
AMD Radeon RX 6800 XT
AMD Radeon RX 6800 XT, R9 5950X
12626 Points +5%
Average NVIDIA GeForce RTX 3090
  (11613 - 12587, n=14)
12289 Points +2%
NVIDIA GeForce RTX 3080 Ti Founders Edition
NVIDIA GeForce RTX 3080 Ti, R7 5800X
12074 Points
Nvidia GeForce RTX 3090 Founders Edition
NVIDIA GeForce RTX 3090, R9 5900X
11613 Points -4%
ASUS GeForce RTX 3080 ROG STRIX OC GAMING
NVIDIA GeForce RTX 3080, R9 5900X
10793 Points -11%
Average NVIDIA GeForce RTX 3080
  (10645 - 10793, n=2)
10719 Points -11%
Average NVIDIA Titan RTX
  (8461 - 10793, n=29)
8868 Points -27%
AMD Ryzen 9 5900X
NVIDIA Titan RTX, R9 5900X
8649 Points -28%
MSI GeForce RTX 3070 Gaming X Trio
NVIDIA GeForce RTX 3070, R9 5900X
8483 Points -30%
Average NVIDIA GeForce RTX 3070
  (8043 - 8483, n=5)
8250 Points -32%
Average NVIDIA GeForce RTX 2080 Ti (Desktop)
  (7925 - 8504, n=4)
8226 Points -32%
KFA2 GeForce RTX 2080 Ti EX
NVIDIA GeForce RTX 2080 Ti (Desktop), R9 3900X
7925 Points -34%
Average NVIDIA GeForce RTX 2080 Super (Desktop)
  (6500 - 6700, n=3)
6585 Points -45%
Nvidia GeForce RTX 2080 Super
NVIDIA GeForce RTX 2080 Super (Desktop), R7 2700X
6500 Points -46%
Fire Strike Extreme Graphics
AMD Radeon RX 6900 XT
AMD Radeon RX 6900 XT, R9 5950X
26650 Points +15%
AMD Radeon RX 6800 XT
AMD Radeon RX 6800 XT, R9 5950X
25015 Points +8%
Average NVIDIA GeForce RTX 3090
  (22075 - 24730, n=14)
23806 Points +3%
NVIDIA GeForce RTX 3080 Ti Founders Edition
NVIDIA GeForce RTX 3080 Ti, R7 5800X
23127 Points
Nvidia GeForce RTX 3090 Founders Edition
NVIDIA GeForce RTX 3090, R9 5900X
22075 Points -5%
ASUS GeForce RTX 3080 ROG STRIX OC GAMING
NVIDIA GeForce RTX 3080, R9 5900X
20861 Points -10%
Average NVIDIA GeForce RTX 3080
  (20007 - 20861, n=2)
20434 Points -12%
Average NVIDIA Titan RTX
  (16484 - 20861, n=29)
17649 Points -24%
AMD Ryzen 9 5900X
NVIDIA Titan RTX, R9 5900X
17176 Points -26%
Average NVIDIA GeForce RTX 2080 Ti (Desktop)
  (15603 - 16856, n=3)
16416 Points -29%
MSI GeForce RTX 3070 Gaming X Trio
NVIDIA GeForce RTX 3070, R9 5900X
16196 Points -30%
Average NVIDIA GeForce RTX 3070
  (15503 - 16276, n=5)
15859 Points -31%
KFA2 GeForce RTX 2080 Ti EX
NVIDIA GeForce RTX 2080 Ti (Desktop), R9 3900X
15603 Points -33%
Average NVIDIA GeForce RTX 2080 Super (Desktop)
  (12968 - 13551, n=3)
13172 Points -43%
Nvidia GeForce RTX 2080 Super
NVIDIA GeForce RTX 2080 Super (Desktop), R7 2700X
12968 Points -44%
2560x1440 Port Royal Graphics
NVIDIA GeForce RTX 3080 Ti Founders Edition
NVIDIA GeForce RTX 3080 Ti, R7 5800X
12798 Points
Average NVIDIA GeForce RTX 3090
  (12255 - 13075, n=6)
12767 Points 0%
Nvidia GeForce RTX 3090 Founders Edition
NVIDIA GeForce RTX 3090, R9 5900X
12384 Points -3%
Average NVIDIA GeForce RTX 3080
  (11238 - 11433, n=2)
11336 Points -11%
ASUS GeForce RTX 3080 ROG STRIX OC GAMING
NVIDIA GeForce RTX 3080, R9 5900X
11238 Points -12%
AMD Radeon RX 6900 XT
AMD Radeon RX 6900 XT, R9 5950X
9585 Points -25%
AMD Ryzen 9 5900X
NVIDIA Titan RTX, R9 5900X
9335 Points -27%
AMD Ryzen 9 5900X
NVIDIA Titan RTX, R9 5900X
9239 Points -28%
Average NVIDIA Titan RTX
  (8945 - 9528, n=24)
9303 Points -27%
Average NVIDIA GeForce RTX 2080 Ti (Desktop)
  (8537 - 9021, n=2)
8779 Points -31%
KFA2 GeForce RTX 2080 Ti EX
NVIDIA GeForce RTX 2080 Ti (Desktop), R9 3900X
8537 Points -33%
MSI GeForce RTX 3070 Gaming X Trio
NVIDIA GeForce RTX 3070, R9 5900X
8191 Points -36%
Average NVIDIA GeForce RTX 3070
  (7796 - 8191, n=5)
7941 Points -38%
Average NVIDIA GeForce RTX 2080 Super (Desktop)
  (6745 - 6947, n=3)
6873 Points -46%
Nvidia GeForce RTX 2080 Super
NVIDIA GeForce RTX 2080 Super (Desktop), R7 2700X
6745 Points -47%
Unigine Heaven 4.0
Extreme Preset DX11
Average NVIDIA GeForce RTX 3090
  (272 - 315, n=11)
300 fps +3%
NVIDIA GeForce RTX 3080 Ti Founders Edition
NVIDIA GeForce RTX 3080 Ti, R7 5800X
290.2 (50.9min - 582.7max) fps
Nvidia GeForce RTX 3090 Founders Edition
NVIDIA GeForce RTX 3090, R9 5900X
274 fps -6%
AMD Radeon RX 6900 XT
AMD Radeon RX 6900 XT, R9 5950X
259.5 (49.3min - 537.2max) fps -11%
AMD Radeon RX 6800 XT
AMD Radeon RX 6800 XT, R9 5950X
247.9 fps -15%
Average NVIDIA GeForce RTX 3080
  (233 - 253, n=2)
243 fps -16%
AMD Ryzen 9 5900X
NVIDIA Titan RTX, R9 5900X
237.1 fps -18%
Average NVIDIA Titan RTX
  (207 - 248, n=12)
236 fps -19%
ASUS GeForce RTX 3080 ROG STRIX OC GAMING
NVIDIA GeForce RTX 3080, R9 5900X
232.6 fps -20%
Average NVIDIA GeForce RTX 2080 Ti (Desktop)
  (215 - 226, n=3)
222 fps -24%
KFA2 GeForce RTX 2080 Ti EX
NVIDIA GeForce RTX 2080 Ti (Desktop), R9 3900X
215.2 fps -26%
Average NVIDIA GeForce RTX 3070
  (196.4 - 214, n=5)
206 fps -29%
MSI GeForce RTX 3070 Gaming X Trio
NVIDIA GeForce RTX 3070, R9 5900X
202.5 fps -30%
Nvidia GeForce RTX 2080 Super
NVIDIA GeForce RTX 2080 Super (Desktop), R7 2700X
175.2 fps -40%
Average NVIDIA GeForce RTX 2080 Super (Desktop)
  ()
175.2 fps -40%
Extreme Preset OpenGL
Average NVIDIA GeForce RTX 3090
  (188.2 - 284, n=10)
270 fps +2%
NVIDIA GeForce RTX 3080 Ti Founders Edition
NVIDIA GeForce RTX 3080 Ti, R7 5800X
263.6 (12.2min - 543.3max) fps
Average NVIDIA GeForce RTX 3080
  (232 - 243, n=2)
238 fps -10%
ASUS GeForce RTX 3080 ROG STRIX OC GAMING
NVIDIA GeForce RTX 3080, R9 5900X
232.4 fps -12%
Average NVIDIA Titan RTX
  (203 - 299, n=12)
223 fps -15%
AMD Ryzen 9 5900X
NVIDIA Titan RTX, R9 5900X
215.1 fps -18%
AMD Radeon RX 6900 XT
AMD Radeon RX 6900 XT, R9 5950X
206.5 (8.2min - 453.7max) fps -22%
Average NVIDIA GeForce RTX 2080 Ti (Desktop)
  (202 - 213, n=3)
206 fps -22%
KFA2 GeForce RTX 2080 Ti EX
NVIDIA GeForce RTX 2080 Ti (Desktop), R9 3900X
204.4 fps -22%
AMD Radeon RX 6800 XT
AMD Radeon RX 6800 XT, R9 5950X
204 fps -23%
MSI GeForce RTX 3070 Gaming X Trio
NVIDIA GeForce RTX 3070, R9 5900X
196.1 fps -26%
Average NVIDIA GeForce RTX 3070
  (187.5 - 196.1, n=4)
192.5 fps -27%
Nvidia GeForce RTX 3090 Founders Edition
NVIDIA GeForce RTX 3090, R9 5900X
188.2 fps -29%
Nvidia GeForce RTX 2080 Super
NVIDIA GeForce RTX 2080 Super (Desktop), R7 2700X
167.5 fps -36%
Average NVIDIA GeForce RTX 2080 Super (Desktop)
  ()
167.5 fps -36%
Unigine Valley 1.0
1920x1080 Extreme HD DirectX AA:x8
Average NVIDIA GeForce RTX 3090
  (184.2 - 247, n=11)
225 fps +9%
NVIDIA GeForce RTX 3080 Ti Founders Edition
NVIDIA GeForce RTX 3080 Ti, R7 5800X
206 (51.6min - 350.7max) fps
AMD Radeon RX 6900 XT
AMD Radeon RX 6900 XT, R9 5950X
200.8 (53.4min - 359.1max) fps -3%
Nvidia GeForce RTX 3090 Founders Edition
NVIDIA GeForce RTX 3090, R9 5900X
192.4 fps -7%
AMD Radeon RX 6800 XT
AMD Radeon RX 6800 XT, R9 5950X
190.6 fps -7%
AMD Ryzen 9 5900X
NVIDIA Titan RTX, R9 5900X
180.1 fps -13%
Average NVIDIA GeForce RTX 3080
  (176.2 - 181.8, n=2)
179 fps -13%
ASUS GeForce RTX 3080 ROG STRIX OC GAMING
NVIDIA GeForce RTX 3080, R9 5900X
176.2 fps -14%
Average NVIDIA Titan RTX
  (135 - 191.4, n=12)
173.3 fps -16%
Average NVIDIA GeForce RTX 2080 Ti (Desktop)
  (159.4 - 164.1, n=3)
162.2 fps -21%
Average NVIDIA GeForce RTX 3070
  (155.1 - 168.5, n=5)
161.2 fps -22%
KFA2 GeForce RTX 2080 Ti EX
NVIDIA GeForce RTX 2080 Ti (Desktop), R9 3900X
159.4 fps -23%
MSI GeForce RTX 3070 Gaming X Trio
NVIDIA GeForce RTX 3070, R9 5900X
155.1 fps -25%
Nvidia GeForce RTX 2080 Super
NVIDIA GeForce RTX 2080 Super (Desktop), R7 2700X
120.2 fps -42%
Average NVIDIA GeForce RTX 2080 Super (Desktop)
  ()
120.2 fps -42%
1920x1080 Extreme HD Preset OpenGL AA:x8
Average NVIDIA GeForce RTX 3090
  (158.8 - 226, n=10)
203 fps +4%
NVIDIA GeForce RTX 3080 Ti Founders Edition
NVIDIA GeForce RTX 3080 Ti, R7 5800X
195.1 (46.1min - 342.7max) fps
Average NVIDIA GeForce RTX 3080
  (163.8 - 172, n=2)
167.9 fps -14%
AMD Radeon RX 6900 XT
AMD Radeon RX 6900 XT, R9 5950X
167.4 (56.7min - 375.7max) fps -14%
ASUS GeForce RTX 3080 ROG STRIX OC GAMING
NVIDIA GeForce RTX 3080, R9 5900X
163.8 fps -16%
Nvidia GeForce RTX 3090 Founders Edition
NVIDIA GeForce RTX 3090, R9 5900X
158.8 fps -19%
AMD Ryzen 9 5900X
NVIDIA Titan RTX, R9 5900X
158.5 fps -19%
AMD Radeon RX 6800 XT
AMD Radeon RX 6800 XT, R9 5950X
158.2 fps -19%
Average NVIDIA Titan RTX
  (139.2 - 181.2, n=12)
158.1 fps -19%
Average NVIDIA GeForce RTX 2080 Ti (Desktop)
  (144.5 - 147.8, n=3)
145.8 fps -25%
KFA2 GeForce RTX 2080 Ti EX
NVIDIA GeForce RTX 2080 Ti (Desktop), R9 3900X
145.1 fps -26%
MSI GeForce RTX 3070 Gaming X Trio
NVIDIA GeForce RTX 3070, R9 5900X
142.9 fps -27%
Average NVIDIA GeForce RTX 3070
  (140.2 - 144.9, n=4)
142.7 fps -27%
Nvidia GeForce RTX 2080 Super
NVIDIA GeForce RTX 2080 Super (Desktop), R7 2700X
114.5 fps -41%
Average NVIDIA GeForce RTX 2080 Super (Desktop)
  ()
114.5 fps -41%
Unigine Superposition
1280x720 720p Low
Average NVIDIA GeForce RTX 3090
  (33329 - 54879, n=10)
46049 Points +7%
NVIDIA GeForce RTX 3080 Ti Founders Edition
NVIDIA GeForce RTX 3080 Ti, R7 5800X
43163 Points
AMD Ryzen 9 5900X
NVIDIA Titan RTX, R9 5900X
40994 Points -5%
Average NVIDIA Titan RTX
  (25622 - 50876, n=9)
40891 Points -5%
AMD Radeon RX 6900 XT
AMD Radeon RX 6900 XT, R9 5950X
37023 Points -14%
AMD Radeon RX 6800 XT
AMD Radeon RX 6800 XT, R9 5950X
36452 Points -16%
Nvidia GeForce RTX 3090 Founders Edition
NVIDIA GeForce RTX 3090, R9 5900X
34649 Points -20%
Average NVIDIA GeForce RTX 3070
  (27330 - 40007, n=5)
34576 Points -20%
MSI GeForce RTX 3070 Gaming X Trio
NVIDIA GeForce RTX 3070, R9 5900X
31666 Points -27%
Average NVIDIA GeForce RTX 3080
  (30851 - 32183, n=2)
31517 Points -27%
ASUS GeForce RTX 3080 ROG STRIX OC GAMING
NVIDIA GeForce RTX 3080, R9 5900X
30851 Points -29%
Average NVIDIA GeForce RTX 2080 Super (Desktop)
  ()
26907 Points -38%
1920x1080 1080p High
Average NVIDIA GeForce RTX 3090
  (23626 - 27207, n=11)
26018 Points +4%
AMD Radeon RX 6900 XT
AMD Radeon RX 6900 XT, R9 5950X
25029 Points 0%
NVIDIA GeForce RTX 3080 Ti Founders Edition
NVIDIA GeForce RTX 3080 Ti, R7 5800X
24997 Points
Nvidia GeForce RTX 3090 Founders Edition
NVIDIA GeForce RTX 3090, R9 5900X
23853 Points -5%
AMD Radeon RX 6800 XT
AMD Radeon RX 6800 XT, R9 5950X
22265 Points -11%
Average NVIDIA GeForce RTX 3080
  (21333 - 21912, n=2)
21623 Points -13%
ASUS GeForce RTX 3080 ROG STRIX OC GAMING
NVIDIA GeForce RTX 3080, R9 5900X
21333 Points -15%
AMD Ryzen 9 5900X
NVIDIA Titan RTX, R9 5900X
20315 Points -19%
Average NVIDIA Titan RTX
  (19460 - 20658, n=9)
20301 Points -19%
MSI GeForce RTX 3070 Gaming X Trio
NVIDIA GeForce RTX 3070, R9 5900X
17346 Points -31%
Average NVIDIA GeForce RTX 3070
  (17054 - 17491, n=5)
17312 Points -31%
Average NVIDIA GeForce RTX 2080 Super (Desktop)
  ()
15558 Points -38%
1920x1080 1080p Extreme
Average NVIDIA GeForce RTX 3090
  (11806 - 12694, n=11)
12209 Points +1%
NVIDIA GeForce RTX 3080 Ti Founders Edition
NVIDIA GeForce RTX 3080 Ti, R7 5800X
12038 Points
Nvidia GeForce RTX 3090 Founders Edition
NVIDIA GeForce RTX 3090, R9 5900X
11806 Points -2%
Average NVIDIA GeForce RTX 3080
  (10572 - 10822, n=2)
10697 Points -11%
AMD Radeon RX 6900 XT
AMD Radeon RX 6900 XT, R9 5950X
10683 Points -11%
ASUS GeForce RTX 3080 ROG STRIX OC GAMING
NVIDIA GeForce RTX 3080, R9 5900X
10572 Points -12%
AMD Radeon RX 6800 XT
AMD Radeon RX 6800 XT, R9 5950X
10046 Points -17%
AMD Ryzen 9 5900X
NVIDIA Titan RTX, R9 5900X
9056 Points -25%
Average NVIDIA Titan RTX
  (8916 - 9285, n=9)
9051 Points -25%
MSI GeForce RTX 3070 Gaming X Trio
NVIDIA GeForce RTX 3070, R9 5900X
8507 Points -29%
Average NVIDIA GeForce RTX 3070
  (8276 - 8507, n=5)
8354 Points -31%
Average NVIDIA GeForce RTX 2080 Super (Desktop)
  ()
7080 Points -41%
3840x2160 4k Optimized
Average NVIDIA GeForce RTX 3090
  (15794 - 16868, n=11)
16326 Points +1%
NVIDIA GeForce RTX 3080 Ti Founders Edition
NVIDIA GeForce RTX 3080 Ti, R7 5800X
16153 Points
Nvidia GeForce RTX 3090 Founders Edition
NVIDIA GeForce RTX 3090, R9 5900X
15794 Points -2%
AMD Radeon RX 6900 XT
AMD Radeon RX 6900 XT, R9 5950X
14955 Points -7%
Average NVIDIA GeForce RTX 3080
  (13984 - 14243, n=2)
14114 Points -13%
ASUS GeForce RTX 3080 ROG STRIX OC GAMING
NVIDIA GeForce RTX 3080, R9 5900X
13984 Points -13%
AMD Radeon RX 6800 XT
AMD Radeon RX 6800 XT, R9 5950X
13471 Points -17%
Average NVIDIA Titan RTX
  (11937 - 12644, n=9)
12203 Points -24%
AMD Ryzen 9 5900X
NVIDIA Titan RTX, R9 5900X
12186 Points -25%
MSI GeForce RTX 3070 Gaming X Trio
NVIDIA GeForce RTX 3070, R9 5900X
10755 Points -33%
Average NVIDIA GeForce RTX 3070
  (10544 - 10755, n=5)
10667 Points -34%
Average NVIDIA GeForce RTX 2080 Super (Desktop)
  ()
9338 Points -42%
7680x4320 8k Optimized
Average NVIDIA GeForce RTX 3090
  (6969 - 7521, n=11)
7144 Points +1%
NVIDIA GeForce RTX 3080 Ti Founders Edition
NVIDIA GeForce RTX 3080 Ti, R7 5800X
7095 Points
Nvidia GeForce RTX 3090 Founders Edition
NVIDIA GeForce RTX 3090, R9 5900X
7002 Points -1%
Average NVIDIA GeForce RTX 3080
  (6243 - 6346, n=2)
6295 Points -11%
ASUS GeForce RTX 3080 ROG STRIX OC GAMING
NVIDIA GeForce RTX 3080, R9 5900X
6243 Points -12%
AMD Radeon RX 6900 XT
AMD Radeon RX 6900 XT, R9 5950X
5764 Points -19%
AMD Ryzen 9 5900X
NVIDIA Titan RTX, R9 5900X
5402 Points -24%
Average NVIDIA Titan RTX
  (5255 - 5571, n=9)
5393 Points -24%
AMD Radeon RX 6800 XT
AMD Radeon RX 6800 XT, R9 5950X
5256 Points -26%
MSI GeForce RTX 3070 Gaming X Trio
NVIDIA GeForce RTX 3070, R9 5900X
4695 Points -34%
Average NVIDIA GeForce RTX 3070
  (4587 - 4695, n=5)
4624 Points -35%
Average NVIDIA GeForce RTX 2080 Super (Desktop)
  ()
3989 Points -44%
3DMark 11 Performance
41396 pontos
3DMark Fire Strike Score
32491 pontos
3DMark Fire Strike Extreme Score
21605 pontos
3DMark Time Spy Score
17433 pontos
Ajuda

Cálculos de referência - Bons ganhos sobre o RTX 3080 e o RX 6900 XT

O RTX 3080 Ti tem apenas uma margem muito pequena sobre a média RTX 3090 na ComputeMark em geral, sendo 16% mais rápido que a média RTX 3080 e o RX 6900 XT. Uma tendência semelhante é observada também no teste da GPU LuxMark Room. No entanto, a AMD tem uma vantagem muito significativa sobre todas as ofertas NVIDIA no teste da GPU LuxMark Sala. Enquanto o RTX 3080 Ti é cerca de 15% mais rápido na GPU Sala em comparação com a média RTX 3080, ele está 53% atrás do Radeon RX 6900 XT

Os testes de computação Geekbench mostram que o RTX 3080 Ti tem boas pistas em geral. Ele se liga ao RTX 3090 no OpenCL, mas é interessante notar que é 27% mais rápido na versão Vulkan do teste.

ComputeMark v2.1
1024x600 Normal, QJuliaRayTrace
Average NVIDIA GeForce RTX 3090
  (16403 - 18223, n=10)
17454 Points +2%
NVIDIA GeForce RTX 3080 Ti Founders Edition
NVIDIA GeForce RTX 3080 Ti, R7 5800X
17050 Points
Nvidia GeForce RTX 3090 Founders Edition
NVIDIA GeForce RTX 3090, R9 5900X
16543 Points -3%
Average NVIDIA GeForce RTX 3080
  (14718 - 15508, n=2)
15113 Points -11%
ASUS GeForce RTX 3080 ROG STRIX OC GAMING
NVIDIA GeForce RTX 3080, R9 5900X
14718 Points -14%
AMD Radeon RX 6900 XT
AMD Radeon RX 6900 XT, R9 5950X
12255 Points -28%
MSI GeForce RTX 3070 Gaming X Trio
NVIDIA GeForce RTX 3070, R9 5900X
11816 Points -31%
Average NVIDIA GeForce RTX 3070
  (11510 - 11816, n=3)
11665 Points -32%
AMD Radeon RX 6800 XT
AMD Radeon RX 6800 XT, R9 5950X
11304 Points -34%
Average NVIDIA Titan RTX
  (9418 - 10129, n=3)
9748 Points -43%
Average NVIDIA GeForce RTX 2080 Ti (Desktop)
  (9104 - 9690, n=3)
9492 Points -44%
KFA2 GeForce RTX 2080 Ti EX
NVIDIA GeForce RTX 2080 Ti (Desktop), R9 3900X
9104 Points -47%
Nvidia GeForce RTX 2080 Super
NVIDIA GeForce RTX 2080 Super (Desktop), R7 2700X
7258 Points -57%
1024x600 Normal, Mandel Scalar
Average NVIDIA GeForce RTX 3090
  (10650 - 11564, n=10)
11162 Points +1%
NVIDIA GeForce RTX 3080 Ti Founders Edition
NVIDIA GeForce RTX 3080 Ti, R7 5800X
11049 Points
AMD Radeon RX 6900 XT
AMD Radeon RX 6900 XT, R9 5950X
10834 Points -2%
Nvidia GeForce RTX 3090 Founders Edition
NVIDIA GeForce RTX 3090, R9 5900X
10650 Points -4%
AMD Radeon RX 6800 XT
AMD Radeon RX 6800 XT, R9 5950X
10018 Points -9%
Average NVIDIA GeForce RTX 3080
  (9554 - 9938, n=2)
9746 Points -12%
ASUS GeForce RTX 3080 ROG STRIX OC GAMING
NVIDIA GeForce RTX 3080, R9 5900X
9554 Points -14%
MSI GeForce RTX 3070 Gaming X Trio
NVIDIA GeForce RTX 3070, R9 5900X
7314 Points -34%
Average NVIDIA GeForce RTX 3070
  (7042 - 7314, n=3)
7169 Points -35%
Average NVIDIA Titan RTX
  (5977 - 6406, n=3)
6184 Points -44%
Average NVIDIA GeForce RTX 2080 Ti (Desktop)
  (5679 - 6226, n=3)
6010 Points -46%
KFA2 GeForce RTX 2080 Ti EX
NVIDIA GeForce RTX 2080 Ti (Desktop), R9 3900X
5679 Points -49%
Nvidia GeForce RTX 2080 Super
NVIDIA GeForce RTX 2080 Super (Desktop), R7 2700X
4525 Points -59%
1024x600 Normal, Mandel Vector
NVIDIA GeForce RTX 3080 Ti Founders Edition
NVIDIA GeForce RTX 3080 Ti, R7 5800X
9513 Points
Average NVIDIA GeForce RTX 3090
  (8038 - 10097, n=10)
9467 Points 0%
Nvidia GeForce RTX 3090 Founders Edition
NVIDIA GeForce RTX 3090, R9 5900X
9236 Points -3%
AMD Radeon RX 6900 XT
AMD Radeon RX 6900 XT, R9 5950X
8690 Points -9%
AMD Radeon RX 6800 XT
AMD Radeon RX 6800 XT, R9 5950X
8399 Points -12%
Average NVIDIA GeForce RTX 3080
  (7148 - 7540, n=2)
7344 Points -23%
ASUS GeForce RTX 3080 ROG STRIX OC GAMING
NVIDIA GeForce RTX 3080, R9 5900X
7148 Points -25%
Average NVIDIA GeForce RTX 3070
  (5364 - 6266, n=3)
5707 Points -40%
MSI GeForce RTX 3070 Gaming X Trio
NVIDIA GeForce RTX 3070, R9 5900X
5490 Points -42%
Average NVIDIA Titan RTX
  (4944 - 5440, n=3)
5158 Points -46%
Average NVIDIA GeForce RTX 2080 Ti (Desktop)
  (4695 - 5092, n=3)
4941 Points -48%
KFA2 GeForce RTX 2080 Ti EX
NVIDIA GeForce RTX 2080 Ti (Desktop), R9 3900X
4695 Points -51%
Nvidia GeForce RTX 2080 Super
NVIDIA GeForce RTX 2080 Super (Desktop), R7 2700X
3835 Points -60%
1024x600 Normal, Fluid 2DTexArr
Average NVIDIA GeForce RTX 3090
  (4344 - 4608, n=10)
4492 Points +1%
NVIDIA GeForce RTX 3080 Ti Founders Edition
NVIDIA GeForce RTX 3080 Ti, R7 5800X
4453 Points
Nvidia GeForce RTX 3090 Founders Edition
NVIDIA GeForce RTX 3090, R9 5900X
4344 Points -2%
Average NVIDIA GeForce RTX 3080
  (4087 - 4159, n=2)
4123 Points -7%
ASUS GeForce RTX 3080 ROG STRIX OC GAMING
NVIDIA GeForce RTX 3080, R9 5900X
4087 Points -8%
AMD Radeon RX 6800 XT
AMD Radeon RX 6800 XT, R9 5950X
3947 Points -11%
AMD Radeon RX 6900 XT
AMD Radeon RX 6900 XT, R9 5950X
3924 Points -12%
Average NVIDIA Titan RTX
  (3691 - 3828, n=3)
3757 Points -16%
Average NVIDIA GeForce RTX 2080 Ti (Desktop)
  (3444 - 3539, n=3)
3499 Points -21%
KFA2 GeForce RTX 2080 Ti EX
NVIDIA GeForce RTX 2080 Ti (Desktop), R9 3900X
3444 Points -23%
MSI GeForce RTX 3070 Gaming X Trio
NVIDIA GeForce RTX 3070, R9 5900X
2704 Points -39%
Average NVIDIA GeForce RTX 3070
  (2666 - 2706, n=3)
2692 Points -40%
Nvidia GeForce RTX 2080 Super
NVIDIA GeForce RTX 2080 Super (Desktop), R7 2700X
2655 Points -40%
1024x600 Normal, Fluid 3DTex
Average NVIDIA GeForce RTX 3090
  (5246 - 5520, n=10)
5448 Points +3%
NVIDIA GeForce RTX 3080 Ti Founders Edition
NVIDIA GeForce RTX 3080 Ti, R7 5800X
5312 Points
Nvidia GeForce RTX 3090 Founders Edition
NVIDIA GeForce RTX 3090, R9 5900X
5246 Points -1%
AMD Radeon RX 6800 XT
AMD Radeon RX 6800 XT, R9 5950X
5154 Points -3%
AMD Radeon RX 6900 XT
AMD Radeon RX 6900 XT, R9 5950X
5154 Points -3%
Average NVIDIA GeForce RTX 3080
  (4417 - 4450, n=2)
4434 Points -17%
ASUS GeForce RTX 3080 ROG STRIX OC GAMING
NVIDIA GeForce RTX 3080, R9 5900X
4417 Points -17%
Average NVIDIA Titan RTX
  (3877 - 4027, n=3)
3955 Points -26%
Average NVIDIA GeForce RTX 2080 Ti (Desktop)
  (3589 - 3653, n=3)
3625 Points -32%
KFA2 GeForce RTX 2080 Ti EX
NVIDIA GeForce RTX 2080 Ti (Desktop), R9 3900X
3589 Points -32%
MSI GeForce RTX 3070 Gaming X Trio
NVIDIA GeForce RTX 3070, R9 5900X
2776 Points -48%
Average NVIDIA GeForce RTX 3070
  (2749 - 2791, n=3)
2772 Points -48%
Nvidia GeForce RTX 2080 Super
NVIDIA GeForce RTX 2080 Super (Desktop), R7 2700X
2736 Points -48%
1024x600 Normal, Score
Average NVIDIA GeForce RTX 3090
  (44948 - 49118, n=9)
47804 Points +1%
NVIDIA GeForce RTX 3080 Ti Founders Edition
NVIDIA GeForce RTX 3080 Ti, R7 5800X
47377 Points
Nvidia GeForce RTX 3090 Founders Edition
NVIDIA GeForce RTX 3090, R9 5900X
46018 Points -3%
AMD Radeon RX 6900 XT
AMD Radeon RX 6900 XT, R9 5950X
40857 Points -14%
Average NVIDIA GeForce RTX 3080
  (39924 - 41594, n=2)
40759 Points -14%
ASUS GeForce RTX 3080 ROG STRIX OC GAMING
NVIDIA GeForce RTX 3080, R9 5900X
39924 Points -16%
AMD Radeon RX 6800 XT
AMD Radeon RX 6800 XT, R9 5950X
38823 Points -18%
MSI GeForce RTX 3070 Gaming X Trio
NVIDIA GeForce RTX 3070, R9 5900X
30100 Points -36%
Average NVIDIA GeForce RTX 3070
  (29330 - 30581, n=3)
30004 Points -37%
Average NVIDIA Titan RTX
  (27907 - 29830, n=3)
28802 Points -39%
Average NVIDIA GeForce RTX 2080 Ti (Desktop)
  (26510 - 28145, n=3)
27567 Points -42%
KFA2 GeForce RTX 2080 Ti EX
NVIDIA GeForce RTX 2080 Ti (Desktop), R9 3900X
26510 Points -44%
Nvidia GeForce RTX 2080 Super
NVIDIA GeForce RTX 2080 Super (Desktop), R7 2700X
21009 Points -56%
LuxMark v2.0 64Bit
Room GPUs-only
Average NVIDIA GeForce RTX 3090
  (5727 - 5985, n=9)
5893 Samples/s +2%
Nvidia GeForce RTX 3090 Founders Edition
NVIDIA GeForce RTX 3090, R9 5900X
5808 Samples/s +1%
NVIDIA GeForce RTX 3080 Ti Founders Edition
NVIDIA GeForce RTX 3080 Ti, R7 5800X
5772 Samples/s
Average NVIDIA GeForce RTX 3080
  (5112 - 5198, n=2)
5155 Samples/s -11%
ASUS GeForce RTX 3080 ROG STRIX OC GAMING
NVIDIA GeForce RTX 3080, R9 5900X
5112 Samples/s -11%
AMD Radeon RX 6900 XT
AMD Radeon RX 6900 XT, R9 5950X
5084 Samples/s -12%
AMD Radeon RX 6800 XT
AMD Radeon RX 6800 XT, R9 5950X
5057 Samples/s -12%
Average NVIDIA Titan RTX
  (4643 - 4703, n=2)
4673 Samples/s -19%
Average NVIDIA GeForce RTX 2080 Ti (Desktop)
  (4425 - 4494, n=3)
4449 Samples/s -23%
KFA2 GeForce RTX 2080 Ti EX
NVIDIA GeForce RTX 2080 Ti (Desktop), R9 3900X
4429 Samples/s -23%
MSI GeForce RTX 3070 Gaming X Trio
NVIDIA GeForce RTX 3070, R9 5900X
4293 Samples/s -26%
Average NVIDIA GeForce RTX 3070
  (2187 - 4293, n=3)
3588 Samples/s -38%
Nvidia GeForce RTX 2080 Super
NVIDIA GeForce RTX 2080 Super (Desktop), R7 2700X
3430 Samples/s -41%
Sala GPUs-only
AMD Radeon RX 6900 XT
AMD Radeon RX 6900 XT, R9 5950X
31400 Samples/s +111%
AMD Radeon RX 6800 XT
AMD Radeon RX 6800 XT, R9 5950X
28023 Samples/s +88%
Average NVIDIA GeForce RTX 3090
  (14590 - 15242, n=9)
14945 Samples/s 0%
NVIDIA GeForce RTX 3080 Ti Founders Edition
NVIDIA GeForce RTX 3080 Ti, R7 5800X
14871 Samples/s
Nvidia GeForce RTX 3090 Founders Edition
NVIDIA GeForce RTX 3090, R9 5900X
14670 Samples/s -1%
Average NVIDIA GeForce RTX 3080
  (12797 - 12980, n=2)
12889 Samples/s -13%
ASUS GeForce RTX 3080 ROG STRIX OC GAMING
NVIDIA GeForce RTX 3080, R9 5900X
12797 Samples/s -14%
Average NVIDIA Titan RTX
  (10799 - 10996, n=2)
10898 Samples/s -27%
Average NVIDIA GeForce RTX 2080 Ti (Desktop)
  (9999 - 10291, n=3)
10156 Samples/s -32%
MSI GeForce RTX 3070 Gaming X Trio
NVIDIA GeForce RTX 3070, R9 5900X
10115 Samples/s -32%
Average NVIDIA GeForce RTX 3070
  (10096 - 10115, n=3)
10107 Samples/s -32%
KFA2 GeForce RTX 2080 Ti EX
NVIDIA GeForce RTX 2080 Ti (Desktop), R9 3900X
9999 Samples/s -33%
Nvidia GeForce RTX 2080 Super
NVIDIA GeForce RTX 2080 Super (Desktop), R7 2700X
7878 Samples/s -47%
Geekbench 5.5
OpenCL Score
Average NVIDIA GeForce RTX 3090
  (199930 - 224611, n=19)
214008 Points 0%
NVIDIA GeForce RTX 3080 Ti Founders Edition
NVIDIA GeForce RTX 3080 Ti, R7 5800X
213283 Points
Nvidia GeForce RTX 3090 Founders Edition
NVIDIA GeForce RTX 3090, R9 5900X
199930 Points -6%
ASUS GeForce RTX 3080 ROG STRIX OC GAMING
NVIDIA GeForce RTX 3080, R9 5900X
192091 Points -10%
Average NVIDIA GeForce RTX 3080
  (164477 - 192091, n=2)
178284 Points -16%
AMD Radeon RX 6900 XT
AMD Radeon RX 6900 XT, R9 5950X
172661 Points -19%
AMD Radeon RX 6800 XT
AMD Radeon RX 6800 XT, R9 5950X
159072 Points -25%
AMD Ryzen 9 5900X
NVIDIA Titan RTX, R9 5900X
149070 Points -30%
Average NVIDIA Titan RTX
  (132850 - 153940, n=20)
140450 Points -34%
Average NVIDIA GeForce RTX 3070
  (134961 - 138625, n=4)
136574 Points -36%
MSI GeForce RTX 3070 Gaming X Trio
NVIDIA GeForce RTX 3070, R9 5900X
136521 Points -36%
Vulkan Score
NVIDIA GeForce RTX 3080 Ti Founders Edition
NVIDIA GeForce RTX 3080 Ti, R7 5800X
187800 Points
Nvidia GeForce RTX 3090 Founders Edition
NVIDIA GeForce RTX 3090, R9 5900X
147831 Points -21%
Average NVIDIA GeForce RTX 3090
  (62516 - 168974, n=19)
128422 Points -32%
Average NVIDIA Titan RTX
  (70085 - 138172, n=20)
92754 Points -51%
AMD Radeon RX 6900 XT
AMD Radeon RX 6900 XT, R9 5950X
88587 Points -53%
AMD Radeon RX 6800 XT
AMD Radeon RX 6800 XT, R9 5950X
81098 Points -57%
Average NVIDIA GeForce RTX 3080
  (76596 - 83486, n=2)
80041 Points -57%
AMD Ryzen 9 5900X
NVIDIA Titan RTX, R9 5900X
76596 Points -59%
ASUS GeForce RTX 3080 ROG STRIX OC GAMING
NVIDIA GeForce RTX 3080, R9 5900X
76596 Points -59%
Average NVIDIA GeForce RTX 3070
  (27460 - 107958, n=4)
71908 Points -62%
MSI GeForce RTX 3070 Gaming X Trio
NVIDIA GeForce RTX 3070, R9 5900X
62516 Points -67%

Benchmarks de jogo - RTX 3080 Ti marca um home run em 4K Ultra

A NVIDIA lança o RTX 3080 Ti como a principal GPU de jogos, e não decepciona. Um bom número de títulos pode ser jogado no máximo a 4K, próximo à marca de 100 fps. Apenas alguns jogos como Cyberpunk 2077 (DLSS desligado), Guerra Total: Três Reinos, e Watch Dogs: Legion (DLSS desligado) lutam para alcançar o ponto doce de 60 fps em 4K Ultra. Aqueles desejosos de aproveitar ao máximo suas exibições de alta taxa de renovação se beneficiam com a redução da resolução para 1440p.

Na sua maioria, o RTX 3080 Ti FE está bem dentro da margem de erro do desempenho de jogo do RTX 3090. A leve redução nos núcleos CUDA e a redução pela metade da memória do RTX 3090 parece ter um efeito negligenciável nos títulos atuais. Istoé uma coisa boa, pois se traduz em uma economia direta de US$ 300 (no MSRP!) do RTX 3090 se seu caso de uso primário for 4K Ultra 60 fps+ jogos.

Achamos o RTX 3080 Ti entre 11% e 22% mais rápido do que o Radeon RX 6900 XT em nosso conjunto de teste de jogo. Dito isto, as cartas Radeon RDNA 2 tinham uma vantagem em Assassin's Creed Valhalla(+11%, 6900 XT) e Hitman 3(+7%, 6900 XT).

Testamos o desempenho de traçado de raio em títulos como Call of Duty: Black Ops Cold War, Metro Exodus, Resident Evil Village, e Control com DLSS desligado e, muito interessante, o RTX 3080 Ti parecia oferecer benefícios perceptíveis até mesmo sobre o RTX 3090 com RT On. Em comparação com o RTX 3080, estamos olhando para qualquer lugar entre 12% e 21% de aumento no desempenho de RT, dependendo da resolução

A NVIDIA parece ter feito um bom trabalho com as térmicas, como é evidente pelo desempenho bastante consistente próximo à marca de 174 fps observada em O teste de estresse Witcher 3

em 1080p Ultra. No entanto, descobrimos que a placa pode permitir-se atingir um fps mais alto, embora por um breve período de cerca de cinco minutos antes de cair de volta ao valor original. Isto provavelmente pode ser devido a um aumento oportunista do relógio neste ponto durante o teste de estresse.

163173183Tooltip
NVIDIA GeForce RTX 3080 Ti Founders Edition NVIDIA GeForce RTX 3080 Ti, R7 5800X: Ø169.6 (163-187)
The Witcher 3
3840x2160 High Graphics & Postprocessing (Nvidia HairWorks Off)
Average NVIDIA GeForce RTX 3090
  (128 - 160.2, n=12)
151.5 fps +2%
NVIDIA GeForce RTX 3080 Ti Founders Edition
NVIDIA GeForce RTX 3080 Ti, R7 5800X
149 (132min, 132.59P1 - 161max) fps
Nvidia GeForce RTX 3090 Founders Edition
NVIDIA GeForce RTX 3090, R9 5900X
148 fps -1%
AMD Radeon RX 6900 XT
AMD Radeon RX 6900 XT, R9 5950X
122 (105min, 105P1 - 134max) fps -18%
ASUS GeForce RTX 3080 ROG STRIX OC GAMING
NVIDIA GeForce RTX 3080, R9 5900X
115 (107min - 124max) fps -23%
Average NVIDIA GeForce RTX 3080
  (114 - 115, n=2)
114.5 fps -23%
AMD Radeon RX 6800 XT
AMD Radeon RX 6800 XT, R9 5950X
110 (97min - 117max) fps -26%
AMD Ryzen 9 5900X
NVIDIA Titan RTX, R9 5900X
104 (97min - 112max) fps -30%
Average NVIDIA Titan RTX
  (94 - 107.1, n=28)
102.4 fps -31%
Average NVIDIA GeForce RTX 2080 Ti (Desktop)
  (96 - 101, n=3)
98.3 fps -34%
KFA2 GeForce RTX 2080 Ti EX
NVIDIA GeForce RTX 2080 Ti (Desktop), R9 3900X
96 (87min - 109max) fps -36%
Average NVIDIA GeForce RTX 3070
  (84 - 93.9, n=5)
89.3 fps -40%
MSI GeForce RTX 3070 Gaming X Trio
NVIDIA GeForce RTX 3070, R9 5900X
88.2 (82min - 97max) fps -41%
Nvidia GeForce RTX 2080 Super
NVIDIA GeForce RTX 2080 Super (Desktop), R7 2700X
79 (71min - 87max) fps -47%
Average NVIDIA GeForce RTX 2080 Super (Desktop)
  ()
79 fps -47%
Nvidia GeForce RTX 2070 Super
NVIDIA GeForce RTX 2070 Super (Desktop), R7 2700X
68 (61min - 74max) fps -54%
3840x2160 Ultra Graphics & Postprocessing (HBAO+)
Average NVIDIA GeForce RTX 3090
  (85.4 - 98.5, n=8)
93.4 fps 0%
NVIDIA GeForce RTX 3080 Ti Founders Edition
NVIDIA GeForce RTX 3080 Ti, R7 5800X
93.2 (86min, 86P1 - 103max) fps
Nvidia GeForce RTX 3090 Founders Edition
NVIDIA GeForce RTX 3090, R9 5900X
91.8 fps -2%
Average NVIDIA GeForce RTX 3080
  (78 - 85.7, n=2)
81.9 fps -12%
ASUS GeForce RTX 3080 ROG STRIX OC GAMING
NVIDIA GeForce RTX 3080, R9 5900X
78 (72min - 83max) fps -16%
AMD Radeon RX 6900 XT
AMD Radeon RX 6900 XT, R9 5950X
76.6 (70min, 70P1 - 84max) fps -18%
Average NVIDIA Titan RTX
  ()
71.8 fps -23%
Average NVIDIA GeForce RTX 2080 Ti (Desktop)
  (65 - 67, n=3)
65.7 fps -30%
KFA2 GeForce RTX 2080 Ti EX
NVIDIA GeForce RTX 2080 Ti (Desktop), R9 3900X
65 (59min - 71max) fps -30%
Average NVIDIA GeForce RTX 3070
  (59 - 60.3, n=2)
59.7 fps -36%
Nvidia GeForce RTX 2080 Super
NVIDIA GeForce RTX 2080 Super (Desktop), R7 2700X
55.2 (49min - 61max) fps -41%
Average NVIDIA GeForce RTX 2080 Super (Desktop)
  (55.2 - 55.2, n=2)
55.2 fps -41%
Nvidia GeForce RTX 2070 Super
NVIDIA GeForce RTX 2070 Super (Desktop), R7 2700X
46.3 (41min - 50max) fps -50%
1920x1080 Ultra Graphics & Postprocessing (HBAO+)
Average NVIDIA GeForce RTX 3090
  (160 - 192.6, n=16)
179.9 fps +3%
NVIDIA GeForce RTX 3080 Ti Founders Edition
NVIDIA GeForce RTX 3080 Ti, R7 5800X
174 (163min, 165P1 - 187max) fps
Nvidia GeForce RTX 3090 Founders Edition
NVIDIA GeForce RTX 3090, R9 5900X
171.5 fps -1%
AMD Radeon RX 6900 XT
AMD Radeon RX 6900 XT, R9 5950X
163.6 (139min - 179max) fps -6%
AMD Radeon RX 6800 XT
AMD Radeon RX 6800 XT, R9 5950X
160 (138min - 179max) fps -8%
ASUS GeForce RTX 3080 ROG STRIX OC GAMING
NVIDIA GeForce RTX 3080, R9 5900X
152 (138min - 171max) fps -13%
Average NVIDIA GeForce RTX 3080
  (145 - 152, n=2)
148.5 fps -15%
AMD Ryzen 9 5900X
NVIDIA Titan RTX, R9 5900X
141 (127min - 154max) fps -19%
Average NVIDIA Titan RTX
  (124 - 150, n=28)
137.7 fps -21%
KFA2 GeForce RTX 2080 Ti EX
NVIDIA GeForce RTX 2080 Ti (Desktop), R9 3900X
135 (118min - 158max) fps -22%
Average NVIDIA GeForce RTX 2080 Ti (Desktop)
  (131 - 136, n=3)
134 fps -23%
MSI GeForce RTX 3070 Gaming X Trio
NVIDIA GeForce RTX 3070, R9 5900X
122 (110min - 138max) fps -30%
Nvidia GeForce RTX 2080 Super
NVIDIA GeForce RTX 2080 Super (Desktop), R7 2700X
109 (81min - 123max) fps -37%
Average NVIDIA GeForce RTX 2080 Super (Desktop)
  ()
109 fps -37%
Average NVIDIA GeForce RTX 3070
  (52.8 - 132.2, n=7)
106.1 fps -39%
Nvidia GeForce RTX 2070 Super
NVIDIA GeForce RTX 2070 Super (Desktop), R7 2700X
97 (83min - 109max) fps -44%
Assassin´s Creed Valhalla
3840x2160 Ultra High Preset
AMD Radeon RX 6900 XT
AMD Radeon RX 6900 XT, R9 5950X (SAM ENABLED)
68 (33min - 230max) fps +11%
AMD Radeon RX 6900 XT
AMD Radeon RX 6900 XT, R9 5950X
63 (32min - 219max) fps +3%
AMD Radeon RX 6800 XT
AMD Radeon RX 6800 XT, R9 5950X
65 (33min - 179max) fps +7%
Average NVIDIA GeForce RTX 3090
  (55 - 74, n=3)
62 fps +2%
NVIDIA GeForce RTX 3080 Ti Founders Edition
NVIDIA GeForce RTX 3080 Ti, R7 5800X
61 (26min - 135max) fps
Nvidia GeForce RTX 3090 Founders Edition
NVIDIA GeForce RTX 3090, R9 5900X
57 (36min - 113max) fps -7%
Average NVIDIA GeForce RTX 3080
  ()
52 fps -15%
MSI GeForce RTX 3070 Gaming X Trio
NVIDIA GeForce RTX 3070, R9 5900X
47 (31min - 92max) fps -23%
Average NVIDIA GeForce RTX 2080 Ti (Desktop)
  ()
46 fps -25%
Average NVIDIA GeForce RTX 3070
  (42 - 47, n=3)
44 fps -28%
AMD Ryzen 9 5900X
NVIDIA Titan RTX, R9 5900X
43 fps -30%
Average NVIDIA Titan RTX
  ()
43 fps -30%
Average NVIDIA GeForce RTX 2080 Super (Desktop)
  ()
36 fps -41%
2560x1440 Ultra High Preset
AMD Radeon RX 6900 XT
AMD Radeon RX 6900 XT, R9 5950X (SAM ENABLED)
115 (41min - 242max) fps +34%
AMD Radeon RX 6900 XT
AMD Radeon RX 6900 XT, R9 5950X
102 (40min - 239max) fps +19%
AMD Radeon RX 6800 XT
AMD Radeon RX 6800 XT, R9 5950X
98 (25min - 211max) fps +14%
Average NVIDIA GeForce RTX 3090
  (76 - 120, n=3)
91.7 fps +7%
NVIDIA GeForce RTX 3080 Ti Founders Edition
NVIDIA GeForce RTX 3080 Ti, R7 5800X
86 (43min - 145max) fps
Nvidia GeForce RTX 3090 Founders Edition
NVIDIA GeForce RTX 3090, R9 5900X
79 (44min - 135max) fps -8%
Average NVIDIA GeForce RTX 3080
  ()
76 fps -12%
MSI GeForce RTX 3070 Gaming X Trio
NVIDIA GeForce RTX 3070, R9 5900X
67 (39min - 124max) fps -22%
Average NVIDIA GeForce RTX 2080 Ti (Desktop)
  ()
67 fps -22%
AMD Ryzen 9 5900X
NVIDIA Titan RTX, R9 5900X
66 fps -23%
Average NVIDIA Titan RTX
  ()
66 fps -23%
Average NVIDIA GeForce RTX 3070
  (65 - 67, n=3)
65.7 fps -24%
Average NVIDIA GeForce RTX 2080 Super (Desktop)
  ()
57 fps -34%
1920x1080 Ultra High Preset
AMD Radeon RX 6900 XT
AMD Radeon RX 6900 XT, R9 5950X (SAM ENABLED)
148 (44min - 248max) fps +48%
AMD Radeon RX 6900 XT
AMD Radeon RX 6900 XT, R9 5950X
125 (43min - 252max) fps +25%
AMD Radeon RX 6800 XT
AMD Radeon RX 6800 XT, R9 5950X
118 (29min - 255max) fps +18%
Average NVIDIA GeForce RTX 3090
  (88 - 152, n=3)
110.3 fps +10%
NVIDIA GeForce RTX 3080 Ti Founders Edition
NVIDIA GeForce RTX 3080 Ti, R7 5800X
100 (50min - 150max) fps
Nvidia GeForce RTX 3090 Founders Edition
NVIDIA GeForce RTX 3090, R9 5900X
91 (48min - 158max) fps -9%
Average NVIDIA GeForce RTX 3080
  ()
88 fps -12%
AMD Ryzen 9 5900X
NVIDIA Titan RTX, R9 5900X
80 fps -20%
Average NVIDIA Titan RTX
  ()
80 fps -20%
Average NVIDIA GeForce RTX 2080 Ti (Desktop)
  ()
80 fps -20%
Average NVIDIA GeForce RTX 3070
  (77 - 80, n=3)
78.3 fps -22%
MSI GeForce RTX 3070 Gaming X Trio
NVIDIA GeForce RTX 3070, R9 5900X
78 (15min - 139max) fps -22%
Average NVIDIA GeForce RTX 2080 Super (Desktop)
  ()
70 fps -30%
The Division 2
3840x2160 Ultra Preset
NVIDIA GeForce RTX 3080 Ti Founders Edition
NVIDIA GeForce RTX 3080 Ti, R7 5800X
76.6 (36.8min, 55.9P1) fps
Average NVIDIA GeForce RTX 3090
  (71.9 - 78, n=4)
74.9 fps -2%
Nvidia GeForce RTX 3090 Founders Edition
NVIDIA GeForce RTX 3090, R9 5900X
72 fps -6%
AMD Radeon RX 6900 XT
AMD Radeon RX 6900 XT, R9 5950X
66.6 (40.2min, 54.6P1) fps -13%
ASUS GeForce RTX 3080 ROG STRIX OC GAMING
NVIDIA GeForce RTX 3080, R9 5900X
65 fps -15%
Average NVIDIA GeForce RTX 3080
  ()
65 fps -15%
AMD Radeon RX 6800 XT
AMD Radeon RX 6800 XT, R9 5950X
63.2 (34.5min, 54.1P1) fps -17%
Average NVIDIA Titan RTX
  ()
62 fps -19%
Average NVIDIA GeForce RTX 2080 Ti (Desktop)
  (53 - 57, n=3)
55.3 fps -28%
KFA2 GeForce RTX 2080 Ti EX
NVIDIA GeForce RTX 2080 Ti (Desktop), R9 3900X
53 fps -31%
MSI GeForce RTX 3070 Gaming X Trio
NVIDIA GeForce RTX 3070, R9 5900X
49 fps -36%
Average NVIDIA GeForce RTX 3070
  ()
49 fps -36%
Nvidia GeForce RTX 2080 Super
NVIDIA GeForce RTX 2080 Super (Desktop), R7 2700X
45 fps -41%
Average NVIDIA GeForce RTX 2080 Super (Desktop)
  (43 - 45, n=2)
44 fps -43%
Nvidia GeForce RTX 2070 Super
NVIDIA GeForce RTX 2070 Super (Desktop), R7 2700X
39 fps -49%
2560x1440 Ultra Preset
Average NVIDIA GeForce RTX 3090
  (120 - 136, n=4)
126.3 fps +4%
Nvidia GeForce RTX 3090 Founders Edition
NVIDIA GeForce RTX 3090, R9 5900X
121 fps 0%
NVIDIA GeForce RTX 3080 Ti Founders Edition
NVIDIA GeForce RTX 3080 Ti, R7 5800X
121 (43.3min, 63.3P1) fps
AMD Radeon RX 6900 XT
AMD Radeon RX 6900 XT, R9 5950X
118 (51.3min, 70.9P1) fps -2%
AMD Radeon RX 6800 XT
AMD Radeon RX 6800 XT, R9 5950X
114 (52.4min, 73P1) fps -6%
ASUS GeForce RTX 3080 ROG STRIX OC GAMING
NVIDIA GeForce RTX 3080, R9 5900X
107 fps -12%
Average NVIDIA GeForce RTX 3080
  ()
107 fps -12%
Average NVIDIA Titan RTX
  ()
102 fps -16%
Average NVIDIA GeForce RTX 2080 Ti (Desktop)
  (92 - 100, n=3)
96.3 fps -20%
KFA2 GeForce RTX 2080 Ti EX
NVIDIA GeForce RTX 2080 Ti (Desktop), R9 3900X
92 fps -24%
MSI GeForce RTX 3070 Gaming X Trio
NVIDIA GeForce RTX 3070, R9 5900X
82 fps -32%
Average NVIDIA GeForce RTX 3070
  ()
82 fps -32%
Nvidia GeForce RTX 2080 Super
NVIDIA GeForce RTX 2080 Super (Desktop), R7 2700X
79 fps -35%
Average NVIDIA GeForce RTX 2080 Super (Desktop)
  ()
79 fps -35%
Nvidia GeForce RTX 2070 Super
NVIDIA GeForce RTX 2070 Super (Desktop), R7 2700X
69 fps -43%
1920x1080 Ultra Preset
Average NVIDIA GeForce RTX 3090
  (140 - 180, n=4)
158 fps +10%
Nvidia GeForce RTX 3090 Founders Edition
NVIDIA GeForce RTX 3090, R9 5900X
152 fps +6%
NVIDIA GeForce RTX 3080 Ti Founders Edition
NVIDIA GeForce RTX 3080 Ti, R7 5800X
143 (43.5min, 71.9P1) fps
ASUS GeForce RTX 3080 ROG STRIX OC GAMING
NVIDIA GeForce RTX 3080, R9 5900X
140 fps -2%
Average NVIDIA GeForce RTX 3080
  ()
140 fps -2%
AMD Radeon RX 6800 XT
AMD Radeon RX 6800 XT, R9 5950X
138 (45.5min, 74.1P1) fps -3%
AMD Radeon RX 6900 XT
AMD Radeon RX 6900 XT, R9 5950X
138 (54.9min, 75.2P1) fps -3%
Average NVIDIA GeForce RTX 2080 Ti (Desktop)
  (123 - 133, n=3)
127 fps -11%
KFA2 GeForce RTX 2080 Ti EX
NVIDIA GeForce RTX 2080 Ti (Desktop), R9 3900X
123 fps -14%
Average NVIDIA Titan RTX
  ()
113 fps -21%
MSI GeForce RTX 3070 Gaming X Trio
NVIDIA GeForce RTX 3070, R9 5900X
112 fps -22%
Average NVIDIA GeForce RTX 3070
  ()
112 fps -22%
Nvidia GeForce RTX 2080 Super
NVIDIA GeForce RTX 2080 Super (Desktop), R7 2700X
106 fps -26%
Average NVIDIA GeForce RTX 2080 Super (Desktop)
  ()
106 fps -26%
Nvidia GeForce RTX 2070 Super
NVIDIA GeForce RTX 2070 Super (Desktop), R7 2700X
90 fps -37%
Red Dead Redemption 2
3840x2160 Maximum Settings
Average NVIDIA GeForce RTX 3090
  (61.9 - 67, n=3)
64.1 fps +2%
Nvidia GeForce RTX 3090 Founders Edition
NVIDIA GeForce RTX 3090, R9 5900X
63.5 (29min - 85max) fps +1%
NVIDIA GeForce RTX 3080 Ti Founders Edition
NVIDIA GeForce RTX 3080 Ti, R7 5800X
62.7 (35.4min, 55.6P1 - 90.3max) fps
Average NVIDIA GeForce RTX 3080
  (56 - 56.4, n=2)
56.2 fps -10%
ASUS GeForce RTX 3080 ROG STRIX OC GAMING
NVIDIA GeForce RTX 3080, R9 5900X
56 fps -11%
AMD Radeon RX 6900 XT
AMD Radeon RX 6900 XT, R9 5950X
54.6 (36.2min, 47.6P1 - 67max) fps -13%
AMD Radeon RX 6800 XT
AMD Radeon RX 6800 XT, R9 5950X
52.9 (41min, 45.5P1 - 65.3max) fps -16%
MSI GeForce RTX 3070 Gaming X Trio
NVIDIA GeForce RTX 3070, R9 5900X
44 (32min - 55max) fps -30%
Average NVIDIA GeForce RTX 3070
  (42.1 - 44, n=3)
42.9 fps -32%
Average NVIDIA GeForce RTX 2080 Ti (Desktop)
  ()
42.3 fps -33%
Average NVIDIA Titan RTX
  ()
41 fps -35%
Average NVIDIA GeForce RTX 2080 Super (Desktop)
  ()
33 fps -47%
2560x1440 Maximum Settings
Average NVIDIA GeForce RTX 3090
  (91.9 - 96, n=3)
93.4 fps +1%
NVIDIA GeForce RTX 3080 Ti Founders Edition
NVIDIA GeForce RTX 3080 Ti, R7 5800X
92.5 (33.8min, 76.9P1 - 155max) fps
Nvidia GeForce RTX 3090 Founders Edition
NVIDIA GeForce RTX 3090, R9 5900X
92.3 (33min - 132max) fps 0%
Average NVIDIA GeForce RTX 3080
  (81 - 86.4, n=2)
83.7 fps -10%
AMD Radeon RX 6800 XT
AMD Radeon RX 6800 XT, R9 5950X
82.7 (59min, 66.7P1 - 103max) fps -11%
AMD Radeon RX 6900 XT
AMD Radeon RX 6900 XT, R9 5950X
82.1 (34min, 66.7P1 - 104max) fps -11%
ASUS GeForce RTX 3080 ROG STRIX OC GAMING
NVIDIA GeForce RTX 3080, R9 5900X
81 fps -12%
MSI GeForce RTX 3070 Gaming X Trio
NVIDIA GeForce RTX 3070, R9 5900X
65 (33min - 100max) fps -30%
Average NVIDIA GeForce RTX 3070
  (63.2 - 65, n=3)
63.9 fps -31%
Average NVIDIA Titan RTX
  ()
63 fps -32%
Average NVIDIA GeForce RTX 2080 Ti (Desktop)
  ()
63 fps -32%
Average NVIDIA GeForce RTX 2080 Super (Desktop)
  ()
50.6 fps -45%
1920x1080 Maximum Settings
NVIDIA GeForce RTX 3080 Ti Founders Edition
NVIDIA GeForce RTX 3080 Ti, R7 5800X
112 (39.2min, 90.9P1 - 148max) fps
Average NVIDIA GeForce RTX 3090
  (109.9 - 115, n=3)
111.6 fps 0%
Nvidia GeForce RTX 3090 Founders Edition
NVIDIA GeForce RTX 3090, R9 5900X
109.9 (37min - 148max) fps -2%
AMD Radeon RX 6800 XT
AMD Radeon RX 6800 XT, R9 5950X
102 (68.7min, 76.9P1 - 129max) fps -9%
Average NVIDIA GeForce RTX 3080
  (96 - 103, n=2)
99.5 fps -11%
AMD Radeon RX 6900 XT
AMD Radeon RX 6900 XT, R9 5950X
98 (34.2min, 76.9P1 - 125max) fps -12%
ASUS GeForce RTX 3080 ROG STRIX OC GAMING
NVIDIA GeForce RTX 3080, R9 5900X
96 fps -14%
MSI GeForce RTX 3070 Gaming X Trio
NVIDIA GeForce RTX 3070, R9 5900X
78 (38min - 126max) fps -30%
Average NVIDIA GeForce RTX 3070
  (76.2 - 78, n=3)
77.4 fps -31%
Average NVIDIA Titan RTX
  ()
76 fps -32%
Average NVIDIA GeForce RTX 2080 Ti (Desktop)
  ()
76 fps -32%
Average NVIDIA GeForce RTX 2080 Super (Desktop)
  ()
61 fps -46%
Mafia Definitive Edition
3840x2160 High Preset
Average NVIDIA GeForce RTX 3090
  (84.5 - 89.1, n=2)
86.8 fps 0%
NVIDIA GeForce RTX 3080 Ti Founders Edition
NVIDIA GeForce RTX 3080 Ti, R7 5800X
86.6 (39.4min, 52.6P0.1, 64P1 - 179max) fps
Nvidia GeForce RTX 3090 Founders Edition
NVIDIA GeForce RTX 3090, R9 5900X
84.5 fps -2%
ASUS GeForce RTX 3080 ROG STRIX OC GAMING
NVIDIA GeForce RTX 3080, R9 5900X
78.2 (17.9min, 31P0.1, 59.3P1 - 292max) fps -10%
Average NVIDIA GeForce RTX 3080
  (78.1 - 78.2, n=2)
78.2 fps -10%
AMD Radeon RX 6900 XT
AMD Radeon RX 6900 XT, R9 5950X
67 (32.3min, 41.7P0.1, 44.7P1 - 211max) fps -23%
Average NVIDIA Titan RTX
  ()
63.4 fps -27%
AMD Radeon RX 6800 XT
AMD Radeon RX 6800 XT, R9 5950X
62.6 (28min, 37.6P0.1, 49.2P1 - 87.3max) fps -28%
Average NVIDIA GeForce RTX 2080 Ti (Desktop)
  ()
62.4 fps -28%
MSI GeForce RTX 3070 Gaming X Trio
NVIDIA GeForce RTX 3070, R9 5900X
56.6 (34.7min, 37.9P0.1, 44.2P1 - 177max) fps -35%
Average NVIDIA GeForce RTX 3070
  (55.2 - 56.6, n=2)
55.9 fps -35%
Average NVIDIA GeForce RTX 2080 Super (Desktop)
  ()
48.5 fps -44%
2560x1440 High Preset
Average NVIDIA GeForce RTX 3090
  (142.3 - 149, n=2)
145.7 fps +3%
Nvidia GeForce RTX 3090 Founders Edition
NVIDIA GeForce RTX 3090, R9 5900X
142.3 fps 0%
NVIDIA GeForce RTX 3080 Ti Founders Edition
NVIDIA GeForce RTX 3080 Ti, R7 5800X
142 (48.1min, 63.2P0.1, 83P1 - 222max) fps
ASUS GeForce RTX 3080 ROG STRIX OC GAMING
NVIDIA GeForce RTX 3080, R9 5900X
137 (26.5min, 66.2P0.1, 95.7P1 - 265max) fps -4%
Average NVIDIA GeForce RTX 3080
  (127 - 137, n=2)
132 fps -7%
AMD Radeon RX 6900 XT
AMD Radeon RX 6900 XT, R9 5950X
120 (17.6min, 61.2P0.1, 83.1P1 - 238max) fps -15%
AMD Radeon RX 6800 XT
AMD Radeon RX 6800 XT, R9 5950X
112 (23.5min, 64P0.1, 80.8P1 - 169max) fps -21%
Average NVIDIA Titan RTX
  ()
109 fps -23%
Average NVIDIA GeForce RTX 2080 Ti (Desktop)
  ()
105 fps -26%
MSI GeForce RTX 3070 Gaming X Trio
NVIDIA GeForce RTX 3070, R9 5900X
98.7 (45.2min, 55.9P0.1, 69.4P1 - 191max) fps -30%
Average NVIDIA GeForce RTX 3070
  (98.1 - 98.7, n=2)
98.4 fps -31%
Average NVIDIA GeForce RTX 2080 Super (Desktop)
  ()
88.8 fps -37%
1920x1080 High Preset
ASUS GeForce RTX 3080 ROG STRIX OC GAMING
NVIDIA GeForce RTX 3080, R9 5900X
169 (32.7min, 75.7P0.1, 112P1 - 361max) fps +4%
NVIDIA GeForce RTX 3080 Ti Founders Edition
NVIDIA GeForce RTX 3080 Ti, R7 5800X
163 (45.1min, 70.3P0.1, 91.6P1 - 335max) fps
Nvidia GeForce RTX 3090 Founders Edition
NVIDIA GeForce RTX 3090, R9 5900X
158.8 fps -3%
Average NVIDIA GeForce RTX 3090
  (157 - 158.8, n=2)
157.9 fps -3%
Average NVIDIA GeForce RTX 3080
  (144 - 169, n=2)
156.5 fps -4%
AMD Radeon RX 6900 XT
AMD Radeon RX 6900 XT, R9 5950X
138 (32.8min, 68.1P0.1, 90.2P1 - 334max) fps -15%
Average NVIDIA GeForce RTX 3070
  (124 - 132, n=2)
128 fps -21%
MSI GeForce RTX 3070 Gaming X Trio
NVIDIA GeForce RTX 3070, R9 5900X
124 (57.4min, 62.8P0.1, 82P1 - 251max) fps -24%
Average NVIDIA Titan RTX
  ()
123.7 fps -24%
AMD Radeon RX 6800 XT
AMD Radeon RX 6800 XT, R9 5950X
121 (23.7min, 68P0.1, 83.3P1 - 223max) fps -26%
Average NVIDIA GeForce RTX 2080 Super (Desktop)
  ()
118.1 fps -28%
Average NVIDIA GeForce RTX 2080 Ti (Desktop)
  ()
117 fps -28%
Cyberpunk 2077 1.0
3840x2160 Ultra Preset
Average NVIDIA GeForce RTX 3090
  (41.5 - 45.3, n=2)
43.4 fps +3%
NVIDIA GeForce RTX 3080 Ti Founders Edition
NVIDIA GeForce RTX 3080 Ti, R7 5800X
42.3 (27.8min, 35.1P0.1, 37.6P1 - 61.2max) fps
Nvidia GeForce RTX 3090 Founders Edition
NVIDIA GeForce RTX 3090, R9 5900X
41.5 fps -2%
Average NVIDIA GeForce RTX 3080
  ()
38.9 fps -8%
AMD Radeon RX 6900 XT
AMD Radeon RX 6900 XT, R9 5950X
34.8 (19.4min, 22.8P0.1, 29.7P1 - 177max) fps -18%
Average NVIDIA GeForce RTX 2080 Ti (Desktop)
  ()
32.2 fps -24%
AMD Ryzen 9 5900X
NVIDIA Titan RTX, R9 5900X
30.9 fps -27%
Average NVIDIA Titan RTX
  ()
30.9 fps -27%
Average NVIDIA GeForce RTX 3070
  (26.6 - 27.9, n=2)
27.3 fps -35%
Average NVIDIA GeForce RTX 2080 Super (Desktop)
  ()
24.1 fps -43%
2560x1440 Ultra Preset
NVIDIA GeForce RTX 3080 Ti Founders Edition
NVIDIA GeForce RTX 3080 Ti, R7 5800X
84.3 (62.5min, 63.4P0.1, 71.2P1 - 108max) fps
Average NVIDIA GeForce RTX 3090
  (78.1 - 85.3, n=2)
81.7 fps -3%
Nvidia GeForce RTX 3090 Founders Edition
NVIDIA GeForce RTX 3090, R9 5900X
78.1 fps -7%
Average NVIDIA GeForce RTX 3080
  ()
72.5 fps -14%
AMD Radeon RX 6900 XT
AMD Radeon RX 6900 XT, R9 5950X
72.3 (21min, 36.7P0.1, 58.6P1 - 231max) fps -14%
Average NVIDIA GeForce RTX 2080 Ti (Desktop)
  ()
64 fps -24%
AMD Ryzen 9 5900X
NVIDIA Titan RTX, R9 5900X
58.4 fps -31%
Average NVIDIA Titan RTX
  ()
58.4 fps -31%
Average NVIDIA GeForce RTX 3070
  (53.7 - 54.8, n=2)
54.3 fps -36%
Average NVIDIA GeForce RTX 2080 Super (Desktop)
  ()
49.1 fps -42%
1920x1080 Ultra Preset
NVIDIA GeForce RTX 3080 Ti Founders Edition
NVIDIA GeForce RTX 3080 Ti, R7 5800X
125 (74.1min, 81.2P0.1, 91P1 - 179max) fps
Nvidia GeForce RTX 3090 Founders Edition
NVIDIA GeForce RTX 3090, R9 5900X
109.7 fps -12%
Average NVIDIA GeForce RTX 3090
  (108 - 109.7, n=2)
108.9 fps -13%
AMD Radeon RX 6900 XT
AMD Radeon RX 6900 XT, R9 5950X
106 (23.2min, 48.3P0.1, 76.1P1 - 189max) fps -15%
Average NVIDIA GeForce RTX 3080
  ()
103 fps -18%
Average NVIDIA GeForce RTX 2080 Ti (Desktop)
  ()
95.4 fps -24%
AMD Ryzen 9 5900X
NVIDIA Titan RTX, R9 5900X
82.3 fps -34%
Average NVIDIA Titan RTX
  ()
82.3 fps -34%
Average NVIDIA GeForce RTX 3070
  (80.6 - 81, n=2)
80.8 fps -35%
Average NVIDIA GeForce RTX 2080 Super (Desktop)
  ()
72.1 fps -42%
1920x1080 Ray Tracing Ultra Preset (DLSS off)
NVIDIA GeForce RTX 3080 Ti Founders Edition
NVIDIA GeForce RTX 3080 Ti, R7 5800X
67.7 (46.3min, 51P0.1, 55P1 - 87.5max) fps
Average NVIDIA GeForce RTX 3090
  (59.6 - 65.4, n=2)
62.5 fps -8%
Nvidia GeForce RTX 3090 Founders Edition
NVIDIA GeForce RTX 3090, R9 5900X
59.6 fps -12%
Average NVIDIA GeForce RTX 3080
  ()
56.6 fps -16%
Average NVIDIA GeForce RTX 2080 Ti (Desktop)
  ()
43.1 fps -36%
Average NVIDIA GeForce RTX 3070
  (41.9 - 42.3, n=2)
42.1 fps -38%
AMD Ryzen 9 5900X
NVIDIA Titan RTX, R9 5900X
40.4 fps -40%
Average NVIDIA Titan RTX
  ()
40.4 fps -40%
Average NVIDIA GeForce RTX 2080 Super (Desktop)
  ()
33 fps -51%
3840x2160 Ray Tracing Ultra Preset (DLSS off)
NVIDIA GeForce RTX 3080 Ti Founders Edition
NVIDIA GeForce RTX 3080 Ti, R7 5800X
21.2 (17.3min, 17.3P0.1, 17.9P1 - 24.5max) fps
Average NVIDIA GeForce RTX 3090
  (19.7 - 22.2, n=2)
21 fps -1%
Nvidia GeForce RTX 3090 Founders Edition
NVIDIA GeForce RTX 3090, R9 5900X
19.7 fps -7%
Average NVIDIA GeForce RTX 3080
  ()
19 fps -10%
Average NVIDIA GeForce RTX 2080 Ti (Desktop)
  ()
13.6 fps -36%
AMD Ryzen 9 5900X
NVIDIA Titan RTX, R9 5900X
13.1 fps -38%
Average NVIDIA Titan RTX
  ()
13.1 fps -38%
Average NVIDIA GeForce RTX 3070
  (10.9 - 12.2, n=2)
11.6 fps -45%
Average NVIDIA GeForce RTX 2080 Super (Desktop)
  ()
7.09 fps -67%
Call of Duty Black Ops Cold War
1920x1080 Highest Settings + Ultra Ray Tracing
AMD Ryzen 9 5900X
NVIDIA Titan RTX, R9 5900X
119 fps +25%
Average NVIDIA Titan RTX
  ()
119 fps +25%
NVIDIA GeForce RTX 3080 Ti Founders Edition
NVIDIA GeForce RTX 3080 Ti, R7 5800X
95.2 (44.1min, 47.7P0.1, 52.9P1 - 250max) fps
Nvidia GeForce RTX 3090 Founders Edition
NVIDIA GeForce RTX 3090, R9 5900X
89 fps -7%
Average NVIDIA GeForce RTX 3090
  (88.3 - 89, n=2)
88.7 fps -7%
Average NVIDIA GeForce RTX 3080
  ()
81.9 fps -14%
Average NVIDIA GeForce RTX 2080 Ti (Desktop)
  ()
77.2 fps -19%
AMD Radeon RX 6900 XT
AMD Radeon RX 6900 XT, R9 5950X
69.5 (40.4min, 48.2P0.1, 54.5P1 - 302max) fps -27%
MSI GeForce RTX 3070 Gaming X Trio
NVIDIA GeForce RTX 3070, R9 5900X
68.5 (19.1min, 22.3P0.1, 30.4P1 - 229max) fps -28%
Average NVIDIA GeForce RTX 3070
  (49.8 - 70.1, n=3)
62.8 fps -34%
Average NVIDIA GeForce RTX 2080 Super (Desktop)
  ()
59 fps -38%
AMD Radeon RX 6800 XT
AMD Radeon RX 6800 XT, R9 5950X
21.8 (8.8min, 9.61P0.1, 16.2P1 - 49.5max) fps -77%
3840x2160 Highest Settings
NVIDIA GeForce RTX 3080 Ti Founders Edition
NVIDIA GeForce RTX 3080 Ti, R7 5800X
76.5 (46.5min, 58.5P0.1, 63.1P1 - 212max) fps
Average NVIDIA GeForce RTX 3090
  (74.6 - 76.1, n=2)
75.4 fps -1%
Nvidia GeForce RTX 3090 Founders Edition
NVIDIA GeForce RTX 3090, R9 5900X
74.6 fps -2%
MSI GeForce RTX 3070 Gaming X Trio
NVIDIA GeForce RTX 3070, R9 5900X
74 (32.6min, 43.5P0.1, 50.6P1 - 270max) fps -3%
AMD Radeon RX 6900 XT
AMD Radeon RX 6900 XT, R9 5950X
68.1 (42.2min, 50.7P0.1, 56.8P1 - 172max) fps -11%
Average NVIDIA GeForce RTX 3080
  ()
65.6 fps -14%
AMD Radeon RX 6800 XT
AMD Radeon RX 6800 XT, R9 5950X
64 (10.8min, 11.6P0.1, 50.8P1 - 159max) fps -16%
Average NVIDIA GeForce RTX 3070
  (43.8 - 74, n=3)
56 fps -27%
Average NVIDIA GeForce RTX 2080 Ti (Desktop)
  ()
54.4 fps -29%
AMD Ryzen 9 5900X
NVIDIA Titan RTX, R9 5900X
52.9 fps -31%
Average NVIDIA Titan RTX
  ()
52.9 fps -31%
Average NVIDIA GeForce RTX 2080 Super (Desktop)
  (38 - 44.5, n=2)
41.3 fps -46%
2560x1440 Highest Settings
NVIDIA GeForce RTX 3080 Ti Founders Edition
NVIDIA GeForce RTX 3080 Ti, R7 5800X
131 (59.4min, 79.8P0.1, 92P1 - 272max) fps
Nvidia GeForce RTX 3090 Founders Edition
NVIDIA GeForce RTX 3090, R9 5900X
124.7 fps -5%
Average NVIDIA GeForce RTX 3090
  (122 - 124.7, n=2)
123.4 fps -6%
AMD Radeon RX 6900 XT
AMD Radeon RX 6900 XT, R9 5950X
115 (54.9min, 82.8P0.1, 92.3P1 - 314max) fps -12%
MSI GeForce RTX 3070 Gaming X Trio
NVIDIA GeForce RTX 3070, R9 5900X
107 (43.6min, 54P0.1, 62.7P1 - 272max) fps -18%
Average NVIDIA GeForce RTX 3080
  ()
104 fps -21%
Average NVIDIA GeForce RTX 3070
  (83 - 107, n=3)
93.2 fps -29%
Average NVIDIA GeForce RTX 2080 Ti (Desktop)
  ()
89.2 fps -32%
AMD Ryzen 9 5900X
NVIDIA Titan RTX, R9 5900X
87.6 fps -33%
Average NVIDIA Titan RTX
  ()
87.6 fps -33%
AMD Radeon RX 6800 XT
AMD Radeon RX 6800 XT, R9 5950X
80.4 (16.5min, 31.8P0.1, 64.3P1 - 285max) fps -39%
Average NVIDIA GeForce RTX 2080 Super (Desktop)
  (51 - 77.6, n=2)
64.3 fps -51%
1920x1080 Highest Settings
NVIDIA GeForce RTX 3080 Ti Founders Edition
NVIDIA GeForce RTX 3080 Ti, R7 5800X
162 (66.2min, 97.6P0.1, 111P1 - 288max) fps
Nvidia GeForce RTX 3090 Founders Edition
NVIDIA GeForce RTX 3090, R9 5900X
161.1 fps -1%
Average NVIDIA GeForce RTX 3090
  (161 - 161.1, n=2)
161.1 fps -1%
AMD Radeon RX 6900 XT
AMD Radeon RX 6900 XT, R9 5950X
153 (60.9min, 98.1P0.1, 117P1 - 437max) fps -6%
AMD Ryzen 9 5900X
NVIDIA Titan RTX, R9 5900X
144 fps -11%
AMD Radeon RX 6800 XT
AMD Radeon RX 6800 XT, R9 5950X
144 (58.7min, 90.7P0.1, 105P1 - 365max) fps -11%
Average NVIDIA Titan RTX
  ()
144 fps -11%
Average NVIDIA GeForce RTX 3080
  ()
127 fps -22%
MSI GeForce RTX 3070 Gaming X Trio
NVIDIA GeForce RTX 3070, R9 5900X
122 (45min, 57.3P0.1, 67.9P1 - 301max) fps -25%
Average NVIDIA GeForce RTX 2080 Ti (Desktop)
  ()
118 fps -27%
Average NVIDIA GeForce RTX 3070
  (95.7 - 122, n=3)
112.6 fps -30%
Average NVIDIA GeForce RTX 2080 Super (Desktop)
  (59 - 106, n=2)
82.5 fps -49%
Metro Exodus
1920x1080 Ultra Quality DXR AF:16x
NVIDIA GeForce RTX 3080 Ti Founders Edition
NVIDIA GeForce RTX 3080 Ti, R7 5800X
112 (53.98min - 169.75max) fps
Average NVIDIA GeForce RTX 3090
  (68.6 - 122.2, n=12)
111.4 fps -1%
Average NVIDIA GeForce RTX 3080
  (91.5 - 102, n=2)
96.8 fps -14%
ASUS GeForce RTX 3080 ROG STRIX OC GAMING
NVIDIA GeForce RTX 3080, R9 5900X
91.5 (51.03min - 134.52max) fps -18%
AMD Radeon RX 6900 XT
AMD Radeon RX 6900 XT, R9 5950X
90.5 (55.53min - 126.79max) fps -19%
AMD Ryzen 9 5900X
NVIDIA Titan RTX, R9 5900X
87.9 (49.32min - 136.76max) fps -22%
Average NVIDIA Titan RTX
  (69 - 95.5, n=23)
86.1 fps -23%
AMD Radeon RX 6800 XT
AMD Radeon RX 6800 XT, R9 5950X
85.5 (52.71min - 120.38max) fps -24%
Average NVIDIA GeForce RTX 2080 Ti (Desktop)
  (78.6 - 84.9, n=3)
81.8 fps -27%
Average NVIDIA GeForce RTX 3070
  (80.4 - 83, n=5)
81.6 fps -27%
MSI GeForce RTX 3070 Gaming X Trio
NVIDIA GeForce RTX 3070, R9 5900X
80.4 (43.5min - 124.3max) fps -28%
KFA2 GeForce RTX 2080 Ti EX
NVIDIA GeForce RTX 2080 Ti (Desktop), R9 3900X
78.6 (43min - 115max) fps -30%
Nvidia GeForce RTX 3090 Founders Edition
NVIDIA GeForce RTX 3090, R9 5900X
68.6 (37.68min - 117.88max) fps -39%
Nvidia GeForce RTX 2080 Super
NVIDIA GeForce RTX 2080 Super (Desktop), R7 2700X
65 (37.62min - 97.62max) fps -42%
Average NVIDIA GeForce RTX 2080 Super (Desktop)
  ()
65 fps -42%
Nvidia GeForce RTX 2070 Super
NVIDIA GeForce RTX 2070 Super (Desktop), R7 2700X
57.5 (34min - 85max) fps -49%
3840x2160 Ultra Quality AF:16x
Average NVIDIA GeForce RTX 3090
  (70.6 - 77.3, n=12)
75 fps +1%
NVIDIA GeForce RTX 3080 Ti Founders Edition
NVIDIA GeForce RTX 3080 Ti, R7 5800X
74.2 (43.62min - 125.9max) fps
Nvidia GeForce RTX 3090 Founders Edition
NVIDIA GeForce RTX 3090, R9 5900X
70.6 (41.43min - 118.98max) fps -5%
AMD Radeon RX 6900 XT
AMD Radeon RX 6900 XT, R9 5950X
66.7 (42.71min - 92.25max) fps -10%
Average NVIDIA GeForce RTX 3080
  (64.1 - 65.9, n=2)
65 fps -12%
ASUS GeForce RTX 3080 ROG STRIX OC GAMING
NVIDIA GeForce RTX 3080, R9 5900X
64.1 (36.54min - 108.57max) fps -14%
AMD Radeon RX 6800 XT
AMD Radeon RX 6800 XT, R9 5950X
56.3 (40.14min - 64.28max) fps -24%
AMD Ryzen 9 5900X
NVIDIA Titan RTX, R9 5900X
54.9 (34.88min - 89.73max) fps -26%
Average NVIDIA Titan RTX
  (51.3 - 57.9, n=27)
54.9 fps -26%
Average NVIDIA GeForce RTX 2080 Ti (Desktop)
  (47.5 - 51, n=3)
49.7 fps -33%
MSI GeForce RTX 3070 Gaming X Trio
NVIDIA GeForce RTX 3070, R9 5900X
49.1 (30.24min - 89.89max) fps -34%
Average NVIDIA GeForce RTX 3070
  (48.3 - 49.7, n=5)
48.9 fps -34%
KFA2 GeForce RTX 2080 Ti EX
NVIDIA GeForce RTX 2080 Ti (Desktop), R9 3900X
47.5 (31min - 69max) fps -36%
Average NVIDIA GeForce RTX 2080 Super (Desktop)
  (40 - 40.4, n=2)
40.2 fps -46%
Nvidia GeForce RTX 2080 Super
NVIDIA GeForce RTX 2080 Super (Desktop), R7 2700X
40 (25.84min - 59.35max) fps -46%
Nvidia GeForce RTX 2070 Super
NVIDIA GeForce RTX 2070 Super (Desktop), R7 2700X
35 (23min - 51max) fps -53%
2560x1440 Ultra Quality AF:16x
Average NVIDIA GeForce RTX 3090
  (102 - 118.2, n=12)
113.2 fps +3%
NVIDIA GeForce RTX 3080 Ti Founders Edition
NVIDIA GeForce RTX 3080 Ti, R7 5800X
110 (55.44min - 188.15max) fps
Nvidia GeForce RTX 3090 Founders Edition
NVIDIA GeForce RTX 3090, R9 5900X
106 (54.88min - 173.25max) fps -4%
AMD Radeon RX 6900 XT
AMD Radeon RX 6900 XT, R9 5950X
102 (59.52min - 156.84max) fps -7%
Average NVIDIA GeForce RTX 3080
  (92.2 - 97.4, n=2)
94.8 fps -14%
AMD Radeon RX 6800 XT
AMD Radeon RX 6800 XT, R9 5950X
94.6 (55.44min - 143.68max) fps -14%
ASUS GeForce RTX 3080 ROG STRIX OC GAMING
NVIDIA GeForce RTX 3080, R9 5900X
92.2 (46.62min - 155.93max) fps -16%
AMD Ryzen 9 5900X
NVIDIA Titan RTX, R9 5900X
84.9 (46.03min - 152.65max) fps -23%
Average NVIDIA Titan RTX
  (69 - 92.9, n=26)
84 fps -24%
Average NVIDIA GeForce RTX 3070
  (74.4 - 78.3, n=5)
75.8 fps -31%
Average NVIDIA GeForce RTX 2080 Ti (Desktop)
  (71.9 - 77.9, n=3)
75.3 fps -32%
MSI GeForce RTX 3070 Gaming X Trio
NVIDIA GeForce RTX 3070, R9 5900X
74.4 (38.95min - 129.85max) fps -32%
KFA2 GeForce RTX 2080 Ti EX
NVIDIA GeForce RTX 2080 Ti (Desktop), R9 3900X
71.9 (40min - 108max) fps -35%
Average NVIDIA GeForce RTX 2080 Super (Desktop)
  (61 - 65, n=2)
63 fps -43%
Nvidia GeForce RTX 2080 Super
NVIDIA GeForce RTX 2080 Super (Desktop), R7 2700X
61 (35.51min - 95.82max) fps -45%
Nvidia GeForce RTX 2070 Super
NVIDIA GeForce RTX 2070 Super (Desktop), R7 2700X
54.3 (32min - 83max) fps -51%
1920x1080 Ultra Quality AF:16x
Average NVIDIA GeForce RTX 3090
  (108 - 145, n=12)
135.3 fps +3%
NVIDIA GeForce RTX 3080 Ti Founders Edition
NVIDIA GeForce RTX 3080 Ti, R7 5800X
131 (62.29min - 206.31max) fps
NVIDIA GeForce RTX 3080 Ti Founders Edition
NVIDIA GeForce RTX 3080 Ti, R7 5800X
131 (62.29min - 206.31max) fps 0%
Nvidia GeForce RTX 3090 Founders Edition
NVIDIA GeForce RTX 3090, R9 5900X
124 (65.58min - 188.71max) fps -5%
AMD Radeon RX 6900 XT
AMD Radeon RX 6900 XT, R9 5950X
123 (67.67min - 199.52max) fps -6%
AMD Radeon RX 6800 XT
AMD Radeon RX 6800 XT, R9 5950X
115 (64.52min - 181.92max) fps -12%
Average NVIDIA GeForce RTX 3080
  (111 - 116, n=2)
113.5 fps -13%
ASUS GeForce RTX 3080 ROG STRIX OC GAMING
NVIDIA GeForce RTX 3080, R9 5900X
111 (57.16min - 183.25max) fps -15%
AMD Ryzen 9 5900X
NVIDIA Titan RTX, R9 5900X
106 (52.66min - 176.55max) fps -19%
Average NVIDIA Titan RTX
  (73 - 116, n=27)
102.2 fps -22%
Average NVIDIA GeForce RTX 3070
  (91.3 - 97.7, n=5)
93.9 fps -28%
Average NVIDIA GeForce RTX 2080 Ti (Desktop)
  (89.7 - 98.6, n=3)
93.8 fps -28%
MSI GeForce RTX 3070 Gaming X Trio
NVIDIA GeForce RTX 3070, R9 5900X
91.3 (46.36min - 152.74max) fps -30%
KFA2 GeForce RTX 2080 Ti EX
NVIDIA GeForce RTX 2080 Ti (Desktop), R9 3900X
89.7 (46min - 140max) fps -32%
Average NVIDIA GeForce RTX 2080 Super (Desktop)
  (76 - 82, n=2)
79 fps -40%
Nvidia GeForce RTX 2080 Super
NVIDIA GeForce RTX 2080 Super (Desktop), R7 2700X
76 (38.54min - 122.4max) fps -42%
Nvidia GeForce RTX 2070 Super
NVIDIA GeForce RTX 2070 Super (Desktop), R7 2700X
67.8 (36min - 110max) fps -48%
Hitman 3
3840x2160 Maximum Settings AF:16x
AMD Radeon RX 6900 XT
AMD Radeon RX 6900 XT, R9 5950X
128.4 fps +7%
AMD Radeon RX 6900 XT
AMD Radeon RX 6900 XT, R9 5950X (SAM ENABLED)
127.8 fps +7%
NVIDIA GeForce RTX 3080 Ti Founders Edition
NVIDIA GeForce RTX 3080 Ti, R7 5800X
119.6 fps
Average NVIDIA GeForce RTX 3090
  (115 - 122, n=2)
118.5 fps -1%
Nvidia GeForce RTX 3090 Founders Edition
NVIDIA GeForce RTX 3090, R9 5900X
115 fps -4%
Average NVIDIA GeForce RTX 3080
  ()
109 fps -9%
Average NVIDIA GeForce RTX 2080 Ti (Desktop)
  ()
85.2 fps -29%
AMD Ryzen 9 5900X
NVIDIA Titan RTX, R9 5900X
82 fps -31%
Average NVIDIA Titan RTX
  ()
82 fps -31%
Average NVIDIA GeForce RTX 3070
  ()
77.5 fps -35%
Average NVIDIA GeForce RTX 2080 Super (Desktop)
  ()
64 fps -46%
2560x1440 Maximum Settings AF:16x
AMD Radeon RX 6900 XT
AMD Radeon RX 6900 XT, R9 5950X
213.1 fps +1%
AMD Radeon RX 6900 XT
AMD Radeon RX 6900 XT, R9 5950X (SAM ENABLED)
213.1 fps +1%
NVIDIA GeForce RTX 3080 Ti Founders Edition
NVIDIA GeForce RTX 3080 Ti, R7 5800X
210.4 fps
Nvidia GeForce RTX 3090 Founders Edition
NVIDIA GeForce RTX 3090, R9 5900X
190 fps -10%
Average NVIDIA GeForce RTX 3090
  (166 - 190, n=2)
178 fps -15%
Average NVIDIA GeForce RTX 3080
  ()
164 fps -22%
Average NVIDIA GeForce RTX 2080 Ti (Desktop)
  ()
147 fps -30%
AMD Ryzen 9 5900X
NVIDIA Titan RTX, R9 5900X
145 fps -31%
Average NVIDIA Titan RTX
  ()
145 fps -31%
Average NVIDIA GeForce RTX 3070
  ()
140 fps -33%
Average NVIDIA GeForce RTX 2080 Super (Desktop)
  ()
115 fps -45%
1920x1080 Maximum Settings AF:16x
AMD Radeon RX 6900 XT
AMD Radeon RX 6900 XT, R9 5950X
276.2 fps +3%
AMD Radeon RX 6900 XT
AMD Radeon RX 6900 XT, R9 5950X (SAM ENABLED)
269.4 fps +1%
NVIDIA GeForce RTX 3080 Ti Founders Edition
NVIDIA GeForce RTX 3080 Ti, R7 5800X
267 fps
Nvidia GeForce RTX 3090 Founders Edition
NVIDIA GeForce RTX 3090, R9 5900X
223 fps -16%
AMD Ryzen 9 5900X
NVIDIA Titan RTX, R9 5900X
202 fps -24%
Average NVIDIA Titan RTX
  ()
202 fps -24%
Average NVIDIA GeForce RTX 3090
  (167 - 223, n=2)
195 fps -27%
Average NVIDIA GeForce RTX 3080
  ()
166 fps -38%
Average NVIDIA GeForce RTX 2080 Super (Desktop)
  ()
166 fps -38%
Average NVIDIA GeForce RTX 3070
  ()
165 fps -38%
Average NVIDIA GeForce RTX 2080 Ti (Desktop)
  ()
162 fps -39%
Outriders
3840x2160 Ultra Preset
Average NVIDIA GeForce RTX 3090
  (85.7 - 89.3, n=2)
87.5 fps +5%
Nvidia GeForce RTX 3090 Founders Edition
NVIDIA GeForce RTX 3090, R9 5900X
85.7 (14.7min, 22.5P0.1, 46.9P1 - 251max) fps +2%
NVIDIA GeForce RTX 3080 Ti Founders Edition
NVIDIA GeForce RTX 3080 Ti, R7 5800X
83.7 (43.7min, 47.1P0.1, 63.2P1 - 197max) fps
Average NVIDIA GeForce RTX 3080
  ()
79.1 fps -5%
AMD Ryzen 9 5900X
NVIDIA Titan RTX, R9 5900X
64 (19.5min, 27.6P0.1, 34.8P1 - 242max) fps -24%
Average NVIDIA Titan RTX
  ()
64 fps -24%
Average NVIDIA GeForce RTX 2080 Ti (Desktop)
  ()
61.8 fps -26%
2560x1440 Ultra Preset
NVIDIA GeForce RTX 3080 Ti Founders Edition
NVIDIA GeForce RTX 3080 Ti, R7 5800X
151 (48.6min, 55.6P0.1, 72.9P1 - 232max) fps
Nvidia GeForce RTX 3090 Founders Edition
NVIDIA GeForce RTX 3090, R9 5900X
150 (18.9min, 38.2P0.1, 79.9P1 - 274max) fps -1%
Average NVIDIA GeForce RTX 3090
  (125 - 150, n=2)
137.5 fps -9%
Average NVIDIA GeForce RTX 3080
  ()
125 fps -17%
AMD Ryzen 9 5900X
NVIDIA Titan RTX, R9 5900X
119 (18.3min, 24.7P0.1, 65.9P1 - 236max) fps -21%
Average NVIDIA Titan RTX
  ()
119 fps -21%
Average NVIDIA GeForce RTX 2080 Ti (Desktop)
  ()
114 fps -25%
1920x1080 Ultra Preset
Nvidia GeForce RTX 3090 Founders Edition
NVIDIA GeForce RTX 3090, R9 5900X
168 (20.9min, 40.1P0.1, 86.5P1 - 275max) fps +14%
AMD Ryzen 9 5900X
NVIDIA Titan RTX, R9 5900X
156 (15.2min, 19.3P0.1, 82.3P1 - 265max) fps +5%
Average NVIDIA Titan RTX
  ()
156 fps +5%
NVIDIA GeForce RTX 3080 Ti Founders Edition
NVIDIA GeForce RTX 3080 Ti, R7 5800X
148 (46.9min, 49.5P0.1, 68.8P1 - 250max) fps
Average NVIDIA GeForce RTX 3090
  (125 - 168, n=2)
146.5 fps -1%
Average NVIDIA GeForce RTX 2080 Ti (Desktop)
  ()
132 fps -11%
Average NVIDIA GeForce RTX 3080
  ()
126 fps -15%
Resident Evil Village
1920x1080 Ray Tracing Preset
Nvidia GeForce RTX 3090 Founders Edition
NVIDIA GeForce RTX 3090, R9 5900X
197 (122min, 151P0.1, 167P1 - 247max) fps +6%
NVIDIA GeForce RTX 3080 Ti Founders Edition
NVIDIA GeForce RTX 3080 Ti, R7 5800X
185 (59.9min, 132P0.1, 146P1 - 260max) fps
Average NVIDIA GeForce RTX 3090
  (144 - 197, n=2)
170.5 fps -8%
Average NVIDIA GeForce RTX 3080
  ()
150 fps -19%
AMD Ryzen 9 5900X
NVIDIA Titan RTX, R9 5900X
138 (84.7min, 95.4P0.1, 105P1 - 185max) fps -25%
Average NVIDIA Titan RTX
  ()
138 fps -25%
Average NVIDIA GeForce RTX 2080 Ti (Desktop)
  ()
138 fps -25%
Average NVIDIA GeForce RTX 3070
  ()
129 fps -30%
3840x2160 Max Preset
Average NVIDIA GeForce RTX 3090
  (116 - 117, n=2)
116.5 fps +2%
Nvidia GeForce RTX 3090 Founders Edition
NVIDIA GeForce RTX 3090, R9 5900X
116 (74.7min, 97.9P0.1, 100P1 - 155max) fps +2%
NVIDIA GeForce RTX 3080 Ti Founders Edition
NVIDIA GeForce RTX 3080 Ti, R7 5800X
114 (60.9min, 95.6P0.1, 99.4P1 - 151max) fps
Average NVIDIA GeForce RTX 3080
  ()
103 fps -10%
Average NVIDIA GeForce RTX 2080 Ti (Desktop)
  ()
74.3 fps -35%
AMD Ryzen 9 5900X
NVIDIA Titan RTX, R9 5900X
74.2 (52.5min, 56.1P0.1, 59.9P1 - 108max) fps -35%
Average NVIDIA Titan RTX
  ()
74.2 fps -35%
Average NVIDIA GeForce RTX 3070
  ()
70.8 fps -38%
2560x1440 Max Preset
Nvidia GeForce RTX 3090 Founders Edition
NVIDIA GeForce RTX 3090, R9 5900X
213 (144min, 170P0.1, 177P1 - 288max) fps +7%
NVIDIA GeForce RTX 3080 Ti Founders Edition
NVIDIA GeForce RTX 3080 Ti, R7 5800X
199 (93min, 150P0.1, 167P1 - 262max) fps
Average NVIDIA GeForce RTX 3090
  (179 - 213, n=2)
196 fps -2%
Average NVIDIA GeForce RTX 3080
  ()
182 fps -9%
Average NVIDIA GeForce RTX 2080 Ti (Desktop)
  ()
147 fps -26%
AMD Ryzen 9 5900X
NVIDIA Titan RTX, R9 5900X
142 (43.4min, 102P0.1, 109P1 - 201max) fps -29%
Average NVIDIA GeForce RTX 3070
  ()
142 fps -29%
Average NVIDIA Titan RTX
  ()
142 fps -29%
1920x1080 Max Preset
Nvidia GeForce RTX 3090 Founders Edition
NVIDIA GeForce RTX 3090, R9 5900X
285 (152min, 198P0.1, 217P1 - 395max) fps +22%
NVIDIA GeForce RTX 3080 Ti Founders Edition
NVIDIA GeForce RTX 3080 Ti, R7 5800X
234 (92.3min, 159P0.1, 175P1 - 298max) fps
Average NVIDIA GeForce RTX 3090
  (180 - 285, n=2)
233 fps 0%
AMD Ryzen 9 5900X
NVIDIA Titan RTX, R9 5900X
212 (117min, 132P0.1, 155P1 - 307max) fps -9%
Average NVIDIA Titan RTX
  ()
212 fps -9%
Average NVIDIA GeForce RTX 3080
  ()
186 fps -21%
Average NVIDIA GeForce RTX 3070
  ()
183 fps -22%
Average NVIDIA GeForce RTX 2080 Ti (Desktop)
  ()
181 fps -23%
Days Gone
3840x2160 Very High Preset
Average NVIDIA GeForce RTX 3090
  (81.2 - 88.7, n=2)
85 fps +2%
NVIDIA GeForce RTX 3080 Ti Founders Edition
NVIDIA GeForce RTX 3080 Ti, R7 5800X
83.3 (24.2min, 39.7P0.1, 58.5P1 - 229max) fps
Nvidia GeForce RTX 3090 Founders Edition
NVIDIA GeForce RTX 3090, R9 5900X
81.2 (30.6min, 39.4P0.1, 55.6P1 - 168max) fps -3%
Average NVIDIA GeForce RTX 3080
  ()
78.6 fps -6%
AMD Ryzen 9 5900X
NVIDIA Titan RTX, R9 5900X
64.9 (32min, 34.4P0.1, 48.3P1 - 168max) fps -22%
Average NVIDIA Titan RTX
  ()
64.9 fps -22%
Average NVIDIA GeForce RTX 2080 Ti (Desktop)
  ()
63.9 fps -23%
Average NVIDIA GeForce RTX 3070
  ()
57.8 fps -31%
2560x1440 Very High Preset
NVIDIA GeForce RTX 3080 Ti Founders Edition
NVIDIA GeForce RTX 3080 Ti, R7 5800X
137 (32.9min, 55.8P0.1, 81.9P1 - 376max) fps
Average NVIDIA GeForce RTX 3090
  (133 - 139, n=2)
136 fps -1%
Nvidia GeForce RTX 3090 Founders Edition
NVIDIA GeForce RTX 3090, R9 5900X
133 (34.2min, 47.6P0.1, 71.1P1 - 307max) fps -3%
Average NVIDIA GeForce RTX 3080
  ()
131 fps -4%
AMD Ryzen 9 5900X
NVIDIA Titan RTX, R9 5900X
108 (35.4min, 45.8P0.1, 62.8P1 - 276max) fps -21%
Average NVIDIA Titan RTX
  ()
108 fps -21%
Average NVIDIA GeForce RTX 2080 Ti (Desktop)
  ()
105 fps -23%
Average NVIDIA GeForce RTX 3070
  ()
99.3 fps -28%
1920x1080 Very High Preset
NVIDIA GeForce RTX 3080 Ti Founders Edition
NVIDIA GeForce RTX 3080 Ti, R7 5800X
178 (22min, 64.2P0.1, 106P1 - 378max) fps
Nvidia GeForce RTX 3090 Founders Edition
NVIDIA GeForce RTX 3090, R9 5900X
164 (30.3min, 46.6P0.1, 78.1P1 - 336max) fps -8%
Average NVIDIA GeForce RTX 3090
  (159 - 164, n=2)
161.5 fps -9%
Average NVIDIA GeForce RTX 3080
  ()
158 fps -11%
AMD Ryzen 9 5900X
NVIDIA Titan RTX, R9 5900X
141 (26.3min, 48.7P0.1, 74.9P1 - 300max) fps -21%
Average NVIDIA Titan RTX
  ()
141 fps -21%
Average NVIDIA GeForce RTX 2080 Ti (Desktop)
  ()
135 fps -24%
Average NVIDIA GeForce RTX 3070
  ()
131 fps -26%
Control
1920x1080 High Quality Preset & High Ray Tracing Preset (DX12)
NVIDIA GeForce RTX 3080 Ti Founders Edition
NVIDIA GeForce RTX 3080 Ti, R7 5800X
114 (5.37min, 73.8P0.1, 94.6P1 - 164max) fps
Average NVIDIA GeForce RTX 3090
  (91.4 - 122.6, n=5)
111.1 fps -3%
Nvidia GeForce RTX 3090 Founders Edition
NVIDIA GeForce RTX 3090, R9 5900X
106.9 fps -6%
ASUS GeForce RTX 3080 ROG STRIX OC GAMING
NVIDIA GeForce RTX 3080, R9 5900X
103 (94min - 116max) fps -10%
Average NVIDIA GeForce RTX 3080
  (98.1 - 103, n=2)
100.6 fps -12%
Average NVIDIA Titan RTX
  (63 - 120, n=3)
88.1 fps -23%
AMD Radeon RX 6900 XT
AMD Radeon RX 6900 XT, R9 5950X (SAM ENABLED)
76.2 (38.7min, 43.3P0.1, 62.8P1 - 142max) fps -33%
AMD Radeon RX 6900 XT
AMD Radeon RX 6900 XT, R9 5950X
73.1 (31.6min, 40.9P0.1, 62.6P1 - 149max) fps -36%
Average NVIDIA GeForce RTX 2080 Ti (Desktop)
  (72 - 76, n=2)
74 fps -35%
KFA2 GeForce RTX 2080 Ti EX
NVIDIA GeForce RTX 2080 Ti (Desktop), R9 3900X
72 (67min - 80max) fps -37%
Average NVIDIA GeForce RTX 3070
  (57.9 - 75.1, n=3)
68.5 fps -40%
AMD Radeon RX 6800 XT
AMD Radeon RX 6800 XT, R9 5950X
66.9 (60min - 75max) fps -41%
MSI GeForce RTX 3070 Gaming X Trio
NVIDIA GeForce RTX 3070, R9 5900X
57.9 (29min - 79max) fps -49%
Average NVIDIA GeForce RTX 2080 Super (Desktop)
  ()
53.2 fps -53%
3840x2160 High Quality Preset (DX11)
NVIDIA GeForce RTX 3080 Ti Founders Edition
NVIDIA GeForce RTX 3080 Ti, R7 5800X
64.9 (41.3min, 50.5P0.1, 55.3P1 - 127max) fps
Average NVIDIA GeForce RTX 3090
  (61.3 - 66, n=5)
62.9 fps -3%
Nvidia GeForce RTX 3090 Founders Edition
NVIDIA GeForce RTX 3090, R9 5900X
61.3 fps -6%
Average NVIDIA GeForce RTX 3080
  (56.2 - 56.7, n=2)
56.5 fps -13%
ASUS GeForce RTX 3080 ROG STRIX OC GAMING
NVIDIA GeForce RTX 3080, R9 5900X
56.2 (49min - 64max) fps -13%
AMD Radeon RX 6900 XT
AMD Radeon RX 6900 XT, R9 5950X
54.7 (39.8min, 41.7P0.1, 44.9P1 - 65.8max) fps -16%
AMD Radeon RX 6900 XT
AMD Radeon RX 6900 XT, R9 5950X (SAM ENABLED)
53.9 (36.6min, 41.7P0.1, 43.5P1 - 64.9max) fps -17%
AMD Radeon RX 6800 XT
AMD Radeon RX 6800 XT, R9 5950X
51.6 (46min - 58max) fps -20%
Average NVIDIA Titan RTX
  (45.2 - 47.3, n=3)
46.5 fps -28%
Average NVIDIA GeForce RTX 2080 Ti (Desktop)
  (42.6 - 45.8, n=2)
44.2 fps -32%
KFA2 GeForce RTX 2080 Ti EX
NVIDIA GeForce RTX 2080 Ti (Desktop), R9 3900X
42.6 (37min - 49max) fps -34%
MSI GeForce RTX 3070 Gaming X Trio
NVIDIA GeForce RTX 3070, R9 5900X
42.3 (37min - 49max) fps -35%
Average NVIDIA GeForce RTX 3070
  (40.6 - 42.3, n=3)
41.3 fps -36%
Average NVIDIA GeForce RTX 2080 Super (Desktop)
  ()
30.4 fps -53%
2560x1440 High Quality Preset (DX11)
NVIDIA GeForce RTX 3080 Ti Founders Edition
NVIDIA GeForce RTX 3080 Ti, R7 5800X
122 (52.6min, 86.2P0.1, 99.3P1 - 392max) fps
Average NVIDIA GeForce RTX 3090
  (115.8 - 123.7, n=5)
120.4 fps -1%
Nvidia GeForce RTX 3090 Founders Edition
NVIDIA GeForce RTX 3090, R9 5900X
115.8 fps -5%
AMD Radeon RX 6900 XT
AMD Radeon RX 6900 XT, R9 5950X
113 (71.5min, 73.2P0.1, 79.6P1 - 164max) fps -7%
AMD Radeon RX 6900 XT
AMD Radeon RX 6900 XT, R9 5950X (SAM ENABLED)
113 (68min, 71.3P0.1, 81.1P1 - 193max) fps -7%
AMD Radeon RX 6800 XT
AMD Radeon RX 6800 XT, R9 5950X
108 (93min - 123max) fps -11%
ASUS GeForce RTX 3080 ROG STRIX OC GAMING
NVIDIA GeForce RTX 3080, R9 5900X
106 (92min - 123max) fps -13%
Average NVIDIA GeForce RTX 3080
  (105 - 106, n=2)
105.5 fps -14%
Average NVIDIA Titan RTX
  (89 - 93.6, n=3)
91.5 fps -25%
Average NVIDIA GeForce RTX 2080 Ti (Desktop)
  (84 - 89, n=2)
86.5 fps -29%
KFA2 GeForce RTX 2080 Ti EX
NVIDIA GeForce RTX 2080 Ti (Desktop), R9 3900X
84 (75min - 95max) fps -31%
MSI GeForce RTX 3070 Gaming X Trio
NVIDIA GeForce RTX 3070, R9 5900X
82.5 (72min - 96max) fps -32%
Average NVIDIA GeForce RTX 3070
  (79.8 - 82.5, n=3)
81.2 fps -33%
Average NVIDIA GeForce RTX 2080 Super (Desktop)
  ()
62 fps -49%
1920x1080 High Quality Preset (DX11)
NVIDIA GeForce RTX 3080 Ti Founders Edition
NVIDIA GeForce RTX 3080 Ti, R7 5800X
181 (49.7min, 115P0.1, 140P1 - 509max) fps
Average NVIDIA GeForce RTX 3090
  (172.2 - 189.2, n=5)
179.9 fps -1%
AMD Radeon RX 6900 XT
AMD Radeon RX 6900 XT, R9 5950X
175 (56.8min, 96P0.1, 112P1 - 314max) fps -3%
AMD Radeon RX 6900 XT
AMD Radeon RX 6900 XT, R9 5950X (SAM ENABLED)
174 (54min, 99P0.1, 112P1 - 335max) fps -4%
Nvidia GeForce RTX 3090 Founders Edition
NVIDIA GeForce RTX 3090, R9 5900X
172.2 fps -5%
AMD Radeon RX 6800 XT
AMD Radeon RX 6800 XT, R9 5950X
168 (145min - 194max) fps -7%
ASUS GeForce RTX 3080 ROG STRIX OC GAMING
NVIDIA GeForce RTX 3080, R9 5900X
155 (133min - 178max) fps -14%
Average NVIDIA GeForce RTX 3080
  (151 - 155, n=2)
153 fps -15%
Average NVIDIA Titan RTX
  (135 - 141.9, n=3)
137.3 fps -24%
Average NVIDIA GeForce RTX 2080 Ti (Desktop)
  (126 - 132, n=2)
129 fps -29%
KFA2 GeForce RTX 2080 Ti EX
NVIDIA GeForce RTX 2080 Ti (Desktop), R9 3900X
126 (111min - 143max) fps -30%
MSI GeForce RTX 3070 Gaming X Trio
NVIDIA GeForce RTX 3070, R9 5900X
122 (103min - 138max) fps -33%
Average NVIDIA GeForce RTX 3070
  (117 - 124.9, n=3)
121.3 fps -33%
Average NVIDIA GeForce RTX 2080 Super (Desktop)
  ()
95 fps -48%
baixo média alto ultraQHD4K
The Witcher 3 (2015) 174 149
Shadow of the Tomb Raider (2018) 178 157 93
Battlefield V (2018) 196 192 136
Far Cry New Dawn (2019) 122 118 100
Metro Exodus (2019) 131 110 74.2
The Division 2 (2019) 143 121 76.6
Total War: Three Kingdoms (2019) 151.2 103.4 51.4
Control (2019) 181 122 64.9
Borderlands 3 (2019) 129 114 71.2
Red Dead Redemption 2 (2019) 112 92.5 62.7
Doom Eternal (2020) 388 316 191
Gears Tactics (2020) 141.1 147.5 88.3
Mafia Definitive Edition (2020) 163 142 86.6
Watch Dogs Legion (2020) 97 88.5 58.7
Dirt 5 (2020) 163 136 92.4
Assassin´s Creed Valhalla (2020) 100 86 61
Call of Duty Black Ops Cold War (2020) 162 131 76.5
Cyberpunk 2077 1.0 (2020) 125 84.3 42.3
Hitman 3 (2021) 267 210.4 119.6
Outriders (2021) 148 151 83.7
Resident Evil Village (2021) 234 199 114
Days Gone (2021) 178 137 83.3

Emissões - Inconsistente a 350 W TGP

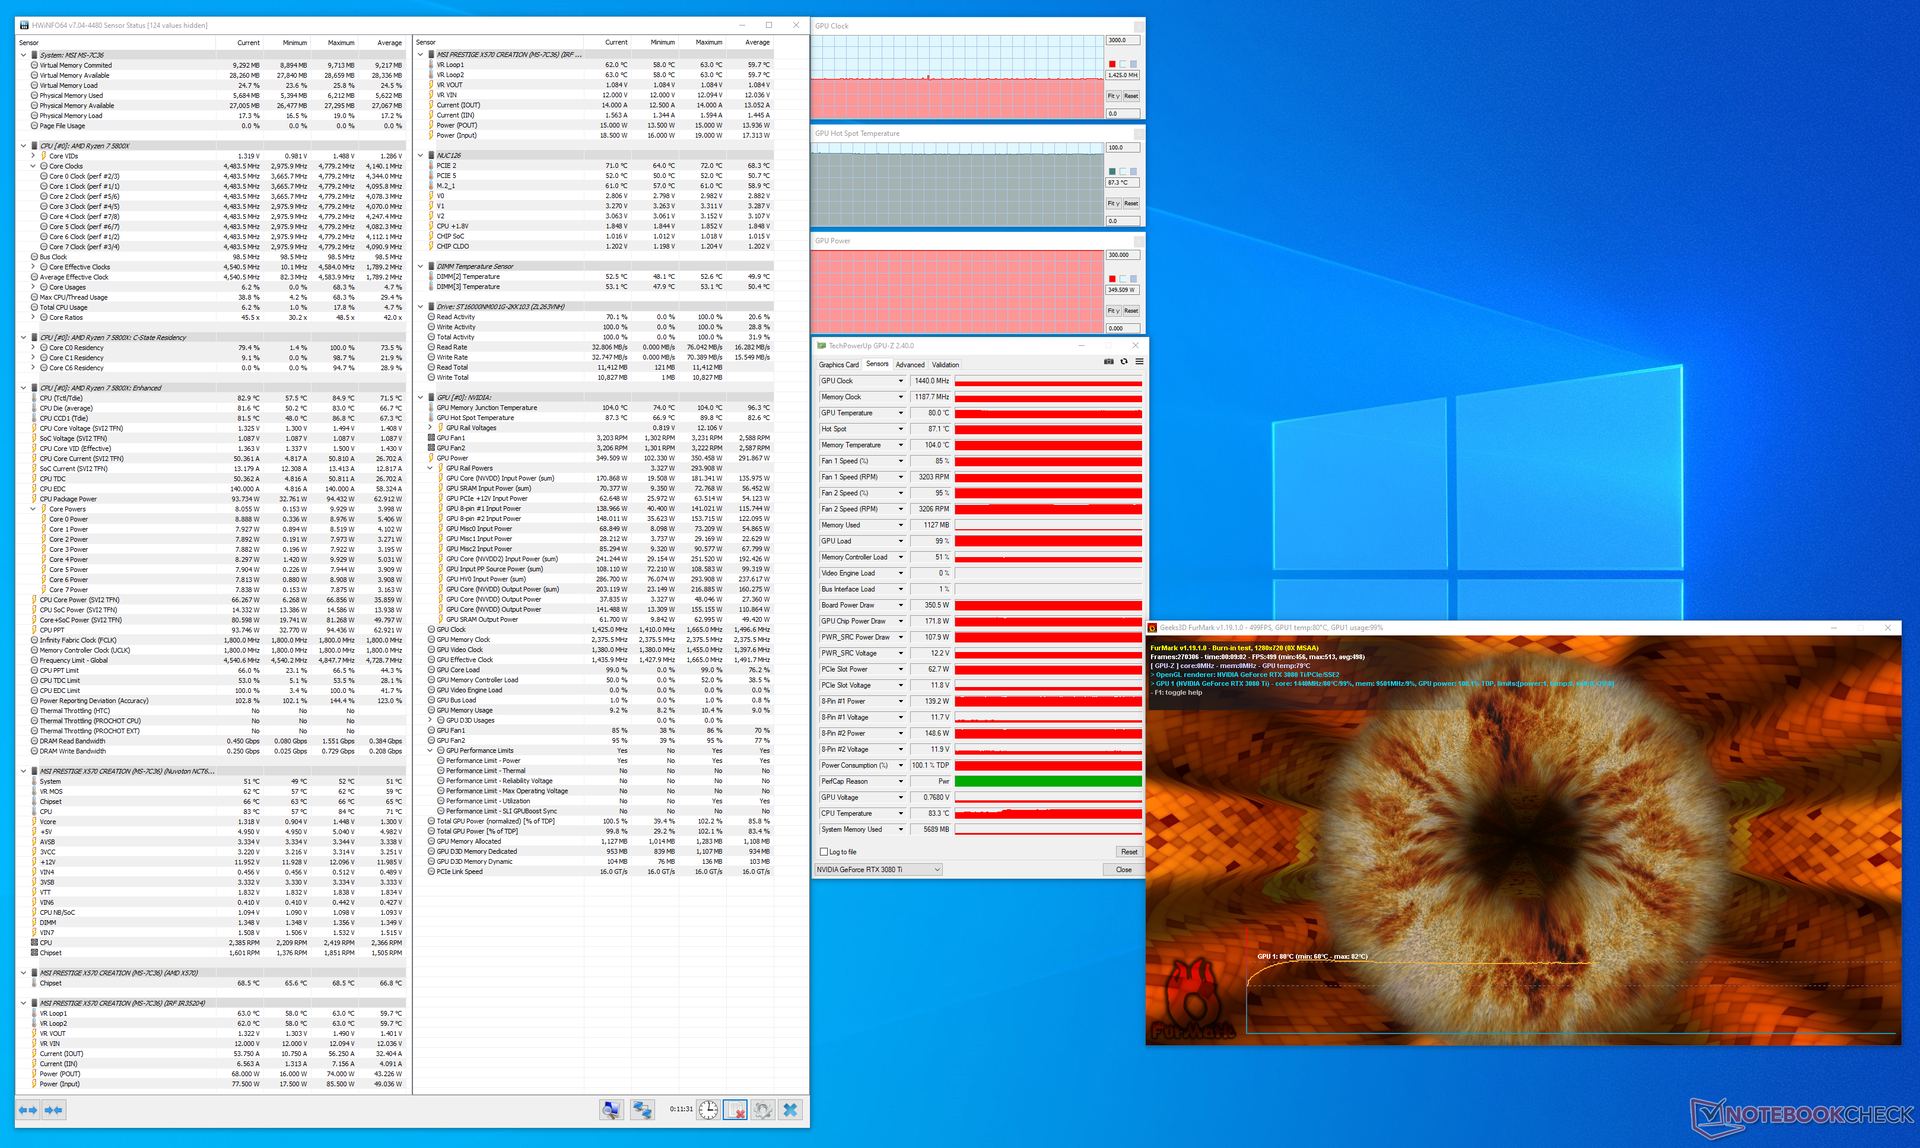
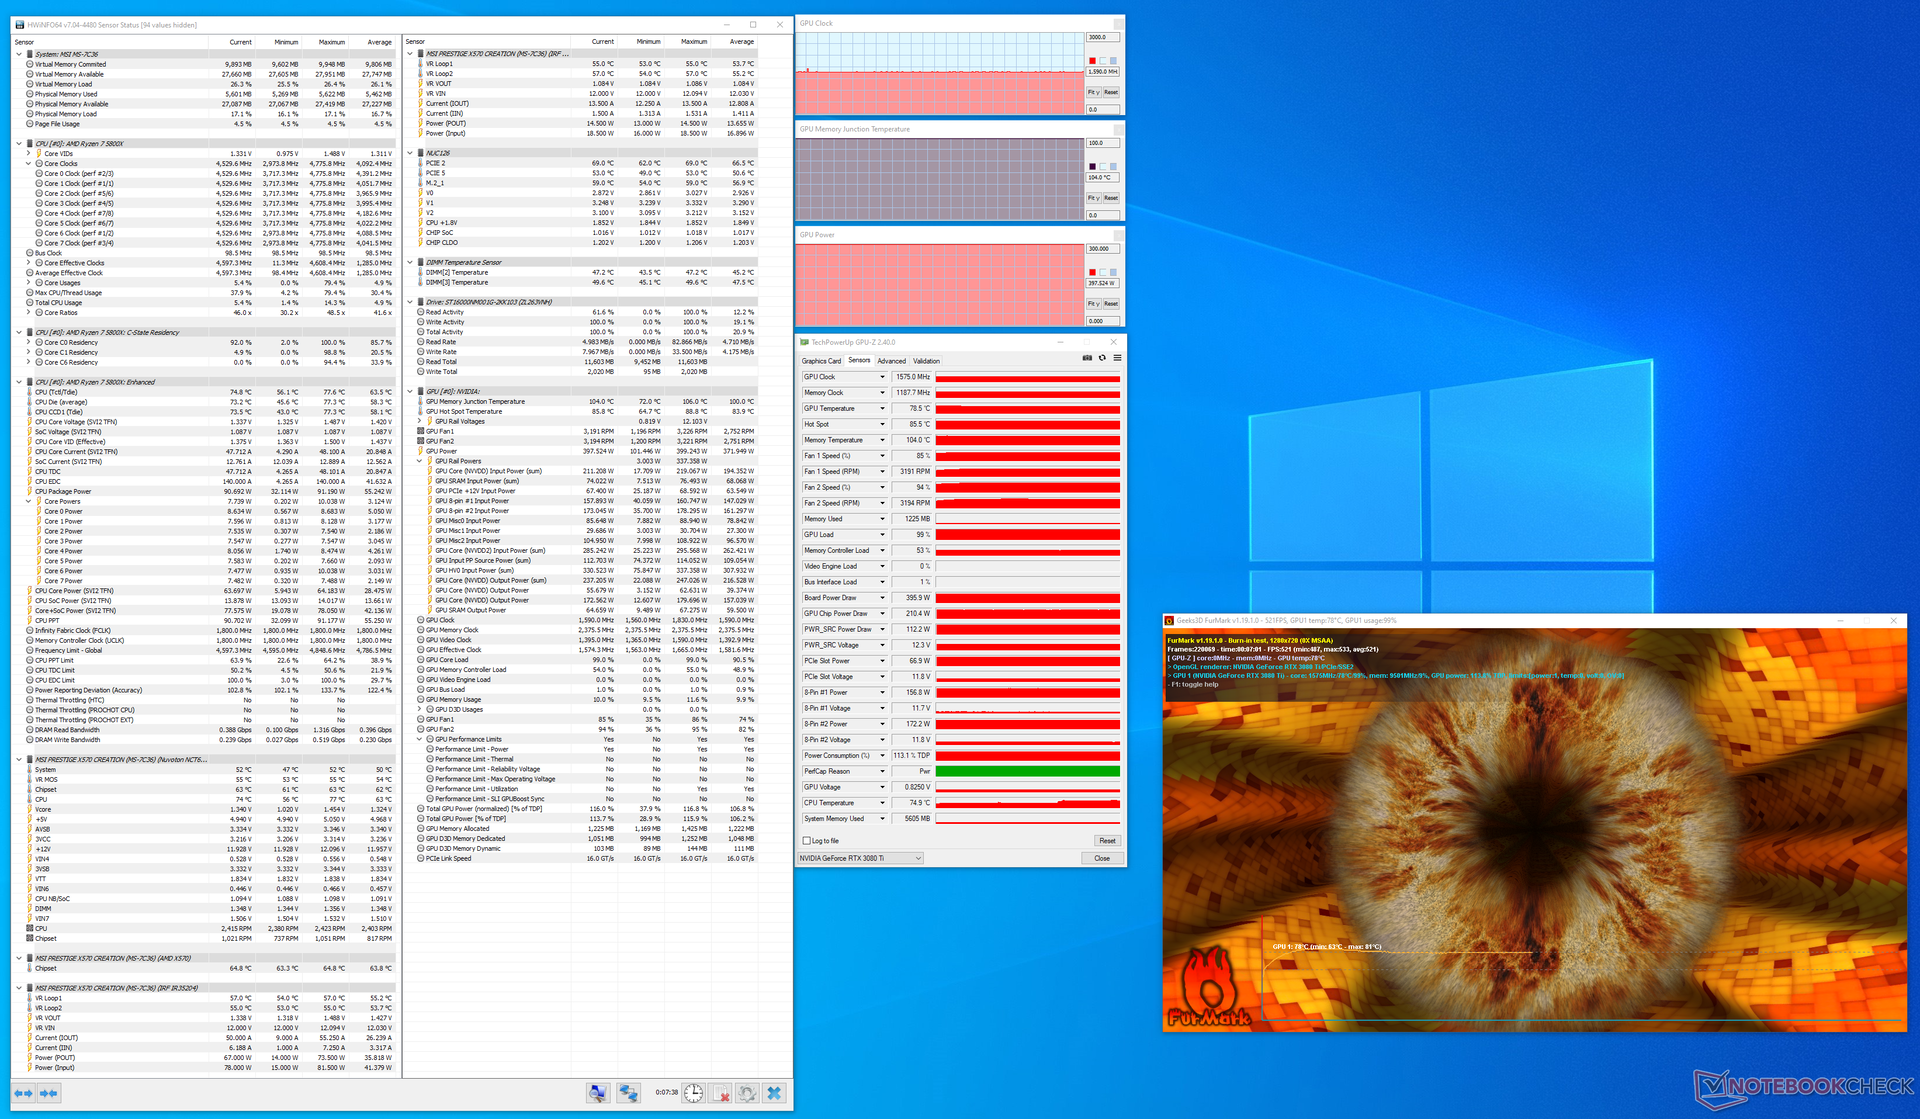
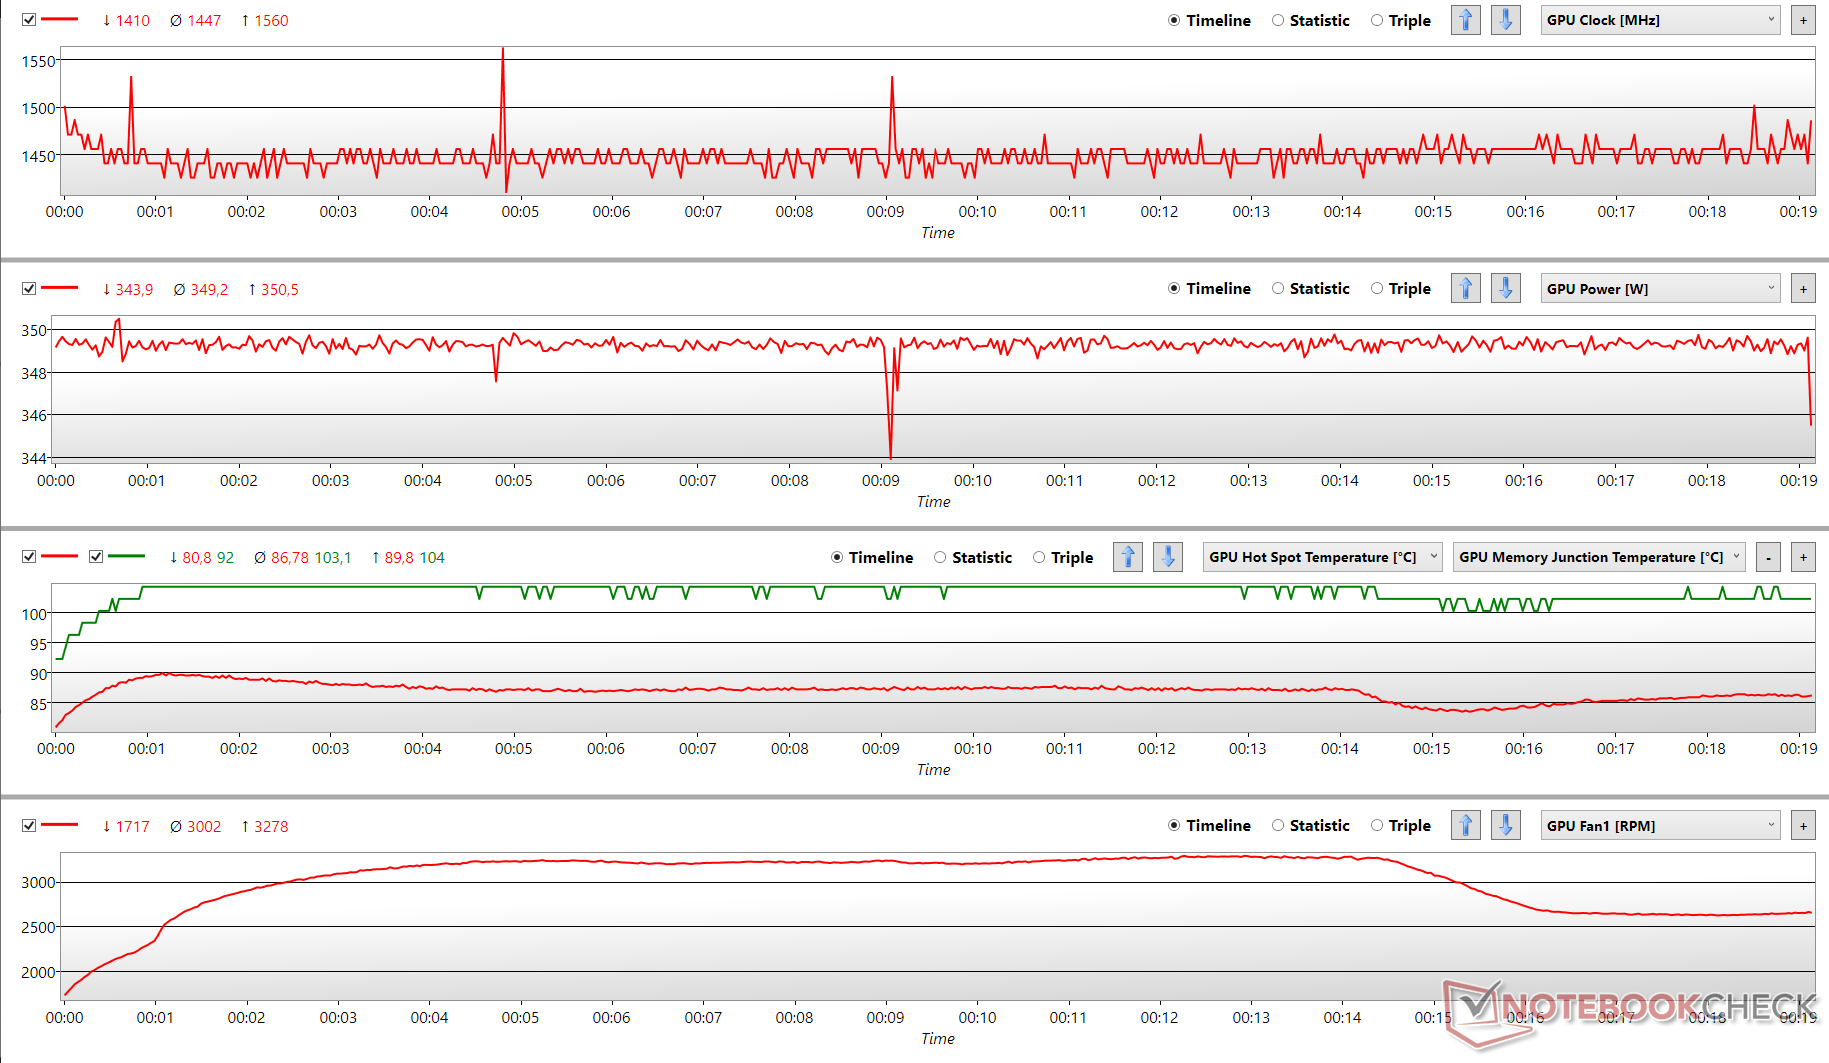
O RTX 3080 Ti é classificado com um TGP de 350 W, que pode ser aumentado em mais 14% a 400 W, conforme especificado no VBIOS. O fato de se destacar a placa com FurMark a 350 W (100% de potência alvo) resulta no núcleo da GPU atingindo 80 °C e os relógios pairando em torno de 1.440 MHz. Notamos que a placa baixou sua meta de potência, às vezes até 345 W, devido à meta de temperatura definida a 83 °Cdurante a qual os relógios aumentam momentaneamente até um máximo de 1.550 MHz. A NVIDIA poderia ter feito um trabalho melhor com o sistema de resfriamento, embora como os ventiladores pareciam estrangular por quase 1000 RPM no final da corrida,percebendo uma queda momentânea na temperatura do ponto quente.

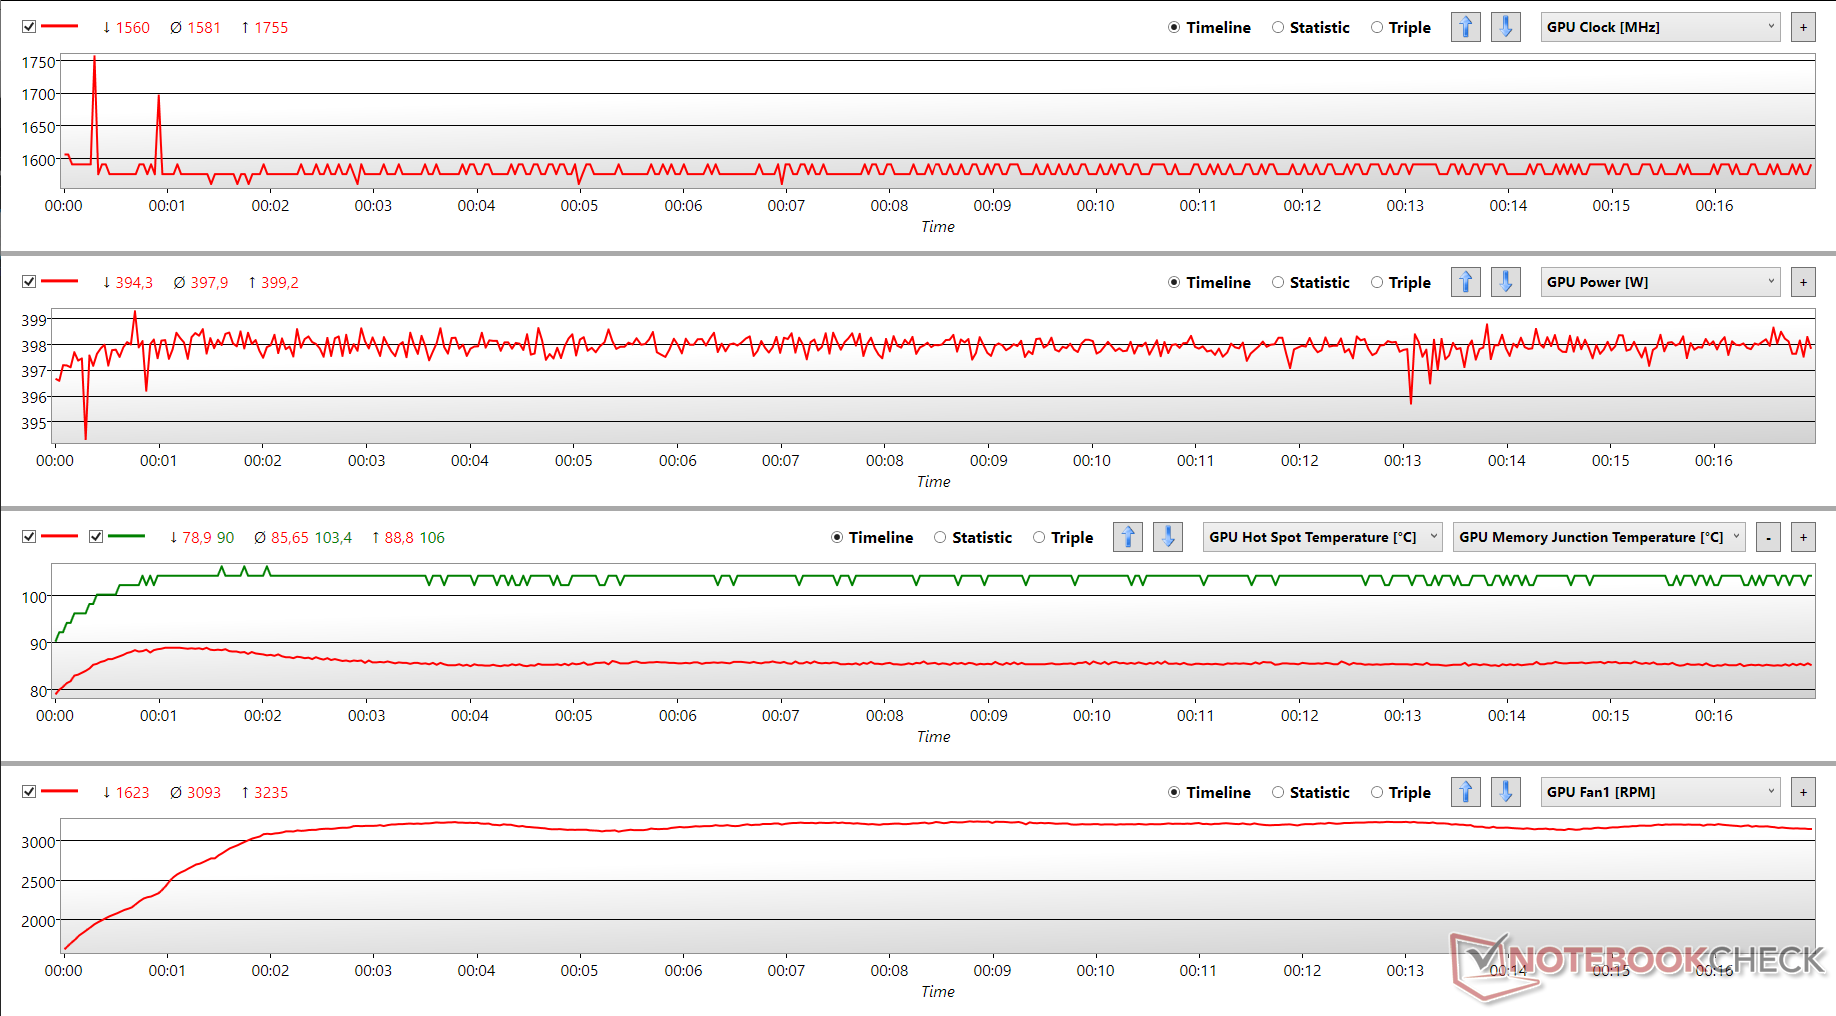
Aumentar a meta de potência para 114% (400 W) através da ferramenta de desempenho integrada em GeForce A experiência oferece um quadro muito diferente. Não só vemos relógios mais altos (1.590 MHz), mas também um impulso melhor sustentado sem picos maiores, apesar do núcleo ter atingido níveis de temperatura semelhantes. A redução automática do TGP também é muito menos pronunciada na meta de 114% de potência do que antes e os ventiladores também parecem ser capazes de se manterem bastante bem. No entanto, descobrimos que empurrar o cartão para 400 W pode ser bastante instável às vezes, resultando em colisões.

Um TGP de 350 W é a configuração padrão de potência, mas a placa não mostra um perfil de relógio consistente durante o estresse. Os entusiastas podem ver o benefício de aumentar um pouco o objetivo de potência no interesse de aumentos mais altos e mais estáveis

De modo geral,parece que a NVIDIA tem uma GPU RTX 3090 GA102 quase cheia em um chassi RTX 3080 resultando em problemas térmicos e de estabilidade quando empurrada para o gancho. Dito isto, não tivemos nenhum problema de estrangulamento durante os jogos, portantoestas inconsistências podem não ser percebidas imediatamente no uso no mundo real.

Tensão FurMark a 100% PT
Tensão FurMark a 114% PT
Parâmetros da GPU durante a tensão FurMark a 100% PT (temperatura do ponto quente da GPU - vermelho, temperatura de junção da memória da GPU - verde)
Parâmetros da GPU durante a tensão FurMark a 114% PT (temperatura do ponto quente da GPU - vermelho, temperatura de junção da memória da GPU - verde)

Consumo de energia

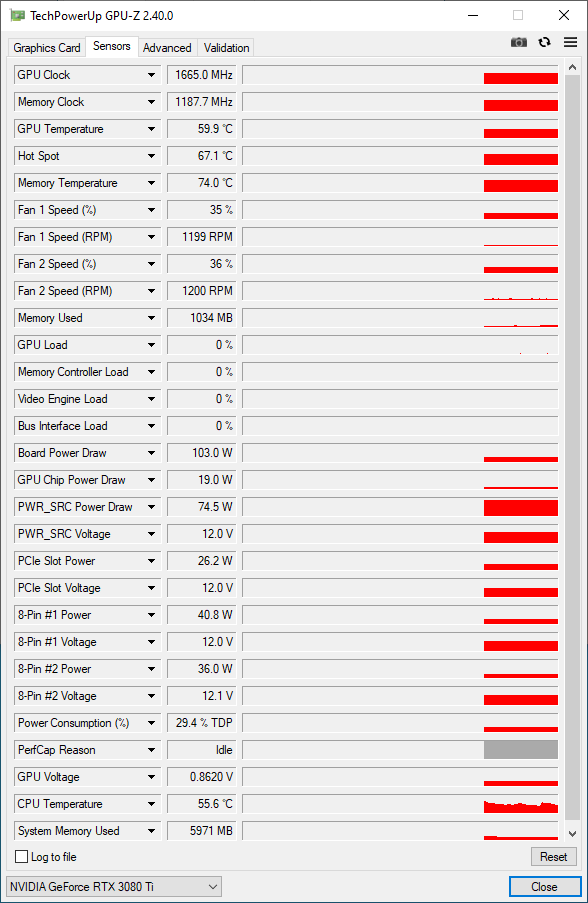
Em modo inativo, o RTX 3080 Ti tem uma potência total da placa de cerca de 103 W com o desenho do chip GA102 de 21 W. Sob carga, a GPU GA102 pode desenhar 172 W para si mesma quando a placa é fixada em um TGP de 350 W. Estes números se assemelham ao que tínhamos visto anteriormente com o MSI GeForce RTX 3080 Gaming X Trio GPU, que ostenta um TGP de 340 W. O RTX 3090 FE na verdade se apresenta como uma opção mais econômica quando se considera o consumo de energia sob estresse. Aumentar a meta de potência para 400 W resulta, consequentemente, no desenho do núcleo da GPU de 210 W sob carga. Comparativamente, o núcleo do RX 6900 XT desenha cerca de 255 W durante a tensão FurMark a uma meta de potência de 100%.

Temperatura

Alta temperatura do núcleo GPU mesmo abaixo de 0% de carga

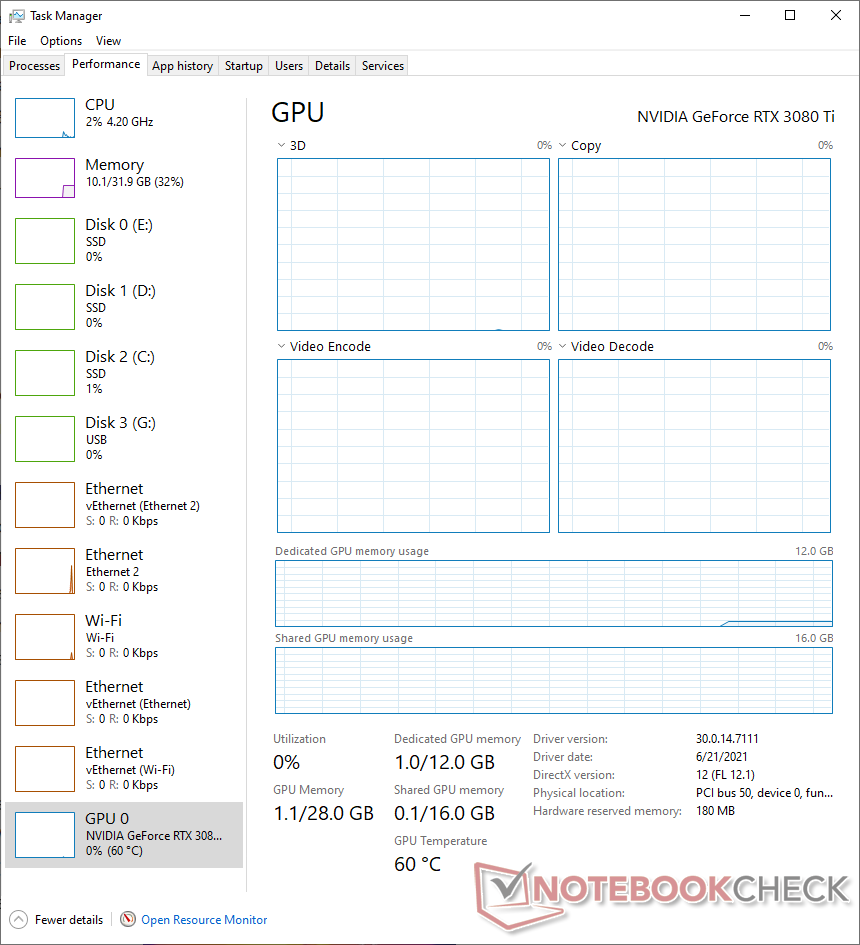
Por algum motivo, nossa unidade RTX 3080 Ti FE sempre apresentou uma temperatura central de 60 °Cmesmo sob ociosidade. Embora a NVIDIA tenha implementado um modo completo de parada do ventilador em todas as placas Ampere FE, devido a tais temperaturas ociosas, encontramos os ventiladores sempre girando a 36% (~1.230 RPM). Isto apesar do Windows Task Manager reportar 0% de atividade em todos os parâmetros da GPU. Também tentamos ajustar o modo de Gerenciamento de Energia para "Normal" no Painel de Controle da NVIDIA, mas isso não pareceu ter nenhum efeito. É possível que este possa ser um problema isolado com nossa unidade, por isso, entramos em contato com a NVIDIA para maiores esclarecimentos.

NVIDIA GeForce Mapa de calor RTX 3080 Ti FE durante a tensão FurMark

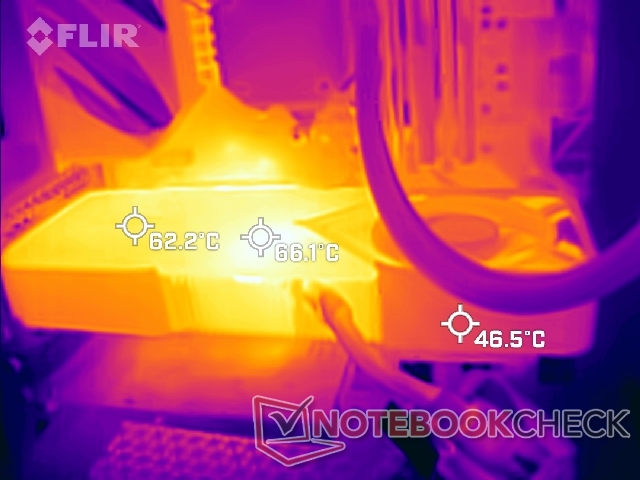
Enquanto o núcleo em si atingiu cerca de 80 °Csob carga, as temperaturas de superfície são mais ou menos as esperadas. Registramos 66 °Cperto da área do núcleo da GPU e cerca de 62 °C pertodos VRMs e da memória em uma temperatura ambiente de cerca de 23 °C .A presença de uma placa traseira de metal parece ser uma vantagem aqui na eficiente dissipação de calor superficial. No entanto, dado o novo projeto do ventilador da NVIDIA, não podemos enfatizar o suficiente a exigência de um bom resfriamento da caixa para conduzir o ar quente para fora.

Uma vez que o ventilador traseiro se esgota em direção ao resfriador AIO e à RAM do sistema, um bom resfriamento da caixa pode ajudar a evitar o acúmulo de calor nos componentes acima da placa, como visto no mapa de calor adjacente. Subvoltar a carda usando utilitários de terceiros pode ajudar a baixar ainda mais as temperaturas. O resfriamento adequado do ambiente também ajuda.

Níveis de ruídos

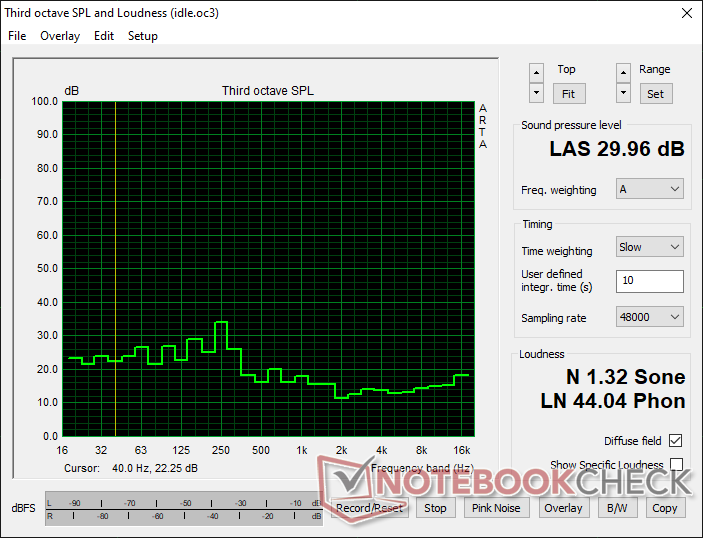
Avaliamos os níveis de ruído do ventilador a uma distância de 20 cm da caixa fechada com todos os outros ventiladores do sistema desligados, exceto a bomba Corsair H115i Capellix AIO, que foi configurada para operar sob o perfil Quiet. Como indicado anteriormente, nunca experimentamos uma parada completa dos ventiladores com nossa unidade. Portanto, os níveis de ruído sob o ocioso pareciam estar um pouco mais altos e estavam perto de 30 dB(A).

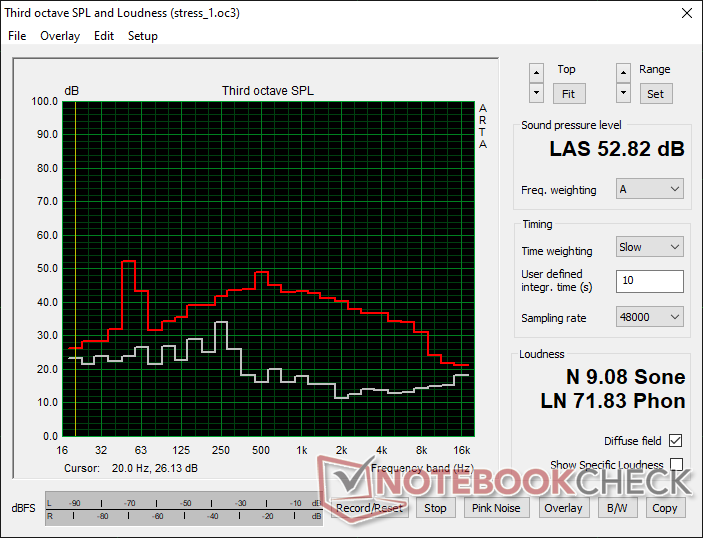
Ao iniciar a tensão FurMark a uma meta de 100% de potência, notamos que os níveis de ruído podem aumentar até 50 dB(A). Registramos um nível máximo de pressão sonora de 53 dB(A) durante a duração do teste.

O uso no mundo real não deve ser tão estressante, mas os altos níveis de ruído podem ficar bastante desconcertantes enquanto se joga. Também notamos alguns choramingos quando os ventiladores funcionavam a toda velocidade. Mais uma vez, é possível que isto possa ser apenas uma má amostra. Entretanto, é claramente evidente que os ventiladores duplos de 85 mm têm que fazer mais trabalho para resfriar adequadamente a GPU GA102 quase cheia, resultando em um ruído do ventilador visivelmente maior do que uma placa RTX 3080 FE típica.

Níveis de ruído - Ocioso com os ventiladores fora do estojo
Níveis de ruído - FurMark stress a 100% PT com os ventiladores do case desligados

Pro

+ Design bom e robusto e qualidade de construção
+ Excelente desempenho em jogos 4K Ultra 60 fps+
+ Desempenho quase indistinguível de um RTX 3090
+ DLSS 2.0 e suporte de traçado de raio em jogos compatíveis
+ Temperaturas de superfície gerenciáveis sob carga

Contra

- Clock inferior ao RTX 3090 FE e RTX 3080 FE
- Emissões elevadas sob carga
- Não muito estável em metas de potência mais elevadas
- Alto nível de ruído do ventilador sob carga
- Custos quase o dobro do RTX 3080 MSRP por apenas cerca de 15% de aumento no desempenho

Veredicto - Ganhos de desempenho e preços não são bem dimensionados

NVIDIA GeForce Edição RTX 3080 Ti Founders. Unidade de revisão, cortesia da NVIDIA Índia.

Talvez pela primeira vez, os jogadores tenham que enfrentar um triplo golpe das restrições da cadeia de suprimentos, preços inflados e a efêmera loucura da mineração de moedas criptográficas. Pelo lado positivo, o novo ressurgimento da AMD trouxe de volta alguma competição muito necessária no espaço da GPU. AEdição dos Fundadores da NVIDIA GeForce RTX 3080 Ti chega a um momento tão crucial na história da GPU.

O RTX 3080 Ti FE traz toda a bondade do design da Ampere's Founders Edition, que parece estar dando aos cartões add-in board (AiB) uma corrida por seu dinheiro. O chassi é premium e, ao contrário do mamute RTX 3090 FE, ele tem um design elegante de 2 slots. A NVIDIA continua a usar o conector de alimentação de 12 pinos, o que pode tornar o gerenciamento de cabos uma tarefa complicada se você não tiver uma PSU moderna com um conector PCIe de 12 pinos.

Entretanto, observamos que o RTX 3080 Ti FE parece não se beneficiar inteiramente do projeto da nova Edição dos Fundadores da NVIDIA. Observamos freqüentes rampas de relógio, altas temperaturas e altos níveis de ruído durante os testes. Deixando de lado a possibilidade de que este poderia ser um problema isolado com nossa amostra de revisão, para todos os efeitos, o RTX 3080 Ti é quase um RTX 3090 no coração. Assim, a utilização deste chip em um chassi destinado ao RTX 3080 é obrigado a resultar em algumas incongruências quando se trata de térmicas.

A NVIDIA GeForce RTX 3080 Ti oferece RTX 3090 níveis de desempenho de jogo em um MSRP que é 300 dólares mais baixo. Embora esta seja sem dúvida a GPU halo que os jogadores hardcore desejariam, ela também é quase duas vezes mais cara que a RTX 3080 para ganhos de performance nominal na maioria dos títulos.

O RTX 3080 Ti visa suplantar o RTX 3080 como a principal GPU Ampere para jogos, e é capaz de fazê-lo com bastante facilidade. No entanto, estamos olhando apenas para uma vantagem de menos de 15% em 4K Ultra na maioria dos títulos. A outra maneira de olhar é que o RTX 3090 tem menos de 5% de vantagem sobre o RTX 3080 Ti na maioria dos jogos, portanto você pode economizar um pouco com o RTX 3080 Ti se o jogo for o caso principal de uso - desde que você seja capaz de realmente comprar o cartão, ou seja. Dado que o RTX 3080 Ti está quase no mesmo nível do RTX 3090 tanto em sintéticos como em jogos, faz sentido optar pelo último apenas se você realmente precisar de toda a bondade da VRAM de 24 GB para tarefas criativas.

Se você não está preocupado com o desempenho de traçado de raio ou DLSS, os Radeon RX 6800 XT e RX 6900 XT da AMD ainda são concorrentes altamente relevantes para o RTX 3080 Ti FE e estão disponíveis em MSRPs muito menores. Dito isto, o desempenho de traçado de raio da AMD já é RTX 2080 Ti-level e a empresa também está trazendo à tona sua própria alternativa DLSS chamada FidelityFX Super Resolution (FSR), que deverá melhorar ainda mais as perspectivas do RDNA 2

Aqueles que procuram jogar as resoluções QHD ou abaixo são mais bem servidos pela RTX 3070 e RTX 3060 Ti a menos que sejam necessárias taxas de quadros realmente altas para acompanhar o ritmo das exibições de alta taxa de atualização.

Preço e disponibilidade

A disponibilidade de GPUs na MSRPs ainda é uma preocupação constante até 2021. A RTX 3080 Ti Founders Edition está fora de estoque na maioria dos varejistas online. Os cartões AiB de empresas como MSI, Asus, EVGA, Zotac e Gigabyte parecem ter uma disponibilidade muito melhor, mas com uma marca significativamente alta. Por exemplo, o MSI Gaming GeForce RTX 3080 Ti Gaming X Trio atualmente varejistas próximos à marca de US$ 2.400 em Newegge Amazônia. Best Buy, entretanto, lista tanto o RTX 3080 Ti FE e outras variantes AiB como esgotadas. A situação no Walmart também não é melhor com cartões como o Zotac AMP Holo GeForce RTX 3080 Ti sendo vendido a US$ 3.399. Recomendamos esperar um pouco mais para que os preços se normalizem antes de decidir sobre uma compra.

Pricecompare

Please share our article, every link counts!
> Análises e revisões de portáteis e celulares > Análises > Análises > NVIDIA GeForce RTX 3080 Ti Revisão da Edição dos Fundadores: Desempenho do RTX 3090 por menos, mas ainda uma proposta de baixo valor
Vaidyanathan Subramaniam, 2021-07- 7 (Update: 2021-07- 7)