NVIDIA GeForce RTX 3060 Ti Revisão da Edição dos Fundadores: Flagship 1440p Ultra e jogo austero 4K por US$ 400
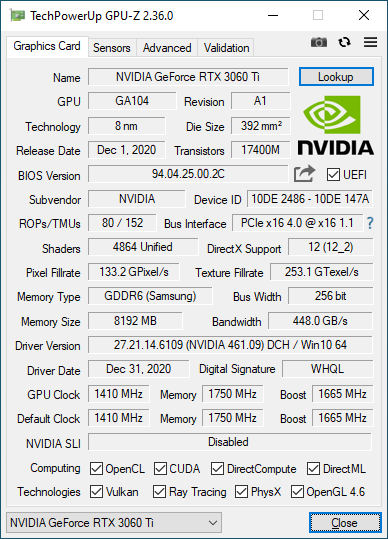
Em dezembro de 2020, a NVIDIA anunciou oficialmente o GeForce RTX 3060 Ti visando a grande maioria dos jogadores de 1080p e 1440p. O RTX 3060 Ti é baseado na mesma GPU GA104 de 8 nm que o RTX 3070, mas permite apenas 4.864 núcleos CUDA.
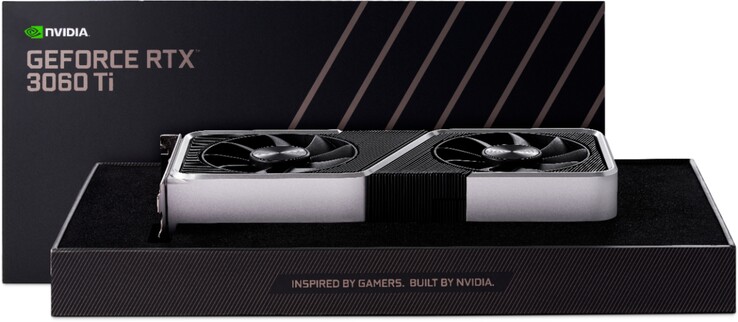
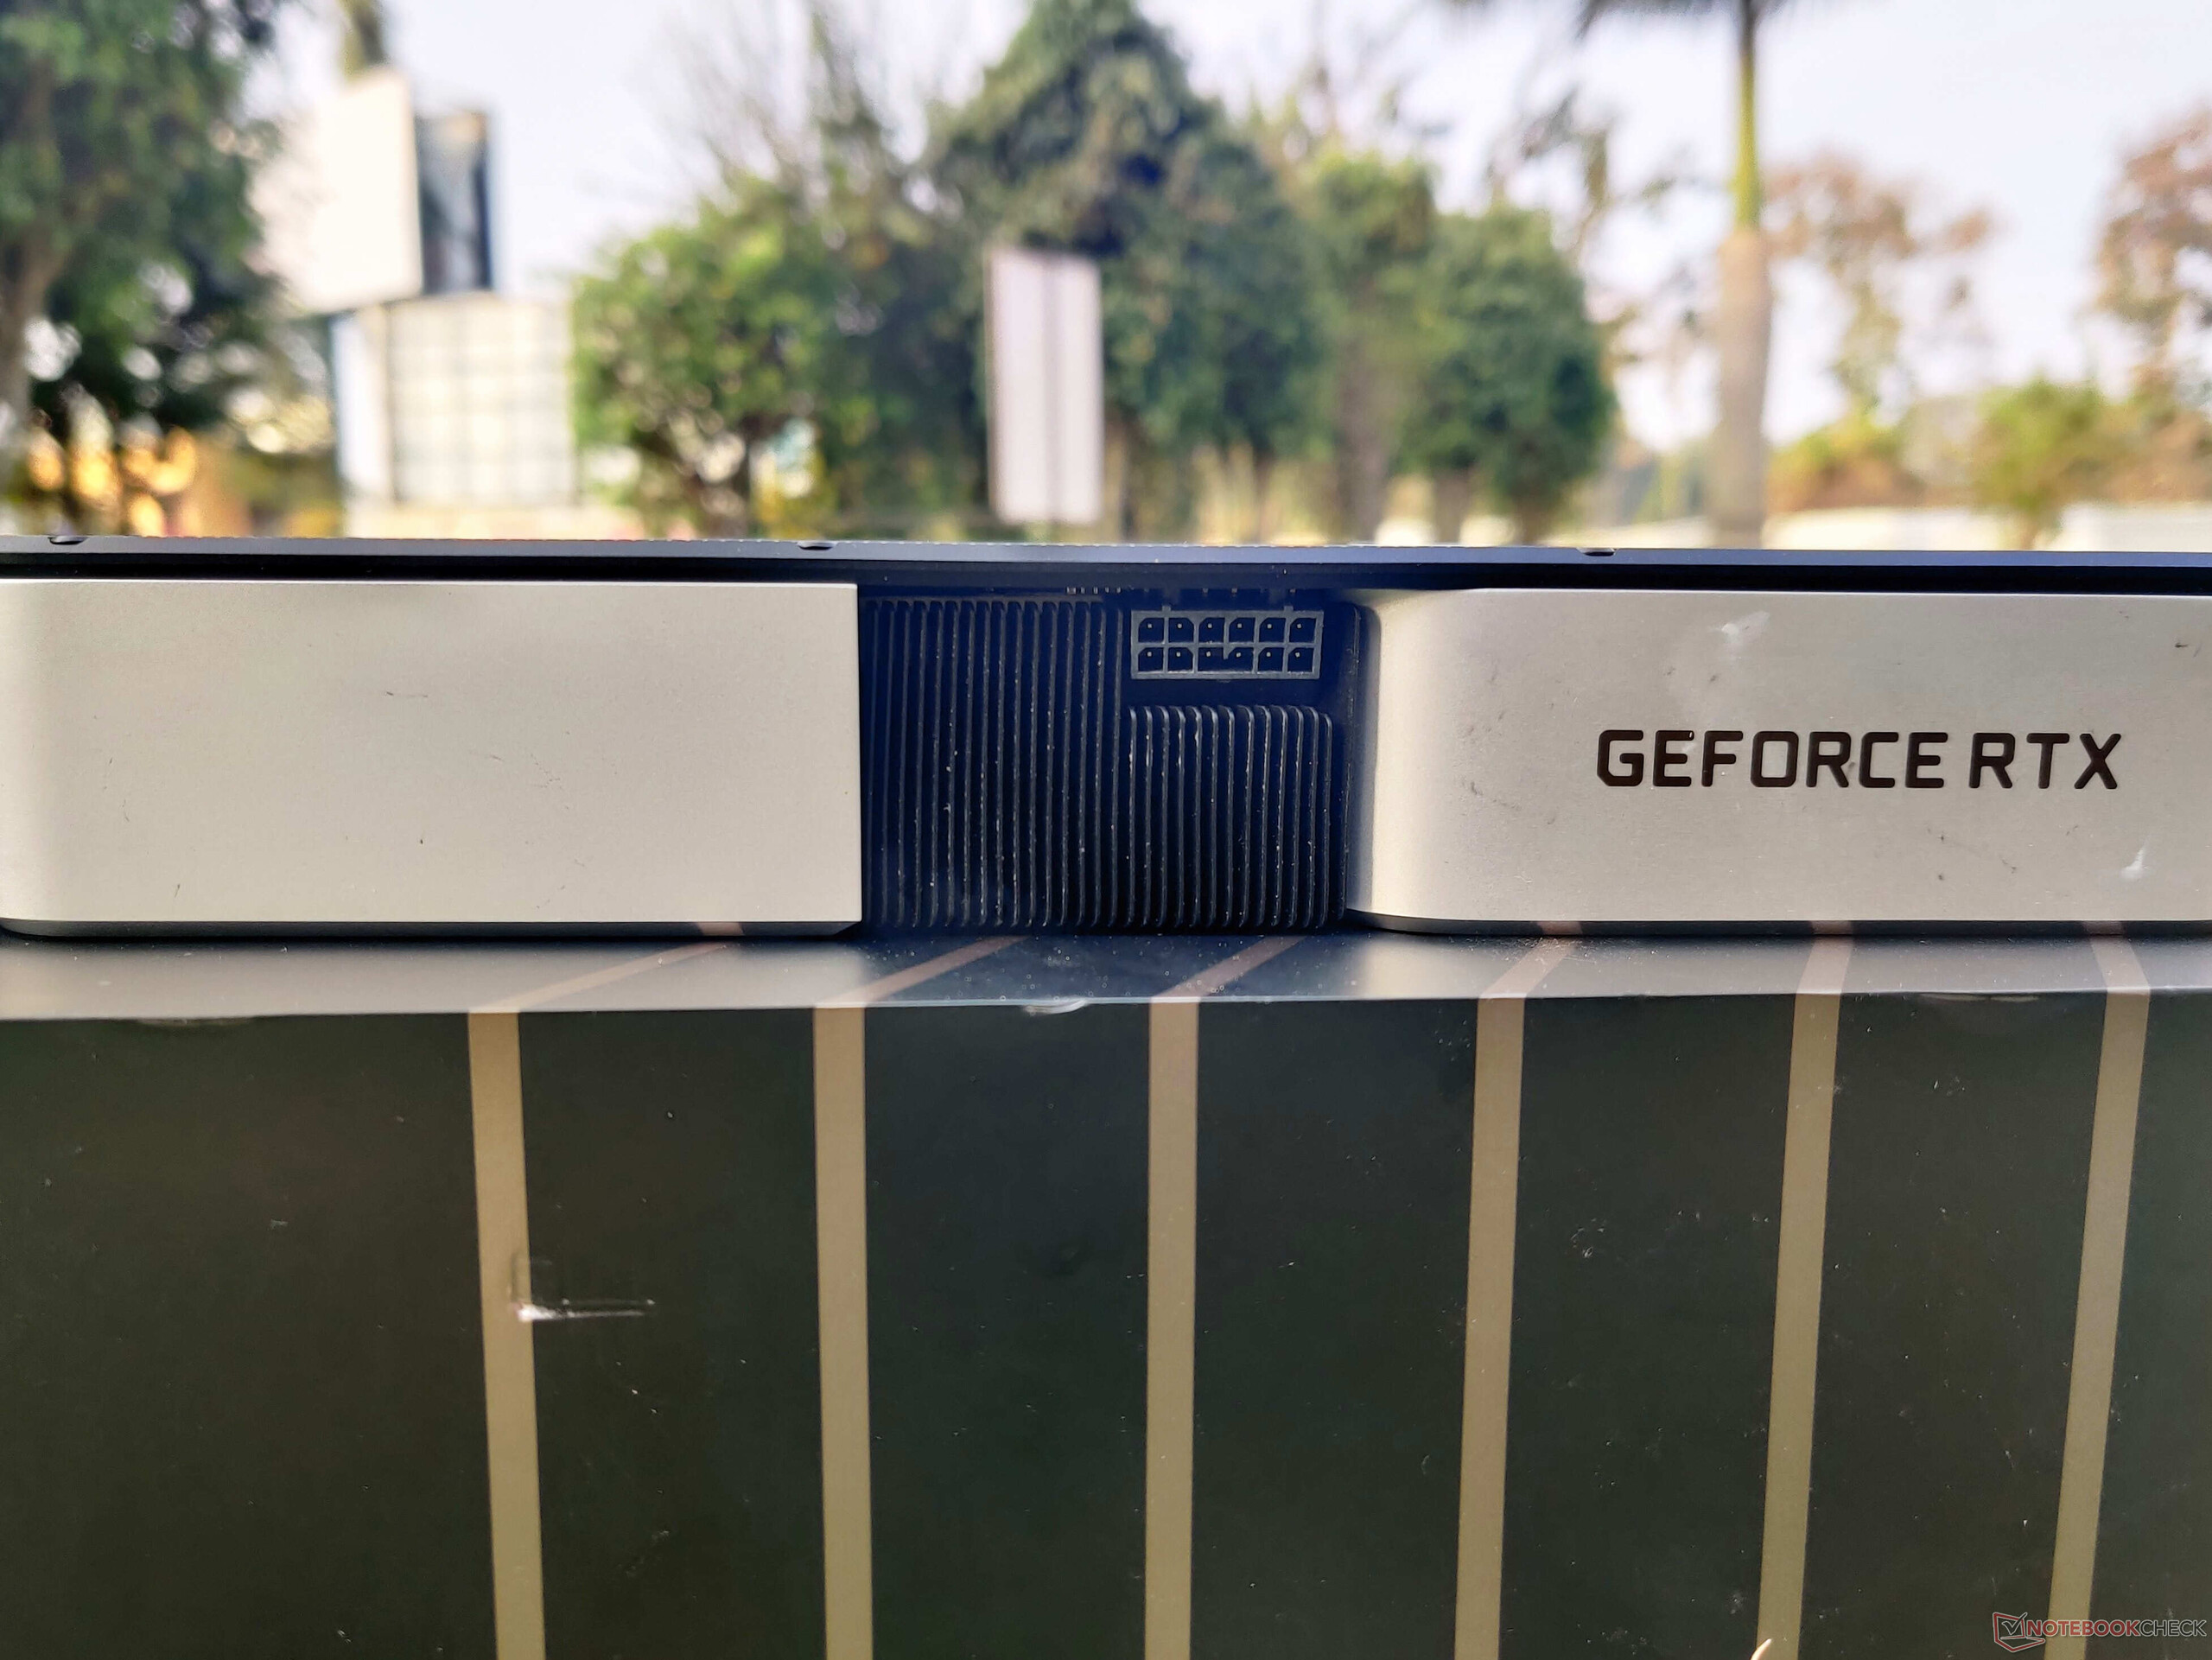
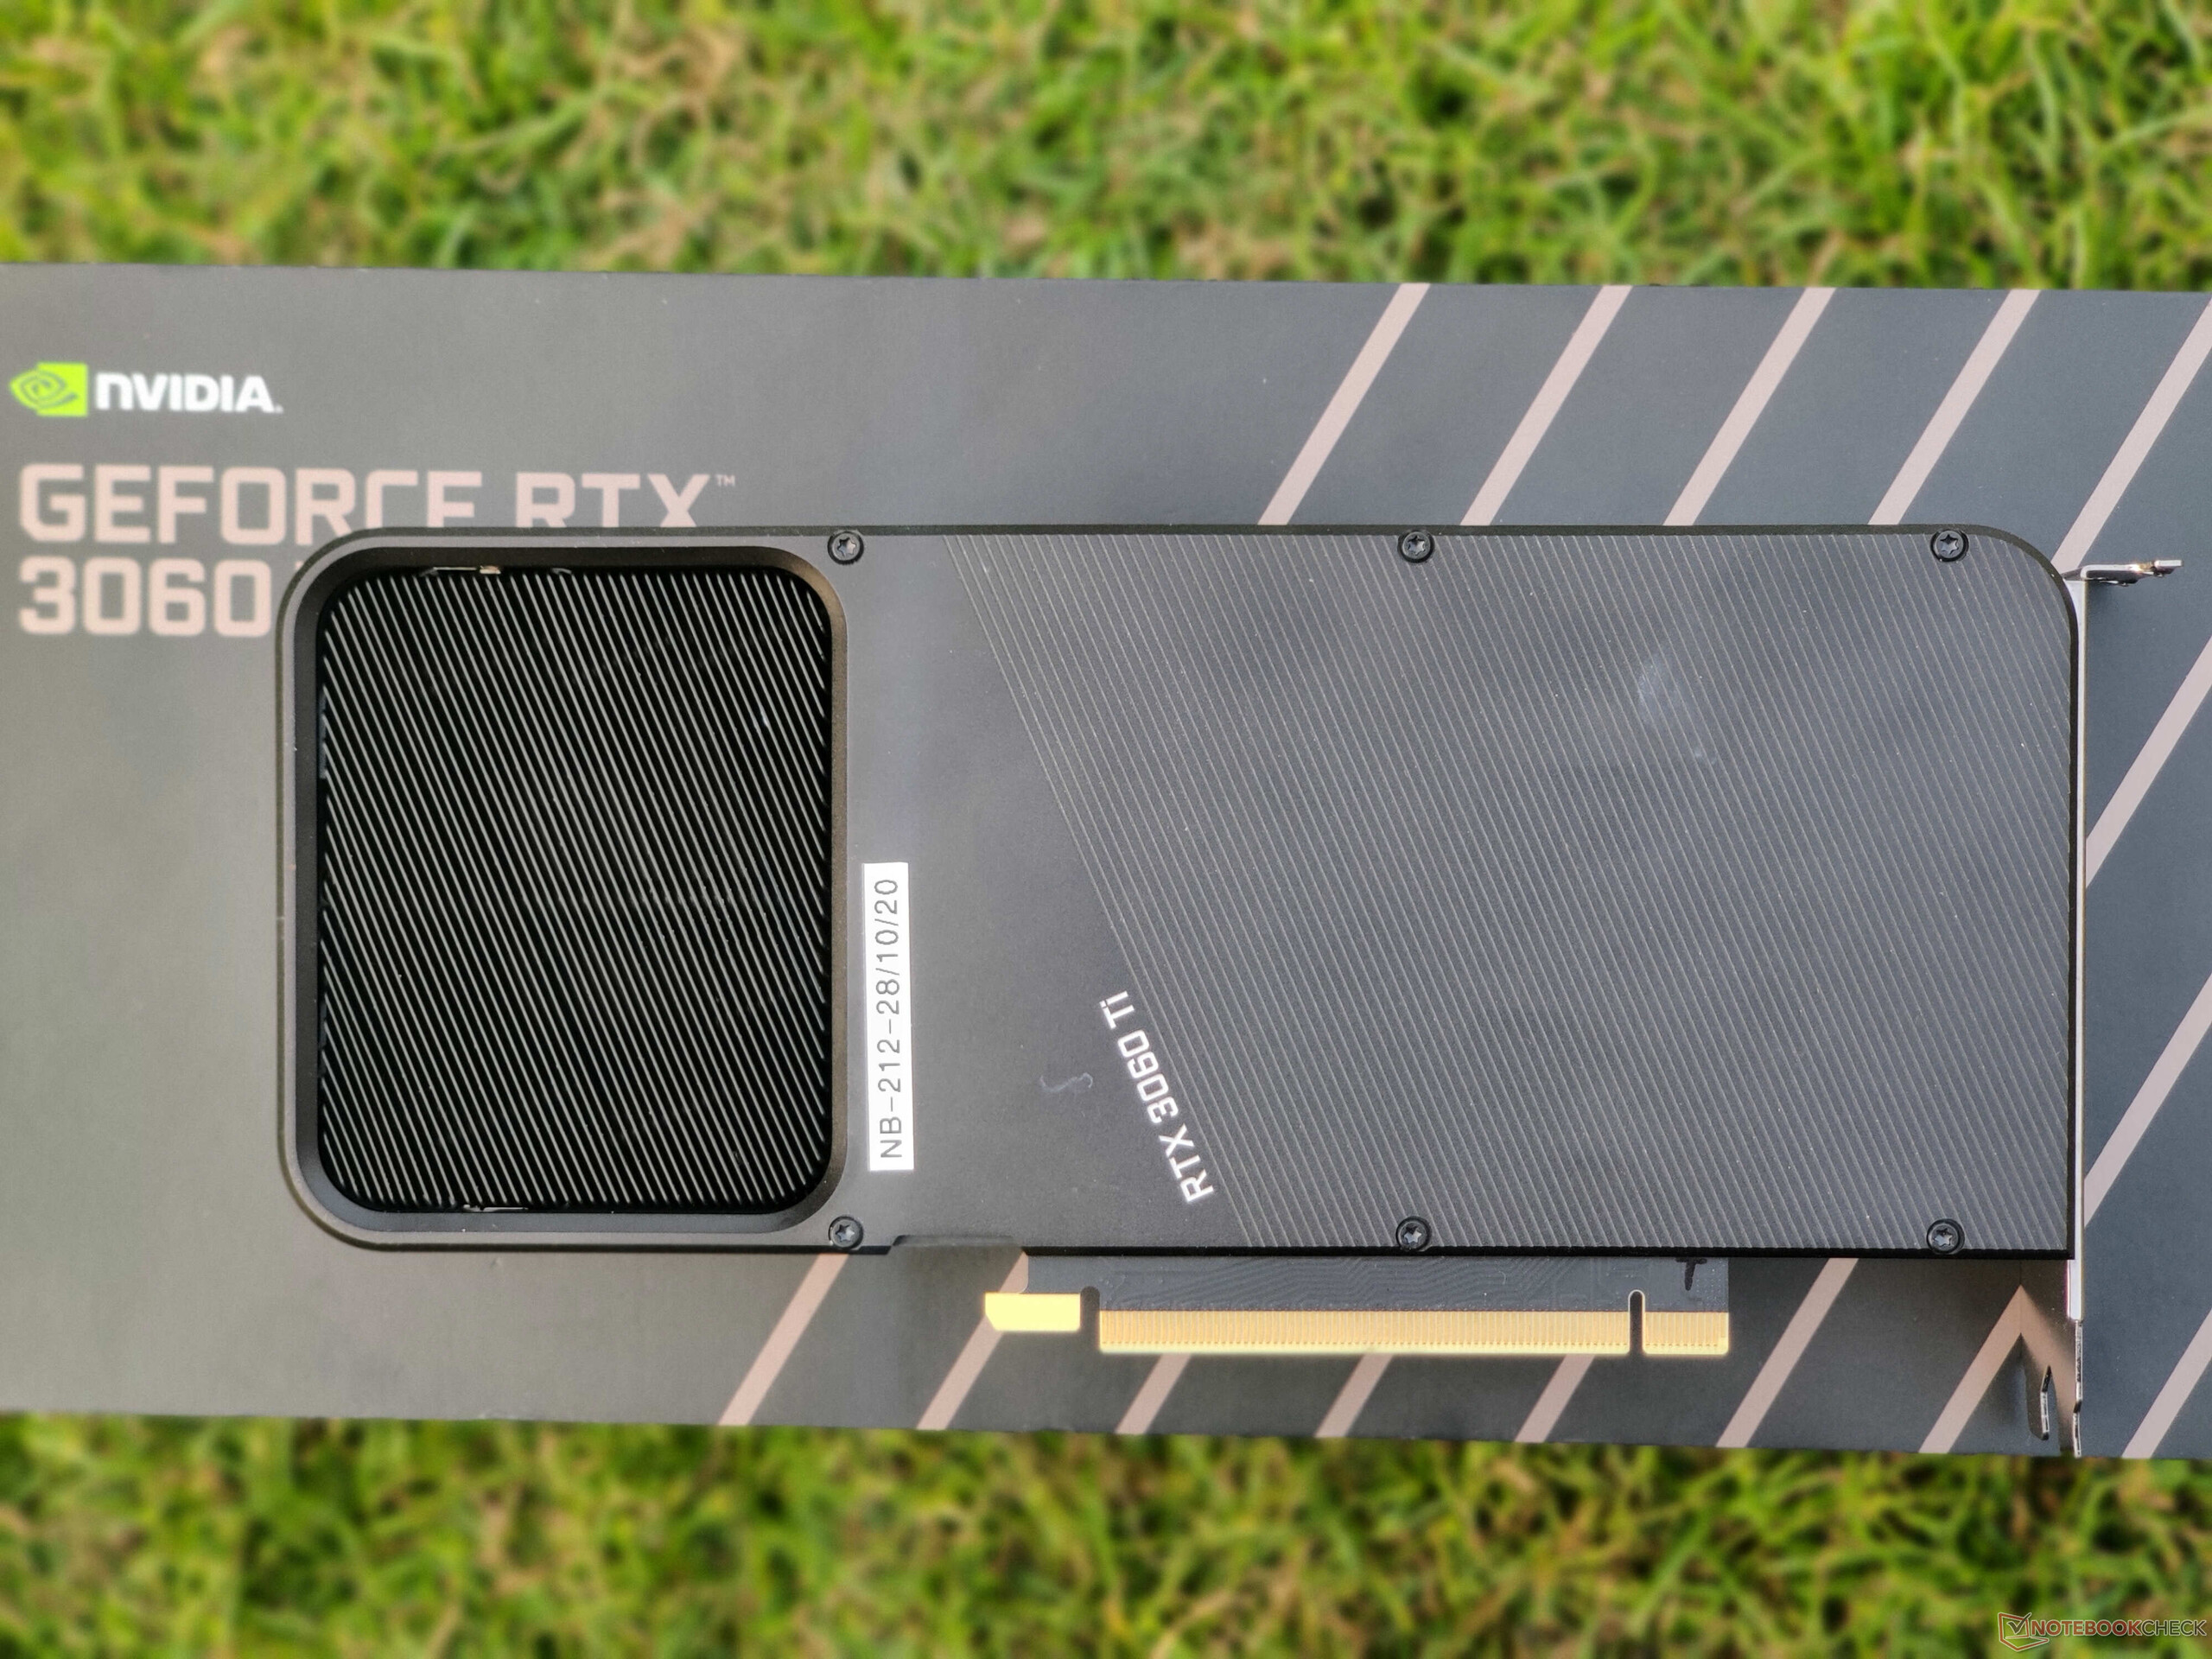
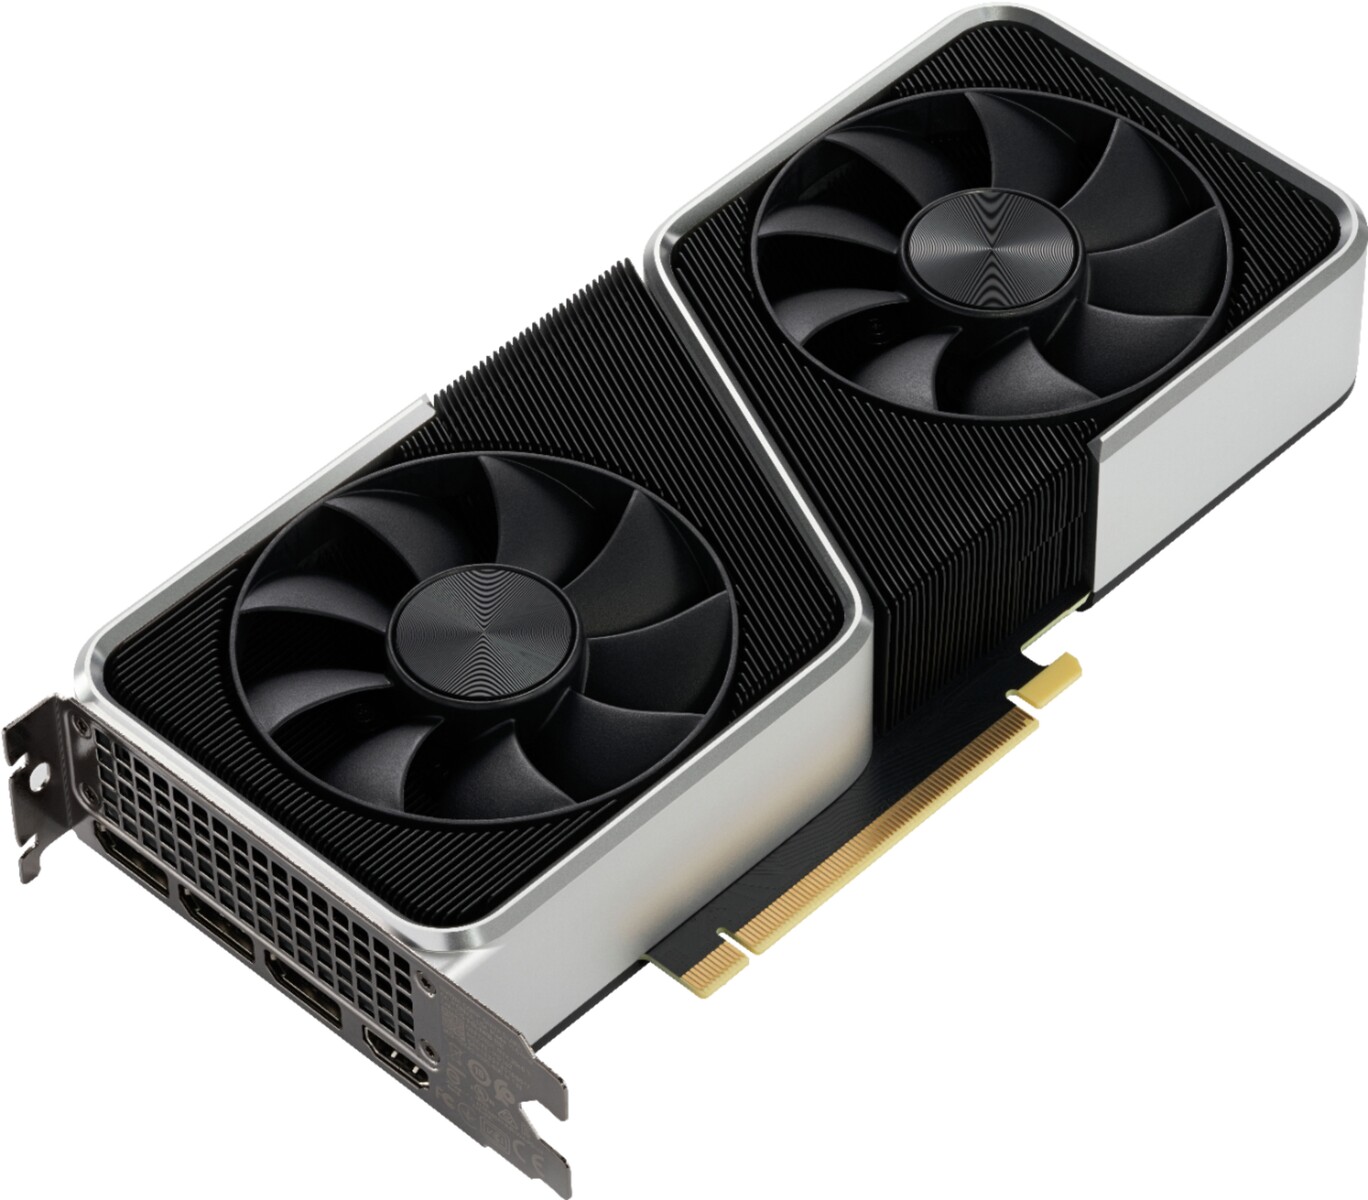
Temos conosco a placa RTX 3060 Ti Founders Edition (FE) da NVIDIA para revisão. A RTX 3060 Ti FE tem um design semelhante ao resto das placas Ampere FE, incluindo o uso de um conector de alimentação Molex MicroFit 3.0 de 12 pinos. Entretanto, ao contrário das outras placas Ampere FE até agora, podemos ver um acabamento metálico prateado brilhante que dá um visual premium.
Com um MSRP de US$ 400, o RTX 3060 Ti pode ser considerado o sucessor espiritual do RTX 2060 Super. Entretanto, o cartão deverá oferecer um desempenho superior ao do RTX 2080 Super por US$300 a menos, tornando-o uma barganha em potencial de mais de uma forma para os jogadores do 1440p Ultra e 1080p de alta taxa de atualização.
Nesta revisão, colocamos o RTX 3060 Ti FE através de seus passos e avaliamos se ele realmente oferece o bang pelo desempenho do buck que a NVIDIA afirma que oferece
Comparação do RTX 3060 Ti com outras GPUs NVIDIA
| Especificação | RTX3090 | RTX3080 FE | RTX3070 FE | RTX3060 Ti FE | Titan RTX | RTX2080 Ti | RTX2080 Super | RTX2070 Super | RTX 2070 Super | TITANX Pascal |
| Chip | GA102 | GA102 | GA104 | GA104 | TU102 | TU102 | TU104 | TU104 | GP102 | |
| Processo FinFET | 8 nm | 8 nm | 8 nm | 8 nm | 8nm | 12 nm | 12 nm | 12 nm | 12 nm | 16 nm |
| CUDA cores | 10,496 | 8,704 | 5,888 | 4,864 | 4,608 | 4,352 | 3,072 | 2,560 | 3,584 | |
| Textureunits | 328 | 272 | 184 | 152 | 288 | 272 | 192 | 160 | 224 | |
| Núcleos Tensores | 328 3ª G. | 272 3ª G. | 184 3ª G. | 1523ª G. | 576 2ª G. | 544 2ª G. | 384 2ª G. | 320 2ª G. | - | |
| RTcores | 82 | 68 | 46 | 38 | 72 | 68 | 48 | 40 | - | |
| Relógio base GPU | 1.395 MHz | 1.440 MHz | 1.500 MHz | 1.410 MHz | 1.350 MHz | 1.350 MHz | 1.650 MHz | 1.605 MHz | 1.417 MHz | |
| Relógio de impulso GPU | 1,695 MHz | 1,710 MHz | 1,750 MHz | 1,665 MHz | 1,770 MHz | 1,545 MHz | 1,815 MHz | 1,770 MHz | 1,531 MHz | |
| Memorybus | 384-bit | 320-bit | 256-bit | 256-bit | 384-bit | 352-bit | 256-bit | 256-bit | 384-bit | |
| Largura de banda de memória | 936 GB/s | 760 GB/s | 448 GB/s | 448GB/s | 672 GB/s | 616 GB/s | 495.9 GB/s | 448 GB/s | 480.4 GB/s | |
| Memória de vídeo | 24 GB GDDR6X | 10 GB GDDR6X | 8 GB GDDR6 | 8GB GDDR6 | 24 GB GDDR6 | 11 GB GDDR6 | 8 GB GDDR6 | 8 GB GDDR6 | 12 GB GDDR5X | |
| Consumo de energia elétrica 350 W320 W220 W200W280 W250 W250 W250 W215 W250 W250 W |
Um tour pela NVIDIA GeForce RTX 3060 Ti Founders Edition
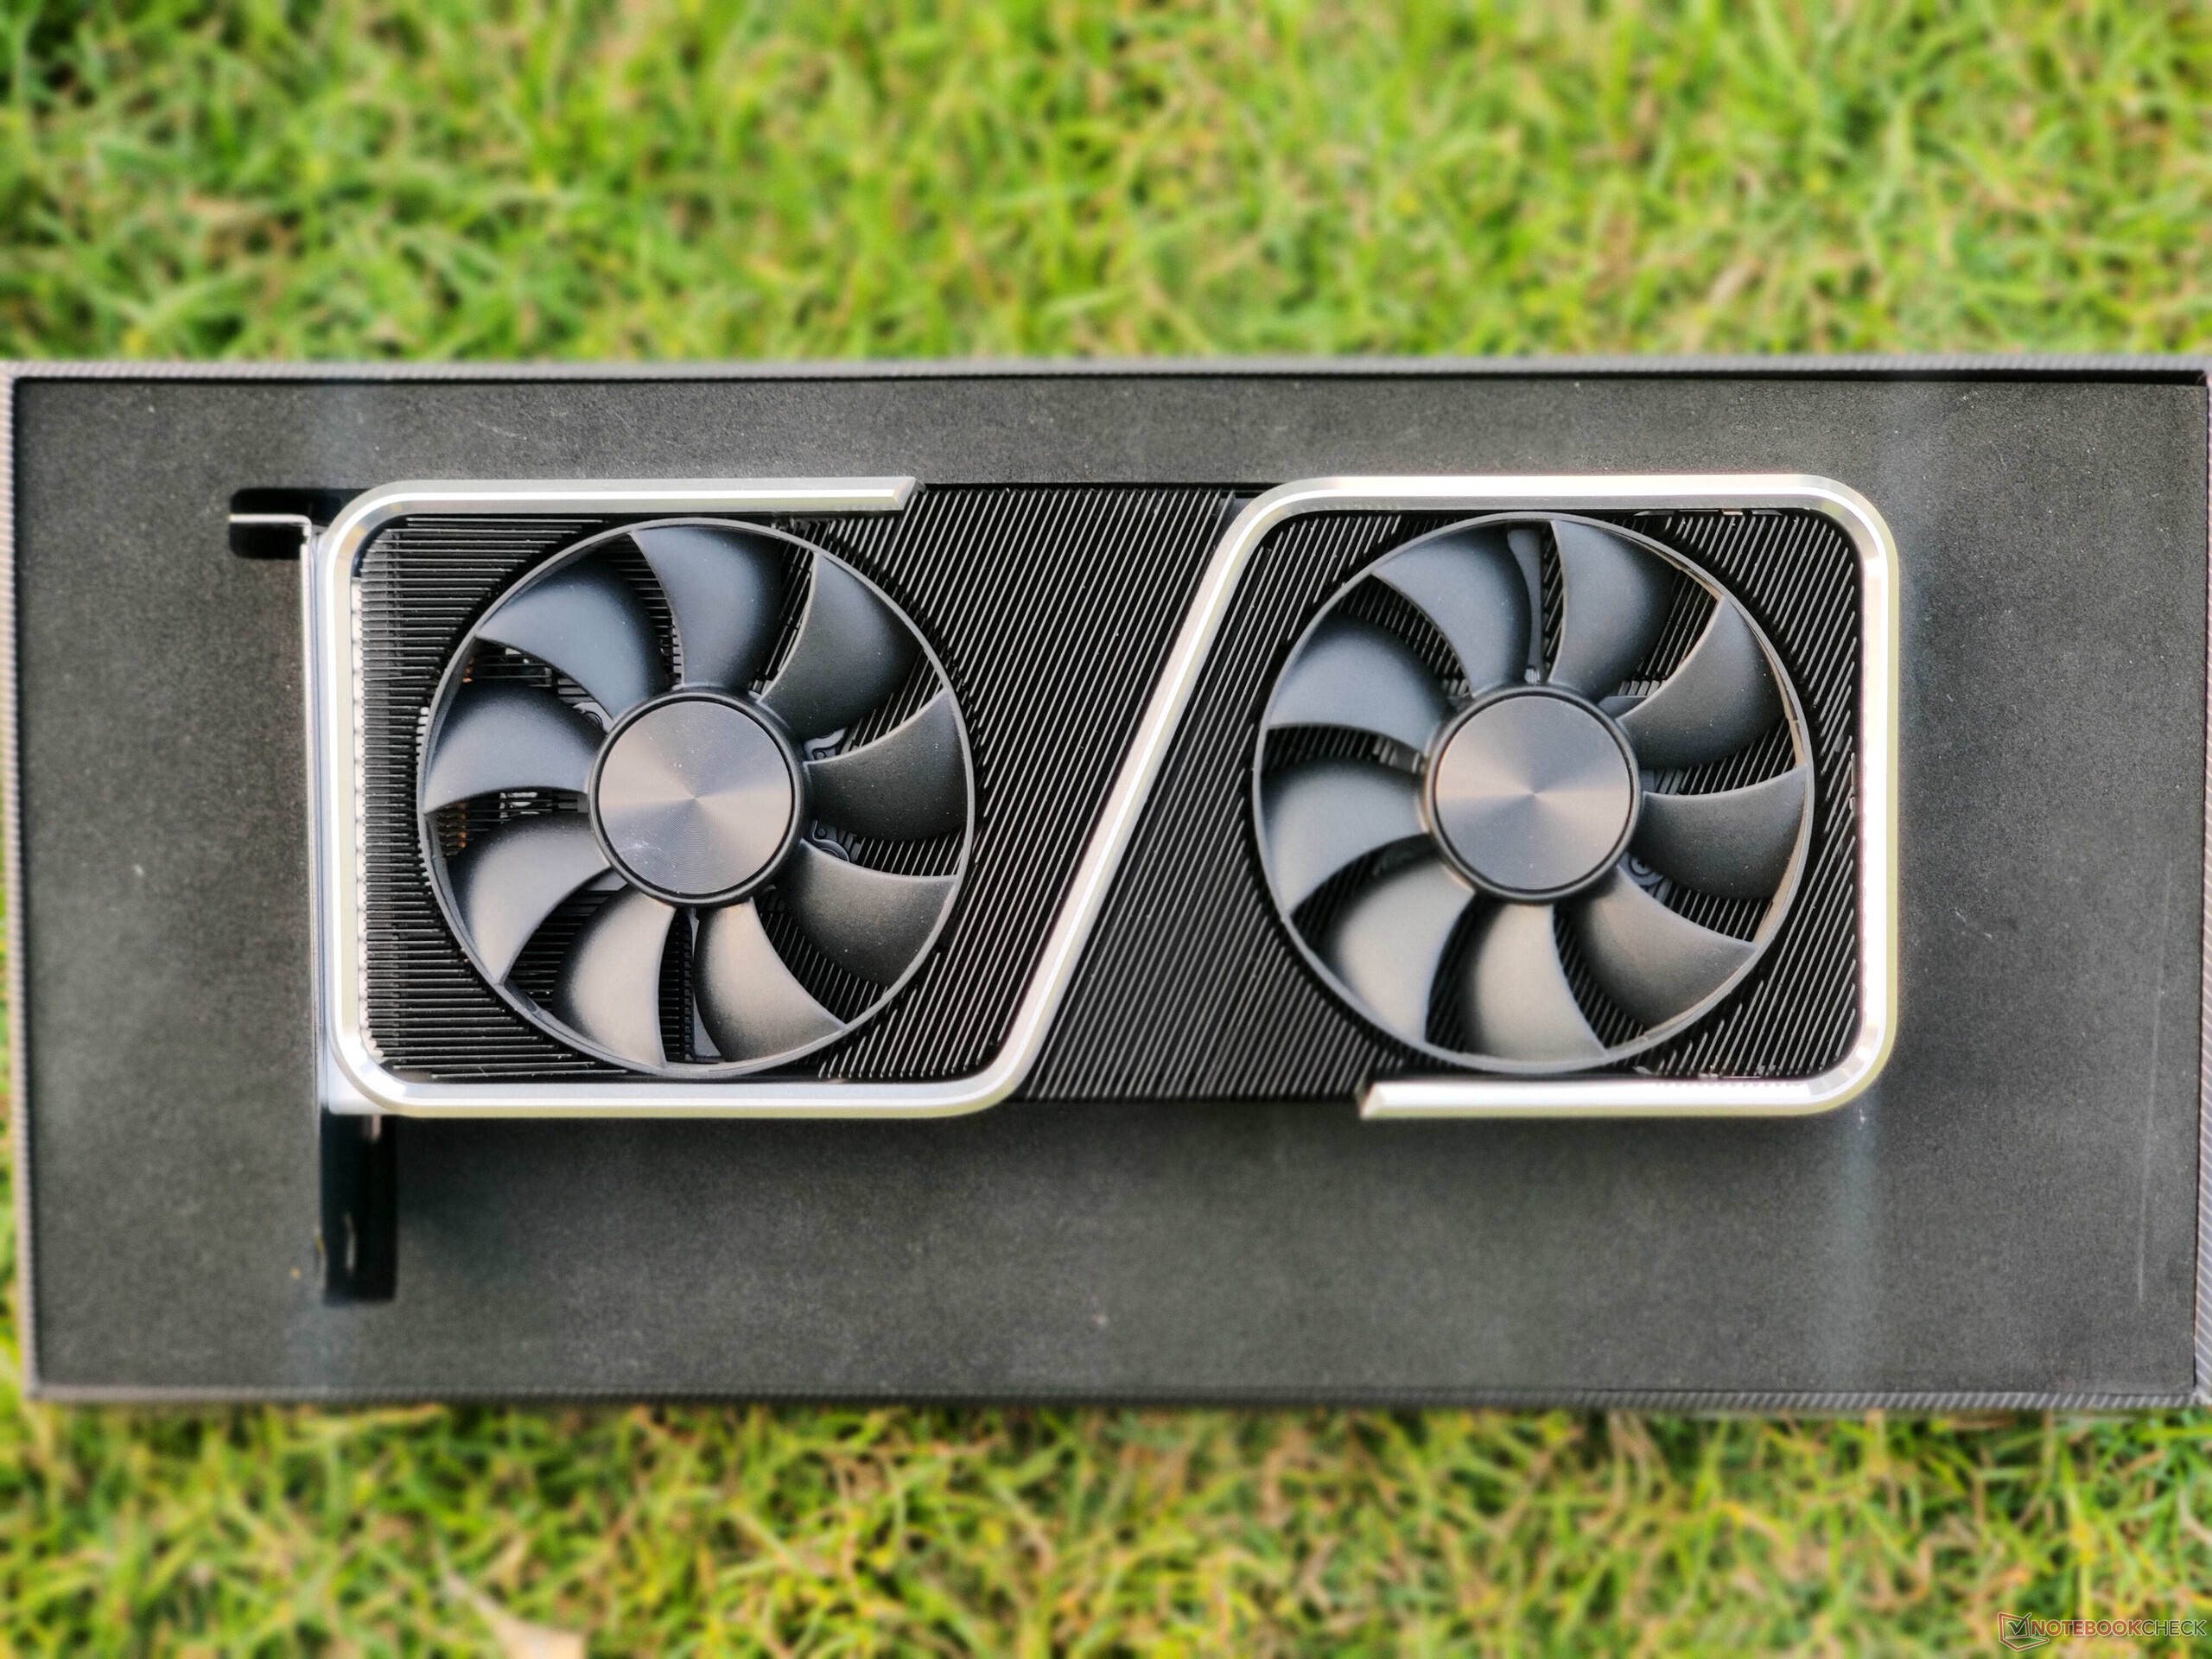
A Edição RTX 3060 Ti Founders incorpora a nova linguagem de projeto da NVIDIA que ajuda com melhor dissipação de calor e baixos níveis de ruído, pelo menos quando comparada com as placas FE da geração anterior. A placa parece bastante despretensiosa, mas a estrutura metálica prateada brilhante confere uma aparência premium. É bem construída, sem torções, rangidos, ou manchas plásticas frágeis
Semelhante ao resto das placas NVIDIA Ampere Founders Edition, a RTX 3060 Ti FE também vem com um conector de alimentação Molex MicroFit 3.0 de 12 pinos que está situado na direção do meio. A NVIDIA inclui um conector de 8 pinos a 12 pinos na caixa
O conector de 12 pinos parece ser um pouco redundante aqui e é uma desvantagem definitiva na frente estética (para não mencionar os problemas de gerenciamento de cabos), pois o RTX 3060 Ti consome menos de 300 W e pode facilmente se contentar apenas com o conector padrão de 8 pinos da PSU.
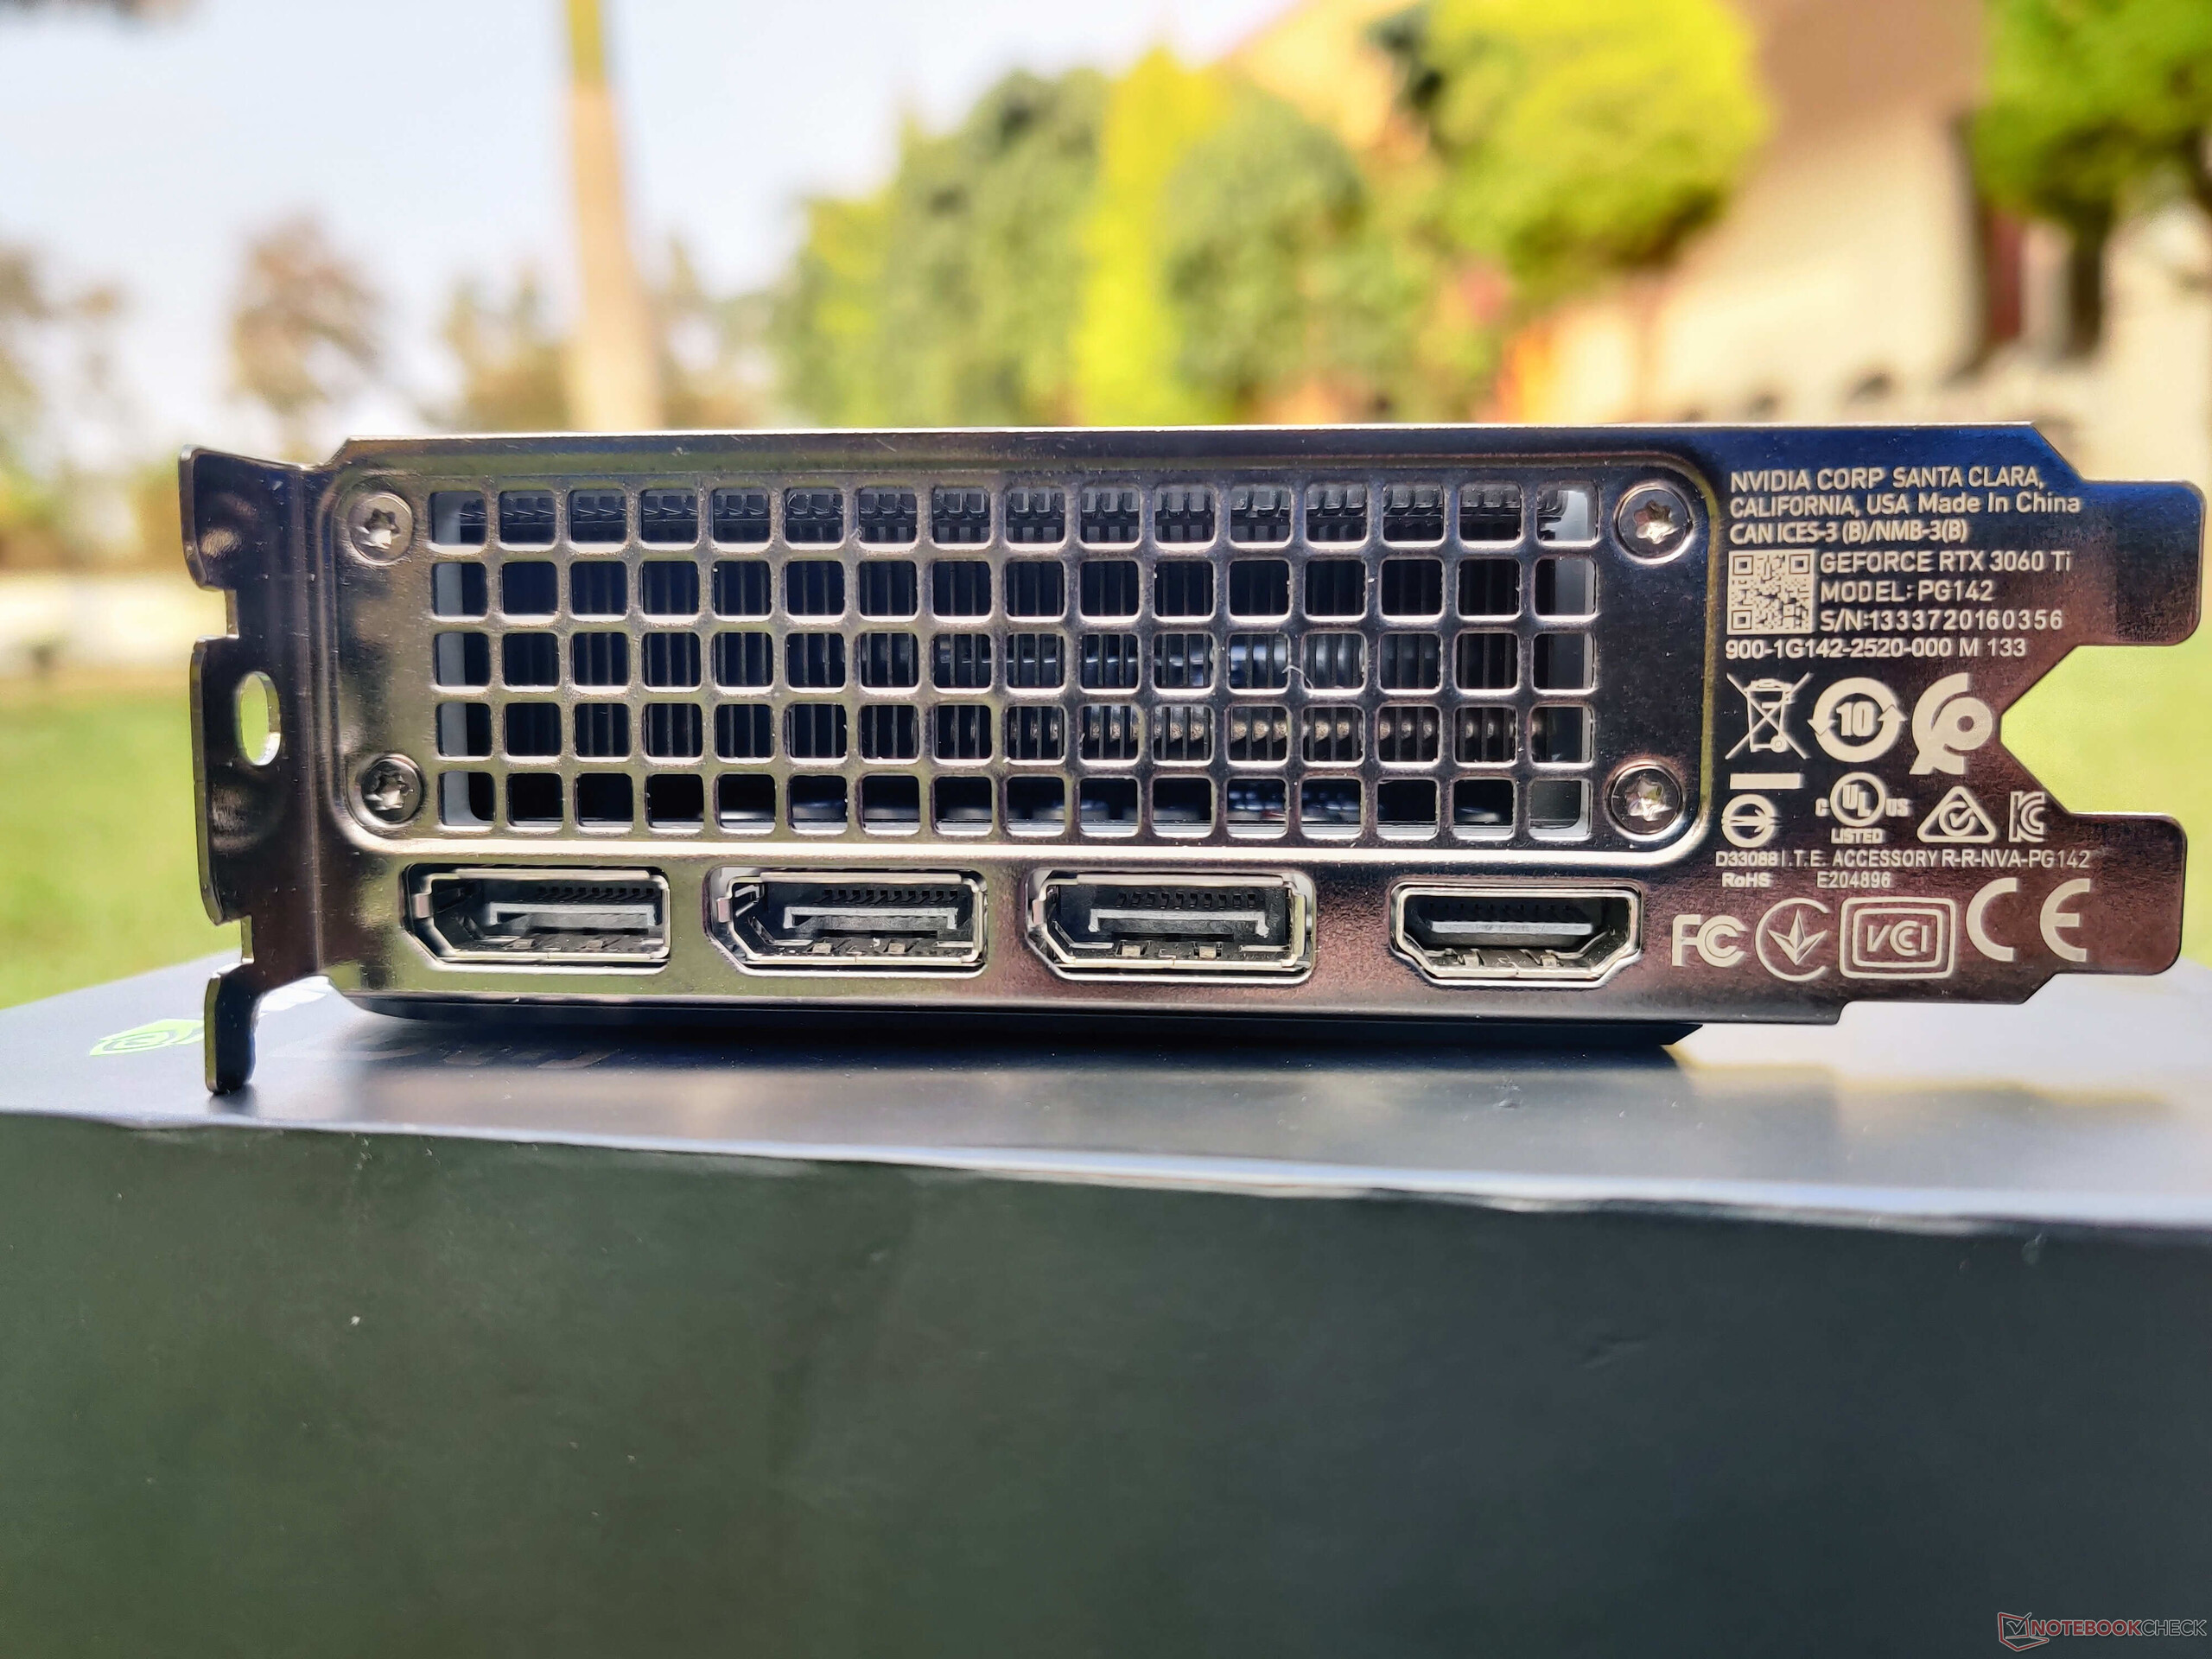
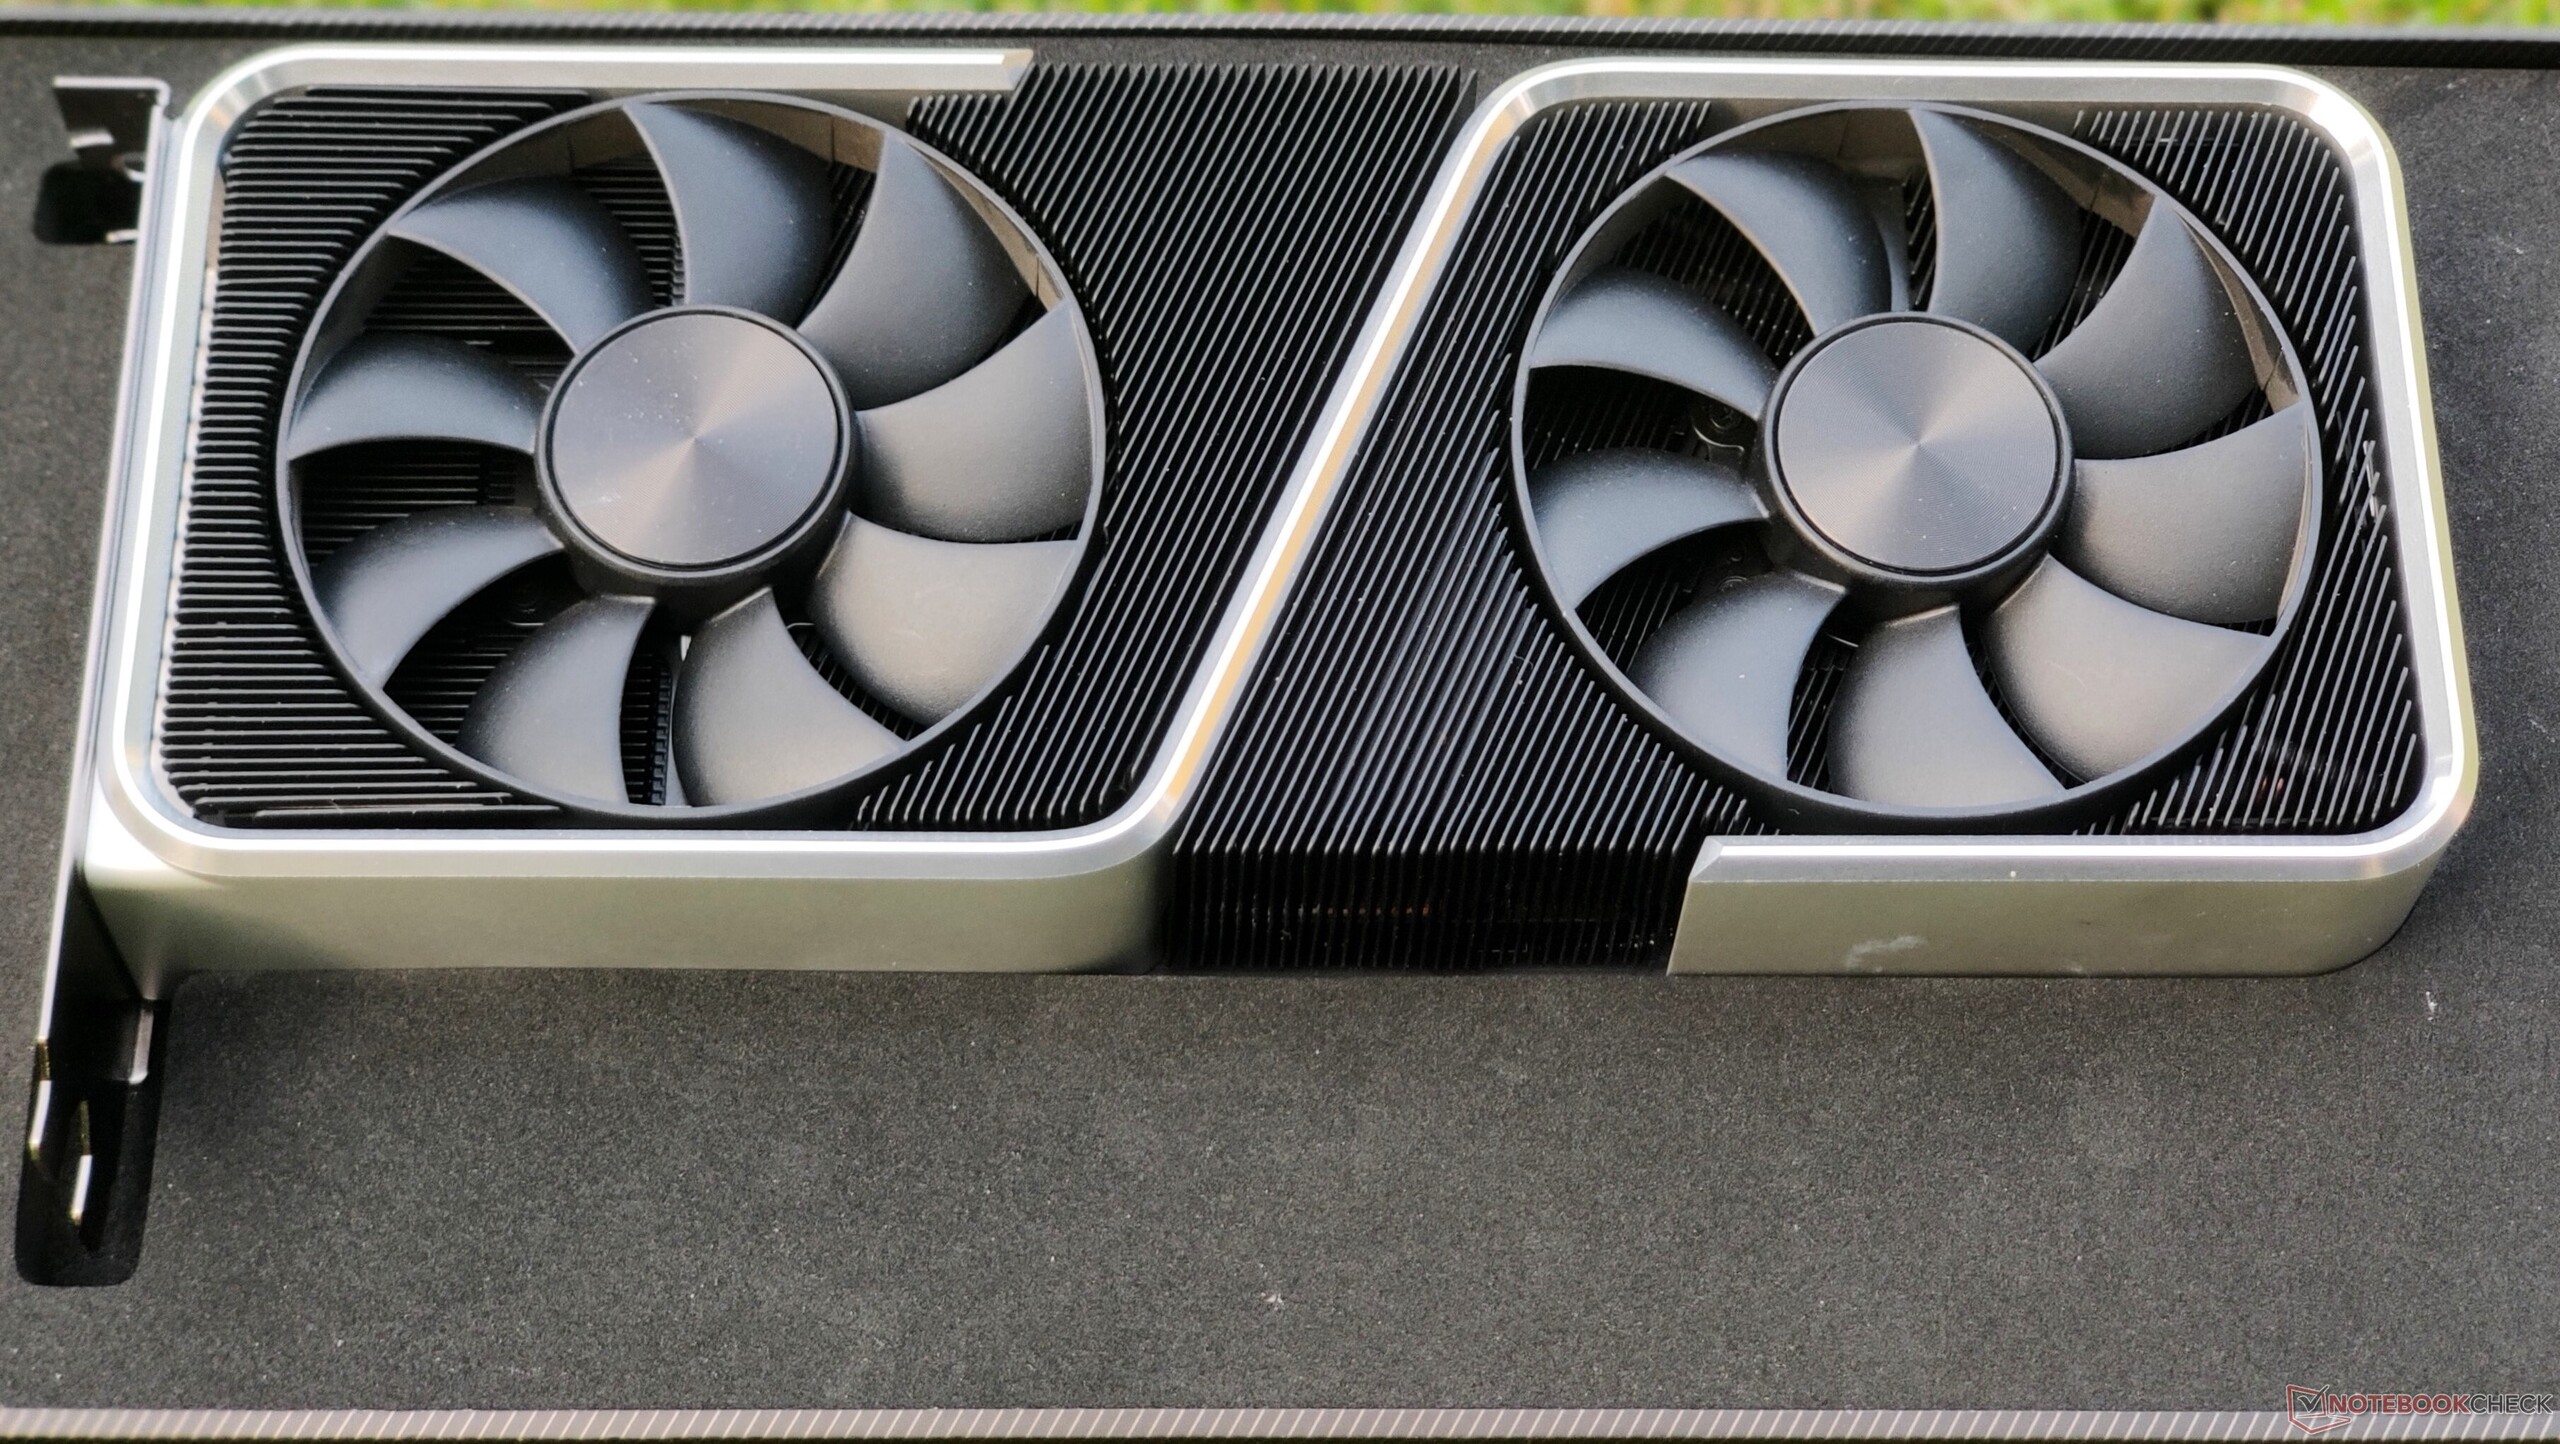
As opções de conectividade são padrão e incluem três portas DisplayPort 1.4a e uma HDMI 2.1. Os ventiladores duplos de 9 lâminas oferecem resfriamento eficaz e têm um perfil de ruído muito bom sob carga, como veremos mais adiante na revisão. É fornecida uma placa traseira metálica que não só ajuda na proteção, mas também possui duas almofadas térmicas por baixo para dissipar o calor longe dos VRMs de memória colocados na parte de trás da placa de circuito impresso.
A NVIDIA GeForce RTX 3060 Ti Founders Edition por US$399,99 (₹35,900) e vem com uma garantia de três anos.
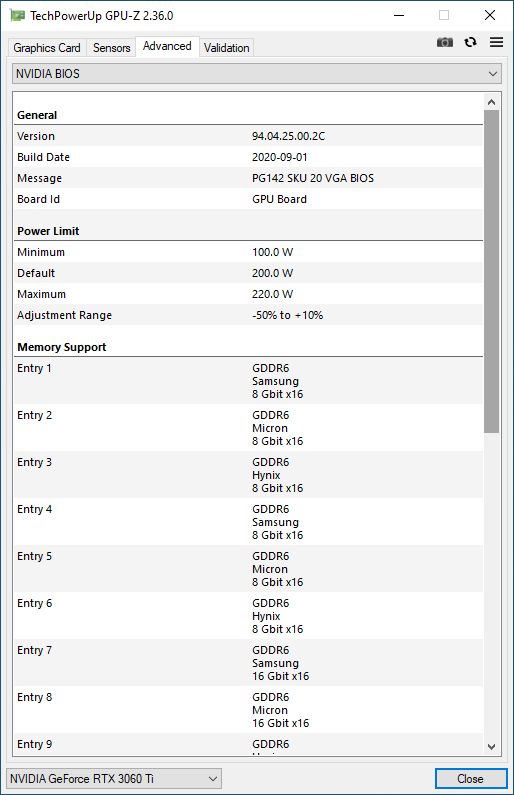
O RTX 3060 Ti FE oferece um relógio de base de 1.410 MHz e pode impulsionar até 1.665 MHz. É possível aumentar a potência alvo de 200 W em mais 20 W. Como a placa carece de qualquer forma de bling RGB, a potência adicional é usada principalmente pela própria GPU. Dito isto, a altura real para overclocking não é muito.
O RTX 3060 Ti oferece 8 GB de VRAM GDDR6 em um barramento de memória de 256 bits com uma largura de banda máxima de 448 GB/s. Embora isto possa parecer baixo em comparação com as ofertas high-end da NVIDIA e de todas as placas Radeon RX 6000 da AMD até agora, dadas as capacidades do RTX 3060 Ti, a VRAM de 8 GB deve ser adequada, a menos que você esteja interessado em aplicações profissionais ou em cargas de trabalho pesadas por computador que possam exigir memória de vídeo de trabalho mais alta. Não tivemos nenhum problema de limitação de memória durante todos os nossos testes
A bancada de teste
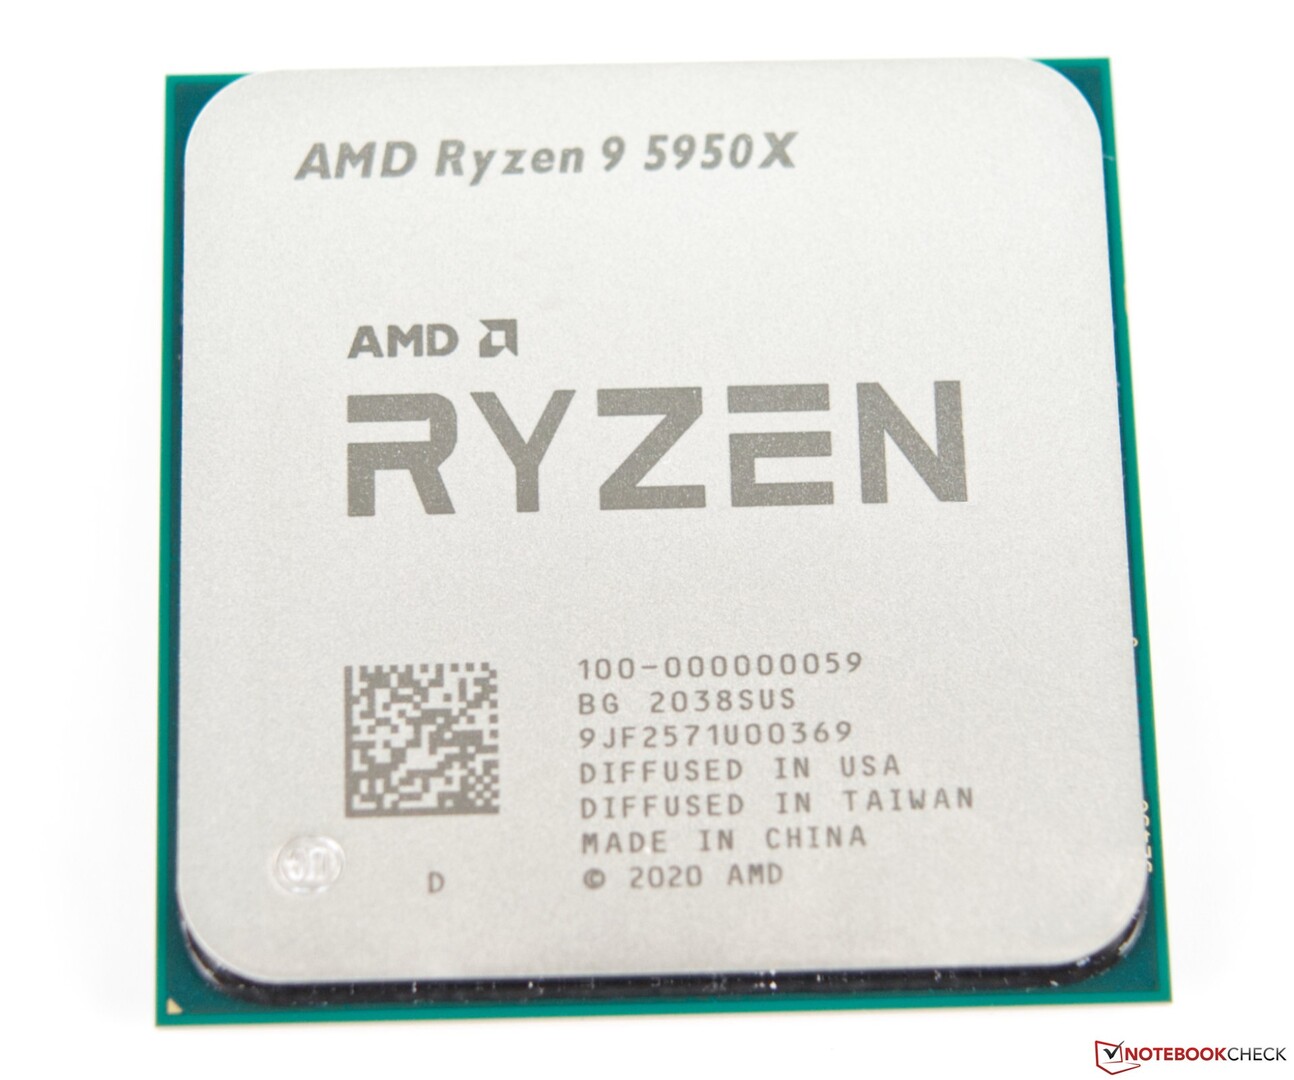
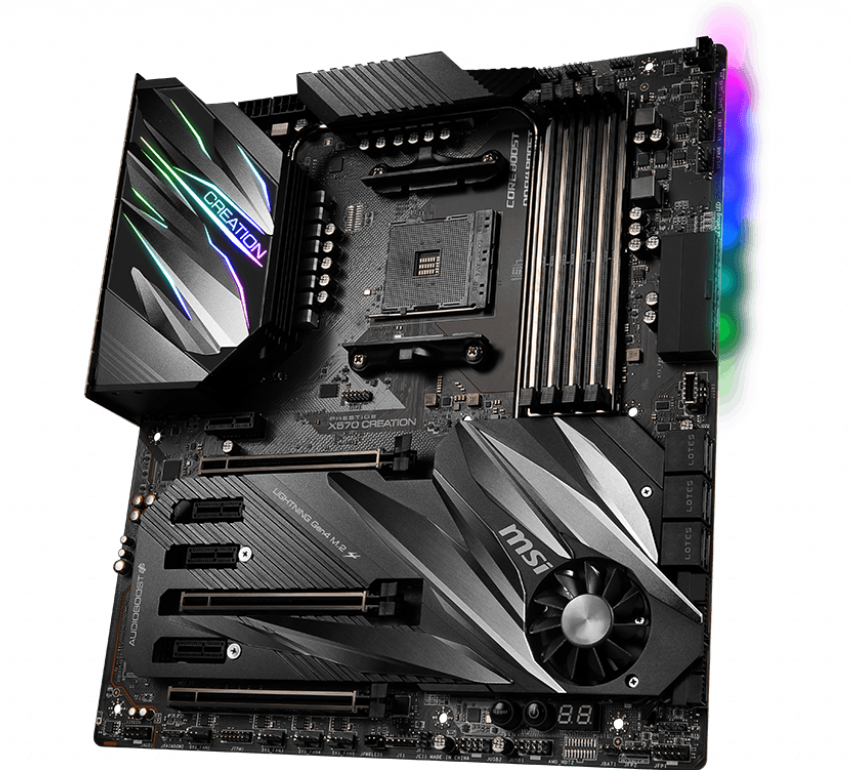
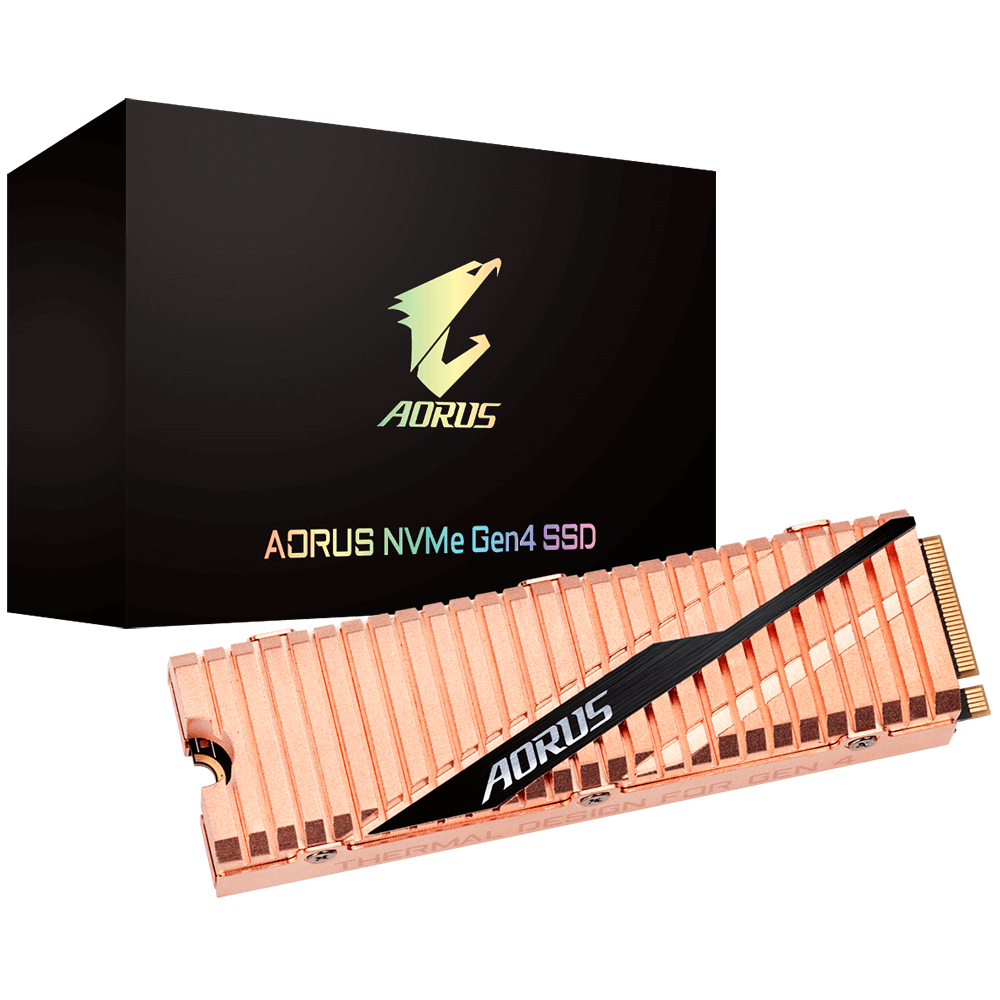
Nosso banco de testes é composto de um processador AMD Ryzen 9 5950X 16-core 32 fios, MSI Prestige X570 Placa mãe de criação, 32 GB (16 GB x2) de G.SKILL Trident Z Neo DDR4-3200 RAM (timings 16-19-19-39), e um Gigabyte Aorus NVMe Gen4 1 TB SSD
O Windows 10 20H2 com as últimas atualizações cumulativas (Build 19041.746) foi instalado no Aorus NVMe Gen4 PCIe SSD enquanto dois SSDs MX500 SATA Crucial de 1 TB foram usados para executar benchmarks e jogos.
Um refrigerador Corsair iCUE H115i Elite Capellix AIO ajudou a manter o mamute Ryzen 9 5950X frio. Toda a construção foi alojada em uma caixa iCUE 4000X RGB Corsair com um Thermaltake Toughpower 850 W 80 Plus Gold como a fonte de energia de escolha. Realizamos todos os testes com o estojo fechado para representar o uso típico.
O RTX 3060 Ti FE foi emparelhado com uma TV inteligente OnePlus Série U 55U1 rodando a 4K 60 Hz. A saída de cores foi ajustada para RGB completo de 32 bits no painel de controle da NVIDIA enquanto a escala do desktop do Windows foi ajustada para 100%.
Gostaríamos de agradecer à AMD por fornecer a CPU Ryzen 9 5950X, Corsair para o resfriador iCUE Elite Capellix AIO e caixa iCUE 4000X, e OnePlus para a TV U série 55U1 4K
Padrões de referência sintéticos
O desempenho do RTX 3060 Ti está no mesmo estádio que um RTX 2080 Super e pode ser até 32% mais rápido do que um RTX 2060 Super, enquanto que o RTX 3070 é inferior em cerca de 10% nos testes do 3DMark.
Uma tendência semelhante também é observada com os benchmarks Unigine Heaven and Valley. Vemos que o delta de desempenho entre as cartas é maior nos testes DirectX do que nos testes OpenGL. Enquanto o RTX 3060 Ti é apenas cerca de 8% mais rápido que o RTX 2080 Super in Heaven 4.0 DirectX, o Valley 1.0 DirectX leva esta diferença a uma diferença significativa de 27%. A Superposição Unigine mostra que o RTX 3060 Ti é 12% a 14% mais lento do que o RTX 3070, mas praticamente se associa à média do RTX 2080 Super em todos os testes, exceto 720p baixo
| 3DMark 11 Performance | 33117 pontos | |
| 3DMark Cloud Gate Standard Score | 66922 pontos | |
| 3DMark Fire Strike Score | 27043 pontos | |
| 3DMark Fire Strike Extreme Score | 13790 pontos | |
| 3DMark Time Spy Score | 11520 pontos | |
Ajuda | ||
Cálculos de referência
O RTX 3060 Ti FE oferece um desempenho de computação decente com cerca de 25% mais pontuações na ComputeMark em comparação com a média do RTX 2080 Super. O LuxMark também mostra benefícios decentes com o RTX 3060 Ti FE sendo apenas cerca de 6% mais lento do que a média RTX 3070.
Aplicações profissionais
Os cartões GeForce não são realmente destinados a cargas de trabalho profissionais tais como CAD/CAM, energia, automóveis ou aplicações médicas. Esta limitação vem principalmente do motorista, já que a NVIDIA idealmente gostaria que os profissionais destas áreas utilizassem a linha Quadro. O Titan RTX, no entanto, consegue manter seu próprio gramado nos testes SPECviewperf, apesar de rodar em motoristas regulares GeForce
Dando uma olhada nos benchmarks SPECviewperf 12 e 13, vemos que o RTX 3060 Ti fica significativamente atrás de um Quadro RTX 5000 (laptop) em cargas de trabalho profissional especializado, apesar deste último ser essencialmente um chip RTX 2080 TU104. No entanto, aqueles que trabalham nos projetos 3D Studio Max e Maya acharão o RTX 3060 Ti um bom executante.
A SPECviewperf 2020 pareceu um pouco tributária para o RTX 3060 Ti FE por ser uma referência de 4K. O RTX 3080 e RTX 3090 mostram vantagens óbvias, mas o AMD Radeon RX 6800 XT é claramente o GPU com melhor desempenho quando se trata de aplicações profissionais
| NVIDIA GeForce RTX 3060 Ti Founders Edition GeForce RTX 3060 Ti, R9 5950X | MSI GeForce RTX 3080 Gaming X Trio GeForce RTX 3080, R9 5900X | MSI GeForce RTX 3090 Suprim X GeForce RTX 3090, R9 5900X | Nvidia GeForce RTX 2080 Super GeForce RTX 2080 Super (Desktop), R7 2700X | AMD Ryzen 9 5900X Titan RTX, R9 5900X | AMD Radeon RX 6800 XT Radeon RX 6800 XT, R9 5950X | Acer ConceptD 9 Pro Quadro RTX 5000 (Laptop), i9-9980HK | |
|---|---|---|---|---|---|---|---|
| SPECviewperf 12 | 1% | 20% | -9% | 312% | 80% | 296% | |
| 1900x1060 Solidworks (sw-03) (fps) | 71.1 | 66 -7% | 72.3 2% | 70.8 0% | 174.9 146% | 150 111% | 230.1 224% |
| 1900x1060 Siemens NX (snx-02) (fps) | 12.3 | 12.85 4% | 14.91 21% | 12.26 0% | 273.2 2121% | 45.07 266% | 258.1 1998% |
| 1900x1060 Showcase (showcase-01) (fps) | 144 | 180 25% | 236 64% | 143.6 0% | 191.1 33% | 223 55% | 126.4 -12% |
| 1900x1060 Medical (medical-01) (fps) | 59.4 | 36.93 -38% | 42.91 -28% | 45 -24% | 90.7 53% | 77.3 30% | 109.3 84% |
| 1900x1060 Maya (maya-04) (fps) | 197 | 146 -26% | 184 -7% | 134.8 -32% | 188.3 -4% | 118 -40% | 179 -9% |
| 1900x1060 Energy (energy-01) (fps) | 13.9 | 16.35 18% | 20.41 47% | 13.09 -6% | 28.31 104% | 28.39 104% | 26 87% |
| 1900x1060 Creo (creo-01) (fps) | 57.8 | 65.6 13% | 75.4 30% | 52.7 -9% | 173 199% | 119 106% | 172.1 198% |
| 1900x1060 Catia (catia-04) (fps) | 109 | 116 6% | 134 23% | 104.2 -4% | 262.7 141% | 238 118% | 220 102% |
| 1900x1060 3ds Max (3dsmax-05) (fps) | 252 | 276 10% | 322 28% | 225.8 -10% | 292.6 16% | 167 -34% | 235.8 -6% |
| SPECviewperf 13 | 25% | 36% | -3% | 290% | 91% | 270% | |
| Solidworks (sw-04) (fps) | 99.6 | 96.5 -3% | 95.3 -4% | 99.6 0% | 196.4 97% | 193 94% | 203.8 105% |
| Siemens NX (snx-03) (fps) | 22.3 | 24.26 9% | 27.03 21% | 21.94 -2% | 493.4 2113% | 81.4 265% | 465.3 1987% |
| Showcase (showcase-02) (fps) | 145 | 204 41% | 241 66% | 144.5 0% | 190.5 31% | 232 60% | 127.1 -12% |
| Medical (medical-02) (fps) | 72.2 | 99 37% | 105 45% | 71.6 -1% | 90.8 26% | 130 80% | 133.4 85% |
| Maya (maya-05) (fps) | 344 | 440 28% | 469 36% | 328.7 -4% | 458 33% | 348 1% | 340.8 -1% |
| Energy (energy-02) (fps) | 25.6 | 37.87 48% | 45.21 77% | 23.78 -7% | 52 103% | 58.4 128% | 57.3 124% |
| Creo (creo-02) (fps) | 225 | 295 31% | 316 40% | 220.1 -2% | 346.5 54% | 276 23% | 319.8 42% |
| Catia (catia-05) (fps) | 161 | 190 18% | 206 28% | 157.7 -2% | 374.8 133% | 412 156% | 338.9 110% |
| 3ds Max (3dsmax-06) (fps) | 252 | 294 17% | 298 18% | 227.8 -10% | 291.3 16% | 284 13% | 232.2 -8% |
| SPECviewperf 2020 | 58% | 85% | 300% | 107% | |||
| 3840x2160 Solidworks (solidworks-05) (fps) | 109 | 158 45% | 180 65% | 153 40% | 108 -1% | ||
| 3840x2160 Siemens NX (snx-04) (fps) | 18.2 | 19.8 9% | 22.6 24% | 347 1807% | 81.7 349% | ||
| 3840x2160 Medical (medical-03) (fps) | 11.4 | 18.47 62% | 21.19 86% | 16.42 44% | 27.84 144% | ||
| 3840x2160 Maya (maya-06) (fps) | 215 | 293 36% | 330 53% | 257 20% | 224 4% | ||
| 3840x2160 Energy (energy-03) (fps) | 14.5 | 51.7 257% | 61.1 321% | 58.2 301% | 60.8 319% | ||
| 3840x2160 Creo (creo-03) (fps) | 76.6 | 77.6 1% | 85.1 11% | 113 48% | 65 -15% | ||
| 3840x2160 CATIA (catia-06) (fps) | 37.9 | 50 32% | 56.6 49% | 78.2 106% | 42.4 12% | ||
| 3840x2160 3ds Max (3dsmax-07) (fps) | 80.1 | 100 25% | 135 69% | 108 35% | 114 42% | ||
| Média Total (Programa/Configurações) | 28% /
27% | 47% /
46% | -6% /
-6% | 301% /
301% | 93% /
92% | 283% /
283% |
Benchmarks de jogo
Logo de cara, o RTX 3060 Ti FE tem um ótimo desempenho até a resolução QHD Ultra na maioria dos jogos. Os jogadores eSports que preferem taxas de quadros mais altas do que a resolução também poderão fazer bom uso deste cartão a 1080p para acionar monitores com altas taxas de atualização. Também é possível jogar a 60 fps+ em 4K Ultra em vários títulos, tais como Campo de batalha V, Far Cry New Dawn, Desgraça Eternae F1 2020. Uma boa maioria dos títulos também pode ser aumentada para 60 fps+ em 4K, ajustando as configurações dentro do jogo sem comprometer muito a fidelidade visual.
O desempenho do Ray Tracing (RT) está dentro de 7% de uma média RTX 3070 desde que o jogo não use RT para iluminação global, como evidenciado pelos resultados de Call of Duty: Guerra Fria das Operações Negras e Cães de guarda Legion 1080p Ultra ray tracing benchmarks. Este delta de desempenho dobra em jogos que empregam extensivamente a iluminação de traçado de raio-global, tais como Metrô: Êxodo e Cyberpunk 2077
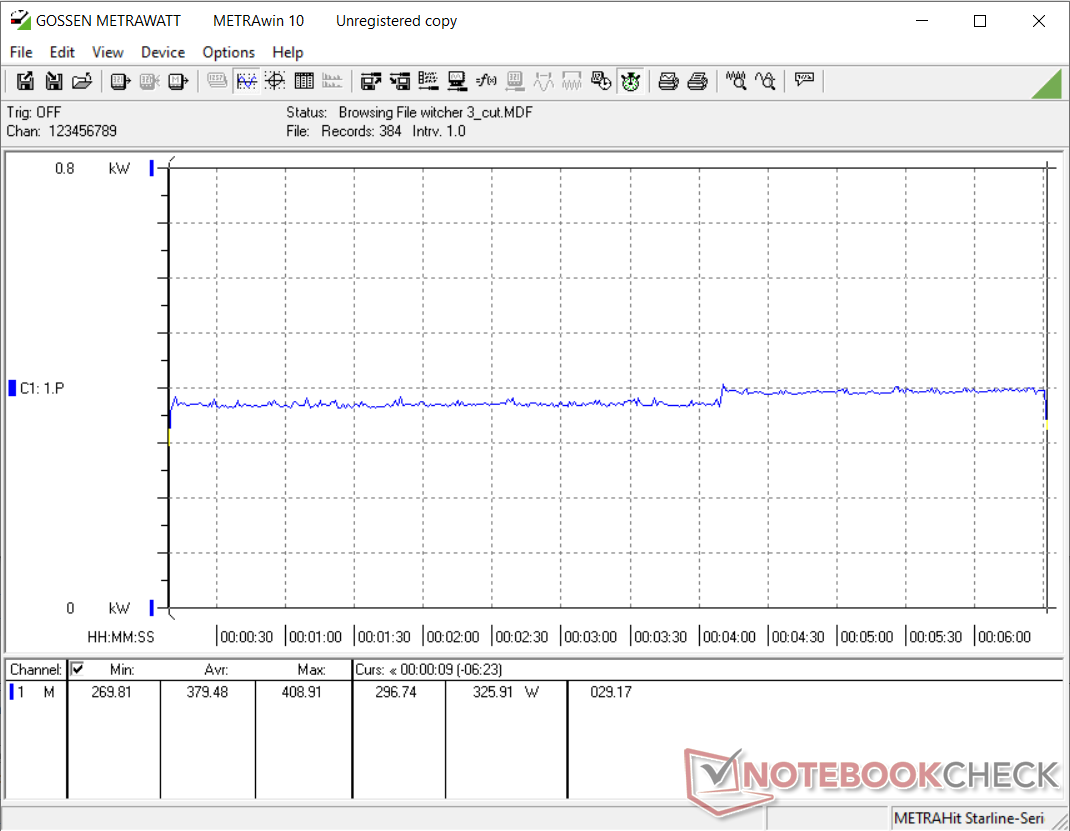
Em O Witcher 3 Teste de ultra tensão, o RTX 3060 Ti FE é visto como bastante estável em geral. Vemos os quadros caindo cerca de 5 fps além da metade do gráfico abaixo, mas a experiência geral não é muito afetada. Isto indica que o resfriamento na placa está à altura da tarefa e é capaz de evitar a estrangulamento térmico
| baixo | média | alto | ultra | QHD | 4K | |
|---|---|---|---|---|---|---|
| The Witcher 3 (2015) | 479 | 342 | 218 | 109 | 81.3 | |
| Shadow of the Tomb Raider (2018) | 185 | 157 | 153 | 145 | 103 | 56 |
| Forza Horizon 4 (2018) | 246 | 200 | 196 | 173 | 150 | 103 |
| Assassin´s Creed Odyssey (2018) | 142 | 121 | 104 | 75 | 65 | 45 |
| Battlefield V (2018) | 181 | 145 | 124 | 114 | 97.9 | 64.9 |
| Far Cry New Dawn (2019) | 123 | 111 | 108 | 99 | 94 | 65 |
| Metro Exodus (2019) | 193 | 139 | 105 | 84.9 | 66.2 | 42.7 |
| The Division 2 (2019) | 225 | 172 | 142 | 109 | 77.3 | 43.7 |
| Anno 1800 (2019) | 134 | 135 | 94.1 | 54.2 | 40.6 | 34.4 |
| Total War: Three Kingdoms (2019) | 367.4 | 195.6 | 127.3 | 92.8 | 59 | 28.8 |
| Control (2019) | 240 | 147 | 110 | 71.9 | 36.1 | |
| Borderlands 3 (2019) | 172 | 149 | 118 | 96 | 70.2 | 38.4 |
| Red Dead Redemption 2 (2019) | 170 | 154 | 108 | 69.9 | 57.3 | 37.5 |
| Doom Eternal (2020) | 508 | 320 | 283 | 274 | 219 | 122 |
| Gears Tactics (2020) | 332.3 | 208.8 | 162.4 | 128.9 | 91.9 | 49.4 |
| F1 2020 (2020) | 369 | 252 | 174 | 135 | 80 | |
| Horizon Zero Dawn (2020) | 181 | 139 | 122 | 109 | 92 | 53 |
| Mafia Definitive Edition (2020) | 159 | 130 | 124 | 90.1 | 49.7 | |
| FIFA 21 (2020) | 242 | 247 | 230 | |||
| Watch Dogs Legion (2020) | 124 | 122 | 109 | 76.6 | 59.1 | 33 |
| Assassin´s Creed Valhalla (2020) | 126 | 95 | 81 | 74 | 60 | 40 |
| Call of Duty Black Ops Cold War (2020) | 243 | 133 | 123 | 110 | 82.1 | 44.9 |
| Immortals Fenyx Rising (2020) | 166 | 119 | 110 | 101 | 84 | 57 |
| Cyberpunk 2077 1.0 (2020) | 122 | 101 | 85.2 | 73.6 | 48 | 24.1 |
Emissões
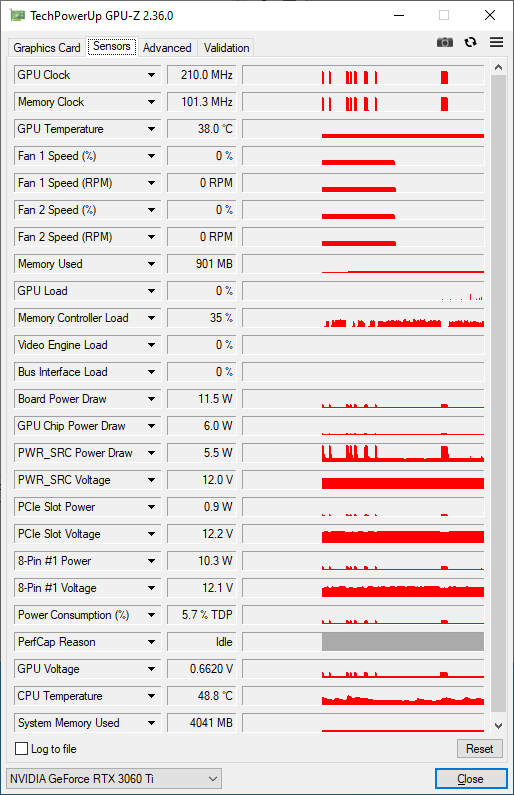
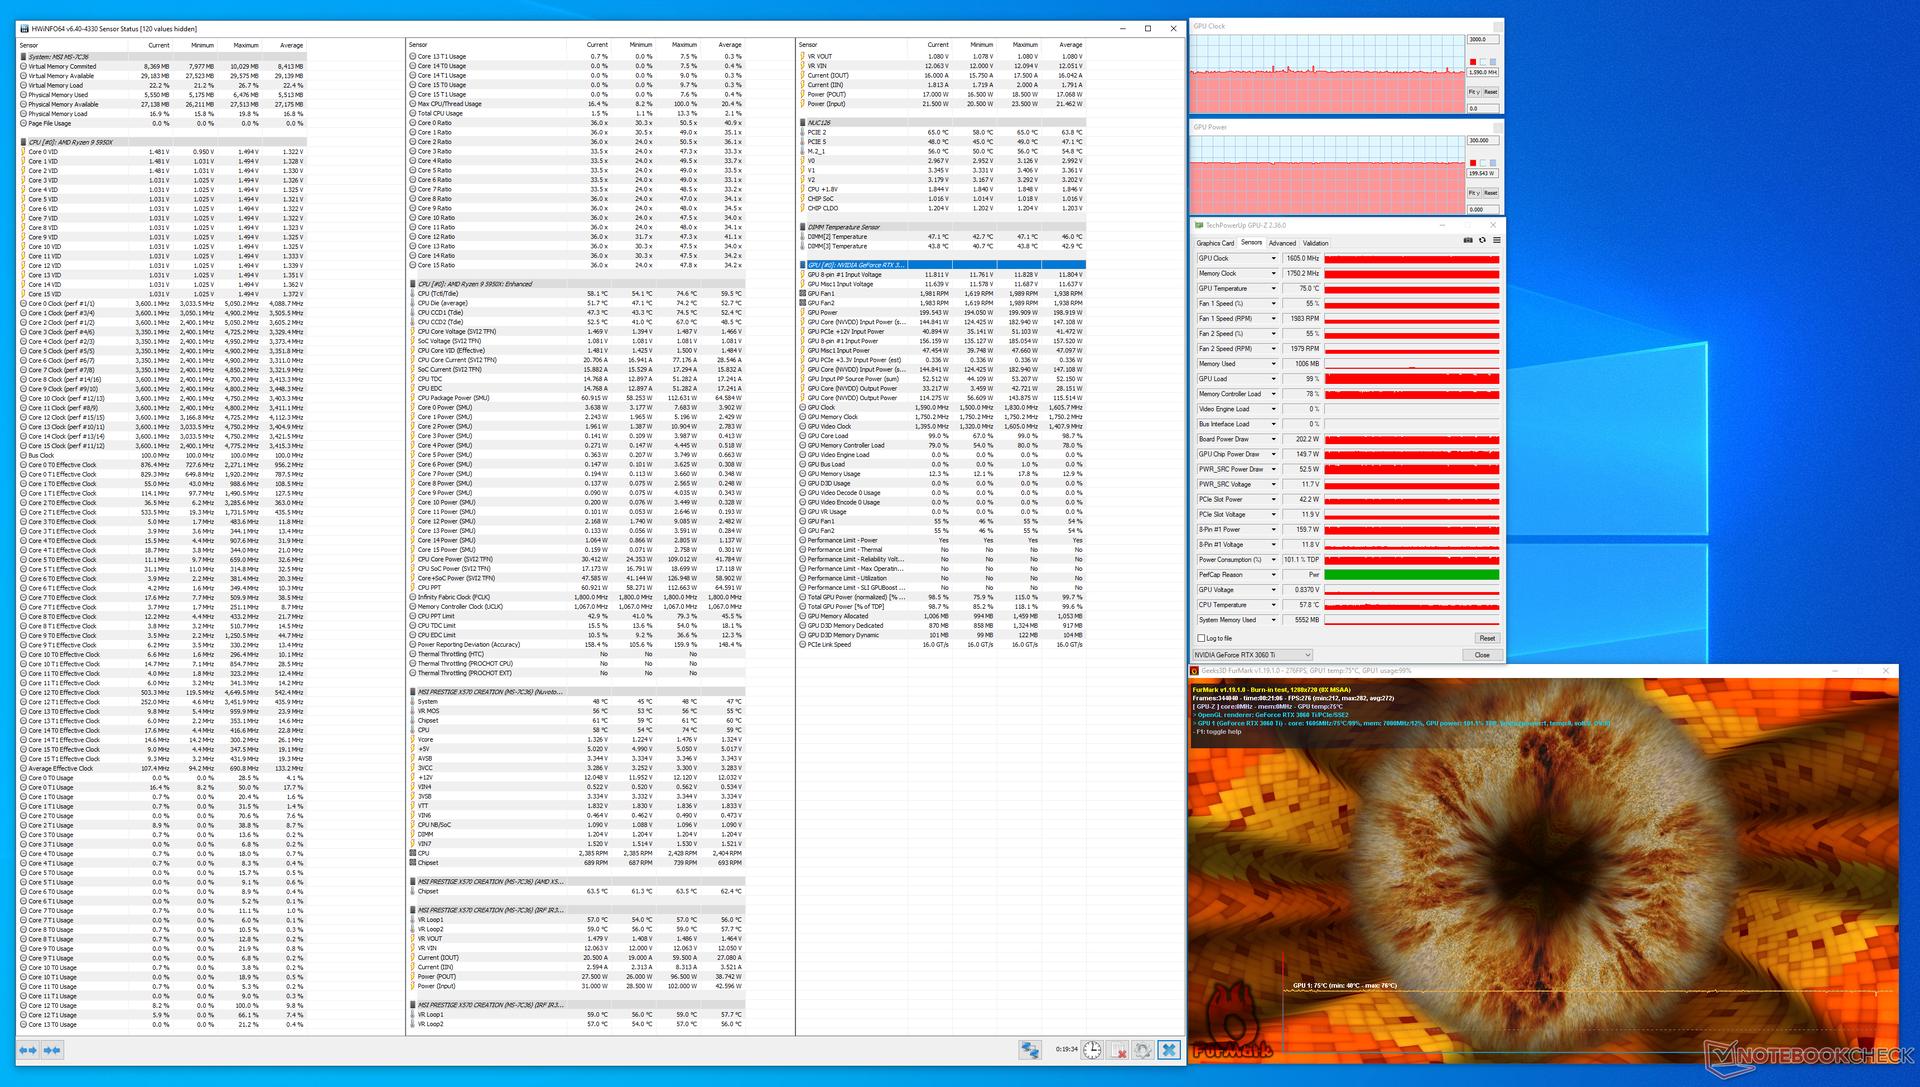
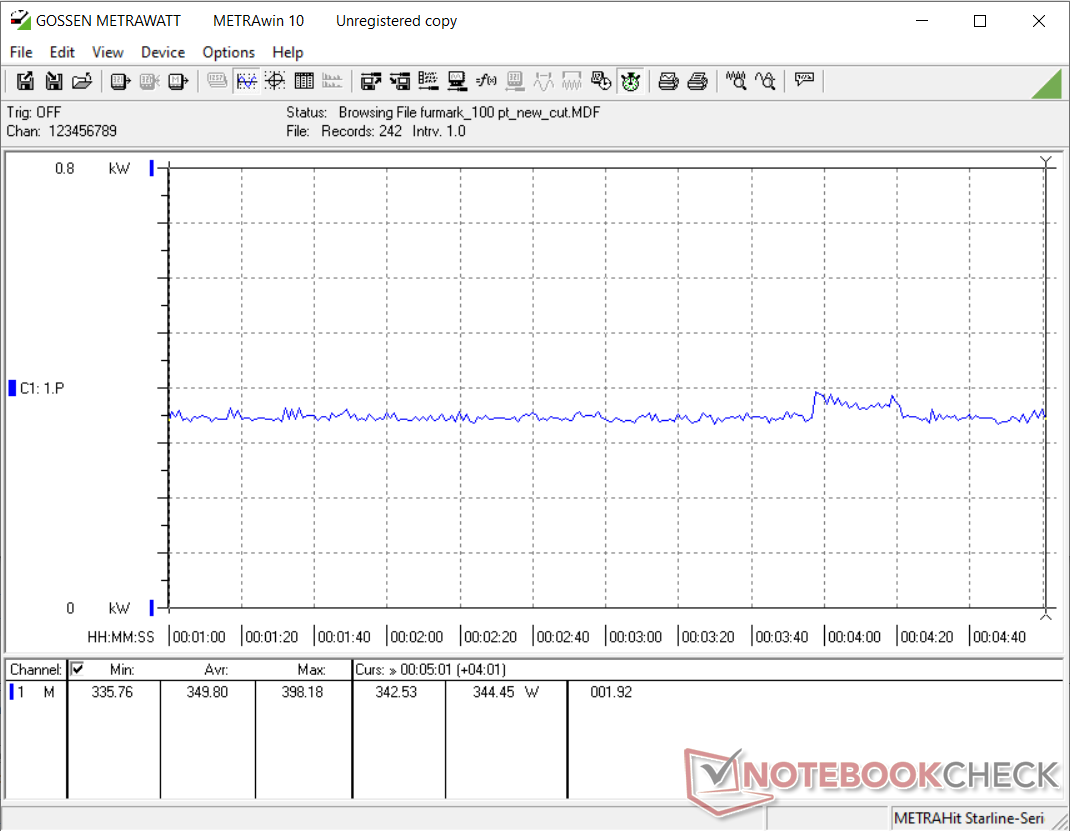
Graças ao projeto mais frio melhorado da NVIDIA, o RTX 3060 Ti FE tem um ótimo desempenho sob estresse. Durante o teste de tensão FurMark, observamos que o núcleo da GPU manteve uma temperatura constante de 75 °C e a potência da placa estava na potência nominal TGP de 200 W.
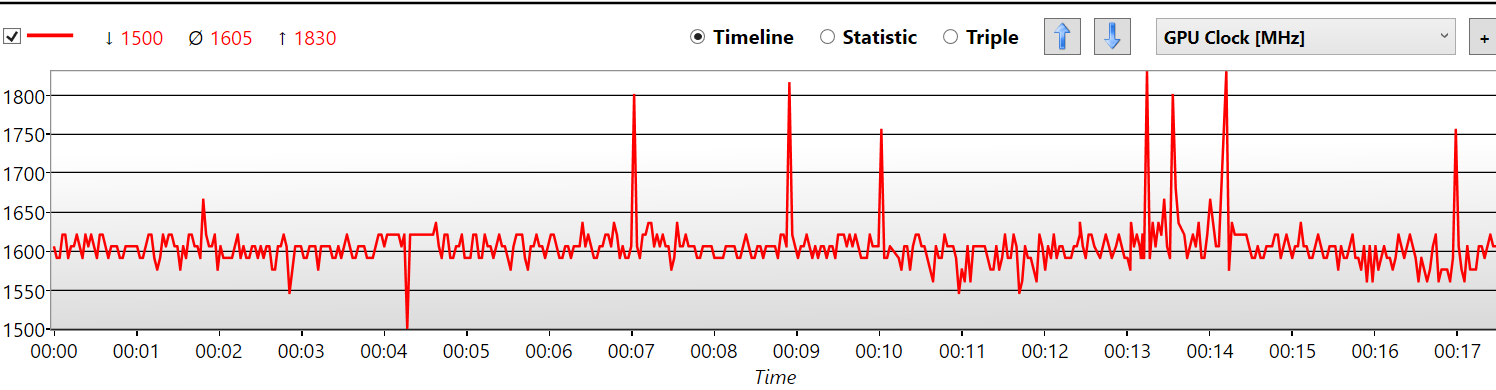
Para a grande parte do teste de tensão, o RTX 3060 Ti FE opera perto de seu relógio de impulso nominal de 1.665 MHz, embora observemos picos ocasionais de até 1.830 MHz
Usamos a tensão FurMark para determinar os níveis de temperatura e ruído. O consumo total de energia do sistema foi determinado durante o stress com FurMark e The Witcher 3 a 1080p Ultra pré-ajustado
Temperatura
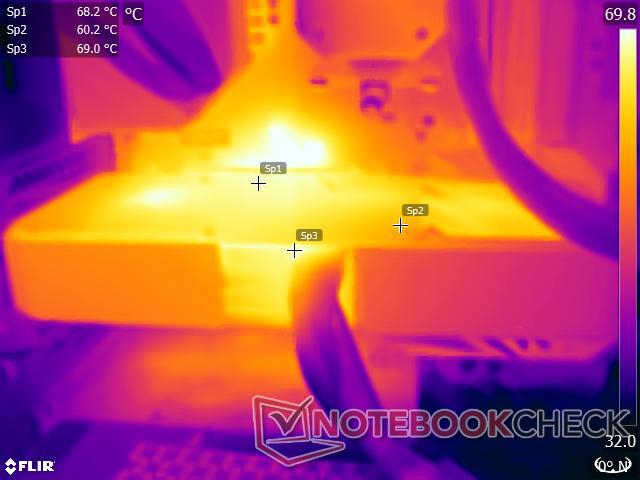
Enquanto o novo sistema de resfriamento da NVIDIA oferece desempenho adequado para evitar o estrangulamento da placa, a própria placa tende a ficar significativamente quente sob carga. Durante o teste de estresse FurMark, observamos que as temperaturas de superfície perto da GPU e áreas de fornecimento de energia estavam próximas à marca dos 70 °C
Isto é de se esperar, pois o núcleo da GPU em si pode atingir 75 °C sob carga e a construção metálica serve apenas para transmitir uma grande parte deste calor para a superfície
A área próxima ao exaustor do ventilador traseiro também é bastante quente a 60 °C, como se pode ver no mapa de calor. Dito isto, a GPU ociosa entre 38 °C e 42 °C durante o tempo em que os ventiladores param completamente
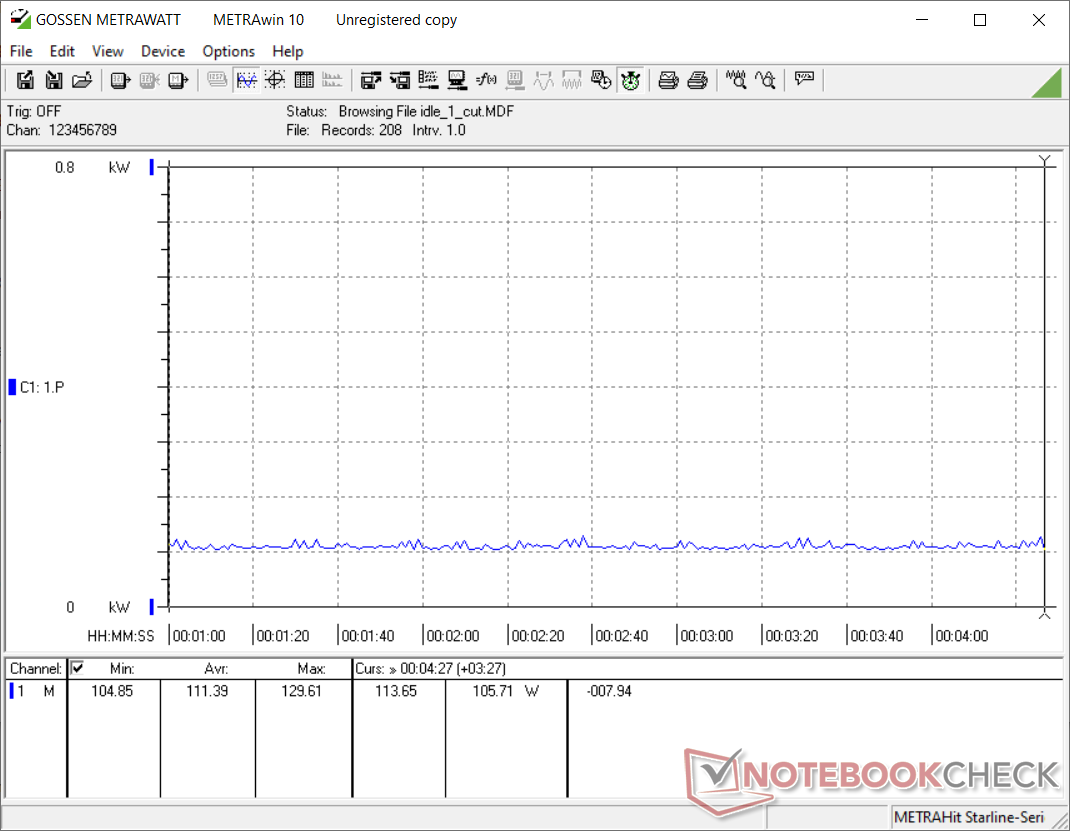
Consumo de energia
Nossa bancada de teste consome cerca de 111 W em inatividade com toda a iluminação RGB desligada e um total de cinco ventiladores (três ventiladores de caixa Corsair SP 120 mm e dois ventiladores de radiador Corsair ML 120 mm) e a bomba Elite Capellix AIO funcionando em um perfil Balanceado.
Observamos um consumo médio total de energia do sistema de 350 W e 379 W durante FurMark e The Witcher 3 Ultra stress, respectivamente
Como visto nos gráficos de consumo de energia abaixo, um ligeiro aumento no consumo de energia é observado próximo à marca dos 4 minutos. Isto pode ser devido ao aumento momentâneo do relógio de impulso que descrevemos anteriormente
Em geral, o RTX 3060 Ti FE é mais ou menos econômico em comparação com a média do RTX 2080 Super em termos de consumo de energia
| Power Consumption | |
| 1280x720 FurMark 1.19 GPU Stress Test (external Monitor) | |
| MSI GeForce RTX 3090 Suprim X (Idle: 105.9 W) | |
| Média NVIDIA GeForce RTX 3080 (Idle: 492 - 505, n=2 W) | |
| MSI GeForce RTX 3080 Gaming X Trio (Idle: 103 W) | |
| Média NVIDIA GeForce RTX 3090 (Idle: 281 - 551, n=9 W) | |
| AMD Radeon RX 6800 XT (Idle: 99.5 W) | |
| KFA2 GeForce RTX 2080 Ti EX (Idle: 100.5 W) | |
| Zotac Gaming GeForce RTX 3070 Twin Edge (Idle: 114.96 W) | |
| Zotac Gaming GeForce RTX 3070 Twin Edge (Idle: 114.96 W) | |
| Nvidia GeForce RTX 2080 Super (Idle: 78.87 W) | |
| Média NVIDIA GeForce RTX 2080 Super (Desktop) (Idle: 328 - 414, n=4 W) | |
| NVIDIA GeForce RTX 3060 Ti FE (Idle: 111.39 W) | |
| Média NVIDIA GeForce RTX 3070 (Idle: 281 - 393, n=7 W) | |
| Média NVIDIA GeForce RTX 2070 Super (Desktop) (Idle: 280 - 358, n=6 W) | |
| AMD Radeon RX 5700 XT (239 fps, Idle: 69.8 W) | |
| Nvidia GeForce RTX 2070 Super (283 fps, Idle: 80.5 W) | |
| Média NVIDIA GeForce RTX 2060 Super (Desktop) (Idle: 235 - 315, n=5 W) | |
| Nvidia GeForce RTX 2060 Super (237 fps, Idle: 77.12 W) | |
| KFA 2 GeForce GTX 1660 Super (Idle: 84.76 W) | |
| KFA2 GeForce GTX 1650 Super EX One Click OC (Idle: 86.5 W) | |
| 1920x1080 The Witcher 3 ultra (external Monitor) | |
| MSI GeForce RTX 3090 Suprim X (Idle: 105.9 W) | |
| Média NVIDIA GeForce RTX 3090 (Idle: 464 - 597, n=18 W) | |
| AMD Radeon RX 6800 XT (Idle: 99.5 W) | |
| Média NVIDIA GeForce RTX 3080 (Idle: 498 - 505, n=2 W) | |
| MSI GeForce RTX 3080 Gaming X Trio (Idle: 103 W) | |
| AMD Ryzen 9 5900X (Idle: 78.1 W) | |
| KFA2 GeForce RTX 2080 Ti EX (Idle: 100.5 W) | |
| Zotac Gaming GeForce RTX 3070 Twin Edge (Idle: 114.96 W) | |
| Média NVIDIA GeForce RTX 3070 (Idle: 317 - 550, n=5 W) | |
| Nvidia GeForce RTX 2080 Super (Idle: 78.87 W) | |
| NVIDIA GeForce RTX 3060 Ti FE (Idle: 111.39 W) | |
| Média NVIDIA GeForce RTX 2080 Super (Desktop) (Idle: 336 - 416, n=5 W) | |
| AMD Radeon RX 5700 XT (Idle: 69.8 W) | |
| Nvidia GeForce RTX 2070 Super (96.8 fps, Idle: 80.5 W) | |
| Média NVIDIA GeForce RTX 2070 Super (Desktop) (Idle: 296 - 377, n=6 W) | |
| Média NVIDIA GeForce RTX 2060 Super (Desktop) (Idle: 246 - 331, n=5 W) | |
| Nvidia GeForce RTX 2060 Super (82.7 fps, Idle: 77.12 W) | |
| KFA 2 GeForce GTX 1660 Super (Idle: 84.76 W) | |
| KFA2 GeForce GTX 1650 Super EX One Click OC (Idle: 86.5 W) | |
* ... menor é melhor
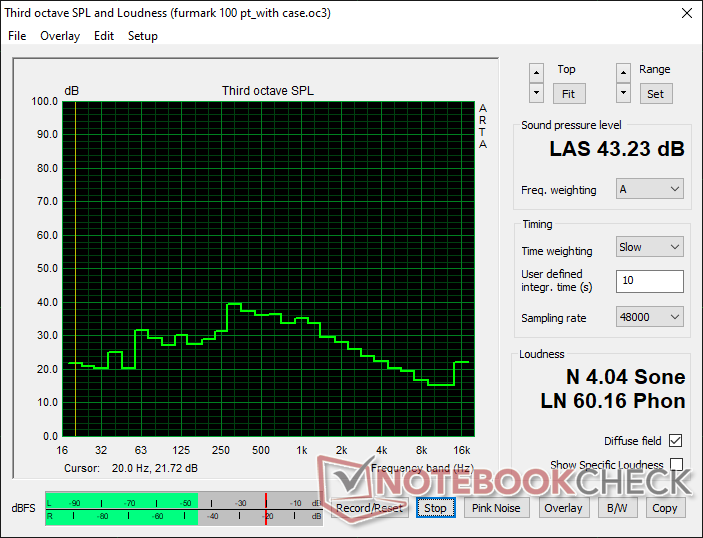
Níveis de ruídos
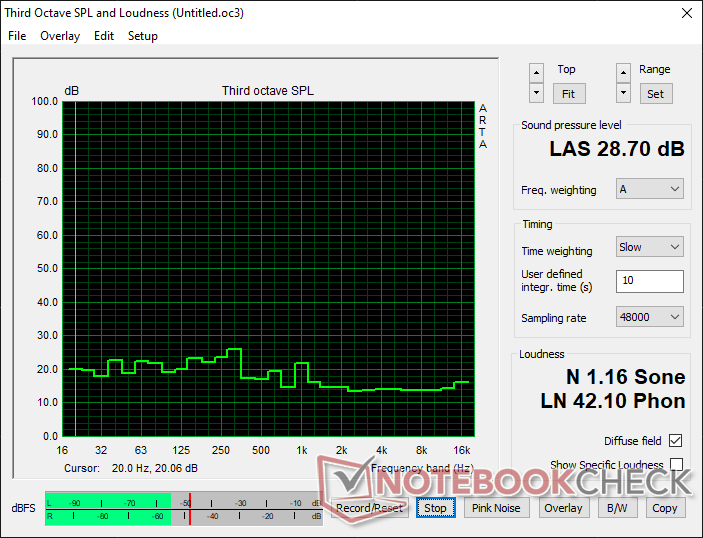
Uma das delicadezas do novo mecanismo de refrigeração da NVIDIA é que os níveis de ruído do ventilador são mantidos bem sob controle
Como a NVIDIA implementou um modo completo de parada do ventilador com placas Ampere FE, o nível de pressão sonora (SPL) no modo inativo é mais ou menos o mesmo que o valor ambiente de 28,70 db(A) a uma distância de 20 cm da caixa fechada.
O SPL subiu para 43,23 db(A) durante o teste de estresse FurMark, o que é muito tolerável, particularmente quando o estojo está fechado. Outros ajustes da curva do ventilador podem ser possíveis usando utilitários de terceiros, como o MSI Afterburner
Pro
Contra
Veredicto
A edição NVIDIA GeForce RTX 3060 Ti Founders Edition acerta um monte de coisas. O cartão parece e sente-se premium, é bem construído e ocupa uma pegada relativamente compacta de 2 slots. A única coisa mais interessante aqui é o conector de alimentação de 12 pinos localizado centralmente, que não acrescenta nenhuma funcionalidade, mas na verdade torna o gerenciamento de cabos incômodo
O novo mecanismo de resfriamento da NVIDIA oferece uma clara vantagem e, com a parada completa do ventilador, a Edição dos Fundadores pode ser potencialmente uma melhor barganha em comparação com as variantes de placa adicional (AiB). Observamos um consumo de energia reduzido (embora apenas marginal) em comparação com o RTX 2080 Super, juntamente com níveis de ruído gerenciáveis sob carga, que são desenvolvimentos bem-vindos
A Edição dos Fundadores da NVIDIA GeForce RTX 3060 Ti oferece desempenho do RTX 2080 Super por US$399,99 (₹35,900) e com um envelope de energia 50 W menor. Tem o potencial de ser uma das GPUs mais populares desta geração, mas as contínuas restrições de fornecimento continuam a diminuir as perspectivas de compra de uma na MSRP.
O RTX 3060 Ti FE deve ser a sua carta de apresentação se você jogar principalmente nas resoluções 1080p Ultra e QHD Ultra. O jogo Smooth 4K é definitivamente possível com alguns ajustes visuais. As melhorias de desempenho do Ray Tracing (RT) sobre o RTX 2080 Super não são muito significativas. Dito isto, o DLSS 2.0 deve ser capaz de oferecer uma chance no braço em títulos suportados para obter quadros jogáveis com RT habilitado
O cartão também é capaz de computar decentemente e modelar em 3D, mas não é realmente adequado para CAD/CAM profissional, médico, automóvel ou fluxos de trabalho de energia
A NVIDIA conseguiu oferecer RTX 2080 Super performance e um pouco mais por US$ 300 a menos e com um TGP 50 W mais baixo. Aqueles que vêm de uma GTX 1070 descobrirão que o RTX 3060 Ti FE oferece a melhor barganha a preços MSRP. Entretanto, os compradores que podem estender um pouco seus orçamentos também podem querer dar uma olhada no RTX 3070 FE se ele puder ser obtido por US$ 499 MSRP.
Preço e disponibilidade
A NVIDIA GeForce RTX 3060 Ti Founders Edition, incluindo as de cartões de parceiros, está incerta no momento de escrever esta revisão. Atualmente, somente a Best Buy tem este cartão listado a US$399,99 MSRP. Sem surpresas, ele está completamente esgotado no momento da publicação. Recomendamos manter um controle sobre o link indicado, pois espera-se que os estoques sejam reabastecidos periodicamente
Price comparison

