Razer Blade 17 2022 Core i7 RTX 3080 Ti revisão laptop: Desempenho sobrealimentado
Sempre que uma nova geração de processadores da Intel ou Nvidia estiver disponível, você pode contar com a Razer para atualizar sua série Blade com as mais recentes opções de CPU ou GPU. A Blade 17 de 2022 é uma atualização interna da Blade 17 de 2021 com CPUs Intel Alder Lake-H do 12º gênero e GeForce GPUs RTX 3070 Ti e 3080 Ti substituindo as opções da 11ª geração Tiger Lake-H e RTX 3070 e 3080 do ano anterior. Como detalhado em nossas visão geral do lago Alderas novas CPUs da 12ª geração introduzem núcleos P de desempenho e núcleos E eficientes, enquanto a série móvel GeForce Ti tem o objetivo de obter mais desempenho essencialmente do mesmo chipset Nvidia Ampere
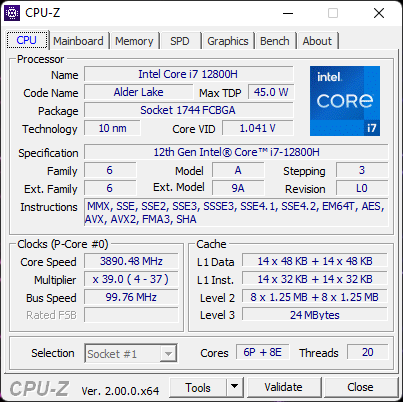
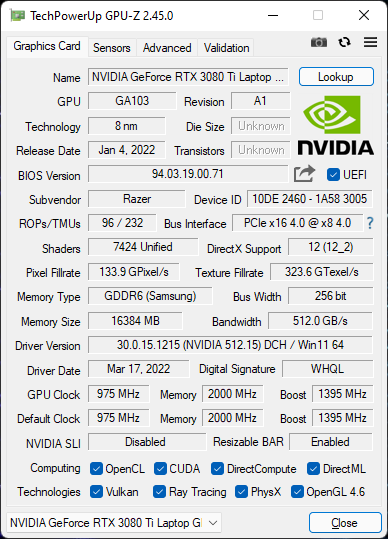
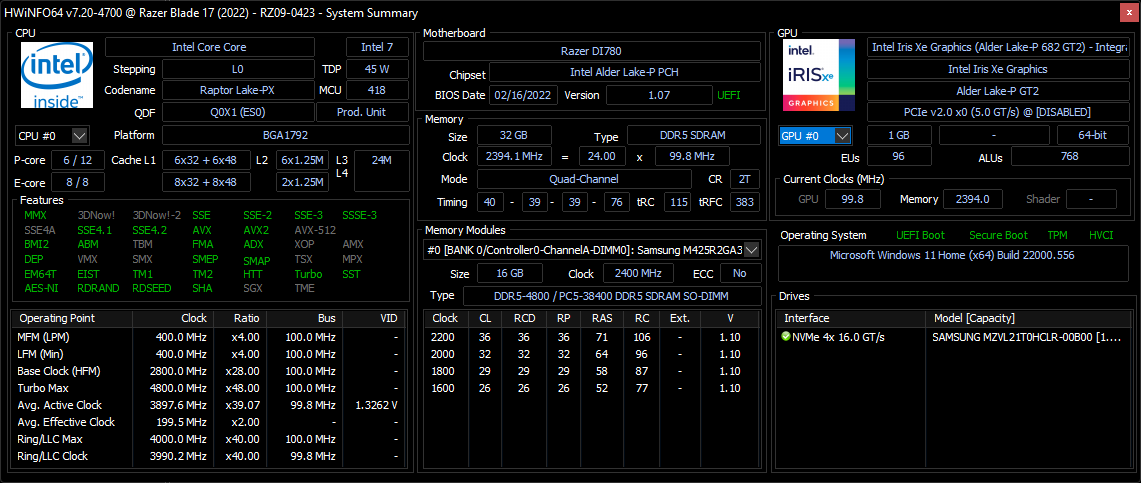
Nossa unidade Blade 17 como revista é uma configuração high-end com o Core i7-12800H, GPU RTX 3080 Ti, e painel QHD de 240 Hz por aproximadamente $4000 USD. Outras SKUs estão disponíveis com as GPUs RTX 3060 ou RTX 3070 Ti, displays FHD ou UHD, ou a CPU Core i9-12900H em vários pontos de partida. Ao contrário da GPU de 100 W da 10ª geração Intel Blade 17 ou 130 W da 11ª geração Blade 17, a GPU desta 12ª geração Blade 17 tem como alvo um TGP ainda maior de 165 W para uma performance potencialmente maior
As alternativas para a Lâmina 17 incluem outros laptops de jogos ultramodernos como o MSI GS76 ou GS77, Asus Zephyrus S17, Aorus 17G, Alienware x17ou Maingear Vector Pro
Mais resenhas da Razer
Possíveis concorrentes em comparação
Avaliação | Data | Modelo | Peso | Altura | Size | Resolução | Preço |
|---|---|---|---|---|---|---|---|
| 91.2 % v7 (old) | 03/2022 | Razer Blade 17 RTX 3080 Ti i7-12800H, GeForce RTX 3080 Ti Laptop GPU | 2.7 kg | 19.9 mm | 17.30" | 2560x1440 | |
| 87.8 % v7 (old) | 02/2021 | Razer Blade Pro 17 2021 (QHD Touch) i7-10875H, GeForce RTX 3080 Laptop GPU | 3 kg | 19.9 mm | 17.30" | 3840x2160 | |
| 86.2 % v7 (old) | 09/2021 | MSI GS76 Stealth 11UH i9-11900H, GeForce RTX 3080 Laptop GPU | 2.4 kg | 20 mm | 17.30" | 3840x2160 | |
| 90.1 % v7 (old) | 07/2021 | Asus ROG Zephyrus S17 GX703HSD i9-11900H, GeForce RTX 3080 Laptop GPU | 2.8 kg | 19.9 mm | 17.30" | 2560x1440 | |
| 86 % v7 (old) | 06/2021 | Aorus 17G YD i7-11800H, GeForce RTX 3080 Laptop GPU | 2.8 kg | 26 mm | 17.30" | 1920x1080 | |
| 89 % v7 (old) | 09/2021 | Alienware x17 RTX 3080 P48E i7-11800H, GeForce RTX 3080 Laptop GPU | 3.2 kg | 21.4 mm | 17.30" | 3840x2160 |
Caso - O mesmo, mas diferente
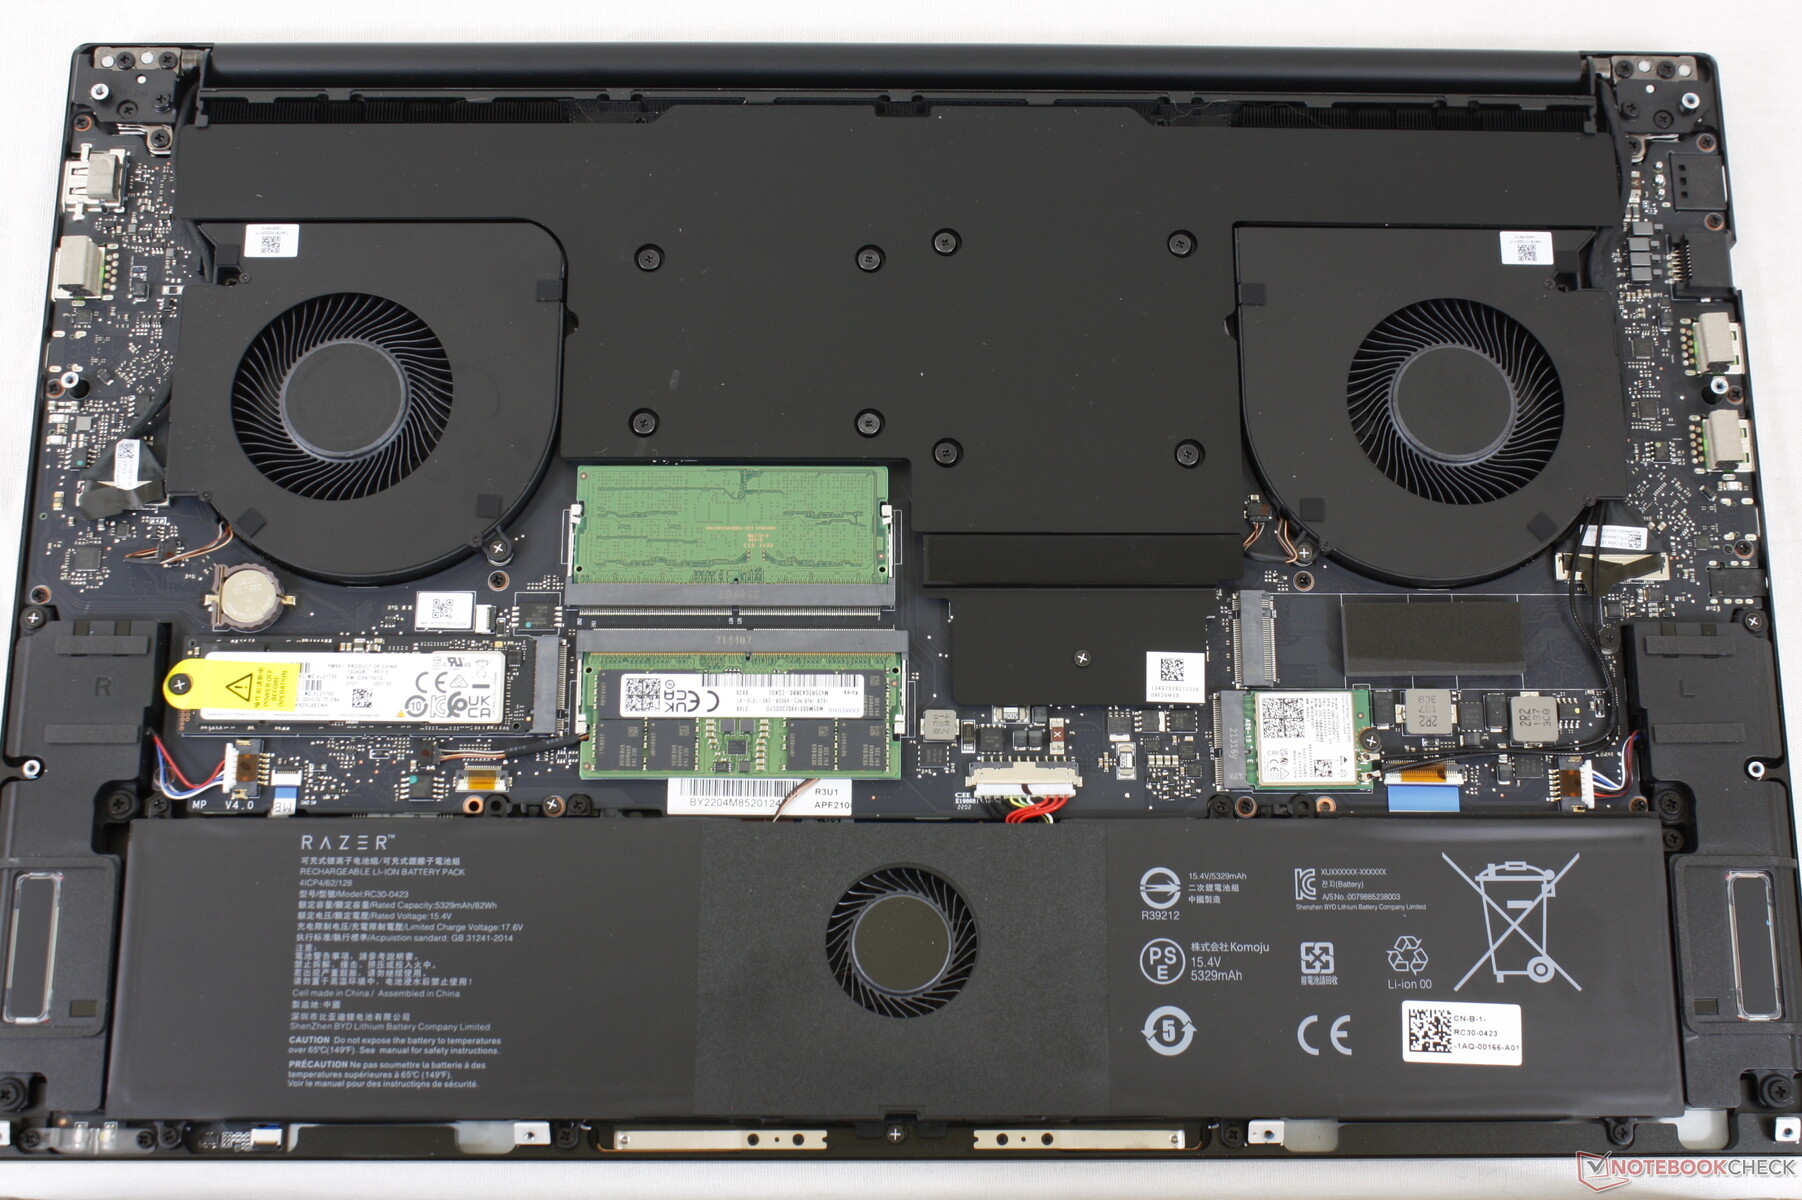
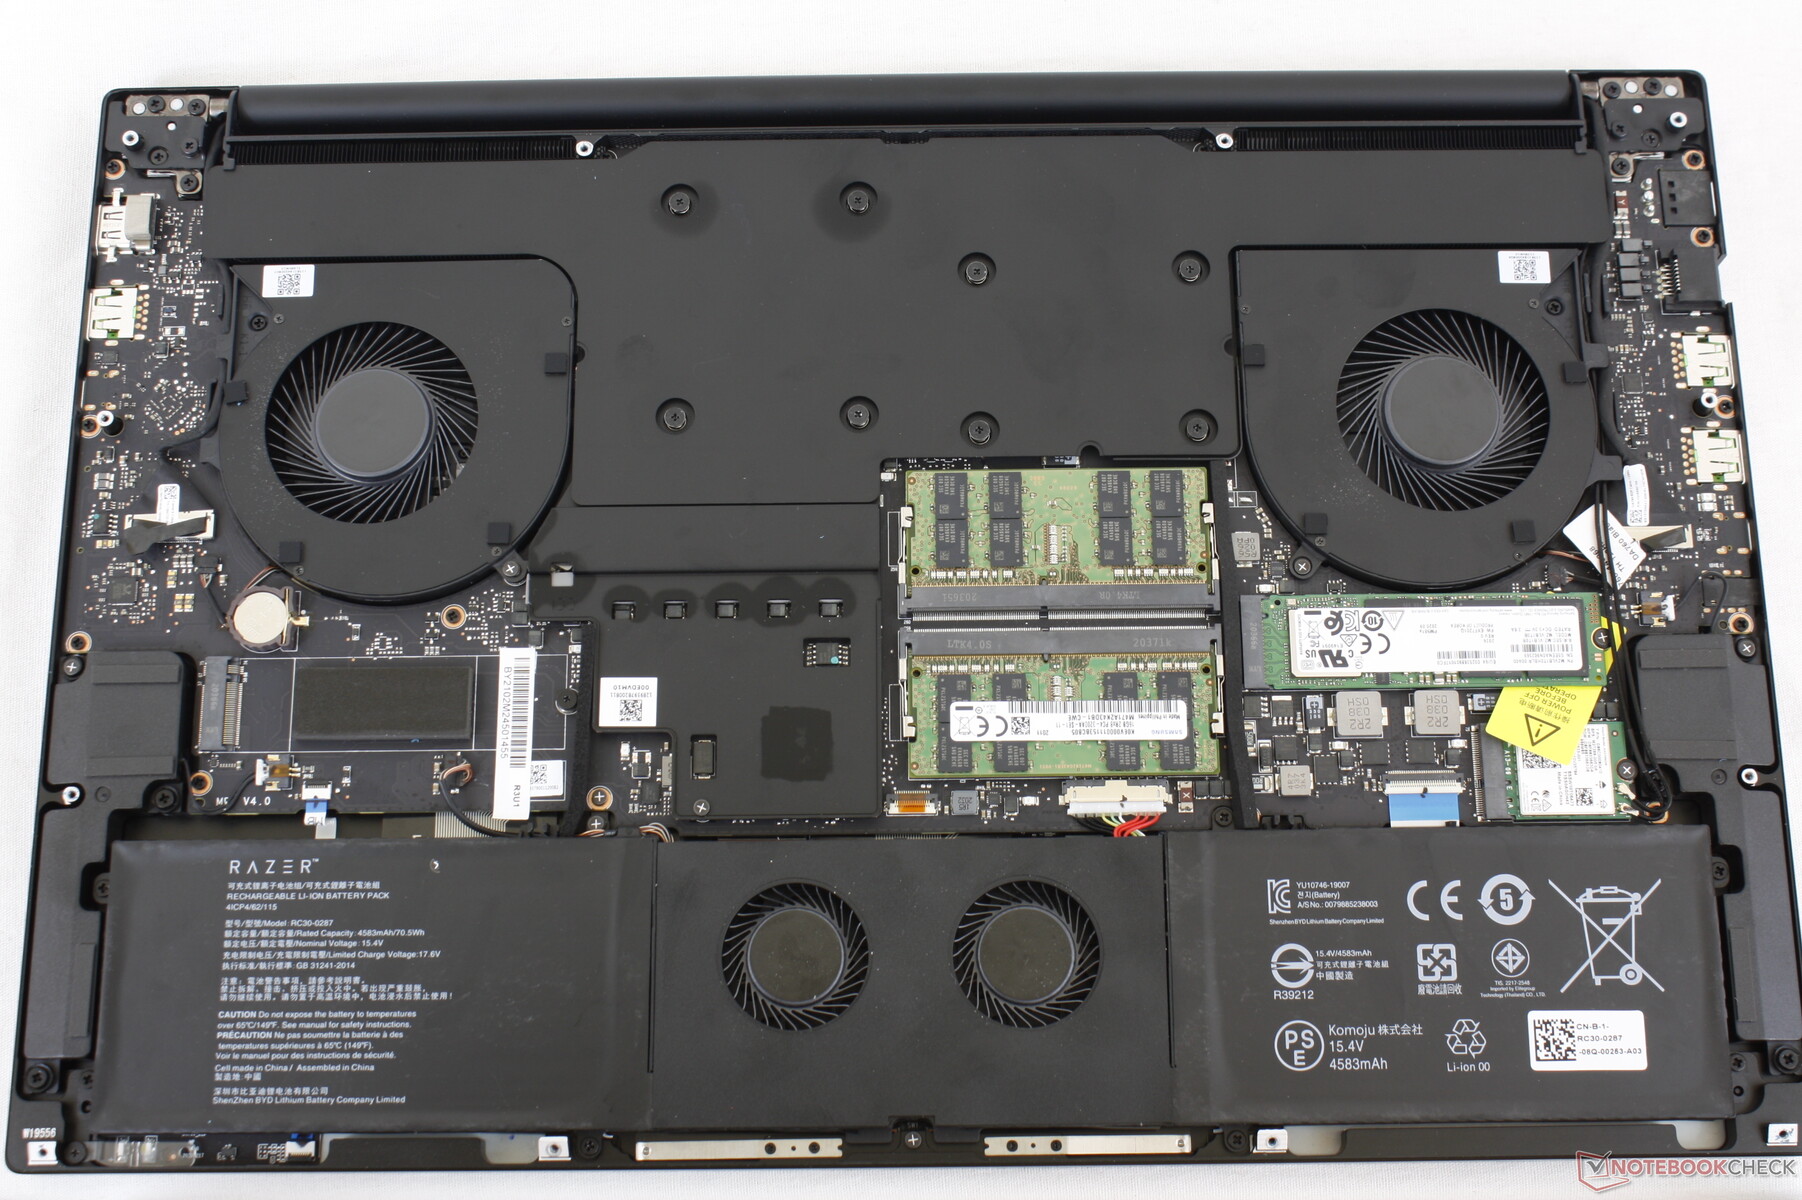
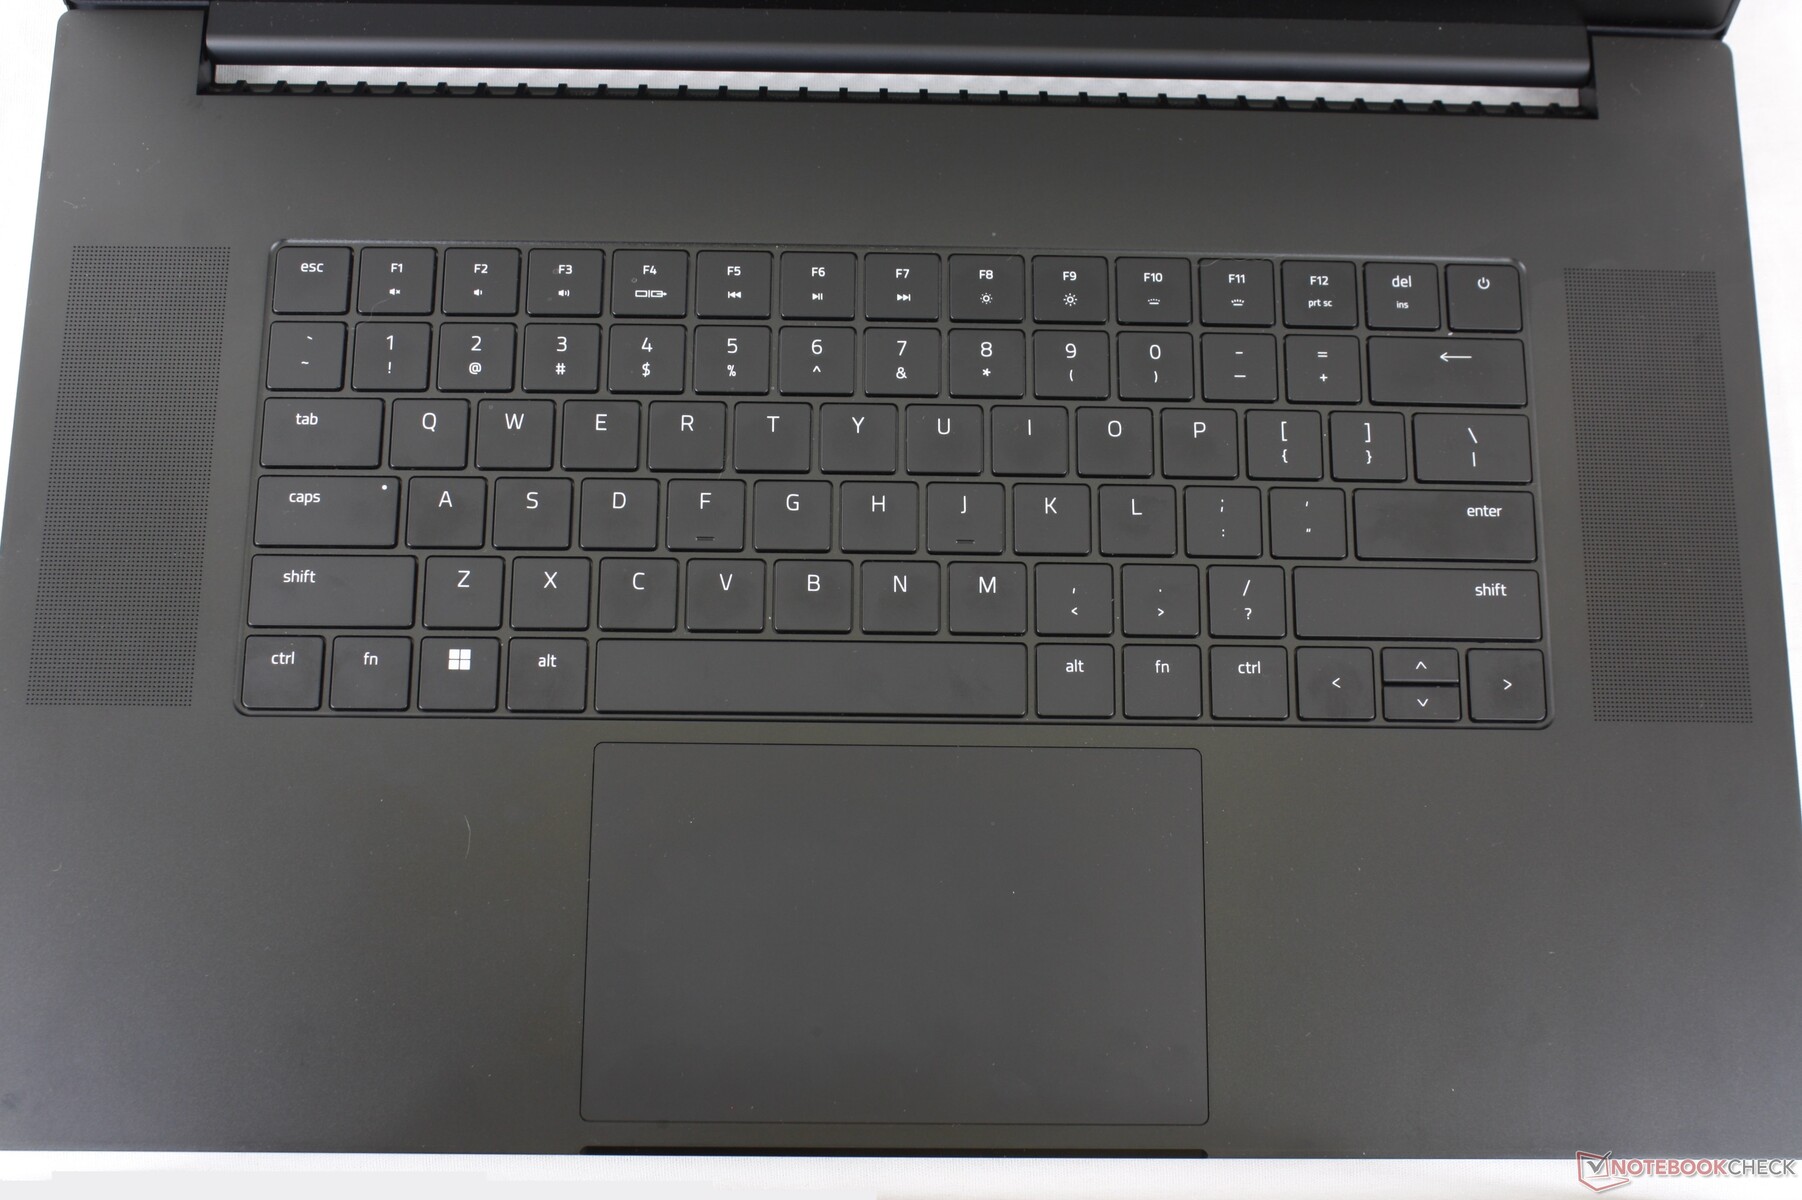
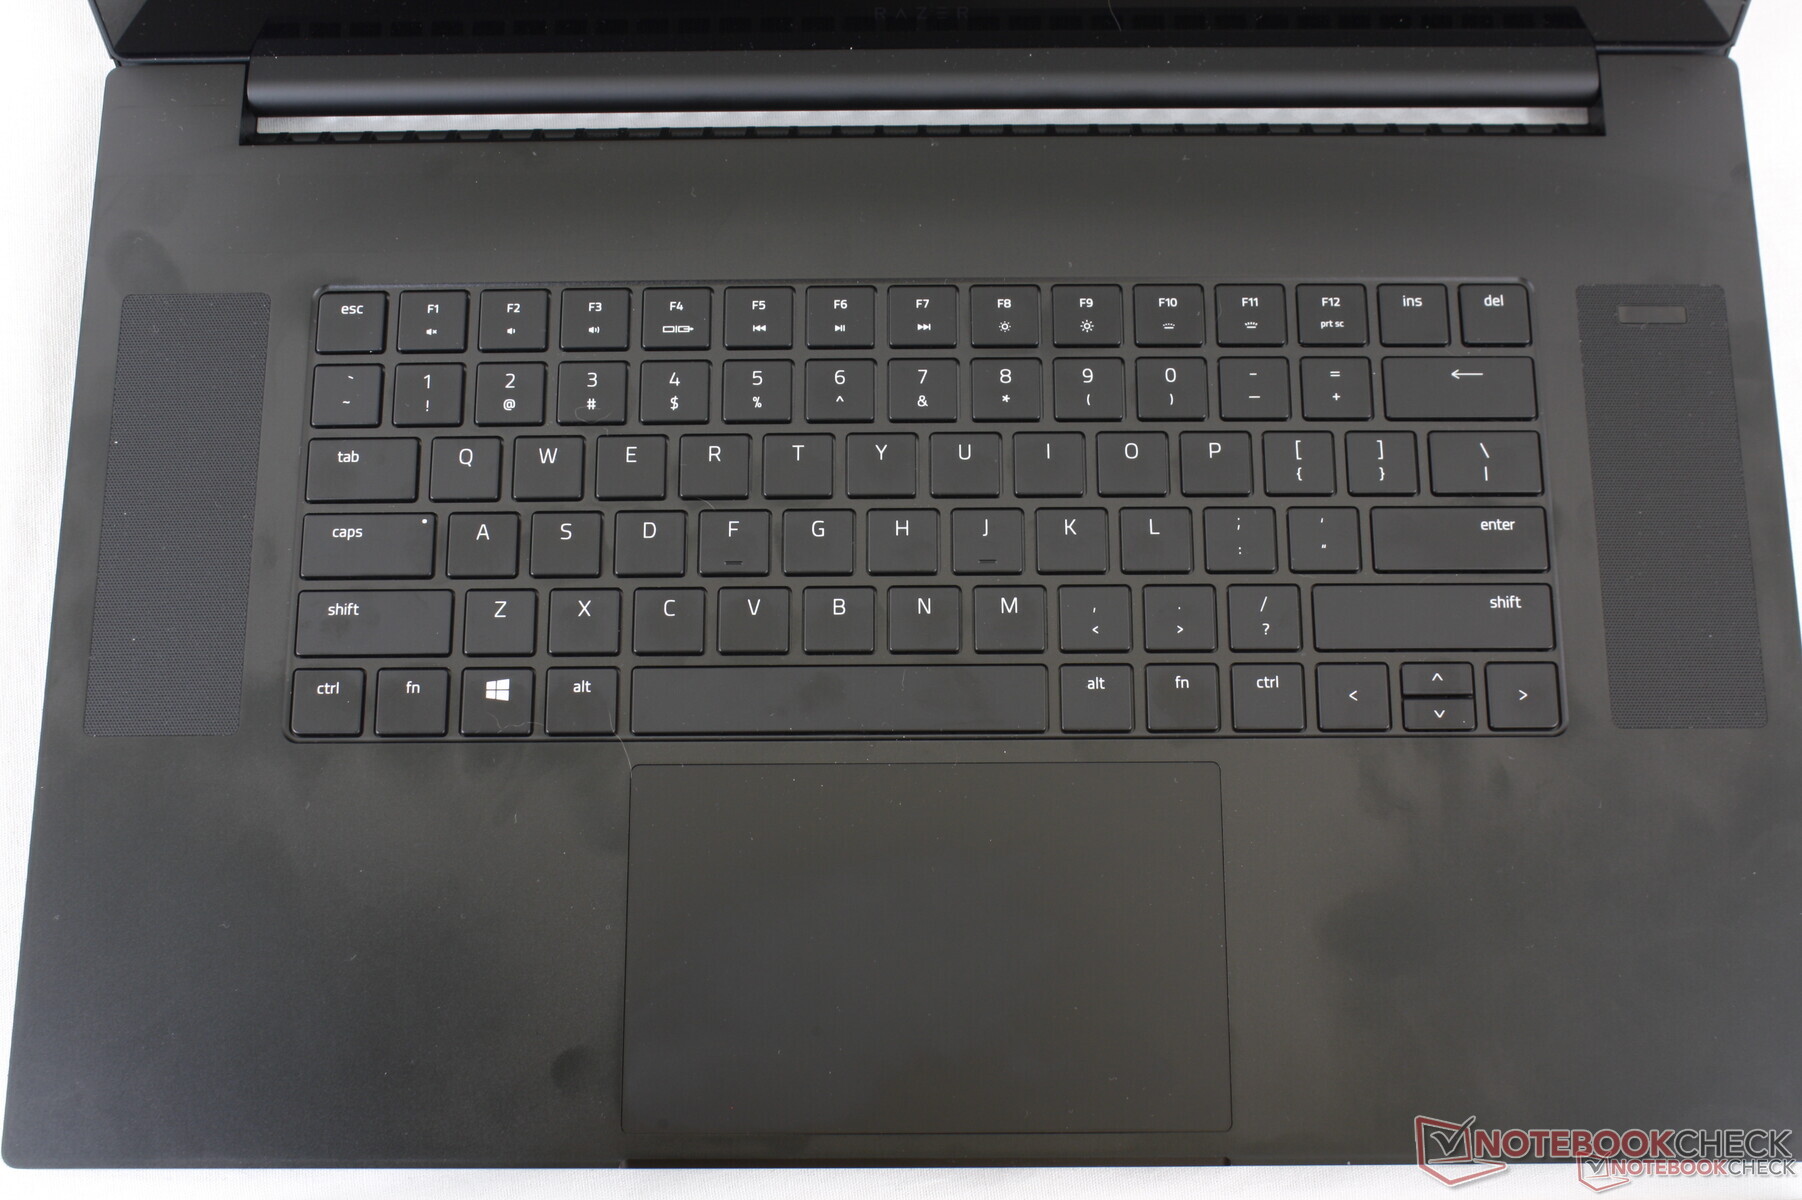
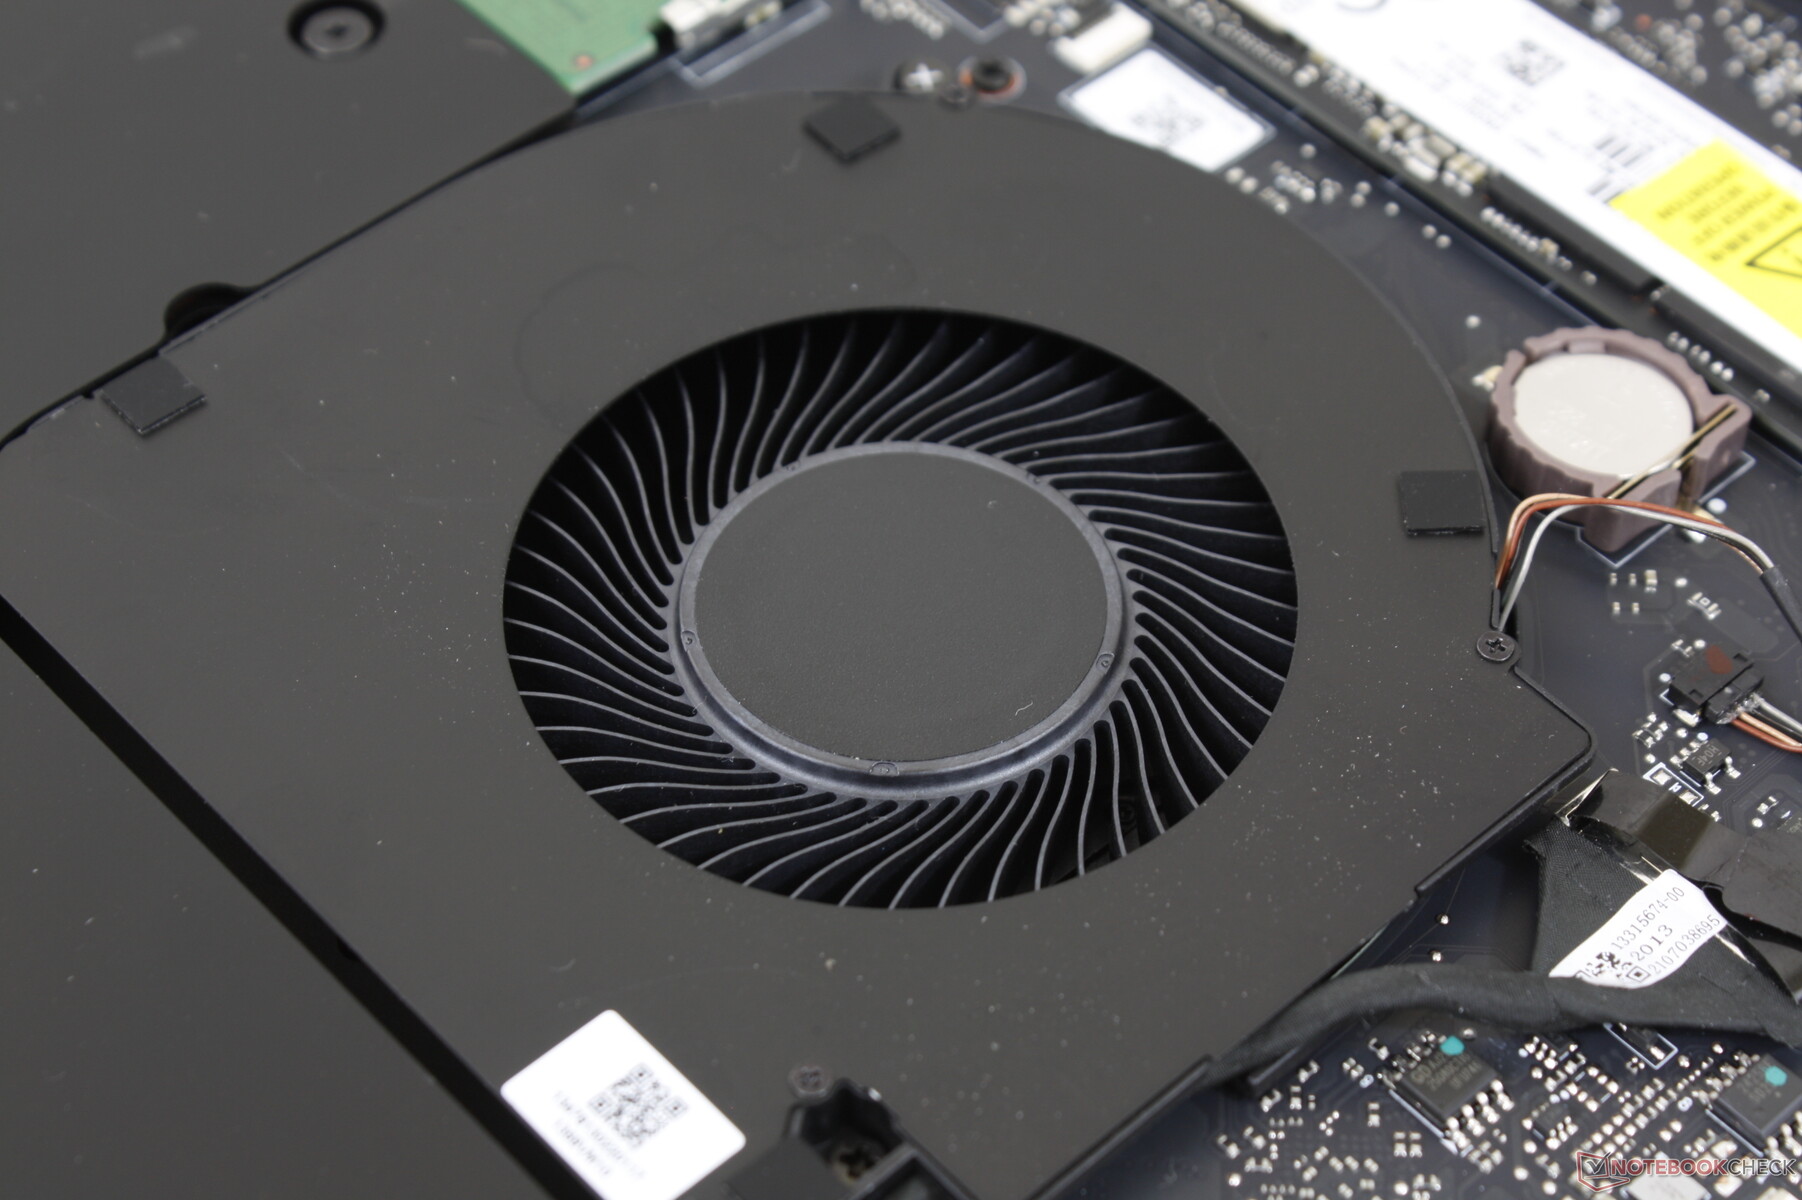
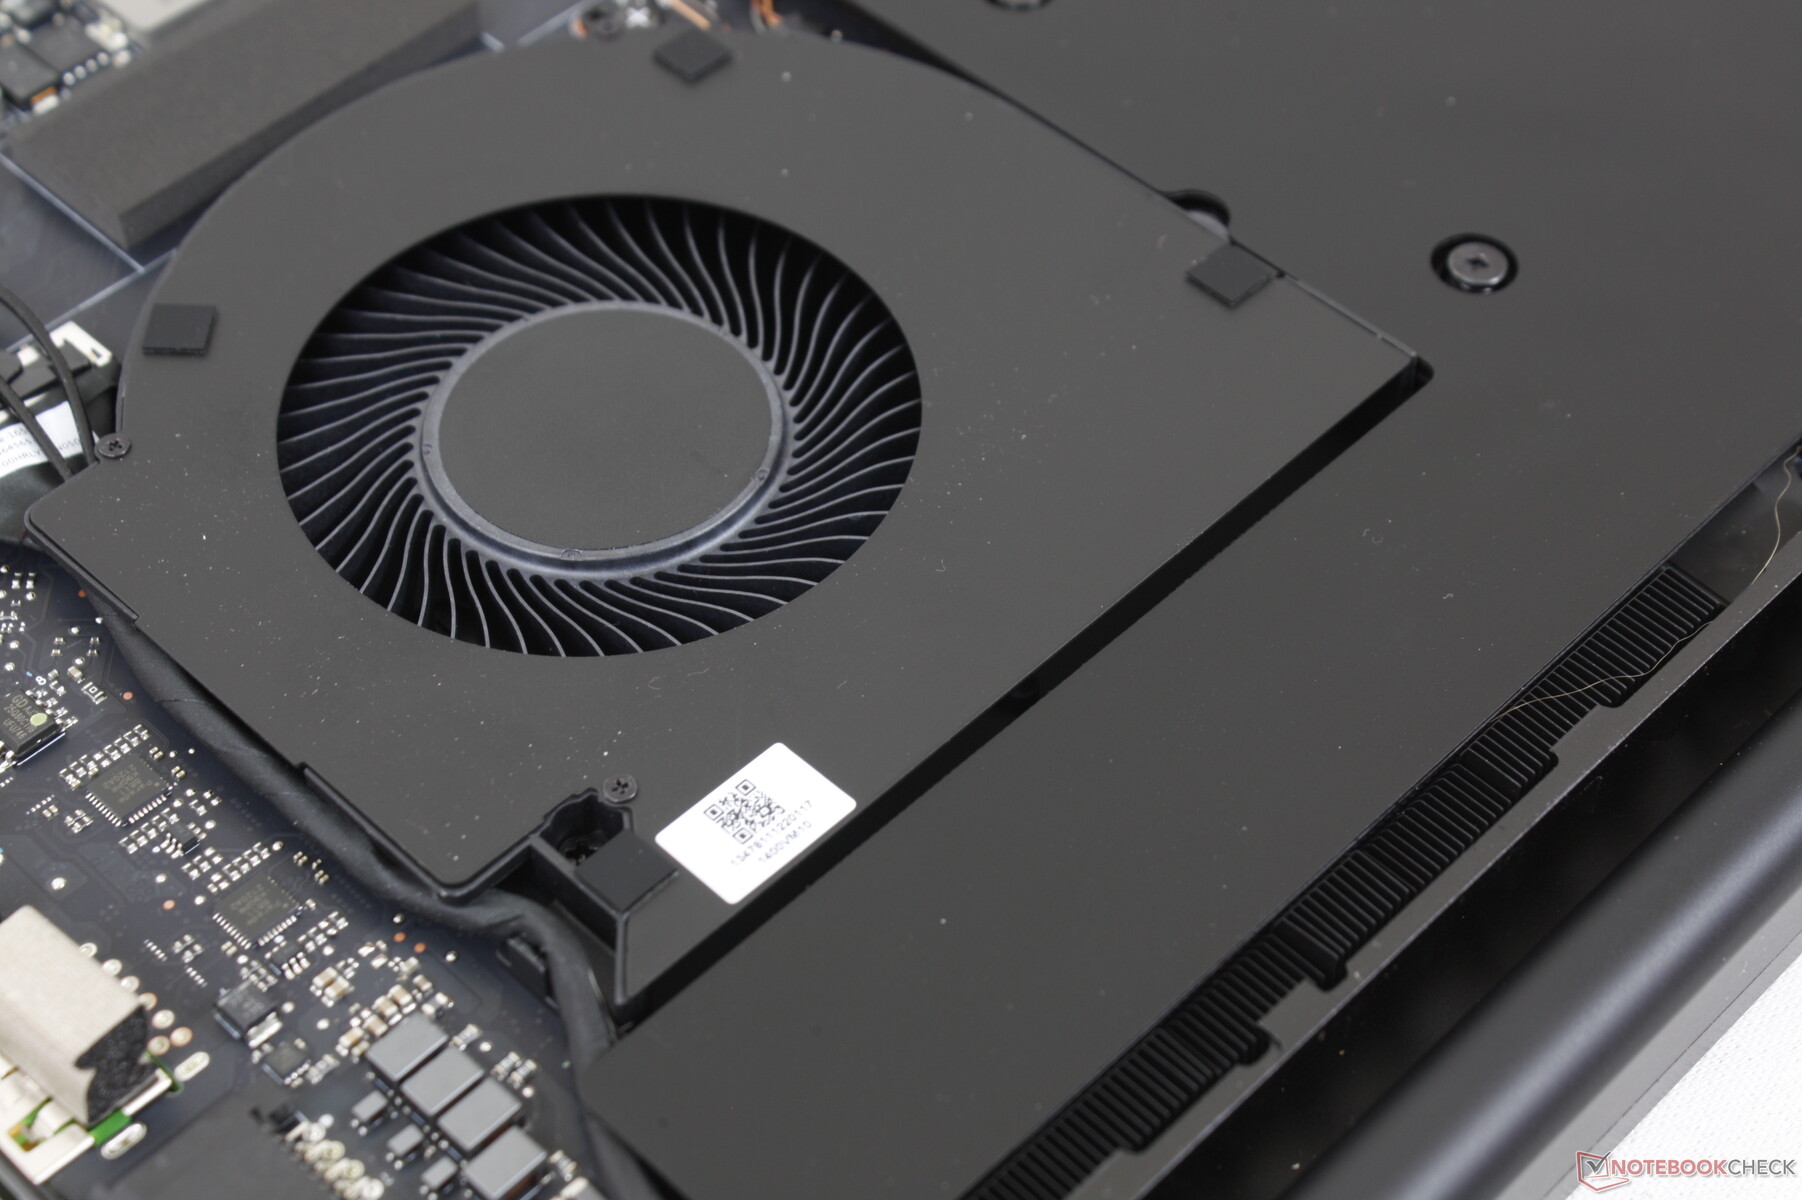
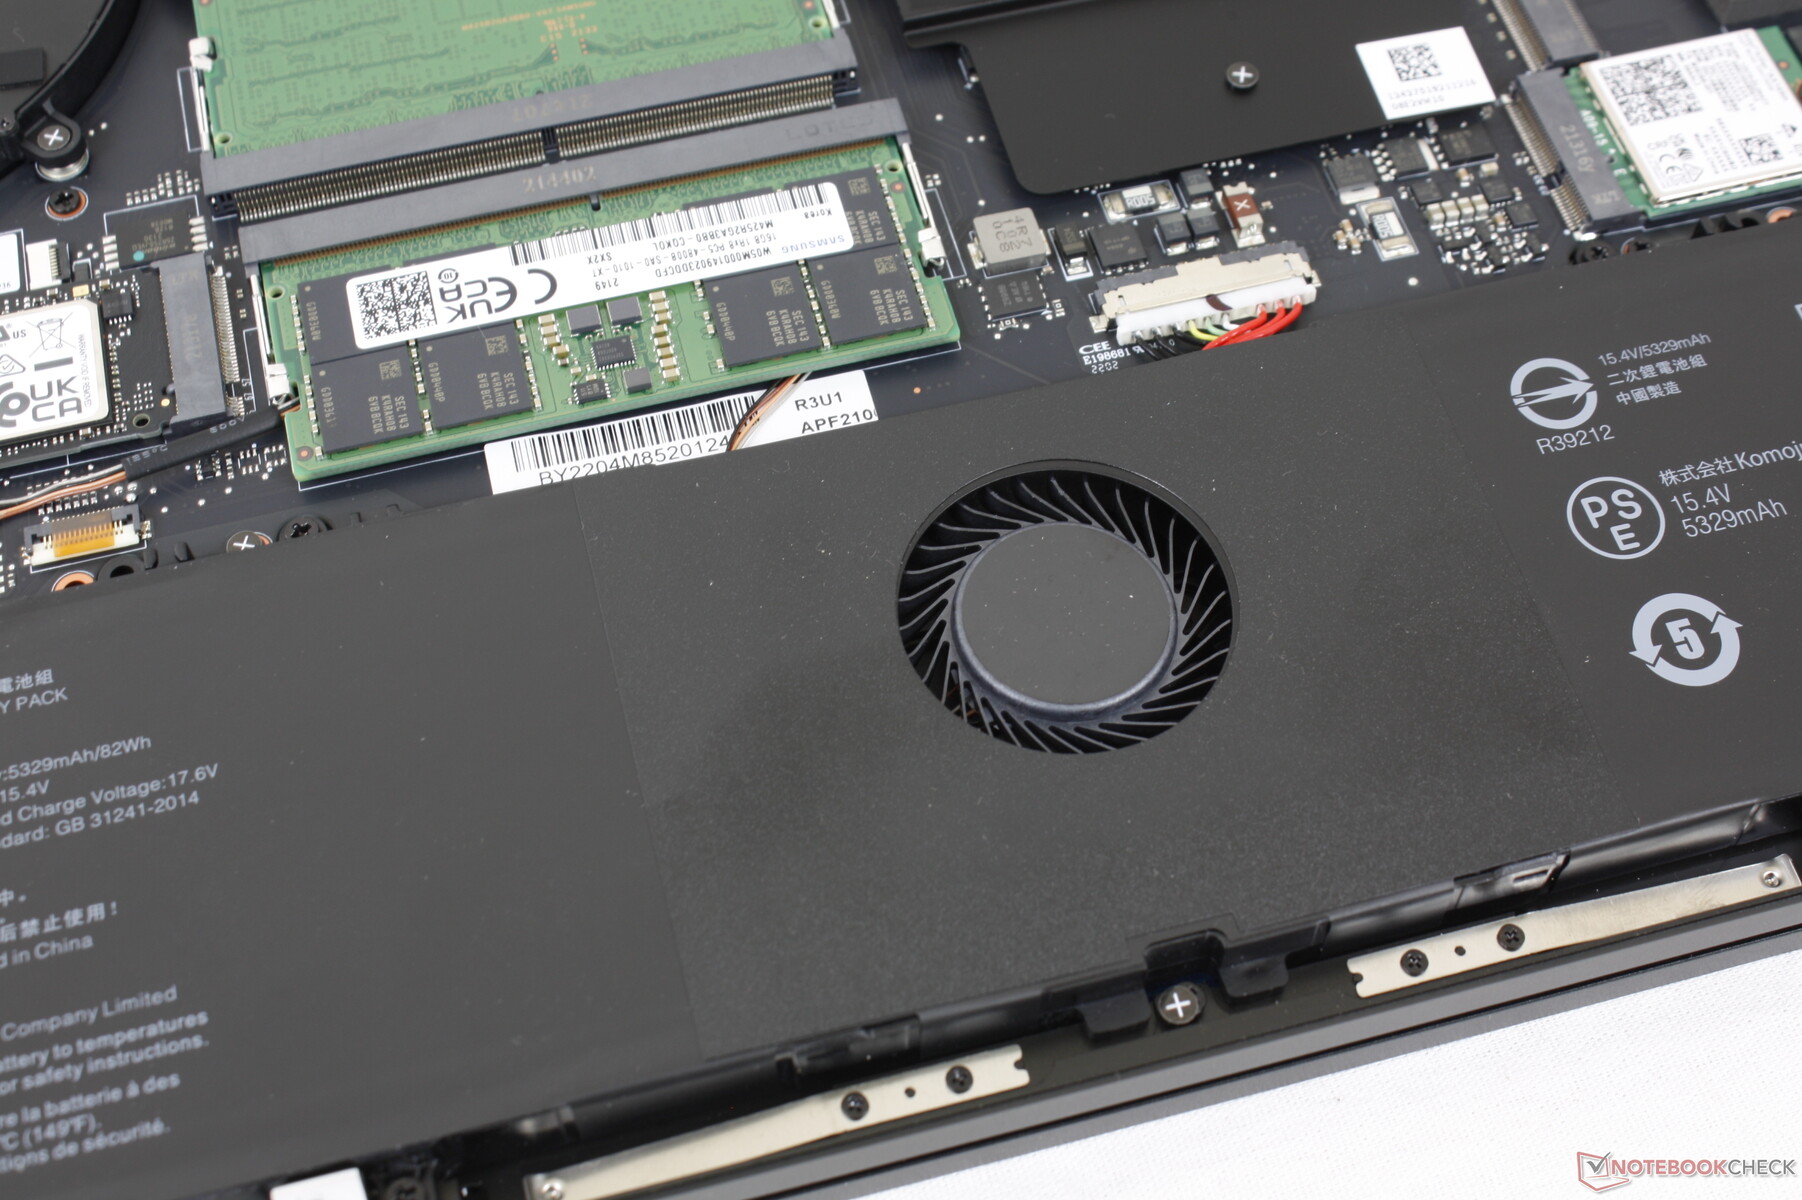
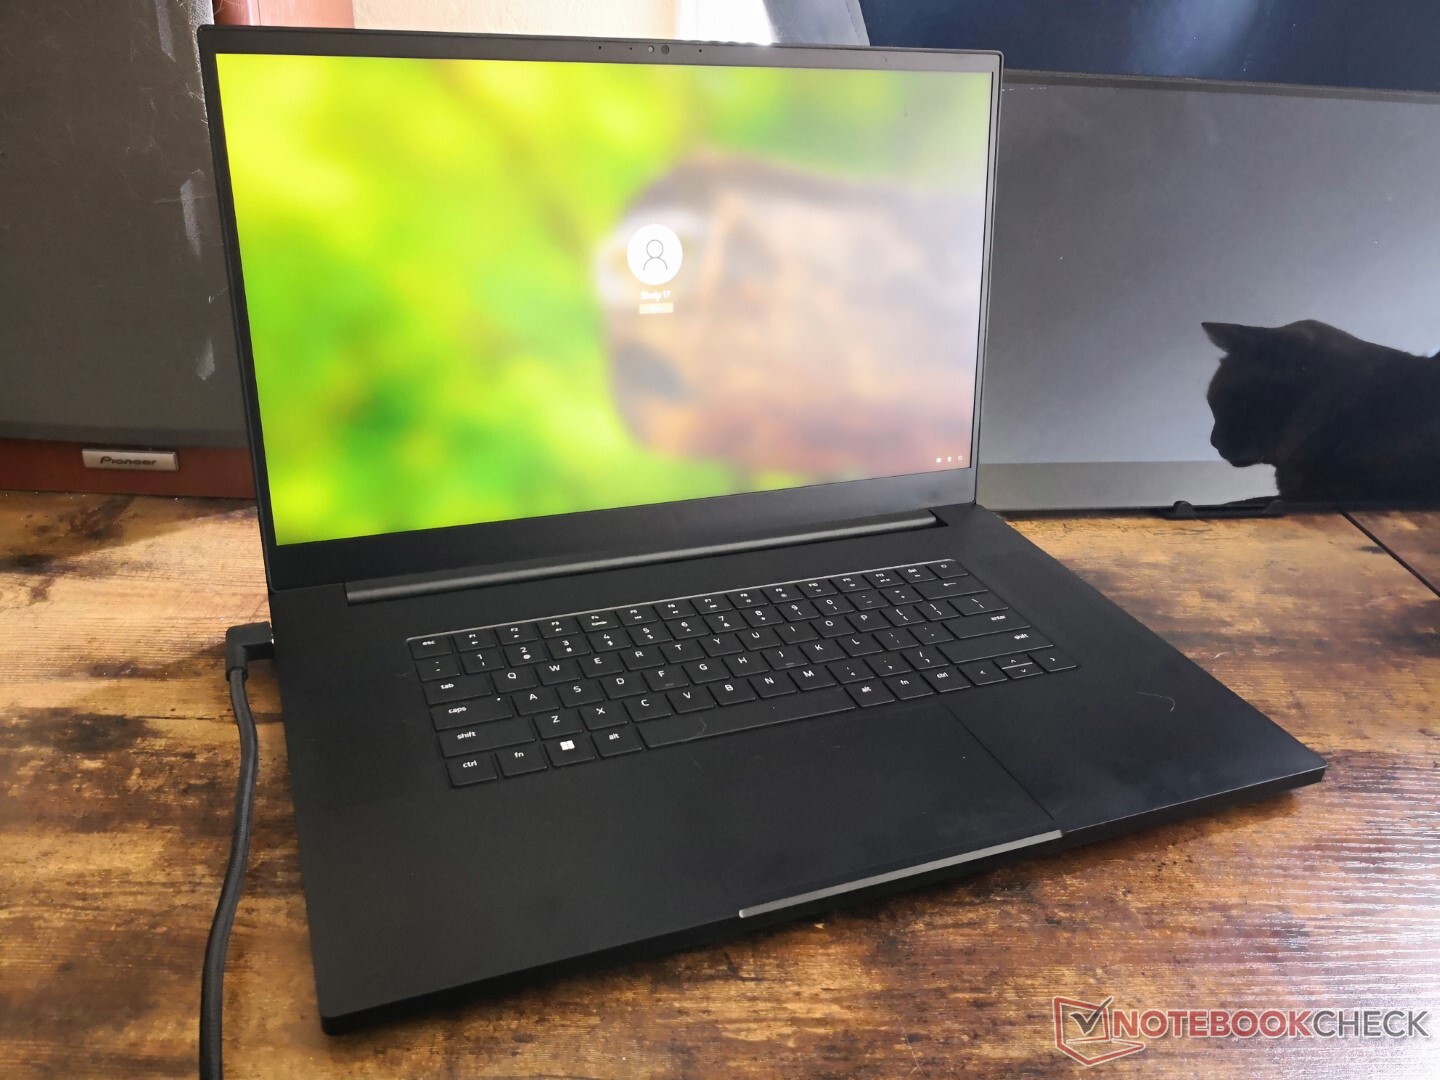
O chassi externo é idêntico ao modelo do ano passado, mas com duas diferenças visuais importantes. Primeiro, as tampas das teclas do teclado são agora maiores do que eram nos modelos mais antigos. Em segundo lugar, agora você pode ver apenas três ventiladores através das grelhas na parte inferior da unidade em vez de quatro, uma vez que a Razer removeu um dos ventiladores. Estas pequenas mudanças têm um impacto sobre a bateria e as temperaturas em geral, como nossa revisão mostrará.
Conectividade - Agora com dois Thunderbolt 4 Portos
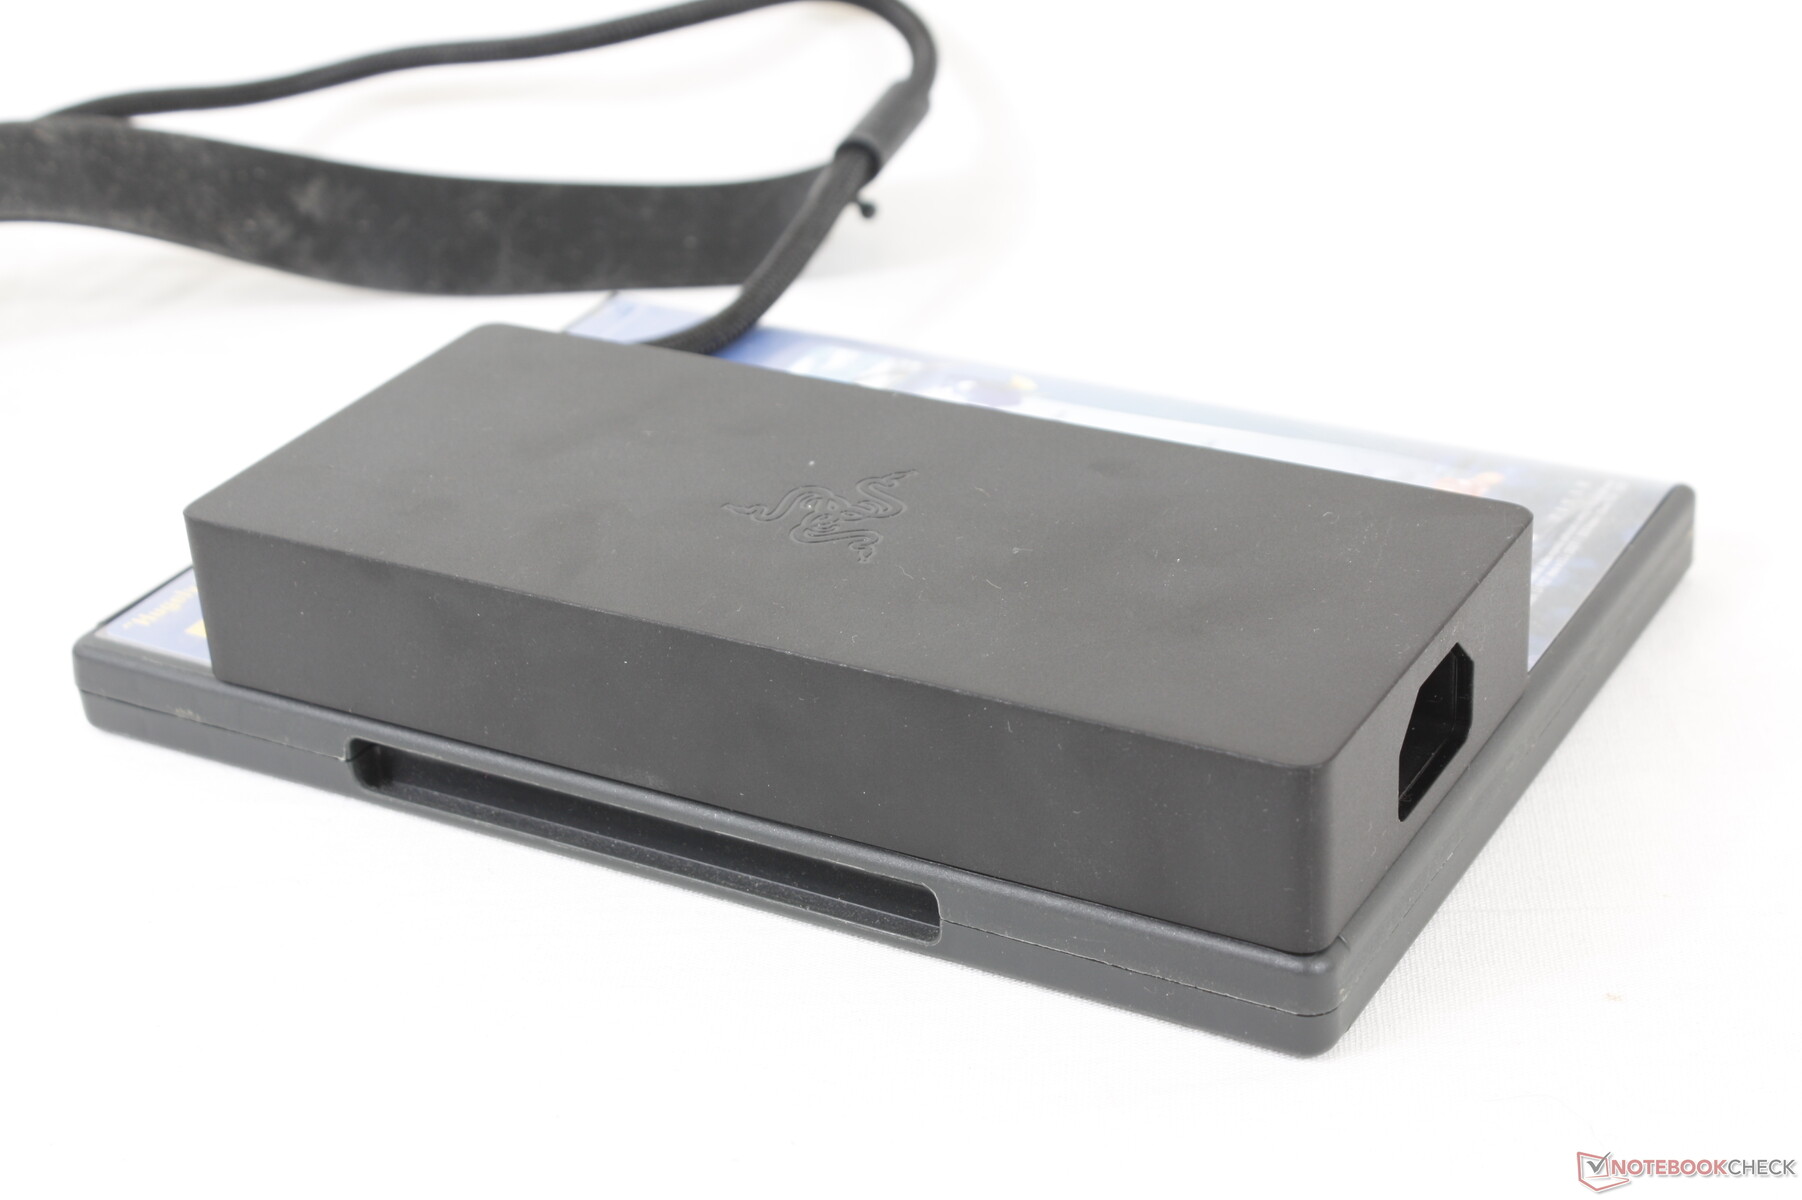
As opções de porta permanecem idênticas ao modelo Intel do 10º gênero, exceto por uma diferença chave: ambas as portas USB-C agora suportam Thunderbolt em vez de apenas uma. O novo modelo é compatível com o adaptador AC do ano passado também, mas o desempenho pode ser afetado uma vez que o modelo mais novo de 2022 utiliza um adaptador de maior capacidade de 280 W.
Leitor de cartões SD
| SD Card Reader | |
| average JPG Copy Test (av. of 3 runs) | |
| Razer Blade Pro 17 2021 (QHD Touch) (Toshiba Exceria Pro SDXC 64 GB UHS-II) | |
| MSI GS76 Stealth 11UH (AV PRO microSD 128 GB V60) | |
| Aorus 17G YD (AV PRO microSD 128 GB V60) | |
| Asus ROG Zephyrus S17 GX703HSD | |
| Alienware x17 RTX 3080 P48E (AV Pro V60) | |
| Razer Blade 17 RTX 3080 Ti (AV Pro V60) | |
| maximum AS SSD Seq Read Test (1GB) | |
| Asus ROG Zephyrus S17 GX703HSD | |
| Alienware x17 RTX 3080 P48E (AV Pro V60) | |
| MSI GS76 Stealth 11UH (AV PRO microSD 128 GB V60) | |
| Aorus 17G YD (AV PRO microSD 128 GB V60) | |
| Razer Blade Pro 17 2021 (QHD Touch) (Toshiba Exceria Pro SDXC 64 GB UHS-II) | |
| Razer Blade 17 RTX 3080 Ti (AV Pro V60) | |
Comunicação
Webcam
A webcam é de 1080p ou 2 MP ao contrário das webcams de 720p ou 1 MP na maioria dos outros laptops para uma imagem mais nítida. Windows Olá também é suportado, mas continua não havendo obturador de privacidade.


Manutenção
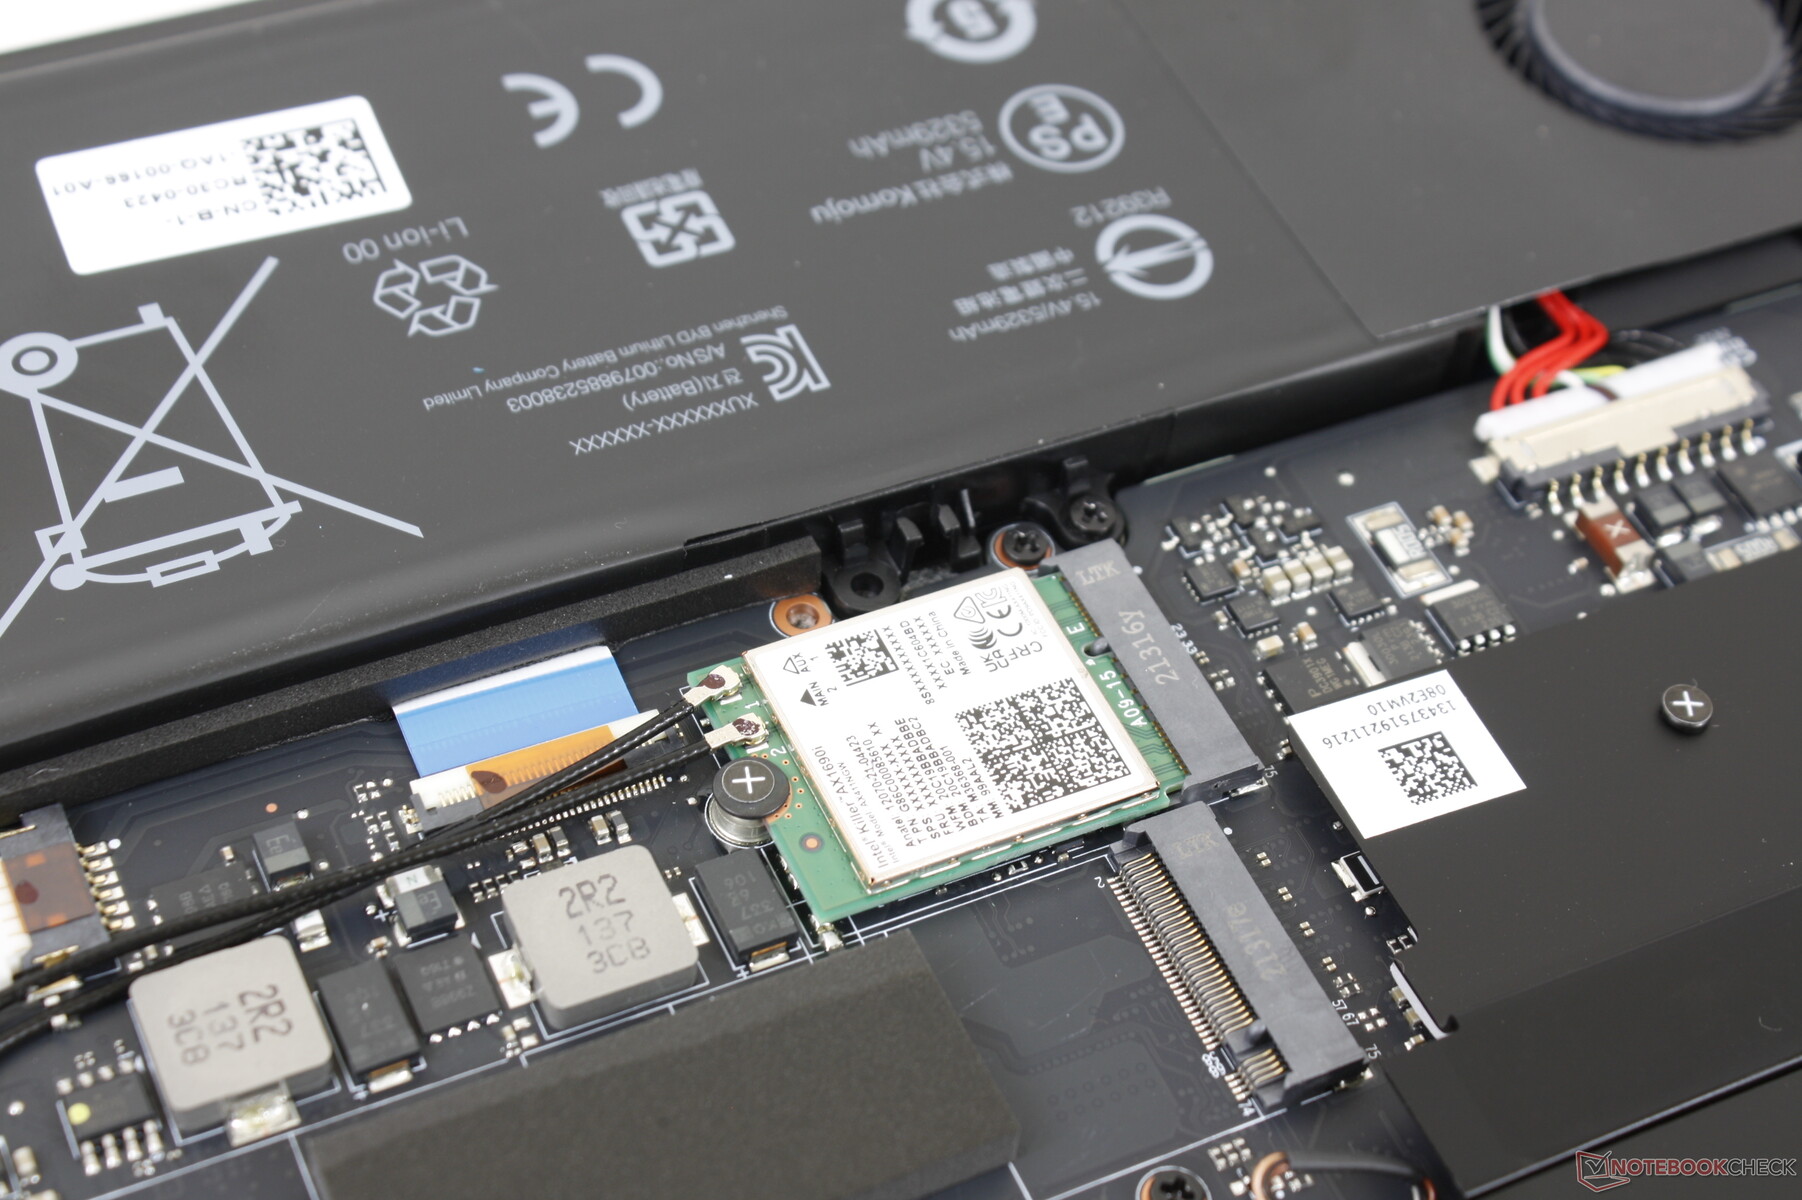
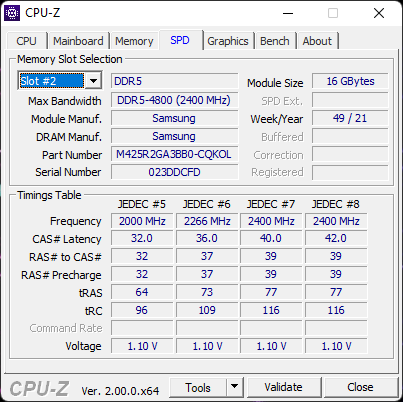
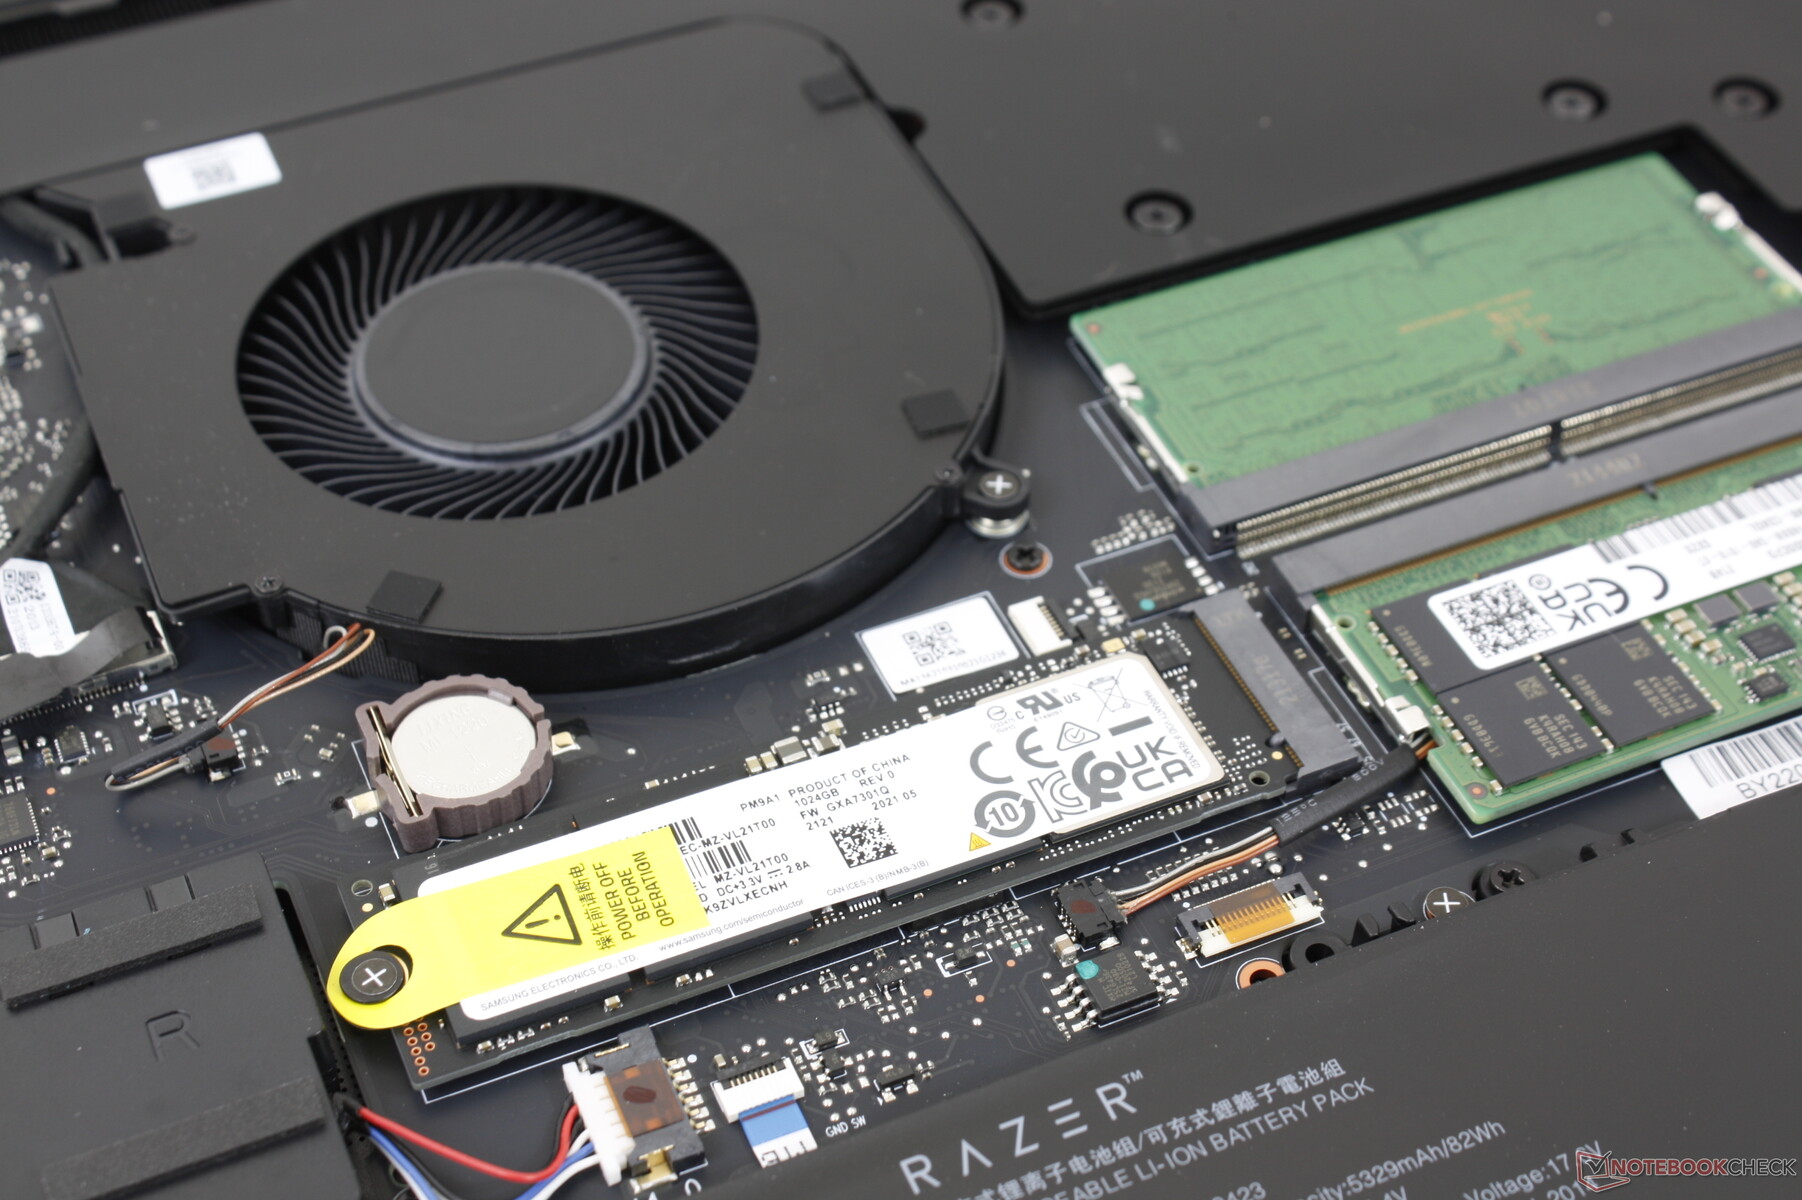
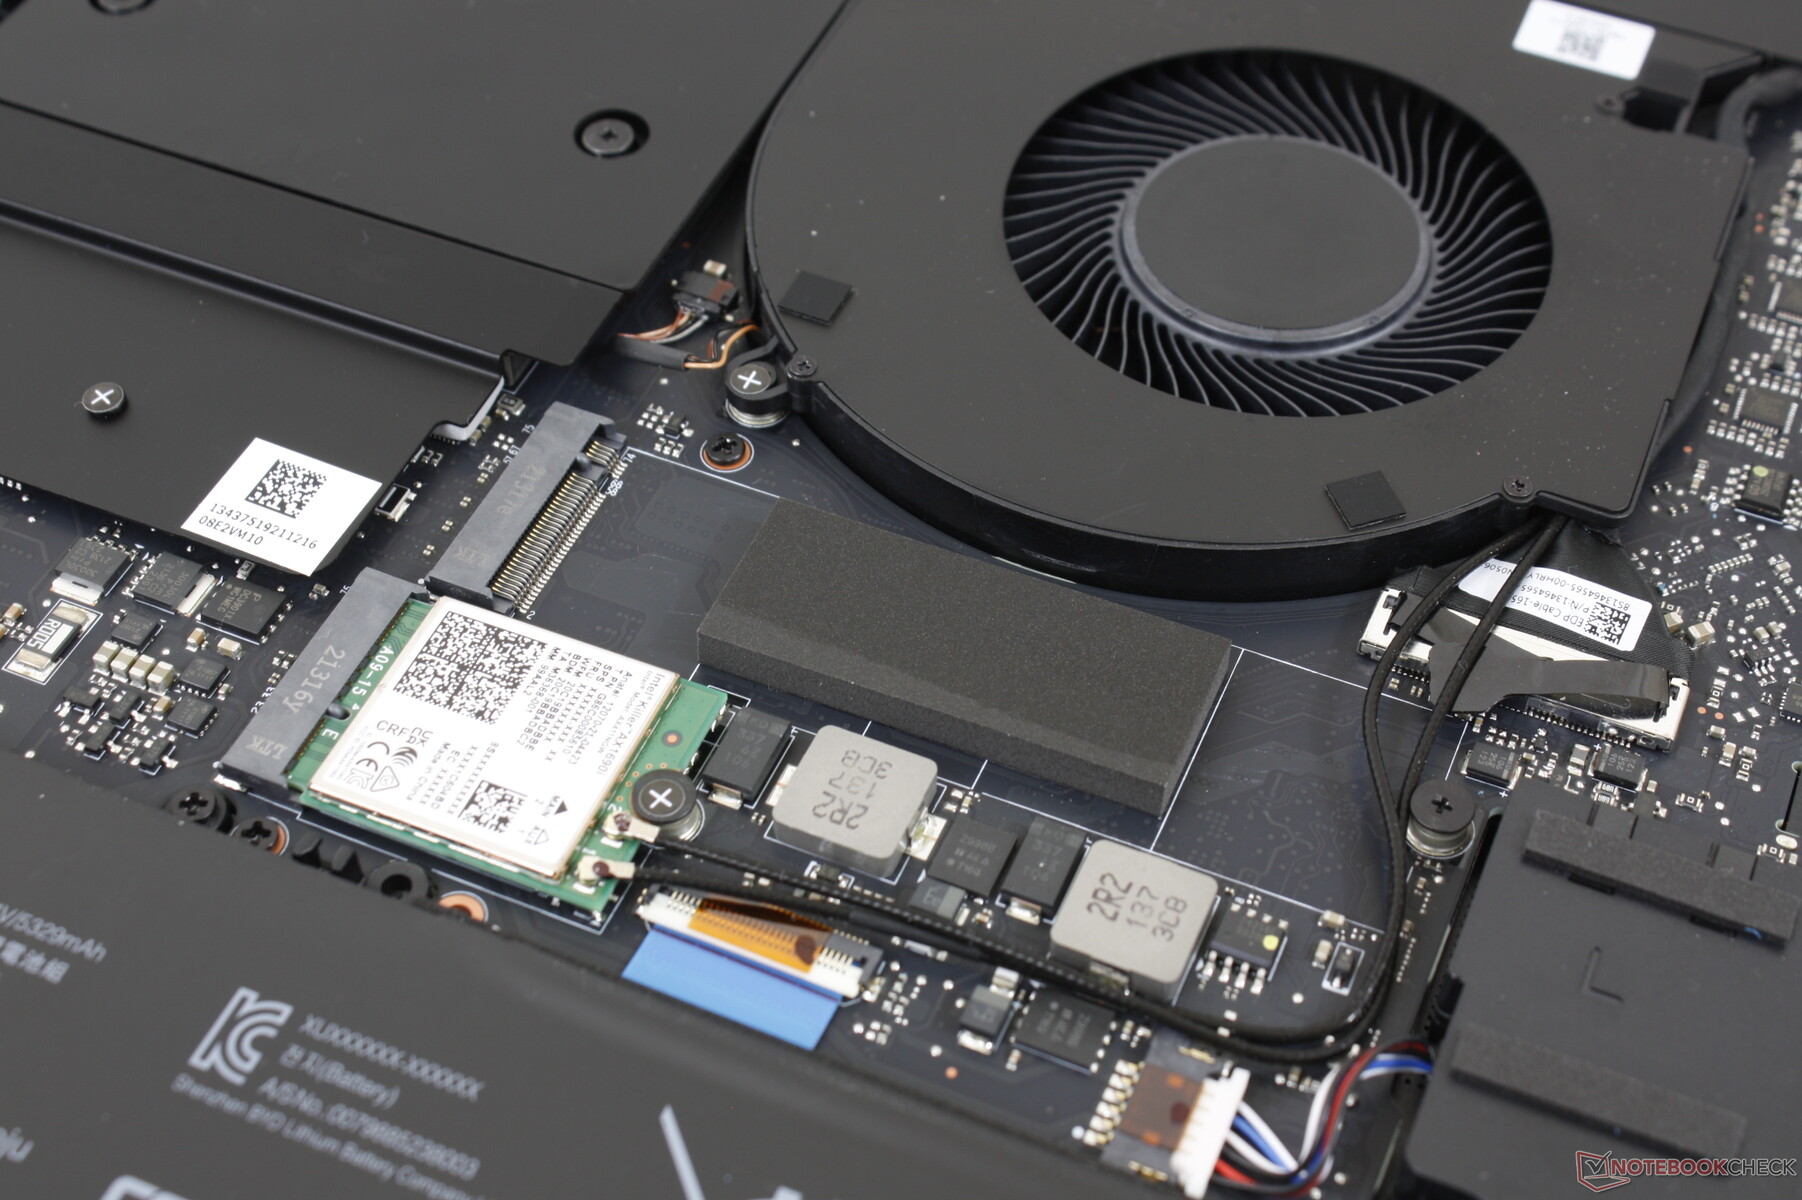
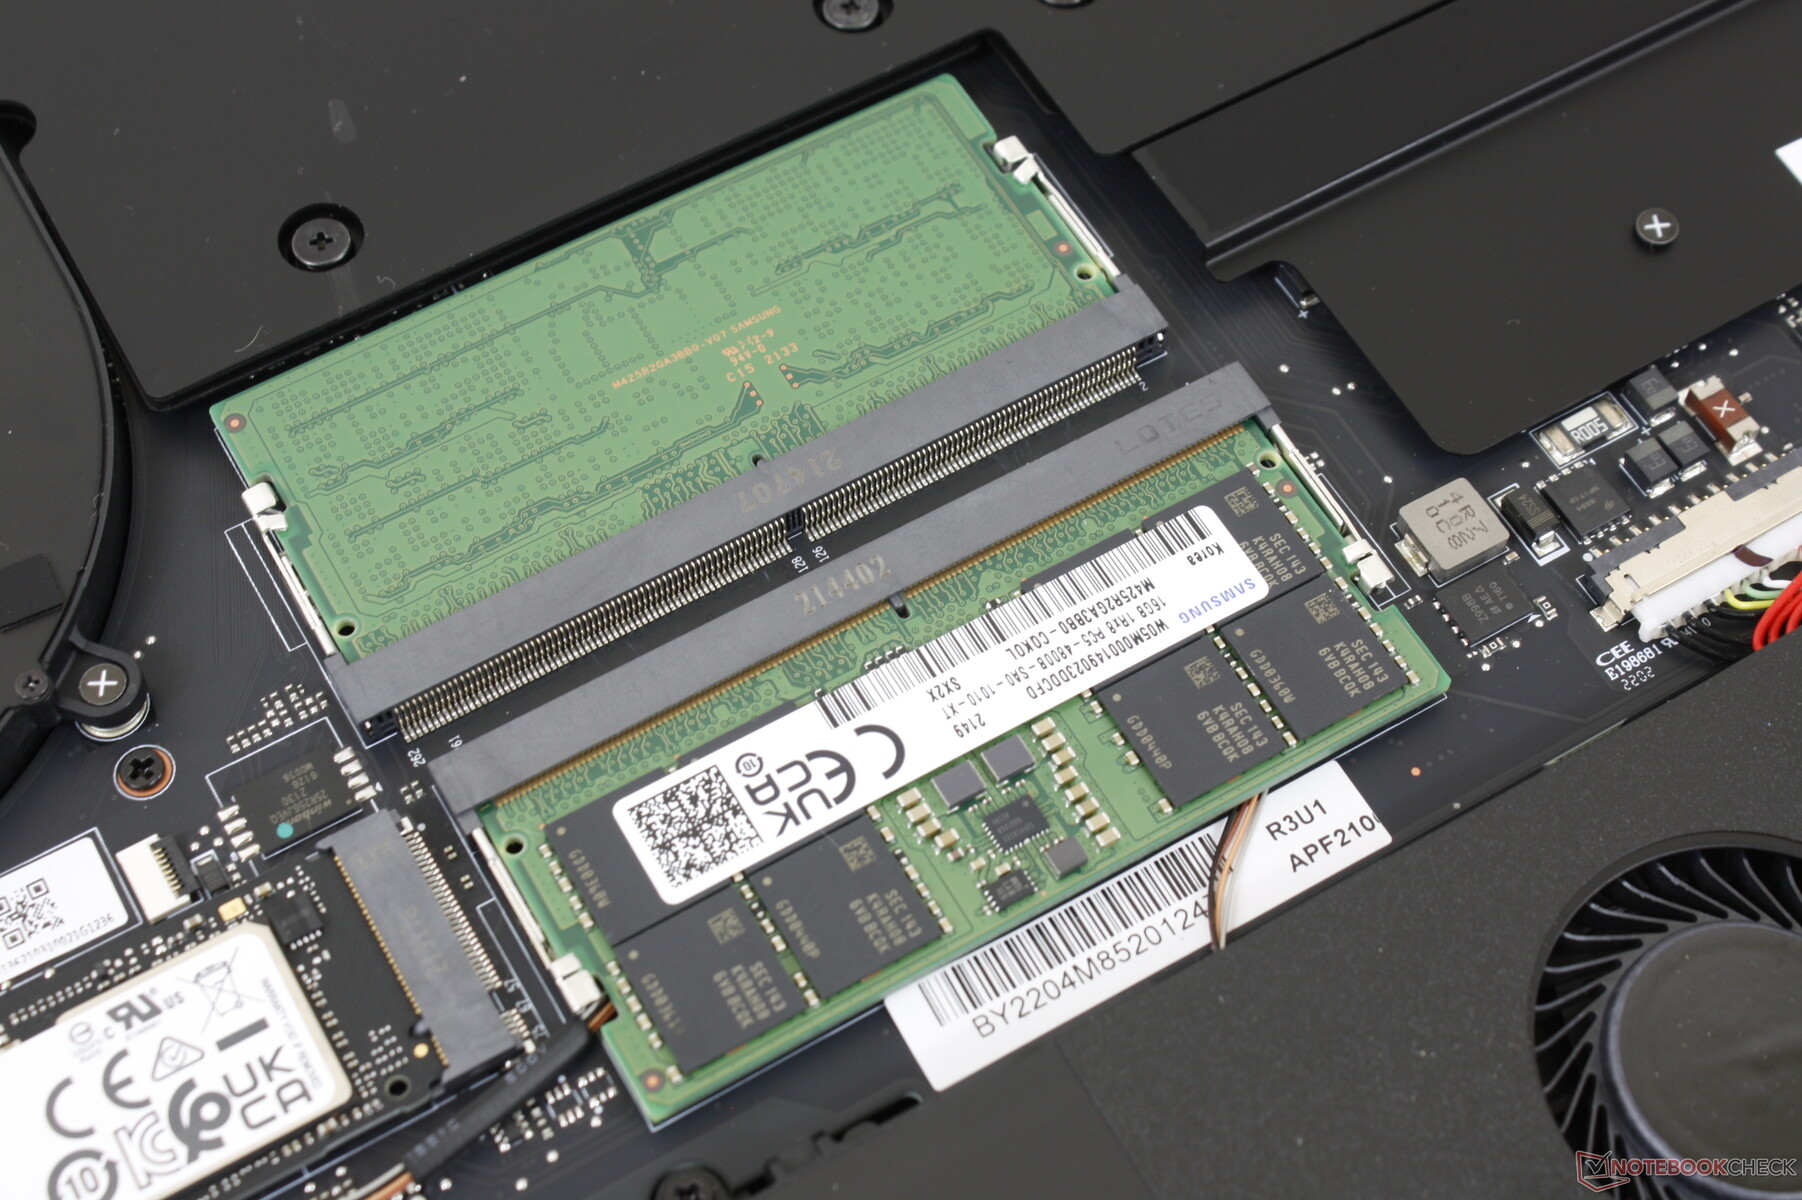
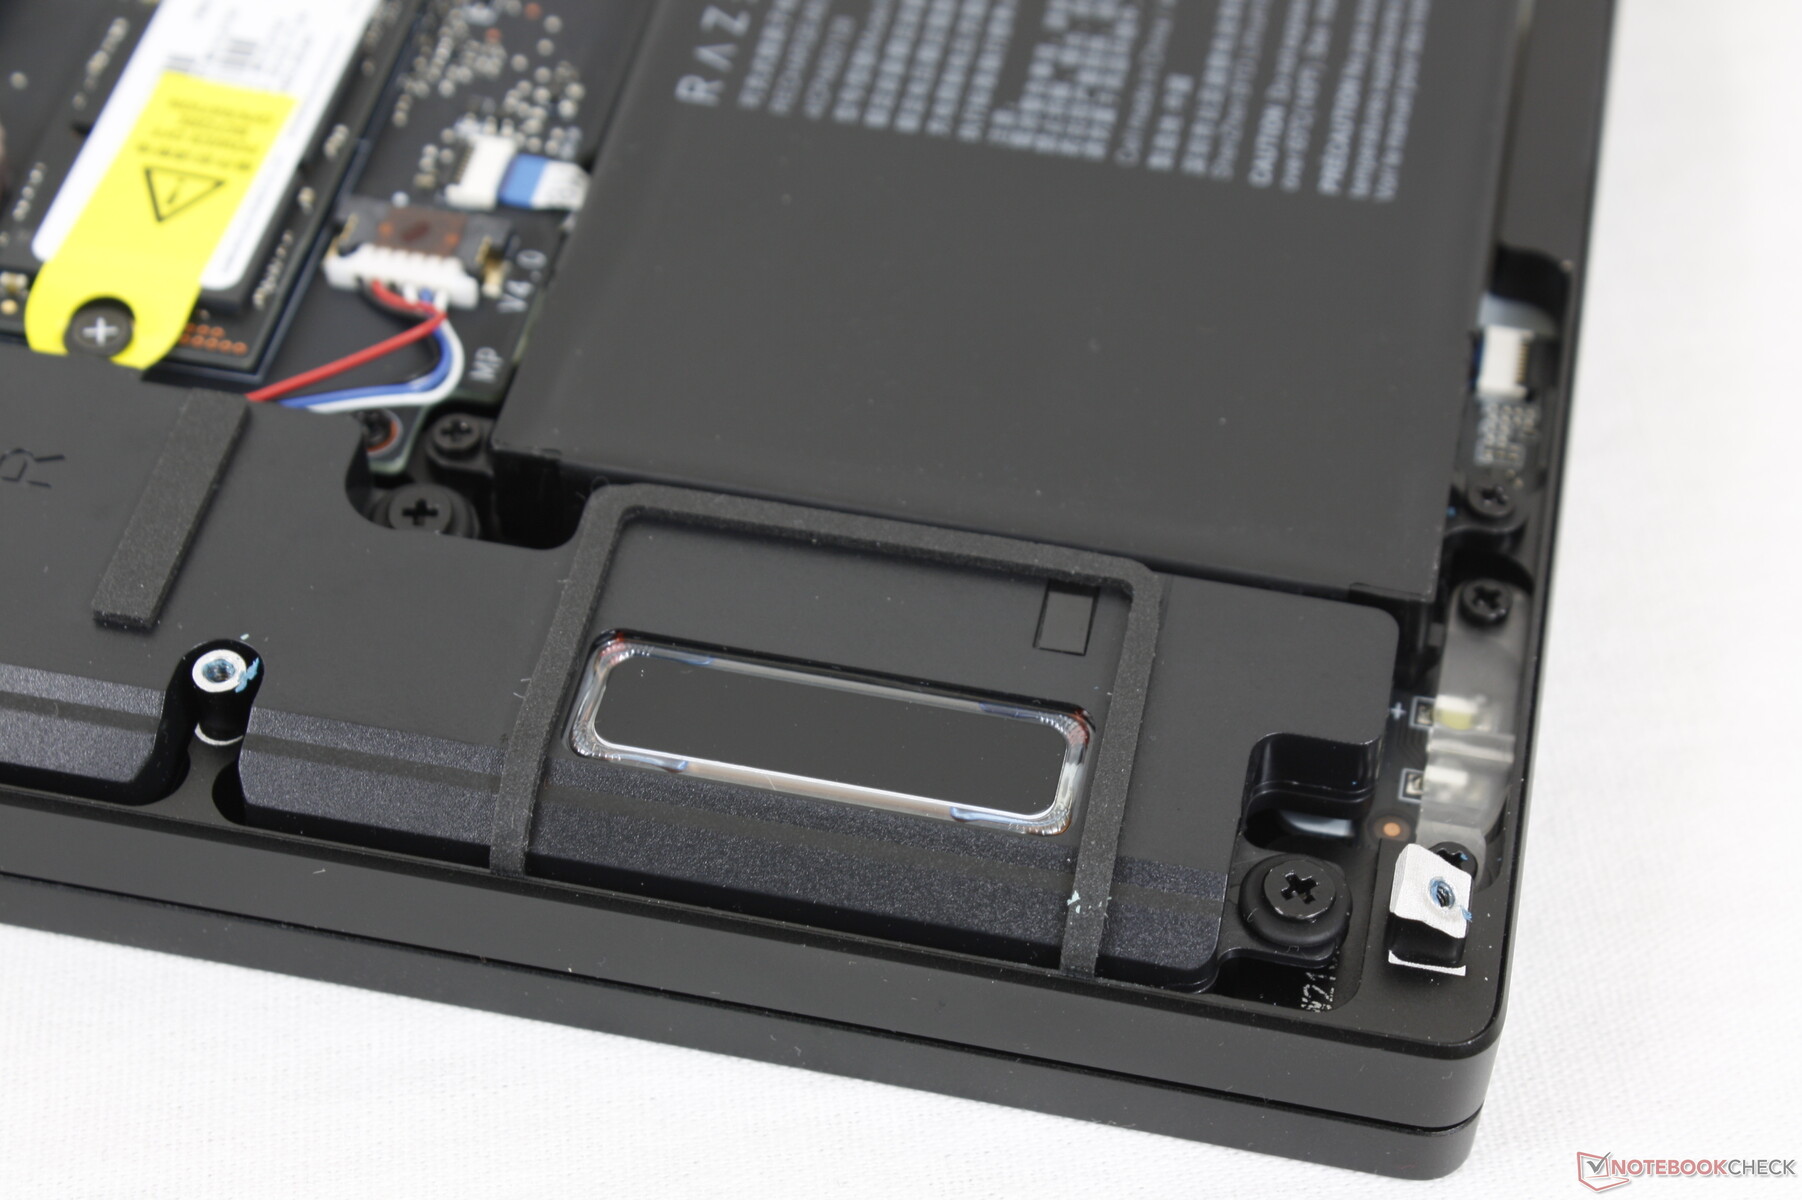
O painel inferior é novamente relativamente fácil de remover com uma chave Torx T5. Enquanto os usuários têm acesso direto aos 2x slots DDR5 SODIMM e 2x slots M.2 PCIe4 SSD, o layout da placa-mãe mudou visivelmente em relação ao modelo do ano passado, como mostram as imagens de comparação abaixo.
Acessórios e Garantia
A caixa inclui o adaptador AC, a papelada e uma folha de adesivos com o logotipo da Razer. A Razer está introduzindo uma garantia de bateria limitada de dois anos como padrão ao lado da garantia básica limitada de um ano para laptops com cada nova compra de um modelo Blade do 12º gênero.
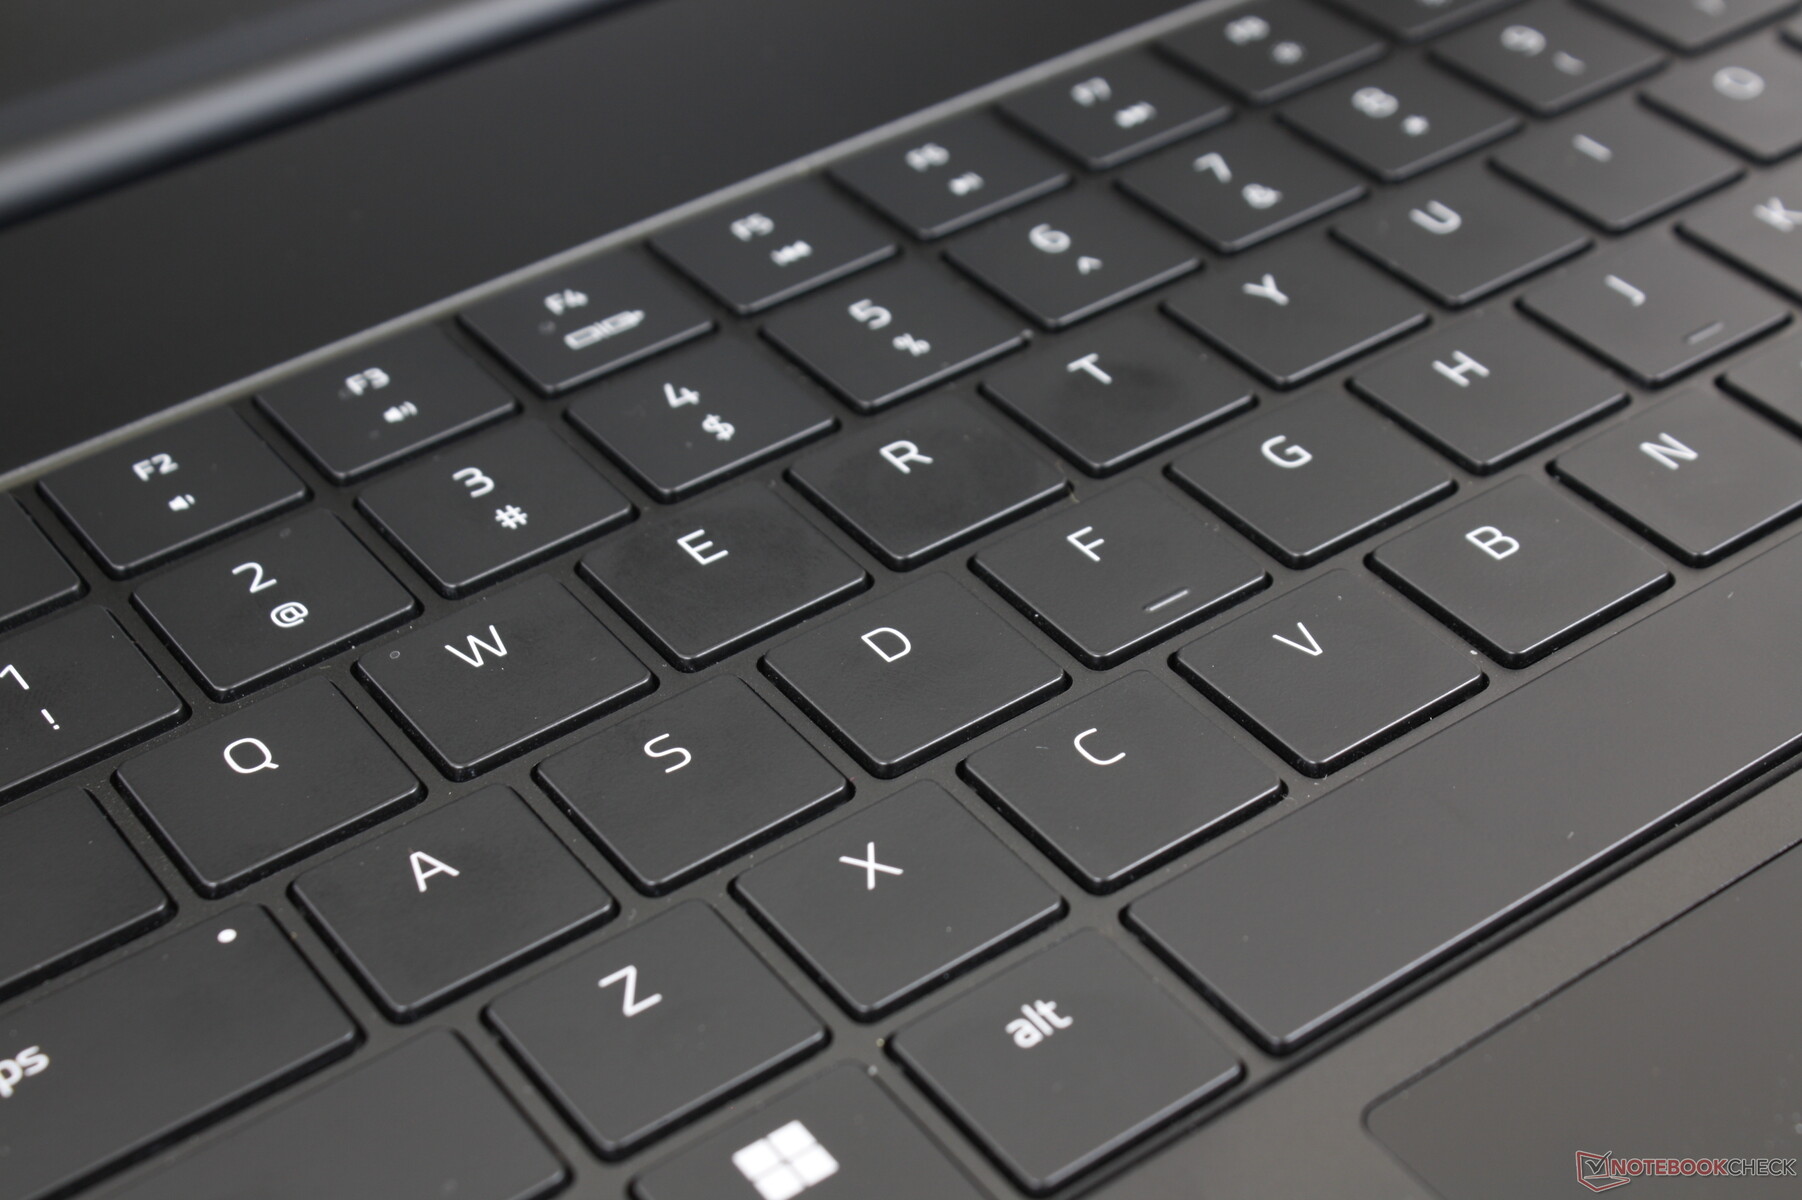
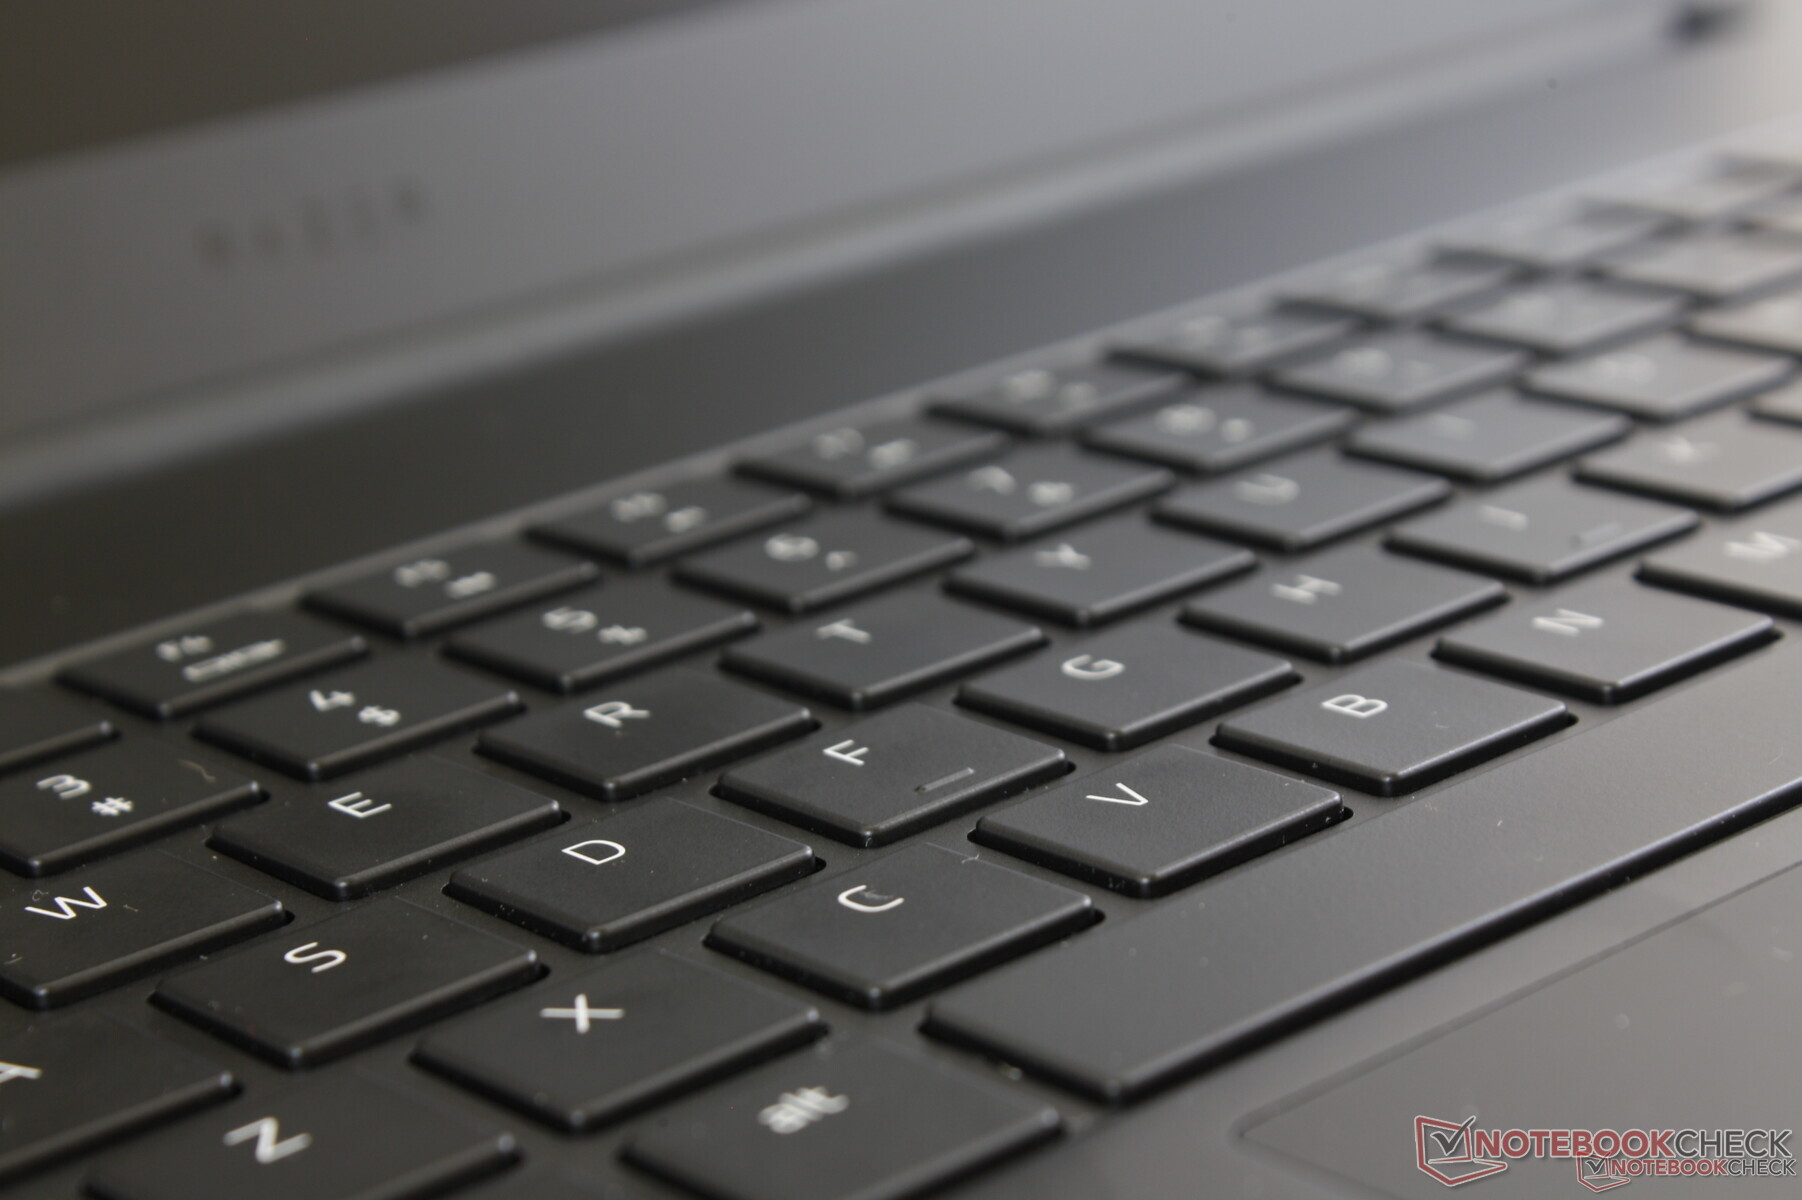
Dispositivos de Entrada - Chaves Maiores, Mesma Clickpad
Teclado
O Blade 17 de 2022 compartilha o mesmo teclado que no 2022 Lâmina 15. A Razer aumentou o tamanho das teclas, mantendo o mesmo comprimento total e largura do teclado para facilitar a digitação. O feedback e as viagens são idênticos ao modelo do ano passado, apesar da mudança de tamanho. Suspeitamos que mais usuários aceitarão esta pequena atualização anual em vez de uma troca completa para teclas ópticas ou mecânicas, que provavelmente dividiriam os ventiladores Razer.
Touchpad
Não há mudanças no touchpad para o melhor ou para o pior. Embora gostemos da ampla área de superfície (13 x 8 cm) e da tração suave, o feedback esponjoso quando pressionado permanece insatisfatório. As ações de arrastar e soltar são, portanto, mais difíceis quando comparadas aos laptops com botões dedicados do mouse, como o Asus TUF FX506 série. As gorduras desagradáveis tendem a se acumular também na superfície fosca.
Mostrador - Sem opções OLED por enquanto
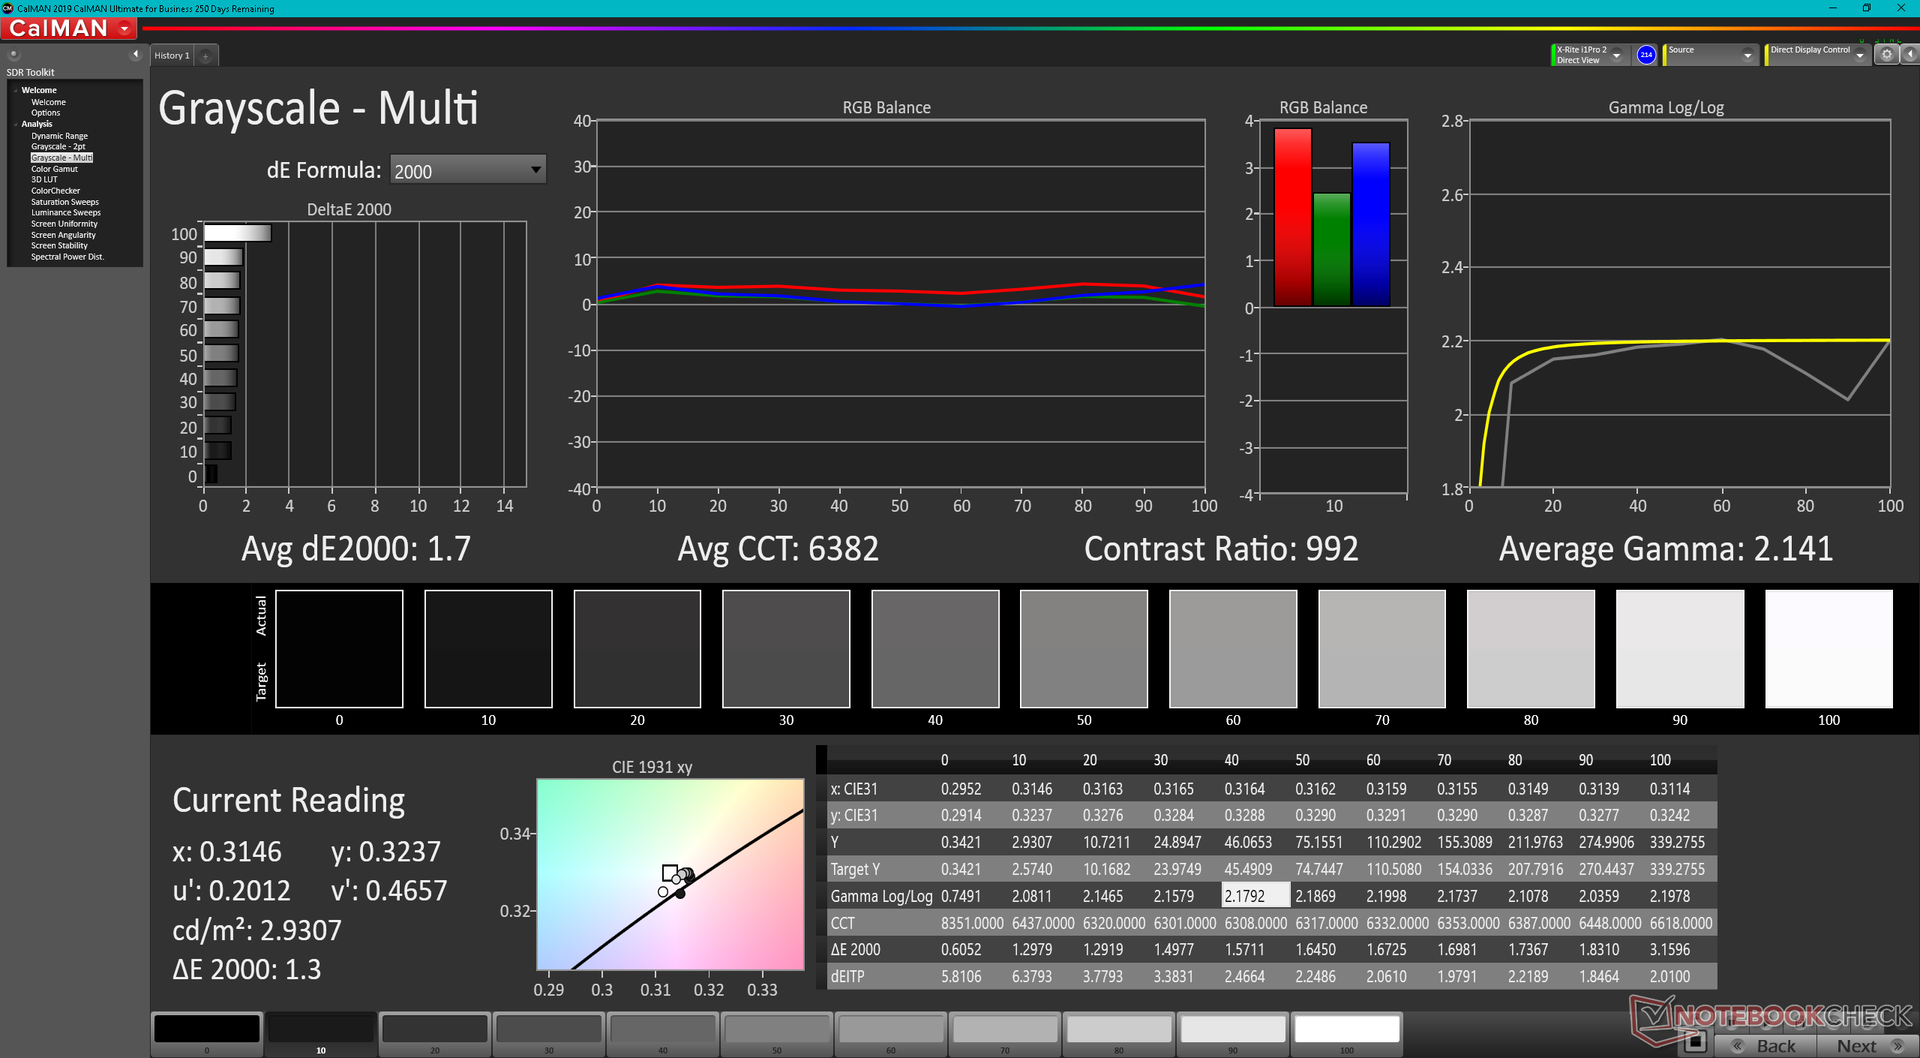
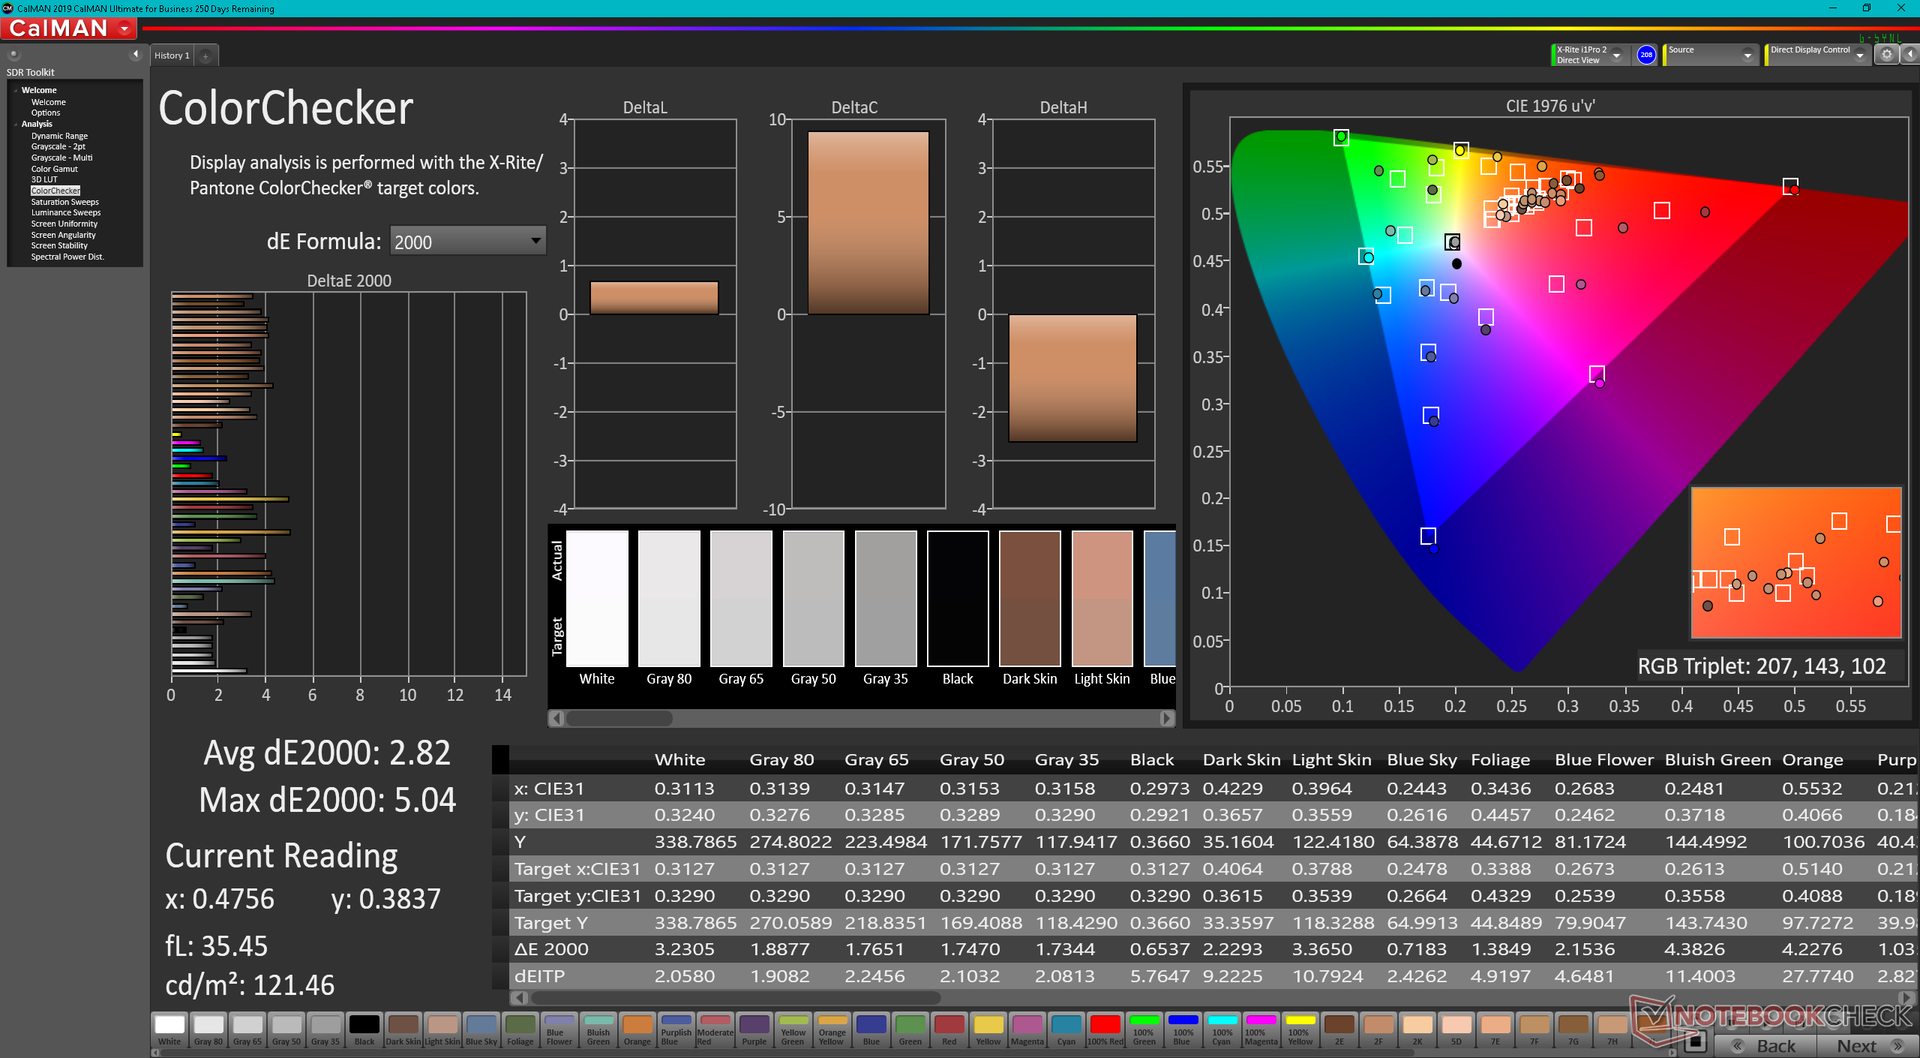
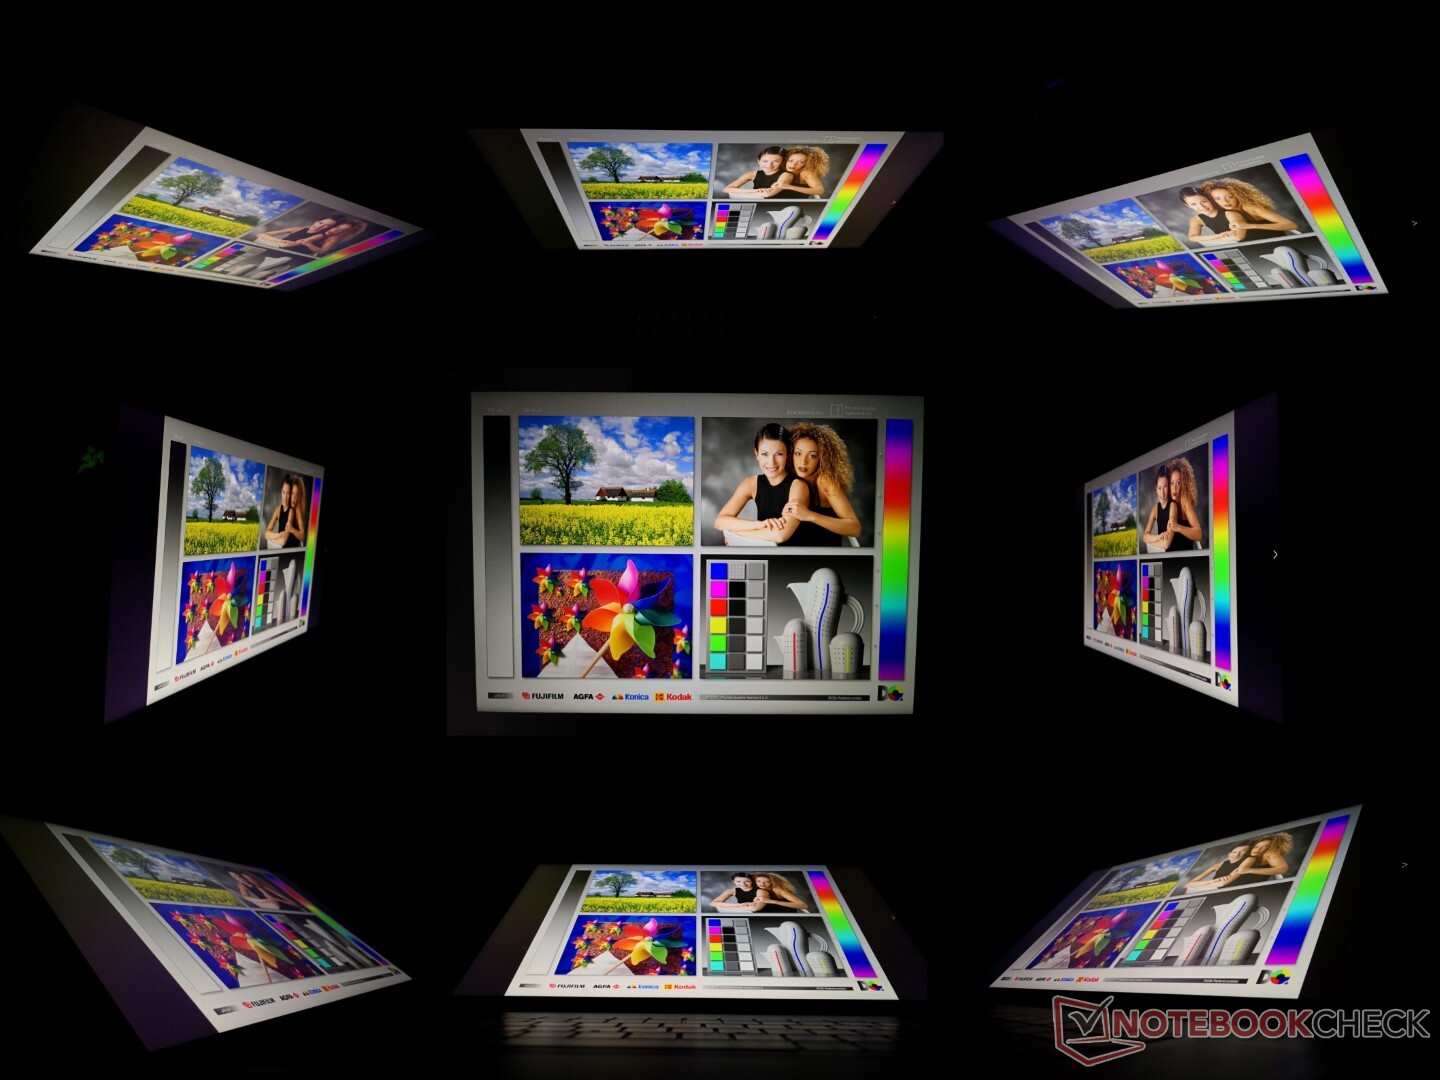
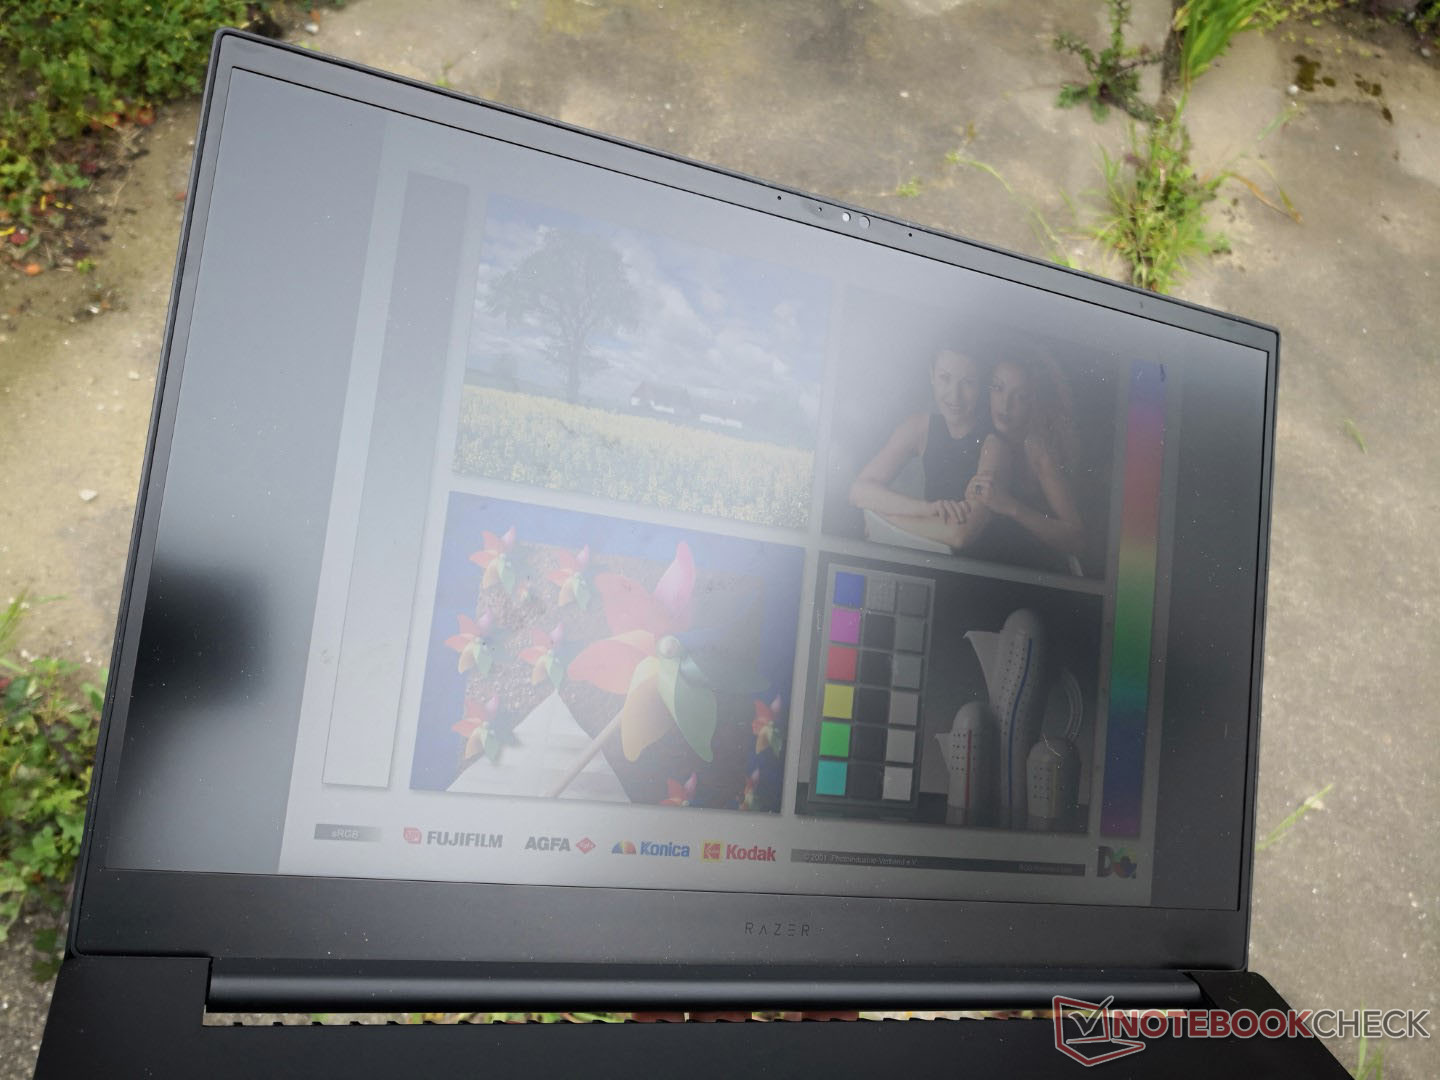
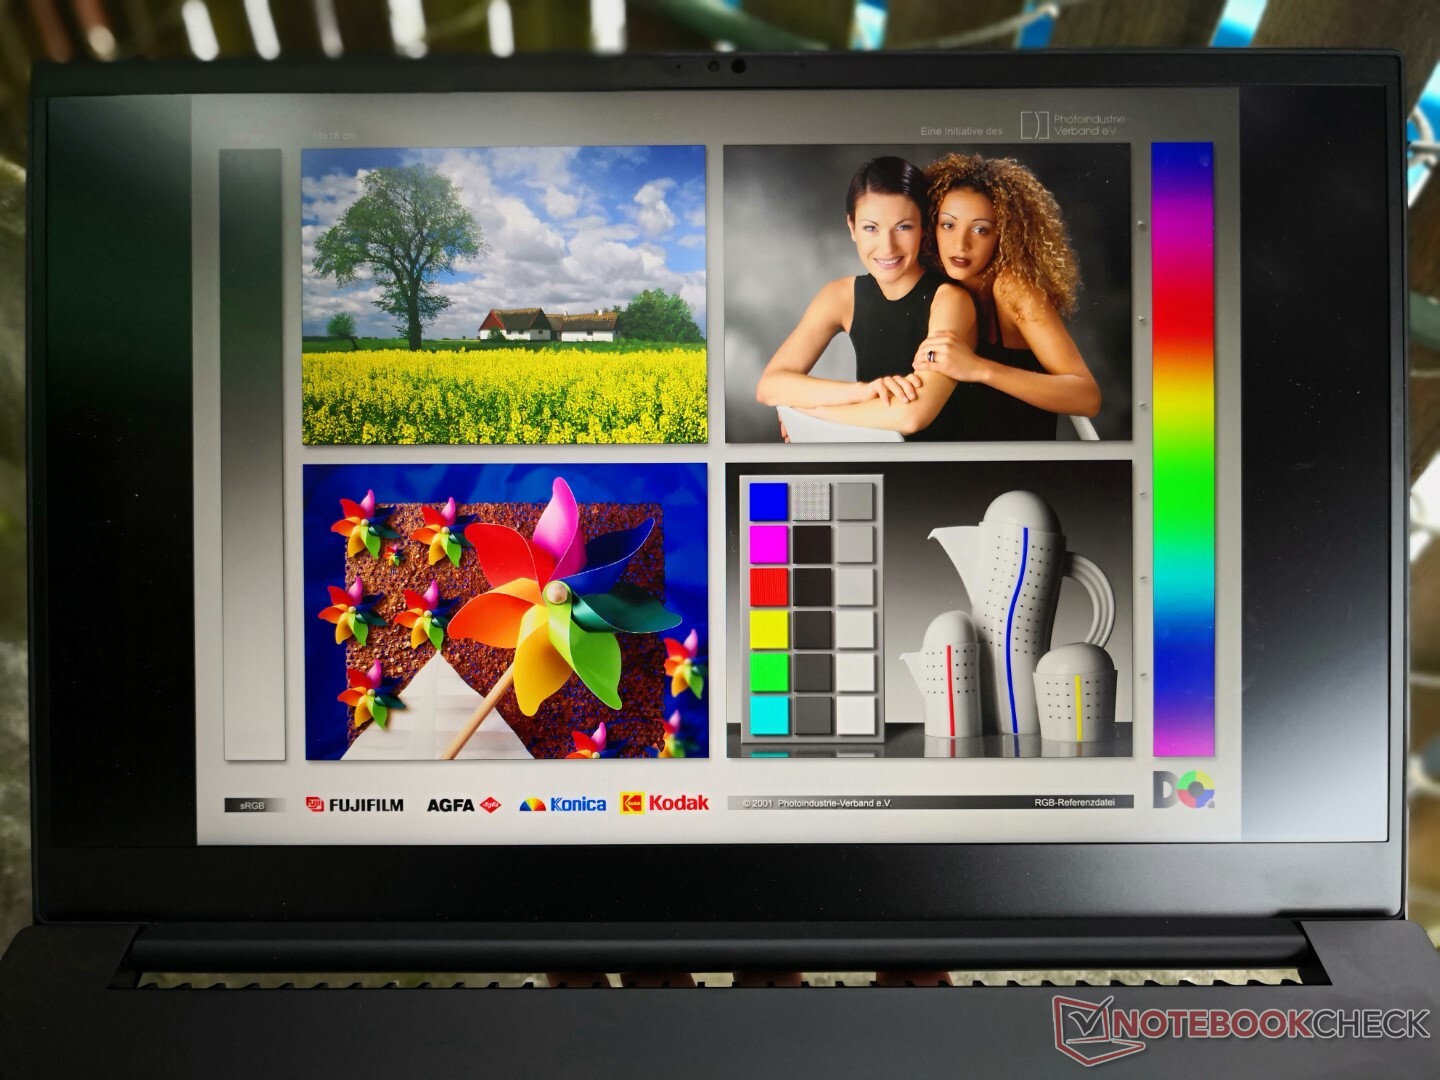
O painel IPS BOE NE173QHM-NZ1 em nossa unidade de teste é adequado tanto para edição gráfica quanto para fins de jogos. Ele cobre a gama de cores DCI-P3 completamente para satisfazer os artistas digitais, ao mesmo tempo em que oferece os rápidos tempos de resposta em preto e branco, rápidas taxas de atualização e compatibilidade G-Sync que os gamers vão querer. O contraste poderia ser melhor especialmente quando comparado com as opções OLED que a Razer tem disponíveis em algumas unidades Blade 15, mas isto é típico dos painéis IPS.
| |||||||||||||||||||||||||
iluminação: 75 %
iluminação com acumulador: 335.8 cd/m²
Contraste: 884:1 (Preto: 0.38 cd/m²)
ΔE ColorChecker Calman: 2.82 | ∀{0.5-29.43 Ø4.71}
ΔE Greyscale Calman: 1.7 | ∀{0.09-98 Ø4.96}
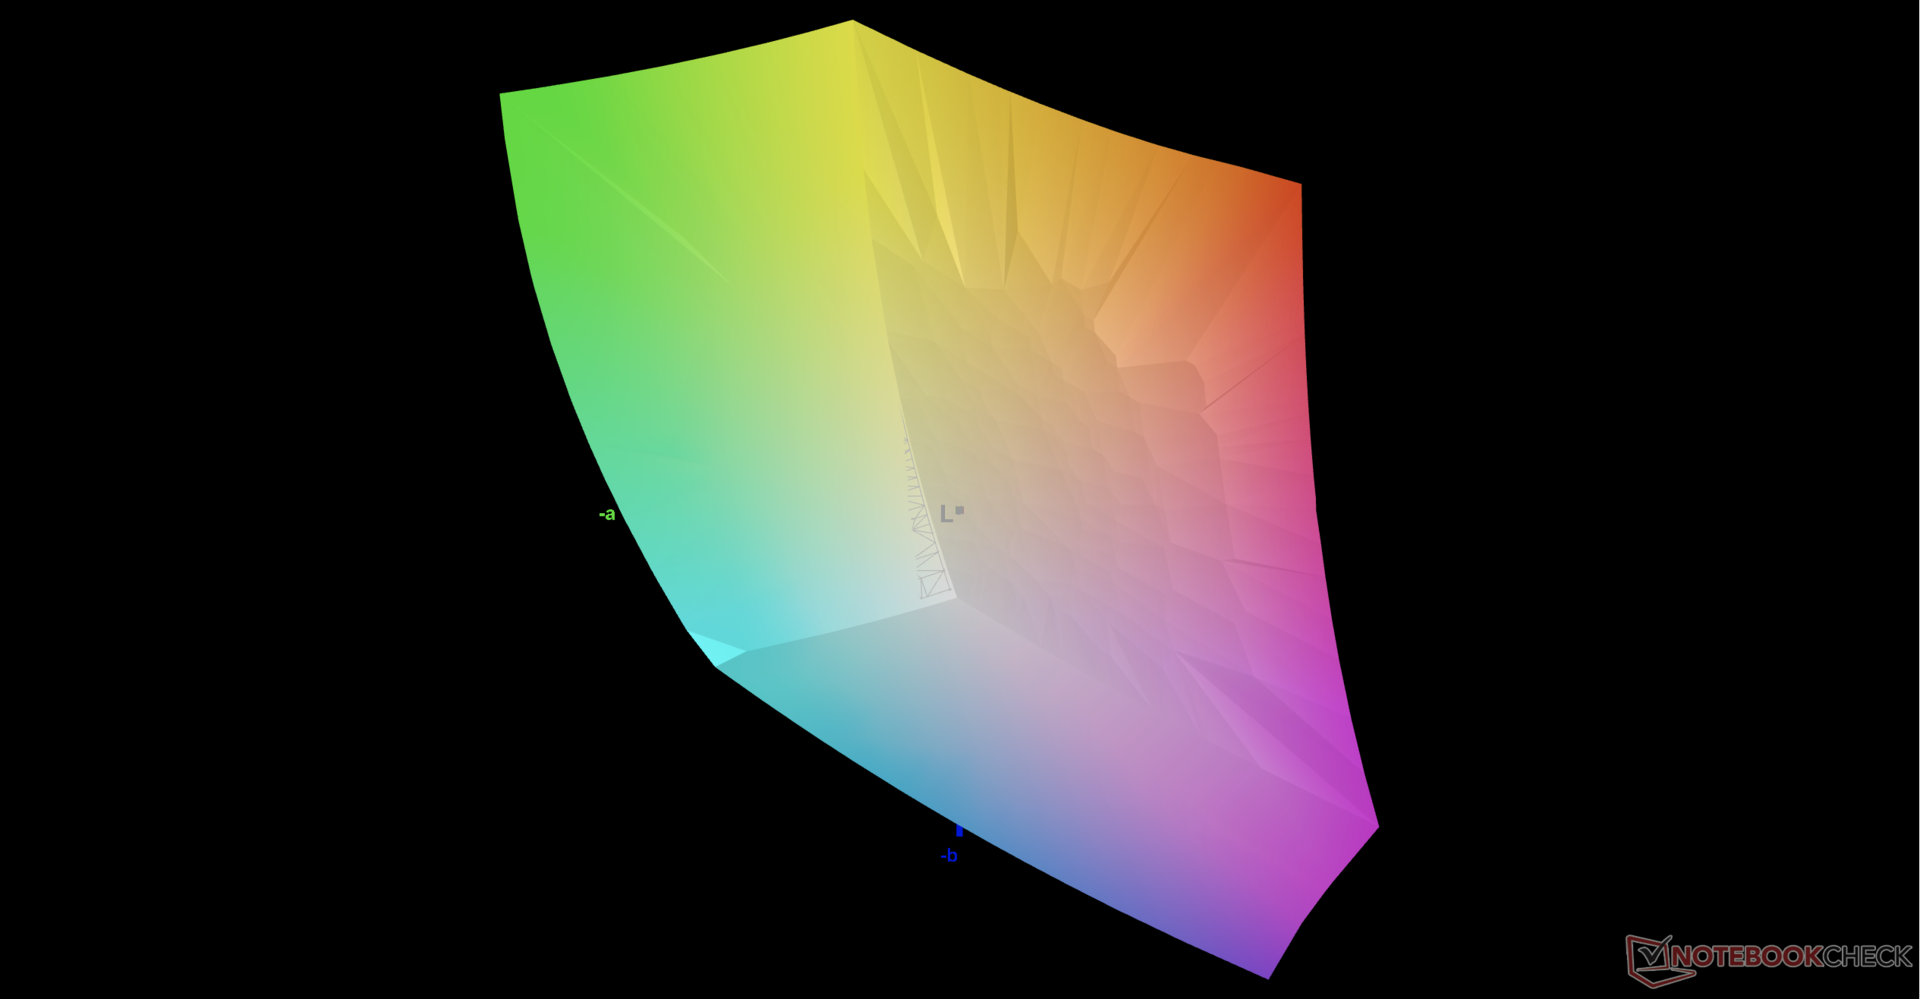
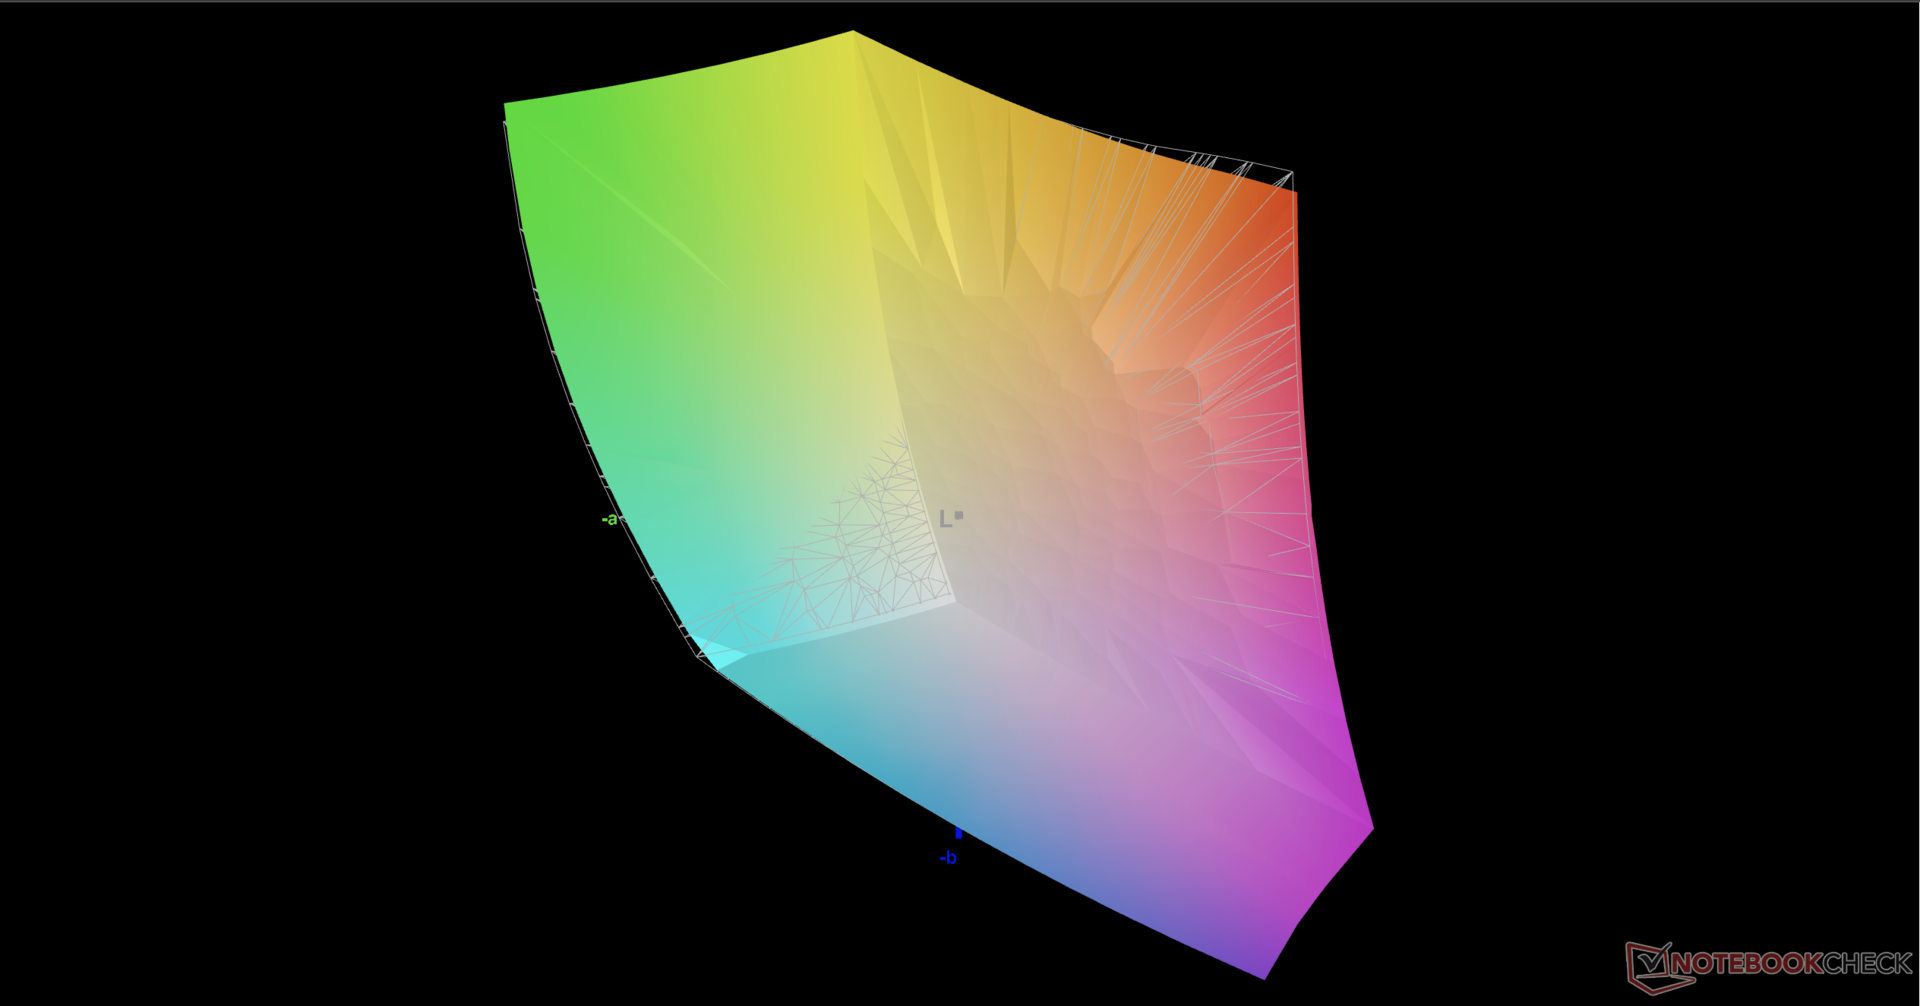
86.2% AdobeRGB 1998 (Argyll 3D)
99.9% sRGB (Argyll 3D)
98.7% Display P3 (Argyll 3D)
Gamma: 2.14
CCT: 6382 K
| Razer Blade 17 RTX 3080 Ti BOE NE173QHM-NZ1, IPS, 2560x1440, 17.3" | Razer Blade Pro 17 2021 (QHD Touch) AU Optronics B173ZAN03.3, IPS, 3840x2160, 17.3" | MSI GS76 Stealth 11UH AUO B173ZAN06.1 (AUODE95), IPS, 3840x2160, 17.3" | Asus ROG Zephyrus S17 GX703HSD BOE099D (BOE CQ NE173QHM-NY3), IPS, 2560x1440, 17.3" | Aorus 17G YD Sharp LQ173M1JW04, IPS, 1920x1080, 17.3" | Alienware x17 RTX 3080 P48E AU Optronics B173ZAN, IPS, 3840x2160, 17.3" | |
|---|---|---|---|---|---|---|
| Display | 2% | -22% | -3% | -14% | 2% | |
| Display P3 Coverage (%) | 98.7 | 88.6 -10% | 63 -36% | 94.2 -5% | 72.3 -27% | 88.3 -11% |
| sRGB Coverage (%) | 99.9 | 100 0% | 94.8 -5% | 98.7 -1% | 100 0% | 100 0% |
| AdobeRGB 1998 Coverage (%) | 86.2 | 99.9 16% | 65 -25% | 84.4 -2% | 73.7 -15% | 100 16% |
| Response Times | 5% | 47% | 52% | 21% | 14% | |
| Response Time Grey 50% / Grey 80% * (ms) | 17.6 ? | 15.2 ? 14% | 8.8 ? 50% | 4.8 73% | 13.6 ? 23% | 14.4 ? 18% |
| Response Time Black / White * (ms) | 11.4 ? | 12 ? -5% | 6.4 ? 44% | 8 30% | 9.2 ? 19% | 10.4 ? 9% |
| PWM Frequency (Hz) | ||||||
| Screen | -76% | 10% | -8% | -10% | -8% | |
| Brightness middle (cd/m²) | 335.9 | 407.2 21% | 474 41% | 322 -4% | 286 -15% | 438.7 31% |
| Brightness (cd/m²) | 294 | 403 37% | 454 54% | 288 -2% | 282 -4% | 435 48% |
| Brightness Distribution (%) | 75 | 90 20% | 88 17% | 72 -4% | 73 -3% | 91 21% |
| Black Level * (cd/m²) | 0.38 | 0.42 -11% | 0.46 -21% | 0.3 21% | 0.24 37% | 0.48 -26% |
| Contrast (:1) | 884 | 970 10% | 1030 17% | 1073 21% | 1192 35% | 914 3% |
| Colorchecker dE 2000 * | 2.82 | 7.25 -157% | 1.5 47% | 3.05 -8% | 2.79 1% | 4.34 -54% |
| Colorchecker dE 2000 max. * | 5.04 | 12.51 -148% | 5.59 -11% | 5.23 -4% | 6.23 -24% | 7.3 -45% |
| Greyscale dE 2000 * | 1.7 | 8.1 -376% | 2.8 -65% | 3.11 -83% | 3.5 -106% | 2.4 -41% |
| Gamma | 2.14 103% | 2.24 98% | 2.158 102% | 2.13 103% | 2.358 93% | 2.09 105% |
| CCT | 6382 102% | 5925 110% | 6597 99% | 6553 99% | 6147 106% | 6413 101% |
| Colorchecker dE 2000 calibrated * | 3.62 | 0.86 | 1.92 | 0.82 | 0.72 | |
| Color Space (Percent of AdobeRGB 1998) (%) | 88.1 | 84 | 74 | |||
| Color Space (Percent of sRGB) (%) | 100 | 99 | 96 | |||
| Média Total (Programa/Configurações) | -23% /
-45% | 12% /
8% | 14% /
2% | -1% /
-6% | 3% /
-2% |
* ... menor é melhor
A Razer calibra cada display na fábrica e nossas medidas independentes com um colorímetro X-Rite provam o mesmo. Os valores médios de escala de cinza e ColorChecker DeltaE são apenas 1,7 e 2,82, respectivamente, para mostrar que a calibração do usuário final não é necessária.
Exibir tempos de resposta
| ↔ Tempo de resposta preto para branco | ||
|---|---|---|
| 11.4 ms ... ascensão ↗ e queda ↘ combinadas | ↗ 4.8 ms ascensão | 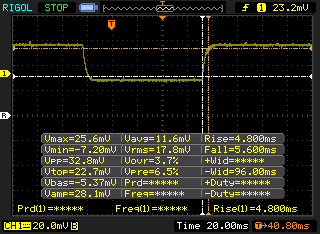 |
| ↘ 5.6 ms queda | ||
| A tela mostra boas taxas de resposta em nossos testes, mas pode ser muito lenta para jogadores competitivos. Em comparação, todos os dispositivos testados variam de 0.1 (mínimo) a 240 (máximo) ms. » 31 % de todos os dispositivos são melhores. Isso significa que o tempo de resposta medido é melhor que a média de todos os dispositivos testados (19.8 ms). | ||
| ↔ Tempo de resposta 50% cinza a 80% cinza | ||
| 17.6 ms ... ascensão ↗ e queda ↘ combinadas | ↗ 8.4 ms ascensão | 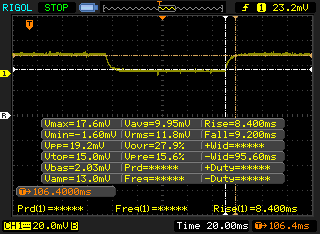 |
| ↘ 9.2 ms queda | ||
| A tela mostra boas taxas de resposta em nossos testes, mas pode ser muito lenta para jogadores competitivos. Em comparação, todos os dispositivos testados variam de 0.165 (mínimo) a 636 (máximo) ms. » 32 % de todos os dispositivos são melhores. Isso significa que o tempo de resposta medido é melhor que a média de todos os dispositivos testados (31 ms). | ||
Cintilação da tela / PWM (modulação por largura de pulso)
| Tela tremeluzindo / PWM não detectado | 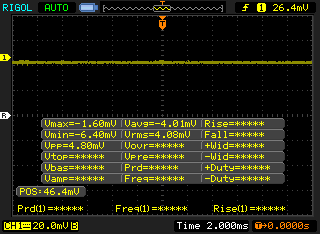 | ||
[pwm_comparison] Em comparação: 52 % de todos os dispositivos testados não usam PWM para escurecer a tela. Se PWM foi detectado, uma média de 7757 (mínimo: 5 - máximo: 343500) Hz foi medida. | |||
Desempenho - Gráficos de 165 W com Intel da 12ª geração
Condições de teste
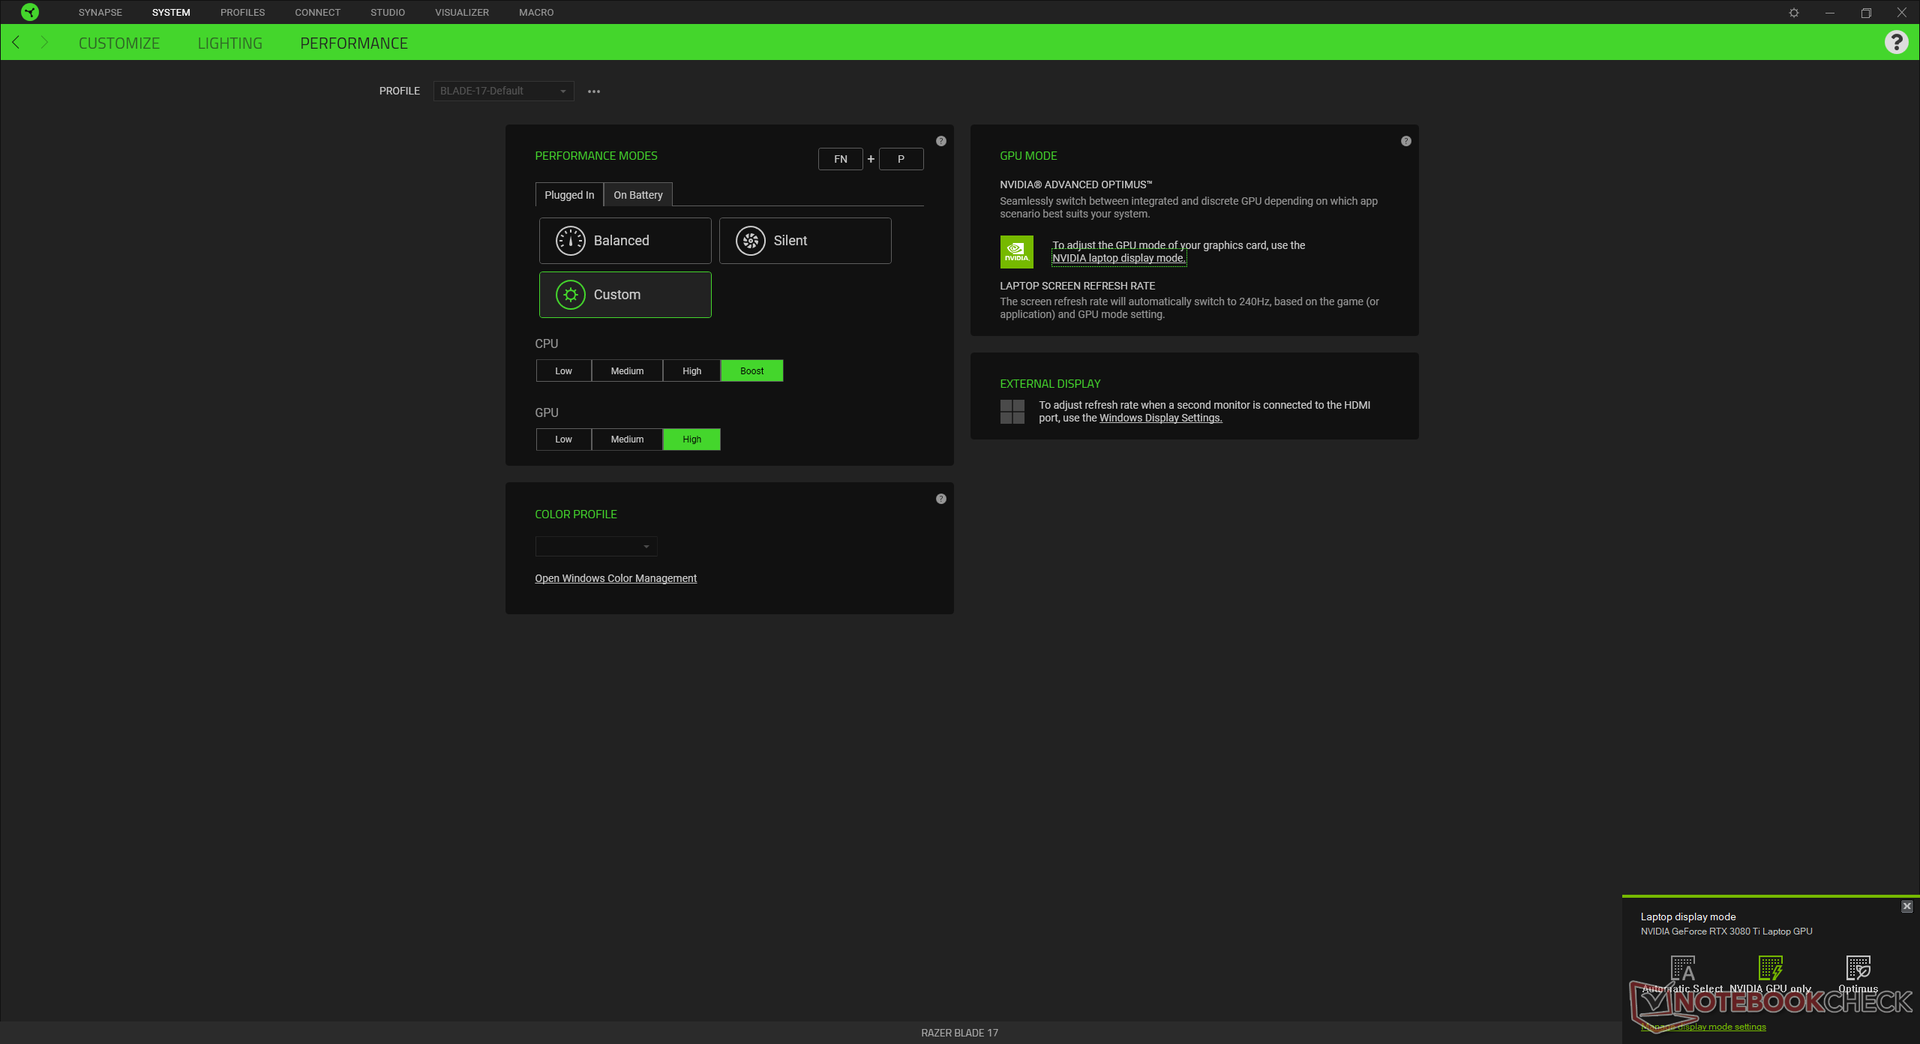
Nossa unidade foi ajustada para o modo Manual com a CPU e GPU em Boost e High, respectivamente, para as mais altas pontuações de referência possíveis. Os usuários devem se familiarizar com o software Synapse, pois ele serve como o centro de controle para características específicas do sistema e perfis de desempenho.
O Blade 17 é um dos poucos laptops para jogos que suportam Advanced Optimus, o que significa que os usuários podem alternar entre os modos Optimus e dGPU G-Sync sem a necessidade de reiniciar.
Processador
O desempenho da CPU é onde esperamos que seja relativo a outros laptops rodando no mesmo Núcleo i7-12800H processador. O desempenho bruto é de cerca de 20 a 25 por cento e 50 a 70 por cento sobre o 11º gênero Núcleo i7-11800H e 10ª geração Núcleo i7-10875Hrespectivamente, nos modelos Blade 17 da geração mais antiga. A atualização para o Core i9-12900H SKU deve oferecer apenas 10% de aumento de desempenho em relação à nossa configuração Core i7-12800H.
A sustentabilidade do desempenho é excelente, sem grandes quedas nas taxas de clock ao longo do tempo ao executar o CineBench R15 xT em um loop.
Cinebench R15 Multi Loop
Cinebench R20: CPU (Multi Core) | CPU (Single Core)
Cinebench R15: CPU Multi 64Bit | CPU Single 64Bit
Blender: v2.79 BMW27 CPU
7-Zip 18.03: 7z b 4 | 7z b 4 -mmt1
Geekbench 5.5: Multi-Core | Single-Core
HWBOT x265 Benchmark v2.2: 4k Preset
LibreOffice : 20 Documents To PDF
R Benchmark 2.5: Overall mean
| HWBOT x265 Benchmark v2.2 / 4k Preset | |
| MSI GE76 Raider | |
| Schenker Uniwill Technology GM7AG8P | |
| Razer Blade 17 RTX 3080 Ti | |
| Média Intel Core i7-12800H (11.7 - 19.4, n=5) | |
| Schenker XMG Apex 17 M21 | |
| Razer Blade 17 RTX 3070 | |
| Gigabyte A7 X1 | |
| MSI GE76 Raider 10UH | |
| Lenovo Legion 5 17ACH6H-82JY0003GE | |
| Razer Blade Pro 17 2021 (QHD Touch) | |
| Acer Nitro 5 AN517-53-54DQ | |
* ... menor é melhor
AIDA64: FP32 Ray-Trace | FPU Julia | CPU SHA3 | CPU Queen | FPU SinJulia | FPU Mandel | CPU AES | CPU ZLib | FP64 Ray-Trace | CPU PhotoWorxx
| Performance rating | |
| Schenker XMG Pro 17 (Late 2021, RTX 3080) | |
| MSI GE76 Raider | |
| Lenovo Legion 5 17ACH6H-82JY0003GE | |
| Schenker Uniwill Technology GM7AG8P | |
| Média Intel Core i7-12800H | |
| Razer Blade 17 RTX 3080 Ti | |
| AIDA64 / FP32 Ray-Trace | |
| Schenker XMG Pro 17 (Late 2021, RTX 3080) | |
| Lenovo Legion 5 17ACH6H-82JY0003GE | |
| MSI GE76 Raider | |
| Média Intel Core i7-12800H (5839 - 15206, n=5) | |
| Schenker Uniwill Technology GM7AG8P | |
| Razer Blade 17 RTX 3080 Ti | |
| AIDA64 / FPU Julia | |
| Lenovo Legion 5 17ACH6H-82JY0003GE | |
| Schenker XMG Pro 17 (Late 2021, RTX 3080) | |
| Média Intel Core i7-12800H (27801 - 80002, n=5) | |
| MSI GE76 Raider | |
| Schenker Uniwill Technology GM7AG8P | |
| Razer Blade 17 RTX 3080 Ti | |
| AIDA64 / CPU SHA3 | |
| Schenker XMG Pro 17 (Late 2021, RTX 3080) | |
| MSI GE76 Raider | |
| Schenker Uniwill Technology GM7AG8P | |
| Média Intel Core i7-12800H (2013 - 3684, n=5) | |
| Lenovo Legion 5 17ACH6H-82JY0003GE | |
| Razer Blade 17 RTX 3080 Ti | |
| AIDA64 / CPU Queen | |
| MSI GE76 Raider | |
| Razer Blade 17 RTX 3080 Ti | |
| Schenker Uniwill Technology GM7AG8P | |
| Média Intel Core i7-12800H (85965 - 108084, n=5) | |
| Schenker XMG Pro 17 (Late 2021, RTX 3080) | |
| Lenovo Legion 5 17ACH6H-82JY0003GE | |
| AIDA64 / FPU SinJulia | |
| MSI GE76 Raider | |
| Schenker Uniwill Technology GM7AG8P | |
| Schenker XMG Pro 17 (Late 2021, RTX 3080) | |
| Lenovo Legion 5 17ACH6H-82JY0003GE | |
| Razer Blade 17 RTX 3080 Ti | |
| Média Intel Core i7-12800H (7027 - 9658, n=5) | |
| AIDA64 / FPU Mandel | |
| Lenovo Legion 5 17ACH6H-82JY0003GE | |
| Schenker XMG Pro 17 (Late 2021, RTX 3080) | |
| MSI GE76 Raider | |
| Média Intel Core i7-12800H (15765 - 38179, n=5) | |
| Schenker Uniwill Technology GM7AG8P | |
| Razer Blade 17 RTX 3080 Ti | |
| AIDA64 / CPU AES | |
| Schenker XMG Pro 17 (Late 2021, RTX 3080) | |
| MSI GE76 Raider | |
| Lenovo Legion 5 17ACH6H-82JY0003GE | |
| Schenker Uniwill Technology GM7AG8P | |
| Média Intel Core i7-12800H (55371 - 73928, n=5) | |
| Razer Blade 17 RTX 3080 Ti | |
| AIDA64 / CPU ZLib | |
| MSI GE76 Raider | |
| Schenker Uniwill Technology GM7AG8P | |
| Média Intel Core i7-12800H (701 - 1047, n=5) | |
| Razer Blade 17 RTX 3080 Ti | |
| Schenker XMG Pro 17 (Late 2021, RTX 3080) | |
| Lenovo Legion 5 17ACH6H-82JY0003GE | |
| AIDA64 / FP64 Ray-Trace | |
| Schenker XMG Pro 17 (Late 2021, RTX 3080) | |
| Lenovo Legion 5 17ACH6H-82JY0003GE | |
| MSI GE76 Raider | |
| Schenker Uniwill Technology GM7AG8P | |
| Média Intel Core i7-12800H (3257 - 8559, n=5) | |
| Razer Blade 17 RTX 3080 Ti | |
| AIDA64 / CPU PhotoWorxx | |
| Razer Blade 17 RTX 3080 Ti | |
| Schenker Uniwill Technology GM7AG8P | |
| MSI GE76 Raider | |
| Média Intel Core i7-12800H (31329 - 40992, n=5) | |
| Schenker XMG Pro 17 (Late 2021, RTX 3080) | |
| Lenovo Legion 5 17ACH6H-82JY0003GE | |
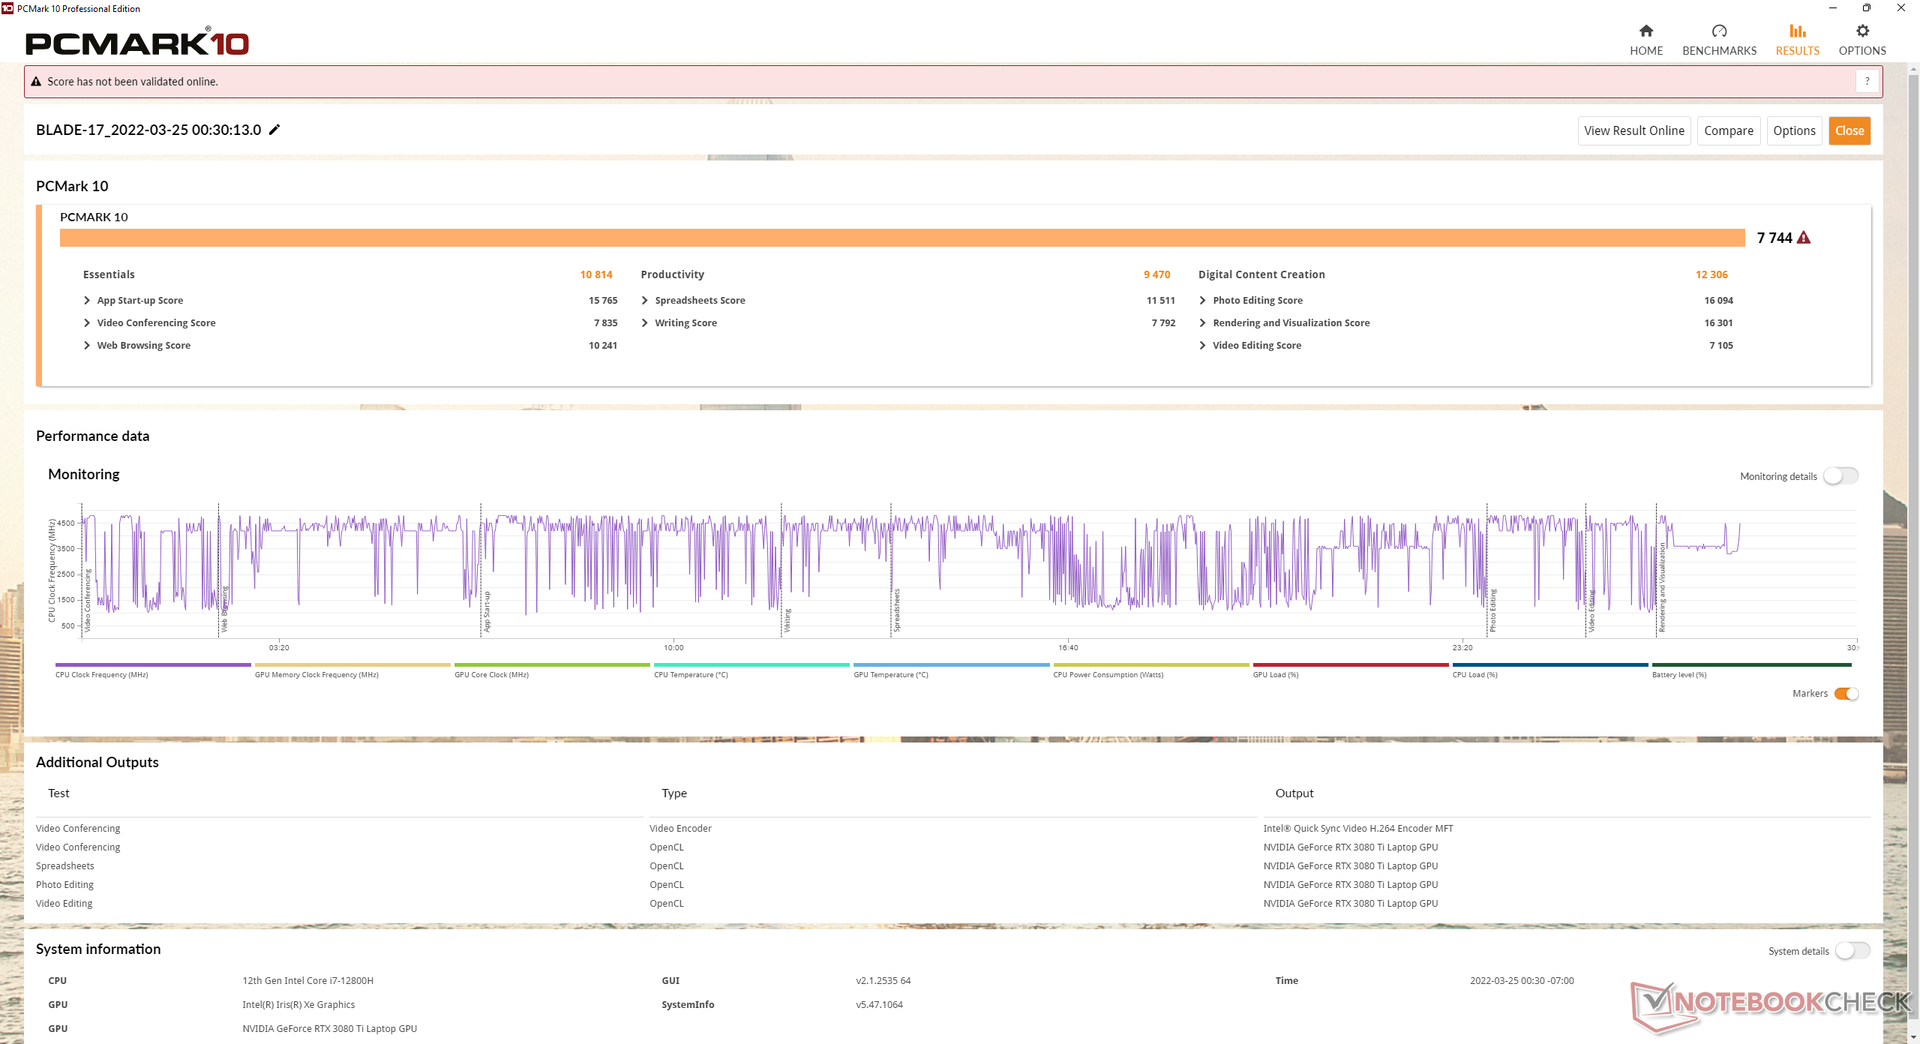
Desempenho do sistema
Os resultados do PCMark 10 são consistentemente mais altos do que o que registramos no modelo do ano passado, especialmente no sub-teste de Criação de Conteúdo Digital. A Razer também parece ter corrigido o problema relativo ao software Synapse que não foi lançado quando não estava conectado à Internet.
| PCMark 10 / Score | |
| Razer Blade 17 RTX 3080 Ti | |
| Média Intel Core i7-12800H, NVIDIA GeForce RTX 3080 Ti Laptop GPU (7313 - 7744, n=3) | |
| Alienware x17 RTX 3080 P48E | |
| Asus ROG Zephyrus S17 GX703HSD | |
| Aorus 17G YD | |
| MSI GS76 Stealth 11UH | |
| Razer Blade Pro 17 2021 (QHD Touch) | |
| PCMark 10 / Essentials | |
| Razer Blade 17 RTX 3080 Ti | |
| Média Intel Core i7-12800H, NVIDIA GeForce RTX 3080 Ti Laptop GPU (10597 - 10814, n=3) | |
| Asus ROG Zephyrus S17 GX703HSD | |
| Aorus 17G YD | |
| Alienware x17 RTX 3080 P48E | |
| Razer Blade Pro 17 2021 (QHD Touch) | |
| MSI GS76 Stealth 11UH | |
| PCMark 10 / Productivity | |
| Alienware x17 RTX 3080 P48E | |
| Média Intel Core i7-12800H, NVIDIA GeForce RTX 3080 Ti Laptop GPU (9470 - 9675, n=3) | |
| Razer Blade 17 RTX 3080 Ti | |
| Aorus 17G YD | |
| Asus ROG Zephyrus S17 GX703HSD | |
| MSI GS76 Stealth 11UH | |
| Razer Blade Pro 17 2021 (QHD Touch) | |
| PCMark 10 / Digital Content Creation | |
| Razer Blade 17 RTX 3080 Ti | |
| Média Intel Core i7-12800H, NVIDIA GeForce RTX 3080 Ti Laptop GPU (10351 - 12306, n=3) | |
| Alienware x17 RTX 3080 P48E | |
| Asus ROG Zephyrus S17 GX703HSD | |
| Aorus 17G YD | |
| MSI GS76 Stealth 11UH | |
| Razer Blade Pro 17 2021 (QHD Touch) | |
| PCMark 10 Score | 7744 pontos | |
Ajuda | ||
| AIDA64 / Memory Copy | |
| MSI GE76 Raider | |
| Razer Blade 17 RTX 3080 Ti | |
| Schenker Uniwill Technology GM7AG8P | |
| Média Intel Core i7-12800H (48643 - 62522, n=5) | |
| Schenker XMG Pro 17 (Late 2021, RTX 3080) | |
| Schenker XMG Apex 17 M21 | |
| Lenovo Legion 5 17ACH6H-82JY0003GE | |
| AIDA64 / Memory Read | |
| Razer Blade 17 RTX 3080 Ti | |
| MSI GE76 Raider | |
| Schenker Uniwill Technology GM7AG8P | |
| Média Intel Core i7-12800H (56629 - 66199, n=5) | |
| Schenker XMG Pro 17 (Late 2021, RTX 3080) | |
| Schenker XMG Apex 17 M21 | |
| Lenovo Legion 5 17ACH6H-82JY0003GE | |
| AIDA64 / Memory Write | |
| Razer Blade 17 RTX 3080 Ti | |
| Schenker Uniwill Technology GM7AG8P | |
| MSI GE76 Raider | |
| Média Intel Core i7-12800H (50923 - 66074, n=5) | |
| Schenker XMG Apex 17 M21 | |
| Schenker XMG Pro 17 (Late 2021, RTX 3080) | |
| Lenovo Legion 5 17ACH6H-82JY0003GE | |
| AIDA64 / Memory Latency | |
| MSI GE76 Raider | |
| Schenker XMG Pro 17 (Late 2021, RTX 3080) | |
| Schenker XMG Apex 17 M21 | |
| Lenovo Legion 5 17ACH6H-82JY0003GE | |
| Média Intel Core i7-12800H (89.3 - 95.2, n=5) | |
| Schenker Uniwill Technology GM7AG8P | |
| Razer Blade 17 RTX 3080 Ti | |
* ... menor é melhor
Latência do DPC
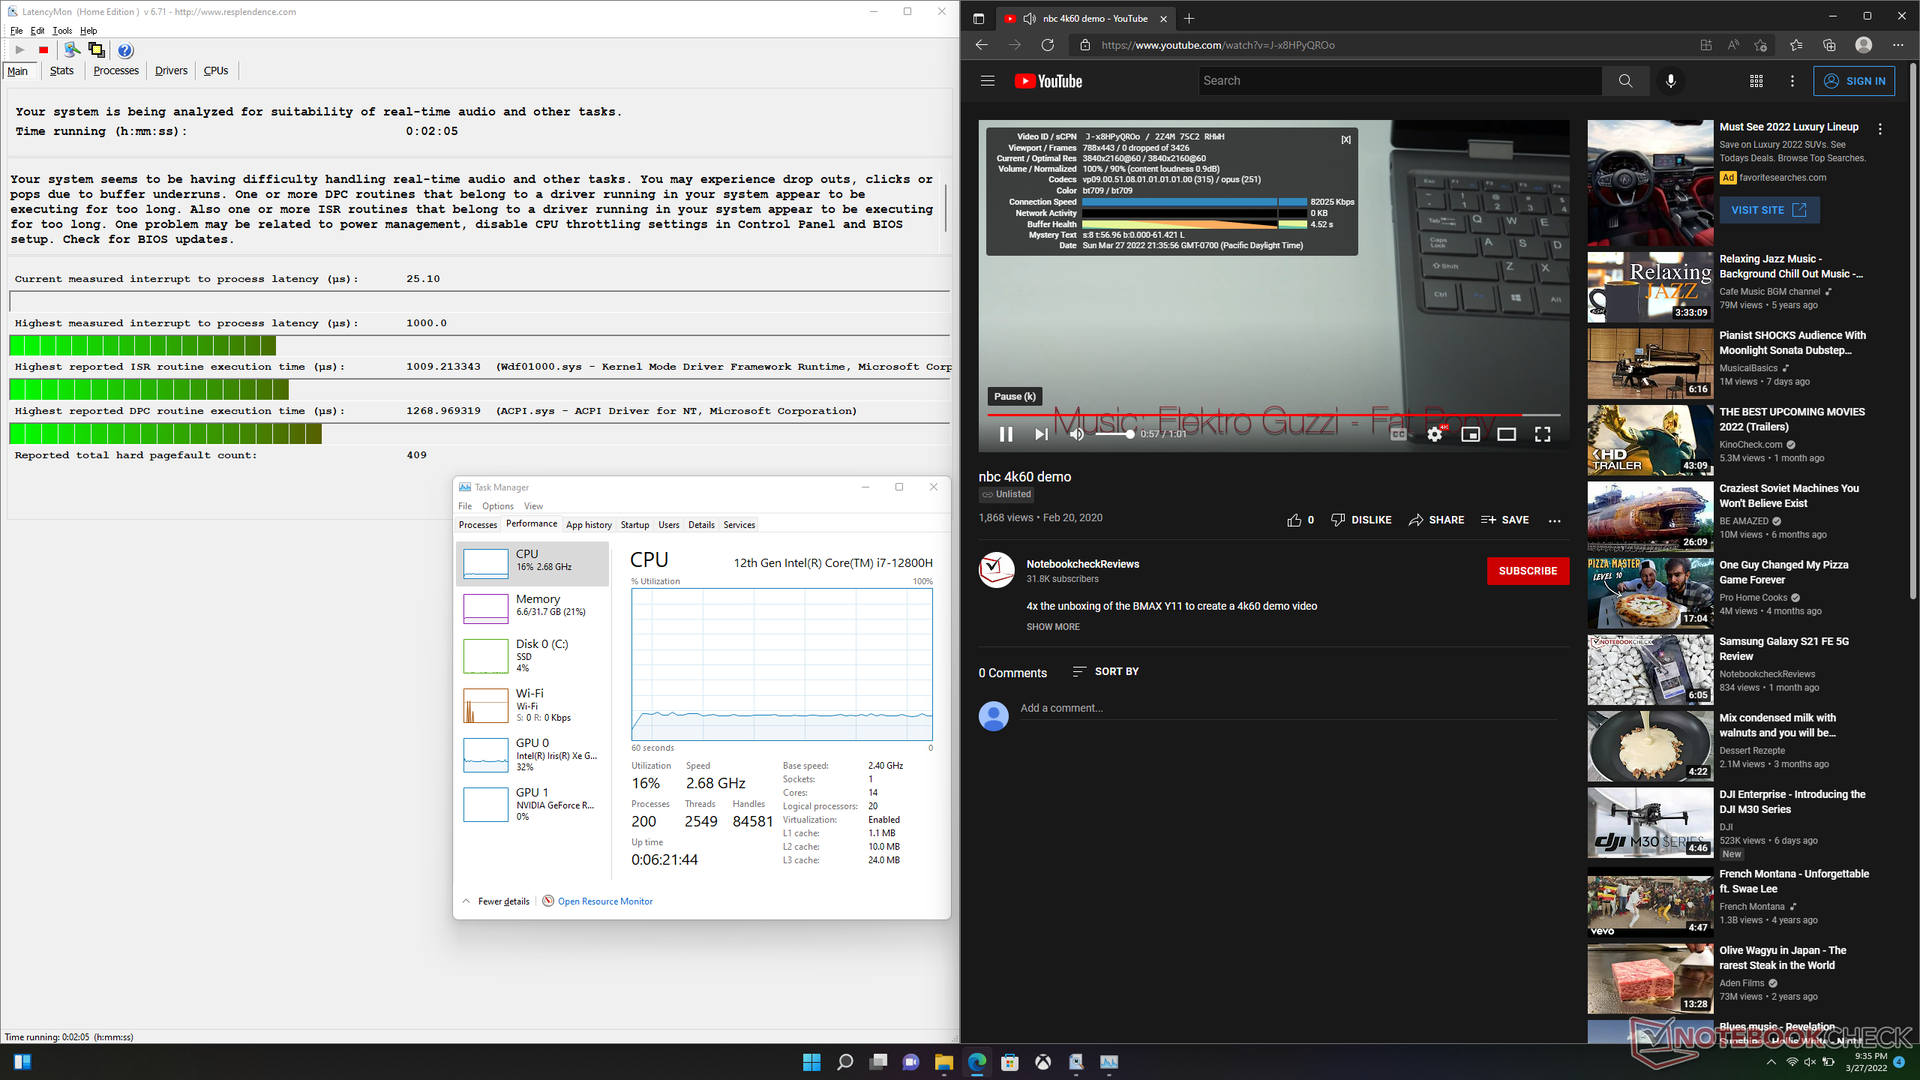
LatencyMon mostra pequenos problemas de DPC ao abrir várias abas do navegador em nossa página inicial. a reprodução de vídeo de 4K a 60 FPS é perfeita, sem queda de quadros.

| DPC Latencies / LatencyMon - interrupt to process latency (max), Web, Youtube, Prime95 | |
| Alienware x17 RTX 3080 P48E | |
| Razer Blade Pro 17 2021 (QHD Touch) | |
| Asus ROG Zephyrus S17 GX703HSD | |
| Aorus 17G YD | |
| Razer Blade 17 RTX 3080 Ti | |
| MSI GS76 Stealth 11UH | |
* ... menor é melhor
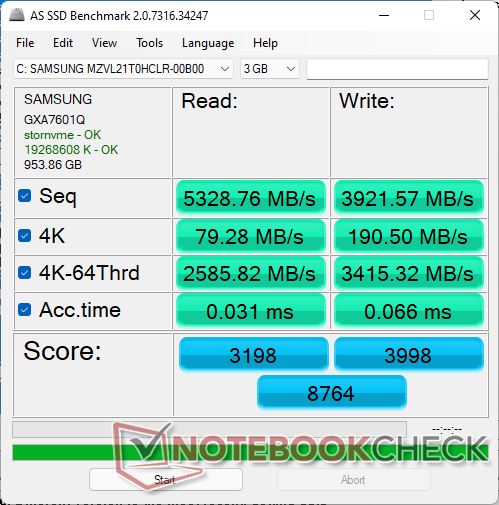
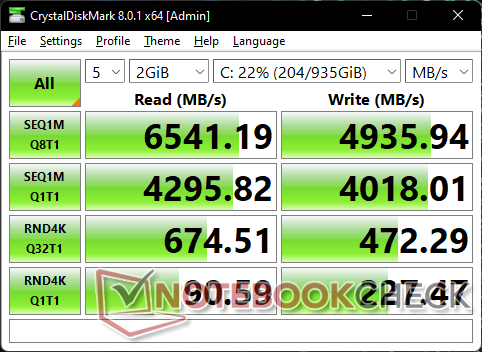
Dispositivos de armazenamento - Até dois M.2 PCIe4 x4 SSDs
A maioria, se não todas, as Blade 17 SKUs são enviadas com SSDs Samsung. Nossa unidade de teste vem com oSamsung PM9A1 que é um dos mais rápidos SSDs de classe de consumo PCIe4 x4 disponíveis. A unidade não apresenta problemas em manter taxas de transferência muito rápidas de mais de 6600 MB/s em nossa unidade, o que sugere uma excelente dissipação de calor, ao contrário do que ocorre noTecnologia Uniwill GM7AG8P.

* ... menor é melhor
Disk Throttling: DiskSpd Read Loop, Queue Depth 8
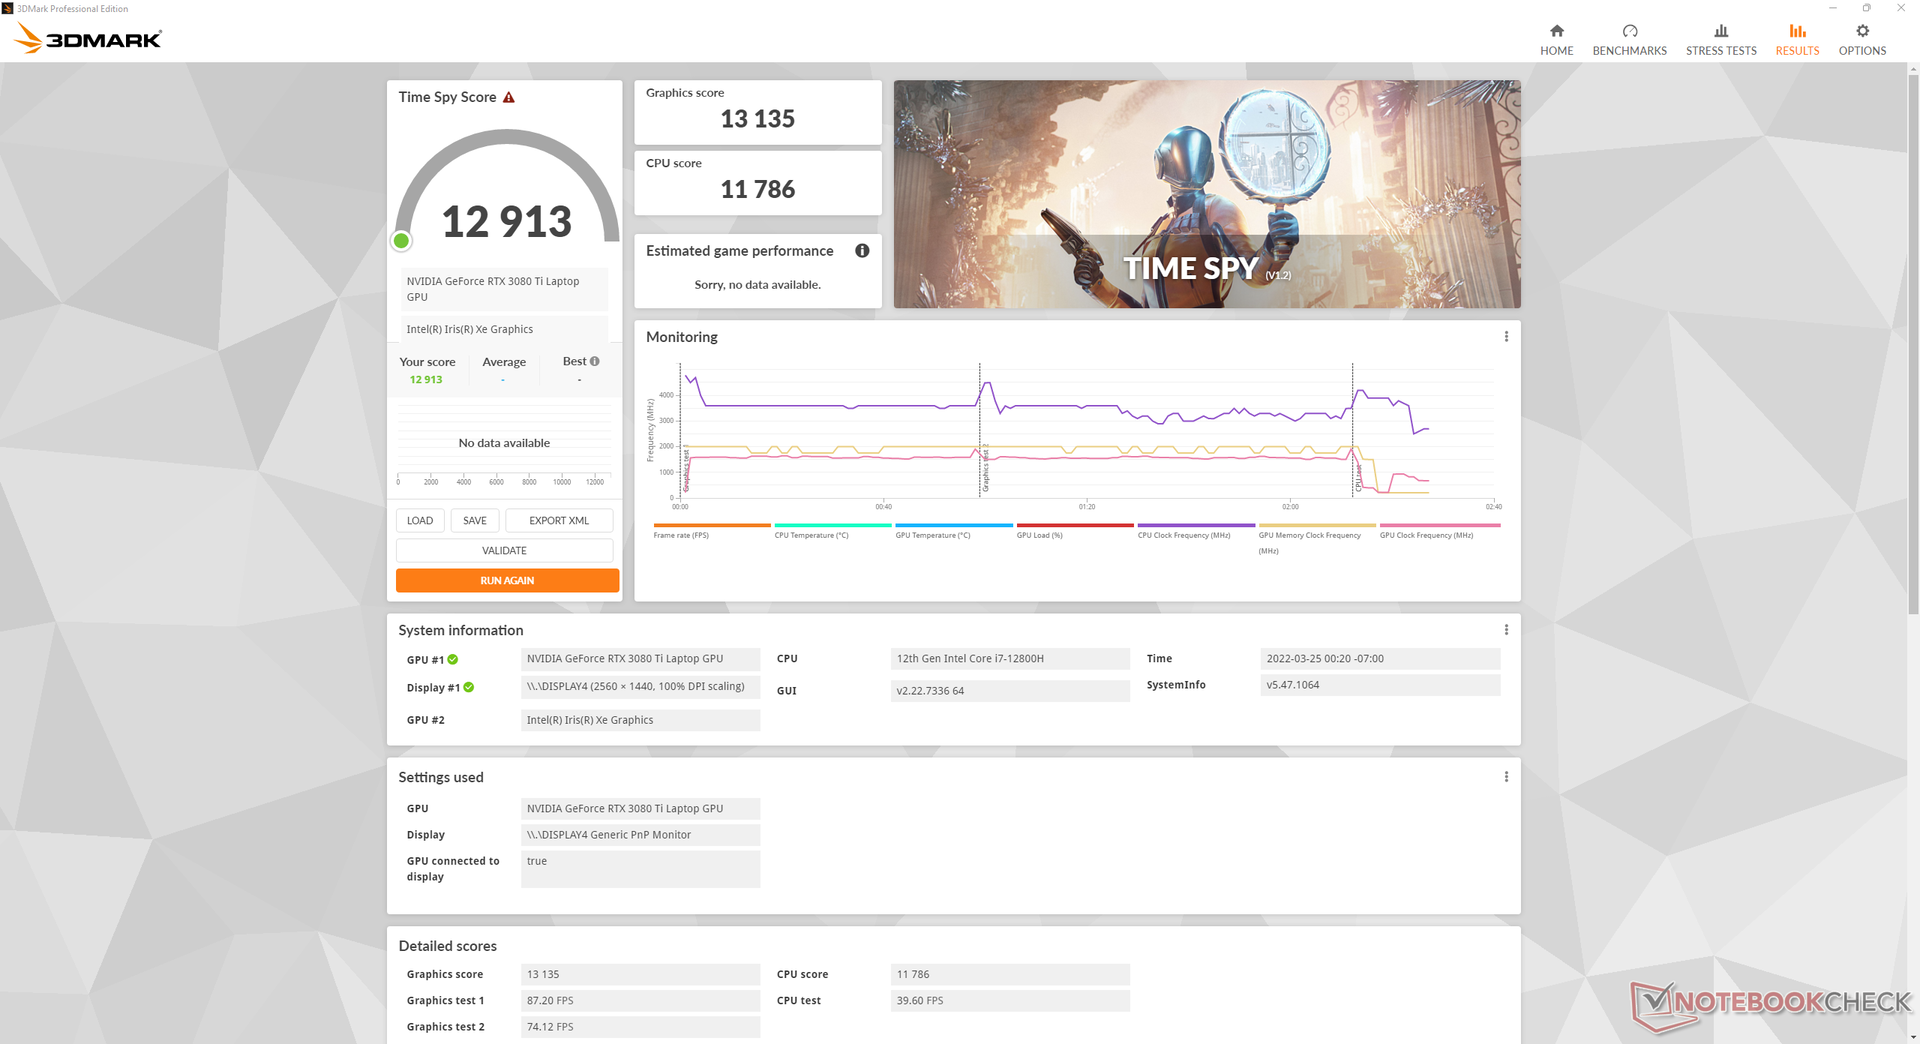
Desempenho da GPU
Após testar mais de meia dúzia de laptops com móvel GeForce RTX 3080 Ti no momento da revisão, o da nossa Lâmina 17 está tendo um desempenho confortavelmente acima da média em cerca de 15%. A alta meta TGP de 165 W é sem dúvida uma grande razão para a vantagem de desempenho como outros laptops com a mesma GPU RTX 3080 Ti como o Lâmina 15 ou Gigabyte Aero 16 YE5 tendem a apontar para metas TGP muito mais baixas de cerca de 100 W. Os usuários podem esperar um aumento de desempenho gráfico bruto de cerca de 20% em relação ao 10º ou 11º geração da Intel Blade 17 com móvel RTX 3080 gráficos.
A execução do sistema no modo dGPU Equilibrado em vez do modo dGPU de desempenho máximo acarretará um déficit de desempenho gráfico de apenas cerca de 5 a 7%.
Downgrading para o modo móvel RTX 3070 Ti de nosso RTX 3080 Ti móvel acarretará um déficit de desempenho de apenas cerca de 10 por cento
É claro, o "real" RTX 3080 Ti para desktop ainda oferecerá um grande salto no desempenho da GPU de quase 50% em relação à nossa versão móvel.
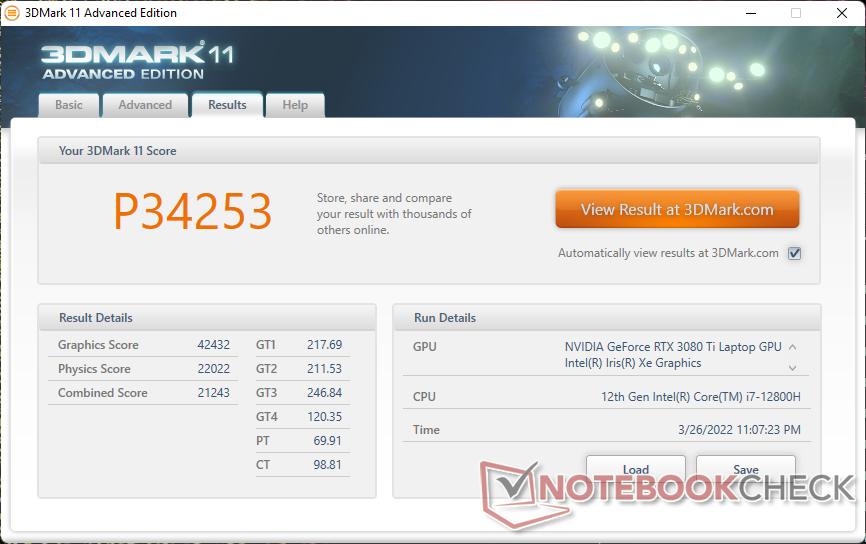
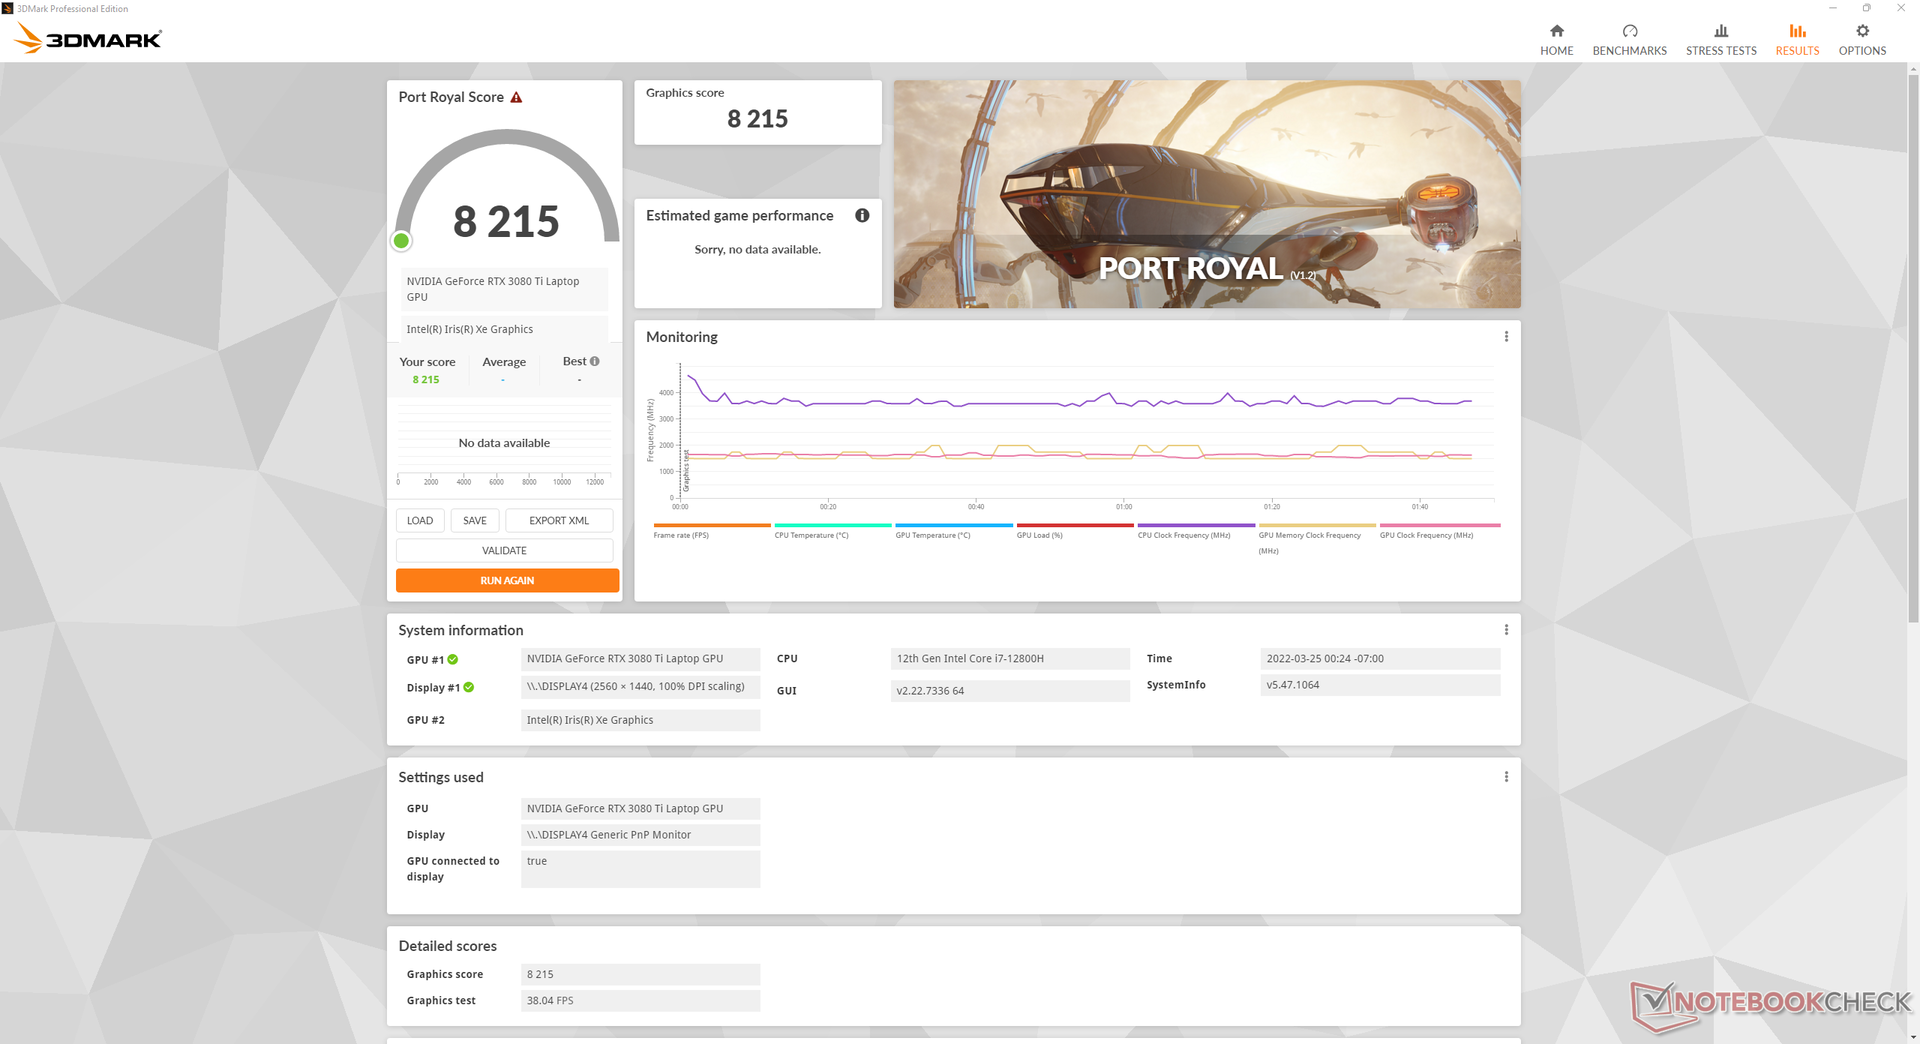
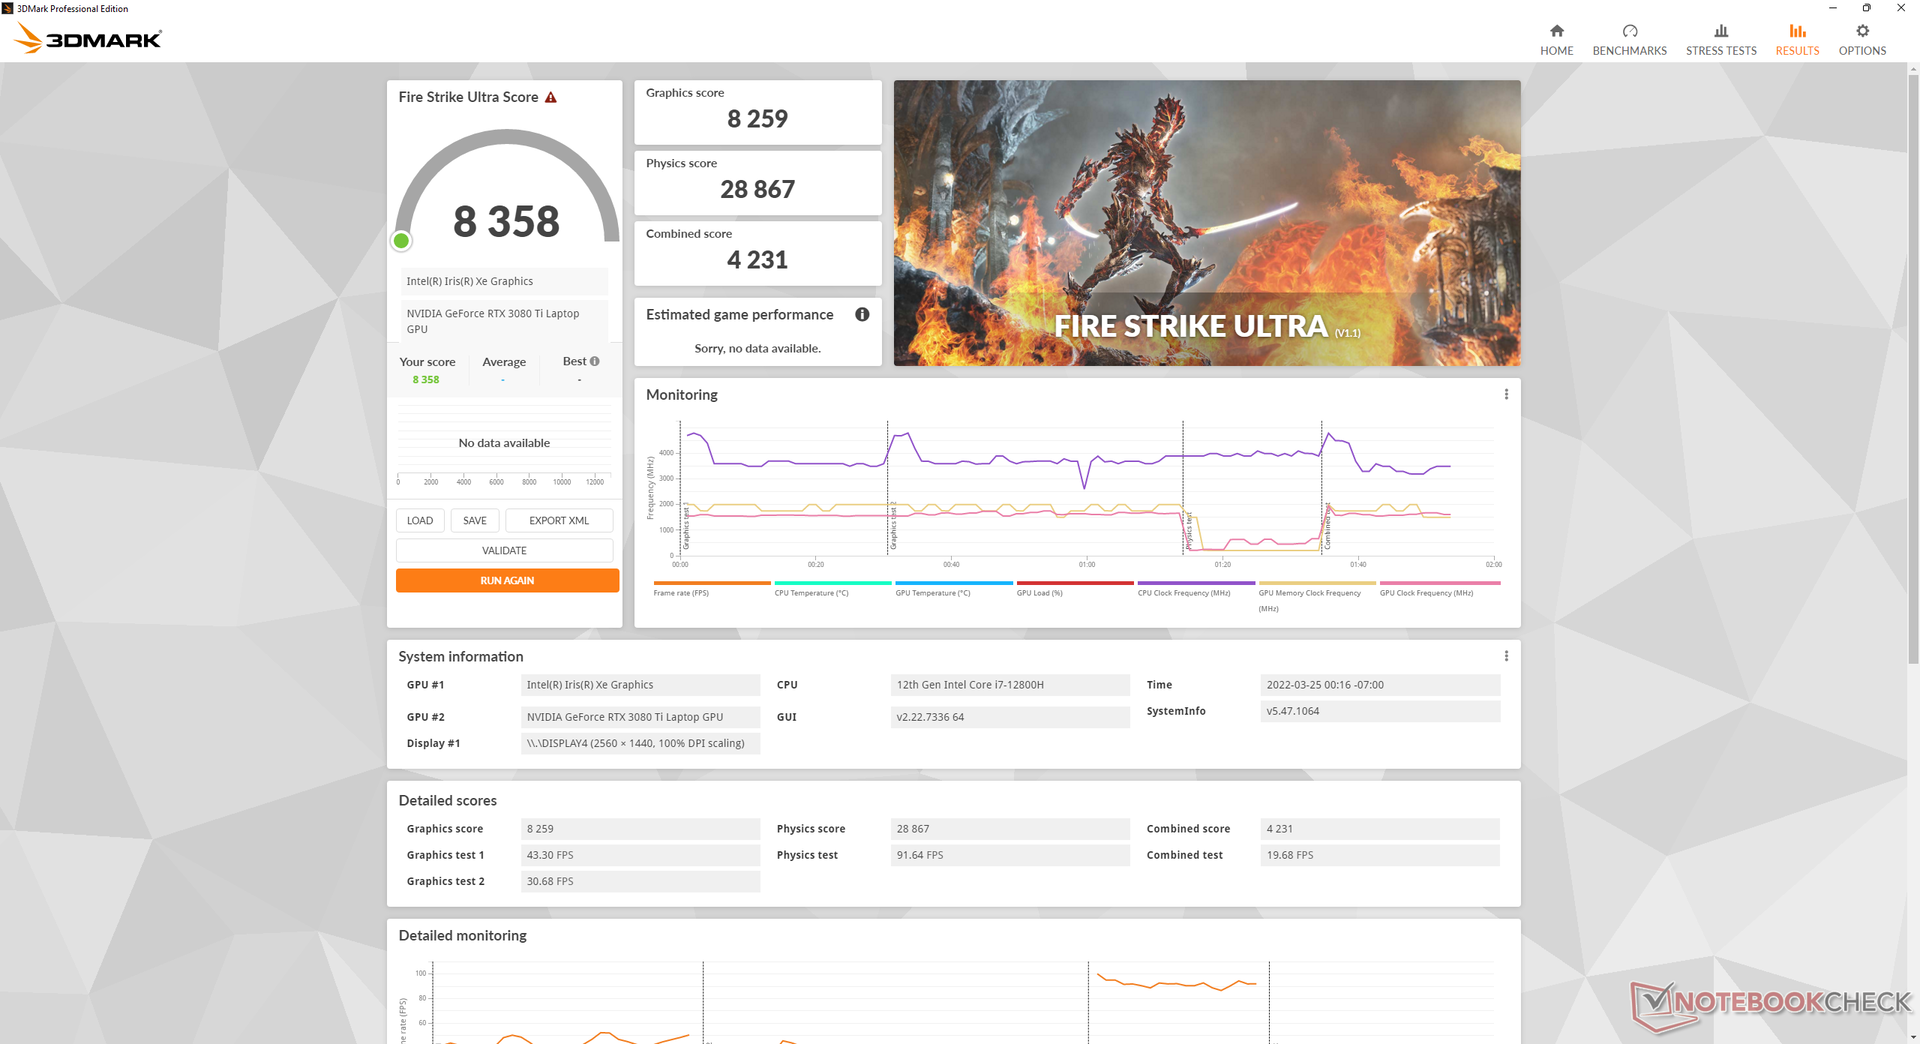
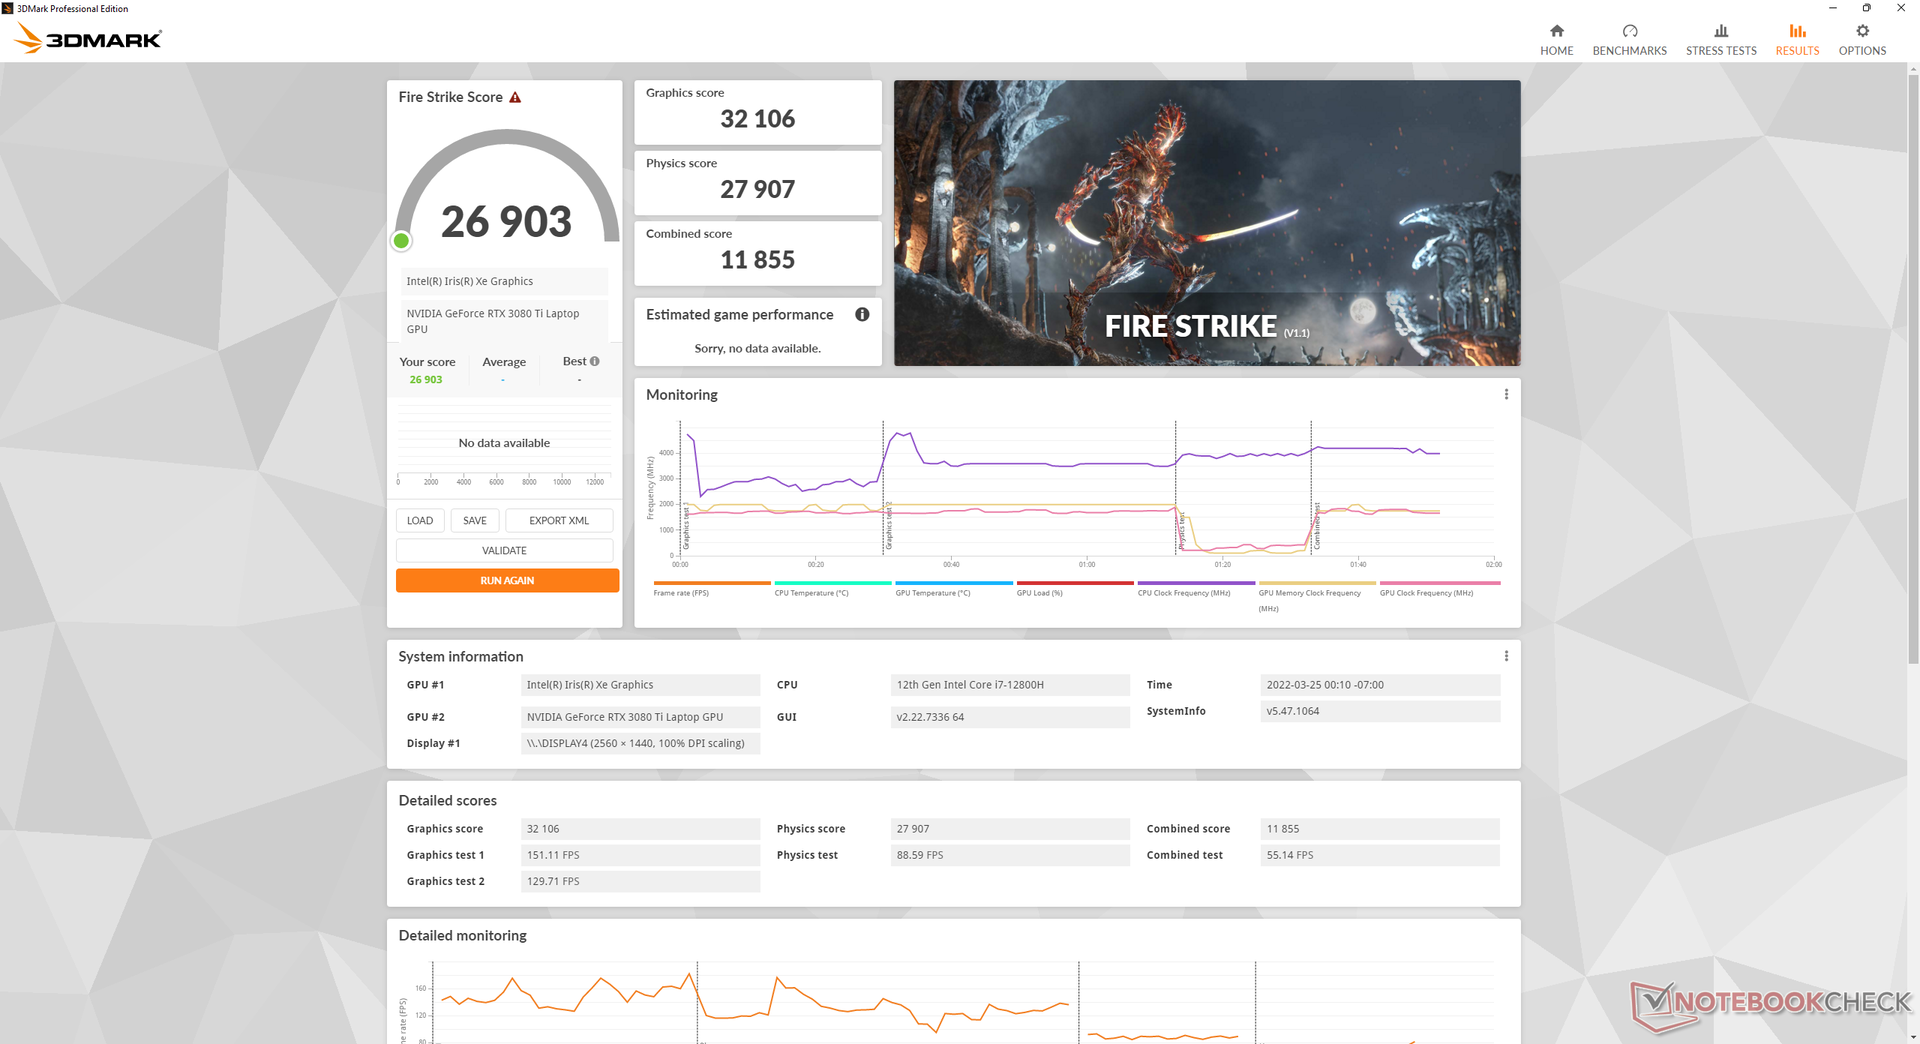
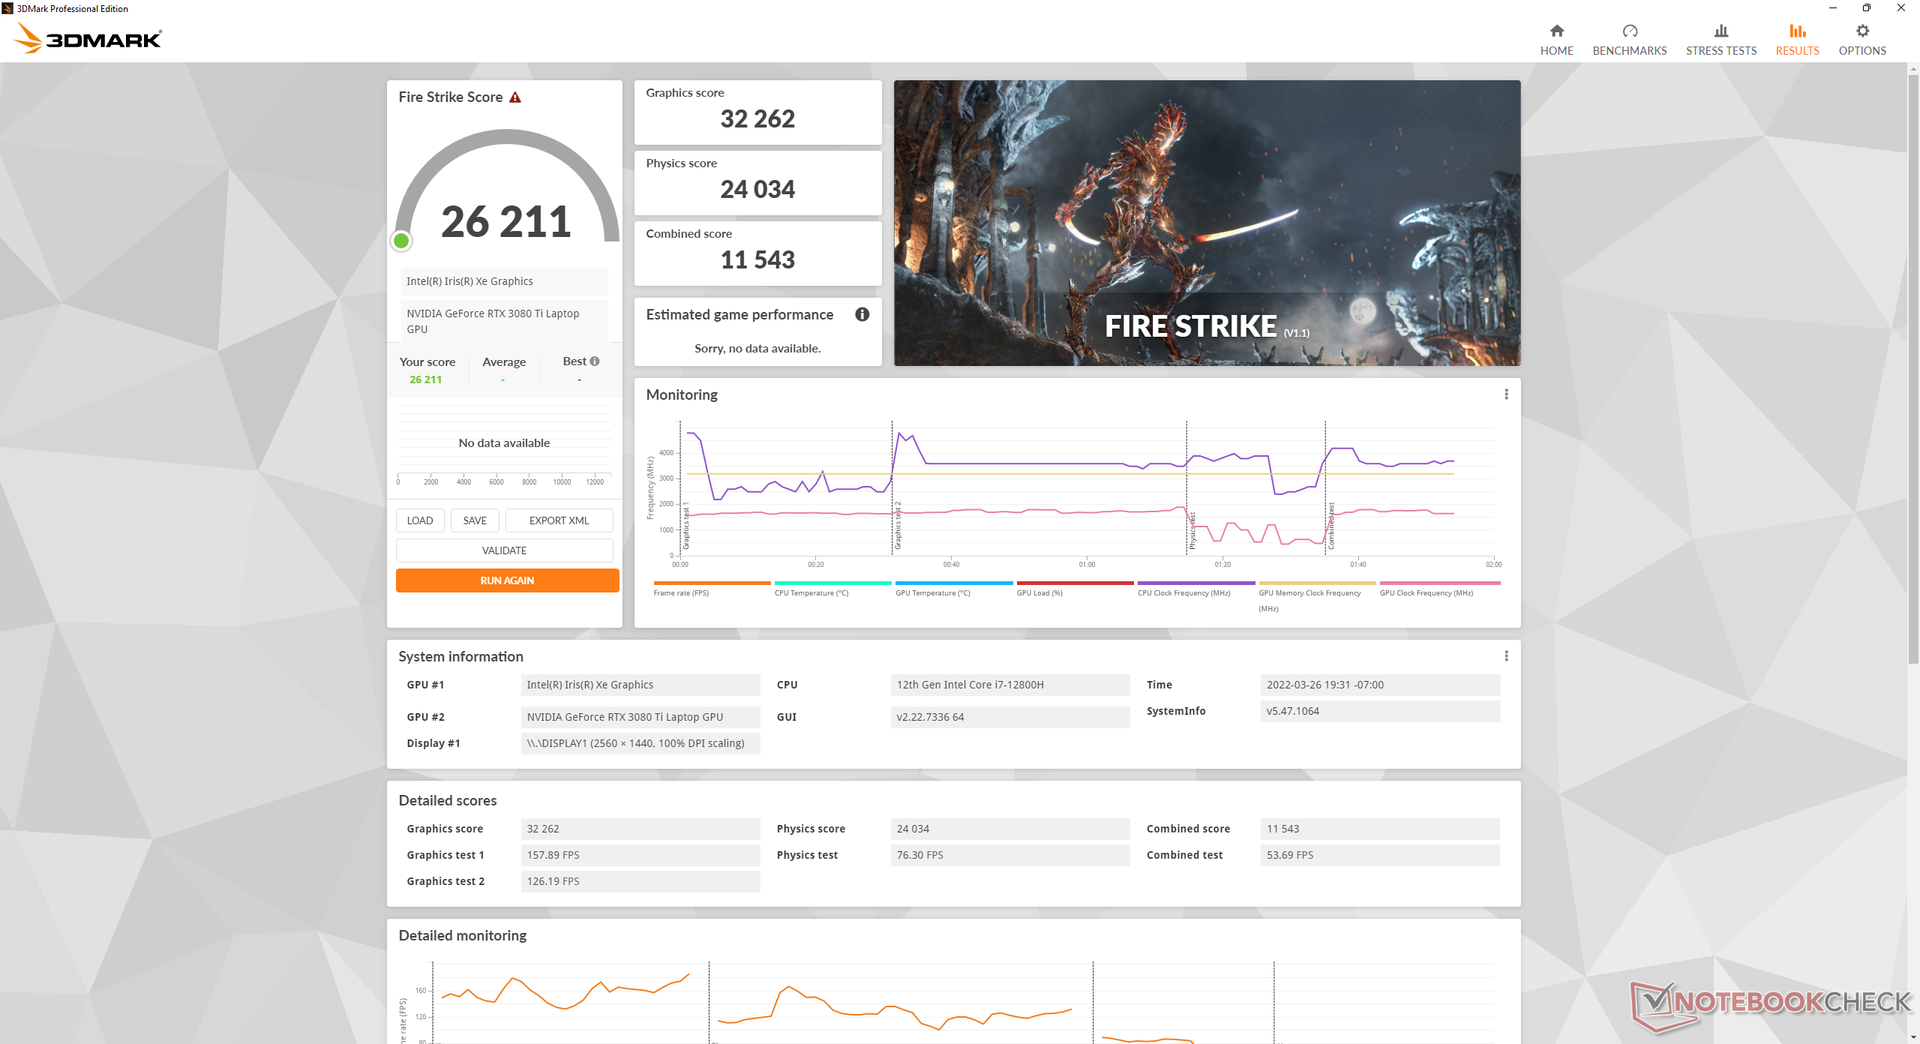
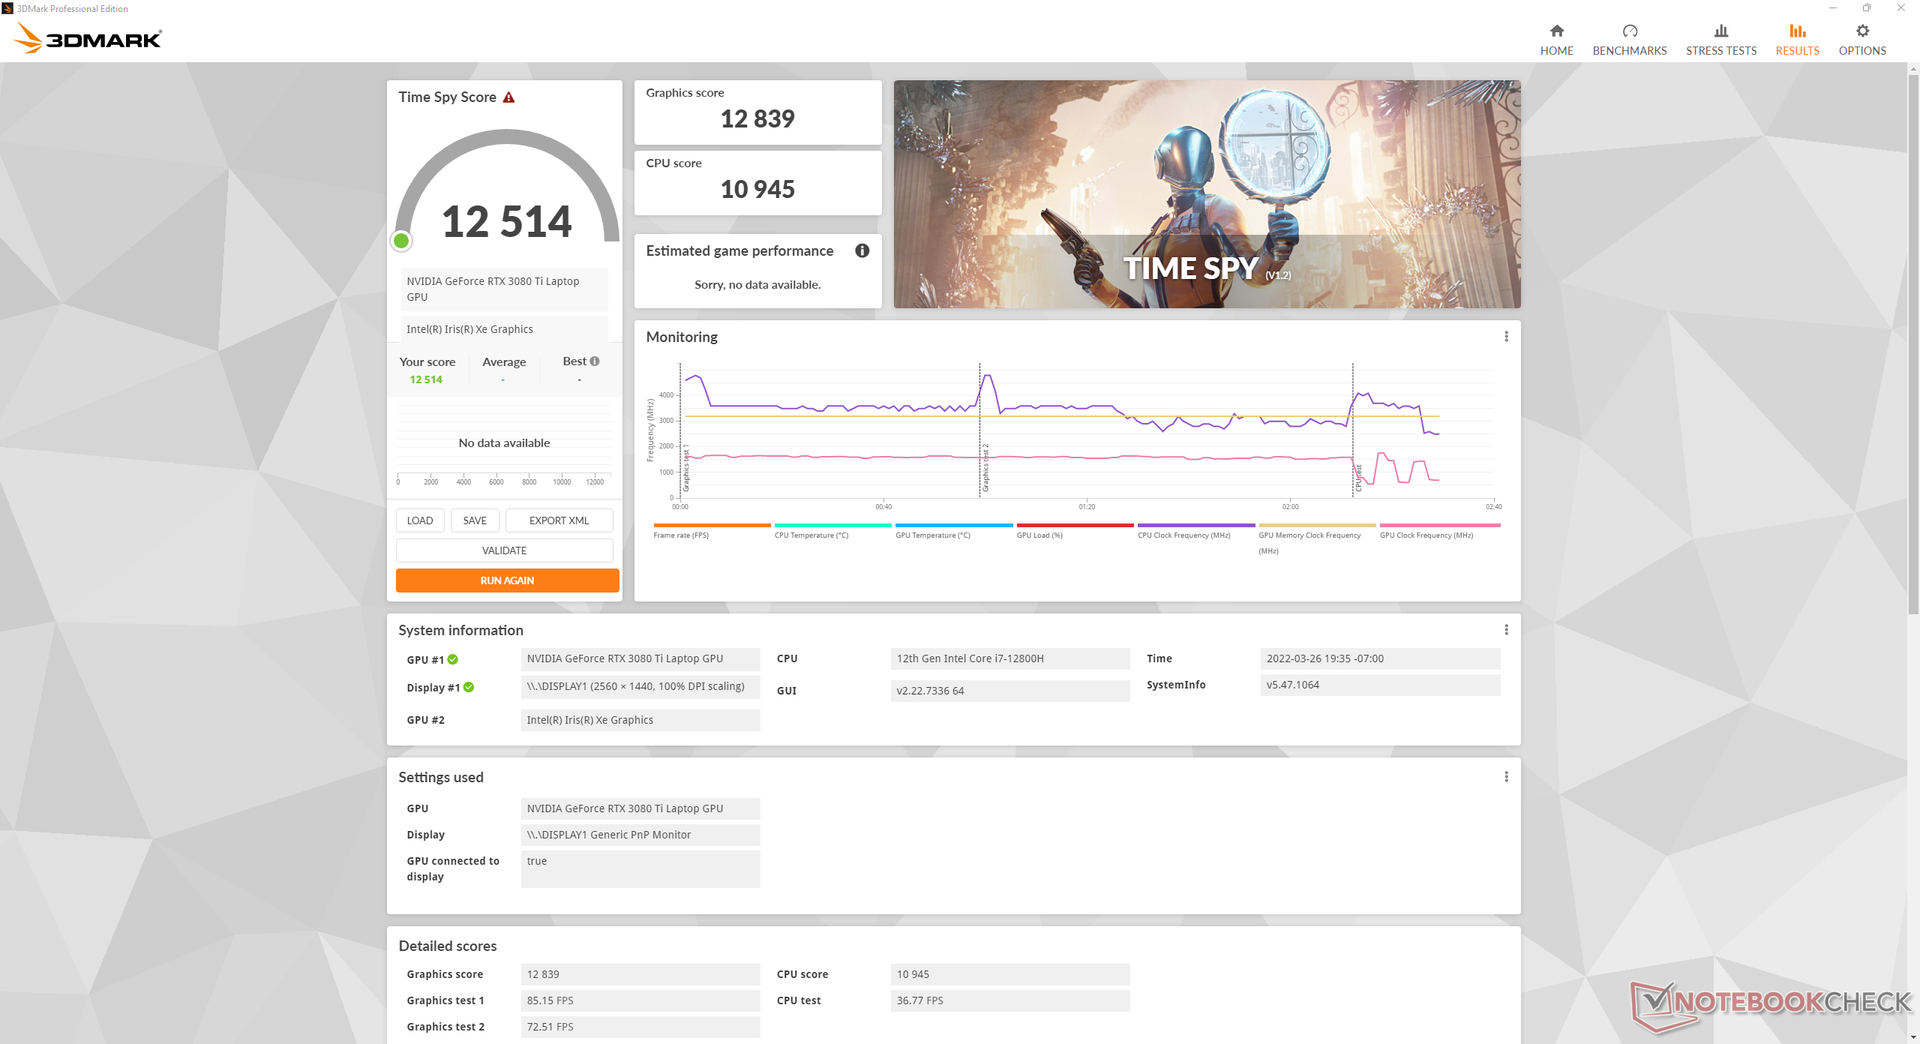


| 3DMark 11 Performance | 34253 pontos | |
| 3DMark Cloud Gate Standard Score | 62059 pontos | |
| 3DMark Fire Strike Score | 26903 pontos | |
| 3DMark Time Spy Score | 12913 pontos | |
Ajuda | ||
Witcher 3 FPS Chart
| baixo | média | alto | ultra | QHD | |
|---|---|---|---|---|---|
| GTA V (2015) | 186 | 182 | 176 | 113 | 105 |
| The Witcher 3 (2015) | 459 | 340.9 | 250.4 | 124.6 | |
| Dota 2 Reborn (2015) | 183 | 171 | 165 | 157 | |
| Final Fantasy XV Benchmark (2018) | 168 | 152 | 121 | 93.3 | |
| X-Plane 11.11 (2018) | 158 | 139 | 111 | ||
| Far Cry 5 (2018) | 171 | 149 | 134 | 125 | 120 |
| Strange Brigade (2018) | 431 | 296 | 242 | 215 | 158 |
| Cyberpunk 2077 1.6 (2022) | 119.1 | 112.1 | 106 | 106.5 | 59.7 |
Emissões
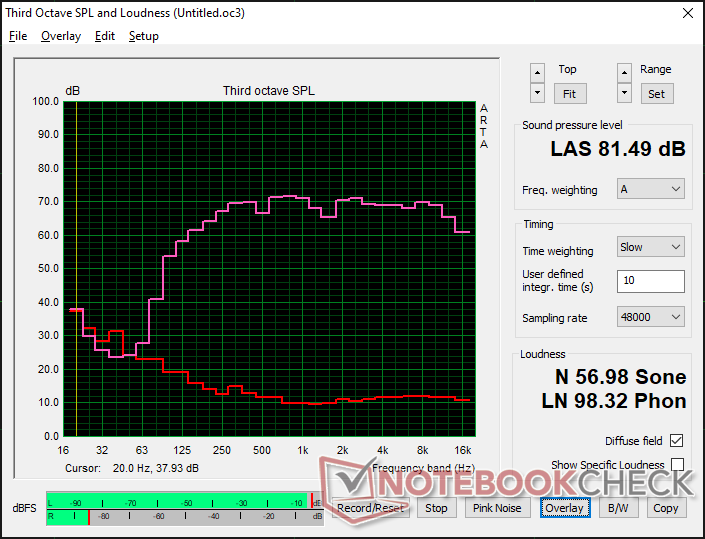
Ruído do sistema - Somente alto quando se joga
Não há mudanças significativas no ruído do ventilador, apesar da mudança de quatro para três ventiladores. Os usuários vão querer estar nos modos Power Saver ou Balanced quando não estiverem executando nenhuma aplicação exigente para ventiladores mais silenciosos.
O ruído do ventilador quando jogando no modo Equilibrado é de cerca de 43,2 dB(A) comparado a 50,9 dB(A) quando jogando no modo Máximo Desempenho, apesar do pequeno déficit gráfico de 5 a 7%. Assim, os usuários podem querer considerar os jogos no modo Equilibrado se o ruído dos ventiladores for uma preocupação.
Barulho
| Ocioso |
| 23.3 / 23.3 / 26.3 dB |
| Carga |
| 38.2 / 49.1 dB |
 | ||
30 dB silencioso 40 dB(A) audível 50 dB(A) ruidosamente alto |
||
min: | ||
| Razer Blade 17 RTX 3080 Ti GeForce RTX 3080 Ti Laptop GPU, i7-12800H, Samsung PM9A1 MZVL21T0HCLR | Razer Blade Pro 17 2021 (QHD Touch) GeForce RTX 3080 Laptop GPU, i7-10875H, Samsung PM981a MZVLB1T0HBLR | MSI GS76 Stealth 11UH GeForce RTX 3080 Laptop GPU, i9-11900H, Samsung PM9A1 MZVL22T0HBLB | Asus ROG Zephyrus S17 GX703HSD GeForce RTX 3080 Laptop GPU, i9-11900H, Samsung PM9A1 MZVL22T0HBLB | Aorus 17G YD GeForce RTX 3080 Laptop GPU, i7-11800H, Samsung PM9A1 MZVL2512HCJQ | Alienware x17 RTX 3080 P48E GeForce RTX 3080 Laptop GPU, i7-11800H, 2x WDC PC SN730 SDBPNTY-1T00 (RAID 0) | |
|---|---|---|---|---|---|---|
| Noise | -12% | -12% | 2% | -25% | -4% | |
| desligado / ambiente * (dB) | 23.3 | 26.1 -12% | 24 -3% | 23 1% | 25 -7% | 24.9 -7% |
| Idle Minimum * (dB) | 23.3 | 26.1 -12% | 24 -3% | 23 1% | 32 -37% | 24.9 -7% |
| Idle Average * (dB) | 23.3 | 26.5 -14% | 25 -7% | 23 1% | 33 -42% | 24.9 -7% |
| Idle Maximum * (dB) | 26.3 | 30.7 -17% | 42 -60% | 23 13% | 39 -48% | 29.6 -13% |
| Load Average * (dB) | 38.2 | 43.5 -14% | 46 -20% | 41 -7% | 43 -13% | 31.1 19% |
| Witcher 3 ultra * (dB) | 50.9 | 54 -6% | 48 6% | 45 12% | 52 -2% | 49.7 2% |
| Load Maximum * (dB) | 49.1 | 55 -12% | 48 2% | 52 -6% | 61 -24% | 54.8 -12% |
* ... menor é melhor
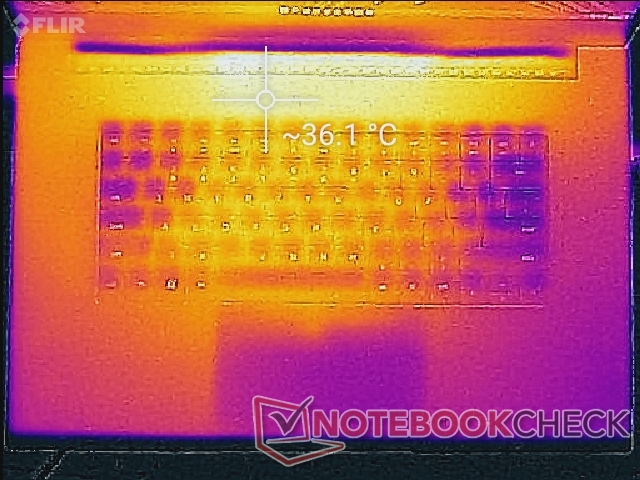
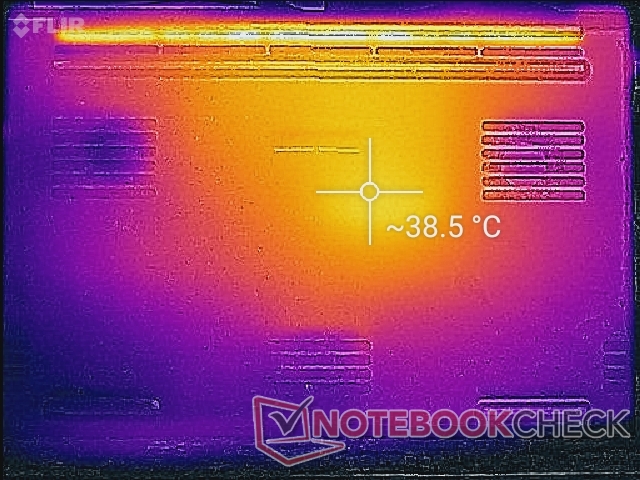
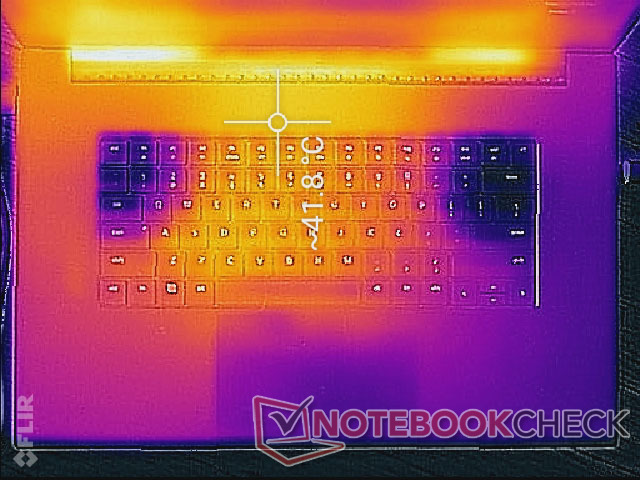
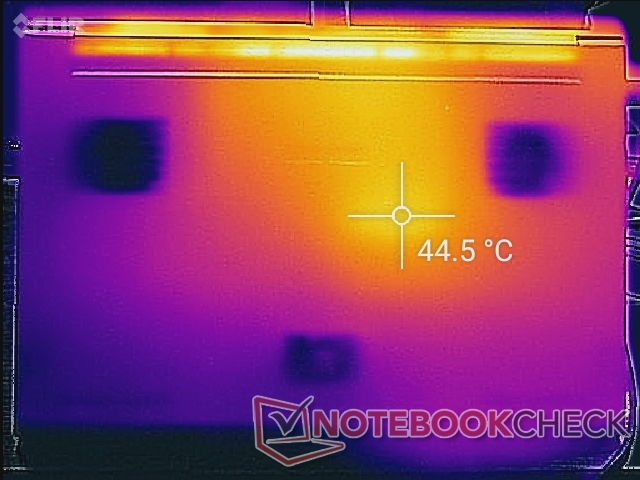
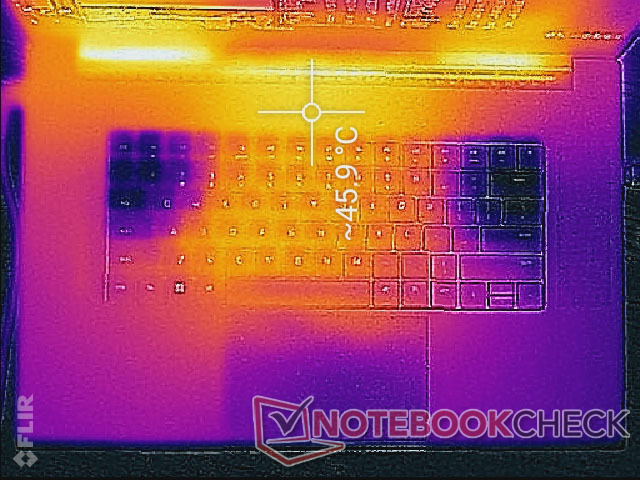
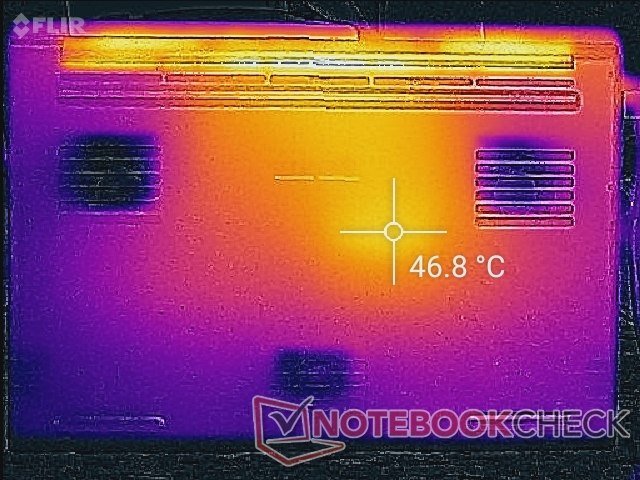
Temperatura - Mais quente do que antes
As temperaturas de superfície são ligeiramente mais quentes no modelo 2022, quando comparadas com o modelo 2021. O centro do teclado pode ser tão quente quanto 38 C quando se joga, enquanto este mesmo ponto no modelo 2021 seria um pouco mais frio em alguns graus. Além disso, o sistema continua a ser muito quente em torno de 31 C a 35 C quando não funciona com nenhuma carga exigente em comparação com apenas 27 C a 30 C no modelo 2021 MSI GS76. As temperaturas mais altas da pele são o preço a pagar por ventiladores globalmente mais silenciosos durante cargas baixas de processamento.
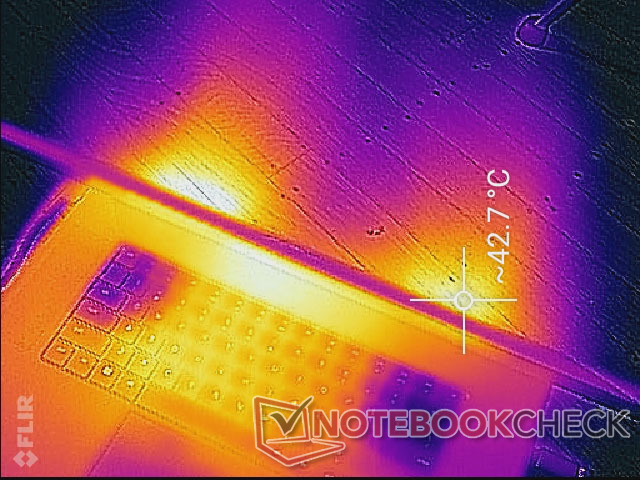
(-) A temperatura máxima no lado superior é 46 °C / 115 F, em comparação com a média de 40.4 °C / 105 F , variando de 21.2 a 68.8 °C para a classe Gaming.
(-) A parte inferior aquece até um máximo de 46.8 °C / 116 F, em comparação com a média de 43.2 °C / 110 F
(+) Em uso inativo, a temperatura média para o lado superior é 31.5 °C / 89 F, em comparação com a média do dispositivo de 33.9 °C / ### class_avg_f### F.
(±) Jogando The Witcher 3, a temperatura média para o lado superior é 33.2 °C / 92 F, em comparação com a média do dispositivo de 33.9 °C / ## #class_avg_f### F.
(+) Os apoios para as mãos e o touchpad estão atingindo a temperatura máxima da pele (32.4 °C / 90.3 F) e, portanto, não estão quentes.
(-) A temperatura média da área do apoio para as mãos de dispositivos semelhantes foi 28.8 °C / 83.8 F (-3.6 °C / -6.5 F).
| Razer Blade 17 RTX 3080 Ti Intel Core i7-12800H, NVIDIA GeForce RTX 3080 Ti Laptop GPU | Razer Blade Pro 17 2021 (QHD Touch) Intel Core i7-10875H, NVIDIA GeForce RTX 3080 Laptop GPU | MSI GS76 Stealth 11UH Intel Core i9-11900H, NVIDIA GeForce RTX 3080 Laptop GPU | Asus ROG Zephyrus S17 GX703HSD Intel Core i9-11900H, NVIDIA GeForce RTX 3080 Laptop GPU | Aorus 17G YD Intel Core i7-11800H, NVIDIA GeForce RTX 3080 Laptop GPU | Alienware x17 RTX 3080 P48E Intel Core i7-11800H, NVIDIA GeForce RTX 3080 Laptop GPU | |
|---|---|---|---|---|---|---|
| Heat | 10% | 4% | -7% | 12% | -4% | |
| Maximum Upper Side * (°C) | 46 | 38.2 17% | 49 -7% | 59 -28% | 36 22% | 58.4 -27% |
| Maximum Bottom * (°C) | 46.8 | 42.2 10% | 57 -22% | 53 -13% | 52 -11% | 49 -5% |
| Idle Upper Side * (°C) | 36.2 | 33.6 7% | 28 23% | 35 3% | 29 20% | 33.6 7% |
| Idle Bottom * (°C) | 38.6 | 36.2 6% | 30 22% | 35 9% | 33 15% | 34.6 10% |
* ... menor é melhor
Teste de estresse
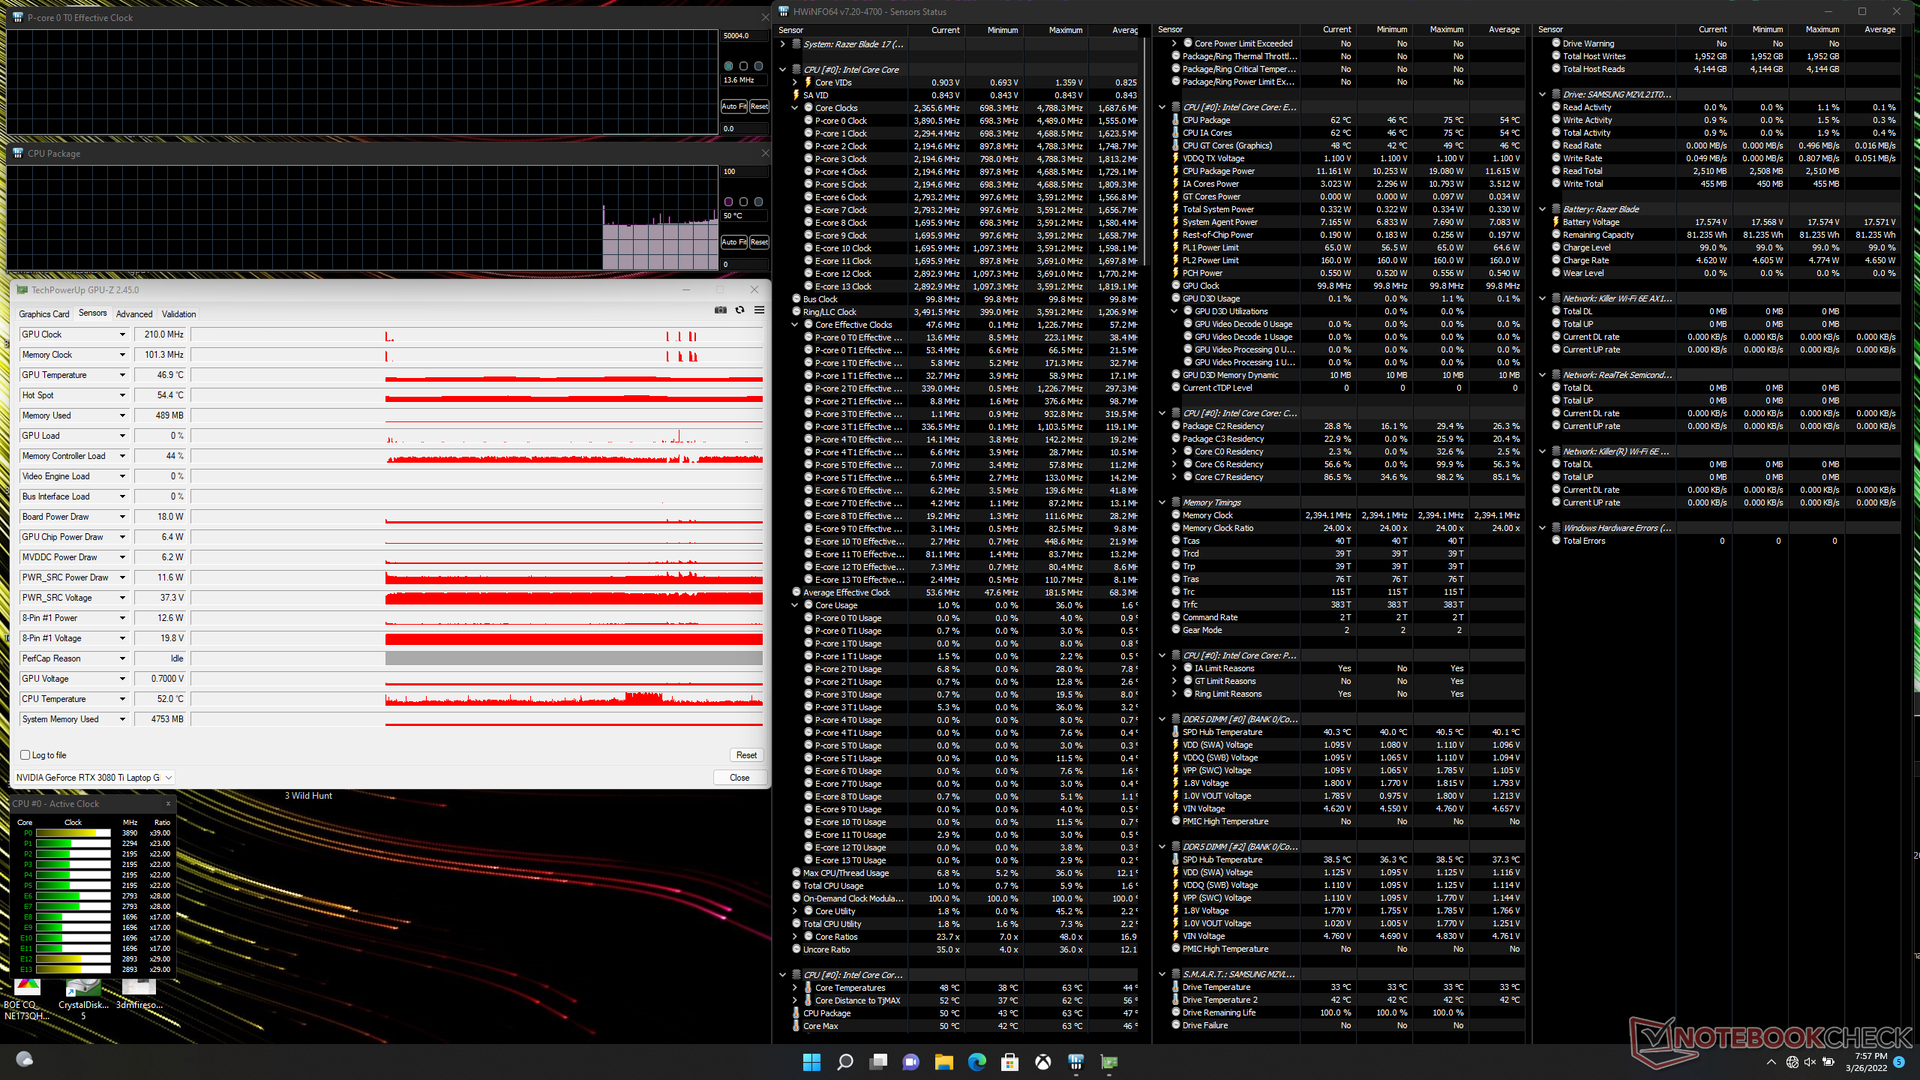
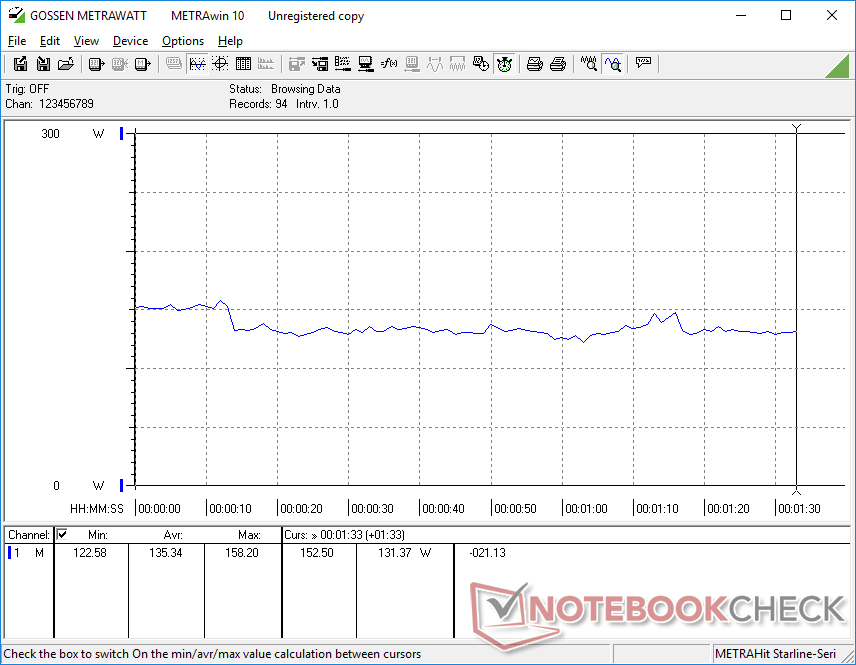
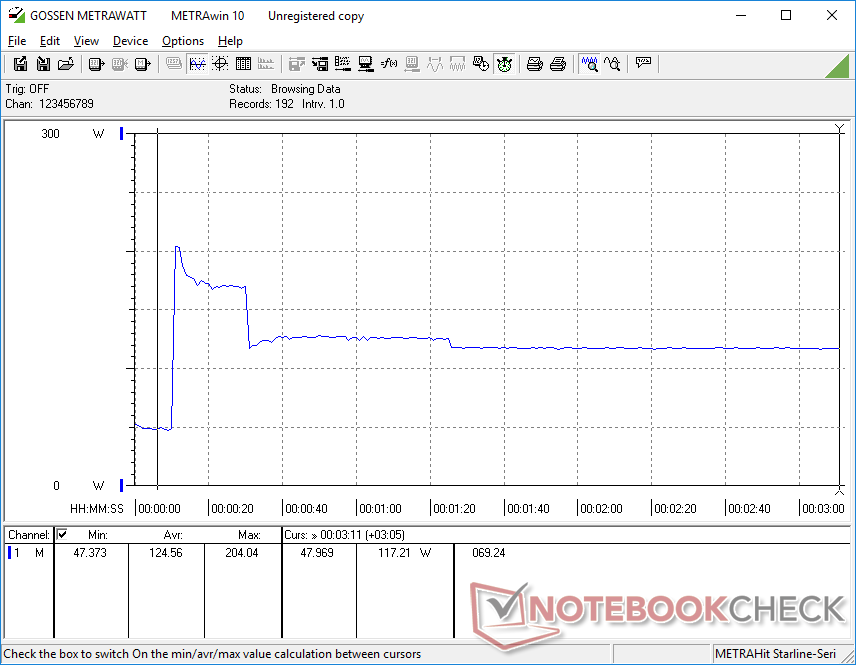
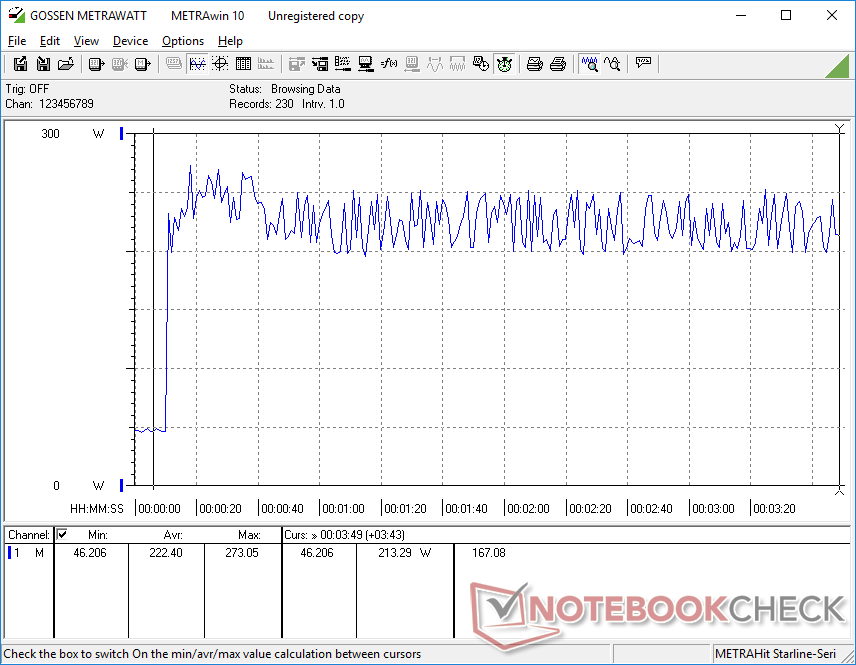
Quando estressada com Prime95 no modo Maximum Performance, a CPU aumentaria para 3,6 GHz durante os primeiros 20 segundos e a uma temperatura central de 99 C. As taxas de relógio e temperatura cairiam então para 2,7 GHz e 83 C antes de eventualmente se estabilizar em 2,5 GHz e 72 C. A potência do pacote da CPU chegaria a 107 W durante o início do teste de estresse antes de se estabilizar em 61 W em comparação com 90 W e 65 W na 11ª geração Intel Blade 17.
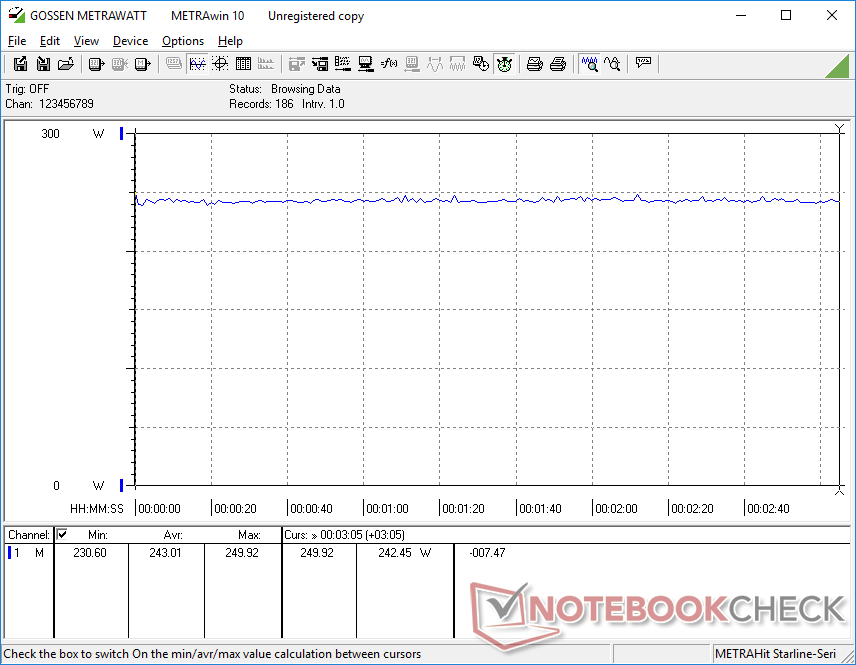
Rodando Witcher 3 no modo Máximo Desempenho resultaria em um consumo constante de energia da placa GPU de 162 W em comparação com apenas 143 W se no modo Equilibrado. Assim, os usuários devem executar a lâmina 17 em suas configurações de desempenho máximo para extrair o máximo de desempenho possível ao jogar. As temperaturas de CPU e GPU estabilizariam em 81 C e 77 C, respectivamente, em comparação com 79 C e 72 C na 11ª geração Intel Blade 17 com gráficos RTX 3070 ou 65 C e 64 C na 10ª geração Intel Blade 17 com gráficos RTX 3080. As temperaturas mais altas do núcleo em nosso modelo Intel do 12º gênero não é surpreendente, dadas suas metas mais altas de TDP e TGP.
Funcionando com bateria limita significativamente o desempenho, já que o sistema não pode ser ajustado para nada superior ao perfil de potência Balanceado. Um teste Fire Strike em baterias retornaria pontuações de Física e Gráficos de 11785 e 9465 pontos, respectivamente, em comparação com 27907 e 32106 pontos quando em rede elétrica.
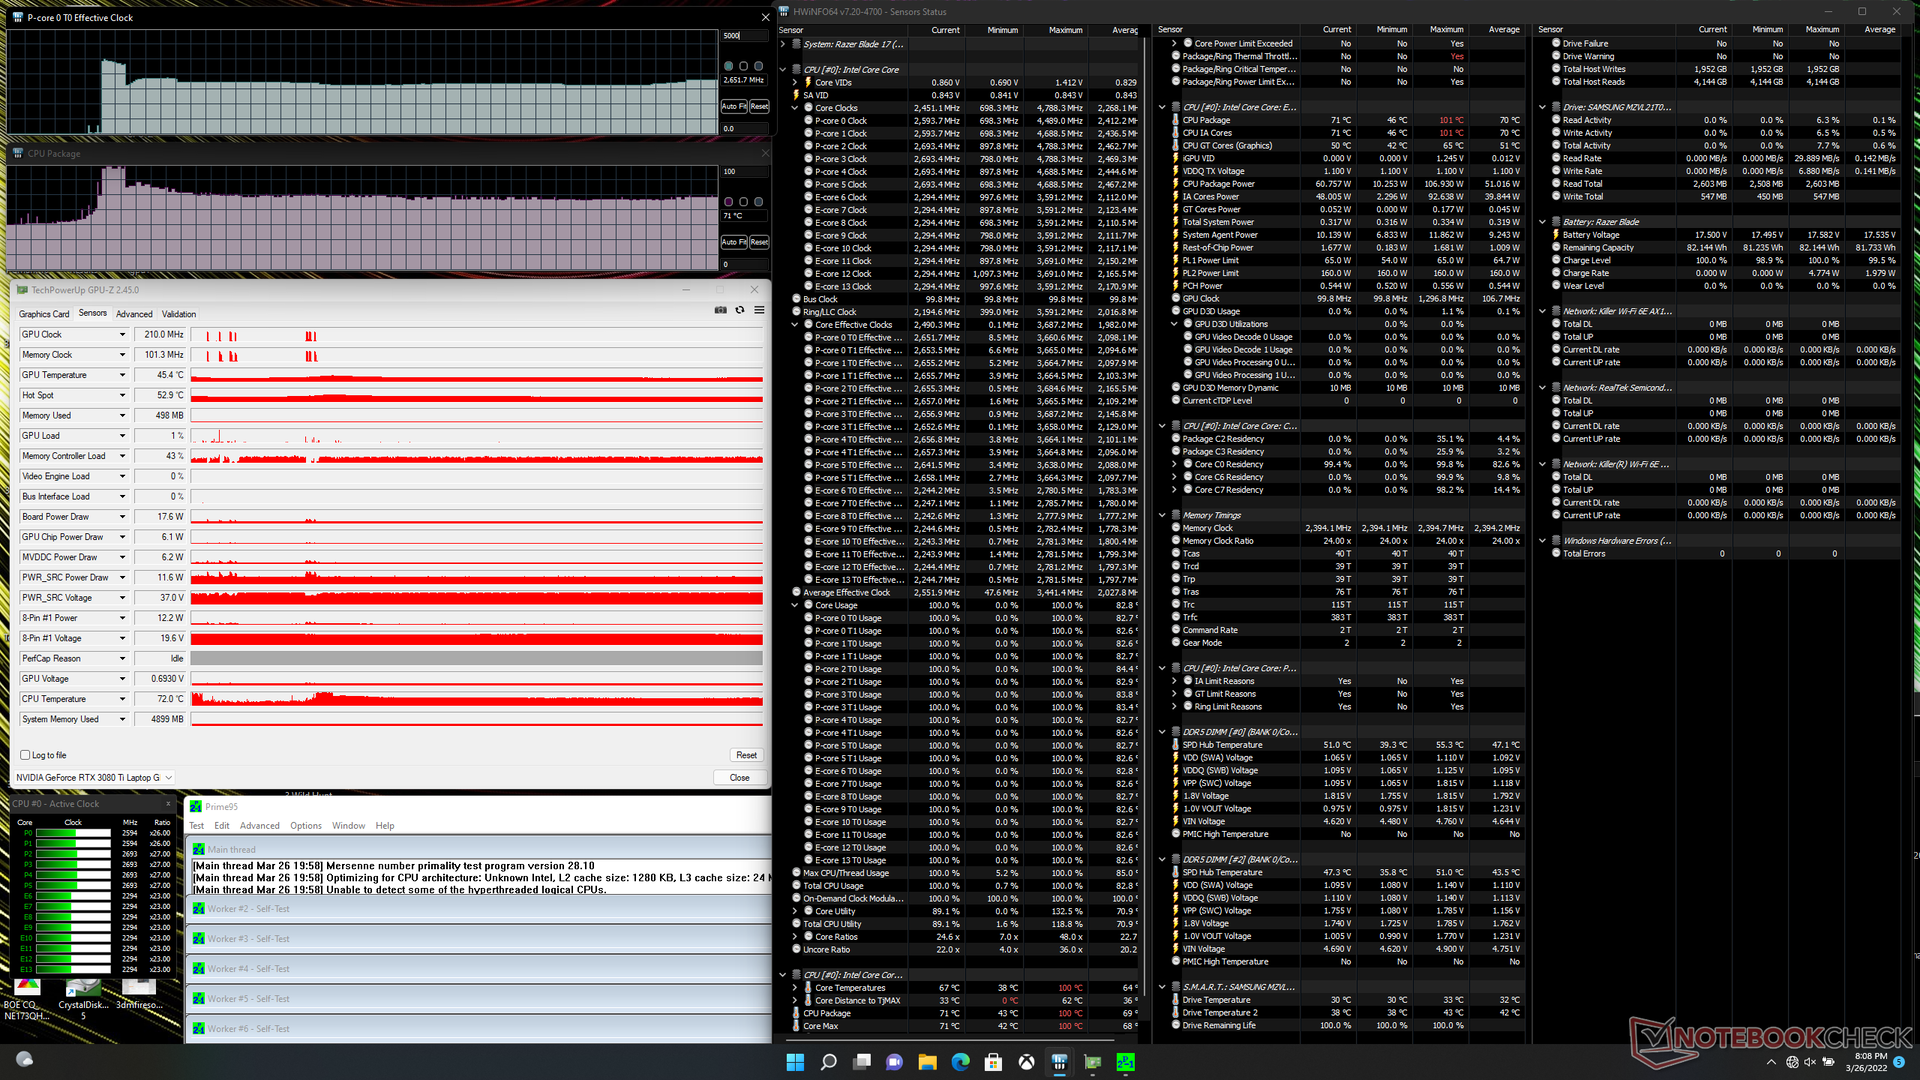
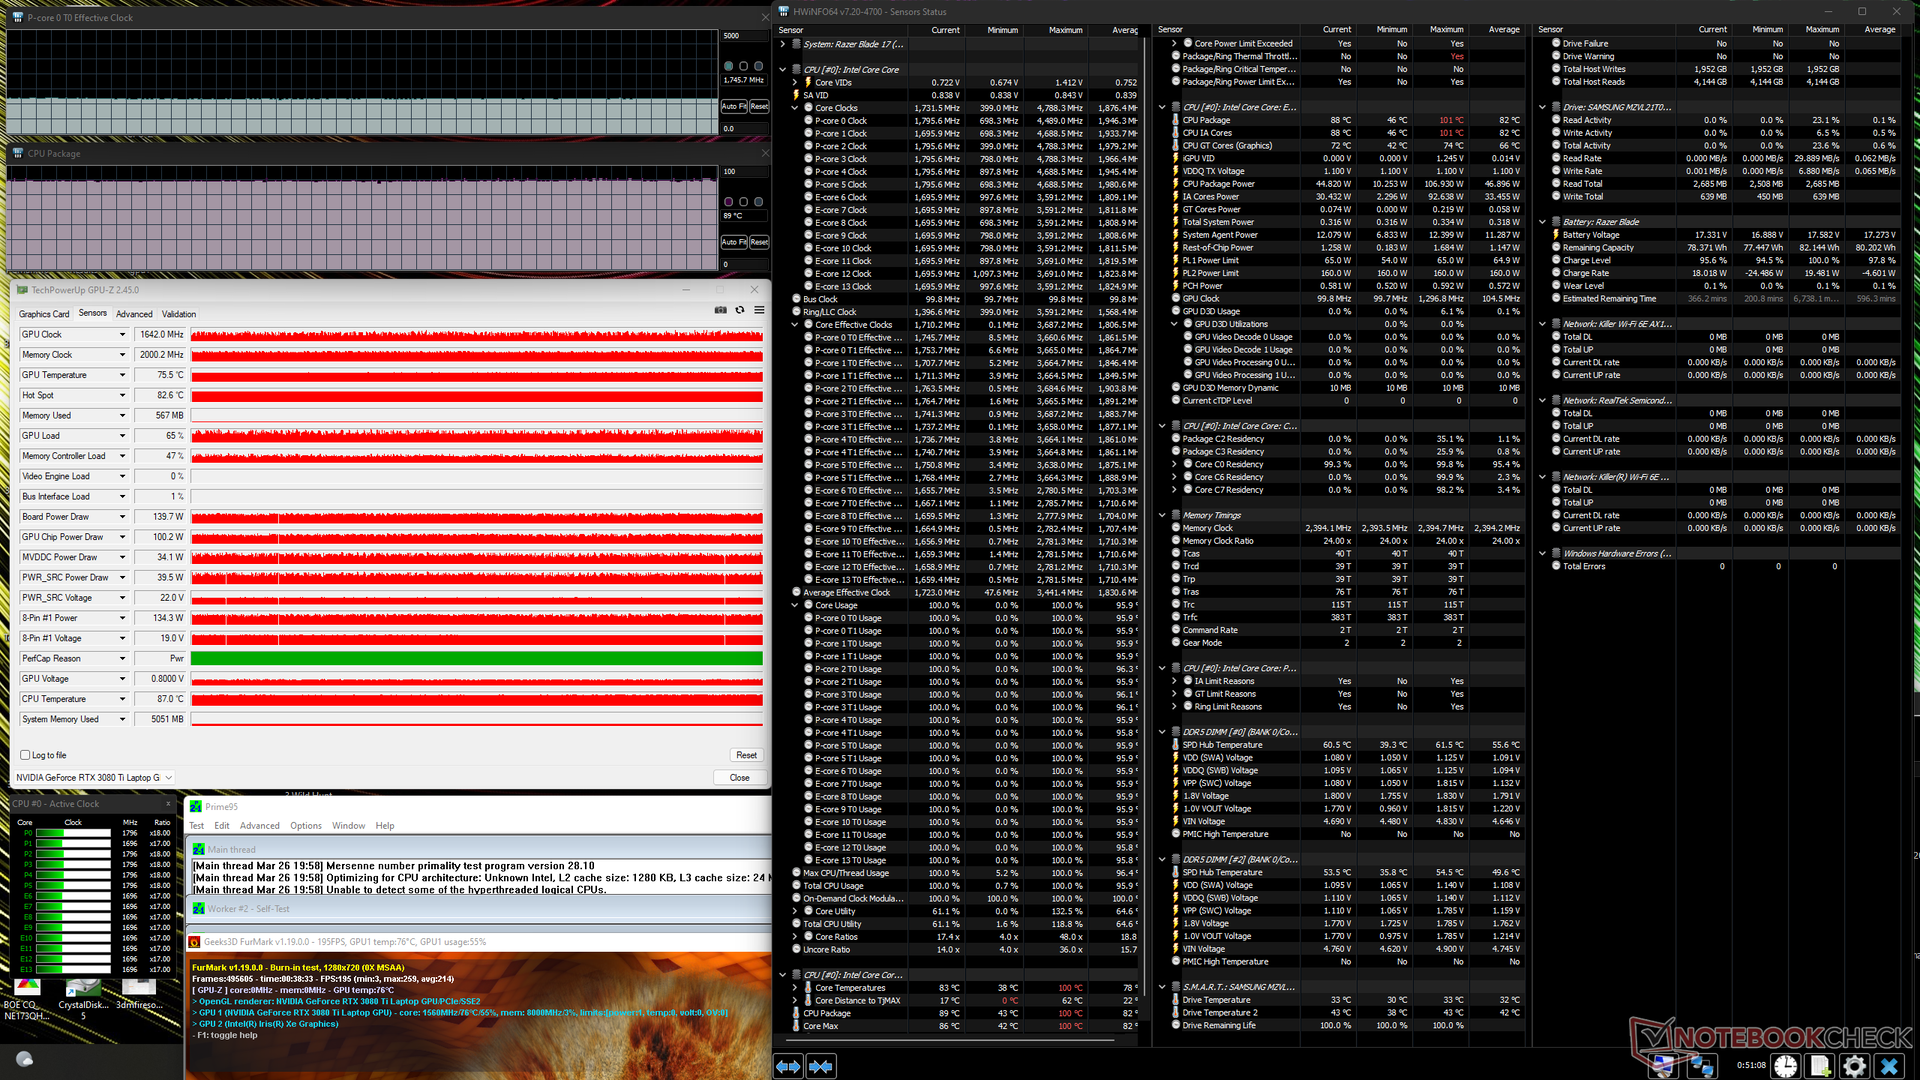
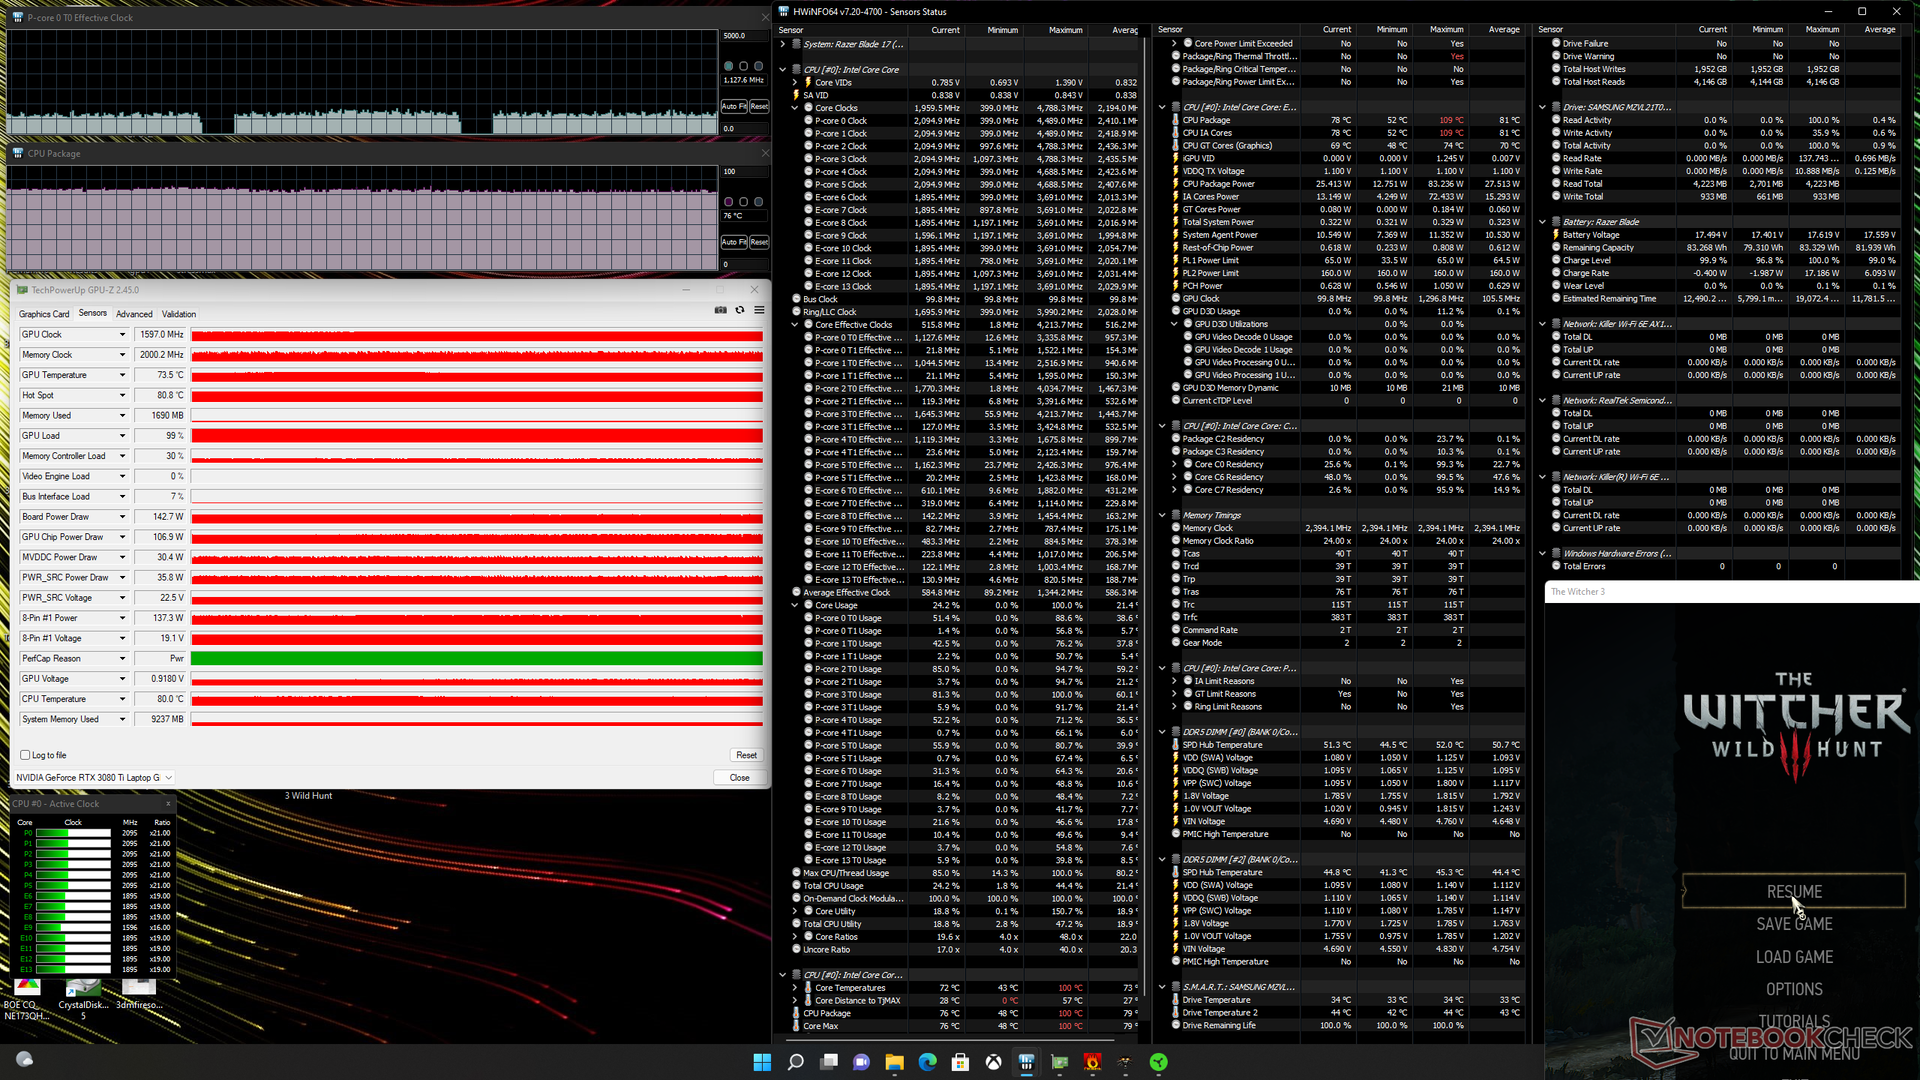
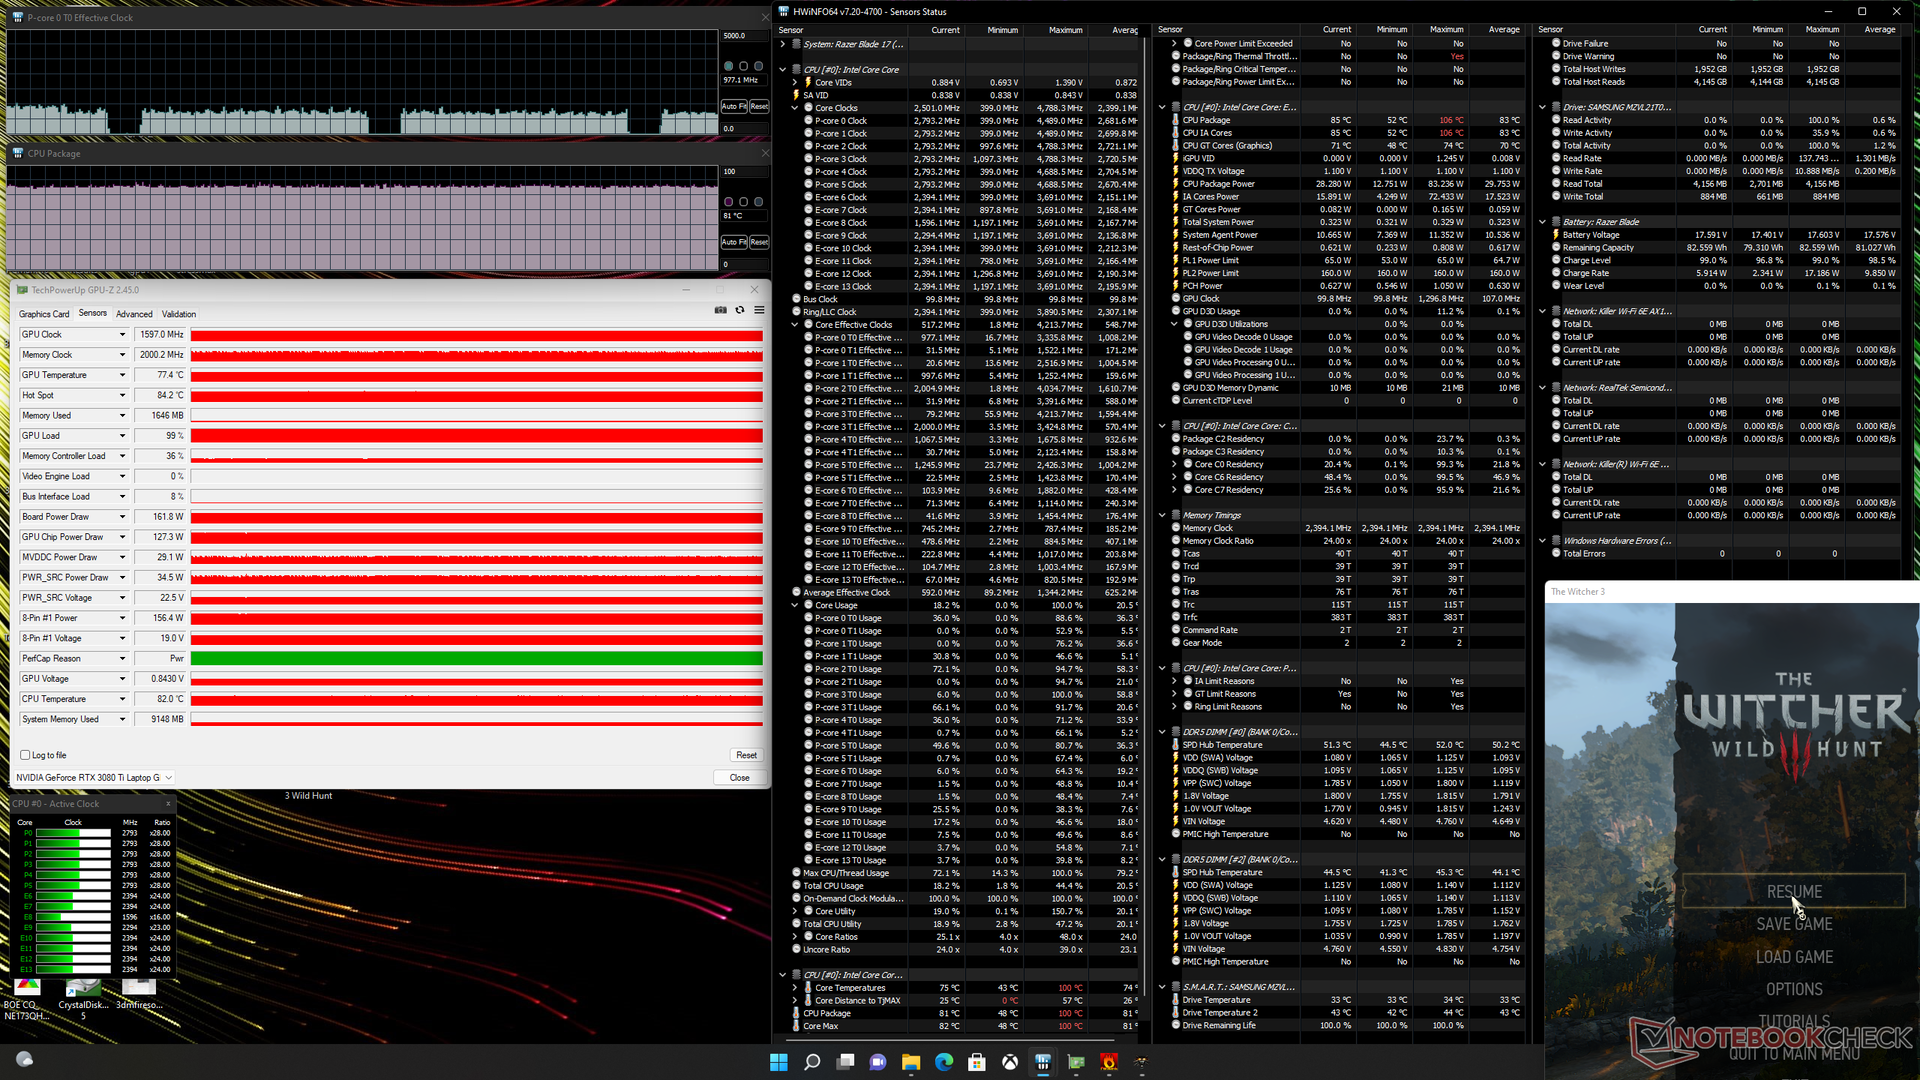
| Relógio CPU (GHz) | Relógio GPU (MHz) | Temperatura média da CPU (°C) | Temperatura média da GPU (°C) | |
| System Idle | -- | -- | 50 | 47 |
| Prime95 Stress | 2.4 - 2.6 | -- | 71 | 45 |
| Prime95 + FurMark Stress | 1.8 | ~1642 | 89 | 76 |
| Witcher 3 Stress (modo equilibrado) | ~1.1 | 1597 | 76 | 74 |
| Witcher 3 Stress (Modo de máximo desempenho) | ~1.1 | 1597 | 81 | 77 |
Oradores
Razer Blade 17 RTX 3080 Ti análise de áudio
(±) | o volume do alto-falante é médio, mas bom (###valor### dB)
Graves 100 - 315Hz
(±) | graves reduzidos - em média 6.7% menor que a mediana
(±) | a linearidade dos graves é média (8.3% delta para a frequência anterior)
Médios 400 - 2.000 Hz
(+) | médios equilibrados - apenas 2.1% longe da mediana
(+) | médios são lineares (4.3% delta para frequência anterior)
Altos 2 - 16 kHz
(+) | agudos equilibrados - apenas 0.7% longe da mediana
(+) | os máximos são lineares (1.7% delta da frequência anterior)
Geral 100 - 16.000 Hz
(+) | o som geral é linear (6.8% diferença em relação à mediana)
Comparado com a mesma classe
» 0% de todos os dispositivos testados nesta classe foram melhores, 0% semelhantes, 99% piores
» O melhor teve um delta de 6%, a média foi 18%, o pior foi 132%
Comparado com todos os dispositivos testados
» 1% de todos os dispositivos testados foram melhores, 0% semelhantes, 99% piores
» O melhor teve um delta de 4%, a média foi 23%, o pior foi 134%
Apple MacBook Pro 16 2021 M1 Pro análise de áudio
(+) | os alto-falantes podem tocar relativamente alto (###valor### dB)
Graves 100 - 315Hz
(+) | bons graves - apenas 3.8% longe da mediana
(+) | o baixo é linear (5.2% delta para a frequência anterior)
Médios 400 - 2.000 Hz
(+) | médios equilibrados - apenas 1.3% longe da mediana
(+) | médios são lineares (2.1% delta para frequência anterior)
Altos 2 - 16 kHz
(+) | agudos equilibrados - apenas 1.9% longe da mediana
(+) | os máximos são lineares (2.7% delta da frequência anterior)
Geral 100 - 16.000 Hz
(+) | o som geral é linear (4.6% diferença em relação à mediana)
Comparado com a mesma classe
» 0% de todos os dispositivos testados nesta classe foram melhores, 0% semelhantes, 100% piores
» O melhor teve um delta de 5%, a média foi 17%, o pior foi 45%
Comparado com todos os dispositivos testados
» 0% de todos os dispositivos testados foram melhores, 0% semelhantes, 100% piores
» O melhor teve um delta de 4%, a média foi 23%, o pior foi 134%
Gestão de energia
Consumo de energia - O mais alto ainda para a série Blade
O novo modelo está muito mais faminto de poder do que antes. Simplesmente ocioso na área de trabalho consumiria entre 30 W e 61 W, dependendo do ajuste de brilho e do perfil de potência, em comparação com quase metade do que na lâmina 17, MSI GS76, ou Asus ROG Zephyrus S17, de 2021. Na verdade, rodando Witcher 3 consumiria 30% mais energia para um aumento de 20 a 25% no desempenho gráfico e 25% no desempenho da CPU sobre o RTX 3070 e Core i7-11800H no 2021 Blade 17.
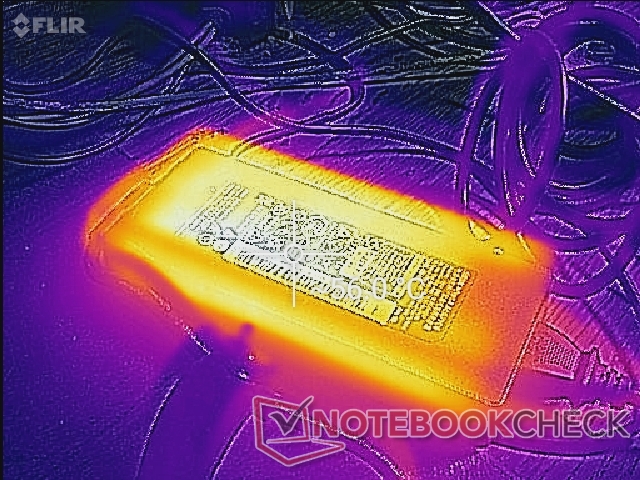
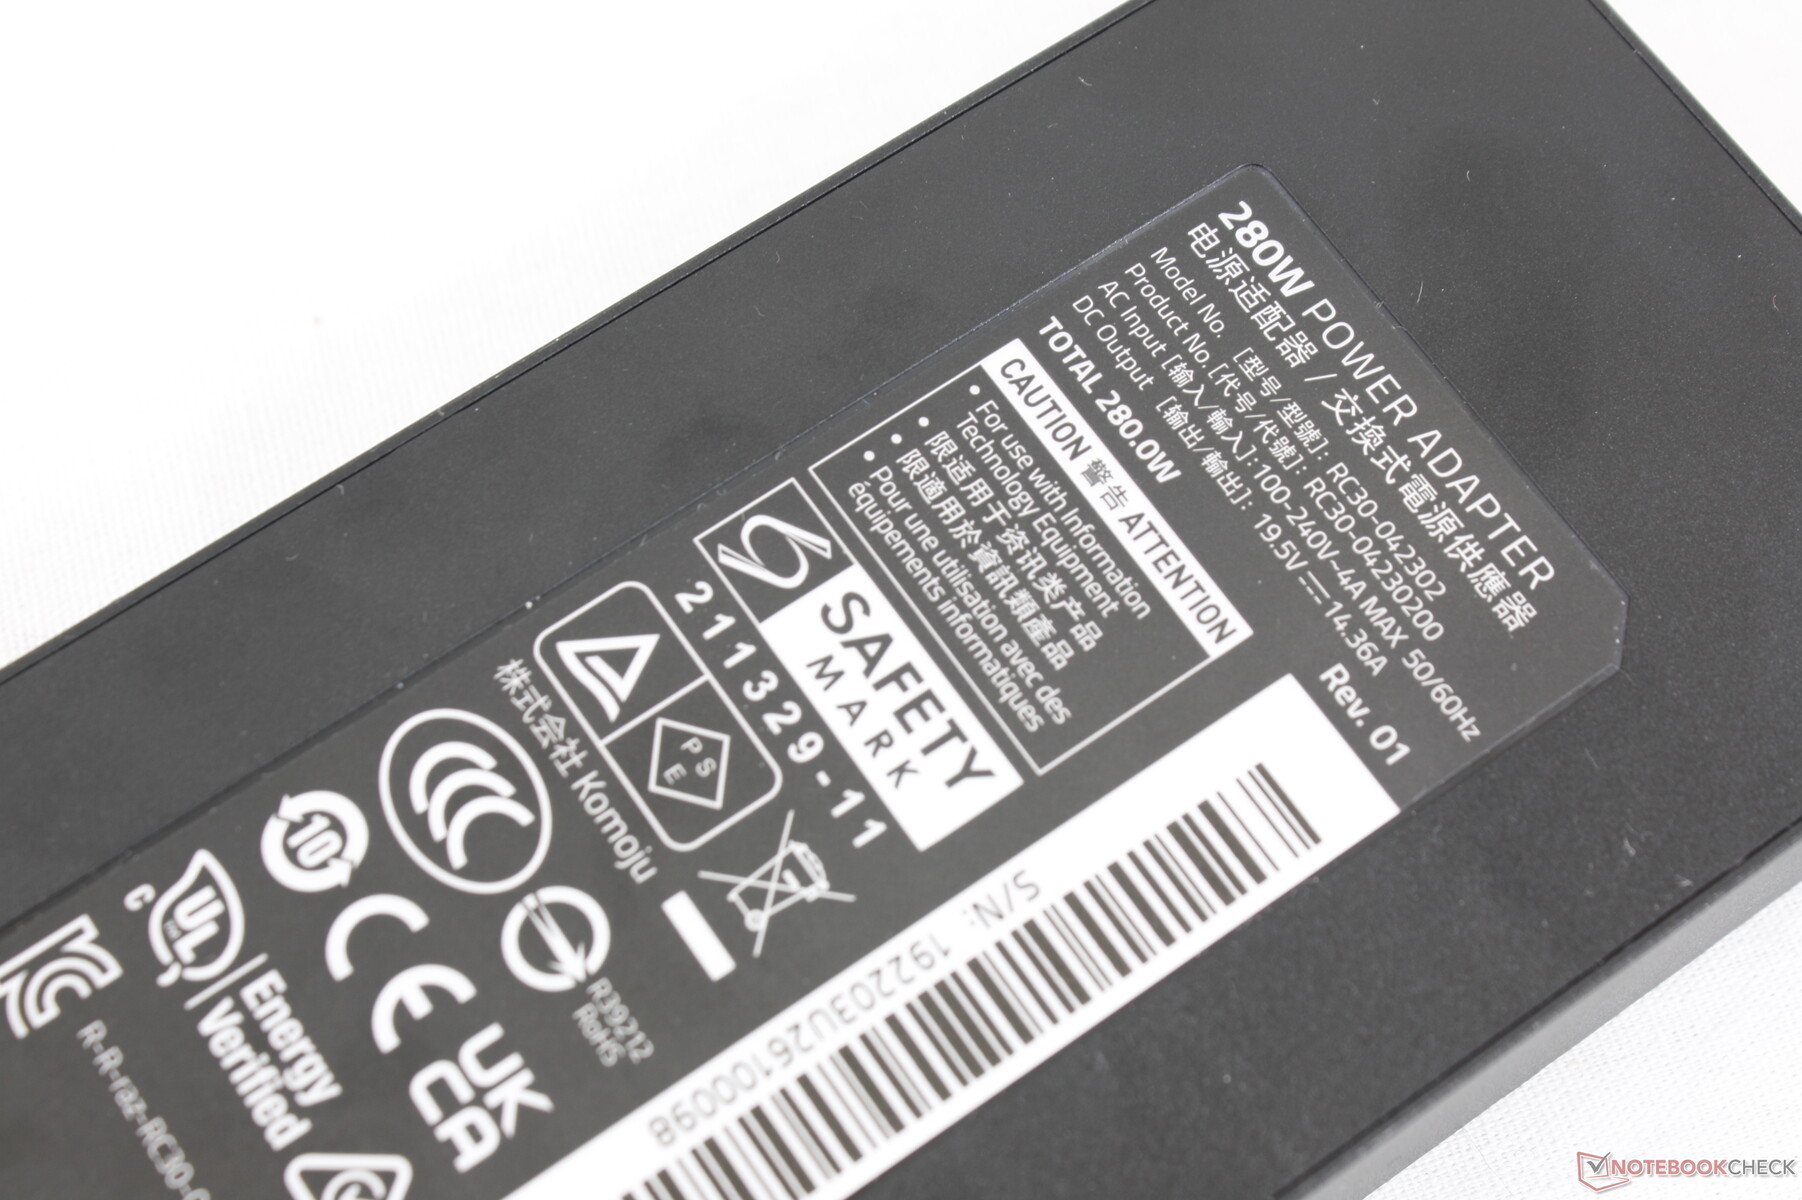
Para acomodar os processadores mais exigentes deste ano, o Blade 17 de 2022 é fornecido com um adaptador AC de 280 W de capacidade superior ao adaptador AC de 230 W que veio com o modelo 2021. Felizmente, o tamanho total do adaptador AC permaneceu praticamente o mesmo em todos os anos (~16,4 x 7 x 2,5 cm vs. ~17 x 7 x 2,5 cm) apesar da maior potência de saída.
| desligado | |
| Ocioso | |
| Carga |
|
Key:
min: | |
| Razer Blade 17 RTX 3080 Ti i7-12800H, GeForce RTX 3080 Ti Laptop GPU, Samsung PM9A1 MZVL21T0HCLR, IPS, 2560x1440, 17.3" | Razer Blade Pro 17 2021 (QHD Touch) i7-10875H, GeForce RTX 3080 Laptop GPU, Samsung PM981a MZVLB1T0HBLR, IPS, 3840x2160, 17.3" | MSI GS76 Stealth 11UH i9-11900H, GeForce RTX 3080 Laptop GPU, Samsung PM9A1 MZVL22T0HBLB, IPS, 3840x2160, 17.3" | Asus ROG Zephyrus S17 GX703HSD i9-11900H, GeForce RTX 3080 Laptop GPU, Samsung PM9A1 MZVL22T0HBLB, IPS, 2560x1440, 17.3" | Aorus 17G YD i7-11800H, GeForce RTX 3080 Laptop GPU, Samsung PM9A1 MZVL2512HCJQ, IPS, 1920x1080, 17.3" | Alienware x17 RTX 3080 P48E i7-11800H, GeForce RTX 3080 Laptop GPU, 2x WDC PC SN730 SDBPNTY-1T00 (RAID 0), IPS, 3840x2160, 17.3" | |
|---|---|---|---|---|---|---|
| Power Consumption | 34% | 38% | 27% | 27% | 24% | |
| Idle Minimum * (Watt) | 29.8 | 15.2 49% | 14 53% | 21.7 27% | 24 19% | 10.2 66% |
| Idle Average * (Watt) | 37.1 | 20.3 45% | 19 49% | 27 27% | 26 30% | 21.2 43% |
| Idle Maximum * (Watt) | 60.8 | 37.3 39% | 31 49% | 33 46% | 38 37% | 48.4 20% |
| Load Average * (Watt) | 135.3 | 114.9 15% | 97 28% | 108 20% | 101 25% | 118.7 12% |
| Witcher 3 ultra * (Watt) | 243 | 158.4 35% | 156 36% | 195 20% | 164 33% | 249 -2% |
| Load Maximum * (Watt) | 273.1 | 223.7 18% | 231 15% | 210 23% | 230 16% | 262 4% |
* ... menor é melhor
Power Consumption Witcher 3 / Stresstest
Power Consumption external Monitor
Vida Útil da Bateria - Ano de Ano Pleno
A capacidade da bateria é maior do que a da lâmina 17 de 2021 devido à remoção do quarto ventilador. Os tempos de funcionamento não são melhores, no entanto, já que a CPU e a GPU mais novas são mais exigentes desta vez. Notamos resultados similares entre 2021 e 2021 2022 Lâmina 15 modelos também.
O carregamento do vazio para o cheio com o adaptador AC incluído leva cerca de 90 minutos. O carregamento USB-C é suportado ao contrário do Asus TUF Gaming F15.
| Razer Blade 17 RTX 3080 Ti i7-12800H, GeForce RTX 3080 Ti Laptop GPU, 82 Wh | Razer Blade Pro 17 2021 (QHD Touch) i7-10875H, GeForce RTX 3080 Laptop GPU, 70.5 Wh | MSI GS76 Stealth 11UH i9-11900H, GeForce RTX 3080 Laptop GPU, 99.9 Wh | Asus ROG Zephyrus S17 GX703HSD i9-11900H, GeForce RTX 3080 Laptop GPU, 90 Wh | Aorus 17G YD i7-11800H, GeForce RTX 3080 Laptop GPU, 99 Wh | Alienware x17 RTX 3080 P48E i7-11800H, GeForce RTX 3080 Laptop GPU, 87 Wh | |
|---|---|---|---|---|---|---|
| Duração da bateria | 19% | 19% | 91% | 22% | -11% | |
| Reader / Idle (h) | 8 | 9.9 24% | 9.9 24% | 9 13% | 7 -12% | |
| WiFi v1.3 (h) | 5.5 | 5.9 7% | 6.4 16% | 7.5 36% | 6 9% | 5.9 7% |
| Load (h) | 1.1 | 1.4 27% | 1.3 18% | 2.7 145% | 1.6 45% | 0.8 -27% |
| H.264 (h) | 7.2 | 6.2 | ||||
| Witcher 3 ultra (h) | 1 |
Pro
Contra
Veredicto - Mais Watts, Mais Poder
O desenho da lâmina 17 foi introduzido em 2019 com gráficos de 100 W GeForce. Esta atualização de 2022 transporta uma GPU ainda mais potente de 165 W sem nenhuma mudança significativa no tamanho ou design do chassi. O desempenho melhorou, é claro, mas o maior consumo de energia em geral implica em temperaturas mais altas, um tijolo de potência mais densa e, em geral, uma duração de bateria mais curta do que os modelos anteriores da Lâmina 17 com processadores mais antigos.
Felizmente, a Razer ajustou alguns aspectos do modelo 2022 para compensar suas maiores exigências de potência. A bateria interna, por exemplo, é maior, embora às custas de um ventilador inteiro que, de outra forma, teria ajudado no resfriamento. Enquanto isso, o adaptador AC de 280 W frequentemente negligenciado é um dos menores e mais leves que já vimos quando comparado a outros adaptadores de alta capacidade para facilitar um pouco as viagens com o Blade 17. O fabricante estava bem ciente dos componentes cada vez mais ávidos de energia durante o desenvolvimento e tomou medidas para aliviar alguns dos inevitáveis inconvenientes.
Ao se concentrar tão fortemente no desempenho, a GPU de 165 W da Razer é capaz de superar a maioria dos outros laptops equipados com a mesma GPU. Outros laptops ultramarinos tendem a ter objetivos TGP mais baixos do que a lâmina 17 para um desempenho consistentemente mais lento. A Blade 17 de 2022 é, portanto, uma das melhores recomendações para os jogadores que desejam maximizar o desempenho gráfico móvel sem se contentar com opções mais espessas como a série MSI GT ou uma Quimera Asus ROG. Talvez os futuros modelos Blade 17 possam incorporar o resfriamento de metal líquido para melhorar as temperaturas.
Preço e Disponibilidade
A Razer está agora vendendo https://www.razer.com/shop/pc/gaming-laptops?query=:newest:category:system-laptops:system-display:17%2Binch nossa configuração conforme revista por aproximadamente $4000 USD. A Amazon e a Best Buy não têm estoque até esta redação.
Razer Blade 17 RTX 3080 Ti
- 07/05/2022 v7 (old)
Allen Ngo
Price comparison

