Revisão Dell Inspiron 16 Plus 7610: Mais desempenho sem Nvidia?

Um Inspiron 16 Plus 7610 sem a placa gráfica Nvidia seria talvez melhor para mim como um não jogador do que a versão dGPU? Adquirimos um Inspiron 16 Plus 7610 MHJ8F com uma placa gráfica dGPU?i7-11800H16 GB de RAM e 512-GB SSD para responder exatamente a esta pergunta. No teste doInspiron 16 Plus 7610 com RTXnossos colegas haviam reclamado sobre o desenvolvimento do desempenho abaixo da média do processador. Então, o Core i7 agora tem mais espaço de manobra em termos de resfriamento? O desenvolvimento de calor talvez seja menor ou a vida útil da bateria mais longa? Descobrimos as respostas neste teste
Possible Competitors in Comparison
Avaliação | Data | Modelo | Peso | Altura | Size | Resolução | Preço |
|---|---|---|---|---|---|---|---|
| 82.6 % v7 (old) | 11/2021 | Dell Inspiron 16 Plus 7610-MHJ8F i7-11800H, UHD Graphics Xe 32EUs (Tiger Lake-H) | 2 kg | 19 mm | 16.00" | 3072x1920 | |
| 86.7 % v7 (old) | 08/2021 | Dell Inspiron 16 Plus 7610 i7-11800H, GeForce RTX 3050 4GB Laptop GPU | 2 kg | 18.99 mm | 16.00" | 3072x1920 | |
| 86.3 % v7 (old) | 06/2021 | LG Gram 16 (2021) i7-1165G7, Iris Xe G7 96EUs | 1.2 kg | 16.8 mm | 16.00" | 2560x1600 | |
| 87.4 % v7 (old) | 08/2021 | Lenovo Legion 5 Pro 16ACH6H (82JQ001PGE) R7 5800H, GeForce RTX 3070 Laptop GPU | 2.6 kg | 26.85 mm | 16.00" | 2560x1600 | |
| 82.4 % v7 (old) | 01/2021 | Dell Inspiron 15 7000 7506 2-in-1 Black Edition i7-1165G7, Xe MAX | 1.9 kg | 17.94 mm | 15.60" | 3840x2160 | |
| 82.7 % v7 (old) | 03/2021 | Acer Aspire 5 A517-52G-79Z5 i7-1165G7, GeForce MX350 | 2.2 kg | 19.9 mm | 17.30" | 1920x1080 |
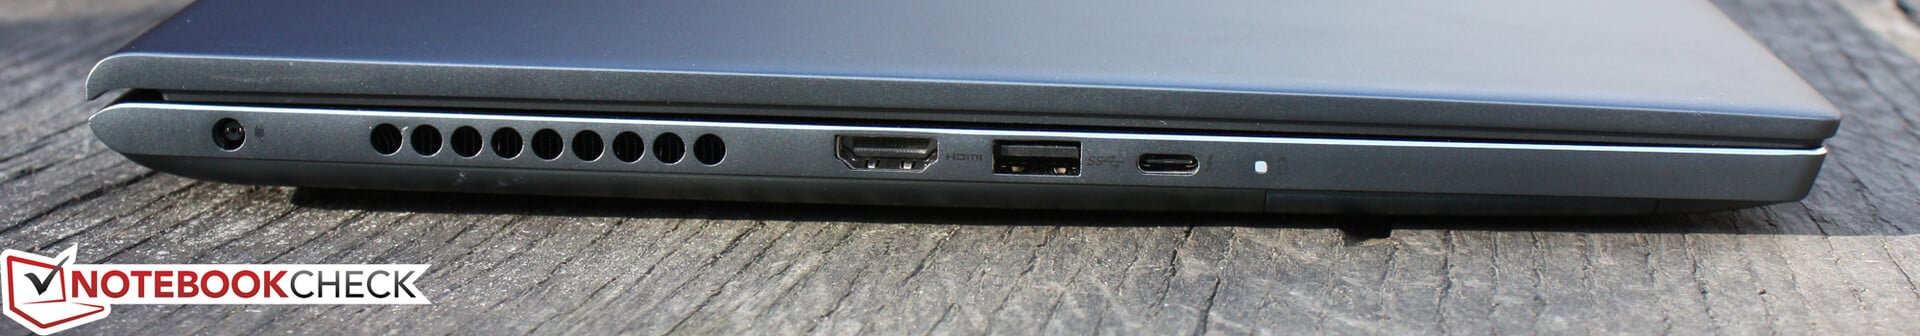
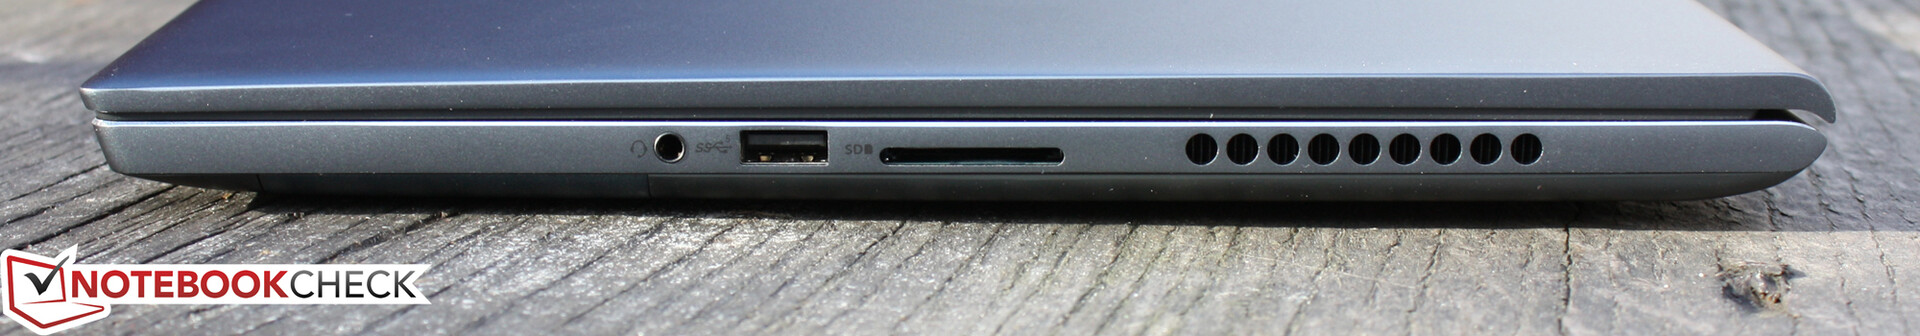
Estojo e equipamento
Você pode encontrar todos os detalhes sobre este assunto em nosso teste completo do Dell Inspiron 16 Plus 7610Versão GPU.


| SD Card Reader | |
| average JPG Copy Test (av. of 3 runs) | |
| Média da turma Multimedia (23 - 531, n=36, últimos 2 anos) | |
| LG Gram 16 (2021) (Toshiba Exceria Pro M501 microSDXC 64GB) | |
| Dell Inspiron 15 7000 7506 2-in-1 Black Edition (Toshiba Exceria Pro M501 microSDXC 32GB) | |
| Dell Inspiron 16 Plus 7610-MHJ8F (AV Pro SD microSD 128 GB V60) | |
| Dell Inspiron 16 Plus 7610 (AV PRO microSD 128 GB V60) | |
| maximum AS SSD Seq Read Test (1GB) | |
| Média da turma Multimedia (37.3 - 1455, n=35, últimos 2 anos) | |
| LG Gram 16 (2021) (Toshiba Exceria Pro M501 microSDXC 64GB) | |
| Dell Inspiron 15 7000 7506 2-in-1 Black Edition (Toshiba Exceria Pro M501 microSDXC 32GB) | |
| Dell Inspiron 16 Plus 7610-MHJ8F (AV Pro SD microSD 128 GB V60) | |
| Dell Inspiron 16 Plus 7610 (AV PRO microSD 128 GB V60) | |

, i7-11800H, OM3PDP3-AD NVMe KDI 512GB")
, i7-11800H, OM3PDP3-AD NVMe KDI 512GB")
Display - Boas cores, brilho aceitável e tempos de resposta lentos

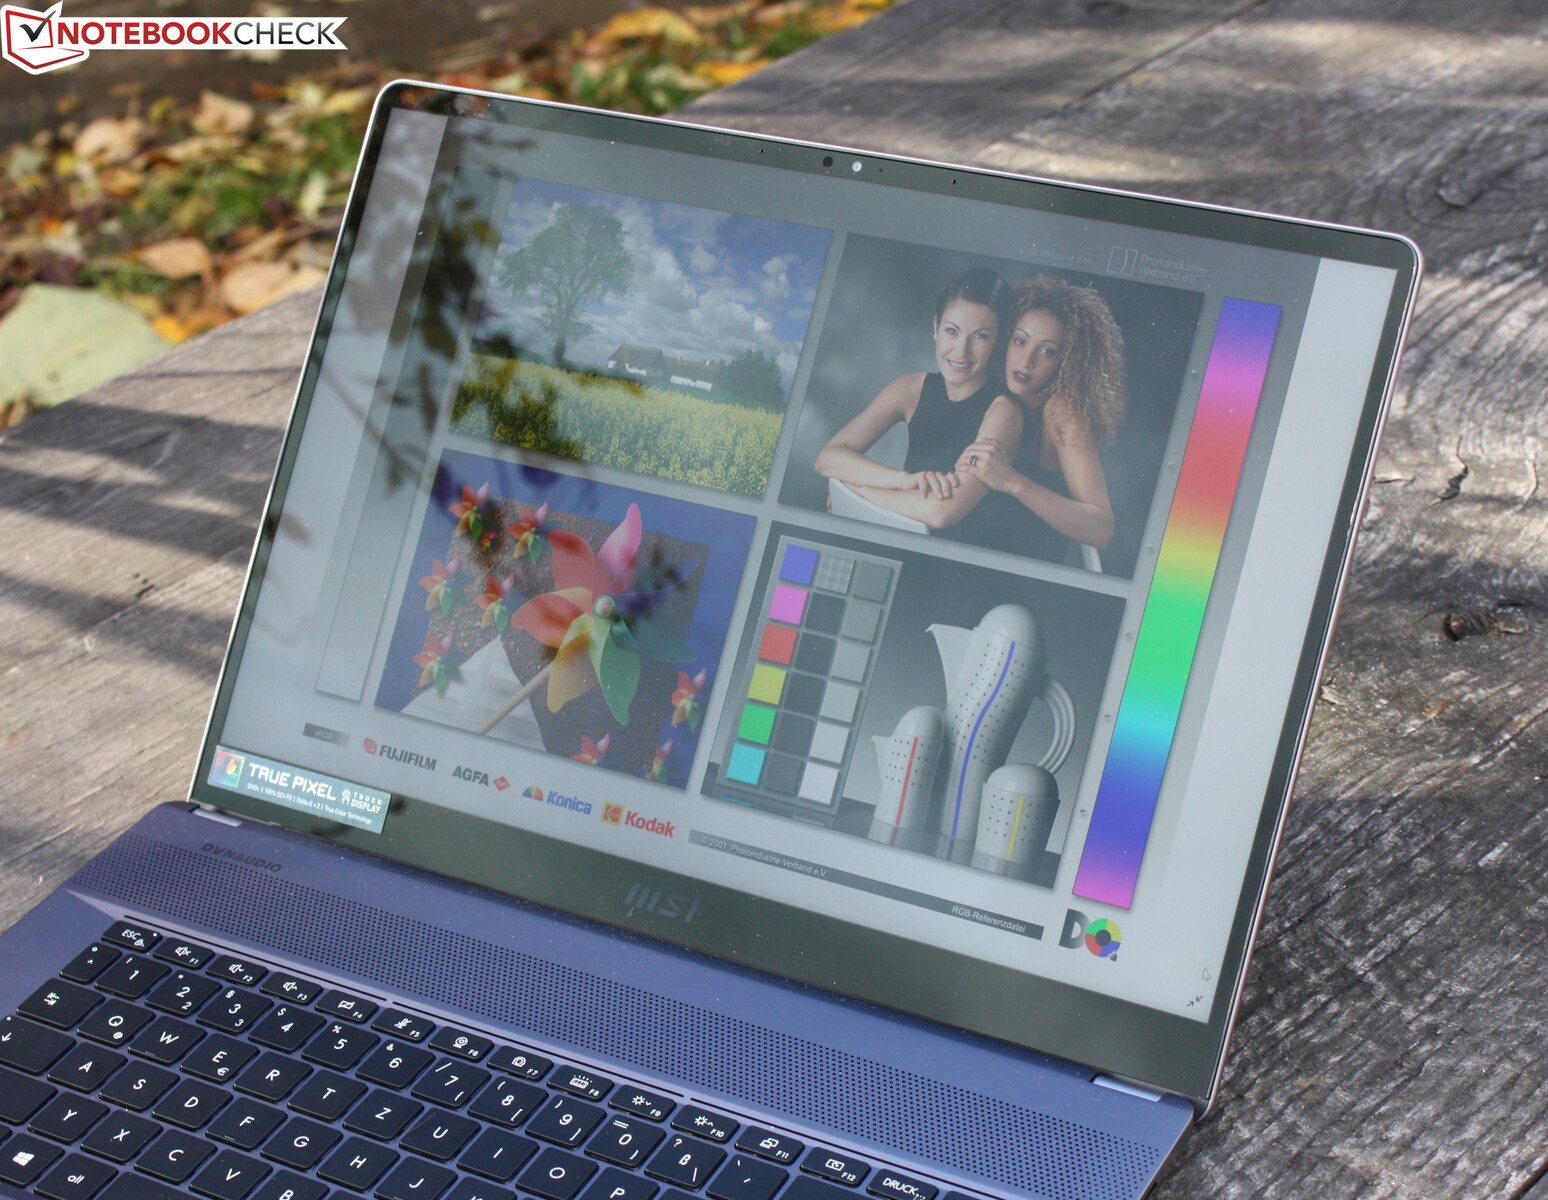
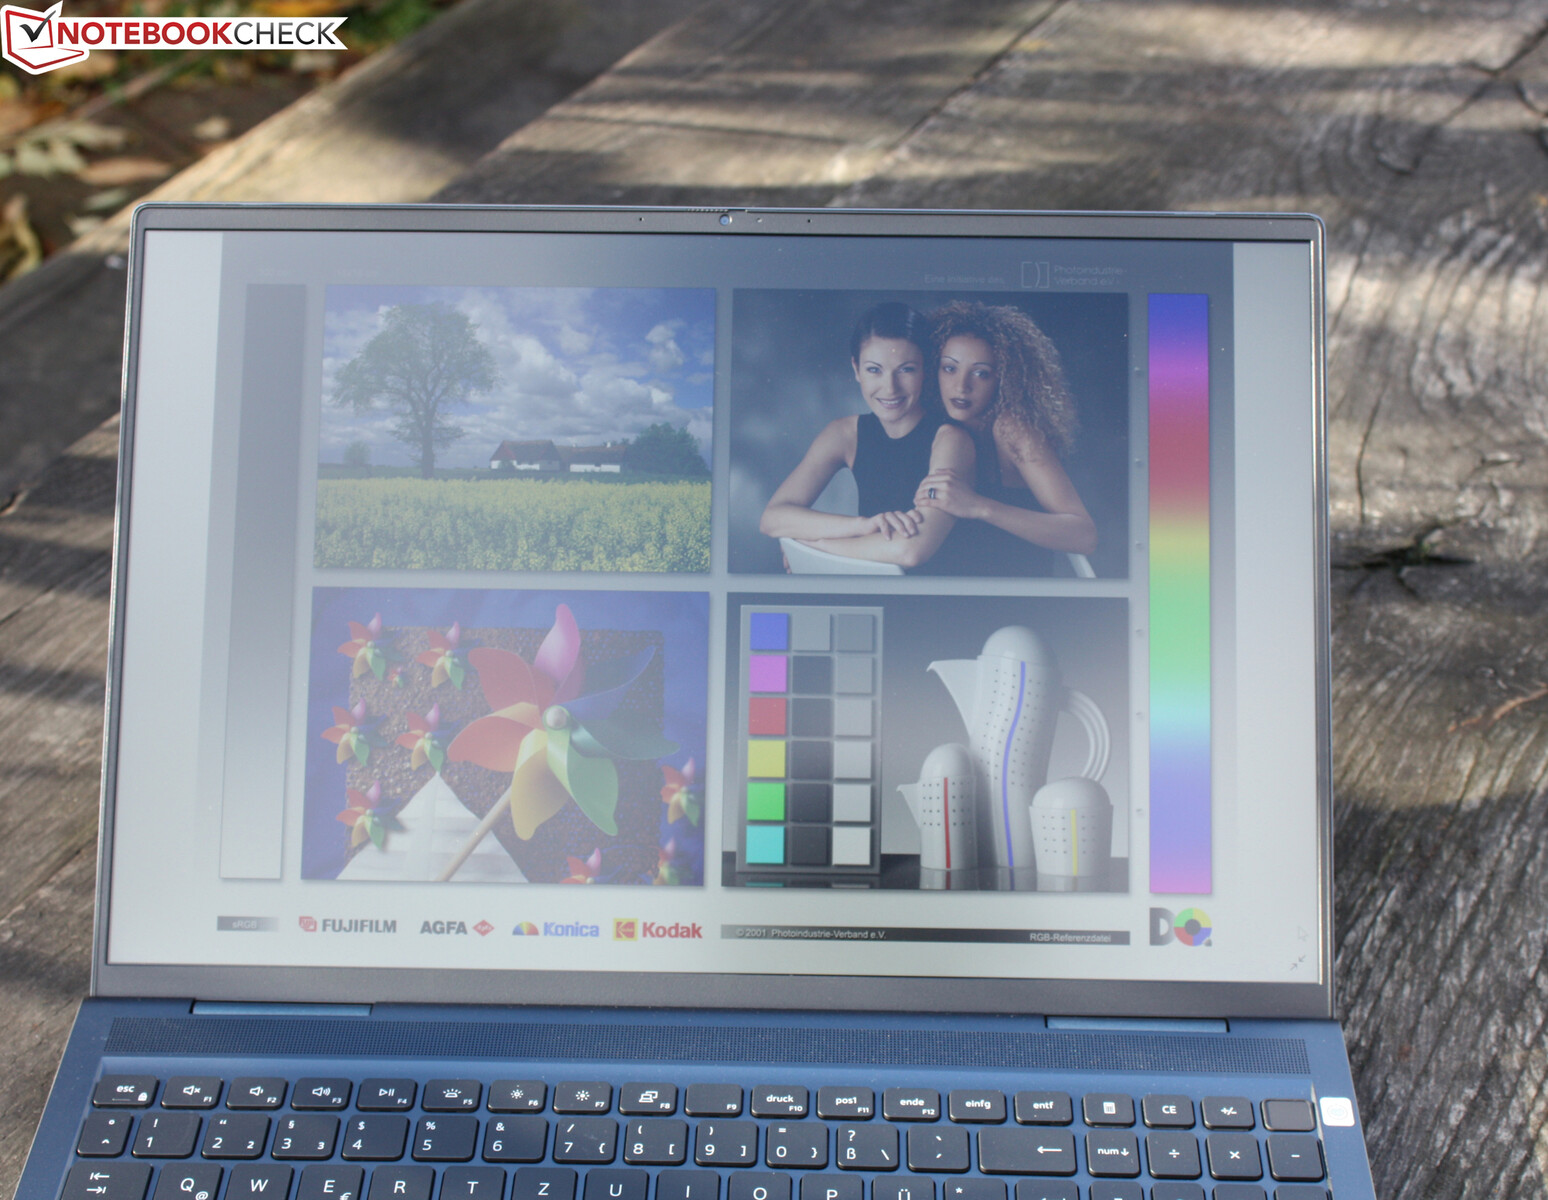
Nossa unidade de teste também usa o painel IPS 3K AU Optronics B160QAN, que aparentemente é o padrão para todos os modelos 7610. A resolução é idêntica à do MacBook Pro 16. Como o DPI fica quase tão alto quanto em um display de 4K, talvez seja necessário ajustar a escala do texto para melhorar a legibilidade.
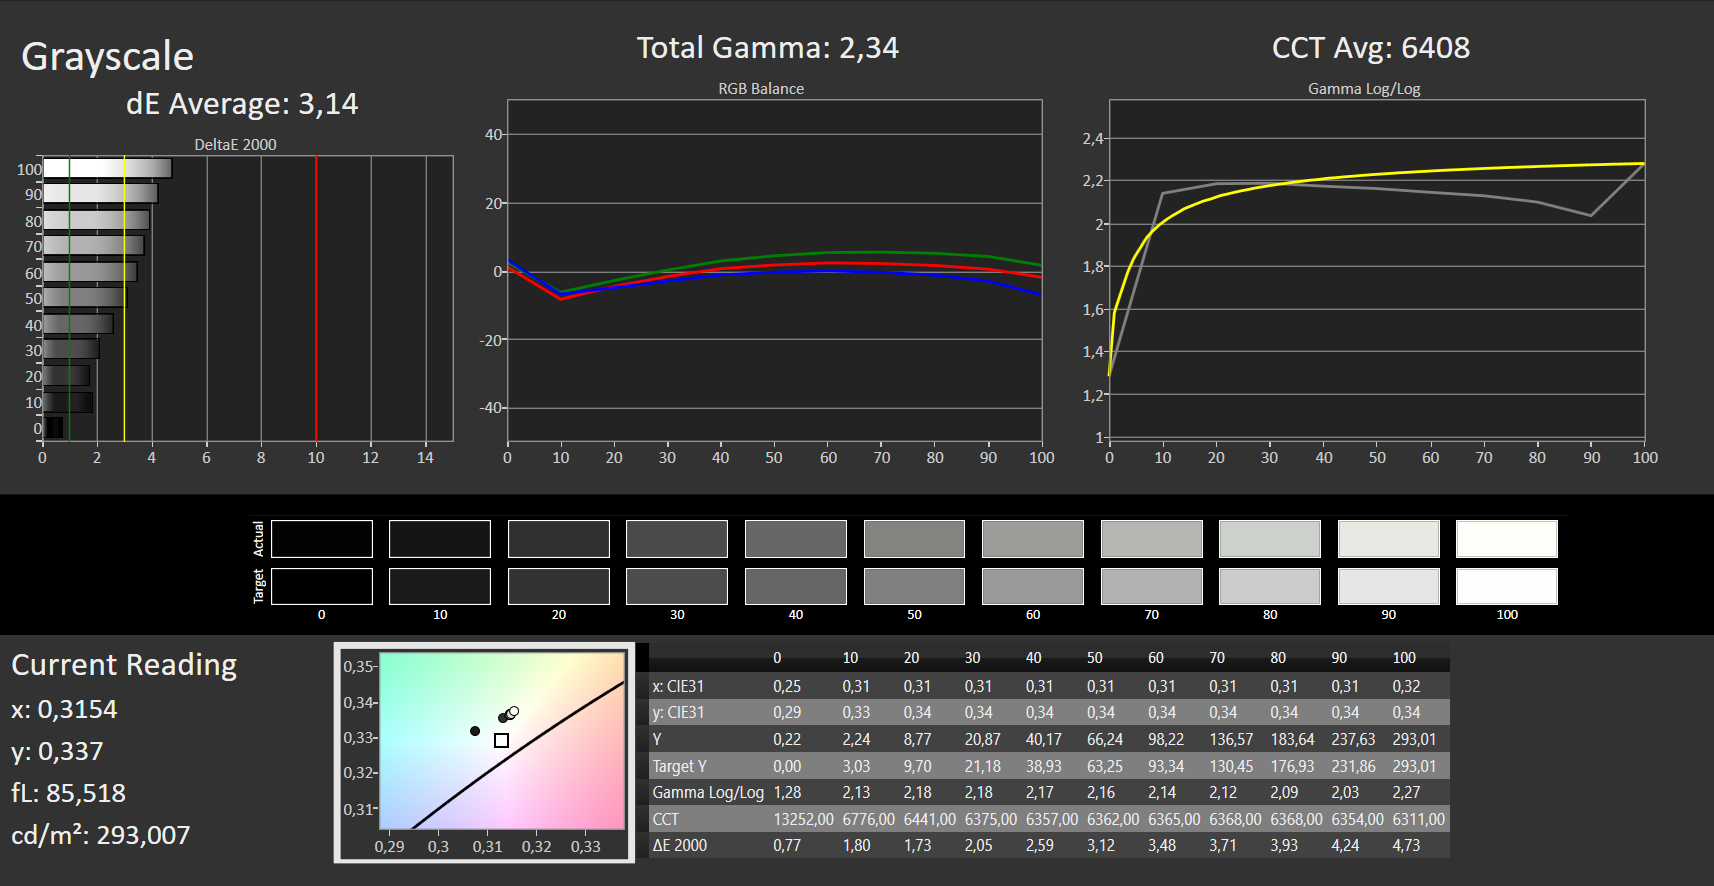
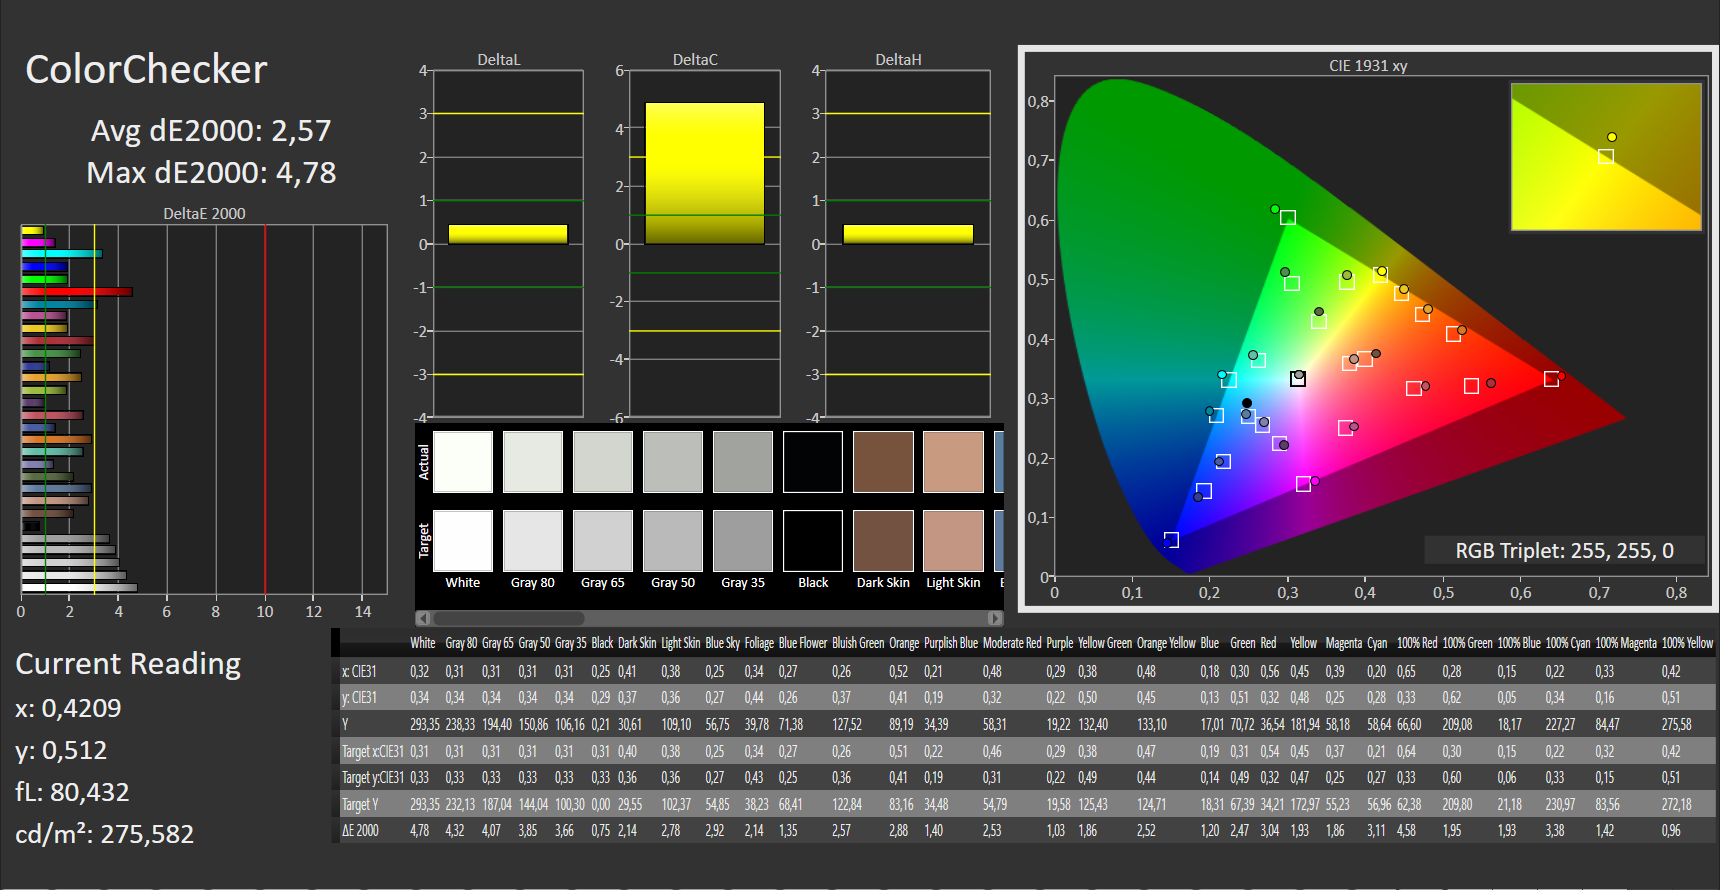
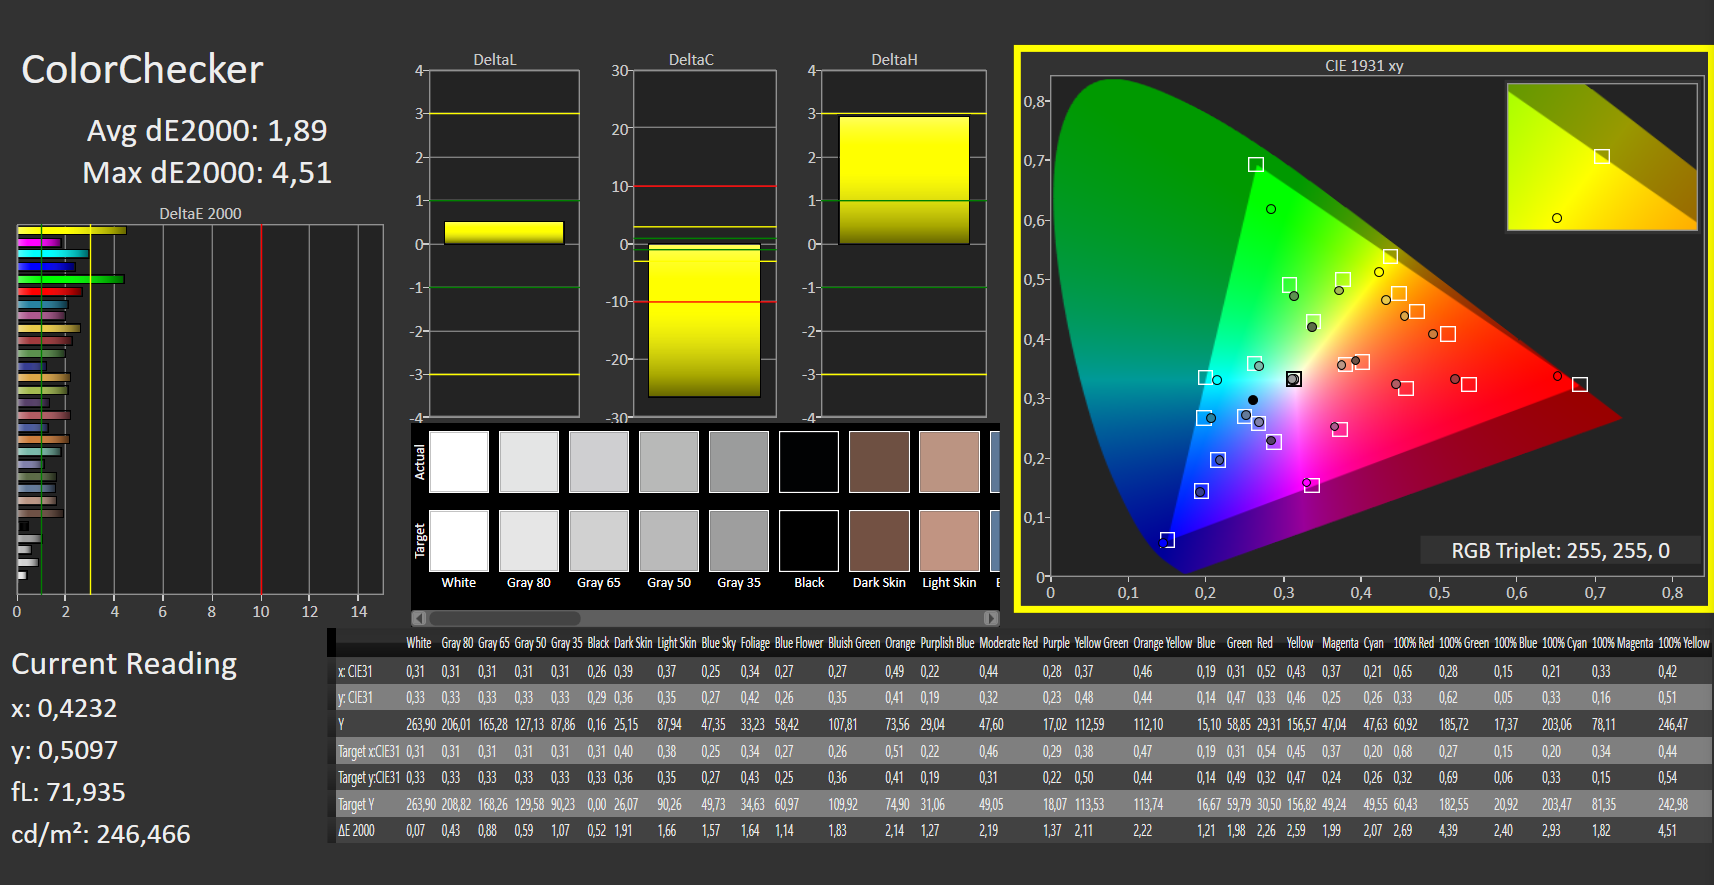
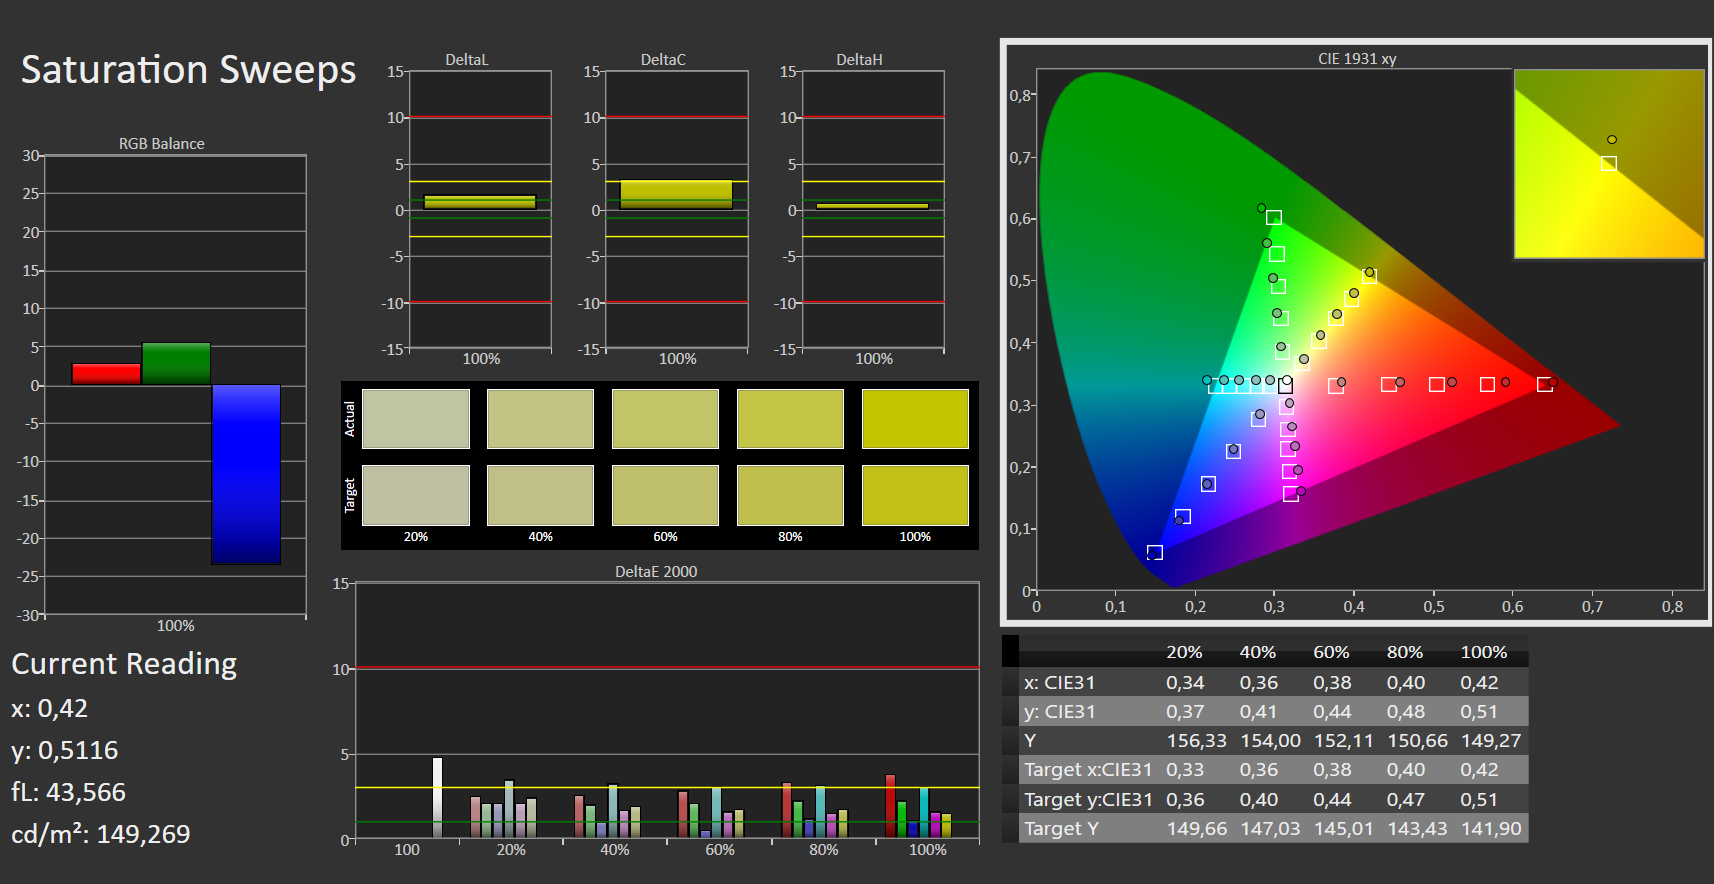
Devido à construção idêntica do painel como no modelo Geforce, os mesmos pontos também são válidos aqui: a qualidade da tela é boa mas não excelente, a relação de contraste é de quase 1400:1, os desvios DeltaE são baixos, e o sRGB é coberto - mas não o espaço de cor Adobe. O Inspiron 16 se distingue por seus tempos de resposta lentos dos laptops de 16 polegadas, como o Legion 5 Pro, que oferece tempos de resposta significativamente mais rápidos. Em comparação com os concorrentes, o brilho é moderado, mas uniformemente distribuído. Não há PWM.
| |||||||||||||||||||||||||
iluminação: 88 %
iluminação com acumulador: 275 cd/m²
Contraste: 1381:1 (Preto: 0.21 cd/m²)
ΔE ColorChecker Calman: 2.57 | ∀{0.5-29.43 Ø4.71}
calibrated: 1.89
ΔE Greyscale Calman: 3.14 | ∀{0.09-98 Ø4.96}
76% AdobeRGB 1998 (Argyll 3D)
100% sRGB (Argyll 3D)
75% Display P3 (Argyll 3D)
Gamma: 2.34
CCT: 6408 K
| Dell Inspiron 16 Plus 7610-MHJ8F AU Optronics B160QAN, AUO9F91, IPS, 3072x1920, 16" | Dell Inspiron 16 Plus 7610 AU Optronics B160QAN, IPS, 3072x1920, 16" | LG Gram 16 (2021) LG Philips LP160WQ1-SPA1, IPS, 2560x1600, 16" | Lenovo Legion 5 Pro 16ACH6H (82JQ001PGE) CSOT T3 MNG007DA1-1, IPS, 2560x1600, 16" | Dell Inspiron 15 7000 7506 2-in-1 Black Edition AU Optronics B156ZAN, IPS, 3840x2160, 15.6" | Acer Aspire 5 A517-52G-79Z5 BOE084E, IPS, 1920x1080, 17.3" | |
|---|---|---|---|---|---|---|
| Display | -1% | 13% | -3% | -1% | -45% | |
| Display P3 Coverage (%) | 75 | 74.1 -1% | 95.8 28% | 74.3 -1% | 39.98 -47% | |
| sRGB Coverage (%) | 100 | 99.4 -1% | 99.8 0% | 99 -1% | 99 -1% | 59.3 -41% |
| AdobeRGB 1998 Coverage (%) | 76 | 75.8 0% | 83.8 10% | 73 -4% | 74.6 -2% | 41.3 -46% |
| Response Times | -3% | 28% | 84% | -4% | 75% | |
| Response Time Grey 50% / Grey 80% * (ms) | 54 ? | 49.2 ? 9% | 44 ? 19% | 9.2 ? 83% | 55.2 ? -2% | 14 ? 74% |
| Response Time Black / White * (ms) | 32 ? | 36.8 ? -15% | 20 ? 37% | 4.8 85% | 34 ? -6% | 8 ? 75% |
| PWM Frequency (Hz) | ||||||
| Screen | 3% | -39% | 13% | -33% | -24% | |
| Brightness middle (cd/m²) | 290 | 296.8 2% | 331 14% | 551 90% | 303.8 5% | 321 11% |
| Brightness (cd/m²) | 285 | 292 2% | 309 8% | 523 84% | 296 4% | 282 -1% |
| Brightness Distribution (%) | 88 | 87 -1% | 88 0% | 88 0% | 93 6% | 81 -8% |
| Black Level * (cd/m²) | 0.21 | 0.21 -0% | 0.22 -5% | 0.54 -157% | 0.24 -14% | 0.36 -71% |
| Contrast (:1) | 1381 | 1413 2% | 1505 9% | 1020 -26% | 1266 -8% | 892 -35% |
| Colorchecker dE 2000 * | 2.57 | 2.56 -0% | 4.64 -81% | 1.8 30% | 4.58 -78% | 4.3 -67% |
| Colorchecker dE 2000 max. * | 4.78 | 4.76 -0% | 9.82 -105% | 2.53 47% | 9.4 -97% | 7.1 -49% |
| Colorchecker dE 2000 calibrated * | 1.89 | 1.86 2% | 3.16 -67% | 1.66 12% | 2.17 -15% | |
| Greyscale dE 2000 * | 3.14 | 2.6 17% | 6.9 -120% | 1.85 41% | 6.4 -104% | 2.26 28% |
| Gamma | 2.34 94% | 2.07 106% | 2.34 94% | 2.3 96% | 2.3 96% | 2.36 93% |
| CCT | 6408 101% | 6628 98% | 7904 82% | 6338 103% | 7414 88% | 6650 98% |
| Color Space (Percent of AdobeRGB 1998) (%) | 75.1 | 72.81 | 66.7 | 38 | ||
| Color Space (Percent of sRGB) (%) | 100 | 99.41 | 99 | 59 | ||
| Média Total (Programa/Configurações) | -0% /
1% | 1% /
-18% | 31% /
22% | -13% /
-22% | 2% /
-14% |
* ... menor é melhor


Exibir tempos de resposta
| ↔ Tempo de resposta preto para branco | ||
|---|---|---|
| 32 ms ... ascensão ↗ e queda ↘ combinadas | ↗ 15 ms ascensão |  |
| ↘ 17 ms queda | ||
| A tela mostra taxas de resposta lentas em nossos testes e será insatisfatória para os jogadores. Em comparação, todos os dispositivos testados variam de 0.1 (mínimo) a 240 (máximo) ms. » 86 % de todos os dispositivos são melhores. Isso significa que o tempo de resposta medido é pior que a média de todos os dispositivos testados (19.8 ms). | ||
| ↔ Tempo de resposta 50% cinza a 80% cinza | ||
| 54 ms ... ascensão ↗ e queda ↘ combinadas | ↗ 24 ms ascensão |  |
| ↘ 30 ms queda | ||
| A tela mostra taxas de resposta lentas em nossos testes e será insatisfatória para os jogadores. Em comparação, todos os dispositivos testados variam de 0.165 (mínimo) a 636 (máximo) ms. » 91 % de todos os dispositivos são melhores. Isso significa que o tempo de resposta medido é pior que a média de todos os dispositivos testados (30.9 ms). | ||
Cintilação da tela / PWM (modulação por largura de pulso)
| Tela tremeluzindo / PWM não detectado |  | ||
[pwm_comparison] Em comparação: 52 % de todos os dispositivos testados não usam PWM para escurecer a tela. Se PWM foi detectado, uma média de 7744 (mínimo: 5 - máximo: 343500) Hz foi medida. | |||
Desempenho
Como padrão, as CPUs H da Intel Tiger Lake (11400H, 11800H) e, opcionalmente, um GeForce RTX 3050 ou RTX 3060são utilizados. Embora nossa unidade de teste não tenha um dGPU, ela não é bem de baixo nível com seus 16 GB de RAM. No momento do teste, não há modelos AMD.
Condições de teste
As referências foram executadas em operação de rede utilizando o perfil de desempenho mais alto.
Processador
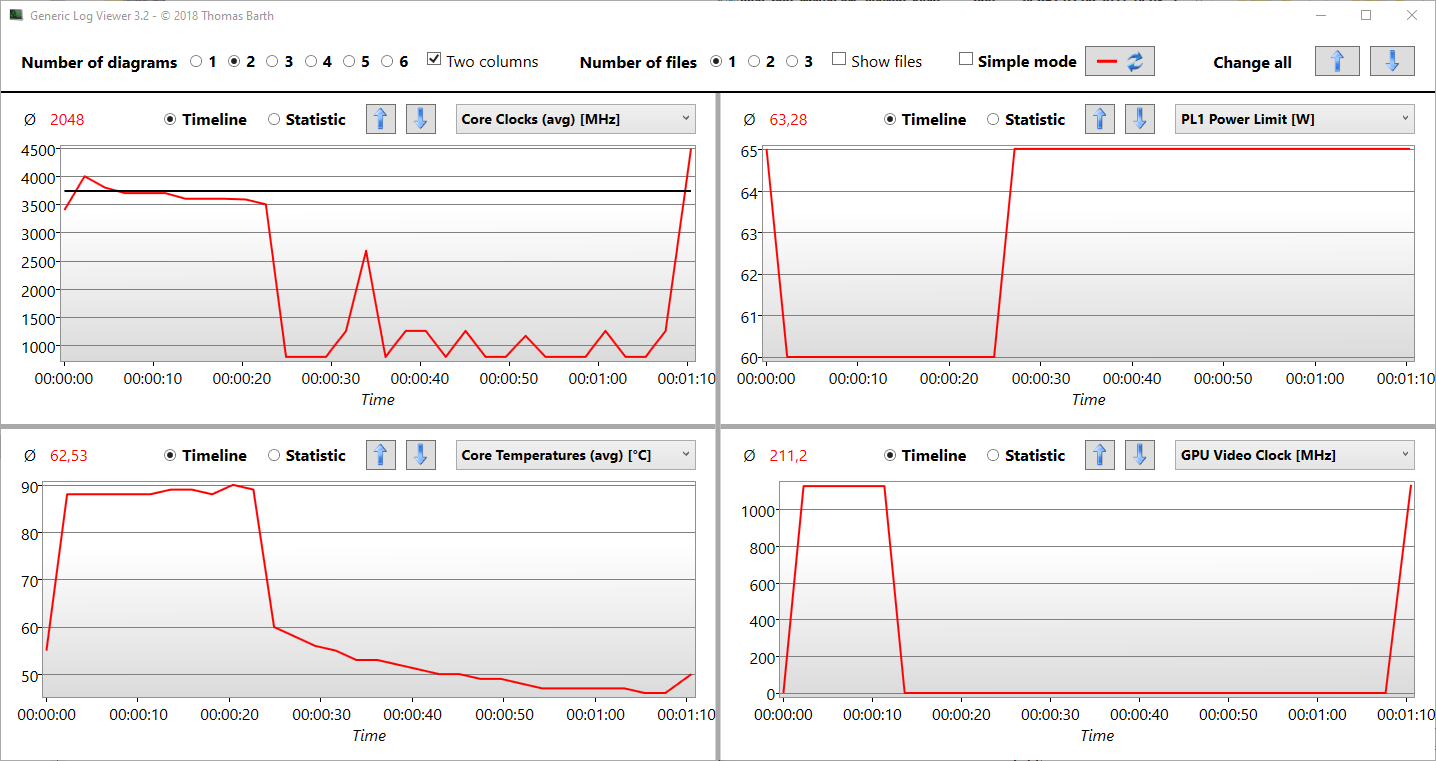
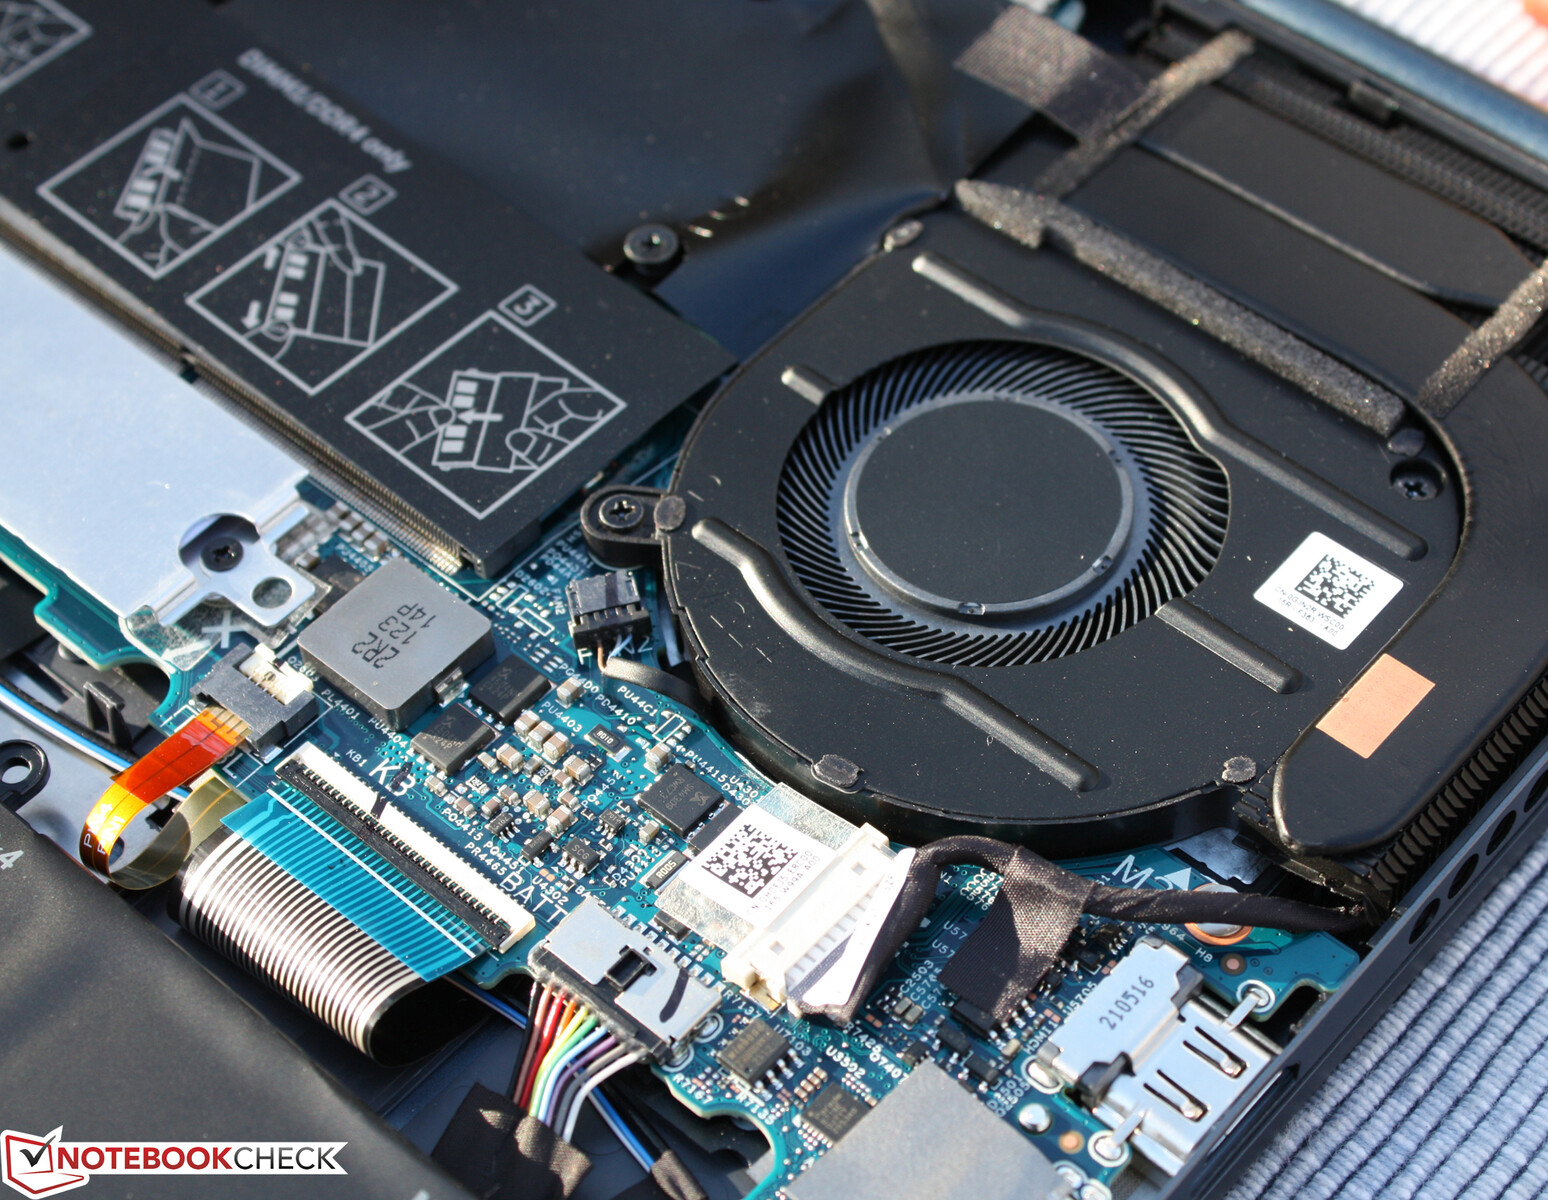
O desempenho da CPU poderia ser melhor, e os resultados do Cinebench Multithread ficam 5 a 20% atrás daqueles de um laptop médio equipado com o Núcleo i7-11800H. O Inspiron 16 Plus 7610 sem dGPU só atinge 13% mais pontos em um único benchmark, o R15, do que o SoC idêntico no modelo com um Geforce. Portanto, parece que o modelo sem dGPU não tem nenhuma vantagem térmica. O desempenho com uma única linha é excelente e corresponde às nossas expectativas em um11800H. Da primeira à terceira corrida, o laço R15 mostra uma vantagem da unidade de teste, portanto, um pouco mais de altura térmica pode ser possível aqui, permitindo que a velocidade do relógio permaneça em um nível alto por vários segundos a mais. O Gráfico Log 15 mostra em detalhes o que acontece: Ele raspa brevemente a marca de 4 GHz antes de cair para 3,6 GHz e o PL1 sendo baixado em 5 watts. Mas como já foi dito, o i7-11800H sem acompanhamento dGPU só atinge melhores pontuações nos benchmarks R15 e Blender
Cinebench R15 Multi Constant Load Test
Cinebench R23: Multi Core | Single Core
Cinebench R20: CPU (Multi Core) | CPU (Single Core)
Cinebench R15: CPU Multi 64Bit | CPU Single 64Bit
Blender: v2.79 BMW27 CPU
7-Zip 18.03: 7z b 4 | 7z b 4 -mmt1
Geekbench 5.5: Multi-Core | Single-Core
HWBOT x265 Benchmark v2.2: 4k Preset
LibreOffice : 20 Documents To PDF
R Benchmark 2.5: Overall mean
| CPU Performance rating | |
| Média da turma Multimedia | |
| Média Intel Core i7-11800H | |
| Lenovo Legion 5 Pro 16ACH6H (82JQ001PGE) | |
| Dell Inspiron 16 Plus 7610 -2! | |
| Dell Inspiron 16 Plus 7610-MHJ8F | |
| Acer Aspire 5 A517-52G-79Z5 | |
| Dell Inspiron 15 7000 7506 2-in-1 Black Edition -1! | |
| LG Gram 16 (2021) | |
| Cinebench R23 / Multi Core | |
| Média da turma Multimedia (4861 - 33362, n=65, últimos 2 anos) | |
| Lenovo Legion 5 Pro 16ACH6H (82JQ001PGE) | |
| Lenovo Legion 5 Pro 16ACH6H (82JQ001PGE) | |
| Média Intel Core i7-11800H (6508 - 14088, n=48) | |
| Dell Inspiron 16 Plus 7610-MHJ8F | |
| Dell Inspiron 16 Plus 7610 | |
| Acer Aspire 5 A517-52G-79Z5 | |
| Dell Inspiron 15 7000 7506 2-in-1 Black Edition | |
| LG Gram 16 (2021) | |
| Cinebench R23 / Single Core | |
| Média da turma Multimedia (1128 - 2459, n=64, últimos 2 anos) | |
| Dell Inspiron 16 Plus 7610 | |
| Acer Aspire 5 A517-52G-79Z5 | |
| Dell Inspiron 16 Plus 7610-MHJ8F | |
| Média Intel Core i7-11800H (1386 - 1522, n=45) | |
| Lenovo Legion 5 Pro 16ACH6H (82JQ001PGE) | |
| Lenovo Legion 5 Pro 16ACH6H (82JQ001PGE) | |
| LG Gram 16 (2021) | |
| Cinebench R20 / CPU (Multi Core) | |
| Média da turma Multimedia (1887 - 12912, n=56, últimos 2 anos) | |
| Lenovo Legion 5 Pro 16ACH6H (82JQ001PGE) | |
| Lenovo Legion 5 Pro 16ACH6H (82JQ001PGE) | |
| Média Intel Core i7-11800H (2498 - 5408, n=50) | |
| Dell Inspiron 16 Plus 7610 | |
| Dell Inspiron 16 Plus 7610-MHJ8F | |
| Acer Aspire 5 A517-52G-79Z5 | |
| Dell Inspiron 15 7000 7506 2-in-1 Black Edition | |
| LG Gram 16 (2021) | |
| Cinebench R20 / CPU (Single Core) | |
| Média da turma Multimedia (425 - 853, n=56, últimos 2 anos) | |
| Dell Inspiron 16 Plus 7610 | |
| Dell Inspiron 16 Plus 7610-MHJ8F | |
| Média Intel Core i7-11800H (520 - 586, n=47) | |
| Acer Aspire 5 A517-52G-79Z5 | |
| Lenovo Legion 5 Pro 16ACH6H (82JQ001PGE) | |
| Lenovo Legion 5 Pro 16ACH6H (82JQ001PGE) | |
| LG Gram 16 (2021) | |
| Dell Inspiron 15 7000 7506 2-in-1 Black Edition | |
| Cinebench R15 / CPU Multi 64Bit | |
| Média da turma Multimedia (856 - 5224, n=60, últimos 2 anos) | |
| Lenovo Legion 5 Pro 16ACH6H (82JQ001PGE) | |
| Média Intel Core i7-11800H (1342 - 2173, n=50) | |
| Dell Inspiron 16 Plus 7610-MHJ8F | |
| Dell Inspiron 16 Plus 7610 | |
| Acer Aspire 5 A517-52G-79Z5 | |
| LG Gram 16 (2021) | |
| Dell Inspiron 15 7000 7506 2-in-1 Black Edition | |
| Cinebench R15 / CPU Single 64Bit | |
| Média da turma Multimedia (184.8 - 326, n=58, últimos 2 anos) | |
| Lenovo Legion 5 Pro 16ACH6H (82JQ001PGE) | |
| Lenovo Legion 5 Pro 16ACH6H (82JQ001PGE) | |
| Dell Inspiron 16 Plus 7610 | |
| Dell Inspiron 16 Plus 7610-MHJ8F | |
| Média Intel Core i7-11800H (201 - 231, n=46) | |
| Acer Aspire 5 A517-52G-79Z5 | |
| LG Gram 16 (2021) | |
| Dell Inspiron 15 7000 7506 2-in-1 Black Edition | |
| Blender / v2.79 BMW27 CPU | |
| LG Gram 16 (2021) | |
| Dell Inspiron 15 7000 7506 2-in-1 Black Edition | |
| Acer Aspire 5 A517-52G-79Z5 | |
| Dell Inspiron 16 Plus 7610-MHJ8F | |
| Média Intel Core i7-11800H (217 - 454, n=46) | |
| Dell Inspiron 16 Plus 7610 | |
| Lenovo Legion 5 Pro 16ACH6H (82JQ001PGE) | |
| Lenovo Legion 5 Pro 16ACH6H (82JQ001PGE) | |
| Média da turma Multimedia (100 - 557, n=57, últimos 2 anos) | |
| 7-Zip 18.03 / 7z b 4 | |
| Média da turma Multimedia (26062 - 130368, n=54, últimos 2 anos) | |
| Lenovo Legion 5 Pro 16ACH6H (82JQ001PGE) | |
| Lenovo Legion 5 Pro 16ACH6H (82JQ001PGE) | |
| Média Intel Core i7-11800H (33718 - 56758, n=46) | |
| Dell Inspiron 16 Plus 7610 | |
| Dell Inspiron 16 Plus 7610-MHJ8F | |
| Acer Aspire 5 A517-52G-79Z5 | |
| Dell Inspiron 15 7000 7506 2-in-1 Black Edition | |
| LG Gram 16 (2021) | |
| 7-Zip 18.03 / 7z b 4 -mmt1 | |
| Média da turma Multimedia (3666 - 7545, n=55, últimos 2 anos) | |
| Dell Inspiron 16 Plus 7610 | |
| Lenovo Legion 5 Pro 16ACH6H (82JQ001PGE) | |
| Lenovo Legion 5 Pro 16ACH6H (82JQ001PGE) | |
| Média Intel Core i7-11800H (5138 - 5732, n=46) | |
| Acer Aspire 5 A517-52G-79Z5 | |
| Dell Inspiron 16 Plus 7610-MHJ8F | |
| Dell Inspiron 15 7000 7506 2-in-1 Black Edition | |
| LG Gram 16 (2021) | |
| Geekbench 5.5 / Multi-Core | |
| Média da turma Multimedia (4652 - 20422, n=55, últimos 2 anos) | |
| Média Intel Core i7-11800H (4655 - 9851, n=40) | |
| Lenovo Legion 5 Pro 16ACH6H (82JQ001PGE) | |
| Lenovo Legion 5 Pro 16ACH6H (82JQ001PGE) | |
| Dell Inspiron 16 Plus 7610-MHJ8F | |
| Dell Inspiron 16 Plus 7610-MHJ8F | |
| Dell Inspiron 16 Plus 7610-MHJ8F | |
| Dell Inspiron 15 7000 7506 2-in-1 Black Edition | |
| LG Gram 16 (2021) | |
| Acer Aspire 5 A517-52G-79Z5 | |
| Geekbench 5.5 / Single-Core | |
| Média da turma Multimedia (805 - 2974, n=55, últimos 2 anos) | |
| Dell Inspiron 16 Plus 7610-MHJ8F | |
| Dell Inspiron 16 Plus 7610-MHJ8F | |
| Dell Inspiron 16 Plus 7610-MHJ8F | |
| Acer Aspire 5 A517-52G-79Z5 | |
| Média Intel Core i7-11800H (1429 - 1625, n=40) | |
| LG Gram 16 (2021) | |
| Dell Inspiron 15 7000 7506 2-in-1 Black Edition | |
| Lenovo Legion 5 Pro 16ACH6H (82JQ001PGE) | |
| Lenovo Legion 5 Pro 16ACH6H (82JQ001PGE) | |
| HWBOT x265 Benchmark v2.2 / 4k Preset | |
| Média da turma Multimedia (5.26 - 36.1, n=55, últimos 2 anos) | |
| Lenovo Legion 5 Pro 16ACH6H (82JQ001PGE) | |
| Lenovo Legion 5 Pro 16ACH6H (82JQ001PGE) | |
| Média Intel Core i7-11800H (7.38 - 17.4, n=46) | |
| Dell Inspiron 16 Plus 7610 | |
| Dell Inspiron 16 Plus 7610-MHJ8F | |
| Dell Inspiron 15 7000 7506 2-in-1 Black Edition | |
| Acer Aspire 5 A517-52G-79Z5 | |
| LG Gram 16 (2021) | |
| LibreOffice / 20 Documents To PDF | |
| Lenovo Legion 5 Pro 16ACH6H (82JQ001PGE) | |
| Lenovo Legion 5 Pro 16ACH6H (82JQ001PGE) | |
| Acer Aspire 5 A517-52G-79Z5 | |
| Média da turma Multimedia (23.9 - 146.7, n=56, últimos 2 anos) | |
| Dell Inspiron 15 7000 7506 2-in-1 Black Edition | |
| Média Intel Core i7-11800H (38.6 - 59.9, n=45) | |
| Dell Inspiron 16 Plus 7610 | |
| LG Gram 16 (2021) | |
| Dell Inspiron 16 Plus 7610-MHJ8F | |
| R Benchmark 2.5 / Overall mean | |
| LG Gram 16 (2021) | |
| Dell Inspiron 15 7000 7506 2-in-1 Black Edition | |
| Dell Inspiron 16 Plus 7610-MHJ8F | |
| Acer Aspire 5 A517-52G-79Z5 | |
| Média Intel Core i7-11800H (0.548 - 0.615, n=46) | |
| Dell Inspiron 16 Plus 7610 | |
| Lenovo Legion 5 Pro 16ACH6H (82JQ001PGE) | |
| Lenovo Legion 5 Pro 16ACH6H (82JQ001PGE) | |
| Média da turma Multimedia (0.3604 - 0.947, n=55, últimos 2 anos) | |
* ... menor é melhor
AIDA64: FP32 Ray-Trace | FPU Julia | CPU SHA3 | CPU Queen | FPU SinJulia | FPU Mandel | CPU AES | CPU ZLib | FP64 Ray-Trace | CPU PhotoWorxx
| Performance rating | |
| Média da turma Multimedia | |
| Lenovo Legion 5 Pro 16ACH6H (82JQ001PGE) | |
| Média Intel Core i7-11800H | |
| Dell Inspiron 16 Plus 7610-MHJ8F | |
| LG Gram 16 (2021) | |
| Dell Inspiron 16 Plus 7610 -9! | |
| AIDA64 / FP32 Ray-Trace | |
| Média da turma Multimedia (2214 - 50388, n=53, últimos 2 anos) | |
| Lenovo Legion 5 Pro 16ACH6H (82JQ001PGE) | |
| Lenovo Legion 5 Pro 16ACH6H (82JQ001PGE) | |
| Média Intel Core i7-11800H (8772 - 15961, n=20) | |
| Dell Inspiron 16 Plus 7610-MHJ8F | |
| LG Gram 16 (2021) | |
| AIDA64 / FPU Julia | |
| Lenovo Legion 5 Pro 16ACH6H (82JQ001PGE) | |
| Lenovo Legion 5 Pro 16ACH6H (82JQ001PGE) | |
| Média da turma Multimedia (12867 - 201874, n=53, últimos 2 anos) | |
| Média Intel Core i7-11800H (39404 - 65636, n=20) | |
| Dell Inspiron 16 Plus 7610-MHJ8F | |
| LG Gram 16 (2021) | |
| AIDA64 / CPU SHA3 | |
| Média Intel Core i7-11800H (2599 - 4439, n=20) | |
| Média da turma Multimedia (626 - 8623, n=53, últimos 2 anos) | |
| Dell Inspiron 16 Plus 7610-MHJ8F | |
| Lenovo Legion 5 Pro 16ACH6H (82JQ001PGE) | |
| Lenovo Legion 5 Pro 16ACH6H (82JQ001PGE) | |
| LG Gram 16 (2021) | |
| AIDA64 / CPU Queen | |
| Lenovo Legion 5 Pro 16ACH6H (82JQ001PGE) | |
| Lenovo Legion 5 Pro 16ACH6H (82JQ001PGE) | |
| Dell Inspiron 16 Plus 7610-MHJ8F | |
| Média Intel Core i7-11800H (85233 - 91941, n=20) | |
| Média da turma Multimedia (13483 - 181505, n=40, últimos 2 anos) | |
| LG Gram 16 (2021) | |
| AIDA64 / FPU SinJulia | |
| Lenovo Legion 5 Pro 16ACH6H (82JQ001PGE) | |
| Lenovo Legion 5 Pro 16ACH6H (82JQ001PGE) | |
| Média Intel Core i7-11800H (6420 - 9792, n=20) | |
| Dell Inspiron 16 Plus 7610-MHJ8F | |
| Média da turma Multimedia (886 - 28794, n=53, últimos 2 anos) | |
| LG Gram 16 (2021) | |
| AIDA64 / FPU Mandel | |
| Lenovo Legion 5 Pro 16ACH6H (82JQ001PGE) | |
| Lenovo Legion 5 Pro 16ACH6H (82JQ001PGE) | |
| Média da turma Multimedia (6395 - 105740, n=53, últimos 2 anos) | |
| Média Intel Core i7-11800H (23365 - 39464, n=20) | |
| Dell Inspiron 16 Plus 7610-MHJ8F | |
| LG Gram 16 (2021) | |
| AIDA64 / CPU AES | |
| Lenovo Legion 5 Pro 16ACH6H (82JQ001PGE) | |
| Lenovo Legion 5 Pro 16ACH6H (82JQ001PGE) | |
| Média Intel Core i7-11800H (74617 - 149388, n=20) | |
| Dell Inspiron 16 Plus 7610-MHJ8F | |
| Média da turma Multimedia (8171 - 126790, n=53, últimos 2 anos) | |
| LG Gram 16 (2021) | |
| AIDA64 / CPU ZLib | |
| Média da turma Multimedia (143.8 - 2022, n=53, últimos 2 anos) | |
| Lenovo Legion 5 Pro 16ACH6H (82JQ001PGE) | |
| Lenovo Legion 5 Pro 16ACH6H (82JQ001PGE) | |
| Dell Inspiron 16 Plus 7610-MHJ8F | |
| Média Intel Core i7-11800H (461 - 830, n=43) | |
| LG Gram 16 (2021) | |
| Dell Inspiron 16 Plus 7610 | |
| AIDA64 / FP64 Ray-Trace | |
| Média da turma Multimedia (1014 - 26875, n=53, últimos 2 anos) | |
| Lenovo Legion 5 Pro 16ACH6H (82JQ001PGE) | |
| Lenovo Legion 5 Pro 16ACH6H (82JQ001PGE) | |
| Média Intel Core i7-11800H (4545 - 8717, n=21) | |
| Dell Inspiron 16 Plus 7610-MHJ8F | |
| LG Gram 16 (2021) | |
| AIDA64 / CPU PhotoWorxx | |
| Média da turma Multimedia (8187 - 88154, n=53, últimos 2 anos) | |
| LG Gram 16 (2021) | |
| Média Intel Core i7-11800H (11898 - 26757, n=21) | |
| Lenovo Legion 5 Pro 16ACH6H (82JQ001PGE) | |
| Lenovo Legion 5 Pro 16ACH6H (82JQ001PGE) | |
| Dell Inspiron 16 Plus 7610-MHJ8F | |
Desempenho do sistema
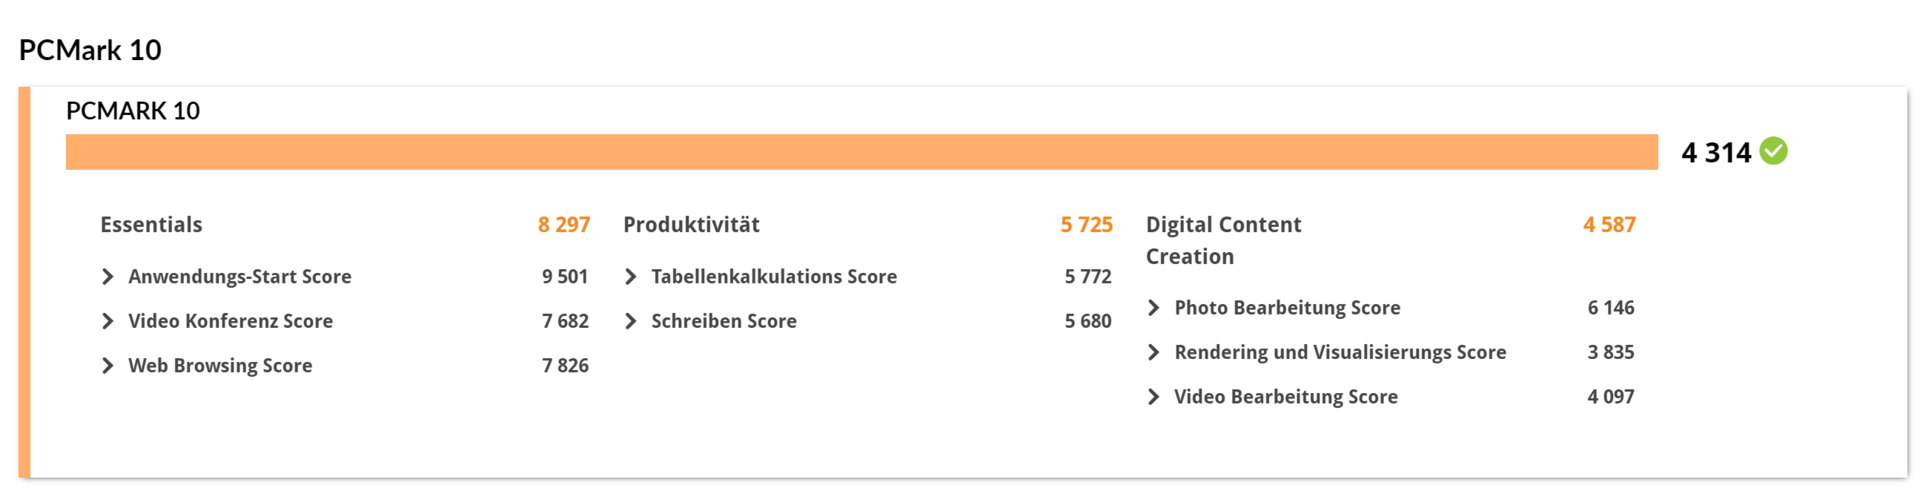
A pontuação PCMark sofre com a falta da Geforce, e vemos uma diferença de 25 a 50% nas sub pontuações. Entretanto, este não é o caso do Essentials, que se torna ainda mais alto do que com o dGPU. Na operação em bateria, o desempenho cai ligeiramente, mas não muito.
| PCMark 10 / Score | |
| Média da turma Multimedia (4325 - 10386, n=51, últimos 2 anos) | |
| Lenovo Legion 5 Pro 16ACH6H (82JQ001PGE) | |
| Dell Inspiron 16 Plus 7610 | |
| Acer Aspire 5 A517-52G-79Z5 | |
| Dell Inspiron 16 Plus 7610-MHJ8F | |
| Média Intel Core i7-11800H, Intel UHD Graphics Xe 32EUs (Tiger Lake-H) (5036 - 5067, n=2) | |
| Dell Inspiron 15 7000 7506 2-in-1 Black Edition | |
| LG Gram 16 (2021) | |
| PCMark 10 / Essentials | |
| Média da turma Multimedia (8025 - 11664, n=50, últimos 2 anos) | |
| LG Gram 16 (2021) | |
| Dell Inspiron 16 Plus 7610-MHJ8F | |
| Dell Inspiron 16 Plus 7610 | |
| Média Intel Core i7-11800H, Intel UHD Graphics Xe 32EUs (Tiger Lake-H) (9694 - 9847, n=2) | |
| Dell Inspiron 15 7000 7506 2-in-1 Black Edition | |
| Lenovo Legion 5 Pro 16ACH6H (82JQ001PGE) | |
| Acer Aspire 5 A517-52G-79Z5 | |
| PCMark 10 / Productivity | |
| Média da turma Multimedia (7323 - 18233, n=50, últimos 2 anos) | |
| Acer Aspire 5 A517-52G-79Z5 | |
| Lenovo Legion 5 Pro 16ACH6H (82JQ001PGE) | |
| Dell Inspiron 16 Plus 7610 | |
| LG Gram 16 (2021) | |
| Média Intel Core i7-11800H, Intel UHD Graphics Xe 32EUs (Tiger Lake-H) (6562 - 6723, n=2) | |
| Dell Inspiron 15 7000 7506 2-in-1 Black Edition | |
| Dell Inspiron 16 Plus 7610-MHJ8F | |
| PCMark 10 / Digital Content Creation | |
| Média da turma Multimedia (3651 - 16240, n=50, últimos 2 anos) | |
| Lenovo Legion 5 Pro 16ACH6H (82JQ001PGE) | |
| Dell Inspiron 16 Plus 7610 | |
| Dell Inspiron 16 Plus 7610-MHJ8F | |
| Dell Inspiron 15 7000 7506 2-in-1 Black Edition | |
| Média Intel Core i7-11800H, Intel UHD Graphics Xe 32EUs (Tiger Lake-H) (5318 - 5464, n=2) | |
| Acer Aspire 5 A517-52G-79Z5 | |
| LG Gram 16 (2021) | |
| PCMark 10 Score | 5067 pontos | |
Ajuda | ||
| AIDA64 / Memory Copy | |
| Média da turma Multimedia (11299 - 132135, n=53, últimos 2 anos) | |
| LG Gram 16 (2021) | |
| Média Intel Core i7-11800H (24508 - 48144, n=21) | |
| Dell Inspiron 16 Plus 7610-MHJ8F | |
| Lenovo Legion 5 Pro 16ACH6H (82JQ001PGE) | |
| Lenovo Legion 5 Pro 16ACH6H (82JQ001PGE) | |
| AIDA64 / Memory Read | |
| Média da turma Multimedia (11624 - 174586, n=53, últimos 2 anos) | |
| LG Gram 16 (2021) | |
| Lenovo Legion 5 Pro 16ACH6H (82JQ001PGE) | |
| Lenovo Legion 5 Pro 16ACH6H (82JQ001PGE) | |
| Dell Inspiron 16 Plus 7610-MHJ8F | |
| Média Intel Core i7-11800H (25882 - 50365, n=20) | |
| AIDA64 / Memory Write | |
| Média da turma Multimedia (11755 - 134998, n=53, últimos 2 anos) | |
| LG Gram 16 (2021) | |
| Dell Inspiron 16 Plus 7610-MHJ8F | |
| Média Intel Core i7-11800H (22240 - 46214, n=20) | |
| Lenovo Legion 5 Pro 16ACH6H (82JQ001PGE) | |
| Lenovo Legion 5 Pro 16ACH6H (82JQ001PGE) | |
| AIDA64 / Memory Latency | |
| Média da turma Multimedia (7 - 535, n=52, últimos 2 anos) | |
| Dell Inspiron 16 Plus 7610-MHJ8F | |
| LG Gram 16 (2021) | |
| Lenovo Legion 5 Pro 16ACH6H (82JQ001PGE) | |
| Lenovo Legion 5 Pro 16ACH6H (82JQ001PGE) | |
| Média Intel Core i7-11800H (71.9 - 104.1, n=44) | |
| Dell Inspiron 16 Plus 7610 | |
* ... menor é melhor
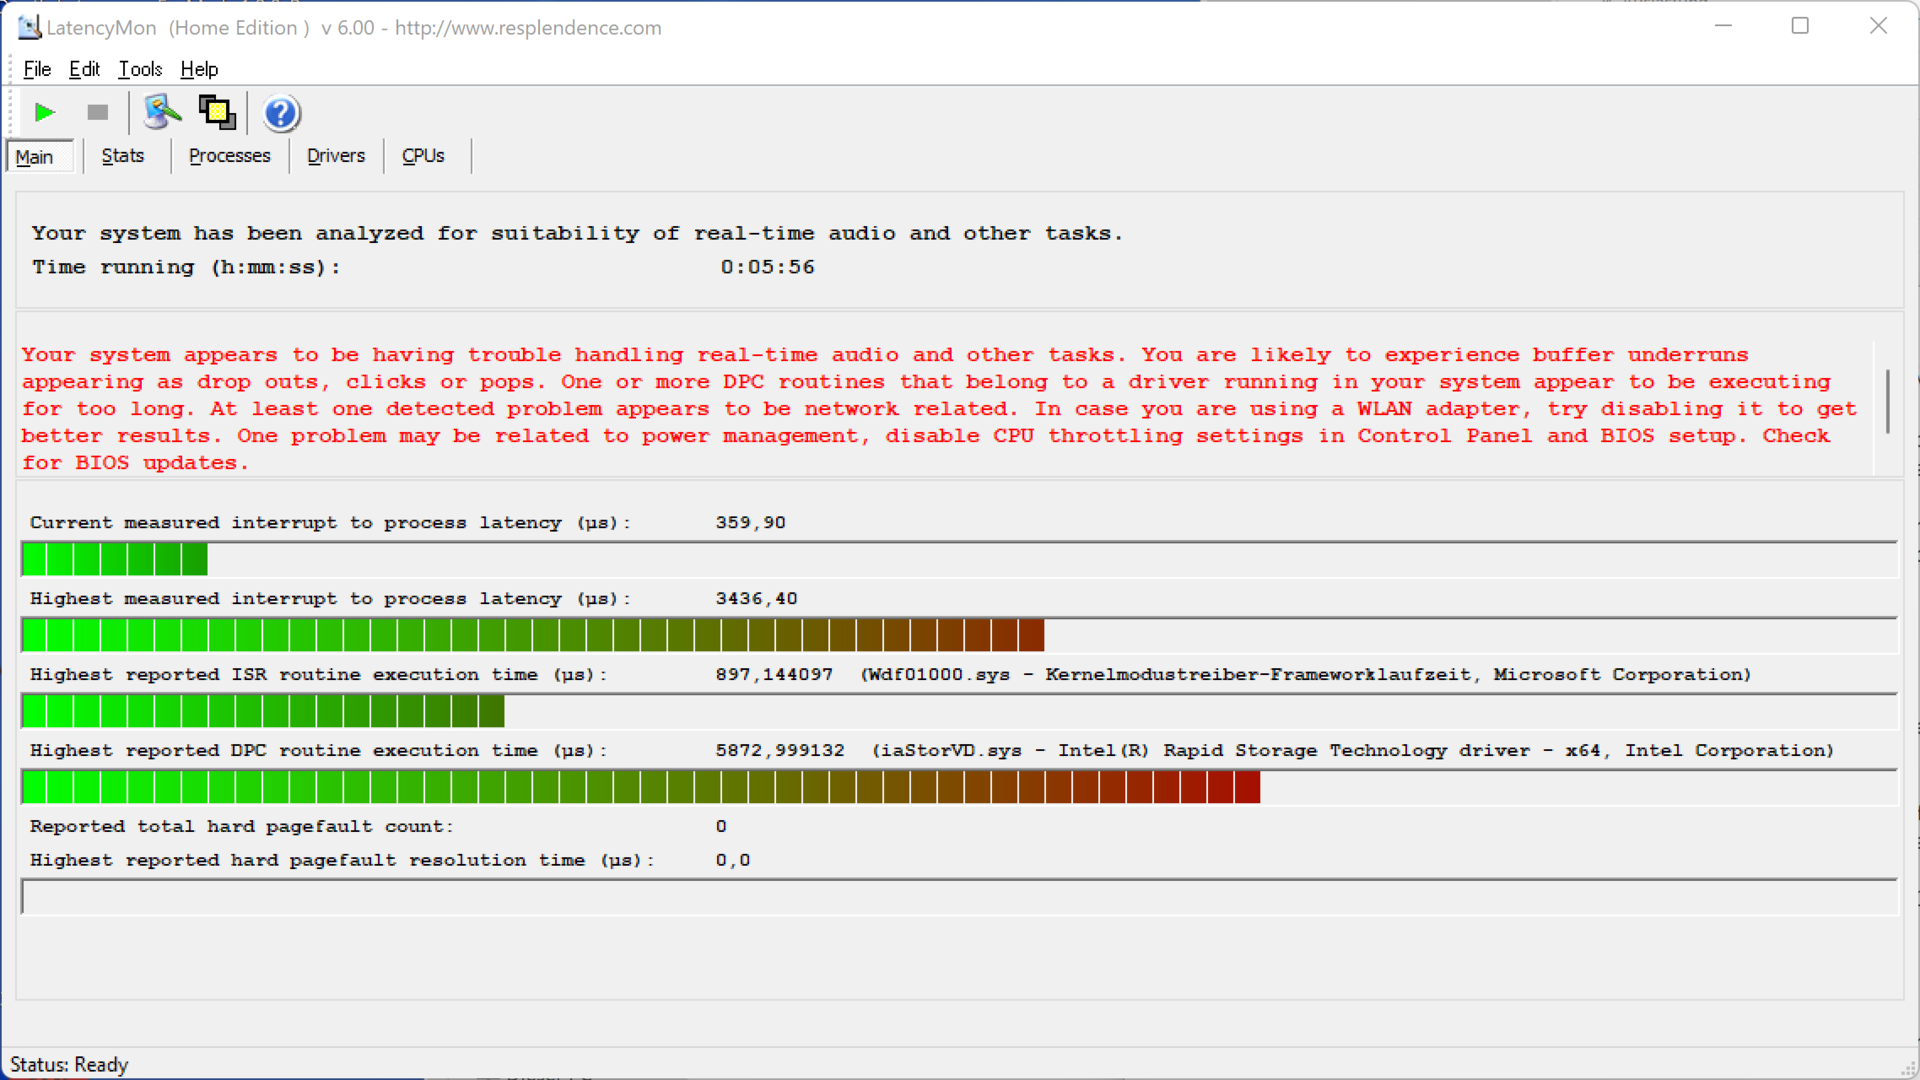
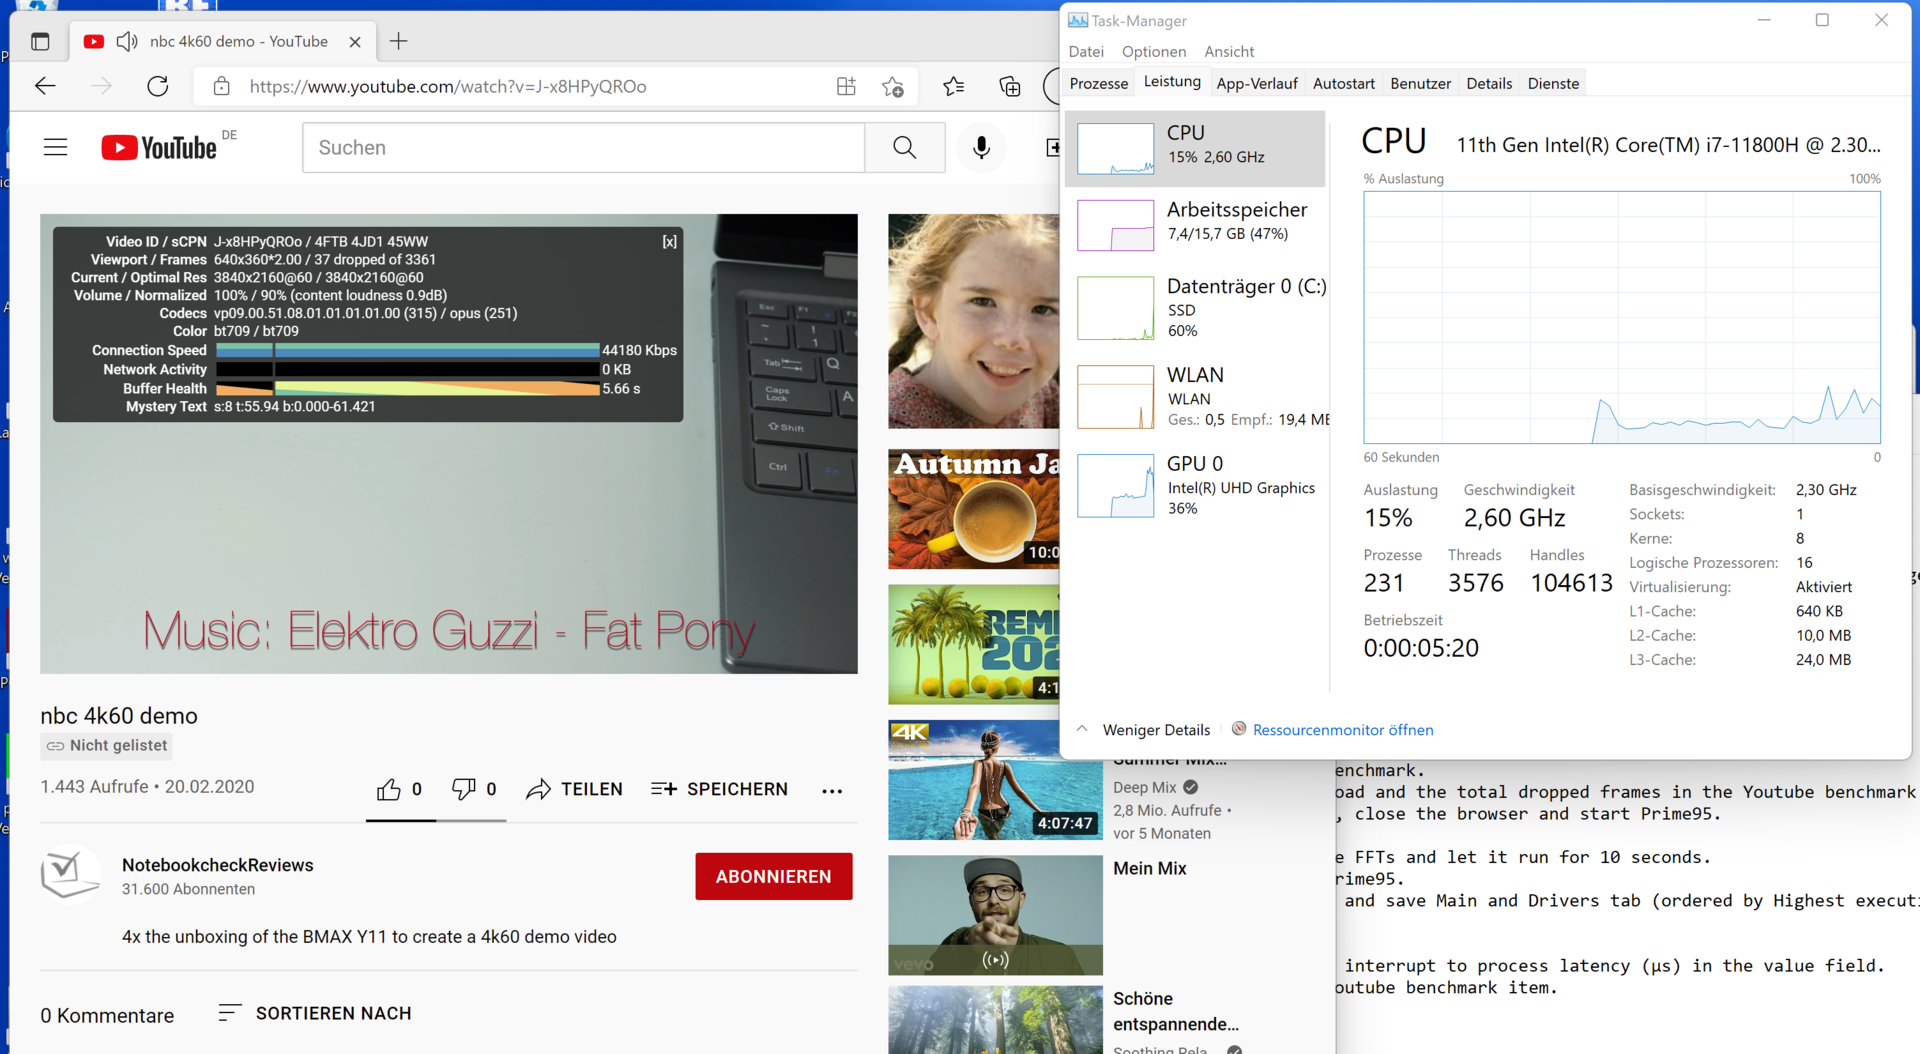
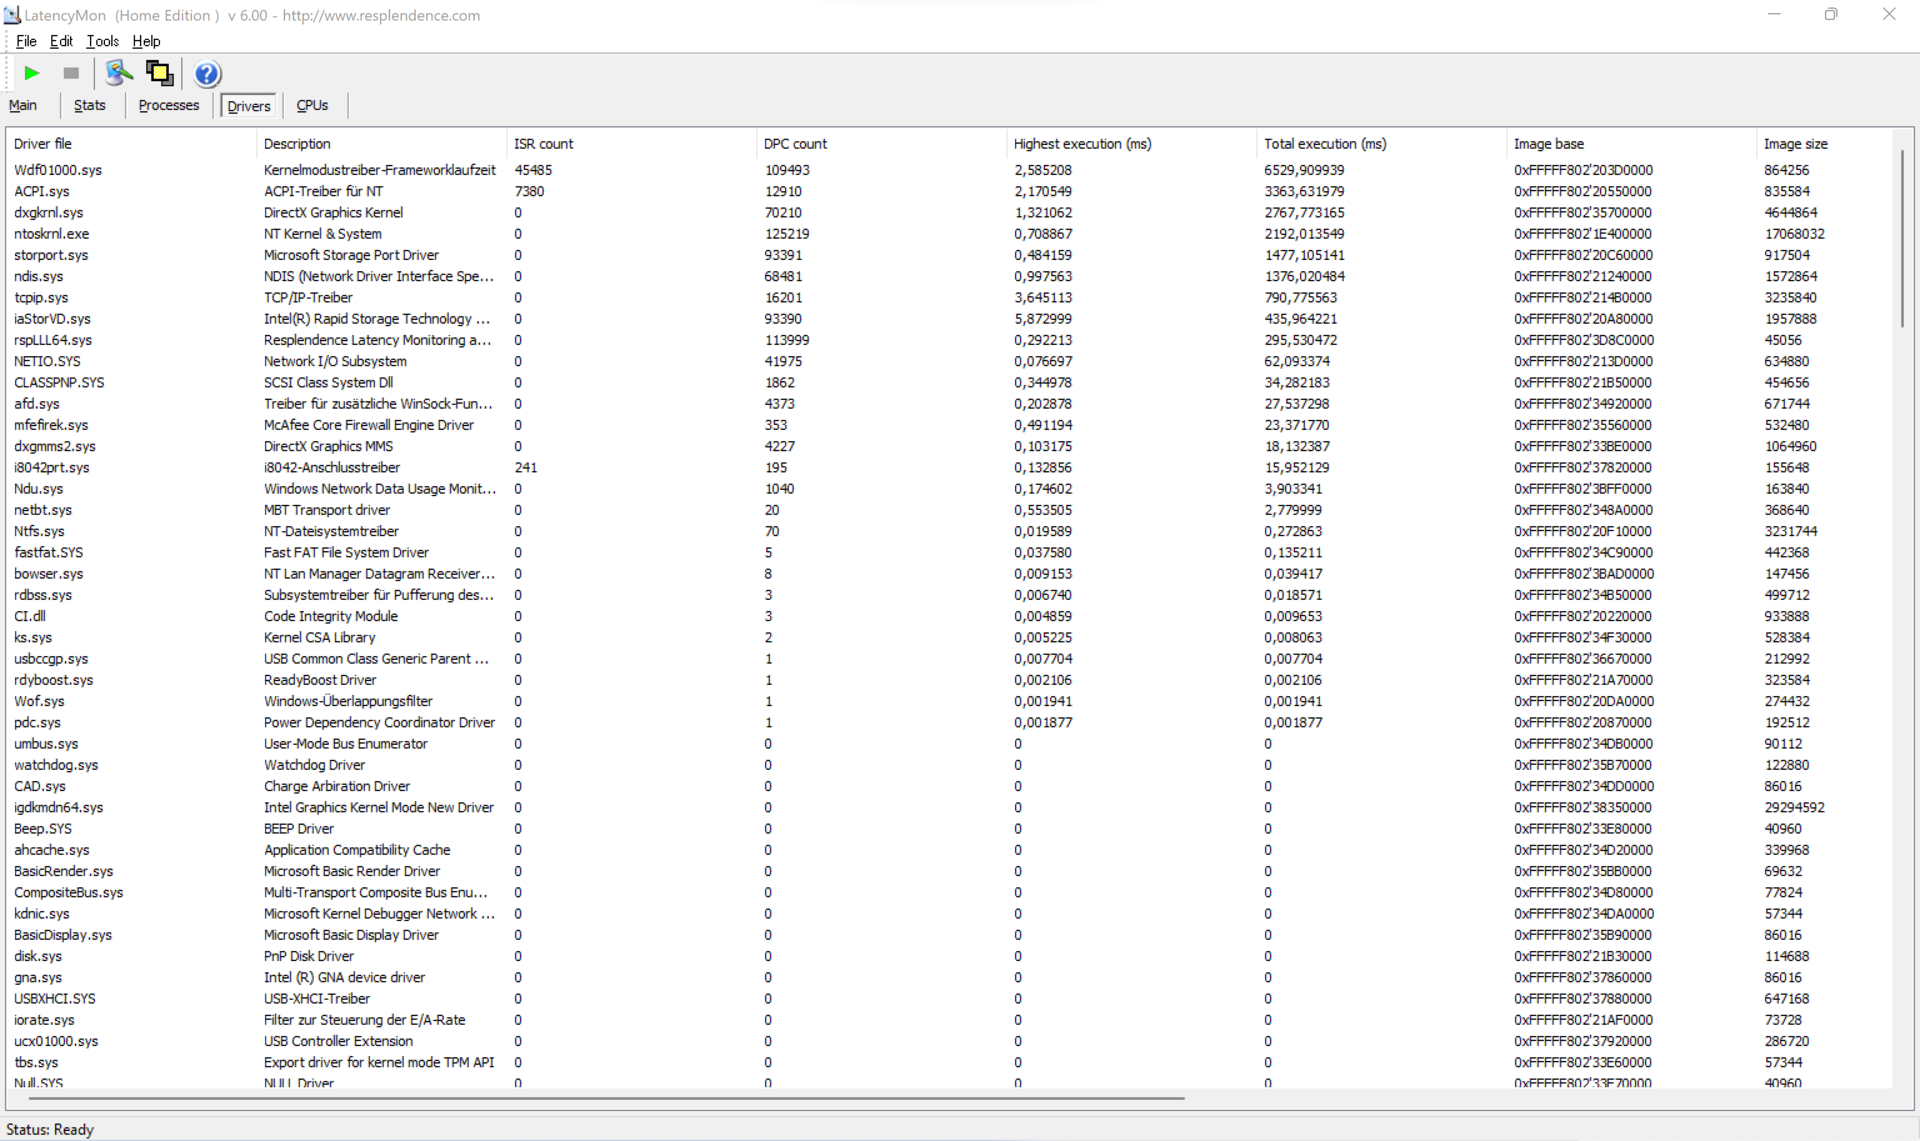
Latências DPC
Ao abrir nossa página inicial em várias abas ou ao executar Prime95, LatencyMon relata algumas latências DPC problemáticas. A reprodução de um vídeo de 4K também não funciona completamente sem problemas, com 37 quadros sendo descartados durante a execução do vídeo de 60 segundos. A razão está no Kernel e no driver ACPI.
| DPC Latencies / LatencyMon - interrupt to process latency (max), Web, Youtube, Prime95 | |
| Dell Inspiron 16 Plus 7610 | |
| Acer Aspire 5 A517-52G-79Z5 | |
| Lenovo Legion 5 Pro 16ACH6H (82JQ001PGE) | |
| LG Gram 16 (2021) | |
| Dell Inspiron 15 7000 7506 2-in-1 Black Edition | |
* ... menor é melhor
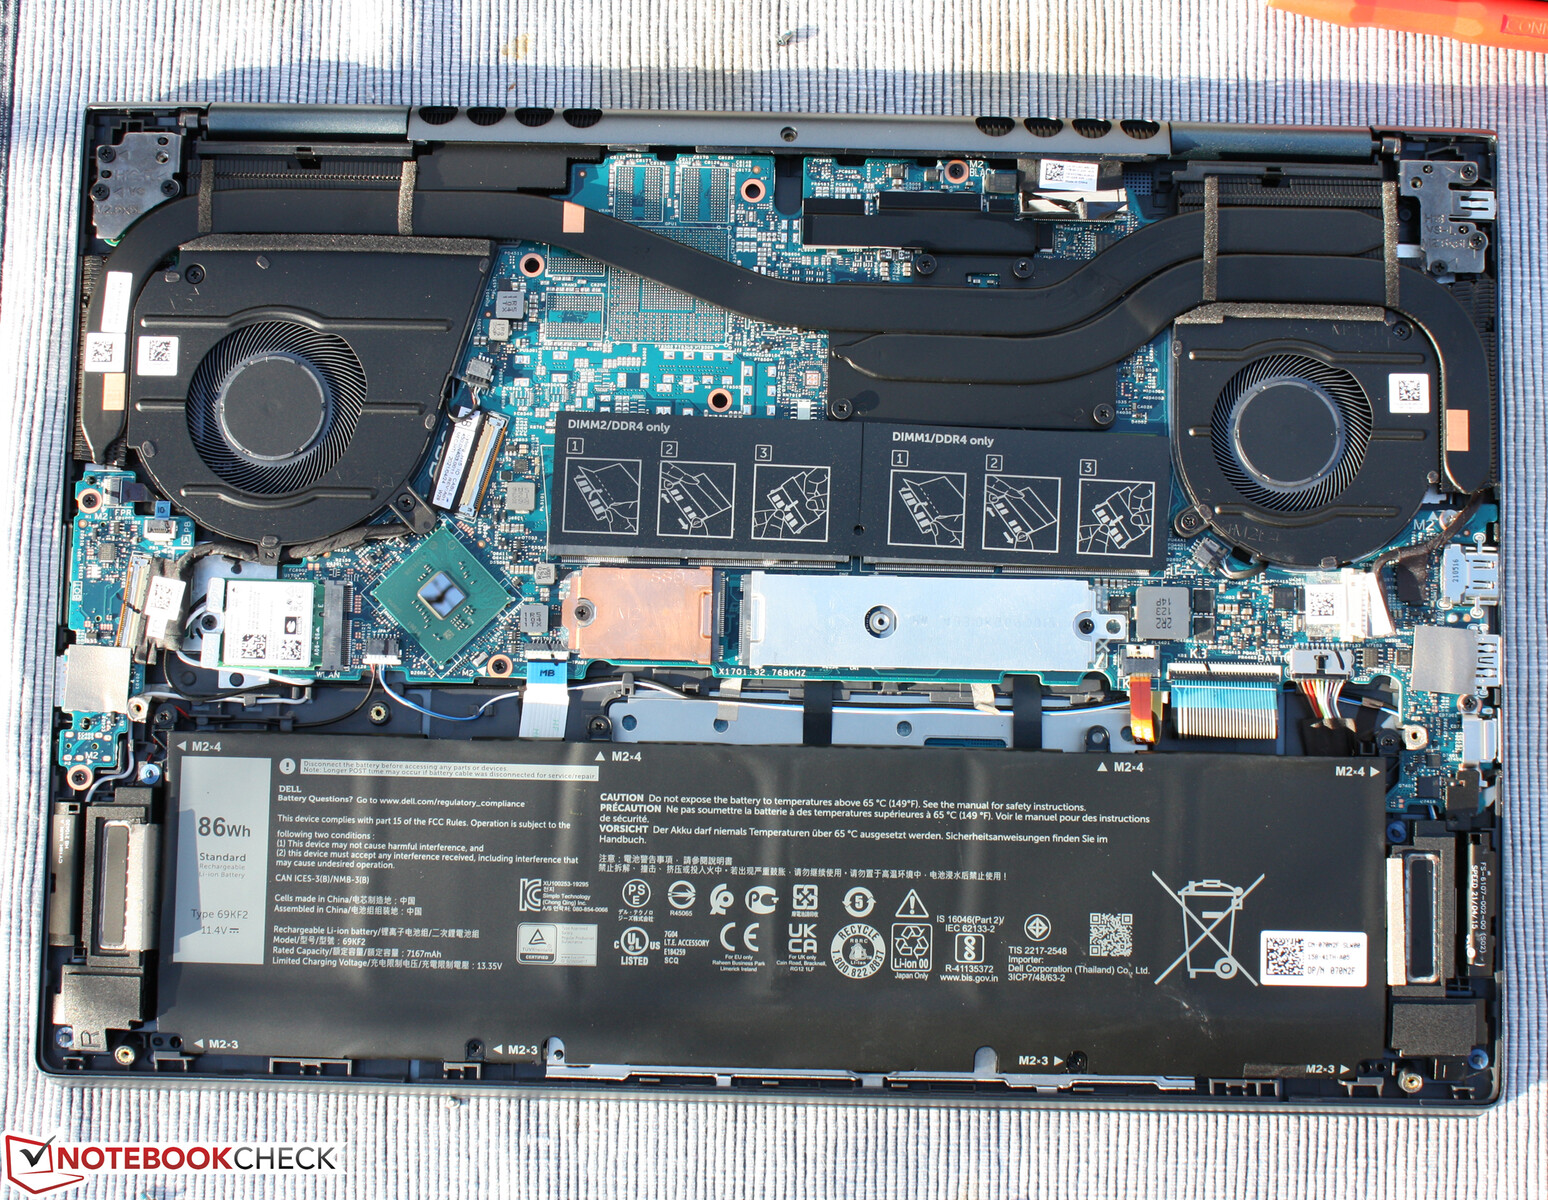
Solução de armazenamento - Um acionamento interno
Nosso modelo 7610 é equipado com o incomum Kingston OM3PDP3-AD NVMe SSD. Com até a metade do desempenho do Micron 2300 no XPS 15 9510, sua velocidade é, na melhor das hipóteses, média. Como a Dell recebe suas unidades de vários fabricantes de SSD que incluem Samsung, Micron, Western Digital, Toshiba e aparentemente também Kingston, é difícil prever com qual unidade um laptop Inspiron disponível dos fornecedores será equipado.
Nota: Enquanto você pode inserir até duas unidades internas, pelo menos uma delas tem que ter o formato menor 2230.

* ... menor é melhor
Constant Performance Reading: DiskSpd Read Loop, Queue Depth 8
Placa Gráfica
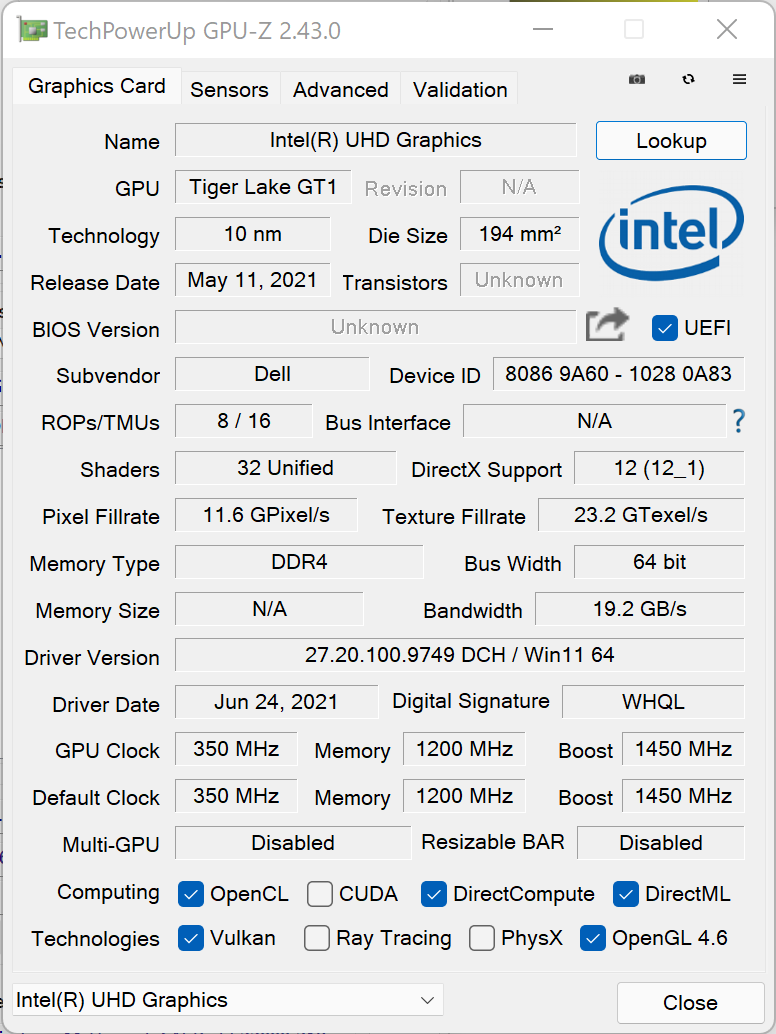
Não há dúvidas sobre isso, mas a Intel UHD Xe (32 UE) não traz muito desempenho, o que é confirmado por todos os benchmarks. O Inspiron 16 Plus 7610 equipado com RTX está 500% à frente, e nos jogos, entre 250 e quase 500%.
Aqueles que decidem pela versão iGPU têm que conviver com o fato de que então o suporte de hardware através dos núcleos CUDA da Nvidia também estará faltando. Isto diminuirá, por exemplo, a velocidade de renderização durante o processamento de vídeo ou imagem de forma significativa. Uma jogabilidade suave só é possível em alguns jogos antigos selecionados ou naqueles que são menos exigentes.
| 3DMark 11 Performance | 3691 pontos | |
| 3DMark Fire Strike Score | 2345 pontos | |
| 3DMark Time Spy Score | 805 pontos | |
Ajuda | ||
| baixo | média | alto | ultra | 4K | |
|---|---|---|---|---|---|
| The Witcher 3 (2015) | 50.1 | 31.1 | 15.8 | 7.5 | |
| Dota 2 Reborn (2015) | 126.2 | 76.6 | 36.3 | 33.3 | 12.1 |
| X-Plane 11.11 (2018) | 21.3 | 17.6 | 11.1 | 9.43 | |
| Strange Brigade (2018) | 56.7 | 21.7 | 16.9 | 16.2 |
Emissões e gerenciamento de energia - Um laptop Dell legal
Emissões sonoras
Os ventiladores do Inspiron 16 conseguem permanecer em silêncio ou pelo menos muito silenciosos por um longo tempo. Com o melhor modo de economia de energia, os ventiladores quase nunca se ligam. No modo balanceado, os dois ventiladores funcionam esporadicamente por alguns segundos. Estas duas afirmações dizem respeito à operação ociosa. É impressionante que a carga não causará uma reversão imediata dos ventiladores, mas apenas uma resposta muito retardada, mesmo no modo Performance. No 3DMark, por exemplo, eles só se tornam perceptíveis após cerca de 40 segundos. Assim que sua velocidade aumenta, a 49 dB(A), o laptop rapidamente se torna tão barulhento quanto os laptops para jogos. O valor máximo é idêntico ao da versão Nvidia do laptop, as características do ventilador são idênticas
Barulho
| Ocioso |
| 26.3 / 26.3 / dB |
| Carga |
| 33 / 49.2 dB |
 | ||
30 dB silencioso 40 dB(A) audível 50 dB(A) ruidosamente alto |
||
min: | ||
| Dell Inspiron 16 Plus 7610-MHJ8F UHD Graphics Xe 32EUs (Tiger Lake-H), i7-11800H, OM3PDP3-AD NVMe KDI 512GB | Dell Inspiron 16 Plus 7610 GeForce RTX 3050 4GB Laptop GPU, i7-11800H, Kingston OM3PDP3512B | LG Gram 16 (2021) Iris Xe G7 96EUs, i7-1165G7, SK Hynix PC601 1TB HFS001TD9TNG | Lenovo Legion 5 Pro 16ACH6H (82JQ001PGE) GeForce RTX 3070 Laptop GPU, R7 5800H, WDC PC SN730 SDBPNTY-1T00 | Dell Inspiron 15 7000 7506 2-in-1 Black Edition Xe MAX, i7-1165G7, Micron 2300 1TB MTFDHBA1T0TDV | Acer Aspire 5 A517-52G-79Z5 GeForce MX350, i7-1165G7, WDC PC SN530 SDBPNPZ-1T00 | |
|---|---|---|---|---|---|---|
| Noise | -6% | 9% | 1% | -10% | -2% | |
| desligado / ambiente * (dB) | 26.3 | 24.4 7% | 26 1% | 23 13% | 27.3 -4% | 24.9 5% |
| Idle Minimum * (dB) | 26.3 | 24.4 7% | 26 1% | 25 5% | 27.3 -4% | 24.9 5% |
| Idle Average * (dB) | 26.3 | 24.4 7% | 26 1% | 25 5% | 27.3 -4% | 24.9 5% |
| Load Average * (dB) | 33 | 48.3 -46% | 30.8 7% | 35.5 -8% | 47.4 -44% | 44.1 -34% |
| Witcher 3 ultra * (dB) | 44 | 48.9 -11% | 46.67 -6% | 47.4 -8% | ||
| Load Maximum * (dB) | 49.2 | 48.9 1% | 31.1 37% | 50.35 -2% | 47.5 3% | 44.8 9% |
| Idle Maximum * (dB) | 24.4 | 26 | 25 | 27.3 | 27 |
* ... menor é melhor
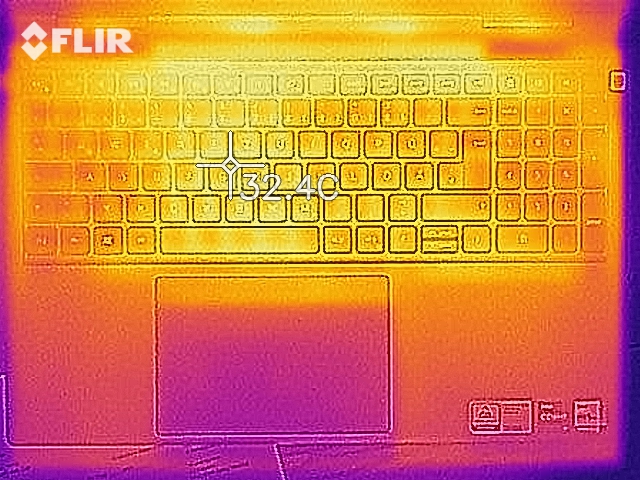
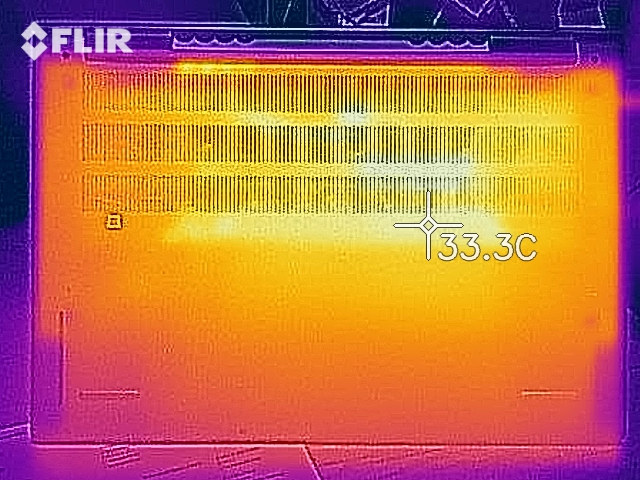
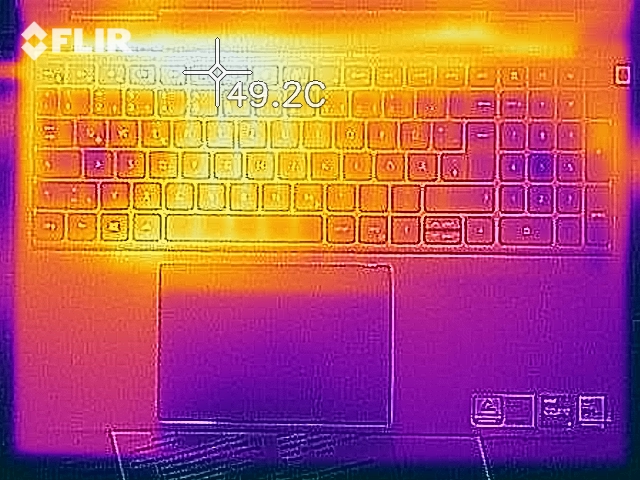
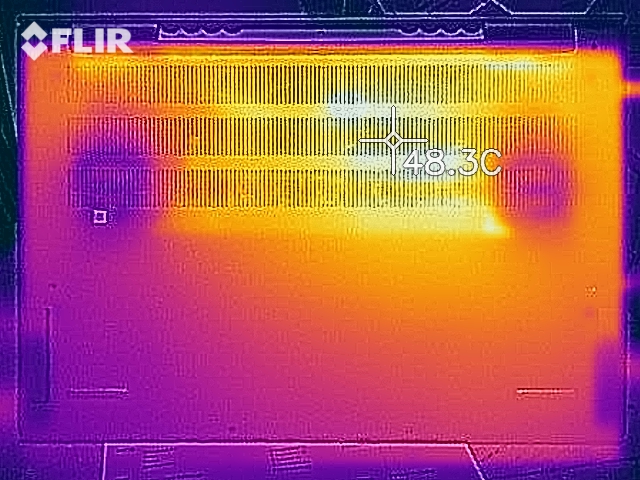
Temperatura
Apesar dos ventiladores lentos, as temperaturas de superfície não são altas, variando em média em torno de 29 ºC (~84 ºF). O modelo dGPU tem uma média 3 ºC (~5 ºF) mais alta, mas somente na parte inferior. Como era de se esperar, há uma diferença significativa sob carga: No hotspot no fundo, o modelo Geforce é cerca de 10 ºC (~18 ºF) mais quente do que a versão iGPU
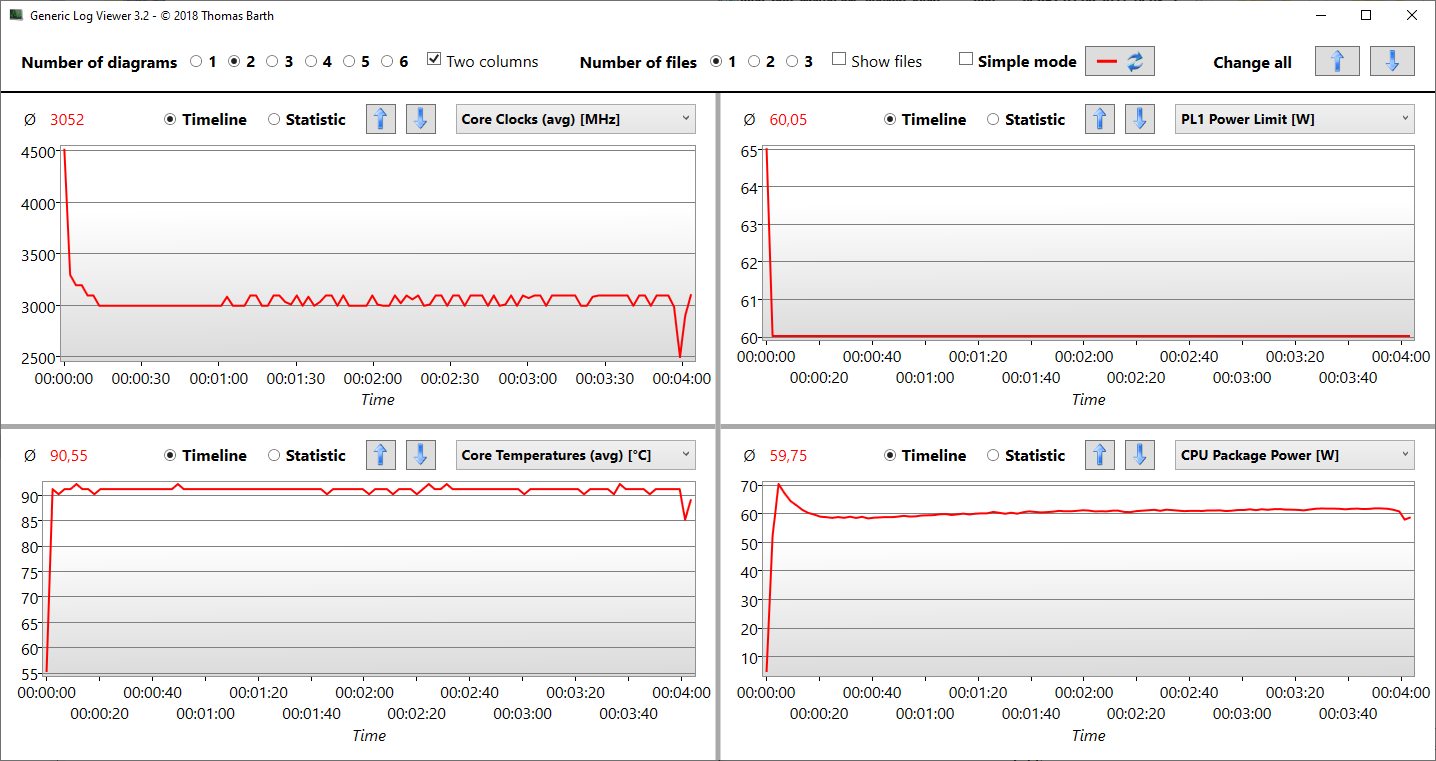
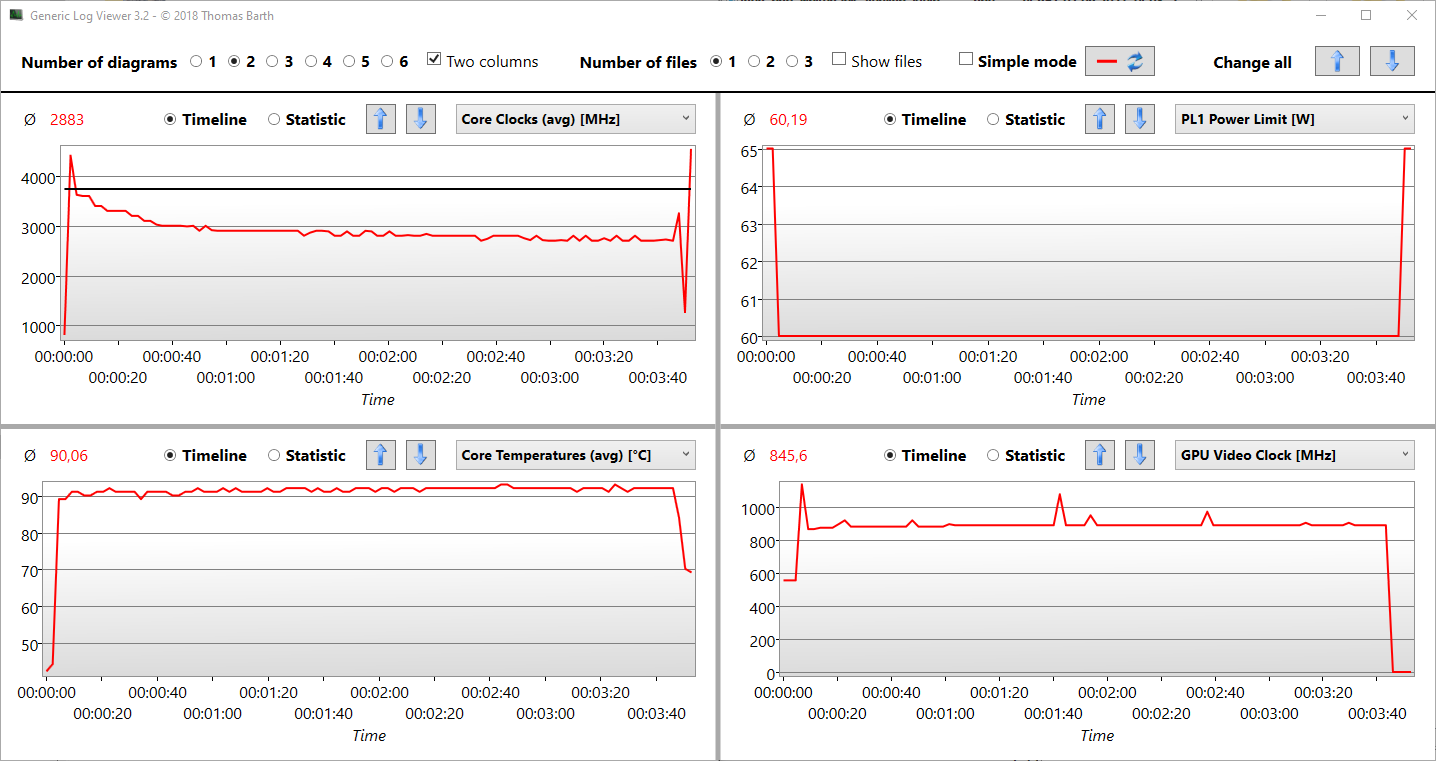
Sob carga de Prime95, a velocidade do relógio aumenta para 4,3 GHz por um ou dois segundos, após o que é atingida uma temperatura central de 90 ºC (194 ºF). A velocidade do relógio então cai para a faixa de 2,8 a 3,0 GHz, a fim de manter uma temperatura de cerca de 90 °C (194 °F). A diferença é que o modelo dGPU tenta manter 83 °C (181 °F), nivelando-se na faixa de 2,4 a 3,2-GHz.
(±) A temperatura máxima no lado superior é 43.4 °C / 110 F, em comparação com a média de 36.8 °C / 98 F , variando de 21 a 71 °C para a classe Multimedia.
(-) A parte inferior aquece até um máximo de 45.1 °C / 113 F, em comparação com a média de 39.1 °C / 102 F
(+) Em uso inativo, a temperatura média para o lado superior é 28.4 °C / 83 F, em comparação com a média do dispositivo de 31.3 °C / ### class_avg_f### F.
(+) Os apoios para as mãos e o touchpad estão atingindo a temperatura máxima da pele (34.8 °C / 94.6 F) e, portanto, não estão quentes.
(-) A temperatura média da área do apoio para as mãos de dispositivos semelhantes foi 28.7 °C / 83.7 F (-6.1 °C / -10.9 F).
| Dell Inspiron 16 Plus 7610-MHJ8F Intel Core i7-11800H, Intel UHD Graphics Xe 32EUs (Tiger Lake-H) | Dell Inspiron 16 Plus 7610 Intel Core i7-11800H, NVIDIA GeForce RTX 3050 4GB Laptop GPU | LG Gram 16 (2021) Intel Core i7-1165G7, Intel Iris Xe Graphics G7 96EUs | Lenovo Legion 5 Pro 16ACH6H (82JQ001PGE) AMD Ryzen 7 5800H, NVIDIA GeForce RTX 3070 Laptop GPU | Dell Inspiron 15 7000 7506 2-in-1 Black Edition Intel Core i7-1165G7, Intel Iris Xe MAX Graphics | Acer Aspire 5 A517-52G-79Z5 Intel Core i7-1165G7, NVIDIA GeForce MX350 | |
|---|---|---|---|---|---|---|
| Heat | -13% | 7% | -17% | -9% | 16% | |
| Maximum Upper Side * (°C) | 43.4 | 46.4 -7% | 46.9 -8% | 50 -15% | 43 1% | 35 19% |
| Maximum Bottom * (°C) | 45.1 | 54.8 -22% | 45.1 -0% | 55 -22% | 48.8 -8% | 40 11% |
| Idle Upper Side * (°C) | 30.6 | 31.4 -3% | 26.4 14% | 34 -11% | 31.6 -3% | 25.6 16% |
| Idle Bottom * (°C) | 31.1 | 36.6 -18% | 24.1 23% | 37 -19% | 38.6 -24% | 25.3 19% |
* ... menor é melhor
Dell Inspiron 16 Plus 7610-MHJ8F análise de áudio
(±) | o volume do alto-falante é médio, mas bom (###valor### dB)
Graves 100 - 315Hz
(-) | quase nenhum baixo - em média 19.5% menor que a mediana
(±) | a linearidade dos graves é média (11.1% delta para a frequência anterior)
Médios 400 - 2.000 Hz
(+) | médios equilibrados - apenas 4.6% longe da mediana
(+) | médios são lineares (6.4% delta para frequência anterior)
Altos 2 - 16 kHz
(±) | máximos mais altos - em média 6.1% maior que a mediana
(±) | a linearidade dos máximos é média (7.7% delta para frequência anterior)
Geral 100 - 16.000 Hz
(±) | a linearidade do som geral é média (22.5% diferença em relação à mediana)
Comparado com a mesma classe
» 80% de todos os dispositivos testados nesta classe foram melhores, 4% semelhantes, 16% piores
» O melhor teve um delta de 5%, a média foi 17%, o pior foi 45%
Comparado com todos os dispositivos testados
» 66% de todos os dispositivos testados foram melhores, 6% semelhantes, 28% piores
» O melhor teve um delta de 4%, a média foi 23%, o pior foi 134%
LG Gram 16 (2021) análise de áudio
(±) | o volume do alto-falante é médio, mas bom (###valor### dB)
Graves 100 - 315Hz
(-) | quase nenhum baixo - em média 18.8% menor que a mediana
(±) | a linearidade dos graves é média (12.2% delta para a frequência anterior)
Médios 400 - 2.000 Hz
(+) | médios equilibrados - apenas 2.2% longe da mediana
(+) | médios são lineares (5.4% delta para frequência anterior)
Altos 2 - 16 kHz
(+) | agudos equilibrados - apenas 2.5% longe da mediana
(+) | os máximos são lineares (3.7% delta da frequência anterior)
Geral 100 - 16.000 Hz
(+) | o som geral é linear (14.7% diferença em relação à mediana)
Comparado com a mesma classe
» 13% de todos os dispositivos testados nesta classe foram melhores, 4% semelhantes, 83% piores
» O melhor teve um delta de 7%, a média foi 21%, o pior foi 53%
Comparado com todos os dispositivos testados
» 19% de todos os dispositivos testados foram melhores, 4% semelhantes, 76% piores
» O melhor teve um delta de 4%, a média foi 23%, o pior foi 134%
Gerenciamento de energia
Consumo de energia
Durante a operação ociosa, o laptop usa um pouco mais de 5 watts no nível de brilho mais baixo e no perfil de desempenho que mais economiza energia. O máximo durante a operação ociosa é de 14 watts, o que é um valor moderado. Em cenários similares, o LG Gram 16 consome apenas entre 4 e 11 watts. O Inspiron 16 Plus 7610 correspondente com Geforce consome entre 8 e 17 watts, apesar de seu dGPU ser desligado pela chaveamento Optimus.
Sob carga, as diferenças são naturalmente enormes. Sob carga extremamente alta, medimos um consumo máximo de apenas 76 watts na fonte de alimentação de 130 watts. Como mostra o gráfico abaixo, o modelo iGPU é capaz de consumir mais potência (teste de estresse com Prime95 e Furmark), atingindo 100 watts. Durante o teste de estresse, ele se situa em 90 watts. Executando o Ultra Witcher 3, ele varia em torno de uma média de 44 watts.
| desligado | |
| Ocioso | |
| Carga |
|
Key:
min: | |
Power Consumption The Witcher 3 / Stress Test
| Dell Inspiron 16 Plus 7610-MHJ8F i7-11800H, UHD Graphics Xe 32EUs (Tiger Lake-H), OM3PDP3-AD NVMe KDI 512GB, IPS, 3072x1920, 16" | Dell Inspiron 16 Plus 7610 i7-11800H, GeForce RTX 3050 4GB Laptop GPU, Kingston OM3PDP3512B, IPS, 3072x1920, 16" | LG Gram 16 (2021) i7-1165G7, Iris Xe G7 96EUs, SK Hynix PC601 1TB HFS001TD9TNG, IPS, 2560x1600, 16" | Lenovo Legion 5 Pro 16ACH6H (82JQ001PGE) R7 5800H, GeForce RTX 3070 Laptop GPU, WDC PC SN730 SDBPNTY-1T00, IPS, 2560x1600, 16" | Dell Inspiron 15 7000 7506 2-in-1 Black Edition i7-1165G7, Xe MAX, Micron 2300 1TB MTFDHBA1T0TDV, IPS, 3840x2160, 15.6" | Acer Aspire 5 A517-52G-79Z5 i7-1165G7, GeForce MX350, WDC PC SN530 SDBPNPZ-1T00, IPS, 1920x1080, 17.3" | |
|---|---|---|---|---|---|---|
| Power Consumption | -69% | 24% | -129% | -17% | 16% | |
| Idle Minimum * (Watt) | 5.4 | 7.7 -43% | 3.8 30% | 10.45 -94% | 4 26% | 4.1 24% |
| Idle Average * (Watt) | 9.8 | 10.7 -9% | 9 8% | 14.92 -52% | 15.5 -58% | 7.8 20% |
| Idle Maximum * (Watt) | 14 | 16.8 -20% | 11.3 19% | 16.02 -14% | 16.2 -16% | 10 29% |
| Load Average * (Watt) | 44 | 100.39 -128% | 35.2 20% | 119.65 -172% | 49.7 -13% | 47 -7% |
| Witcher 3 ultra * (Watt) | 44 | 108 -145% | 174.9 -298% | 52.2 -19% | ||
| Load Maximum * (Watt) | 76.8 | 129 -68% | 43.5 43% | 187.26 -144% | 92.7 -21% | 64.7 16% |
* ... menor é melhor
Vida útil da bateria
A diferença na duração da bateria das versões iGPU e dGPU é apenas marginal no teste WiFi, e o modelo Geforce dura aqui até alguns minutos mais. Por outro lado, sob carga, o modelo iGPU é capaz de durar mais 50 minutos (Battery Eater Classic). O modelo iGPU também ganha em termos de duração da bateria ociosa, e um acréscimo de 120 minutos permite que a unidade de teste dure 22:30 horas. No entanto, este valor não é realmente realista, já que é medido com brilho mínimo e no modo Avião. Os 86 Wh são idênticos em ambos os modelos.
| Dell Inspiron 16 Plus 7610-MHJ8F i7-11800H, UHD Graphics Xe 32EUs (Tiger Lake-H), 86 Wh | Dell Inspiron 16 Plus 7610 i7-11800H, GeForce RTX 3050 4GB Laptop GPU, 86 Wh | LG Gram 16 (2021) i7-1165G7, Iris Xe G7 96EUs, 80 Wh | Lenovo Legion 5 Pro 16ACH6H (82JQ001PGE) R7 5800H, GeForce RTX 3070 Laptop GPU, 80 Wh | Dell Inspiron 15 7000 7506 2-in-1 Black Edition i7-1165G7, Xe MAX, 68 Wh | Acer Aspire 5 A517-52G-79Z5 i7-1165G7, GeForce MX350, 50.2 Wh | Média da turma Multimedia | |
|---|---|---|---|---|---|---|---|
| Duração da bateria | -8% | 32% | -56% | -16% | -36% | -7% | |
| Reader / Idle (h) | 22.5 | 20.5 -9% | 28.6 27% | 9.1 -60% | 25 11% | 13.8 -39% | 24.9 ? 11% |
| WiFi (h) | 9.5 | ||||||
| WiFi v1.3 (h) | 9.5 | 9.9 4% | 15.7 65% | 7 -26% | 9.7 2% | 7.4 -22% | 12.3 ? 29% |
| Load (h) | 4.1 | 3.3 -20% | 4.3 5% | 0.7 -83% | 1.6 -61% | 2.2 -46% | 1.645 ? -60% |
| H.264 (h) | 20.1 | 4.9 | 16.8 ? | ||||
| Witcher 3 ultra (h) | 1.3 |
Pro
Contra
Veredicto - Mais frio e mais resistência

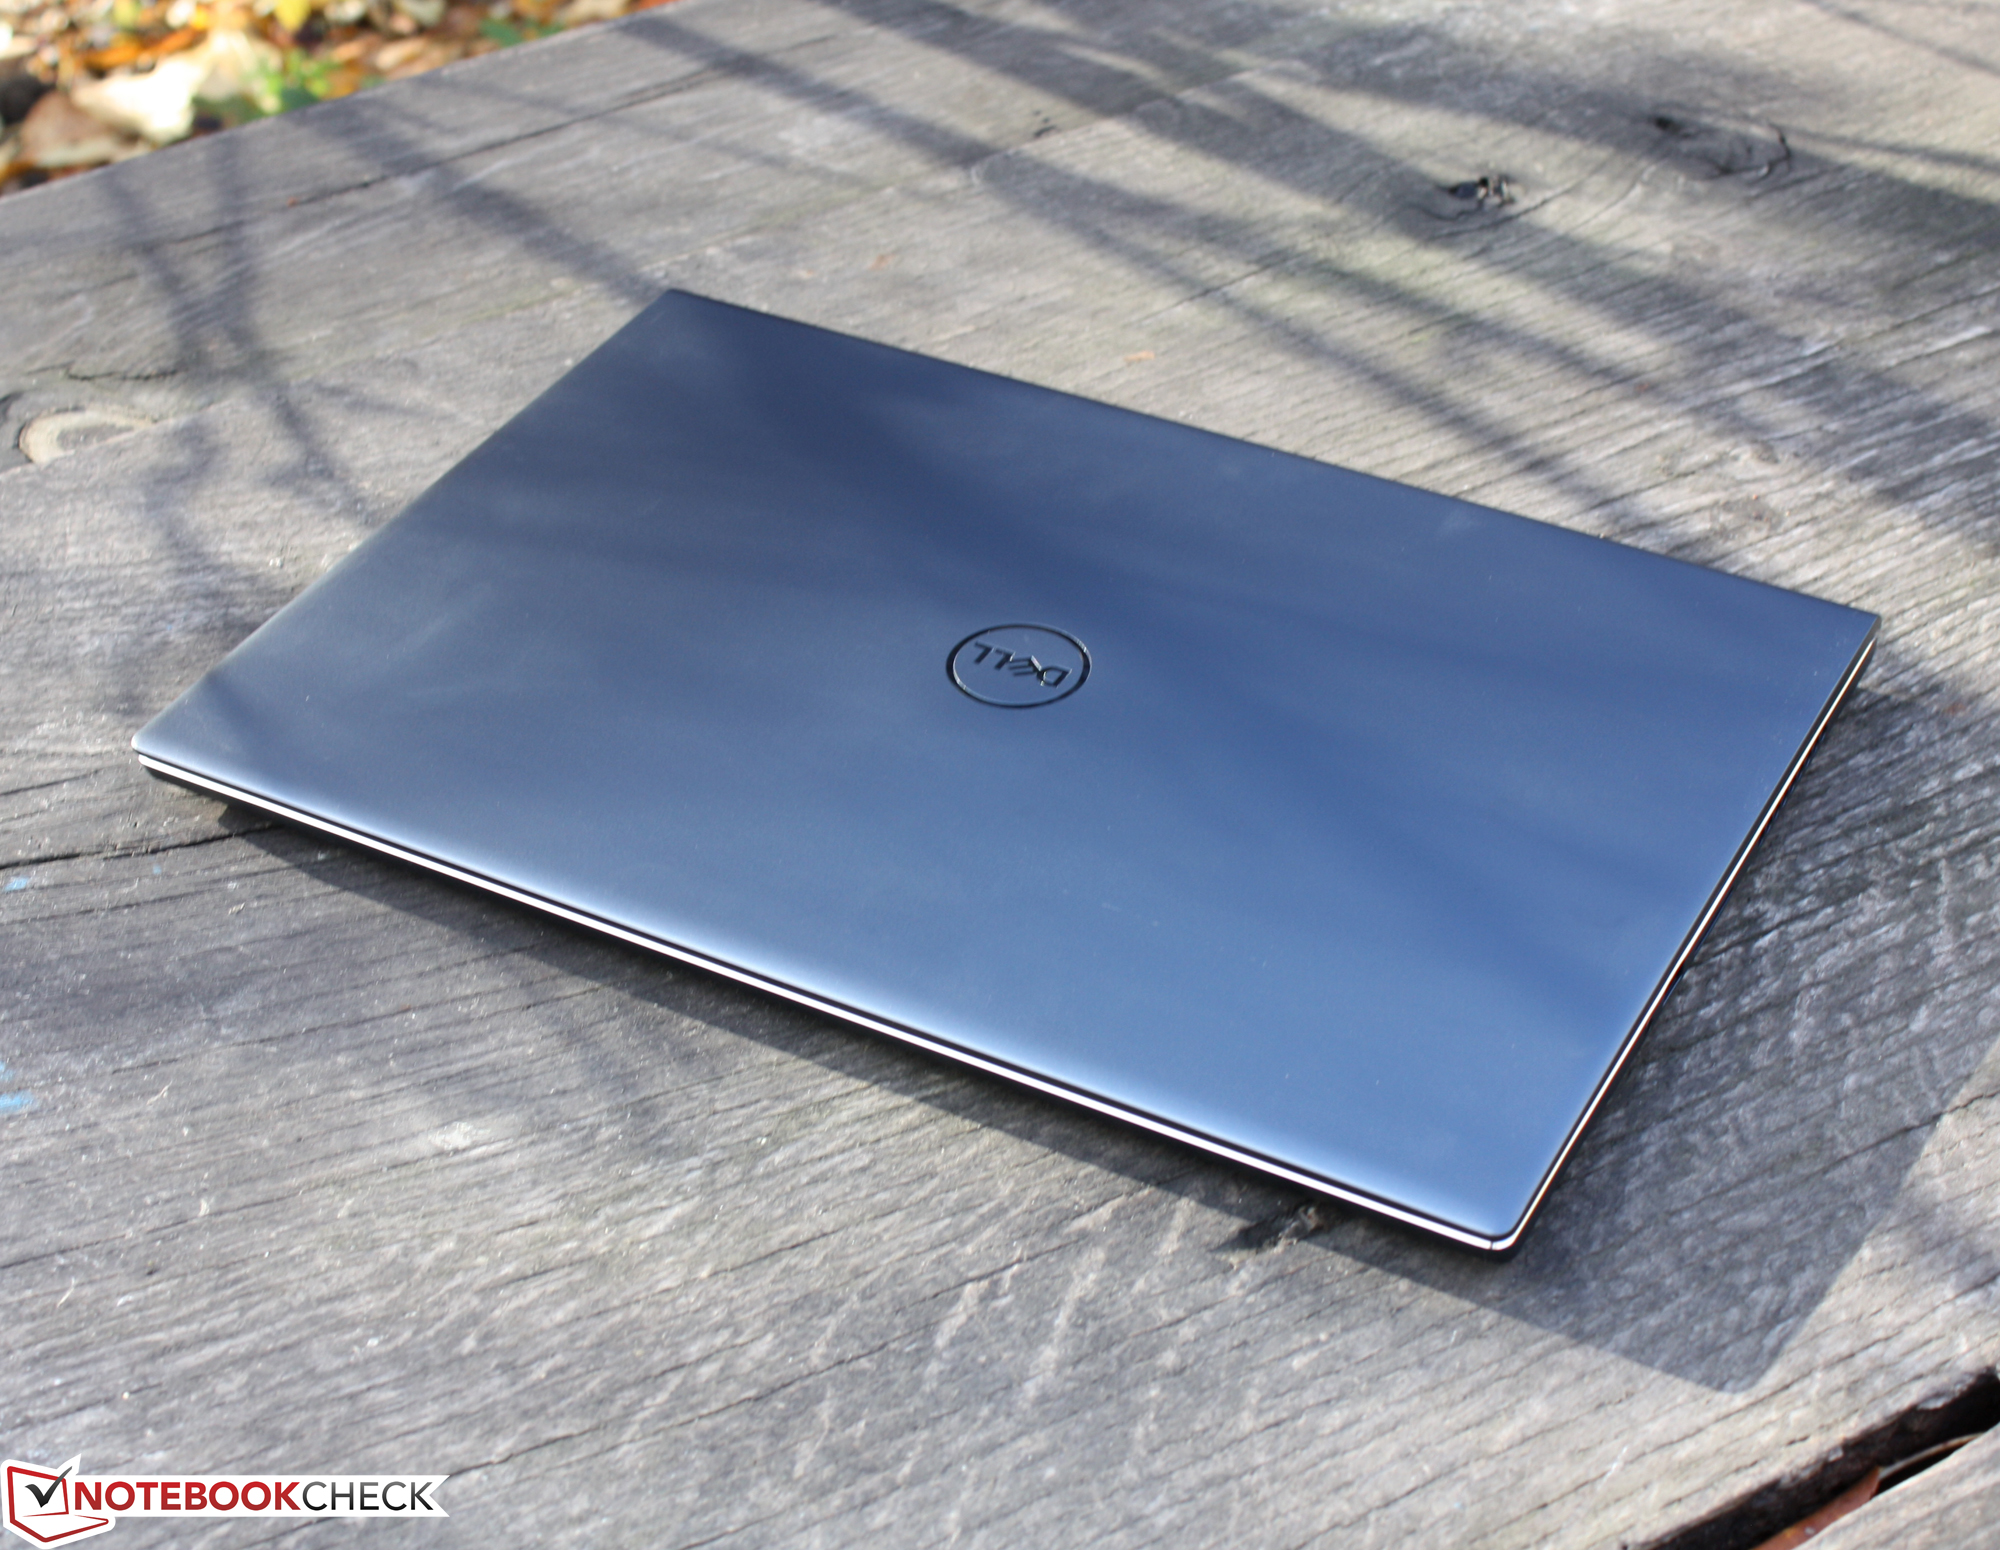
O Inspiron 16 é um laptop para se exibir: A caixa de metal pesado comunica uma qualidade táctil que se aproxima da do mais caro XPS 15. As luneiras são finas, e o equipamento de conexão é extenso. A manutenção revela-se fácil, e a tela 3K fosca cobre perfeitamente todo o pacote.
No desempenho, as coisas não parecem tão boas. Em comparação com os concorrentes com equipamento similar ou quase similar, a CPU é mais lenta do que o esperado, o que também é o caso do modelo iGPU. Entretanto, nossa unidade de teste foi capaz de alcançar um pouco em termos de pontos, o que significa que inicialmente foi computada mais rapidamente do que a versão com o chip gráfico Nvidia.
Enquanto o Dell Inspiron 16 Plus 7610 compartilha as vantagens de seu modelo irmão, ele prescinde do desempenho dos gráficos da Geforce. Isto traz uma maior vida útil da bateria, menor consumo de energia e um estojo mais frio.
Aqueles que se sentem entusiasmados com o Inspiron 16 Plus 7610 em geral, mas estão considerando se a versão mais acessível do iGPU é suficiente, devem entender isto: Não há diferença na vida útil da bateria WiFi, que é a medida mais realista na prática. Entretanto, a unidade de teste dura mais tempo durante a operação ociosa ou sob carga constante. Seu funcionamento é mais eficiente, e não aquece tanto sob carga. Assim, aqueles que estão procurando um companheiro de escritório de 16 polegadas com um bom visor de 3K não ficarão desapontados com o Inspiron 16 Plus 7610
Atualmente, a diferença de preço entre nossa unidade de teste iGPU (1200 Euros = ~$1348, i7, 512 GB, 16 GB, versão loja) e a versão mais acessível da Geforce com um RTX 3050, mas equipamentos similares são 200 Euros (~$225). Se você escolher o i5, é apenas uma diferença de 50 euros (~$56).
Uma alternativa mais poderosa e acessível para a Dell é oLegion 5 Proda Lenovo, que pontua com um Ryzen 5000H mais potente e já inclui um RTX 3050 Ti junto com um display de 165-Hz por 1300 Euros (~$1461). OLG Gramm 16coloca o foco no baixo peso e uma vida útil consideravelmente maior da bateria com um desempenho inferior. Aqueles para quem tudo isso é muito caro, podem dar uma olhada nas 17 polegadas Acer Aspire 5 A517. Por apenas 800 Euros (~$899), você obtém menos exibição e um desempenho menor do que com o iGPU Dell, mas um dGPU de nível básico.
Preço e Disponibilidade
A unidade de teste configurada com um i7-11800H, 16 GB de RAM, e 512-GB SSD está atualmente disponível em Dell por $999.
Dell Inspiron 16 Plus 7610-MHJ8F
- 11/22/2021 v7 (old)
Sebastian Jentsch
Price comparison

