
Veredicto
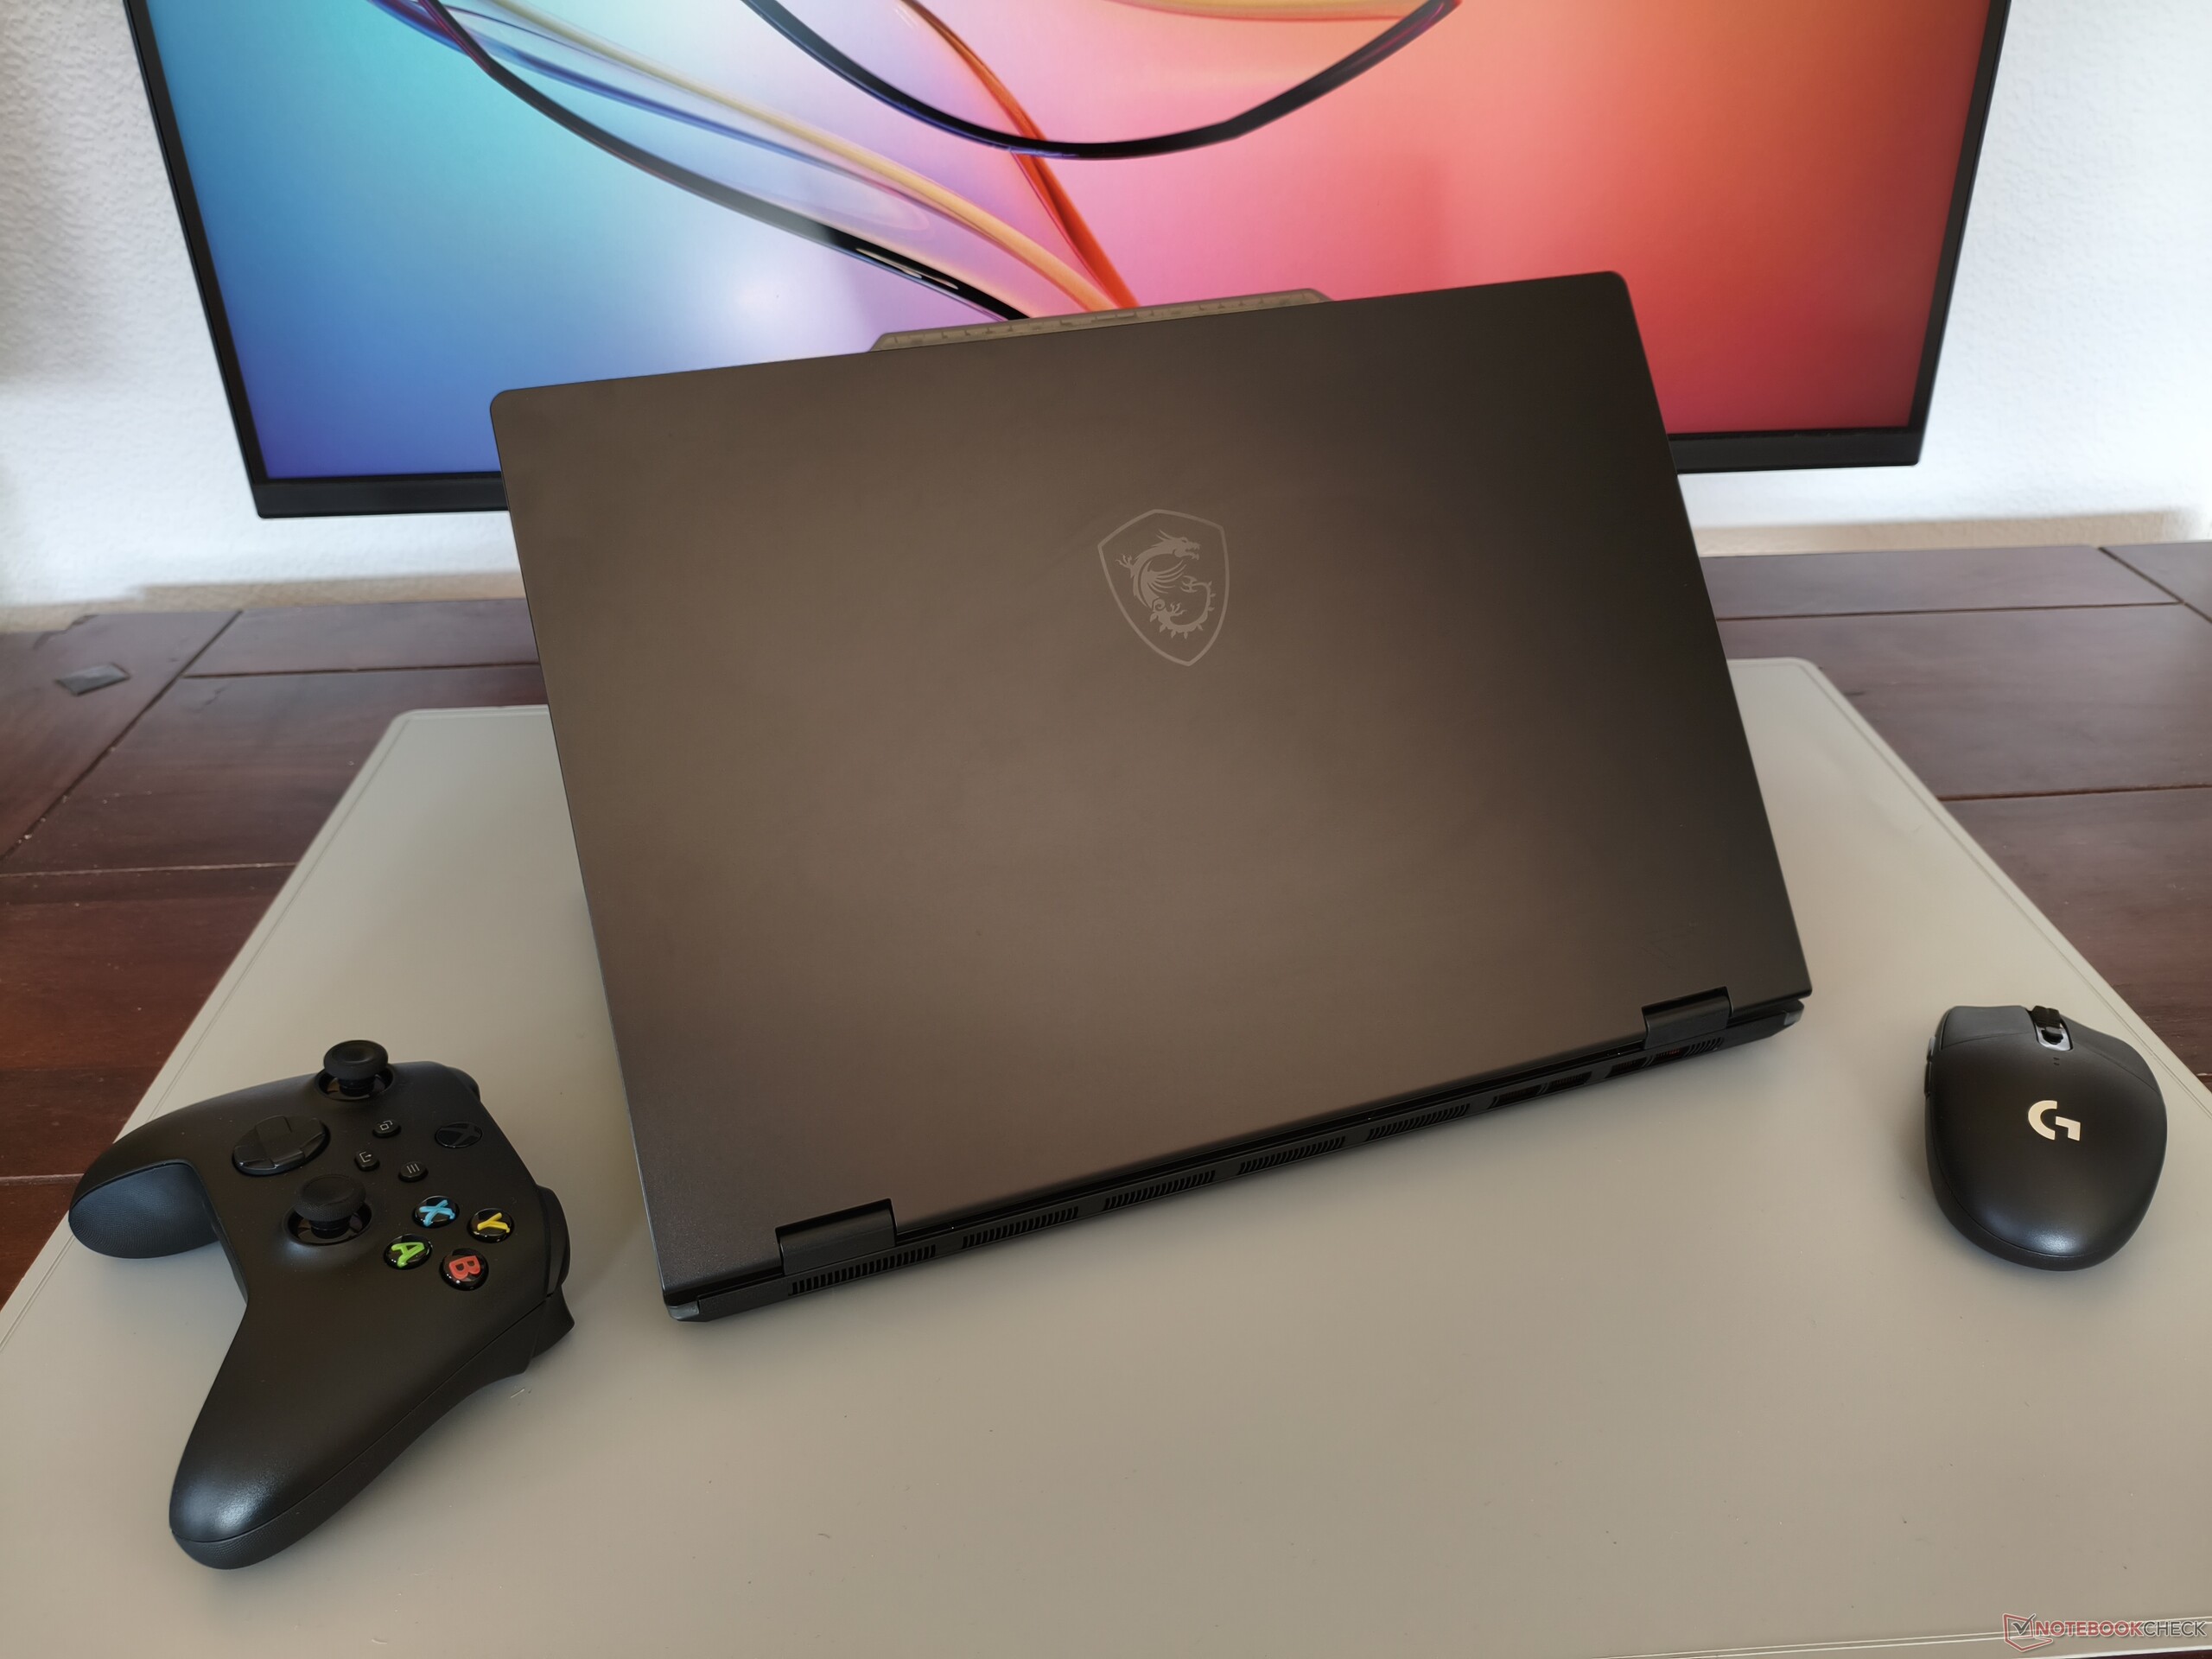
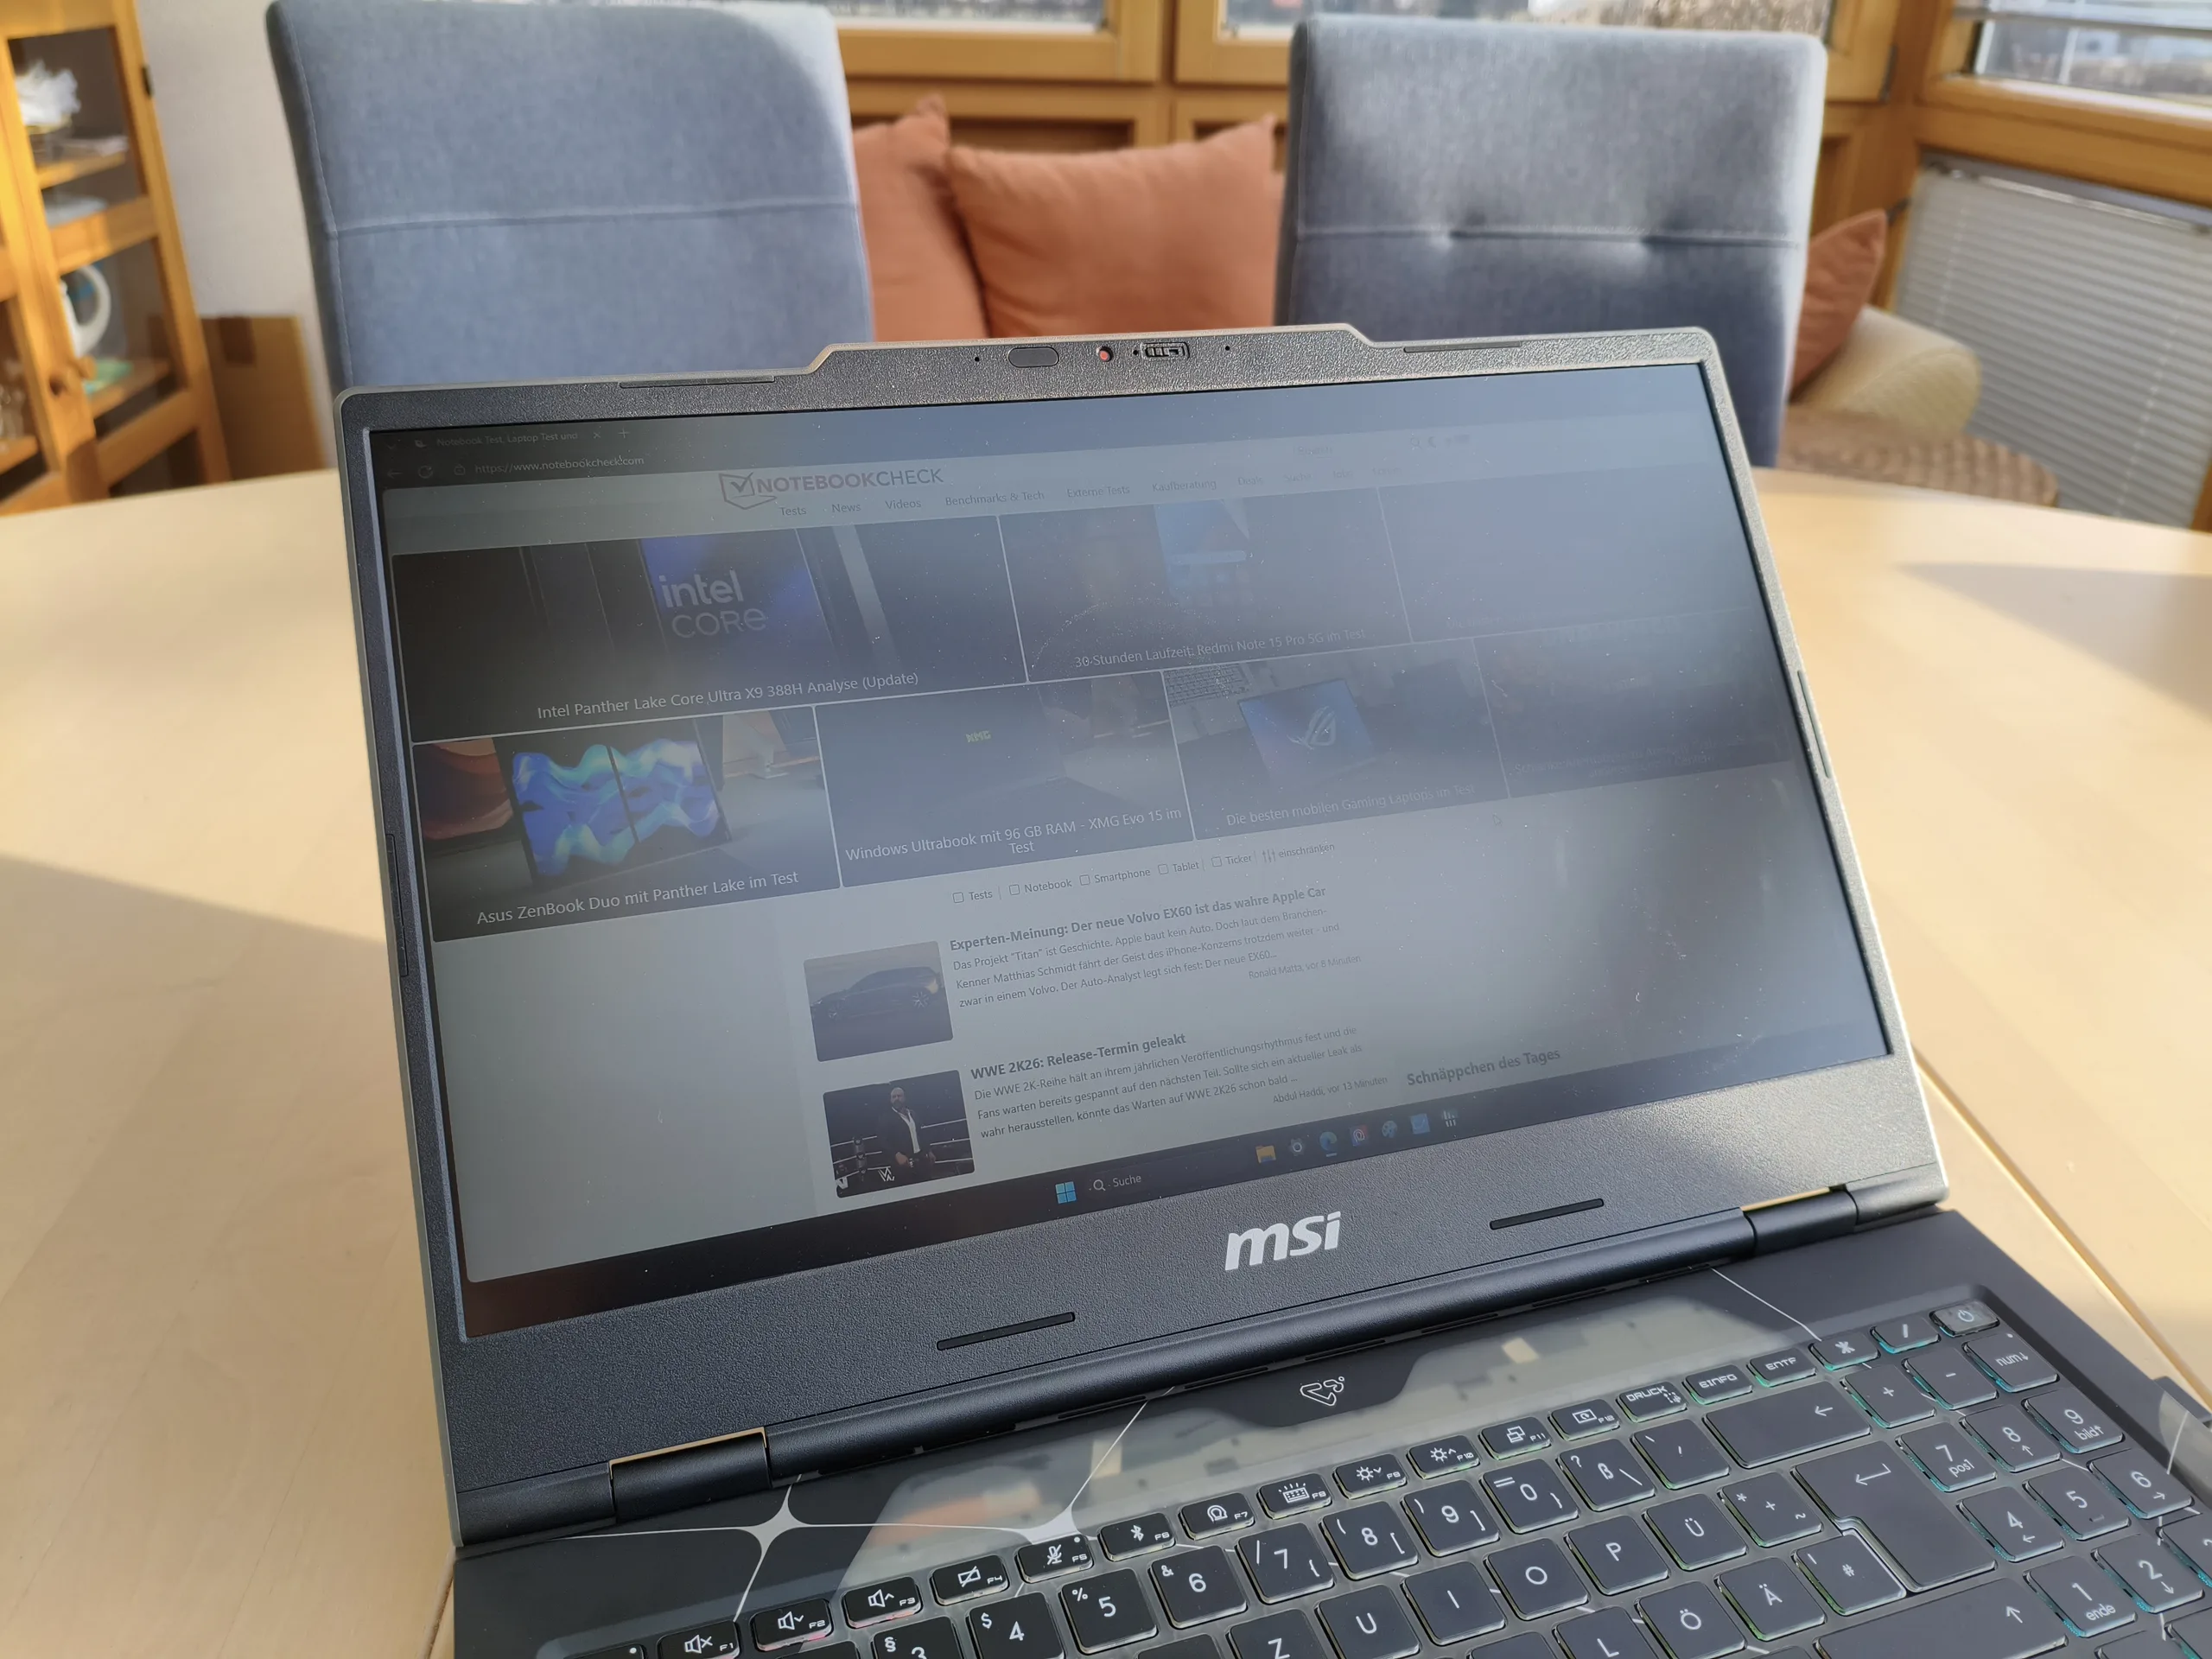
Se o senhor está procurando um notebook para jogos que se destaque da multidão, o Cyborg 15 é a escolha certa. Embora a tampa da tela ainda seja relativamente pouco espetacular, a parte superior da unidade básica chama a atenção com seu padrão e elementos transparentes. Para comparação: o 2023 testado antecessor com RTX 4060 era mais discreto aqui. Infelizmente, quase nada mudou na tela. A nova versão também tem que se contentar com um espaço de cor pequeno, que seria mais adequado para um notebook de escritório de 400 euros (~$472).
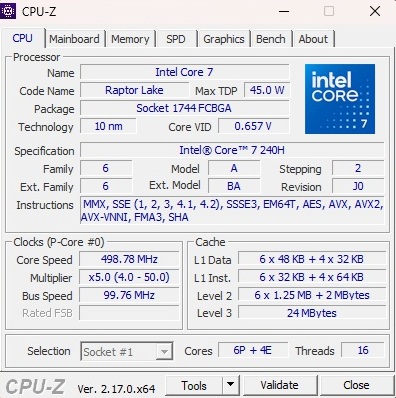
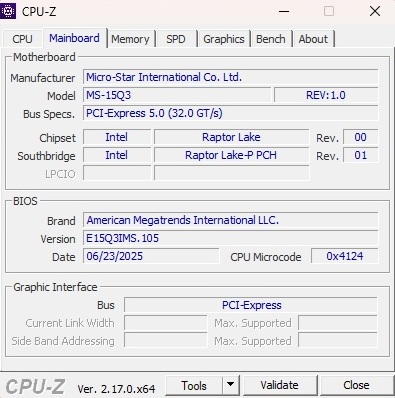
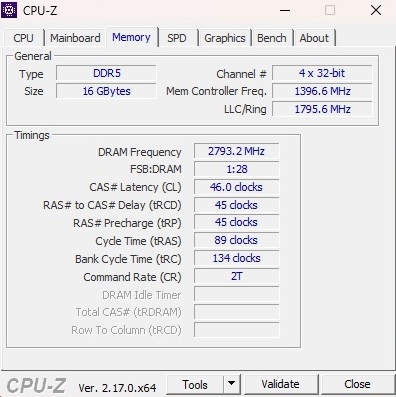
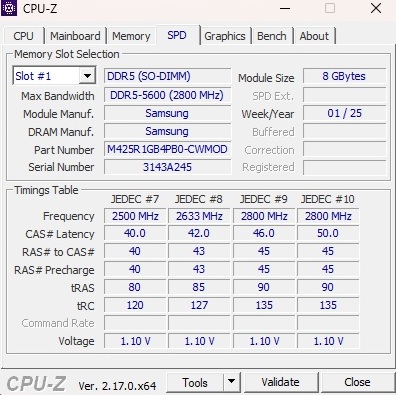
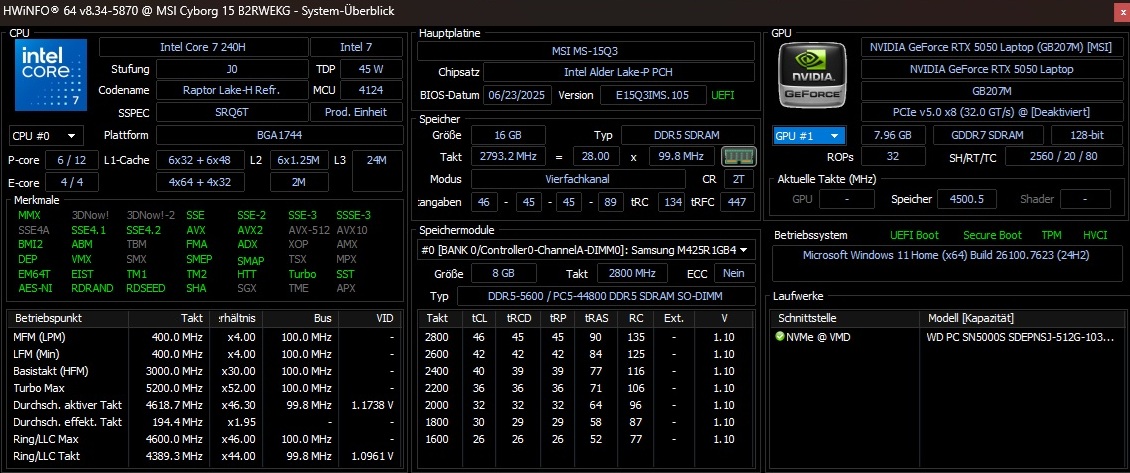
A potência da placa de vídeo também é digna de discussão: Como a MSI só dá à RTX 5050 um magro TGP de 45 watts, o desempenho da GPU fica aquém de seu potencial, como mostraremos no decorrer do artigo, embora o desenvolvimento de ruído seja limitado. O resto do equipamento é sólido, mas não luxuoso para o preço, com um Core 7 240H, 16 GB de RAM DDR5 (2x 8 GB) e um SSD de 512 GB. Enquanto isso, há pontos positivos para o obturador de privacidade da webcam, o que não é comum em laptops para jogos em particular.
Os concorrentes do Cyborg 15 incluem outros notebooks RTX 5050 e RTX 5060, como o Acer Nitro V 15o HP Victus 15 e o Lenovo LOQ 15que se encontram em regiões de classificação semelhantes. Se o senhor estiver disposto a gastar um pouco mais de dinheiro, deve ler o teste do Lenovo Legion 5 15que quase recebeu uma classificação muito boa.
Pro
Contra
Preço e disponibilidade
O MSI Cyborg 15 B2RWEKG testado está disponível por cerca de 1.100 euros (~$1298) em várias lojas on-line (por exemplo, Galaxus).
- $1,298.94MSI Cyborg 15 B2RWEKG-293US .6" Gaming Notebook - Full HD - 144 Hz - Intel Core 7 240H - 16 GB - 1 TB SSD - Translucent Black
- $1,298.94MSI Cyborg 15 B2RWEKG-258US 15.6" Full HD 144Hz Gaming Laptop, Intel Core 5 210H 2.2GHz, 16GB RAM, 1TB SSD, NVIDIA GeForce RTX 5050 8GB, Windows 11 Home, Translucent Black
- $1,399.99msi 15.6 Inch Cyborg 15 Gaming Laptop Intel Core 7 240H NVIDIA GeForce RTX 5060 32GB RAM 1TB SSD 144Hz FHD Display WiFi 6 Bluetooth Windows 11 12 Month CPS Warranty
Especificações
Alojamento
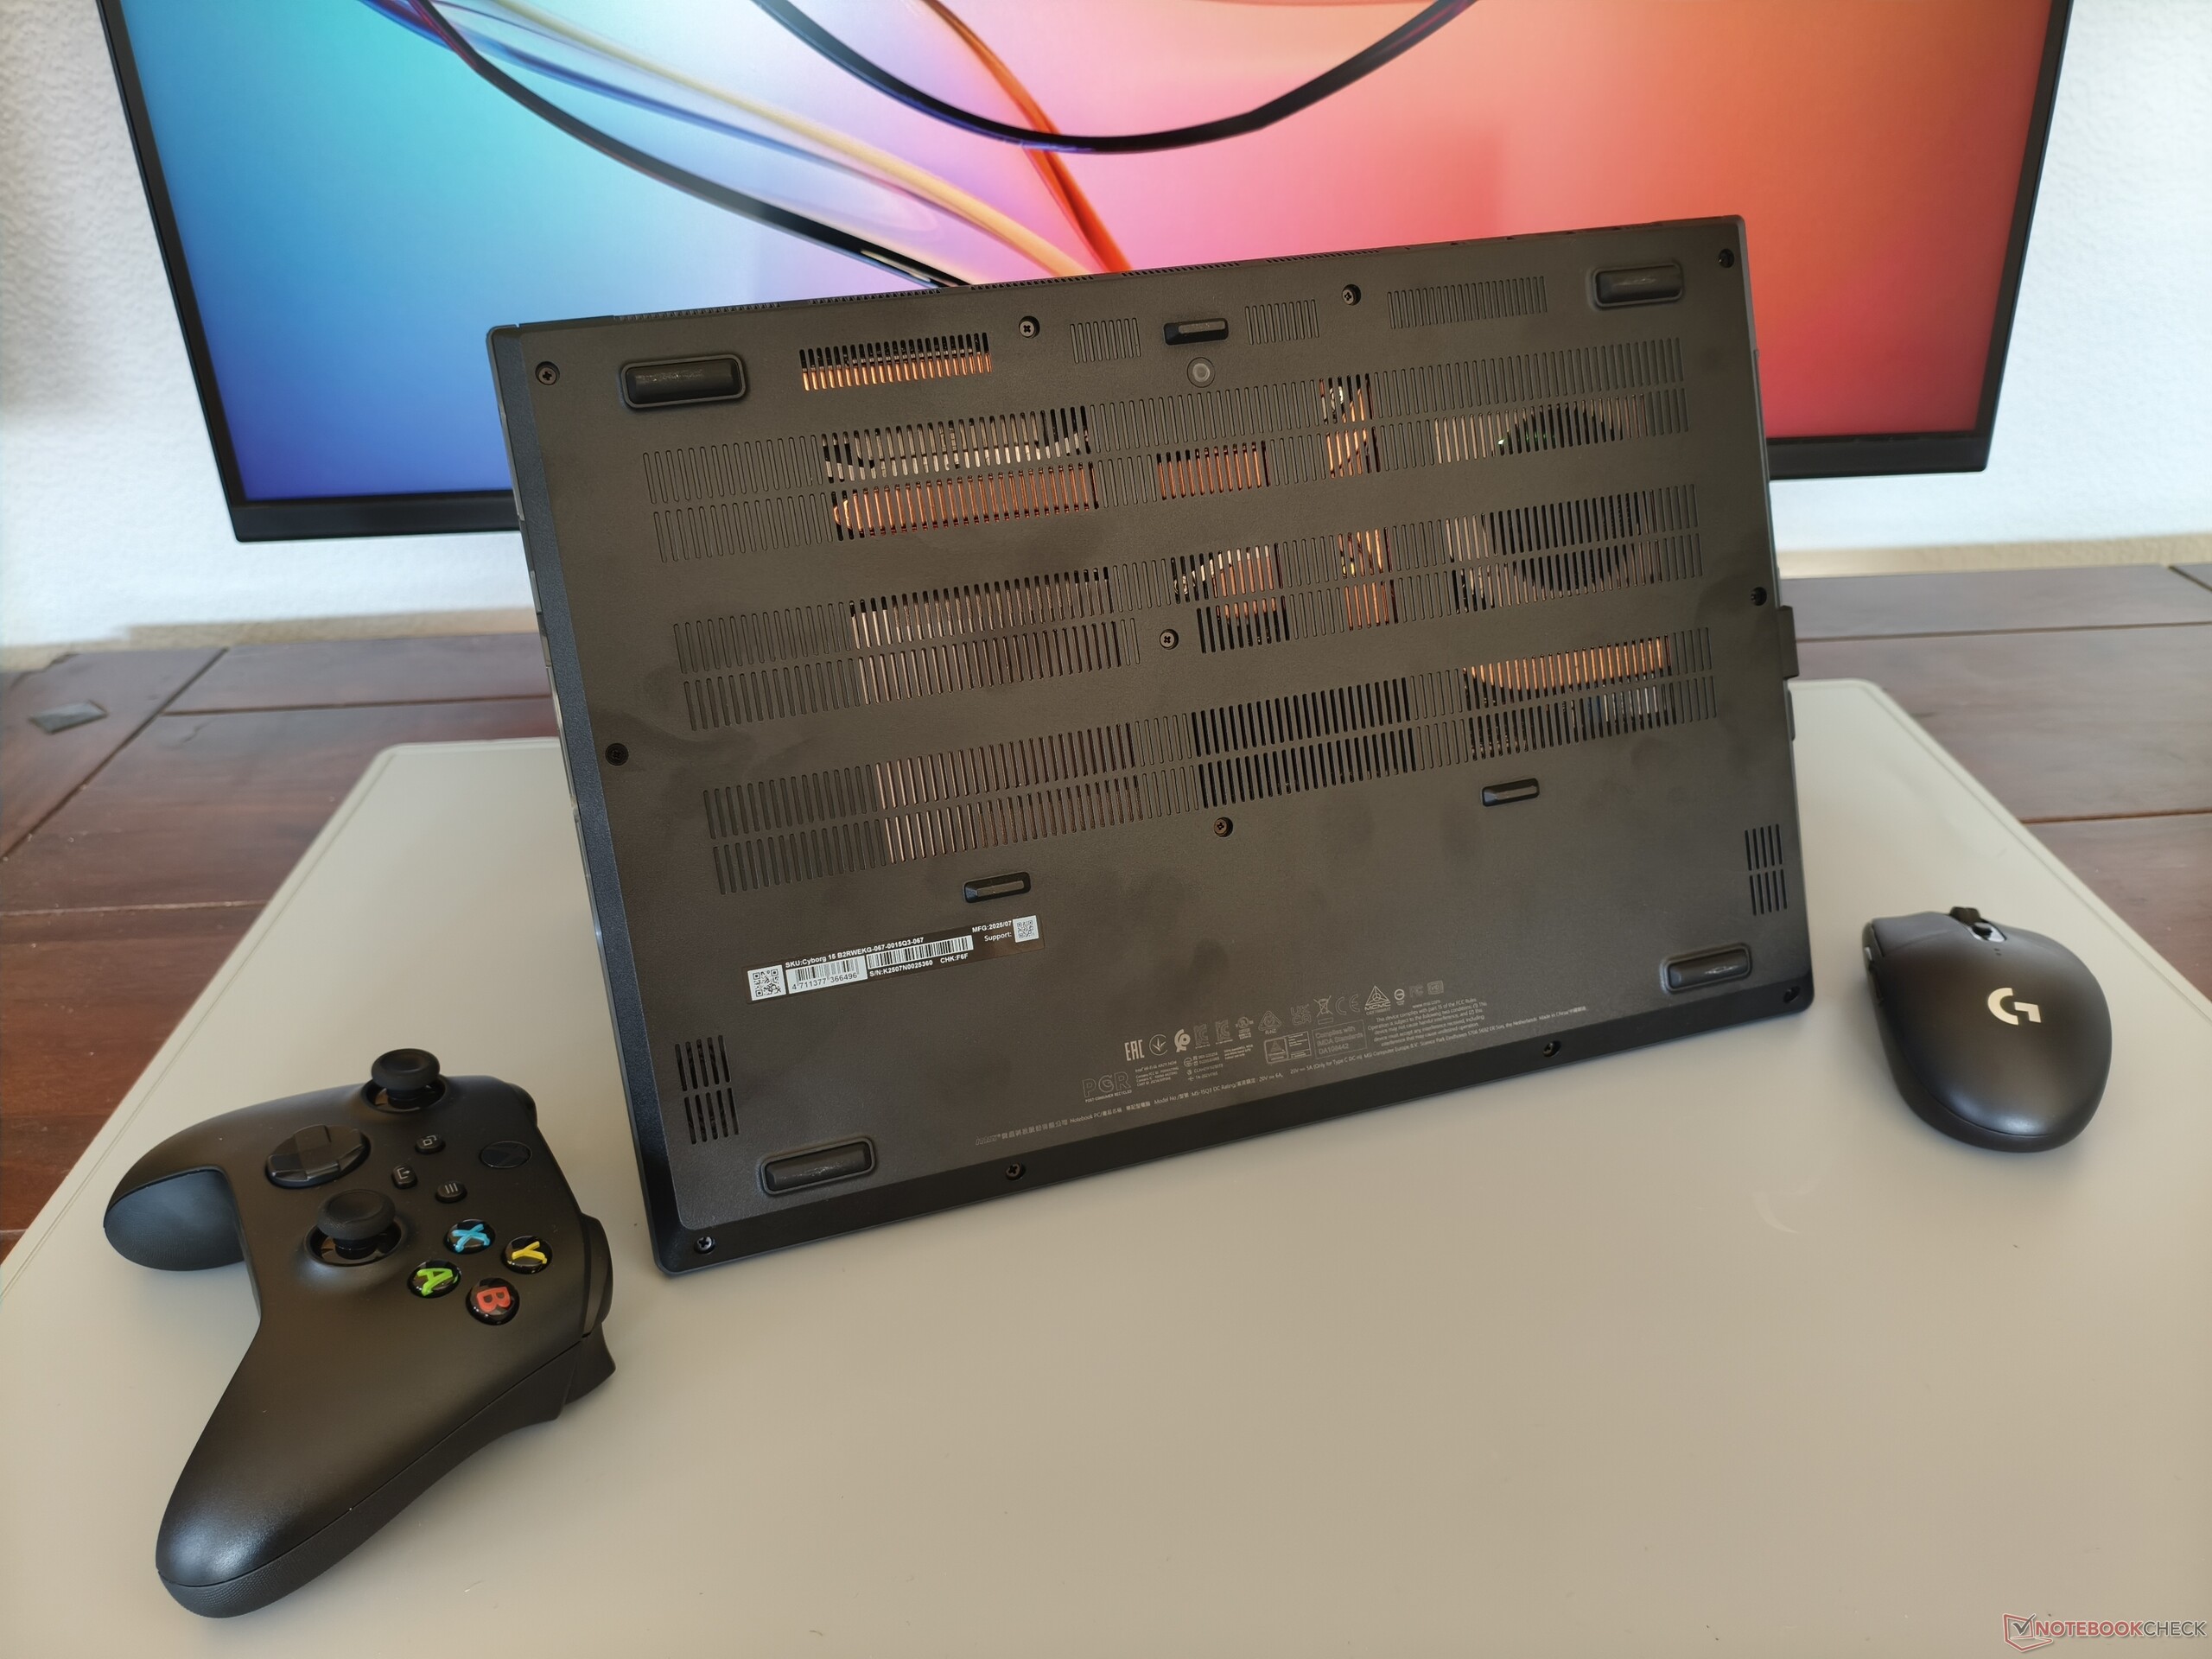
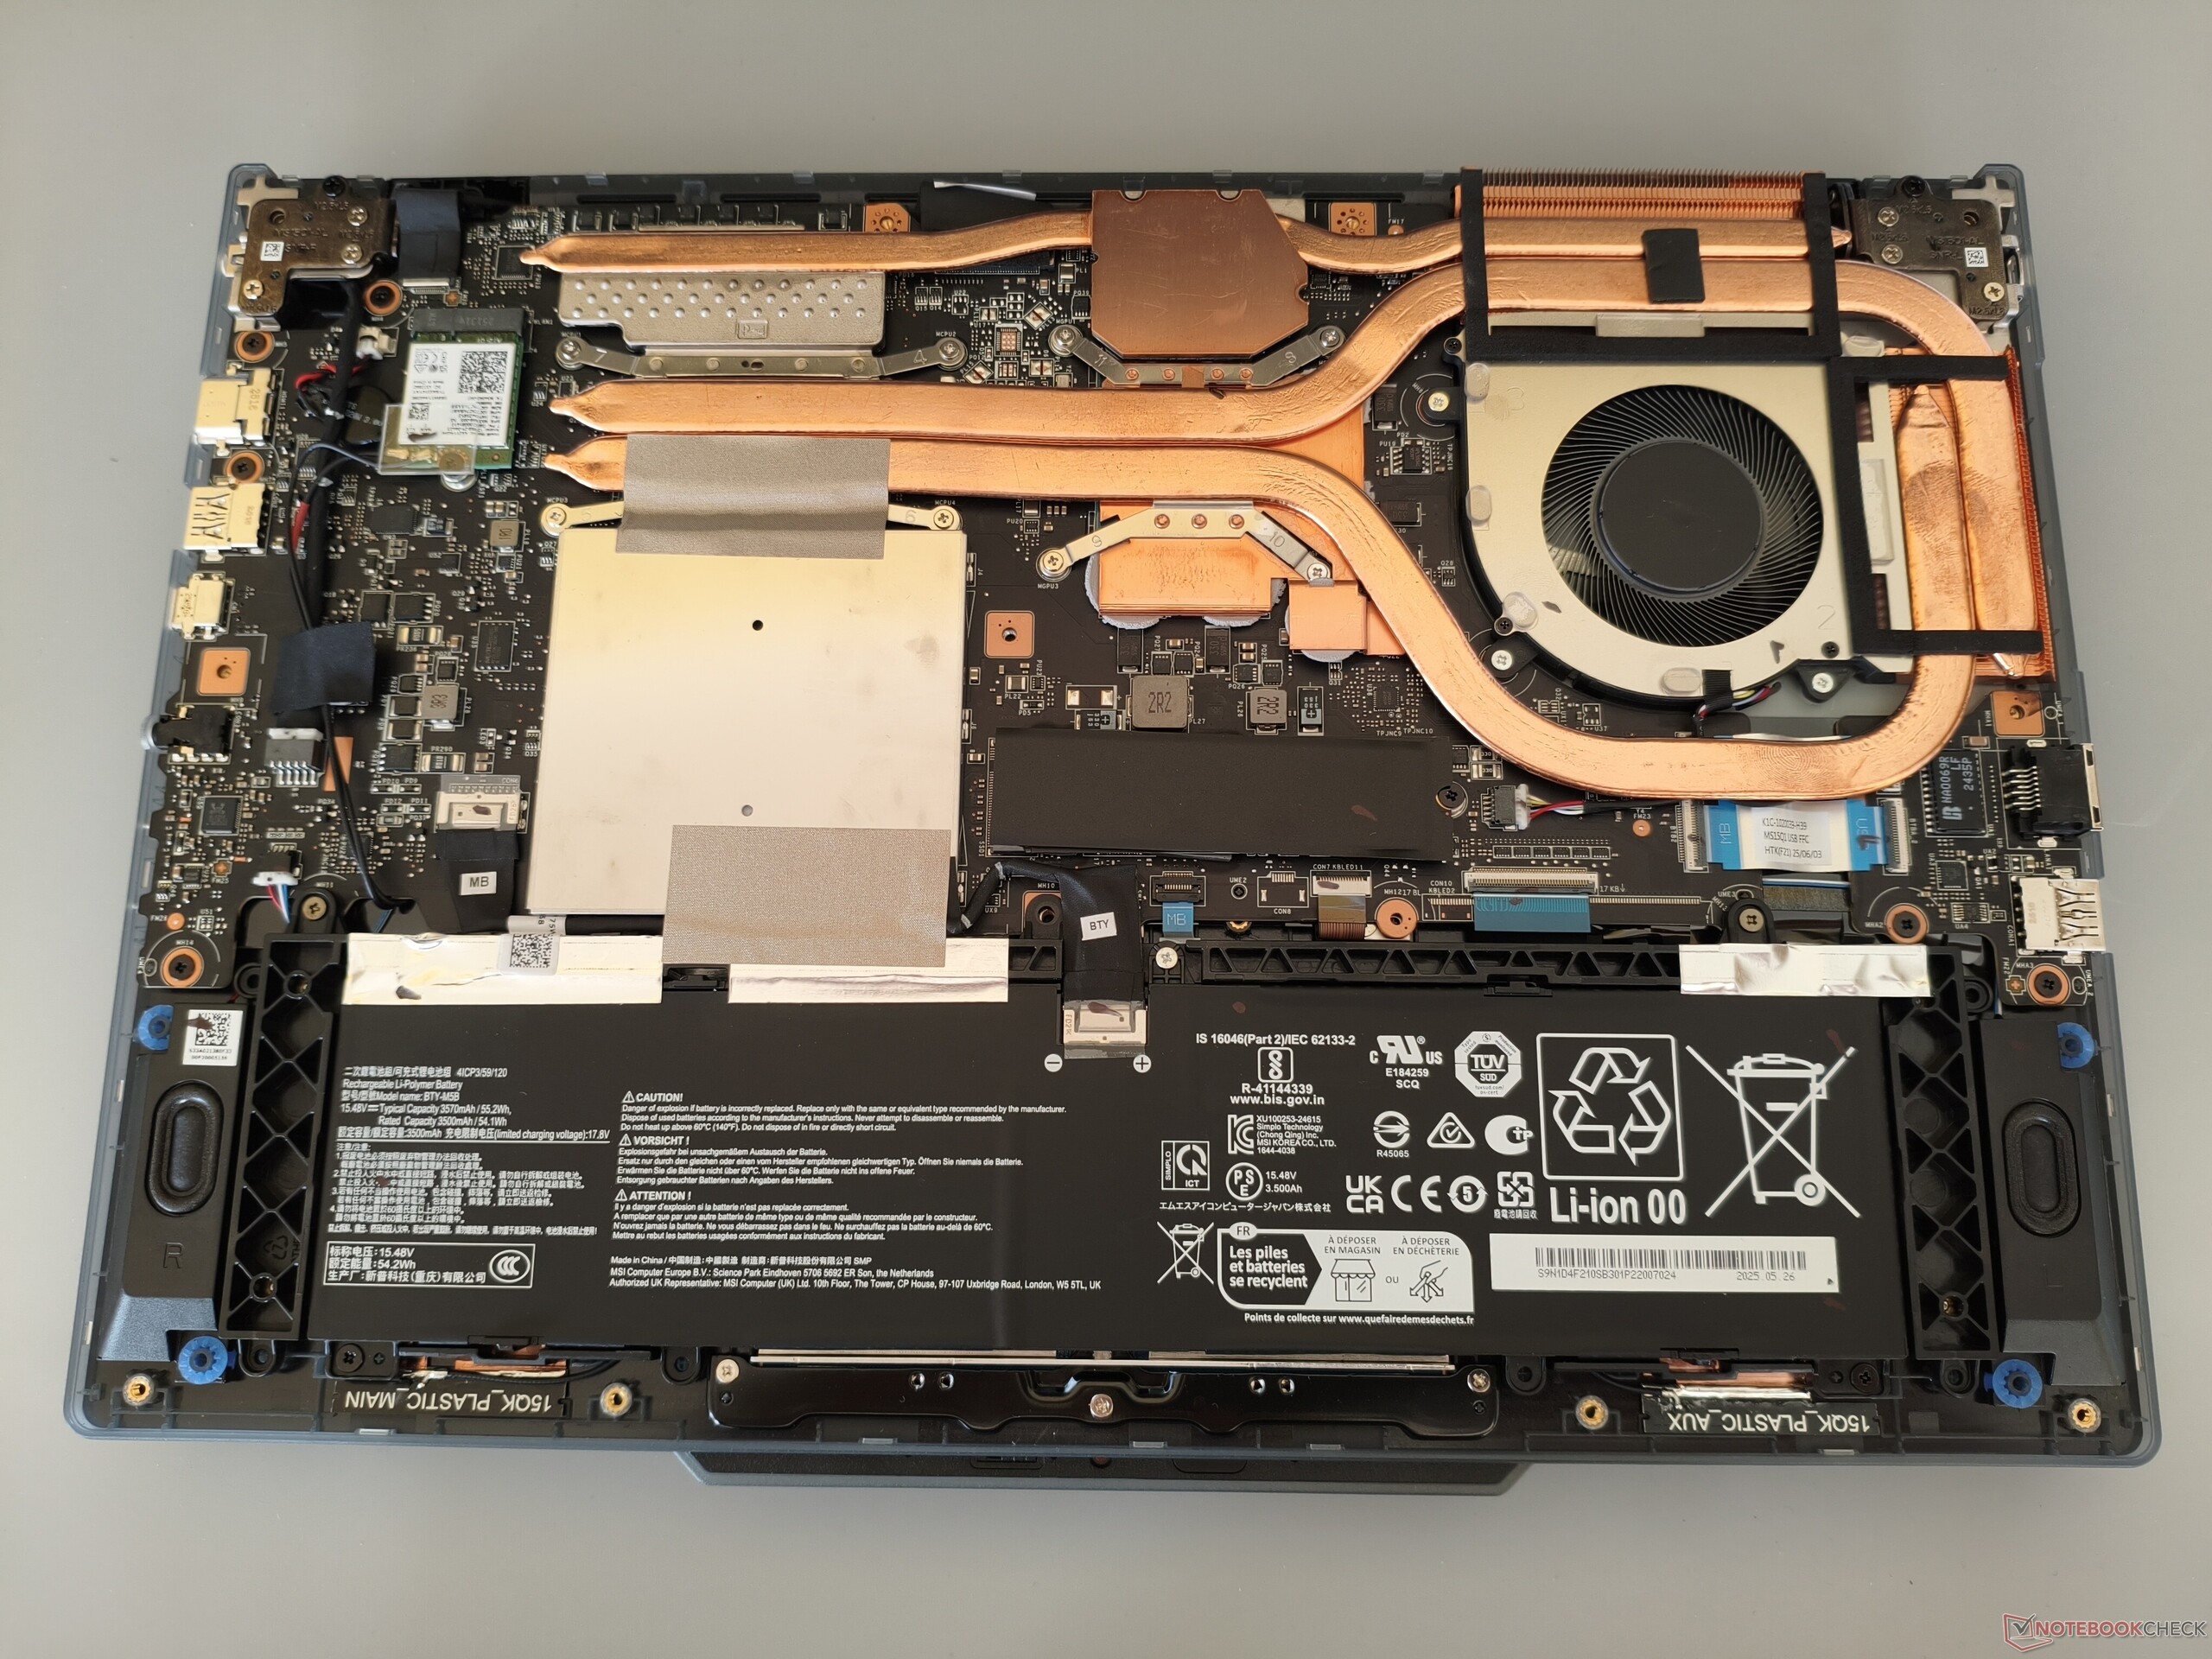
A caixa é composta por uma mistura de metal (tampa) e plástico (unidade de base). Em sua maior parte, o acabamento e a estabilidade não são motivo de crítica. A MSI merece um elogio especial pelo generoso ângulo de abertura de 180°. Com um peso de pouco menos de 2,2 kg (~4,9 lbs), o Cyborg 15 se situa confortavelmente no meio da concorrência, que pesa entre 1,9 e 2,4 kg (~4,2 e 5,3 lbs). Para abrir o gabinete, é necessário remover 12 parafusos Phillips. O senhor pode ver como é a aparência do gabinete nas fotos abaixo.
Equipamentos
A conectividade acaba sendo bastante escassa. Embora haja uma porta LAN Gigabit, não há leitor de cartões. Enquanto isso, gostaríamos de ver padrões mais modernos para as portas USB; o Thunderbolt, por exemplo, não está presente. De qualquer forma, o módulo sem fio da Intel é agradavelmente rápido, especialmente ao receber dados. Como acontece com a maioria dos laptops, a webcam deixa muito a desejar em termos de nitidez da imagem, entre outras coisas.
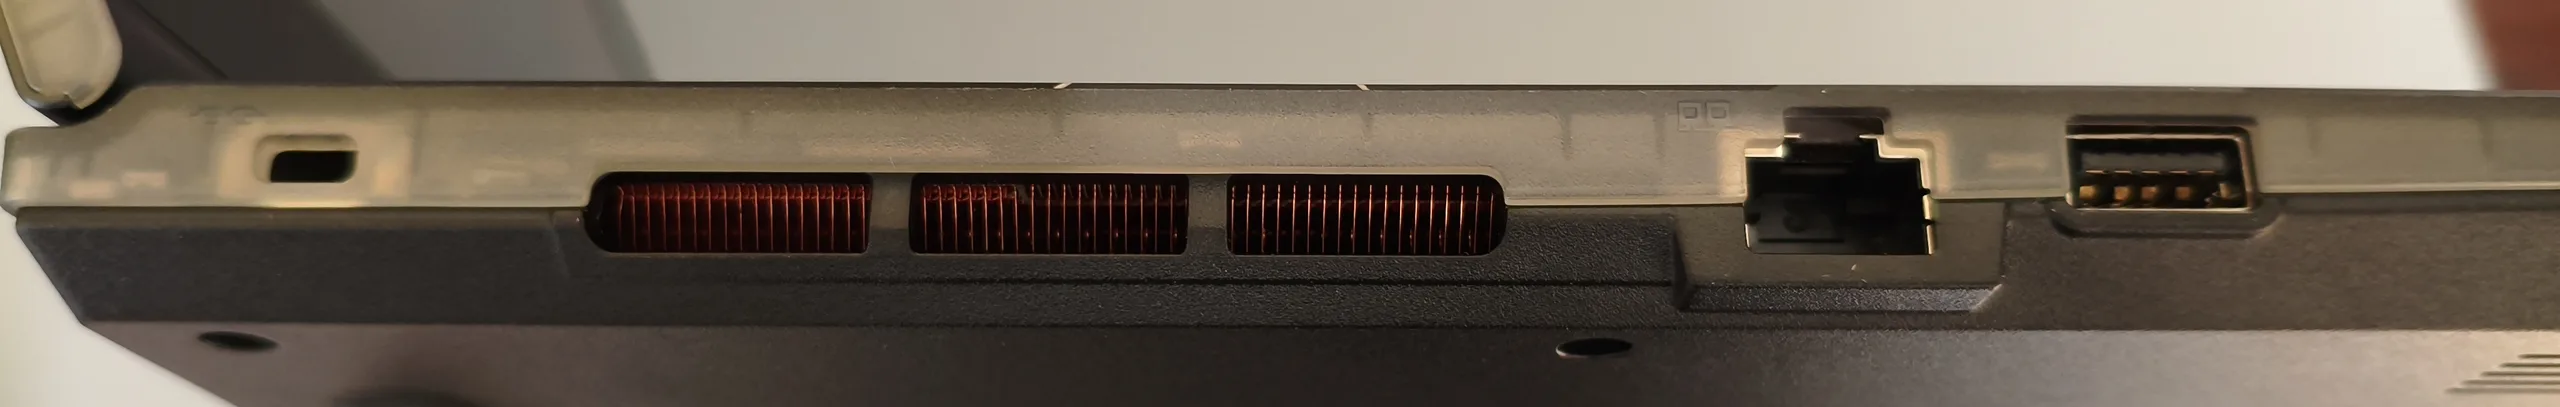
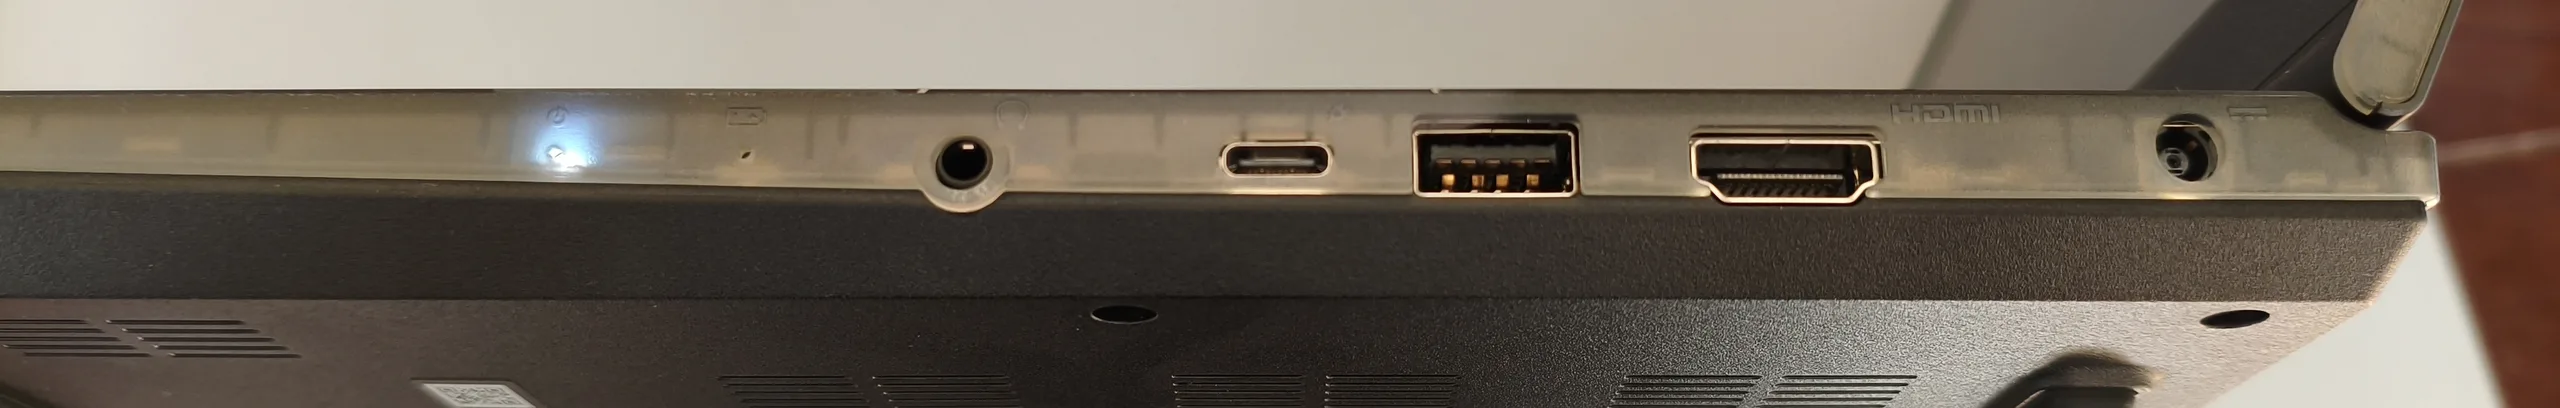
Comunicação
Webcam


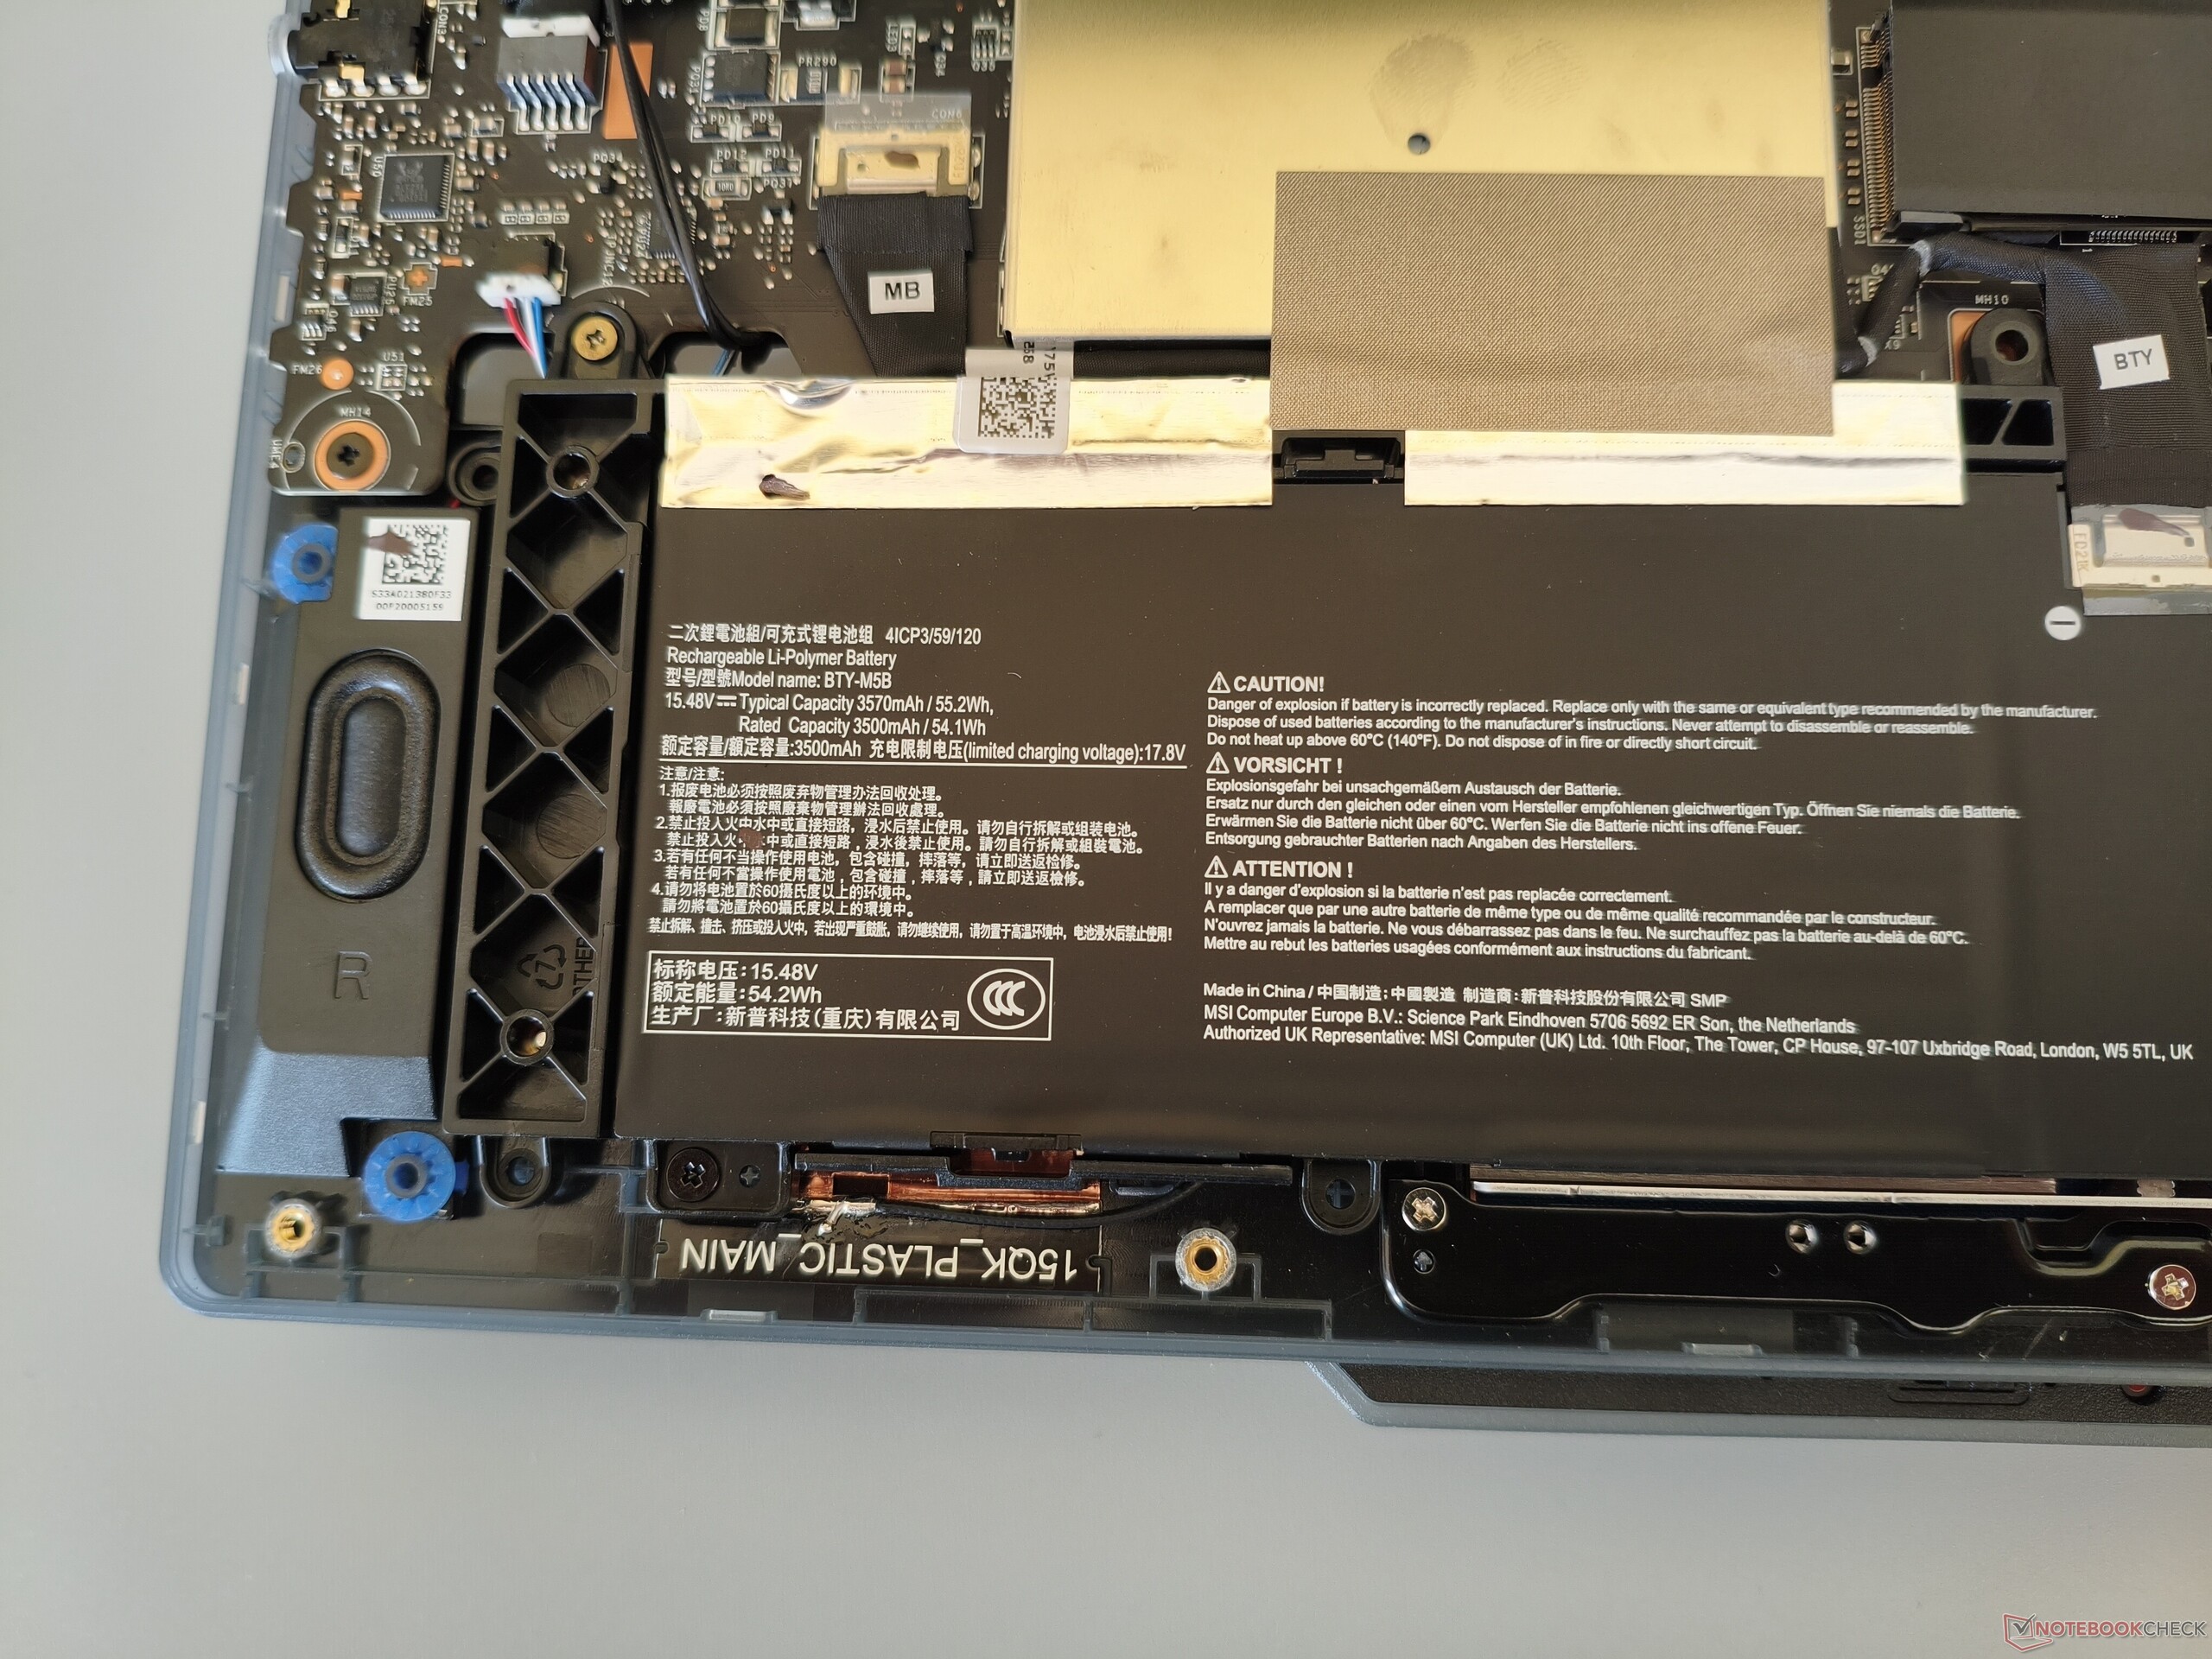
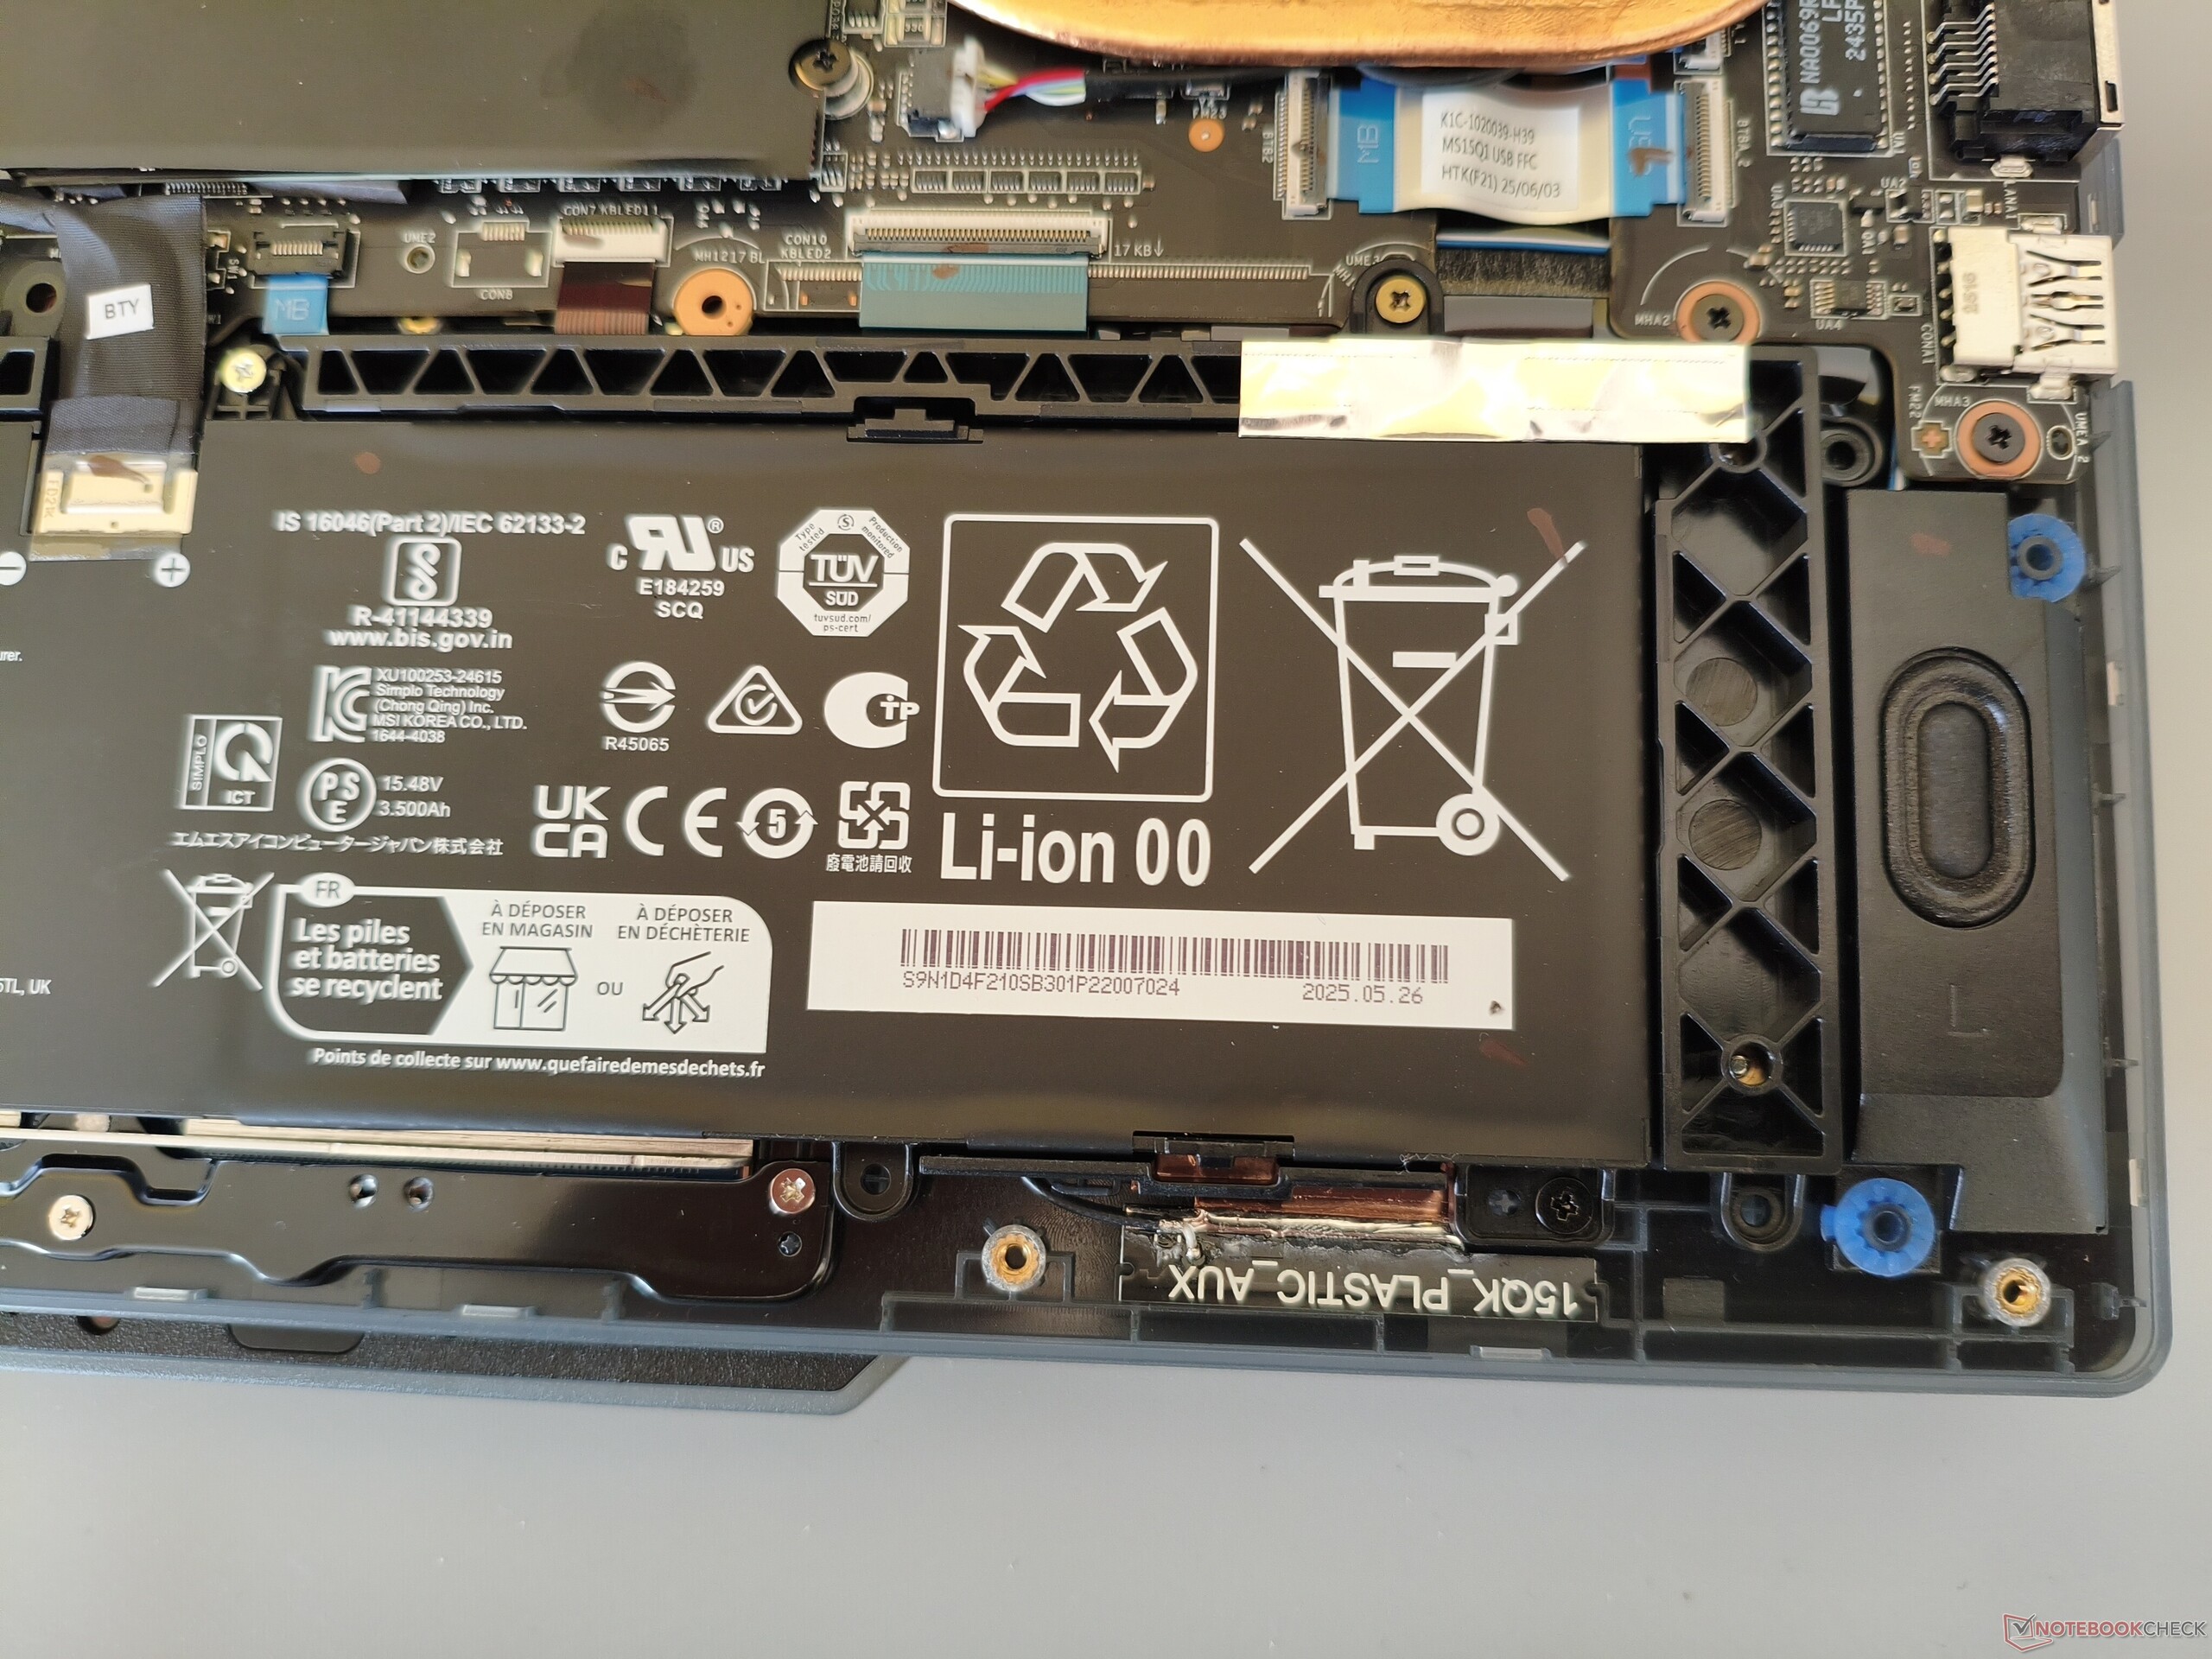
Manutenção

Dispositivos de entrada
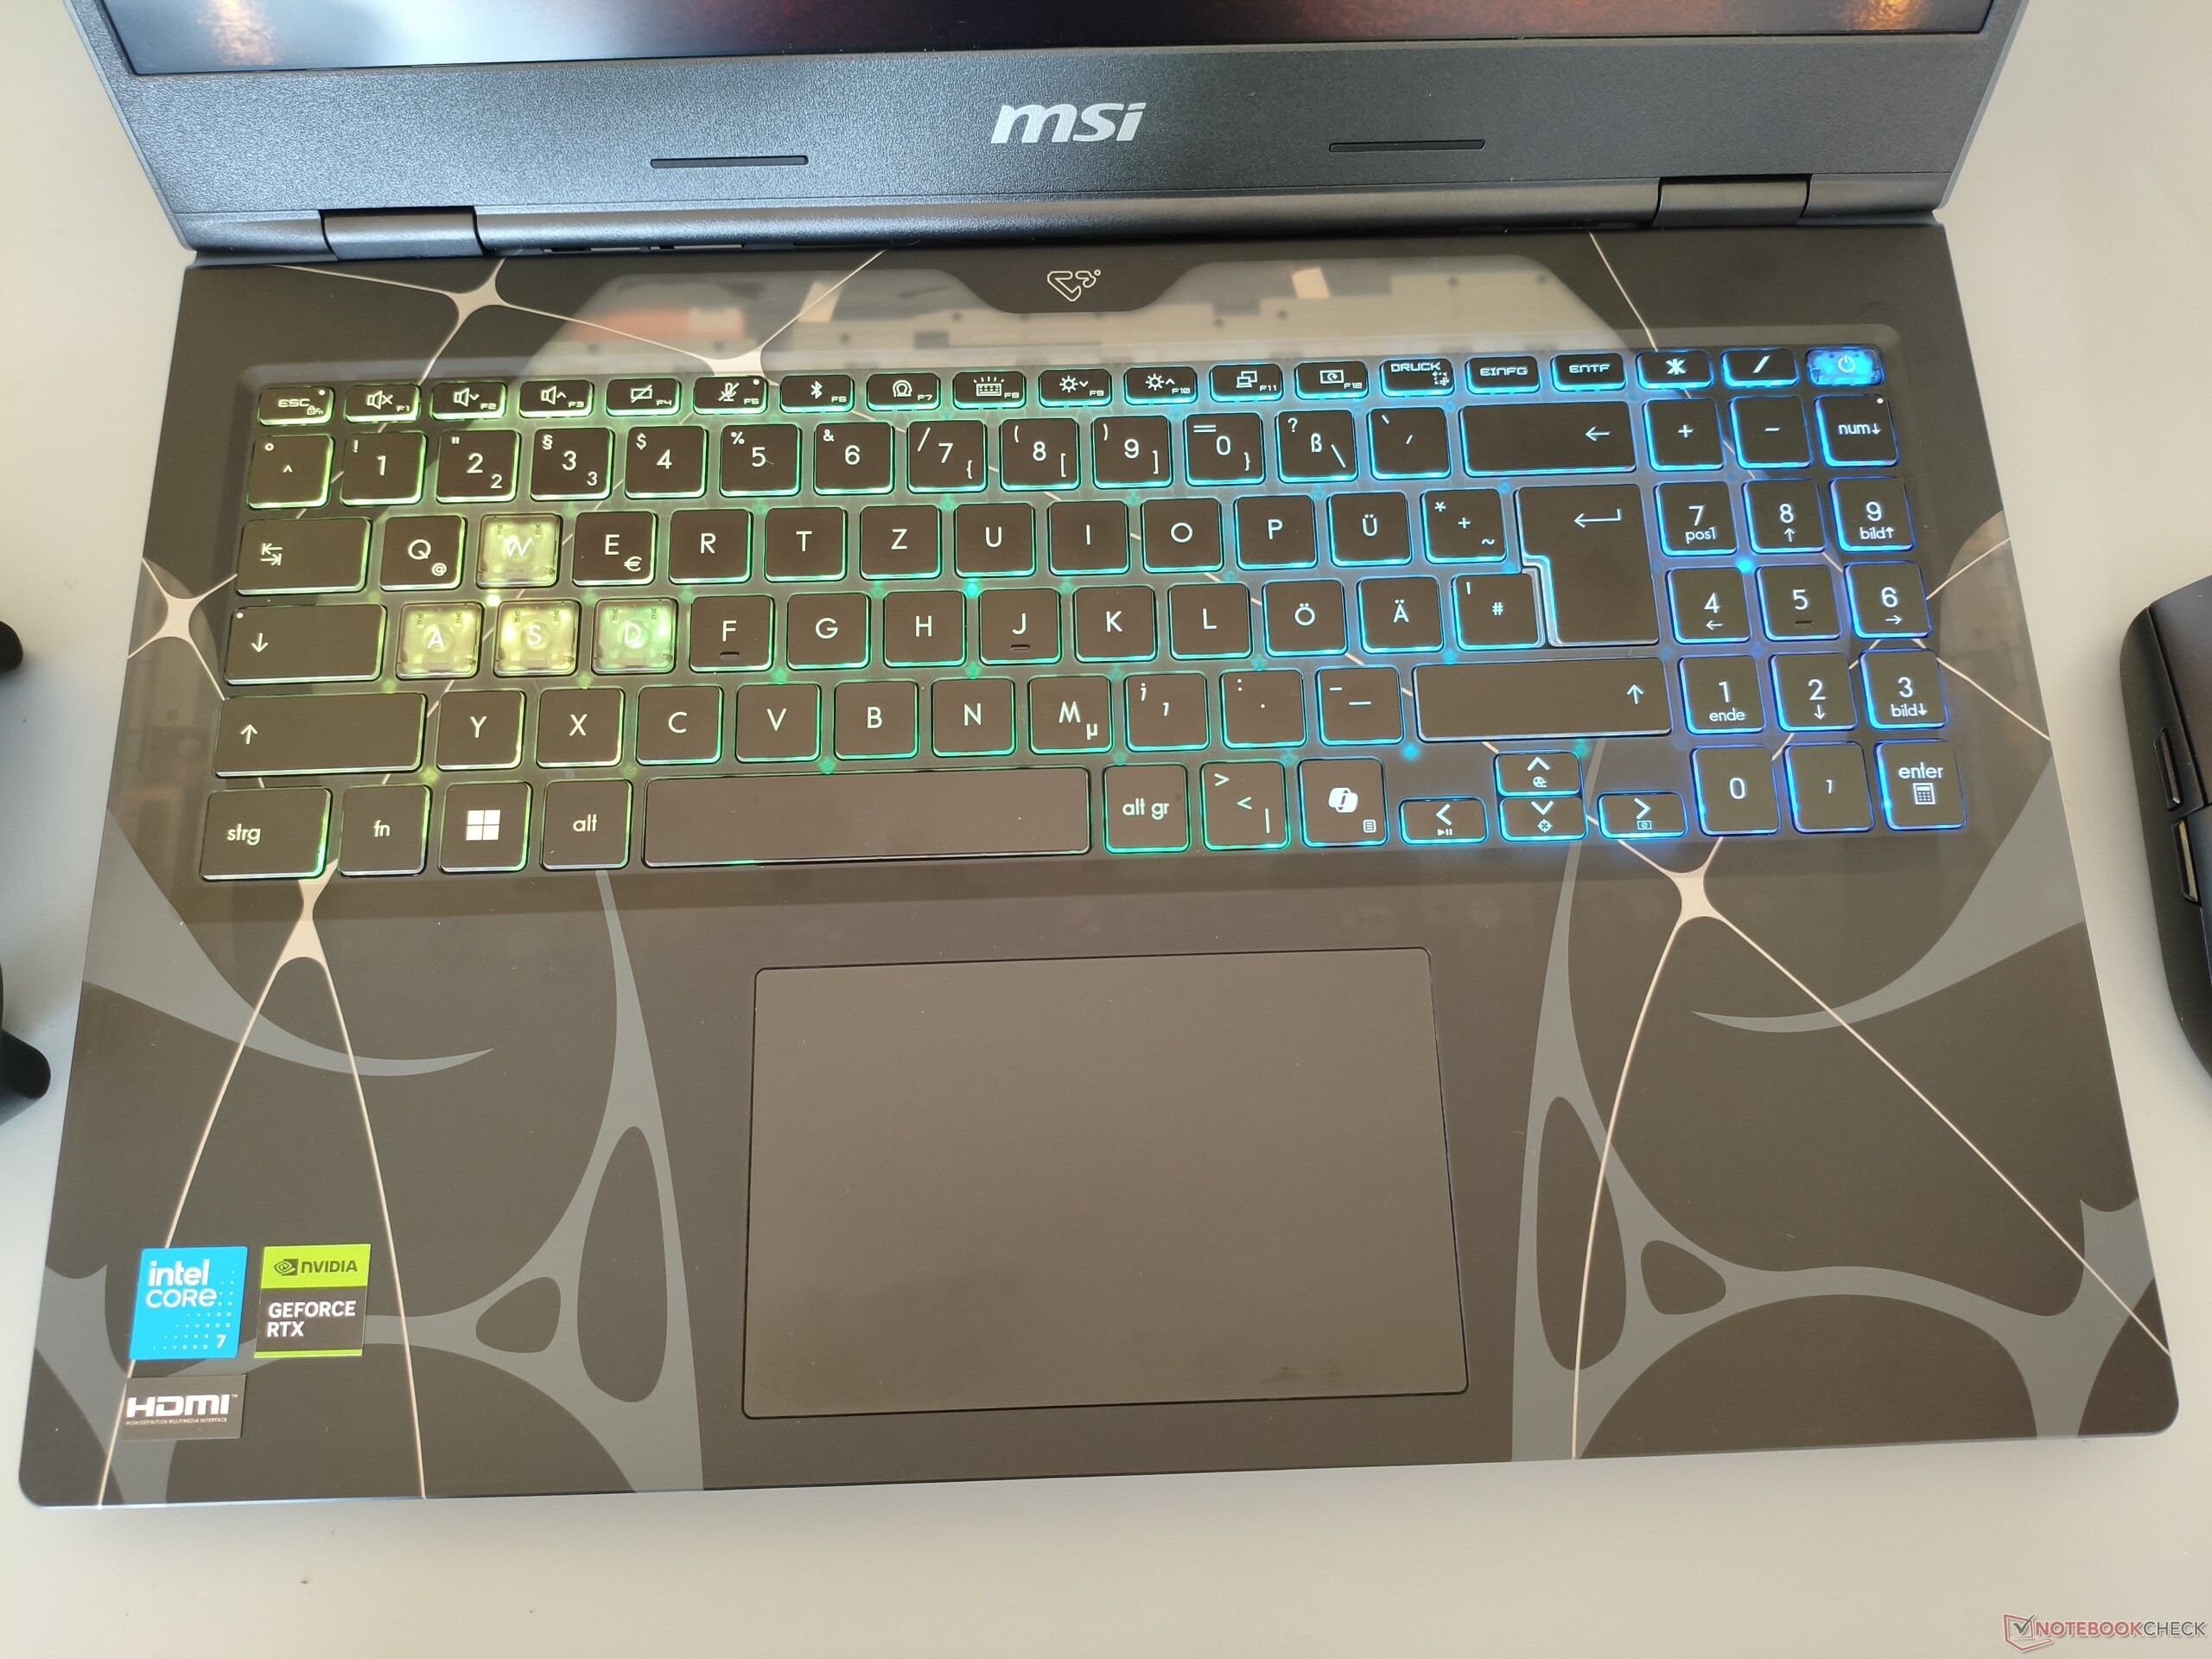
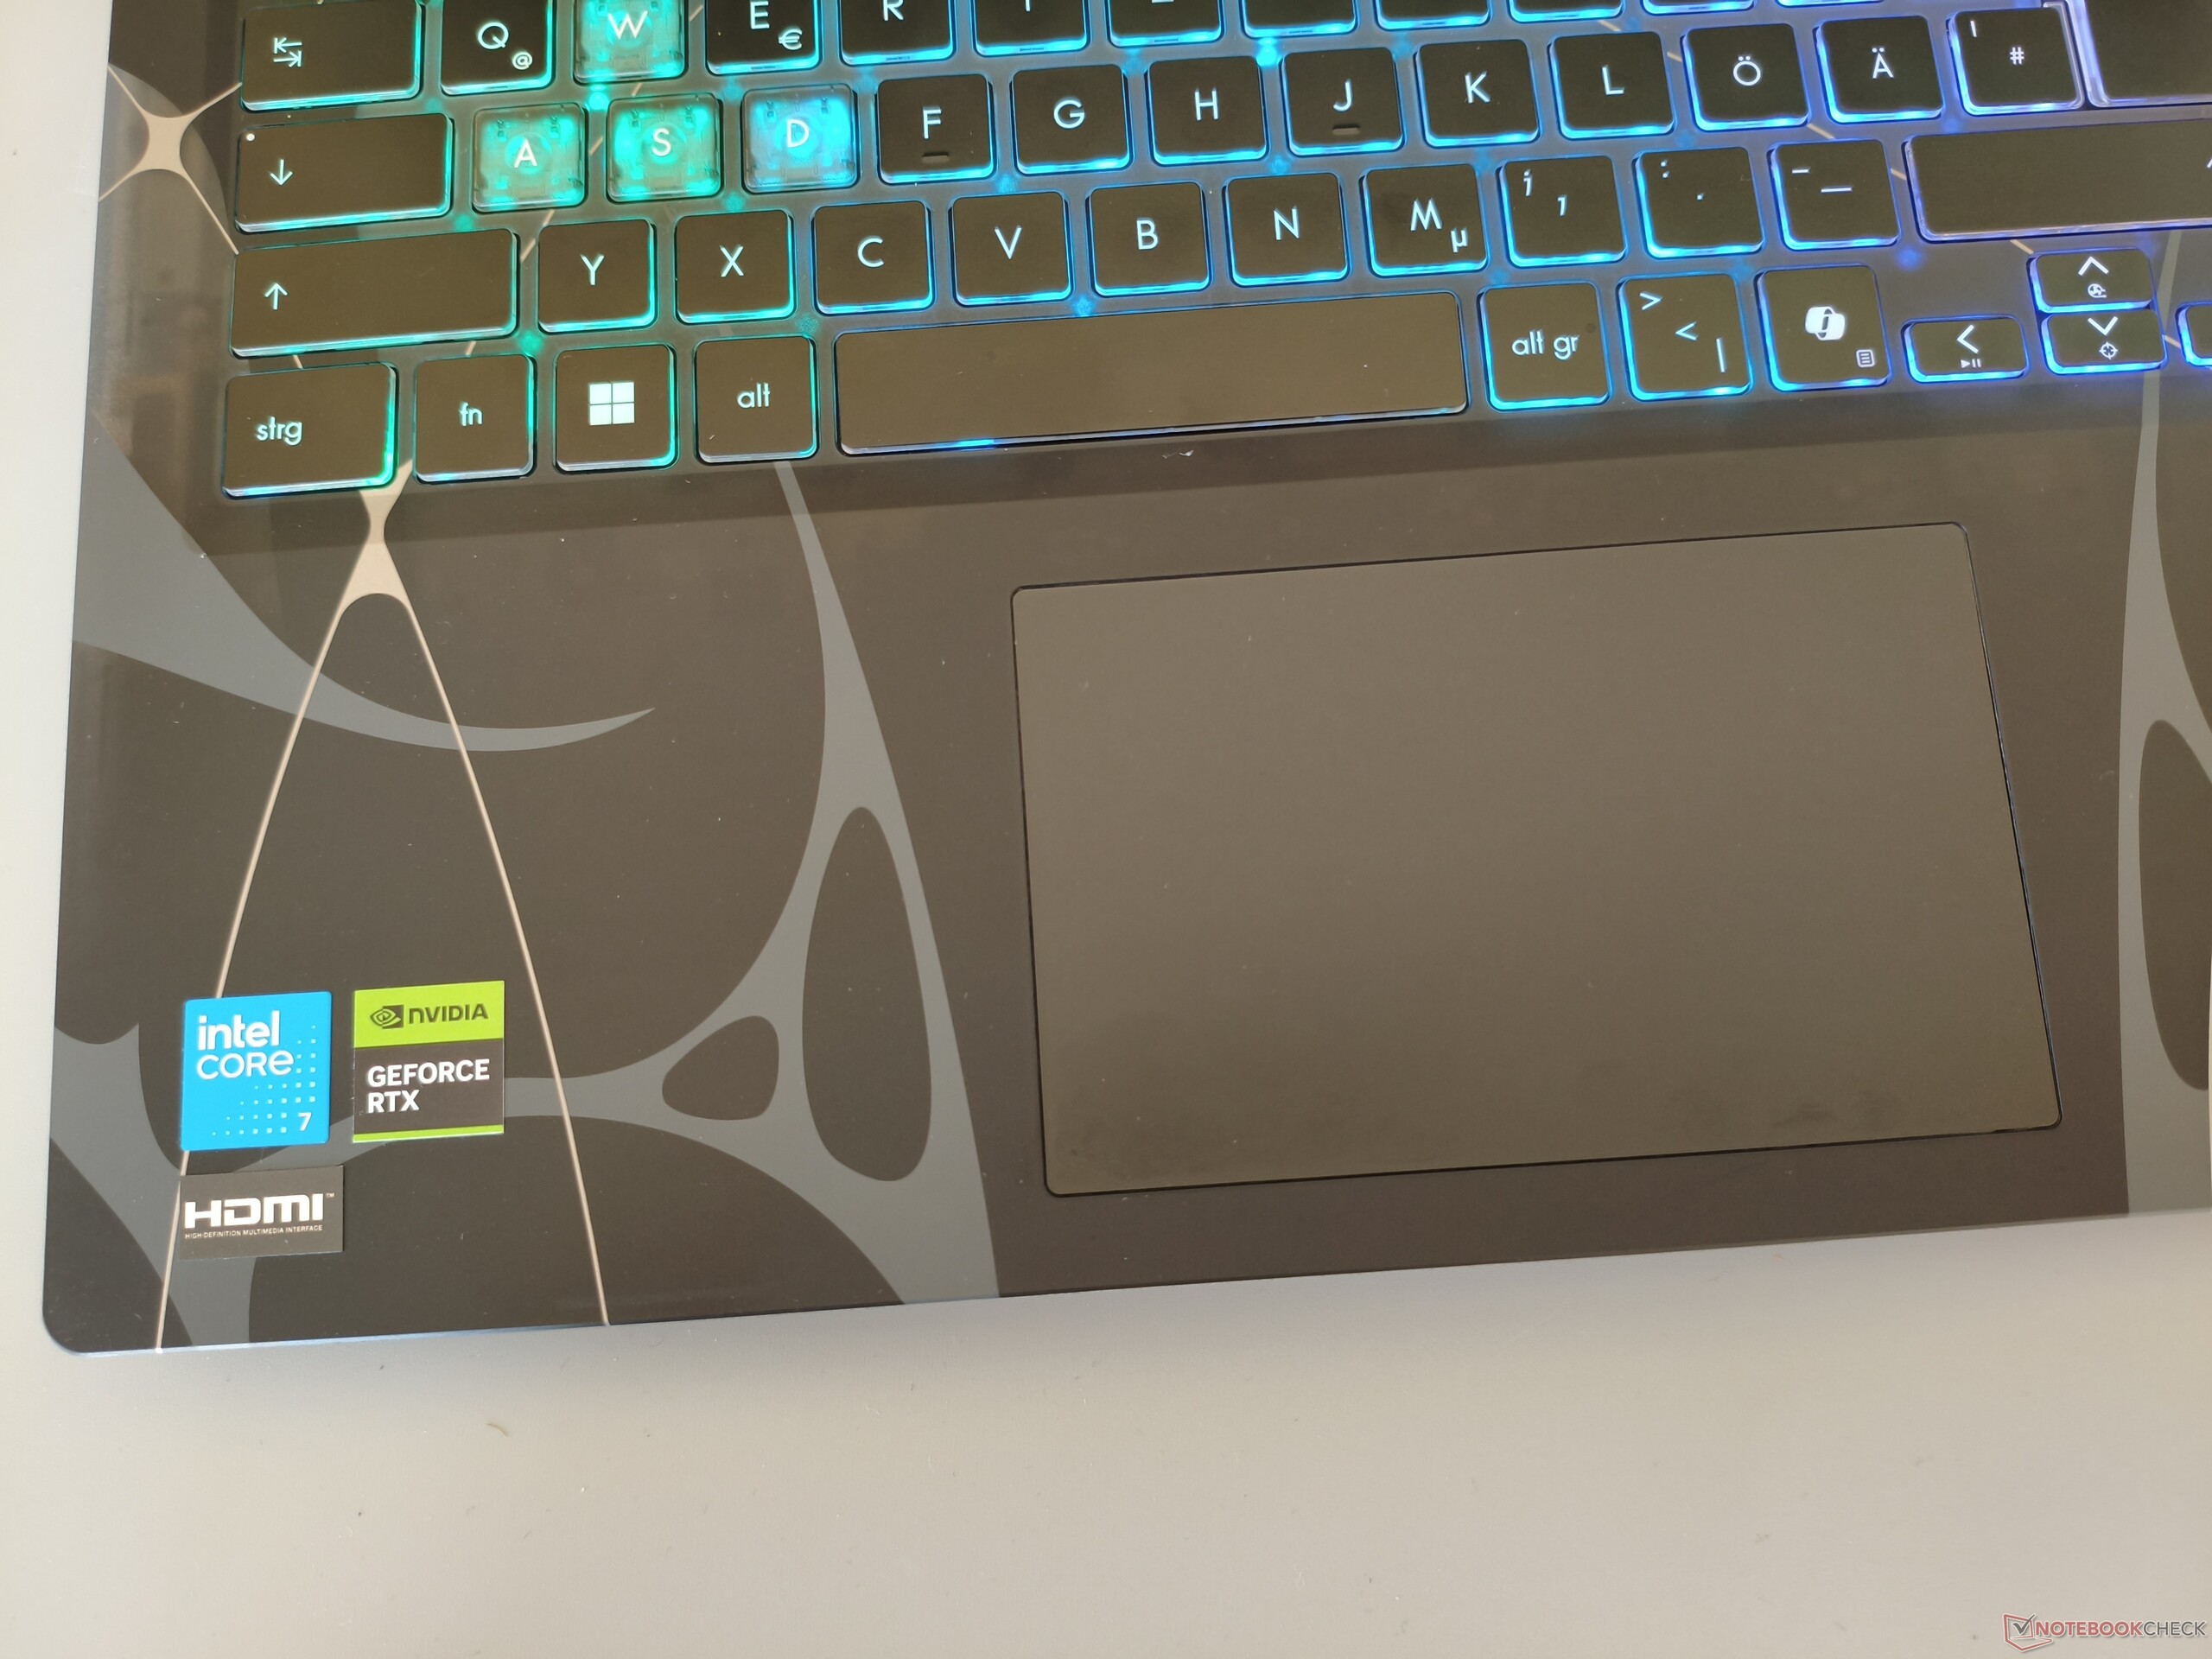
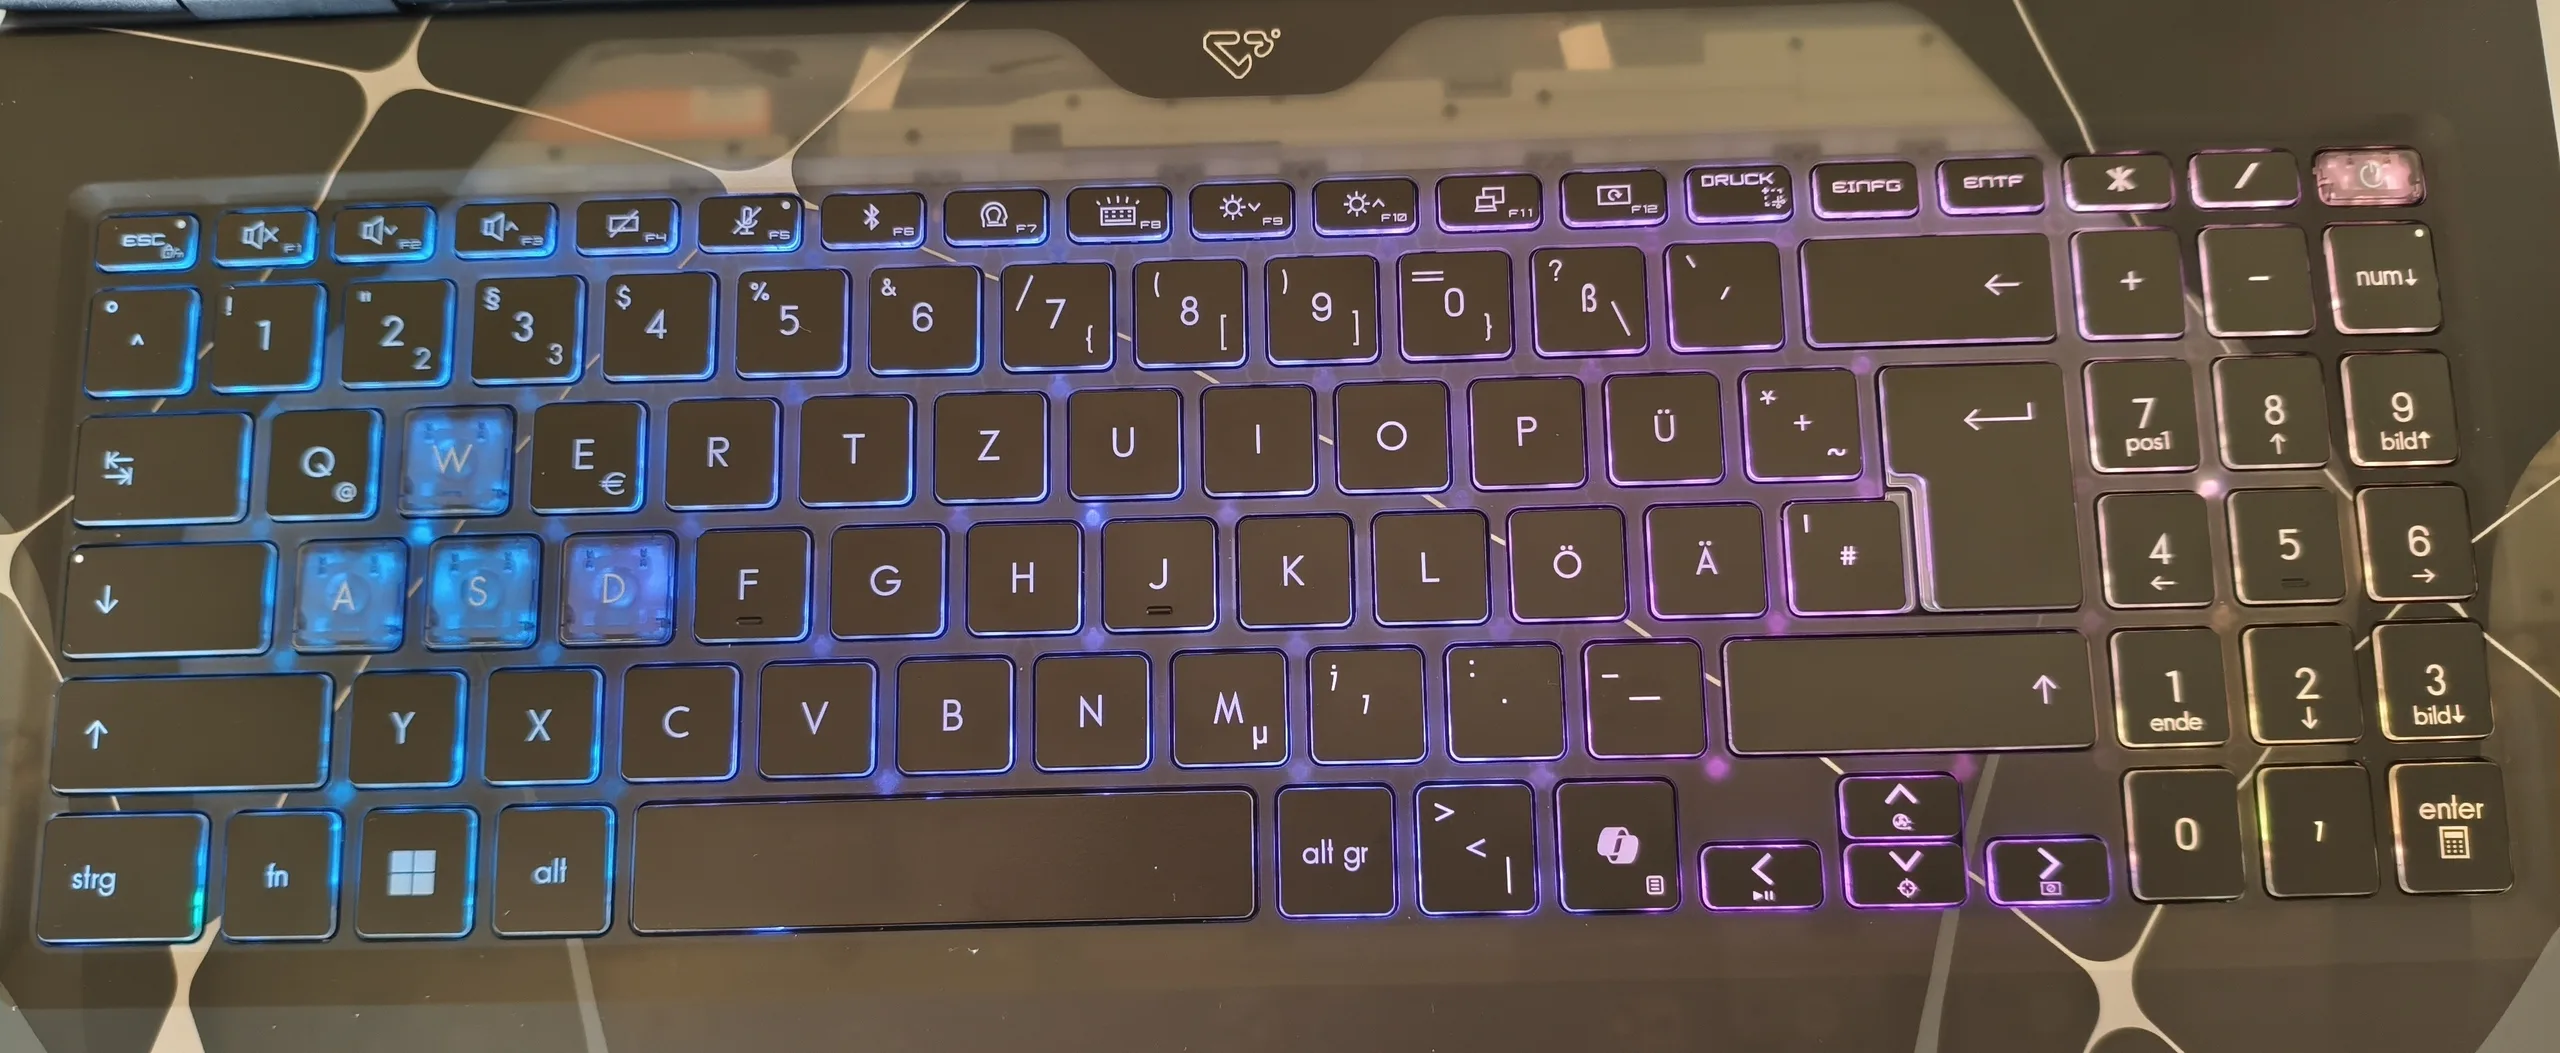
O teclado requer uma certa familiarização devido ao layout idiossincrático típico da MSI. O fato de o teclado numérico ter apenas três colunas, em vez de quatro, também leva algum tempo para se acostumar. Nós descreveríamos a sensação de digitação como sólida. Os jogadores também podem contar com uma iluminação RGB relativamente potente. O touchpad mede 12 x 7,6 cm (~4,7 x 3,0 pol.), o que é mais do que suficiente para um dispositivo de 15 polegadas. O substituto do mouse tem um desempenho satisfatório no teste em termos de precisão, propriedades de deslizamento e gestos.
Tela
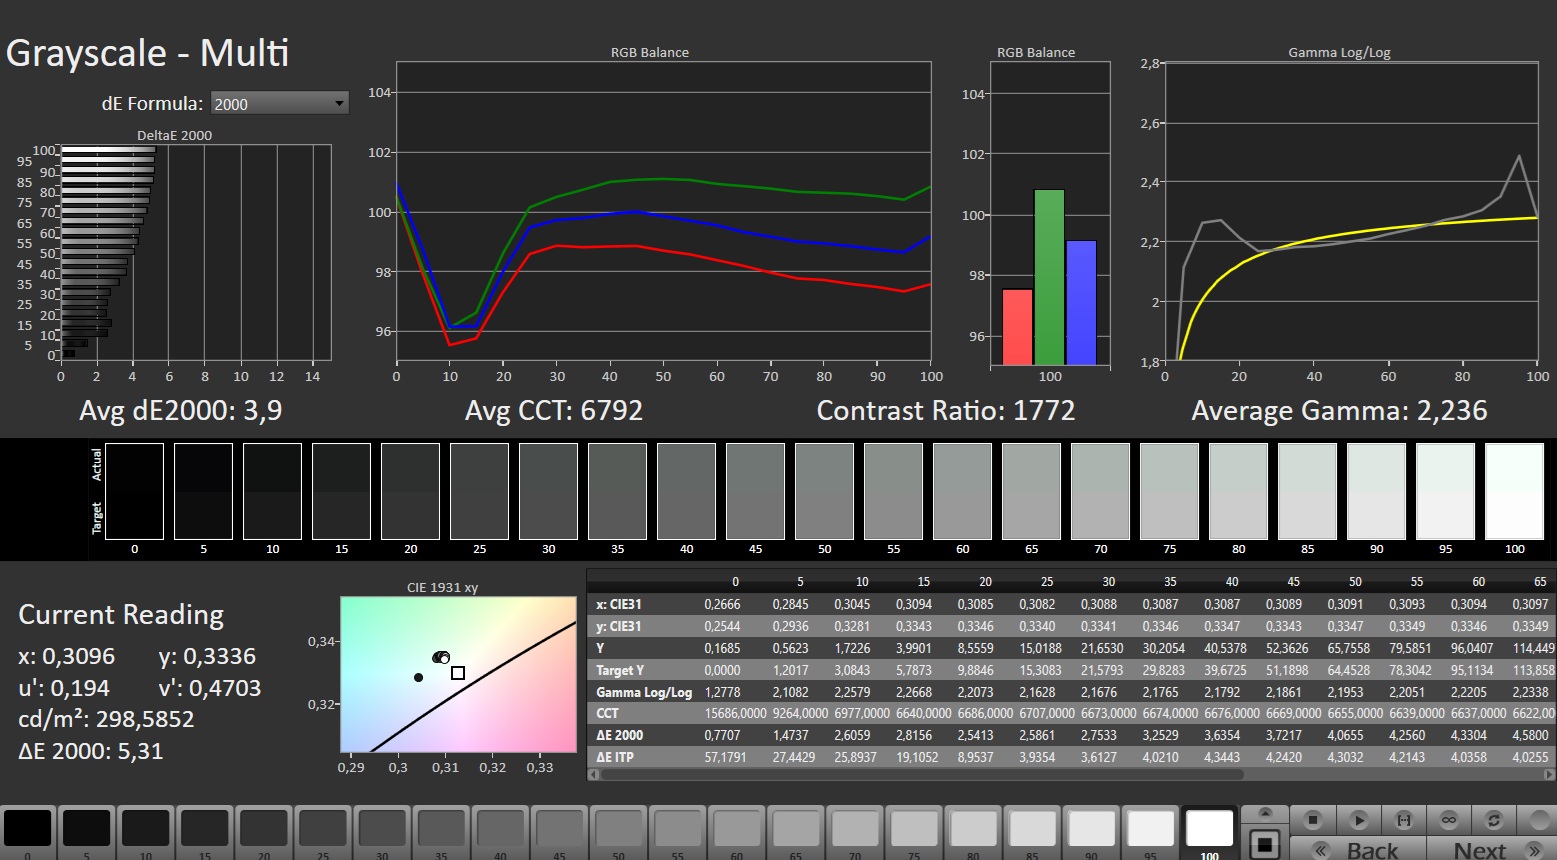
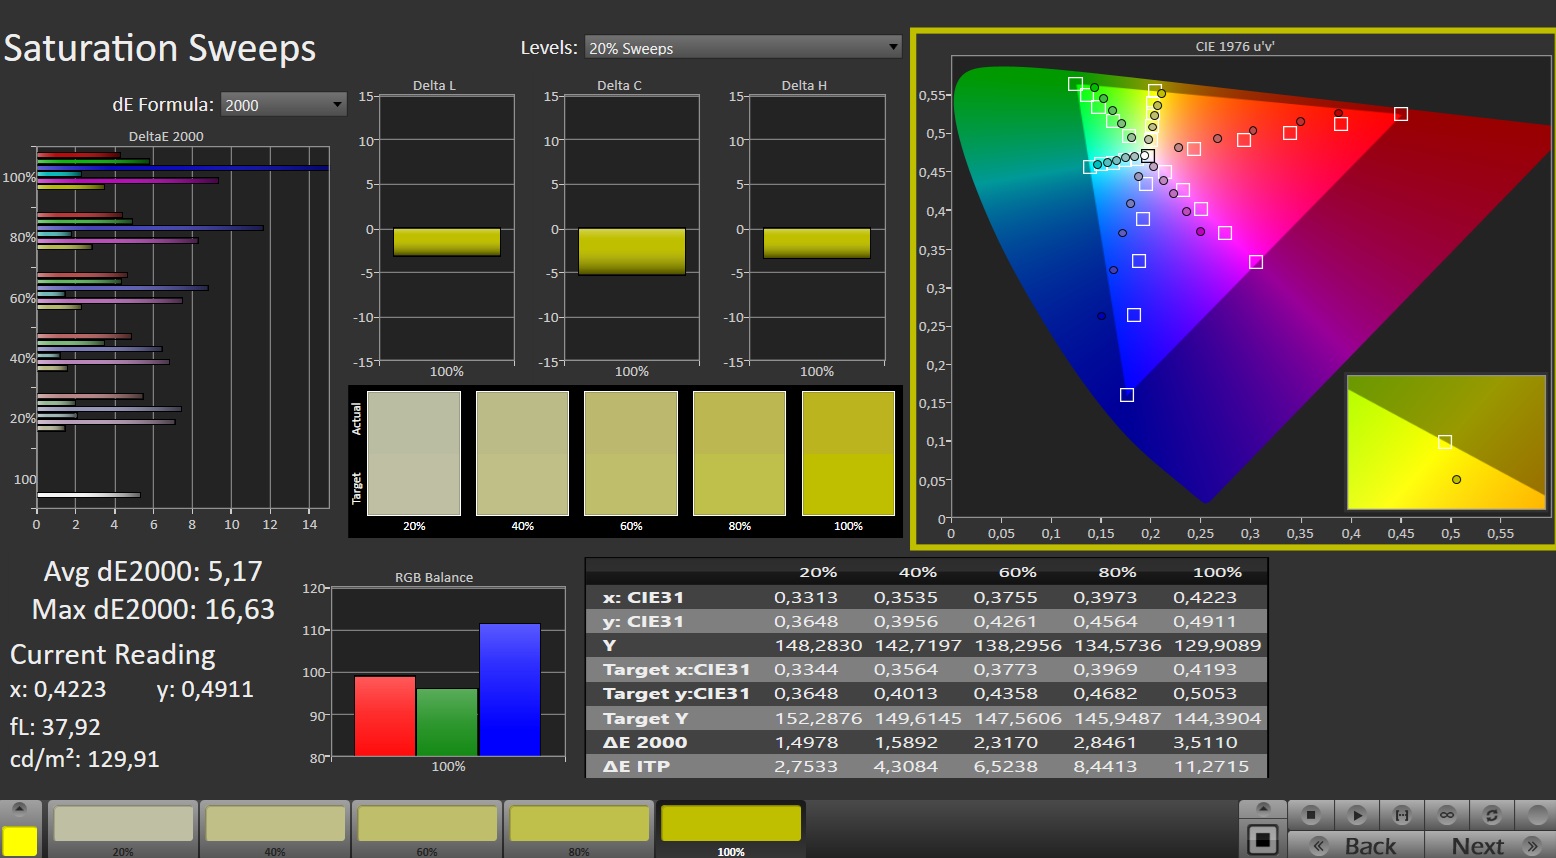
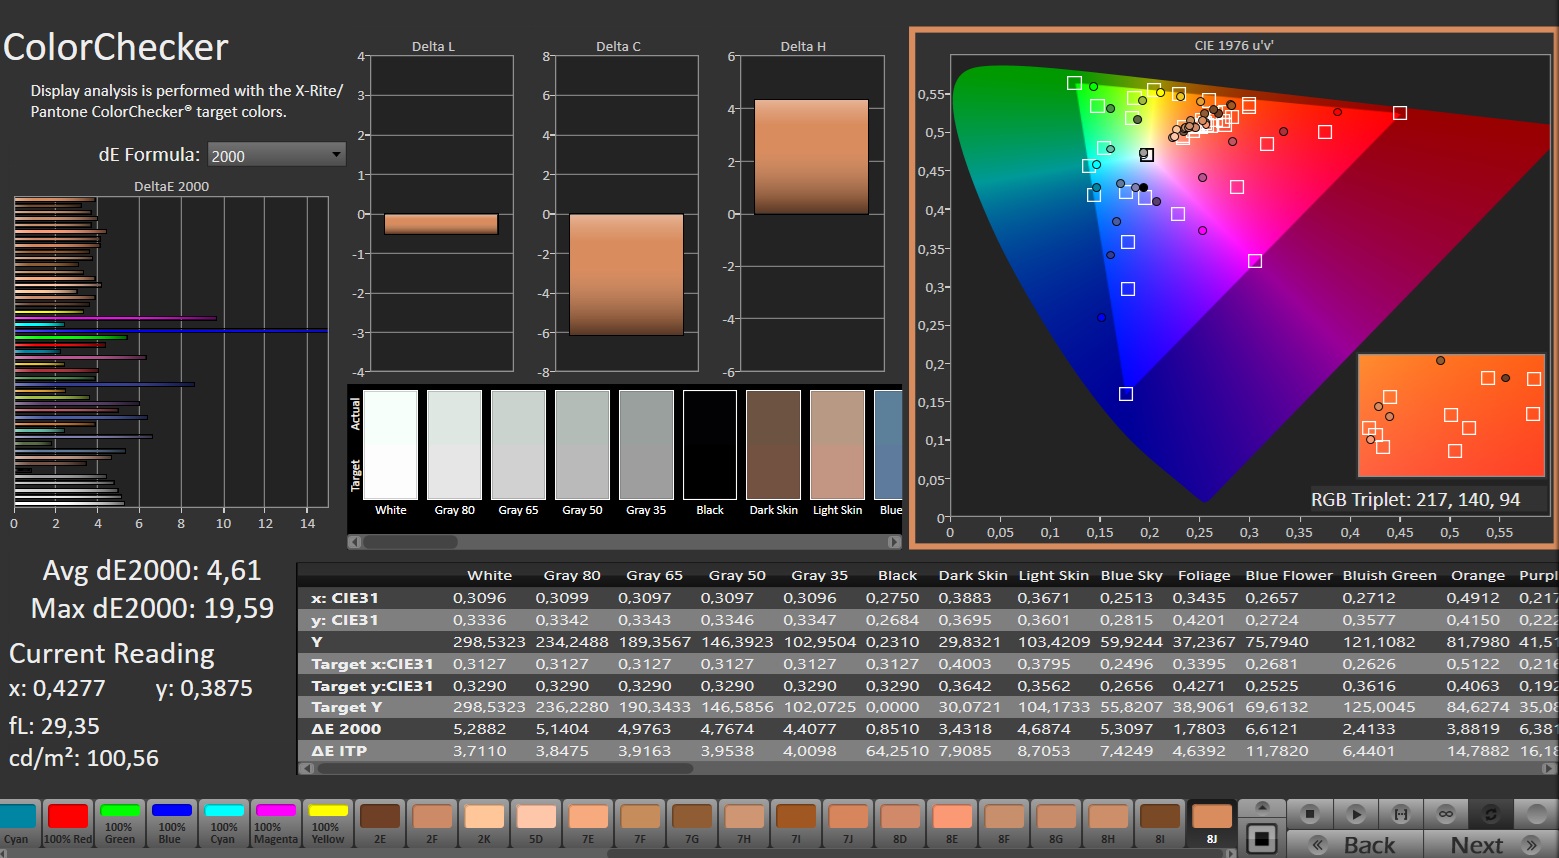
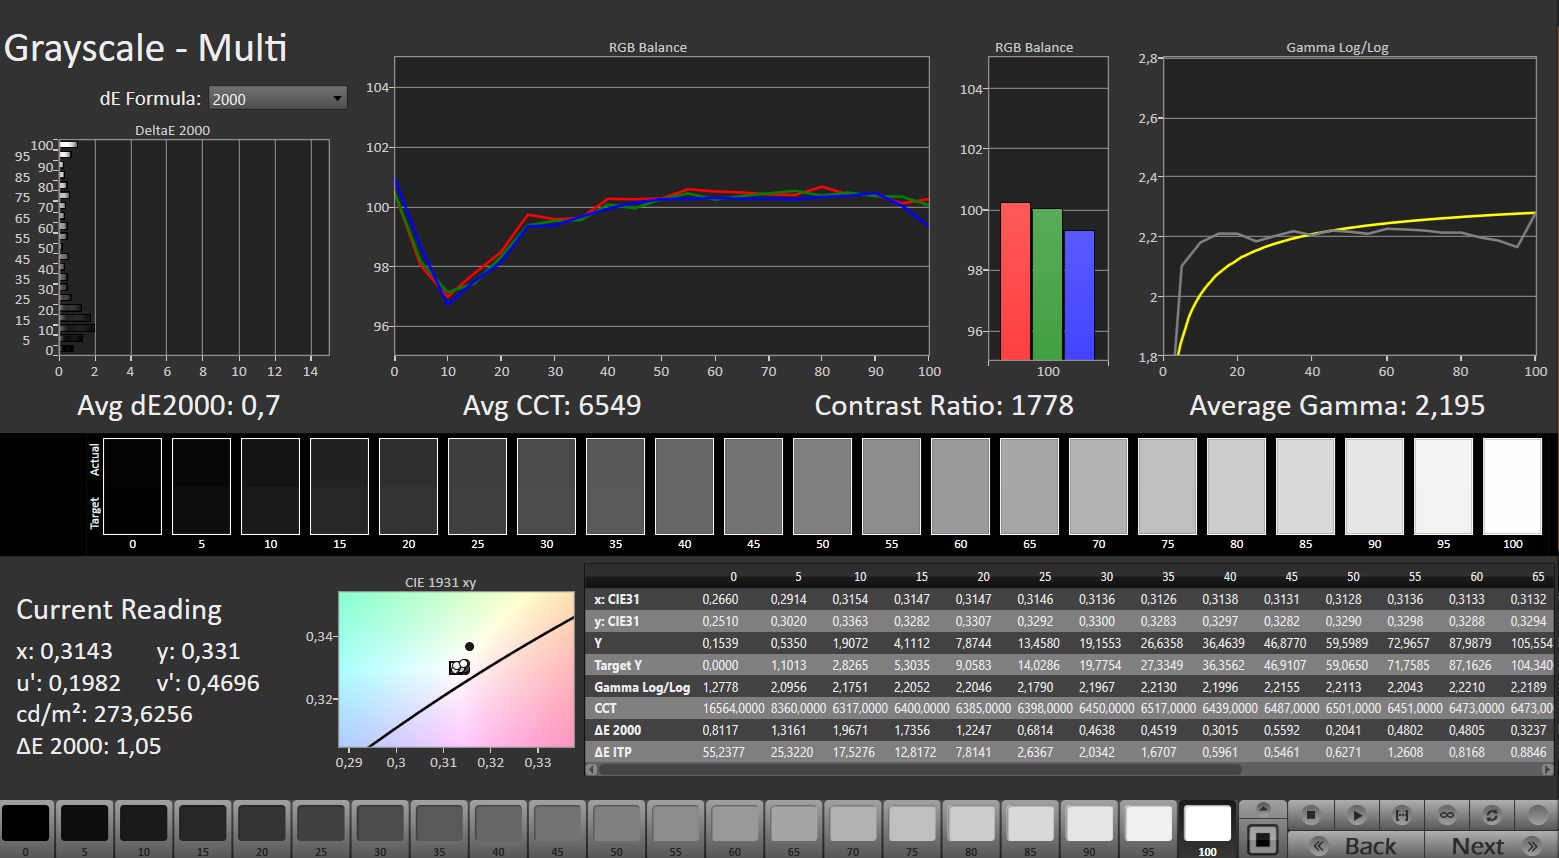
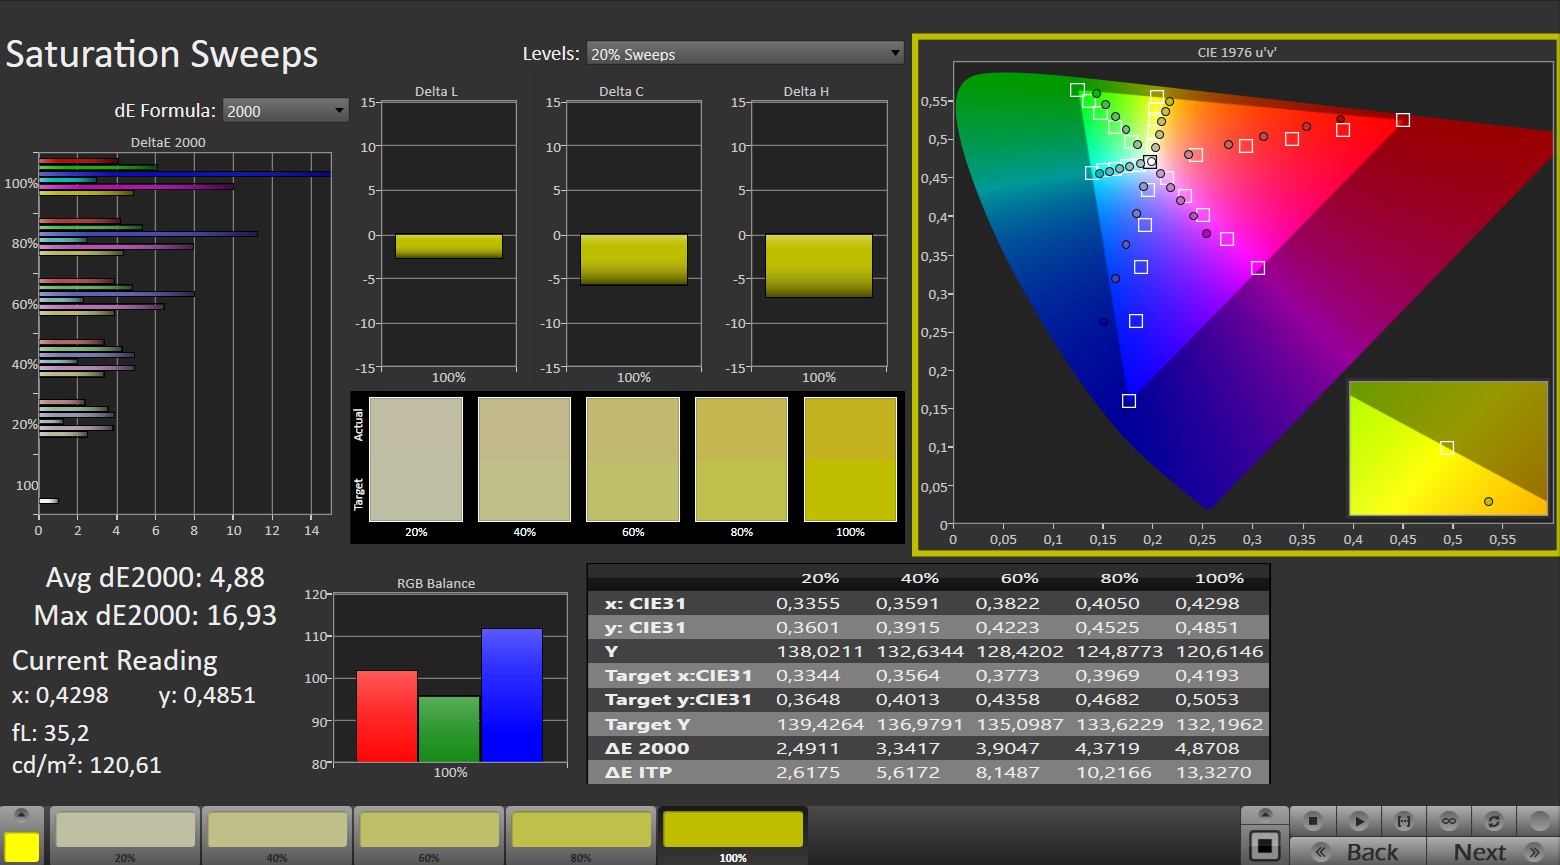
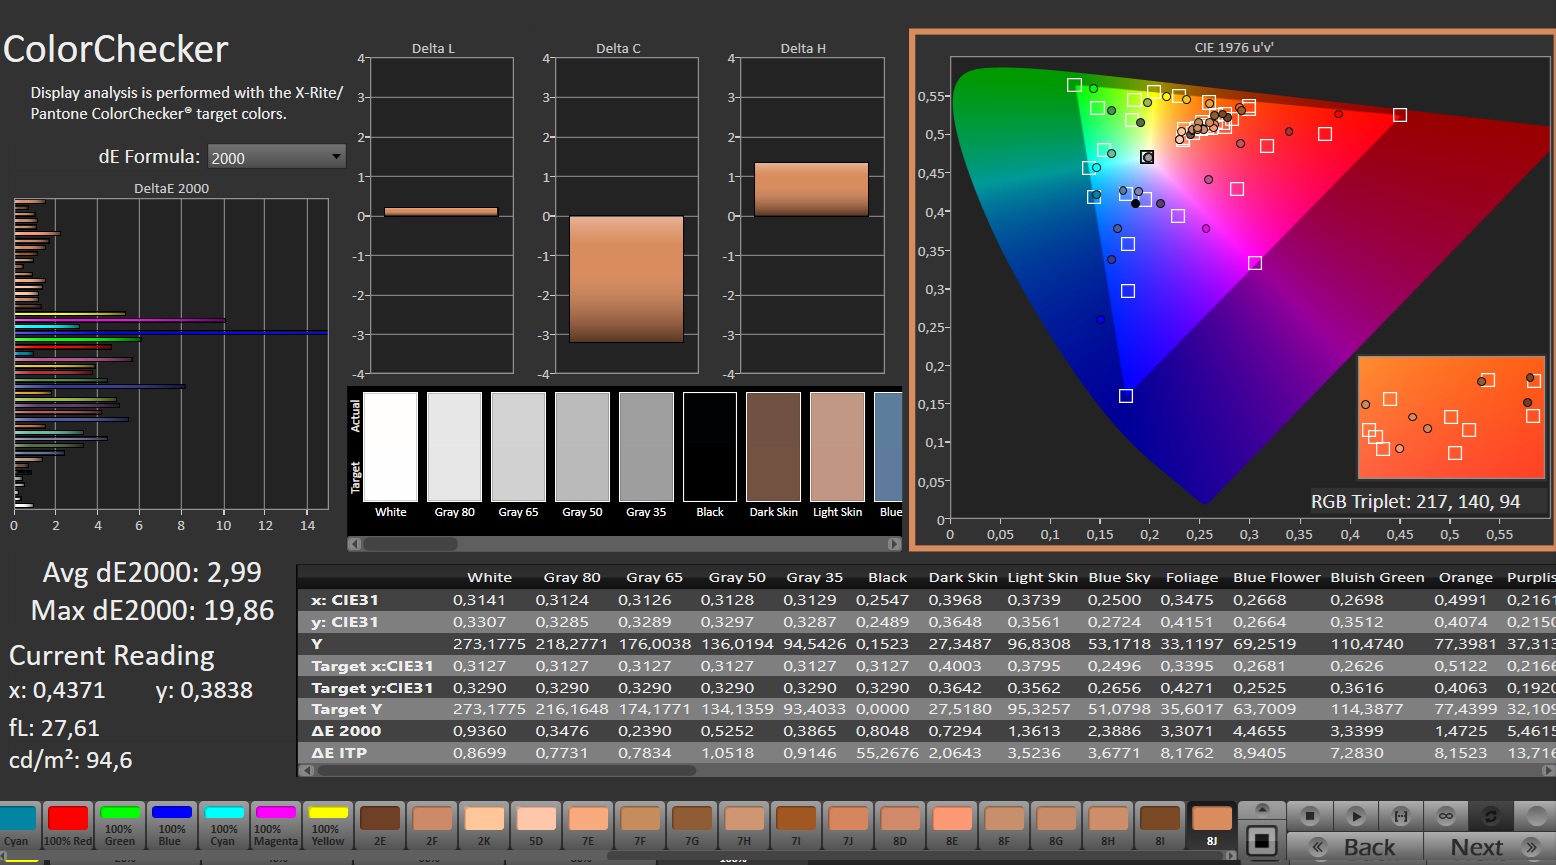
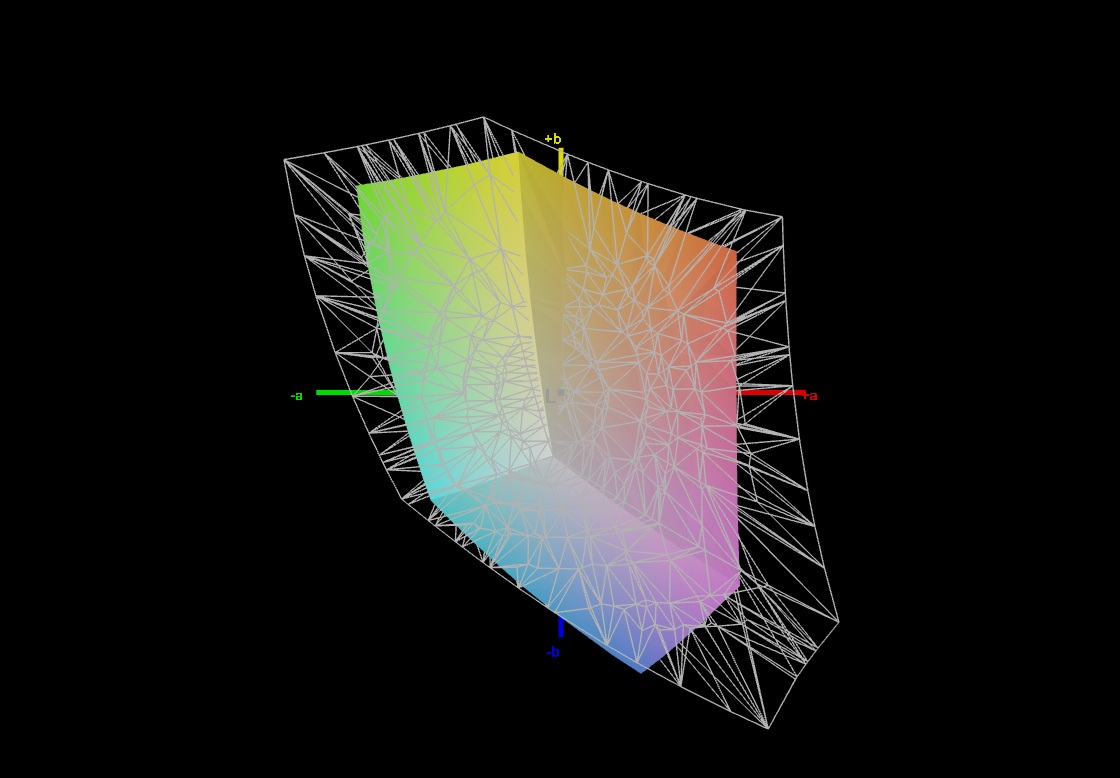
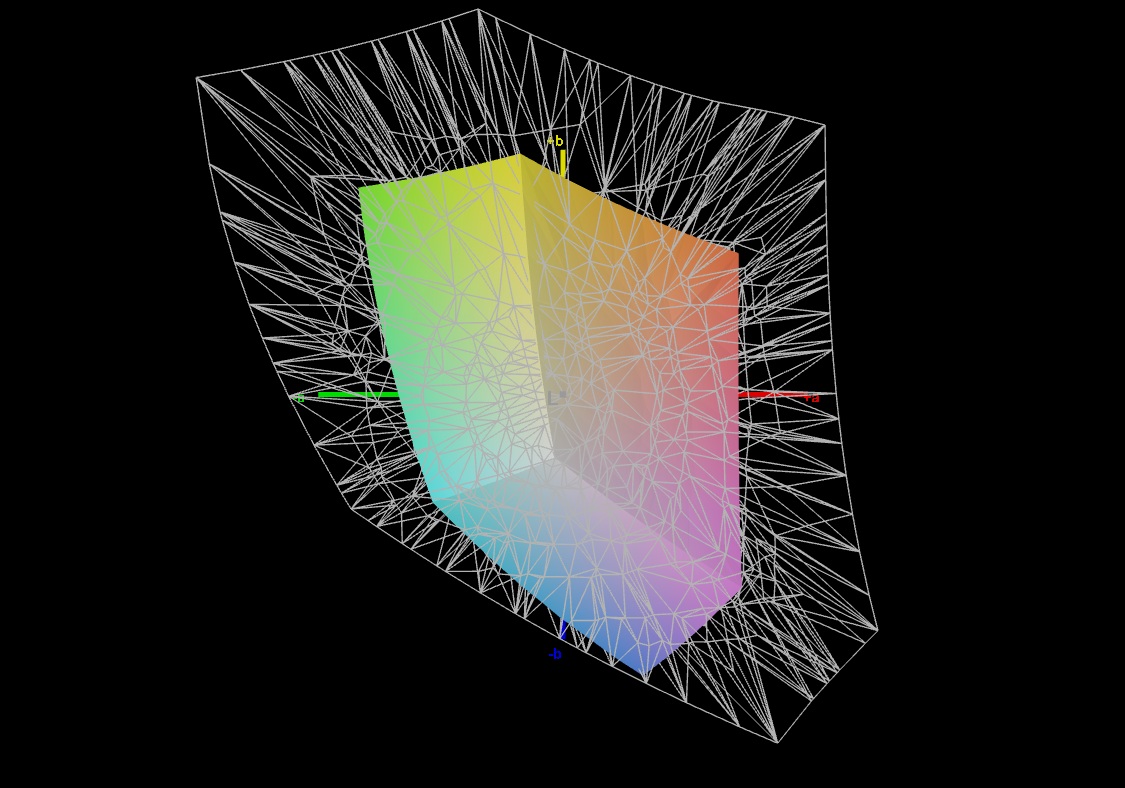
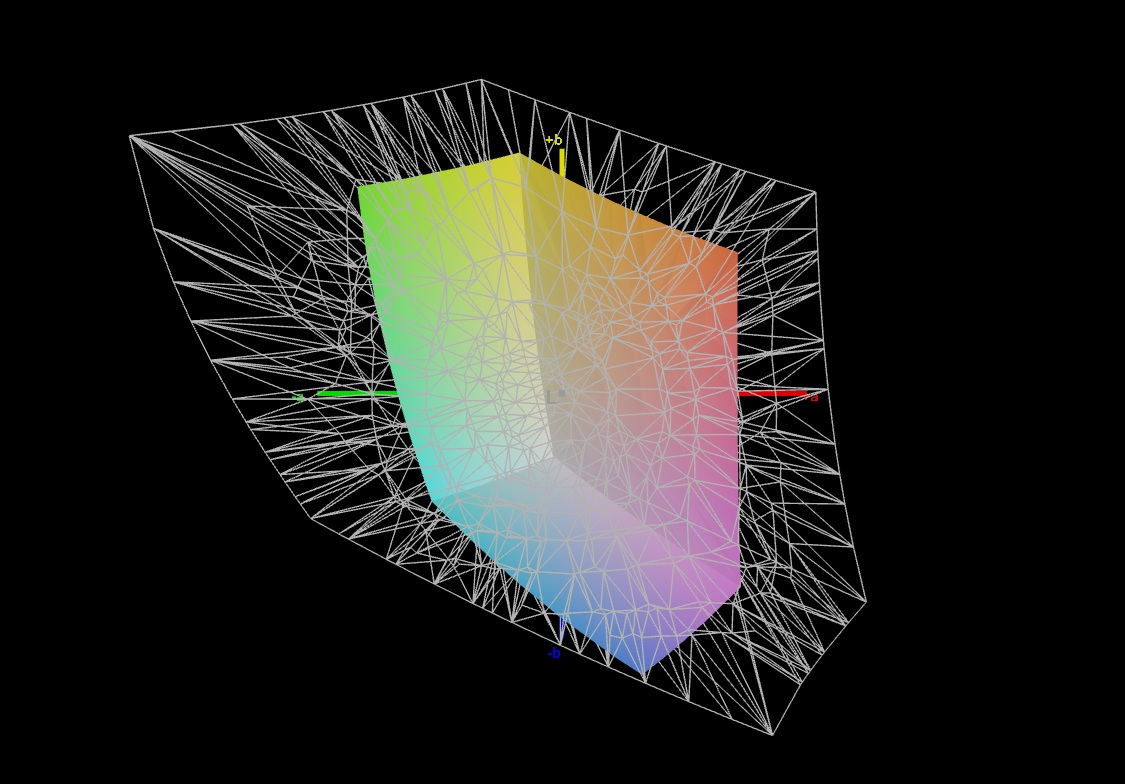
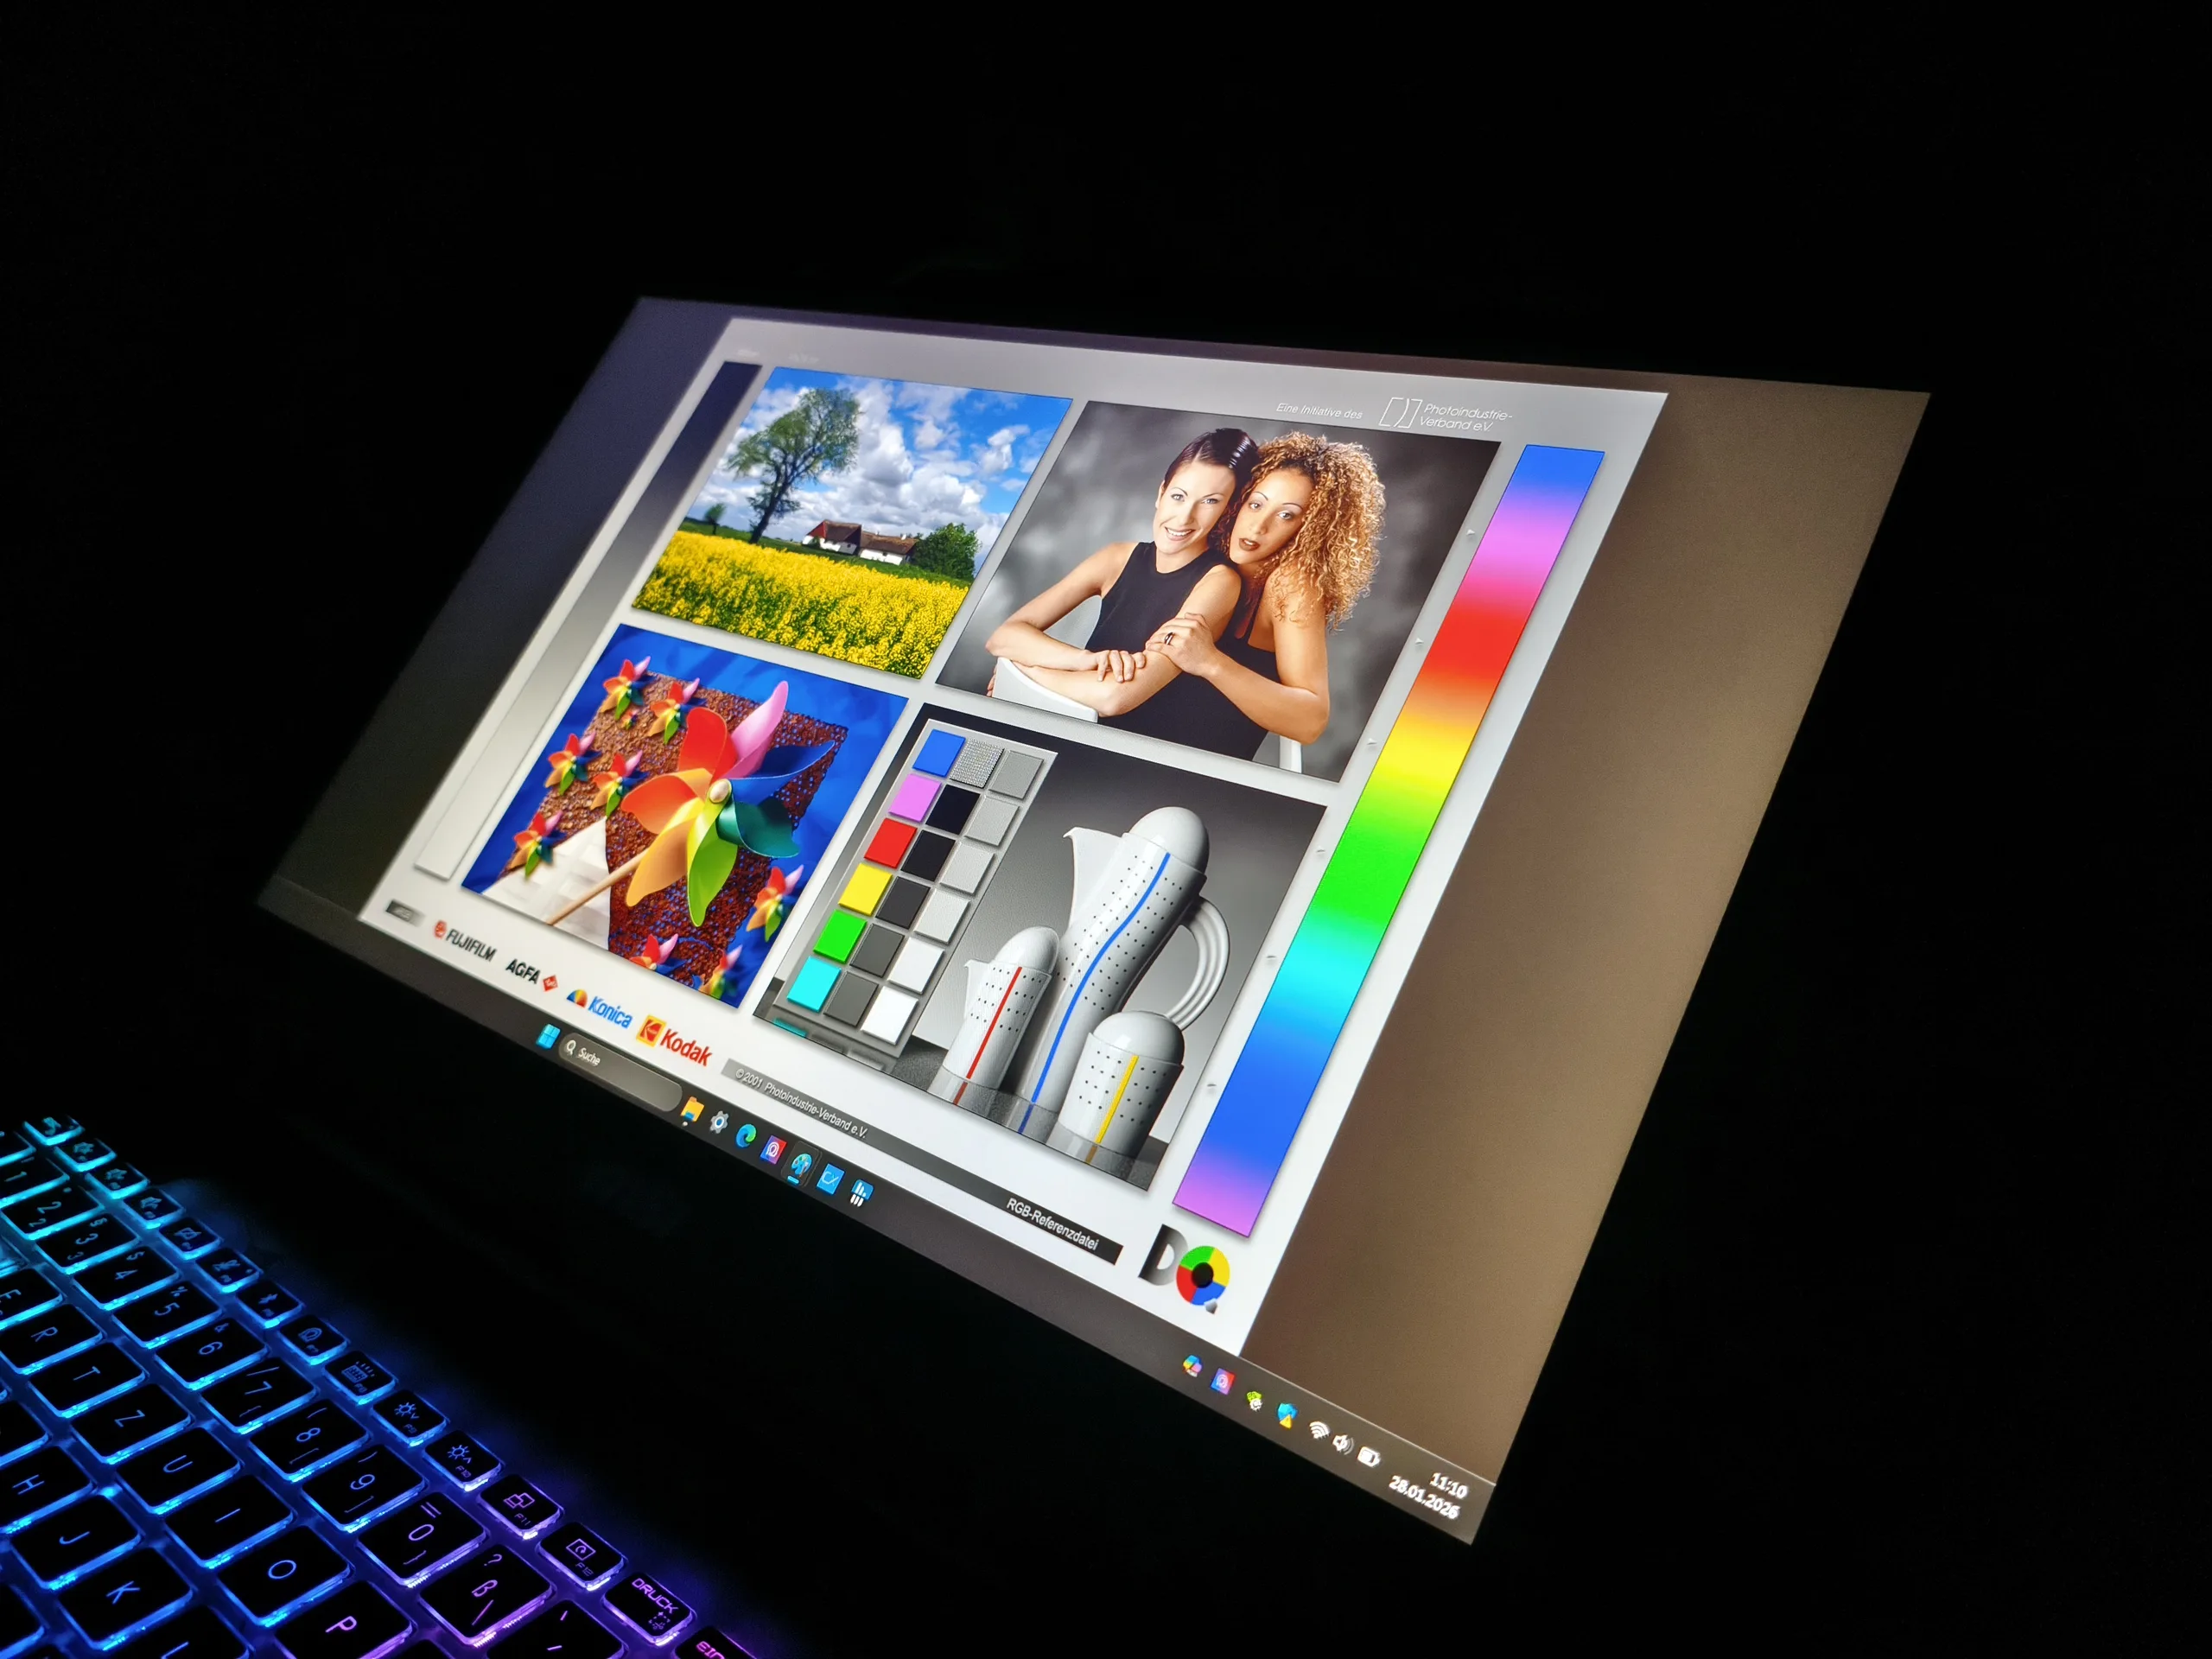
Como mencionado no início, a qualidade da tela do painel Full HD (144 Hz) deixa algo a desejar. Embora o contraste seja bastante respeitável (quase 1.700:1) graças ao baixo valor de preto de 0,17 cd/m², a luminosidade de cerca de 270 cd/m² não é impressionante. Devido ao pequeno espaço de cores (somente 65% sRGB), os compradores também têm que viver com uma impressão de imagem bastante pálida. O Lenovo LOQ 15 mostra como as coisas podem ser melhores nessa faixa de preço, enquanto outros aspectos como o tempo de resposta e os ângulos de visão são medianos.
| |||||||||||||||||||||||||
iluminação: 87 %
iluminação com acumulador: 286 cd/m²
Contraste: 1682:1 (Preto: 0.17 cd/m²)
ΔE ColorChecker Calman: 4.61 | ∀{0.5-29.43 Ø4.71}
calibrated: 2.99
ΔE Greyscale Calman: 3.9 | ∀{0.09-98 Ø4.96}
44.9% AdobeRGB 1998 (Argyll 3D)
64.8% sRGB (Argyll 3D)
43.4% Display P3 (Argyll 3D)
Gamma: 2.236
CCT: 6792 K
| MSI Cyborg 15 B2RWEKG CMN N156HRA-EA1, IPS, 1920x1080, 15.6", 144 Hz | MSI Cyborg 15 A12VF AU Optronics B156HAN15.1, IPS, 1920x1080, 15.6", 144 Hz | Acer Nitro V 15 ANV15-52-50S2 BOEhydis NE156FHM-NXA, IPS, 1920x1080, 15.6", 165 Hz | HP Victus 15-fa2160ng CMN1560, IPS, 1920x1080, 15.6", 144 Hz | Lenovo LOQ 15AHP10 CSOT MNF601BA1-4, IPS, 1920x1080, 15.6", 144 Hz | Lenovo Legion 5 15AHP G10 LEN151WQXGA, OLED, 2560x1600, 15.1", 165 Hz | |
|---|---|---|---|---|---|---|
| Display | -3% | -7% | -8% | 54% | 101% | |
| Display P3 Coverage (%) | 43.4 | 42.3 -3% | 40.3 -7% | 43 -1% | 67.3 55% | 99.9 130% |
| sRGB Coverage (%) | 64.8 | 62.6 -3% | 60.3 -7% | 64.3 -1% | 99.2 53% | 100 54% |
| AdobeRGB 1998 Coverage (%) | 44.9 | 43.7 -3% | 41.6 -7% | 34.7 -23% | 69.1 54% | 98.3 119% |
| Response Times | 25% | -23% | -2% | -15% | 98% | |
| Response Time Grey 50% / Grey 80% * (ms) | 27.6 ? | 22 ? 20% | 39 ? -41% | 28.6 ? -4% | 33.9 ? -23% | 0.42 ? 98% |
| Response Time Black / White * (ms) | 20 ? | 14 ? 30% | 20.8 ? -4% | 20 ? -0% | 21.2 ? -6% | 0.4 ? 98% |
| PWM Frequency (Hz) | 1152 ? | |||||
| PWM Amplitude * (%) | 11 | |||||
| Screen | -2% | -2% | -5% | 30% | 67% | |
| Brightness middle (cd/m²) | 286 | 247 -14% | 382 34% | 324 13% | 318 11% | 492 72% |
| Brightness (cd/m²) | 272 | 234 -14% | 347 28% | 303 11% | 300 10% | 495 82% |
| Brightness Distribution (%) | 87 | 89 2% | 86 -1% | 87 0% | 89 2% | 92 6% |
| Black Level * (cd/m²) | 0.17 | 0.25 -47% | 0.31 -82% | 0.26 -53% | 0.2 -18% | |
| Contrast (:1) | 1682 | 988 -41% | 1232 -27% | 1246 -26% | 1590 -5% | |
| Colorchecker dE 2000 * | 4.61 | 3.78 18% | 4.34 6% | 4.7 -2% | 1.33 71% | 0.9 80% |
| Colorchecker dE 2000 max. * | 19.59 | 6.42 67% | 19.19 2% | 18.19 7% | 4.42 77% | 1.8 91% |
| Colorchecker dE 2000 calibrated * | 2.99 | 3.94 -32% | 3.56 -19% | 2.93 2% | 0.94 69% | |
| Greyscale dE 2000 * | 3.9 | 2.16 45% | 2.4 38% | 3.9 -0% | 1.9 51% | 1.2 69% |
| Gamma | 2.236 98% | 2.33 94% | 2.165 102% | 2.21 100% | 2.187 101% | 2.16 102% |
| CCT | 6792 96% | 6906 94% | 7024 93% | 7541 86% | 6678 97% | 6291 103% |
| Média Total (Programa/Configurações) | 7% /
2% | -11% /
-6% | -5% /
-6% | 23% /
29% | 89% /
82% |
* ... menor é melhor
Exibir tempos de resposta
| ↔ Tempo de resposta preto para branco | ||
|---|---|---|
| 20 ms ... ascensão ↗ e queda ↘ combinadas | ↗ 10.6 ms ascensão | 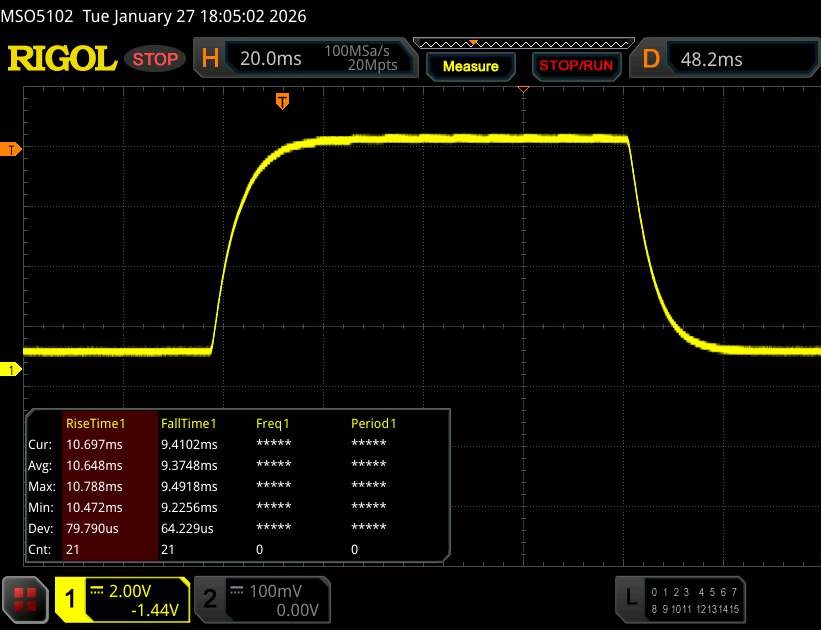 |
| ↘ 9.4 ms queda | ||
| A tela mostra boas taxas de resposta em nossos testes, mas pode ser muito lenta para jogadores competitivos. Em comparação, todos os dispositivos testados variam de 0.1 (mínimo) a 240 (máximo) ms. » 44 % de todos os dispositivos são melhores. Isso significa que o tempo de resposta medido é semelhante à média de todos os dispositivos testados (19.8 ms). | ||
| ↔ Tempo de resposta 50% cinza a 80% cinza | ||
| 27.6 ms ... ascensão ↗ e queda ↘ combinadas | ↗ 12.9 ms ascensão | 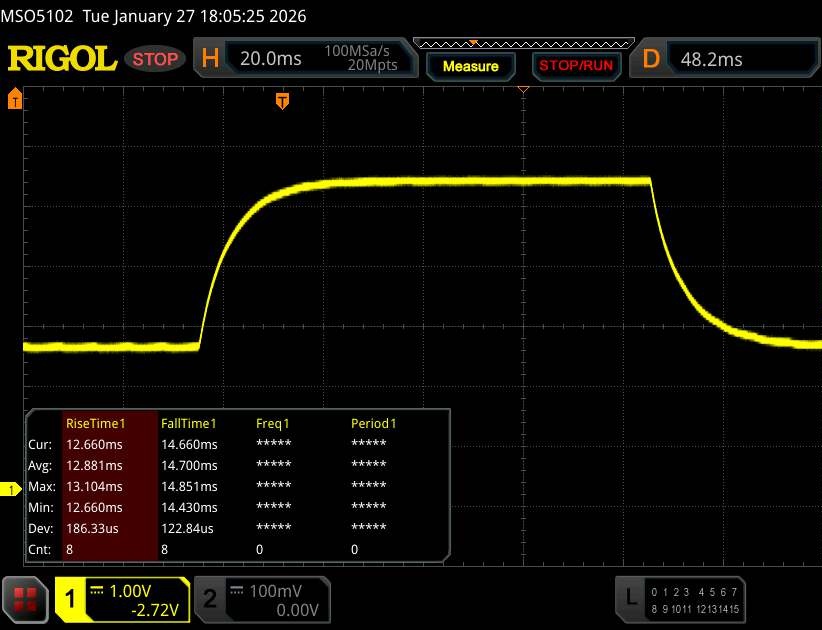 |
| ↘ 14.7 ms queda | ||
| A tela mostra taxas de resposta relativamente lentas em nossos testes e pode ser muito lenta para os jogadores. Em comparação, todos os dispositivos testados variam de 0.165 (mínimo) a 636 (máximo) ms. » 38 % de todos os dispositivos são melhores. Isso significa que o tempo de resposta medido é melhor que a média de todos os dispositivos testados (30.9 ms). | ||
Cintilação da tela / PWM (modulação por largura de pulso)
| Tela tremeluzindo / PWM não detectado |  | ||
[pwm_comparison] Em comparação: 52 % de todos os dispositivos testados não usam PWM para escurecer a tela. Se PWM foi detectado, uma média de 7744 (mínimo: 5 - máximo: 343500) Hz foi medida. | |||
Desempenho
O desempenho do Cyborg 15 está na faixa intermediária. Se a RAM ou o armazenamento em massa se esgotarem, eles podem ser atualizados graças a dois bancos SO-DIMM e um slot M.2-2280.
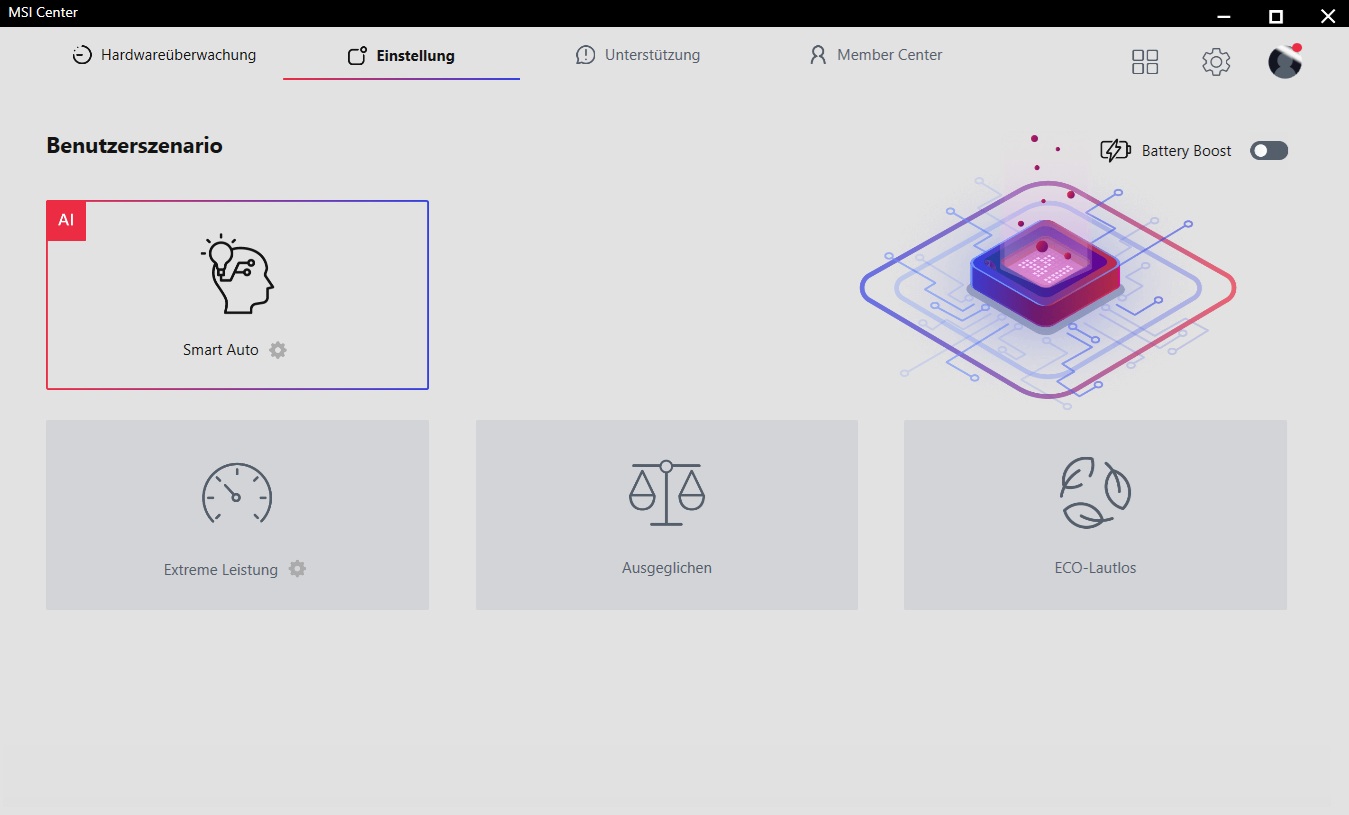
Condições de teste
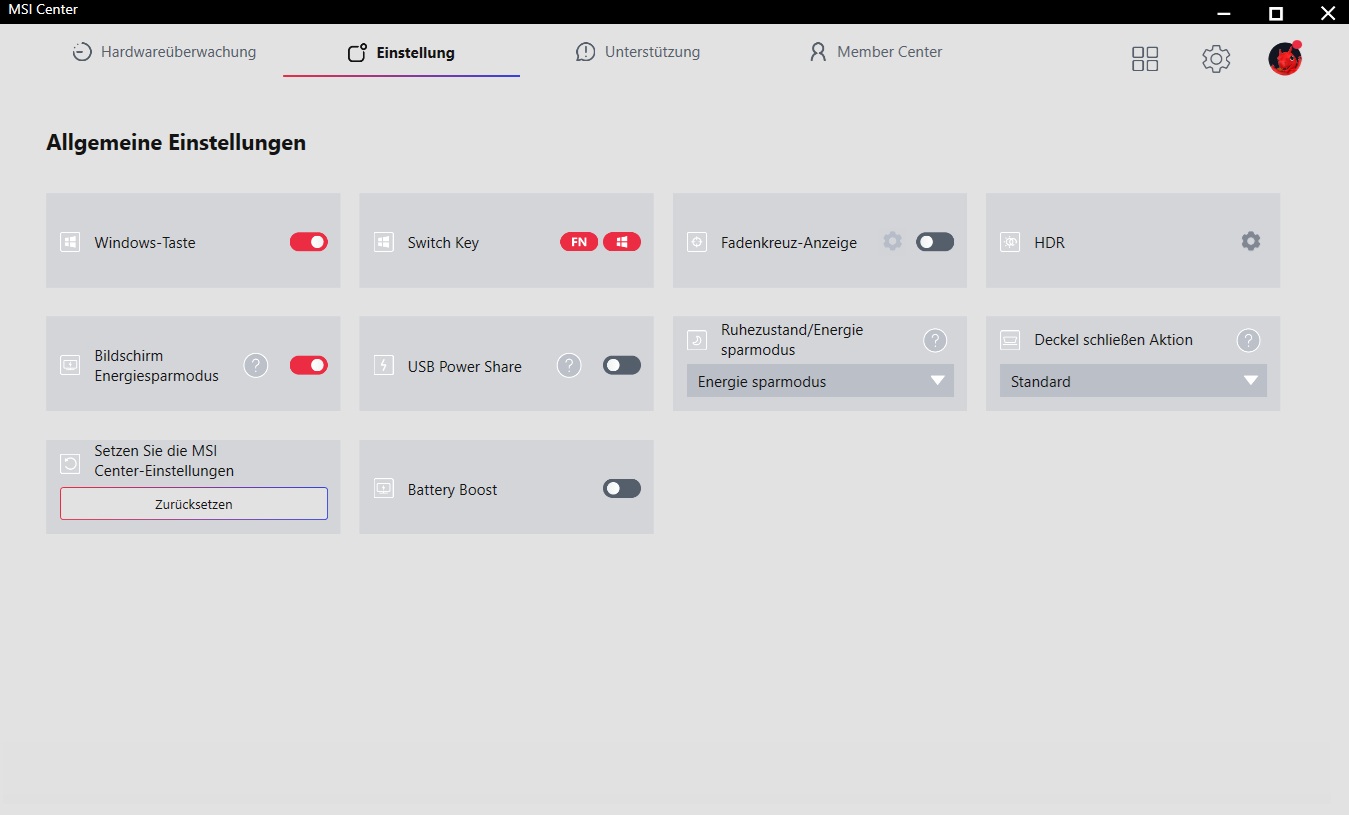
O MSI Center pré-instalado oferece vários cenários de usuário, desde ECO Silent até Extreme Performance. Nossas medições foram realizadas com o modo AI Smart Auto (as diferenças entre os perfis podem ser encontradas na tabela abaixo).
| Modo | Smart Auto | Extreme performance | Balanced | ECO Silent |
| Ruído do Cyberpunk 2077 | 45 dB(A) | 48 dB(A) | 45 dB(A) | 37 dB(A) |
| Taxa de quadros do Cyberpunk 2077 (FHD/Ultra) | 55,3 fps | 56,3 fps | 55,2 fps | 36,2 fps |
| Consumo de energia da GPU | ~40 W | ~45 W | ~40 W | ~35 W |
| CPU PL1 | 45 W | 45 W | 35 W | 15 W |
| CPU PL2 | 45 W | 45 W | 35 W | 15 W |
| Cinebench R15 Multi Score | 1913 Points | 1931 Points | 1669 Points | 731 Points |
Processador
Com o Core 7 240H é um modelo de 10 nm da geração Raptor Lake, que contém seis núcleos de desempenho incluindo Hyper-Threading e quatro núcleos de eficiência sem HT, possibilitando um total de 16 threads paralelos. No curso da CPU, o chip está posicionado entre o Core i5-13420H do Victus 15 ou Acer Nitro V 15 e o Core i7-12650H do antigo Cyborg 15. A concorrência da AMD está se adiantando, pelo menos na forma do Ryzen 7 250 (Lenovo LOQ 15) ou Ryzen 7 260 (Lenovo Legion 5 15).
Cinebench R15 Teste de resistência múltipla
* ... menor é melhor
AIDA64: FP32 Ray-Trace | FPU Julia | CPU SHA3 | CPU Queen | FPU SinJulia | FPU Mandel | CPU AES | CPU ZLib | FP64 Ray-Trace | CPU PhotoWorxx
| Performance rating | |
| Média da turma Gaming | |
| Lenovo Legion 5 15AHP G10 | |
| Lenovo LOQ 15AHP10 | |
| Média Intel Core 7 240H | |
| MSI Cyborg 15 A12VF | |
| MSI Cyborg 15 B2RWEKG | |
| Acer Nitro V 15 ANV15-52-50S2 | |
| HP Victus 15-fa2160ng | |
| AIDA64 / FP32 Ray-Trace | |
| Média da turma Gaming (10227 - 85542, n=102, últimos 2 anos) | |
| Lenovo Legion 5 15AHP G10 | |
| Lenovo LOQ 15AHP10 | |
| Média Intel Core 7 240H (11867 - 15972, n=4) | |
| MSI Cyborg 15 A12VF | |
| Acer Nitro V 15 ANV15-52-50S2 | |
| MSI Cyborg 15 B2RWEKG | |
| HP Victus 15-fa2160ng | |
| AIDA64 / FPU Julia | |
| Média da turma Gaming (51376 - 372155, n=102, últimos 2 anos) | |
| Lenovo Legion 5 15AHP G10 | |
| Lenovo LOQ 15AHP10 | |
| Média Intel Core 7 240H (59260 - 80238, n=4) | |
| MSI Cyborg 15 A12VF | |
| Acer Nitro V 15 ANV15-52-50S2 | |
| MSI Cyborg 15 B2RWEKG | |
| HP Victus 15-fa2160ng | |
| AIDA64 / CPU SHA3 | |
| Média da turma Gaming (2180 - 10115, n=102, últimos 2 anos) | |
| Lenovo Legion 5 15AHP G10 | |
| Lenovo LOQ 15AHP10 | |
| MSI Cyborg 15 A12VF | |
| Média Intel Core 7 240H (2455 - 3287, n=4) | |
| Acer Nitro V 15 ANV15-52-50S2 | |
| HP Victus 15-fa2160ng | |
| MSI Cyborg 15 B2RWEKG | |
| AIDA64 / CPU Queen | |
| Lenovo Legion 5 15AHP G10 | |
| Média da turma Gaming (49785 - 173351, n=86, últimos 2 anos) | |
| Lenovo LOQ 15AHP10 | |
| MSI Cyborg 15 A12VF | |
| Média Intel Core 7 240H (75356 - 81422, n=2) | |
| MSI Cyborg 15 B2RWEKG | |
| Acer Nitro V 15 ANV15-52-50S2 | |
| HP Victus 15-fa2160ng | |
| AIDA64 / FPU SinJulia | |
| Lenovo Legion 5 15AHP G10 | |
| Média da turma Gaming (4424 - 33636, n=102, últimos 2 anos) | |
| Lenovo LOQ 15AHP10 | |
| Média Intel Core 7 240H (7777 - 9366, n=4) | |
| MSI Cyborg 15 A12VF | |
| MSI Cyborg 15 B2RWEKG | |
| Acer Nitro V 15 ANV15-52-50S2 | |
| HP Victus 15-fa2160ng | |
| AIDA64 / FPU Mandel | |
| Média da turma Gaming (25115 - 196829, n=102, últimos 2 anos) | |
| Lenovo Legion 5 15AHP G10 | |
| Lenovo LOQ 15AHP10 | |
| Média Intel Core 7 240H (29381 - 39967, n=4) | |
| MSI Cyborg 15 A12VF | |
| Acer Nitro V 15 ANV15-52-50S2 | |
| MSI Cyborg 15 B2RWEKG | |
| HP Victus 15-fa2160ng | |
| AIDA64 / CPU AES | |
| Média da turma Gaming (39258 - 247074, n=102, últimos 2 anos) | |
| Lenovo Legion 5 15AHP G10 | |
| Lenovo LOQ 15AHP10 | |
| MSI Cyborg 15 A12VF | |
| Média Intel Core 7 240H (50528 - 67855, n=4) | |
| MSI Cyborg 15 B2RWEKG | |
| Acer Nitro V 15 ANV15-52-50S2 | |
| HP Victus 15-fa2160ng | |
| AIDA64 / CPU ZLib | |
| Média da turma Gaming (574 - 2531, n=102, últimos 2 anos) | |
| Lenovo Legion 5 15AHP G10 | |
| Lenovo LOQ 15AHP10 | |
| MSI Cyborg 15 A12VF | |
| Média Intel Core 7 240H (725 - 951, n=4) | |
| Acer Nitro V 15 ANV15-52-50S2 | |
| HP Victus 15-fa2160ng | |
| MSI Cyborg 15 B2RWEKG | |
| AIDA64 / FP64 Ray-Trace | |
| Média da turma Gaming (5509 - 45446, n=102, últimos 2 anos) | |
| Lenovo Legion 5 15AHP G10 | |
| Lenovo LOQ 15AHP10 | |
| Média Intel Core 7 240H (6389 - 8569, n=4) | |
| MSI Cyborg 15 A12VF | |
| Acer Nitro V 15 ANV15-52-50S2 | |
| MSI Cyborg 15 B2RWEKG | |
| HP Victus 15-fa2160ng | |
| AIDA64 / CPU PhotoWorxx | |
| Média da turma Gaming (12271 - 89891, n=102, últimos 2 anos) | |
| Lenovo Legion 5 15AHP G10 | |
| Média Intel Core 7 240H (21710 - 44874, n=4) | |
| MSI Cyborg 15 B2RWEKG | |
| MSI Cyborg 15 A12VF | |
| Lenovo LOQ 15AHP10 | |
| HP Victus 15-fa2160ng | |
| Acer Nitro V 15 ANV15-52-50S2 | |
Desempenho do sistema
O Cyborg 15 também está no meio do caminho em termos de desempenho do sistema. O computador responde agradavelmente rápido no uso diário.
PCMark 10: Productivity | Digital Content Creation
CrossMark: Overall | Productivity | Creativity | Responsiveness
WebXPRT 3: Overall
WebXPRT 4: Overall
Mozilla Kraken 1.1: Total
| Performance rating | |
| Média da turma Gaming | |
| Lenovo Legion 5 15AHP G10 | |
| MSI Cyborg 15 A12VF | |
| Lenovo LOQ 15AHP10 -2! | |
| MSI Cyborg 15 B2RWEKG | |
| Média Intel Core 7 240H, NVIDIA GeForce RTX 5050 Laptop | |
| Acer Nitro V 15 ANV15-52-50S2 | |
| HP Victus 15-fa2160ng | |
| PCMark 10 / Productivity | |
| Média da turma Gaming (6845 - 25323, n=95, últimos 2 anos) | |
| MSI Cyborg 15 B2RWEKG | |
| Média Intel Core 7 240H, NVIDIA GeForce RTX 5050 Laptop (n=1) | |
| Acer Nitro V 15 ANV15-52-50S2 | |
| Lenovo Legion 5 15AHP G10 | |
| MSI Cyborg 15 A12VF | |
| Lenovo LOQ 15AHP10 | |
| HP Victus 15-fa2160ng | |
| PCMark 10 / Digital Content Creation | |
| Média da turma Gaming (7602 - 19954, n=95, últimos 2 anos) | |
| Lenovo Legion 5 15AHP G10 | |
| Lenovo LOQ 15AHP10 | |
| MSI Cyborg 15 A12VF | |
| HP Victus 15-fa2160ng | |
| Acer Nitro V 15 ANV15-52-50S2 | |
| MSI Cyborg 15 B2RWEKG | |
| Média Intel Core 7 240H, NVIDIA GeForce RTX 5050 Laptop (n=1) | |
| CrossMark / Overall | |
| Média da turma Gaming (1366 - 2409, n=94, últimos 2 anos) | |
| MSI Cyborg 15 A12VF | |
| Lenovo Legion 5 15AHP G10 | |
| Lenovo LOQ 15AHP10 | |
| MSI Cyborg 15 B2RWEKG | |
| Média Intel Core 7 240H, NVIDIA GeForce RTX 5050 Laptop (n=1) | |
| Acer Nitro V 15 ANV15-52-50S2 | |
| HP Victus 15-fa2160ng | |
| CrossMark / Productivity | |
| Média da turma Gaming (1386 - 2254, n=94, últimos 2 anos) | |
| Lenovo LOQ 15AHP10 | |
| MSI Cyborg 15 A12VF | |
| Lenovo Legion 5 15AHP G10 | |
| MSI Cyborg 15 B2RWEKG | |
| Média Intel Core 7 240H, NVIDIA GeForce RTX 5050 Laptop (n=1) | |
| Acer Nitro V 15 ANV15-52-50S2 | |
| HP Victus 15-fa2160ng | |
| CrossMark / Creativity | |
| Média da turma Gaming (1343 - 2786, n=94, últimos 2 anos) | |
| Lenovo Legion 5 15AHP G10 | |
| MSI Cyborg 15 A12VF | |
| MSI Cyborg 15 B2RWEKG | |
| Média Intel Core 7 240H, NVIDIA GeForce RTX 5050 Laptop (n=1) | |
| Lenovo LOQ 15AHP10 | |
| HP Victus 15-fa2160ng | |
| Acer Nitro V 15 ANV15-52-50S2 | |
| CrossMark / Responsiveness | |
| Média da turma Gaming (1226 - 2334, n=94, últimos 2 anos) | |
| Lenovo LOQ 15AHP10 | |
| MSI Cyborg 15 A12VF | |
| Lenovo Legion 5 15AHP G10 | |
| MSI Cyborg 15 B2RWEKG | |
| Média Intel Core 7 240H, NVIDIA GeForce RTX 5050 Laptop (n=1) | |
| Acer Nitro V 15 ANV15-52-50S2 | |
| HP Victus 15-fa2160ng | |
| WebXPRT 3 / Overall | |
| Média da turma Gaming (220 - 532, n=98, últimos 2 anos) | |
| Lenovo Legion 5 15AHP G10 | |
| MSI Cyborg 15 A12VF | |
| MSI Cyborg 15 B2RWEKG | |
| Média Intel Core 7 240H, NVIDIA GeForce RTX 5050 Laptop (n=1) | |
| HP Victus 15-fa2160ng | |
| Acer Nitro V 15 ANV15-52-50S2 | |
| WebXPRT 4 / Overall | |
| Média da turma Gaming (165 - 354, n=98, últimos 2 anos) | |
| Lenovo Legion 5 15AHP G10 | |
| MSI Cyborg 15 B2RWEKG | |
| Média Intel Core 7 240H, NVIDIA GeForce RTX 5050 Laptop (n=1) | |
| MSI Cyborg 15 A12VF | |
| HP Victus 15-fa2160ng | |
| Acer Nitro V 15 ANV15-52-50S2 | |
| Mozilla Kraken 1.1 / Total | |
| Acer Nitro V 15 ANV15-52-50S2 | |
| HP Victus 15-fa2160ng | |
| MSI Cyborg 15 A12VF | |
| MSI Cyborg 15 B2RWEKG | |
| Média Intel Core 7 240H, NVIDIA GeForce RTX 5050 Laptop (n=1) | |
| Lenovo LOQ 15AHP10 | |
| Lenovo Legion 5 15AHP G10 | |
| Média da turma Gaming (391 - 590, n=100, últimos 2 anos) | |
* ... menor é melhor
| AIDA64 / Memory Copy | |
| Média da turma Gaming (21750 - 129946, n=102, últimos 2 anos) | |
| Lenovo Legion 5 15AHP G10 | |
| MSI Cyborg 15 B2RWEKG | |
| Média Intel Core 7 240H (34965 - 69215, n=4) | |
| MSI Cyborg 15 A12VF | |
| Lenovo LOQ 15AHP10 | |
| HP Victus 15-fa2160ng | |
| Acer Nitro V 15 ANV15-52-50S2 | |
| AIDA64 / Memory Read | |
| Média da turma Gaming (22956 - 118858, n=102, últimos 2 anos) | |
| MSI Cyborg 15 B2RWEKG | |
| MSI Cyborg 15 A12VF | |
| Lenovo Legion 5 15AHP G10 | |
| Média Intel Core 7 240H (39706 - 71870, n=4) | |
| HP Victus 15-fa2160ng | |
| Lenovo LOQ 15AHP10 | |
| Acer Nitro V 15 ANV15-52-50S2 | |
| AIDA64 / Memory Write | |
| Lenovo Legion 5 15AHP G10 | |
| Média da turma Gaming (22297 - 135096, n=102, últimos 2 anos) | |
| Média Intel Core 7 240H (33560 - 80488, n=4) | |
| MSI Cyborg 15 B2RWEKG | |
| MSI Cyborg 15 A12VF | |
| Lenovo LOQ 15AHP10 | |
| HP Victus 15-fa2160ng | |
| Acer Nitro V 15 ANV15-52-50S2 | |
| AIDA64 / Memory Latency | |
| Média Intel Core 7 240H (97.1 - 125.6, n=4) | |
| Média da turma Gaming (75.3 - 165.4, n=102, últimos 2 anos) | |
| HP Victus 15-fa2160ng | |
| MSI Cyborg 15 B2RWEKG | |
| Acer Nitro V 15 ANV15-52-50S2 | |
| Lenovo LOQ 15AHP10 | |
| Lenovo Legion 5 15AHP G10 | |
| MSI Cyborg 15 A12VF | |
* ... menor é melhor
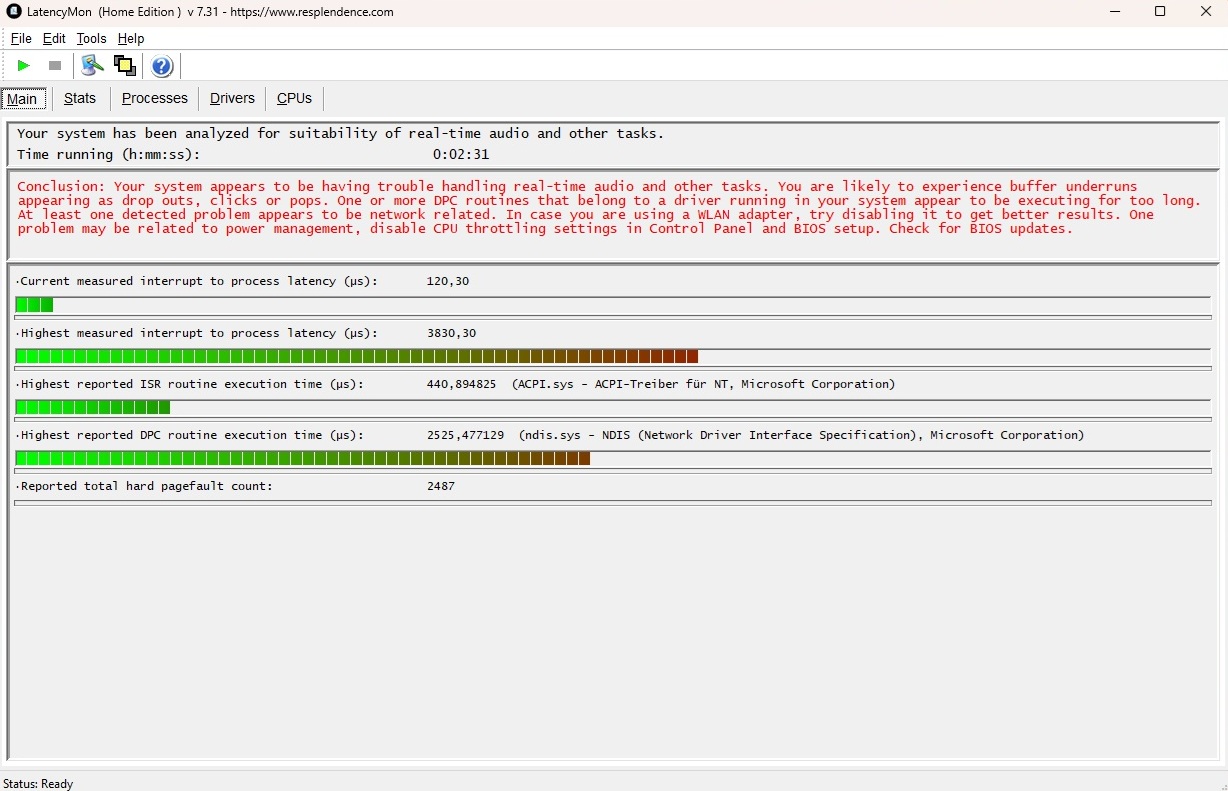
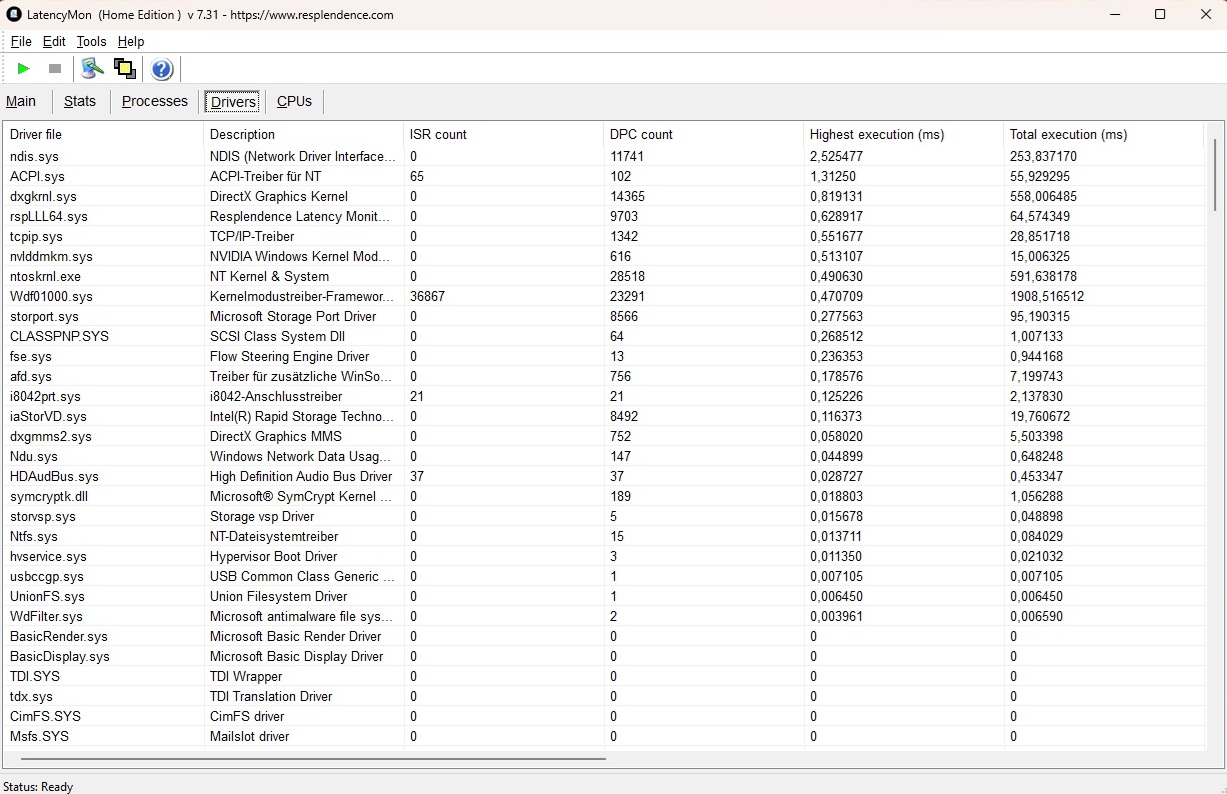
Latências de DPC
Como sempre acontece, o senhor precisa se recuperar quando se trata de latência. No entanto, muitos notebooks ficam aquém, como pode ser visto na tabela.
| DPC Latencies / LatencyMon - interrupt to process latency (max), Web, Youtube, Prime95 | |
| MSI Cyborg 15 B2RWEKG | |
| Acer Nitro V 15 ANV15-52-50S2 | |
| HP Victus 15-fa2160ng | |
| Lenovo Legion 5 15AHP G10 | |
| Lenovo LOQ 15AHP10 | |
| MSI Cyborg 15 A12VF | |
* ... menor é melhor
Armazenamento em massa
512 GB de capacidade de armazenamento é um pouco escasso em 2026. No entanto, o SSD NVMe integrado da Western Digital é relativamente rápido e também apresentou um desempenho bastante consistente no teste de resistência, o que não pode ser dito de todos os concorrentes.

* ... menor é melhor
Desempenho contínuo de leitura: Loop de leitura do DiskSpd, profundidade da fila 8
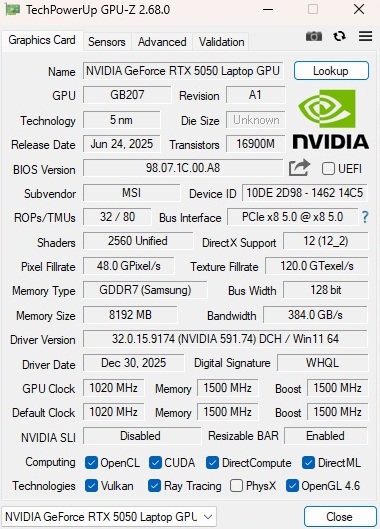
Desempenho da GPU
O GeForce RTX 5050 marca a entrada da Nvidia no mundo dos jogos móveis. Embora o chip Blackwell seja especificado com até 100 watts de TGP em outros dispositivos, o Cyborg 15 atinge apenas um máximo de 45 watts - um valor bastante reduzido. Portanto, não é de surpreender que o dispositivo de 15 polegadas esteja um pouco menos de 20% atrás de suas contrapartes RTX 5050 no curso da GPU e até mesmo um pouco atrás de seu antecessor com a RTX 4060.
| 3DMark 11 Performance | 20180 pontos | |
| 3DMark Cloud Gate Standard Score | 49085 pontos | |
| 3DMark Fire Strike Score | 18022 pontos | |
| 3DMark Time Spy Score | 7561 pontos | |
Ajuda | ||
* ... menor é melhor
Desempenho em jogos
A situação é semelhante nos benchmarks de jogos, embora o Acer Nitro V 15 também seja mais fraco aqui. Se o senhor se limitar à resolução nativa de 1.920 x 1.080 pixels, a maioria dos jogos atuais, pelo menos, funciona sem problemas com detalhes médios a altos. Se quiser extrair mais FPS do sistema, o senhor pode usar recursos como o upscaling, como de costume. Incluindo o DLSS Balanced Black Ops 7 é executado a 40 FPS em vez de 24 FPS ao usar a predefinição Extreme, por exemplo. A geração quádrupla de quadros catapulta o desempenho para impressionantes 103 FPS, embora a sensação subjetiva de velocidade possa variar um pouco.
| Cyberpunk 2077 - 1920x1080 Ultra Preset (FSR off) | |
| Média da turma Gaming (17.7 - 169.9, n=112, últimos 2 anos) | |
| Lenovo Legion 5 15AHP G10 | |
| Lenovo LOQ 15AHP10 | |
| HP Victus 15-fa2160ng | |
| Média NVIDIA GeForce RTX 5050 Laptop (55.3 - 76.9, n=10) | |
| Acer Nitro V 15 ANV15-52-50S2 | |
| MSI Cyborg 15 B2RWEKG | |
| GTA V - 1920x1080 Highest AA:4xMSAA + FX AF:16x | |
| Média da turma Gaming (67.1 - 186.9, n=90, últimos 2 anos) | |
| Lenovo Legion 5 15AHP G10 | |
| Média NVIDIA GeForce RTX 5050 Laptop (88.1 - 129.7, n=8) | |
| Lenovo LOQ 15AHP10 | |
| MSI Cyborg 15 B2RWEKG | |
| MSI Cyborg 15 A12VF | |
| HP Victus 15-fa2160ng | |
| baixo | média | alto | ultra | |
|---|---|---|---|---|
| GTA V (2015) | 175.1 | 162 | 93.6 | |
| Dota 2 Reborn (2015) | 99.5 | 82.8 | 84.8 | |
| X-Plane 11.11 (2018) | 80.4 | 66.9 | ||
| Baldur's Gate 3 (2023) | 76.3 | 66.1 | 59.4 | |
| Cyberpunk 2077 (2023) | 76 | 62.6 | 55.3 | |
| Stalker 2 (2024) | 46.4 | 40.2 | 28.8 | |
| Indiana Jones and the Great Circle (2024) | 59.5 | 50.1 | 30.6 | |
| Monster Hunter Wilds (2025) | 45.5 | 41.4 | 32.1 | |
| The Outer Worlds 2 (2025) | 64.8 | 51.1 | 26.4 | |
| ARC Raiders (2025) | 81.7 | 64.5 | 43.5 | |
| Anno 117: Pax Romana (2025) | 56 | 40.7 | 20.2 | |
| Call of Duty Black Ops 7 (2025) | 87 | 70 | 24 |
| Call of Duty Black Ops 7 | |
| 1920x1080 Extreme Preset + Raytracing | |
| Média da turma Gaming (24 - 69, n=12, últimos 2 anos) | |
| Tulpar T6 V3.5 | |
| Acer Nitro V14 AI ANV14-62-R9LT | |
| Média NVIDIA GeForce RTX 5050 Laptop (24 - 27, n=2) | |
| MSI Cyborg 15 B2RWEKG | |
| 1920x1080 Ultra Preset | |
| Média da turma Gaming (70 - 170, n=12, últimos 2 anos) | |
| Tulpar T6 V3.5 | |
| Acer Nitro V14 AI ANV14-62-R9LT | |
| Média NVIDIA GeForce RTX 5050 Laptop (70 - 75, n=2) | |
| MSI Cyborg 15 B2RWEKG | |
| The Outer Worlds 2 | |
| 1920x1080 Very High Preset AA:T | |
| Média da turma Gaming (26.4 - 58.4, n=11, últimos 2 anos) | |
| Tulpar T6 V3.5 | |
| Média NVIDIA GeForce RTX 5050 Laptop (26.4 - 33.2, n=3) | |
| Acer Nitro V14 AI ANV14-62-R9LT | |
| MSI Cyborg 15 B2RWEKG | |
| 1920x1080 High Preset AA:T | |
| Média da turma Gaming (51.1 - 94.5, n=11, últimos 2 anos) | |
| Tulpar T6 V3.5 | |
| Média NVIDIA GeForce RTX 5050 Laptop (51.1 - 60, n=3) | |
| Acer Nitro V14 AI ANV14-62-R9LT | |
| MSI Cyborg 15 B2RWEKG | |
| ARC Raiders | |
| 1920x1080 Epic Preset + Epic Raytracing AA:TSR | |
| Média da turma Gaming (43.5 - 98.6, n=11, últimos 2 anos) | |
| Tulpar T6 V3.5 | |
| Média NVIDIA GeForce RTX 5050 Laptop (43.5 - 58.2, n=4) | |
| Acer Nitro V14 AI ANV14-62-R9LT | |
| MSI Cyborg 15 B2RWEKG | |
| 1920x1080 High Preset AA:TSR | |
| Média da turma Gaming (64.5 - 144.4, n=11, últimos 2 anos) | |
| Tulpar T6 V3.5 | |
| Média NVIDIA GeForce RTX 5050 Laptop (64.5 - 85.9, n=4) | |
| Acer Nitro V14 AI ANV14-62-R9LT | |
| MSI Cyborg 15 B2RWEKG | |
Gráfico de ultra FPS do Cyberpunk 2077
Emissões
Emissões de ruído
Como a CPU e a GPU não atingem os valores máximos, o computador de 15 polegadas permanece mais silencioso do que a maioria dos concorrentes sob carga. 45 dB(A) no Cyberpunk 2077 é claramente audível, mas não muito alto. No modo inativo, o Cyborg 15 é relativamente silencioso por longos períodos e, às vezes, a ventoinha fica completamente desligada.
Barulho
| Ocioso |
| 25 / 28 / 33 dB |
| Carga |
| 44 / 50 dB |
 | ||
30 dB silencioso 40 dB(A) audível 50 dB(A) ruidosamente alto |
||
min: | ||
| MSI Cyborg 15 B2RWEKG Core 7 240H, GeForce RTX 5050 Laptop | MSI Cyborg 15 A12VF i7-12650H, GeForce RTX 4060 Laptop GPU | Acer Nitro V 15 ANV15-52-50S2 i5-13420H, GeForce RTX 5050 Laptop | HP Victus 15-fa2160ng i5-13420H, GeForce RTX 5050 Laptop | Lenovo LOQ 15AHP10 R7 250, GeForce RTX 5060 Laptop | Lenovo Legion 5 15AHP G10 R7 260, GeForce RTX 5060 Laptop | |
|---|---|---|---|---|---|---|
| Noise | -19% | -7% | 1% | -32% | 4% | |
| desligado / ambiente * (dB) | 24 | 27 -13% | 24 -0% | 24 -0% | 25 -4% | 25.5 -6% |
| Idle Minimum * (dB) | 25 | 27 -8% | 28 -12% | 28 -12% | 43 -72% | 25.5 -2% |
| Idle Average * (dB) | 28 | 37.5 -34% | 29 -4% | 29 -4% | 45 -61% | 25.5 9% |
| Idle Maximum * (dB) | 33 | 38 -15% | 33 -0% | 30 9% | 48 -45% | 26.9 18% |
| Load Average * (dB) | 44 | 56.3 -28% | 48 -9% | 40 9% | 53 -20% | 34.6 21% |
| Cyberpunk 2077 ultra * (dB) | 45 | 52 -16% | 46 -2% | 51 -13% | 50.1 -11% | |
| Load Maximum * (dB) | 50 | 56.3 -13% | 54 -8% | 48 4% | 53 -6% | 50.1 -0% |
* ... menor é melhor
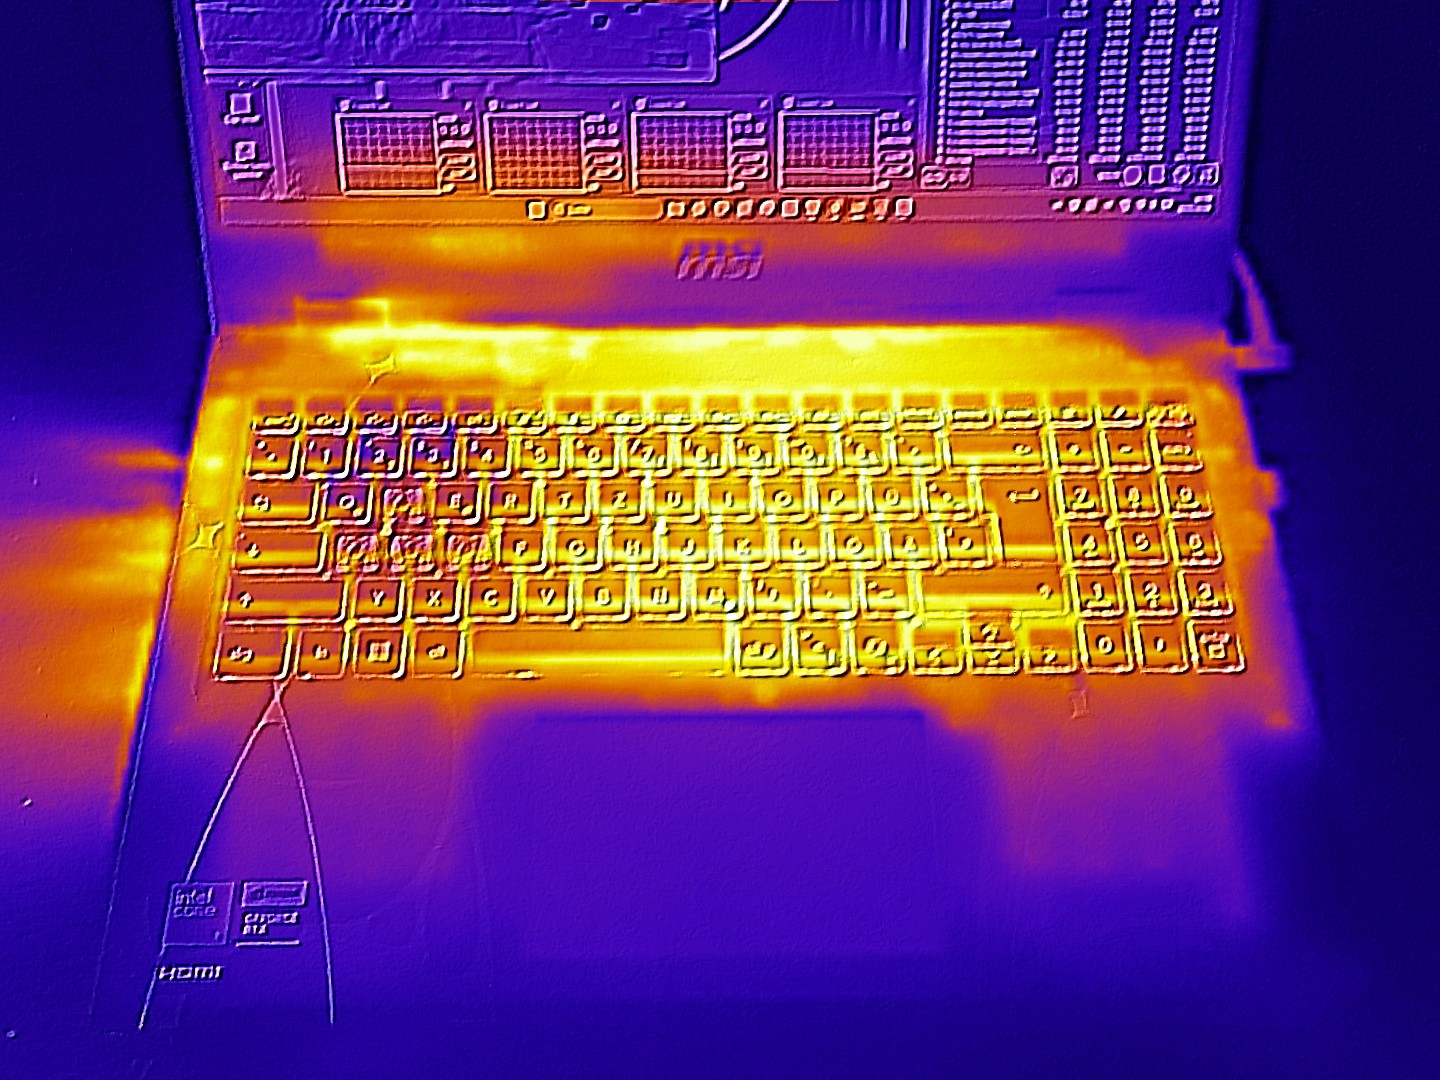
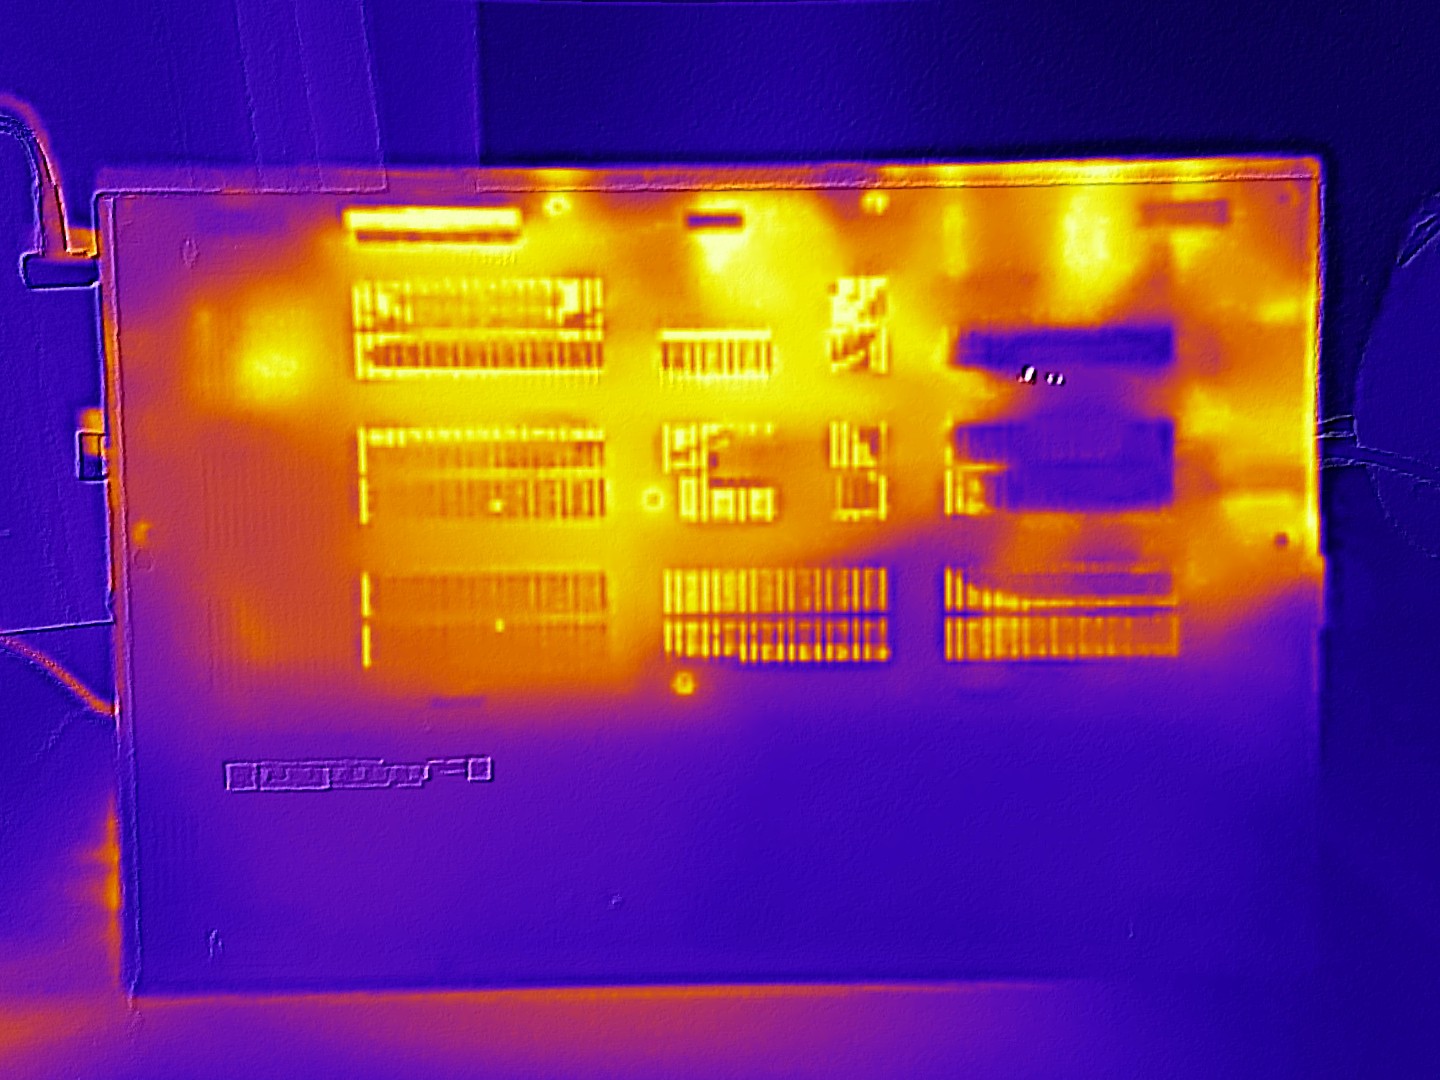
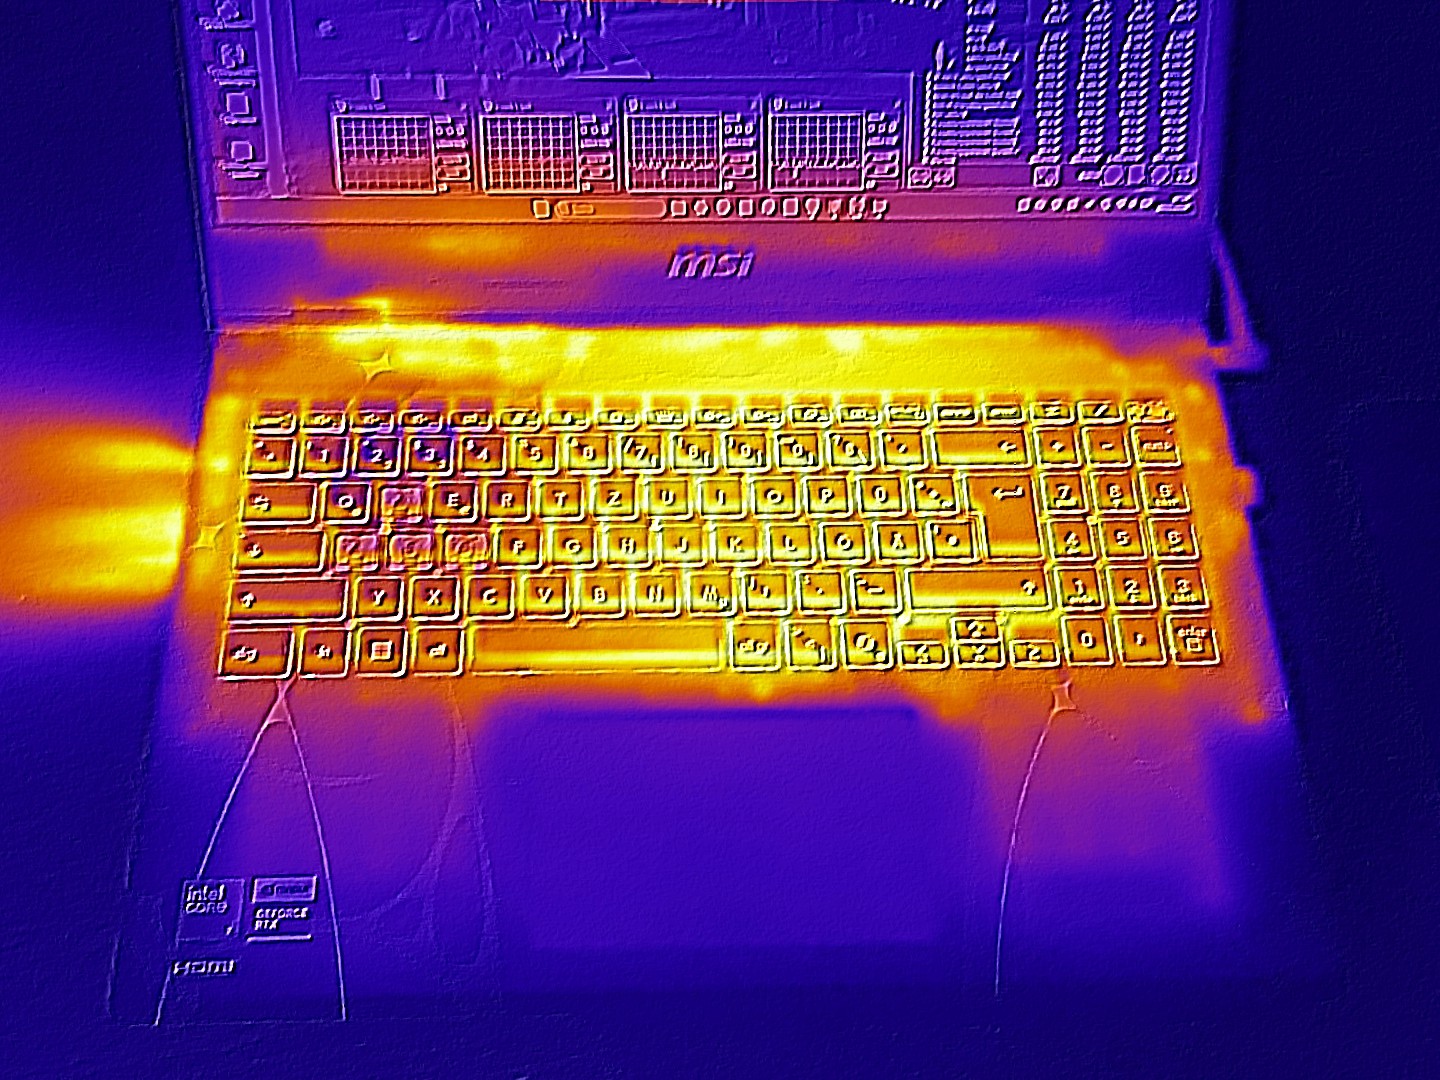
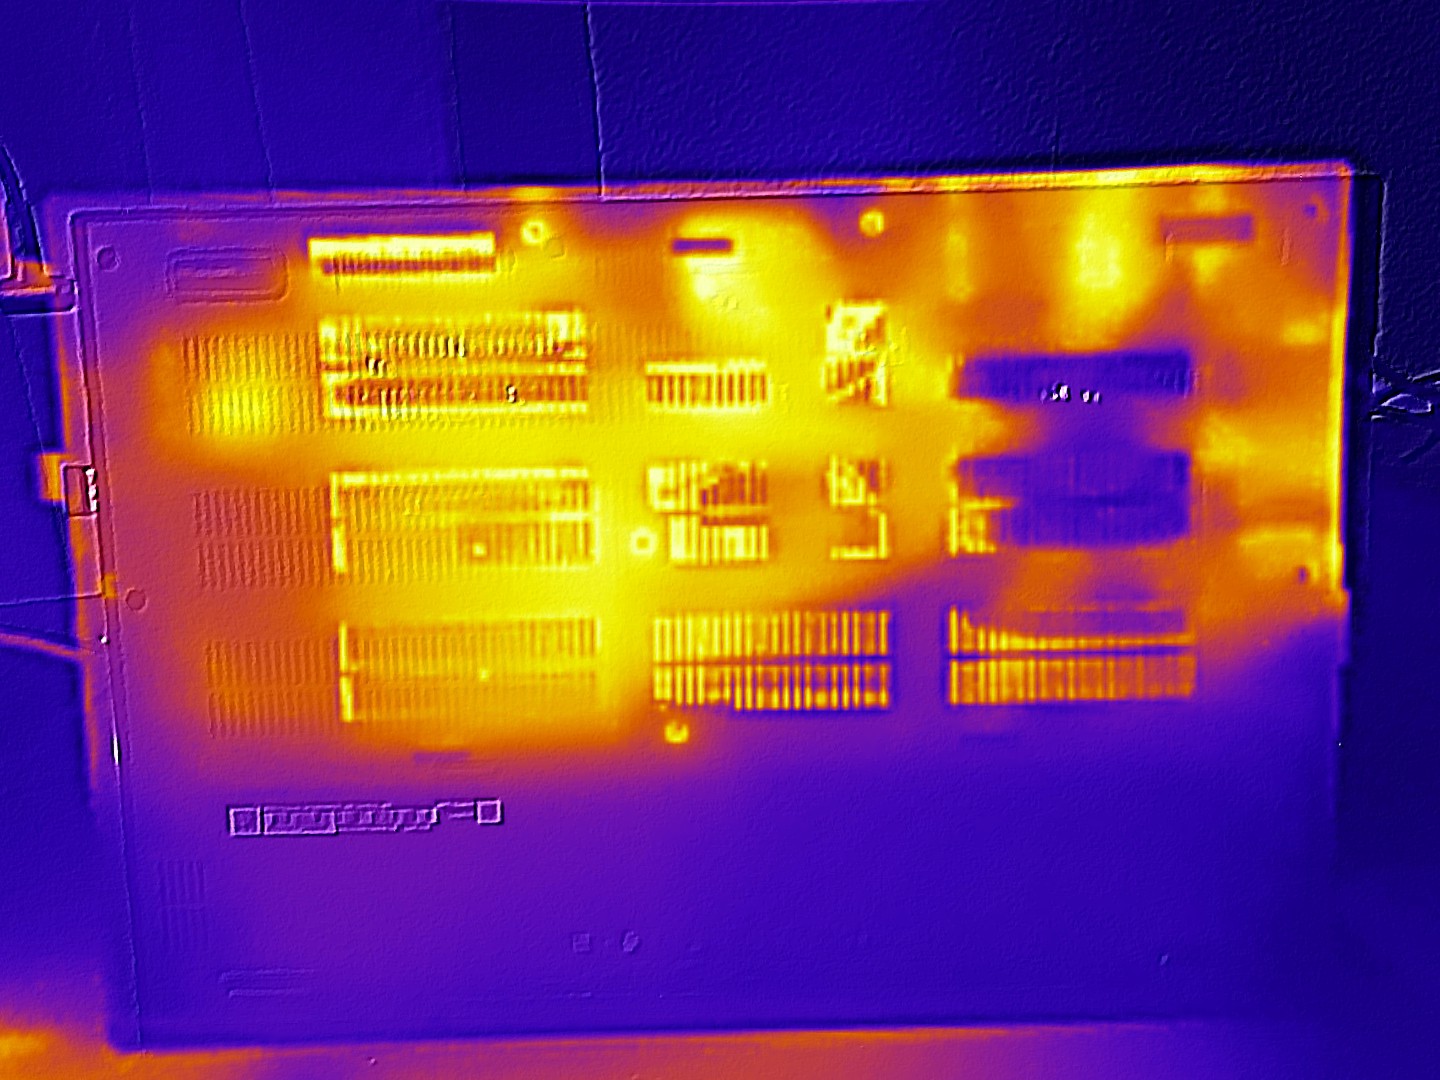
Temperatura
As temperaturas também são boas. A parte superior e inferior aquecem até um máximo de 46 e 45 °C (~114,8 e 113 °F), respectivamente, sob carga elevada. Alguns pontos fracos são evidentes no modo inativo, em que o Cyborg 15 tende a ser mais quente do que seus concorrentes.
(-) A temperatura máxima no lado superior é 46 °C / 115 F, em comparação com a média de 40.4 °C / 105 F , variando de 21.2 a 68.8 °C para a classe Gaming.
(±) A parte inferior aquece até um máximo de 45 °C / 113 F, em comparação com a média de 43.2 °C / 110 F
(±) Em uso inativo, a temperatura média para o lado superior é 32.6 °C / 91 F, em comparação com a média do dispositivo de 33.9 °C / ### class_avg_f### F.
(-) 3: The average temperature for the upper side is 39 °C / 102 F, compared to the average of 33.9 °C / 93 F for the class Gaming.
(+) Os apoios para as mãos e o touchpad estão atingindo a temperatura máxima da pele (32 °C / 89.6 F) e, portanto, não estão quentes.
(-) A temperatura média da área do apoio para as mãos de dispositivos semelhantes foi 28.8 °C / 83.8 F (-3.2 °C / -5.8 F).
| MSI Cyborg 15 B2RWEKG Core 7 240H, GeForce RTX 5050 Laptop | MSI Cyborg 15 A12VF i7-12650H, GeForce RTX 4060 Laptop GPU | Acer Nitro V 15 ANV15-52-50S2 i5-13420H, GeForce RTX 5050 Laptop | HP Victus 15-fa2160ng i5-13420H, GeForce RTX 5050 Laptop | Lenovo LOQ 15AHP10 R7 250, GeForce RTX 5060 Laptop | Lenovo Legion 5 15AHP G10 R7 260, GeForce RTX 5060 Laptop | |
|---|---|---|---|---|---|---|
| Heat | 16% | 9% | 9% | -0% | 9% | |
| Maximum Upper Side * (°C) | 46 | 47.5 -3% | 46 -0% | 43 7% | 49 -7% | 42.2 8% |
| Maximum Bottom * (°C) | 45 | 35.5 21% | 49 -9% | 43 4% | 58 -29% | 51.7 -15% |
| Idle Upper Side * (°C) | 36 | 27.7 23% | 28 22% | 37 -3% | 32 11% | 28.5 21% |
| Idle Bottom * (°C) | 38 | 29.5 22% | 30 21% | 28 26% | 29 24% | 29.2 23% |
* ... menor é melhor
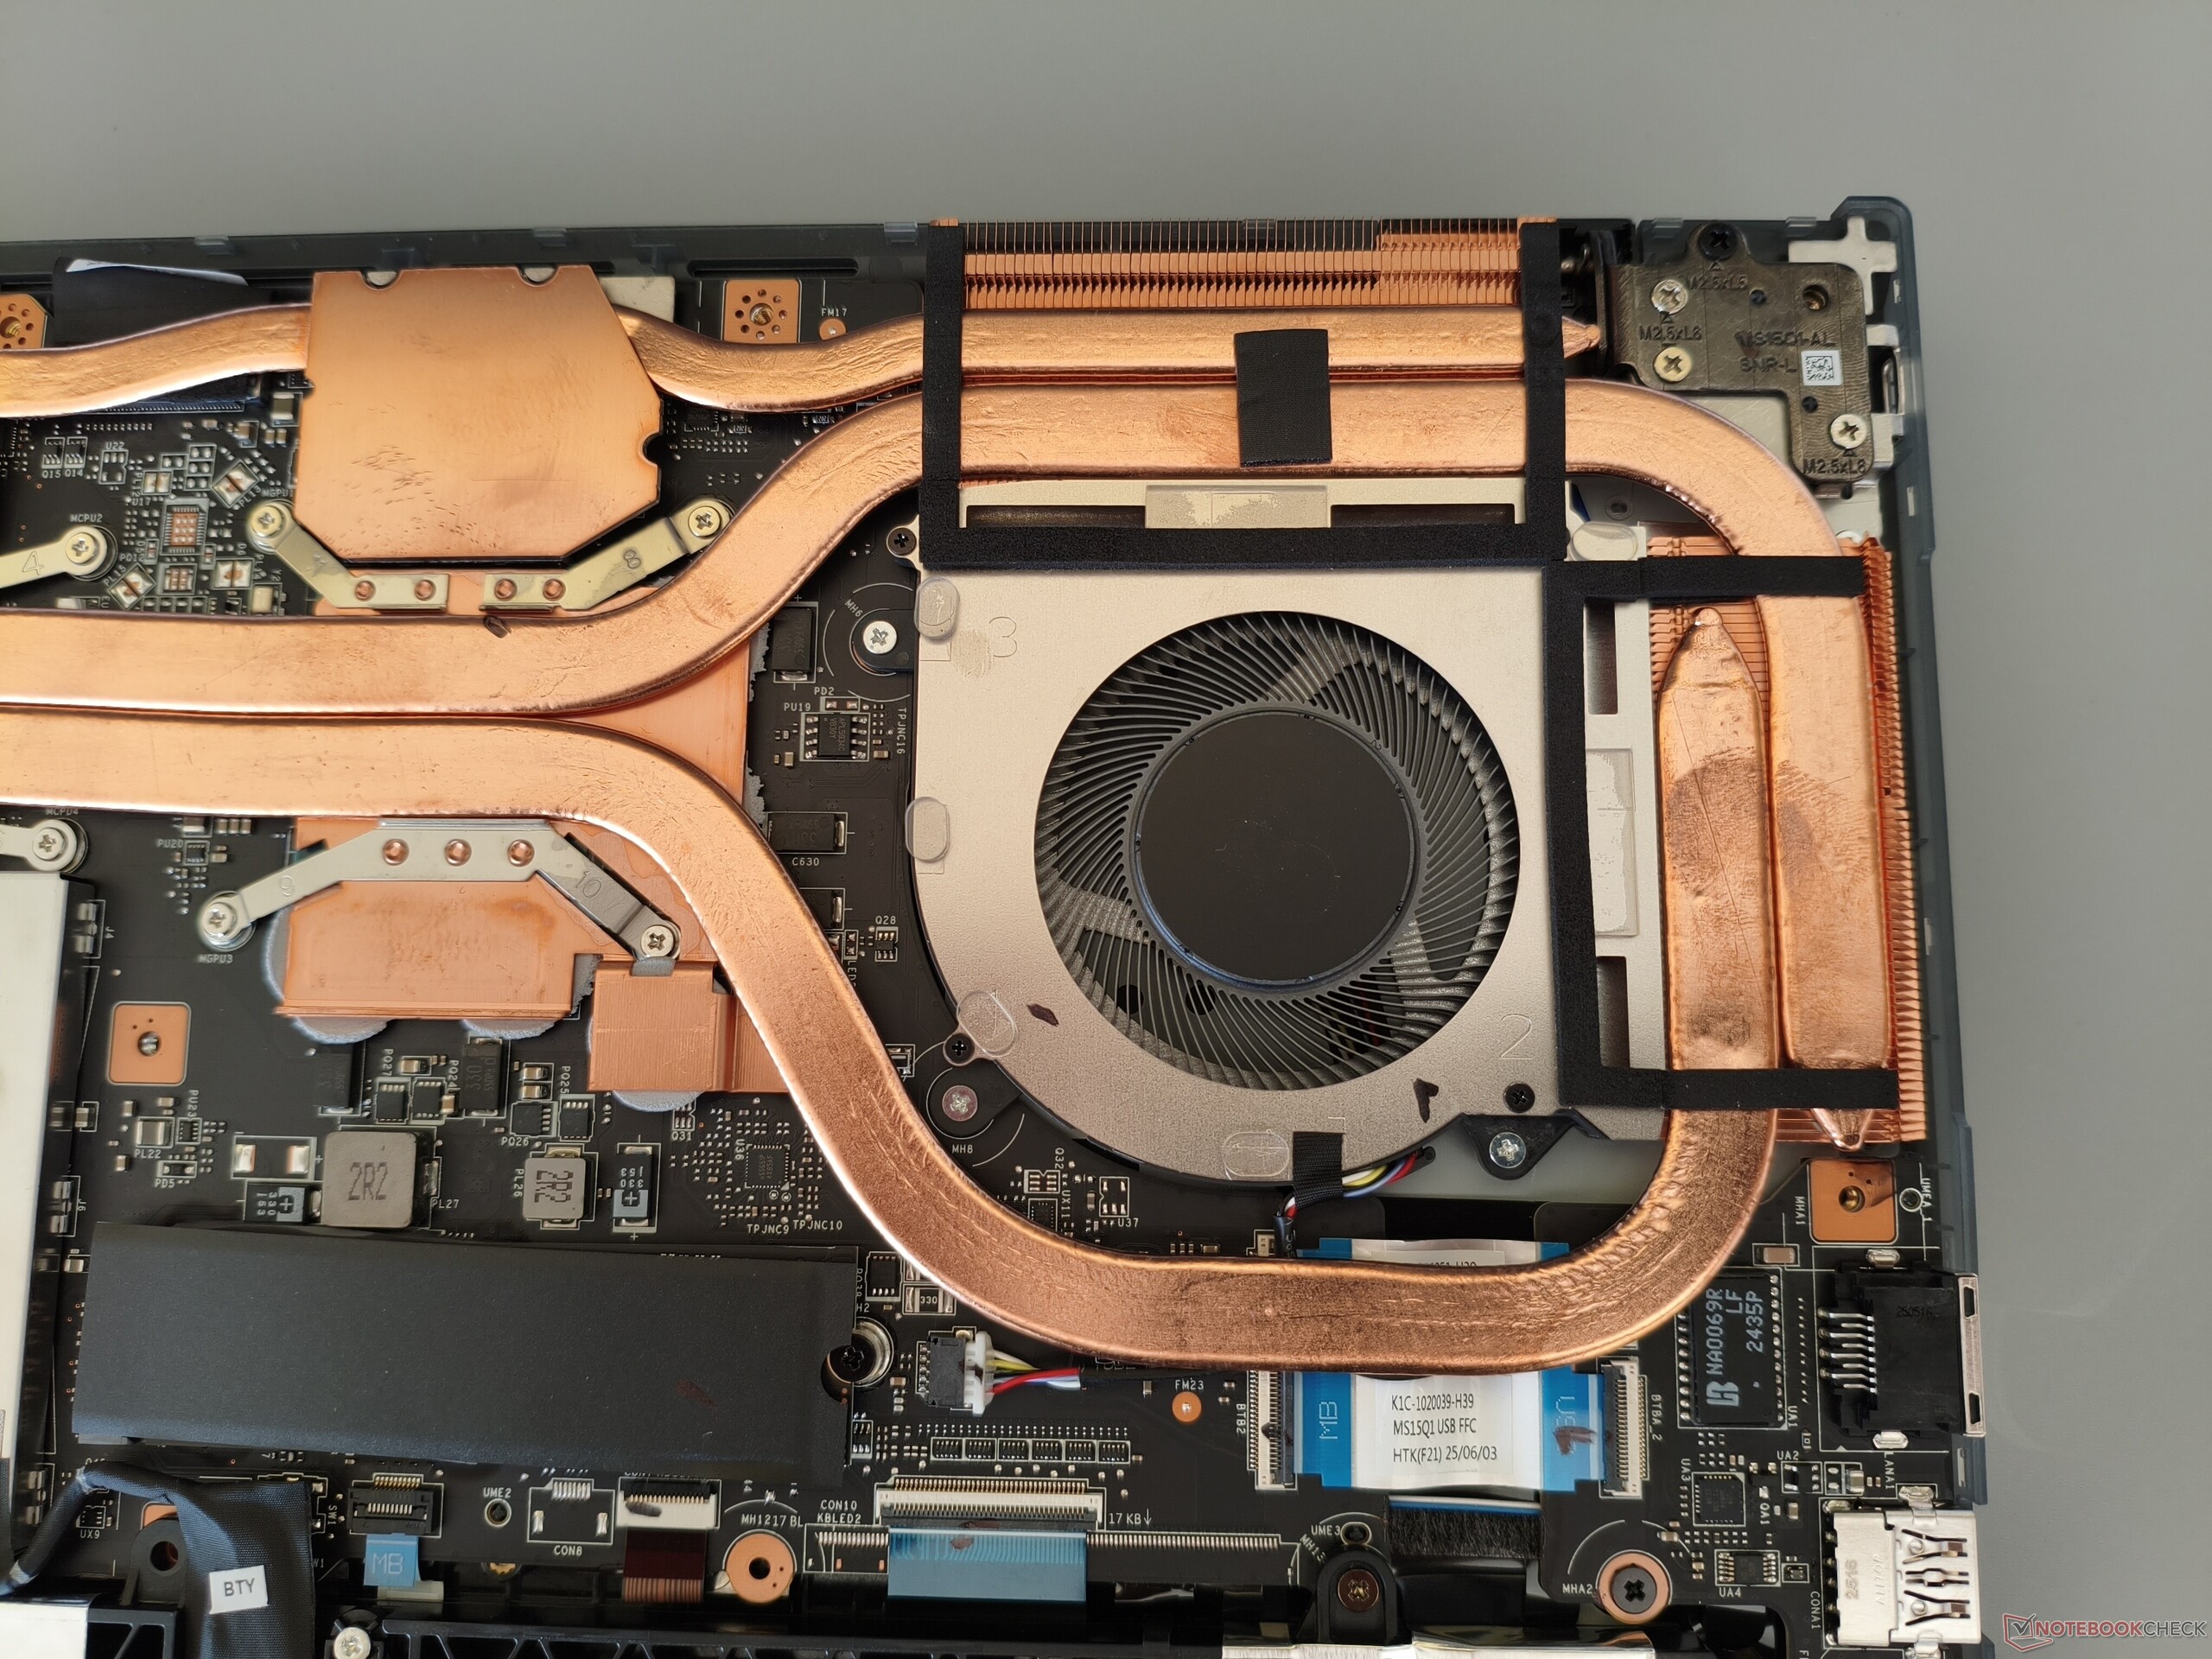
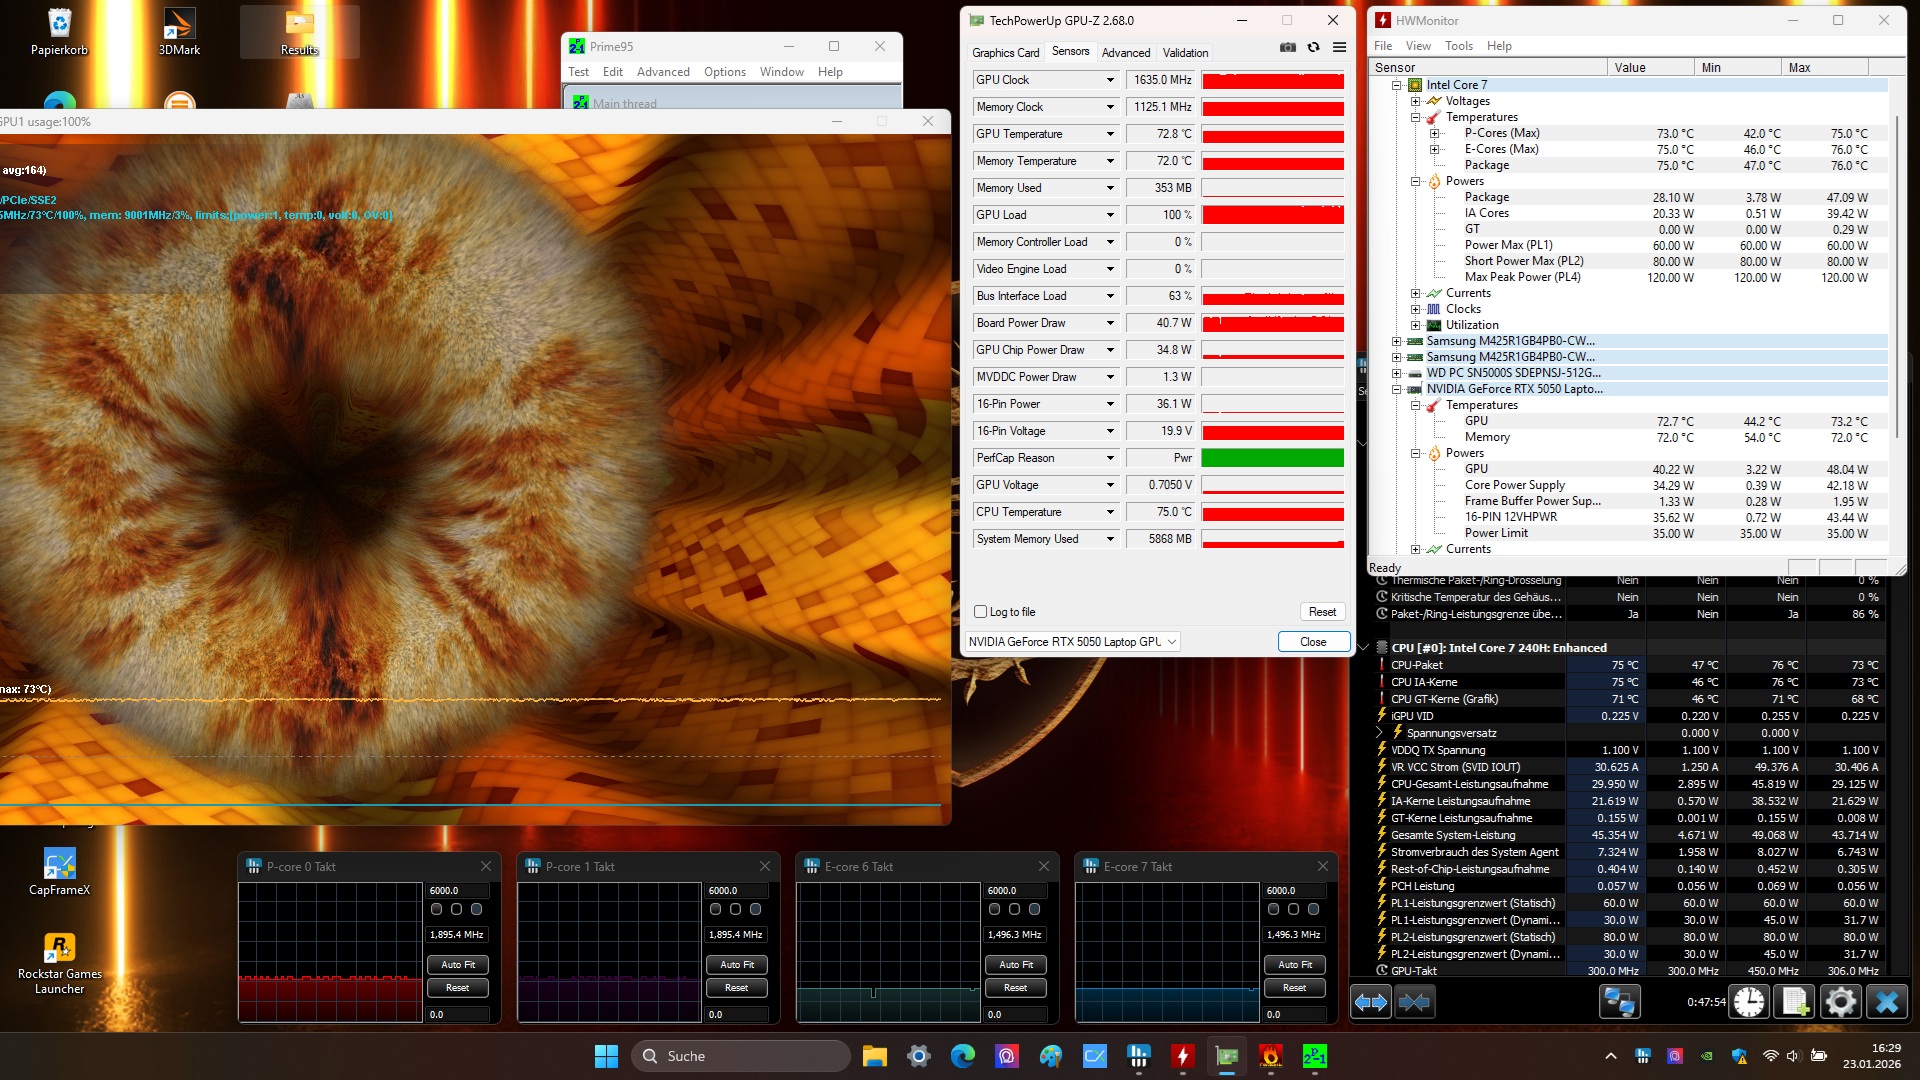
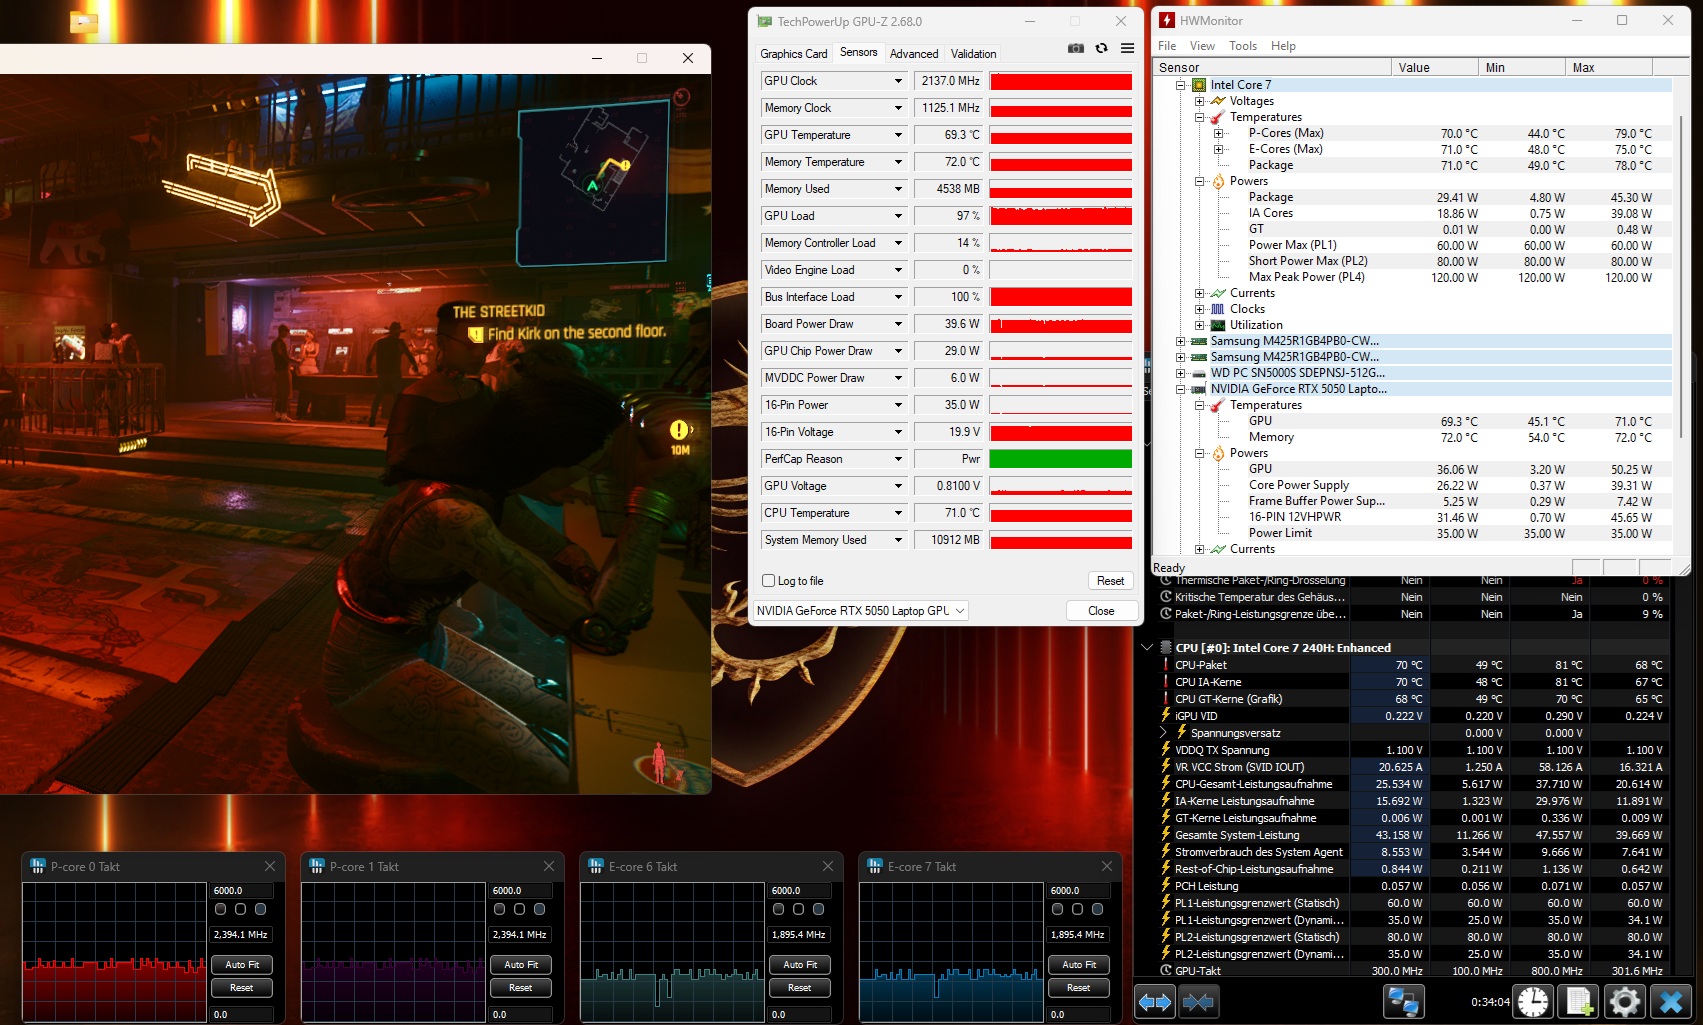
Teste de estresse
No teste de estresse com as ferramentas FurMark e Prime95, o Core 7 240H e o GeForce RTX 5050 se estabilizaram em moderados 73 °C (163,4 °F).
Alto-falante
Os alto-falantes são um pouco melhores do que a média dos jogos, embora o Cyborg 15 também sofra com um baixo bastante fraco.
MSI Cyborg 15 B2RWEKG análise de áudio
(+) | os alto-falantes podem tocar relativamente alto (###valor### dB)
Graves 100 - 315Hz
(-) | quase nenhum baixo - em média 23.6% menor que a mediana
(±) | a linearidade dos graves é média (12.5% delta para a frequência anterior)
Médios 400 - 2.000 Hz
(+) | médios equilibrados - apenas 2.9% longe da mediana
(+) | médios são lineares (5.3% delta para frequência anterior)
Altos 2 - 16 kHz
(+) | agudos equilibrados - apenas 3.8% longe da mediana
(+) | os máximos são lineares (5.1% delta da frequência anterior)
Geral 100 - 16.000 Hz
(+) | o som geral é linear (14.1% diferença em relação à mediana)
Comparado com a mesma classe
» 24% de todos os dispositivos testados nesta classe foram melhores, 8% semelhantes, 68% piores
» O melhor teve um delta de 6%, a média foi 18%, o pior foi 132%
Comparado com todos os dispositivos testados
» 17% de todos os dispositivos testados foram melhores, 4% semelhantes, 79% piores
» O melhor teve um delta de 4%, a média foi 23%, o pior foi 134%
Acer Nitro V 15 ANV15-52-50S2 análise de áudio
(+) | os alto-falantes podem tocar relativamente alto (###valor### dB)
Graves 100 - 315Hz
(-) | quase nenhum baixo - em média 27.5% menor que a mediana
(-) | graves não são lineares (15% delta para frequência anterior)
Médios 400 - 2.000 Hz
(+) | médios equilibrados - apenas 4.7% longe da mediana
(+) | médios são lineares (4.4% delta para frequência anterior)
Altos 2 - 16 kHz
(+) | agudos equilibrados - apenas 2% longe da mediana
(+) | os máximos são lineares (4.5% delta da frequência anterior)
Geral 100 - 16.000 Hz
(±) | a linearidade do som geral é média (17.9% diferença em relação à mediana)
Comparado com a mesma classe
» 55% de todos os dispositivos testados nesta classe foram melhores, 9% semelhantes, 36% piores
» O melhor teve um delta de 6%, a média foi 18%, o pior foi 132%
Comparado com todos os dispositivos testados
» 37% de todos os dispositivos testados foram melhores, 8% semelhantes, 55% piores
» O melhor teve um delta de 4%, a média foi 23%, o pior foi 134%
Gerenciamento de energia
Consumo de energia
Embora o consumo ocioso não esteja fora dos padrões, o laptop de 15 polegadas é relativamente econômico sob carga em comparação com outros laptops RTX 5050.
| desligado | |
| Ocioso | |
| Carga |
|
Key:
min: | |
| MSI Cyborg 15 B2RWEKG Core 7 240H, GeForce RTX 5050 Laptop | MSI Cyborg 15 A12VF i7-12650H, GeForce RTX 4060 Laptop GPU | Acer Nitro V 15 ANV15-52-50S2 i5-13420H, GeForce RTX 5050 Laptop | HP Victus 15-fa2160ng i5-13420H, GeForce RTX 5050 Laptop | Lenovo LOQ 15AHP10 R7 250, GeForce RTX 5060 Laptop | Lenovo Legion 5 15AHP G10 R7 260, GeForce RTX 5060 Laptop | Média da turma Gaming | |
|---|---|---|---|---|---|---|---|
| Power Consumption | 29% | -6% | -3% | -35% | -18% | -39% | |
| Idle Minimum * (Watt) | 14.9 | 6 60% | 16.8 -13% | 7.9 47% | 20 -34% | 6.9 54% | 13.1 ? 12% |
| Idle Average * (Watt) | 16.3 | 8.8 46% | 17.6 -8% | 9.2 44% | 20.7 -27% | 10.7 34% | 19 ? -17% |
| Idle Maximum * (Watt) | 22.2 | 11.9 46% | 19.8 11% | 13.5 39% | 22.7 -2% | 11.3 49% | 24.6 ? -11% |
| Load Average * (Watt) | 72 | 89 -24% | 66 8% | 78 -8% | 71 1% | 69.7 3% | 111.3 ? -55% |
| Cyberpunk 2077 ultra * (Watt) | 90.3 | 106.5 -18% | 128.4 -42% | 153.1 -70% | 162.6 -80% | ||
| Cyberpunk 2077 ultra external monitor * (Watt) | 89.6 | 105 -17% | 126.7 -41% | 151.1 -69% | 165 -84% | ||
| Load Maximum * (Watt) | 117 | 99 15% | 119 -2% | 187 -60% | 172 -47% | 233.6 -100% | 260 ? -122% |
| Witcher 3 ultra * (Watt) | 90.3 |
* ... menor é melhor
Consumo de energia Cyberpunk / Teste de estresse
Consumo de energia com monitor externo
Duração da bateria
Infelizmente, a duração da bateria tem que ficar atrás do predecessor. Pouco menos de 5,5 horas em nosso teste Wi-Fi com o brilho reduzido para 150 cd/m² ainda é aceitável quando comparamos o HP Victus 15 e o Lenovo LOQ 15.
| MSI Cyborg 15 B2RWEKG Core 7 240H, GeForce RTX 5050 Laptop, 55.2 Wh | MSI Cyborg 15 A12VF i7-12650H, GeForce RTX 4060 Laptop GPU, 53.5 Wh | Acer Nitro V 15 ANV15-52-50S2 i5-13420H, GeForce RTX 5050 Laptop, 76 Wh | HP Victus 15-fa2160ng i5-13420H, GeForce RTX 5050 Laptop, 70 Wh | Lenovo LOQ 15AHP10 R7 250, GeForce RTX 5060 Laptop, 60 Wh | Lenovo Legion 5 15AHP G10 R7 260, GeForce RTX 5060 Laptop, 80 Wh | Média da turma Gaming | |
|---|---|---|---|---|---|---|---|
| Duração da bateria | 39% | 2% | -20% | -17% | 80% | 31% | |
| WiFi v1.3 (h) | 5.4 | 7.5 39% | 5.5 2% | 4.3 -20% | 4.5 -17% | 9.7 80% | 7.08 ? 31% |
| Reader / Idle (h) | 13.6 | 6.9 | 7.84 ? | ||||
| H.264 (h) | 8 | 11.5 | 8.27 ? | ||||
| Load (h) | 2.3 | 1.3 | 1.2 | 1.496 ? | |||
| Cyberpunk 2077 ultra 150cd (h) | 0.9 |
Avaliação geral do Notebookcheck
O MSI Cyborg 15 é um gamer de 15 polegadas visualmente impressionante que oferece um desempenho sólido a um preço acessível, mas é um pouco fraco nas áreas de tela (espaço de cores) e potência da GPU (TGP escasso).
MSI Cyborg 15 B2RWEKG
- 01/28/2026 v8
Florian Glaser
 Total Sustainability Score:
 Possíveis alternativas em comparação
Imagem | Modelo / Análises | Preço | Peso | Altura | Tela |
|---|---|---|---|---|---|
1. 75.2%  | MSI Cyborg 15 B2RWEKG Intel Core 7 240H ⎘ NVIDIA GeForce RTX 5050 Laptop ⎘ 16 GB Memória, 512 GB SSD | Amazon: Preço de tabela: 1099 EUR | 2.2 kg | 23.2 mm | 15.60" 1920x1080 141 PPI IPS |
2. 82.4% v7 (old)  | MSI Cyborg 15 A12VF Intel Core i7-12650H ⎘ NVIDIA GeForce RTX 4060 Laptop GPU ⎘ 16 GB Memória, 1024 GB SSD | Amazon: 1. $899.99 msi CYBORG1512043 Cyborg 15 ... 2. $999.00 msi Cyborg 15 Gaming Laptop:... 3. $1,269.00 MSI Cyborg 15 Gaming AI Lapt... Preço de tabela: 1799 Euro | 2 kg | 22.9 mm | 15.60" 1920x1080 141 PPI IPS |
3. 73.7%  | Acer Nitro V 15 ANV15-52-50S2 Intel Core i5-13420H ⎘ NVIDIA GeForce RTX 5050 Laptop ⎘ 16 GB Memória, 1024 GB SSD | Amazon: Preço de tabela: 1049 EUR | 2.1 kg | 23.5 mm | 15.60" 1920x1080 141 PPI IPS |
4. 75.8%  | HP Victus 15-fa2160ng Intel Core i5-13420H ⎘ NVIDIA GeForce RTX 5050 Laptop ⎘ 24 GB Memória, 512 GB SSD | Amazon: Preço de tabela: 1000 EUR | 2.4 kg | 23.5 mm | 15.60" 1920x1080 141 PPI IPS |
5. 77.5%  | Lenovo LOQ 15AHP10 AMD Ryzen 7 250 ⎘ NVIDIA GeForce RTX 5060 Laptop ⎘ 16 GB Memória, 1024 GB SSD | Amazon: | 2.4 kg | 24 mm | 15.60" 1920x1080 141 PPI IPS |
6. 87.2%  | Lenovo Legion 5 15AHP G10 AMD Ryzen 7 260 ⎘ NVIDIA GeForce RTX 5060 Laptop ⎘ 32 GB Memória, 1024 GB SSD | Amazon: Preço de tabela: 1449€ | 1.9 kg | 21.5 mm | 15.10" 2560x1600 200 PPI OLED |
Transparência
A seleção dos dispositivos a serem analisados é feita pela nossa equipe editorial. A amostra de teste foi fornecida ao autor como empréstimo pelo fabricante ou varejista para fins desta revisão. O credor não teve influência nesta revisão, nem o fabricante recebeu uma cópia desta revisão antes da publicação. Não houve obrigação de publicar esta revisão. Como empresa de mídia independente, a Notebookcheck não está sujeita à autoridade de fabricantes, varejistas ou editores.
É assim que o Notebookcheck está testando
Todos os anos, o Notebookcheck analisa de forma independente centenas de laptops e smartphones usando procedimentos padronizados para garantir que todos os resultados sejam comparáveis. Desenvolvemos continuamente nossos métodos de teste há cerca de 20 anos e definimos padrões da indústria no processo. Em nossos laboratórios de teste, equipamentos de medição de alta qualidade são utilizados por técnicos e editores experientes. Esses testes envolvem um processo de validação em vários estágios. Nosso complexo sistema de classificação é baseado em centenas de medições e benchmarks bem fundamentados, o que mantém a objetividade.