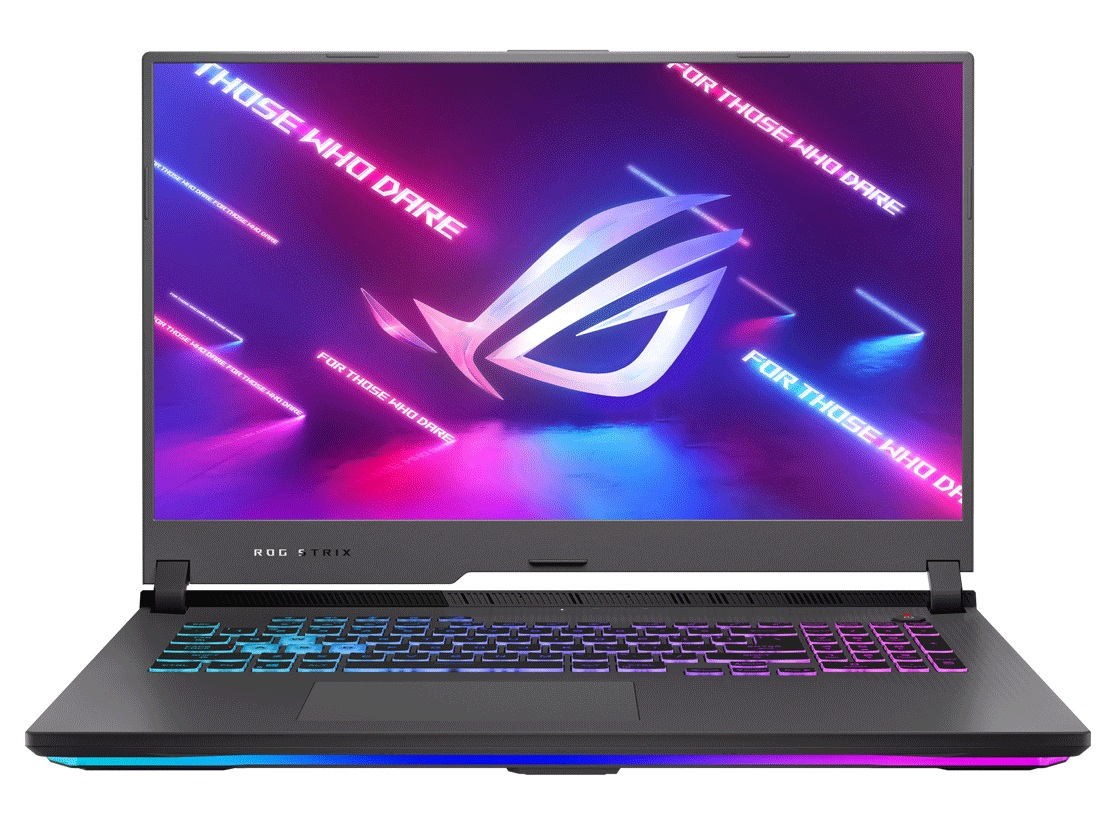
Asus ROG Strix G17 G713QE revisão de laptop: GeForce RTX 3050 Ti arrasta para baixo um grande sistema

A série ROG Strix G17 G713 é bem sucedida no ano passado Série G712 ao eliminar a Intel para a AMD e atualizar a maioria das SKUs para GeForce Ampere graphics. As opções configuráveis são extensas com nada menos que 16 (!) SKUs individuais todos detalhados aqui na página oficial do produto Asus. As opções são posteriormente massivas, variando do Zen 2 Ryzen 7 4800H até o CPU Zen 3 Ryzen 9 5900HX e 65 W GeForce GTX 1650 gráficos até o 130 W GeForce RTX 3070. As opções de visualização também variam amplamente da base 144 Hz do painel FHD até 165 Hz QHD ou 300 Hz FHD com cores mais cheias. Mesmo as capacidades da bateria, espessuras e adaptadores AC são diferentes, dependendo dos gráficos.
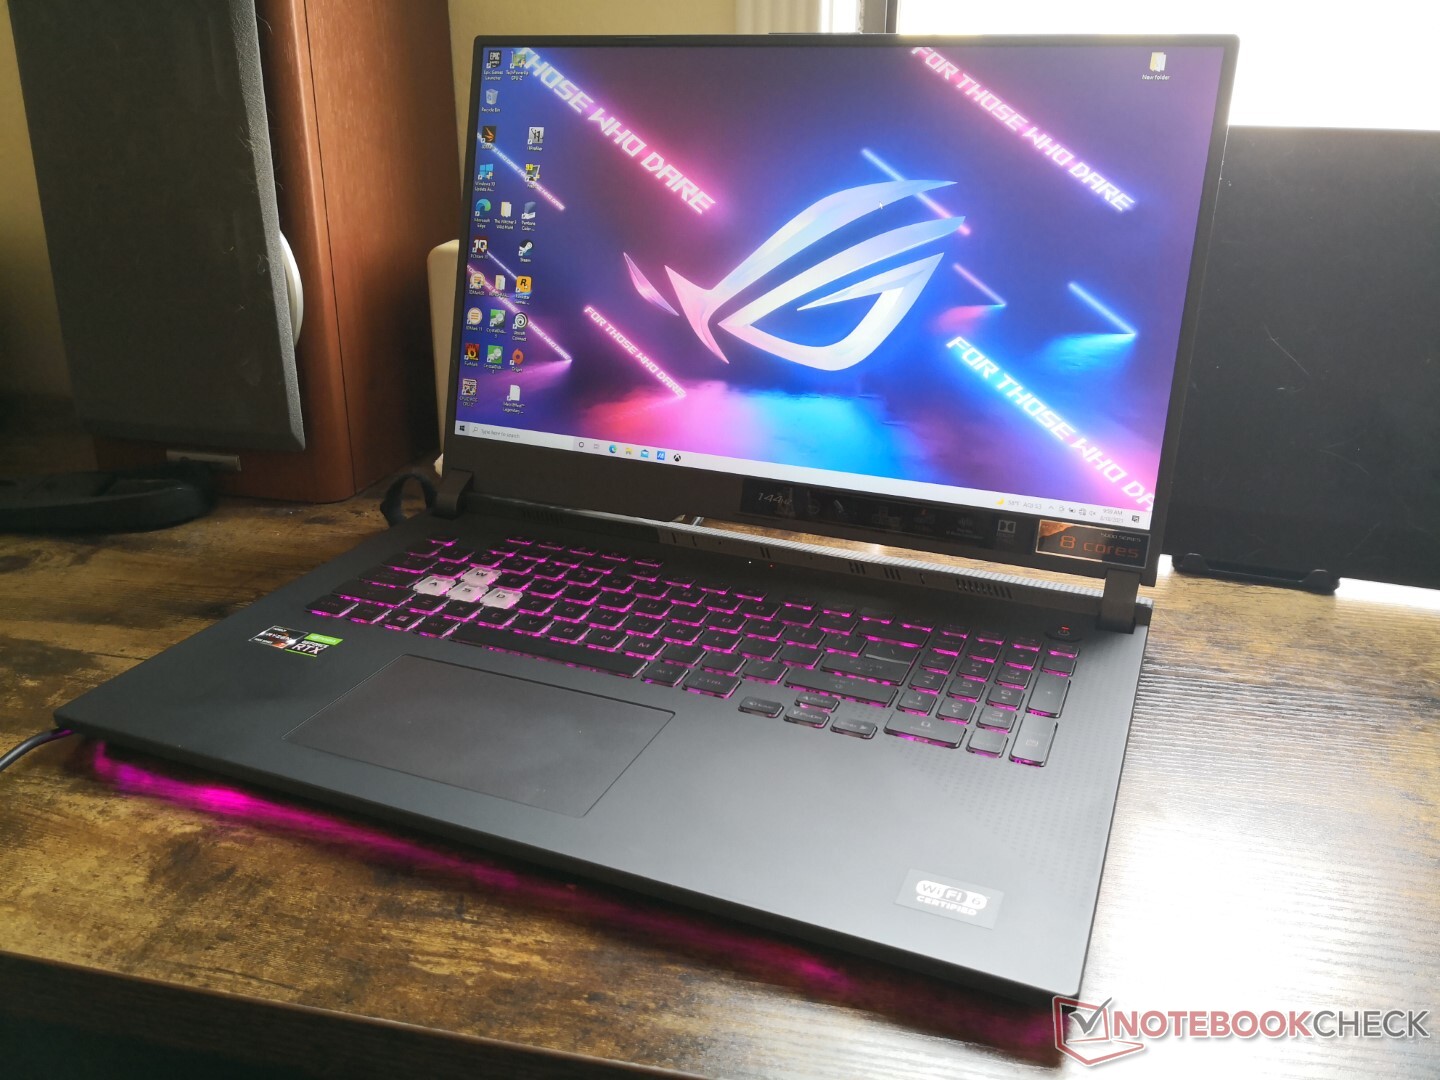
Nossa unidade de teste hoje é SKU de médio alcance equipada com a CPU Ryzen 7 5800H, GPU RTX 3050 Ti de 95 W, e display FHD de 144 Hz. Os concorrentes neste espaço incluem outros laptops para jogos de nível básico a médio alcance de 17,3 polegadas, como o MSI Katana GF76, Acer Nitro 5, Série G da Dellou Lenovo Legion 5.
Mais revisões do Asus:
potential competitors in comparison
Avaliação | Data | Modelo | Peso | Altura | Size | Resolução | Preço |
|---|---|---|---|---|---|---|---|
| 83.4 % v7 (old) | 08/2021 | Asus ROG Strix G17 G713QE-RB74 R7 5800H, GeForce RTX 3050 Ti Laptop GPU | 2.5 kg | 24.6 mm | 17.30" | 1920x1080 | |
| 81.1 % v7 (old) | 08/2021 | Acer Nitro 5 AN517-53-54DQ i5-11300H, GeForce RTX 3050 4GB Laptop GPU | 2.6 kg | 25 mm | 17.30" | 1920x1080 | |
| 80.4 % v7 (old) | 06/2021 | MSI Katana GF76 11UE i7-11800H, GeForce RTX 3060 Laptop GPU | 2.7 kg | 25.2 mm | 17.30" | 1920x1080 | |
| 86.6 % v7 (old) | 05/2021 | Asus Strix Scar 17 G733QSA-XS99 R9 5900HX, GeForce RTX 3080 Laptop GPU | 2.8 kg | 28.3 mm | 17.30" | 1920x1080 | |
| 83.3 % v7 (old) | 02/2021 | MSI Alpha 17 A4DEK R7 4800H, Radeon RX 5600M | 2.6 kg | 28 mm | 17.30" | 1920x1080 | |
| 83.1 % v7 (old) | 10/2020 | Asus Strix G17 G712LWS i7-10750H, GeForce RTX 2070 Super Mobile | 2.8 kg | 26.5 mm | 17.30" | 1920x1080 |
Caso - Familiar, mas diferente
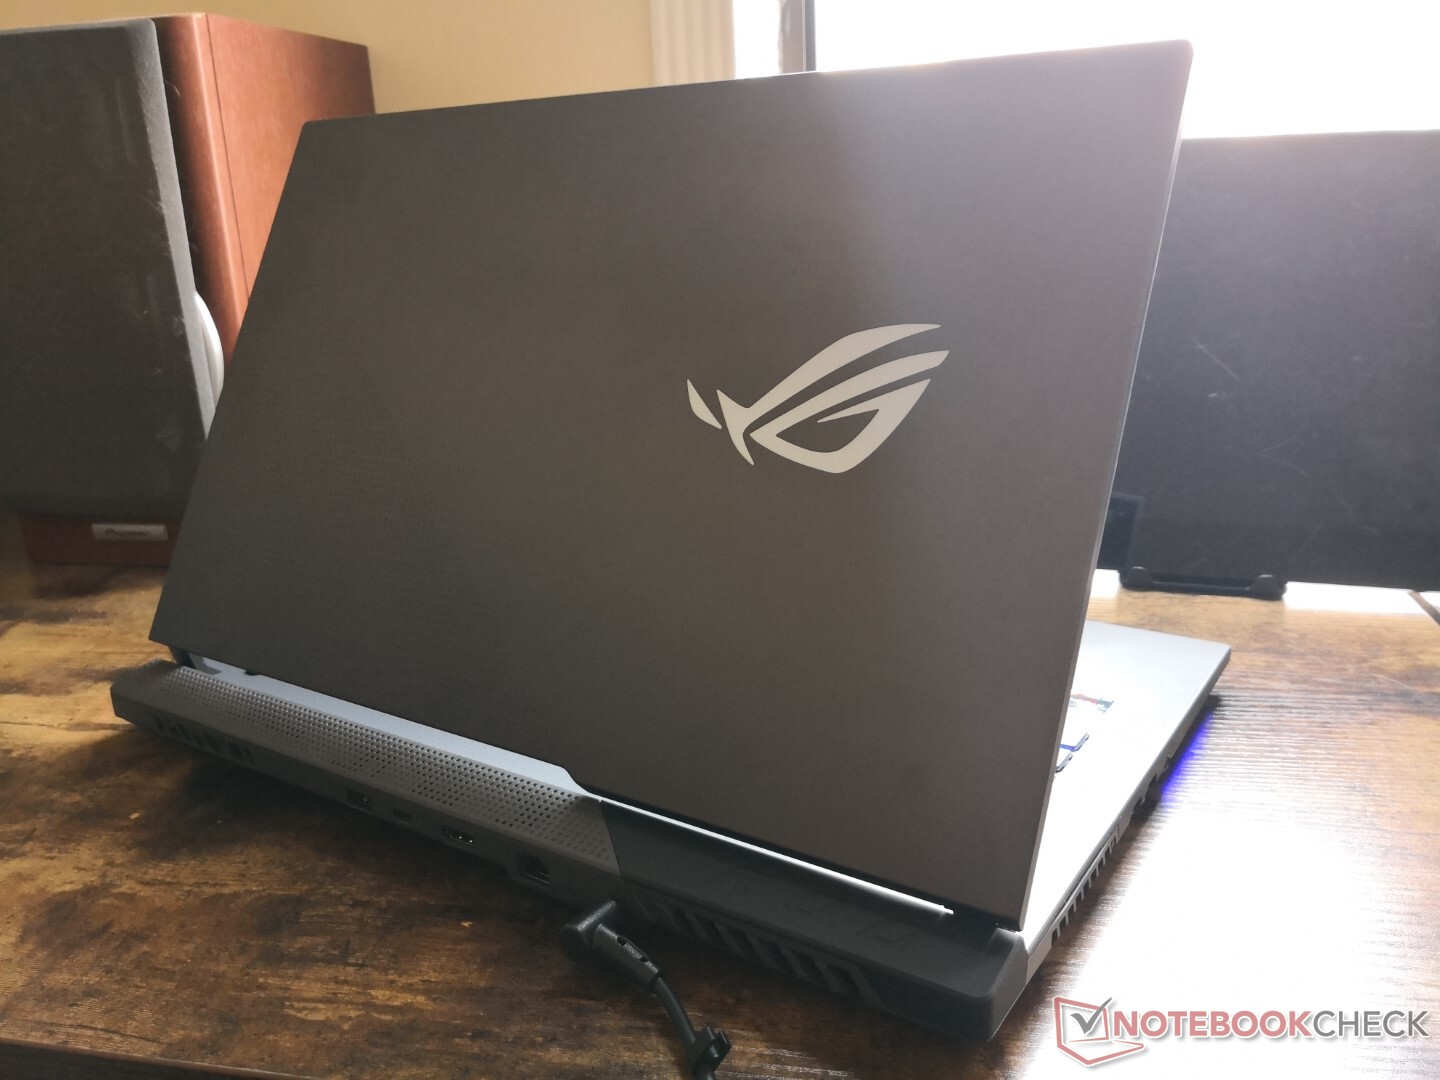
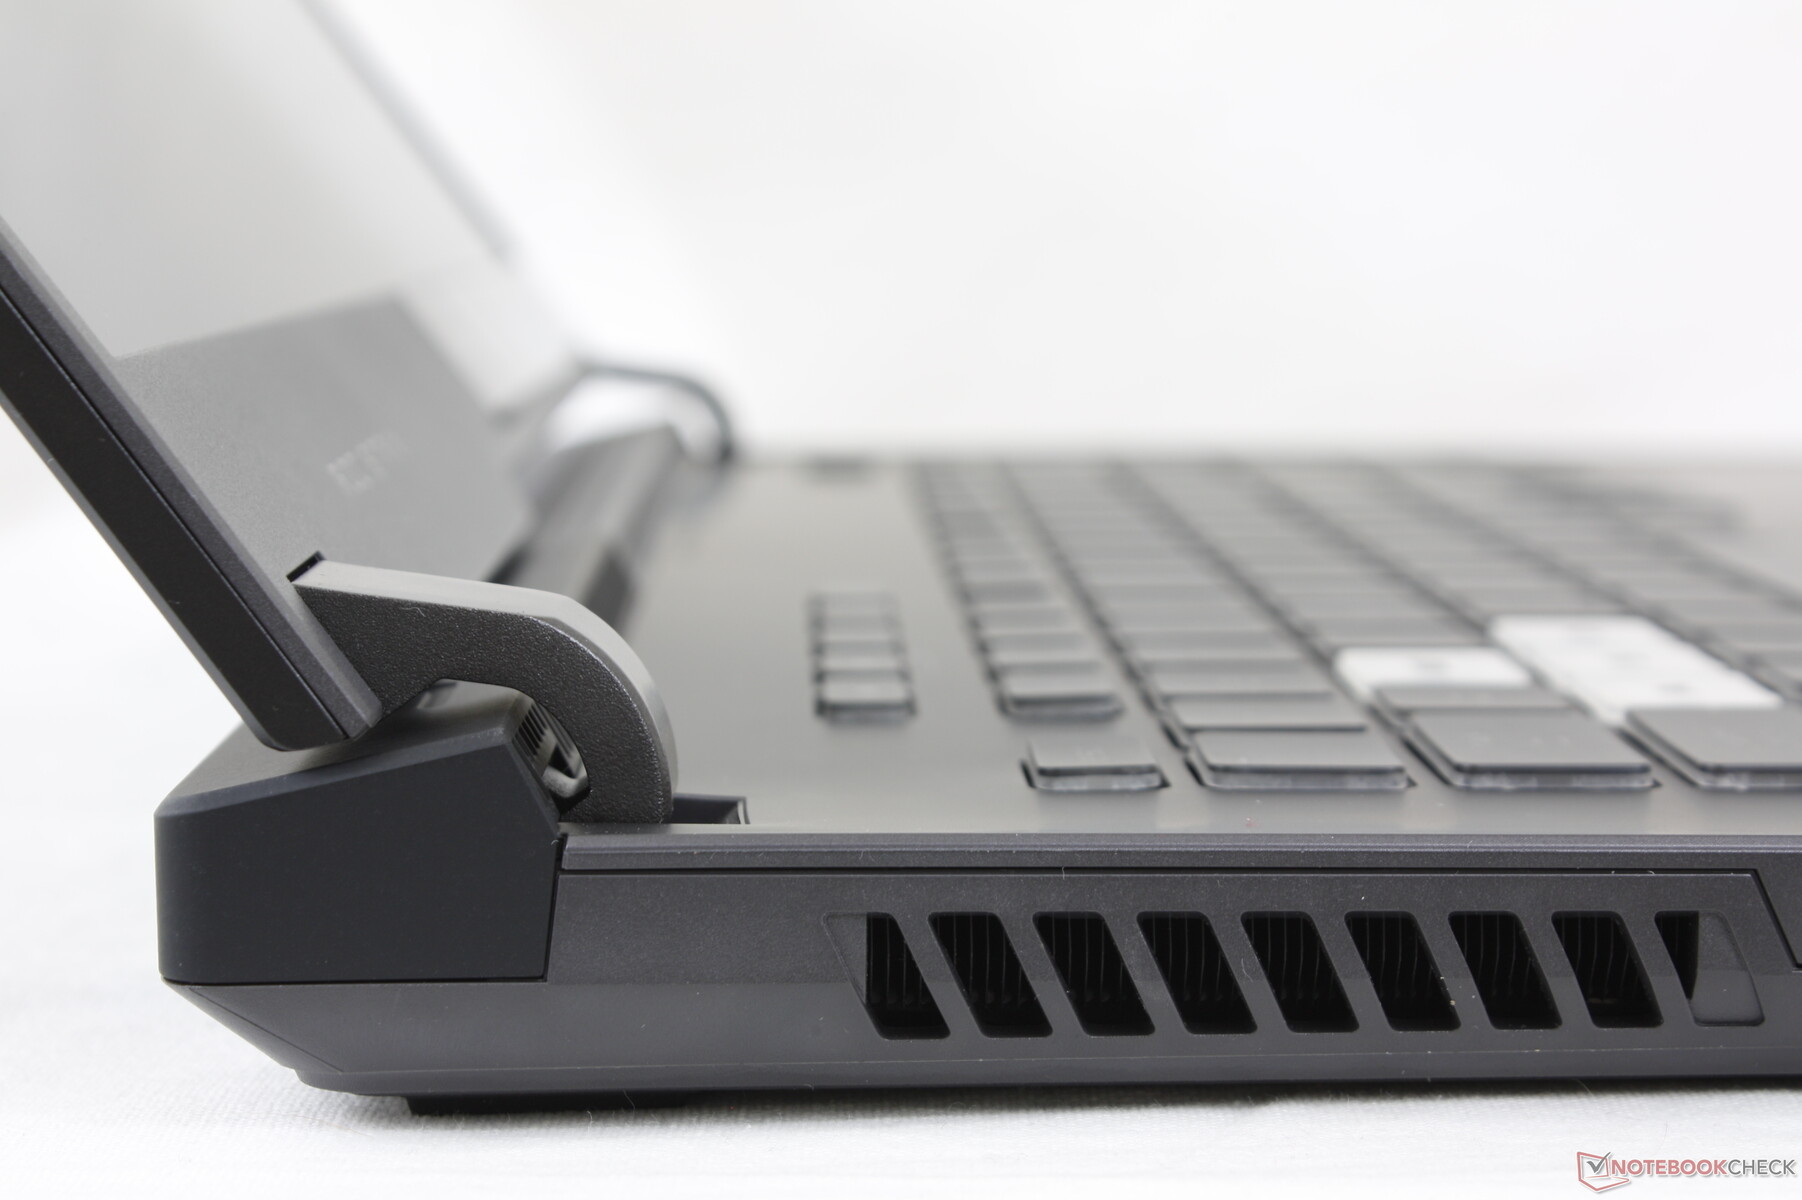
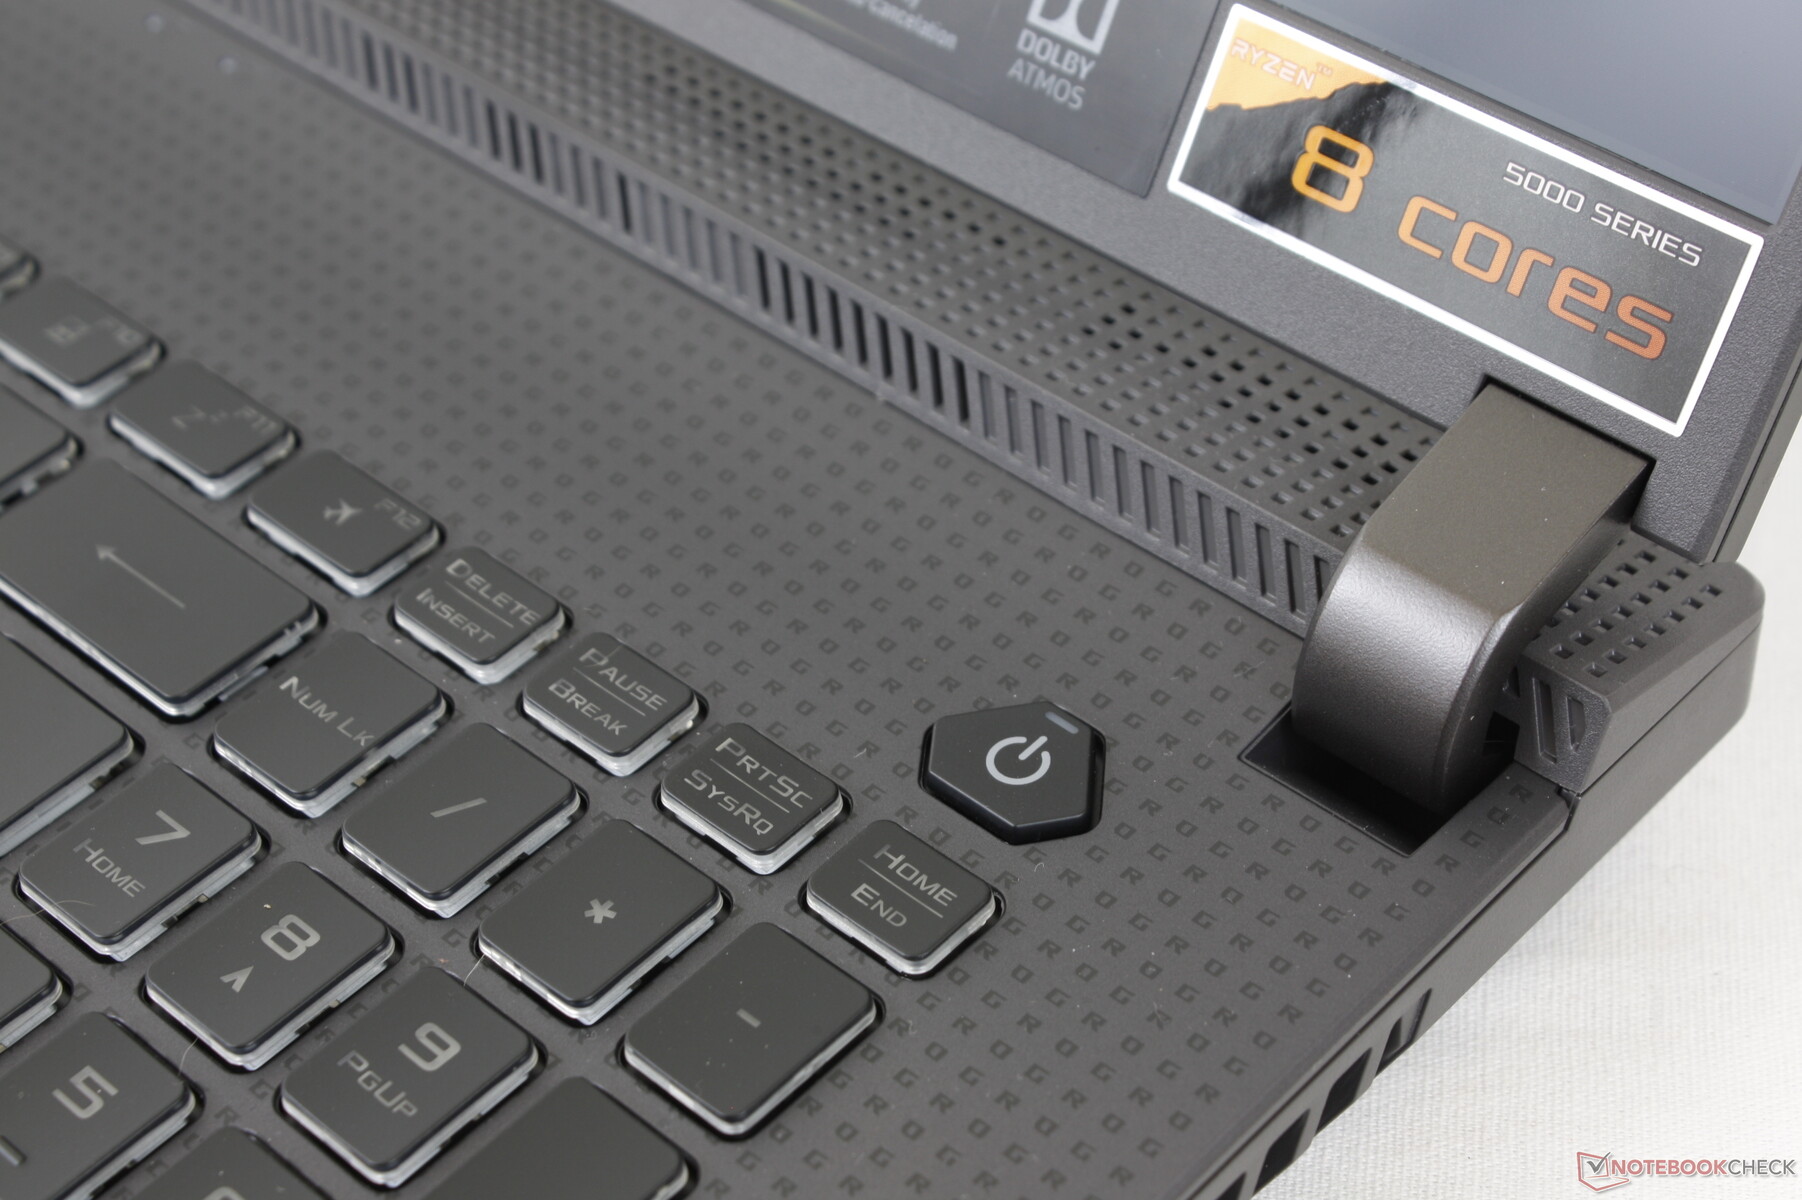
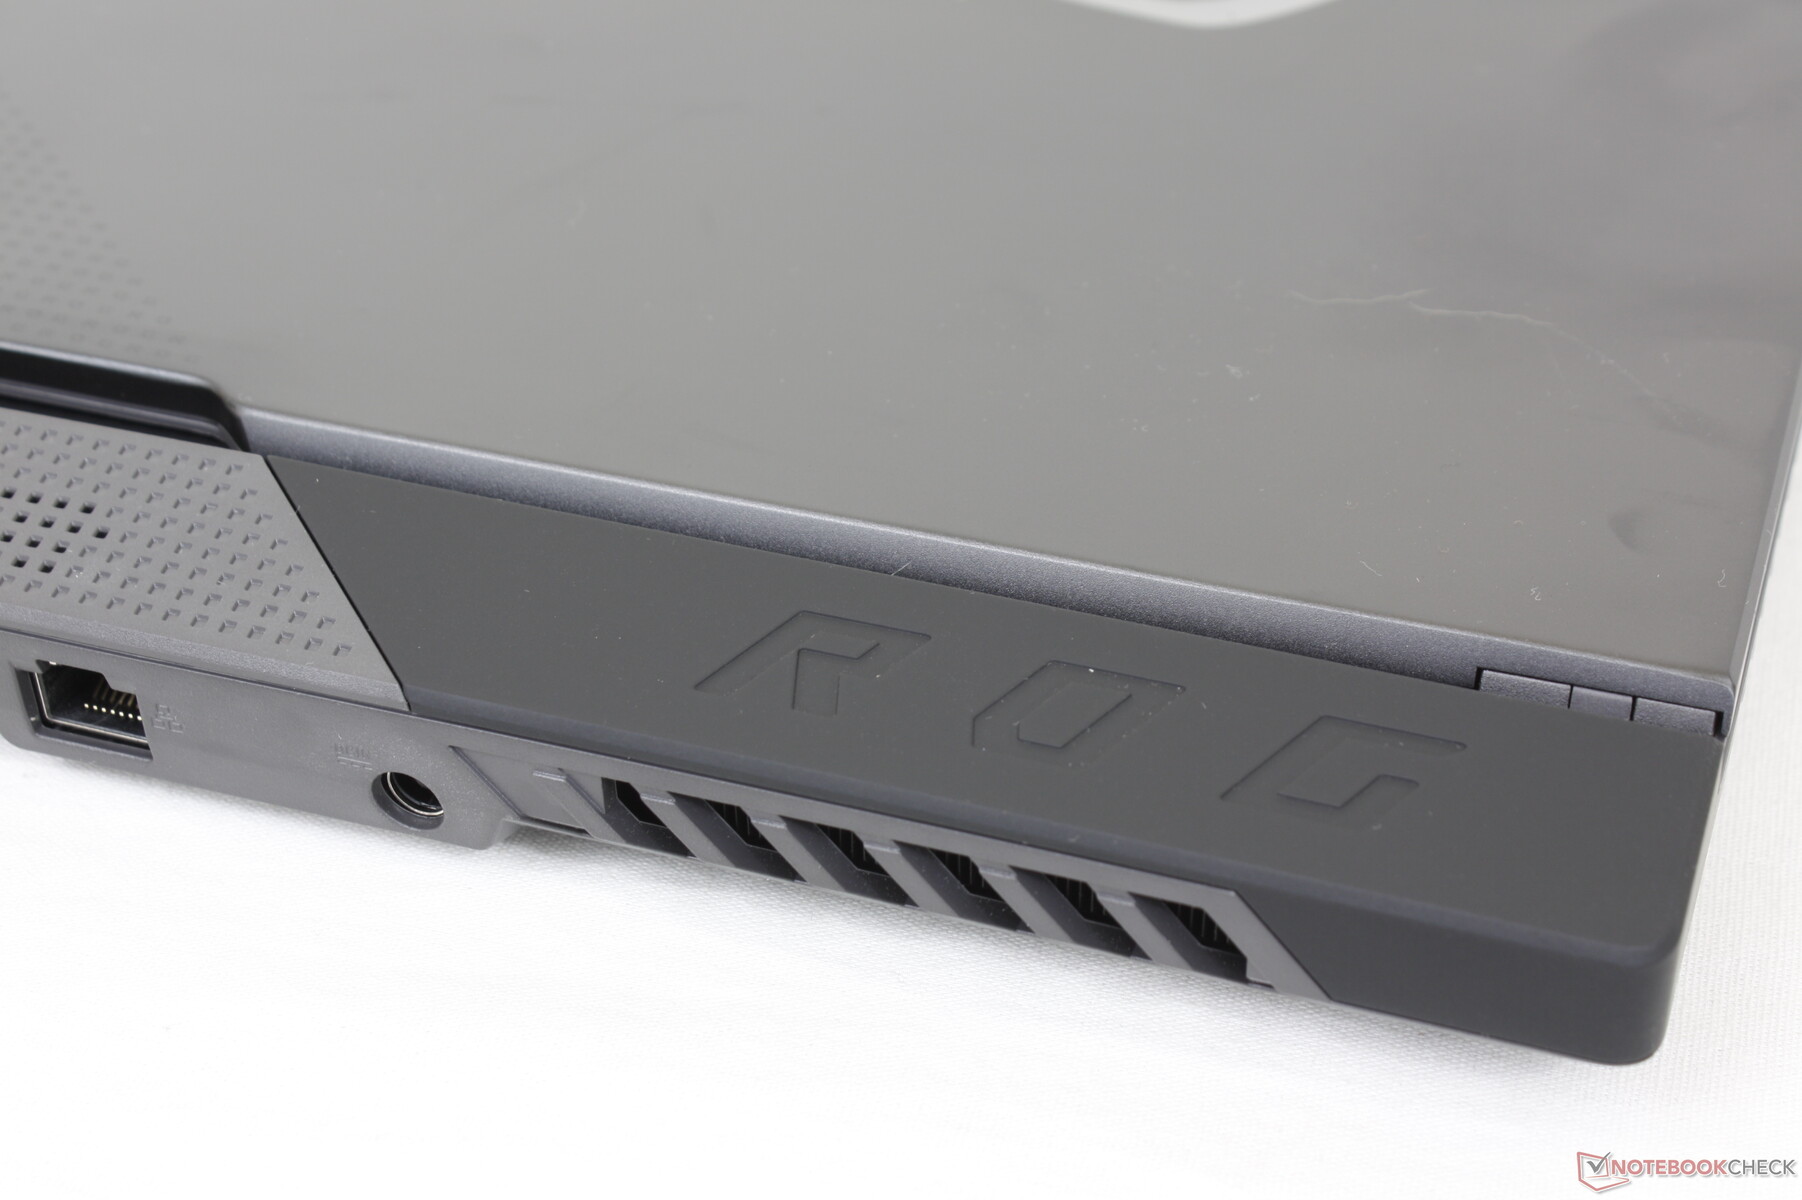
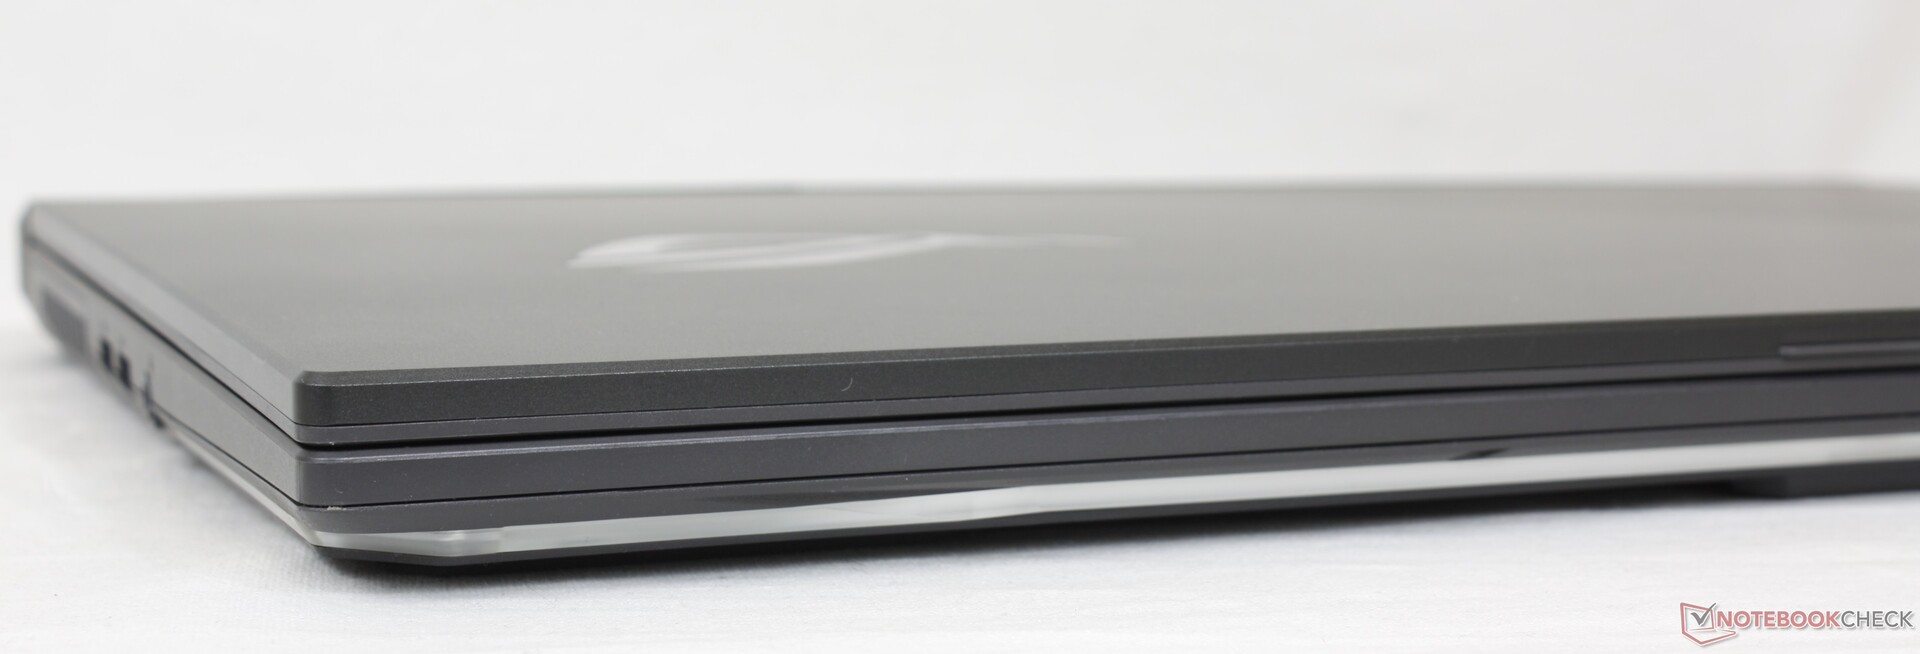
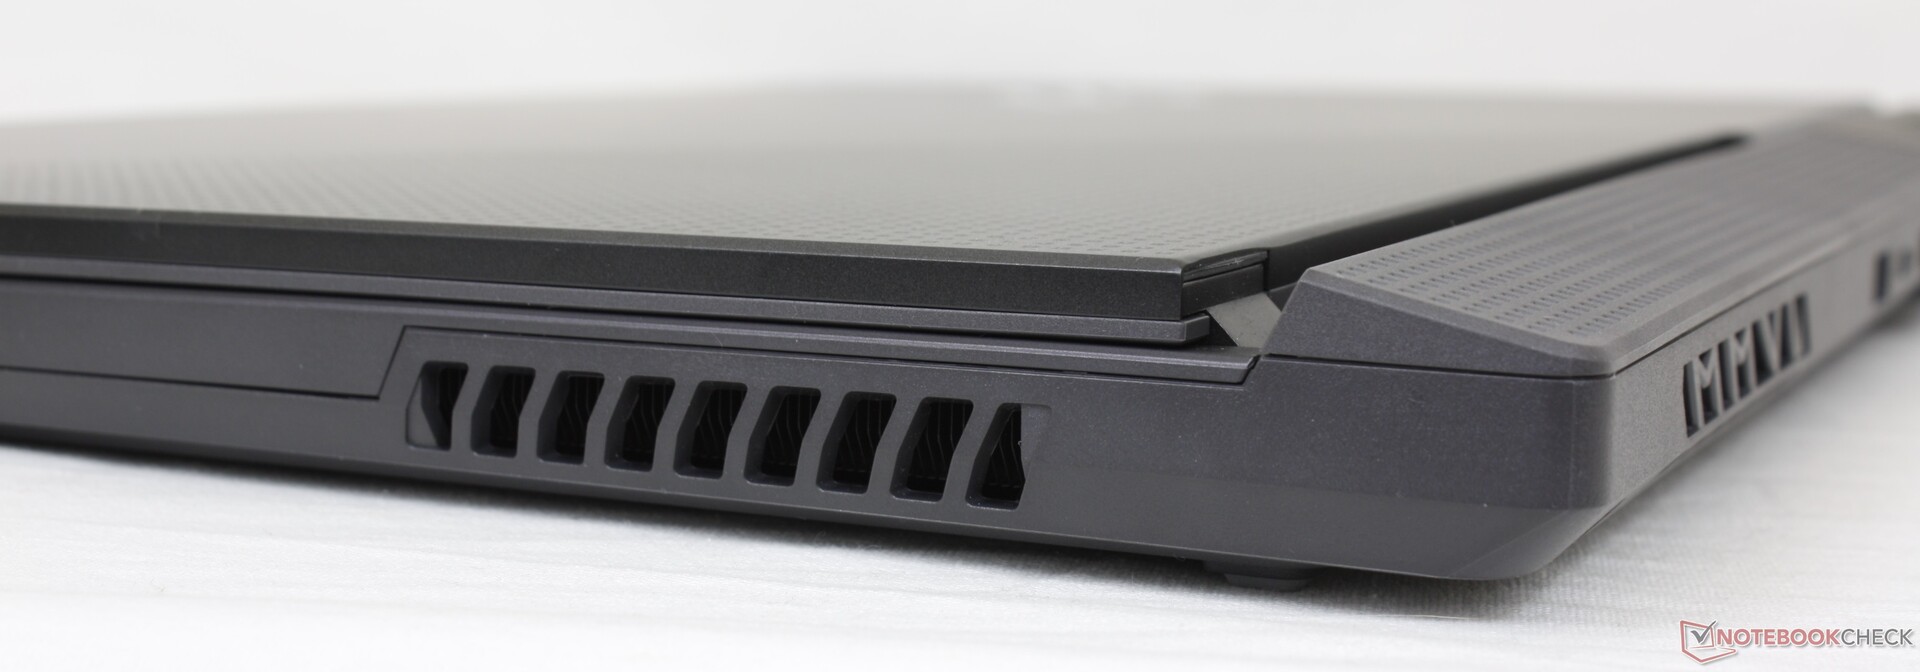
Pode ser difícil distinguir todos os diferentes modelos ROG Strix, pois eles compartilham o mesmo design visual. O "motor a jato" estendido traseiro, as grandes dobradiças visíveis, a espessa moldura do queixo, a plataforma do teclado ligeiramente emborrachada e a falta de uma webcam integrada são todos inalterados em relação às gerações anteriores. As principais diferenças se devem ao estilo, já que certas partes do chassi agora são mais planas e suaves para um visual mais elegante. A borda direita e a tampa externa, por exemplo, são embelezadas com um novo padrão ROG que não está presente nos modelos mais antigos.
A rigidez do chassi não melhorou em relação ao G712 do ano passado. No entanto, ela ainda é mais forte do que a série MSI GF ou GP, especialmente quando se trata das dobradiças.
Curiosamente, o G713 vem em duas versões que diferem tanto em peso quanto em dimensões, dependendo da configuração. Nossa unidade específica é a versão menor com espessura e peso de 2,46 cm e 2,5 kg, respectivamente, enquanto as configurações com o RTX 3060 ou mais rápido são mais espessas (2,83 cm) e mais pesadas (2,7+ kg). É um sistema robusto, independentemente de estar entre o Zephyrus S17 mais fino e o S17 mais grosso Lenovo Legion 5.
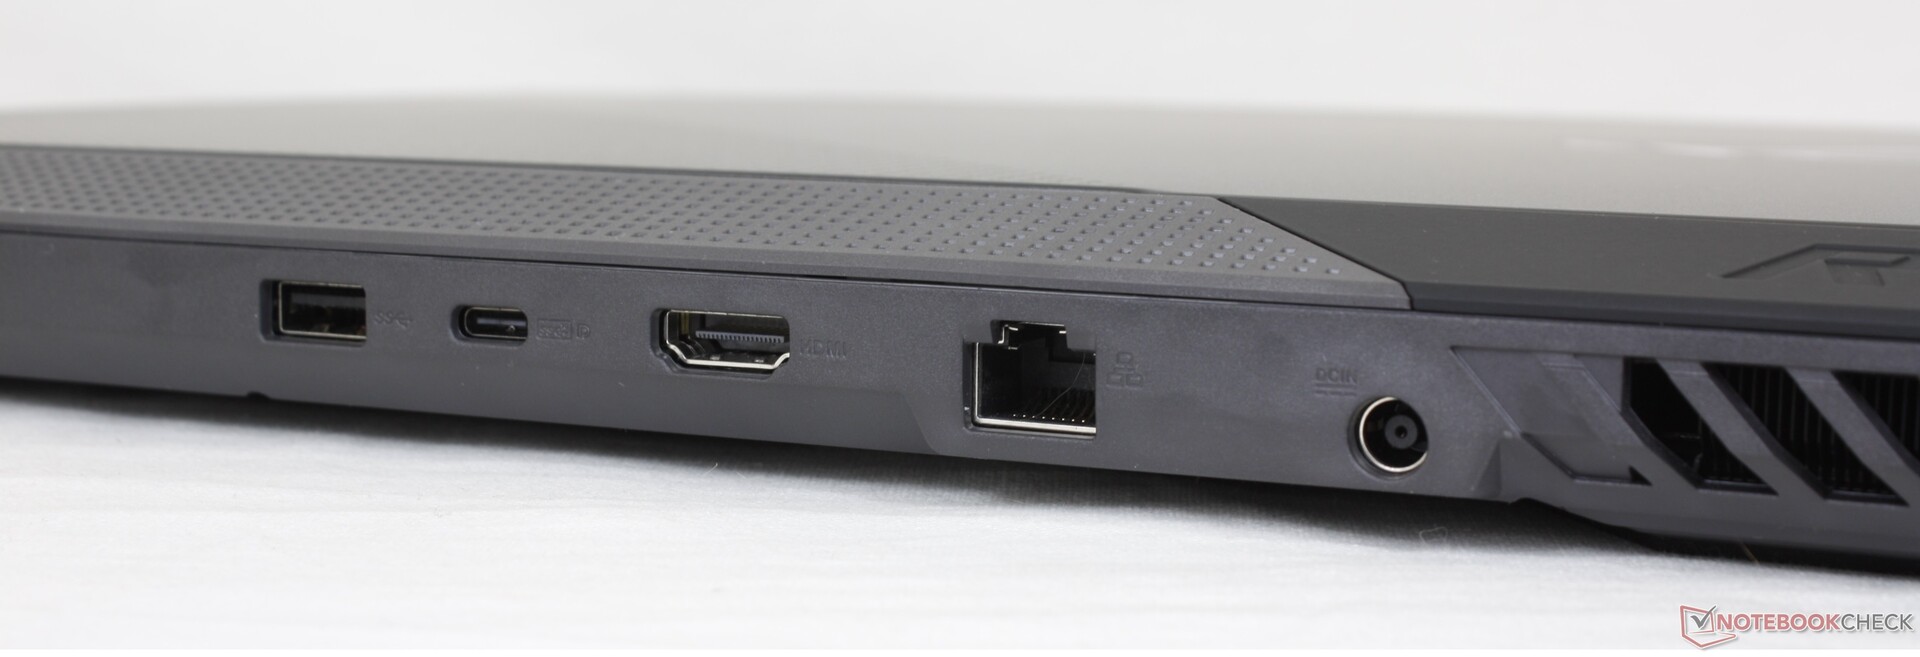
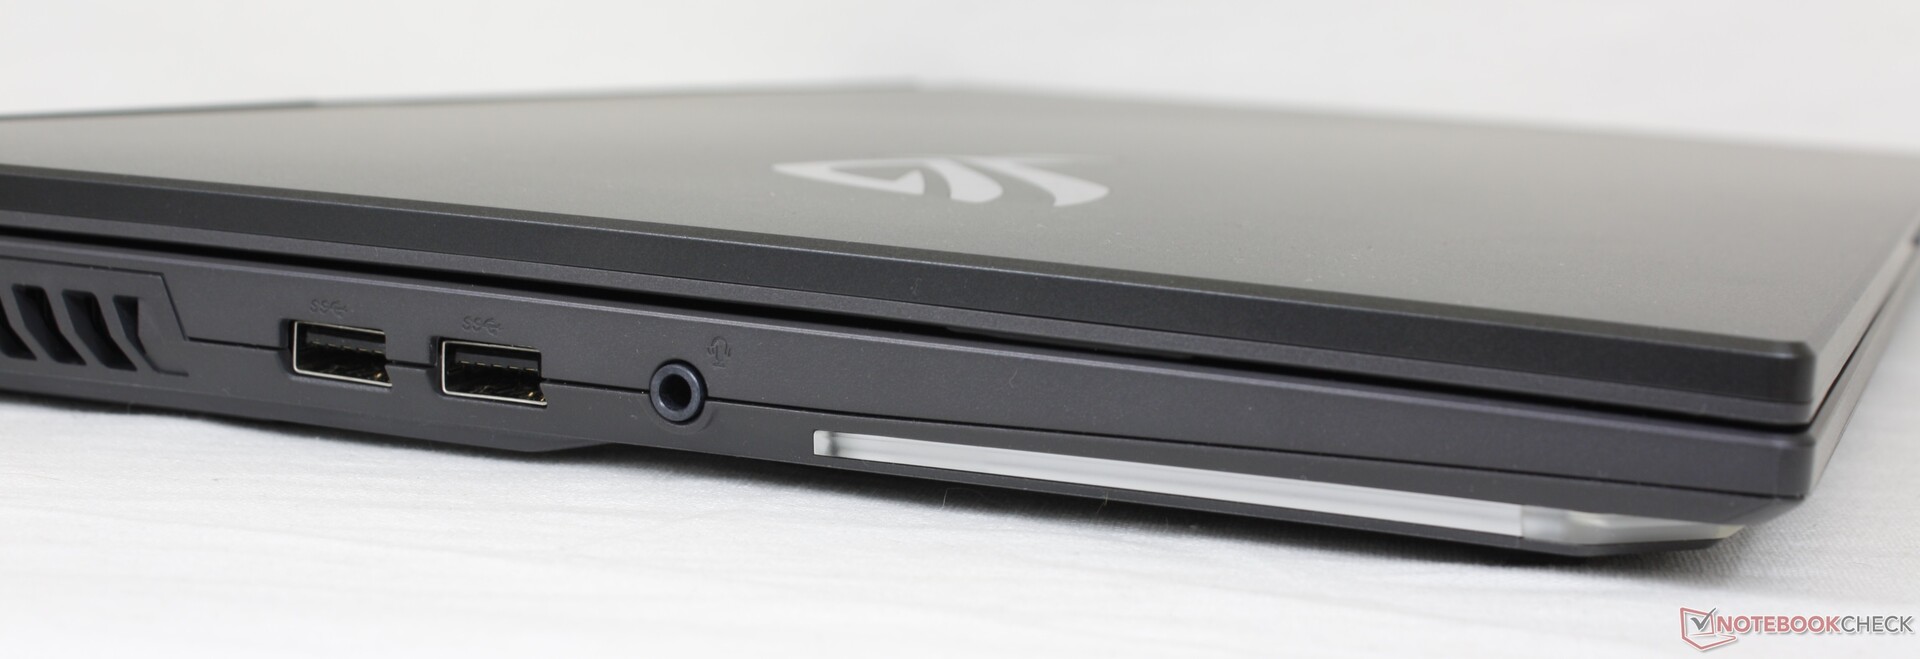
Conectividade - Sem relâmpago
Os portos são idênticos ao preço G733QS mas sem Asus Keystone, já que o fabricante gosta de reservar a característica apenas para seus modelos emblemáticos. O posicionamento das portas pode ser desfavorável para alguns usuários, pois não há portas ao longo da borda direita, enquanto as portas ao longo da traseira podem ser de difícil acesso.
Comunicação
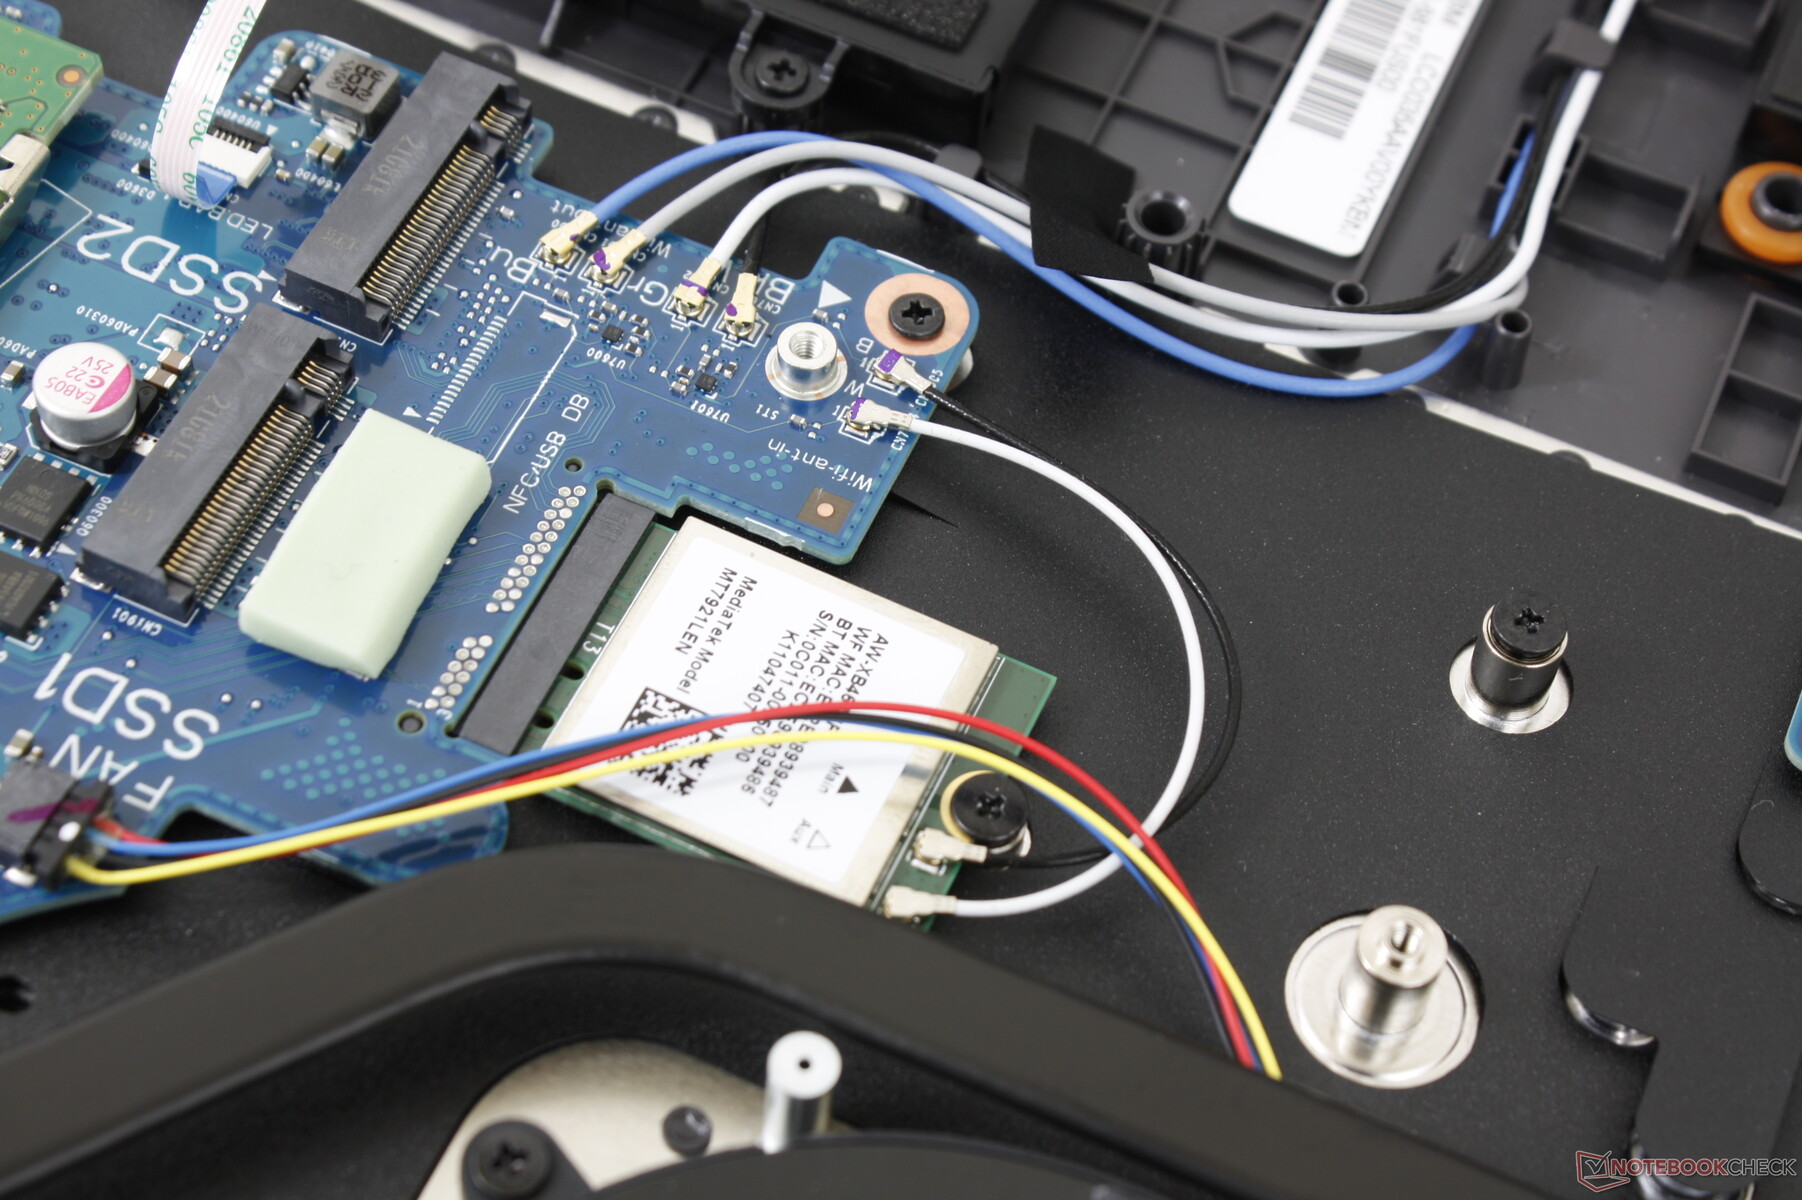
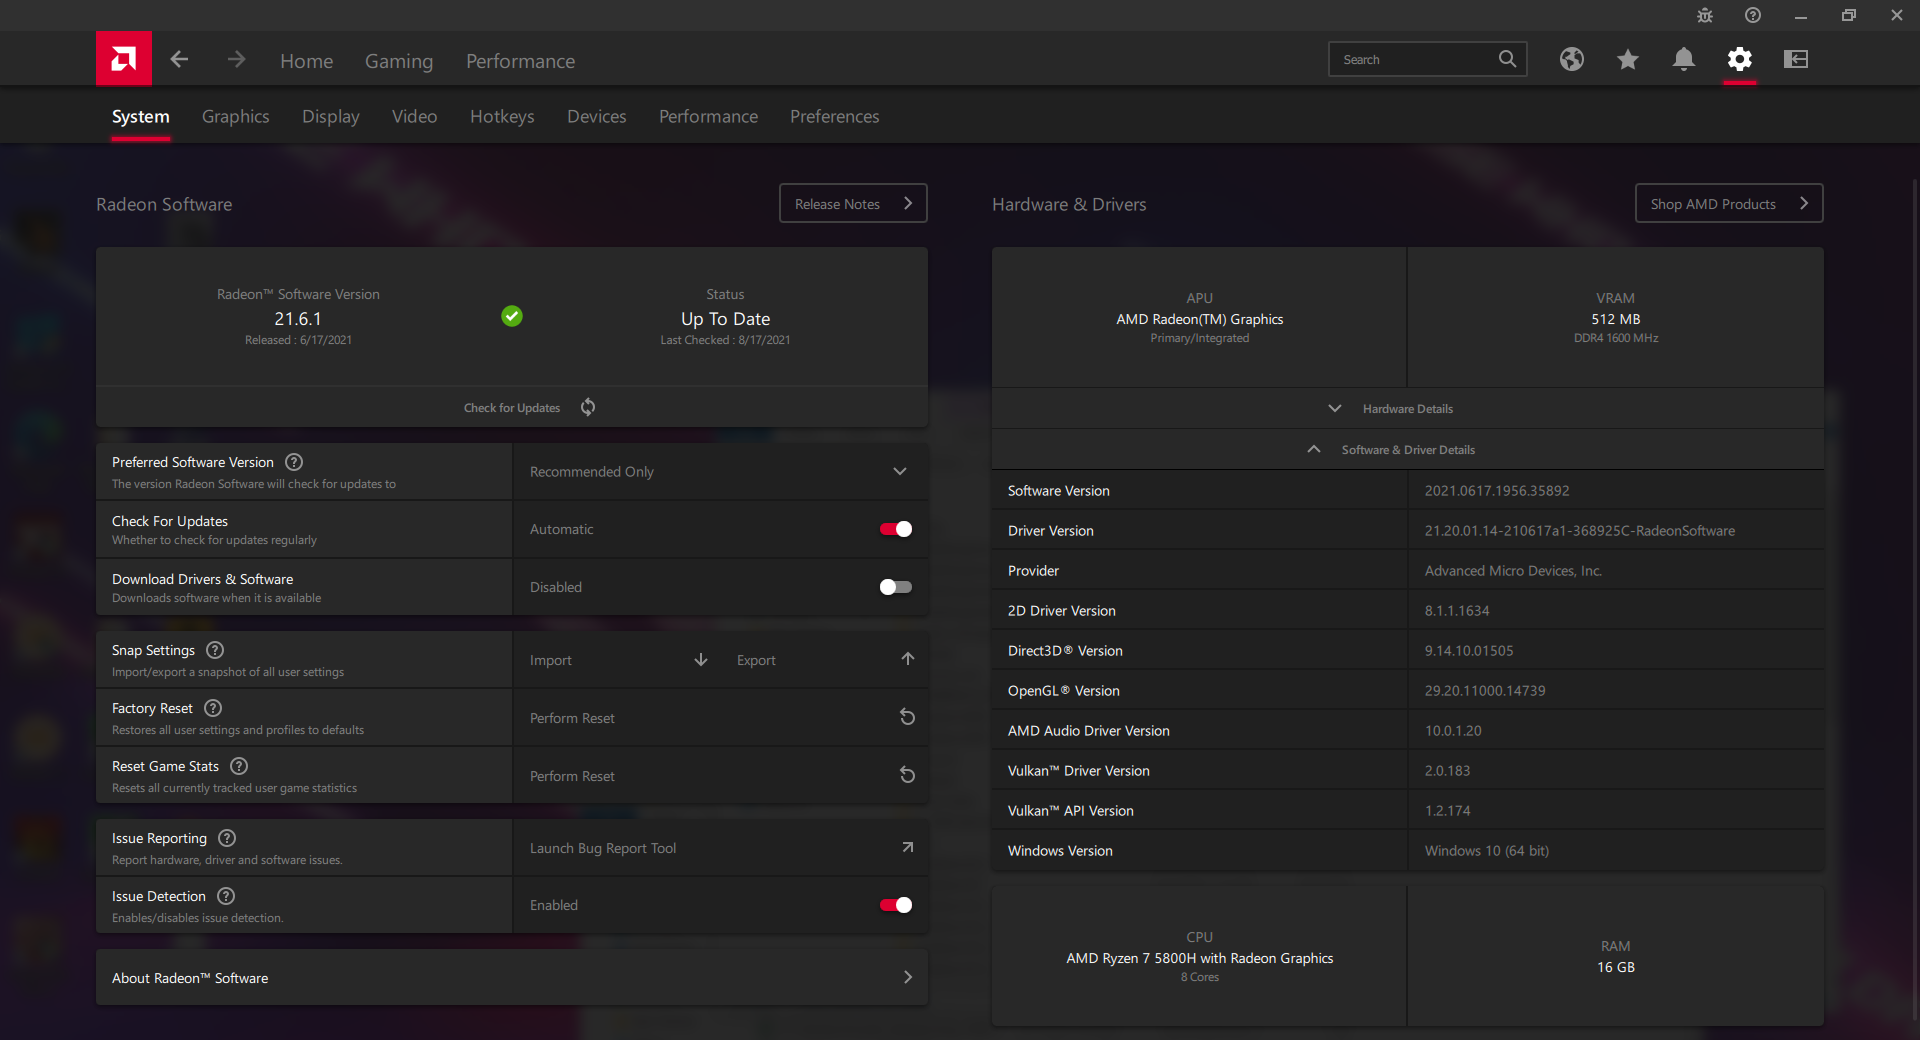
O MediaTek MT7921 habilitado para Wi-Fi 6 compete contra a série mais comum da Intel AX200/201. Embora confiável em termos de navegação e streaming de vídeo, seu desempenho não é tão rápido quanto a solução da Intel que atinge regularmente acima de 1 Gbps.
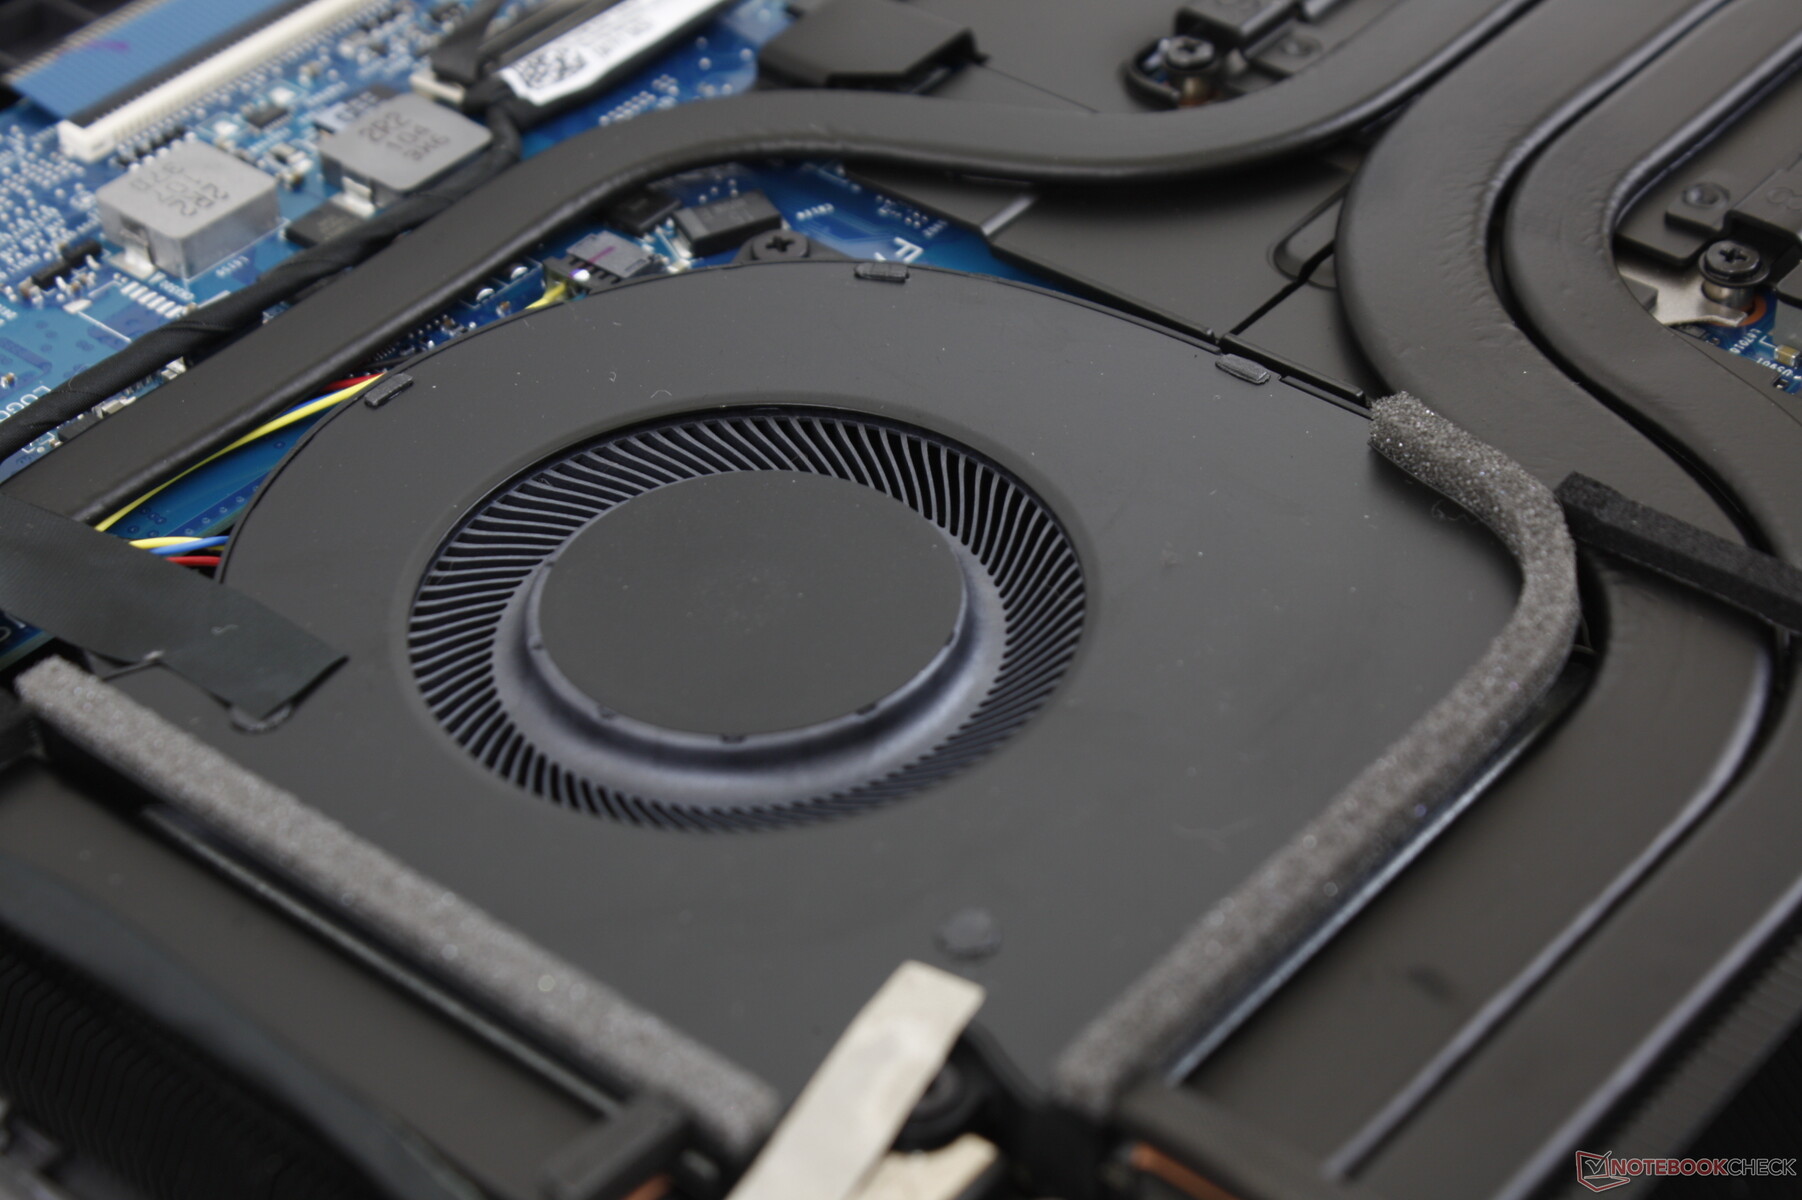
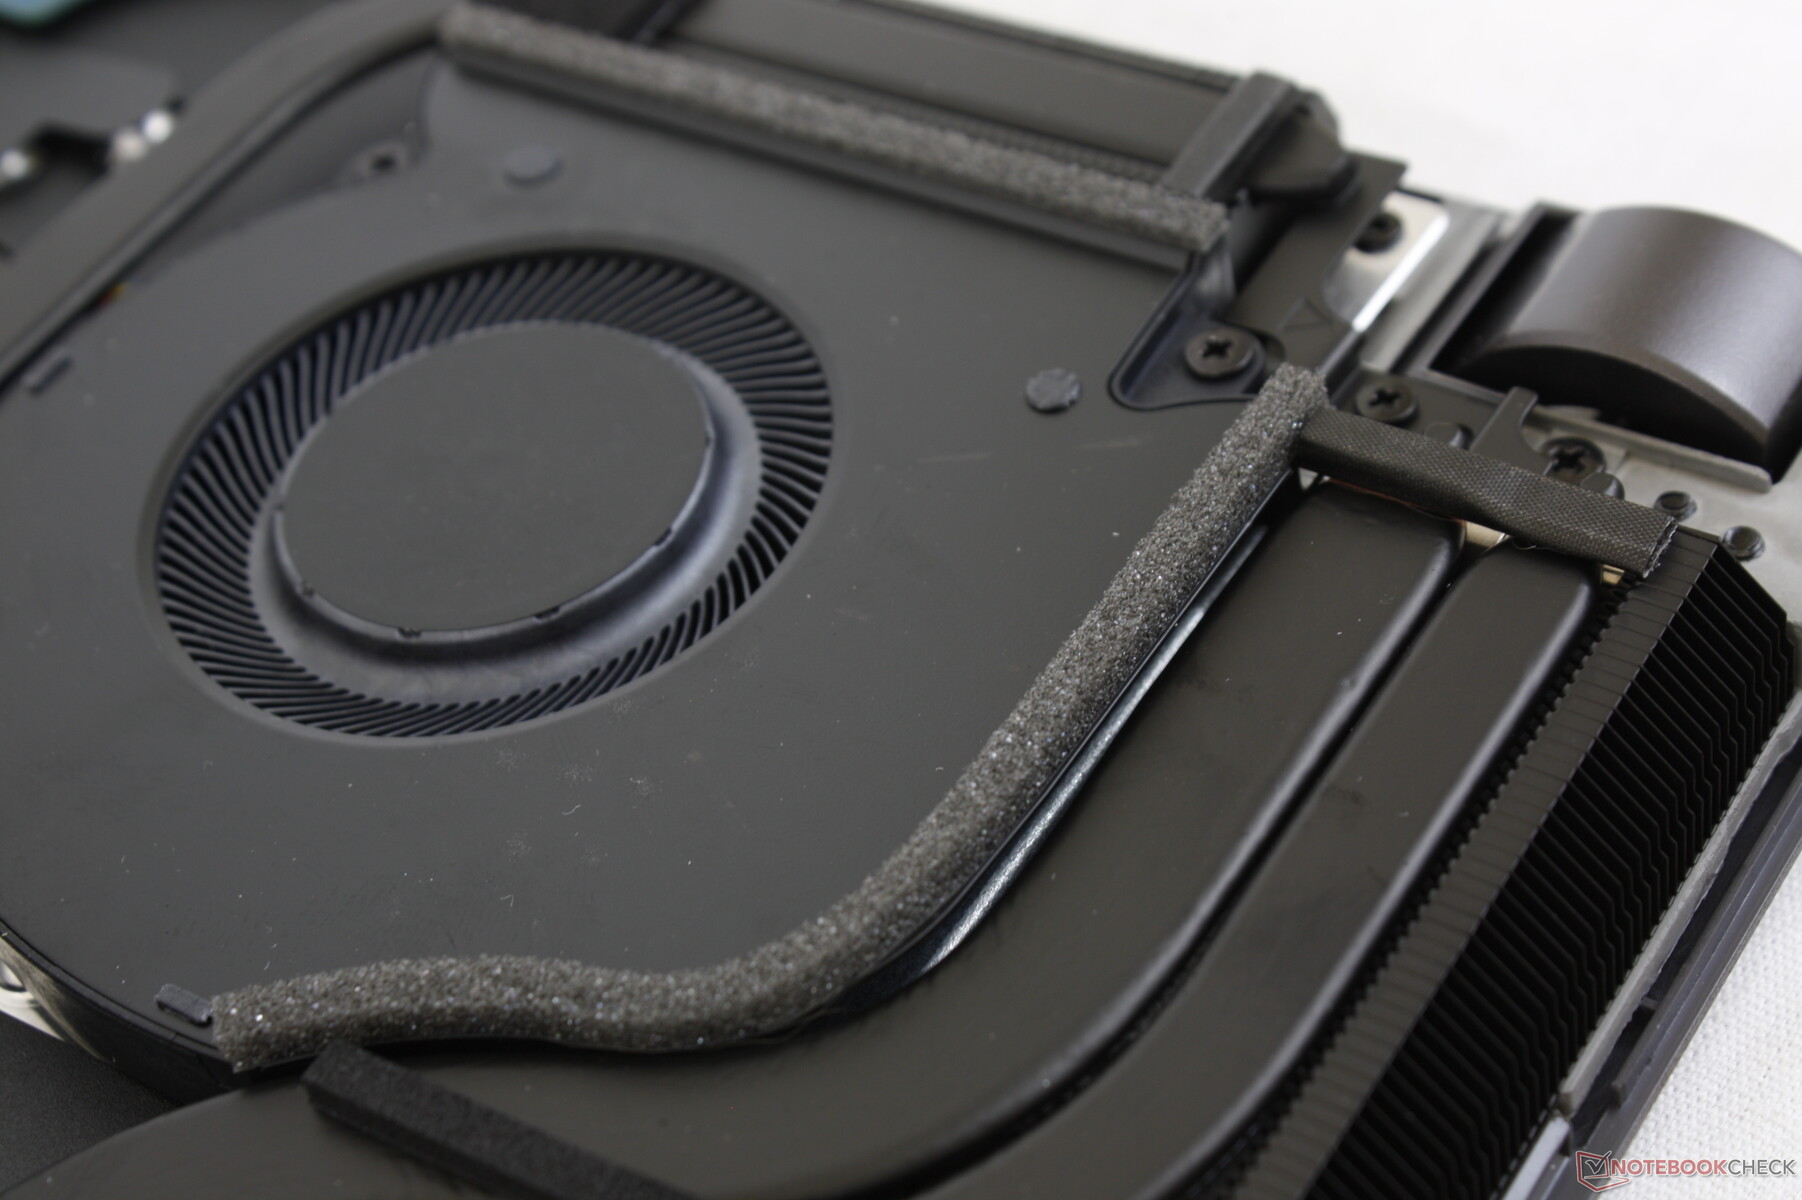
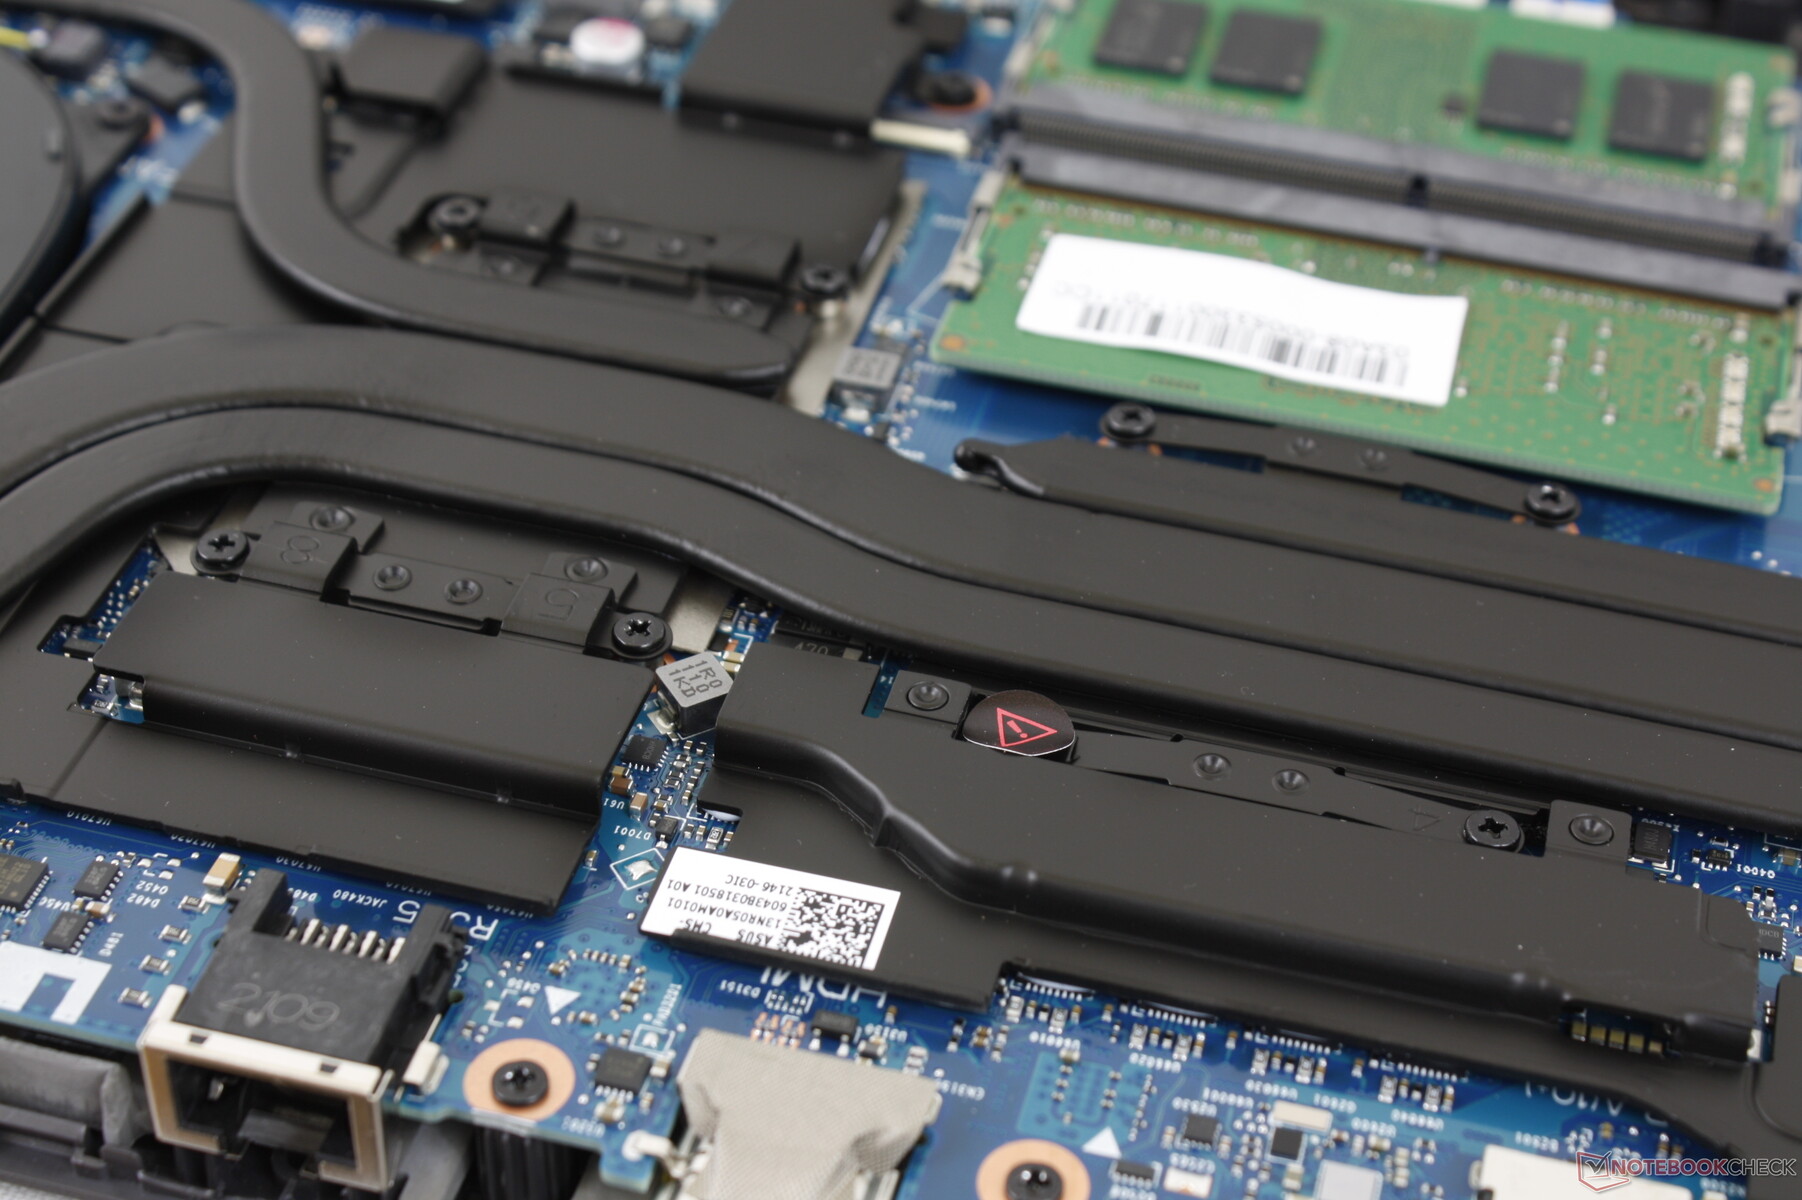
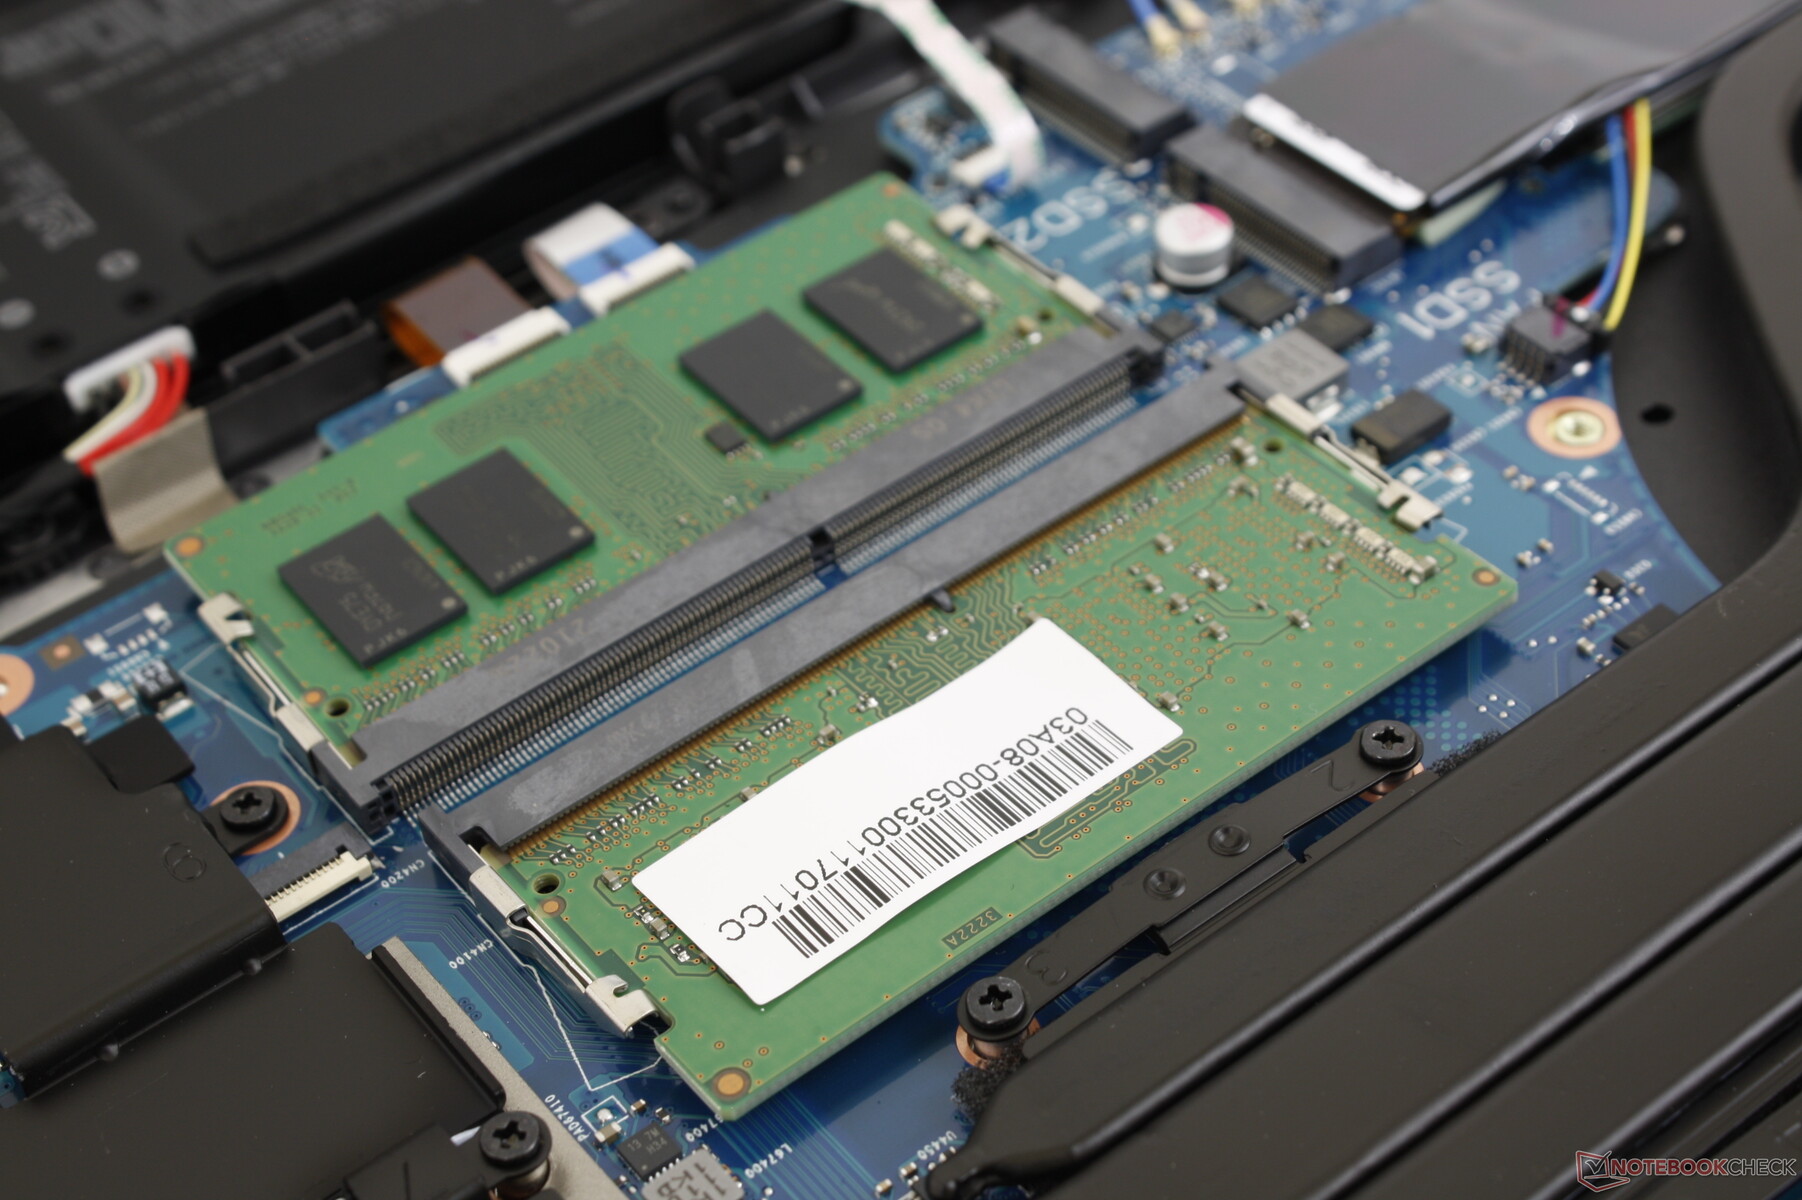
Manutenção - Upgrades fáceis
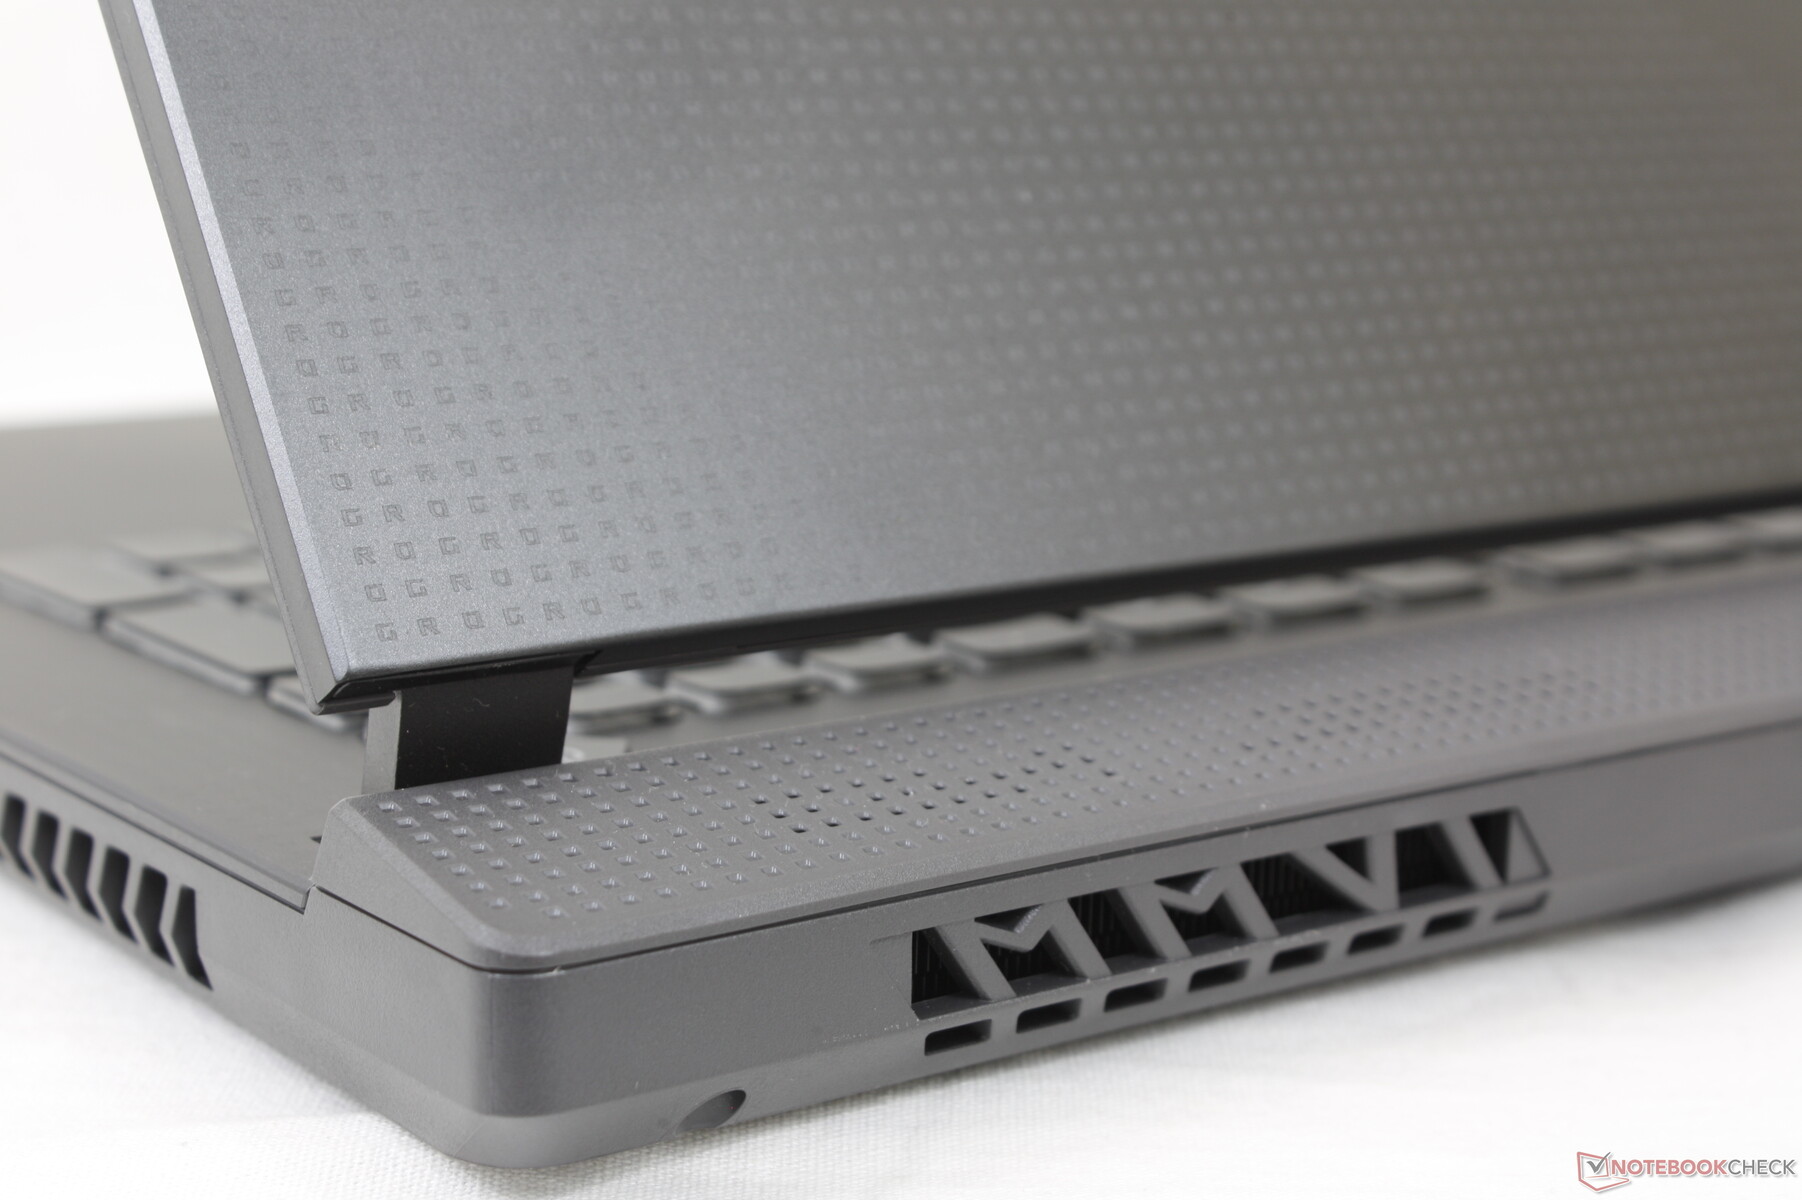
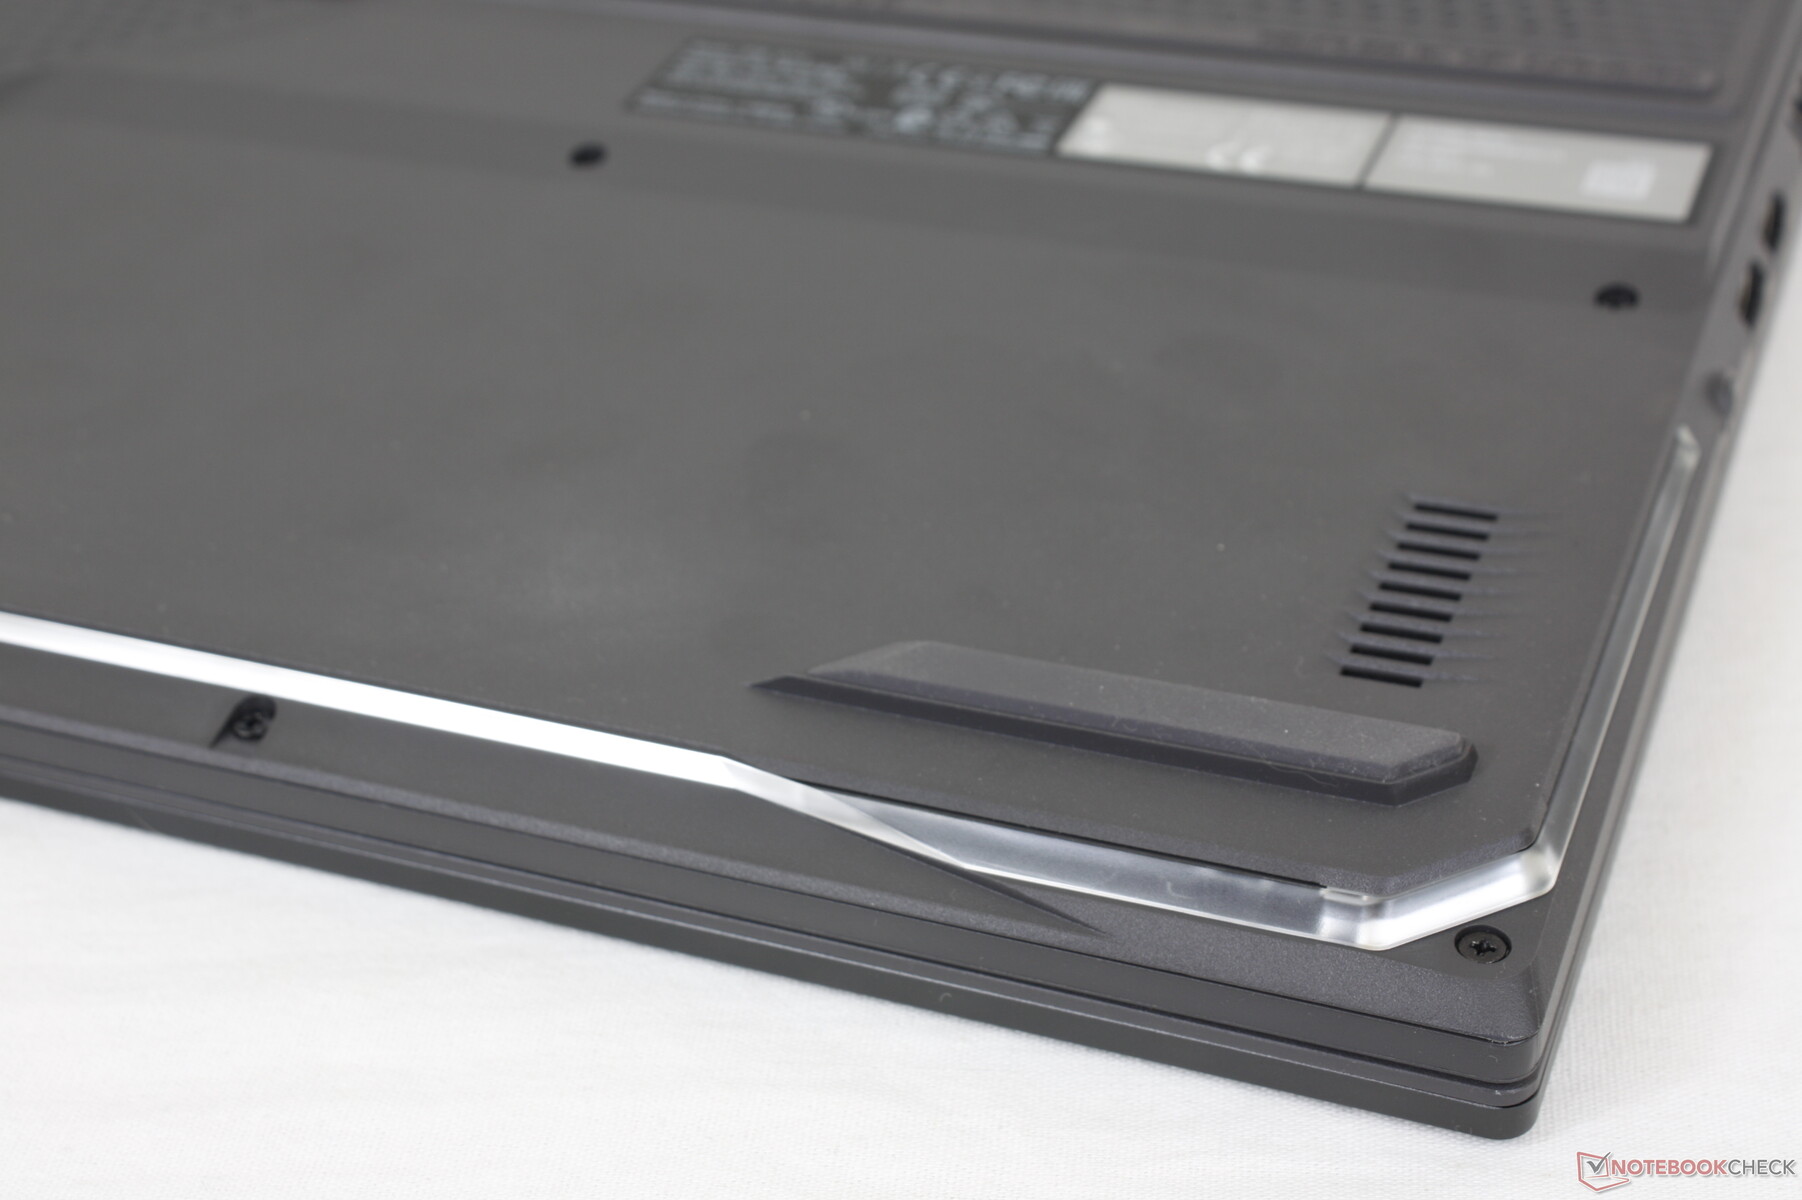
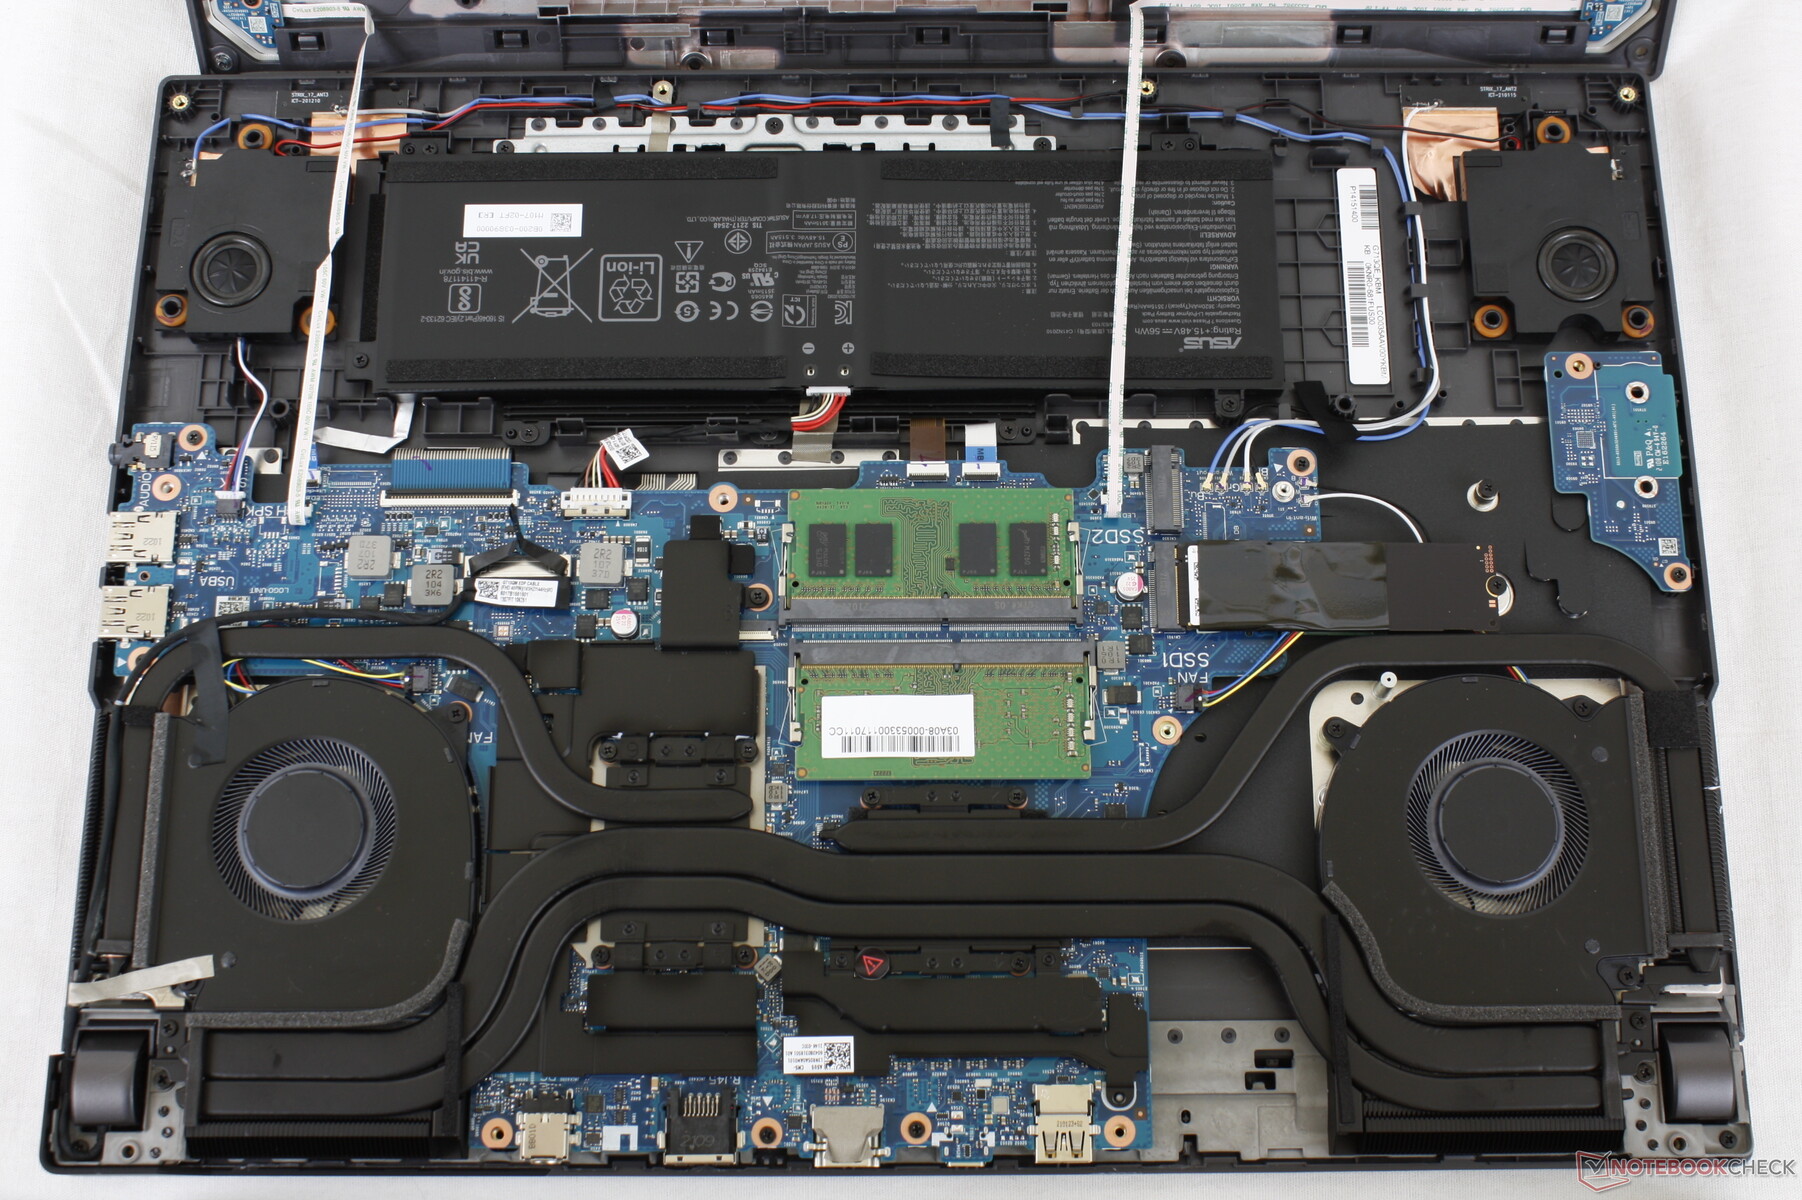
O painel inferior é firmemente travado à base e, portanto, é necessária uma aresta afiada para a desmontagem. Internamente, o sistema difere significativamente do G712 em termos de bateria, alto-falantes e o tamanho da solução de resfriamento.
Certifique-se de não danificar as duas frágeis fitas que conectam o painel inferior à placa-mãe. Estas fitas não estão presentes na maioria dos outros laptops desde que o G713 tem LEDs personalizáveis ao longo da borda frontal.
Acessórios e Garantia
Não há extras na caixa fora do adaptador AC e na papelada. Aplica-se a habitual garantia limitada de um ano do fabricante.
Dispositivos de entrada - Alto e Clicky
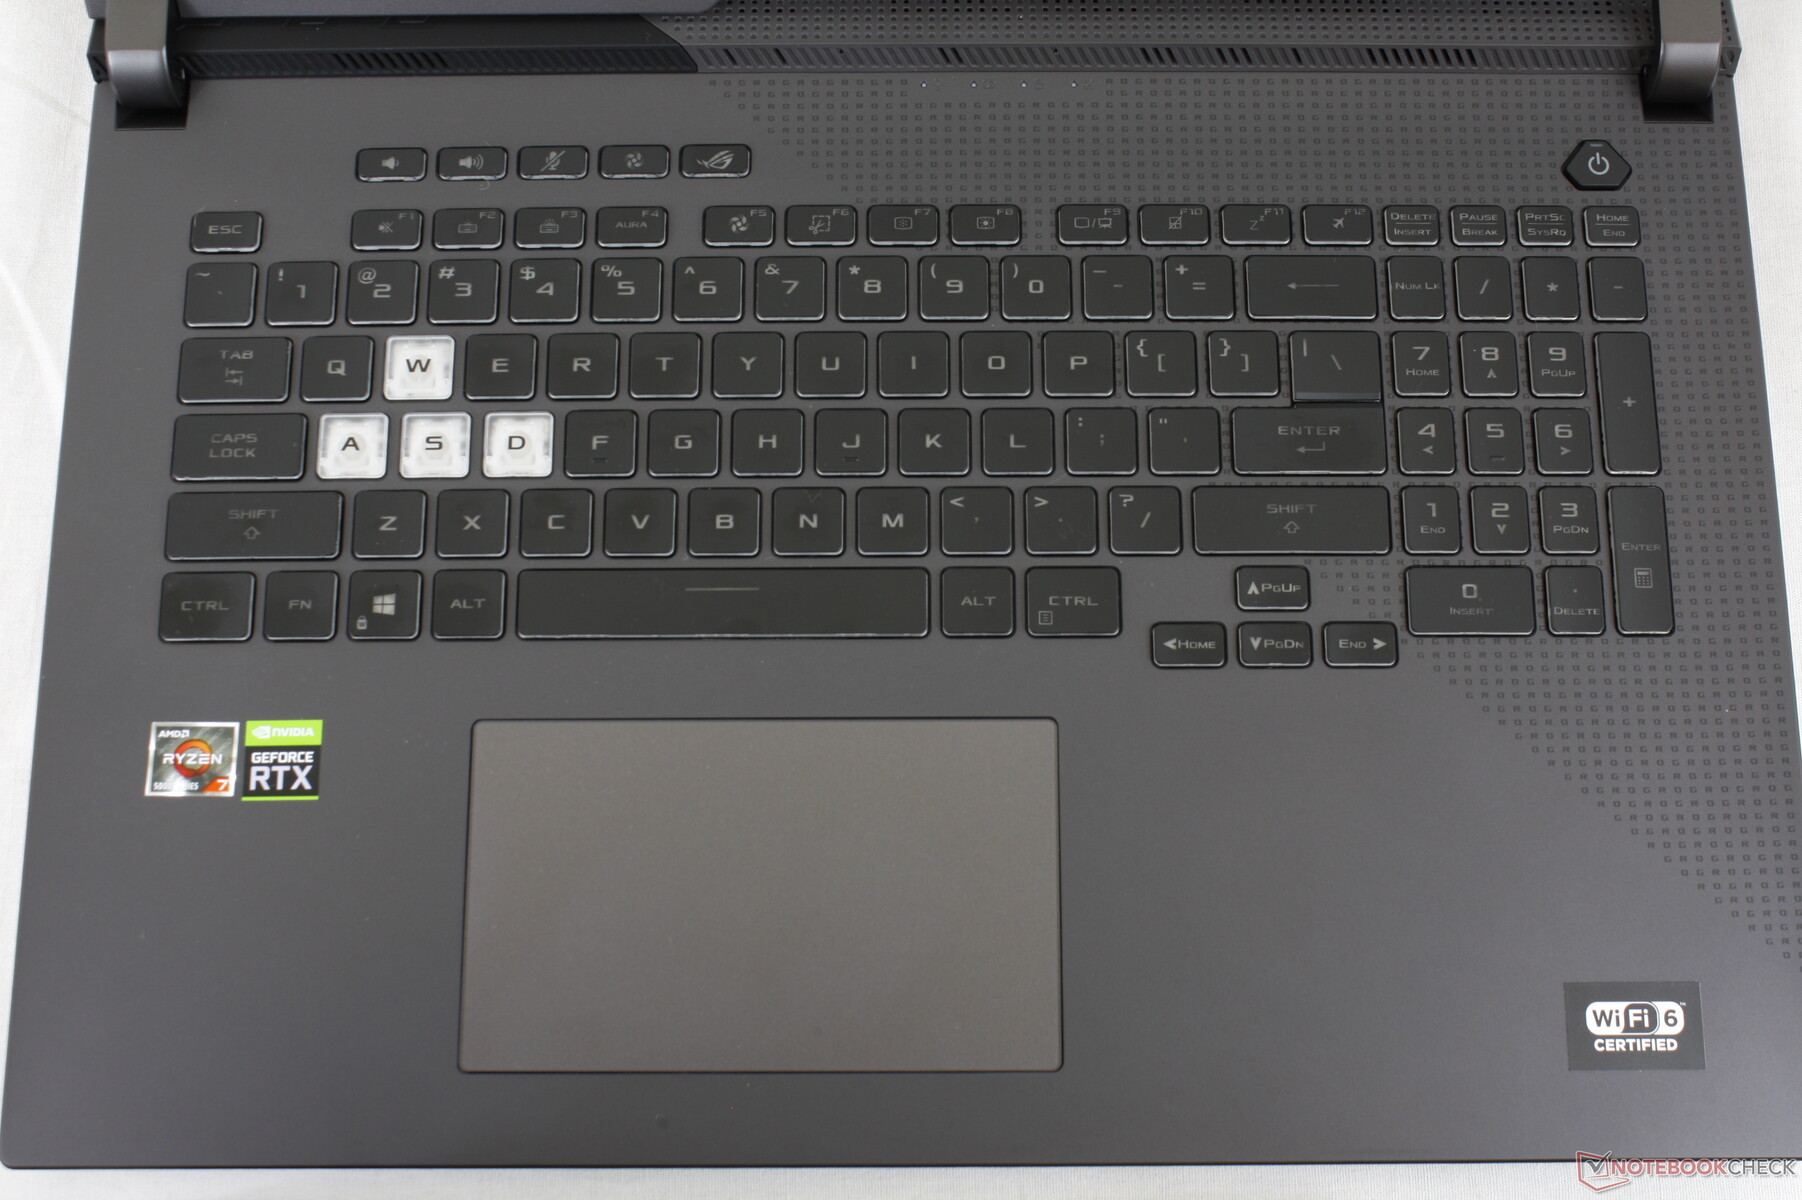
Teclado
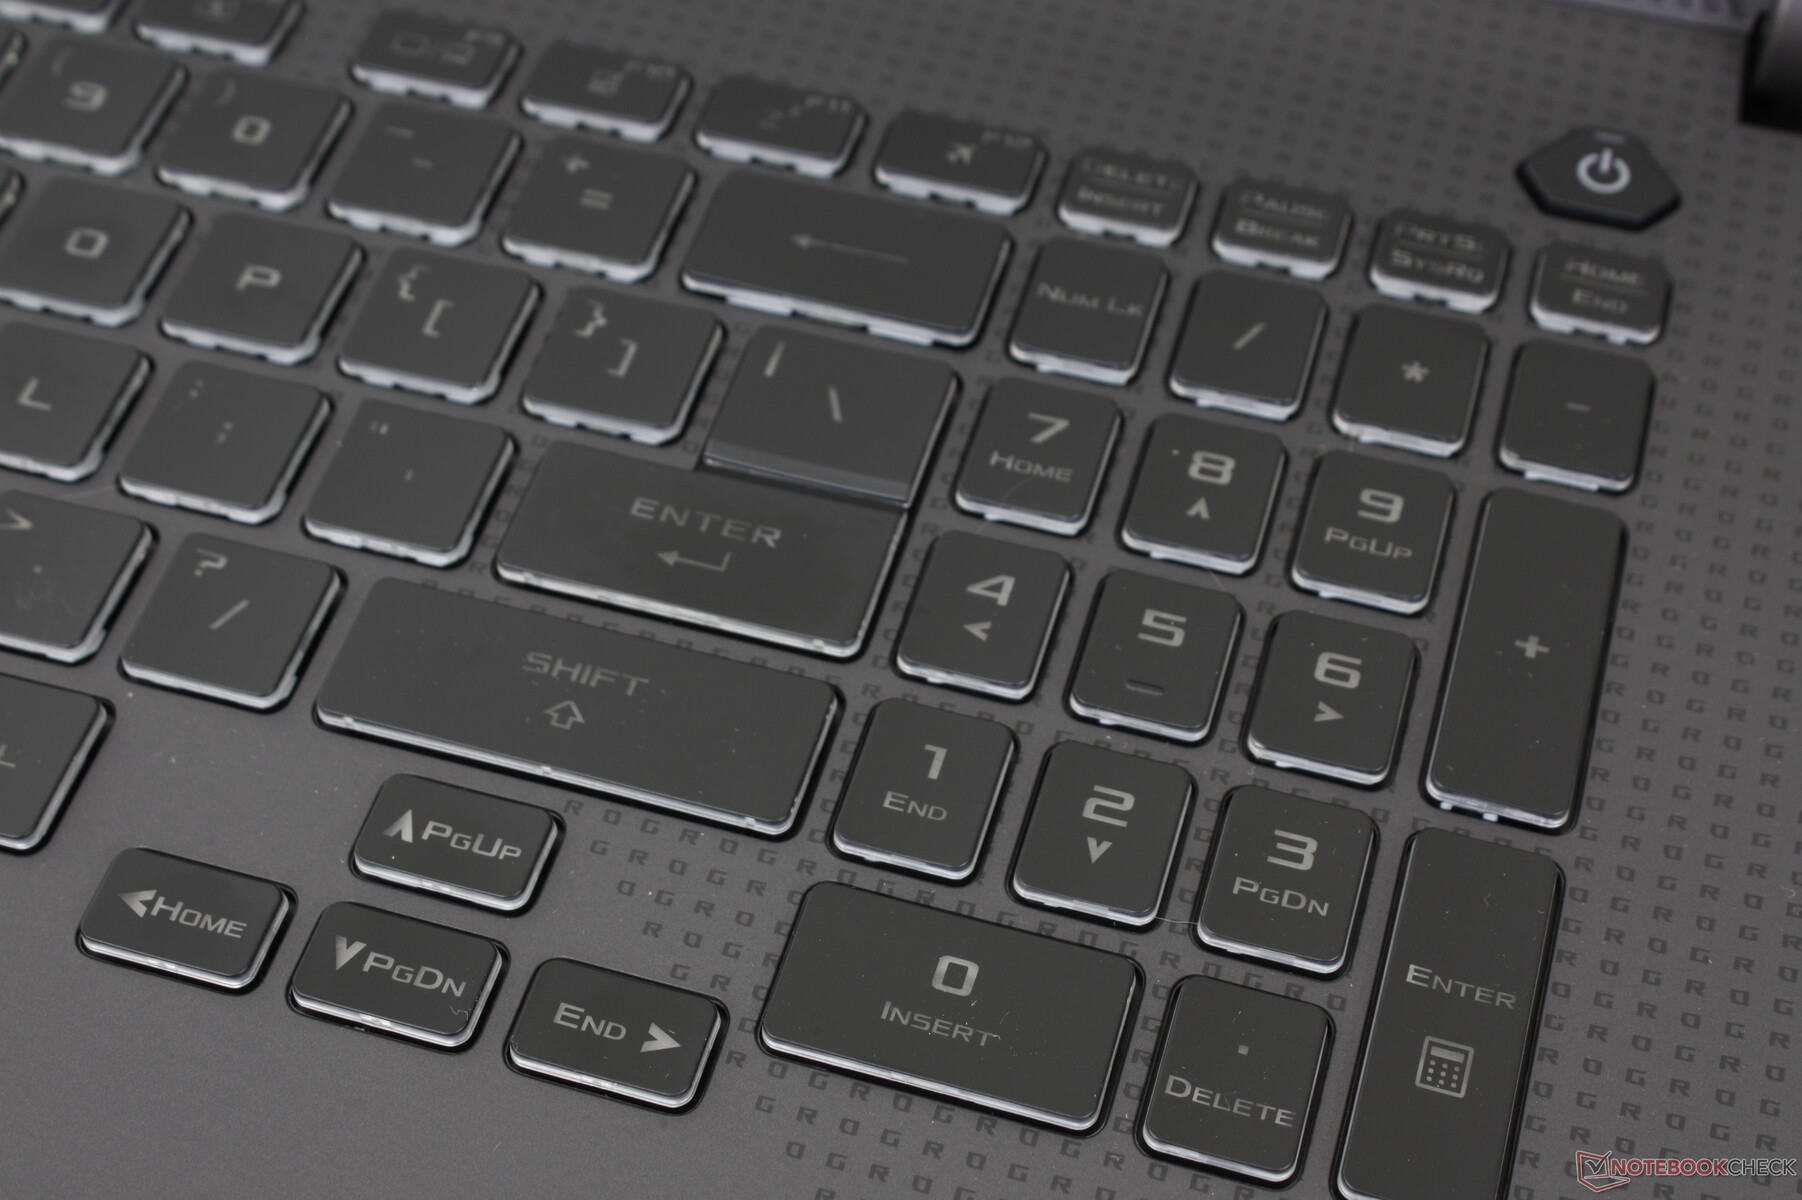
Com exceção dos modelos mais recentes com interruptores mecânicos, a experiência de digitação na maioria dos computadores portáteis ROG Strix é quase idêntica, uma vez que todos eles utilizam designs de chassis similares. As chaves têm um feedback mais profundo e satisfatório do que em um laptop Razer, mas com um ruído mais alto do que no MSI Katana. As teclas numpad e setas permanecem menores e mais apertadas do que as teclas QWERTY principais
A iluminação RGB de quatro zonas está disponível na maioria dos SKUs, enquanto os SKUs mais altos possuem iluminação RGB por tecla.
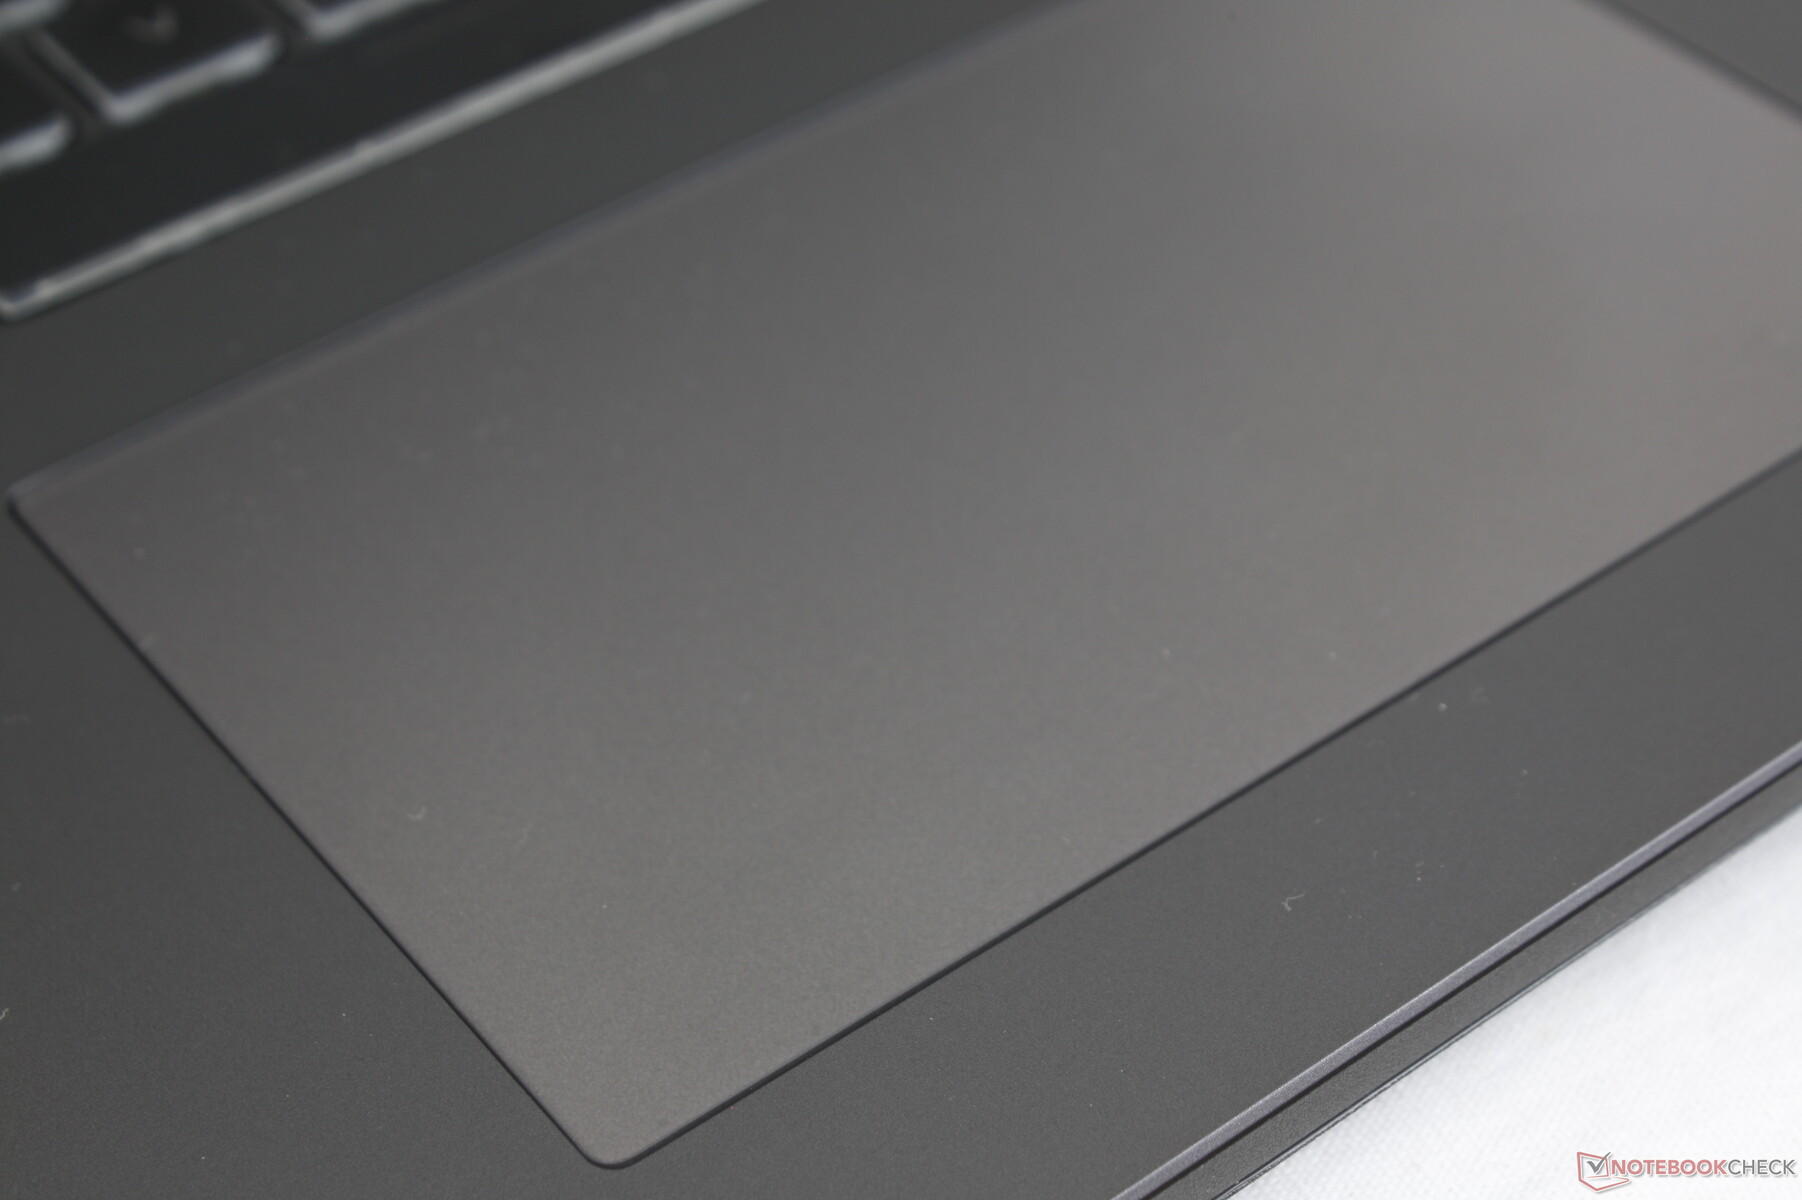
Touchpad
O clickpad é maior do que o do G733 (13 x 7,7 cm vs. 10,8 x 6 cm) desde que o Asus deixou cair os botões dedicados do mouse em favor de uma área maior de superfície. O deslizamento no clickpad é suave e com muito pouca aderência a velocidades lentas. Enquanto isso, as teclas de clique integradas são barulhentas e relativamente firmes para um clique satisfatório quando pressionadas.

Visor - Alta Taxa de Atualização, Cores Raso
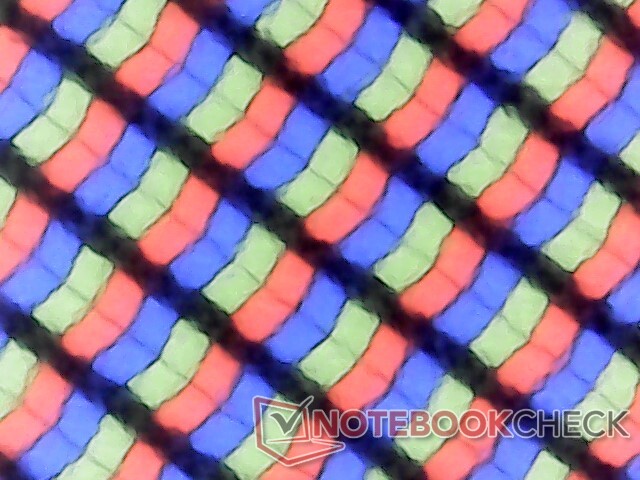
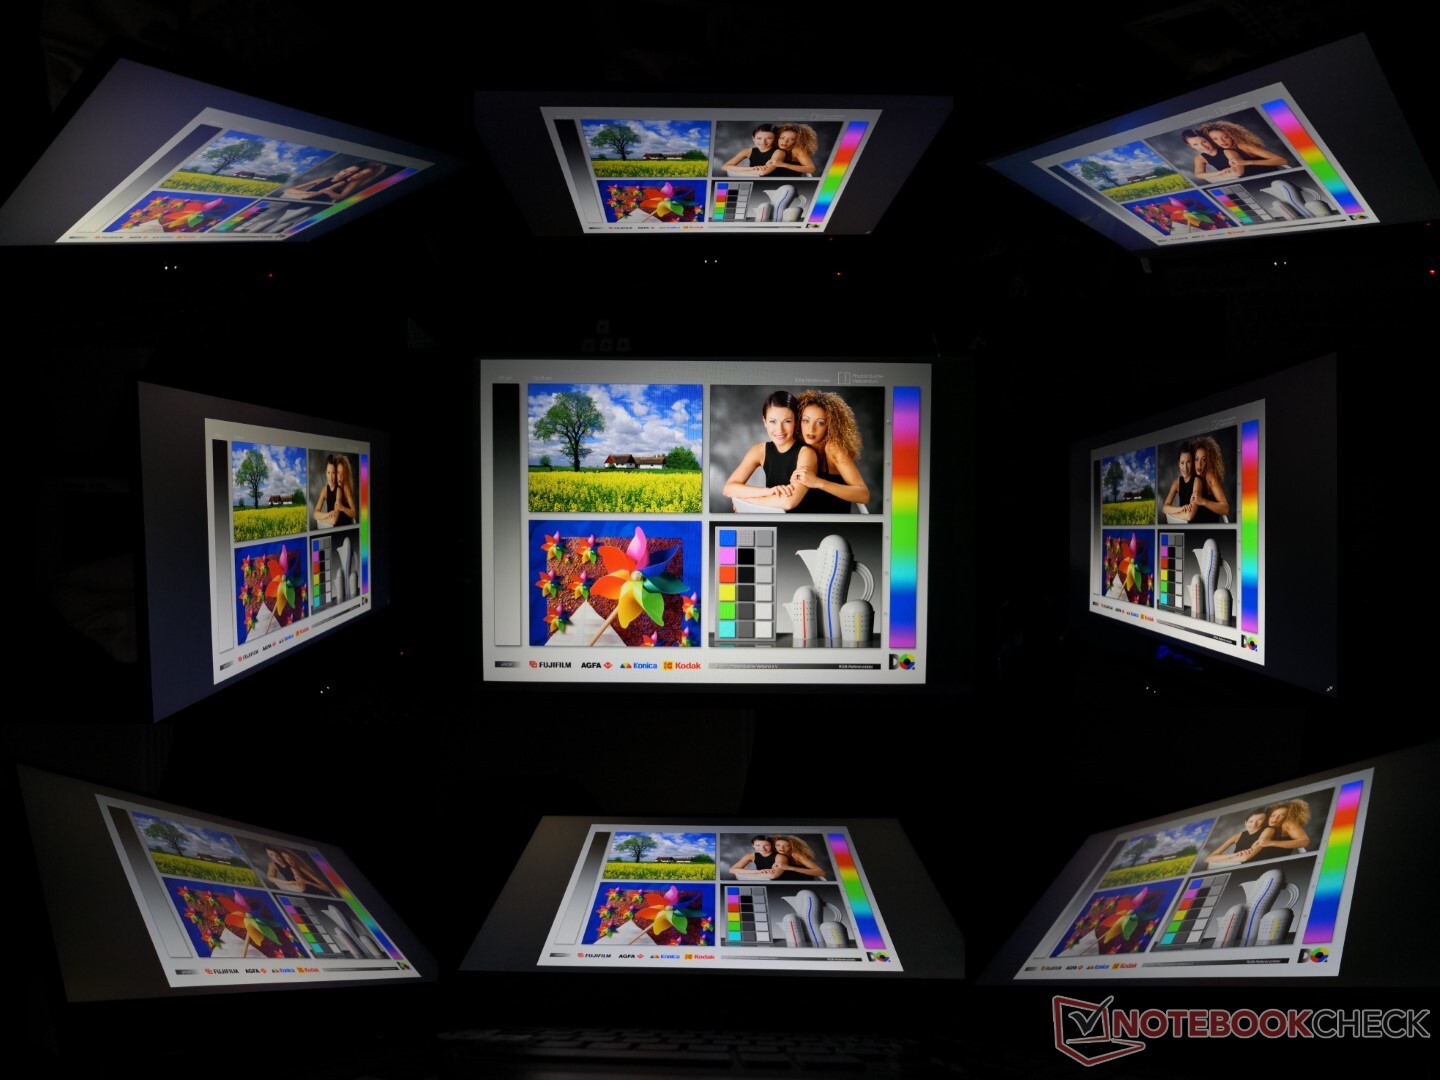
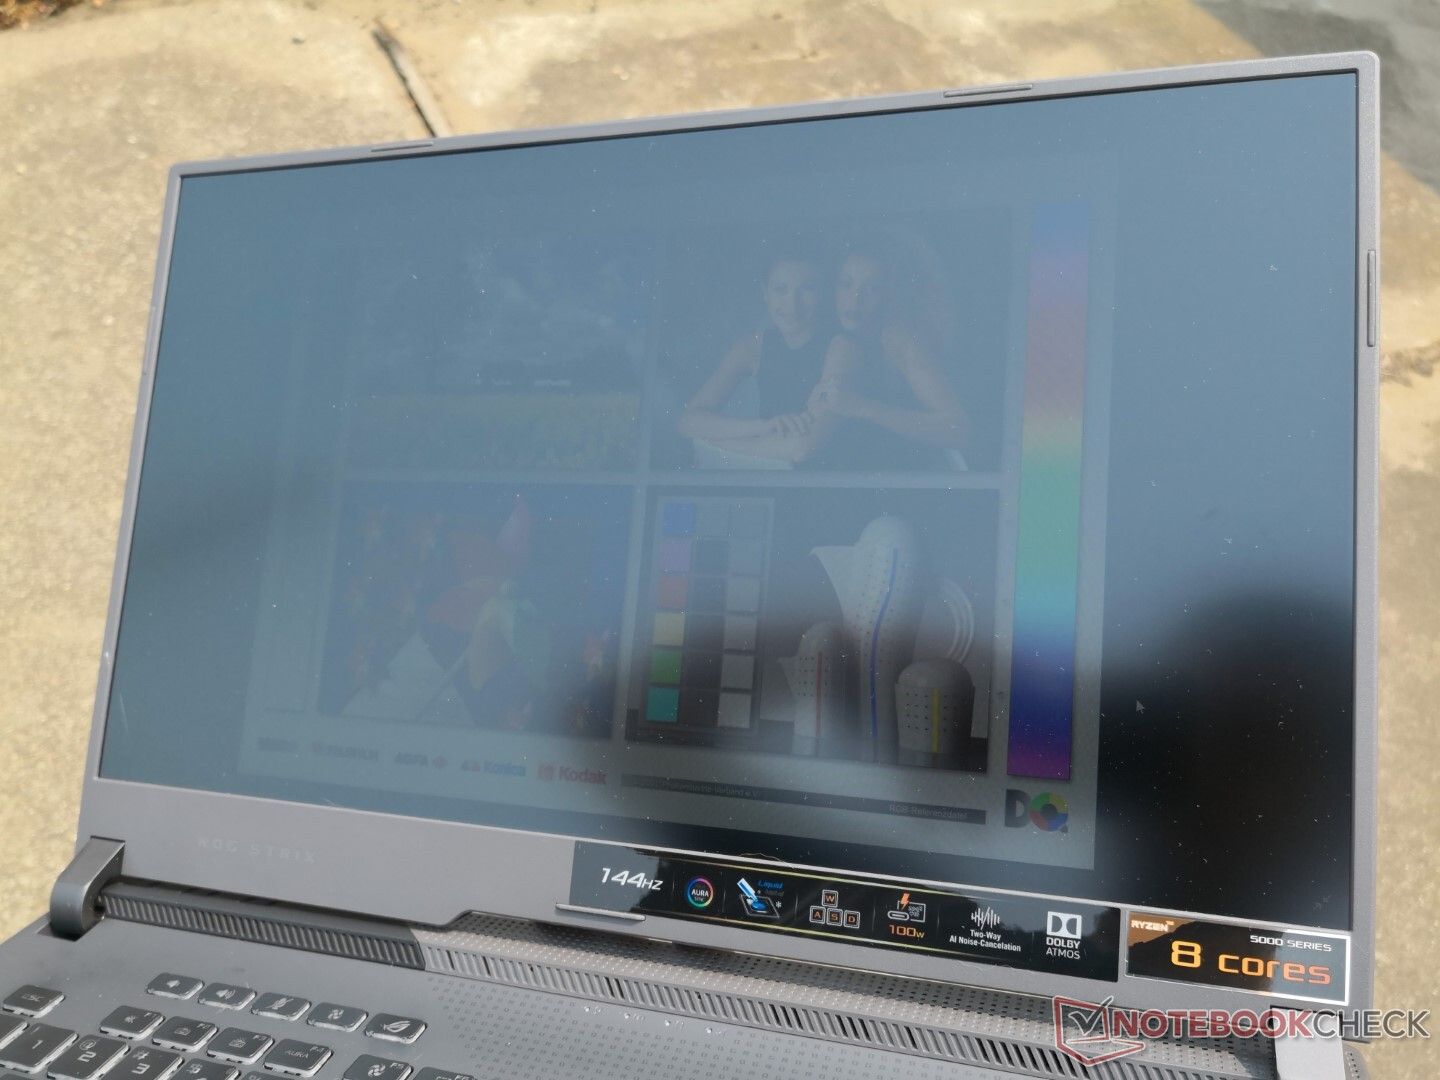
Nossa configuração Asus usa o mesmo painel IPS AU Optronics B173HAN04.9 que o encontrado no painel IPS da concorrência MSI Katana para características similares entre eles. Este painel de 1080p é notável por sua taxa de atualização nativa de 144 Hz e suporte FreeSync, mas fica um pouco curto nos tempos de resposta e na precisão das cores.
A Asus oferece pelo menos duas outras opções de painel (1080p 300 Hz e 1440p 165 Hz) cada uma com características diferentes de nossa unidade 1080p 144 Hz, incluindo tempos de resposta mais rápidos e/ou cores mais profundas. Assim, nossas medidas abaixo refletem apenas a opção 1080p 144 Hz.
| |||||||||||||||||||||||||
iluminação: 92 %
iluminação com acumulador: 270.5 cd/m²
Contraste: 1424:1 (Preto: 0.19 cd/m²)
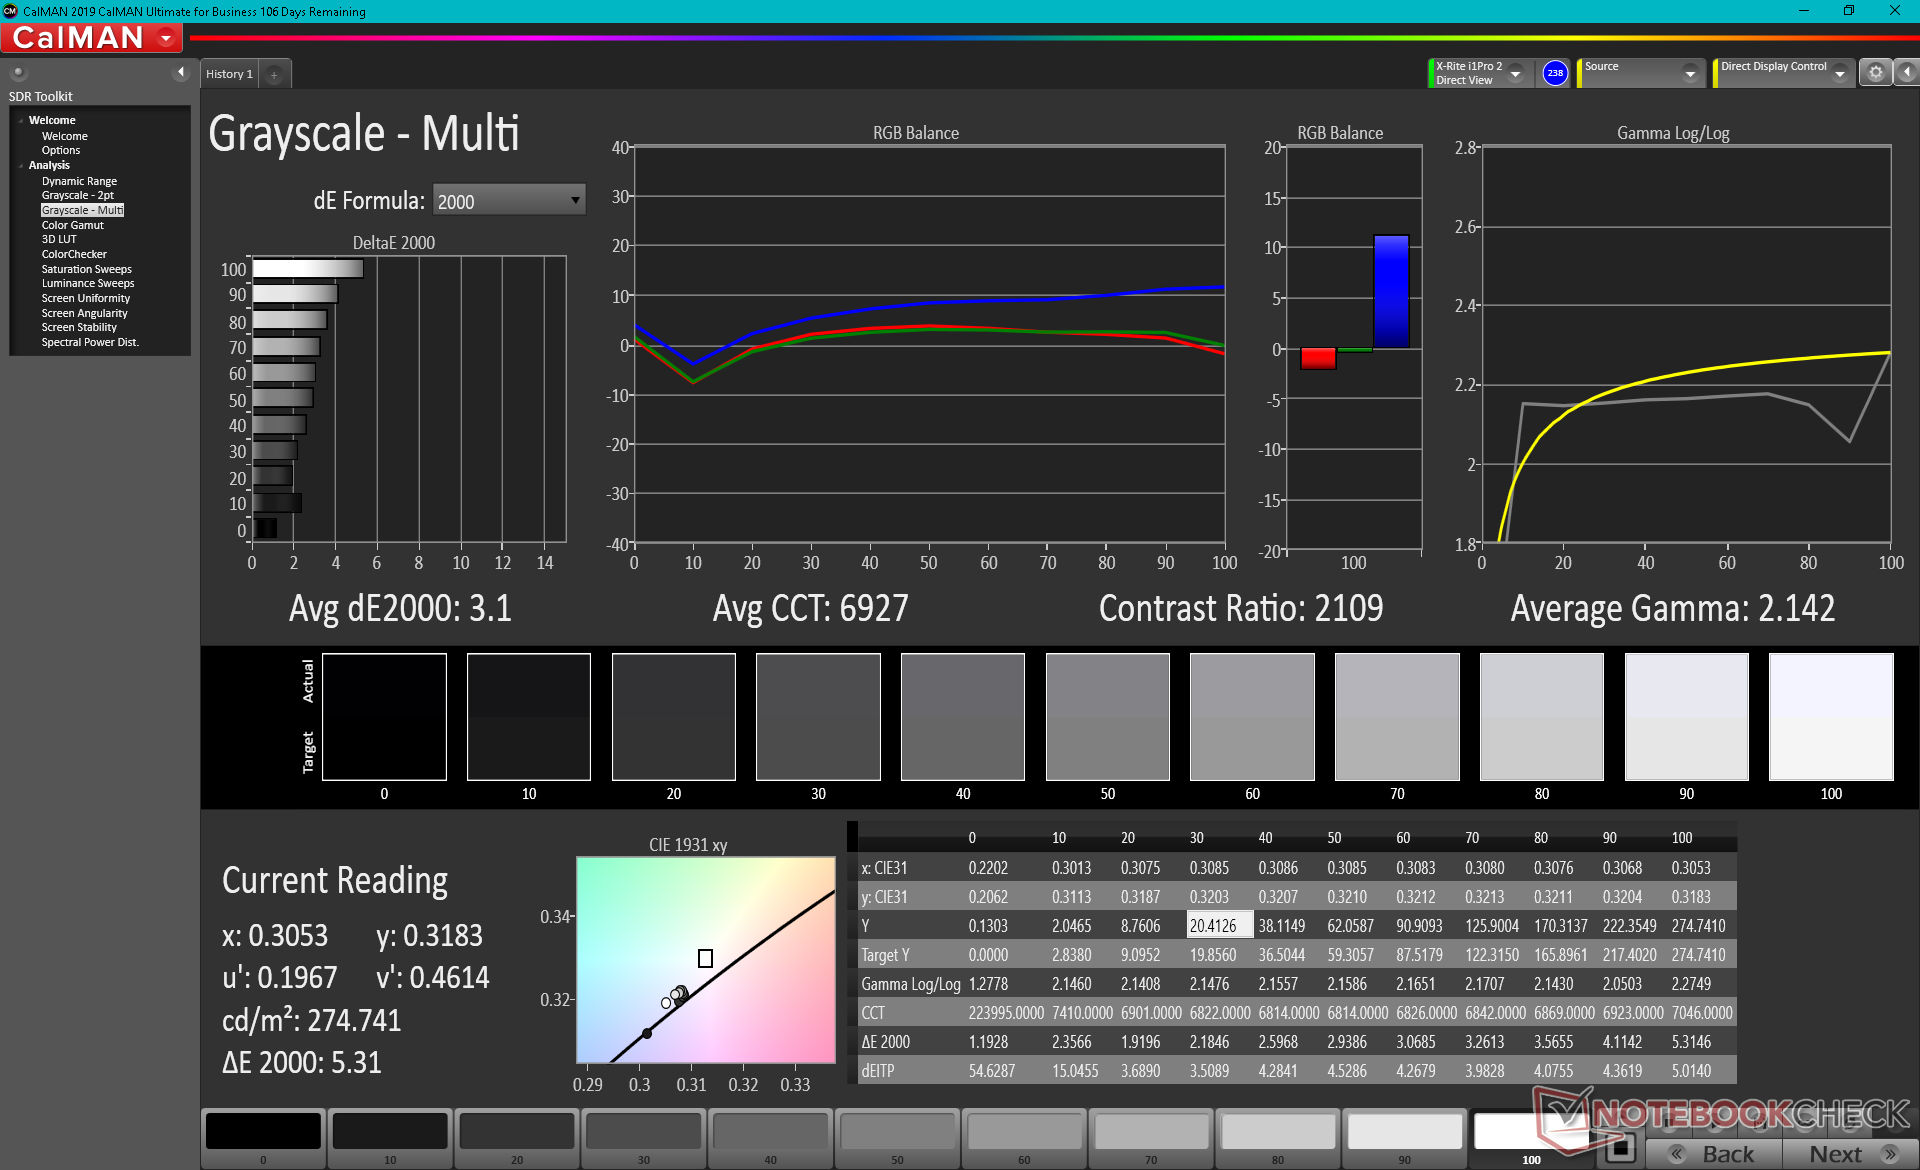
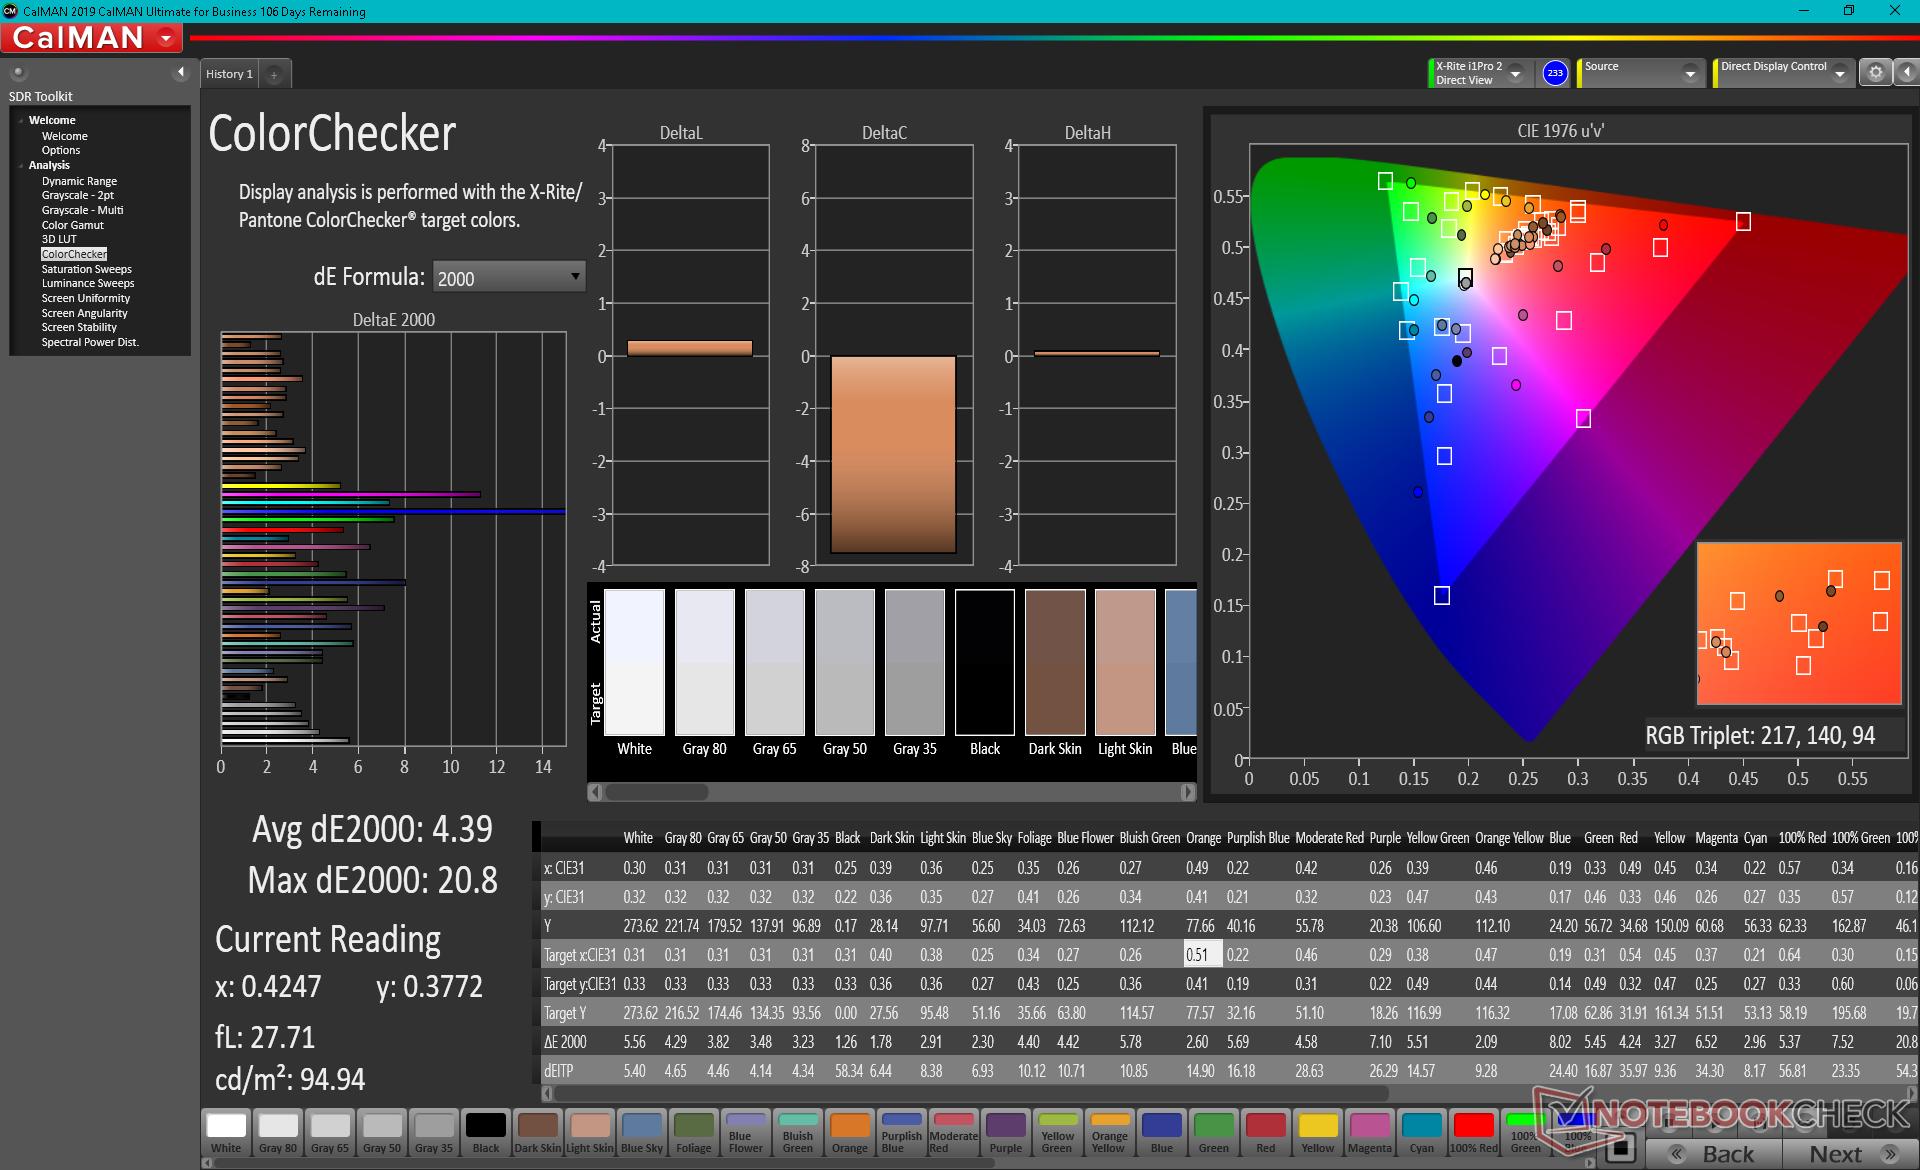
ΔE ColorChecker Calman: 4.39 | ∀{0.5-29.43 Ø4.71}
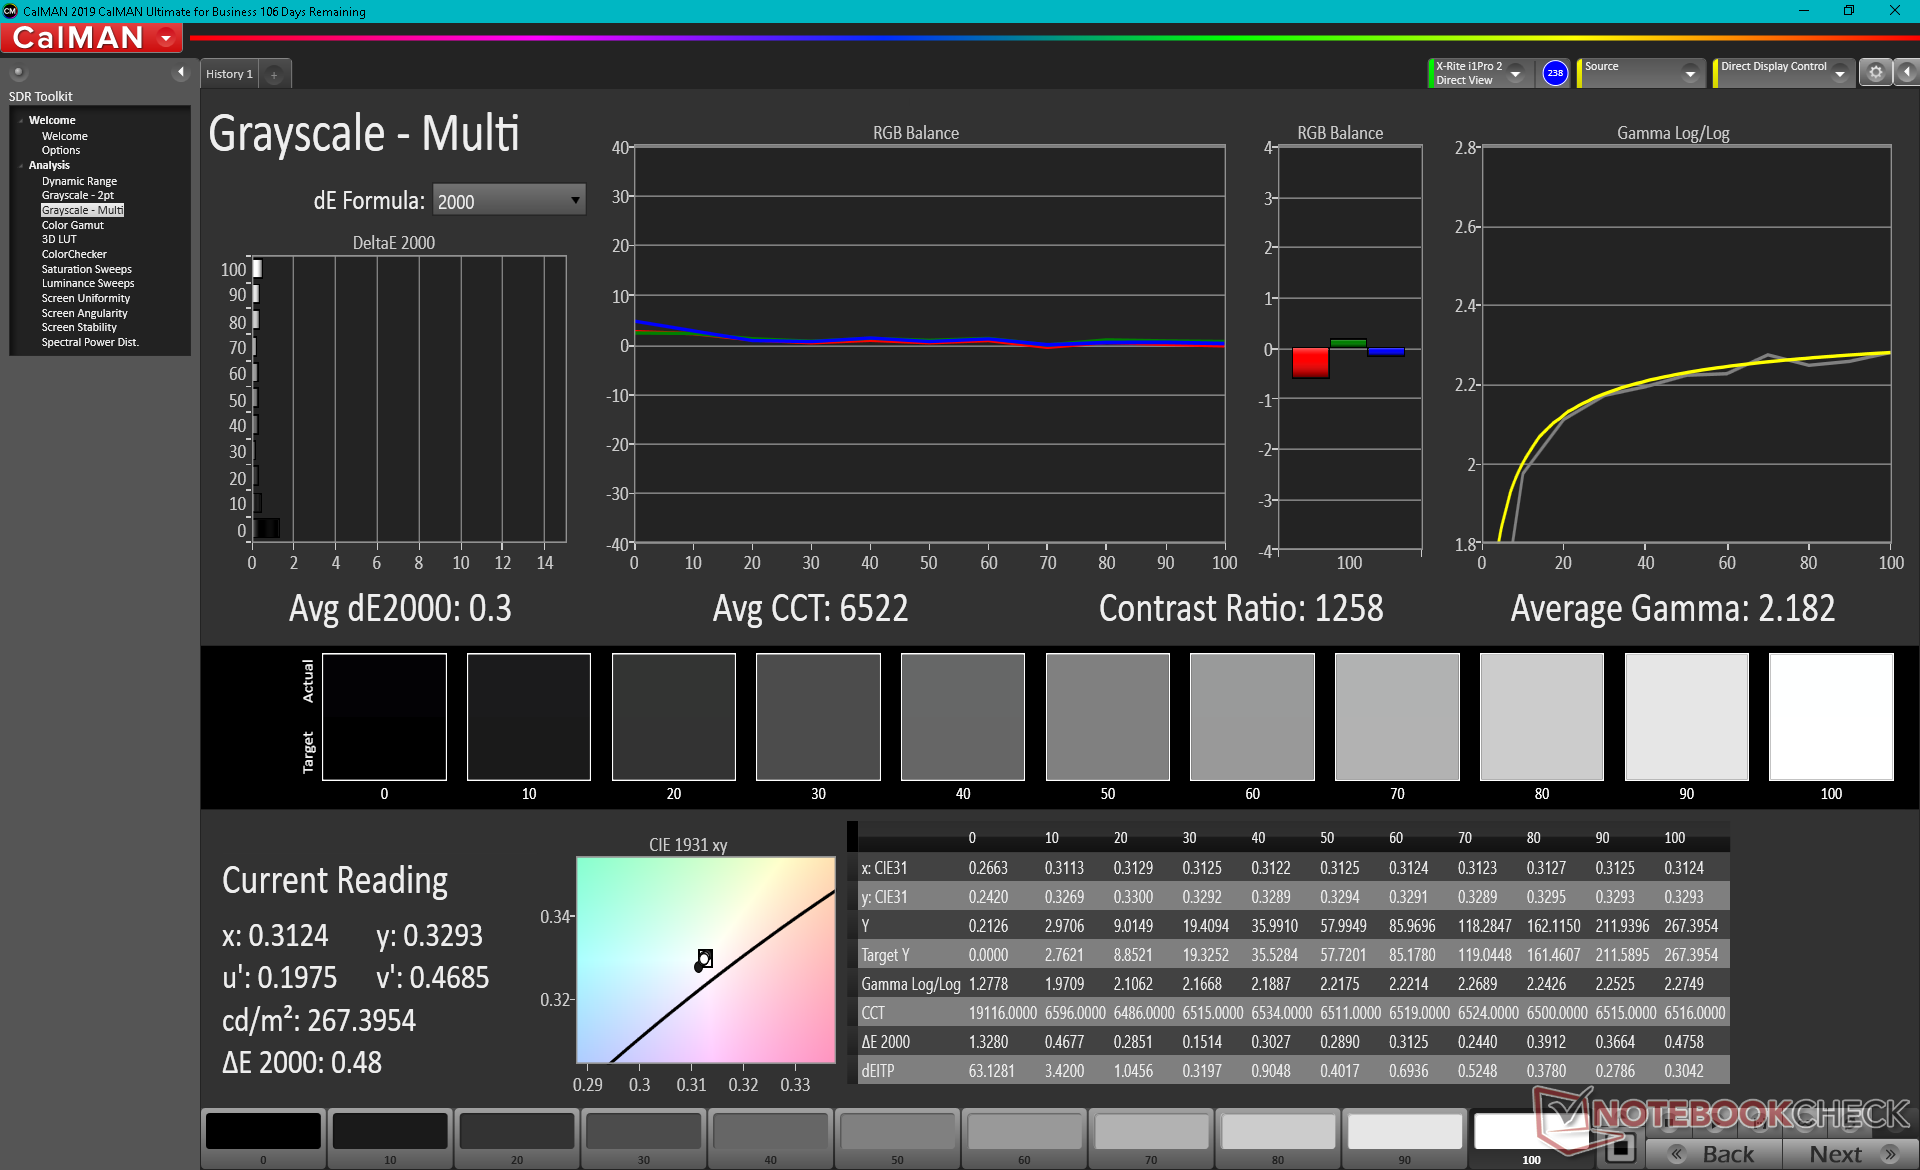
calibrated: 1.56
ΔE Greyscale Calman: 3.1 | ∀{0.09-98 Ø4.96}
41.6% AdobeRGB 1998 (Argyll 3D)
60.3% sRGB (Argyll 3D)
40.2% Display P3 (Argyll 3D)
Gamma: 2.14
CCT: 6927 K
| Asus ROG Strix G17 G713QE-RB74 AU Optronics B173HAN04.9, IPS, 17.3", 1920x1080 | Acer Nitro 5 AN517-53-54DQ BOE NV173FHM-NX4 (BOE09B4), IPS, 17.3", 1920x1080 | MSI Katana GF76 11UE AU Optronics B173HAN04.9, IPS, 17.3", 1920x1080 | Asus Strix Scar 17 G733QSA-XS99 AU Optronics B173HAN05.4, IPS, 17.3", 1920x1080 | MSI Alpha 17 A4DEK AU Optronics AUO978F, IPS, 17.3", 1920x1080 | Asus Strix G17 G712LWS LG Philips LP173WFG-SPB3, IPS, 17.3", 1920x1080 | |
|---|---|---|---|---|---|---|
| Display | -9% | -1% | 72% | -2% | 61% | |
| Display P3 Coverage (%) | 40.2 | 36.7 -9% | 39.8 -1% | 71 77% | 39.55 -2% | 65.2 62% |
| sRGB Coverage (%) | 60.3 | 55 -9% | 59.5 -1% | 99.4 65% | 59.2 -2% | 96.8 61% |
| AdobeRGB 1998 Coverage (%) | 41.6 | 37.9 -9% | 41.12 -1% | 72.2 74% | 40.86 -2% | 66.4 60% |
| Response Times | 5% | -36% | 60% | -51% | 46% | |
| Response Time Grey 50% / Grey 80% * (ms) | 26.8 ? | 24.8 ? 7% | 36.8 ? -37% | 6.6 ? 75% | 40 ? -49% | 14.4 ? 46% |
| Response Time Black / White * (ms) | 19.2 ? | 18.8 ? 2% | 26 ? -35% | 10.8 ? 44% | 29.2 ? -52% | 10.4 ? 46% |
| PWM Frequency (Hz) | ||||||
| Screen | -23% | -18% | 16% | -21% | 5% | |
| Brightness middle (cd/m²) | 270.5 | 286 6% | 260 -4% | 303.8 12% | 254 -6% | 323 19% |
| Brightness (cd/m²) | 269 | 261 -3% | 251 -7% | 292 9% | 254 -6% | 300 12% |
| Brightness Distribution (%) | 92 | 83 -10% | 85 -8% | 85 -8% | 93 1% | 89 -3% |
| Black Level * (cd/m²) | 0.19 | 0.23 -21% | 0.26 -37% | 0.23 -21% | 0.23 -21% | 0.31 -63% |
| Contrast (:1) | 1424 | 1243 -13% | 1000 -30% | 1321 -7% | 1104 -22% | 1042 -27% |
| Colorchecker dE 2000 * | 4.39 | 4.92 -12% | 3.9 11% | 1.87 57% | 4.12 6% | 3.01 31% |
| Colorchecker dE 2000 max. * | 20.8 | 19.29 7% | 20.64 1% | 3.26 84% | 19.66 5% | 7.65 63% |
| Colorchecker dE 2000 calibrated * | 1.56 | 4.73 -203% | 3.71 -138% | 1.45 7% | 3.78 -142% | 1 36% |
| Greyscale dE 2000 * | 3.1 | 1.9 39% | 1.6 48% | 2.7 13% | 3.2 -3% | 3.8 -23% |
| Gamma | 2.14 103% | 2.175 101% | 2.068 106% | 2.26 97% | 2.179 101% | 2.154 102% |
| CCT | 6927 94% | 6782 96% | 6511 100% | 6436 101% | 6754 96% | 7507 87% |
| Color Space (Percent of AdobeRGB 1998) (%) | 65.6 | 41 | 66 | |||
| Color Space (Percent of sRGB) (%) | 99.4 | 59 | 90 | |||
| Média Total (Programa/Configurações) | -9% /
-16% | -18% /
-17% | 49% /
34% | -25% /
-21% | 37% /
23% |
* ... menor é melhor
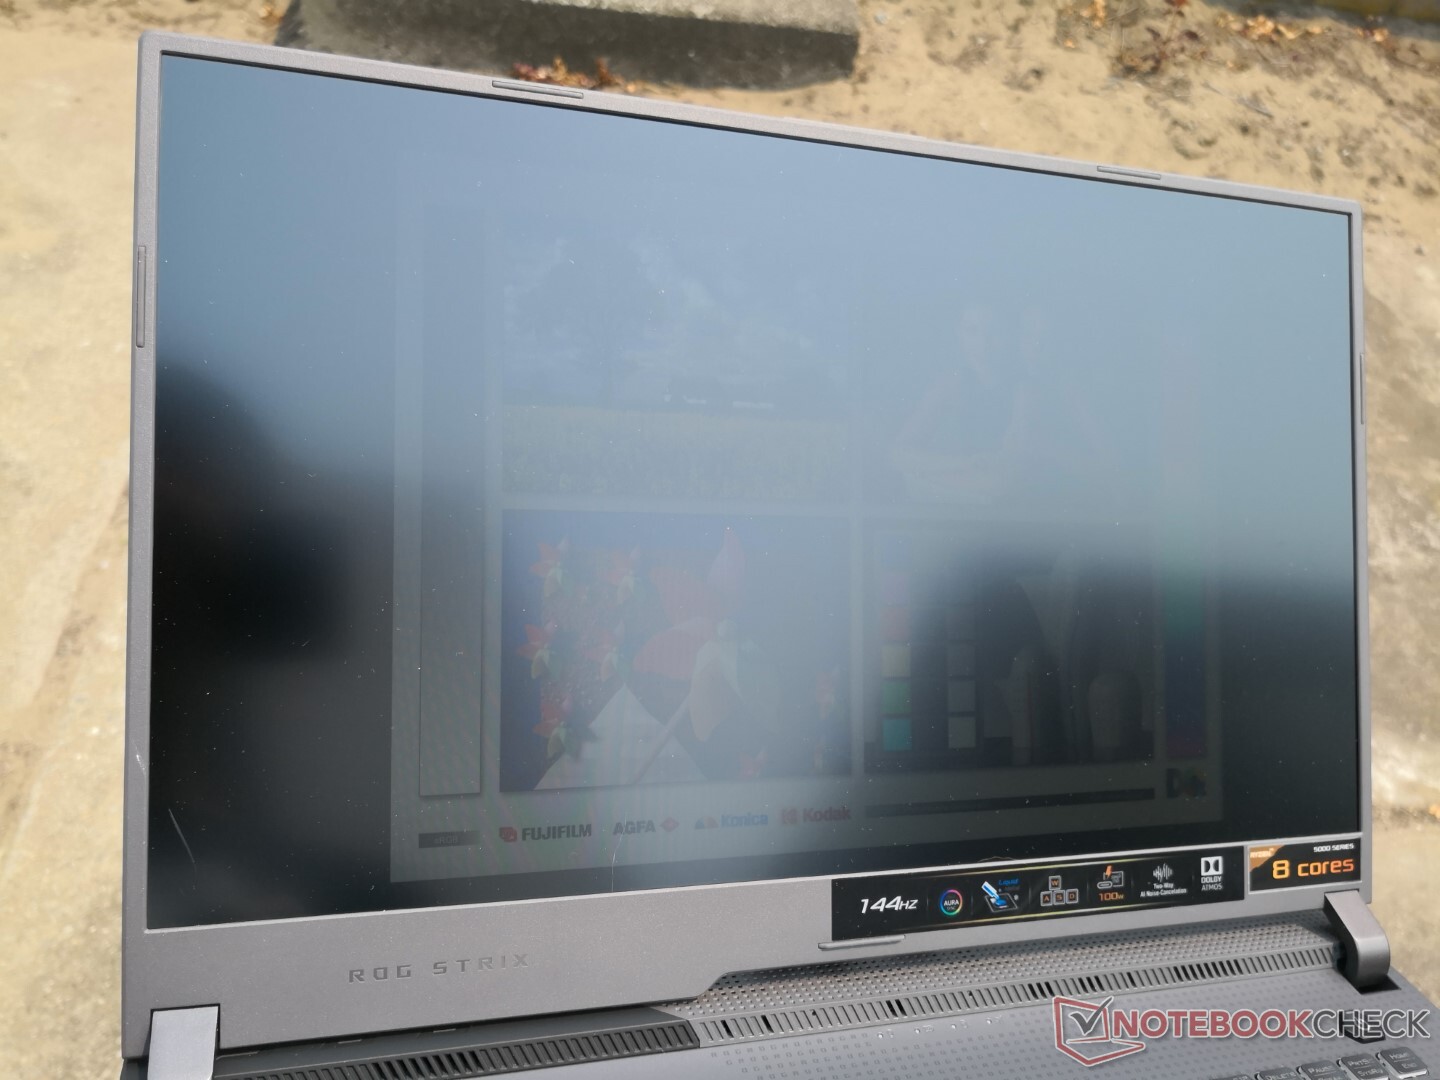
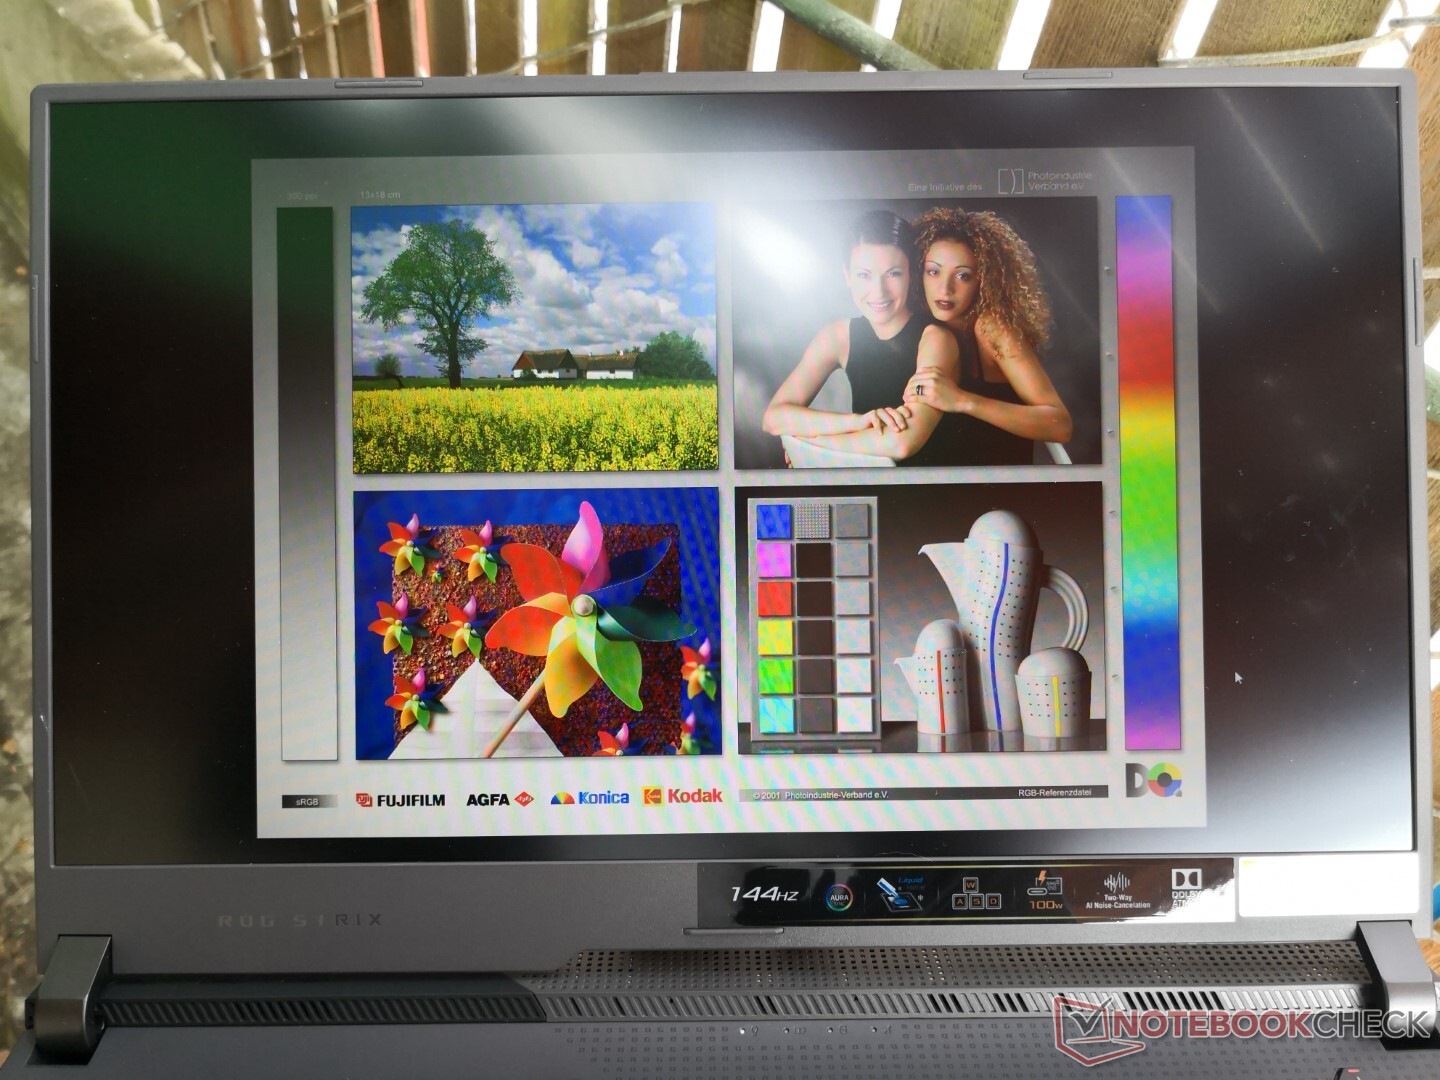
A gama é estreita em apenas 60% do sRGB para indicar uma tela imprópria para a edição gráfica profissional. De fato, tais painéis são comuns em laptops de jogos orçamentários onde os tempos de resposta muitas vezes têm prioridade sobre a precisão das cores. A Asus oferece painéis superiores com cobertura completa sRGB ou P3 nesta série G713 em particular para cobrir todas as bases.
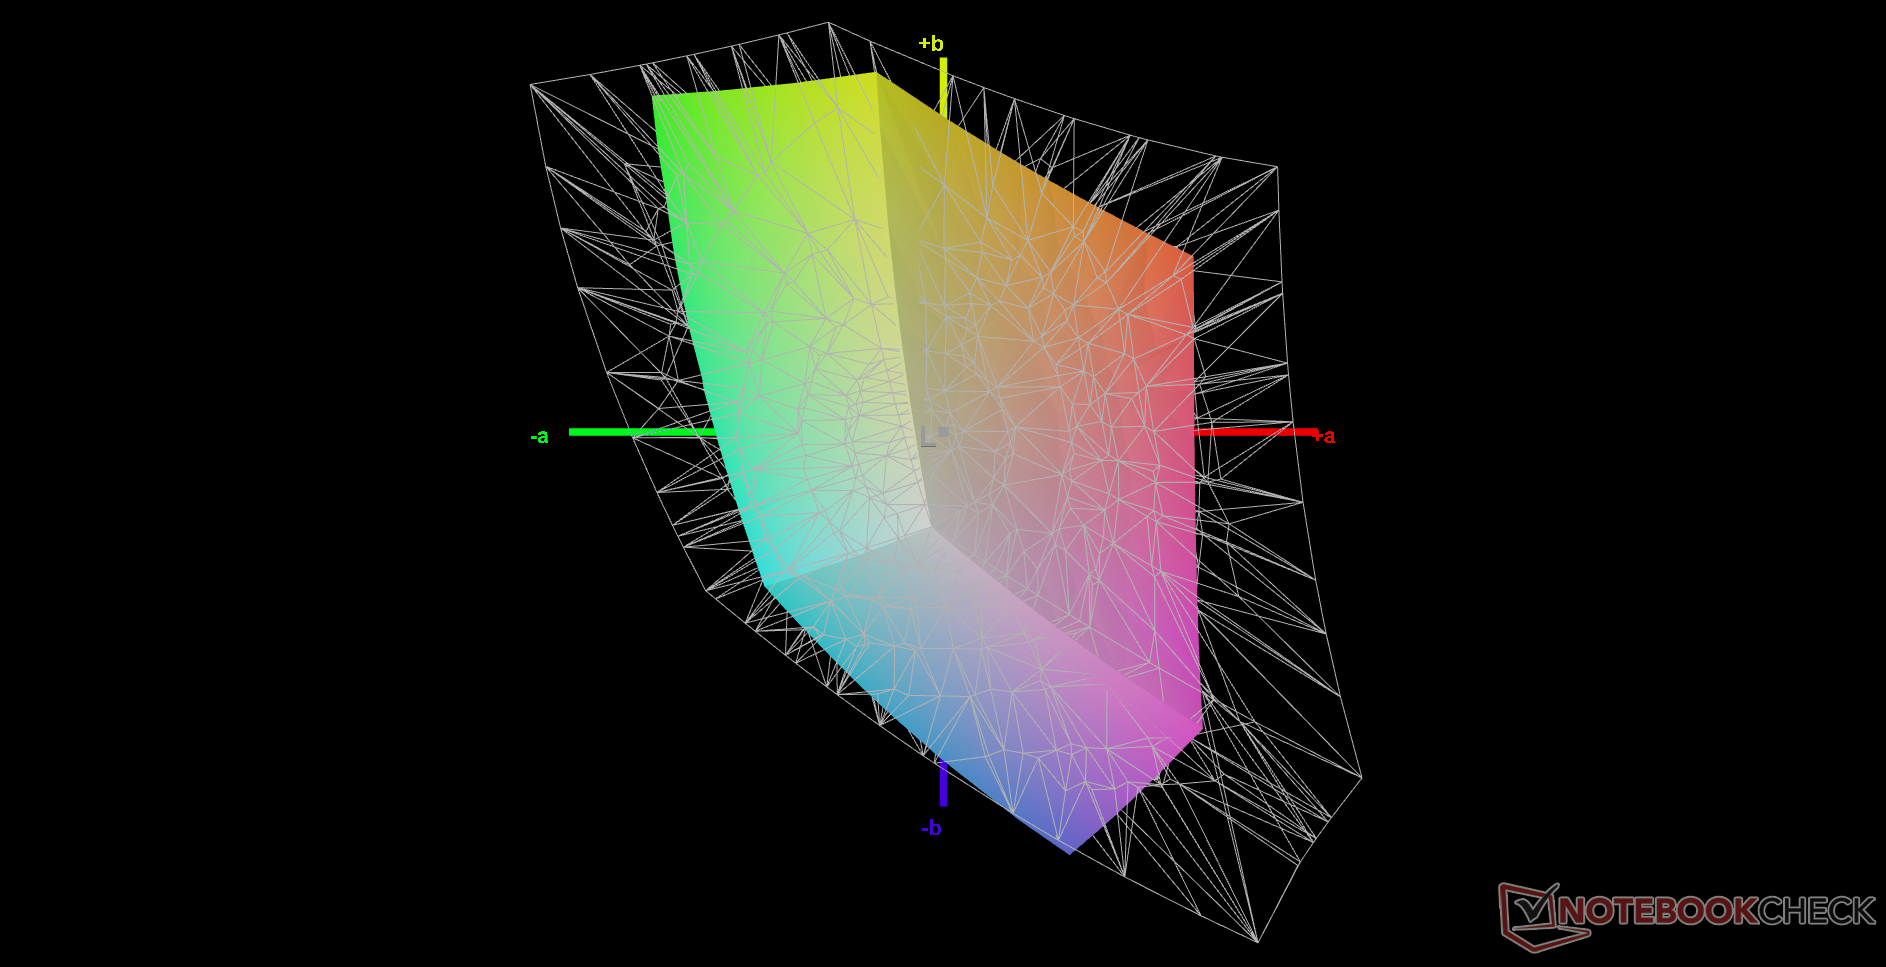
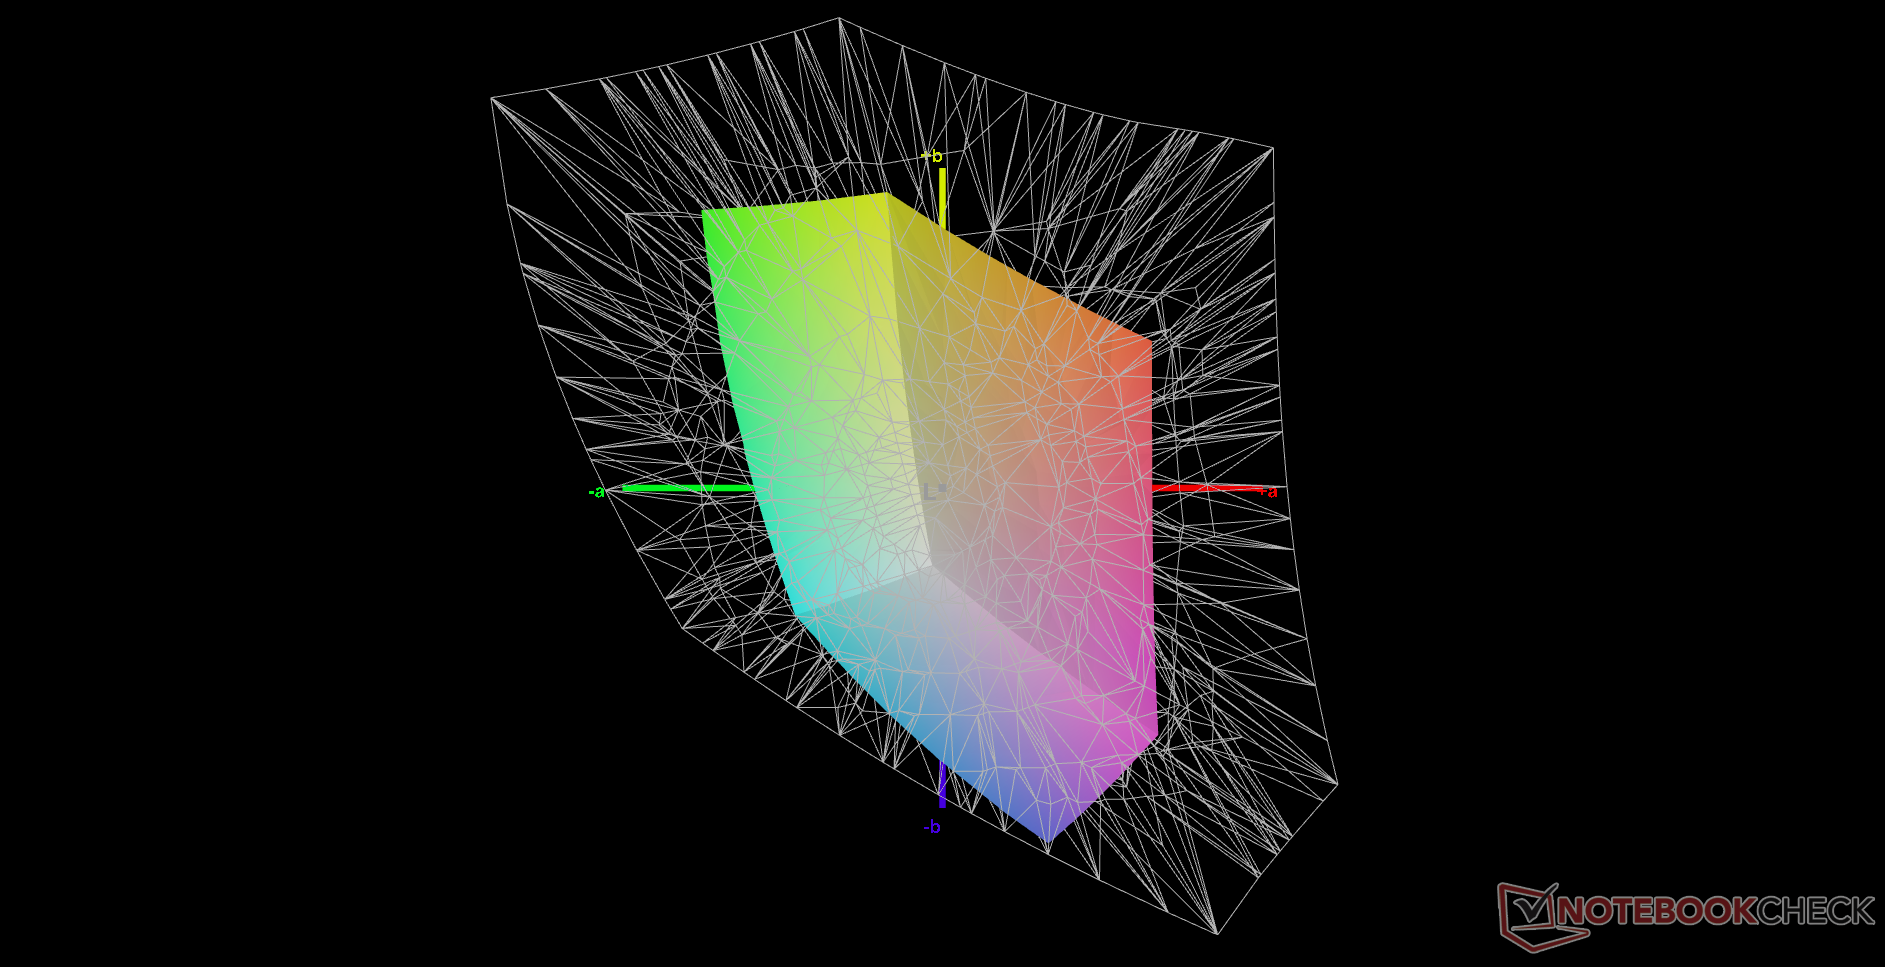
Embora nada mal fora da caixa, as cores e a escala de cinza têm espaço para melhorias. Calibrar o display nós mesmos melhoraríamos os valores médios da escala de cinza e da cor DeltaE de 3,1 e 4,39 para apenas 0,3 e 1,56, respectivamente. No entanto, as cores inevitavelmente se tornam muito mais imprecisas em níveis de saturação mais elevados devido ao limitado espaço de cores mencionado acima.
Exibir tempos de resposta
| ↔ Tempo de resposta preto para branco | ||
|---|---|---|
| 19.2 ms ... ascensão ↗ e queda ↘ combinadas | ↗ 10.8 ms ascensão | 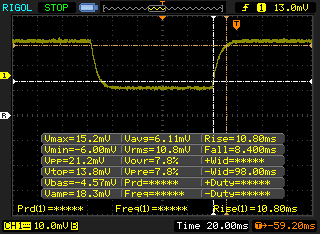 |
| ↘ 8.4 ms queda | ||
| A tela mostra boas taxas de resposta em nossos testes, mas pode ser muito lenta para jogadores competitivos. Em comparação, todos os dispositivos testados variam de 0.1 (mínimo) a 240 (máximo) ms. » 43 % de todos os dispositivos são melhores. Isso significa que o tempo de resposta medido é semelhante à média de todos os dispositivos testados (19.8 ms). | ||
| ↔ Tempo de resposta 50% cinza a 80% cinza | ||
| 26.8 ms ... ascensão ↗ e queda ↘ combinadas | ↗ 14 ms ascensão | 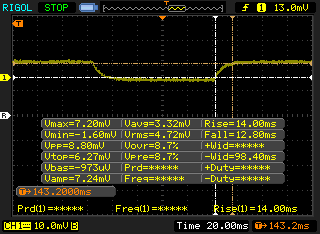 |
| ↘ 12.8 ms queda | ||
| A tela mostra taxas de resposta relativamente lentas em nossos testes e pode ser muito lenta para os jogadores. Em comparação, todos os dispositivos testados variam de 0.165 (mínimo) a 636 (máximo) ms. » 37 % de todos os dispositivos são melhores. Isso significa que o tempo de resposta medido é melhor que a média de todos os dispositivos testados (31 ms). | ||
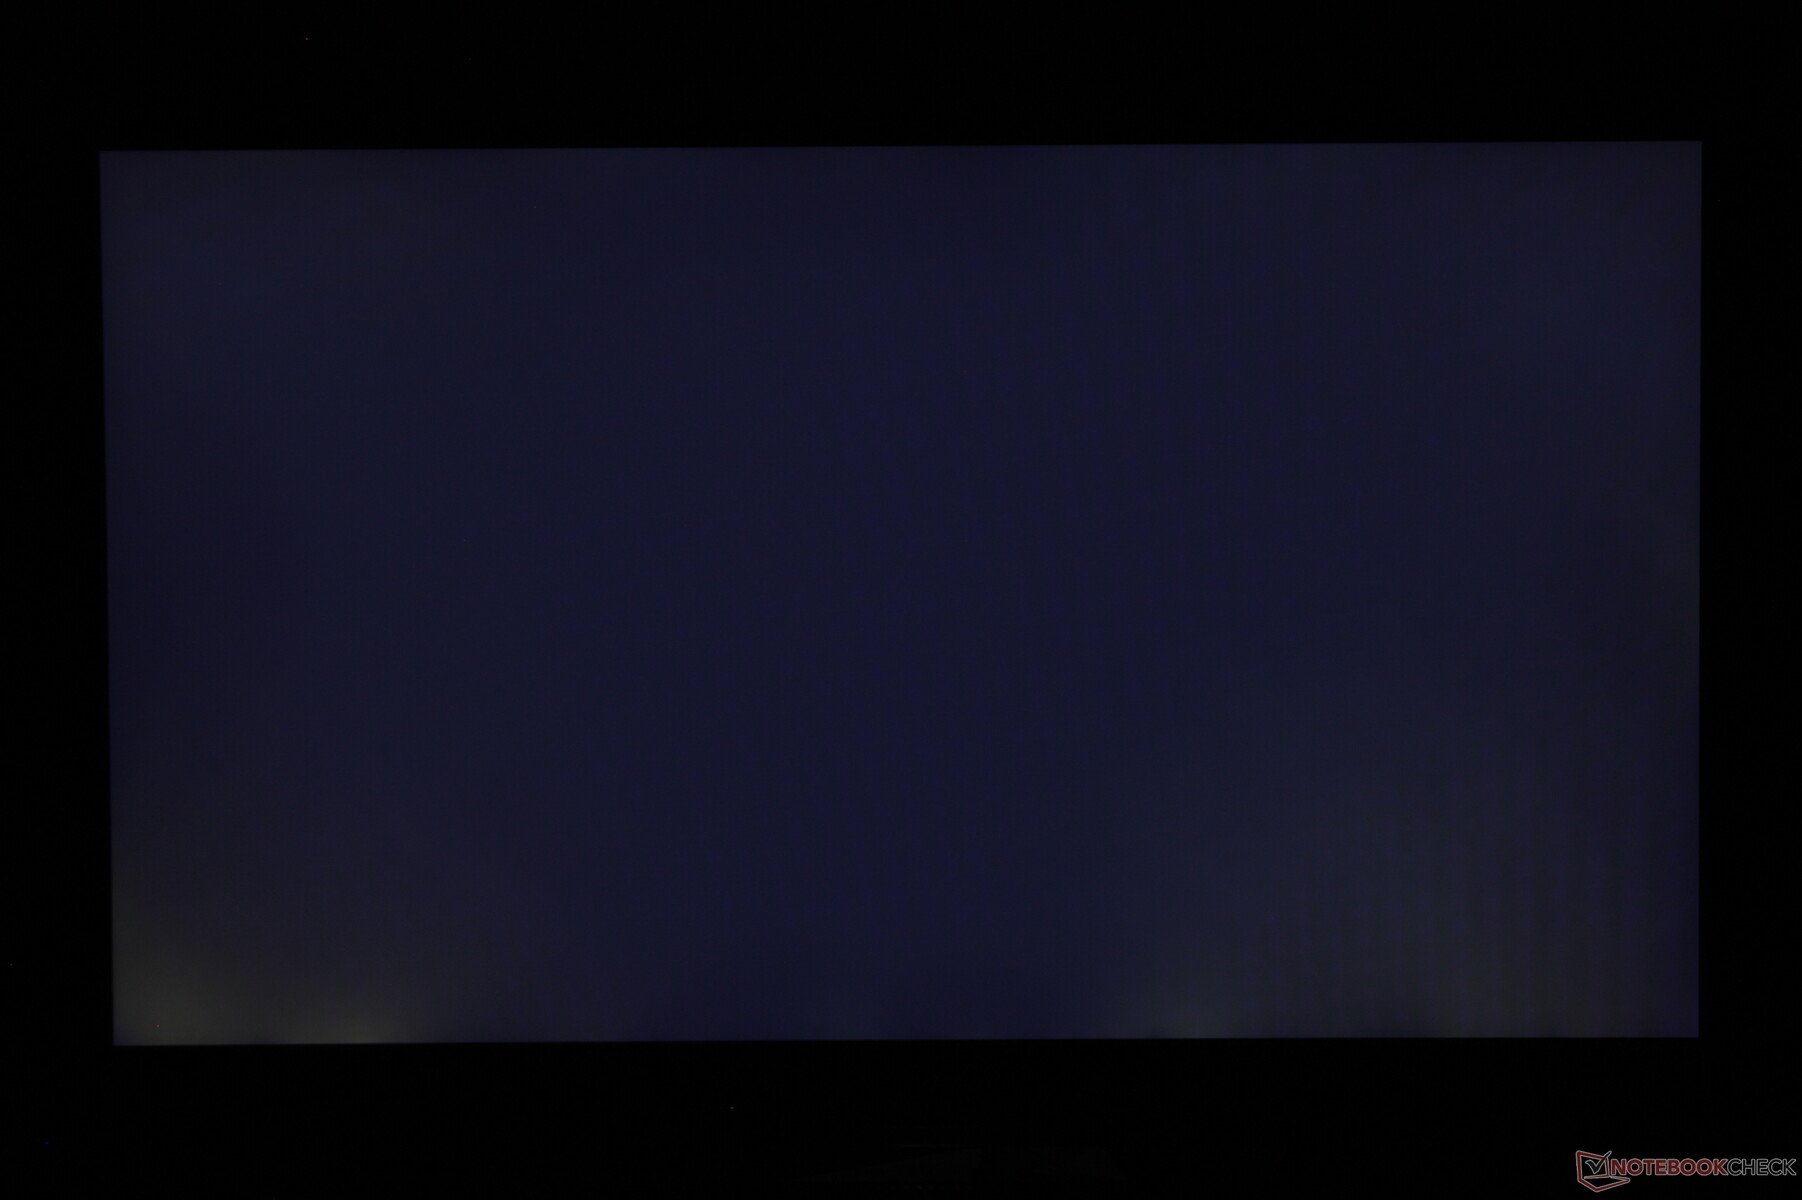
Cintilação da tela / PWM (modulação por largura de pulso)
| Tela tremeluzindo / PWM não detectado | 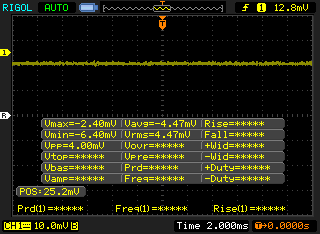 | ||
[pwm_comparison] Em comparação: 52 % de todos os dispositivos testados não usam PWM para escurecer a tela. Se PWM foi detectado, uma média de 7757 (mínimo: 5 - máximo: 343500) Hz foi medida. | |||
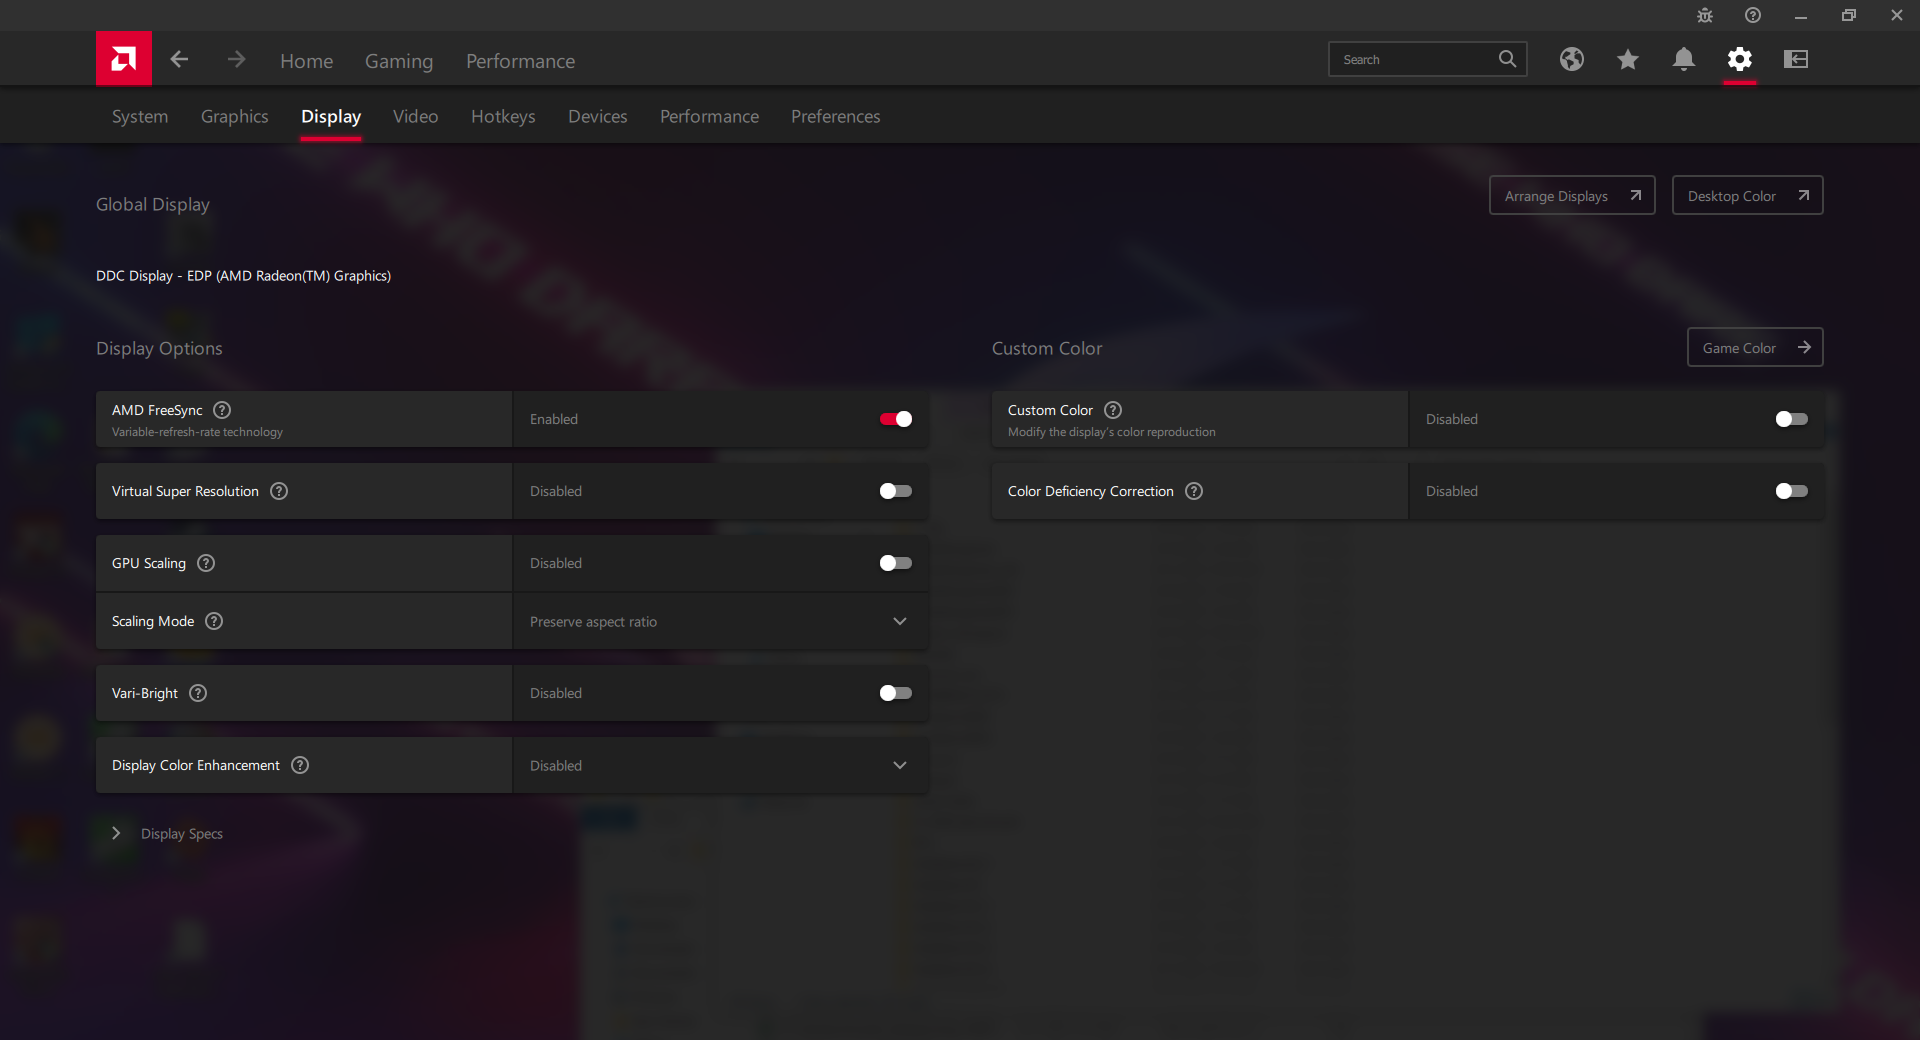
O brilho máximo é aproximadamente a média para um laptop com 17,3 polegadas e, portanto, a visibilidade externa não é nada de especial no G713. Lembre-se de desativar o AMD Vari-Bright através do software AMD Radeon ou então a luminosidade máxima cairá para apenas 175 lêndeas quando estiver ligado à bateria.
Desempenho - Processador de nível i9
Todas as configurações G713 no momento vêm apenas com CPUs AMD para o melhor ou para o pior. Enquanto as séries Zen 2 e Zen 3 podem muitas vezes superar as melhores CPUs Core-H da Intel, elas não têm suporte para PCIe 4 e Thunderbolt 4, o que pode irritar alguns gamers.
No lado gráfico, as GPUs vão desde o GeForce GTX 1650 até o RTX 3070 para apelar para uma gama muito ampla de orçamentos. Barra redimensionável e FreeSync são suportadas enquanto o Advanced Optimus não é. Uma chave manual para desativar a discreta GPU Nvidia pode ser encontrada através do software Asus Armoury Crate.
Nossa unidade foi configurada para o modo Turbo antes de executar qualquer benchmark de desempenho abaixo para obter as melhores pontuações possíveis.
Processador
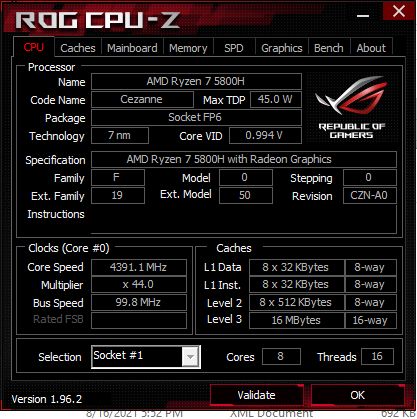
O desempenho bruto da CPU é excelente para rivalizar com o Core i9 11th gen Tiger Lake-H processadores da Intel. Os concorrentes Núcleo i9-11900HA AMD, por exemplo, oferece um desempenho semelhante de multifios, mas um pouco mais rápido de rosca única, como de costume, quando se compara as CPUs Intel e AMD. Gen-to-gen, o Ryzen 7 5800H é apenas marginalmente mais rápido do que o Ryzen 7 4800H uma vez que a série Zen 2 H já era um grande salto sobre a Ryzen 7 3750H
A sustentabilidade do desempenho também é excelente, sem queda nas pontuações ao longo do tempo ao executar o CineBench R15 xT em um loop contínuo. Entretanto, é difícil recomendar o Ryzen 9 5900HX sobre o Ryzen 7 5800H, uma vez que eles têm um desempenho quase idêntico.
Cinebench R15 Multi Loop
Cinebench R23: Multi Core | Single Core
Cinebench R15: CPU Multi 64Bit | CPU Single 64Bit
Blender: v2.79 BMW27 CPU
7-Zip 18.03: 7z b 4 -mmt1 | 7z b 4
Geekbench 5.5: Single-Core | Multi-Core
HWBOT x265 Benchmark v2.2: 4k Preset
LibreOffice : 20 Documents To PDF
R Benchmark 2.5: Overall mean
| Cinebench R23 / Multi Core | |
| Asus Strix Scar 17 G733QSA-XS99 | |
| Asus ROG Strix G17 G713QE-RB74 | |
| Asus ROG Zephyrus S17 GX703HSD | |
| Acer Nitro 5 AN517-41-R9S5 | |
| Média AMD Ryzen 7 5800H (8812 - 13214, n=29) | |
| Medion Erazer Beast X20 | |
| Huawei MateBook D 16-53011VFJ | |
| Cinebench R23 / Single Core | |
| Asus ROG Zephyrus S17 GX703HSD | |
| Asus Strix Scar 17 G733QSA-XS99 | |
| Acer Nitro 5 AN517-41-R9S5 | |
| Asus ROG Strix G17 G713QE-RB74 | |
| Média AMD Ryzen 7 5800H (1294 - 1441, n=29) | |
| Medion Erazer Beast X20 | |
| Huawei MateBook D 16-53011VFJ | |
Cinebench R23: Multi Core | Single Core
Cinebench R15: CPU Multi 64Bit | CPU Single 64Bit
Blender: v2.79 BMW27 CPU
7-Zip 18.03: 7z b 4 -mmt1 | 7z b 4
Geekbench 5.5: Single-Core | Multi-Core
HWBOT x265 Benchmark v2.2: 4k Preset
LibreOffice : 20 Documents To PDF
R Benchmark 2.5: Overall mean
* ... menor é melhor
Desempenho do sistema
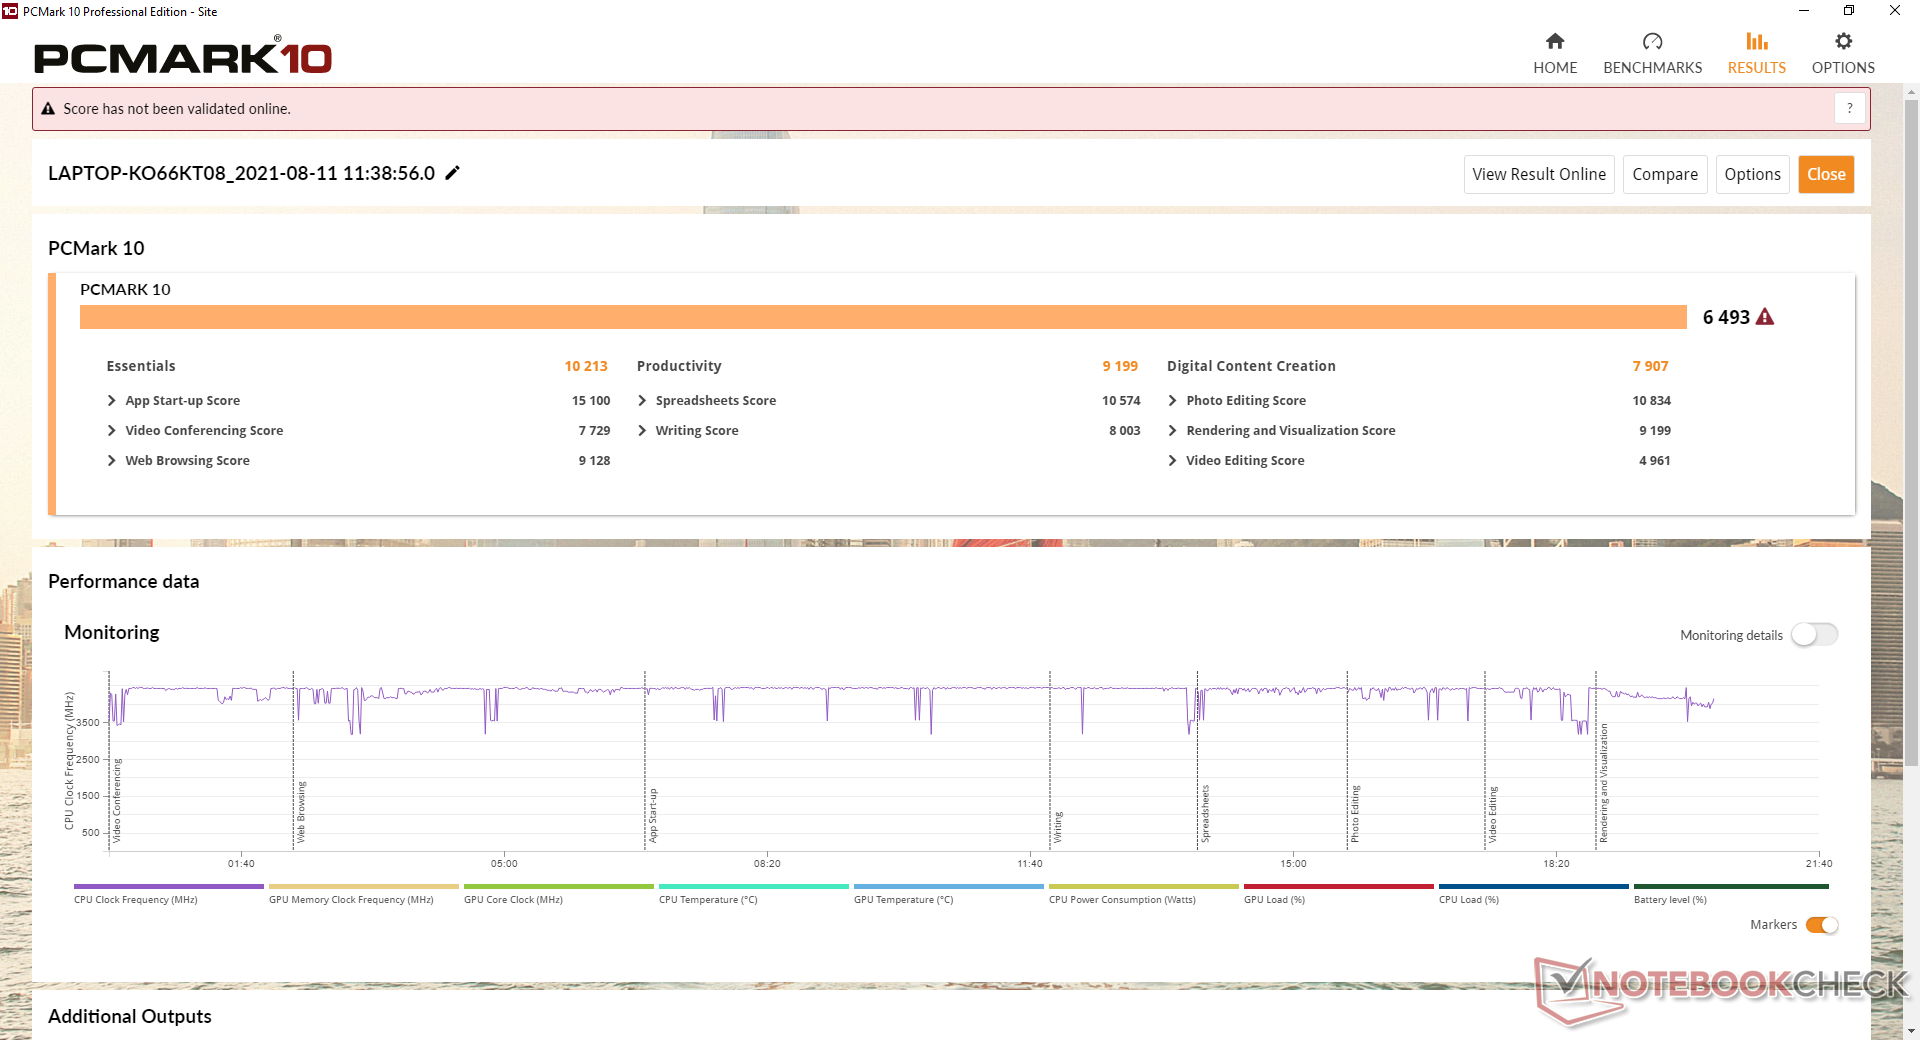
Os resultados do PCMark 10 são ligeiramente superiores ao esperado, provavelmente devido à CPU Ryzen 7 muito rápida, mas o RTX 3050 Ti mais lento traz tudo para baixo. Pelo menos os resultados são consistentemente mais altos do que o MSI Alfa 17 alimentado somente por hardware AMD.
| PCMark 10 / Score | |
| Asus Strix Scar 17 G733QSA-XS99 | |
| MSI Katana GF76 11UE | |
| Asus ROG Strix G17 G713QE-RB74 | |
| Média AMD Ryzen 7 5800H, NVIDIA GeForce RTX 3050 Ti Laptop GPU (6098 - 6493, n=2) | |
| MSI Alpha 17 A4DEK | |
| Acer Nitro 5 AN517-53-54DQ | |
| Asus Strix G17 G712LWS | |
| PCMark 10 / Essentials | |
| Asus Strix Scar 17 G733QSA-XS99 | |
| Asus ROG Strix G17 G713QE-RB74 | |
| Média AMD Ryzen 7 5800H, NVIDIA GeForce RTX 3050 Ti Laptop GPU (9631 - 10213, n=2) | |
| MSI Katana GF76 11UE | |
| Asus Strix G17 G712LWS | |
| Acer Nitro 5 AN517-53-54DQ | |
| MSI Alpha 17 A4DEK | |
| PCMark 10 / Productivity | |
| Asus Strix Scar 17 G733QSA-XS99 | |
| Asus ROG Strix G17 G713QE-RB74 | |
| Média AMD Ryzen 7 5800H, NVIDIA GeForce RTX 3050 Ti Laptop GPU (8625 - 9199, n=2) | |
| MSI Katana GF76 11UE | |
| Acer Nitro 5 AN517-53-54DQ | |
| Asus Strix G17 G712LWS | |
| MSI Alpha 17 A4DEK | |
| PCMark 10 / Digital Content Creation | |
| Asus Strix Scar 17 G733QSA-XS99 | |
| MSI Katana GF76 11UE | |
| MSI Alpha 17 A4DEK | |
| Asus ROG Strix G17 G713QE-RB74 | |
| Média AMD Ryzen 7 5800H, NVIDIA GeForce RTX 3050 Ti Laptop GPU (7408 - 7907, n=2) | |
| Acer Nitro 5 AN517-53-54DQ | |
| Asus Strix G17 G712LWS | |
| PCMark 10 Score | 6493 pontos | |
Ajuda | ||
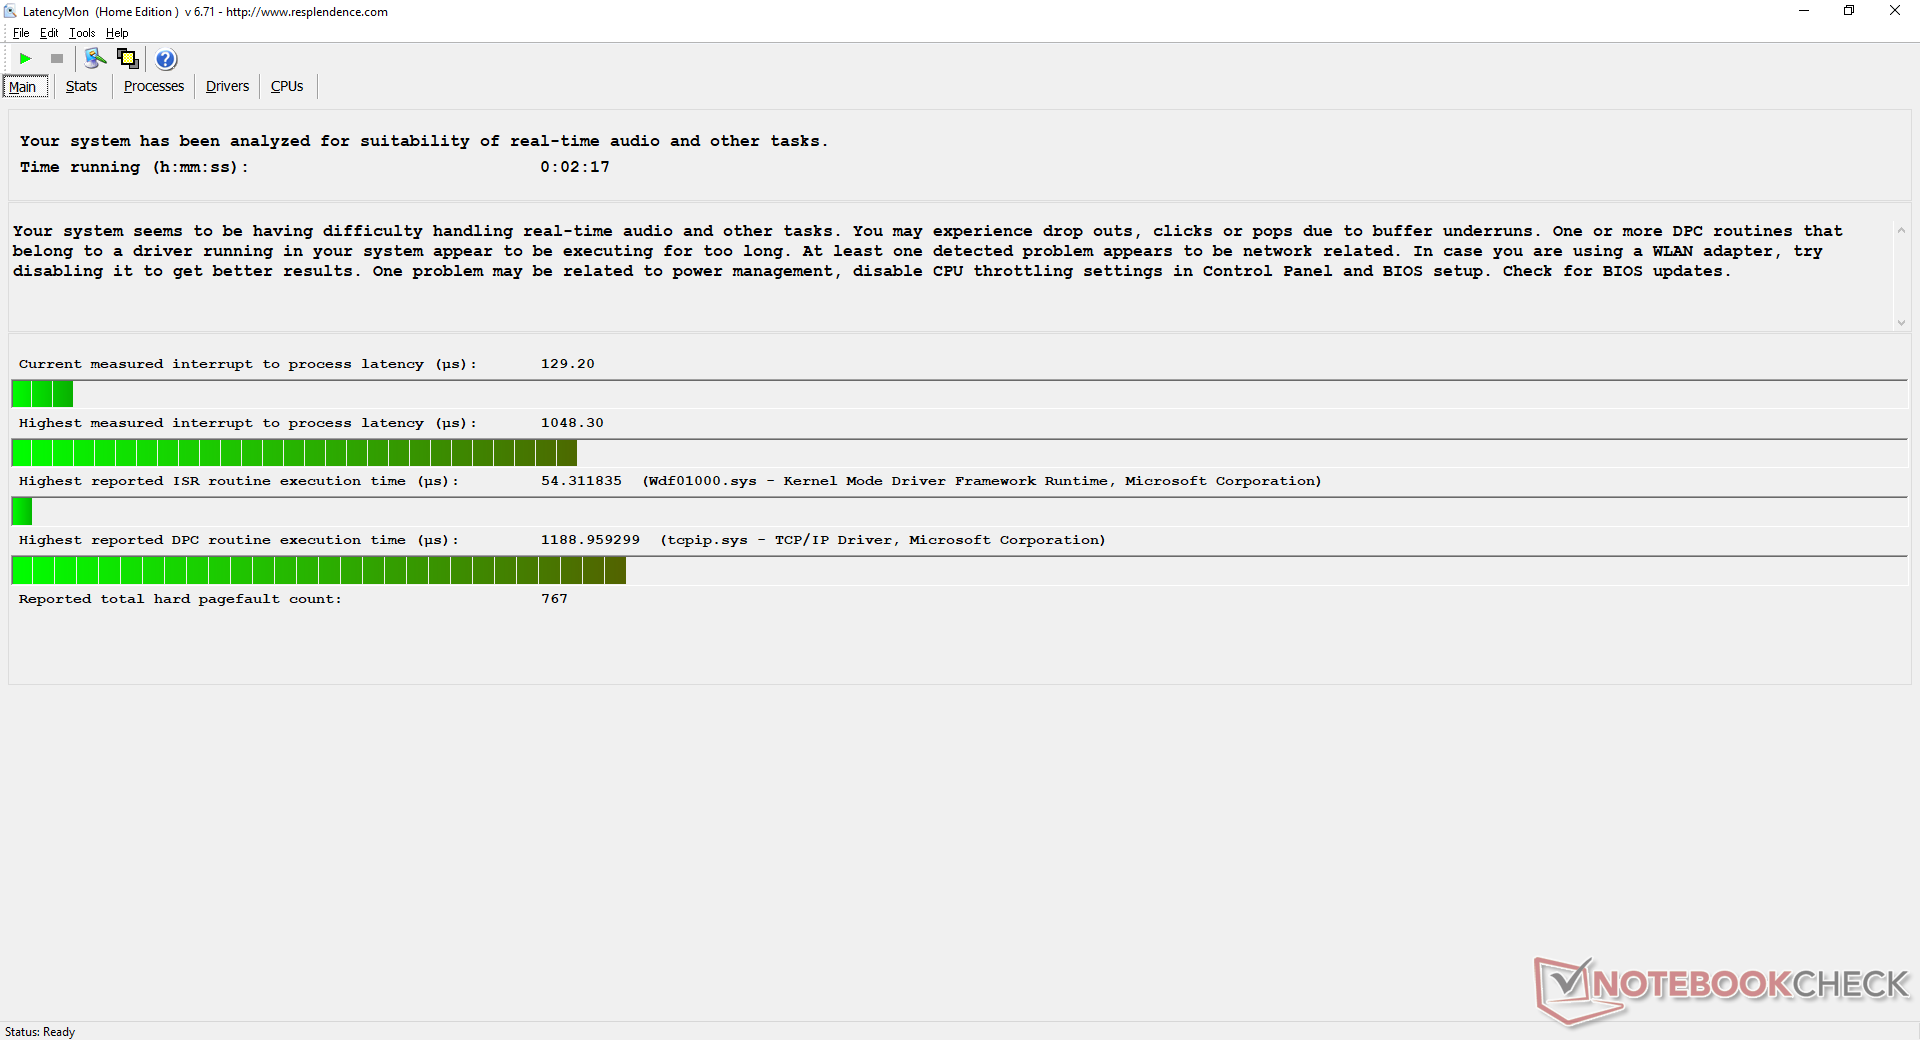
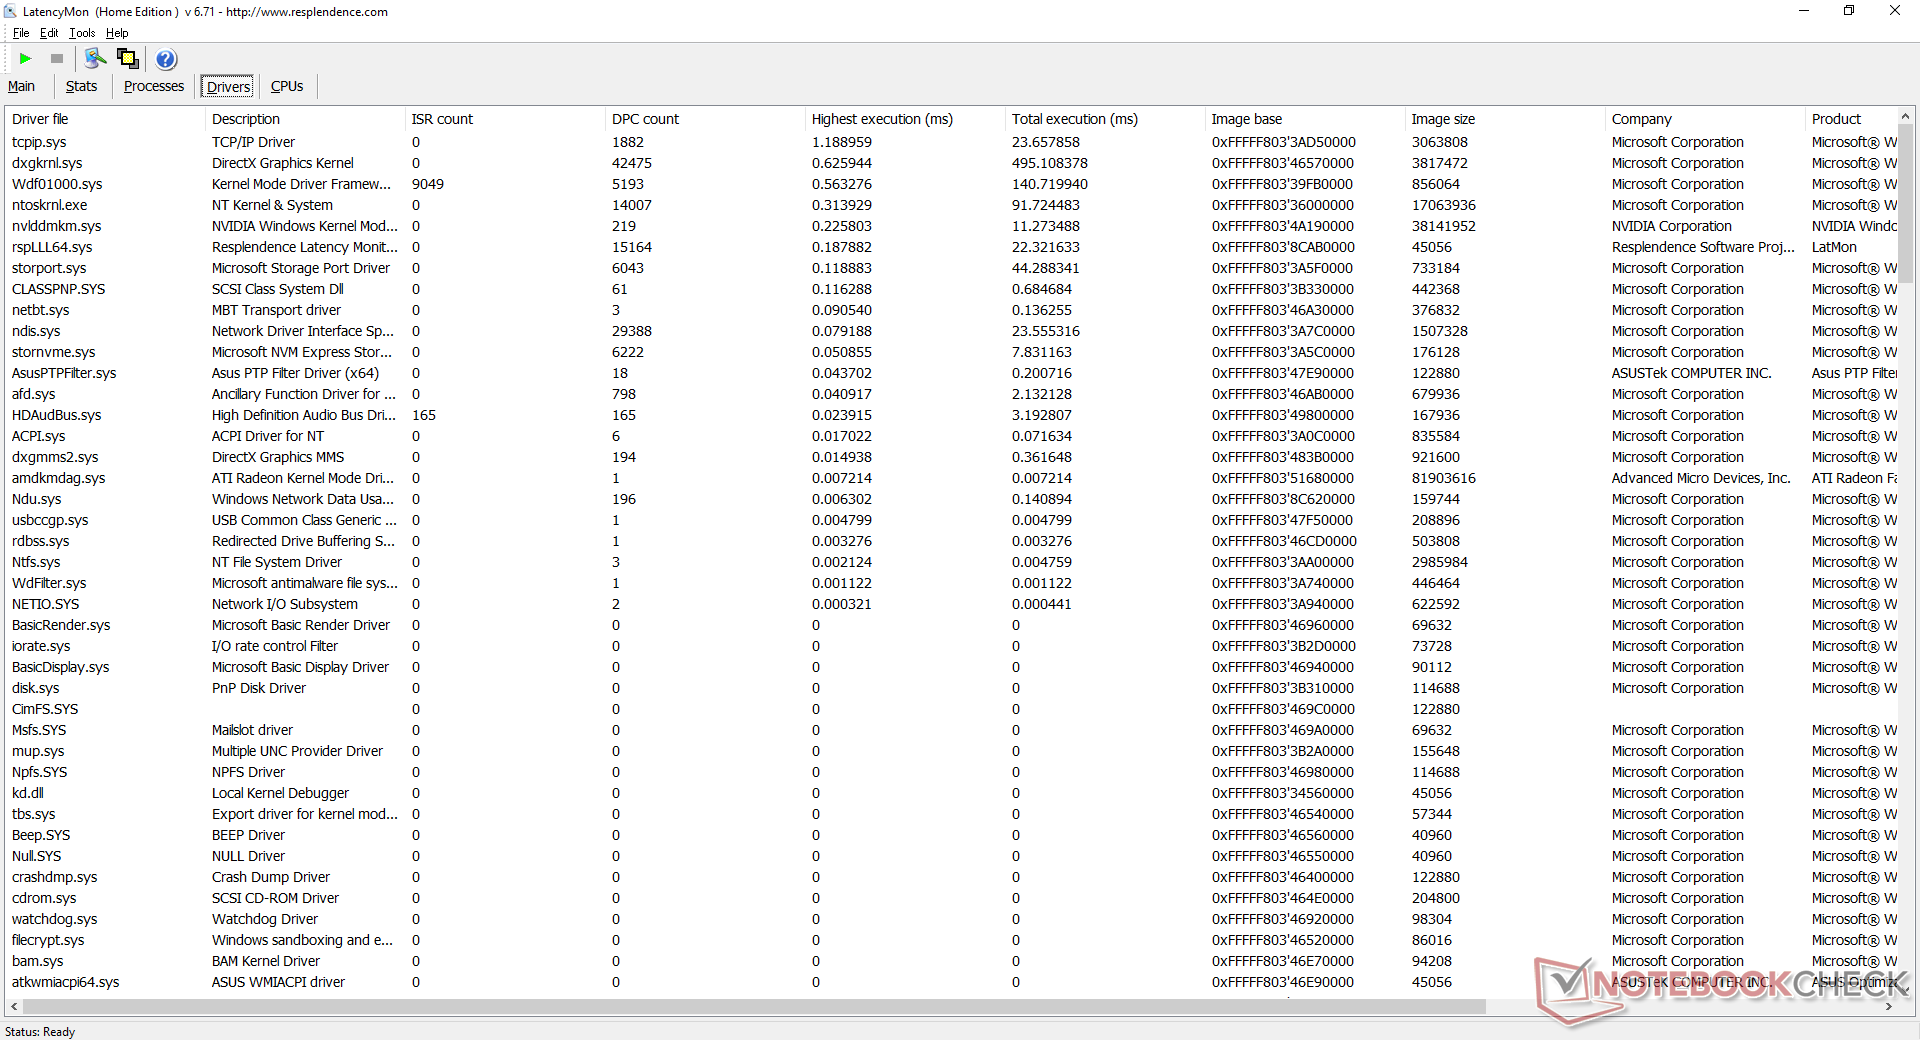
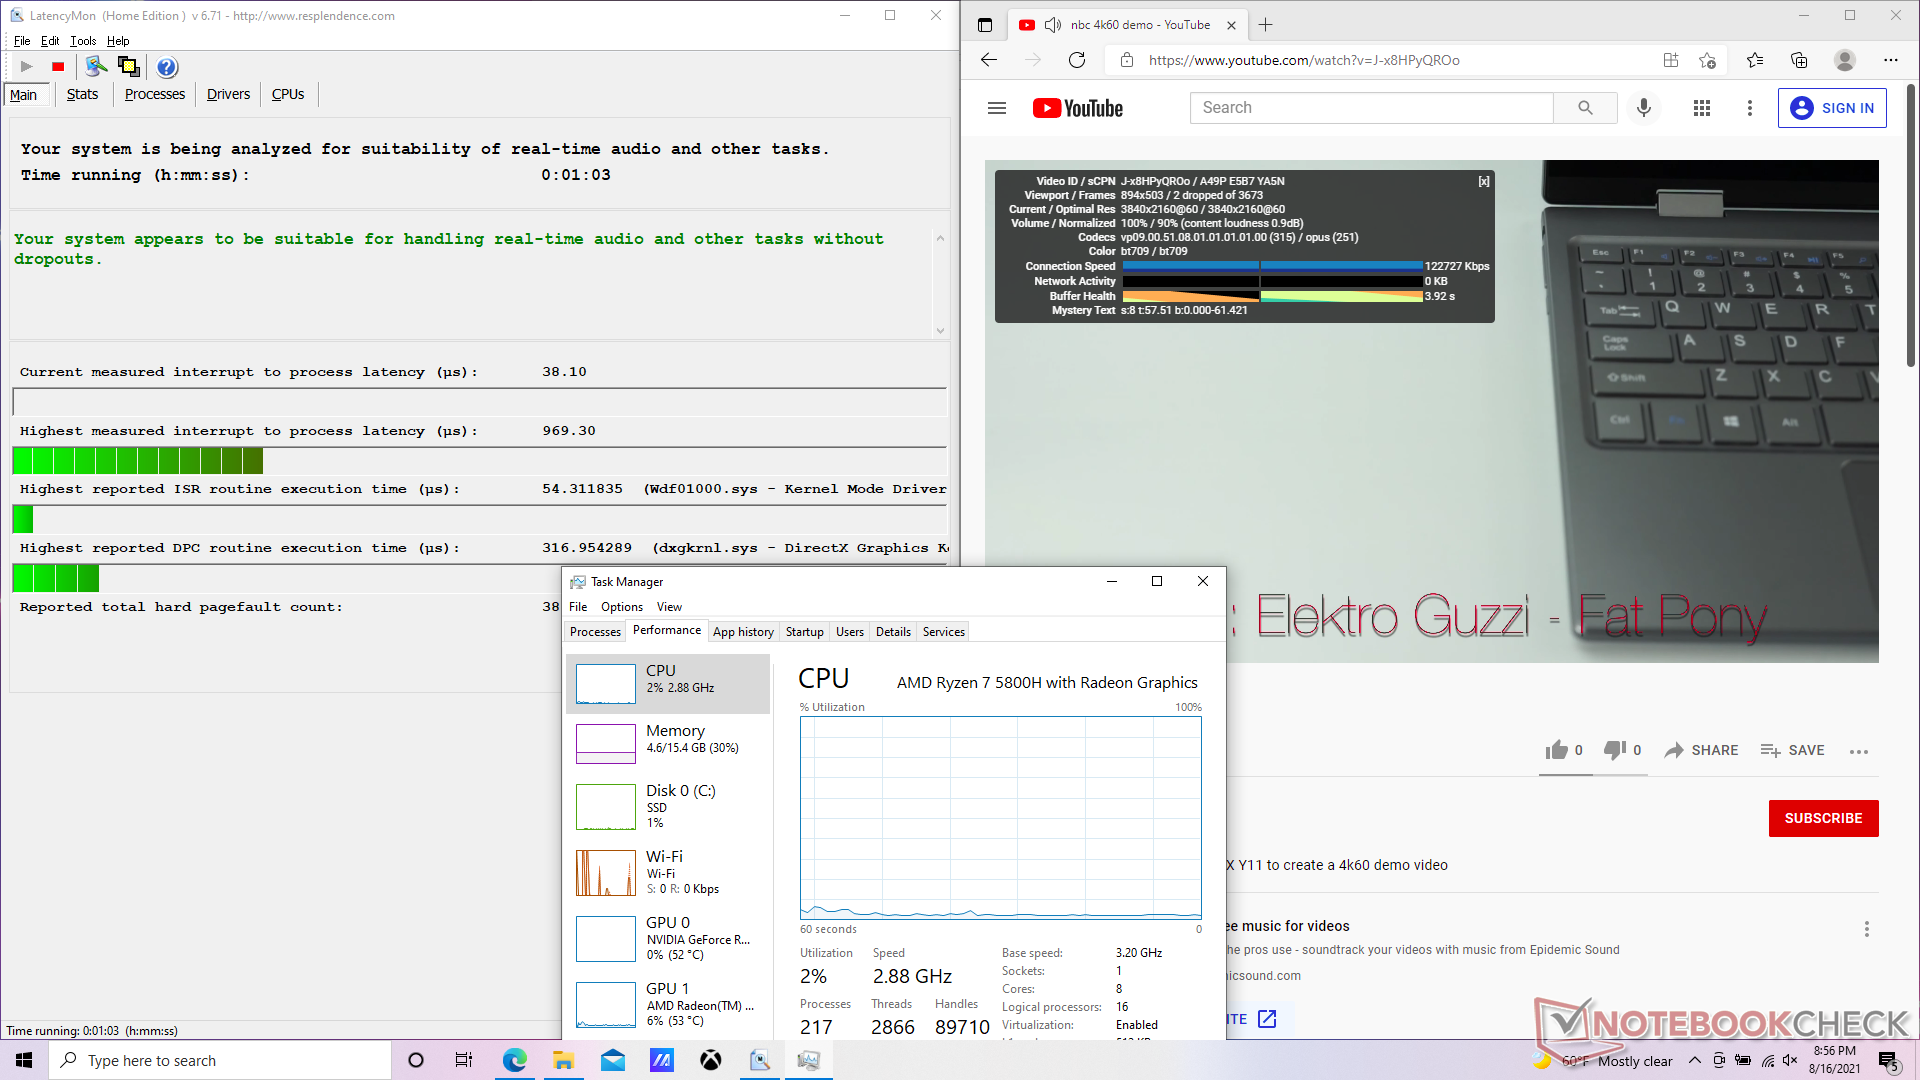
Latência do DPC
LatencyMon mostra pequenos problemas de latência ao abrir várias abas do navegador em nossa página inicial. A reprodução do vídeo de 4K a 60 FPS é, de outra forma, suave, com apenas 2 quadros descartados durante nosso vídeo de teste de minutos.
| DPC Latencies / LatencyMon - interrupt to process latency (max), Web, Youtube, Prime95 | |
| MSI Alpha 17 A4DEK | |
| MSI Katana GF76 11UE | |
| Asus Strix G17 G712LWS | |
| Acer Nitro 5 AN517-53-54DQ | |
| Asus ROG Strix G17 G713QE-RB74 | |
| Asus Strix Scar 17 G733QSA-XS99 | |
* ... menor é melhor
Dispositivos de armazenamento - Sem acionamentos de 2,5 polegadas
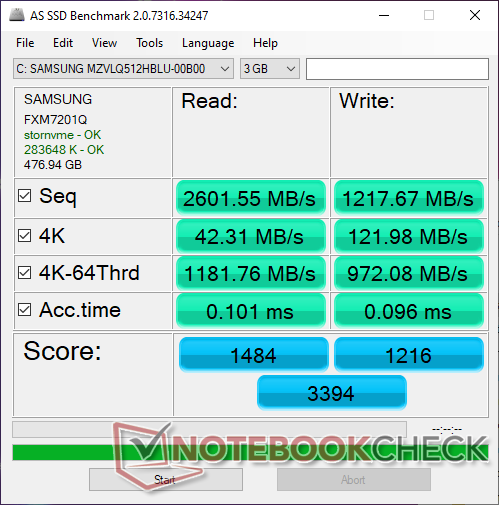
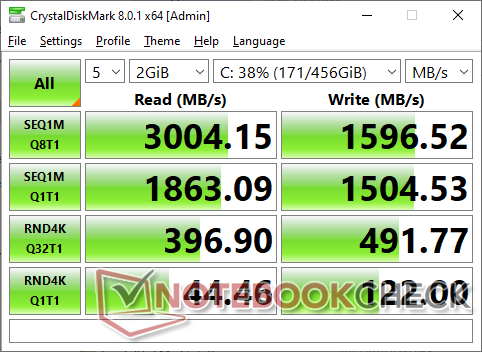
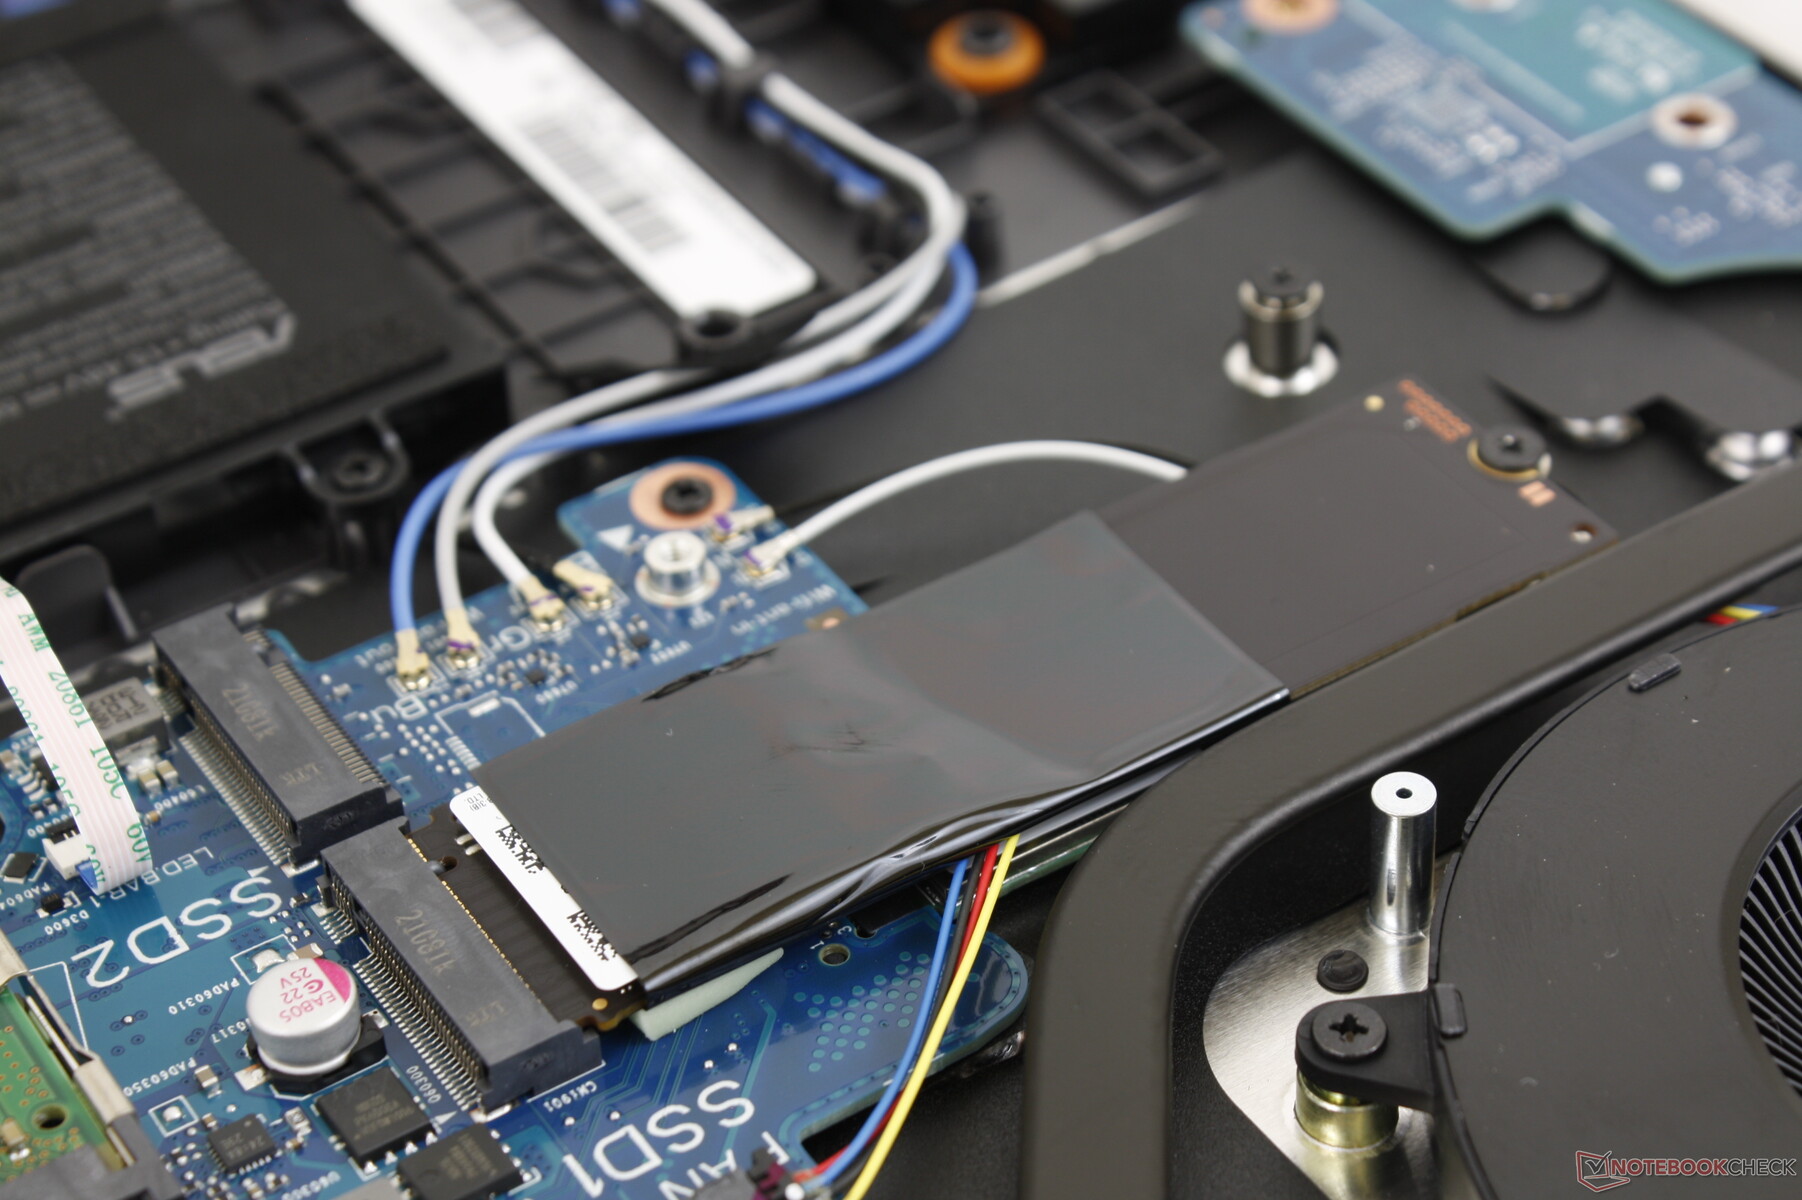
O Samsung PM991a MZVLQ512HBLU é um SSD de médio alcance superior PCIe 3 NVMe com taxas teóricas sequenciais de leitura e escrita de 3100 MB/s e 1800 MB/s, respectivamente, para ser mais lento que o PM981a que pode atingir velocidades de até 3500 MB/s e 2900 MB/s. Os proprietários podem instalar até dois SSDs M.2 NVMe internos.
| Asus ROG Strix G17 G713QE-RB74 Samsung PM991 MZVLQ512HBLU | Acer Nitro 5 AN517-53-54DQ SK Hynix BC711 HFM512GD3HX015N | MSI Katana GF76 11UE Kingston OM8PCP3512F-AB | Asus Strix G17 G712LWS Intel SSD 660p 1TB SSDPEKNW010T8 | Lenovo IdeaPad 5 Pro 16IHU6 Samsung SSD PM981a MZVLB512HBJQ | |
|---|---|---|---|---|---|
| AS SSD | 60% | -42% | -11% | 43% | |
| Seq Read (MB/s) | 2602 | 2859 10% | 1704 -35% | 1778 -32% | 2541 -2% |
| Seq Write (MB/s) | 1218 | 2693 121% | 716 -41% | 1478 21% | 2555 110% |
| 4K Read (MB/s) | 42.31 | 68.8 63% | 37.77 -11% | 49.76 18% | 56 32% |
| 4K Write (MB/s) | 122 | 154.5 27% | 66 -46% | 117.9 -3% | 129.6 6% |
| 4K-64 Read (MB/s) | 1182 | 1860 57% | 441.2 -63% | 591 -50% | 1633 38% |
| 4K-64 Write (MB/s) | 972 | 1680 73% | 735 -24% | 875 -10% | 1863 92% |
| Access Time Read * (ms) | 0.101 | 0.043 57% | 0.191 -89% | 0.082 19% | 0.077 24% |
| Access Time Write * (ms) | 0.096 | 0.028 71% | 0.053 45% | 0.041 57% | 0.029 70% |
| Score Read (Points) | 1484 | 2214 49% | 649 -56% | 818 -45% | 1944 31% |
| Score Write (Points) | 1216 | 2104 73% | 872 -28% | 1140 -6% | 2248 85% |
| Score Total (Points) | 3394 | 5451 61% | 1816 -46% | 2377 -30% | 5192 53% |
| Copy ISO MB/s (MB/s) | 1538 | 912 -41% | 1495 -3% | 2246 46% | |
| Copy Program MB/s (MB/s) | 805 | 278.9 -65% | 446 -45% | 861 7% | |
| Copy Game MB/s (MB/s) | 1418 | 144.6 -90% | 697 -51% | 1552 9% | |
| CrystalDiskMark 5.2 / 6 | 58% | -19% | 4% | 43% | |
| Write 4K (MB/s) | 120.8 | 206.1 71% | 107.3 -11% | 141.1 17% | 203 68% |
| Read 4K (MB/s) | 44.19 | 77.8 76% | 45.46 3% | 60.9 38% | 52.3 18% |
| Write Seq (MB/s) | 1518 | 2842 87% | 978 -36% | 1681 11% | 2138 41% |
| Read Seq (MB/s) | 1828 | 2552 40% | 1255 -31% | 1602 -12% | 1974 8% |
| Write 4K Q32T1 (MB/s) | 492.5 | 583 18% | 579 18% | 406.6 -17% | 640 30% |
| Read 4K Q32T1 (MB/s) | 390.7 | 663 70% | 299.6 -23% | 470.2 20% | 707 81% |
| Write Seq Q32T1 (MB/s) | 1602 | 3014 88% | 978 -39% | 1759 10% | 2973 86% |
| Read Seq Q32T1 (MB/s) | 3086 | 3556 15% | 1977 -36% | 1932 -37% | 3559 15% |
| Média Total (Programa/Configurações) | 59% /
59% | -31% /
-34% | -4% /
-6% | 43% /
43% |
* ... menor é melhor

Disk Throttling: DiskSpd Read Loop, Queue Depth 8
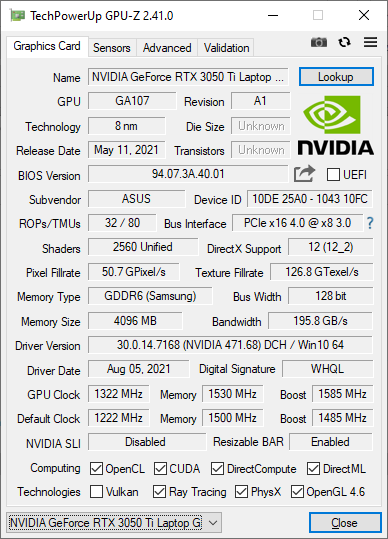
Desempenho da GPU - Mais lento que o do GeForce GTX 1660 Ti
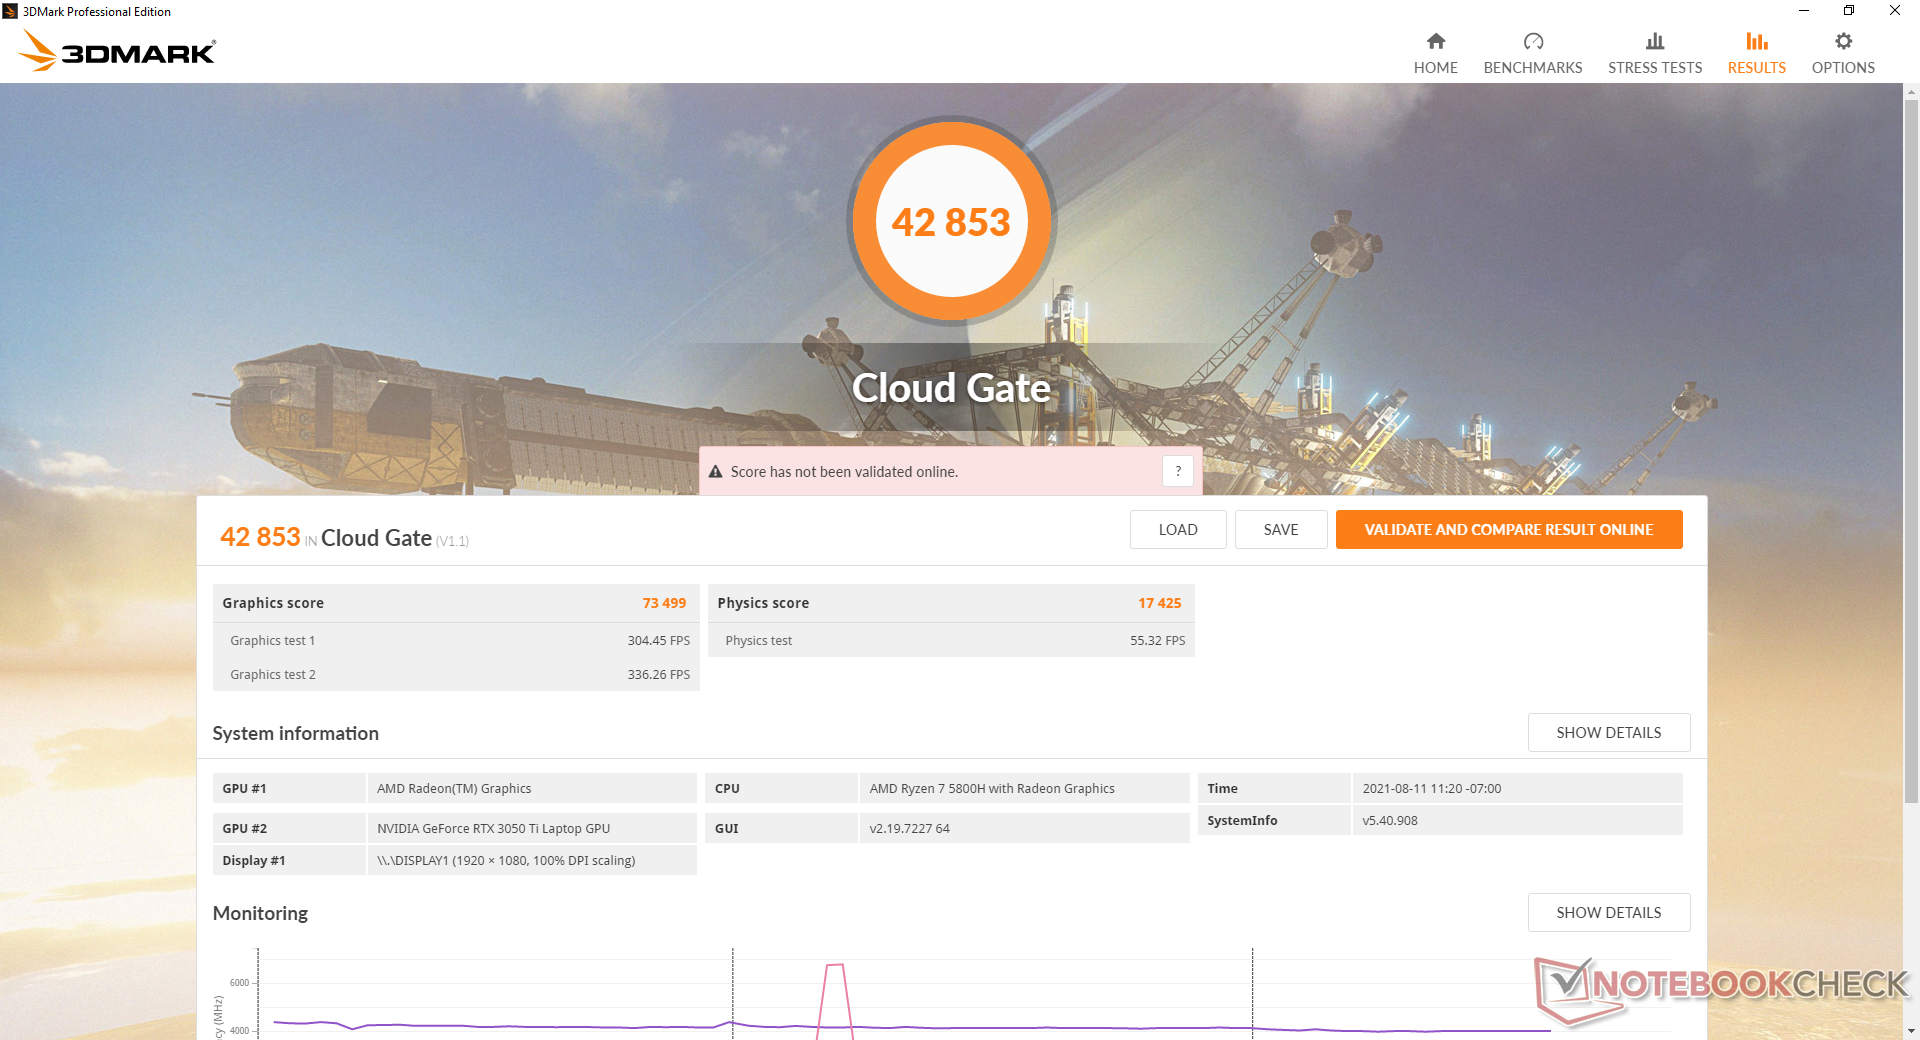
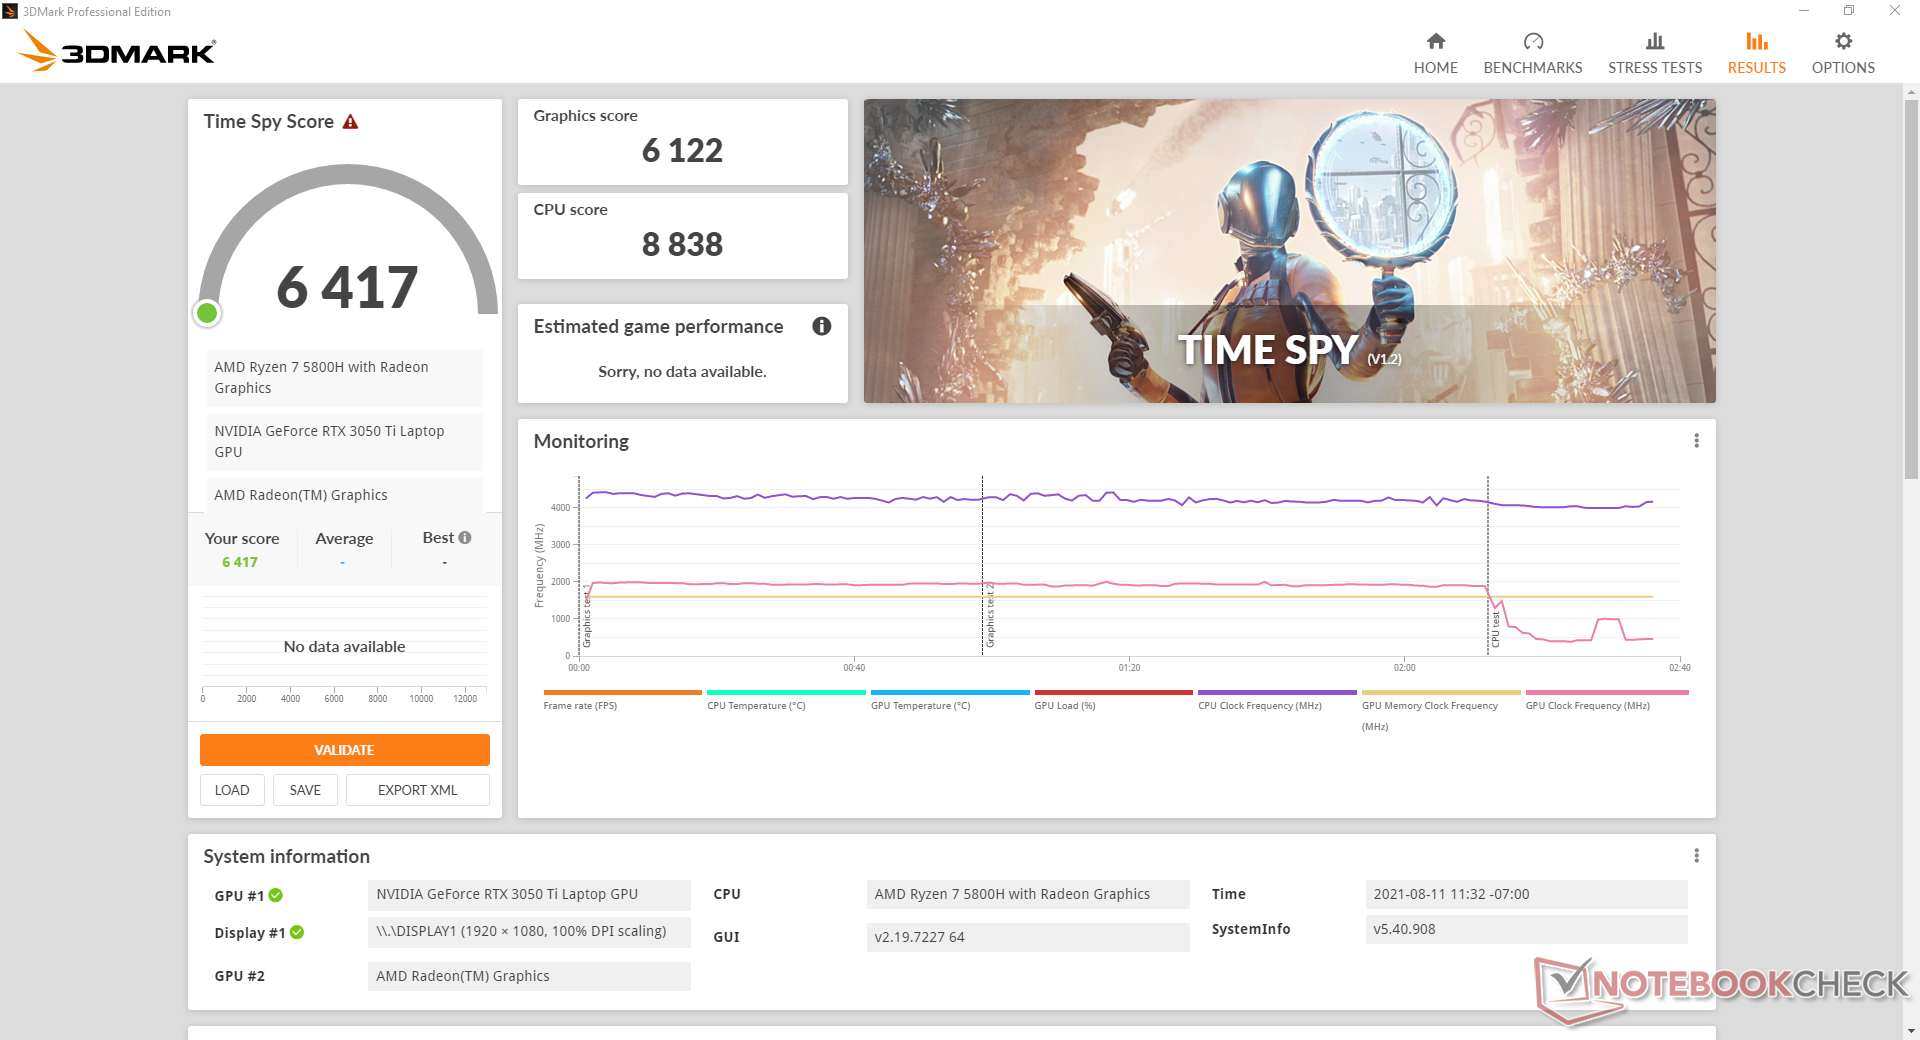
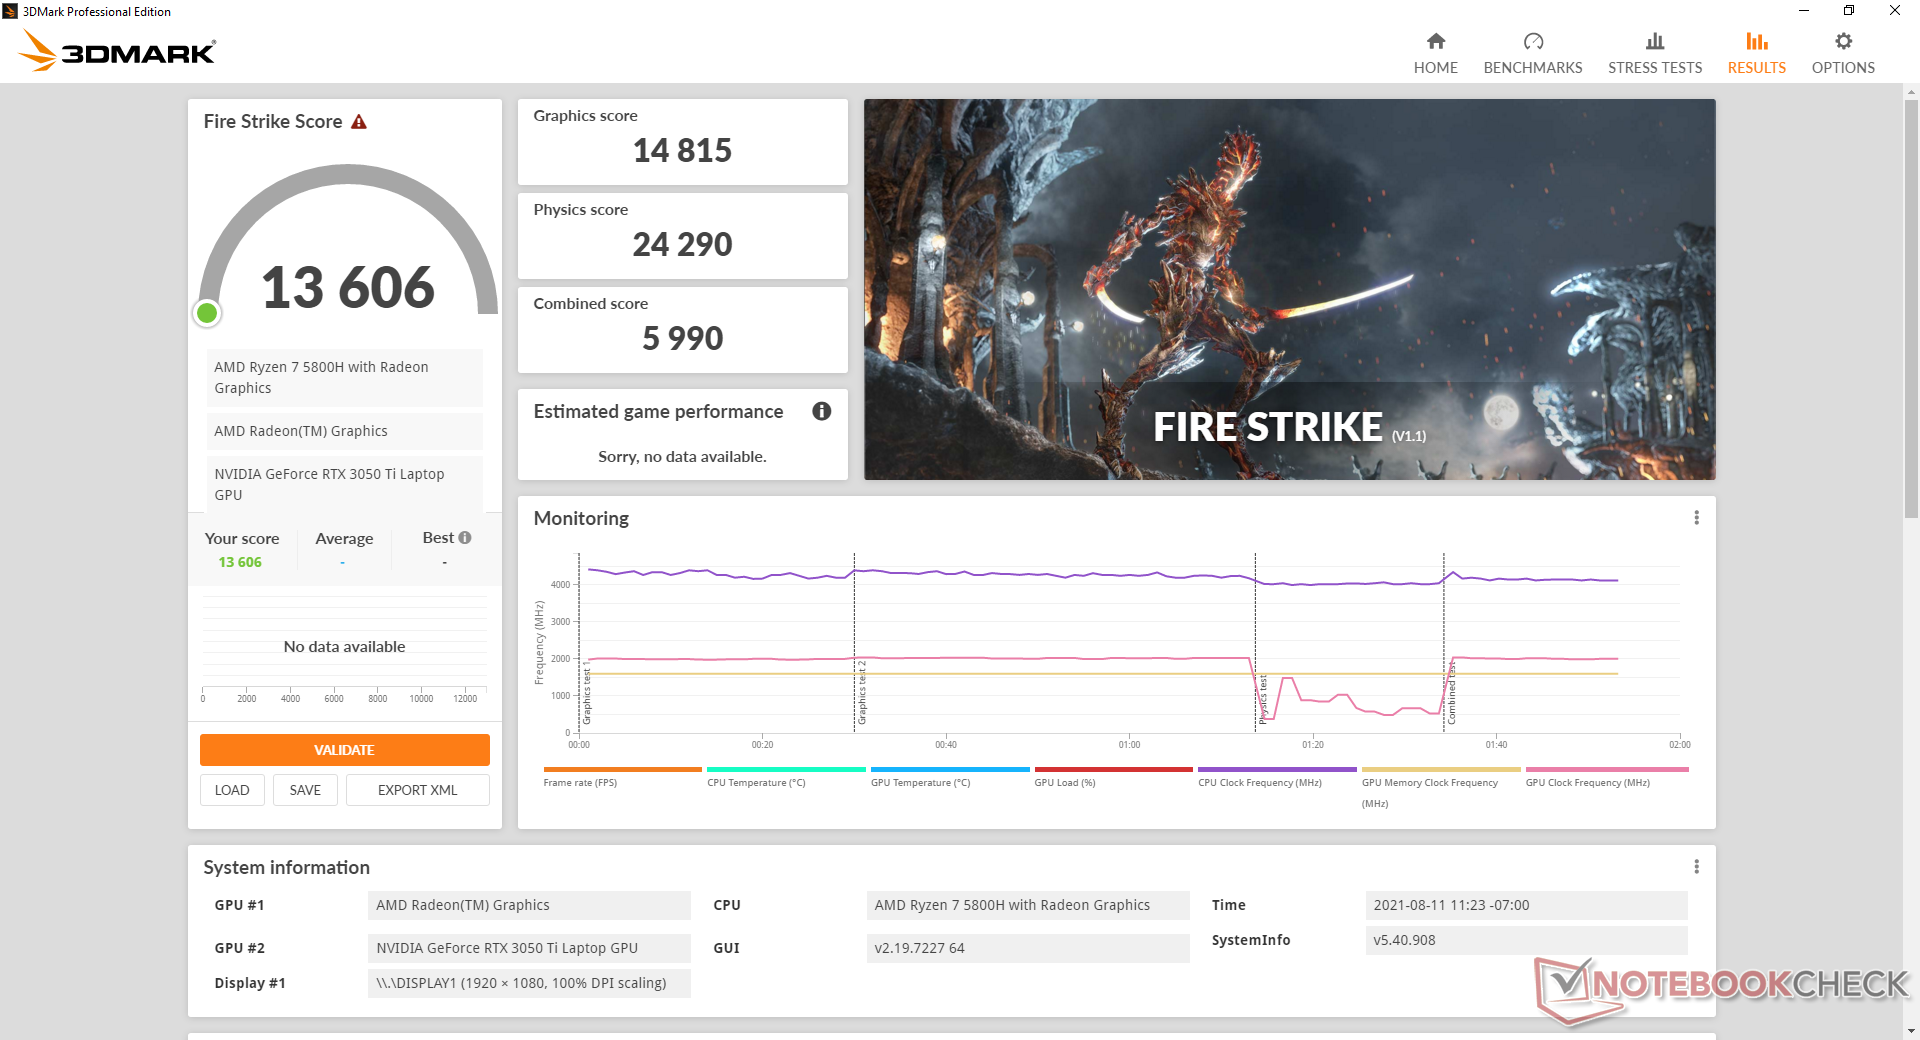
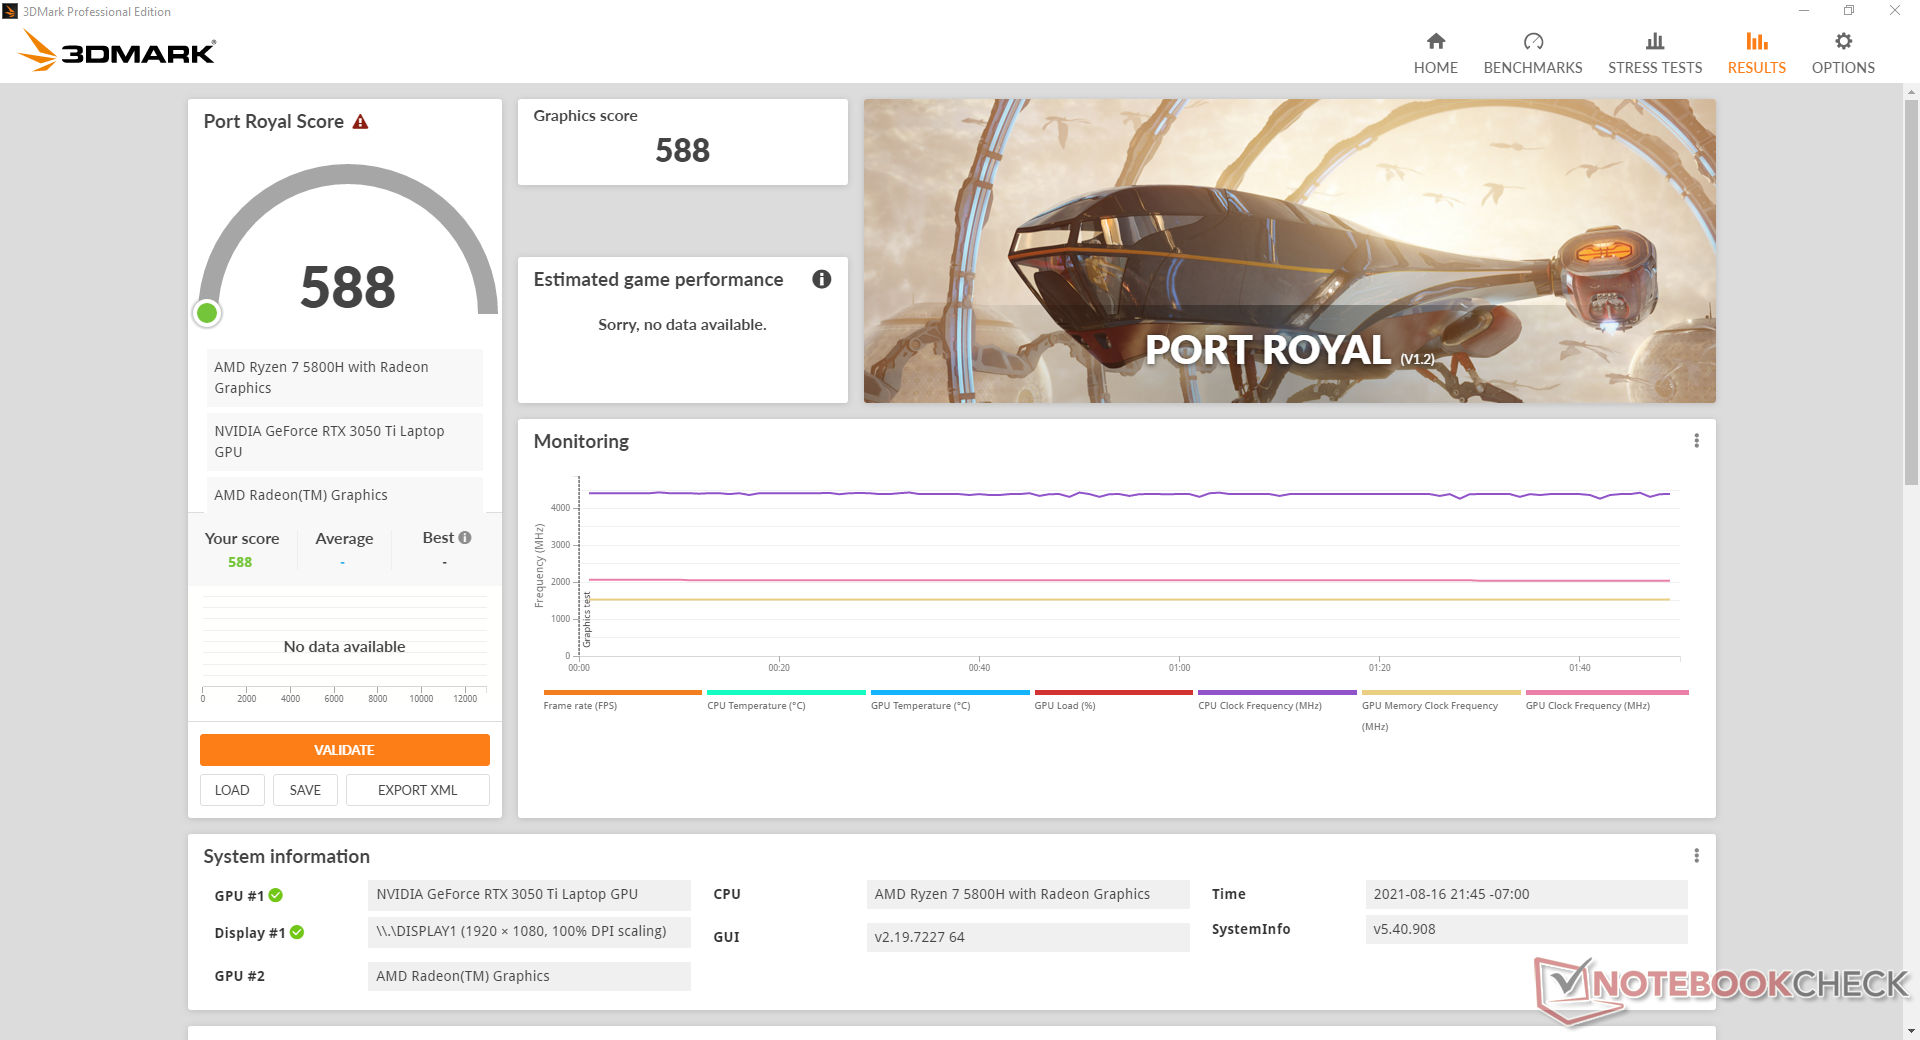
O desempenho gráfico é decepcionante para uma placa gráfica baseada em RTX. Os resultados do 3DMark são cerca de 16 a 25 por cento mais rápidos do que o RTX 3050 no Acer Nitro 5 para estar ao mesmo nível dos menos caros GeForce GTX 1660 Ti na melhor das hipóteses. Na verdade, a GTX 1660 Ti ainda vai superar nossa RTX 3050 Ti sob a maioria dos cenários de jogos, especialmente quando em configurações superiores a 1080p. Atualização para o RTX 3060 irá impulsionar os usuários em 40 a 50 por cento de gráficos brutos.
O desempenho gráfico cairá ligeiramente se não for executado no modo Asus Turbo, como exemplificado por nossa seção de Teste de Estresse abaixo.
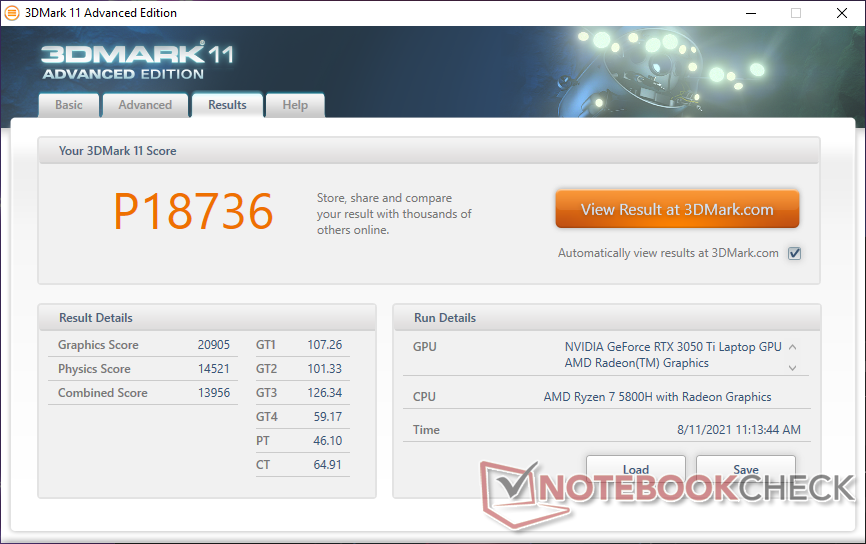
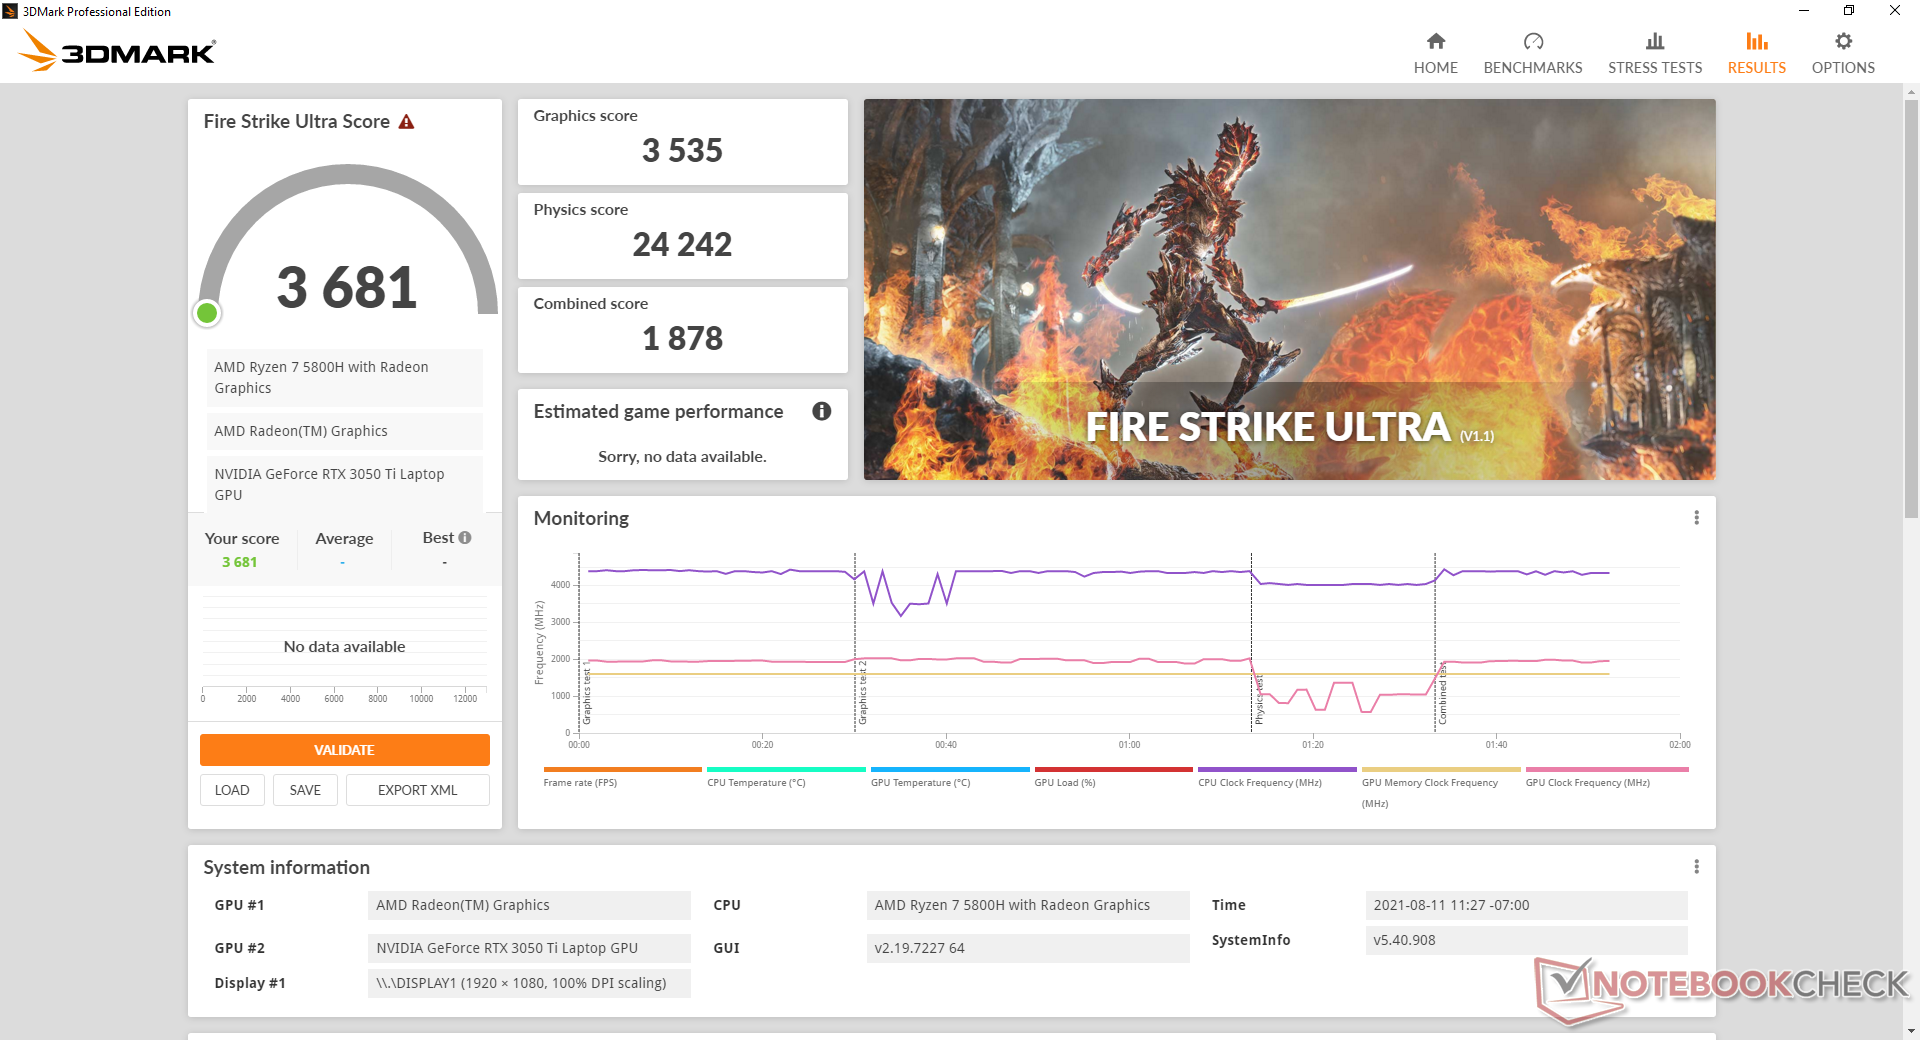
| 3DMark 11 Performance | 18736 pontos | |
| 3DMark Cloud Gate Standard Score | 42853 pontos | |
| 3DMark Fire Strike Score | 13606 pontos | |
| 3DMark Time Spy Score | 6417 pontos | |
Ajuda | ||
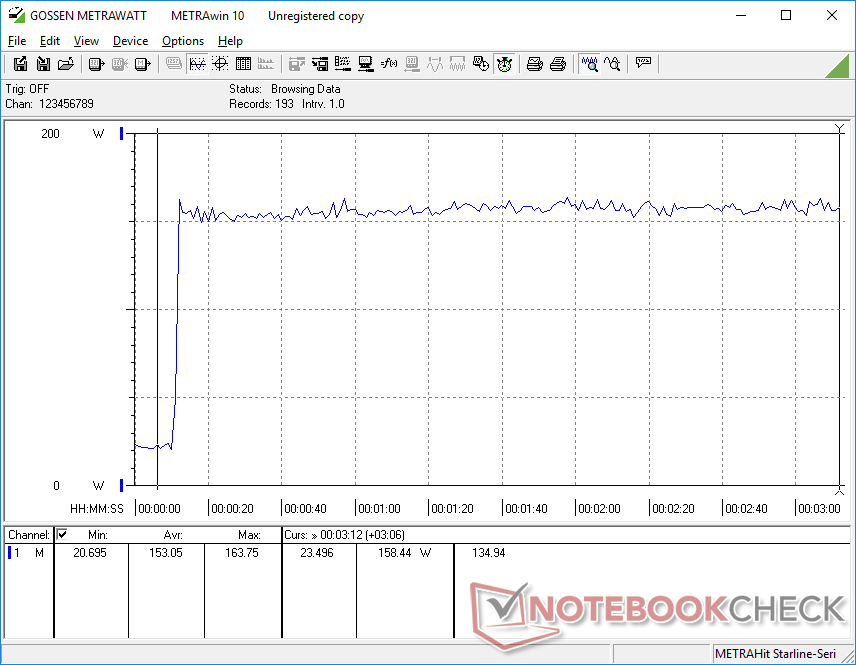
Rodando Witcher 3 por uma hora inteira mostra um desempenho estável, exceto por um mergulho inesperado para a faixa baixa de 20 FPS. A queda indica uma atividade de fundo interrompida durante o jogo que está potencialmente relacionada ao software Asus pré-instalado ou outros pop ups. Felizmente, isto não ocorre periodicamente.
Witcher 3 FPS Chart
| baixo | média | alto | ultra | |
|---|---|---|---|---|
| GTA V (2015) | 172 | 122 | 72.2 | |
| The Witcher 3 (2015) | 262.3 | 104.2 | 58.4 | |
| Dota 2 Reborn (2015) | 134 | 131 | 111 | 107 |
| Final Fantasy XV Benchmark (2018) | 132 | 81.8 | 56.6 | |
| X-Plane 11.11 (2018) | 94.1 | 81.6 | 68.4 | |
| Far Cry 5 (2018) | 125 | 101 | 94 | 89 |
| Strange Brigade (2018) | 227 | 134 | 114 | 100 |
| Shadow of the Tomb Raider (2018) | 115 | 92 | 83 | 72 |
| Far Cry New Dawn (2019) | 94 | 80 | 78 | 70 |
| Metro Exodus (2019) | 126.3 | 71.2 | 55.3 | 43.5 |
| Borderlands 3 (2019) | 123.5 | 88 | 56.8 | 36.8 |
| Gears Tactics (2020) | 125.9 | 136.4 | 90.6 | 64.7 |
| Horizon Zero Dawn (2020) | 52 | 47 | 44 | 41 |
| Watch Dogs Legion (2020) | 44 | 46 | 42 | 28 |
| Dirt 5 (2020) | 111.8 | 77.4 | 67.3 | 53.3 |
| Assassin´s Creed Valhalla (2020) | 84 | 53 | 34 | 24 |
| Immortals Fenyx Rising (2020) | 89 | 73 | 58 | 54 |
| Hitman 3 (2021) | 121.3 | 95.3 | 82.7 | 79.8 |
| F1 2021 (2021) | 200 | 141 | 125 | 69 |
Emissions — Loud Only When Gaming
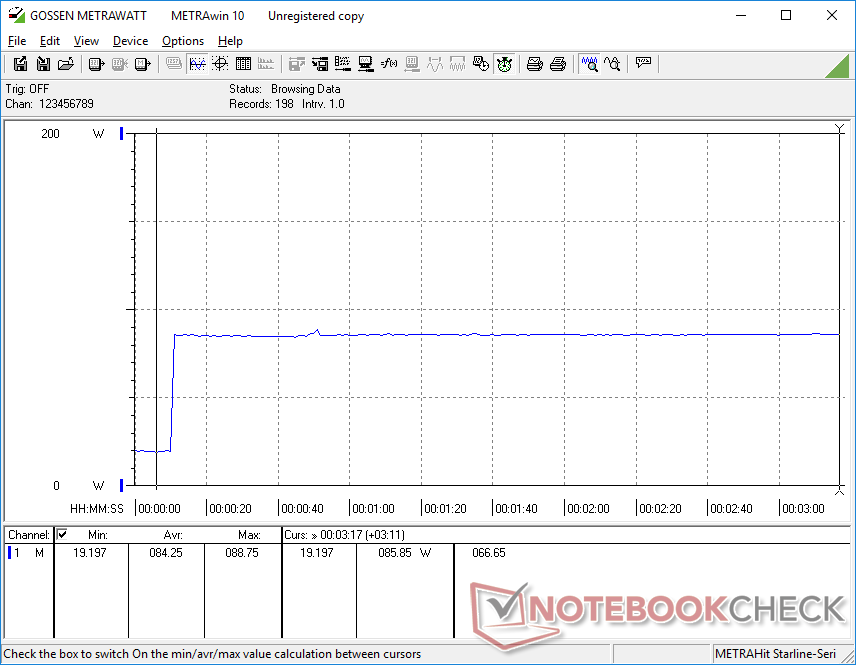
Ruído do sistema
O ruído dos ventiladores está intimamente ligado aos perfis de potência do Armoury Crate. Desta vez, porém, o Asus parece ter melhorado o comportamento dos ventiladores. Enquanto os ventiladores nos modelos Strix mais antigos aumentariam automaticamente para RPM máxima quando configurados para o modo Turbo, eles parecem ser mais silenciosos não importa o modo até que a potência extra seja realmente necessária. Os usuários podem transmitir vídeos e realizar outras tarefas leves no modo Turbo sem que os ventiladores pulsem constantemente.
Há uma diferença notável de ruído do ventilador entre o modo Performance e o modo Turbo. Os jogos no modo Performance resultam em um ruído constante do ventilador de 46,4 dB(A), enquanto o modo Turbo aumenta este ruído para 49,9 dB(A). Os ventiladores mais altos vêm com um desempenho gráfico mais rápido, como mostrado em nossa seção de Teste de Estresse abaixo.
| Asus ROG Strix G17 G713QE-RB74 GeForce RTX 3050 Ti Laptop GPU, R7 5800H, Samsung PM991 MZVLQ512HBLU | Acer Nitro 5 AN517-53-54DQ GeForce RTX 3050 4GB Laptop GPU, i5-11300H, SK Hynix BC711 HFM512GD3HX015N | MSI Katana GF76 11UE GeForce RTX 3060 Laptop GPU, i7-11800H, Kingston OM8PCP3512F-AB | Asus Strix Scar 17 G733QSA-XS99 GeForce RTX 3080 Laptop GPU, R9 5900HX, 2x Samsung PM981a MZVLB1T0HBLR (RAID 0) | MSI Alpha 17 A4DEK Radeon RX 5600M, R7 4800H, Kingston OM8PCP3512F-AB | Asus Strix G17 G712LWS GeForce RTX 2070 Super Mobile, i7-10750H, Intel SSD 660p 1TB SSDPEKNW010T8 | |
|---|---|---|---|---|---|---|
| Noise | -8% | -23% | 1% | -12% | -22% | |
| desligado / ambiente * (dB) | 24.9 | 25 -0% | 25 -0% | 25 -0% | 25 -0% | 25 -0% |
| Idle Minimum * (dB) | 25.1 | 25 -0% | 33 -31% | 25.2 -0% | 31 -24% | 32 -27% |
| Idle Average * (dB) | 25.1 | 31 -24% | 34 -35% | 25.2 -0% | 32 -27% | 34 -35% |
| Idle Maximum * (dB) | 25.1 | 33 -31% | 35 -39% | 25.2 -0% | 33 -31% | 37 -47% |
| Load Average * (dB) | 36.3 | 43 -18% | 53 -46% | 30.7 15% | 38 -5% | 51 -40% |
| Witcher 3 ultra * (dB) | 49.9 | 44 12% | 49 2% | 51.3 -3% | 46 8% | 50 -0% |
| Load Maximum * (dB) | 49.9 | 47 6% | 57 -14% | 51.3 -3% | 54 -8% | 53 -6% |
* ... menor é melhor
Barulho
| Ocioso |
| 25.1 / 25.1 / 25.1 dB |
| Carga |
| 36.3 / 49.9 dB |
 | ||
30 dB silencioso 40 dB(A) audível 50 dB(A) ruidosamente alto |
||
min: | ||
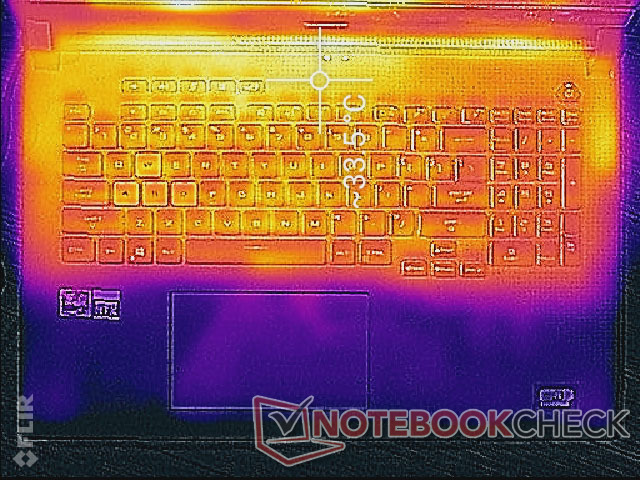
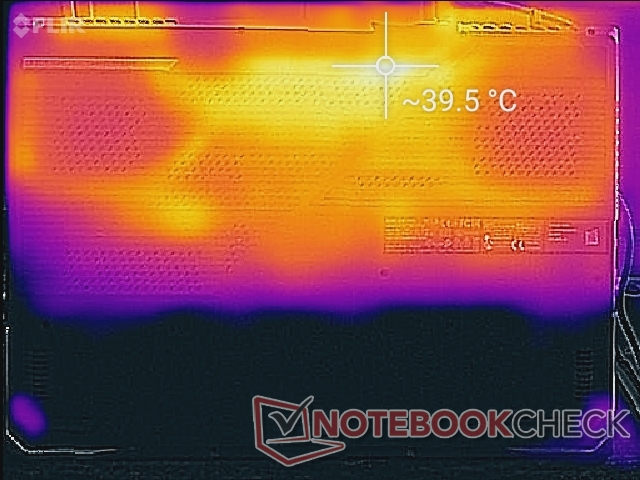
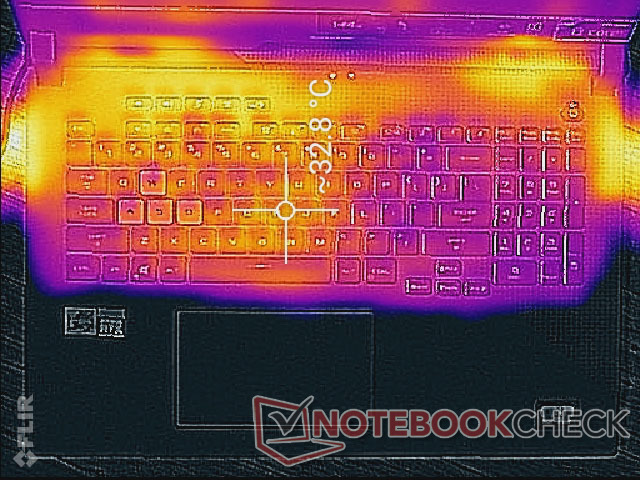
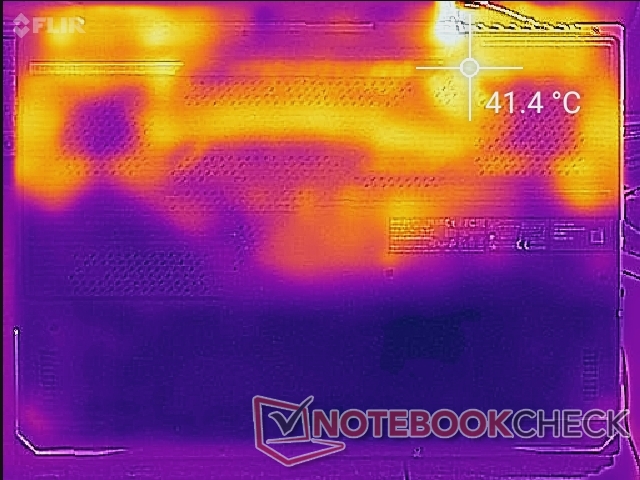
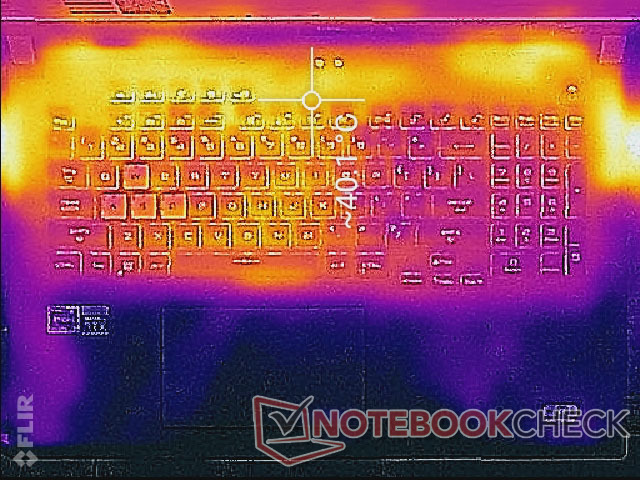
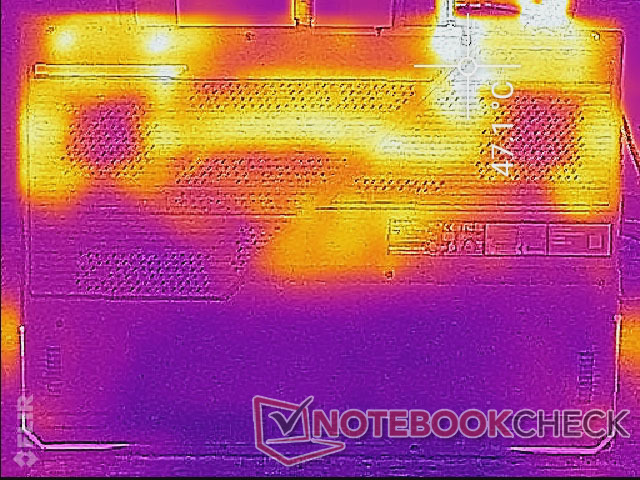
Temperatura - Quase sempre morno
As temperaturas superficiais são frias ao longo dos quadrantes dianteiros enquanto crescem cada vez mais quentes em direção à traseira. Como os ventiladores internos gostam de ficar ociosos quando as cargas de processamento são baixas, os pontos quentes estão no lado mais quente a até 33 C e 40 C nos pontos quentes superiores e inferiores, respectivamente
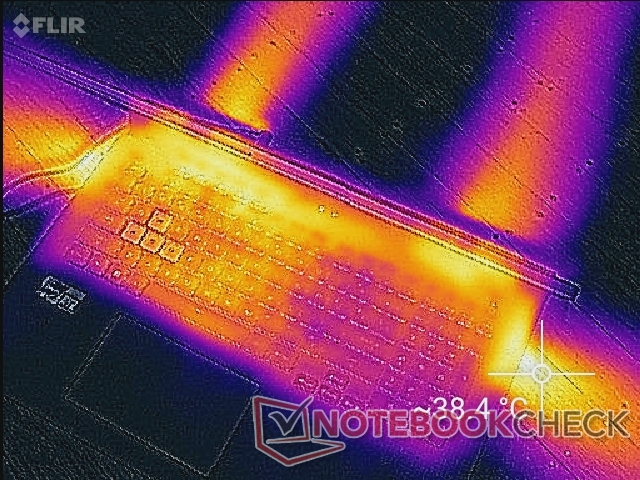
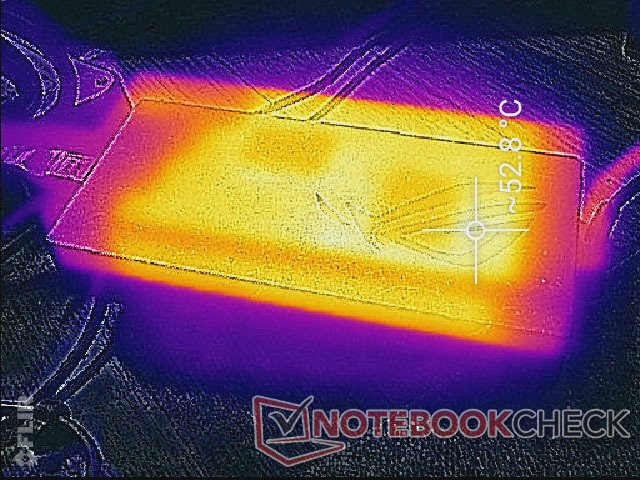
(±) A temperatura máxima no lado superior é 43.8 °C / 111 F, em comparação com a média de 40.4 °C / 105 F , variando de 21.2 a 68.8 °C para a classe Gaming.
(-) A parte inferior aquece até um máximo de 47.2 °C / 117 F, em comparação com a média de 43.2 °C / 110 F
(+) Em uso inativo, a temperatura média para o lado superior é 29.5 °C / 85 F, em comparação com a média do dispositivo de 33.9 °C / ### class_avg_f### F.
(+) Jogando The Witcher 3, a temperatura média para o lado superior é 28.8 °C / 84 F, em comparação com a média do dispositivo de 33.9 °C / ## #class_avg_f### F.
(+) Os apoios para as mãos e o touchpad são mais frios que a temperatura da pele, com um máximo de 29.6 °C / 85.3 F e, portanto, são frios ao toque.
(±) A temperatura média da área do apoio para as mãos de dispositivos semelhantes foi 28.8 °C / 83.8 F (-0.8 °C / -1.5 F).
Teste de Estresse - Excelente Sustentabilidade do CPU Boost
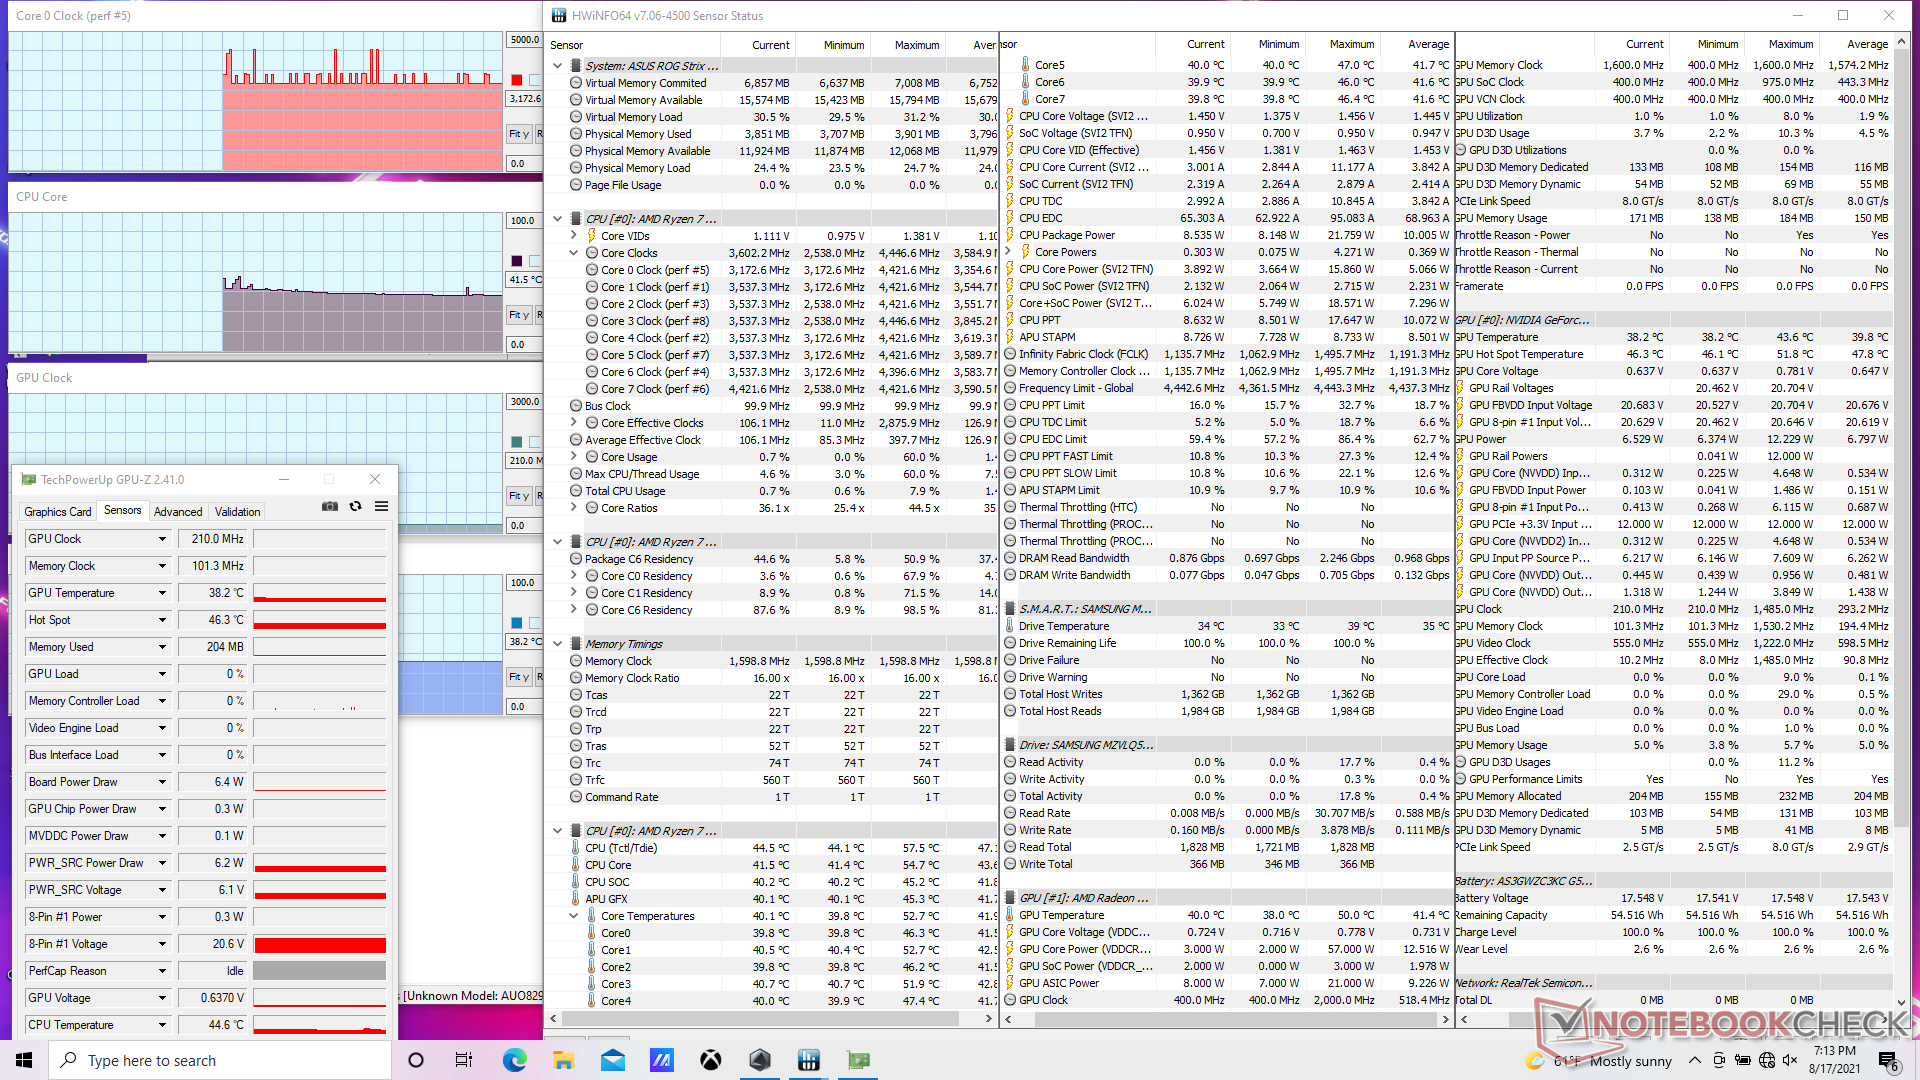
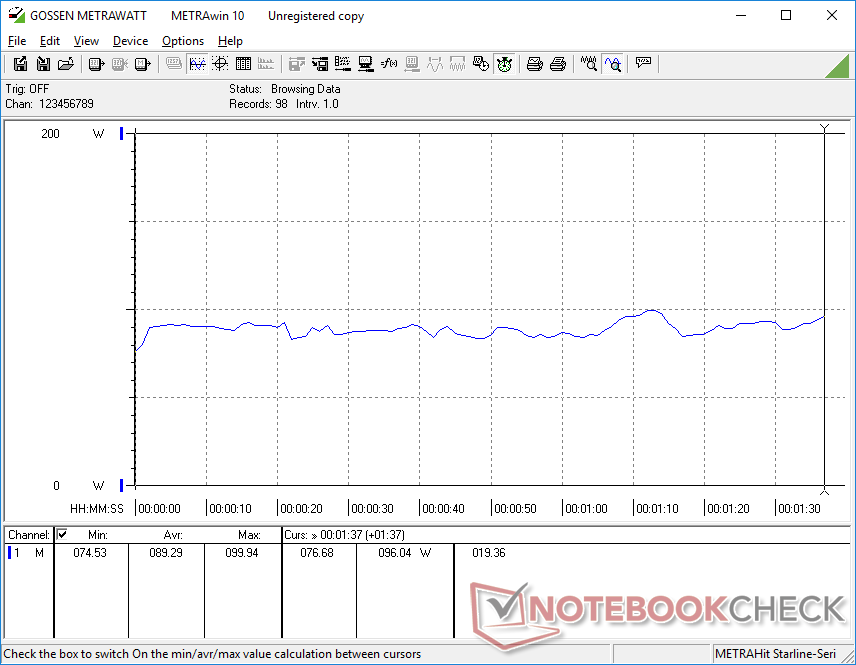
Quando sob estresse Prime95, a CPU aumentaria momentaneamente para 4,1 GHz antes de se estabilizar em 4 GHz e 76 C. A taxa máxima de Boost nominal do relógio Ryzen 7 5800H é de 4,4 GHz e, portanto, os 4 GHz estáveis são respeitáveis. A CPU atinge no máximo 84 C quando sob cargas extremas por longos períodos.
A CPU e a GPU estabilizam-se em 72 C e 78 C, respectivamente, quando em funcionamento Witcher 3. Curiosamente, estas temperaturas permanecem praticamente as mesmas, não importando a configuração do modo Turbo, mas a maioria dos jogadores vai querer habilitar o modo Turbo de qualquer forma, já que a GPU e as taxas de relógio de memória se tornam cada uma ligeiramente mais rápidas (GPU de 1845 MHz a 1972 MHz e memória de 1500 MHz a 1530 MHz) ao custo de ventiladores mais altos. A potência máxima da GPU também saltaria de 80 W para 90 W quando no modo Turbo, que está próximo ao anúncio da Asus de uma GPU TGP de 95 W.
O funcionamento com bateria limitará o desempenho gráfico, especialmente porque o modo Turbo só está disponível quando está ligado à rede elétrica. Um teste 3DMark 11 com baterias retornaria pontuações de Física e Gráficos de 13986 e 12434 pontos, respectivamente, em comparação com 14521 e 20905 pontos quando em rede elétrica.
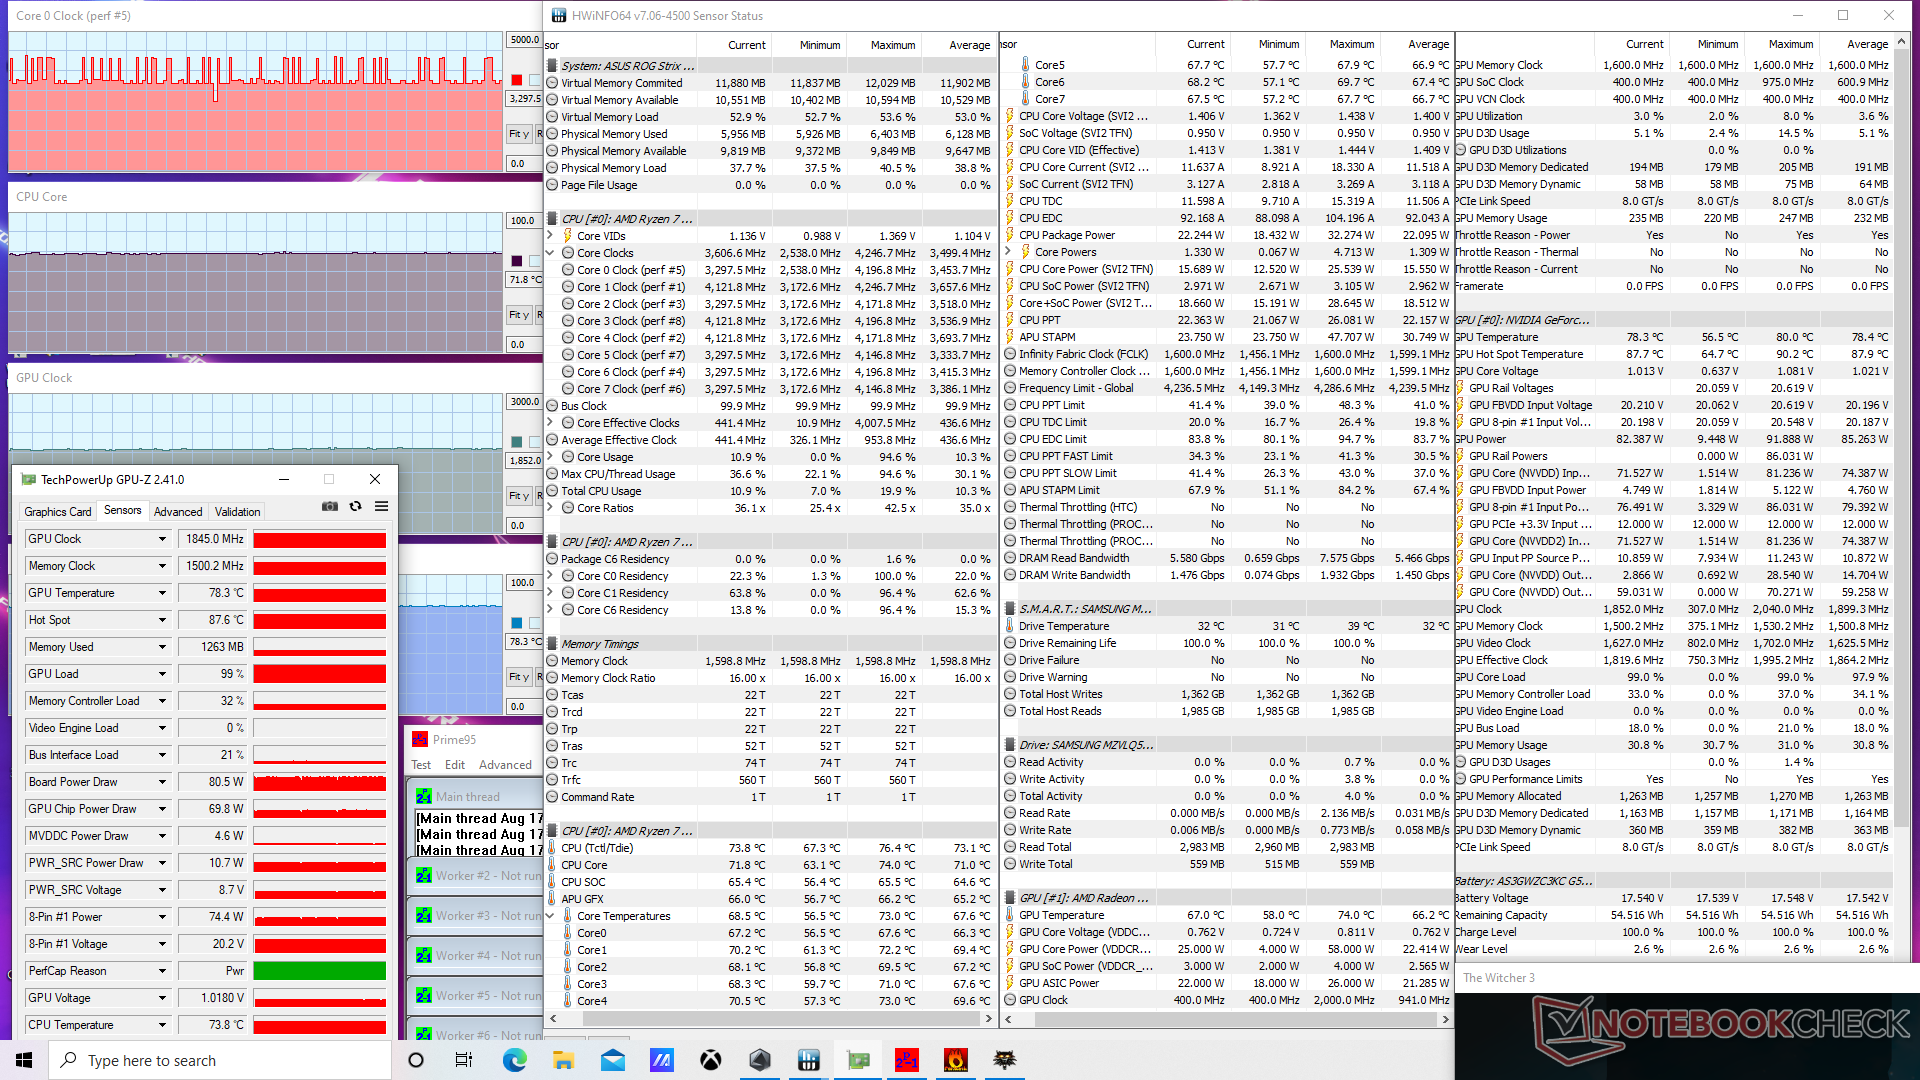
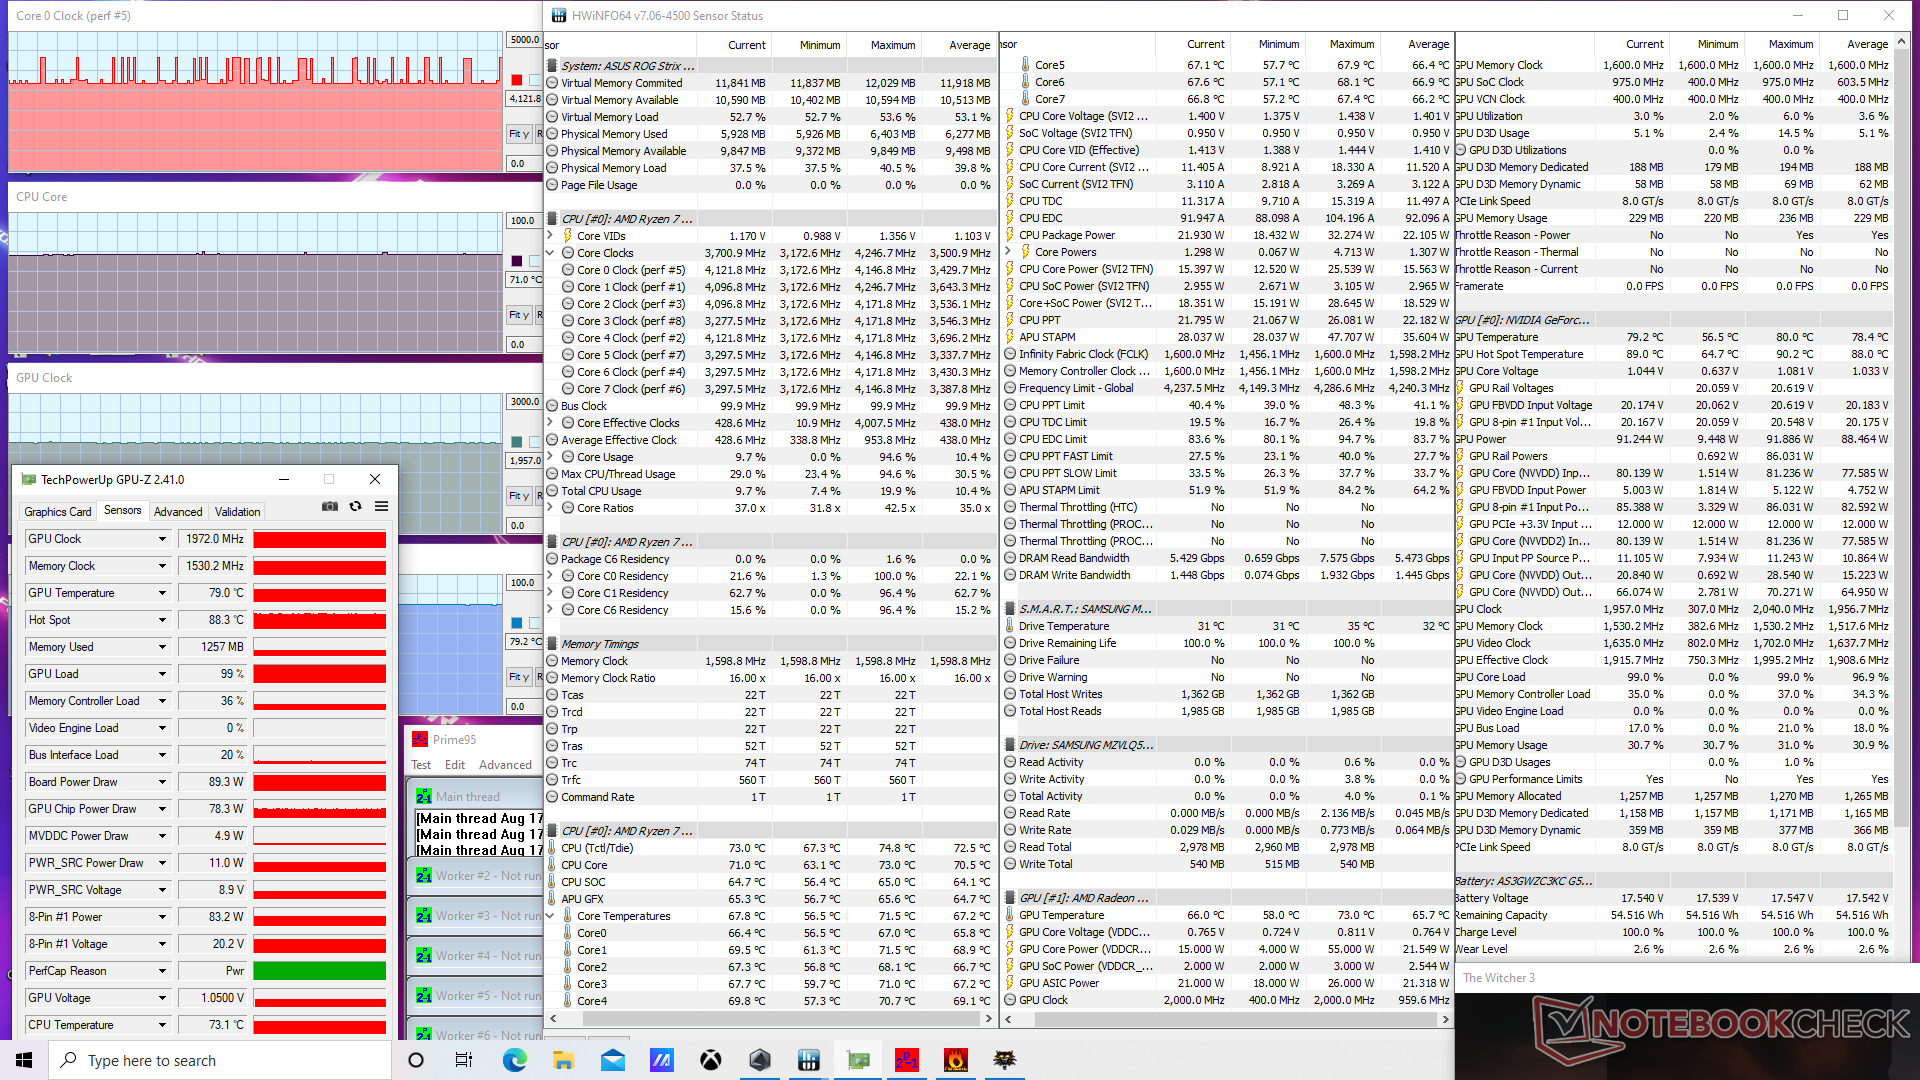
| RelógioCPU (GHz) | RelógioGPU (MHz) | Temperaturamédiada CPU (°C) | Temperaturamédiada GPU (°C) | |
| System Idle | -- | --42 | 38 | |
| Prime95 Stress (Turbo on) | 4.0 | -- | 76 | |
| Prime95 + FurMark Stress (Turbo on) | 3.9 | 1905 | 84 | 81 |
| Witcher 3 Stress (Turbo off) | 3.3 - 4.1 | 1845 | 72 | 78 |
| Witcher 3 Stress (Turbo on) | 3.3 - 4.1 | 1972 | 71 | 79 |
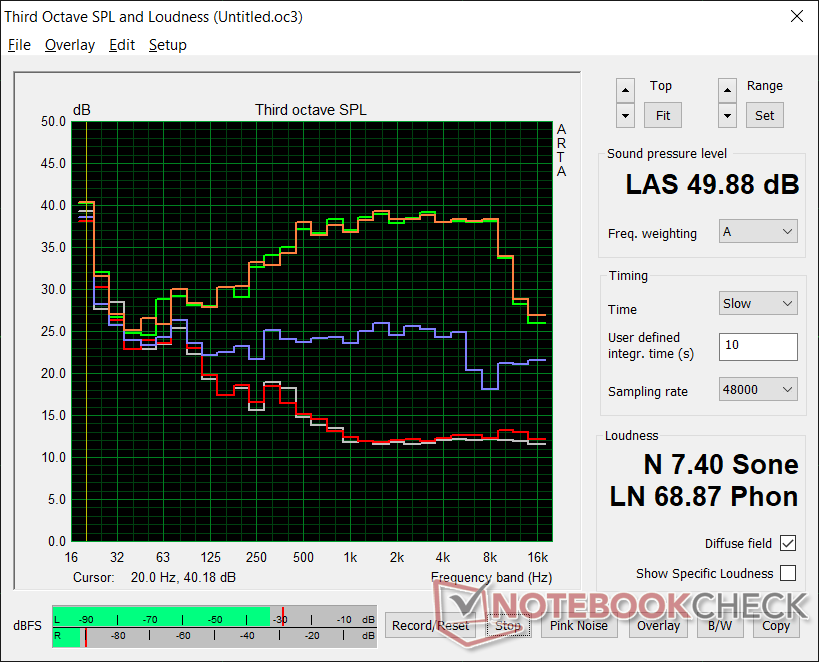
Oradores
Os alto-falantes de 2 W estéreo são relativamente fracos. Mesmo os alto-falantes nos menores de 13 polegadas HP Pavilion Aero 13 são mais barulhentos e têm um alcance mais amplo do que os da nossa Strix G17.


Asus ROG Strix G17 G713QE-RB74 análise de áudio
(±) | o volume do alto-falante é médio, mas bom (###valor### dB)
Graves 100 - 315Hz
(±) | graves reduzidos - em média 13% menor que a mediana
(±) | a linearidade dos graves é média (9.8% delta para a frequência anterior)
Médios 400 - 2.000 Hz
(±) | médios mais altos - em média 5.6% maior que a mediana
(+) | médios são lineares (6.5% delta para frequência anterior)
Altos 2 - 16 kHz
(+) | agudos equilibrados - apenas 3.4% longe da mediana
(±) | a linearidade dos máximos é média (12% delta para frequência anterior)
Geral 100 - 16.000 Hz
(±) | a linearidade do som geral é média (16.9% diferença em relação à mediana)
Comparado com a mesma classe
» 44% de todos os dispositivos testados nesta classe foram melhores, 11% semelhantes, 44% piores
» O melhor teve um delta de 6%, a média foi 18%, o pior foi 132%
Comparado com todos os dispositivos testados
» 30% de todos os dispositivos testados foram melhores, 8% semelhantes, 62% piores
» O melhor teve um delta de 4%, a média foi 23%, o pior foi 134%
Apple MacBook 12 (Early 2016) 1.1 GHz análise de áudio
(+) | os alto-falantes podem tocar relativamente alto (###valor### dB)
Graves 100 - 315Hz
(±) | graves reduzidos - em média 11.3% menor que a mediana
(±) | a linearidade dos graves é média (14.2% delta para a frequência anterior)
Médios 400 - 2.000 Hz
(+) | médios equilibrados - apenas 2.4% longe da mediana
(+) | médios são lineares (5.5% delta para frequência anterior)
Altos 2 - 16 kHz
(+) | agudos equilibrados - apenas 2% longe da mediana
(+) | os máximos são lineares (4.5% delta da frequência anterior)
Geral 100 - 16.000 Hz
(+) | o som geral é linear (10.2% diferença em relação à mediana)
Comparado com a mesma classe
» 7% de todos os dispositivos testados nesta classe foram melhores, 2% semelhantes, 90% piores
» O melhor teve um delta de 5%, a média foi 18%, o pior foi 53%
Comparado com todos os dispositivos testados
» 5% de todos os dispositivos testados foram melhores, 1% semelhantes, 94% piores
» O melhor teve um delta de 4%, a média foi 23%, o pior foi 134%
Energy Management — Poor GPU Performance-per-Watt
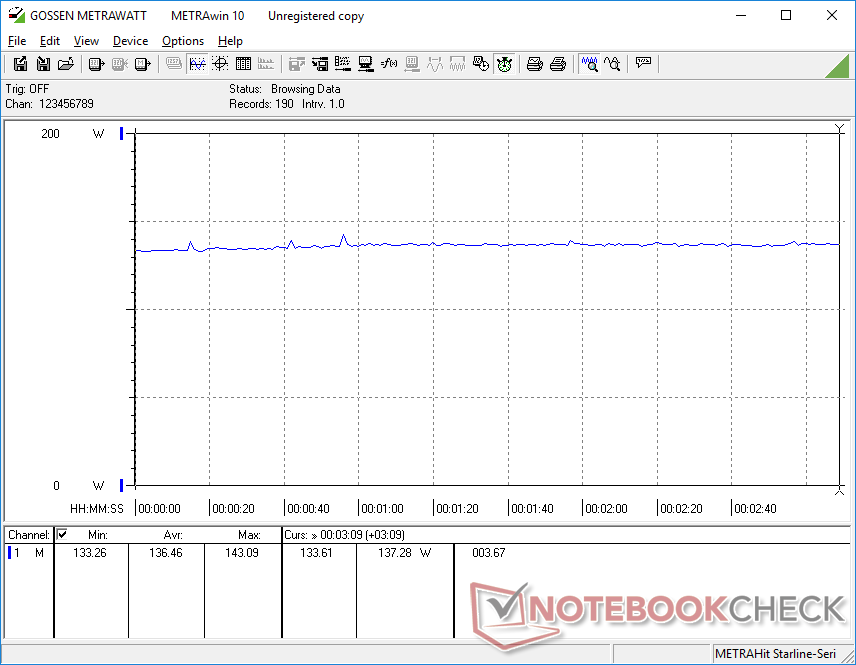
Consumo de energia
O consumo geral de energia está próximo ao que observamos na MSI Katana com a GPU RTX 3060 mais rápida. Rodando Witcher 3 consumiria cerca de 9% menos energia em nosso Asus apesar de seu déficit de 30% de desempenho gráfico para mostrar um desempenho inferior por watt do RTX 3050 Ti
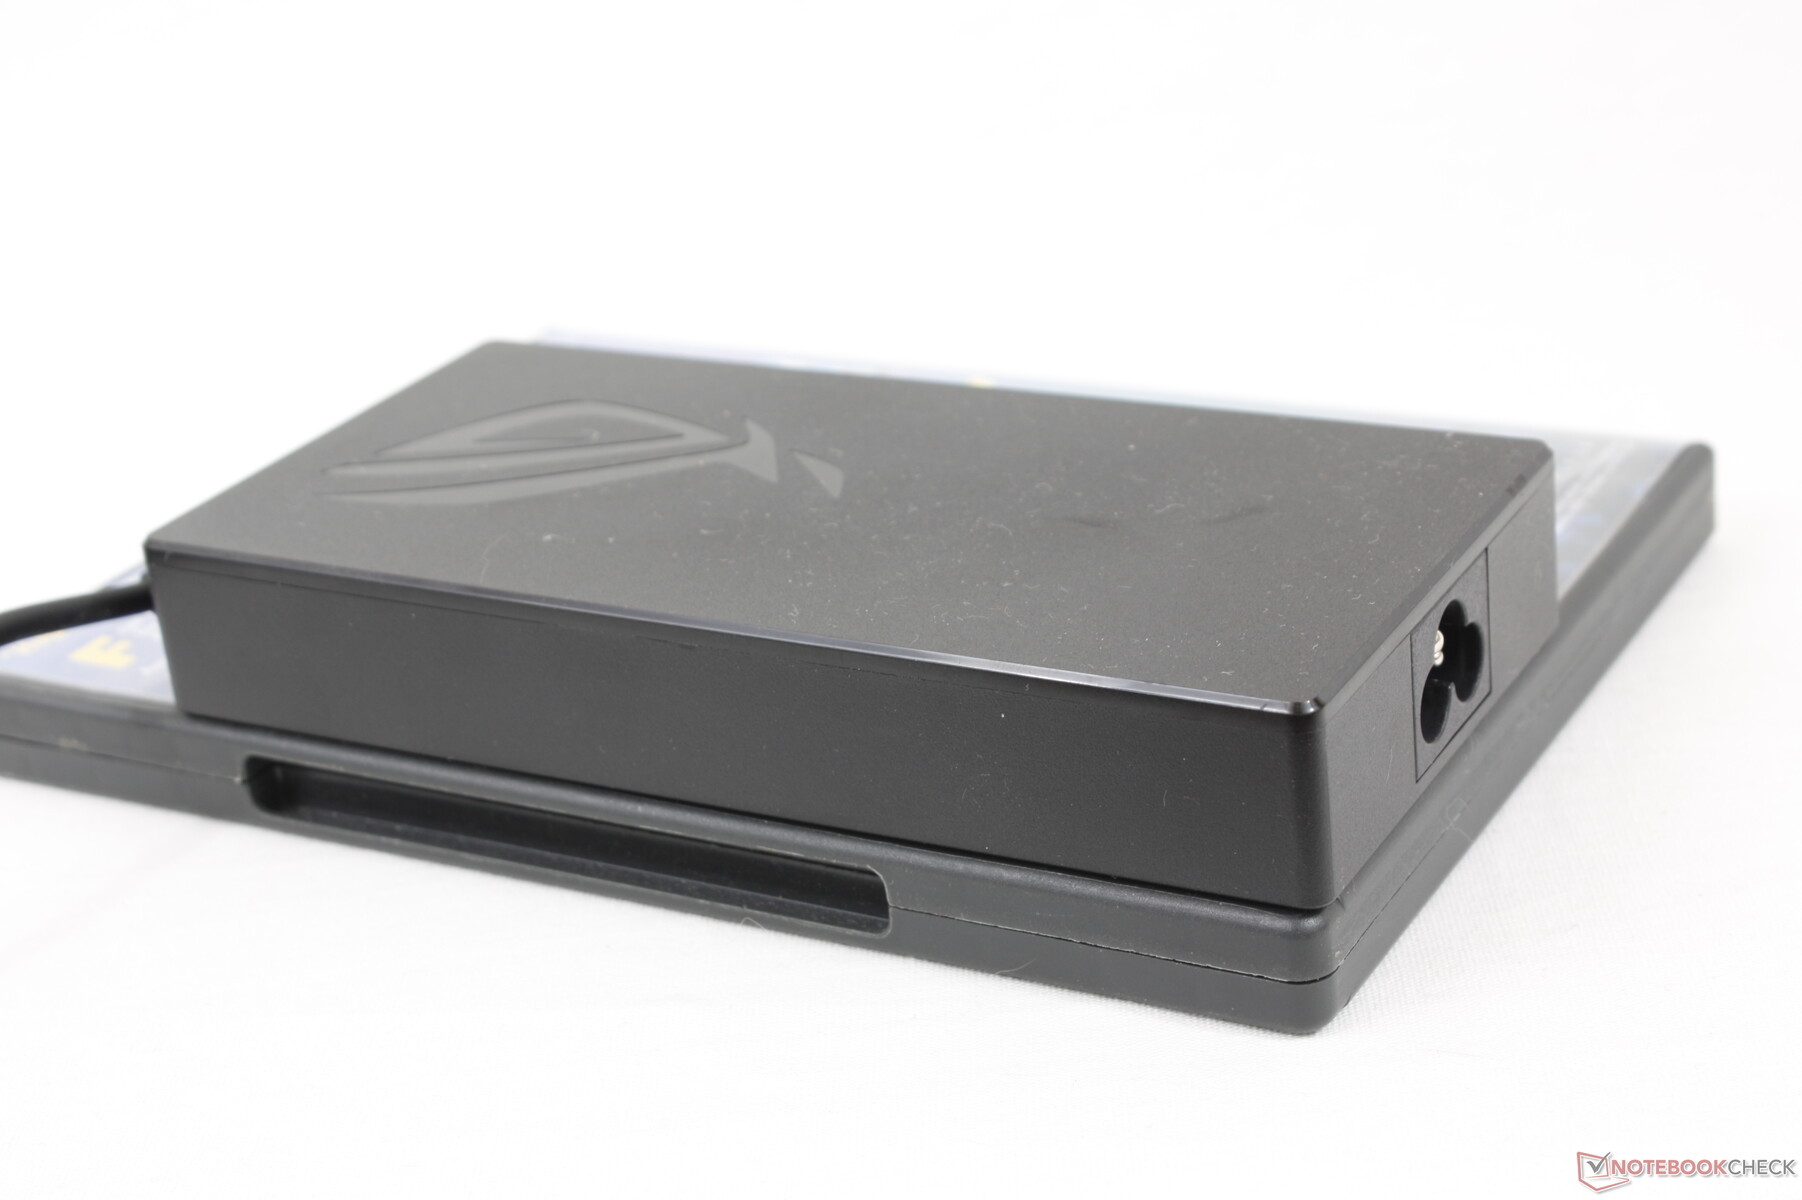
Somos capazes de registrar um consumo máximo de 163 W a partir do adaptador de média (~15,2 x 7,3 x 2,3 cm) 200 W AC. Nossa configuração não tem problemas para carregar e rodar jogos simultaneamente. Outros SKUs podem vir com adaptadores menores de 160 W ou maiores de 240 W, dependendo da opção gráfica.
| desligado | |
| Ocioso | |
| Carga |
|
Key:
min: | |
| Asus ROG Strix G17 G713QE-RB74 R7 5800H, GeForce RTX 3050 Ti Laptop GPU, Samsung PM991 MZVLQ512HBLU, IPS, 1920x1080, 17.3" | Acer Nitro 5 AN517-53-54DQ i5-11300H, GeForce RTX 3050 4GB Laptop GPU, SK Hynix BC711 HFM512GD3HX015N, IPS, 1920x1080, 17.3" | MSI Katana GF76 11UE i7-11800H, GeForce RTX 3060 Laptop GPU, Kingston OM8PCP3512F-AB, IPS, 1920x1080, 17.3" | Asus Strix Scar 17 G733QSA-XS99 R9 5900HX, GeForce RTX 3080 Laptop GPU, 2x Samsung PM981a MZVLB1T0HBLR (RAID 0), IPS, 1920x1080, 17.3" | MSI Alpha 17 A4DEK R7 4800H, Radeon RX 5600M, Kingston OM8PCP3512F-AB, IPS, 1920x1080, 17.3" | Asus Strix G17 G712LWS i7-10750H, GeForce RTX 2070 Super Mobile, Intel SSD 660p 1TB SSDPEKNW010T8, IPS, 1920x1080, 17.3" | |
|---|---|---|---|---|---|---|
| Power Consumption | 28% | -4% | -25% | 2% | -26% | |
| Idle Minimum * (Watt) | 9.2 | 4 57% | 9 2% | 10.9 -18% | 9 2% | 10 -9% |
| Idle Average * (Watt) | 12.6 | 9 29% | 13 -3% | 14.7 -17% | 12 5% | 14 -11% |
| Idle Maximum * (Watt) | 23.3 | 15 36% | 20 14% | 26.8 -15% | 18 23% | 25 -7% |
| Load Average * (Watt) | 89.3 | 85 5% | 102 -14% | 106.7 -19% | 76 15% | 134 -50% |
| Witcher 3 ultra * (Watt) | 136 | 104 24% | 149 -10% | 192.4 -41% | 136 -0% | 186 -37% |
| Load Maximum * (Watt) | 162.7 | 135 17% | 187 -15% | 228.4 -40% | 222 -36% | 230 -41% |
* ... menor é melhor
Power Consumption Witcher 3 / Stresstest
Vida útil da bateria
A capacidade da bateria é menor do que na última geração G712 (56 Wh vs. 66 Wh), mas os tempos de execução permanecem praticamente os mesmos às 5,5 a 6 horas de uso da WLAN no mundo real quando no perfil de potência balanceada com a GPU integrada ativa. O Strix Scar 17 G733, mais caro, pode durar várias horas mais devido à sua bateria muito maior de 90 Wh. As configurações mais avançadas do G713 vêm com a bateria maior de 90 Wh em vez da base 56 Wh para maior vida útil da bateria.
O carregamento do vazio para o cheio leva cerca de 1,5 horas. A recarga de USB-C PD é suportada, embora a um ritmo mais lento.
| Asus ROG Strix G17 G713QE-RB74 R7 5800H, GeForce RTX 3050 Ti Laptop GPU, 56 Wh | Acer Nitro 5 AN517-53-54DQ i5-11300H, GeForce RTX 3050 4GB Laptop GPU, 57 Wh | MSI Katana GF76 11UE i7-11800H, GeForce RTX 3060 Laptop GPU, 53 Wh | Asus Strix Scar 17 G733QSA-XS99 R9 5900HX, GeForce RTX 3080 Laptop GPU, 90 Wh | MSI Alpha 17 A4DEK R7 4800H, Radeon RX 5600M, 65 Wh | Asus Strix G17 G712LWS i7-10750H, GeForce RTX 2070 Super Mobile, 66 Wh | |
|---|---|---|---|---|---|---|
| Duração da bateria | 35% | -26% | 34% | 18% | 6% | |
| Reader / Idle (h) | 11.1 | 17.4 57% | 4.8 -57% | 13.3 20% | 10.5 -5% | 9.1 -18% |
| WiFi v1.3 (h) | 6 | 7.2 20% | 3.7 -38% | 9.3 55% | 7.3 22% | 5.5 -8% |
| Load (h) | 1.1 | 1.4 27% | 1.3 18% | 1.4 27% | 1.5 36% | 1.6 45% |
| Witcher 3 ultra (h) | 0.8 |
Pro
Contra
Veredicto - Escolha sua configuração com cuidado
Como dito anteriormente, há nada menos que 16 configurações da Asus ROG Strix G17 G713 com diferentes espessuras, peso, adaptadores CA, displays, capacidades de bateria, iluminação RGB, e muito mais. Os potenciais compradores devem selecionar cuidadosamente suas respectivas SKUs, observando as especificações no site oficial do Asus https://rog.asus.com/laptops/rog-strix/2021-rog-strix-g17-series/spec que detalham todas as diferenças entre eles.
Para nossa configuração de revisão em particular, tanto a CPU AMD Zen 3 quanto a rápida taxa de atualização do display de 144 Hz merecem elogios. O RTX 3050 e RTX 3050 Ti são mais difíceis de recomendar, no entanto, já que seus níveis de desempenho seguem o mais antigo GTX 1660 Ti, na melhor das hipóteses. A atualização para o RTX 3060 ou superior dará pernas mais longas e um desempenho significativamente maior por watt
Infelizmente, optar pelo RTX 3060 ou mais rápido implica em alguns inconvenientes porque tais SKUs são mais espessas, mais pesadas e com adaptadores CA maiores do que nosso RTX 3050 Ti SKU. A convenção de nomes da Asus é especialmente confusa a este respeito, pois a série G713 na verdade consiste em dois modelos distintos e, no entanto, eles compartilham quase os mesmos nomes de varejo. A base forte, as dobradiças rígidas e a facilidade de atualização são, no entanto, melhores do que a maioria dos outros laptops econômicos, incluindo o HP Pavilion Gaming, Lenovo Legion 5, MSI Katana, ou Dell série G5 ao custo de uma pegada maior
Preço e disponibilidade
A Asus ROG Strix G17 G713 está amplamente disponível através da maioria dos varejistas, incluindo Amazônia, Melhor compra, Walmart, e Newegg com o RTX 3060 ou superior a partir de $1500 USD. Nossa configuração específica com o RTX 3050 Ti, entretanto, ainda não está disponível no momento da redação.
Asus ROG Strix G17 G713QE-RB74
- 08/20/2021 v7 (old)
Allen Ngo
Price comparison

