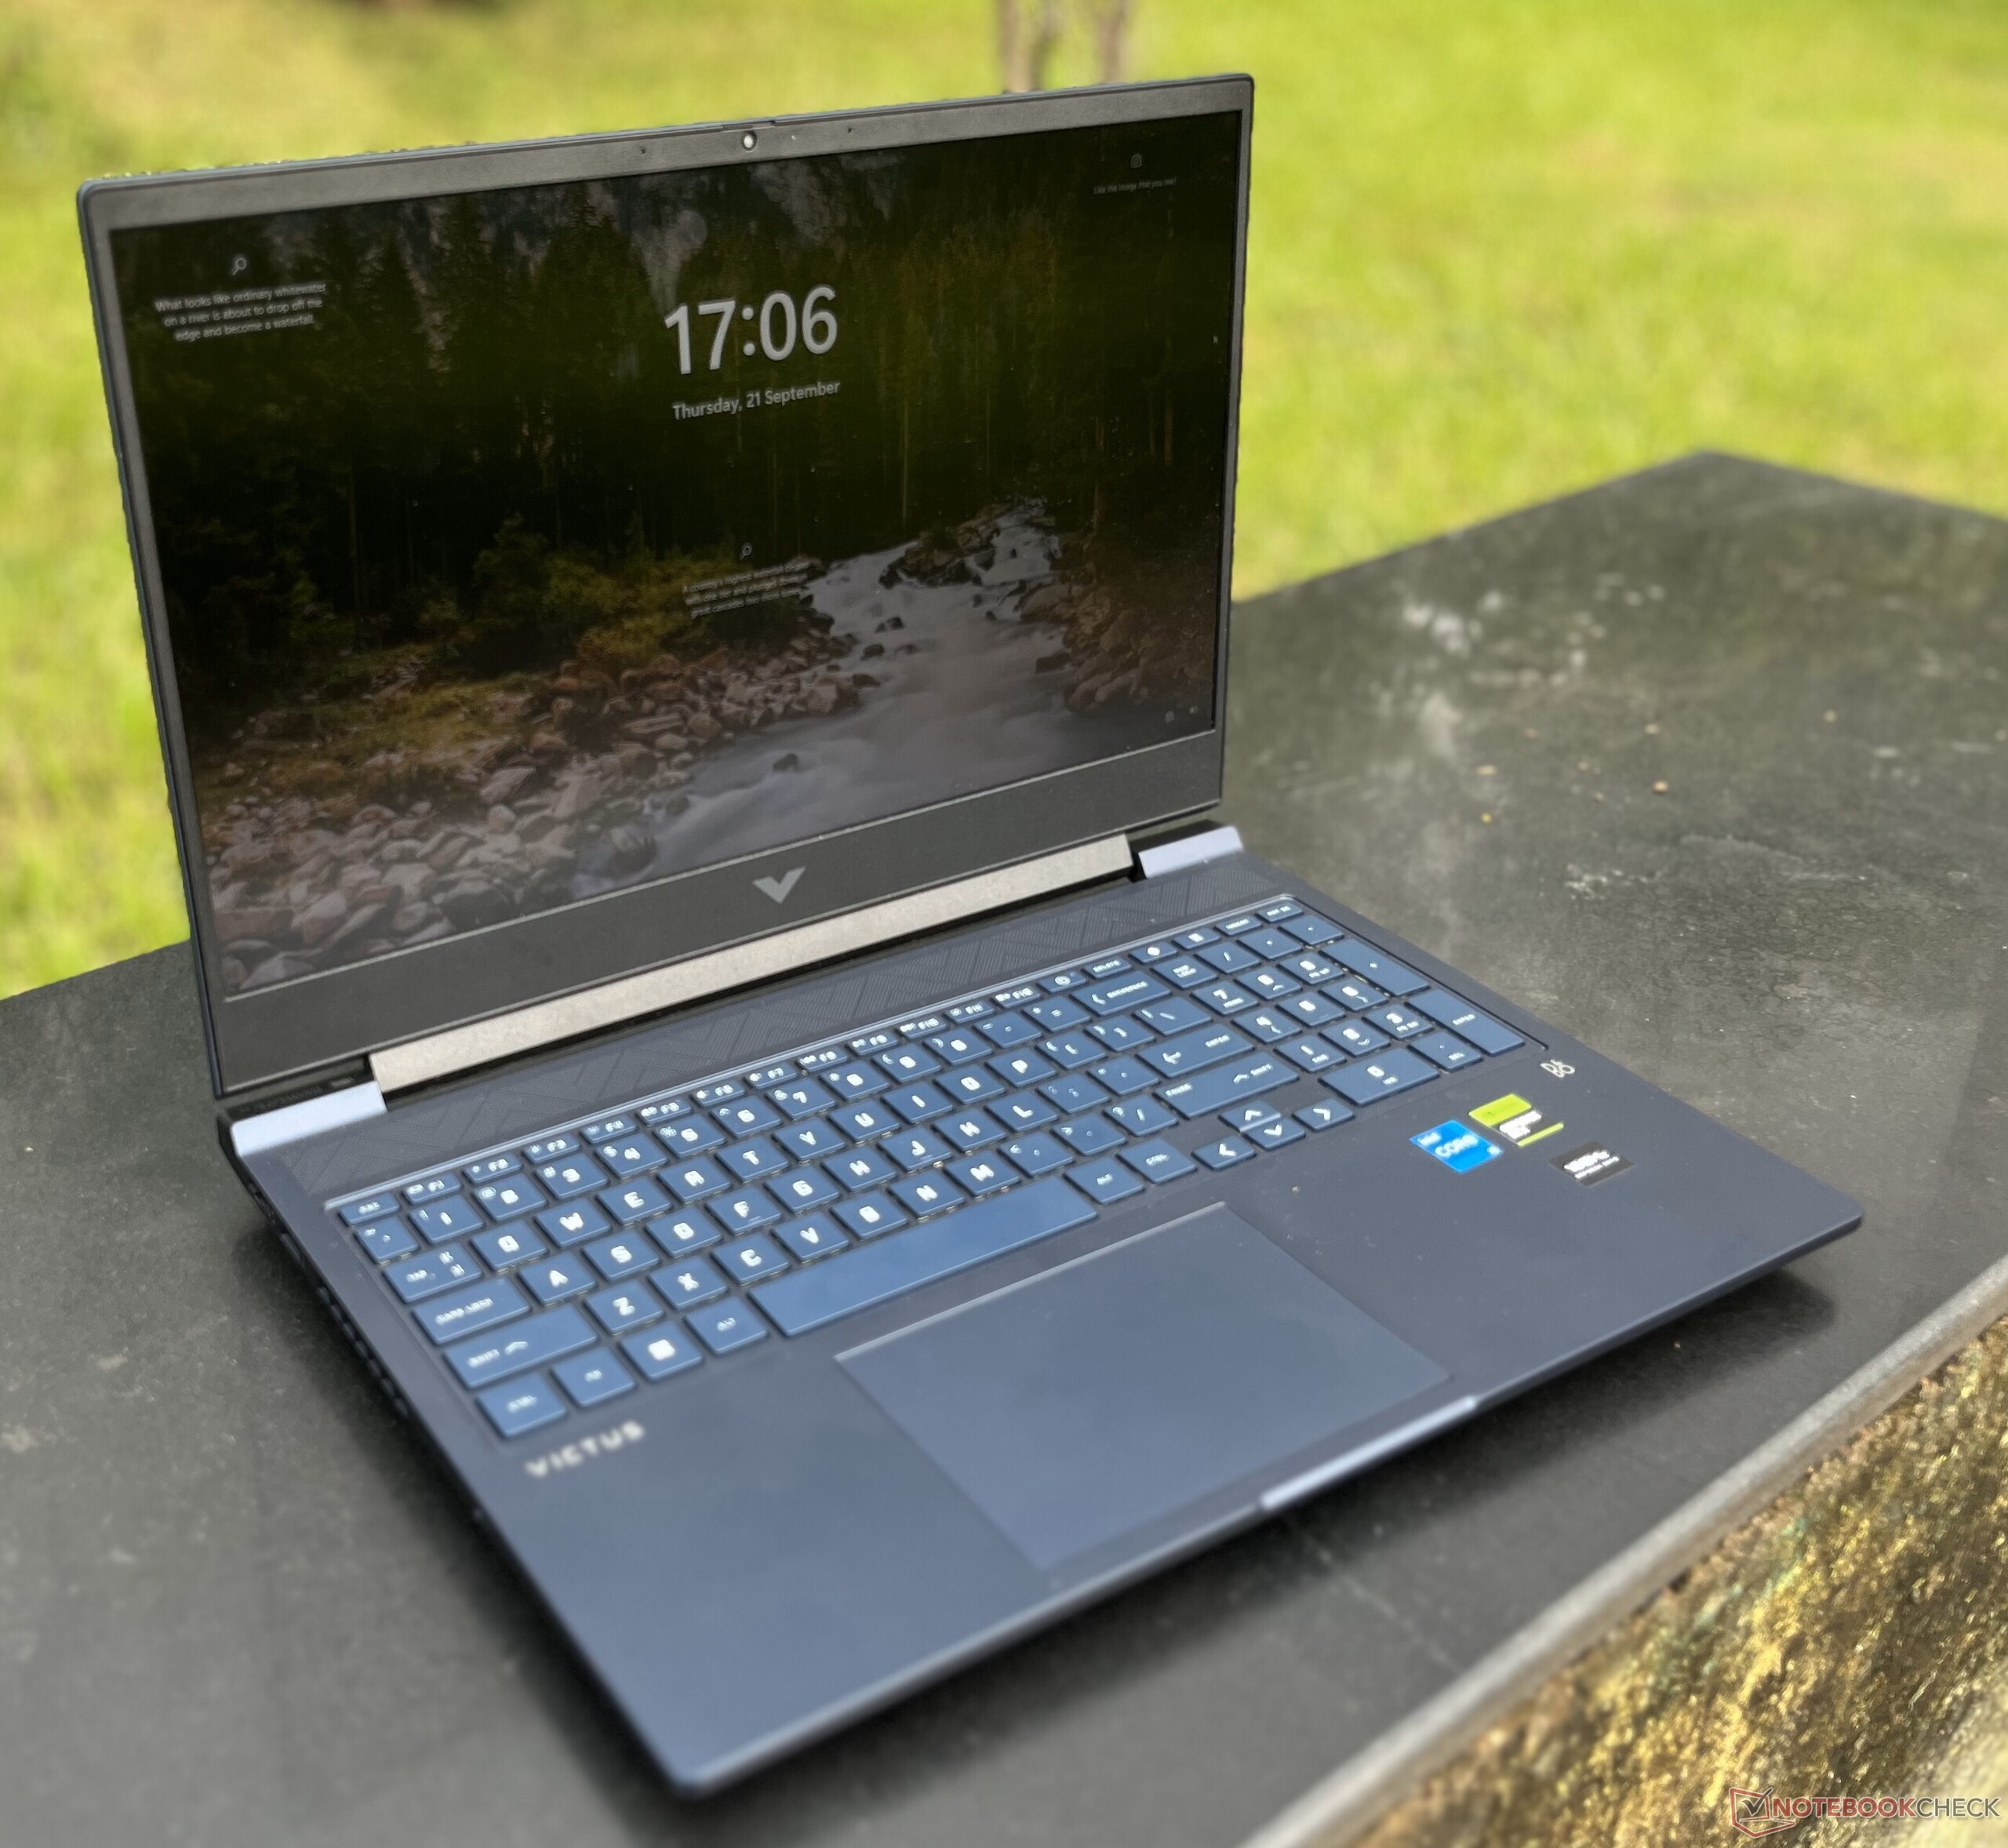
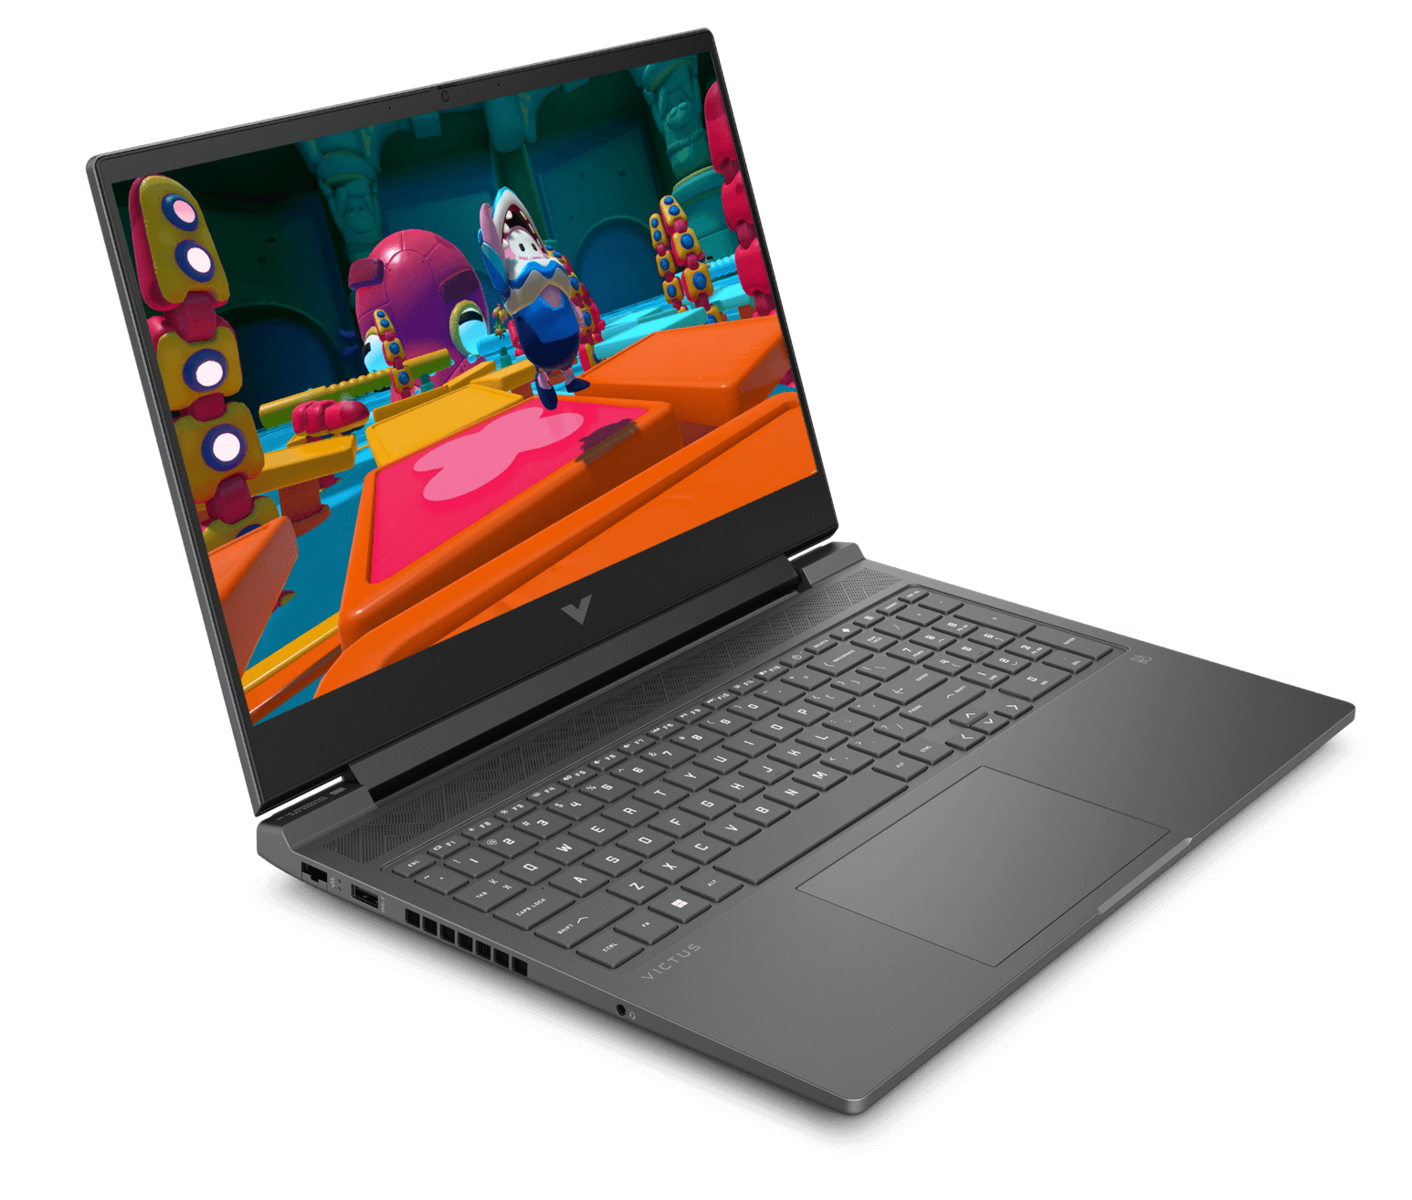
Análise do laptop HP Victus 16: Uma potência para jogos em 1080p com poucos compromissos

A linha de laptops Victus da HP é voltada para o público com orçamento limitado que procura soluções para jogos. No entanto, ele ainda executa vários softwares Omen, consolidando efetivamente sua posição no repertório de laptops para jogos da HP.
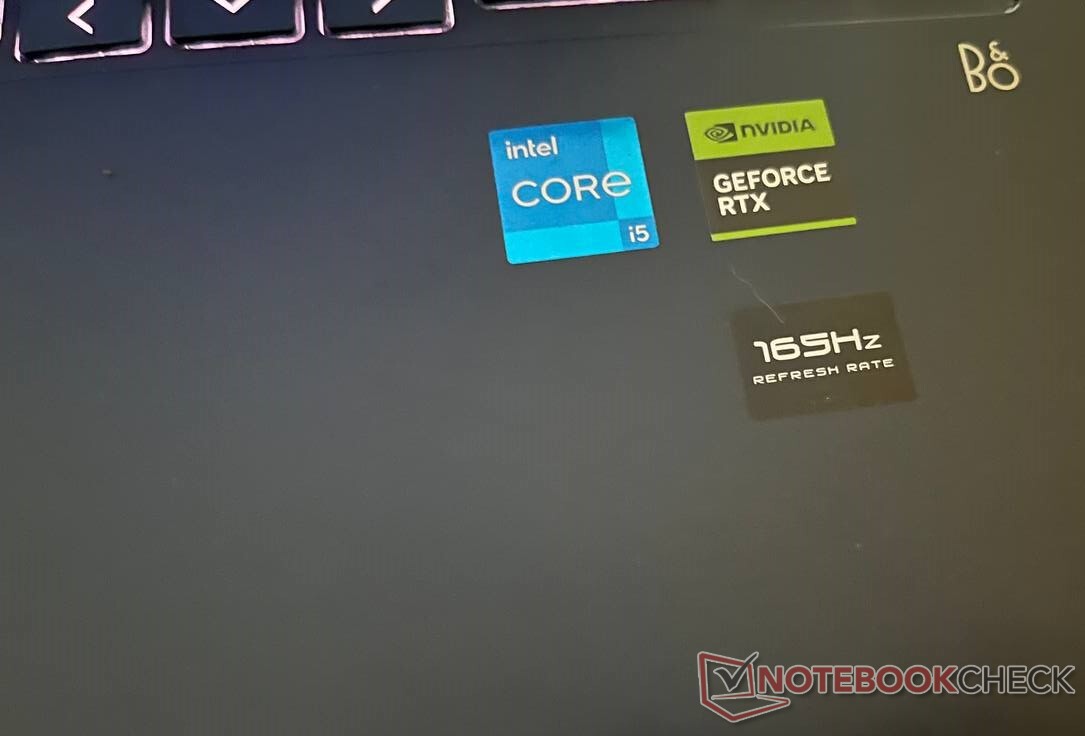
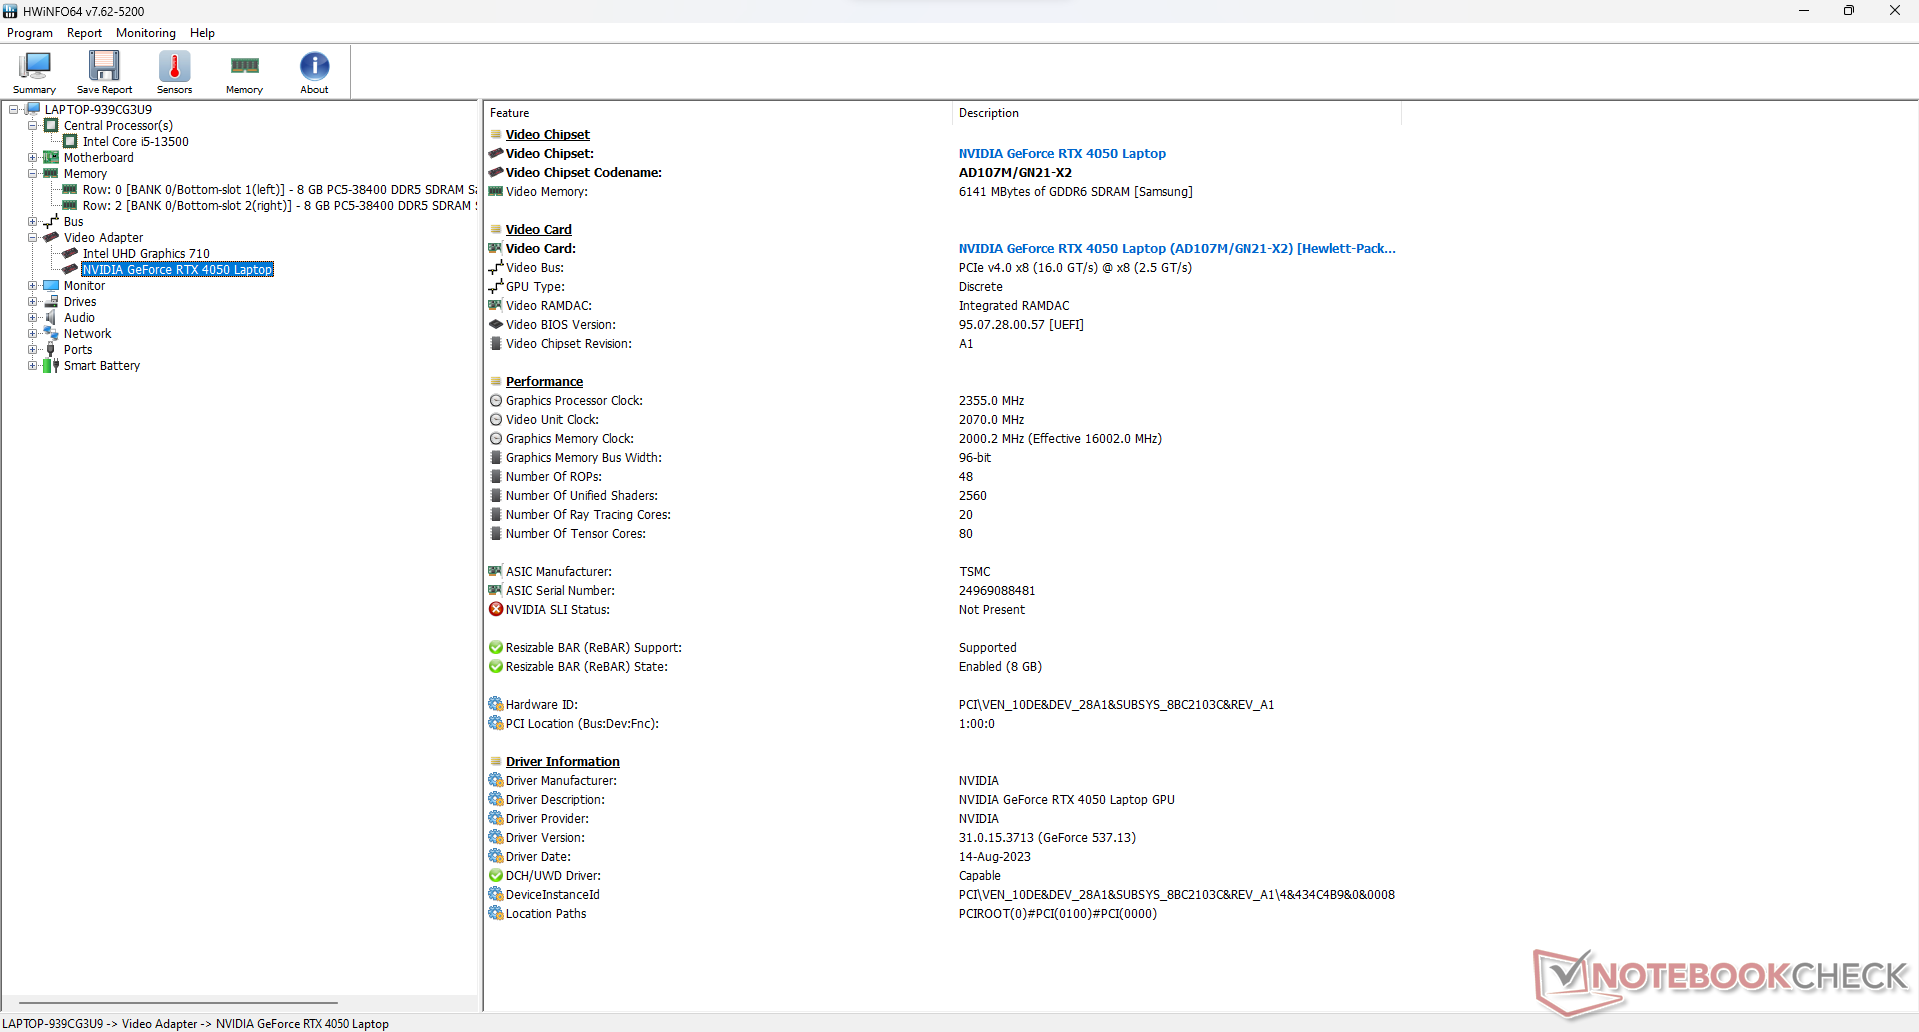
O HP Victus 16-r0076TX oferece uma combinação interessante de hardware de médio porte, um processador Intel Core i5-13500HXraptor Lake-HX e uma placa de vídeo Nvidia GeForce RTX 4050 (Ada Lovelace).
É uma melhoria significativa em relação à sua última iteração, o HP Victus 16-e0145ngque executava um processador AMD Ryzen 5 5600H e Nvidia GeForce RTX 3050 Ti. No entanto, a atualização das especificações também vem com um aumento de custo correspondente.
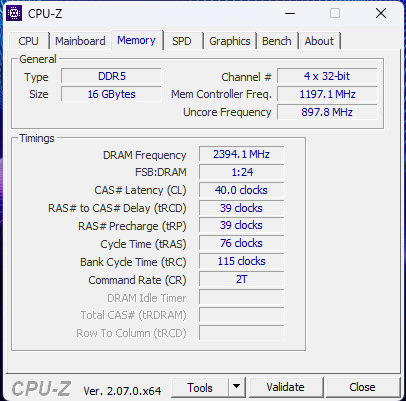
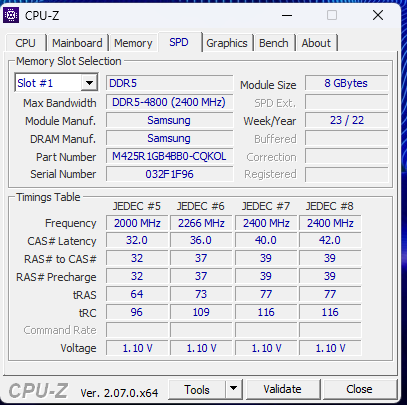
Outras especificações incluem um painel IPS FHD (1.920 x 1.080) de 16 polegadas com clock de 165 Hz, um SSD NVMe de 512 GB e 16 GB de RAM DDR5 (4.800 MT/s). É uma máquina interessante que pode satisfazer o desejo da maioria dos gamers.
Possíveis concorrentes em comparação
Avaliação | Data | Modelo | Peso | Altura | Size | Resolução | Preço |
|---|---|---|---|---|---|---|---|
| 85.6 % v7 (old) | 09/2023 | HP Victus 16-r0076TX i5-13500HX, GeForce RTX 4050 Laptop GPU | 2.3 kg | 22.9 mm | 16.10" | 1920x1080 | |
| 86.7 % v7 (old) | 08/2023 | Acer Nitro 16 AN16-41-R7YE R5 7535HS, GeForce RTX 4050 Laptop GPU | 2.6 kg | 27.9 mm | 16.00" | 1920x1200 | |
| 87.3 % v7 (old) | 07/2023 | Acer Predator Triton 14 PT14-51 i7-13700H, GeForce RTX 4050 Laptop GPU | 1.7 kg | 19.81 mm | 14.00" | 2560x1600 | |
| 88.3 % v7 (old) | 09/2023 | Alienware m16 R1 Intel i7-13700HX, GeForce RTX 4060 Laptop GPU | 3 kg | 25.4 mm | 16.00" | 2560x1600 | |
| 89.5 % v7 (old) | 07/2023 | Acer Predator Helios 16 PH16-71-731Q i7-13700HX, GeForce RTX 4060 Laptop GPU | 2.6 kg | 26.9 mm | 16.00" | 2560x1600 | |
| 84.2 % v7 (old) | 06/2023 | Dell G15 5530 i7-13650HX, GeForce RTX 4060 Laptop GPU | 3 kg | 26.95 mm | 15.60" | 1920x1080 | |
| 89 % v7 (old) | 08/2023 | Lenovo Legion Pro 5 16ARX8 (R5 7645HX, RTX 4050) R5 7645HX, GeForce RTX 4050 Laptop GPU | 2.5 kg | 27.3 mm | 16.00" | 2560x1600 | |
| 85.7 % v7 (old) | 07/2023 | Lenovo LOQ 15APH8 R7 7840HS, GeForce RTX 4050 Laptop GPU | 2.5 kg | 25.2 mm | 15.60" | 1920x1080 |
Caixa: Corpo de plástico resistente com uma tela frágil
Logo que sai da caixa, fica óbvio que o HP Victus 16 não é muito portátil. Por outro lado, os laptops para jogos raramente são leves e, com 2,3 kg, o laptop está na extremidade mais leve do espectro.
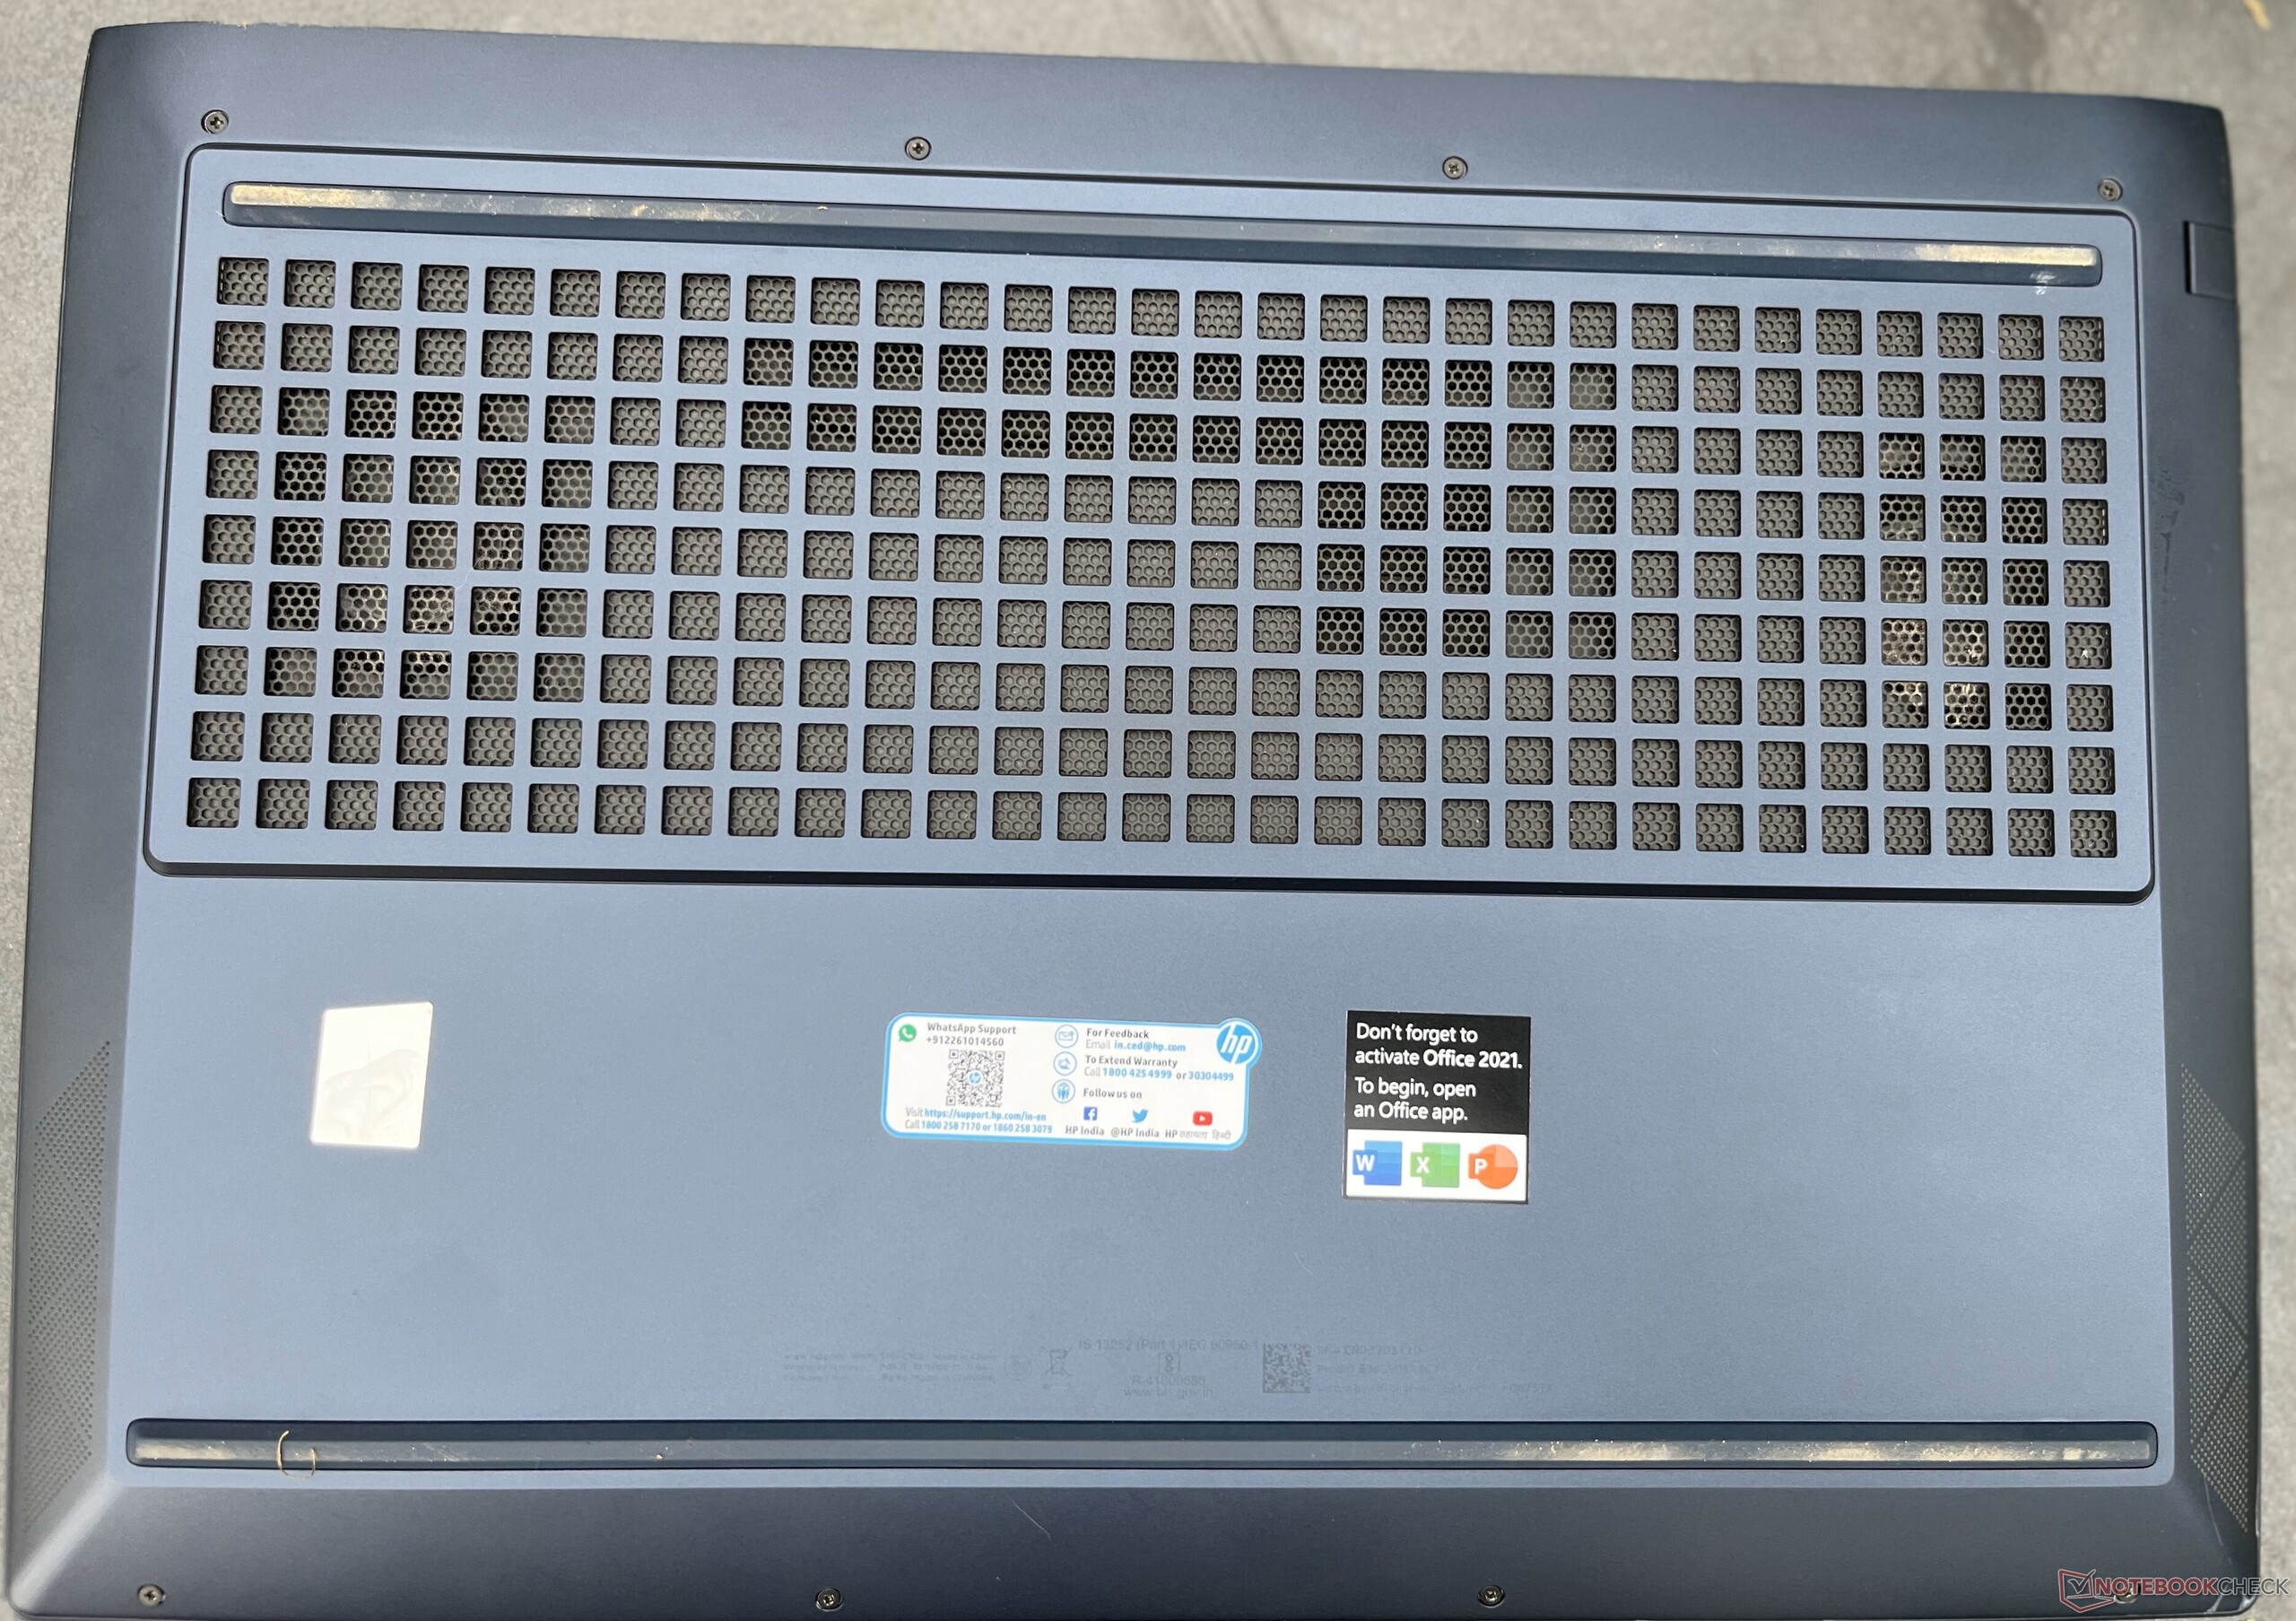
O chassi todo preto não tem muita marca, exceto por um "V" na parte de trás e um conjunto padrão de adesivos na frente. A HP pretende manter o laptop limpo incluindo um filtro de poeira em todas as aberturas.
Uma tela de 16 polegadas permite que a HP inclua um teclado completo (numpad incluído) no Victus 16. A tela se flexiona um pouco demais, e seria bom se a HP a revisasse nas versões posteriores.
Conectividade: Poderia ter mais E/S
A E/S no HP Victus 16 é surpreendentemente leve para um laptop para jogos. À direita, há uma porta USB-C, duas portas USB-A (todas as três classificadas em 5 Gbps) e uma porta HDMI 2.1 em uma extremidade. Ao lado dela, há um conector de pino cilíndrico para o carregador. As portas USB e HDMI estão um pouco próximas demais para o conforto, especialmente perto da porta HDMI.
Do outro lado, há apenas um conector Ethernet RJ-45, uma porta USB Tipo A e um conector de áudio de 3,5 mm. Teria sido bom ter alguma E/S adicional na parte traseira. A porta USB-C parece quase uma reflexão tardia, dada sua baixa velocidade.


Comunicação
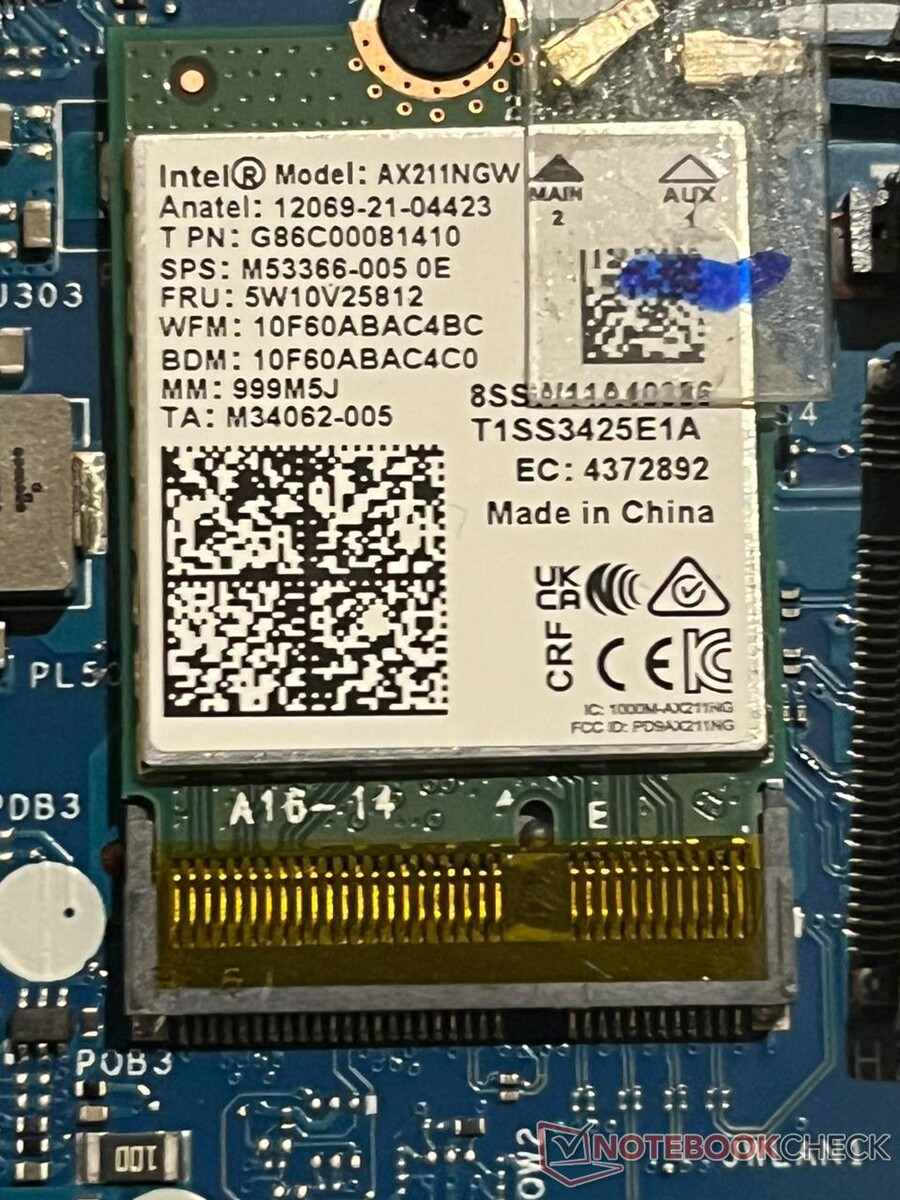
Para um laptop de nível básico, o HP Victus 16 tem uma boa variedade de opções de rede. Você tem Wi-Fi 6E e uma porta Ethernet, que permitem a transferência de arquivos em alta velocidade.
No iPerf3, o modem Wi-Fi 6E da Intel pôde receber dados a 1.646 Mbps com nosso roteador Asus ROG Rapture AXE11000. Isso é muito mais rápido do que seus concorrentes, que geralmente não possuem a funcionalidade Wi-Fi 6.
| Networking / iperf3 transmit AXE11000 | |
| Lenovo Legion Pro 5 16ARX8 (R5 7645HX, RTX 4050) | |
| Dell G15 5530 | |
| HP Victus 16-r0076TX | |
| Acer Predator Triton 14 PT14-51 | |
| Acer Nitro 16 AN16-41-R7YE | |
| Acer Predator Helios 16 PH16-71-731Q | |
| Alienware m16 R1 Intel | |
| Média da turma Gaming (560 - 1862, n=89, últimos 2 anos) | |
| Média Intel Wi-Fi 6E AX211 (64 - 1921, n=276) | |
| Lenovo LOQ 15APH8 | |
| Networking / iperf3 receive AXE11000 | |
| Acer Predator Triton 14 PT14-51 | |
| Acer Nitro 16 AN16-41-R7YE | |
| Alienware m16 R1 Intel | |
| Lenovo Legion Pro 5 16ARX8 (R5 7645HX, RTX 4050) | |
| Dell G15 5530 | |
| HP Victus 16-r0076TX | |
| Média da turma Gaming (680 - 1745, n=89, últimos 2 anos) | |
| Acer Predator Helios 16 PH16-71-731Q | |
| Média Intel Wi-Fi 6E AX211 (582 - 1890, n=276) | |
| Lenovo LOQ 15APH8 | |
| Networking / iperf3 transmit AXE11000 6GHz | |
| Lenovo Legion Pro 5 16ARX8 (R5 7645HX, RTX 4050) | |
| Acer Predator Helios 16 PH16-71-731Q | |
| HP Victus 16-r0076TX | |
| Média da turma Gaming (723 - 1868, n=37, últimos 2 anos) | |
| Média Intel Wi-Fi 6E AX211 (385 - 1851, n=226) | |
| Networking / iperf3 receive AXE11000 6GHz | |
| Lenovo Legion Pro 5 16ARX8 (R5 7645HX, RTX 4050) | |
| HP Victus 16-r0076TX | |
| Média da turma Gaming (975 - 1775, n=36, últimos 2 anos) | |
| Média Intel Wi-Fi 6E AX211 (700 - 1857, n=226) | |
| Acer Predator Helios 16 PH16-71-731Q | |
Webcam
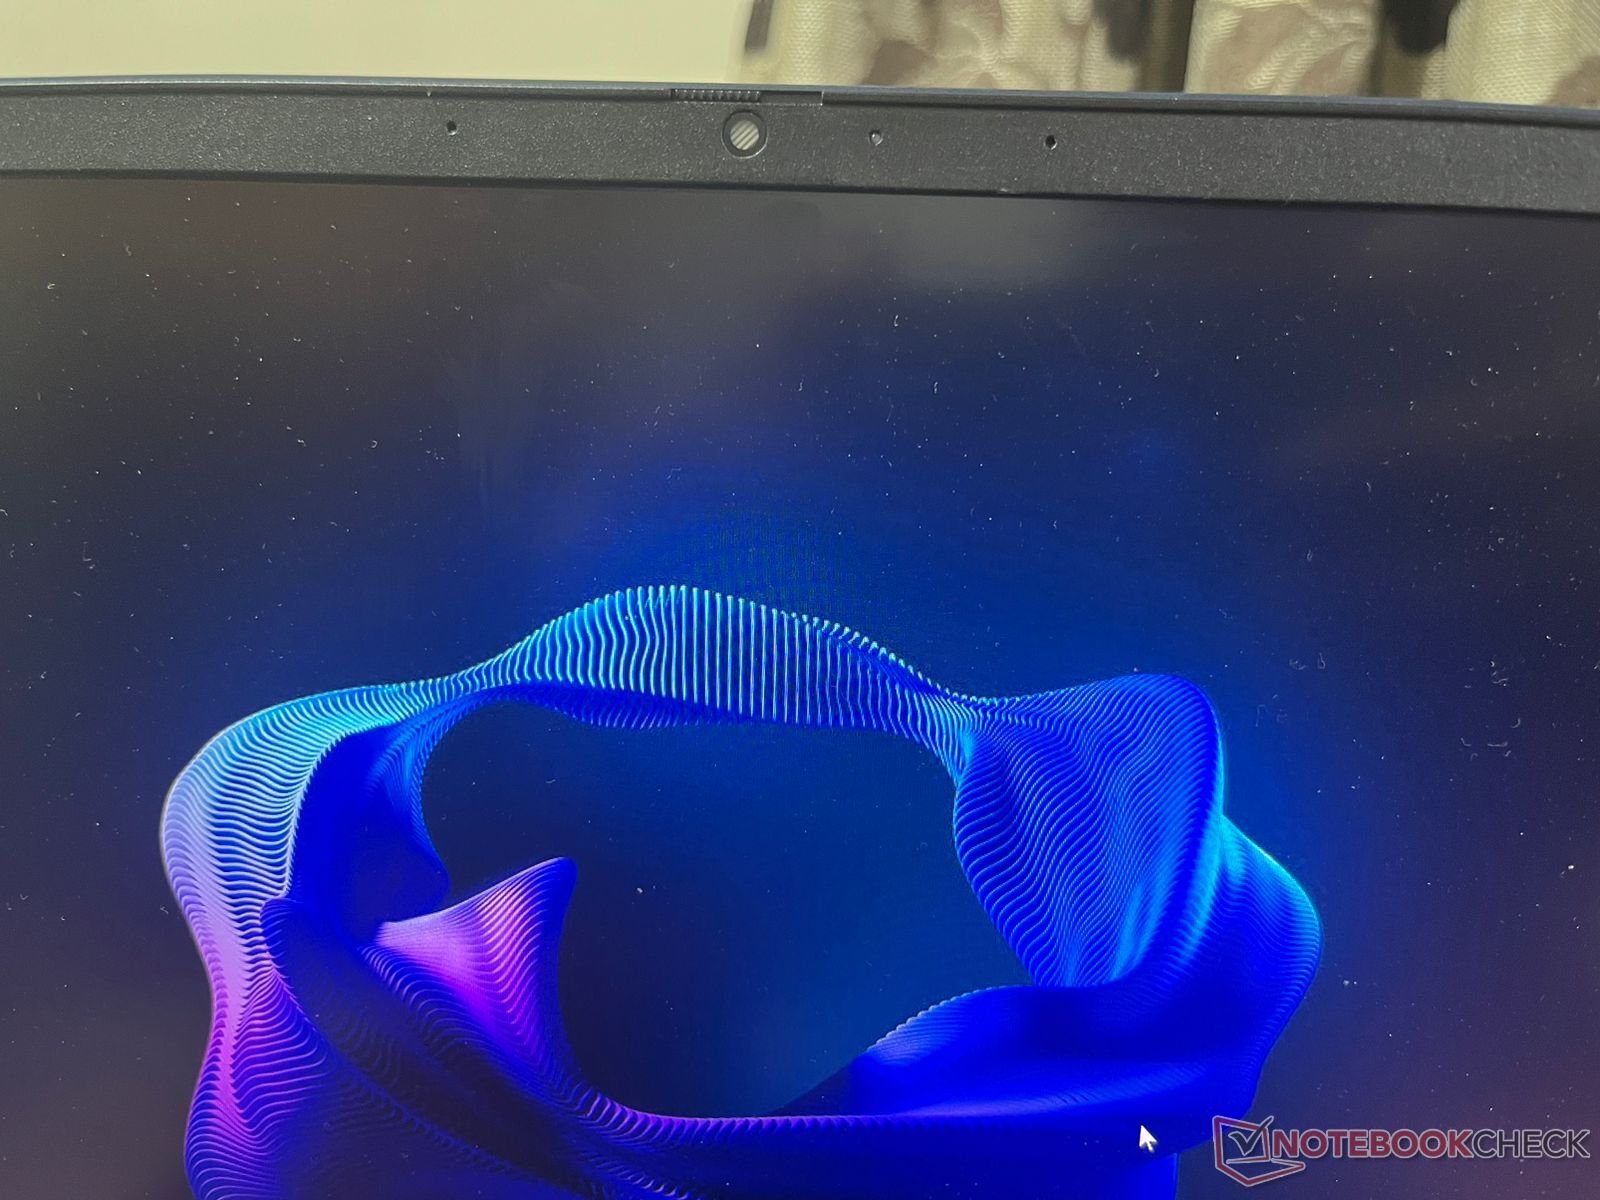
As webcams são uma raridade nos notebooks para jogos, e o fato de o HP Victus 16 incluir até mesmo um módulo de 1080p (~2 MP) é nada menos que um bônus. Ela não é muito precisa em termos de cores, mas deve cobrir tarefas básicas, como videoconferências e chamadas.
Há até um obturador de privacidade físico (difícil de encontrar) que desliga totalmente a câmera. Além disso, há uma seção dedicada no Omen Gaming Hub para aprimoramentos de câmera/microfone usando o Nvidia Broadcast.


Segurança
Os recursos de segurança estão completamente ausentes no HP Victus 16, exceto por um módulo TPM, que é necessário para o Windows 11. Não há sinal de um sensor de impressão digital, Windows Hello ou mesmo um slot Kensington Lock.
Acessórios e garantia
Não há muito o que falar sobre a embalagem do HP Victus 16. Ela é bem simples, com apenas o laptop e uma fonte de alimentação. Entretanto, este último é notavelmente grande, como é o caso da maioria dos laptops para jogos.
A HP Índia oferece uma garantia limitada de um ano para o Victus 16. Com um acréscimo de ₹2.999, você ganha dois anos adicionais de garantia e um plano antivírus por três anos. No entanto, a oferta é válida por tempo limitado.
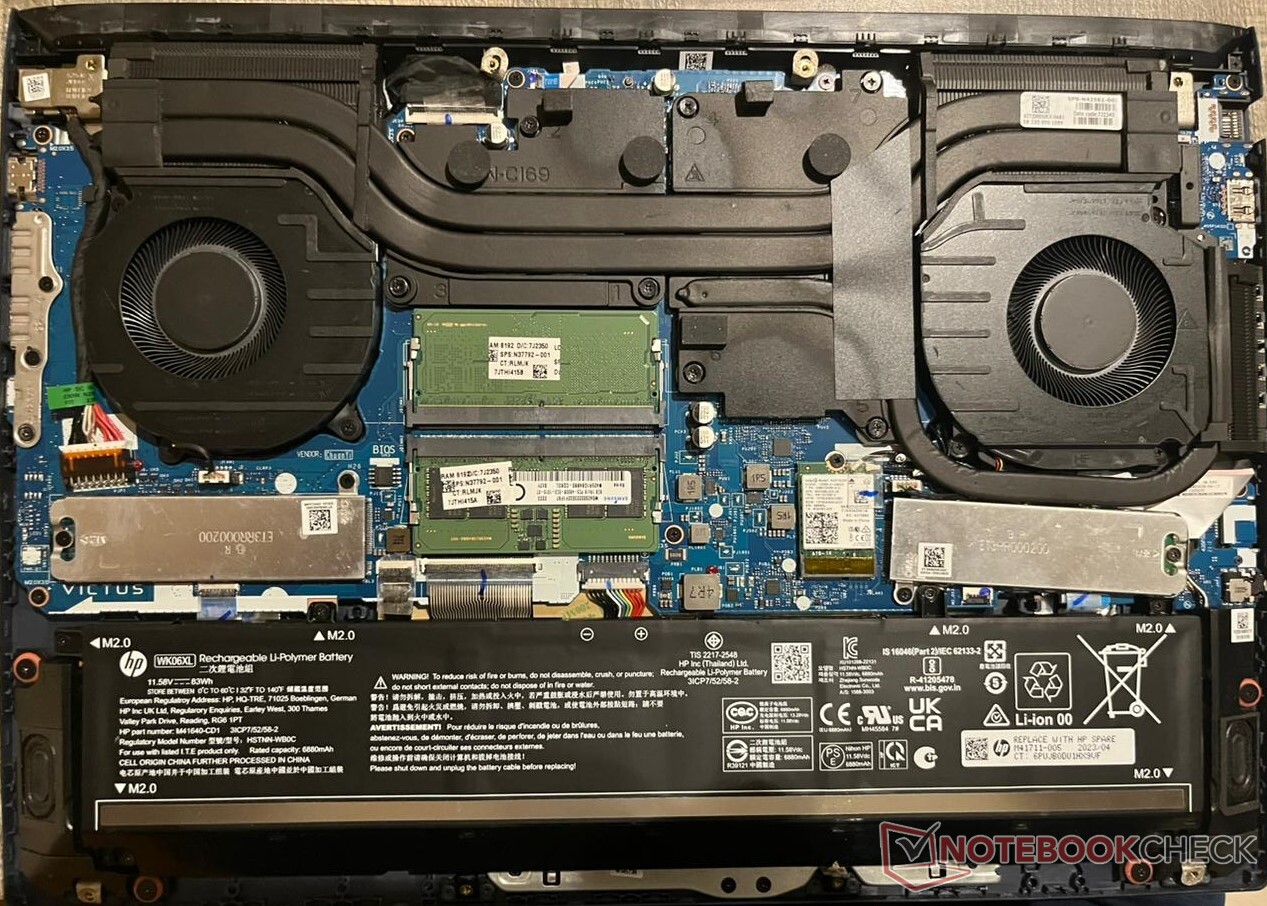
Manutenção
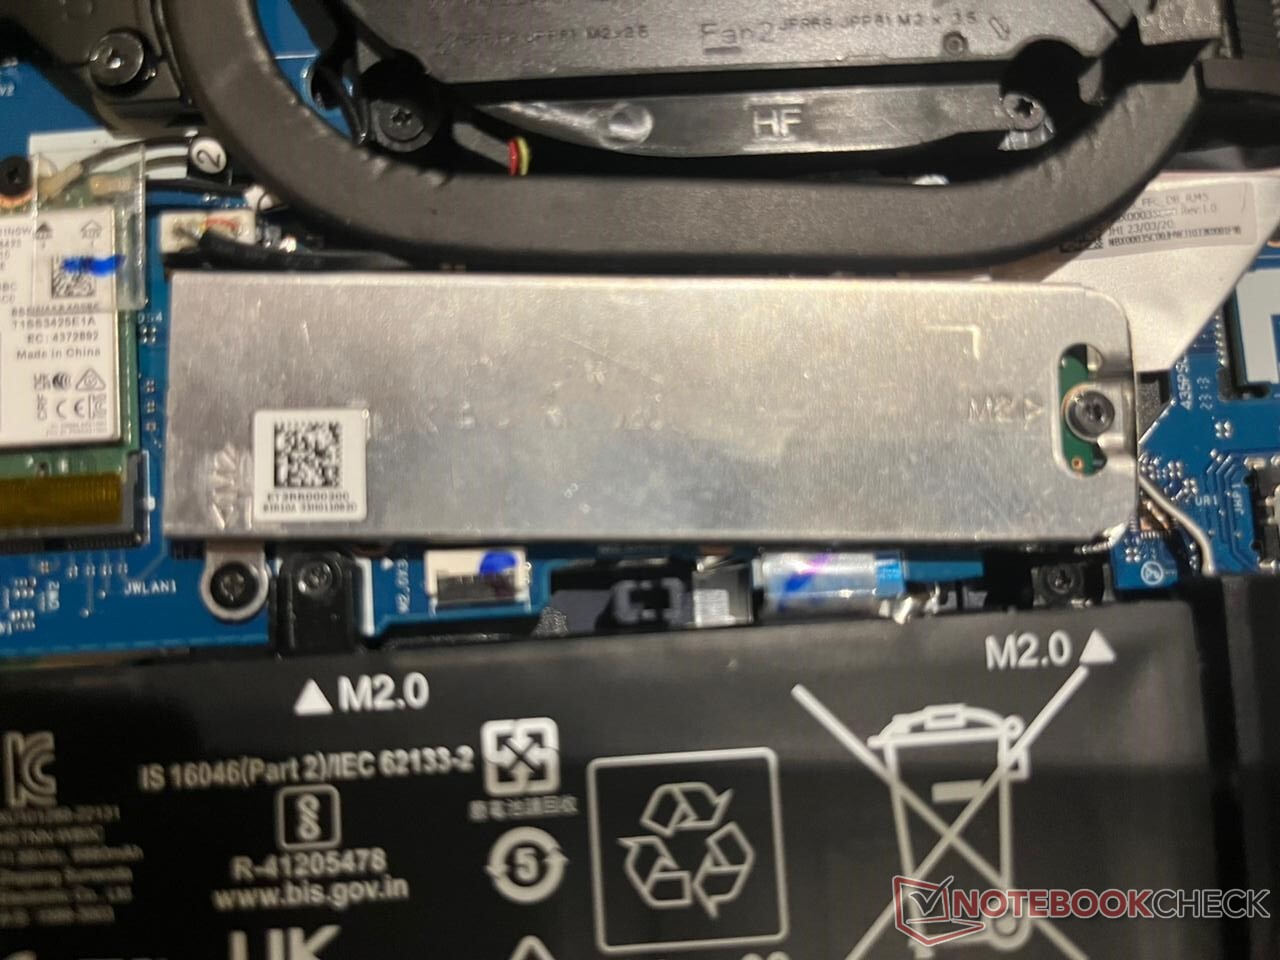
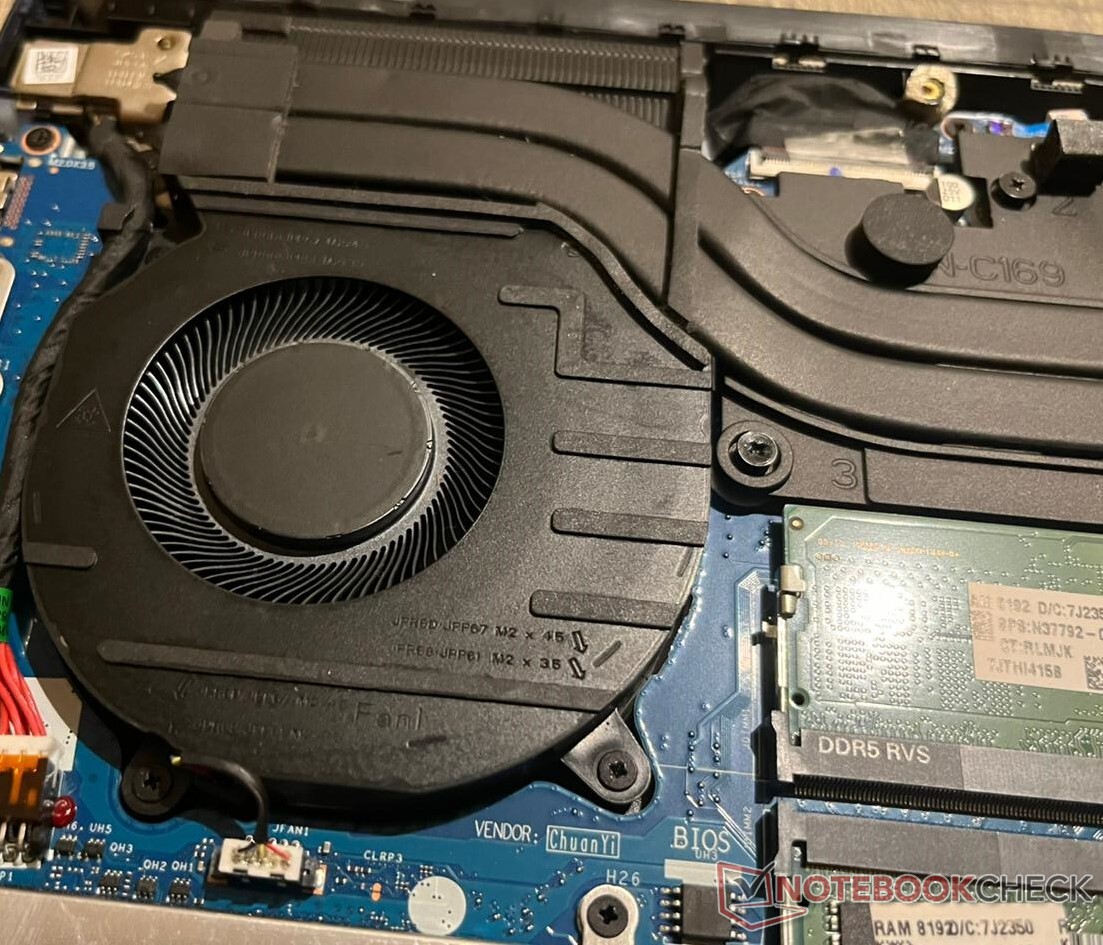
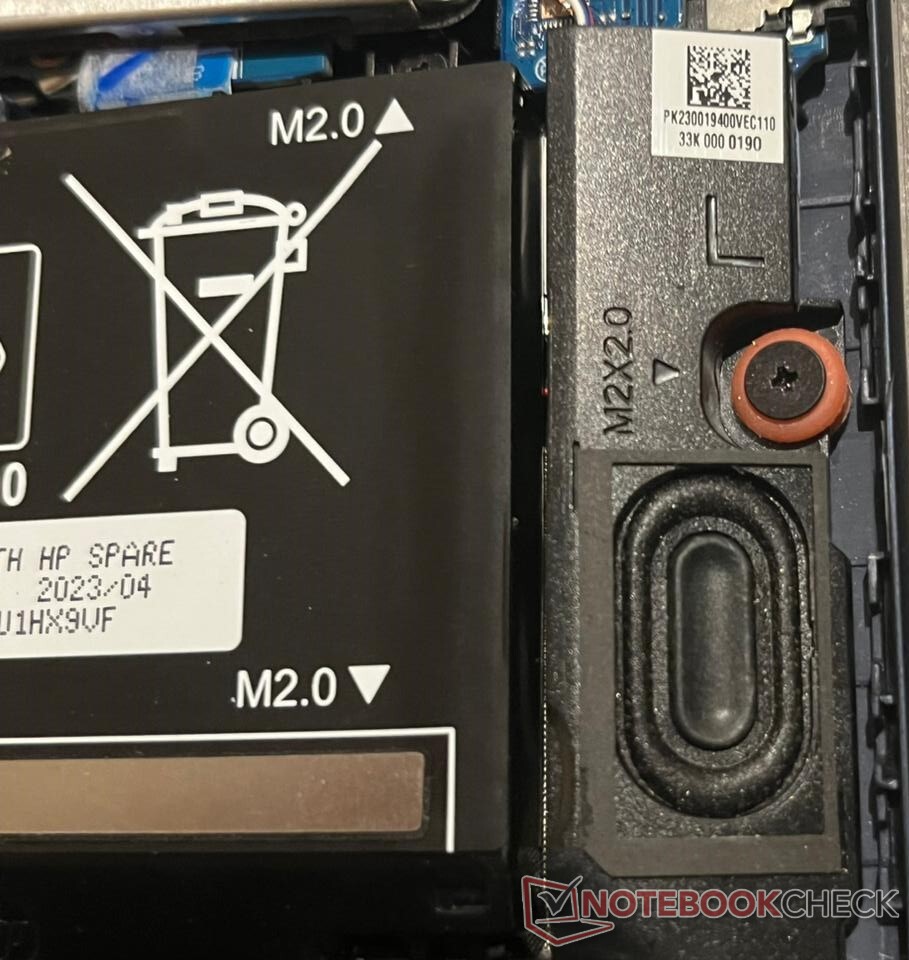
Entrar no HP Victus 16 é muito fácil. Tudo o que você precisa é de uma chave de fenda Philips, soltar oito parafusos na parte traseira e abrir a placa de cobertura. A placa WLAN, a RAM DDR5 e o SSD NVMe podem ser substituídos. A bateria pode ser desparafusada e substituída, se necessário.
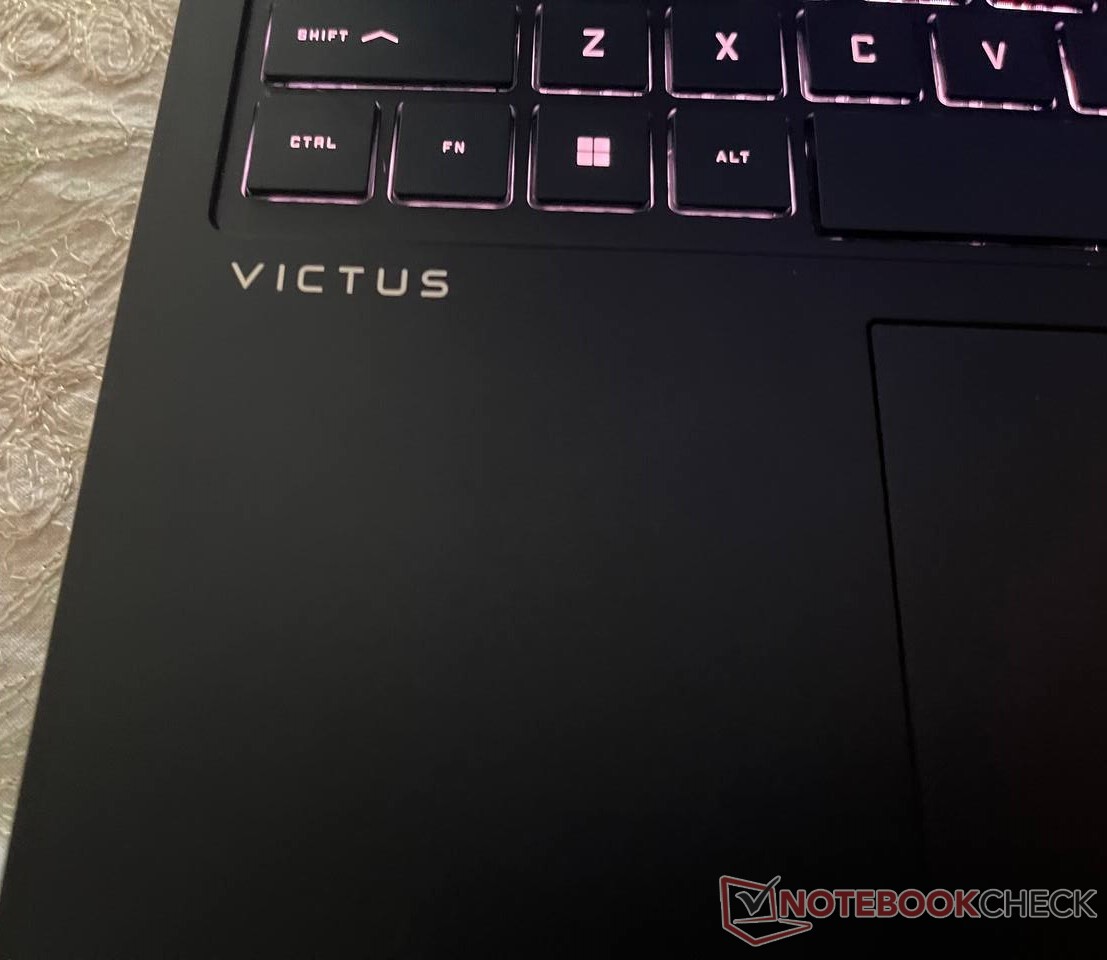
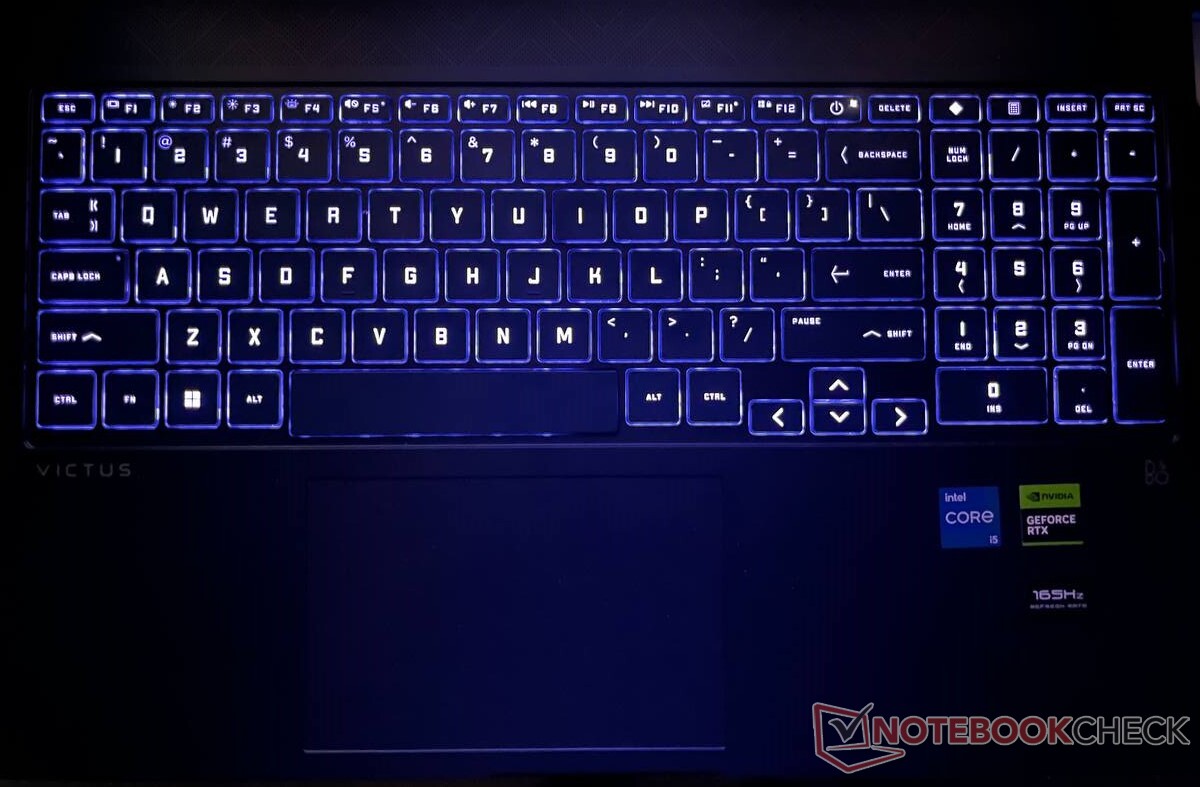
Dispositivos de entrada: Teclado decente com iluminação RGB
O HP Victus 16 vem com um teclado totalmente carregado e um trackpad suficientemente grande. As teclas são grandes e não deve demorar muito para que os usuários de desktop reprogramem sua memória muscular para trabalhar com o laptop. O teclado numérico é uma adição bem-vinda, mas a HP optou por colocar o botão liga/desliga no pior lugar possível, ao lado da tecla delete. Levamos um minuto para encontrar o botão liga/desliga na primeira vez, e temos certeza de que não seremos os únicos.
Teclado
As teclas pareciam um pouco moles, mas não muito imersivas. Aqueles que desejam personalizar a iluminação do teclado podem fazê-lo por meio do aplicativo Omen Lighting.
Há um botão dedicado para abrir o aplicativo Omen Gaming Hub e outro para a calculadora.
Apesar de seu chassi de plástico, o teclado é bastante resistente e não se flexiona muito sob pressão.
Touchpad
O touchpad tem todos os gestos do Windows Precision cobertos. No entanto, o touchpad não é clicável em sua totalidade, sendo que parte da parte superior é rígida.
A rejeição da palma da mão também é adequada, pois ignora os deslizes e cliques acidentais durante a digitação. O rastreamento e os gestos ao longo das bordas funcionam sem problemas.
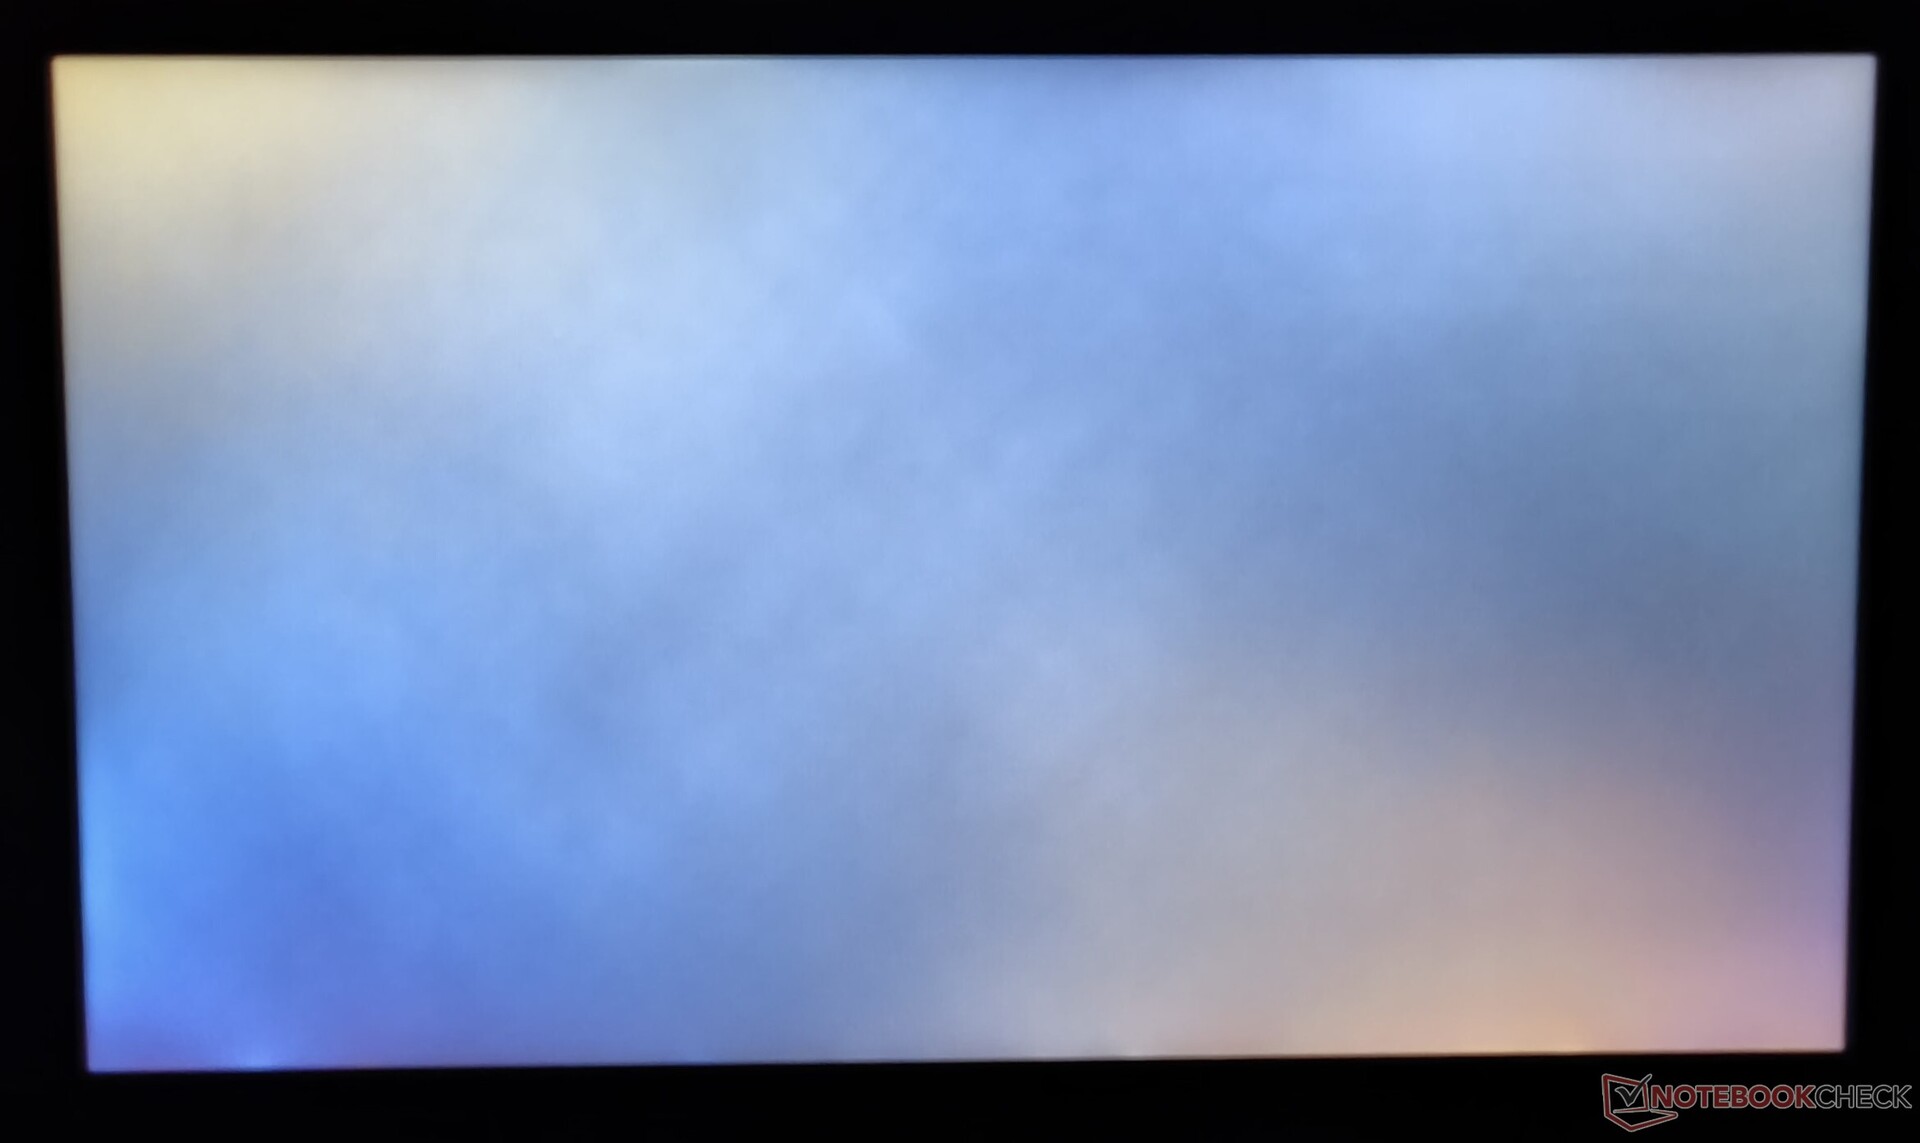
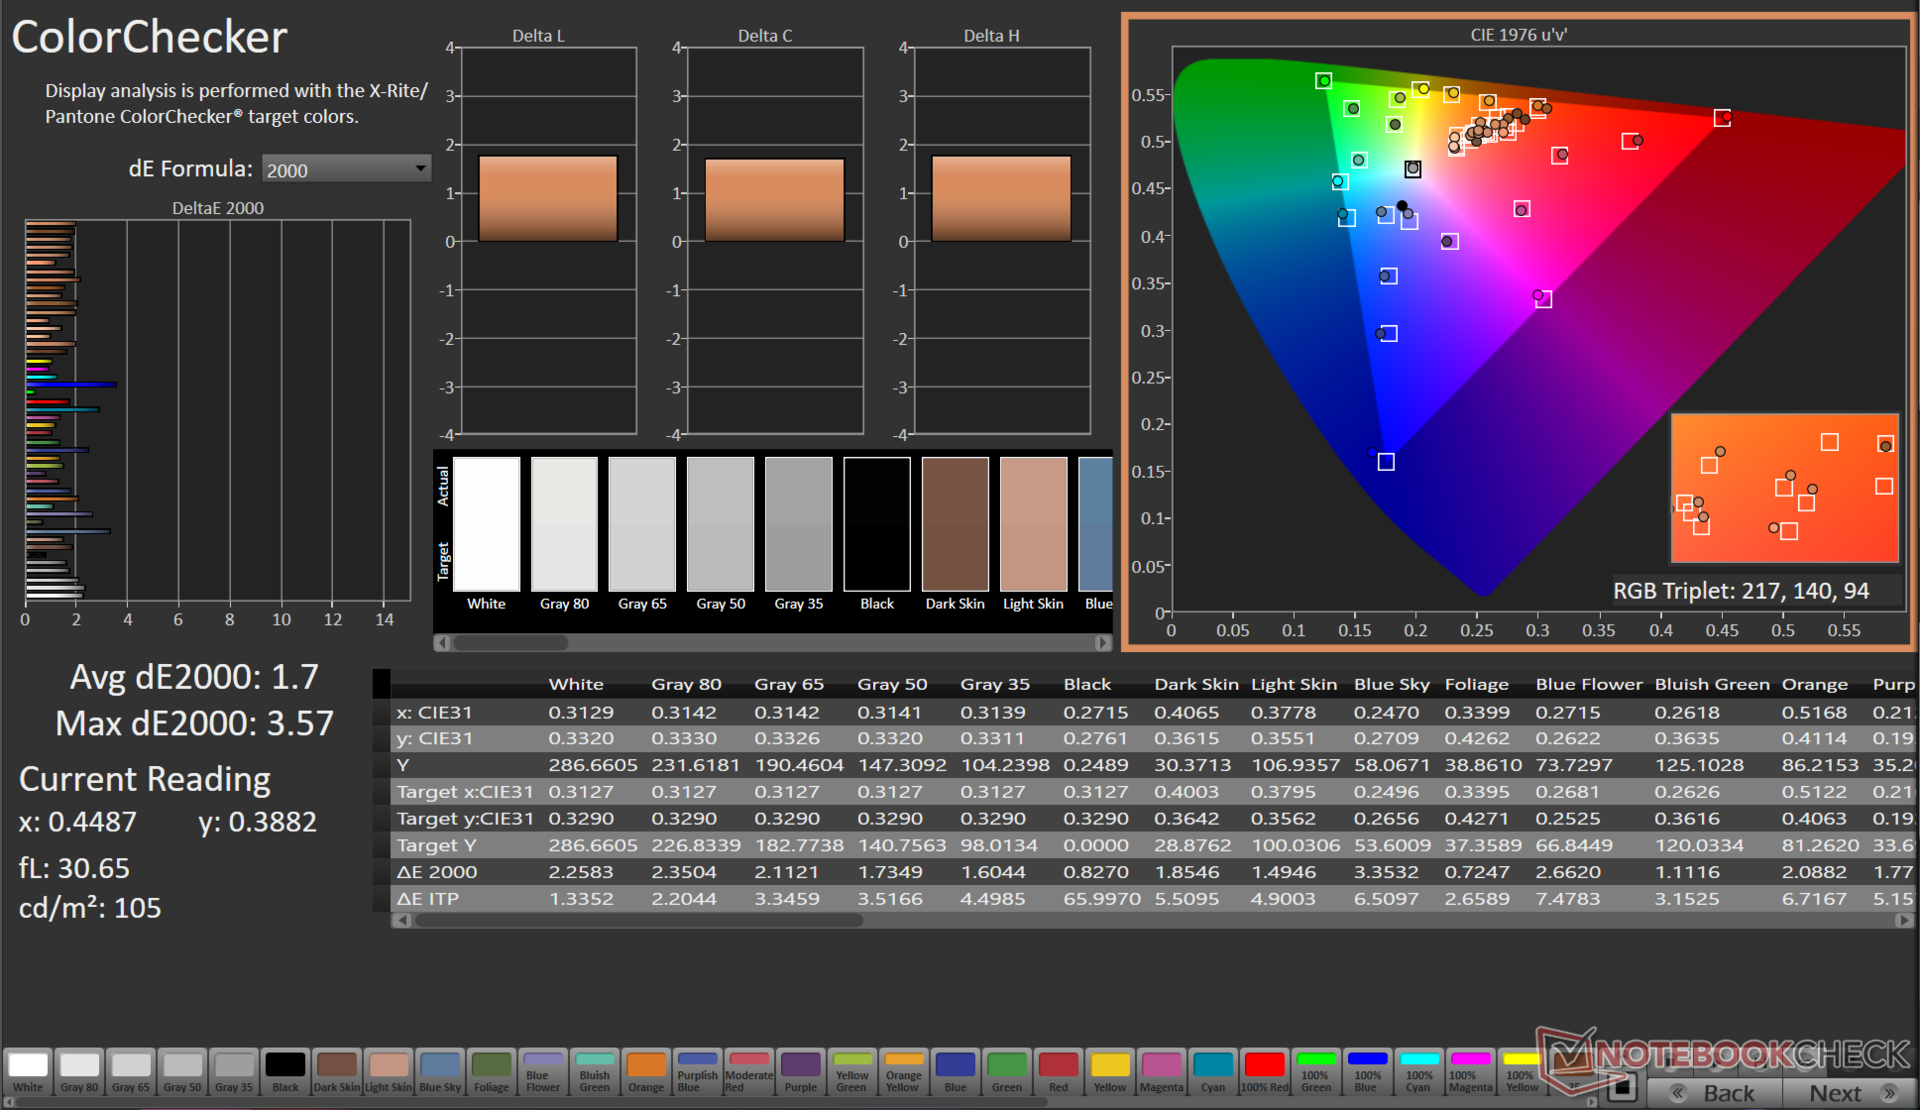
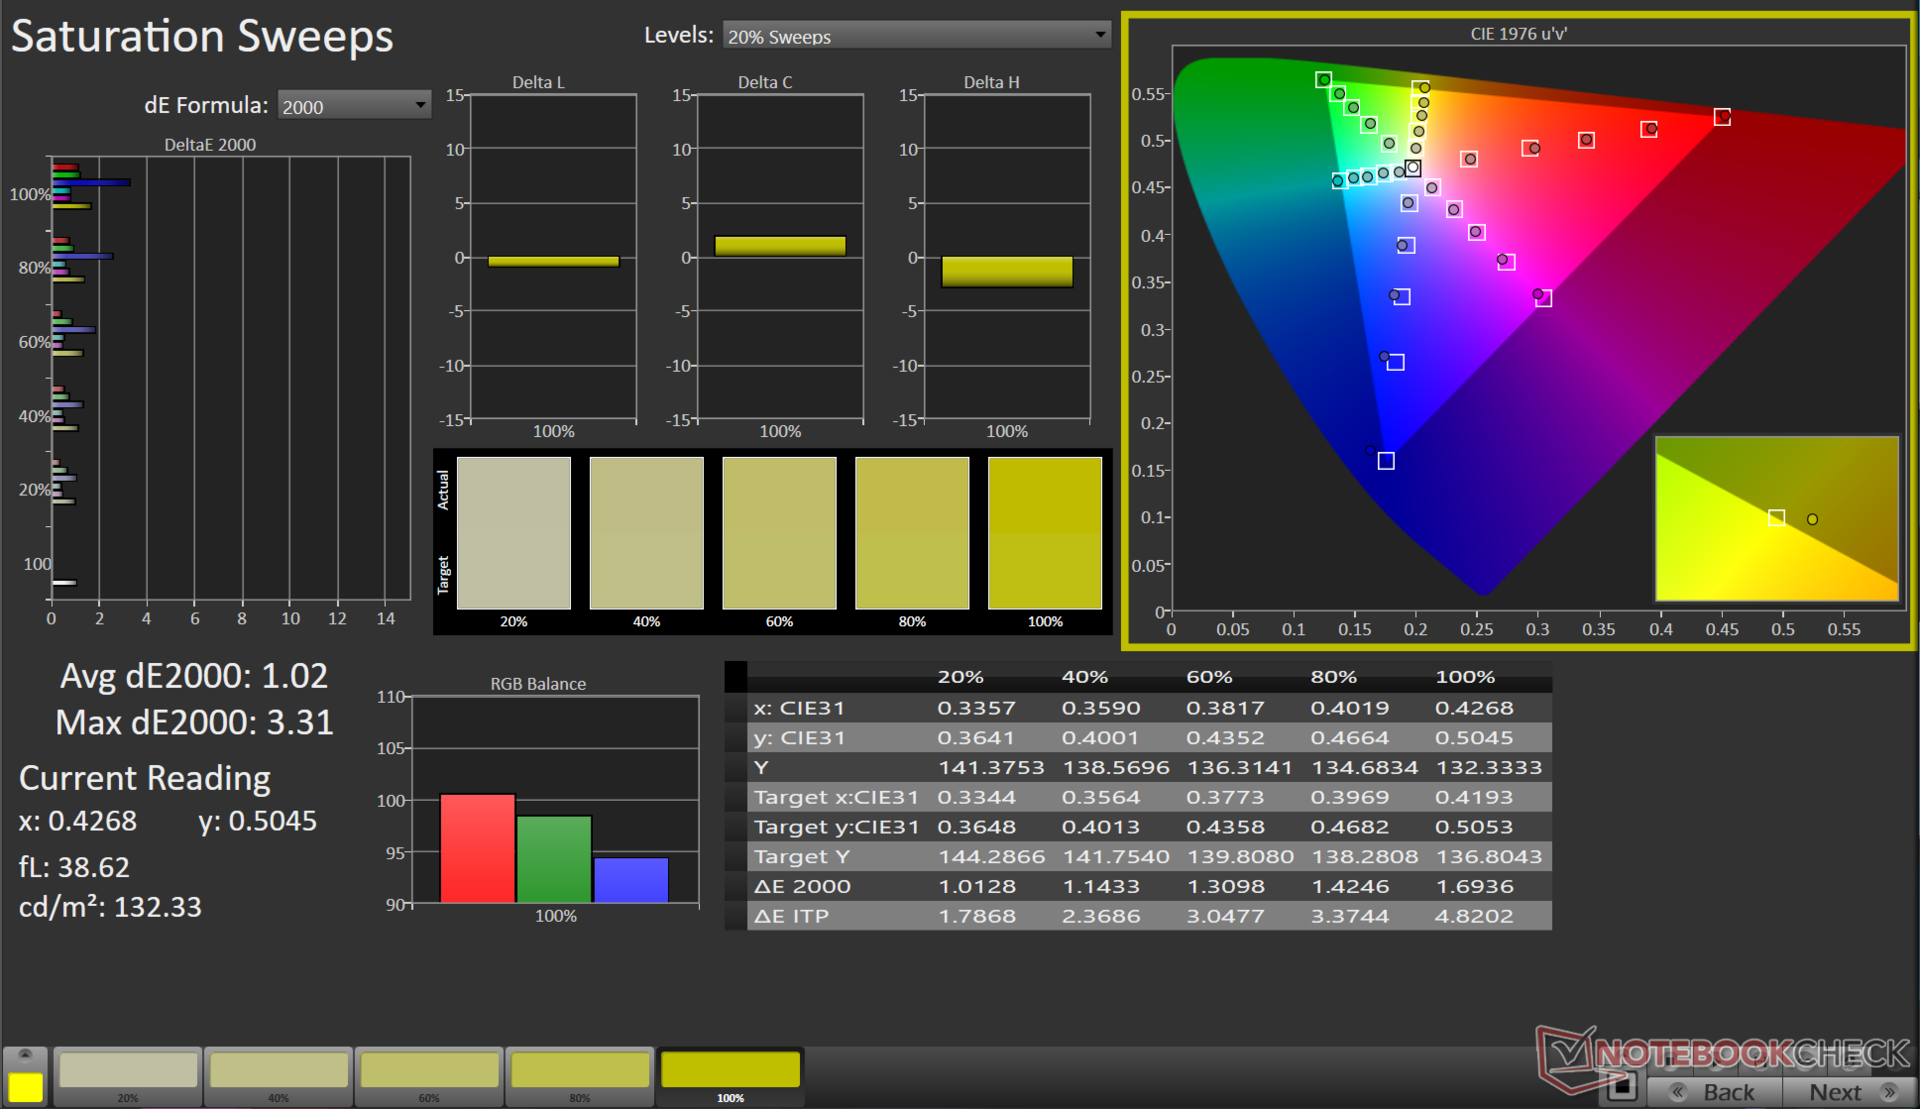
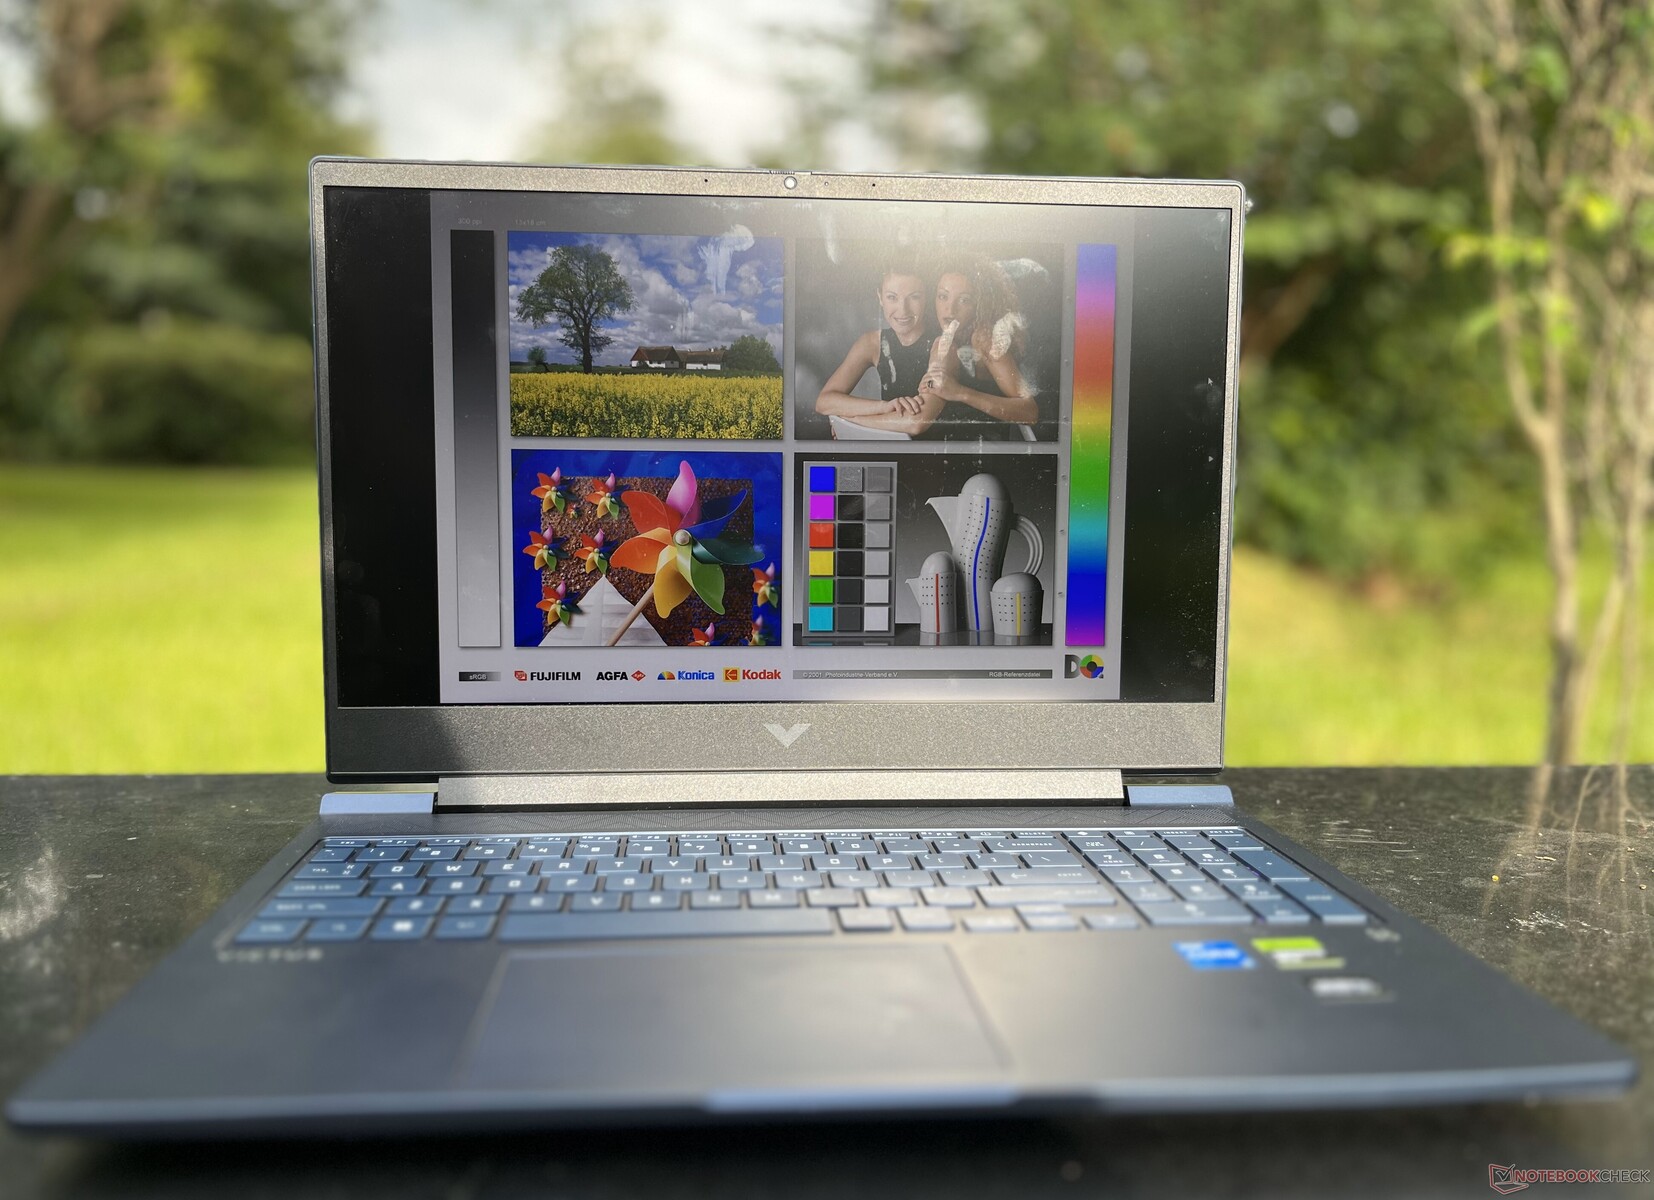
Tela: Uma tela de 165 Hz com brilho abaixo da média
Nossa amostra do HP Victus 16 vem com um painel LCD IPS de 16,1 polegadas FHD (1.920 x 1.080) da Chi Mei. A HP oferece duas opções adicionais de tela com os SKUs do Victus 16, 144 Hz FHD e 240 Hz QHD (2.550 x 1.440).
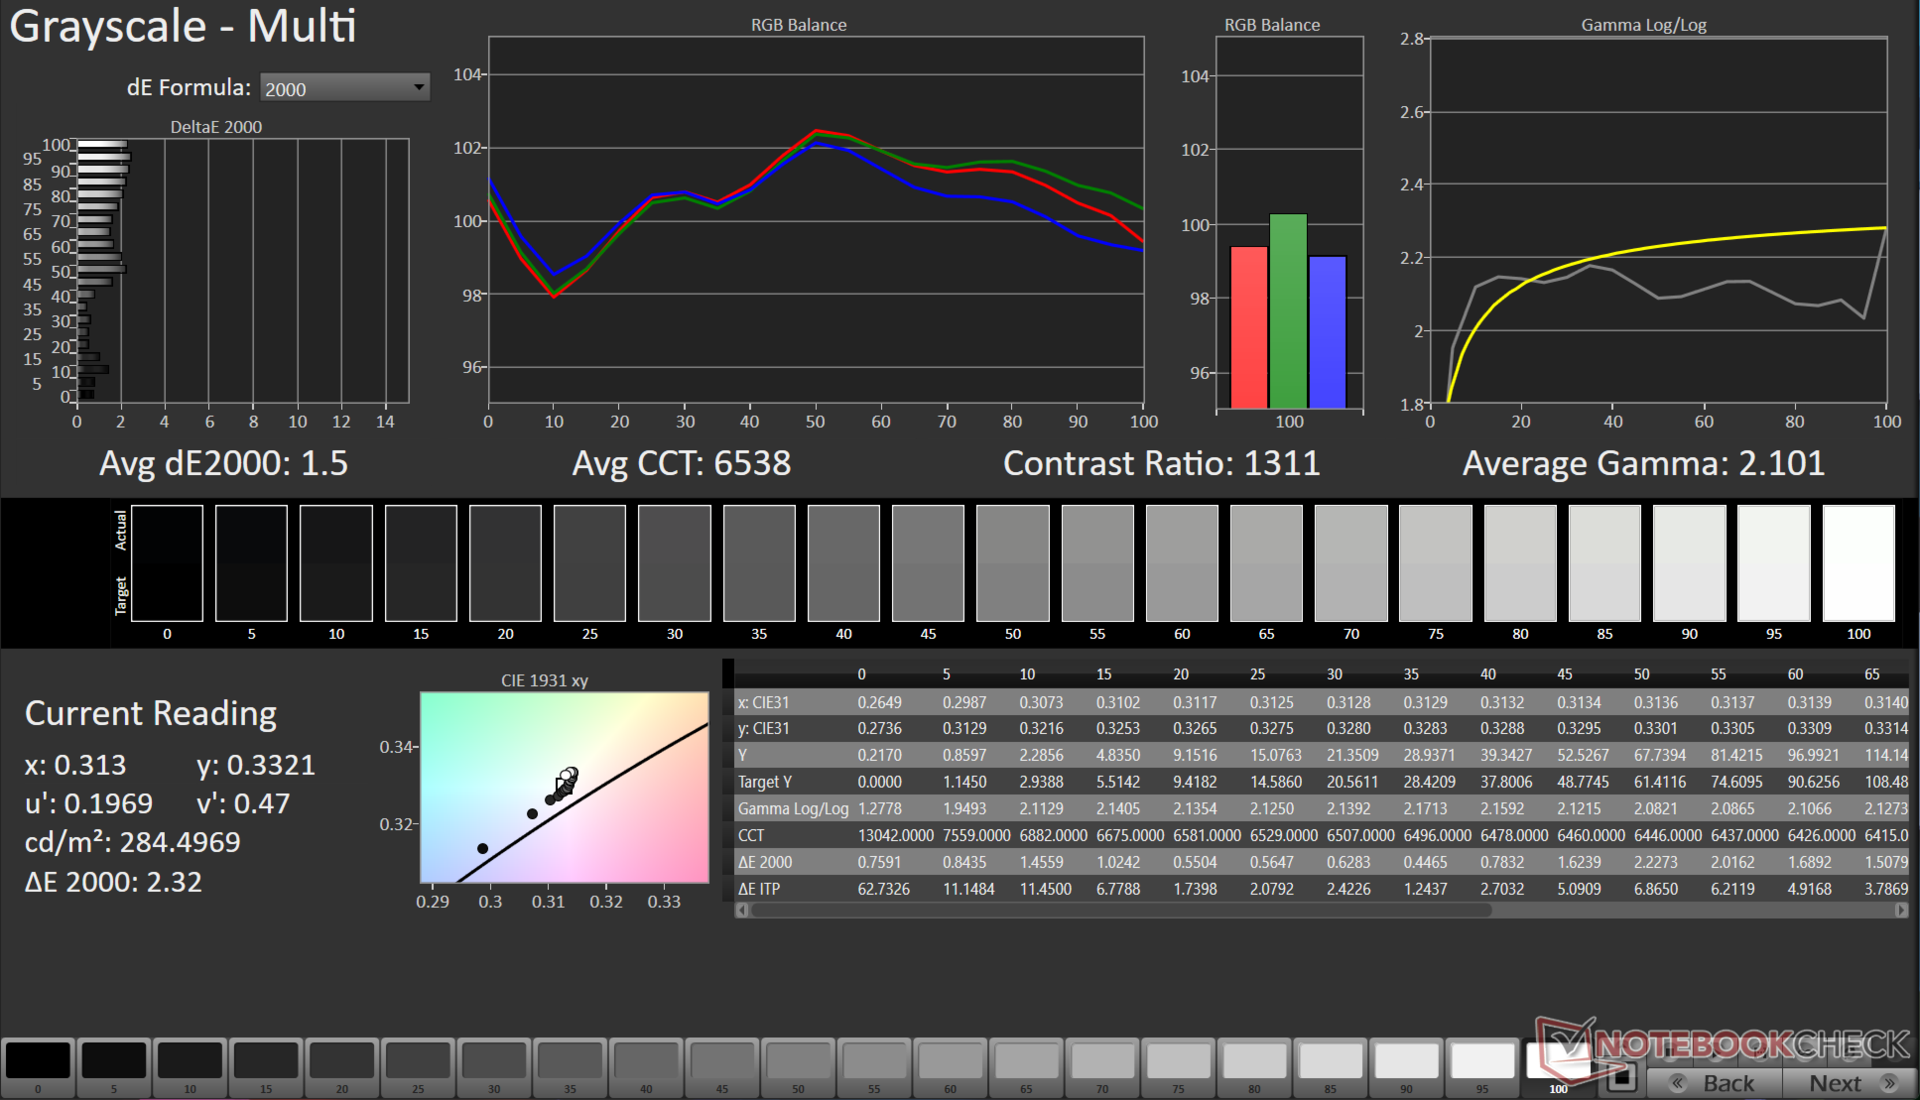
O site da HP afirma que esse painel específico tem um brilho máximo de 300 nits. Nossos testes confirmam o número, mas a distribuição está na extremidade inferior (82%). Ela também é um pouco desequilibrada, especialmente na parte central direita.
Por fim, sua taxa de contraste de 1.381:1 está confortavelmente dentro de uma faixa aceitável. No entanto, o painel é afetado por um caso grave de vazamento de luz de fundo, que é um problema recorrente com as telas IPS em geral.

| |||||||||||||||||||||||||
iluminação: 82 %
iluminação com acumulador: 287 cd/m²
Contraste: 1381:1 (Preto: 0.21 cd/m²)
ΔE ColorChecker Calman: 1.7 | ∀{0.5-29.43 Ø4.72}
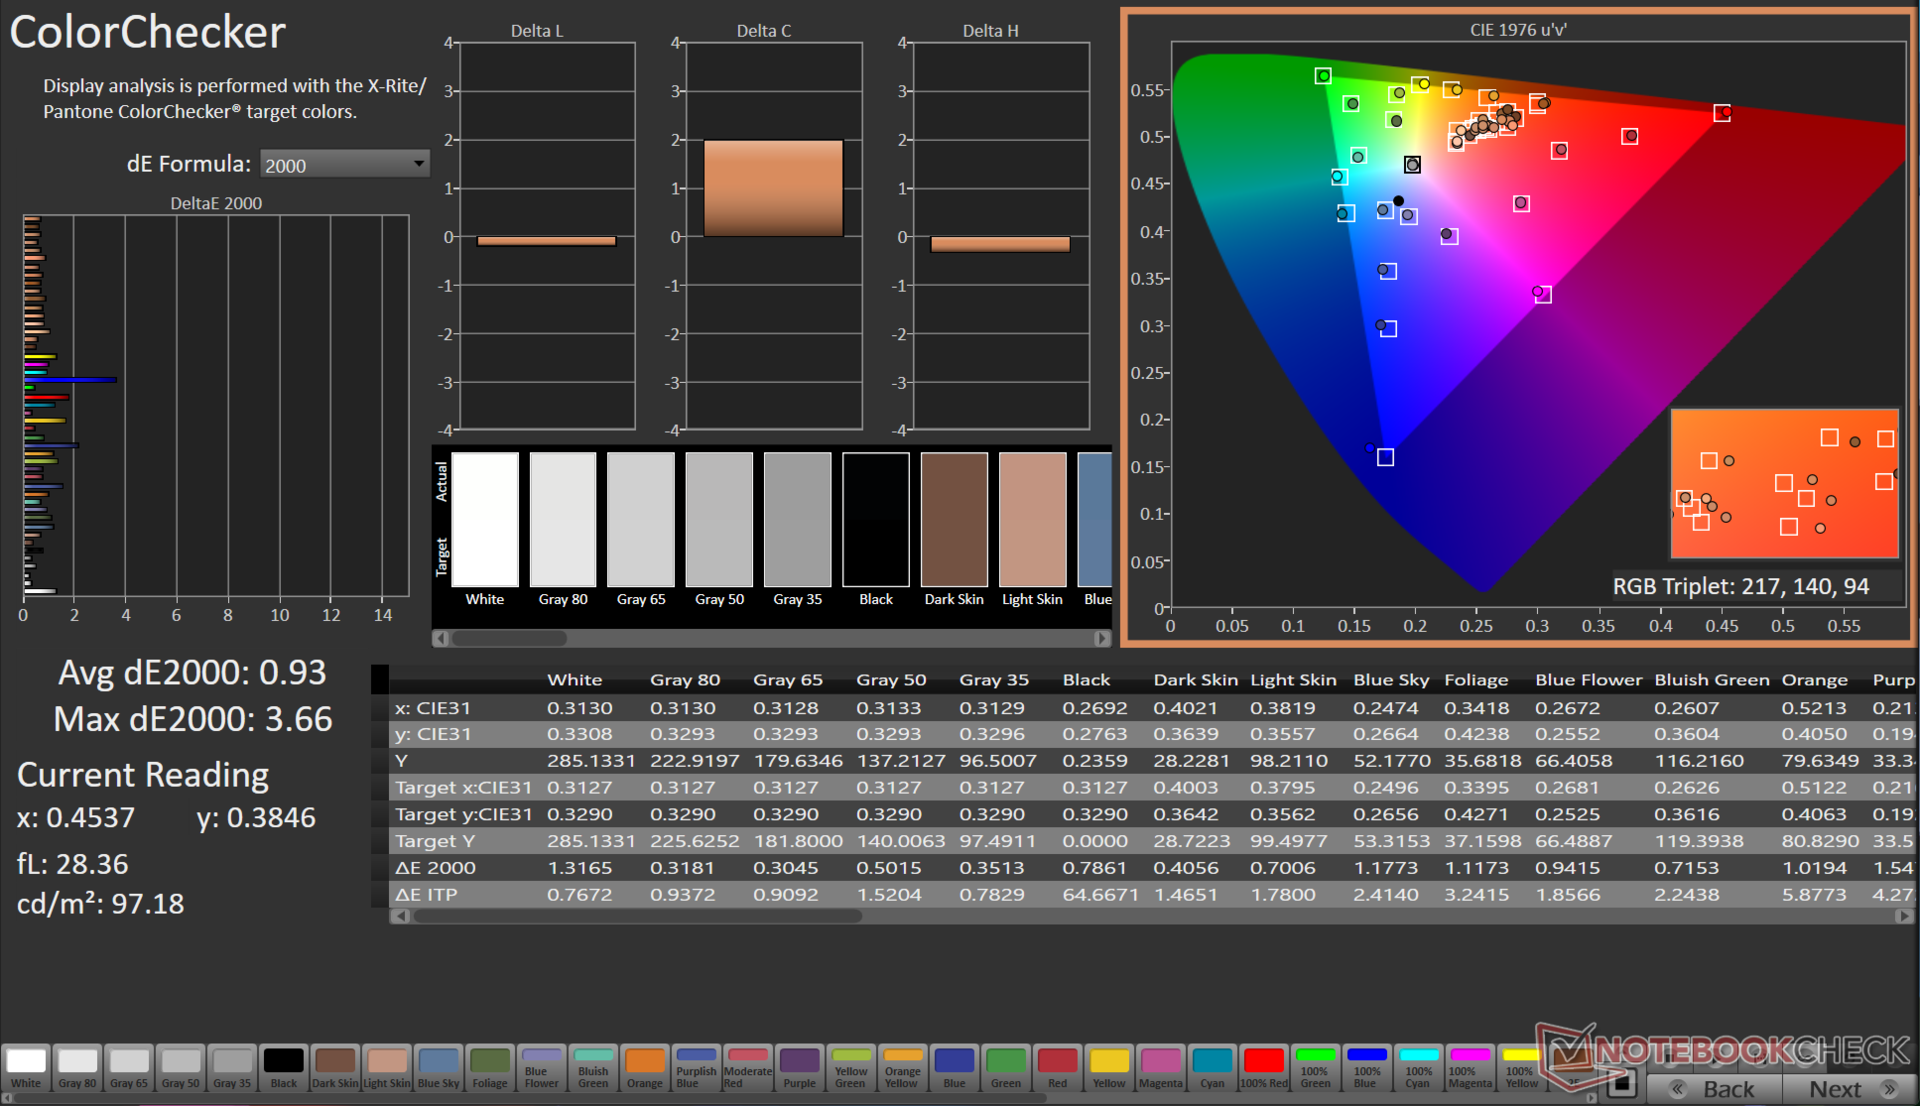
calibrated: 0.93
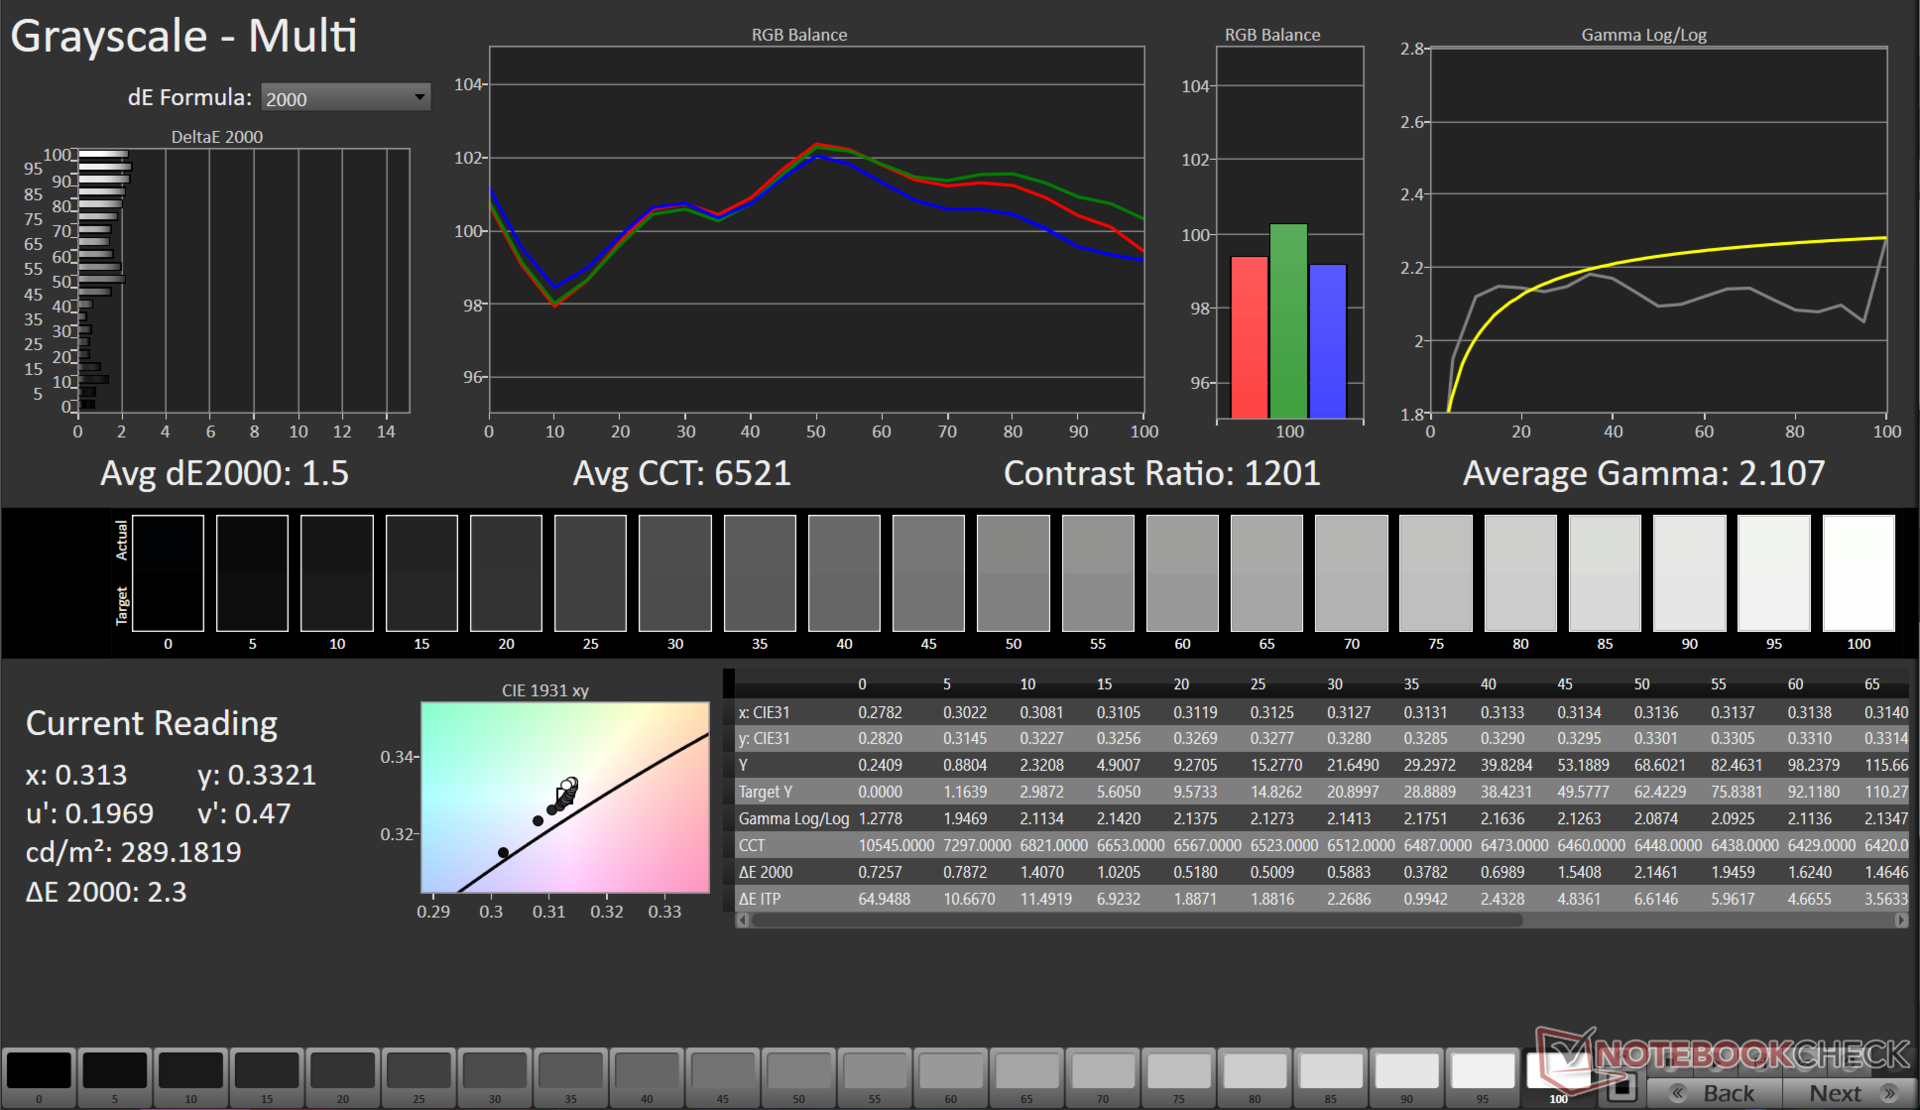
ΔE Greyscale Calman: 1.5 | ∀{0.09-98 Ø4.97}
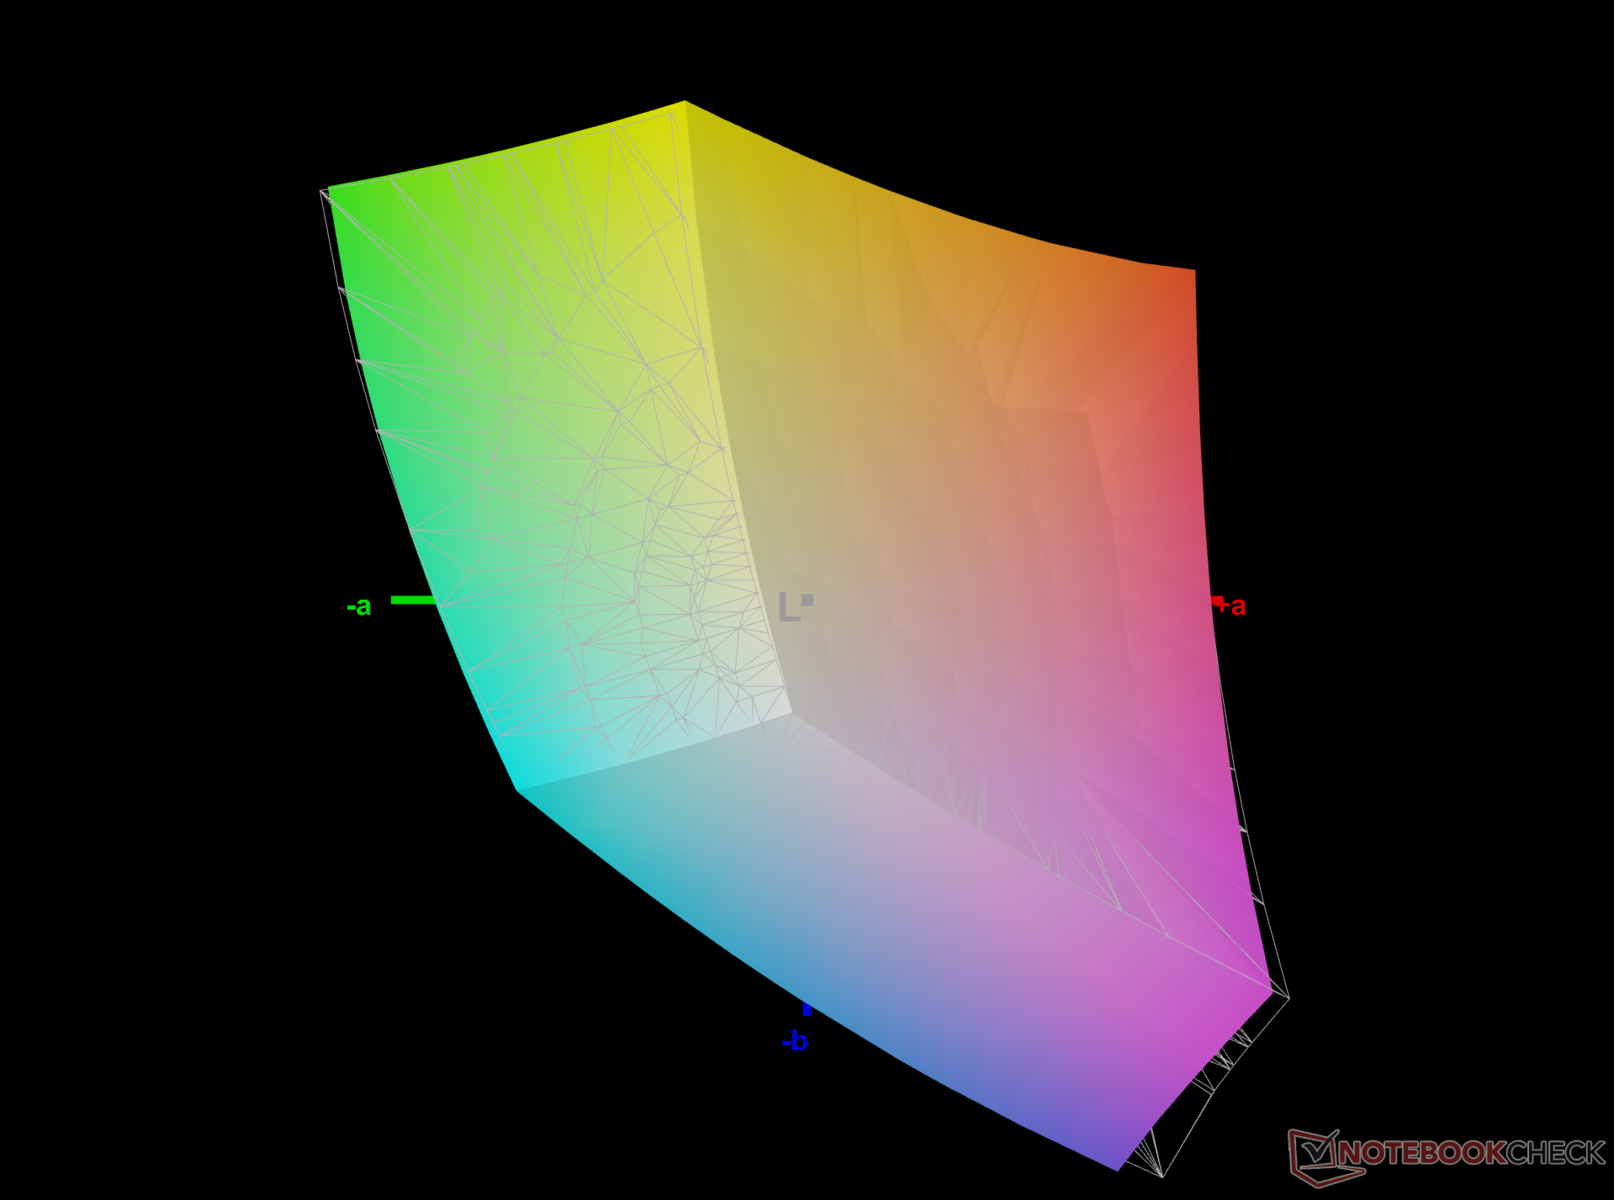
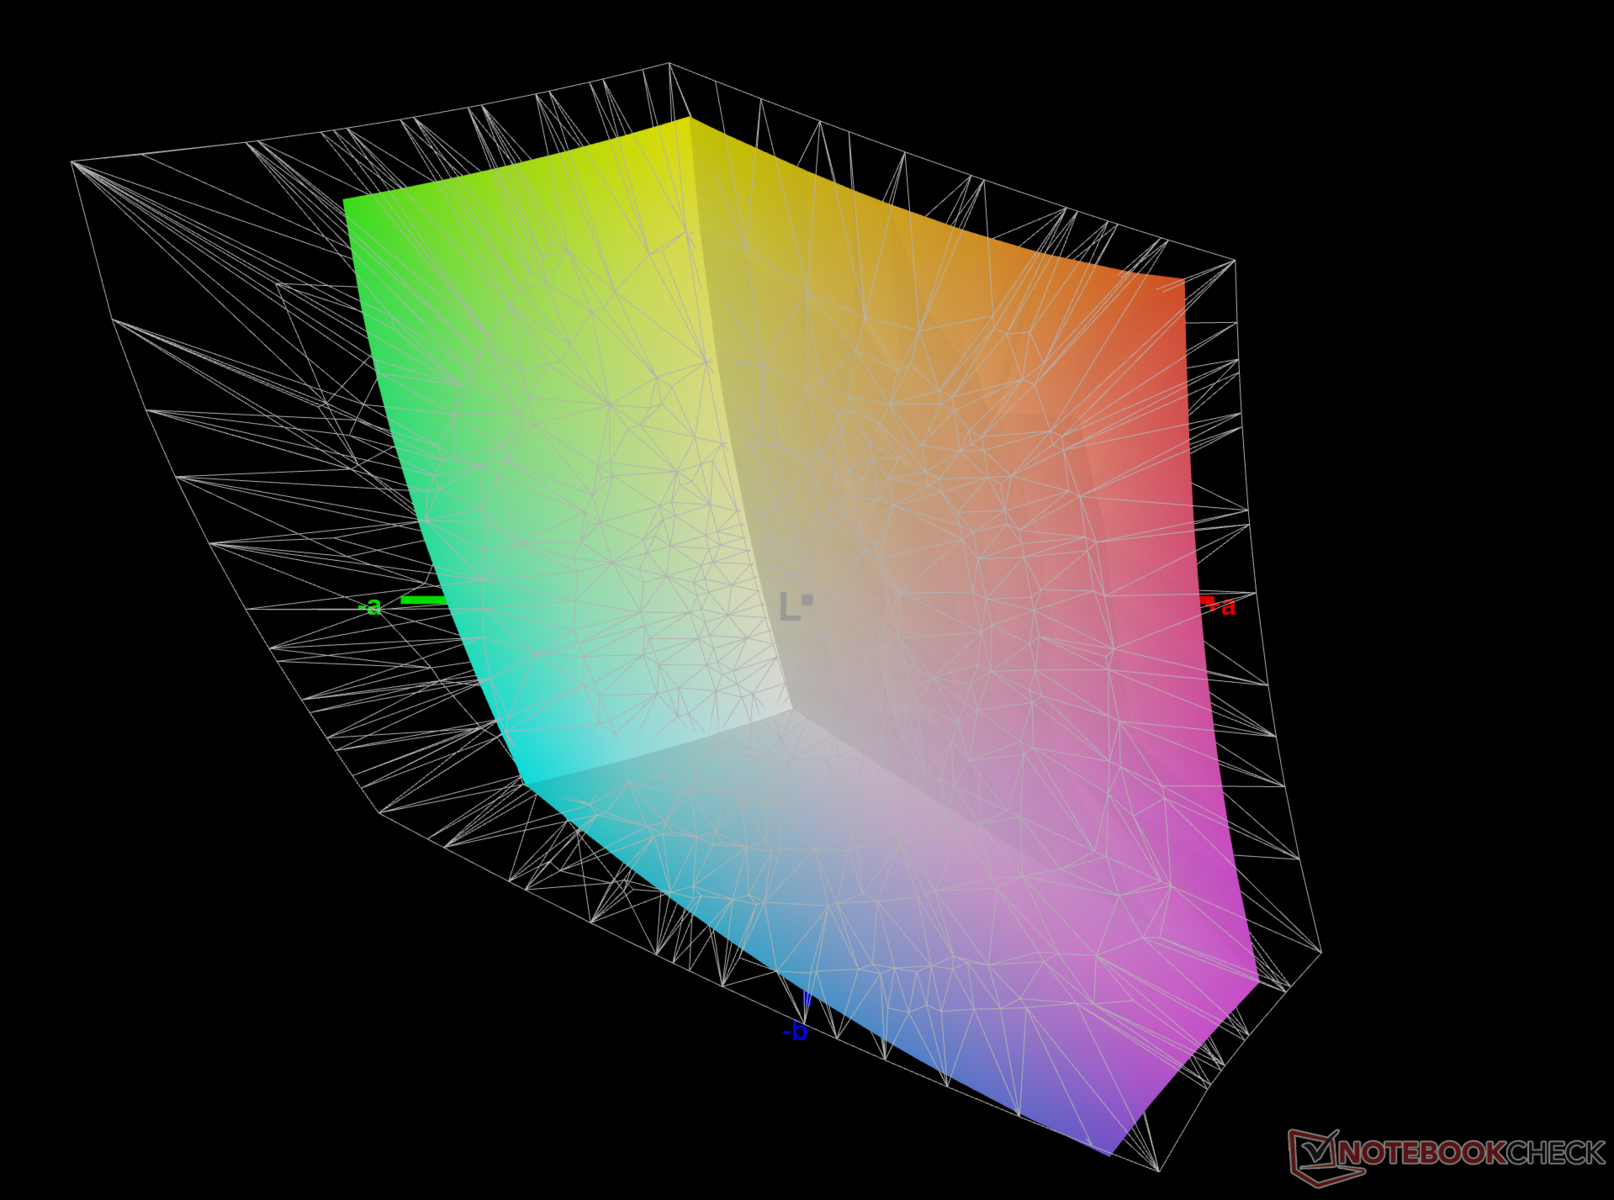
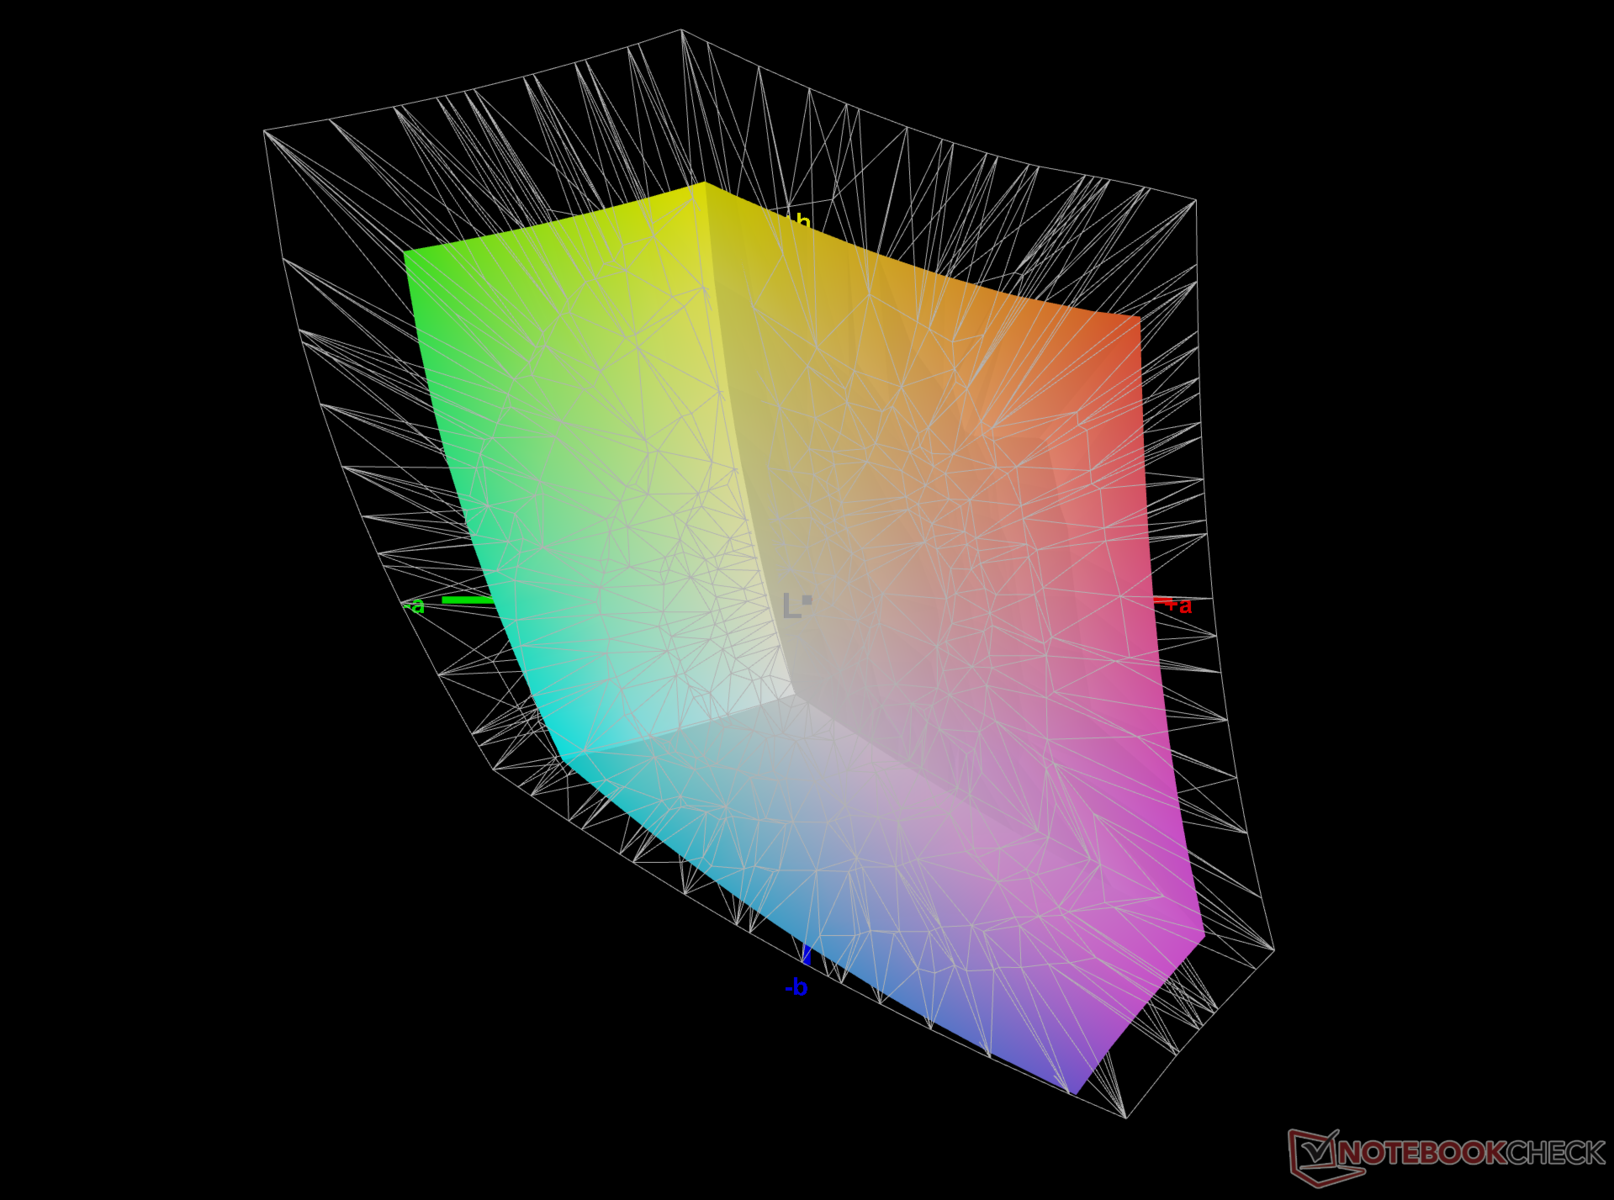
69.7% AdobeRGB 1998 (Argyll 3D)
97.5% sRGB (Argyll 3D)
67.5% Display P3 (Argyll 3D)
Gamma: 2.1
CCT: 6538 K
| HP Victus 16-r0076TX Chi Mei CMN1629, IPS, 1920x1080, 16.1" | Acer Nitro 16 AN16-41-R7YE AU Optronics B160UAN01.Q, IPS, 1920x1200, 16" | Dell G15 5530 AUO B156HAN, IPS, 1920x1080, 15.6" | Lenovo Legion Pro 5 16ARX8 (R5 7645HX, RTX 4050) CSOT T3 MNG007DA2-2, IPS, 2560x1600, 16" | Lenovo LOQ 15APH8 BOE NJ NE156FHM-NX3, IPS, 1920x1080, 15.6" | |
|---|---|---|---|---|---|
| Display | 11% | 5% | 4% | -39% | |
| Display P3 Coverage (%) | 67.5 | 80 19% | 73.1 8% | 71.6 6% | 40.2 -40% |
| sRGB Coverage (%) | 97.5 | 99.4 2% | 98.4 1% | 99.8 2% | 60.2 -38% |
| AdobeRGB 1998 Coverage (%) | 69.7 | 77.4 11% | 74.4 7% | 72.9 5% | 41.5 -40% |
| Response Times | -25% | 38% | -31% | -407% | |
| Response Time Grey 50% / Grey 80% * (ms) | 6.18 ? | 11.2 ? -81% | 3.39 ? 45% | 12 ? -94% | 42.7 ? -591% |
| Response Time Black / White * (ms) | 7.62 ? | 5.2 ? 32% | 5.35 ? 30% | 5.2 ? 32% | 24.5 ? -222% |
| PWM Frequency (Hz) | 21620 ? | ||||
| Screen | -67% | -74% | -1% | -85% | |
| Brightness middle (cd/m²) | 290 | 415 43% | 320 10% | 543 87% | 346.2 19% |
| Brightness (cd/m²) | 275 | 380 38% | 316 15% | 516 88% | 329 20% |
| Brightness Distribution (%) | 82 | 84 2% | 94 15% | 87 6% | 81 -1% |
| Black Level * (cd/m²) | 0.21 | 0.36 -71% | 0.21 -0% | 0.58 -176% | 0.31 -48% |
| Contrast (:1) | 1381 | 1153 -17% | 1524 10% | 936 -32% | 1117 -19% |
| Colorchecker dE 2000 * | 1.7 | 4.71 -177% | 4.55 -168% | 1.35 21% | 4.19 -146% |
| Colorchecker dE 2000 max. * | 3.57 | 6.98 -96% | 9.83 -175% | 3.22 10% | 19.19 -438% |
| Colorchecker dE 2000 calibrated * | 0.93 | 2.68 -188% | 1.51 -62% | 1.31 -41% | 1.66 -78% |
| Greyscale dE 2000 * | 1.5 | 3.6 -140% | 6.2 -313% | 1.03 31% | 2.6 -73% |
| Gamma | 2.1 105% | 2.182 101% | 2.07 106% | 2.38 92% | 2.19 100% |
| CCT | 6538 99% | 7153 91% | 6479 100% | 6452 101% | 6749 96% |
| Média Total (Programa/Configurações) | -27% /
-45% | -10% /
-41% | -9% /
-4% | -177% /
-121% |
* ... menor é melhor
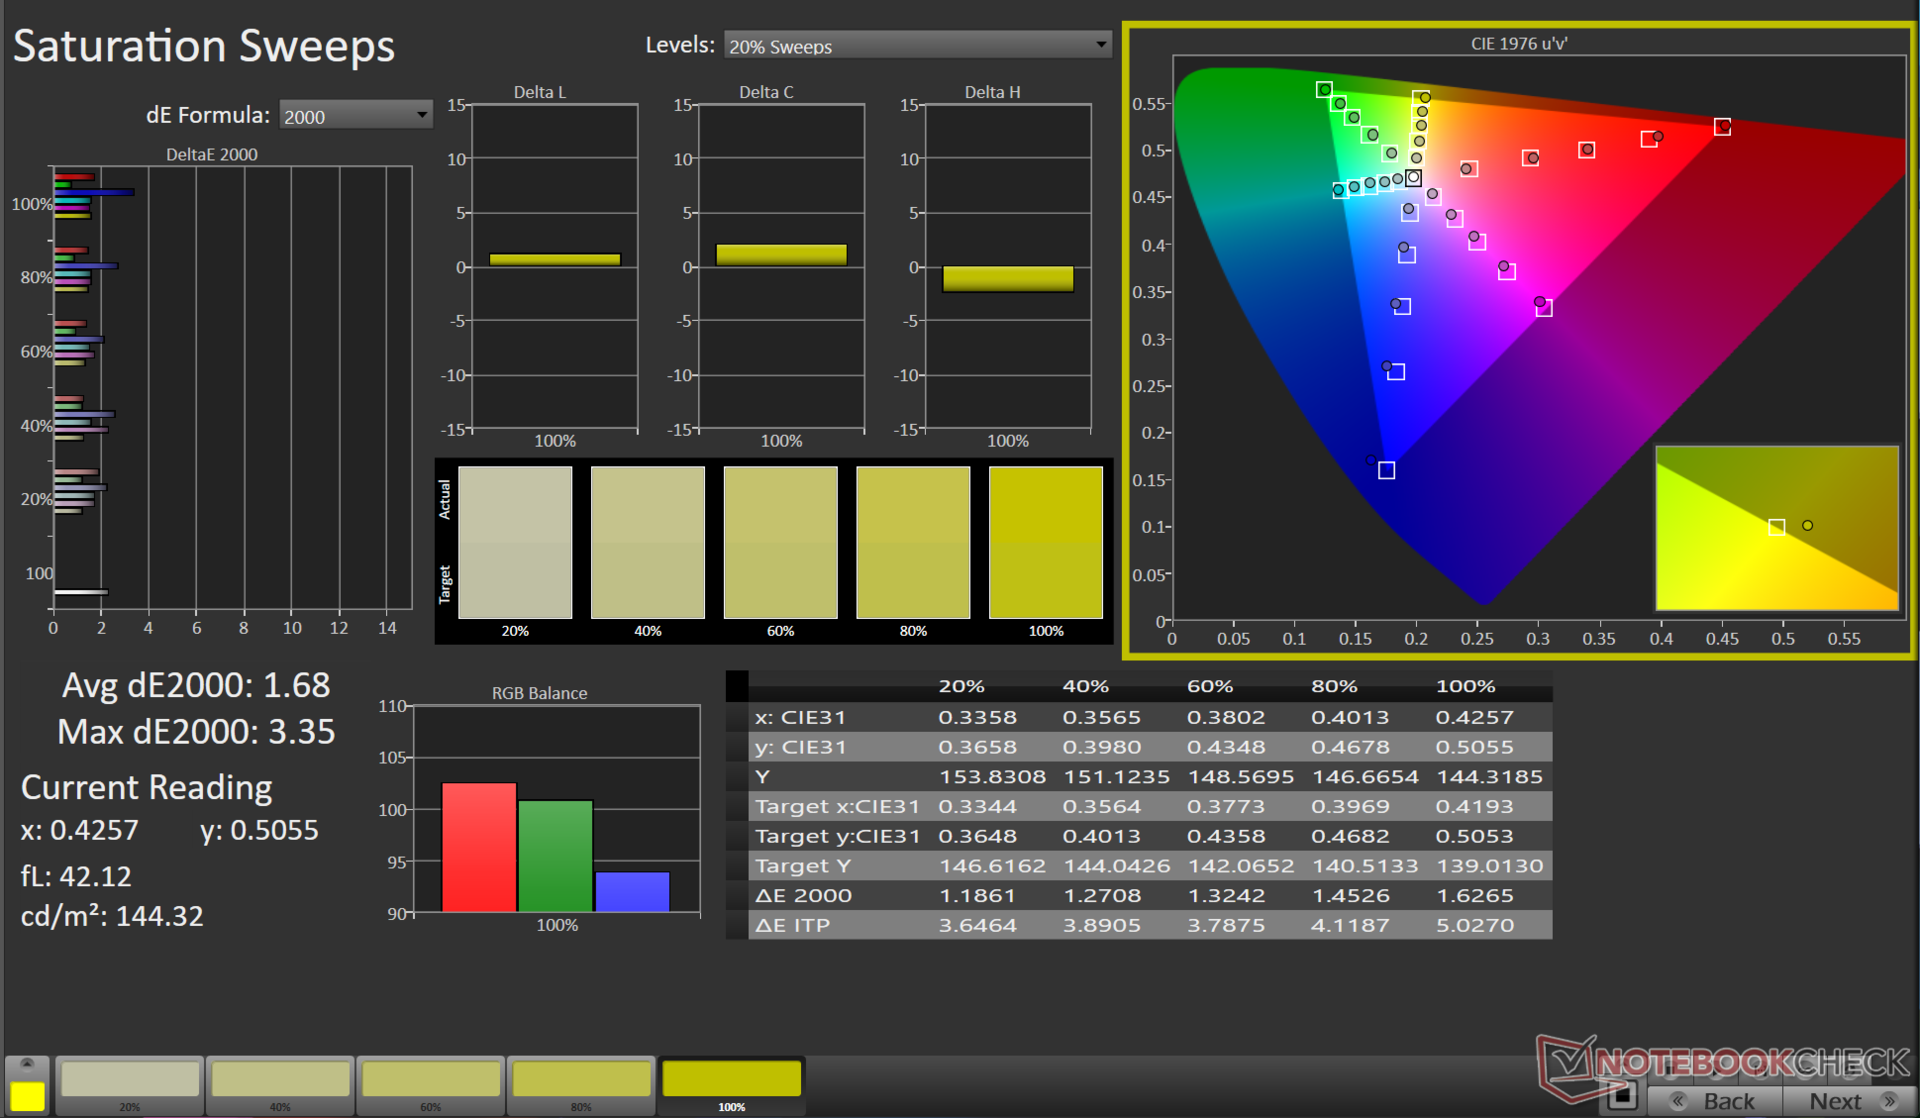
O HP Victus 16 economiza na precisão das cores para uma experiência com taxa de atualização mais alta. Ele cobre 97,5% da gama de cores sRGB, 69,7% do Adobe RGB e 67,5% do DCI-P3. Como muitos monitores, ele tem problemas para reproduzir diferentes tons de azul.
Exibir tempos de resposta
| ↔ Tempo de resposta preto para branco | ||
|---|---|---|
| 7.62 ms ... ascensão ↗ e queda ↘ combinadas | ↗ 4.07 ms ascensão | 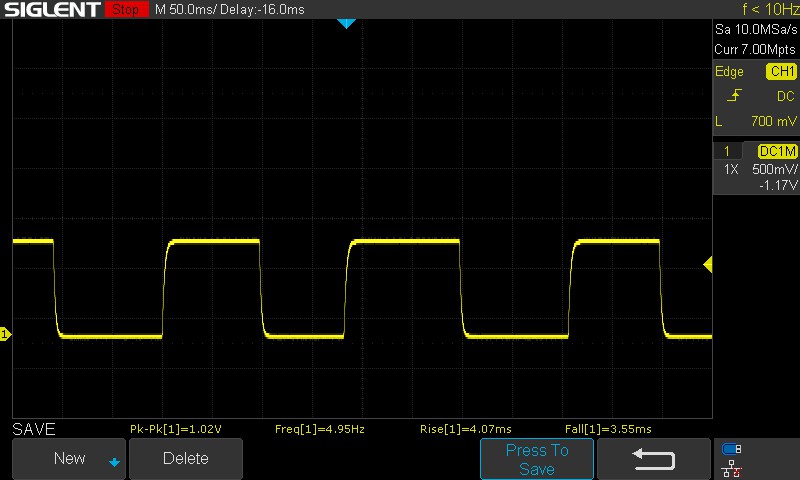 |
| ↘ 3.55 ms queda | ||
| A tela mostra taxas de resposta muito rápidas em nossos testes e deve ser muito adequada para jogos em ritmo acelerado. Em comparação, todos os dispositivos testados variam de 0.1 (mínimo) a 240 (máximo) ms. » 22 % de todos os dispositivos são melhores. Isso significa que o tempo de resposta medido é melhor que a média de todos os dispositivos testados (19.8 ms). | ||
| ↔ Tempo de resposta 50% cinza a 80% cinza | ||
| 6.18 ms ... ascensão ↗ e queda ↘ combinadas | ↗ 3.01 ms ascensão | 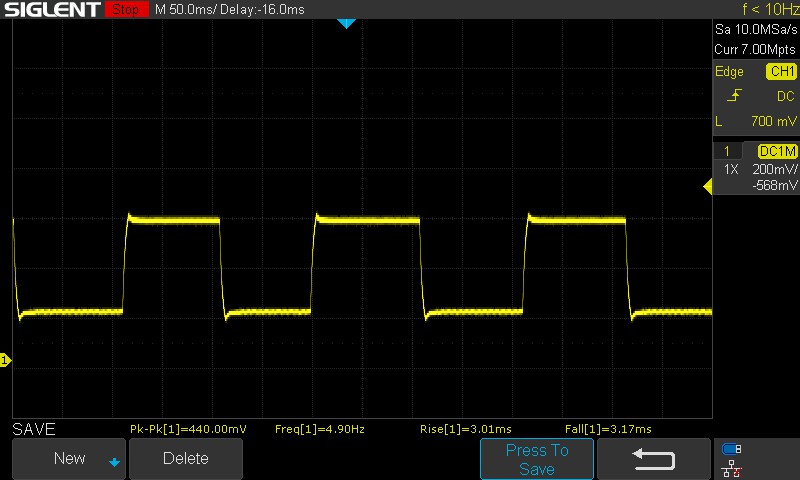 |
| ↘ 3.17 ms queda | ||
| A tela mostra taxas de resposta muito rápidas em nossos testes e deve ser muito adequada para jogos em ritmo acelerado. Em comparação, todos os dispositivos testados variam de 0.165 (mínimo) a 636 (máximo) ms. » 19 % de todos os dispositivos são melhores. Isso significa que o tempo de resposta medido é melhor que a média de todos os dispositivos testados (31 ms). | ||
Cintilação da tela / PWM (modulação por largura de pulso)
| Tela tremeluzindo / PWM não detectado | ≤ 100 % configuração de brilho | 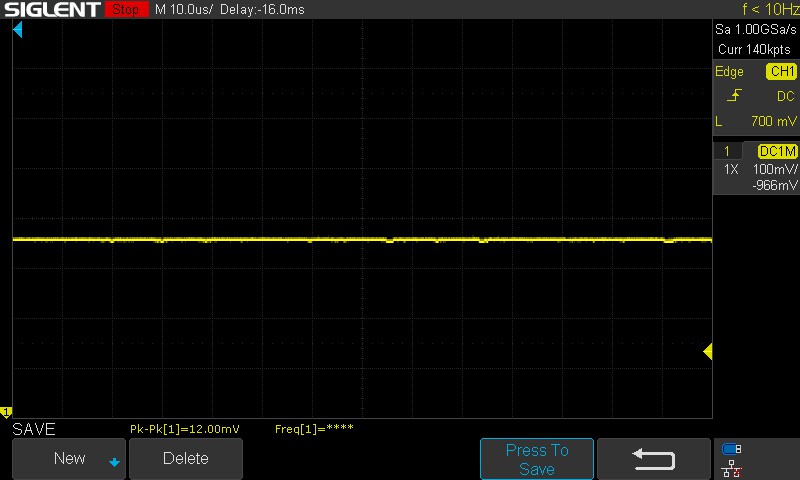 | |
[pwm_comparison] Em comparação: 52 % de todos os dispositivos testados não usam PWM para escurecer a tela. Se PWM foi detectado, uma média de 7750 (mínimo: 5 - máximo: 343500) Hz foi medida. | |||
O tempo de resposta anunciado pela HP (de cinza para cinza) é de 7 ms, o que é confirmado por nossos testes, que encontraram o valor de 6,18 ms. Da mesma forma, o tempo de resposta do preto para o branco foi de respeitáveis 7,62 ms.
Alguns trabalhos com um espectrofotômetro X-rite i1Basic Pro 3 e o Calman Calibration Software da Portrait Displays produziram resultados apenas marginalmente melhores, com os valores de desvio de escala de cinza, ColourChecker e Saturation Sweep Delta E melhorando apenas marginalmente.
Uma tela IPS geralmente garante ângulos de visão decentes. Entretanto, esse não é o caso do painel Chi Mei do HP Omen 16. Há uma perda notável de detalhes ao visualizar a tela de ângulos extremos.
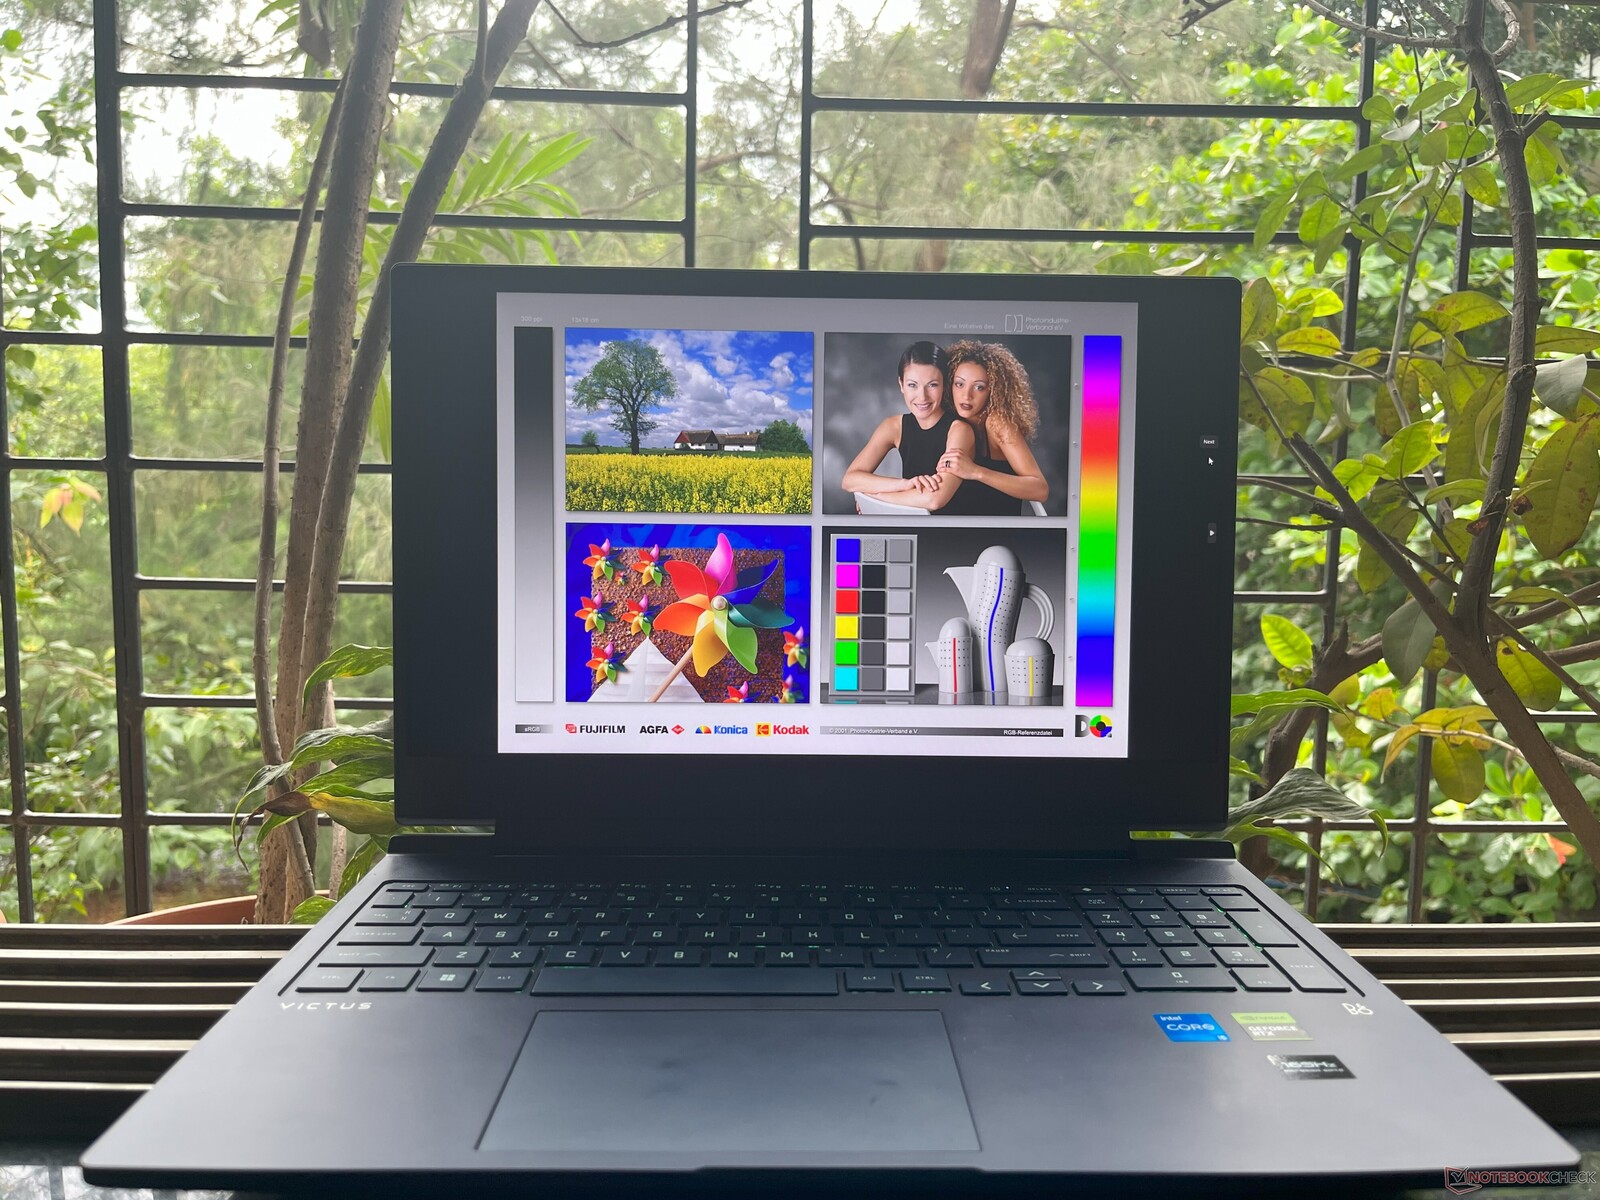
A visualização em ambientes externos está acima da média, especialmente para um dispositivo com apenas 300 nits de brilho. A perda de detalhes foi mínima na sombra e sob a luz direta do sol. Entretanto, recomendamos manter o laptop em ambientes fechados, pois ele não é exatamente portátil.

Desempenho: Raptor Lake e Ada Lovelace se destacam
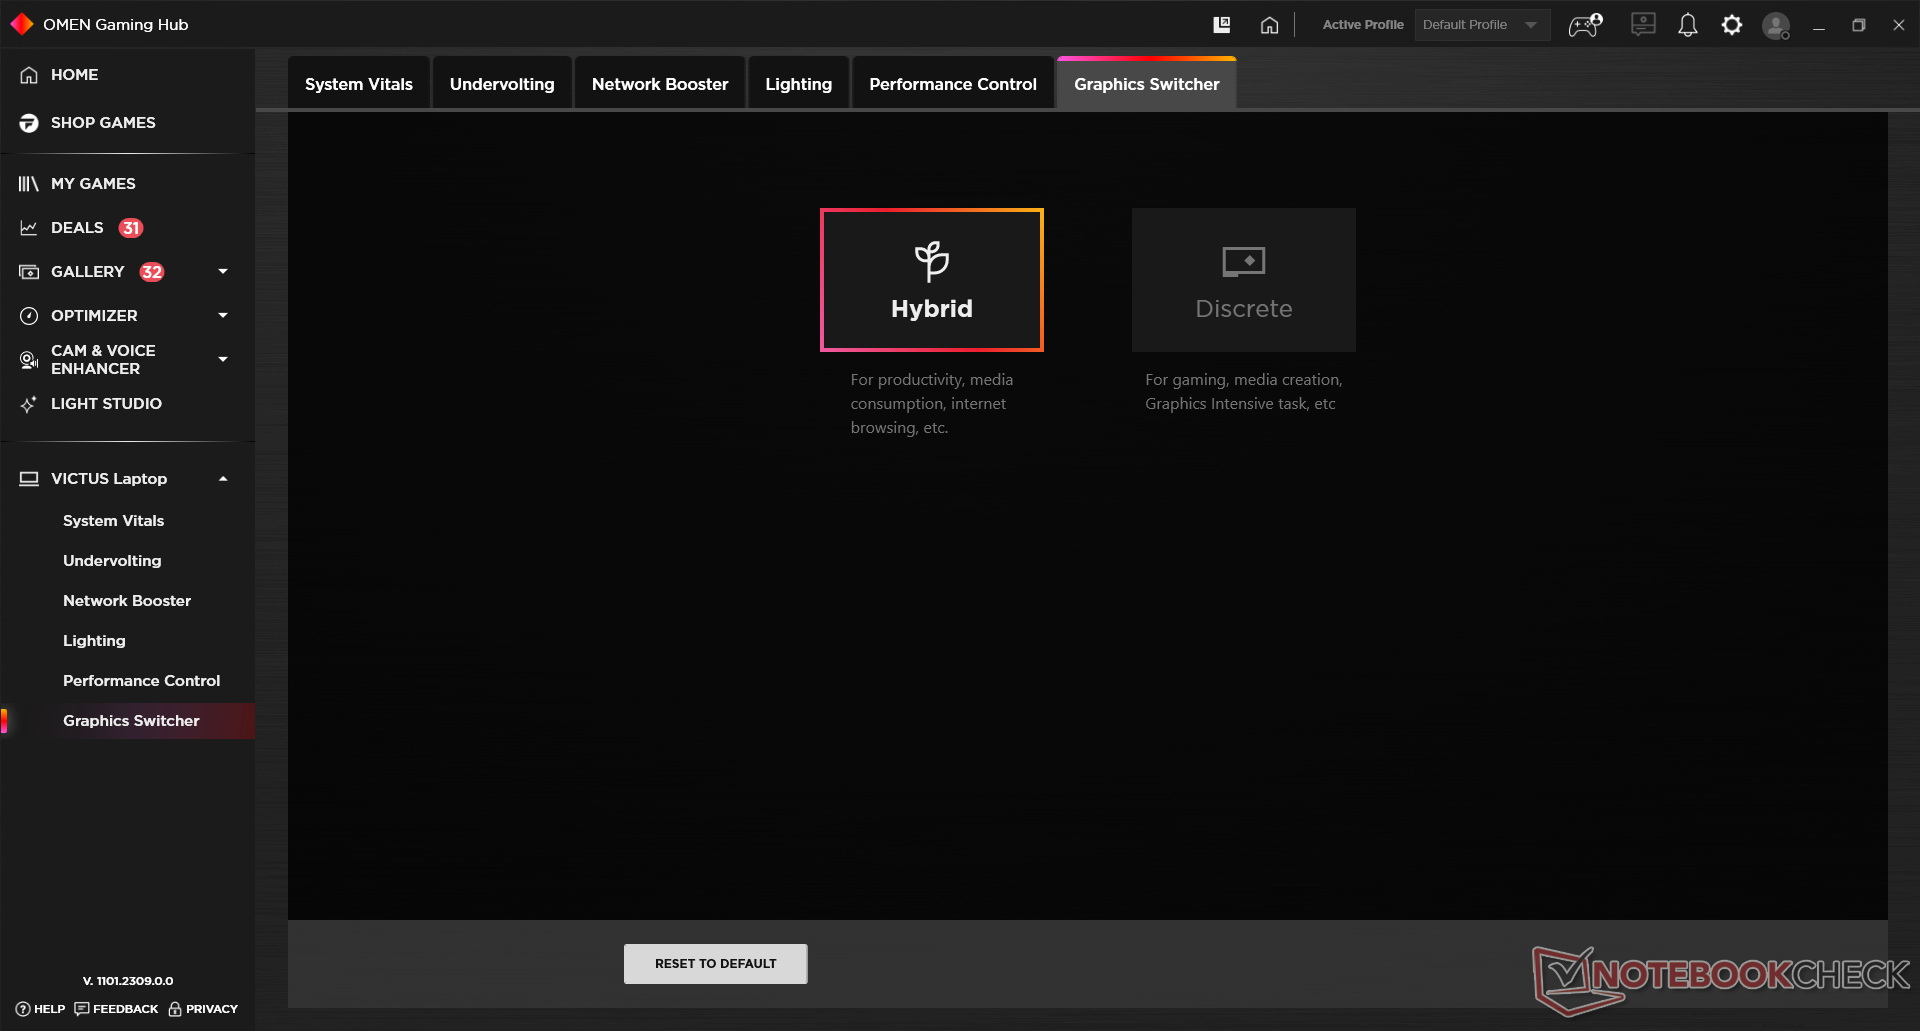
O HP Victus 16 está disponível em algumas configurações. O nosso é a variante básica com um processador Intel Core i5-13500HX e GPU para laptop Nvidia GeForce RTX 4050. É possível optar por uma GeForce RTX 4060 e RTX 4070 se necessário.
Quem estiver procurando uma CPU mais potente pode optar pelo Core i7-13700HX que só pode ser emparelhado com um GeForce RTX 4070. Os usuários que procuram memória extra também podem optar por uma versão com 32 GB de RAM e 1 TB de armazenamento.
Condições de teste
Escolhemos o plano "Performance" para levar o hardware aos seus limites. Alguns testes foram realizados com a bateria no modo "Eco" para verificar a degradação do desempenho. O HWInfo não conseguiu mostrar as informações corretas de PL1 e PL2 para diferentes perfis, portanto, obtivemos esses valores durante o teste de loop do Cinebench R15.
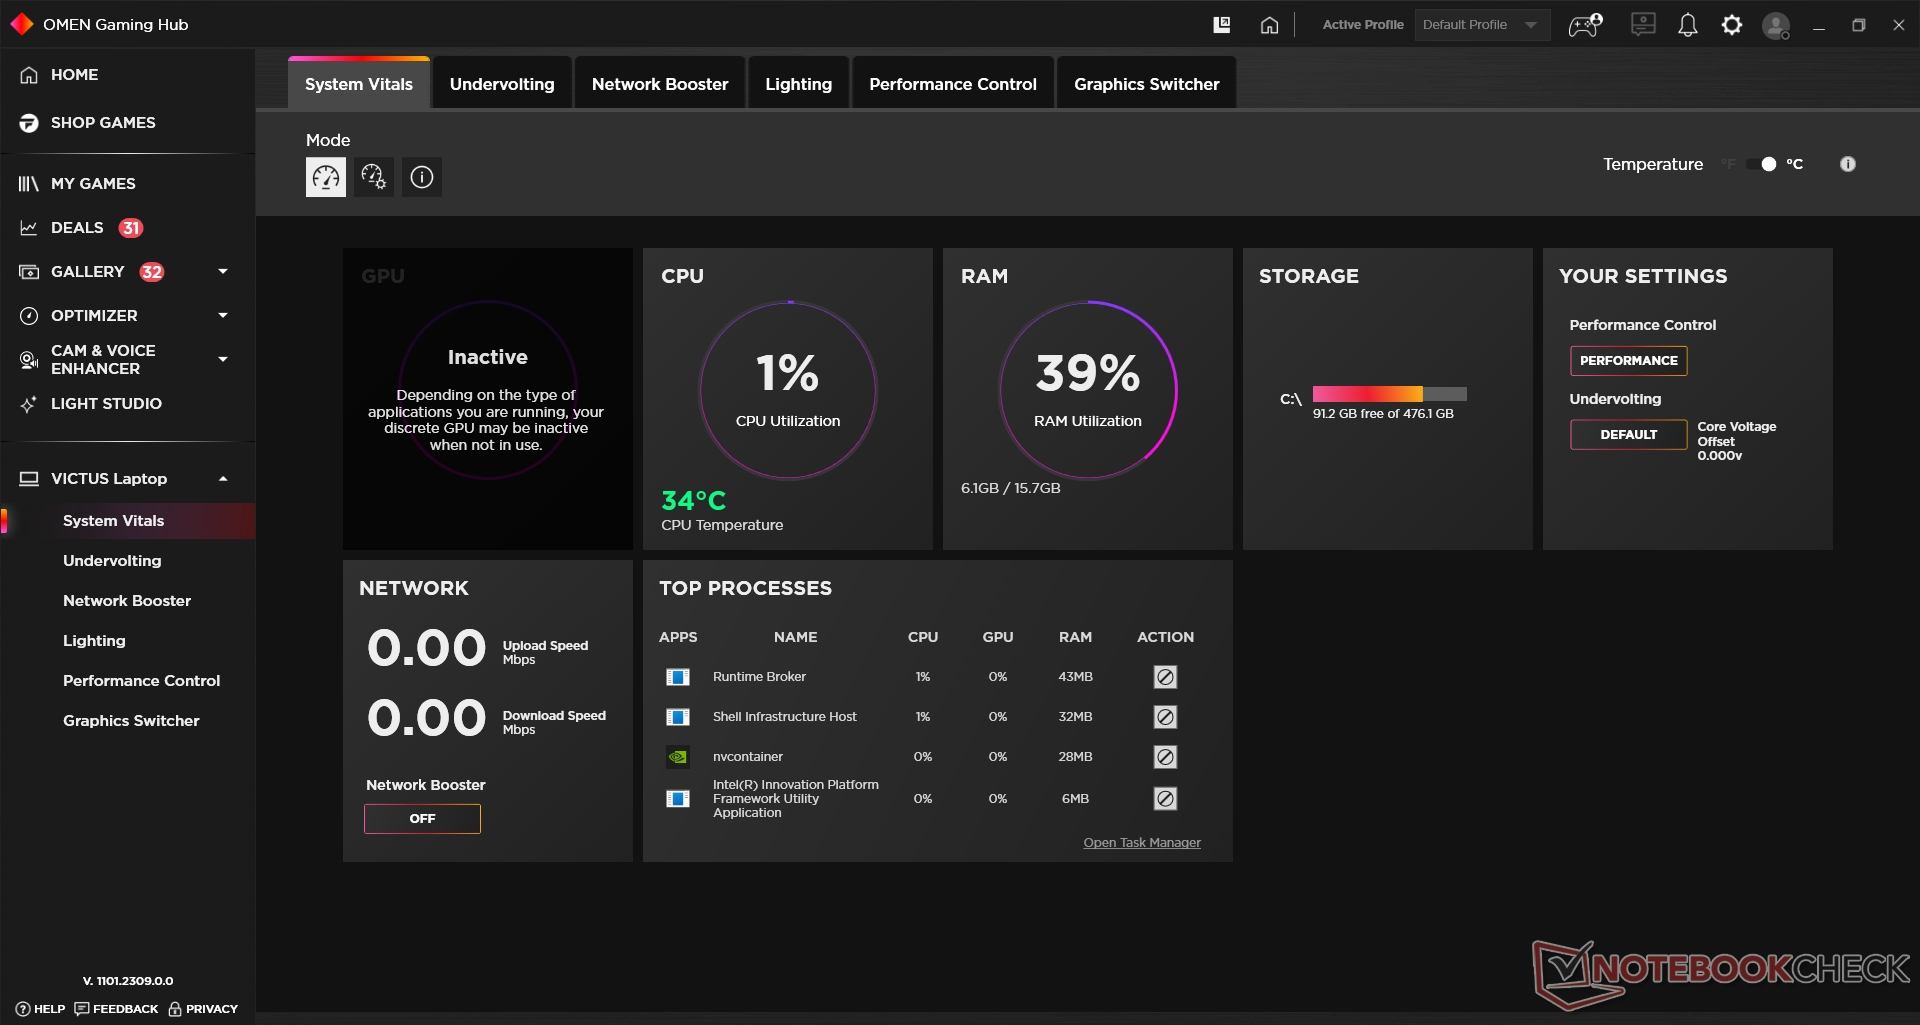
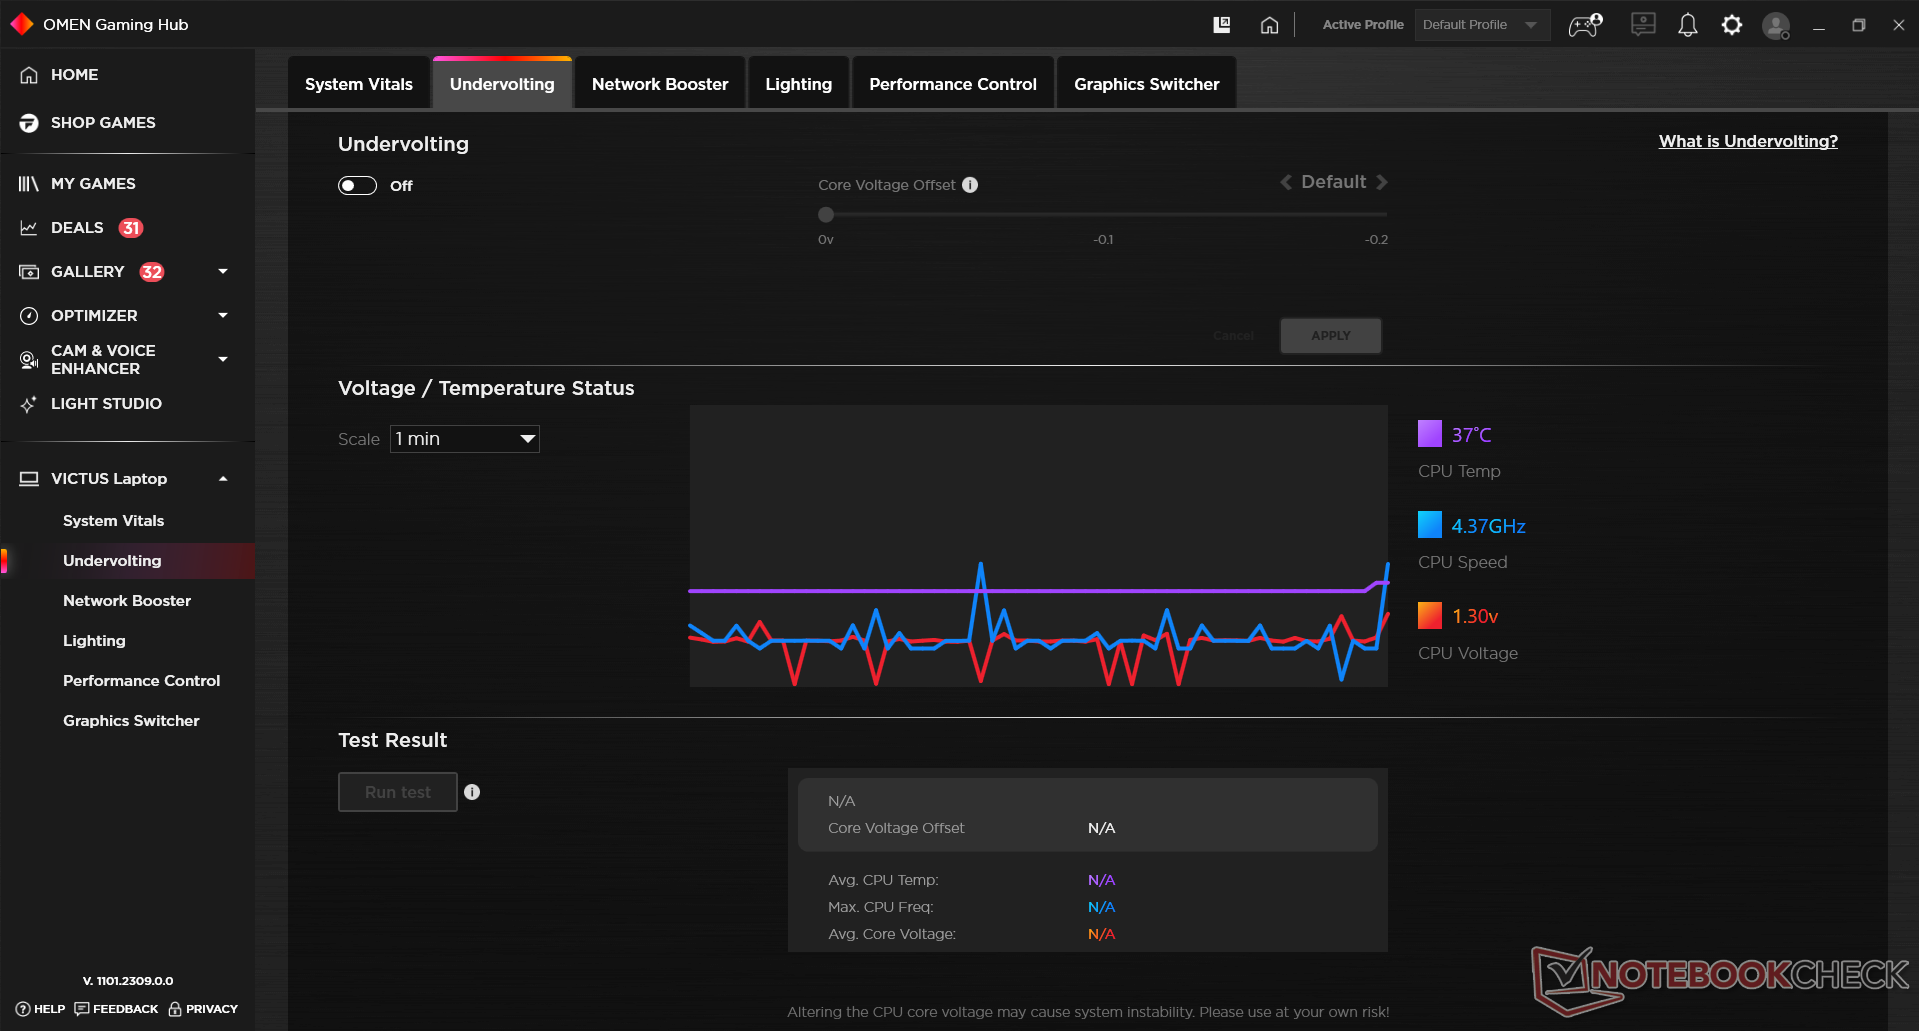
Se estiver interessado em mexer no laptop, você passará muito tempo no Omen Gaming Hub. Ele oferece uma visão panorâmica de tudo, desde as temperaturas, os clocks e as tensões da CPU. Ele permite até que os entusiastas subtensionem seus laptops sem precisar navegar pelo BIOS.
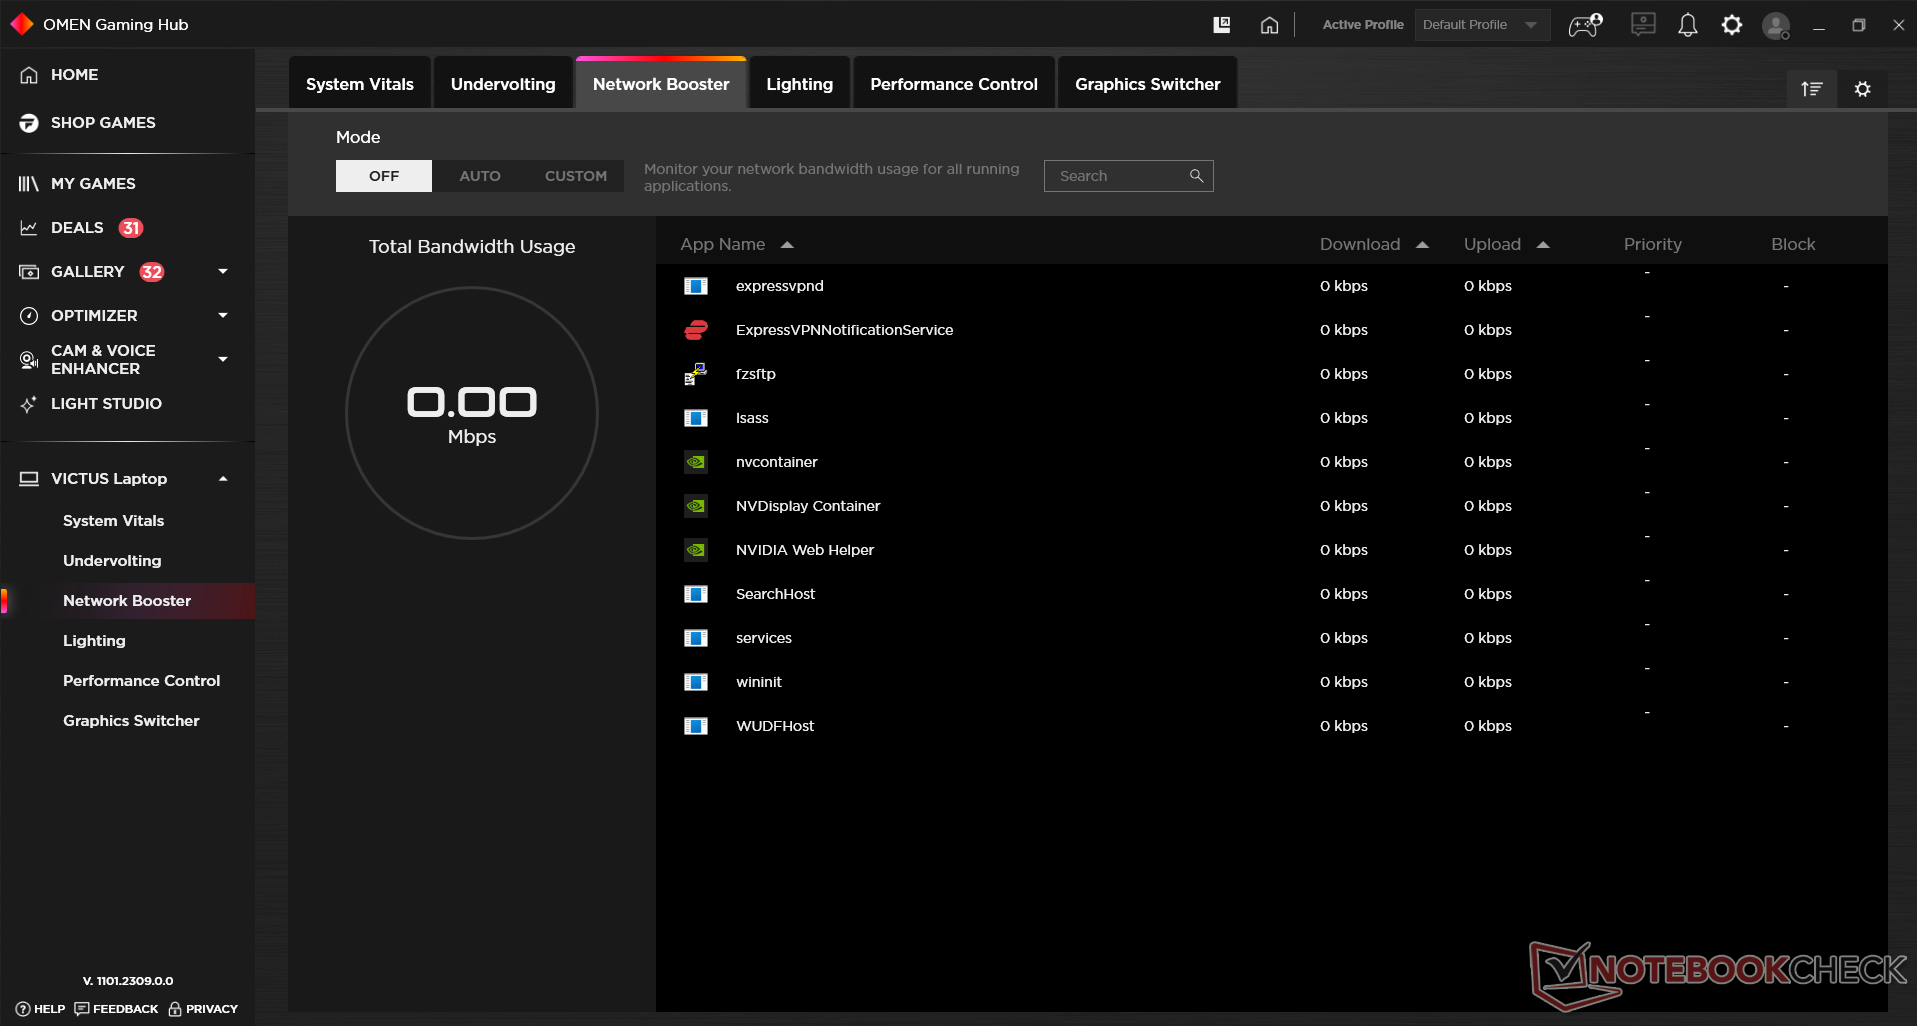
Em seguida, há uma guia "impulsionador de rede" que prioriza o tráfego para tarefas em execução e uma seção "controle de desempenho" que dá acesso aos planos de energia mencionados acima. Ela também permite que você defina curvas personalizadas do ventilador ou que ele esteja sempre no máximo.
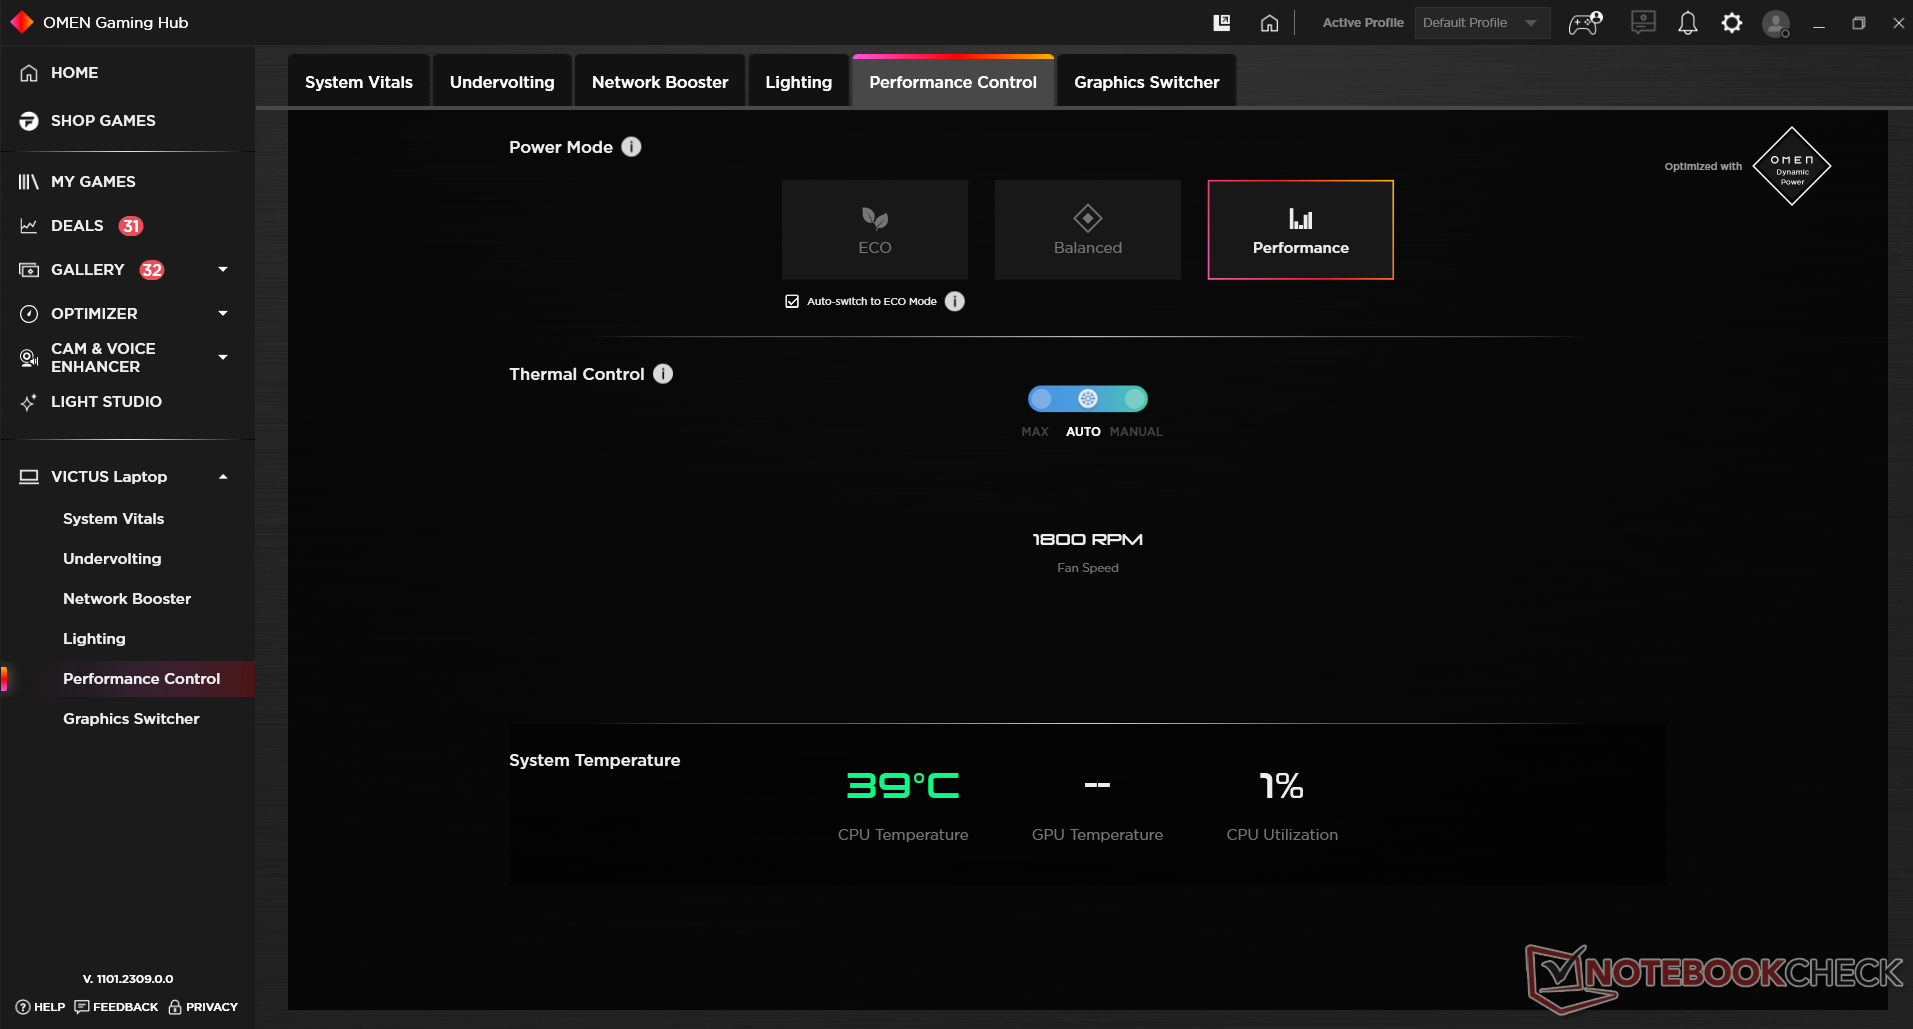
| Perfil | PL1 | PL2 | PL4 |
|---|---|---|---|
| Eco | 35 W | 46 W | 200 W |
| Balanceado | 51 W | 130 W | 200 W |
| Desempenho | 78 W | 130 W | 200 W |
Processador
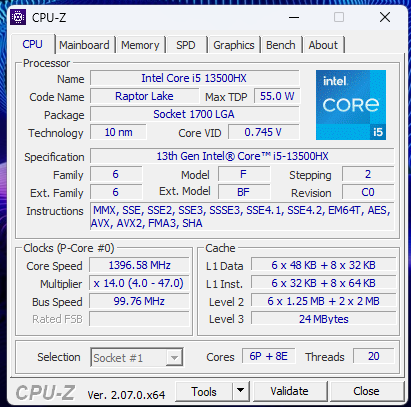
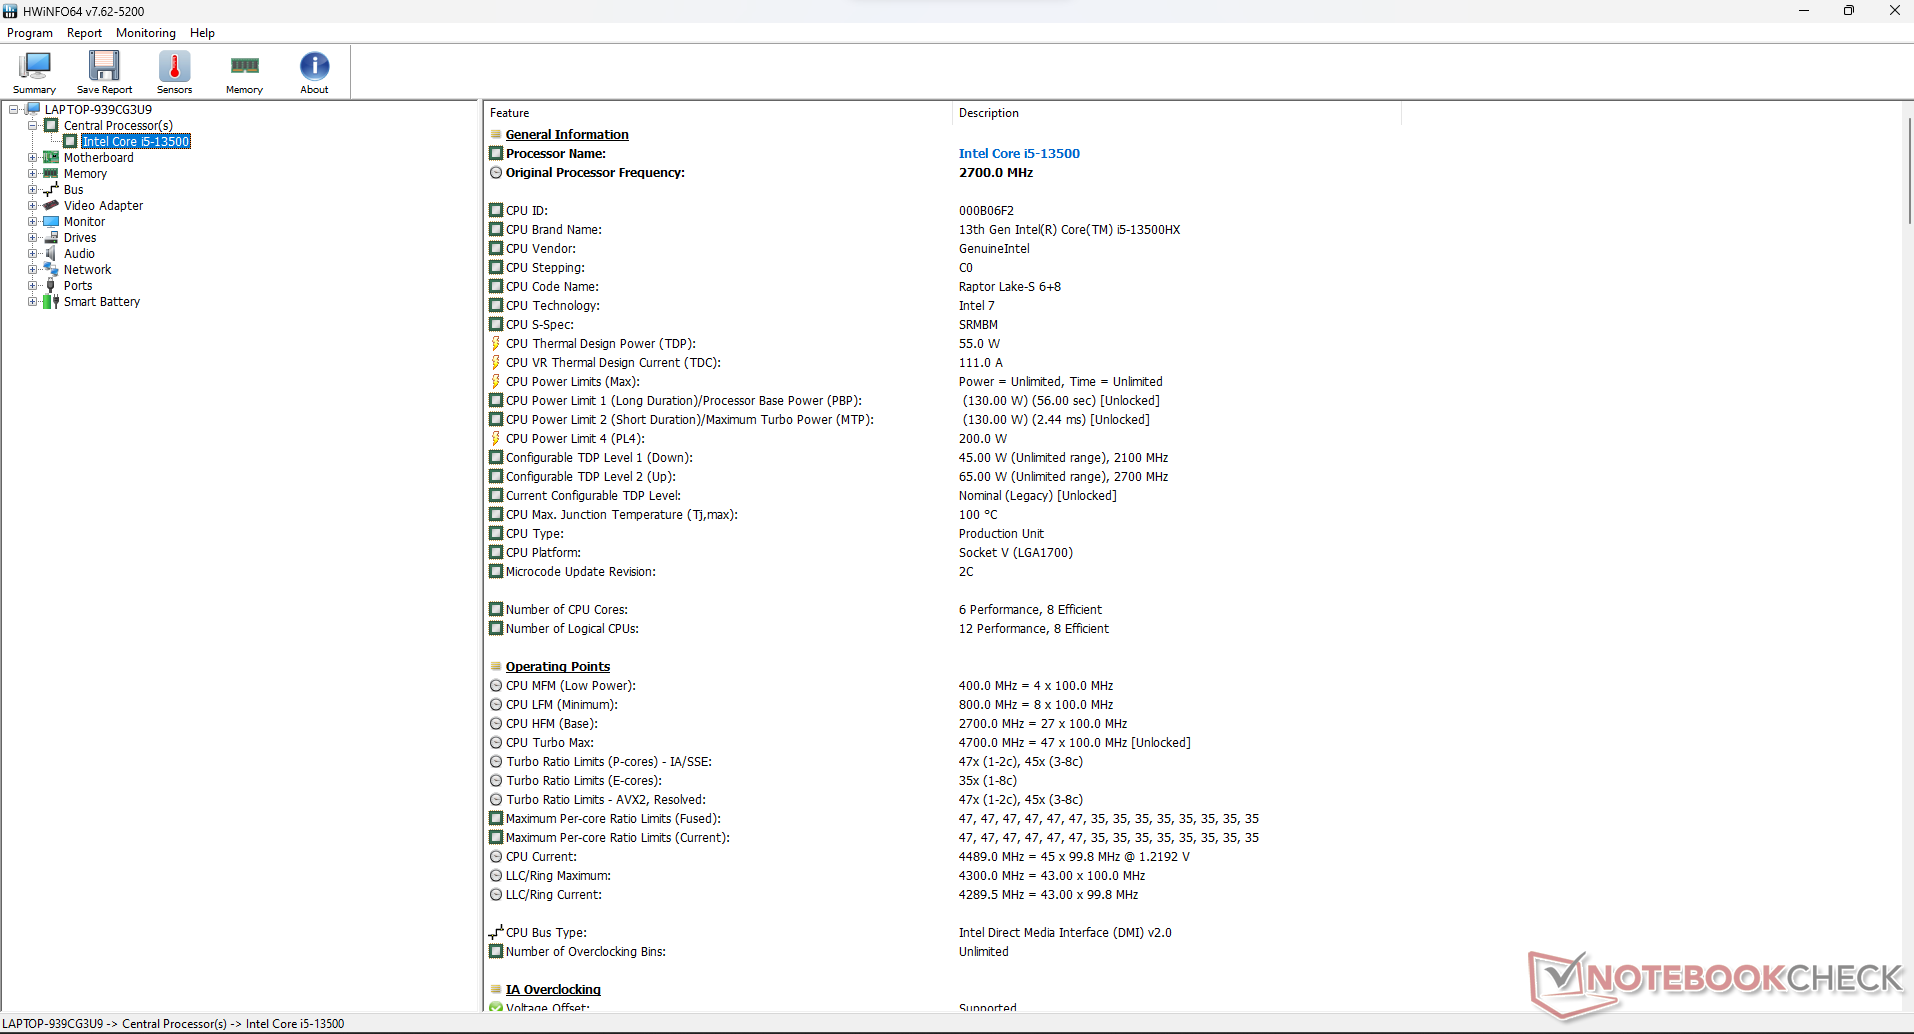
O Intel Core i5-13500HX que está equipando nosso HP Victus 16 é uma CPU Raptor Lake de 14 núcleos (6 de desempenho mais 8 de eficiência) e 20 threads. Ele foi lançado como parte da série de chips Raptor Lake-HX que aumentou o TDP básico (55 Watts) em relação aos seus equivalentes da marca H. Além do espaço extra de TDP, ele também aumenta o número de núcleos de desempenho.
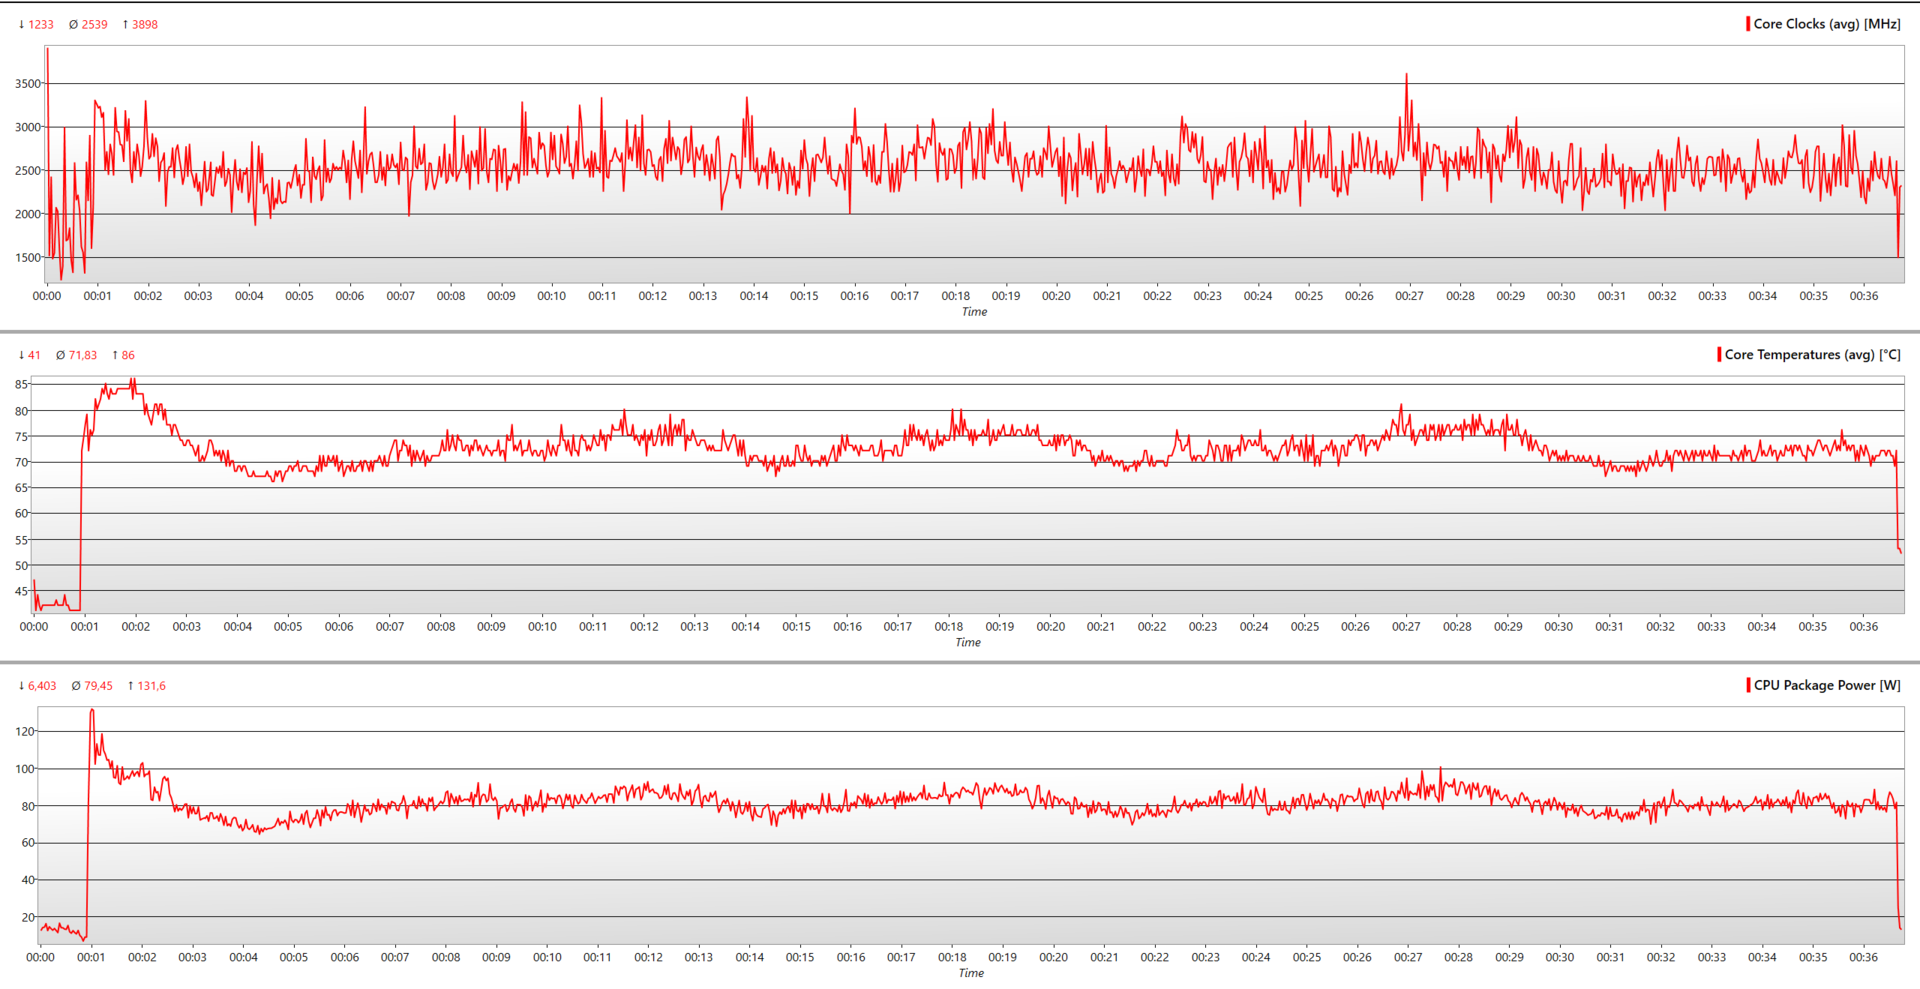
Apesar de ser a peça Raptor Lake-HX mais barata, o Core i5-13500HX está bem acima de sua classe de peso. Em seu estado PL2, o processador pode consumir até 131 Watts de energia. No entanto, esse número se estabiliza em 83 watts sob cargas sustentadas.
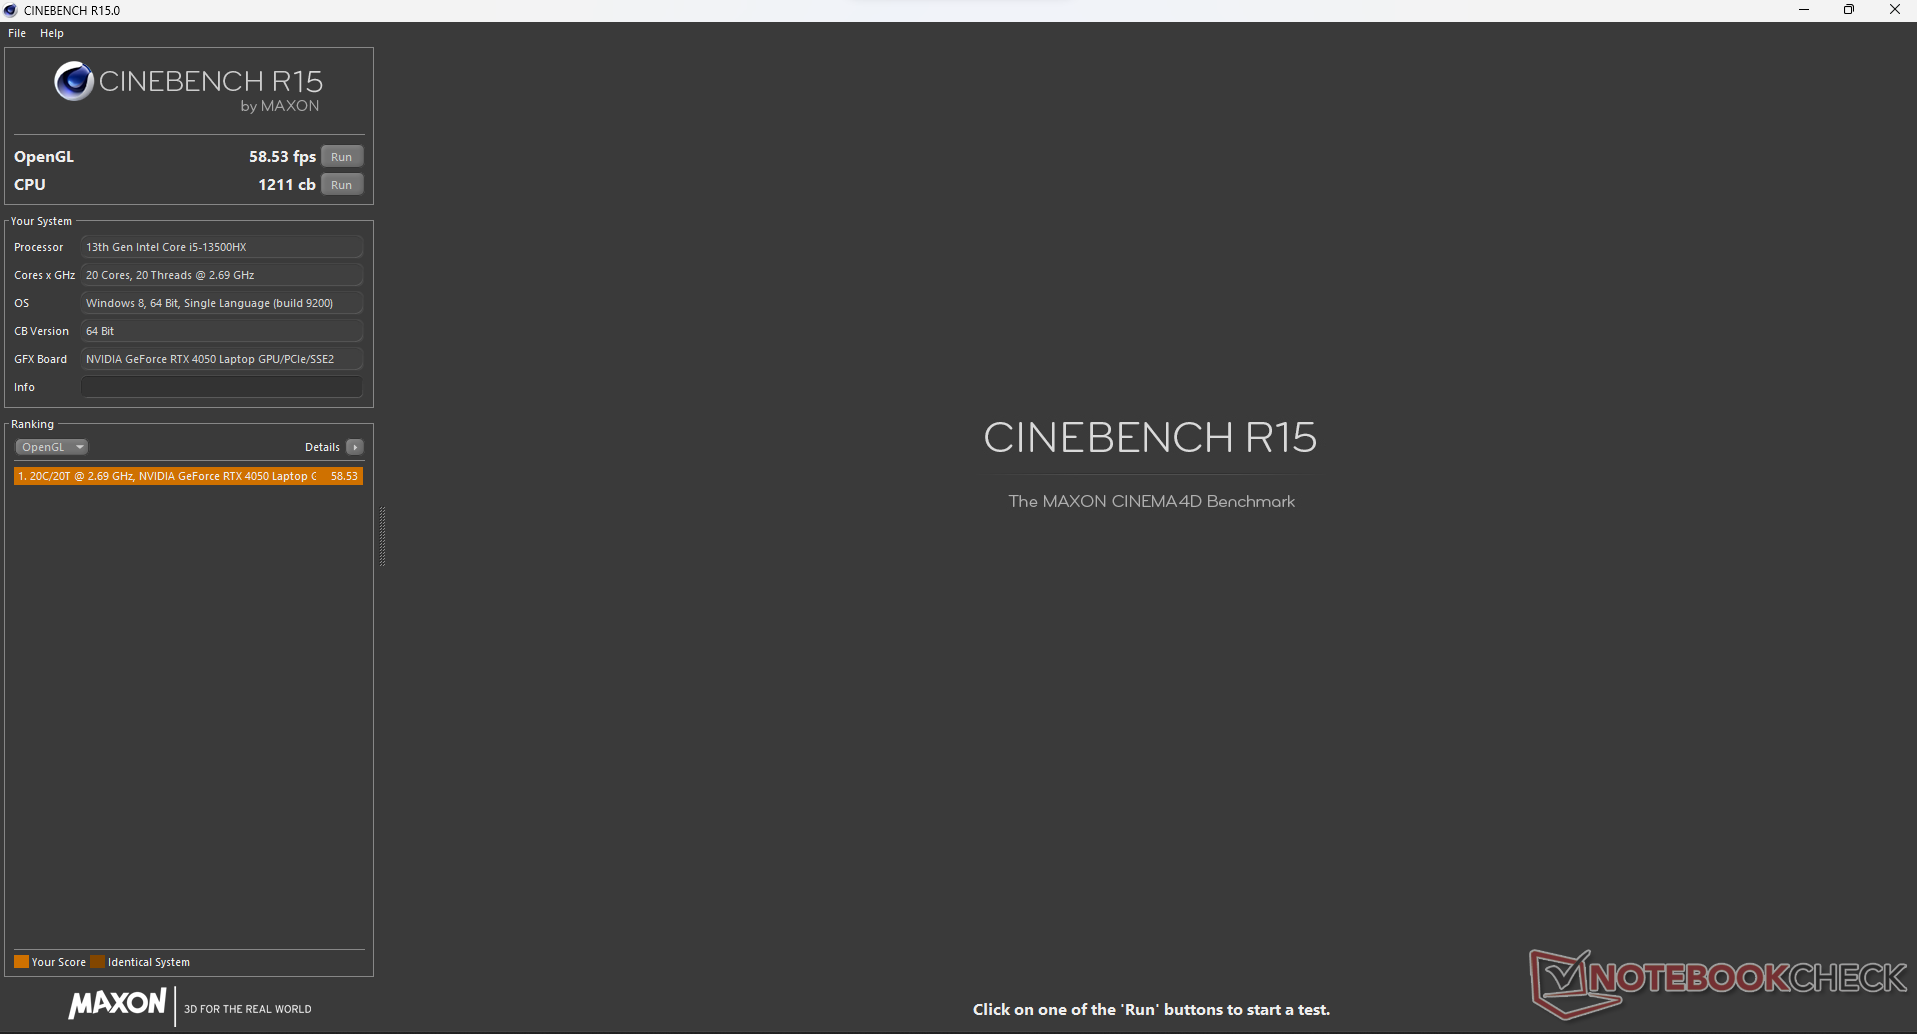
Os notebooks para jogos são conhecidos por perderem muito desempenho com a bateria, e o HP Victus 16 não é diferente. Por exemplo, sua pontuação no Cinebench R15 cai em cerca de 58%, de 2.863 para 1.211 pontos, quando a alimentação CA é desconectada.
Cinebench R15 Multi Loop
Cinebench R23: Multi Core | Single Core
Cinebench R20: CPU (Multi Core) | CPU (Single Core)
Cinebench R15: CPU Multi 64Bit | CPU Single 64Bit
Blender: v2.79 BMW27 CPU
7-Zip 18.03: 7z b 4 | 7z b 4 -mmt1
Geekbench 5.5: Multi-Core | Single-Core
HWBOT x265 Benchmark v2.2: 4k Preset
LibreOffice : 20 Documents To PDF
R Benchmark 2.5: Overall mean
| CPU Performance rating | |
| Média da turma Gaming | |
| Acer Predator Helios 16 PH16-71-731Q | |
| Alienware m16 R1 Intel | |
| HP Victus 16-r0076TX -1! | |
| Média Intel Core i5-13500HX | |
| Acer Predator Triton 14 PT14-51 | |
| Aorus 15 BSF | |
| MSI Katana 15 B12VEK | |
| Asus TUF A15 FA507 | |
| Acer Nitro 16 AN16-41-R7YE | |
| Cinebench R23 / Multi Core | |
| Média da turma Gaming (10488 - 40970, n=106, últimos 2 anos) | |
| Acer Predator Helios 16 PH16-71-731Q | |
| Alienware m16 R1 Intel | |
| Acer Predator Triton 14 PT14-51 | |
| Média Intel Core i5-13500HX (18235 - 19176, n=3) | |
| HP Victus 16-r0076TX | |
| Aorus 15 BSF | |
| MSI Katana 15 B12VEK | |
| Asus TUF A15 FA507 | |
| Acer Nitro 16 AN16-41-R7YE | |
| Cinebench R23 / Single Core | |
| Média da turma Gaming (1166 - 2356, n=106, últimos 2 anos) | |
| Alienware m16 R1 Intel | |
| Aorus 15 BSF | |
| Acer Predator Helios 16 PH16-71-731Q | |
| Média Intel Core i5-13500HX (1689 - 1772, n=2) | |
| MSI Katana 15 B12VEK | |
| HP Victus 16-r0076TX | |
| Acer Predator Triton 14 PT14-51 | |
| Asus TUF A15 FA507 | |
| Acer Nitro 16 AN16-41-R7YE | |
| Cinebench R20 / CPU (Multi Core) | |
| Média da turma Gaming (4029 - 16108, n=105, últimos 2 anos) | |
| Acer Predator Helios 16 PH16-71-731Q | |
| Alienware m16 R1 Intel | |
| Acer Predator Triton 14 PT14-51 | |
| Média Intel Core i5-13500HX (6978 - 7371, n=3) | |
| HP Victus 16-r0076TX | |
| Aorus 15 BSF | |
| MSI Katana 15 B12VEK | |
| Asus TUF A15 FA507 | |
| Acer Nitro 16 AN16-41-R7YE | |
| Cinebench R20 / CPU (Single Core) | |
| Média da turma Gaming (442 - 895, n=105, últimos 2 anos) | |
| Alienware m16 R1 Intel | |
| Aorus 15 BSF | |
| Acer Predator Helios 16 PH16-71-731Q | |
| Média Intel Core i5-13500HX (648 - 695, n=3) | |
| MSI Katana 15 B12VEK | |
| Acer Predator Triton 14 PT14-51 | |
| HP Victus 16-r0076TX | |
| Asus TUF A15 FA507 | |
| Acer Nitro 16 AN16-41-R7YE | |
| Cinebench R15 / CPU Multi 64Bit | |
| Média da turma Gaming (1578 - 6271, n=104, últimos 2 anos) | |
| Acer Predator Helios 16 PH16-71-731Q | |
| Acer Predator Helios 16 PH16-71-731Q | |
| Alienware m16 R1 Intel | |
| Acer Predator Triton 14 PT14-51 | |
| Média Intel Core i5-13500HX (2856 - 2964, n=3) | |
| HP Victus 16-r0076TX | |
| Aorus 15 BSF | |
| Asus TUF A15 FA507 | |
| MSI Katana 15 B12VEK | |
| Acer Nitro 16 AN16-41-R7YE | |
| Cinebench R15 / CPU Single 64Bit | |
| Média da turma Gaming (188.8 - 343, n=105, últimos 2 anos) | |
| Alienware m16 R1 Intel | |
| Acer Predator Helios 16 PH16-71-731Q | |
| Aorus 15 BSF | |
| Média Intel Core i5-13500HX (242 - 263, n=3) | |
| Asus TUF A15 FA507 | |
| MSI Katana 15 B12VEK | |
| Acer Predator Triton 14 PT14-51 | |
| HP Victus 16-r0076TX | |
| Acer Nitro 16 AN16-41-R7YE | |
| Blender / v2.79 BMW27 CPU | |
| Acer Nitro 16 AN16-41-R7YE | |
| MSI Katana 15 B12VEK | |
| Asus TUF A15 FA507 | |
| Aorus 15 BSF | |
| HP Victus 16-r0076TX | |
| Média Intel Core i5-13500HX (178 - 193, n=3) | |
| Acer Predator Triton 14 PT14-51 | |
| Acer Predator Helios 16 PH16-71-731Q | |
| Alienware m16 R1 Intel | |
| Média da turma Gaming (80 - 330, n=103, últimos 2 anos) | |
| 7-Zip 18.03 / 7z b 4 | |
| Média da turma Gaming (33491 - 148086, n=104, últimos 2 anos) | |
| Alienware m16 R1 Intel | |
| Acer Predator Helios 16 PH16-71-731Q | |
| Acer Predator Triton 14 PT14-51 | |
| Média Intel Core i5-13500HX (68923 - 73701, n=3) | |
| HP Victus 16-r0076TX | |
| Aorus 15 BSF | |
| Asus TUF A15 FA507 | |
| MSI Katana 15 B12VEK | |
| Acer Nitro 16 AN16-41-R7YE | |
| 7-Zip 18.03 / 7z b 4 -mmt1 | |
| Alienware m16 R1 Intel | |
| Média da turma Gaming (4199 - 7436, n=104, últimos 2 anos) | |
| Acer Predator Helios 16 PH16-71-731Q | |
| Aorus 15 BSF | |
| Asus TUF A15 FA507 | |
| Acer Nitro 16 AN16-41-R7YE | |
| Média Intel Core i5-13500HX (5377 - 5850, n=3) | |
| MSI Katana 15 B12VEK | |
| Acer Predator Triton 14 PT14-51 | |
| HP Victus 16-r0076TX | |
| Geekbench 5.5 / Multi-Core | |
| Média da turma Gaming (6460 - 27010, n=104, últimos 2 anos) | |
| Acer Predator Helios 16 PH16-71-731Q | |
| Alienware m16 R1 Intel | |
| Acer Predator Triton 14 PT14-51 | |
| Aorus 15 BSF | |
| Média Intel Core i5-13500HX (12683 - 13767, n=3) | |
| HP Victus 16-r0076TX | |
| MSI Katana 15 B12VEK | |
| Asus TUF A15 FA507 | |
| Acer Nitro 16 AN16-41-R7YE | |
| Geekbench 5.5 / Single-Core | |
| Média da turma Gaming (986 - 2474, n=104, últimos 2 anos) | |
| Acer Predator Helios 16 PH16-71-731Q | |
| Aorus 15 BSF | |
| Alienware m16 R1 Intel | |
| Média Intel Core i5-13500HX (1688 - 1779, n=3) | |
| Acer Predator Triton 14 PT14-51 | |
| HP Victus 16-r0076TX | |
| MSI Katana 15 B12VEK | |
| Asus TUF A15 FA507 | |
| Acer Nitro 16 AN16-41-R7YE | |
| HWBOT x265 Benchmark v2.2 / 4k Preset | |
| Média da turma Gaming (11.5 - 44.3, n=104, últimos 2 anos) | |
| Acer Predator Helios 16 PH16-71-731Q | |
| Alienware m16 R1 Intel | |
| Acer Predator Triton 14 PT14-51 | |
| Média Intel Core i5-13500HX (20.3 - 20.9, n=3) | |
| HP Victus 16-r0076TX | |
| MSI Katana 15 B12VEK | |
| Asus TUF A15 FA507 | |
| Aorus 15 BSF | |
| Acer Nitro 16 AN16-41-R7YE | |
| LibreOffice / 20 Documents To PDF | |
| Asus TUF A15 FA507 | |
| Média da turma Gaming (33.2 - 88.8, n=104, últimos 2 anos) | |
| Acer Predator Triton 14 PT14-51 | |
| Aorus 15 BSF | |
| MSI Katana 15 B12VEK | |
| Acer Nitro 16 AN16-41-R7YE | |
| Alienware m16 R1 Intel | |
| Média Intel Core i5-13500HX (42.5 - 45, n=2) | |
| Acer Predator Helios 16 PH16-71-731Q | |
| R Benchmark 2.5 / Overall mean | |
| Acer Nitro 16 AN16-41-R7YE | |
| Asus TUF A15 FA507 | |
| MSI Katana 15 B12VEK | |
| HP Victus 16-r0076TX | |
| Acer Predator Triton 14 PT14-51 | |
| Média Intel Core i5-13500HX (0.4512 - 0.4891, n=3) | |
| Alienware m16 R1 Intel | |
| Aorus 15 BSF | |
| Média da turma Gaming (0.3439 - 0.759, n=105, últimos 2 anos) | |
| Acer Predator Helios 16 PH16-71-731Q | |
* ... menor é melhor
AIDA64: FP32 Ray-Trace | FPU Julia | CPU SHA3 | CPU Queen | FPU SinJulia | FPU Mandel | CPU AES | CPU ZLib | FP64 Ray-Trace | CPU PhotoWorxx
| Performance rating | |
| Média da turma Gaming | |
| Alienware m16 R1 Intel | |
| Acer Predator Helios 16 PH16-71-731Q | |
| Acer Predator Triton 14 PT14-51 | |
| Média Intel Core i5-13500HX | |
| HP Victus 16-r0076TX | |
| Asus TUF A15 FA507 | |
| Aorus 15 BSF | |
| MSI Katana 15 B12VEK | |
| Acer Nitro 16 AN16-41-R7YE | |
| AIDA64 / FP32 Ray-Trace | |
| Média da turma Gaming (10227 - 85542, n=103, últimos 2 anos) | |
| Alienware m16 R1 Intel | |
| Acer Predator Helios 16 PH16-71-731Q | |
| Asus TUF A15 FA507 | |
| Média Intel Core i5-13500HX (15888 - 16544, n=3) | |
| Acer Predator Triton 14 PT14-51 | |
| HP Victus 16-r0076TX | |
| MSI Katana 15 B12VEK | |
| Aorus 15 BSF | |
| Acer Nitro 16 AN16-41-R7YE | |
| AIDA64 / FPU Julia | |
| Média da turma Gaming (51376 - 238426, n=103, últimos 2 anos) | |
| Alienware m16 R1 Intel | |
| Asus TUF A15 FA507 | |
| Acer Predator Helios 16 PH16-71-731Q | |
| Acer Predator Triton 14 PT14-51 | |
| HP Victus 16-r0076TX | |
| Média Intel Core i5-13500HX (80761 - 85623, n=3) | |
| Acer Nitro 16 AN16-41-R7YE | |
| MSI Katana 15 B12VEK | |
| Aorus 15 BSF | |
| AIDA64 / CPU SHA3 | |
| Média da turma Gaming (2180 - 9817, n=103, últimos 2 anos) | |
| Alienware m16 R1 Intel | |
| Acer Predator Helios 16 PH16-71-731Q | |
| Acer Predator Triton 14 PT14-51 | |
| Média Intel Core i5-13500HX (3868 - 4017, n=3) | |
| HP Victus 16-r0076TX | |
| Asus TUF A15 FA507 | |
| MSI Katana 15 B12VEK | |
| Aorus 15 BSF | |
| Acer Nitro 16 AN16-41-R7YE | |
| AIDA64 / CPU Queen | |
| Média da turma Gaming (49785 - 173351, n=90, últimos 2 anos) | |
| Alienware m16 R1 Intel | |
| Acer Predator Helios 16 PH16-71-731Q | |
| Média Intel Core i5-13500HX (105168 - 107075, n=3) | |
| Aorus 15 BSF | |
| HP Victus 16-r0076TX | |
| Asus TUF A15 FA507 | |
| Acer Predator Triton 14 PT14-51 | |
| MSI Katana 15 B12VEK | |
| Acer Nitro 16 AN16-41-R7YE | |
| AIDA64 / FPU SinJulia | |
| Média da turma Gaming (4424 - 33636, n=103, últimos 2 anos) | |
| Alienware m16 R1 Intel | |
| Acer Predator Helios 16 PH16-71-731Q | |
| Asus TUF A15 FA507 | |
| Média Intel Core i5-13500HX (10334 - 10793, n=3) | |
| Acer Predator Triton 14 PT14-51 | |
| HP Victus 16-r0076TX | |
| Acer Nitro 16 AN16-41-R7YE | |
| Aorus 15 BSF | |
| MSI Katana 15 B12VEK | |
| AIDA64 / FPU Mandel | |
| Média da turma Gaming (25115 - 128721, n=103, últimos 2 anos) | |
| Asus TUF A15 FA507 | |
| Alienware m16 R1 Intel | |
| Acer Predator Helios 16 PH16-71-731Q | |
| Acer Nitro 16 AN16-41-R7YE | |
| Média Intel Core i5-13500HX (39805 - 41418, n=3) | |
| HP Victus 16-r0076TX | |
| Acer Predator Triton 14 PT14-51 | |
| MSI Katana 15 B12VEK | |
| Aorus 15 BSF | |
| AIDA64 / CPU AES | |
| Alienware m16 R1 Intel | |
| Acer Predator Helios 16 PH16-71-731Q | |
| Acer Predator Triton 14 PT14-51 | |
| Aorus 15 BSF | |
| Média da turma Gaming (39258 - 247074, n=103, últimos 2 anos) | |
| Média Intel Core i5-13500HX (79903 - 154368, n=3) | |
| Acer Nitro 16 AN16-41-R7YE | |
| HP Victus 16-r0076TX | |
| MSI Katana 15 B12VEK | |
| Asus TUF A15 FA507 | |
| AIDA64 / CPU ZLib | |
| Média da turma Gaming (574 - 2531, n=103, últimos 2 anos) | |
| Acer Predator Helios 16 PH16-71-731Q | |
| Alienware m16 R1 Intel | |
| Acer Predator Triton 14 PT14-51 | |
| Média Intel Core i5-13500HX (1104 - 1233, n=3) | |
| HP Victus 16-r0076TX | |
| Aorus 15 BSF | |
| MSI Katana 15 B12VEK | |
| Acer Nitro 16 AN16-41-R7YE | |
| Asus TUF A15 FA507 | |
| AIDA64 / FP64 Ray-Trace | |
| Média da turma Gaming (5509 - 45446, n=103, últimos 2 anos) | |
| Alienware m16 R1 Intel | |
| Acer Predator Helios 16 PH16-71-731Q | |
| Média Intel Core i5-13500HX (8587 - 9008, n=3) | |
| Acer Predator Triton 14 PT14-51 | |
| HP Victus 16-r0076TX | |
| Asus TUF A15 FA507 | |
| MSI Katana 15 B12VEK | |
| Aorus 15 BSF | |
| Acer Nitro 16 AN16-41-R7YE | |
| AIDA64 / CPU PhotoWorxx | |
| Acer Predator Triton 14 PT14-51 | |
| Média da turma Gaming (12271 - 89891, n=103, últimos 2 anos) | |
| Média Intel Core i5-13500HX (36861 - 42683, n=3) | |
| Aorus 15 BSF | |
| MSI Katana 15 B12VEK | |
| HP Victus 16-r0076TX | |
| Alienware m16 R1 Intel | |
| Acer Predator Helios 16 PH16-71-731Q | |
| Acer Nitro 16 AN16-41-R7YE | |
| Asus TUF A15 FA507 | |
dê uma olhada em nosso Core i5-13500HX para obter mais informações e comparações
Desempenho do sistema
Embora o HP Victus 16 funcione bem como um driver diário, ele fica atrás da concorrência no PCMark 10, onde marcou apenas 6.125 pontos.
Sua pontuação no CrossMark de 1.701 pontos o coloca à frente do Lenovo LOQ 15 e do Acer Nitro 16.
A situação é mais ou menos a mesma no AIDA64, onde o processador Raptor Lake-HX permanece consistentemente à frente de seus equivalentes da AMD.
CrossMark: Overall | Productivity | Creativity | Responsiveness
AIDA64: Memory Copy | Memory Read | Memory Write | Memory Latency
| PCMark 10 / Score | |
| Média da turma Gaming (5828 - 11574, n=92, últimos 2 anos) | |
| Lenovo Legion Pro 5 16ARX8 (R5 7645HX, RTX 4050) | |
| Acer Predator Helios 16 PH16-71-731Q | |
| Lenovo LOQ 15APH8 | |
| Acer Predator Triton 14 PT14-51 | |
| Alienware m16 R1 Intel | |
| Dell G15 5530 | |
| Acer Nitro 16 AN16-41-R7YE | |
| Média Intel Core i5-13500HX, NVIDIA GeForce RTX 4050 Laptop GPU (6125 - 6565, n=2) | |
| HP Victus 16-r0076TX | |
| PCMark 10 / Essentials | |
| Lenovo Legion Pro 5 16ARX8 (R5 7645HX, RTX 4050) | |
| Acer Predator Helios 16 PH16-71-731Q | |
| Dell G15 5530 | |
| Alienware m16 R1 Intel | |
| Média da turma Gaming (8810 - 11935, n=96, últimos 2 anos) | |
| Lenovo LOQ 15APH8 | |
| Acer Predator Triton 14 PT14-51 | |
| Média Intel Core i5-13500HX, NVIDIA GeForce RTX 4050 Laptop GPU (9625 - 10618, n=2) | |
| Acer Nitro 16 AN16-41-R7YE | |
| HP Victus 16-r0076TX | |
| PCMark 10 / Productivity | |
| Lenovo Legion Pro 5 16ARX8 (R5 7645HX, RTX 4050) | |
| Acer Predator Helios 16 PH16-71-731Q | |
| Média da turma Gaming (6845 - 21327, n=94, últimos 2 anos) | |
| Dell G15 5530 | |
| Lenovo LOQ 15APH8 | |
| Acer Predator Triton 14 PT14-51 | |
| Alienware m16 R1 Intel | |
| Média Intel Core i5-13500HX, NVIDIA GeForce RTX 4050 Laptop GPU (8471 - 9005, n=2) | |
| HP Victus 16-r0076TX | |
| Acer Nitro 16 AN16-41-R7YE | |
| PCMark 10 / Digital Content Creation | |
| Média da turma Gaming (7602 - 19657, n=94, últimos 2 anos) | |
| Lenovo LOQ 15APH8 | |
| Lenovo Legion Pro 5 16ARX8 (R5 7645HX, RTX 4050) | |
| Acer Predator Triton 14 PT14-51 | |
| Acer Nitro 16 AN16-41-R7YE | |
| Acer Predator Helios 16 PH16-71-731Q | |
| Alienware m16 R1 Intel | |
| Dell G15 5530 | |
| Média Intel Core i5-13500HX, NVIDIA GeForce RTX 4050 Laptop GPU (7649 - 8031, n=2) | |
| HP Victus 16-r0076TX | |
| CrossMark / Overall | |
| Acer Predator Helios 16 PH16-71-731Q | |
| Alienware m16 R1 Intel | |
| Média da turma Gaming (1366 - 2409, n=93, últimos 2 anos) | |
| Lenovo Legion Pro 5 16ARX8 (R5 7645HX, RTX 4050) | |
| Acer Predator Triton 14 PT14-51 | |
| Dell G15 5530 | |
| Média Intel Core i5-13500HX, NVIDIA GeForce RTX 4050 Laptop GPU (1701 - 1964, n=2) | |
| HP Victus 16-r0076TX | |
| Lenovo LOQ 15APH8 | |
| Acer Nitro 16 AN16-41-R7YE | |
| CrossMark / Productivity | |
| Acer Predator Helios 16 PH16-71-731Q | |
| Alienware m16 R1 Intel | |
| Lenovo Legion Pro 5 16ARX8 (R5 7645HX, RTX 4050) | |
| Média da turma Gaming (1386 - 2254, n=93, últimos 2 anos) | |
| Acer Predator Triton 14 PT14-51 | |
| Dell G15 5530 | |
| Média Intel Core i5-13500HX, NVIDIA GeForce RTX 4050 Laptop GPU (1585 - 1878, n=2) | |
| Lenovo LOQ 15APH8 | |
| HP Victus 16-r0076TX | |
| Acer Nitro 16 AN16-41-R7YE | |
| CrossMark / Creativity | |
| Acer Predator Helios 16 PH16-71-731Q | |
| Alienware m16 R1 Intel | |
| Média da turma Gaming (1343 - 2729, n=93, últimos 2 anos) | |
| Dell G15 5530 | |
| Lenovo Legion Pro 5 16ARX8 (R5 7645HX, RTX 4050) | |
| Acer Predator Triton 14 PT14-51 | |
| Média Intel Core i5-13500HX, NVIDIA GeForce RTX 4050 Laptop GPU (1912 - 2022, n=2) | |
| HP Victus 16-r0076TX | |
| Lenovo LOQ 15APH8 | |
| Acer Nitro 16 AN16-41-R7YE | |
| CrossMark / Responsiveness | |
| Acer Predator Helios 16 PH16-71-731Q | |
| Alienware m16 R1 Intel | |
| Lenovo Legion Pro 5 16ARX8 (R5 7645HX, RTX 4050) | |
| Média Intel Core i5-13500HX, NVIDIA GeForce RTX 4050 Laptop GPU (1478 - 2053, n=2) | |
| Acer Predator Triton 14 PT14-51 | |
| Média da turma Gaming (1226 - 2334, n=93, últimos 2 anos) | |
| Dell G15 5530 | |
| HP Victus 16-r0076TX | |
| Lenovo LOQ 15APH8 | |
| Acer Nitro 16 AN16-41-R7YE | |
| AIDA64 / Memory Copy | |
| Acer Predator Triton 14 PT14-51 | |
| Média da turma Gaming (21750 - 129946, n=103, últimos 2 anos) | |
| Dell G15 5530 | |
| Média Intel Core i5-13500HX, NVIDIA GeForce RTX 4050 Laptop GPU (56320 - 62153, n=3) | |
| Alienware m16 R1 Intel | |
| Acer Predator Helios 16 PH16-71-731Q | |
| HP Victus 16-r0076TX | |
| Acer Nitro 16 AN16-41-R7YE | |
| Lenovo Legion Pro 5 16ARX8 (R5 7645HX, RTX 4050) | |
| Lenovo LOQ 15APH8 | |
| AIDA64 / Memory Read | |
| Média da turma Gaming (22956 - 118858, n=103, últimos 2 anos) | |
| Dell G15 5530 | |
| Alienware m16 R1 Intel | |
| Acer Predator Helios 16 PH16-71-731Q | |
| Acer Predator Triton 14 PT14-51 | |
| Média Intel Core i5-13500HX, NVIDIA GeForce RTX 4050 Laptop GPU (66057 - 66667, n=3) | |
| HP Victus 16-r0076TX | |
| Acer Nitro 16 AN16-41-R7YE | |
| Lenovo Legion Pro 5 16ARX8 (R5 7645HX, RTX 4050) | |
| Lenovo LOQ 15APH8 | |
| AIDA64 / Memory Write | |
| Acer Predator Helios 16 PH16-71-731Q | |
| Acer Predator Triton 14 PT14-51 | |
| Média da turma Gaming (22297 - 135096, n=103, últimos 2 anos) | |
| Média Intel Core i5-13500HX, NVIDIA GeForce RTX 4050 Laptop GPU (56956 - 66135, n=3) | |
| Dell G15 5530 | |
| Alienware m16 R1 Intel | |
| HP Victus 16-r0076TX | |
| Acer Nitro 16 AN16-41-R7YE | |
| Lenovo Legion Pro 5 16ARX8 (R5 7645HX, RTX 4050) | |
| Lenovo LOQ 15APH8 | |
| AIDA64 / Memory Latency | |
| Média da turma Gaming (75.3 - 259, n=103, últimos 2 anos) | |
| Acer Predator Triton 14 PT14-51 | |
| HP Victus 16-r0076TX | |
| Lenovo LOQ 15APH8 | |
| Média Intel Core i5-13500HX, NVIDIA GeForce RTX 4050 Laptop GPU (87.1 - 96.8, n=3) | |
| Dell G15 5530 | |
| Alienware m16 R1 Intel | |
| Acer Nitro 16 AN16-41-R7YE | |
| Acer Predator Helios 16 PH16-71-731Q | |
| Lenovo Legion Pro 5 16ARX8 (R5 7645HX, RTX 4050) | |
* ... menor é melhor
| PCMark 8 Home Score Accelerated | 4602 pontos | |
| PCMark 8 Work Score Accelerated | 6227 pontos | |
| PCMark 10 Score | 6125 pontos | |
Ajuda | ||
Latência DPC
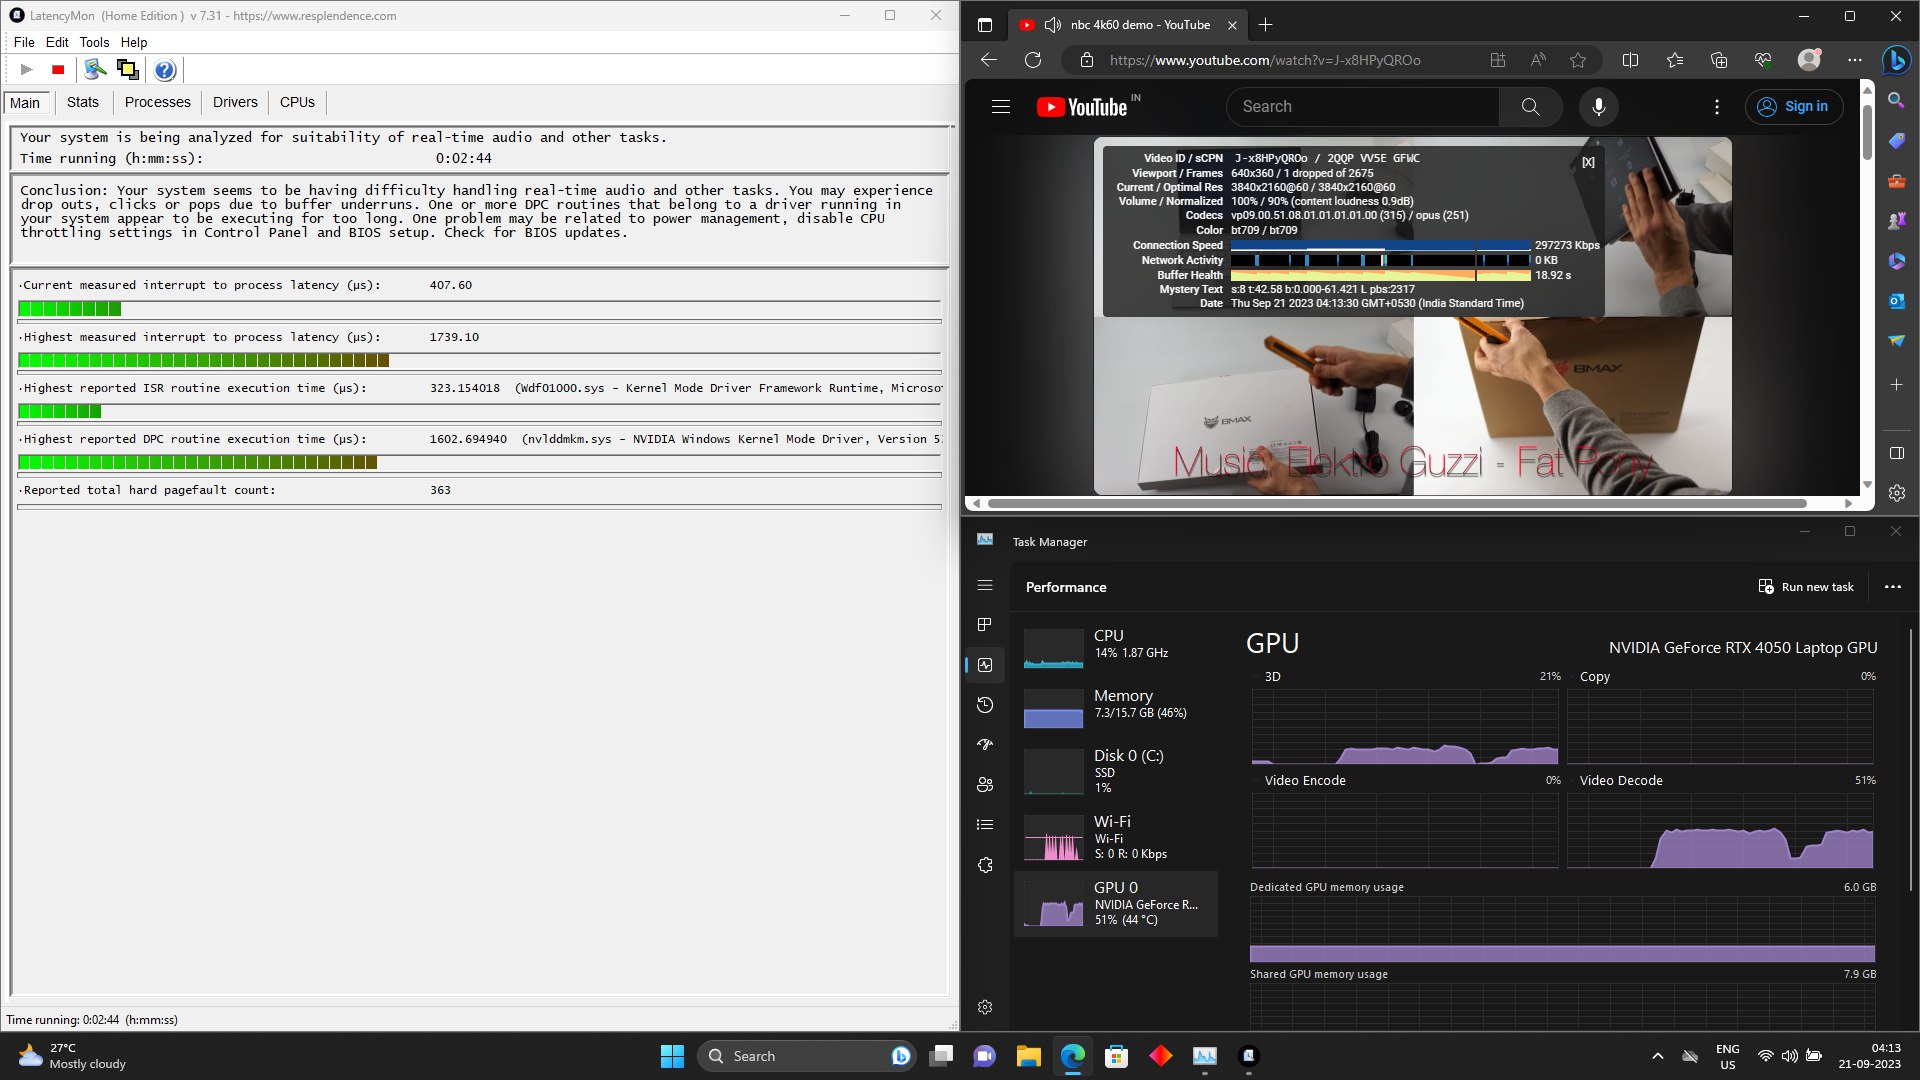
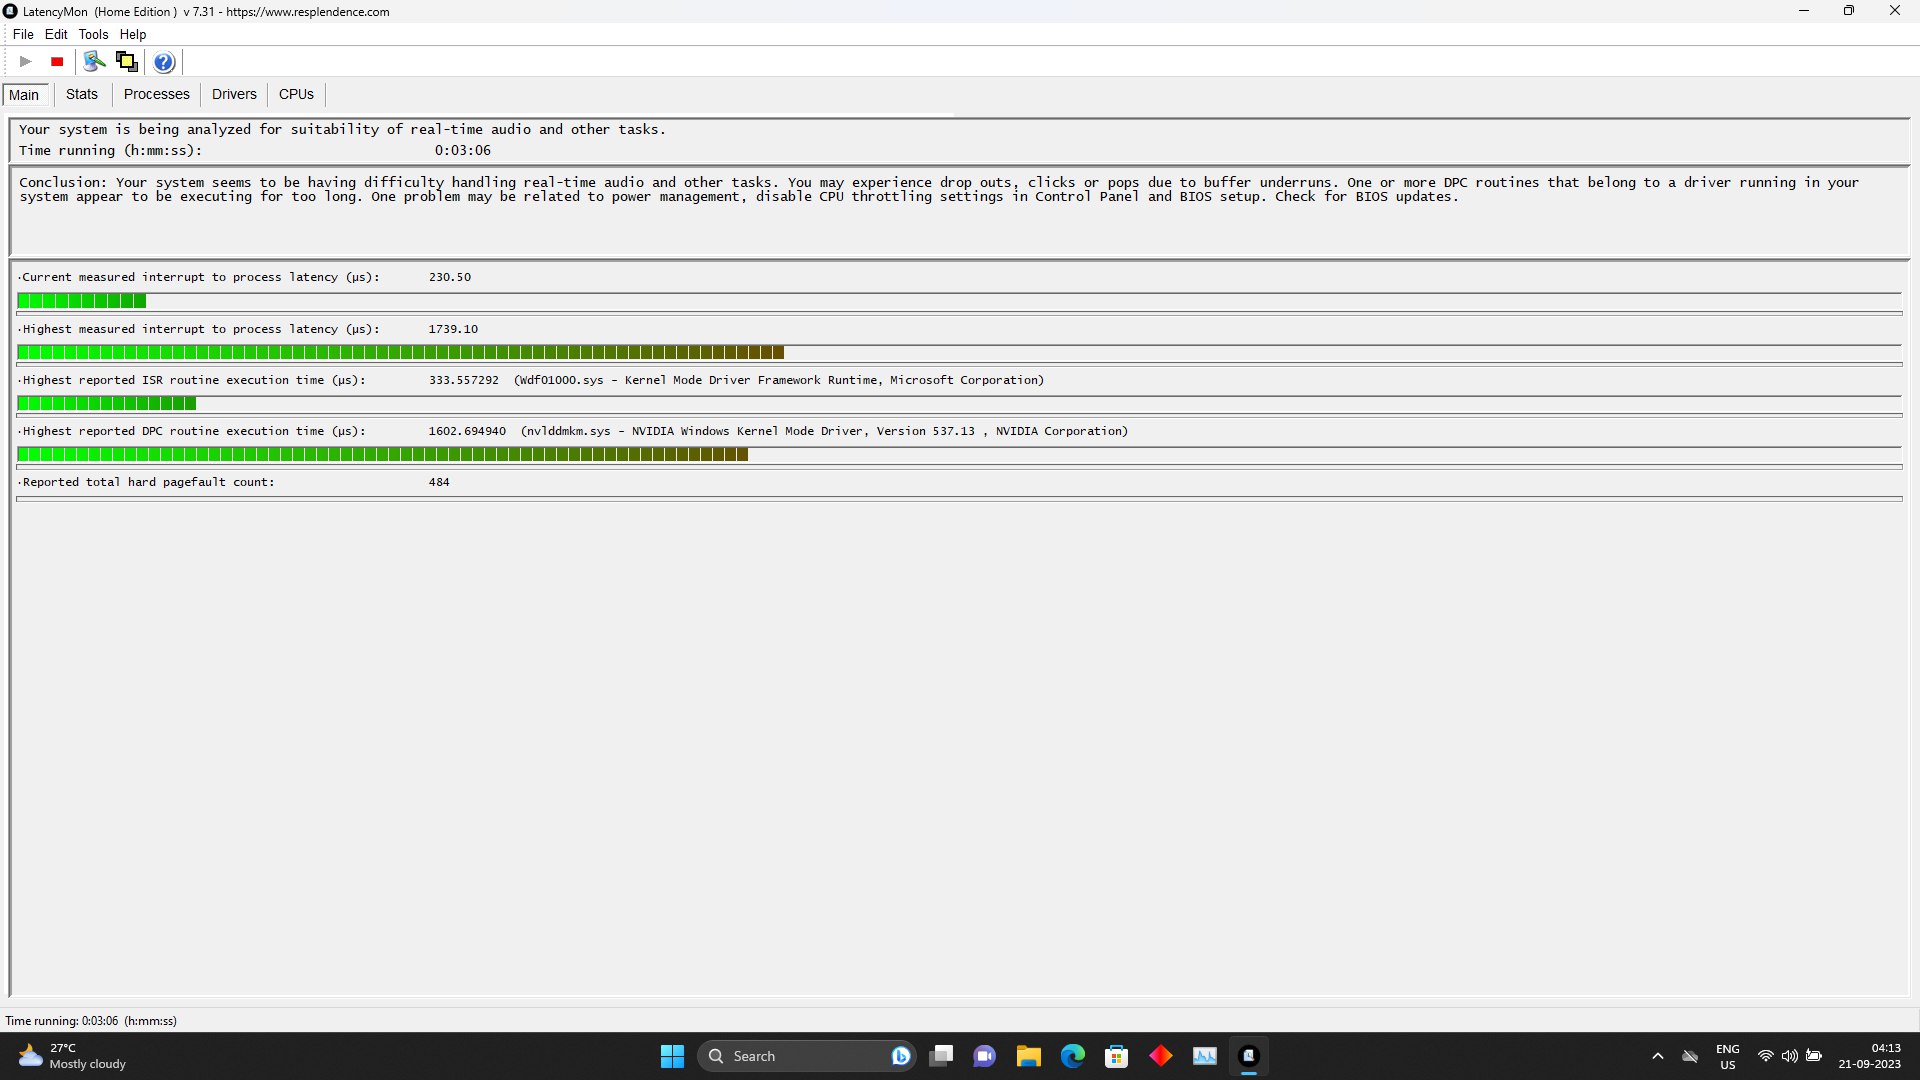
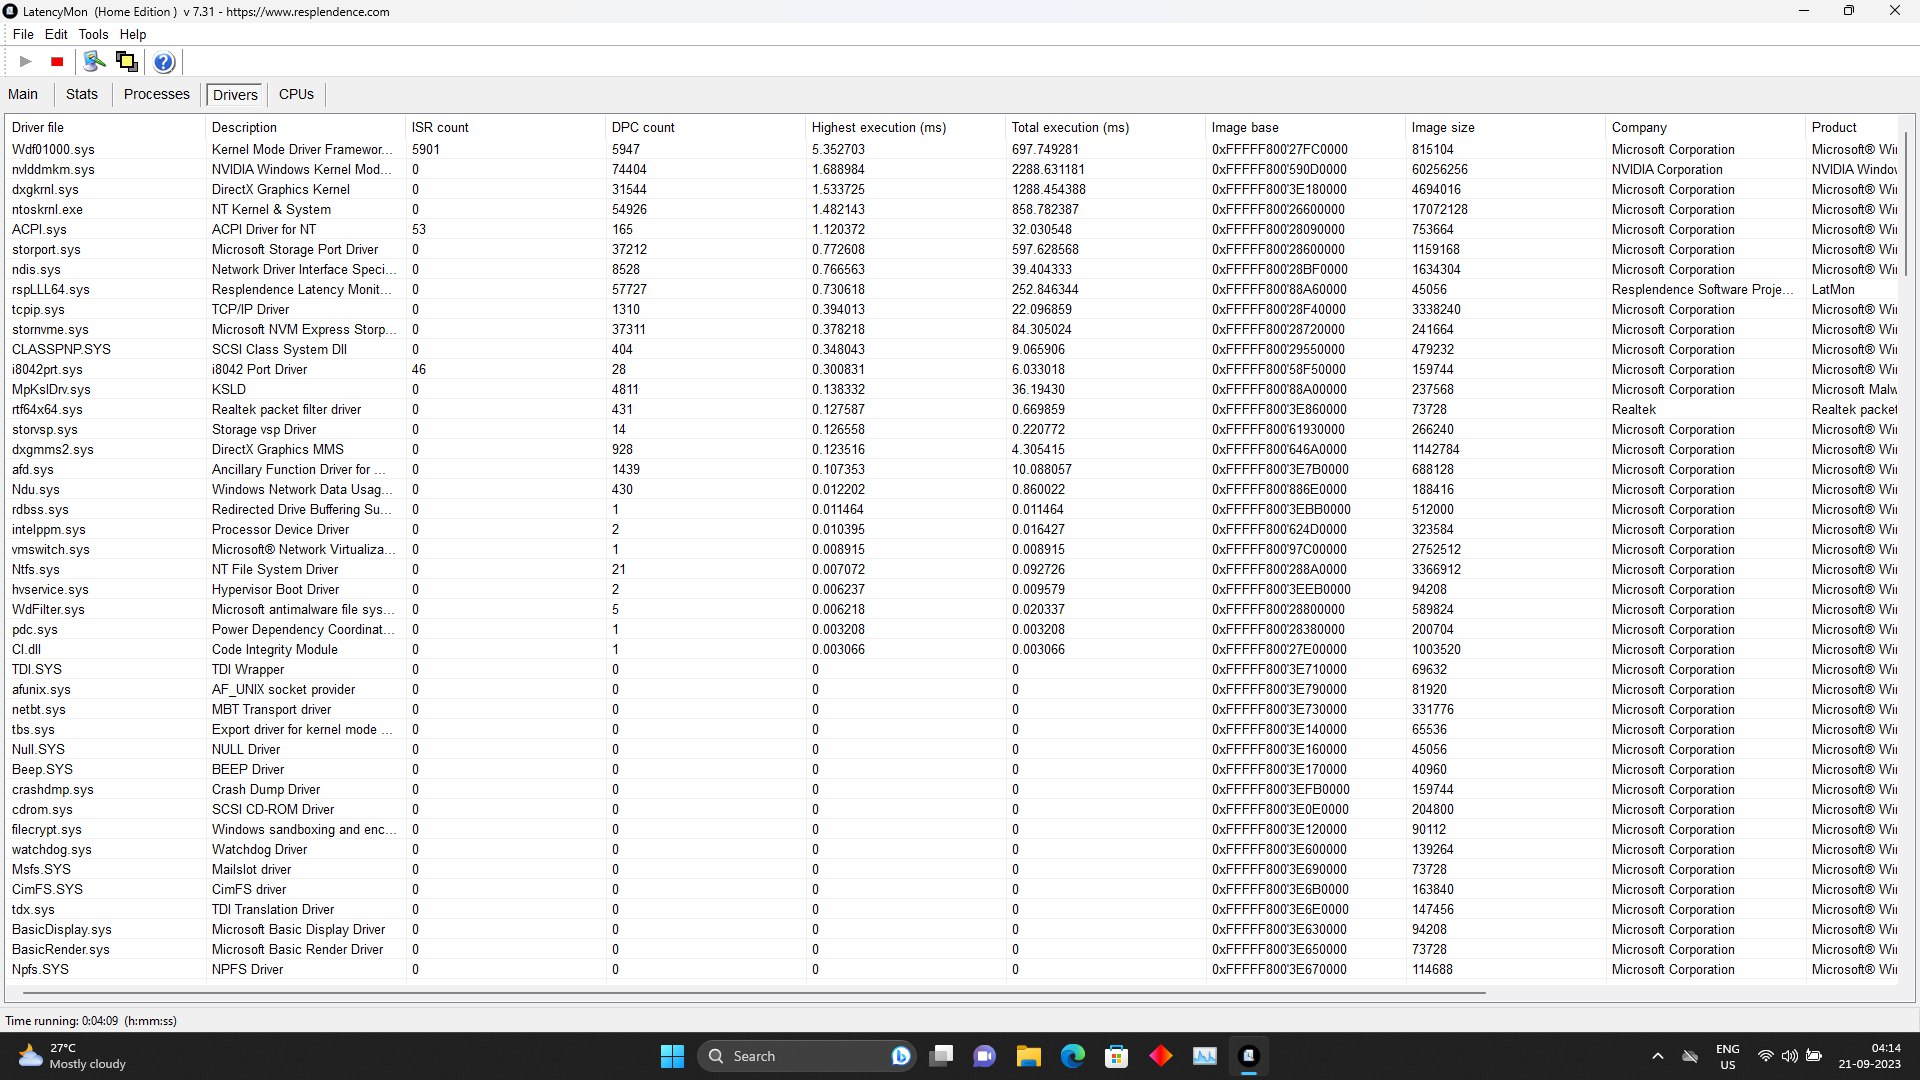
A alta latência de DPC tem sido um problema constante nas placas de vídeo Ada Lovelace para desktop desde o lançamento. O problema parece ter sido transferido para suas variantes de laptop também. Uma rápida olhada no LatencyMon diz que o culpado é o "Wdf0100.sys" (Windows Driver Framework) e o "Nvlddmkm.sys" (Nvidia Windows Kernel Module), indicando que uma atualização de software poderia resolver o problema mais tarde.
Confira Página de classificação de latência para obter mais resultados.
| DPC Latencies / LatencyMon - interrupt to process latency (max), Web, Youtube, Prime95 | |
| Dell G15 5530 | |
| Alienware m16 R1 Intel | |
| HP Victus 16-r0076TX | |
| Acer Predator Helios 16 PH16-71-731Q | |
| Acer Predator Triton 14 PT14-51 | |
| Lenovo LOQ 15APH8 | |
| Acer Nitro 16 AN16-41-R7YE | |
| Lenovo Legion Pro 5 16ARX8 (R5 7645HX, RTX 4050) | |
* ... menor é melhor
Dispositivos de armazenamento
O SSD SK Hynix PC801 NVMe do HP Victus 16 oferece velocidades de transferência decentes em uma variedade de cargas de trabalho. Nossos testes determinaram que ele não fica acelerado mesmo após uso prolongado, graças à sua espessa blindagem de metal.
No entanto, 512 GB é muito pouco em 2023, especialmente com os tamanhos inchados dos jogos se tornando a norma. Felizmente, a HP permite que os usuários instalem uma unidade adicional com relativa facilidade.

* ... menor é melhor
Disk Throttling: DiskSpd Read Loop, Queue Depth 8
Leia mais sobre nossos HDD e SSD benchmarks.
Desempenho da GPU
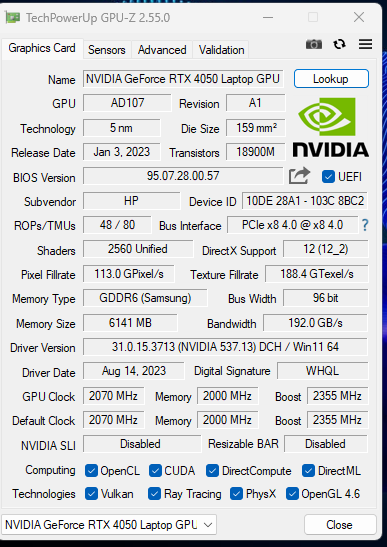
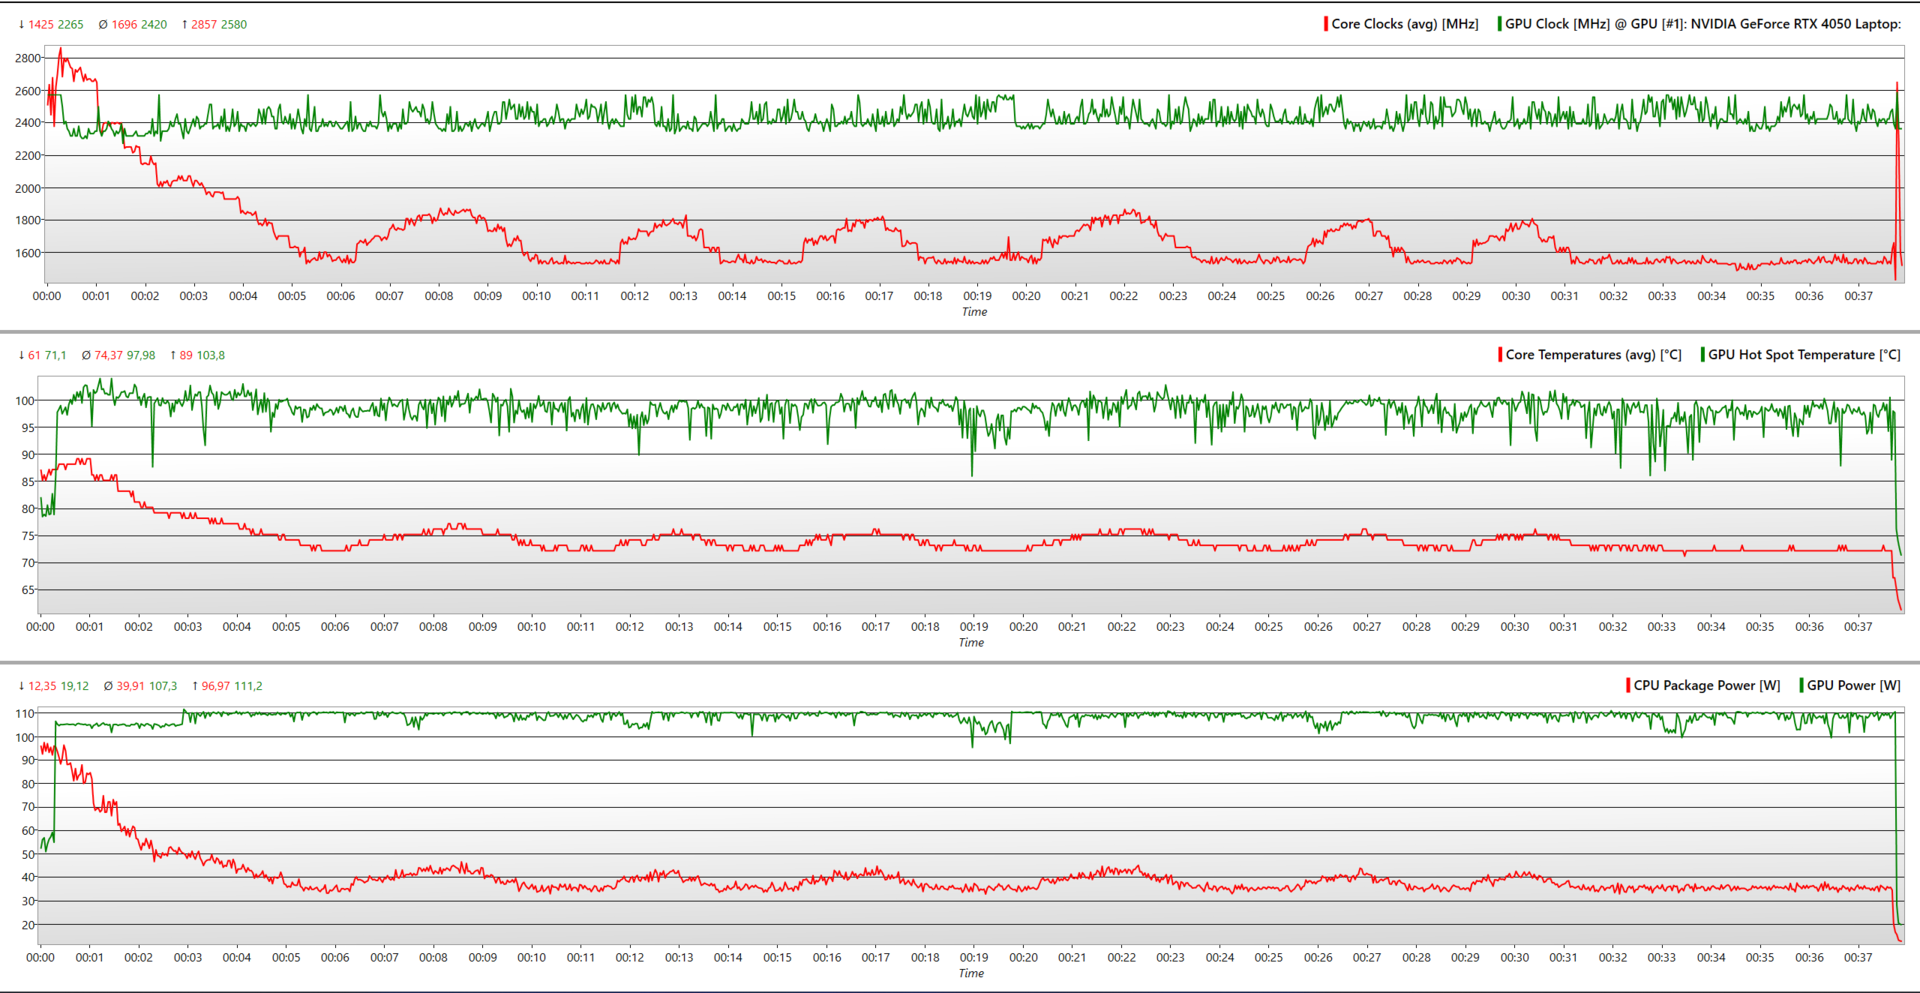
À primeira vista, a Nvidia GeForce RTX 4050 não parece ser a GPU mais potente do mercado. Ela tem 6 GB de VRAM GDDR6 em um barramento de 96 bits, 2.560 núcleos CUDA e um valor de TGP entre 35 e 115 Watts.
Algumas pesquisas no Painel de Controle da Nvidia revelaram que seu TGP máximo atinge cerca de 100 Watts, o que é respeitável. É interessante notar que a GeForce RTX 4050 pode "emprestar" até 20 watts de potência da CPU.
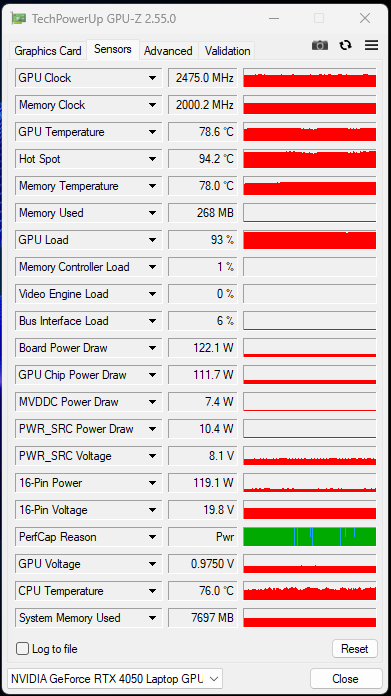
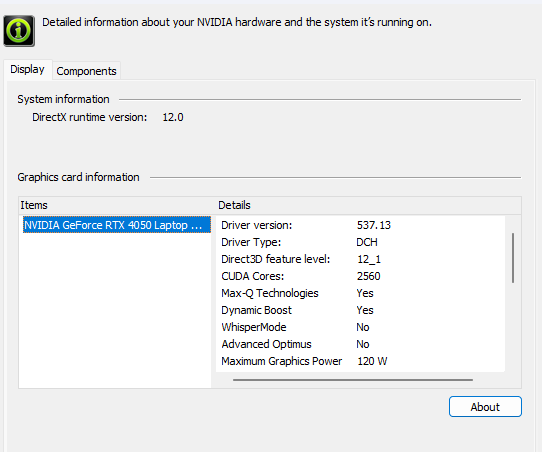
Isso se reflete no FurMark, onde a potência máxima da placa salta para 122,1 Watts sob carga. No entanto, ela não consegue permanecer nesse estado por muito tempo e se estabelece em um valor mais baixo depois de algum tempo.
O HP Victus 16 tem um desempenho marginalmente melhor do que outros notebooks RTX 4050 no 3DMark 11, com uma pontuação de 31.571 pontos. A diferença é menos aparente em testes 3DMark mais antigos, como Ice Storm, Fire Strike e Time Spy.
Concluindo, a GeForce RTX 4050, apesar de sua folha de especificações pouco satisfatória, ainda se mantém à altura da concorrência e é uma placa de vídeo de nível básico impecável.
| 3DMark 06 Standard Score | 46228 pontos | |
| 3DMark 11 Performance | 28214 pontos | |
| 3DMark Ice Storm Standard Score | 198276 pontos | |
| 3DMark Cloud Gate Standard Score | 61259 pontos | |
| 3DMark Fire Strike Score | 21070 pontos | |
| 3DMark Fire Strike Extreme Score | 10180 pontos | |
| 3DMark Time Spy Score | 9069 pontos | |
Ajuda | ||
| Blender / v3.3 Classroom OPTIX/RTX | |
| Média NVIDIA GeForce RTX 4050 Laptop GPU (25 - 37, n=40) | |
| HP Victus 16-r0076TX | |
| MSI Katana 15 B12VEK | |
| Asus TUF A15 FA507 | |
| Asus TUF A15 FA507 | |
| Acer Predator Triton 14 PT14-51 | |
| Acer Nitro 16 AN16-41-R7YE | |
| Alienware m16 R1 Intel | |
| Aorus 15 BSF | |
| Acer Predator Helios 16 PH16-71-731Q | |
| Média da turma Gaming (9 - 32, n=105, últimos 2 anos) | |
| Blender / v3.3 Classroom CUDA | |
| Média NVIDIA GeForce RTX 4050 Laptop GPU (47 - 68, n=39) | |
| MSI Katana 15 B12VEK | |
| Acer Predator Triton 14 PT14-51 | |
| Asus TUF A15 FA507 | |
| Asus TUF A15 FA507 | |
| Acer Nitro 16 AN16-41-R7YE | |
| HP Victus 16-r0076TX | |
| Acer Predator Helios 16 PH16-71-731Q | |
| Alienware m16 R1 Intel | |
| Aorus 15 BSF | |
| Média da turma Gaming (15 - 233, n=106, últimos 2 anos) | |
| Blender / v3.3 Classroom CPU | |
| Acer Nitro 16 AN16-41-R7YE | |
| MSI Katana 15 B12VEK | |
| Média NVIDIA GeForce RTX 4050 Laptop GPU (243 - 907, n=40) | |
| Aorus 15 BSF | |
| Asus TUF A15 FA507 | |
| Asus TUF A15 FA507 | |
| HP Victus 16-r0076TX | |
| Acer Predator Triton 14 PT14-51 | |
| Acer Predator Helios 16 PH16-71-731Q | |
| Alienware m16 R1 Intel | |
| Média da turma Gaming (122 - 565, n=101, últimos 2 anos) | |
* ... menor é melhor
Dê uma olhada em nosso site Nvidia GeForce RTX 4050 para obter mais informações e comparações.
Desempenho em jogos
A GeForce RTX 4050 é surpreendentemente competente em jogos, mesmo com apenas 6 GB de VRAM. Ele foi capaz de executar todos os jogos que lançamos a 1080p e 60 FPS, com todas as configurações aumentadas.
O desempenho estelar do Cyberpunk 2077 pode ser explicado pela extensa otimização do jogo feita pela Nvidia. Títulos de esportes eletrônicos, como DOTA 2 também funcionam bem no laptop.
As melhorias arquitetônicas trazidas por Ada Lovelace dão ao RTX 4050 uma chance decente como máquina de jogos de 1080p. No entanto, não recomendamos a ativação do raytracing sem o DLSS, pois ele é notoriamente pesado em termos de VRAM.
| The Witcher 3 - 1920x1080 Ultra Graphics & Postprocessing (HBAO+) | |
| Média da turma Gaming (104.7 - 240, n=6, últimos 2 anos) | |
| Alienware m16 R1 Intel | |
| Dell G15 5530 | |
| Acer Predator Helios 16 PH16-71-731Q | |
| HP Victus 16-r0076TX | |
| Lenovo Legion Pro 5 16ARX8 (R5 7645HX, RTX 4050) | |
| Acer Nitro 16 AN16-41-R7YE | |
| Lenovo LOQ 15APH8 | |
| Acer Predator Triton 14 PT14-51 | |
Em nossos testes contínuos, o The Witcher 3 foi capaz de funcionar razoavelmente bem com um mínimo de 90 fps o tempo todo. Embora a taxa de quadros tenha ficado em torno de 100 fps em alguns casos, ela caiu devido ao estrangulamento térmico. Em essência, o laptop pode fazer um bom trabalho ao jogar jogos exigentes com uma taxa de quadros bastante consistente.
Witcher 3 FPS Chart
| baixo | média | alto | ultra | |
|---|---|---|---|---|
| The Witcher 3 (2015) | 365 | 282 | 160.2 | 94.7 |
| Dota 2 Reborn (2015) | 181.5 | 163.4 | 159 | 145 |
| Final Fantasy XV Benchmark (2018) | 190.5 | 120.3 | 84.8 | |
| X-Plane 11.11 (2018) | 157.2 | 138.8 | 106.5 | |
| Far Cry 5 (2018) | 155 | 122 | 110 | 109 |
| Strange Brigade (2018) | 355 | 213 | 171.8 | 149.3 |
| Cyberpunk 2077 1.6 (2022) | 111.2 | 85.3 | 65.5 | 71.8 |
| F1 22 (2022) | 214 | 207 | 154.4 | 54.1 |
| F1 23 (2023) | 217 | 210 | 156.2 | 60.8 |
Emissões: Funciona um pouco alto e quente demais
Ruído do sistema
Embora a HP tenha feito tudo o que podia para resfriar o Victus 16, ele tem dificuldade em manter seu hardware sob controle. Uma das primeiras coisas que você notará é como o laptop fica barulhento sob a menor carga, com o ruído ficando progressivamente mais alto durante os jogos.
Nossos testes determinaram que a saída máxima de ruído é de 55 dB(A). Embora fique bem abaixo do limite do que pode ser considerado alto, não é algo que possa simplesmente se misturar ao fundo, não sem um par de fones de ouvido.
Barulho
| Ocioso |
| 23.68 / 23.68 / 23.68 dB |
| Carga |
| 39.44 / 55.37 dB |
 | ||
30 dB silencioso 40 dB(A) audível 50 dB(A) ruidosamente alto |
||
min: | ||
| Modo de desempenho | Idle dB(A) | Load average dB(A) | Load maximum dB(A) | The Witcher 3 1080p Ultra dB(A) |
|---|---|---|---|---|
| Eco | 23,67 | 32,50 | 40,80 | 41,03 / 84 fps |
| Equilibrado | 23,87 | 35,06 | 44,72 | 44,78 / 86 fps |
| Desempenho | 23.68 | 39.44 | 55.37 | 55.42 / 87 fps |
| HP Victus 16-r0076TX i5-13500HX, GeForce RTX 4050 Laptop GPU | Acer Nitro 16 AN16-41-R7YE R5 7535HS, GeForce RTX 4050 Laptop GPU | Acer Predator Triton 14 PT14-51 i7-13700H, GeForce RTX 4050 Laptop GPU | Alienware m16 R1 Intel i7-13700HX, GeForce RTX 4060 Laptop GPU | Acer Predator Helios 16 PH16-71-731Q i7-13700HX, GeForce RTX 4060 Laptop GPU | Dell G15 5530 i7-13650HX, GeForce RTX 4060 Laptop GPU | Lenovo Legion Pro 5 16ARX8 (R5 7645HX, RTX 4050) R5 7645HX, GeForce RTX 4050 Laptop GPU | Lenovo LOQ 15APH8 R7 7840HS, GeForce RTX 4050 Laptop GPU | |
|---|---|---|---|---|---|---|---|---|
| Noise | -1% | -7% | -9% | -3% | 3% | 5% | 0% | |
| desligado / ambiente * (dB) | 21.57 | 24 -11% | 25 -16% | 25 -16% | 24 -11% | 20.41 5% | 23 -7% | 23.1 -7% |
| Idle Minimum * (dB) | 23.68 | 25 -6% | 27 -14% | 25 -6% | 24 -1% | 26.85 -13% | 23 3% | 23.1 2% |
| Idle Average * (dB) | 23.68 | 26 -10% | 29 -22% | 26 -10% | 24 -1% | 26.85 -13% | 23 3% | 23.1 2% |
| Idle Maximum * (dB) | 23.68 | 27 -14% | 31 -31% | 27 -14% | 32.32 -36% | 26.85 -13% | 24.42 -3% | 25.2 -6% |
| Load Average * (dB) | 39.44 | 42 -6% | 42 -6% | 52 -32% | 36.66 7% | 27.65 30% | 34.94 11% | 44.3 -12% |
| Witcher 3 ultra * (dB) | 55.4 | 43 22% | 43 22% | 51 8% | 49.06 11% | 47.9 14% | 43.79 21% | 45.8 17% |
| Load Maximum * (dB) | 55.37 | 45 19% | 45 19% | 53 4% | 49.49 11% | 47.86 14% | 50 10% | 52 6% |
* ... menor é melhor
Temperatura
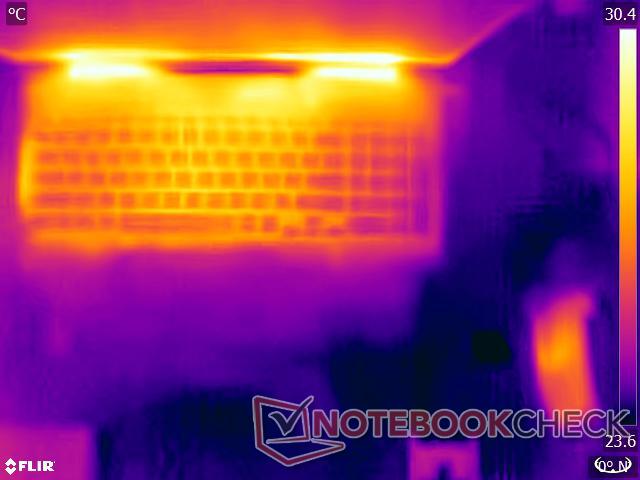
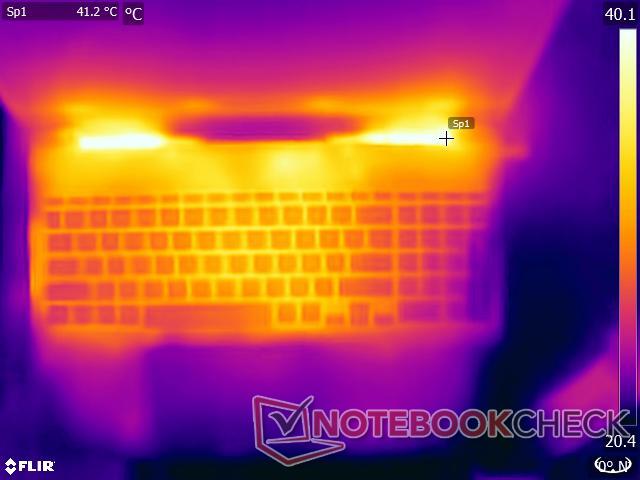
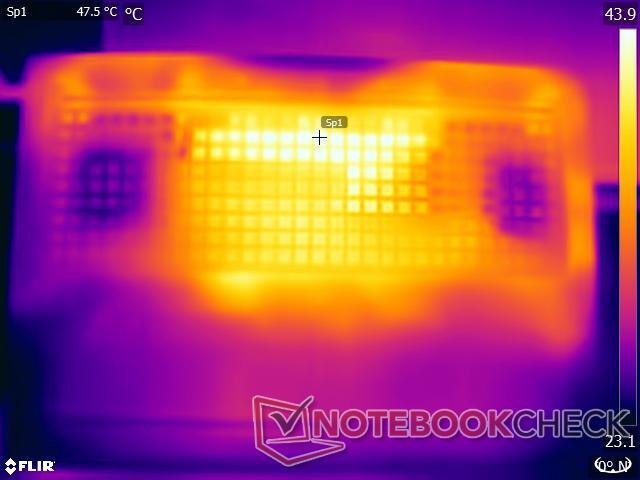
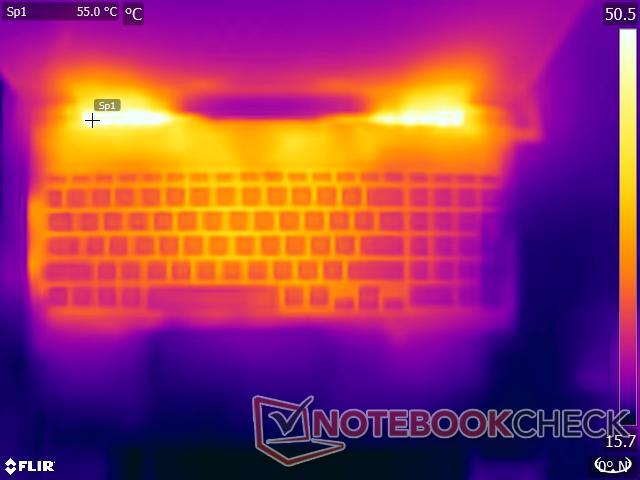
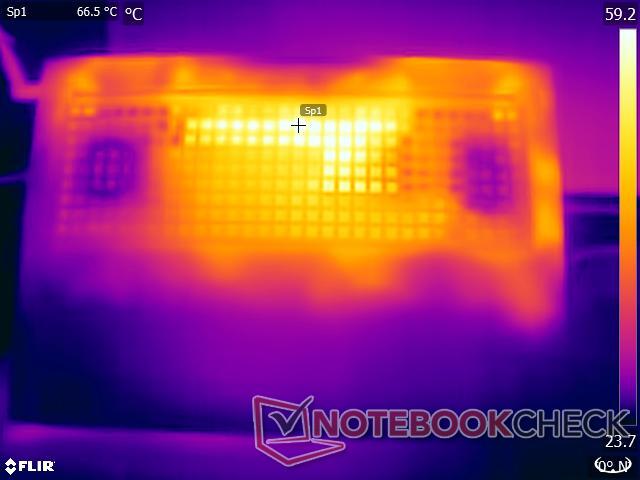
Logo de cara, o HP Victus 16 fica quente ao toque depois de algum tempo jogando. Seu chassi de plástico não consegue isolar o calor gerado pelos componentes que consomem muita energia. O teclado, em particular, fica visivelmente mais quente depois de alguns minutos de jogo.
As escolhas de design da HP fazem com que parte do calor seja expelido em todas as direções. Nossos testes determinaram que a área diretamente adjacente à ventilação pode chegar a 48° C sob carga. Esse é o ponto mais quente que o laptop atinge, com as áreas ao redor oscilando entre 44° C e 45,8 °C.
(-) A temperatura máxima no lado superior é 48 °C / 118 F, em comparação com a média de 40.4 °C / 105 F , variando de 21.2 a 68.8 °C para a classe Gaming.
(-) A parte inferior aquece até um máximo de 48 °C / 118 F, em comparação com a média de 43.2 °C / 110 F
(+) Em uso inativo, a temperatura média para o lado superior é 28 °C / 82 F, em comparação com a média do dispositivo de 33.9 °C / ### class_avg_f### F.
(-) Jogando The Witcher 3, a temperatura média para o lado superior é 38.7 °C / 102 F, em comparação com a média do dispositivo de 33.9 °C / ## #class_avg_f### F.
(+) Os apoios para as mãos e o touchpad são mais frios que a temperatura da pele, com um máximo de 31.2 °C / 88.2 F e, portanto, são frios ao toque.
(-) A temperatura média da área do apoio para as mãos de dispositivos semelhantes foi 28.8 °C / 83.8 F (-2.4 °C / -4.4 F).
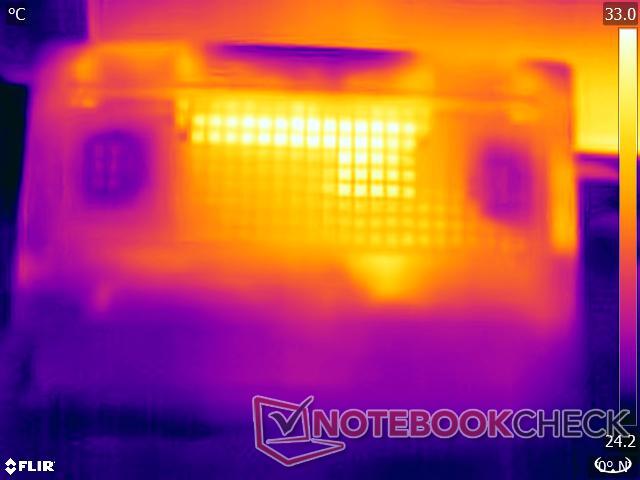
| HP Victus 16-r0076TX Intel Core i5-13500HX, NVIDIA GeForce RTX 4050 Laptop GPU | Acer Nitro 16 AN16-41-R7YE AMD Ryzen 5 7535HS, NVIDIA GeForce RTX 4050 Laptop GPU | Acer Predator Triton 14 PT14-51 Intel Core i7-13700H, NVIDIA GeForce RTX 4050 Laptop GPU | Alienware m16 R1 Intel Intel Core i7-13700HX, NVIDIA GeForce RTX 4060 Laptop GPU | Acer Predator Helios 16 PH16-71-731Q Intel Core i7-13700HX, NVIDIA GeForce RTX 4060 Laptop GPU | Dell G15 5530 Intel Core i7-13650HX, NVIDIA GeForce RTX 4060 Laptop GPU | Lenovo Legion Pro 5 16ARX8 (R5 7645HX, RTX 4050) AMD Ryzen 5 7645HX, NVIDIA GeForce RTX 4050 Laptop GPU | Lenovo LOQ 15APH8 AMD Ryzen 7 7840HS, NVIDIA GeForce RTX 4050 Laptop GPU | |
|---|---|---|---|---|---|---|---|---|
| Heat | -15% | -10% | -17% | -17% | -17% | -14% | 2% | |
| Maximum Upper Side * (°C) | 48 | 51 -6% | 54 -13% | 49 -2% | 41 15% | 54 -13% | 45 6% | 44.4 7% |
| Maximum Bottom * (°C) | 48 | 63 -31% | 56 -17% | 48 -0% | 66 -38% | 62.2 -30% | 54 -13% | 52 -8% |
| Idle Upper Side * (°C) | 29.6 | 34 -15% | 31 -5% | 40 -35% | 36 -22% | 33.4 -13% | 36 -22% | 28 5% |
| Idle Bottom * (°C) | 30.2 | 32 -6% | 31 -3% | 39 -29% | 37 -23% | 33.4 -11% | 38 -26% | 29.6 2% |
* ... menor é melhor
Teste de estresse
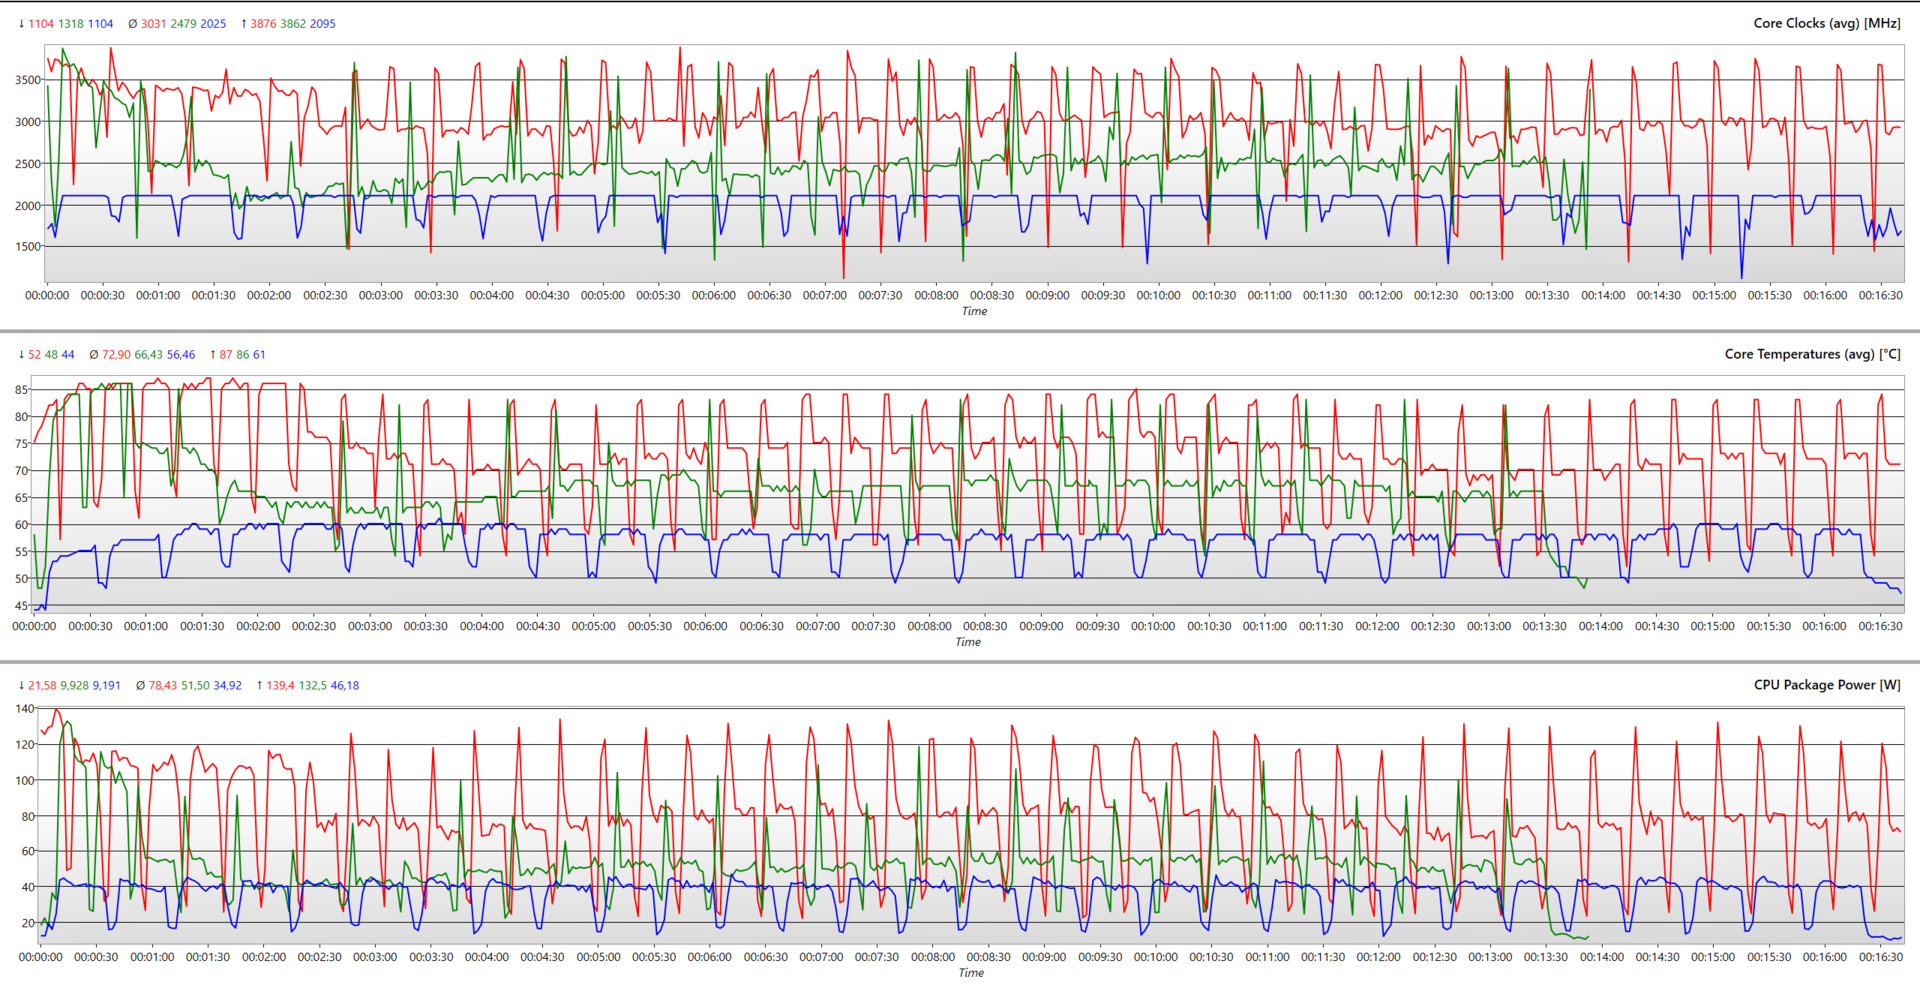
Sob cargas constantes, a CPU e a GPU do HP Victus 16 registram uma queda notável nas velocidades de clock. O processador Core i5-13500HX pode aumentar até 2,8 GHz por um tempo antes de se estabilizar em torno de 1,69 GHz. Sua temperatura gira em torno da região de 77°C.
Da mesma forma, o GeForce RTX 4050 tenta manter seus clocks em 2.580 MHz, mas acaba se fixando em 2.420 MHz, o que se enquadra nos clocks de reforço anunciados pela Nvidia. Ele funciona um pouco mais quente do que a CPU, com uma temperatura média de 82,5 °C, graças aos dois ventiladores robustos e aos tubos de calor que canalizam o calor através das aberturas.
O núcleo P pode aumentar até 4,4 GHz por um breve período, um pouco abaixo do valor anunciado pela Intel de 4,7 GHz. Da mesma forma, seu núcleo E atinge o máximo de 3,49 GHz, um pouco abaixo dos 3,50 GHz. Em média, o clock de aumento geral chega a 3,8 GHz em toda a placa. Depois de algum tempo, ele se estabiliza em torno de 2,53 GHz.
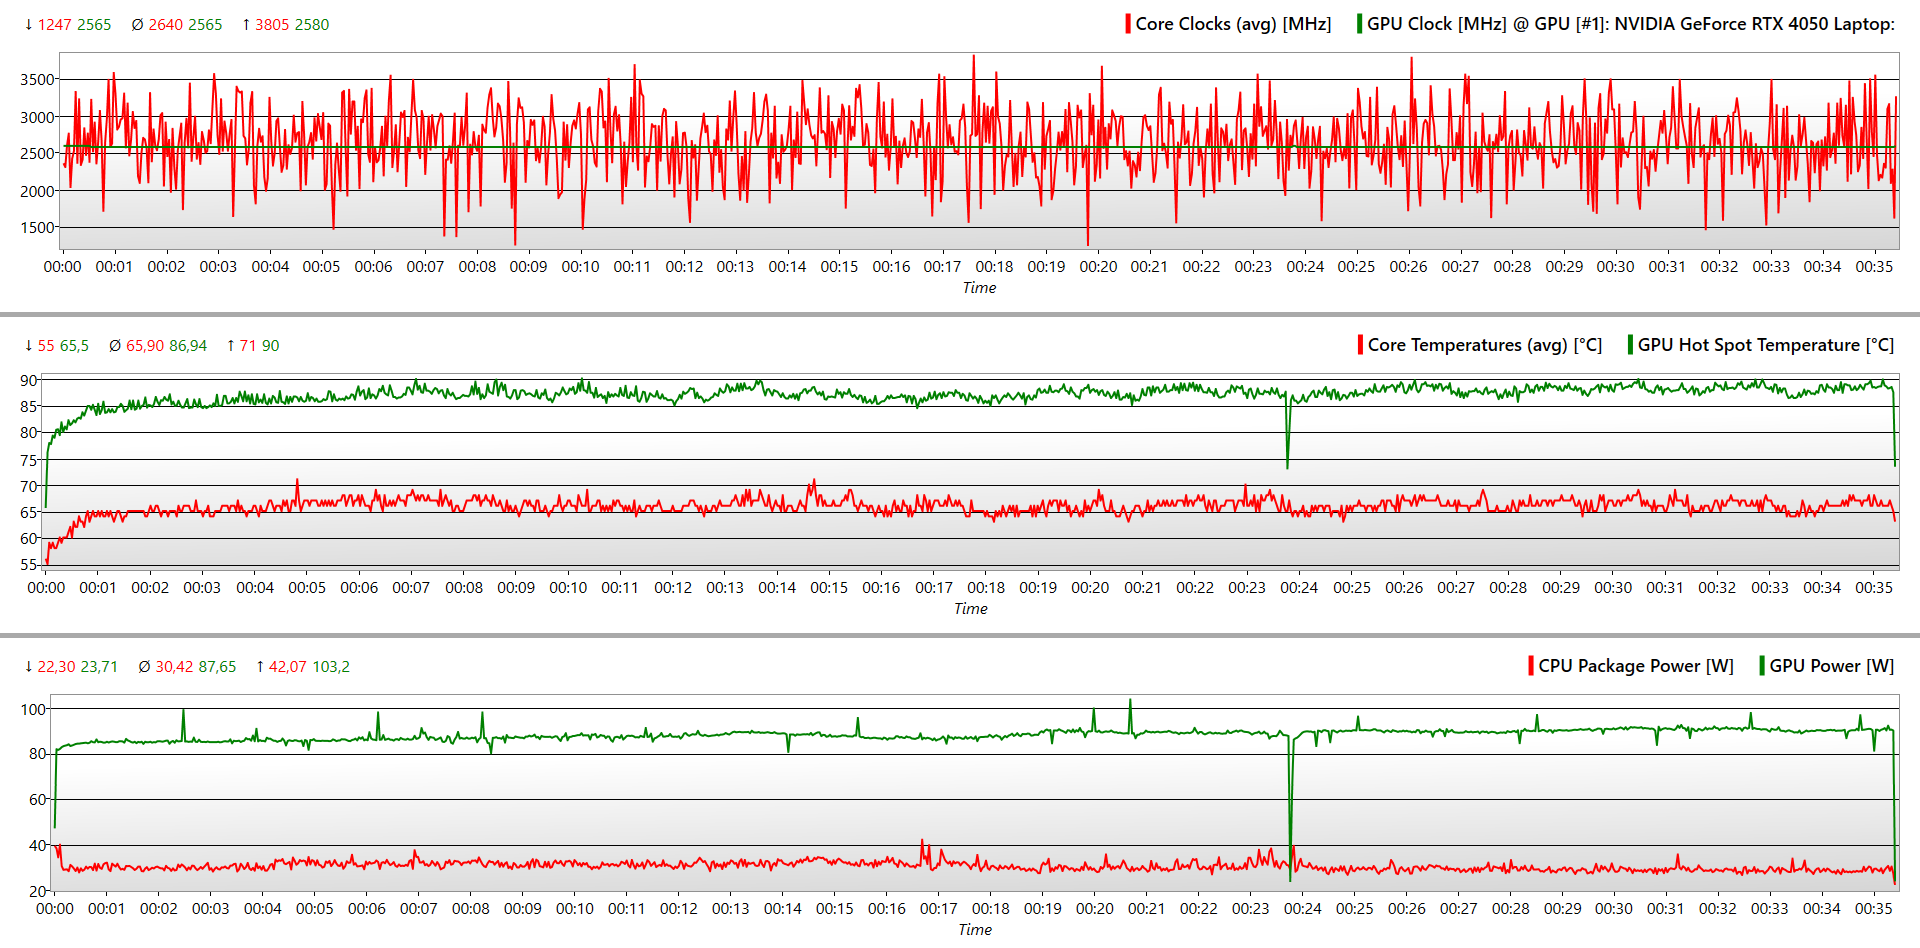
| Estresse | Relógio da CPU (GHz) | Relógio da GPU (MHz) | Temperatura média da CPU (°C) | Temperatura média da GPU (°C) |
| Sistema ocioso | 1.755 | 700 | 41 | 45 |
| Prime95 | 2.539 | 500 | 82.5 | 63.1 |
| Prime95 + FurMark | 1.696 | 2.420 | 77,2 | 82,5 |
| O Witcher 3 1080p Ultra | 3.047 | 2.565 | 80 | 74 |
Alto-falantes
Com um volume máximo de 70,7 dB(A), eles são pouco mais altos do que o ventilador em condições estressantes. Os drivers propriamente ditos são minúsculos e não são nada de especial.
Dito isso, a HP se esforçou um pouco e incluiu o ajuste B&O (Bang and Olufsen). Isso resulta em médios e agudos respeitáveis, mas não se pode dizer o mesmo dos graves. Isso é bom para o consumo de vídeo, mas a qualidade do áudio pode ser comprometida se os ventiladores decidirem aumentar o volume.
Como alternativa, é possível conectar um fone de ouvido/alto-falante por meio do conector de áudio de 3,5 mm ou usar o Bluetooth 5.3 totalmente sem fio.
HP Victus 16-r0076TX análise de áudio
(-) | alto-falantes não muito altos (###valor### dB)
Graves 100 - 315Hz
(±) | graves reduzidos - em média 9.7% menor que a mediana
(±) | a linearidade dos graves é média (7.6% delta para a frequência anterior)
Médios 400 - 2.000 Hz
(+) | médios equilibrados - apenas 3.2% longe da mediana
(+) | médios são lineares (2.5% delta para frequência anterior)
Altos 2 - 16 kHz
(+) | agudos equilibrados - apenas 4% longe da mediana
(+) | os máximos são lineares (5.7% delta da frequência anterior)
Geral 100 - 16.000 Hz
(±) | a linearidade do som geral é média (15.4% diferença em relação à mediana)
Comparado com a mesma classe
» 34% de todos os dispositivos testados nesta classe foram melhores, 7% semelhantes, 59% piores
» O melhor teve um delta de 6%, a média foi 18%, o pior foi 132%
Comparado com todos os dispositivos testados
» 23% de todos os dispositivos testados foram melhores, 4% semelhantes, 73% piores
» O melhor teve um delta de 4%, a média foi 23%, o pior foi 134%
Apple MacBook Pro 16 2021 M1 Pro análise de áudio
(+) | os alto-falantes podem tocar relativamente alto (###valor### dB)
Graves 100 - 315Hz
(+) | bons graves - apenas 3.8% longe da mediana
(+) | o baixo é linear (5.2% delta para a frequência anterior)
Médios 400 - 2.000 Hz
(+) | médios equilibrados - apenas 1.3% longe da mediana
(+) | médios são lineares (2.1% delta para frequência anterior)
Altos 2 - 16 kHz
(+) | agudos equilibrados - apenas 1.9% longe da mediana
(+) | os máximos são lineares (2.7% delta da frequência anterior)
Geral 100 - 16.000 Hz
(+) | o som geral é linear (4.6% diferença em relação à mediana)
Comparado com a mesma classe
» 0% de todos os dispositivos testados nesta classe foram melhores, 0% semelhantes, 100% piores
» O melhor teve um delta de 5%, a média foi 17%, o pior foi 45%
Comparado com todos os dispositivos testados
» 0% de todos os dispositivos testados foram melhores, 0% semelhantes, 100% piores
» O melhor teve um delta de 4%, a média foi 23%, o pior foi 134%
Gerenciamento de energia: A duração da bateria poderia ter sido melhor
Consumo de energia
O processador Raptor Lake-HX do HP Victus 16 e a GPU Ada Lovelace fazem um trabalho rápido com a fonte de alimentação de 230 watts fornecida, consumindo até 237 watts. No entanto, a situação é muito melhor em modo inativo, com o consumo de energia chegando a 22,1 watts.
Esse valor não muda muito nos processadores da marca HX da AMD encontrados em seus concorrentes. É interessante notar que o Dell G5 15's Core i7-13700HX do Dell G5 15 é um pouco mais eficiente em modo inativo, com um consumo médio de energia de 14,98 Watts.
| desligado | |
| Ocioso | |
| Carga |
|
Key:
min: | |
| HP Victus 16-r0076TX i5-13500HX, GeForce RTX 4050 Laptop GPU, SK hynix PC801 HFS512GEJ9X101N BF, IPS, 1920x1080, 16.1" | Acer Nitro 16 AN16-41-R7YE R5 7535HS, GeForce RTX 4050 Laptop GPU, SK hynix HFS512GEJ9X125N, IPS, 1920x1200, 16" | Acer Predator Helios 16 PH16-71-731Q i7-13700HX, GeForce RTX 4060 Laptop GPU, Micron 3400 1TB MTFDKBA1T0TFH, IPS-LED, 2560x1600, 16" | Dell G15 5530 i7-13650HX, GeForce RTX 4060 Laptop GPU, SSTC CL4-3D512-Q11, IPS, 1920x1080, 15.6" | Lenovo Legion Pro 5 16ARX8 (R5 7645HX, RTX 4050) R5 7645HX, GeForce RTX 4050 Laptop GPU, SK hynix PC801 HFS512GEJ9X115N, IPS, 2560x1600, 16" | Lenovo LOQ 15APH8 R7 7840HS, GeForce RTX 4050 Laptop GPU, Micron 2450 512GB MTFDKCD512TFK, IPS, 1920x1080, 15.6" | Média NVIDIA GeForce RTX 4050 Laptop GPU | Média da turma Gaming | |
|---|---|---|---|---|---|---|---|---|
| Power Consumption | 7% | -5% | 13% | 12% | 15% | 21% | -1% | |
| Idle Minimum * (Watt) | 16.12 | 19 -18% | 15.9 1% | 8.4 48% | 13 19% | 15 7% | 9.95 ? 38% | 13 ? 19% |
| Idle Average * (Watt) | 20.47 | 20 2% | 20.5 -0% | 14.98 27% | 17.4 15% | 17.7 14% | 15.8 ? 23% | 18.6 ? 9% |
| Idle Maximum * (Watt) | 22.11 | 23 -4% | 20.9 5% | 15.56 30% | 21.8 1% | 21.5 3% | 20.1 ? 9% | 24.2 ? -9% |
| Load Average * (Watt) | 94.8 | 80 16% | 106 -12% | 96.8 -2% | 96.4 -2% | 73.5 22% | 88 ? 7% | 109.2 ? -15% |
| Witcher 3 ultra * (Watt) | 166.9 | 125.8 25% | 175 -5% | 186 -11% | 125 25% | 138.6 17% | ||
| Load Maximum * (Watt) | 237 | 184 22% | 276 -16% | 271.42 -15% | 204 14% | 176.5 26% | 176.3 ? 26% | 256 ? -8% |
* ... menor é melhor
Power Consumption: The Witcher 3 / Stress test
Power Consumption: External monitor
Duração da bateria
O HP Victus 16 vem com uma bateria respeitável de 83 Wh. Uma unidade de 99 Wh teria sido ideal, mas essas são reservadas para SKUs topo de linha.
Em nosso teste de navegação na Web por Wi-Fi com o brilho definido para 150 nits, obtivemos cerca de 8 horas e 51 minutos de duração da bateria. Aumentar o brilho ao máximo reduziu esse número para 8 horas e 10 minutos.
Curiosamente, o laptop se saiu pior no teste Big Buck Bunny FHD H.264 com o brilho definido em 150 nits e todos os rádios (Wi-Fi, Bluetooth) desligados. Ele durou apenas 7 horas e 39 minutos. Em um cenário ideal, esse número deveria ter sido maior.
Por fim, ele foi abandonado após apenas 1 hora e 31 minutos em nosso teste The Witcher 3 com brilho de 150 nits e o jogo sendo executado nas configurações "Ultra". Esse número caiu para 1 hora e 11 minutos com uma carga combinada de Prime95 e FurMark.
| HP Victus 16-r0076TX i5-13500HX, GeForce RTX 4050 Laptop GPU, 83 Wh | Alienware m16 R1 Intel i7-13700HX, GeForce RTX 4060 Laptop GPU, 86 Wh | Acer Predator Helios 16 PH16-71-731Q i7-13700HX, GeForce RTX 4060 Laptop GPU, 90 Wh | Dell G15 5530 i7-13650HX, GeForce RTX 4060 Laptop GPU, 86 Wh | Lenovo Legion Pro 5 16ARX8 (R5 7645HX, RTX 4050) R5 7645HX, GeForce RTX 4050 Laptop GPU, 80 Wh | Lenovo LOQ 15APH8 R7 7840HS, GeForce RTX 4050 Laptop GPU, 60 Wh | Média da turma Gaming | |
|---|---|---|---|---|---|---|---|
| Duração da bateria | -30% | -13% | -30% | -38% | -13% | 6% | |
| H.264 (h) | 7.7 | 5.6 -27% | 4.8 -38% | 6.8 -12% | 5.4 -30% | 8.64 ? 12% | |
| WiFi v1.3 (h) | 8.9 | 4.8 -46% | 5.6 -37% | 6.5 -27% | 5.6 -37% | 7.4 -17% | 7.11 ? -20% |
| Witcher 3 ultra (h) | 1.5 | 1.5 0% | 0.8 -47% | 0.8 -47% | |||
| Load (h) | 1.2 | 1 -17% | 1.5 25% | 0.8 -33% | 1.1 -8% | 1.502 ? 25% | |
| Reader / Idle (h) | 6.4 | 9.8 | 8.71 ? |
Pro
Contra
Veredicto: Um laptop decente para jogos em 1080p para quem tem um orçamento limitado
O HP Victus 16 é um laptop decente para jogos, mas não sem suas deficiências. Apesar dos melhores esforços da empresa para manter a temperatura sob controle com suas duas ventoinhas e um labirinto de dissipadores de calor, ainda encontramos altas emissões térmicas.
Logo de cara, o processador Raptor Lake-HX faz valer seu peso, permitindo que o laptop supere o desempenho de concorrentes com especificações melhores, como o Lenovo Legion Pro 5 16ARX8 com o processador Ryzen 5 7645HX e a mesma GPU.
Além disso, há a questão do bloatware. Todos nós gostamos de um bom serviço de VPN, mas é irritante quando os pop-ups da ExpressVPN aparecem a cada poucos minutos. E não, o laptop não vem com um plano da ExpressVPN.
O HP Victus 16 é uma máquina de jogos de 1080p ideal para entusiastas de e-sports com um orçamento limitado, graças ao seu poderoso processador e tela de 165 Hz, se você puder suportar o ruído e a temperatura.
Atualmente, há pouquíssimos notebooks no mercado com processadores Raptor Lake-HX de nível básico. Só isso já dá ao HP Victus 16 uma vantagem significativa sobre o Acer Nitro 16 AN16-41 e o Lenovo LOQ 15.
Preço e disponibilidade
O HP Victus 16 pode ser adquirido no site da HP India por ₹129.990. Uma variante mais barata com as mesmas especificações (Core i5-13500HX, GeForce RTX 4050, 16 GB de RAM) e uma tela de 144 Hz de menor qualidade pode ser adquirida por ₹124.990. Como alternativa, sua versão de última geração pode ser comprada na Amazon Índia por ₹68.400. Na Amazon dos EUA, uma versão com melhores especificações, com tela QHD (2.560 x 1.440), um processador AMD Ryzen 7 7840HSe uma GeForce RTX 4060 pode ser adquirida por US$ 1.279.
HP Victus 16-r0076TX
- 09/25/2023 v7 (old)
Anil Ganti
Transparência
A seleção dos dispositivos a serem analisados é feita pela nossa equipe editorial. A amostra de teste foi fornecida ao autor como empréstimo pelo fabricante ou varejista para fins desta revisão. O credor não teve influência nesta revisão, nem o fabricante recebeu uma cópia desta revisão antes da publicação. Não houve obrigação de publicar esta revisão. Como empresa de mídia independente, a Notebookcheck não está sujeita à autoridade de fabricantes, varejistas ou editores.
É assim que o Notebookcheck está testando
Todos os anos, o Notebookcheck analisa de forma independente centenas de laptops e smartphones usando procedimentos padronizados para garantir que todos os resultados sejam comparáveis. Desenvolvemos continuamente nossos métodos de teste há cerca de 20 anos e definimos padrões da indústria no processo. Em nossos laboratórios de teste, equipamentos de medição de alta qualidade são utilizados por técnicos e editores experientes. Esses testes envolvem um processo de validação em vários estágios. Nosso complexo sistema de classificação é baseado em centenas de medições e benchmarks bem fundamentados, o que mantém a objetividade.Price comparison

