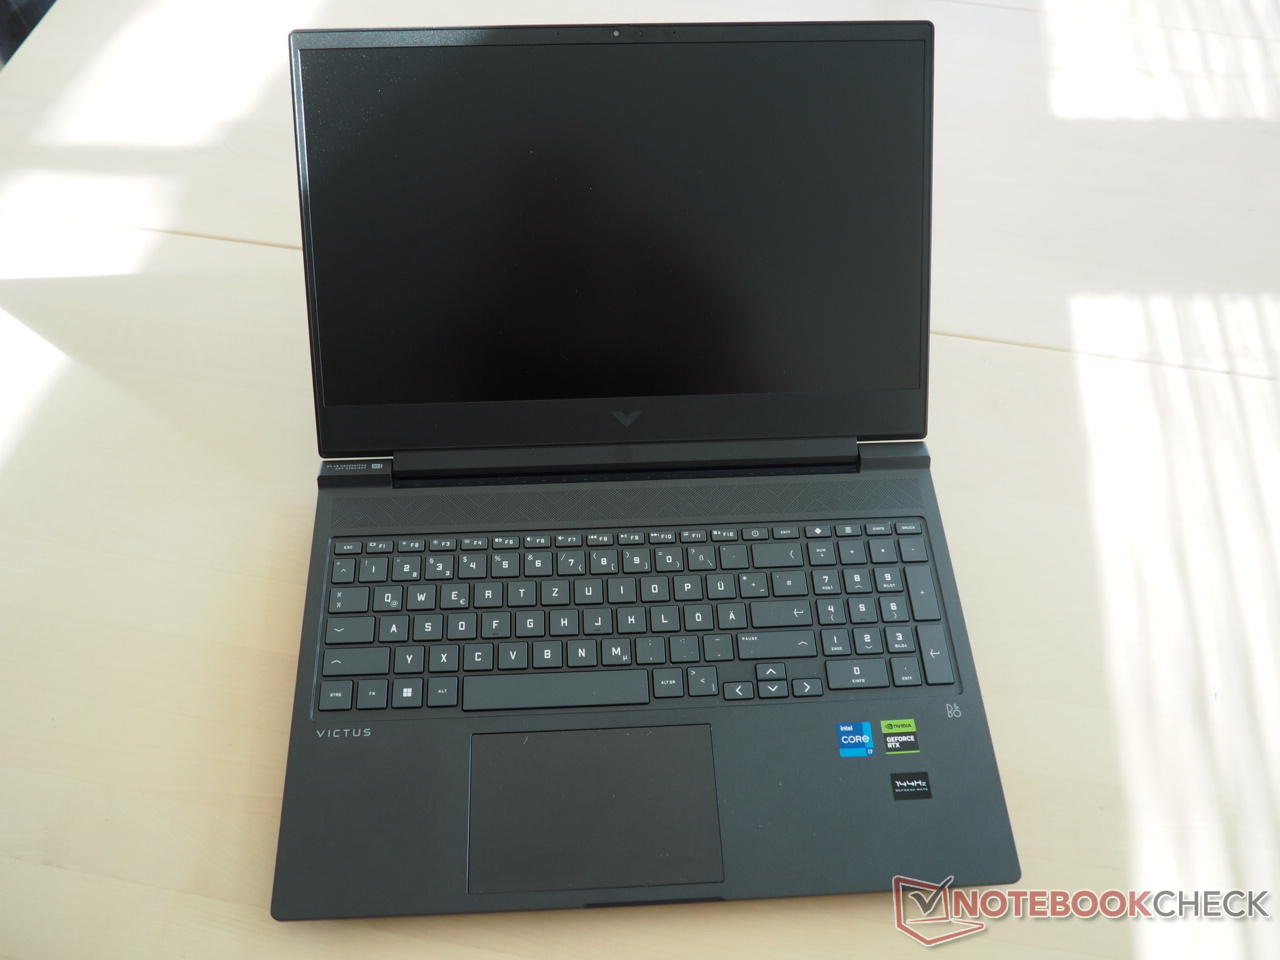
Análise do laptop HP Victus 16: Jogador Full HD com RTX 4070

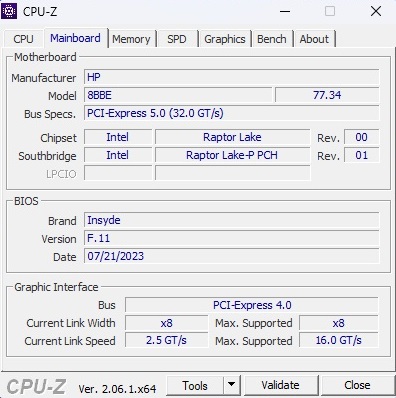
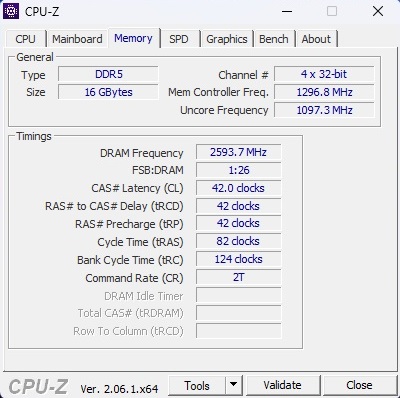
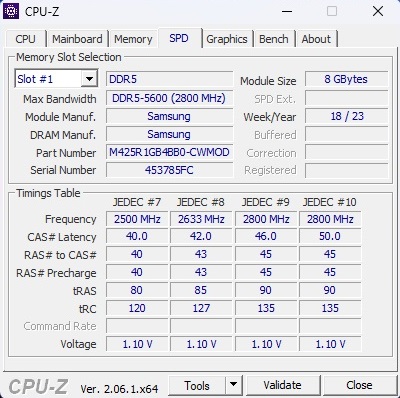
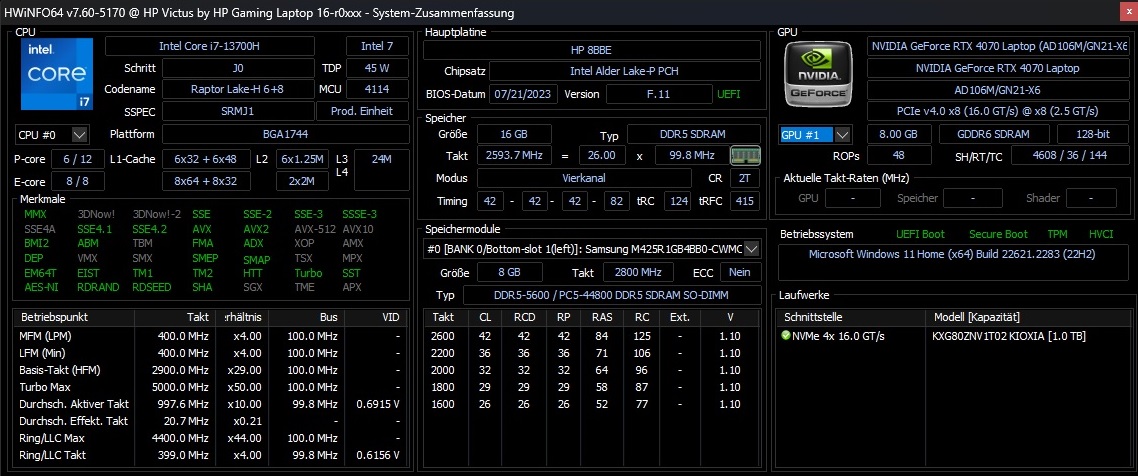
Da mesma forma que a série Omen, o Victus também está disponível em várias configurações de hardware. Nossa unidade de teste, com seu Core i7-13700H e GeForce RTX 4070pertence à extremidade superior da escala de desempenho. 16 GB de RAM DDR5-5600 e um SSD M.2 NVMe de 1 TB também são sólidos para 2023. A tela é um painel IPS fosco no formato 16:9 com 1.920 x 1.080 e 144 Hz. Custo do pacote completo: pelo menos US$ 1.439,99 no momento.
Os concorrentes do Victus 16 incluem outros gamers de 16 polegadas, também com um GeForce RTX 4070, como oLenovo Legion Pro 5 16ARX8, o Acer Nitro 16 AN16-41, o Gigabyte Aero 16 OLED BSF e o MSI Stealth 16 Studio A13VGalguns deles utilizam um processador AMD e todos aparecem nas tabelas a seguir como dispositivos de comparação.
Possíveis concorrentes em comparação
Avaliação | Data | Modelo | Peso | Altura | Size | Resolução | Preço |
|---|---|---|---|---|---|---|---|
| 85.1 % v7 (old) | 09/2023 | HP Victus 16-r0077ng i7-13700H, GeForce RTX 4070 Laptop GPU | 2.4 kg | 24 mm | 16.10" | 1920x1080 | |
| 86.6 % v7 (old) | 09/2023 | HP Omen 16-xf0376ng R7 7840HS, GeForce RTX 4070 Laptop GPU | 2.4 kg | 23.5 mm | 16.10" | 1920x1080 | |
| 88.4 % v7 (old) | 05/2023 | Lenovo Legion Pro 5 16ARX8 R7 7745HX, GeForce RTX 4070 Laptop GPU | 2.5 kg | 26.8 mm | 16.00" | 2560x1600 | |
| 88.1 % v7 (old) | 06/2023 | Acer Nitro 16 AN16-41 R7 7735HS, GeForce RTX 4070 Laptop GPU | 2.7 kg | 27.9 mm | 16.00" | 2560x1600 | |
| 86.2 % v7 (old) | 03/2023 | Gigabyte AERO 16 OLED BSF i9-13900H, GeForce RTX 4070 Laptop GPU | 2.1 kg | 18 mm | 16.00" | 3840x2400 | |
| 88.8 % v7 (old) | 07/2023 | MSI Stealth 16 Studio A13VG i7-13700H, GeForce RTX 4070 Laptop GPU | 2 kg | 19.95 mm | 16.00" | 2560x1600 |
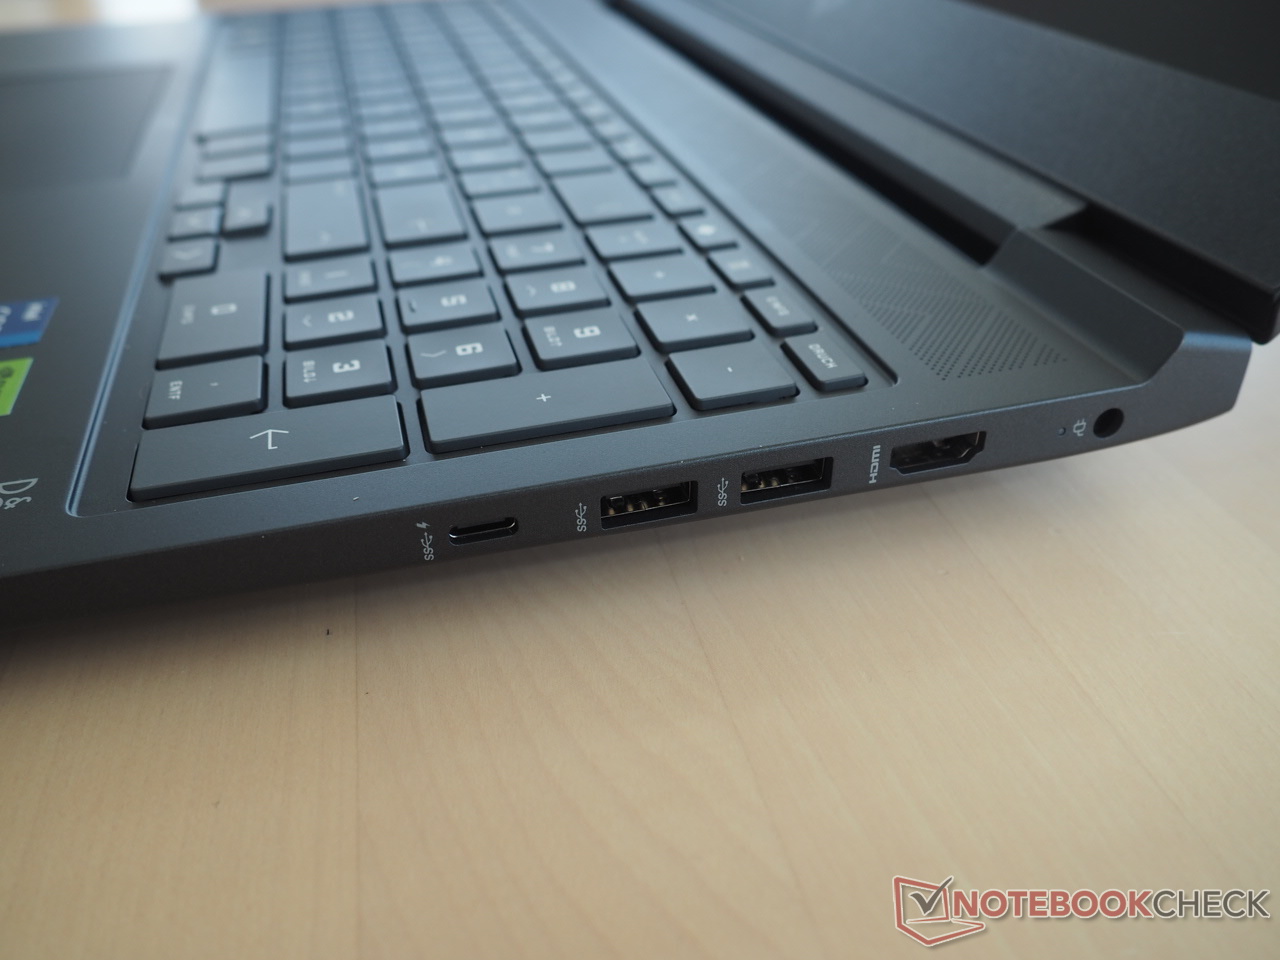
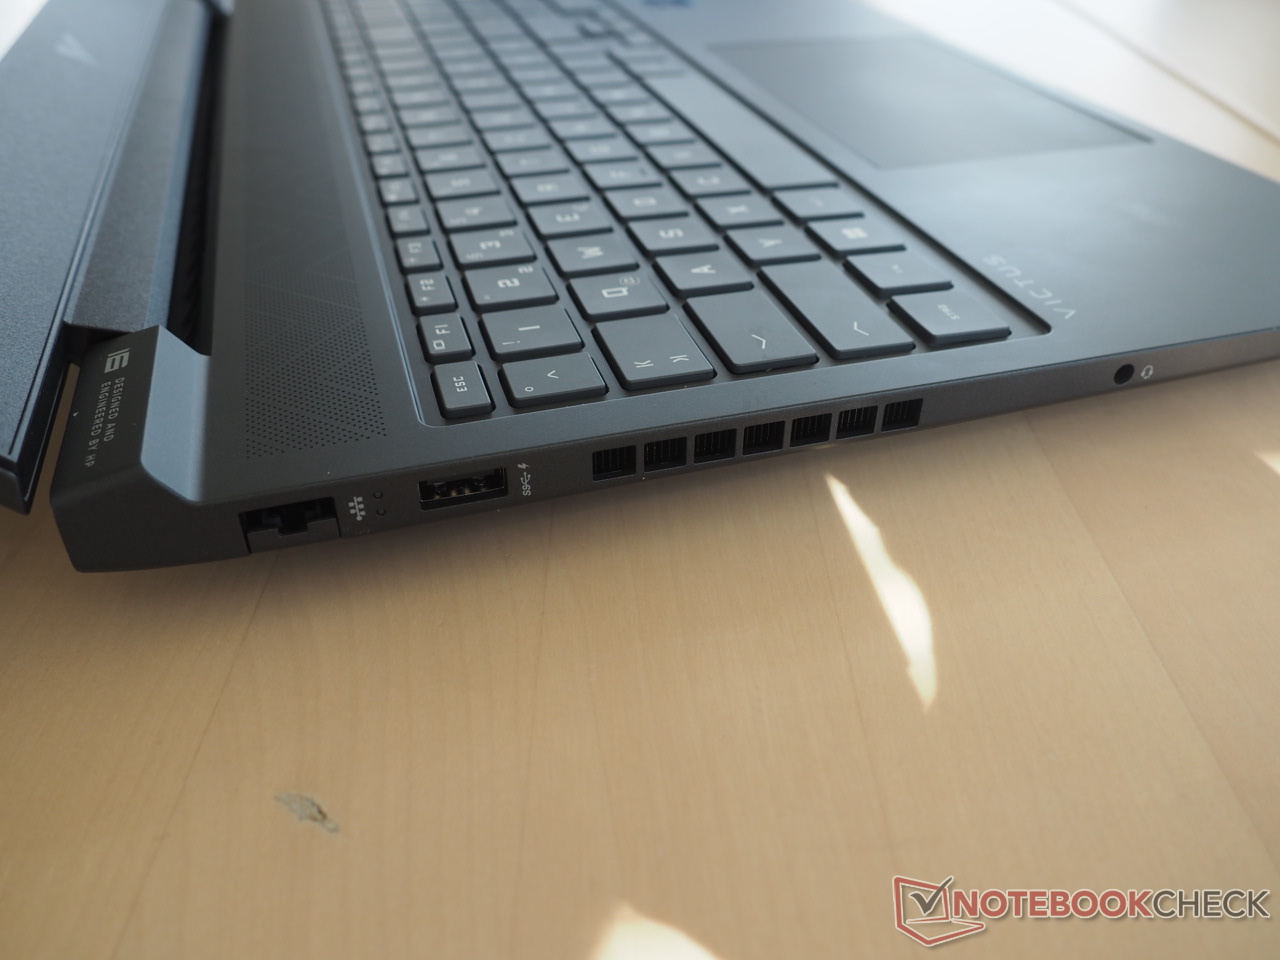
Como o chassi é idêntico ao da versão americana analisada recentemente, com um Core i5-13500HX e uma GeForce RTX 4050,não entraremos em detalhes sobre o gabinete, o equipamento e os dispositivos de entrada nesta análise. Você pode encontrar todas as informações relevantes na análise correspondente aqui.
Comunicação
Webcam


Tela
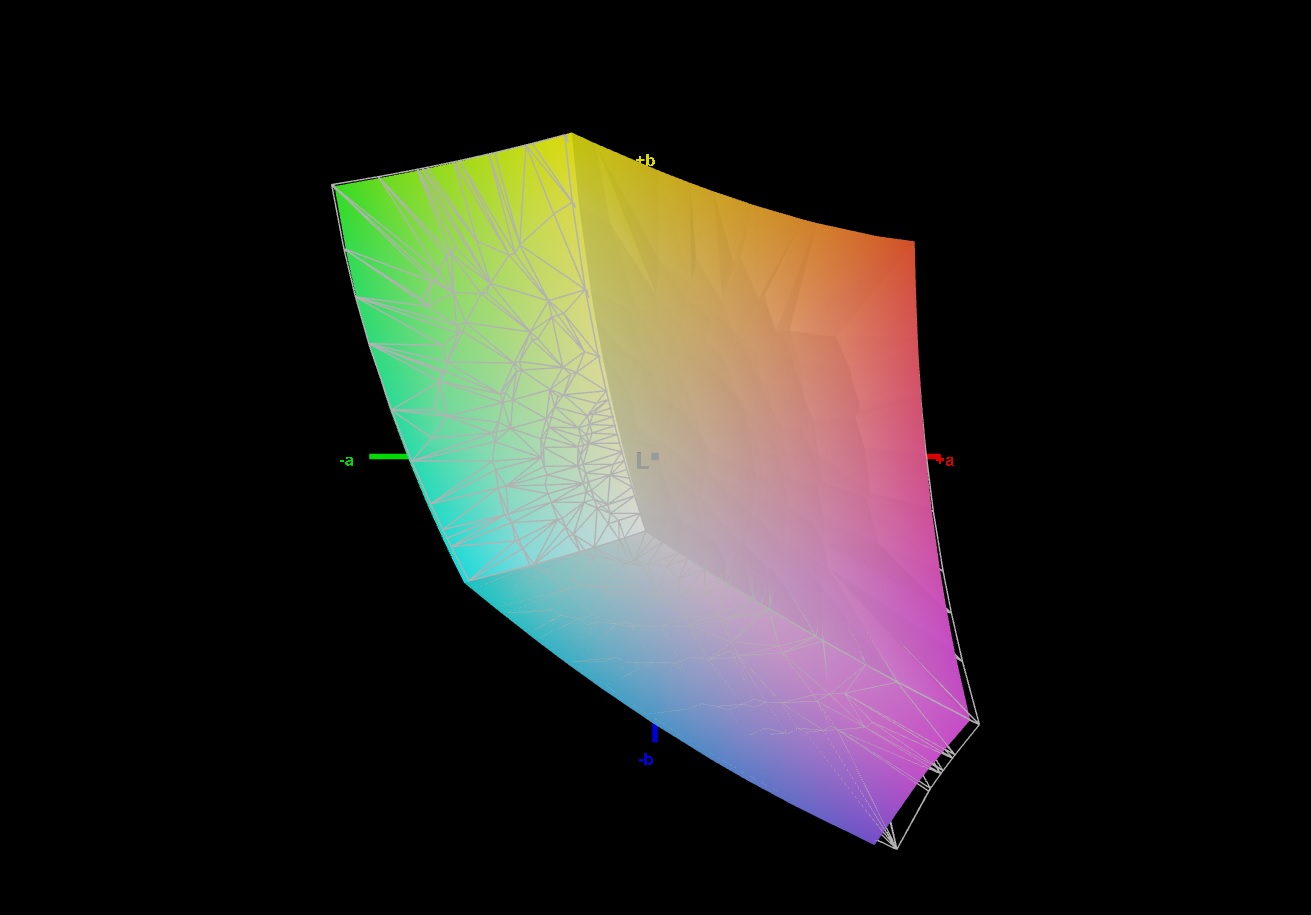
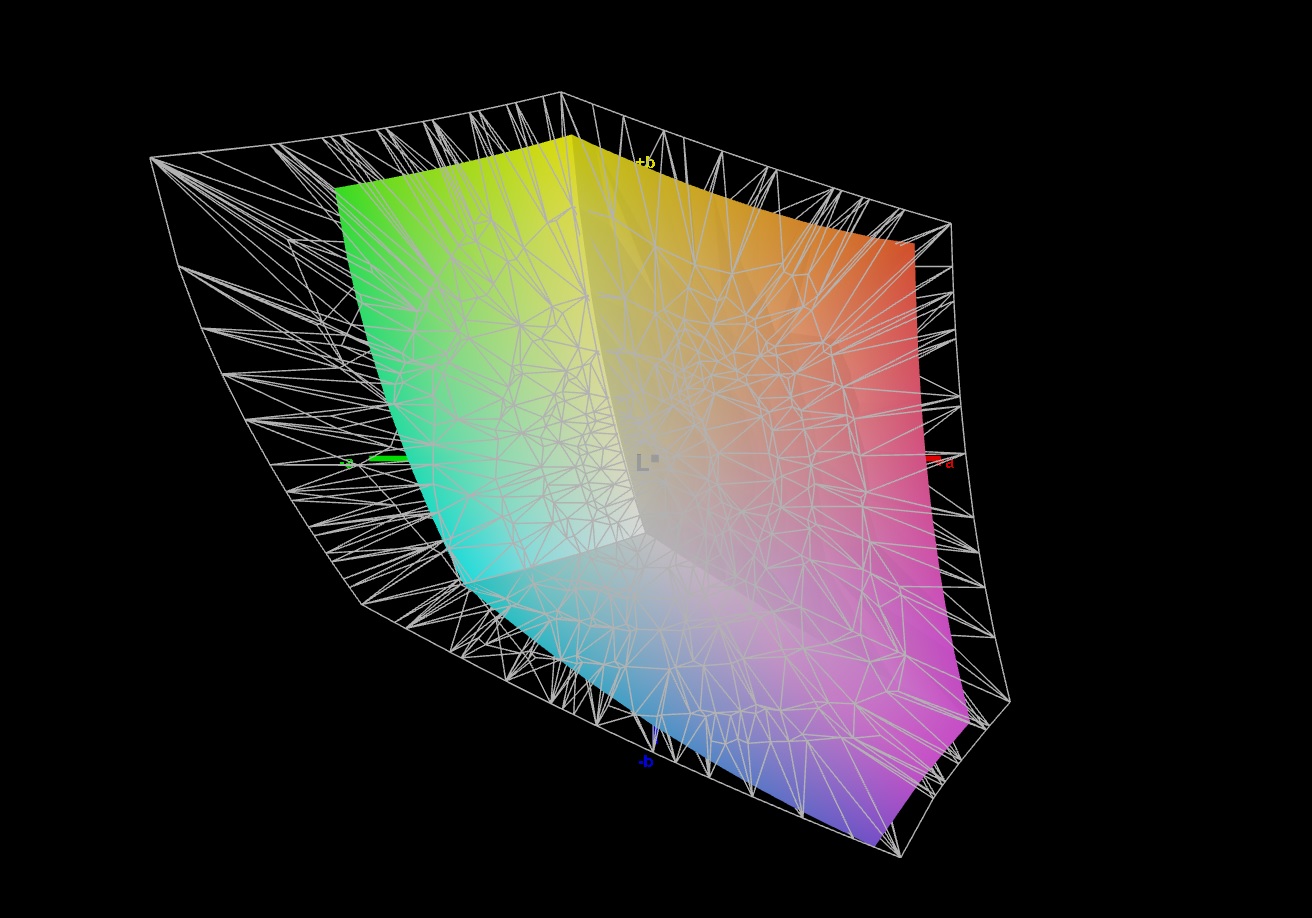
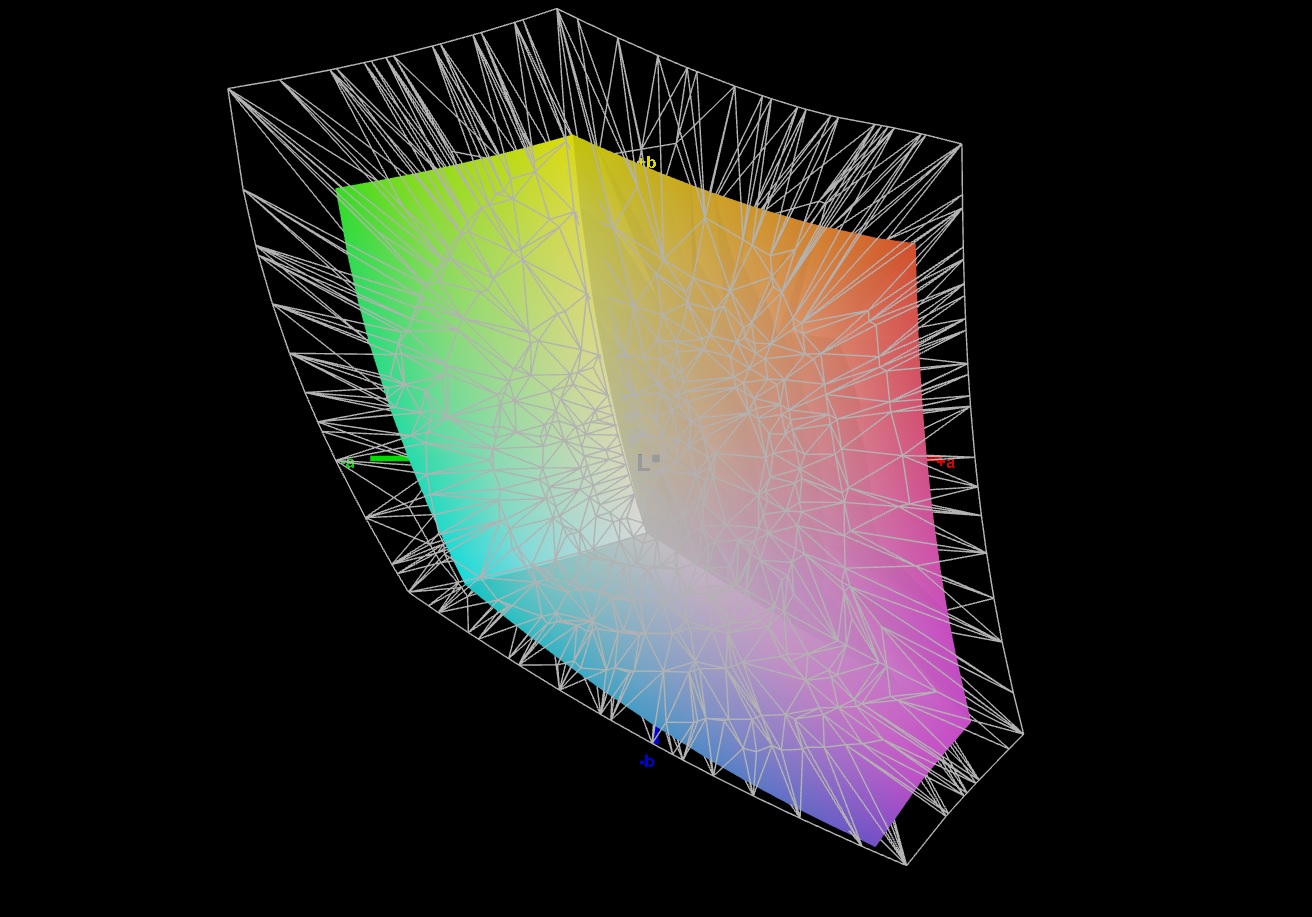
Embora as designações dos painéis sejam muito semelhantes, a versão RTX 4070 tem uma tela Full HD ligeiramente diferente da variante RTX 4050, embora os resultados não sejam muito diferentes em sua maior parte.
| |||||||||||||||||||||||||
iluminação: 85 %
iluminação com acumulador: 308 cd/m²
Contraste: 1232:1 (Preto: 0.25 cd/m²)
ΔE ColorChecker Calman: 1.3 | ∀{0.5-29.43 Ø4.71}
calibrated: 0.92
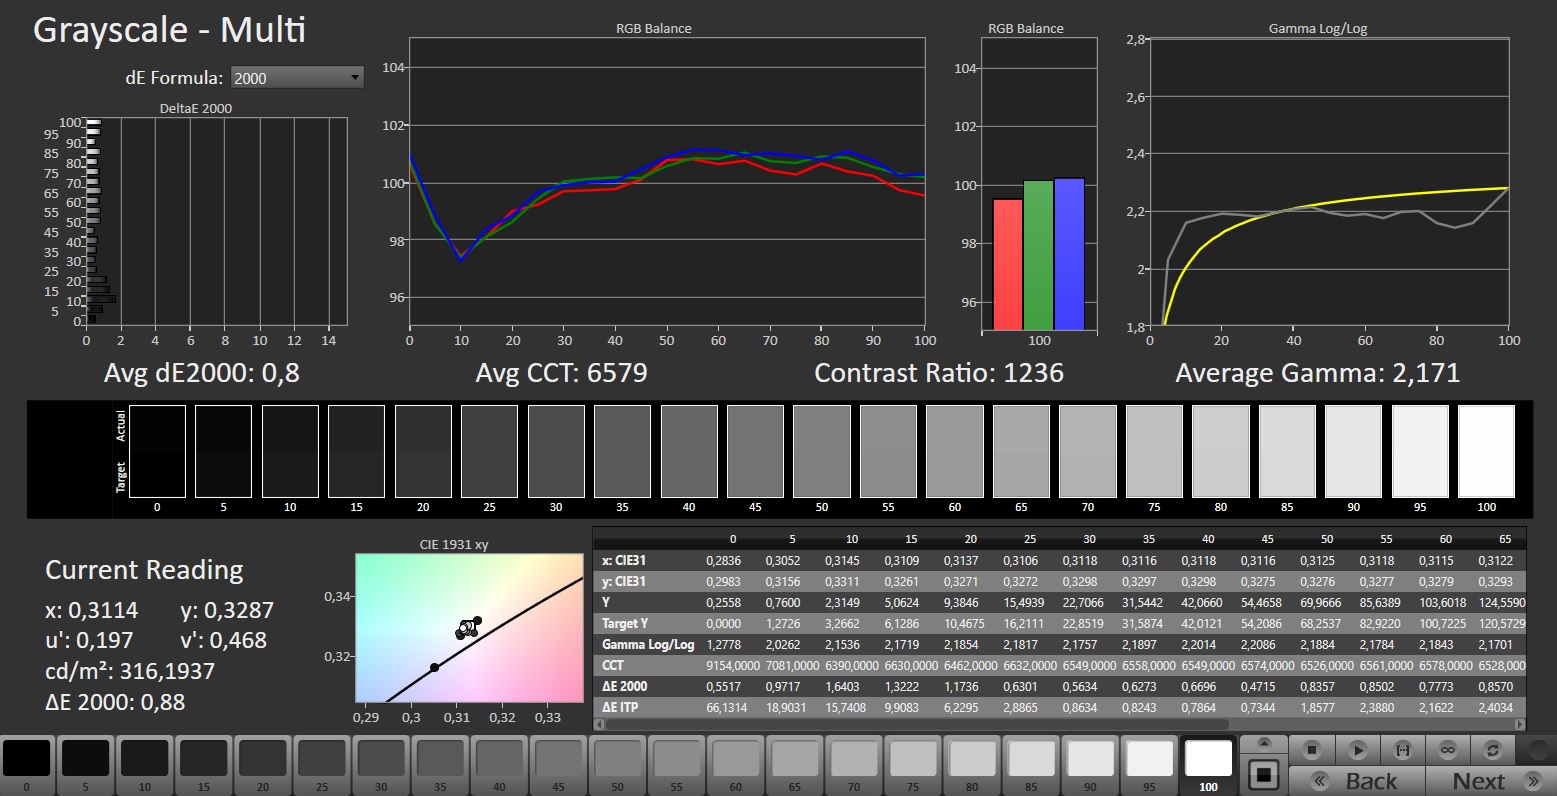
ΔE Greyscale Calman: 1.7 | ∀{0.09-98 Ø4.96}
69% AdobeRGB 1998 (Argyll 3D)
98% sRGB (Argyll 3D)
66.7% Display P3 (Argyll 3D)
Gamma: 2.167
CCT: 6767 K
| HP Victus 16-r0077ng CMN162D, IPS, 1920x1080, 16.1" | HP Omen 16-xf0376ng BOE0B81, IPS, 1920x1080, 16.1" | Lenovo Legion Pro 5 16ARX8 CSOT T3 MNG007DA1-Q, IPS, 2560x1600, 16" | Acer Nitro 16 AN16-41 BOE CQ NE16QDM-NY1, IPS, 2560x1600, 16" | Gigabyte AERO 16 OLED BSF Samsung SDC4191 (ATNA60YV09-0, OLED, 3840x2400, 16" | MSI Stealth 16 Studio A13VG AUO26A9, IPS, 2560x1600, 16" | |
|---|---|---|---|---|---|---|
| Display | 5% | 4% | 1% | 31% | 23% | |
| Display P3 Coverage (%) | 66.7 | 72.1 8% | 70.4 6% | 67.9 2% | 99.9 50% | 96.4 45% |
| sRGB Coverage (%) | 98 | 99.6 2% | 99.6 2% | 99.1 1% | 100 2% | 99.7 2% |
| AdobeRGB 1998 Coverage (%) | 69 | 72.3 5% | 72.6 5% | 69.9 1% | 96.4 40% | 84.8 23% |
| Response Times | 10% | 18% | 28% | 81% | 50% | |
| Response Time Grey 50% / Grey 80% * (ms) | 13.3 ? | 12.3 ? 8% | 7 ? 47% | 11 ? 17% | 2 ? 85% | 4.4 ? 67% |
| Response Time Black / White * (ms) | 8.2 ? | 7.2 ? 12% | 9.1 ? -11% | 5 ? 39% | 1.98 ? 76% | 5.6 ? 32% |
| PWM Frequency (Hz) | 60 | |||||
| Screen | -68% | 11% | -12% | 101% | -73% | |
| Brightness middle (cd/m²) | 308 | 350 14% | 355.3 15% | 520 69% | 389.97 27% | 424 38% |
| Brightness (cd/m²) | 285 | 338 19% | 340 19% | 494 73% | 395 39% | 411 44% |
| Brightness Distribution (%) | 85 | 91 7% | 91 7% | 91 7% | 97 14% | 88 4% |
| Black Level * (cd/m²) | 0.25 | 0.35 -40% | 0.32 -28% | 0.39 -56% | 0.03 88% | 0.37 -48% |
| Contrast (:1) | 1232 | 1000 -19% | 1110 -10% | 1333 8% | 12999 955% | 1146 -7% |
| Colorchecker dE 2000 * | 1.3 | 3.29 -153% | 1.13 13% | 1.94 -49% | 2 -54% | 3.04 -134% |
| Colorchecker dE 2000 max. * | 2.76 | 8.47 -207% | 2.78 -1% | 5.62 -104% | 4.1 -49% | 7.5 -172% |
| Colorchecker dE 2000 calibrated * | 0.92 | 2.23 -142% | 0.32 65% | 0.74 20% | 1.68 -83% | 3.04 -230% |
| Greyscale dE 2000 * | 1.7 | 3.2 -88% | 1.4 18% | 2.94 -73% | 2.23 -31% | 4.34 -155% |
| Gamma | 2.167 102% | 2.131 103% | 2.24 98% | 2.37 93% | 2.41 91% | 2.32 95% |
| CCT | 6767 96% | 6317 103% | 6372 102% | 6443 101% | 6323 103% | 6952 93% |
| Média Total (Programa/Configurações) | -18% /
-41% | 11% /
11% | 6% /
-3% | 71% /
83% | 0% /
-35% |
* ... menor é melhor
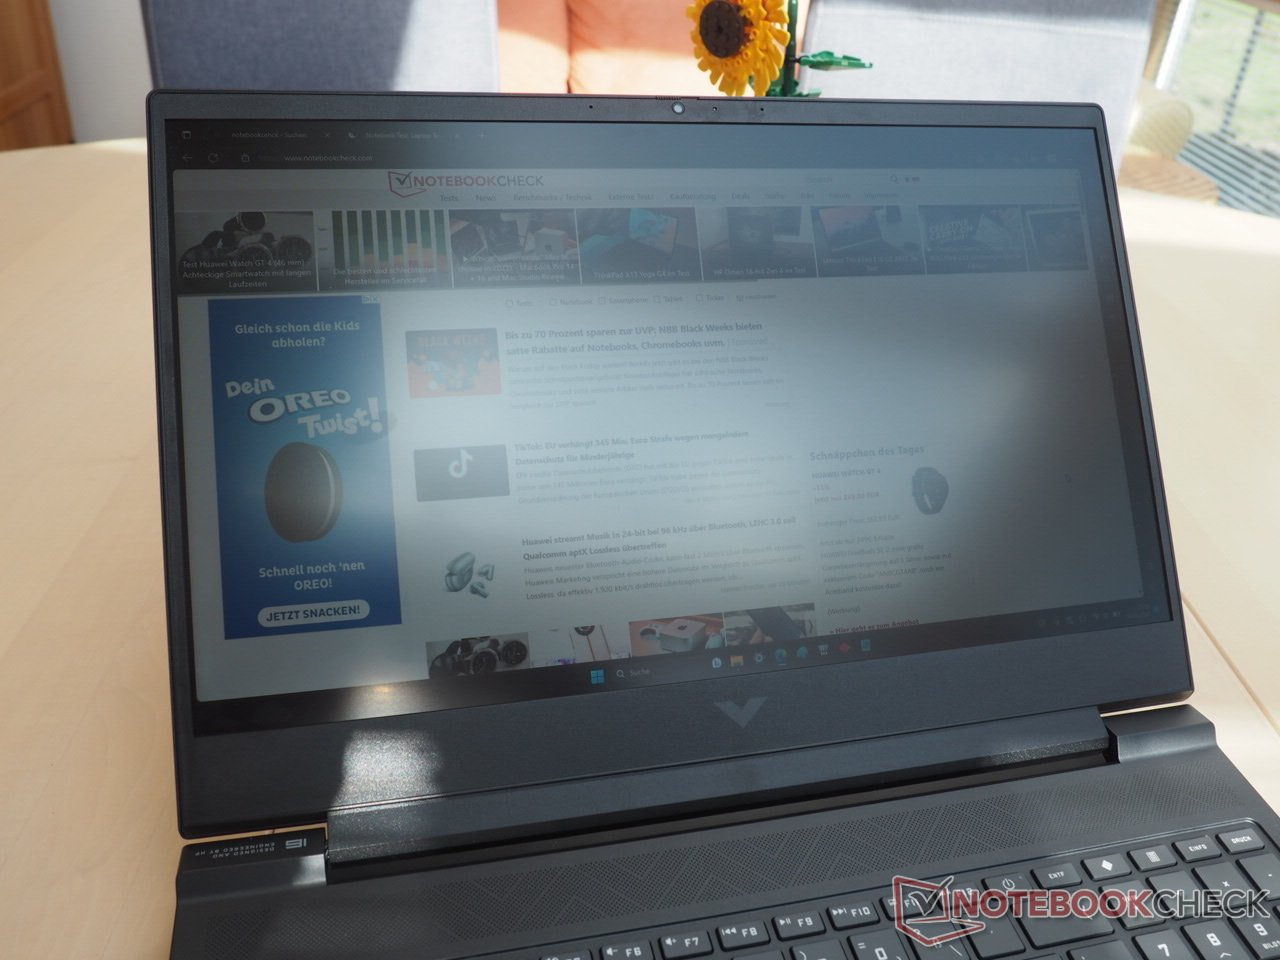
Com um brilho médio de 285 cd/m², o Victus 16 infelizmente não está entre os modelos mais brilhantes. Embora esse valor ainda possa ser suficiente para a maioria dos espaços internos, você atingirá rapidamente os limites de legibilidade e reconhecimento em ambientes externos. Graças ao valor de preto relativamente bom de 0,25 cd/m² para os padrões IPS, a tela ainda atinge um contraste sólido de cerca de 1200:1.
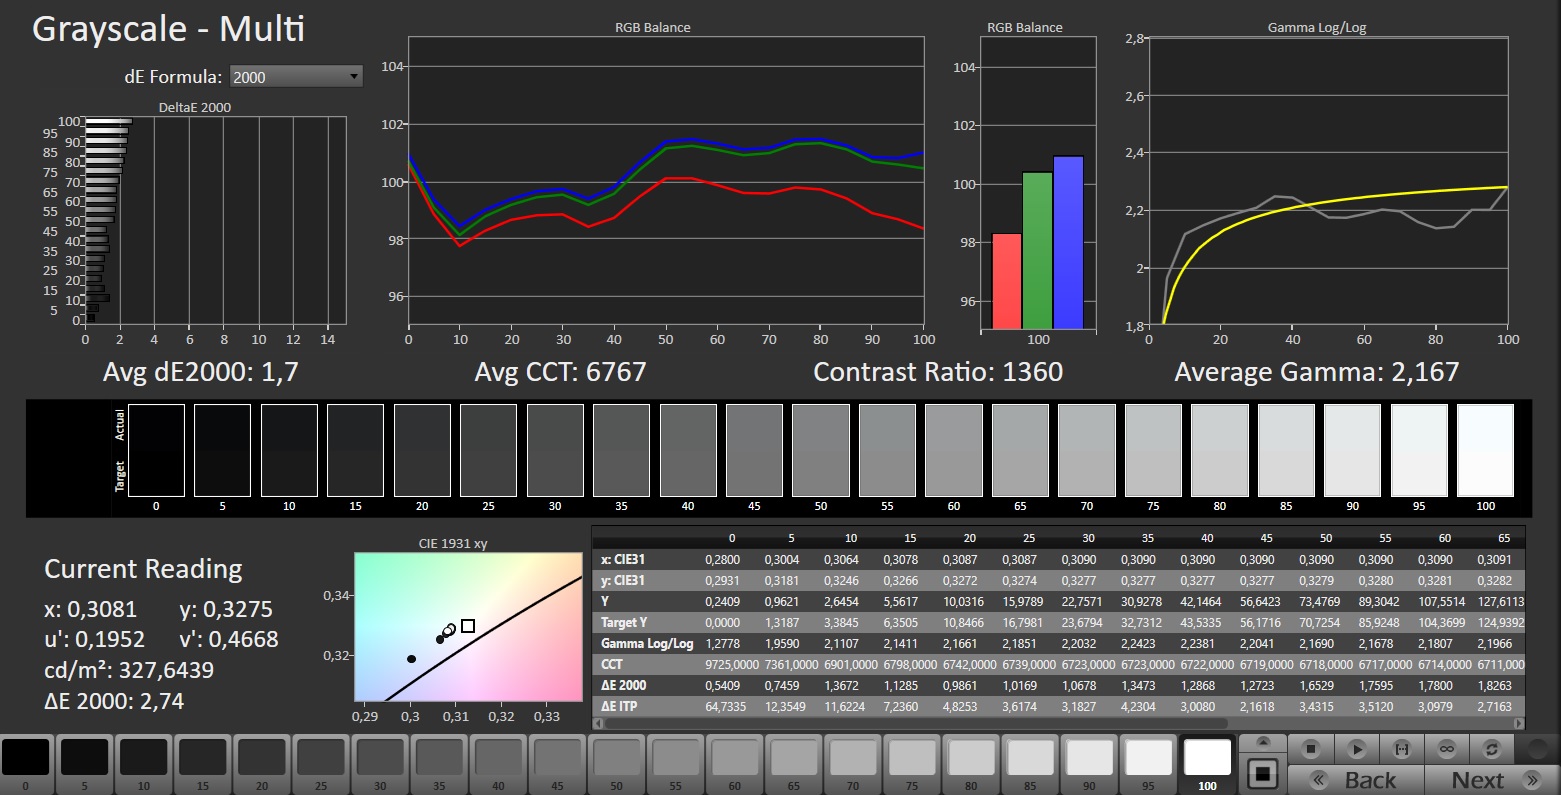
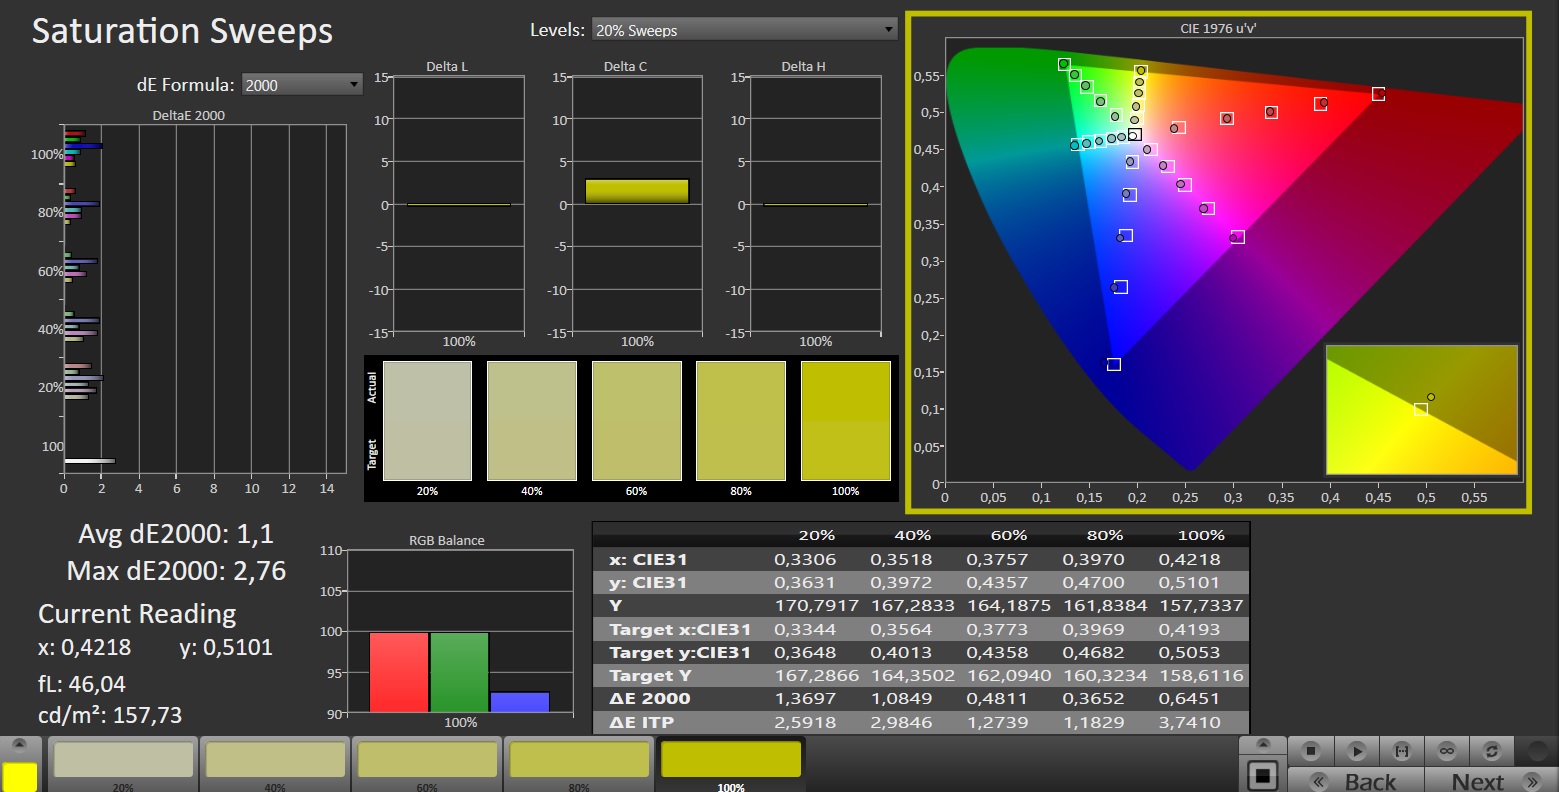
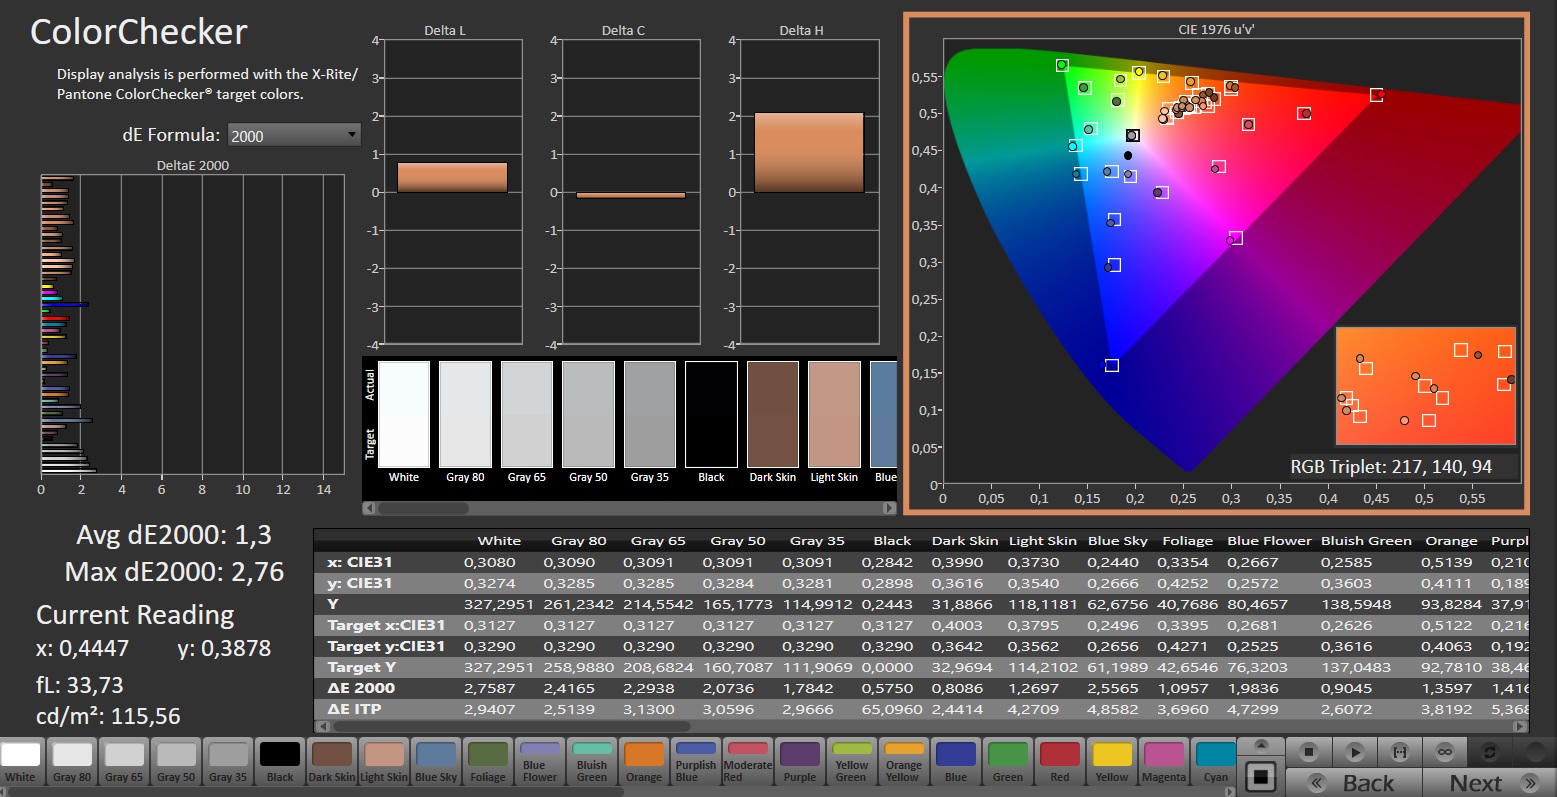
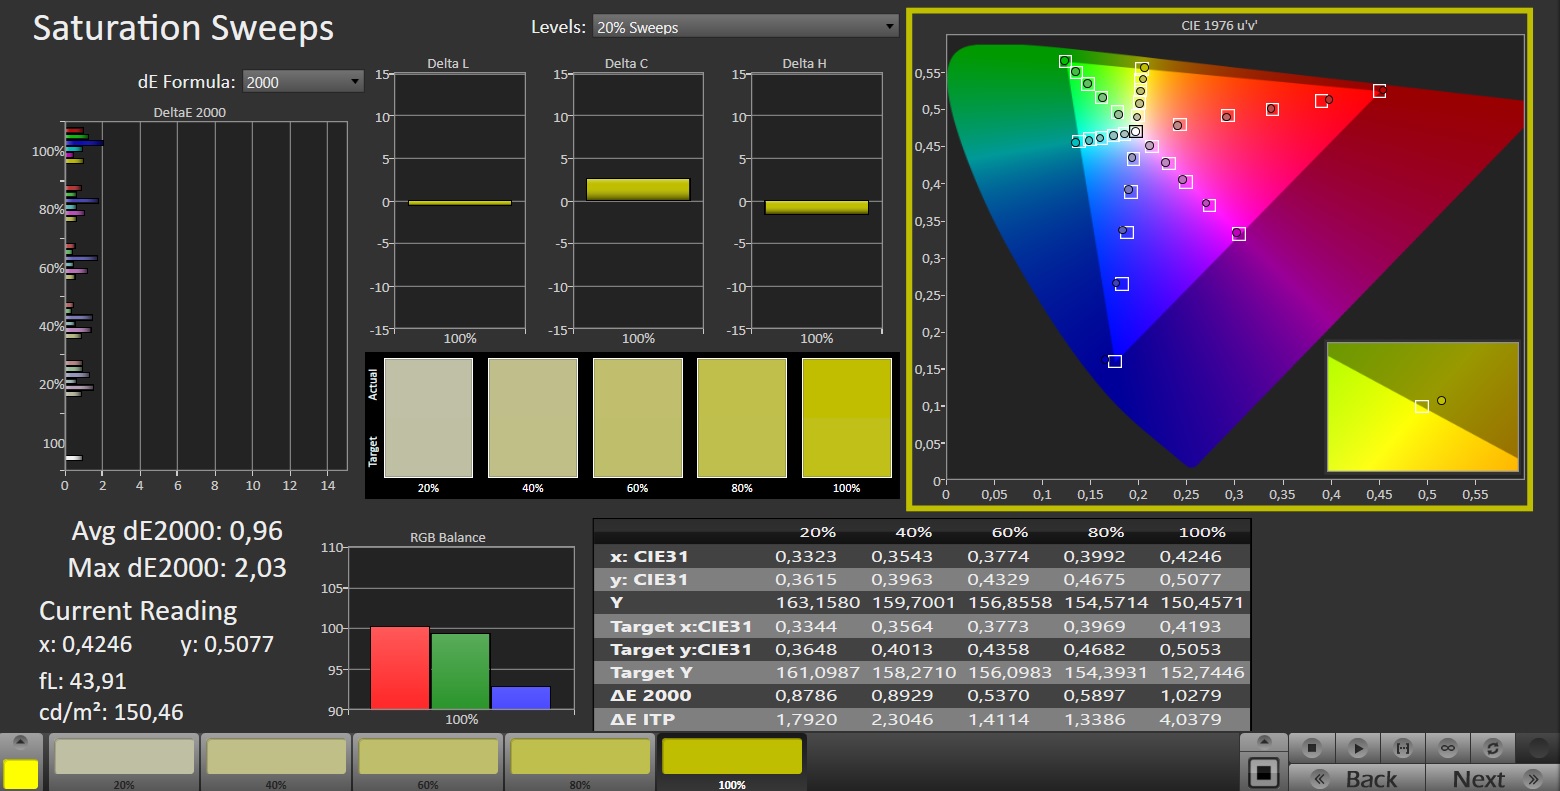
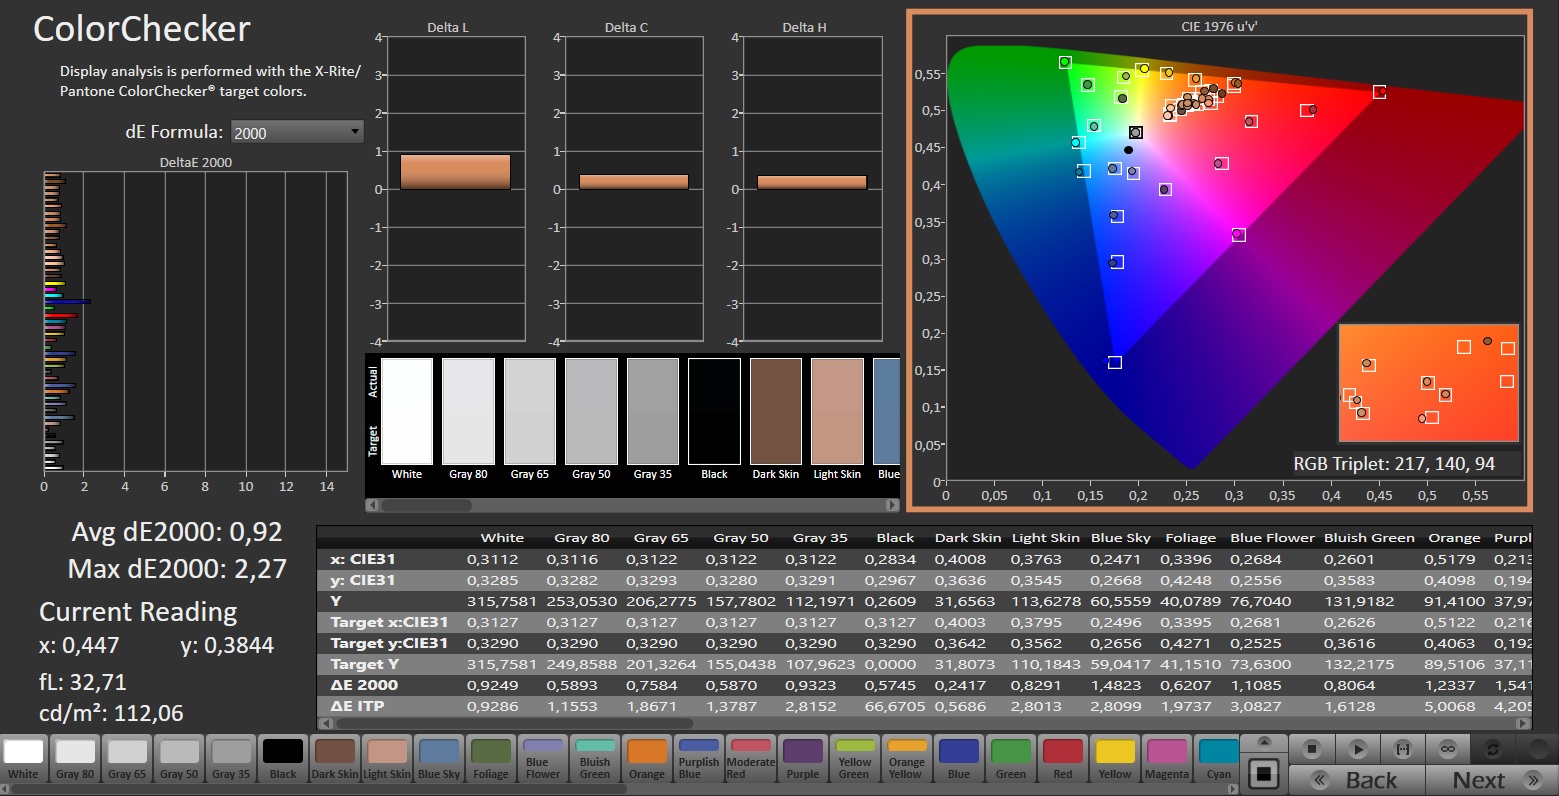
O espaço de cores também não é motivo de críticas, pois o sRGB tem quase 100% de cobertura. 69% para AdobeRGB e 67% para DCI-P3 também são aceitáveis para um notebook para jogos. O Victus 16 merece elogios especiais por sua precisão de cores: mesmo no estado de entrega, os valores estão na faixa ideal (veja as capturas de tela do Calman).
Os ângulos de visão estão no nível típico (bom) de IPS. Nosso dispositivo de teste não apresentou nenhum sinal de cintilação ou sangramento da tela. Os tempos de resposta também foram discretos e devem atender aos requisitos da maioria dos usuários.
Exibir tempos de resposta
| ↔ Tempo de resposta preto para branco | ||
|---|---|---|
| 8.2 ms ... ascensão ↗ e queda ↘ combinadas | ↗ 4.5 ms ascensão | 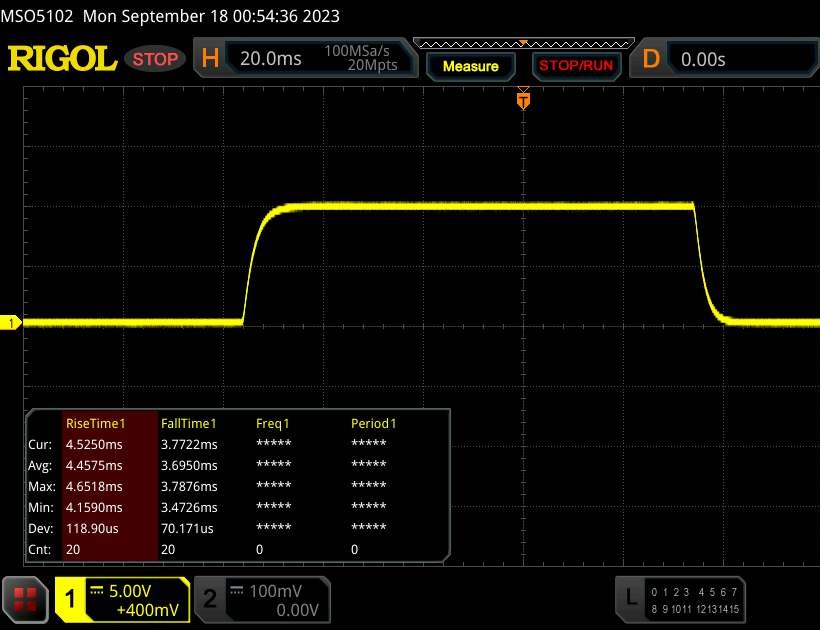 |
| ↘ 3.7 ms queda | ||
| A tela mostra taxas de resposta rápidas em nossos testes e deve ser adequada para jogos. Em comparação, todos os dispositivos testados variam de 0.1 (mínimo) a 240 (máximo) ms. » 24 % de todos os dispositivos são melhores. Isso significa que o tempo de resposta medido é melhor que a média de todos os dispositivos testados (19.8 ms). | ||
| ↔ Tempo de resposta 50% cinza a 80% cinza | ||
| 13.3 ms ... ascensão ↗ e queda ↘ combinadas | ↗ 6 ms ascensão | 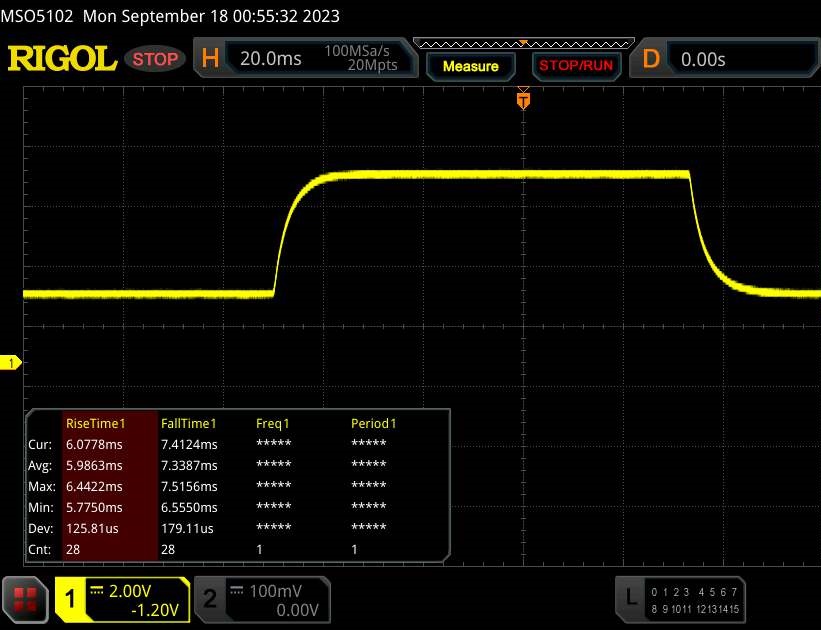 |
| ↘ 7.3 ms queda | ||
| A tela mostra boas taxas de resposta em nossos testes, mas pode ser muito lenta para jogadores competitivos. Em comparação, todos os dispositivos testados variam de 0.165 (mínimo) a 636 (máximo) ms. » 27 % de todos os dispositivos são melhores. Isso significa que o tempo de resposta medido é melhor que a média de todos os dispositivos testados (31 ms). | ||
Cintilação da tela / PWM (modulação por largura de pulso)
| Tela tremeluzindo / PWM não detectado | 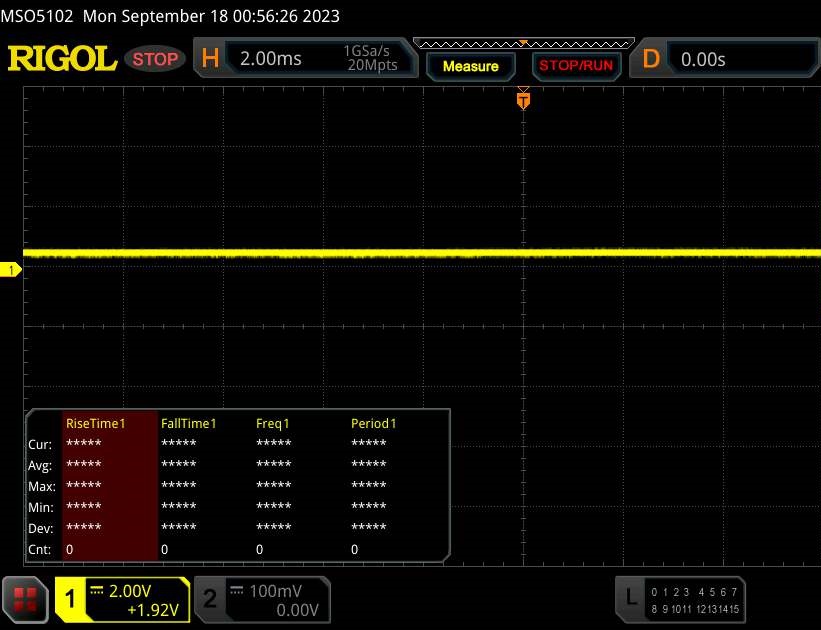 | ||
[pwm_comparison] Em comparação: 52 % de todos os dispositivos testados não usam PWM para escurecer a tela. Se PWM foi detectado, uma média de 7754 (mínimo: 5 - máximo: 343500) Hz foi medida. | |||
Desempenho
Em termos de hardware, o Victus 16 fica entre os segmentos de médio e alto padrão. Embora o processador Intel deva ter reservas mais do que suficientes para os próximos anos, o GeForce RTX 4070 pode ter dificuldades devido ao seu tamanho de VRAM um tanto escasso (8 GB GDDR6 não está mais atualizado ou preparado para o futuro).
Condições de teste
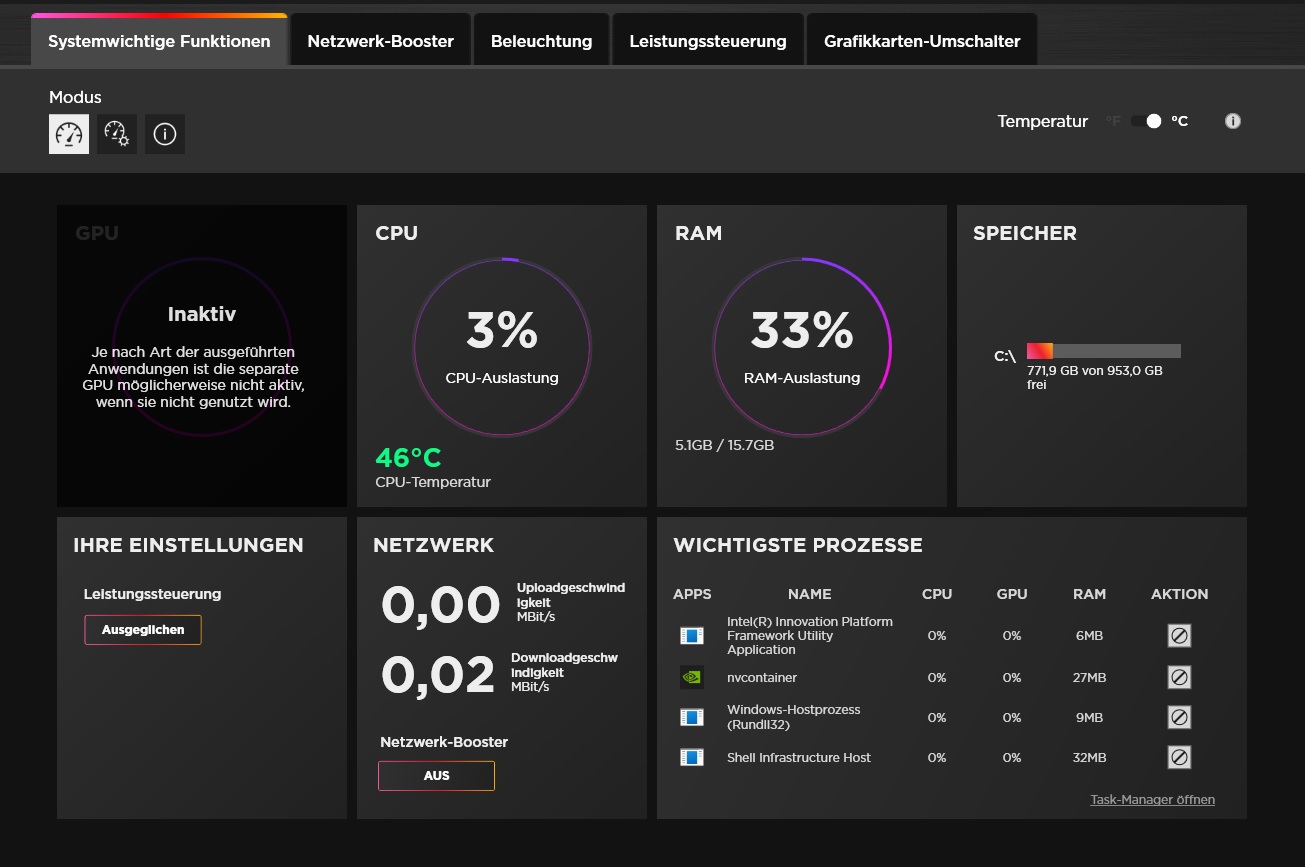
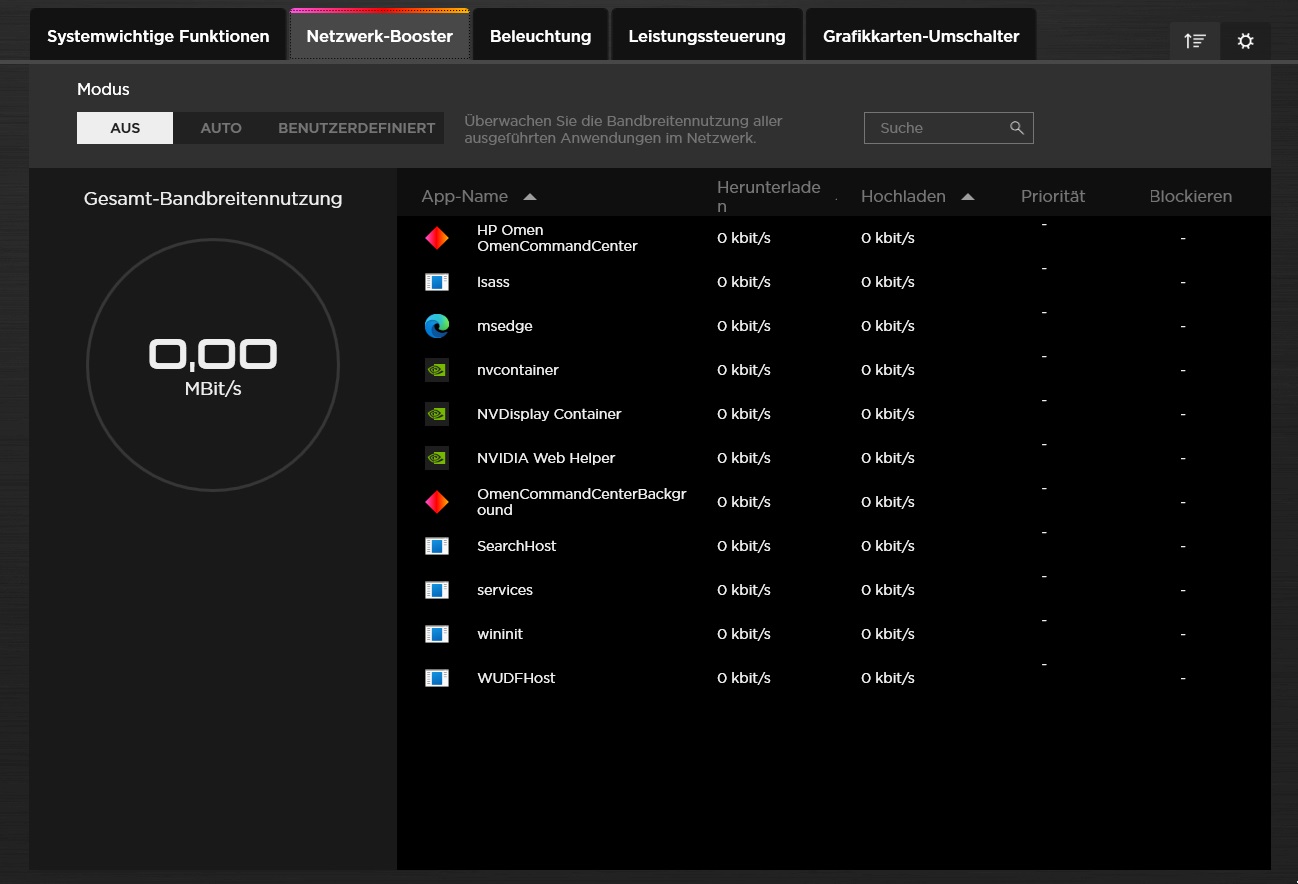
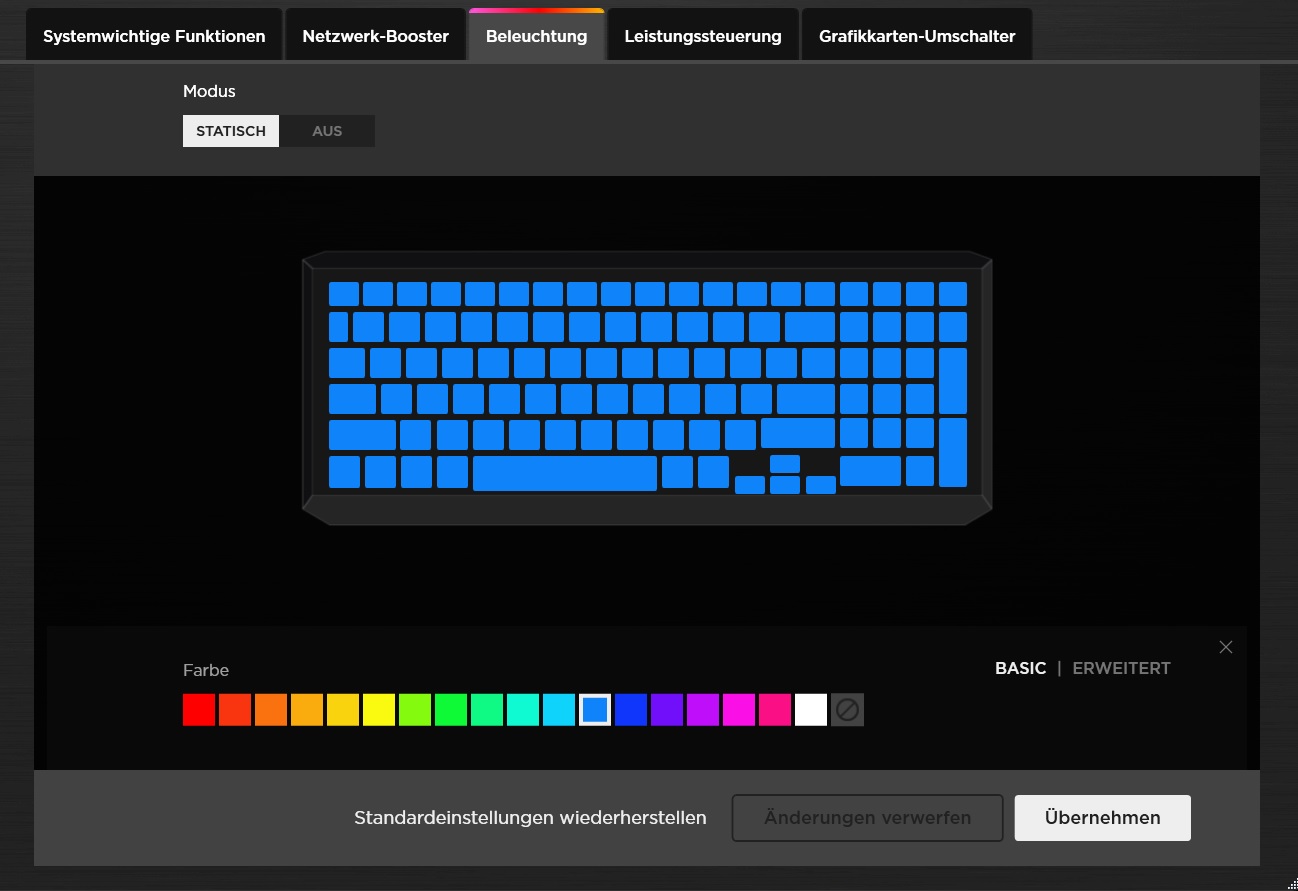
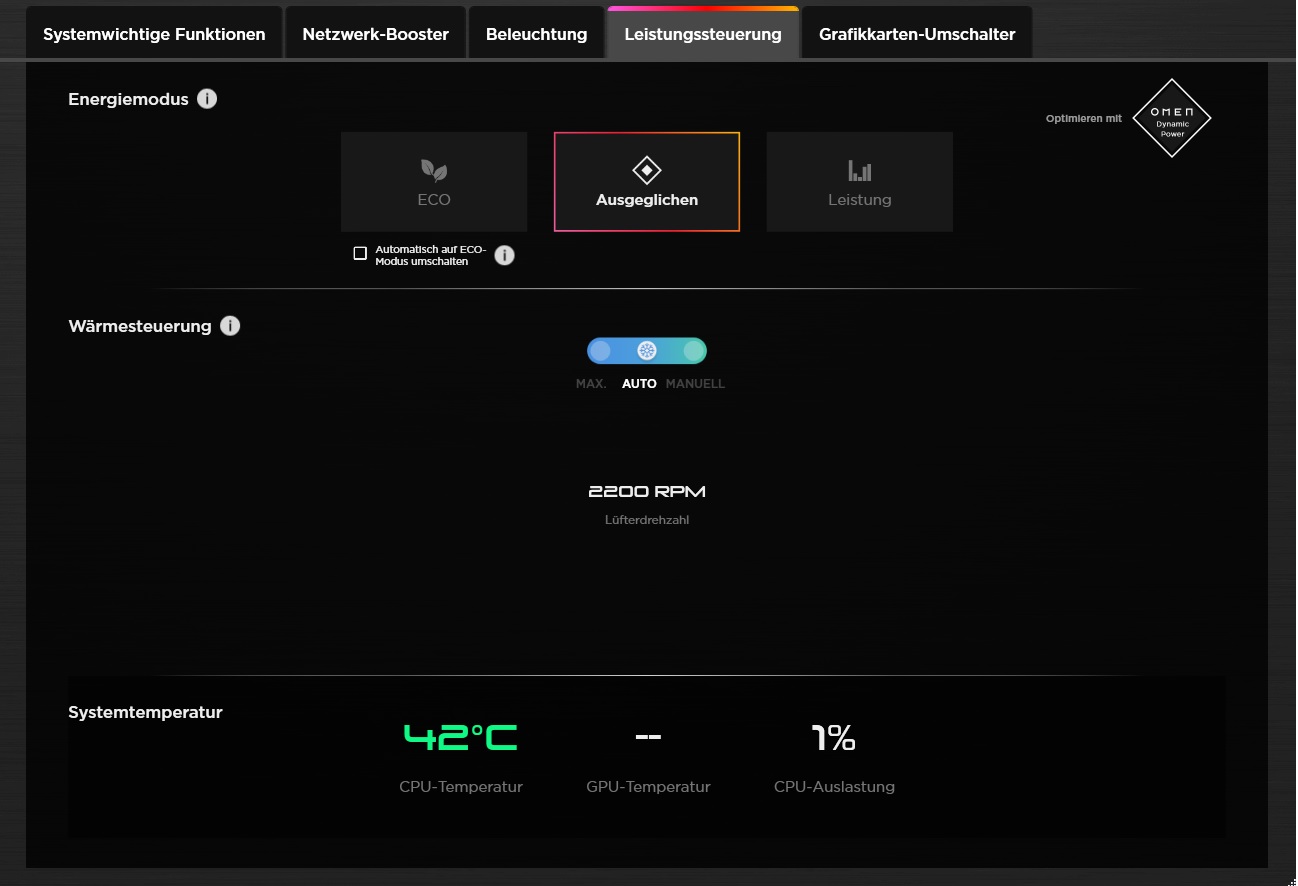
No Omen Gaming Hub pré-instalado, os usuários podem, entre outras coisas, ajustar o controle de desempenho (captura de tela nº 4). Como o desempenho 3D quase não aumenta no modo Desempenho , mas o ruído aumenta significativamente, realizamos todas as medições no modo Equilibrado . O modo Eco faz jus apenas parcialmente ao seu nome: a taxa de quadros e o nível de ruído gravitam em torno do modo intermediário.
| Witcher 3 (FHD/Ultra) | Eco | Balanceado | Desempenho |
|---|---|---|---|
| Taxa de quadros | ~110 fps | ~114 fps | ~118 fps |
| Ruído | ~46 dB(A) | ~46 dB(A) | ~56 dB(A) |
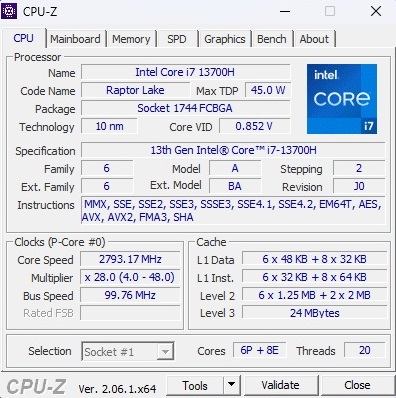
Processador
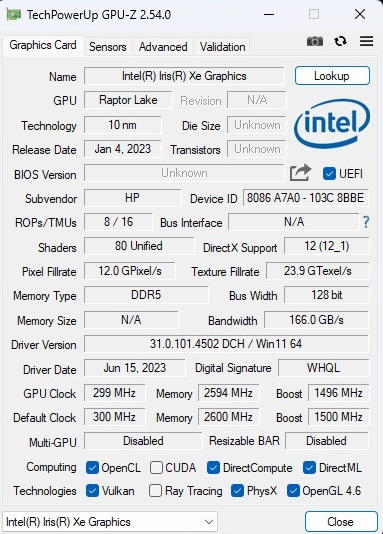
O Core i7-13700H da Intel é encontrado atualmente em um grande número de notebooks para jogos. O modelo de 10 nm da geração Raptor Lake oferece 6 núcleos de desempenho com hyper-threading e 8 núcleos de eficiência sem HT, resultando em até 20 threads paralelos
No curso de benchmark, o Core i7-13700H do Victus 16 oferece desempenho ligeiramente abaixo da média se você comparar os resultados com a média anterior. Pelo menos, é preciso dar crédito à HP pelo fato de o desempenho permanecer bastante estável durante longos períodos de tempo. Não houve grandes flutuações ou quedas em nosso loop do Cinebench.
Cinebench R15 Multi Sustained Load
* ... menor é melhor
AIDA64: FP32 Ray-Trace | FPU Julia | CPU SHA3 | CPU Queen | FPU SinJulia | FPU Mandel | CPU AES | CPU ZLib | FP64 Ray-Trace | CPU PhotoWorxx
| Performance rating | |
| Média da turma Gaming | |
| Lenovo Legion Pro 5 16ARX8 | |
| HP Omen 16-xf0376ng | |
| Gigabyte AERO 16 OLED BSF | |
| MSI Stealth 16 Studio A13VG | |
| Acer Nitro 16 AN16-41 | |
| Média Intel Core i7-13700H | |
| HP Victus 16-r0077ng | |
| AIDA64 / FP32 Ray-Trace | |
| Média da turma Gaming (10227 - 85542, n=105, últimos 2 anos) | |
| Lenovo Legion Pro 5 16ARX8 | |
| HP Omen 16-xf0376ng | |
| Gigabyte AERO 16 OLED BSF | |
| MSI Stealth 16 Studio A13VG | |
| Acer Nitro 16 AN16-41 | |
| HP Victus 16-r0077ng | |
| Média Intel Core i7-13700H (4986 - 18908, n=29) | |
| AIDA64 / FPU Julia | |
| Média da turma Gaming (51376 - 238426, n=105, últimos 2 anos) | |
| Lenovo Legion Pro 5 16ARX8 | |
| HP Omen 16-xf0376ng | |
| Acer Nitro 16 AN16-41 | |
| Gigabyte AERO 16 OLED BSF | |
| MSI Stealth 16 Studio A13VG | |
| HP Victus 16-r0077ng | |
| Média Intel Core i7-13700H (25360 - 92359, n=29) | |
| AIDA64 / CPU SHA3 | |
| Média da turma Gaming (2180 - 10115, n=105, últimos 2 anos) | |
| Lenovo Legion Pro 5 16ARX8 | |
| HP Omen 16-xf0376ng | |
| Gigabyte AERO 16 OLED BSF | |
| MSI Stealth 16 Studio A13VG | |
| Acer Nitro 16 AN16-41 | |
| HP Victus 16-r0077ng | |
| Média Intel Core i7-13700H (1339 - 4224, n=29) | |
| AIDA64 / CPU Queen | |
| Lenovo Legion Pro 5 16ARX8 | |
| HP Omen 16-xf0376ng | |
| Média da turma Gaming (49785 - 173351, n=90, últimos 2 anos) | |
| Acer Nitro 16 AN16-41 | |
| MSI Stealth 16 Studio A13VG | |
| Média Intel Core i7-13700H (59324 - 107159, n=29) | |
| Gigabyte AERO 16 OLED BSF | |
| HP Victus 16-r0077ng | |
| AIDA64 / FPU SinJulia | |
| Lenovo Legion Pro 5 16ARX8 | |
| HP Omen 16-xf0376ng | |
| Média da turma Gaming (4424 - 33636, n=105, últimos 2 anos) | |
| Acer Nitro 16 AN16-41 | |
| MSI Stealth 16 Studio A13VG | |
| Gigabyte AERO 16 OLED BSF | |
| Média Intel Core i7-13700H (4800 - 11050, n=29) | |
| HP Victus 16-r0077ng | |
| AIDA64 / FPU Mandel | |
| Média da turma Gaming (25115 - 128721, n=105, últimos 2 anos) | |
| Lenovo Legion Pro 5 16ARX8 | |
| HP Omen 16-xf0376ng | |
| Acer Nitro 16 AN16-41 | |
| Gigabyte AERO 16 OLED BSF | |
| MSI Stealth 16 Studio A13VG | |
| HP Victus 16-r0077ng | |
| Média Intel Core i7-13700H (12321 - 45118, n=29) | |
| AIDA64 / CPU AES | |
| Gigabyte AERO 16 OLED BSF | |
| Média da turma Gaming (39258 - 247074, n=105, últimos 2 anos) | |
| MSI Stealth 16 Studio A13VG | |
| Média Intel Core i7-13700H (28769 - 151254, n=29) | |
| Lenovo Legion Pro 5 16ARX8 | |
| HP Omen 16-xf0376ng | |
| HP Victus 16-r0077ng | |
| Acer Nitro 16 AN16-41 | |
| AIDA64 / CPU ZLib | |
| Média da turma Gaming (574 - 2531, n=105, últimos 2 anos) | |
| Gigabyte AERO 16 OLED BSF | |
| Lenovo Legion Pro 5 16ARX8 | |
| HP Omen 16-xf0376ng | |
| MSI Stealth 16 Studio A13VG | |
| HP Victus 16-r0077ng | |
| Média Intel Core i7-13700H (389 - 1215, n=29) | |
| Acer Nitro 16 AN16-41 | |
| AIDA64 / FP64 Ray-Trace | |
| Média da turma Gaming (5509 - 45446, n=105, últimos 2 anos) | |
| Lenovo Legion Pro 5 16ARX8 | |
| HP Omen 16-xf0376ng | |
| Gigabyte AERO 16 OLED BSF | |
| MSI Stealth 16 Studio A13VG | |
| Acer Nitro 16 AN16-41 | |
| HP Victus 16-r0077ng | |
| Média Intel Core i7-13700H (2540 - 10135, n=29) | |
| AIDA64 / CPU PhotoWorxx | |
| MSI Stealth 16 Studio A13VG | |
| Média da turma Gaming (12271 - 89891, n=105, últimos 2 anos) | |
| Gigabyte AERO 16 OLED BSF | |
| Média Intel Core i7-13700H (12872 - 52727, n=29) | |
| HP Victus 16-r0077ng | |
| HP Omen 16-xf0376ng | |
| Lenovo Legion Pro 5 16ARX8 | |
| Acer Nitro 16 AN16-41 | |
Desempenho do sistema
Como a SSD não é tão rápida, o Victus 16 fica em último lugar nos benchmarks do sistema. Entretanto, 7.158 pontos no PCMark 10 ainda é um bom resultado geral.
CrossMark: Overall | Productivity | Creativity | Responsiveness
| PCMark 10 / Score | |
| Média da turma Gaming (5828 - 12414, n=93, últimos 2 anos) | |
| Lenovo Legion Pro 5 16ARX8 | |
| HP Omen 16-xf0376ng | |
| Gigabyte AERO 16 OLED BSF | |
| Média Intel Core i7-13700H, NVIDIA GeForce RTX 4070 Laptop GPU (7158 - 7956, n=8) | |
| MSI Stealth 16 Studio A13VG | |
| Acer Nitro 16 AN16-41 | |
| HP Victus 16-r0077ng | |
| PCMark 10 / Essentials | |
| Gigabyte AERO 16 OLED BSF | |
| HP Omen 16-xf0376ng | |
| Lenovo Legion Pro 5 16ARX8 | |
| HP Victus 16-r0077ng | |
| Média Intel Core i7-13700H, NVIDIA GeForce RTX 4070 Laptop GPU (10252 - 11449, n=8) | |
| Média da turma Gaming (8810 - 11935, n=97, últimos 2 anos) | |
| Acer Nitro 16 AN16-41 | |
| MSI Stealth 16 Studio A13VG | |
| PCMark 10 / Productivity | |
| Média da turma Gaming (6845 - 25323, n=95, últimos 2 anos) | |
| Lenovo Legion Pro 5 16ARX8 | |
| HP Omen 16-xf0376ng | |
| Média Intel Core i7-13700H, NVIDIA GeForce RTX 4070 Laptop GPU (8501 - 10769, n=8) | |
| MSI Stealth 16 Studio A13VG | |
| Gigabyte AERO 16 OLED BSF | |
| Acer Nitro 16 AN16-41 | |
| HP Victus 16-r0077ng | |
| PCMark 10 / Digital Content Creation | |
| Média da turma Gaming (7602 - 19954, n=95, últimos 2 anos) | |
| Gigabyte AERO 16 OLED BSF | |
| Lenovo Legion Pro 5 16ARX8 | |
| HP Omen 16-xf0376ng | |
| Média Intel Core i7-13700H, NVIDIA GeForce RTX 4070 Laptop GPU (10358 - 12908, n=8) | |
| MSI Stealth 16 Studio A13VG | |
| Acer Nitro 16 AN16-41 | |
| HP Victus 16-r0077ng | |
| CrossMark / Overall | |
| Lenovo Legion Pro 5 16ARX8 | |
| Média da turma Gaming (1366 - 2409, n=94, últimos 2 anos) | |
| Média Intel Core i7-13700H, NVIDIA GeForce RTX 4070 Laptop GPU (1768 - 2073, n=6) | |
| Gigabyte AERO 16 OLED BSF | |
| MSI Stealth 16 Studio A13VG | |
| Acer Nitro 16 AN16-41 | |
| CrossMark / Productivity | |
| Lenovo Legion Pro 5 16ARX8 | |
| Média da turma Gaming (1386 - 2254, n=94, últimos 2 anos) | |
| Média Intel Core i7-13700H, NVIDIA GeForce RTX 4070 Laptop GPU (1645 - 2006, n=6) | |
| Gigabyte AERO 16 OLED BSF | |
| MSI Stealth 16 Studio A13VG | |
| Acer Nitro 16 AN16-41 | |
| CrossMark / Creativity | |
| Média da turma Gaming (1343 - 2786, n=94, últimos 2 anos) | |
| Lenovo Legion Pro 5 16ARX8 | |
| Média Intel Core i7-13700H, NVIDIA GeForce RTX 4070 Laptop GPU (1936 - 2137, n=6) | |
| Gigabyte AERO 16 OLED BSF | |
| MSI Stealth 16 Studio A13VG | |
| Acer Nitro 16 AN16-41 | |
| CrossMark / Responsiveness | |
| Gigabyte AERO 16 OLED BSF | |
| Lenovo Legion Pro 5 16ARX8 | |
| Média Intel Core i7-13700H, NVIDIA GeForce RTX 4070 Laptop GPU (1451 - 2202, n=6) | |
| Média da turma Gaming (1226 - 2334, n=94, últimos 2 anos) | |
| MSI Stealth 16 Studio A13VG | |
| Acer Nitro 16 AN16-41 | |
| PCMark 10 Score | 7158 pontos | |
Ajuda | ||
| AIDA64 / Memory Copy | |
| Média da turma Gaming (21750 - 129946, n=105, últimos 2 anos) | |
| MSI Stealth 16 Studio A13VG | |
| Gigabyte AERO 16 OLED BSF | |
| HP Omen 16-xf0376ng | |
| Média Intel Core i7-13700H (24334 - 78081, n=29) | |
| HP Victus 16-r0077ng | |
| Lenovo Legion Pro 5 16ARX8 | |
| Acer Nitro 16 AN16-41 | |
| AIDA64 / Memory Read | |
| Média da turma Gaming (22956 - 118858, n=105, últimos 2 anos) | |
| MSI Stealth 16 Studio A13VG | |
| HP Victus 16-r0077ng | |
| Gigabyte AERO 16 OLED BSF | |
| Média Intel Core i7-13700H (23681 - 79656, n=29) | |
| HP Omen 16-xf0376ng | |
| Lenovo Legion Pro 5 16ARX8 | |
| Acer Nitro 16 AN16-41 | |
| AIDA64 / Memory Write | |
| HP Omen 16-xf0376ng | |
| Média da turma Gaming (22297 - 135096, n=105, últimos 2 anos) | |
| MSI Stealth 16 Studio A13VG | |
| Gigabyte AERO 16 OLED BSF | |
| Média Intel Core i7-13700H (22986 - 99898, n=29) | |
| HP Victus 16-r0077ng | |
| Acer Nitro 16 AN16-41 | |
| Lenovo Legion Pro 5 16ARX8 | |
| AIDA64 / Memory Latency | |
| Média da turma Gaming (75.3 - 259, n=105, últimos 2 anos) | |
| Gigabyte AERO 16 OLED BSF | |
| HP Victus 16-r0077ng | |
| Média Intel Core i7-13700H (82.4 - 136.8, n=29) | |
| Acer Nitro 16 AN16-41 | |
| HP Omen 16-xf0376ng | |
| MSI Stealth 16 Studio A13VG | |
| Lenovo Legion Pro 5 16ARX8 | |
* ... menor é melhor
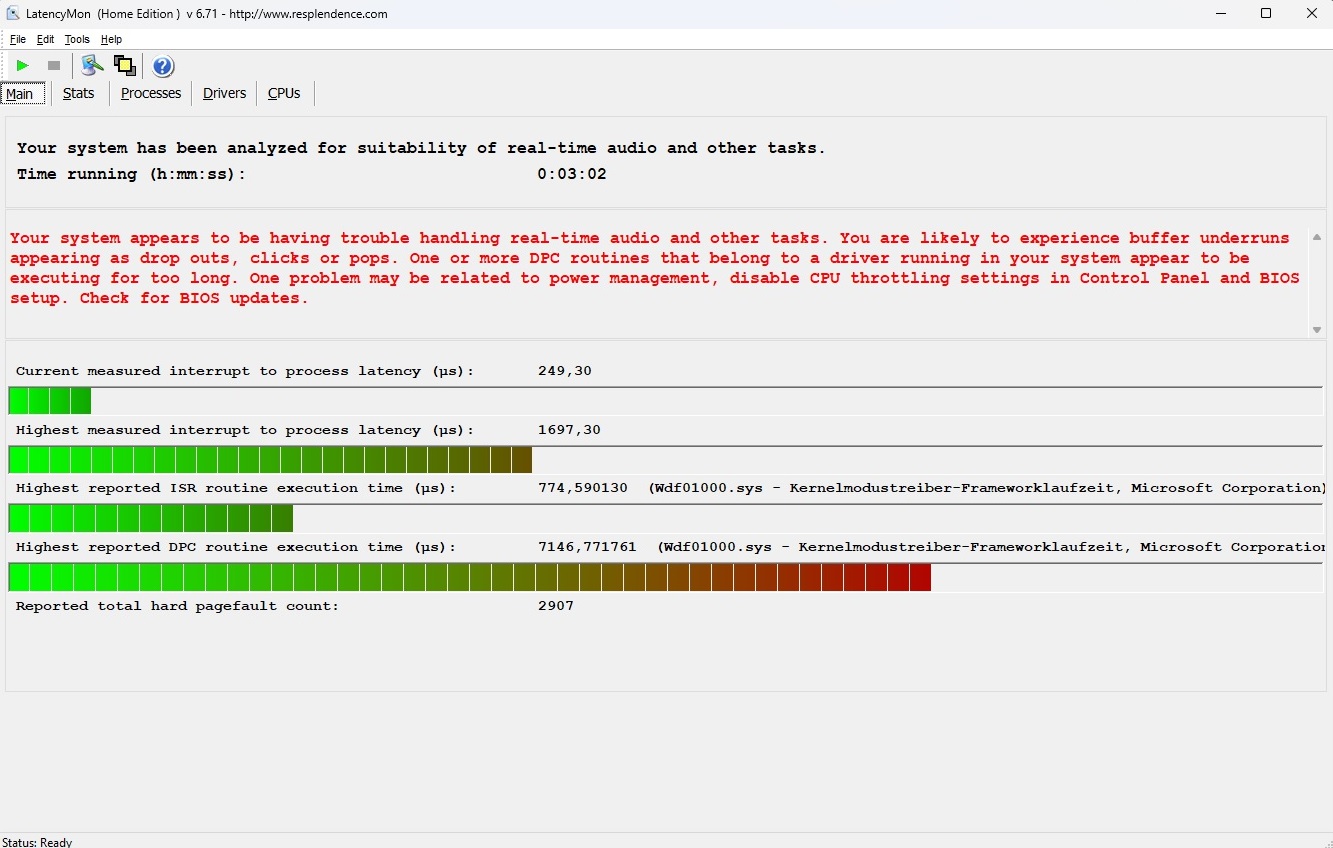
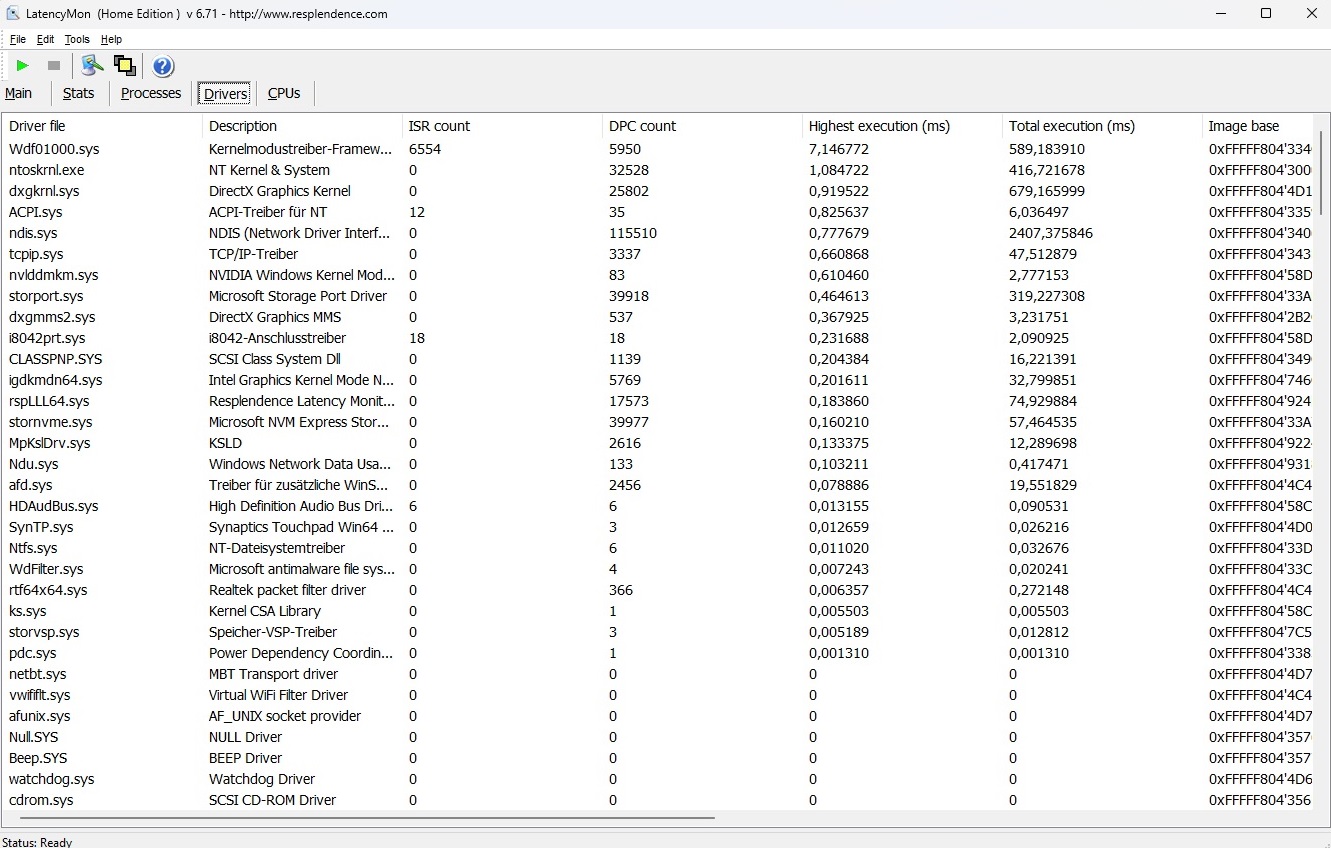
Latência DPC
Como vários outros concorrentes, o Victus 16 também é fraco quando se trata de latência. De acordo com a ferramenta LatencyMon, os usuários podem ter problemas com tarefas sensíveis à latência, como edição de áudio e vídeo em tempo real.
| DPC Latencies / LatencyMon - interrupt to process latency (max), Web, Youtube, Prime95 | |
| MSI Stealth 16 Studio A13VG | |
| HP Omen 16-xf0376ng | |
| HP Victus 16-r0077ng | |
| Acer Nitro 16 AN16-41 | |
| Gigabyte AERO 16 OLED BSF | |
| Lenovo Legion Pro 5 16ARX8 | |
* ... menor é melhor
Dispositivos de armazenamento
No total, o desempenho da SSD é ligeiramente inferior ao do Omen 16, apesar de sua maior capacidade (1.000 GB contra 512 GB), que por si só não consegue acompanhar a concorrência. Nosso loop do DiskSpd também mostra que o SSD Kioxia instalado no Victus 16 perde velocidade após algum tempo sob carga, como pode ser visto em outros laptops.

* ... menor é melhor
Sustained Read Performance: DiskSpd Read Loop, Queue Depth 8
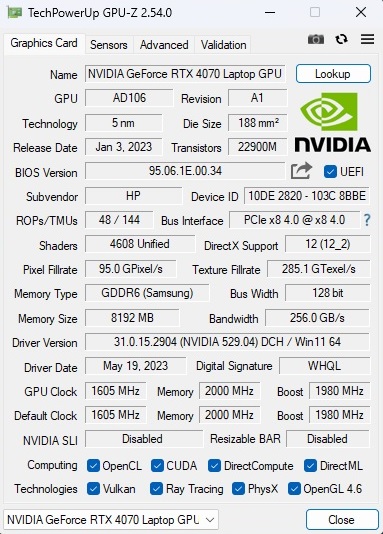
Placa gráfica
Como a Nvidia foi bastante parcimoniosa em termos de expansão de memória (quantidade de VRAM, interface) - como mencionado anteriormente - a GeForce RTX 4070 está bem atrás daRTX 4080 e RTX 4090se compararmos o desempenho puramente com outros notebooks RTX 4070, o Victus 16 não é ruim. Nos benchmarks de gráficos sintéticos, o modelo de 16 polegadas é forçado a ceder a derrota para a concorrência, mas a média anterior do RTX 4070 ainda é mantida, especialmente porque a HP não se limita ao TGP máximo possível de 140 watts, mas apenas o define em 120 watts.
| 3DMark 11 Performance | 33616 pontos | |
| 3DMark Ice Storm Standard Score | 159379 pontos | |
| 3DMark Cloud Gate Standard Score | 65316 pontos | |
| 3DMark Fire Strike Score | 26013 pontos | |
| 3DMark Time Spy Score | 11427 pontos | |
Ajuda | ||
* ... menor é melhor
Desempenho em jogos
Nos testes práticos de jogos, o desempenho 3D também se aproxima da média da RTX 4070. Na resolução Full HD nativa, o Victus 16 é capaz de executar quase todos os jogos atuais sem problemas, mesmo nas configurações máximas. Somente títulos muito exigentes ou mal otimizados, como Immortals of Aveum ou Starfieldnão conseguem atingir mais de 60 FPS.
| The Witcher 3 - 1920x1080 Ultra Graphics & Postprocessing (HBAO+) | |
| Média da turma Gaming (104.7 - 240, n=7, últimos 2 anos) | |
| Lenovo Legion Pro 5 16ARX8 | |
| MSI Stealth 16 Studio A13VG | |
| Gigabyte AERO 16 OLED BSF | |
| HP Victus 16-r0077ng | |
| Acer Nitro 16 AN16-41 | |
| Média NVIDIA GeForce RTX 4070 Laptop GPU (69.8 - 133.7, n=57) | |
| HP Omen 16-xf0376ng | |
| Immortals of Aveum - 1920x1080 Ultra AF:16x | |
| Média NVIDIA GeForce RTX 4070 Laptop GPU (46.1 - 49.9, n=4) | |
| HP Omen 16-xf0376ng | |
| HP Victus 16-r0077ng | |
| Atlas Fallen - 1920x1080 Very High Preset | |
| HP Omen 16-xf0376ng | |
| Média NVIDIA GeForce RTX 4070 Laptop GPU (105.3 - 111.1, n=4) | |
| HP Victus 16-r0077ng | |
| Armored Core 6 - 1920x1080 Maximum Preset | |
| HP Omen 16-xf0376ng | |
| Média NVIDIA GeForce RTX 4070 Laptop GPU (87.2 - 107, n=4) | |
| HP Victus 16-r0077ng | |
| Média da turma Gaming (n=1últimos 2 anos) | |
| Atomic Heart - 1920x1080 Atomic Preset | |
| Acer Nitro 16 AN16-41 | |
| Média NVIDIA GeForce RTX 4070 Laptop GPU (70.4 - 79, n=4) | |
| HP Victus 16-r0077ng | |
| High On Life - 1920x1080 Very High Preset | |
| MSI Stealth 16 Studio A13VG | |
| Média NVIDIA GeForce RTX 4070 Laptop GPU (101.9 - 114, n=4) | |
| HP Victus 16-r0077ng | |
| Company of Heroes 3 - 1920x1080 Maximum Settings | |
| MSI Stealth 16 Studio A13VG | |
| Média NVIDIA GeForce RTX 4070 Laptop GPU (134 - 157.5, n=5) | |
| HP Victus 16-r0077ng | |
| Resident Evil 4 Remake - 1920x1080 Max Preset | |
| MSI Stealth 16 Studio A13VG | |
| Média NVIDIA GeForce RTX 4070 Laptop GPU (74.8 - 86.7, n=4) | |
| Acer Nitro 16 AN16-41 | |
| HP Victus 16-r0077ng | |
| Sons of the Forest - 1920x1080 Ultra Preset AA:T | |
| HP Victus 16-r0077ng | |
| HP Omen 16-xf0376ng | |
| Média NVIDIA GeForce RTX 4070 Laptop GPU (71.1 - 87.5, n=4) | |
| Baldur's Gate 3 - 1920x1080 Ultra Preset AA:T | |
| Média da turma Gaming (59.4 - 246, n=104, últimos 2 anos) | |
| Média NVIDIA GeForce RTX 4070 Laptop GPU (66.7 - 128.5, n=30) | |
| HP Victus 16-r0077ng | |
| Ratchet & Clank Rift Apart - 1920x1080 Very High Preset AA:T | |
| Média NVIDIA GeForce RTX 4070 Laptop GPU (52.3 - 58.1, n=4) | |
| HP Victus 16-r0077ng | |
Em nossos 60 minutos Witcher 3não houve anormalidades, como quedas de quadros. O desempenho caiu um pouco com o tempo, mas permaneceu bastante estável.
Witcher 3 FPS chart
| baixo | média | alto | ultra | |
|---|---|---|---|---|
| GTA V (2015) | 180.9 | 175.7 | 112.8 | |
| The Witcher 3 (2015) | 114 | |||
| Dota 2 Reborn (2015) | 173.9 | 147.9 | 139.3 | 131.6 |
| Final Fantasy XV Benchmark (2018) | 145 | 109.3 | ||
| X-Plane 11.11 (2018) | 136 | 118.3 | 95.4 | |
| Strange Brigade (2018) | 224 | 192.4 | 192 | |
| High On Life (2023) | 166.2 | 126.7 | 101.9 | |
| Atomic Heart (2023) | 131.7 | 86.2 | 70.4 | |
| Company of Heroes 3 (2023) | 174 | 135 | 134 | |
| Sons of the Forest (2023) | 92.1 | 88.5 | 87.5 | |
| Resident Evil 4 Remake (2023) | 108.3 | 105.5 | 74.8 | |
| Ratchet & Clank Rift Apart (2023) | 72.5 | 58 | 52.3 | |
| Atlas Fallen (2023) | 133.8 | 126.7 | 106.6 | |
| Immortals of Aveum (2023) | 56 | 46.1 | ||
| Armored Core 6 (2023) | 102.5 | 101.9 | 97 | |
| Starfield (2023) | 62.3 | 51.2 | 46.6 | |
| The Crew Motorfest (2023) | 60 | 60 | 60 | |
| Baldur's Gate 3 (2023) | 115.2 | 99.1 | 95.4 |
Emissões
Ruído
Se você usar o modo balanceado , o Victus 16 não é muito alto. Cerca de 46 dB(A) em Witcher 3 é um nível claramente audível, mas não extremo (no modo Performance , esse nível se torna irritantemente alto, 56 dB). Em situações de inatividade e tarefas inofensivas, como escritório, vídeo e navegação na Web, os ventiladores geralmente giram entre 28 e 30 dB(A), o que é mais do que a concorrência. A HP tem espaço para melhorias aqui.
Barulho
| Ocioso |
| 28 / 29 / 30 dB |
| Carga |
| 43 / 48 dB |
 | ||
30 dB silencioso 40 dB(A) audível 50 dB(A) ruidosamente alto |
||
min: | ||
| HP Victus 16-r0077ng i7-13700H, GeForce RTX 4070 Laptop GPU | HP Omen 16-xf0376ng R7 7840HS, GeForce RTX 4070 Laptop GPU | Lenovo Legion Pro 5 16ARX8 R7 7745HX, GeForce RTX 4070 Laptop GPU | Acer Nitro 16 AN16-41 R7 7735HS, GeForce RTX 4070 Laptop GPU | Gigabyte AERO 16 OLED BSF i9-13900H, GeForce RTX 4070 Laptop GPU | MSI Stealth 16 Studio A13VG i7-13700H, GeForce RTX 4070 Laptop GPU | |
|---|---|---|---|---|---|---|
| Noise | 2% | 10% | 3% | -3% | 10% | |
| desligado / ambiente * (dB) | 25 | 24 4% | 23.2 7% | 25.7 -3% | 23 8% | 24 4% |
| Idle Minimum * (dB) | 28 | 25 11% | 23.2 17% | 25.7 8% | 23 18% | 24 14% |
| Idle Average * (dB) | 29 | 29 -0% | 23.2 20% | 25.7 11% | 23 21% | 24 17% |
| Idle Maximum * (dB) | 30 | 32 -7% | 26.2 13% | 26.3 12% | 33.64 -12% | 24 20% |
| Load Average * (dB) | 43 | 44 -2% | 31.4 27% | 33.9 21% | 51.49 -20% | 34.81 19% |
| Witcher 3 ultra * (dB) | 46 | 44 4% | 48.4 -5% | 55.27 -20% | 44.05 4% | |
| Load Maximum * (dB) | 48 | 46 4% | 53.8 -12% | 62 -29% | 55.24 -15% | 51.57 -7% |
* ... menor é melhor
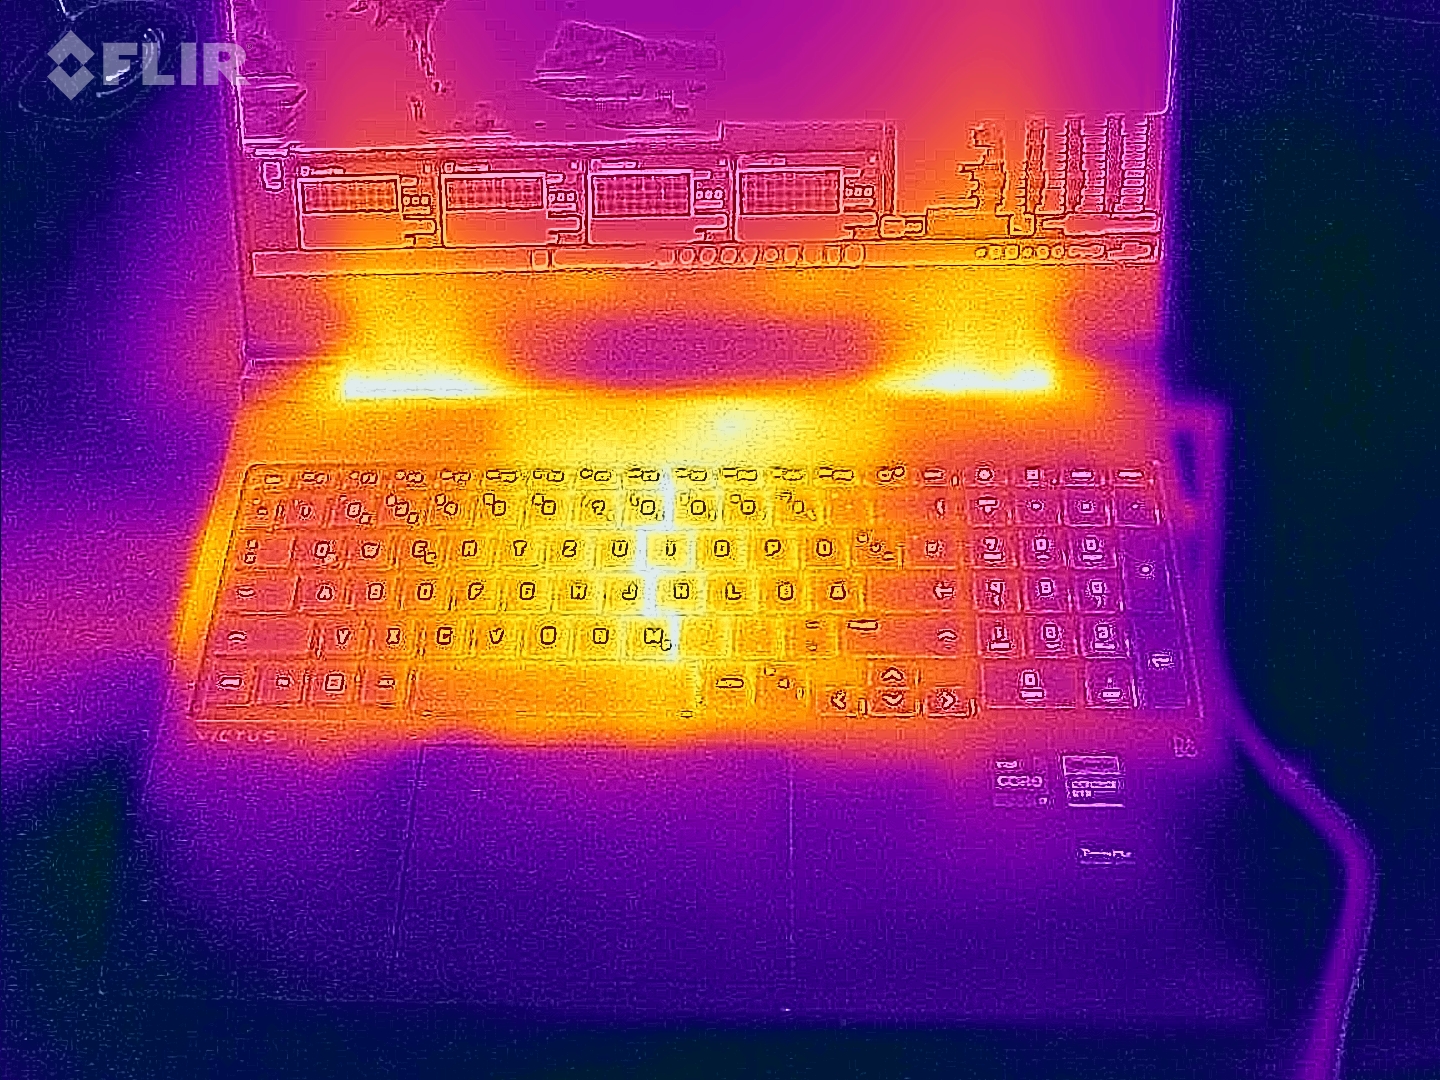
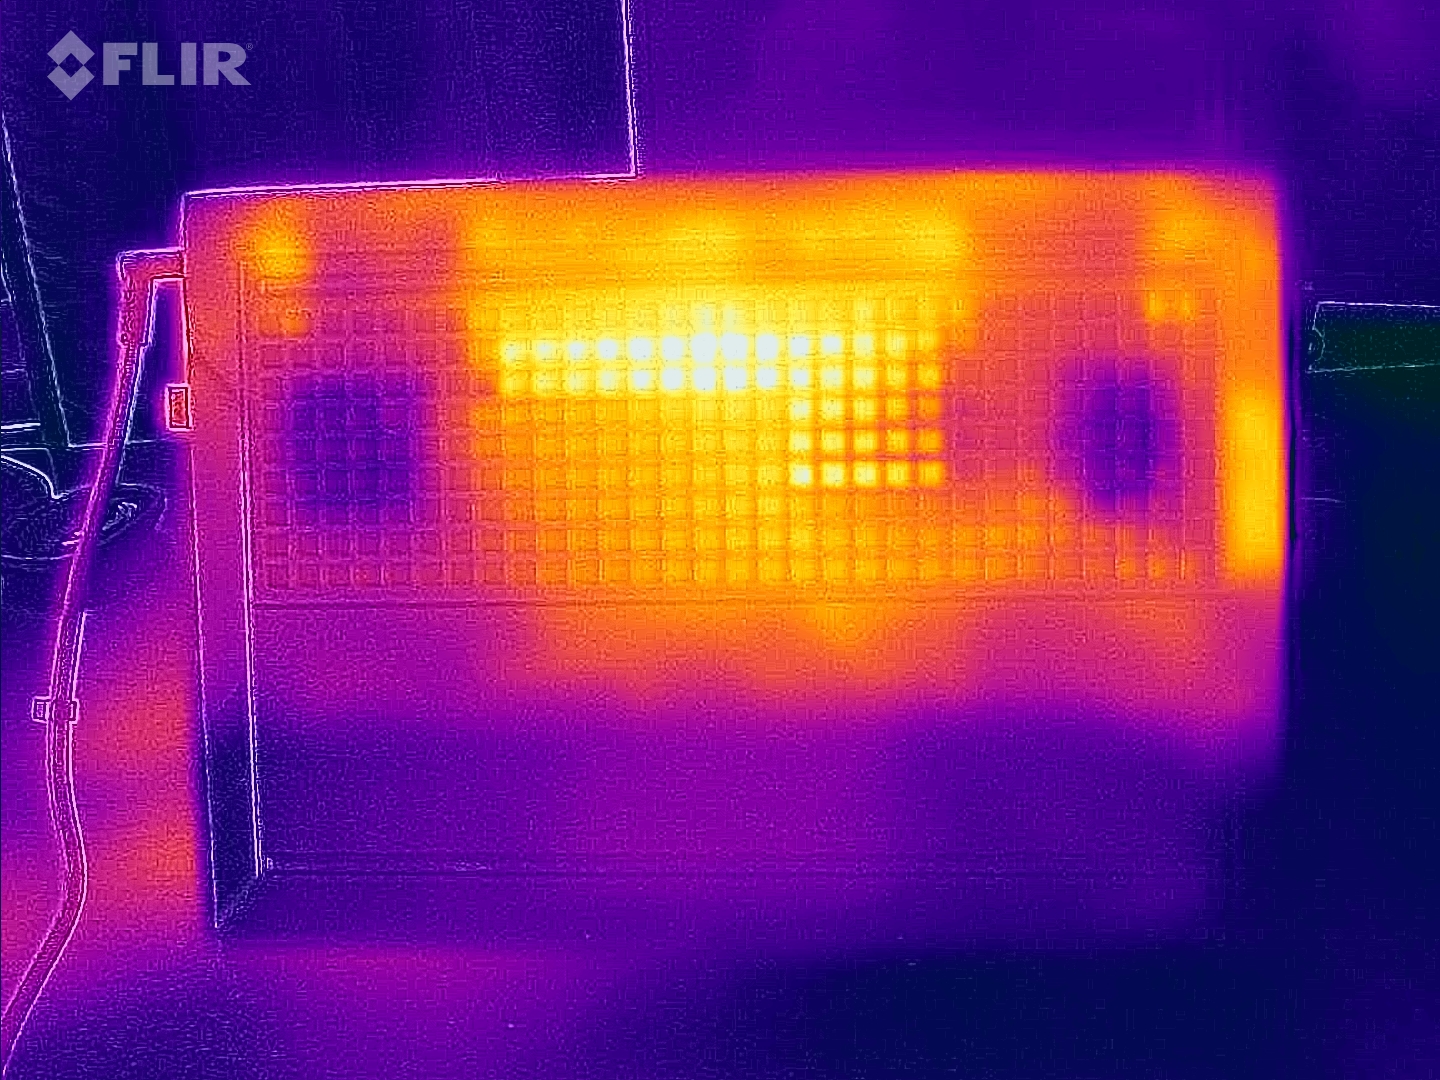
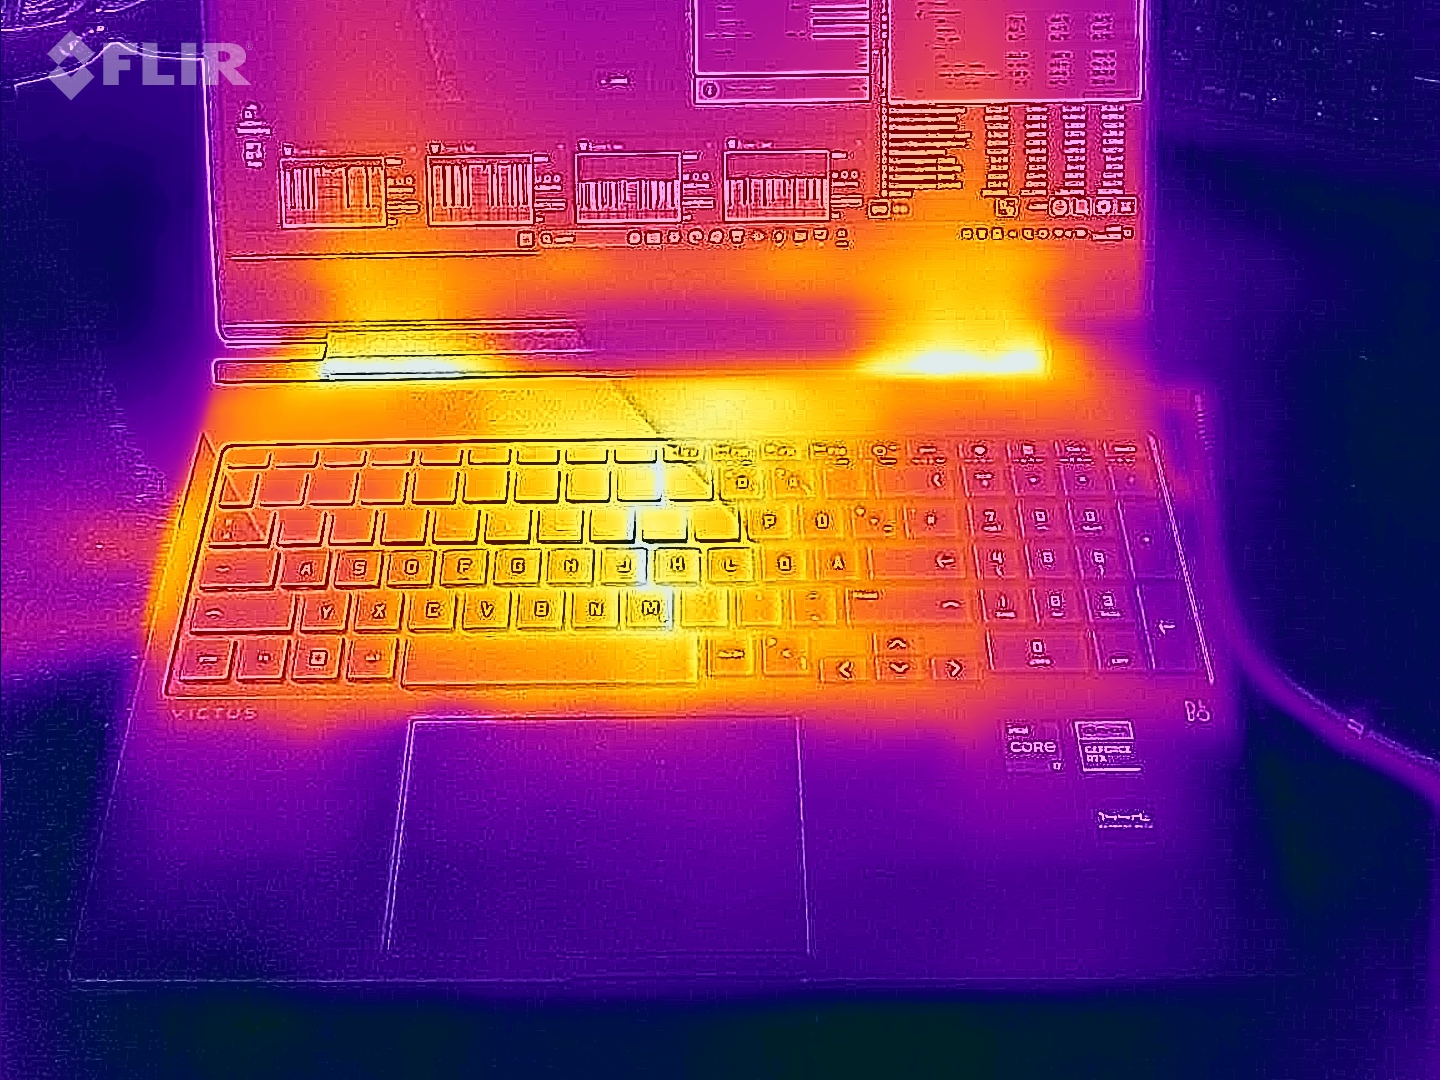
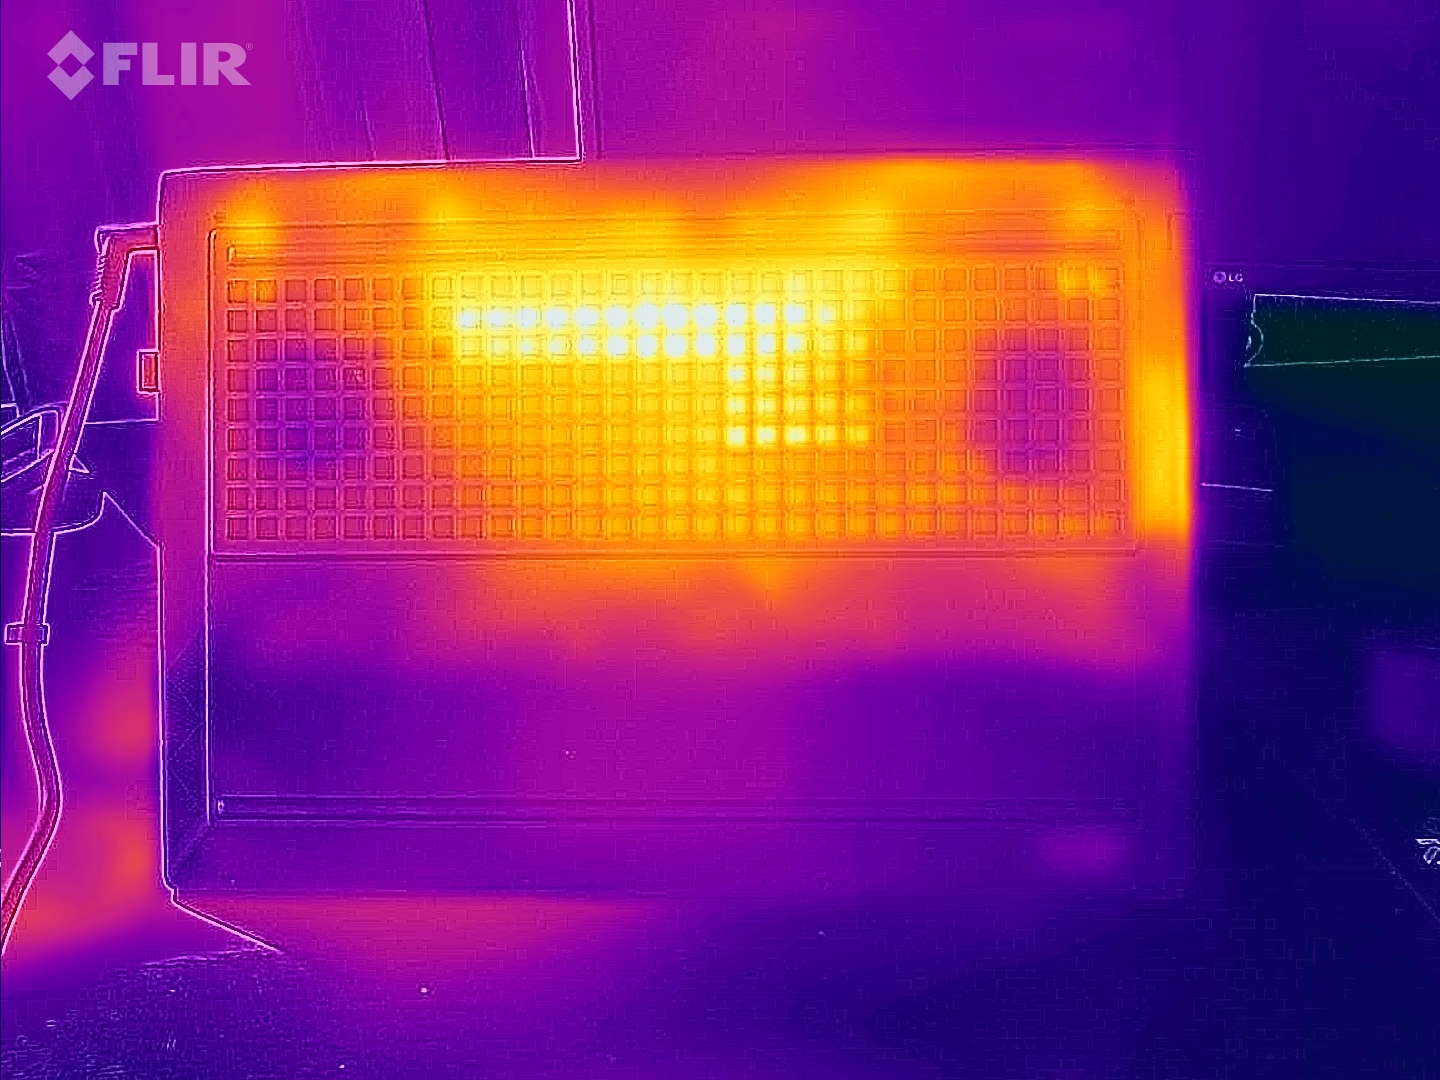
Temperatura
As temperaturas também são um pouco mais altas do que a maioria dos dispositivos de comparação, tanto no modo inativo quanto sob carga. Depois de uma hora de Witcher 3, a parte superior do chassi atingiu 52 °C e a parte inferior do gabinete 54 °C, o que é contra as sessões de jogos no colo. Pelo menos a área da palma da mão sempre permanece em regiões confortáveis, com um máximo de 33 °C.
(-) A temperatura máxima no lado superior é 51 °C / 124 F, em comparação com a média de 40.4 °C / 105 F , variando de 21.2 a 68.8 °C para a classe Gaming.
(-) A parte inferior aquece até um máximo de 54 °C / 129 F, em comparação com a média de 43.2 °C / 110 F
(+) Em uso inativo, a temperatura média para o lado superior é 29.8 °C / 86 F, em comparação com a média do dispositivo de 33.9 °C / ### class_avg_f### F.
(-) Jogando The Witcher 3, a temperatura média para o lado superior é 41.6 °C / 107 F, em comparação com a média do dispositivo de 33.9 °C / ## #class_avg_f### F.
(+) Os apoios para as mãos e o touchpad estão atingindo a temperatura máxima da pele (33 °C / 91.4 F) e, portanto, não estão quentes.
(-) A temperatura média da área do apoio para as mãos de dispositivos semelhantes foi 28.8 °C / 83.8 F (-4.2 °C / -7.6 F).
| HP Victus 16-r0077ng i7-13700H, GeForce RTX 4070 Laptop GPU | HP Omen 16-xf0376ng R7 7840HS, GeForce RTX 4070 Laptop GPU | Lenovo Legion Pro 5 16ARX8 R7 7745HX, GeForce RTX 4070 Laptop GPU | Acer Nitro 16 AN16-41 R7 7735HS, GeForce RTX 4070 Laptop GPU | Gigabyte AERO 16 OLED BSF i9-13900H, GeForce RTX 4070 Laptop GPU | MSI Stealth 16 Studio A13VG i7-13700H, GeForce RTX 4070 Laptop GPU | |
|---|---|---|---|---|---|---|
| Heat | 2% | 15% | 5% | 23% | -16% | |
| Maximum Upper Side * (°C) | 51 | 49 4% | 41.8 18% | 41.5 19% | 41 20% | 60 -18% |
| Maximum Bottom * (°C) | 54 | 57 -6% | 41.4 23% | 51.8 4% | 47 13% | 61 -13% |
| Idle Upper Side * (°C) | 37 | 31 16% | 29 22% | 31.6 15% | 23 38% | 38.2 -3% |
| Idle Bottom * (°C) | 29 | 31 -7% | 30.4 -5% | 34.5 -19% | 23 21% | 37.7 -30% |
* ... menor é melhor
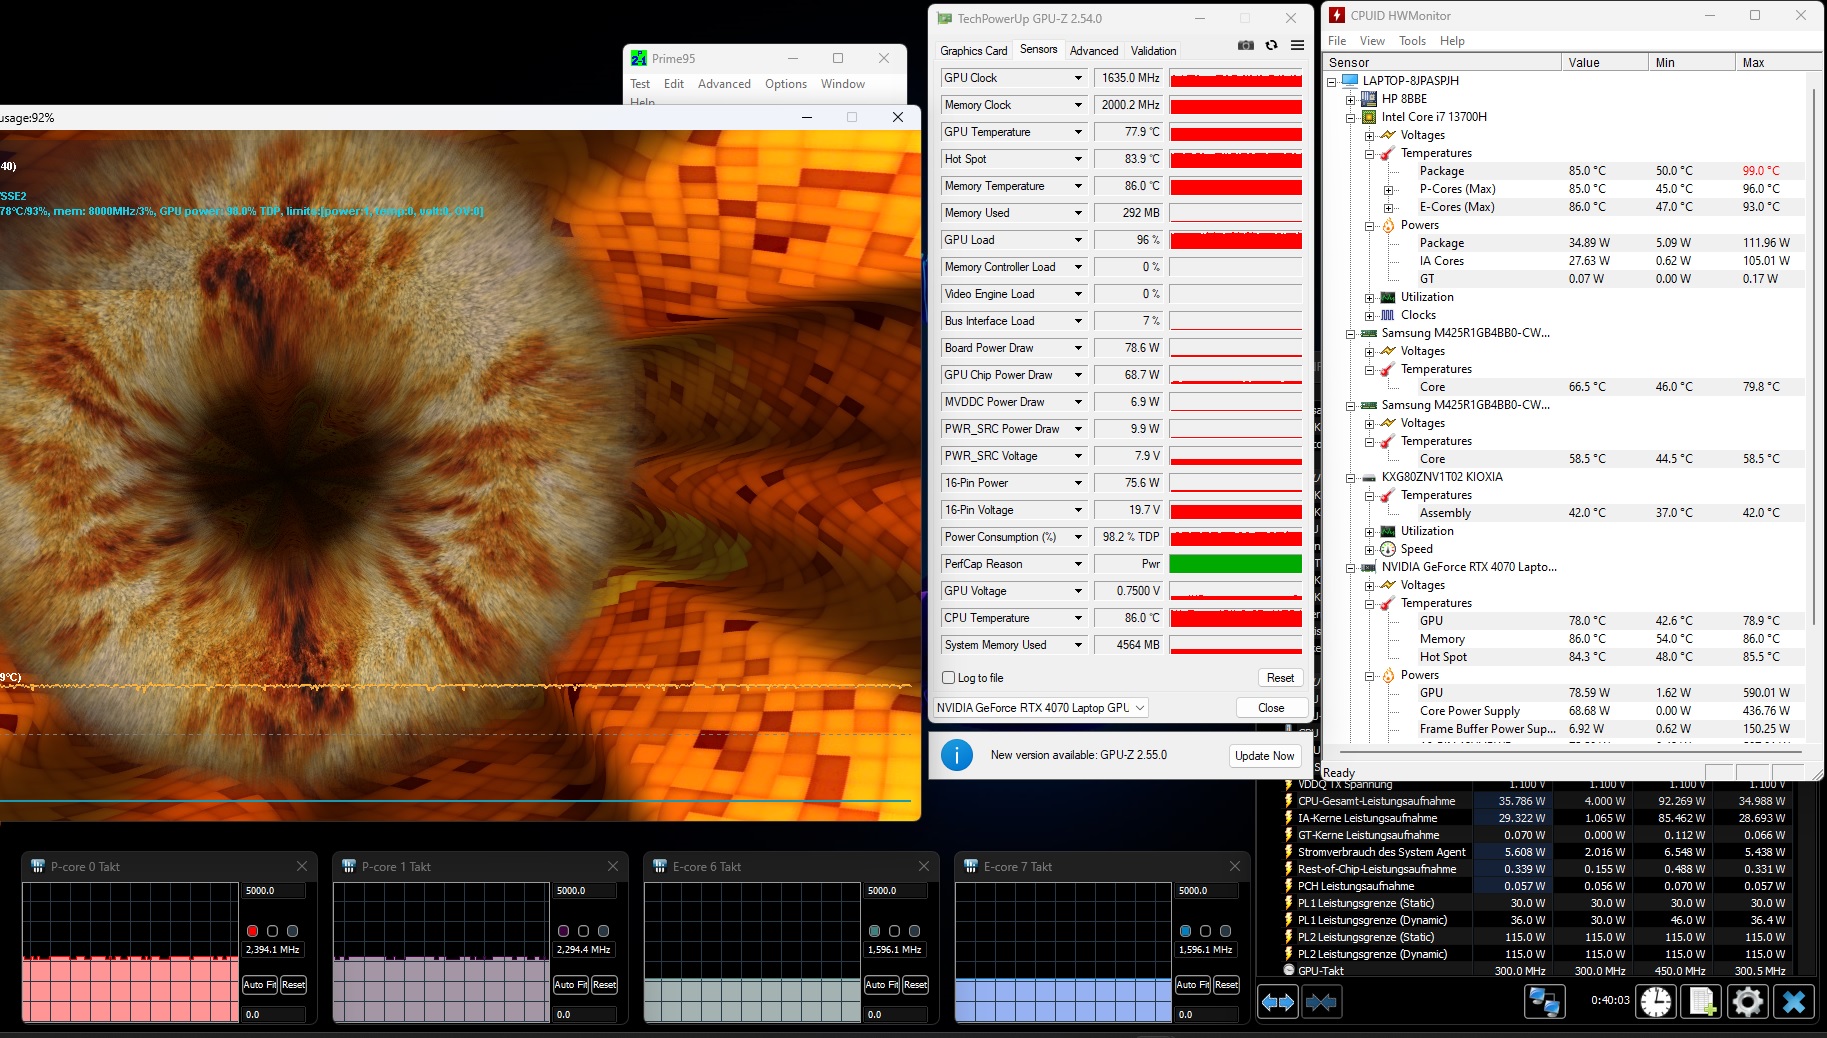
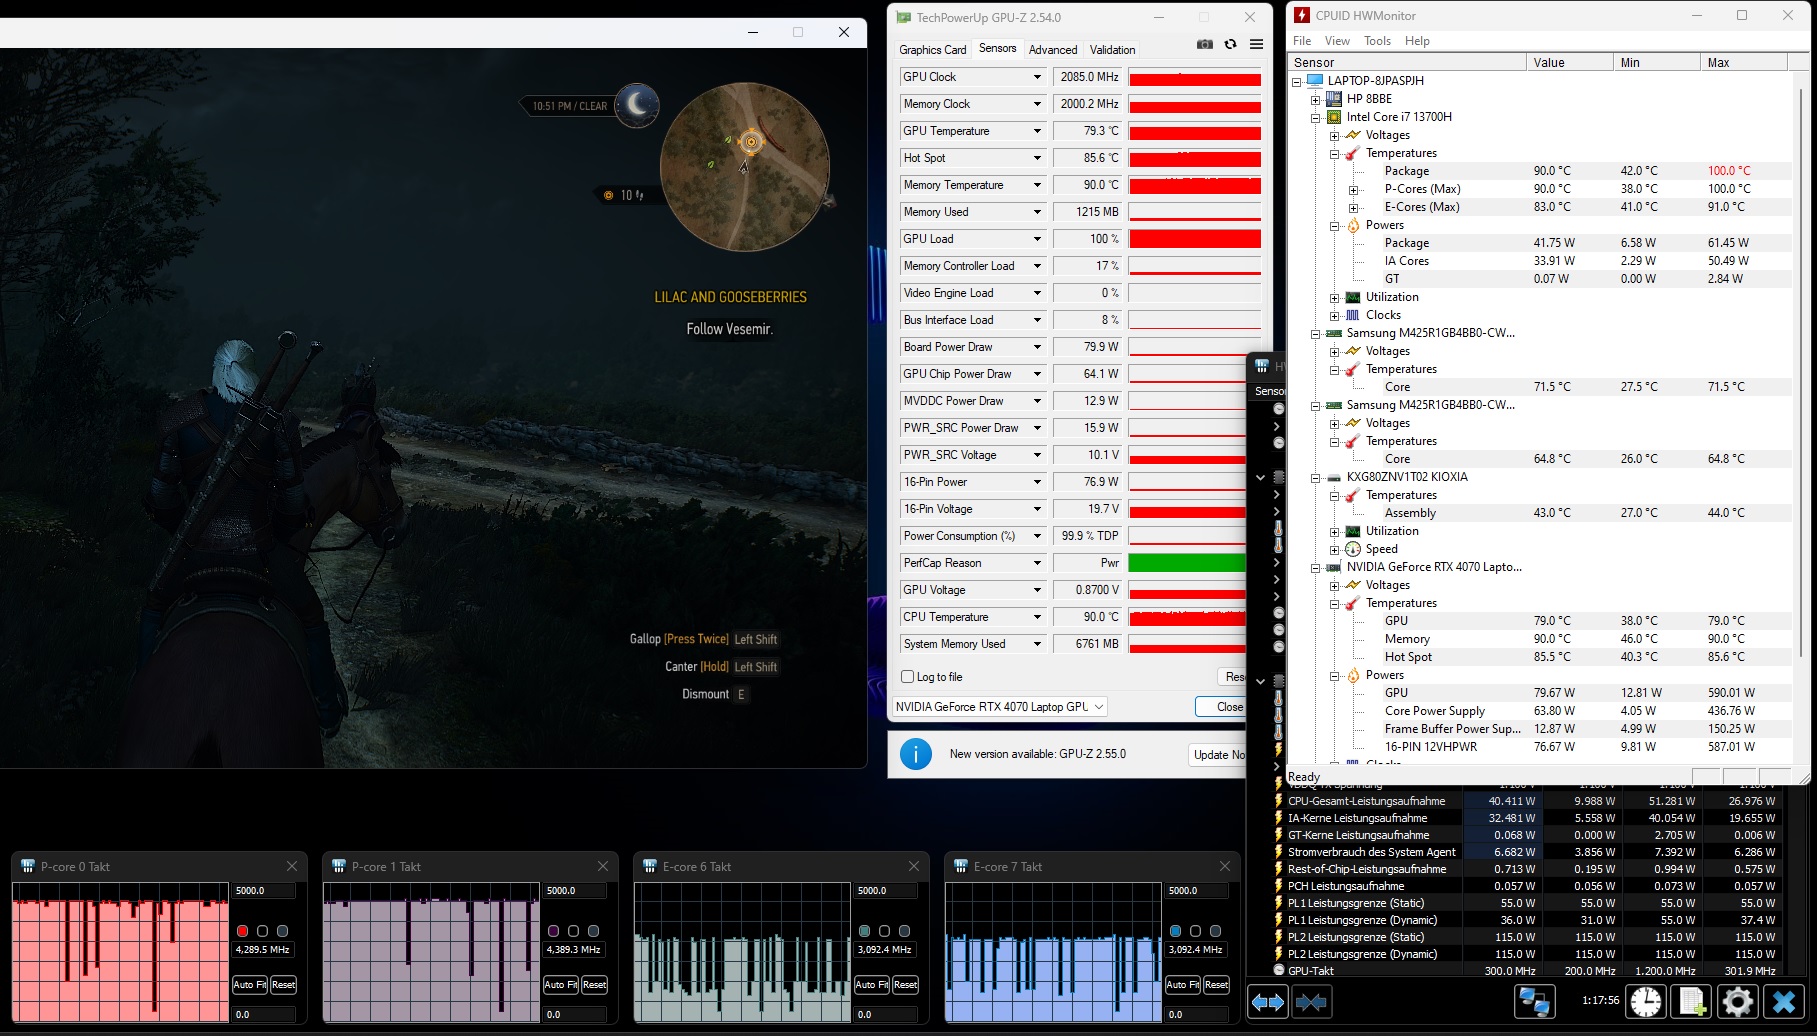
Teste de estresse
O sistema de resfriamento nos deixa com sentimentos mistos. Embora o Core i7-13700H opere apenas em seu clock base ou um pouco abaixo dele sob carga total, a CPU fica bastante quente, em torno de 85 °C. A situação com a placa de vídeo é um pouco mais tranquila. Um pouco menos de 78 °C e uma taxa de clock de 1.635 MHz após 60 minutos de Furmark e Prime95 são um resultado sólido.
Alto-falantes
HP Victus 16-r0077ng análise de áudio
(±) | o volume do alto-falante é médio, mas bom (###valor### dB)
Graves 100 - 315Hz
(-) | quase nenhum baixo - em média 21.1% menor que a mediana
(±) | a linearidade dos graves é média (13.6% delta para a frequência anterior)
Médios 400 - 2.000 Hz
(+) | médios equilibrados - apenas 1.3% longe da mediana
(+) | médios são lineares (2.7% delta para frequência anterior)
Altos 2 - 16 kHz
(+) | agudos equilibrados - apenas 2.8% longe da mediana
(+) | os máximos são lineares (5.3% delta da frequência anterior)
Geral 100 - 16.000 Hz
(±) | a linearidade do som geral é média (15.8% diferença em relação à mediana)
Comparado com a mesma classe
» 37% de todos os dispositivos testados nesta classe foram melhores, 7% semelhantes, 56% piores
» O melhor teve um delta de 6%, a média foi 18%, o pior foi 132%
Comparado com todos os dispositivos testados
» 24% de todos os dispositivos testados foram melhores, 5% semelhantes, 70% piores
» O melhor teve um delta de 4%, a média foi 23%, o pior foi 134%
HP Omen 16-xf0376ng análise de áudio
(±) | o volume do alto-falante é médio, mas bom (###valor### dB)
Graves 100 - 315Hz
(±) | graves reduzidos - em média 14.9% menor que a mediana
(±) | a linearidade dos graves é média (13.6% delta para a frequência anterior)
Médios 400 - 2.000 Hz
(±) | médios mais altos - em média 5.2% maior que a mediana
(+) | médios são lineares (4.7% delta para frequência anterior)
Altos 2 - 16 kHz
(+) | agudos equilibrados - apenas 3.7% longe da mediana
(+) | os máximos são lineares (6.6% delta da frequência anterior)
Geral 100 - 16.000 Hz
(+) | o som geral é linear (14.6% diferença em relação à mediana)
Comparado com a mesma classe
» 28% de todos os dispositivos testados nesta classe foram melhores, 7% semelhantes, 65% piores
» O melhor teve um delta de 6%, a média foi 18%, o pior foi 132%
Comparado com todos os dispositivos testados
» 19% de todos os dispositivos testados foram melhores, 4% semelhantes, 77% piores
» O melhor teve um delta de 4%, a média foi 23%, o pior foi 134%
Gerenciamento de energia
Consumo de energia
O Victus 16 se destaca da concorrência de forma positiva em termos de consumo de energia. A taxa média de consumo ocioso de 13 watts e o consumo em jogos de 142 watts estão abaixo da maioria dos dispositivos de comparação. A fonte de alimentação de 230 watts incluída é, portanto, perfeitamente adequada.
| desligado | |
| Ocioso | |
| Carga |
|
Key:
min: | |
| HP Victus 16-r0077ng i7-13700H, GeForce RTX 4070 Laptop GPU | HP Omen 16-xf0376ng R7 7840HS, GeForce RTX 4070 Laptop GPU | Lenovo Legion Pro 5 16ARX8 R7 7745HX, GeForce RTX 4070 Laptop GPU | Acer Nitro 16 AN16-41 R7 7735HS, GeForce RTX 4070 Laptop GPU | Gigabyte AERO 16 OLED BSF i9-13900H, GeForce RTX 4070 Laptop GPU | MSI Stealth 16 Studio A13VG i7-13700H, GeForce RTX 4070 Laptop GPU | Média da turma Gaming | |
|---|---|---|---|---|---|---|---|
| Power Consumption | 3% | -24% | -20% | -10% | -10% | -32% | |
| Idle Minimum * (Watt) | 8 | 9 -13% | 8.1 -1% | 11.6 -45% | 11.8 -48% | 11 -38% | 13 ? -63% |
| Idle Average * (Watt) | 13 | 14 -8% | 15.9 -22% | 15.6 -20% | 16.1 -24% | 18 -38% | 19 ? -46% |
| Idle Maximum * (Watt) | 22 | 20 9% | 37.2 -69% | 16.5 25% | 17 23% | 19 14% | 24.6 ? -12% |
| Load Average * (Watt) | 86 | 84 2% | 90.9 -6% | 155 -80% | 100.6 -17% | 91 -6% | 110.7 ? -29% |
| Witcher 3 ultra * (Watt) | 141.8 | 140.9 1% | 189.6 -34% | 154.8 -9% | 158 -11% | 130 8% | |
| Load Maximum * (Watt) | 233 | 176 24% | 263.5 -13% | 205 12% | 192 18% | 228 2% | 259 ? -11% |
* ... menor é melhor
Power consumption Witcher 3 / Stress test
Power consumption with an external monitor
Duração da bateria
Com a alternância ativa de gráficos, o Victus 16 dura um tempo relativamente longo sem uma tomada elétrica para um notebook para jogos. No teste prático de WLAN (brilho definido para 150 cd/m²), o dispositivo de 16 polegadas durou 426 minutos, quase 1,5 hora a mais do que o Omen 16, embora alguns concorrentes tenham tempos de execução ainda mais longos graças a baterias maiores (o Victus 16 oferece 83 Wh).
| HP Victus 16-r0077ng i7-13700H, GeForce RTX 4070 Laptop GPU, 83 Wh | HP Omen 16-xf0376ng R7 7840HS, GeForce RTX 4070 Laptop GPU, 83 Wh | Lenovo Legion Pro 5 16ARX8 R7 7745HX, GeForce RTX 4070 Laptop GPU, 80 Wh | Acer Nitro 16 AN16-41 R7 7735HS, GeForce RTX 4070 Laptop GPU, 90 Wh | Gigabyte AERO 16 OLED BSF i9-13900H, GeForce RTX 4070 Laptop GPU, 88 Wh | MSI Stealth 16 Studio A13VG i7-13700H, GeForce RTX 4070 Laptop GPU, 99.9 Wh | Média da turma Gaming | |
|---|---|---|---|---|---|---|---|
| Duração da bateria | -20% | -44% | 27% | 6% | 10% | 0% | |
| WiFi v1.3 (h) | 7.1 | 5.7 -20% | 4 -44% | 9 27% | 7.5 6% | 7.8 10% | 7.11 ? 0% |
| Reader / Idle (h) | 6.5 | 12.2 | 11 | 8.27 ? | |||
| Load (h) | 1 | 1.8 | 2.1 | 2.4 | 1.502 ? | ||
| H.264 (h) | 10.2 | 7.4 | 7.7 | 8.32 ? |
Pro
Contra
Veredicto
Se a HP não tivesse optado por preços razoáveis, o Victus 16-r0077ng teria tido muita dificuldade para enfrentar a concorrência. O Gigabyte Aero 16, o Lenovo Legion Pro 5, o Acer Nitro 16 e o MSI Stealth 16 Studio todos têm melhores classificações gerais, embora alguns deles custem consideravelmente mais.
Por um preço inicial de cerca de US$949,99, o Victus 16 tem um desempenho relativamente bom.
Embora o chassi de plástico não pareça particularmente de alta qualidade e não tenha Thunderbolt 4, ele se destaca pelo design elegante e pelos dispositivos de entrada utilizáveis. A maioria dos compradores também deve ficar satisfeita com a tela Full HD com cores precisas (144 Hz), embora o brilho seja bastante fraco. O desempenho do processador Core i7-13700H e da GeForce RTX 4070 geralmente atende às expectativas, enquanto os valores de emissão são um pouco mistos. No modo balanceado , que recomendamos para o uso diário, o processador de 16 polegadas não é muito barulhento, mas é bastante quente.
De modo geral, os jogadores preocupados com o preço não podem errar aqui. Entretanto, aqueles que valorizam mais a qualidade em áreas individuais ou que desejam melhores resultados devem comprar um dos dispositivos concorrentes.
Preço e disponibilidade
O equivalente nos EUA à nossa configuração de análise do Victus 16 (Core i7-13700H, GeForce RTX 4070 e tela de 144 Hz) está disponível na loja virtual da HP por US$ 1.439,99.
Os preços são válidos a partir de 26.09.2023 e estão sujeitos a alterações.
HP Victus 16-r0077ng
- 09/25/2023 v7 (old)
Florian Glaser
Transparência
A seleção dos dispositivos a serem analisados é feita pela nossa equipe editorial. A amostra de teste foi fornecida ao autor como empréstimo pelo fabricante ou varejista para fins desta revisão. O credor não teve influência nesta revisão, nem o fabricante recebeu uma cópia desta revisão antes da publicação. Não houve obrigação de publicar esta revisão. Como empresa de mídia independente, a Notebookcheck não está sujeita à autoridade de fabricantes, varejistas ou editores.
É assim que o Notebookcheck está testando
Todos os anos, o Notebookcheck analisa de forma independente centenas de laptops e smartphones usando procedimentos padronizados para garantir que todos os resultados sejam comparáveis. Desenvolvemos continuamente nossos métodos de teste há cerca de 20 anos e definimos padrões da indústria no processo. Em nossos laboratórios de teste, equipamentos de medição de alta qualidade são utilizados por técnicos e editores experientes. Esses testes envolvem um processo de validação em vários estágios. Nosso complexo sistema de classificação é baseado em centenas de medições e benchmarks bem fundamentados, o que mantém a objetividade.Price comparison

