MSI Stealth GS77 revisão de laptop: Uma boa alternativa Razer Blade 17?
Quando a MSI introduziu o GS76 com a 11ª geração Intel no ano passado, o modelo utilizaria um projeto de chassi completamente diferente do anterior GS75. Para 2022, o GS77 com a Intel do 12º gênero chegou para substituir o GS76 por mais um novo projeto de chassis. Estamos definitivamente surpresos de ver um novo visual tão cedo para a série MSI GS, especialmente porque a maioria dos outros laptops usaria o mesmo esqueleto de chassi por pelo menos alguns anos seguidos antes de eventualmente receber um facelift
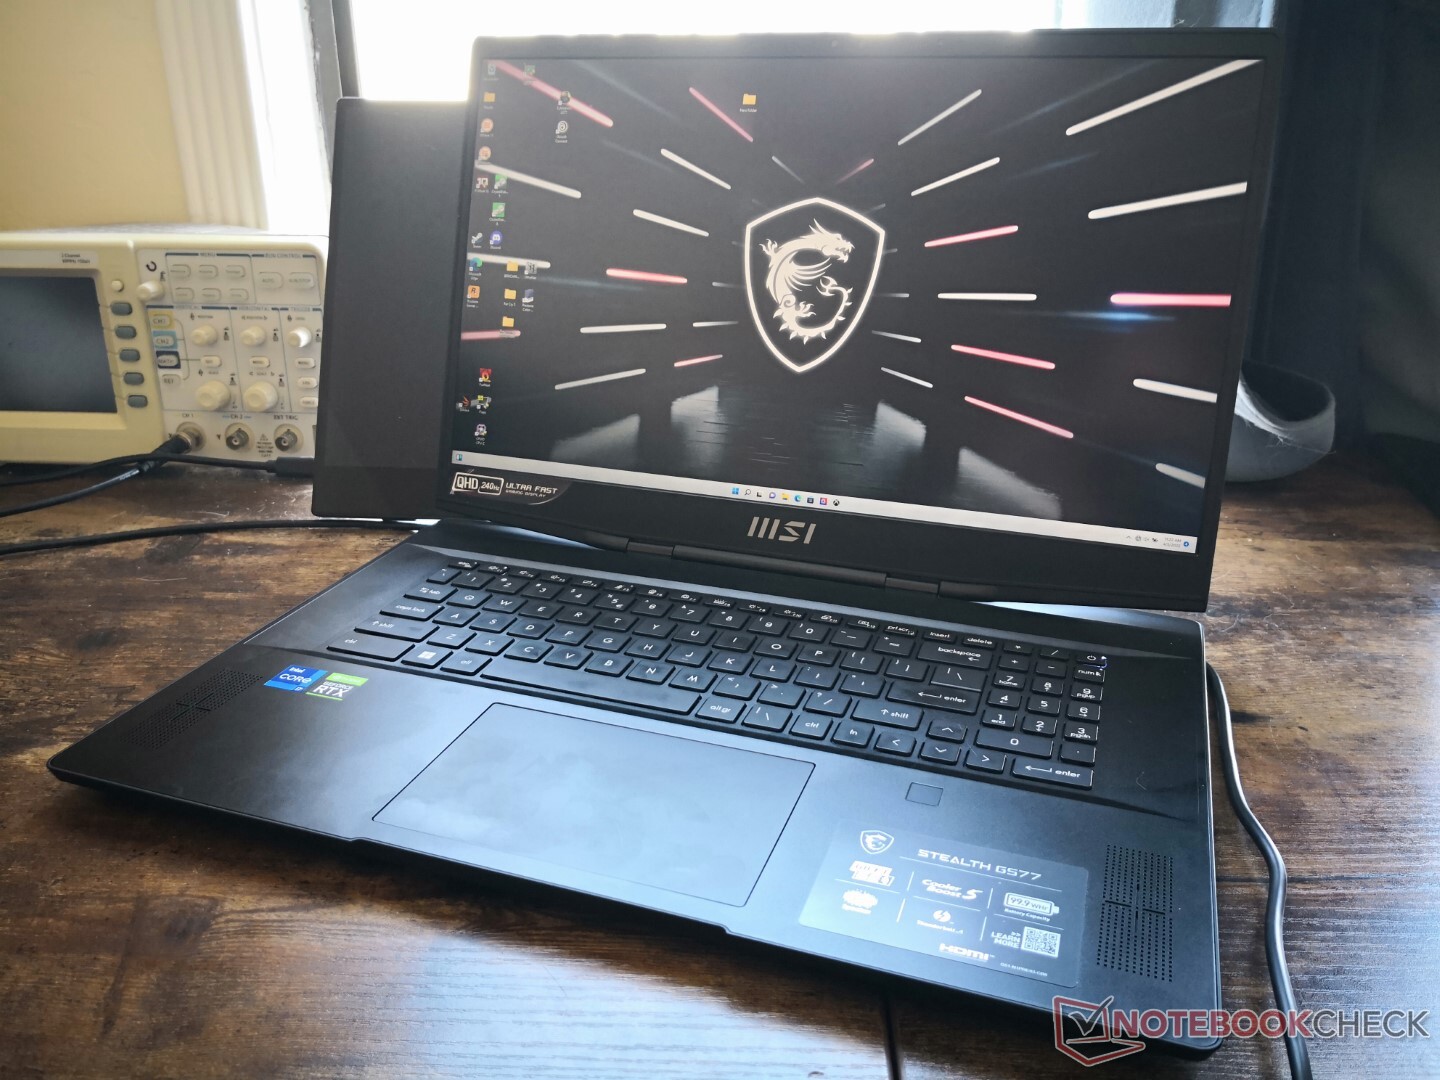
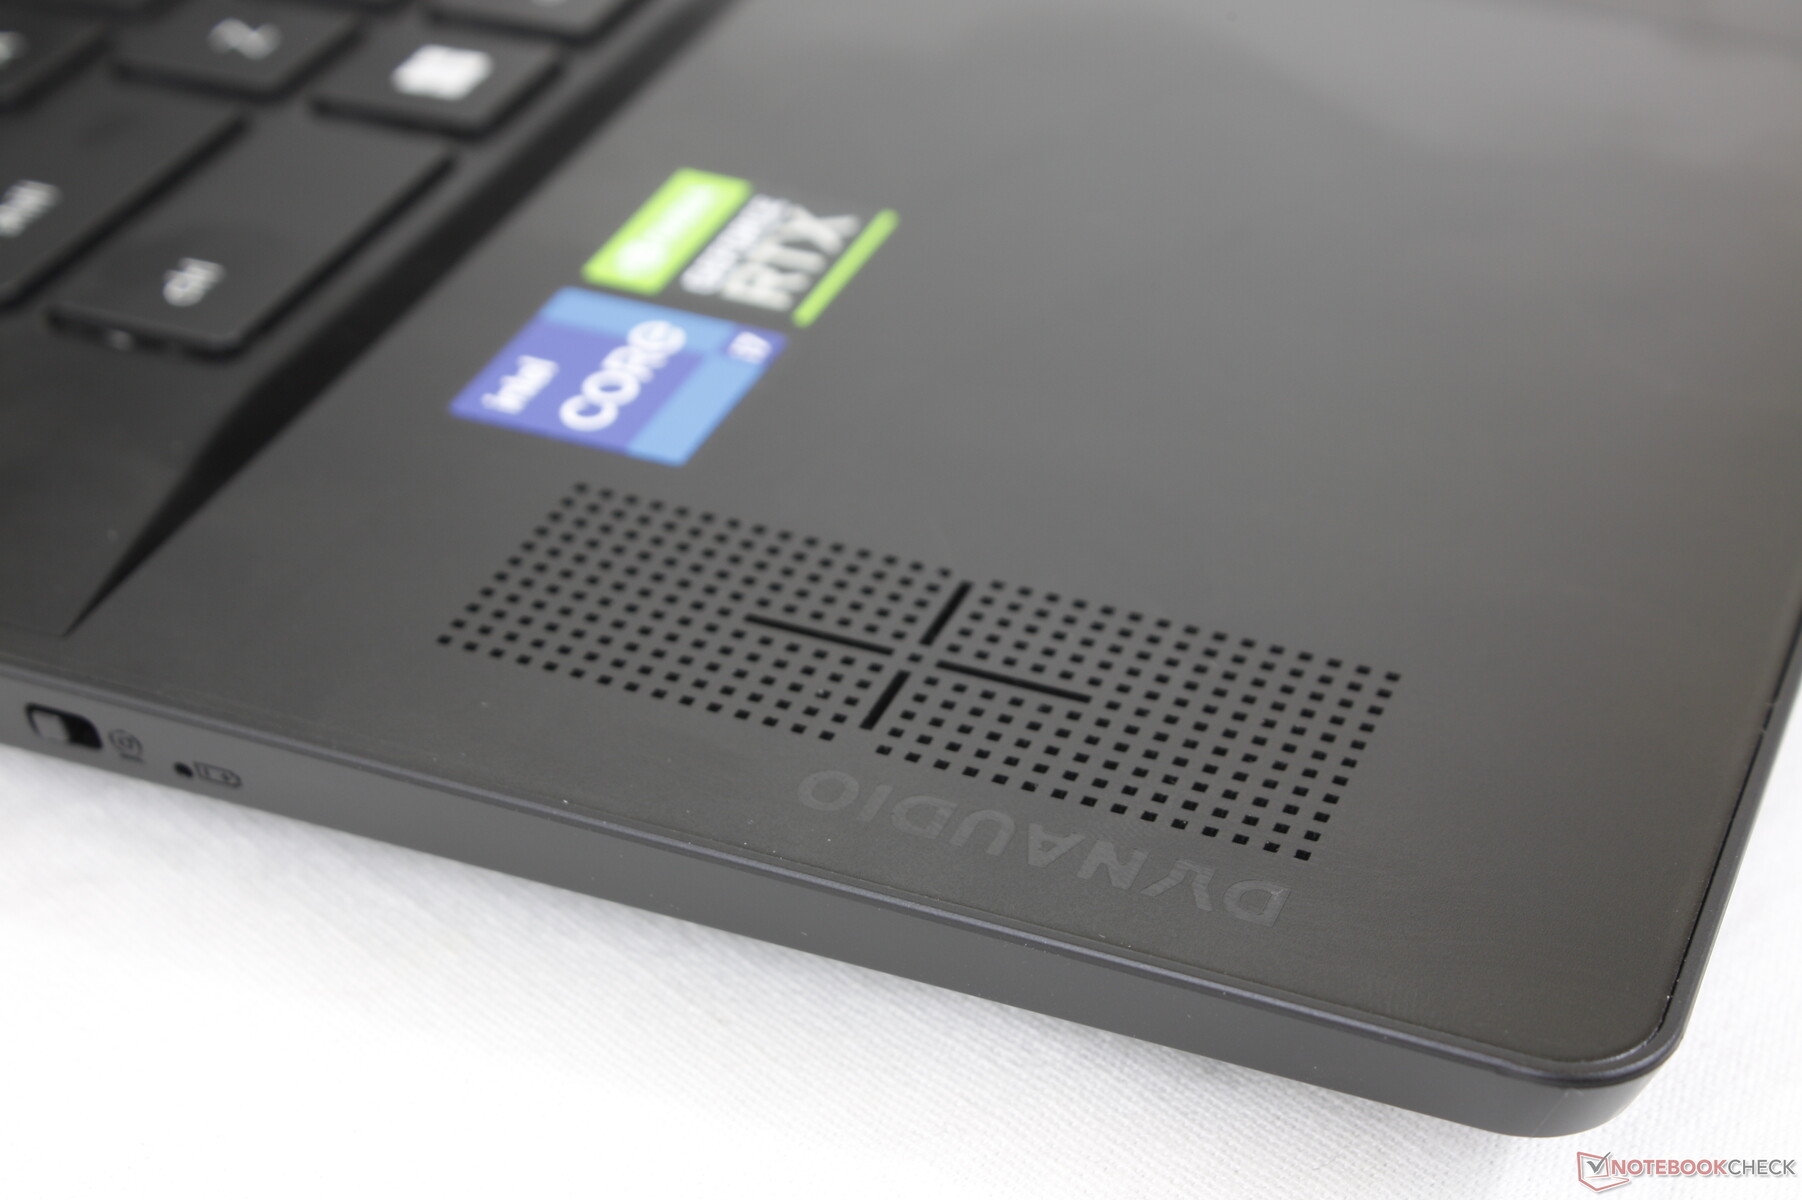
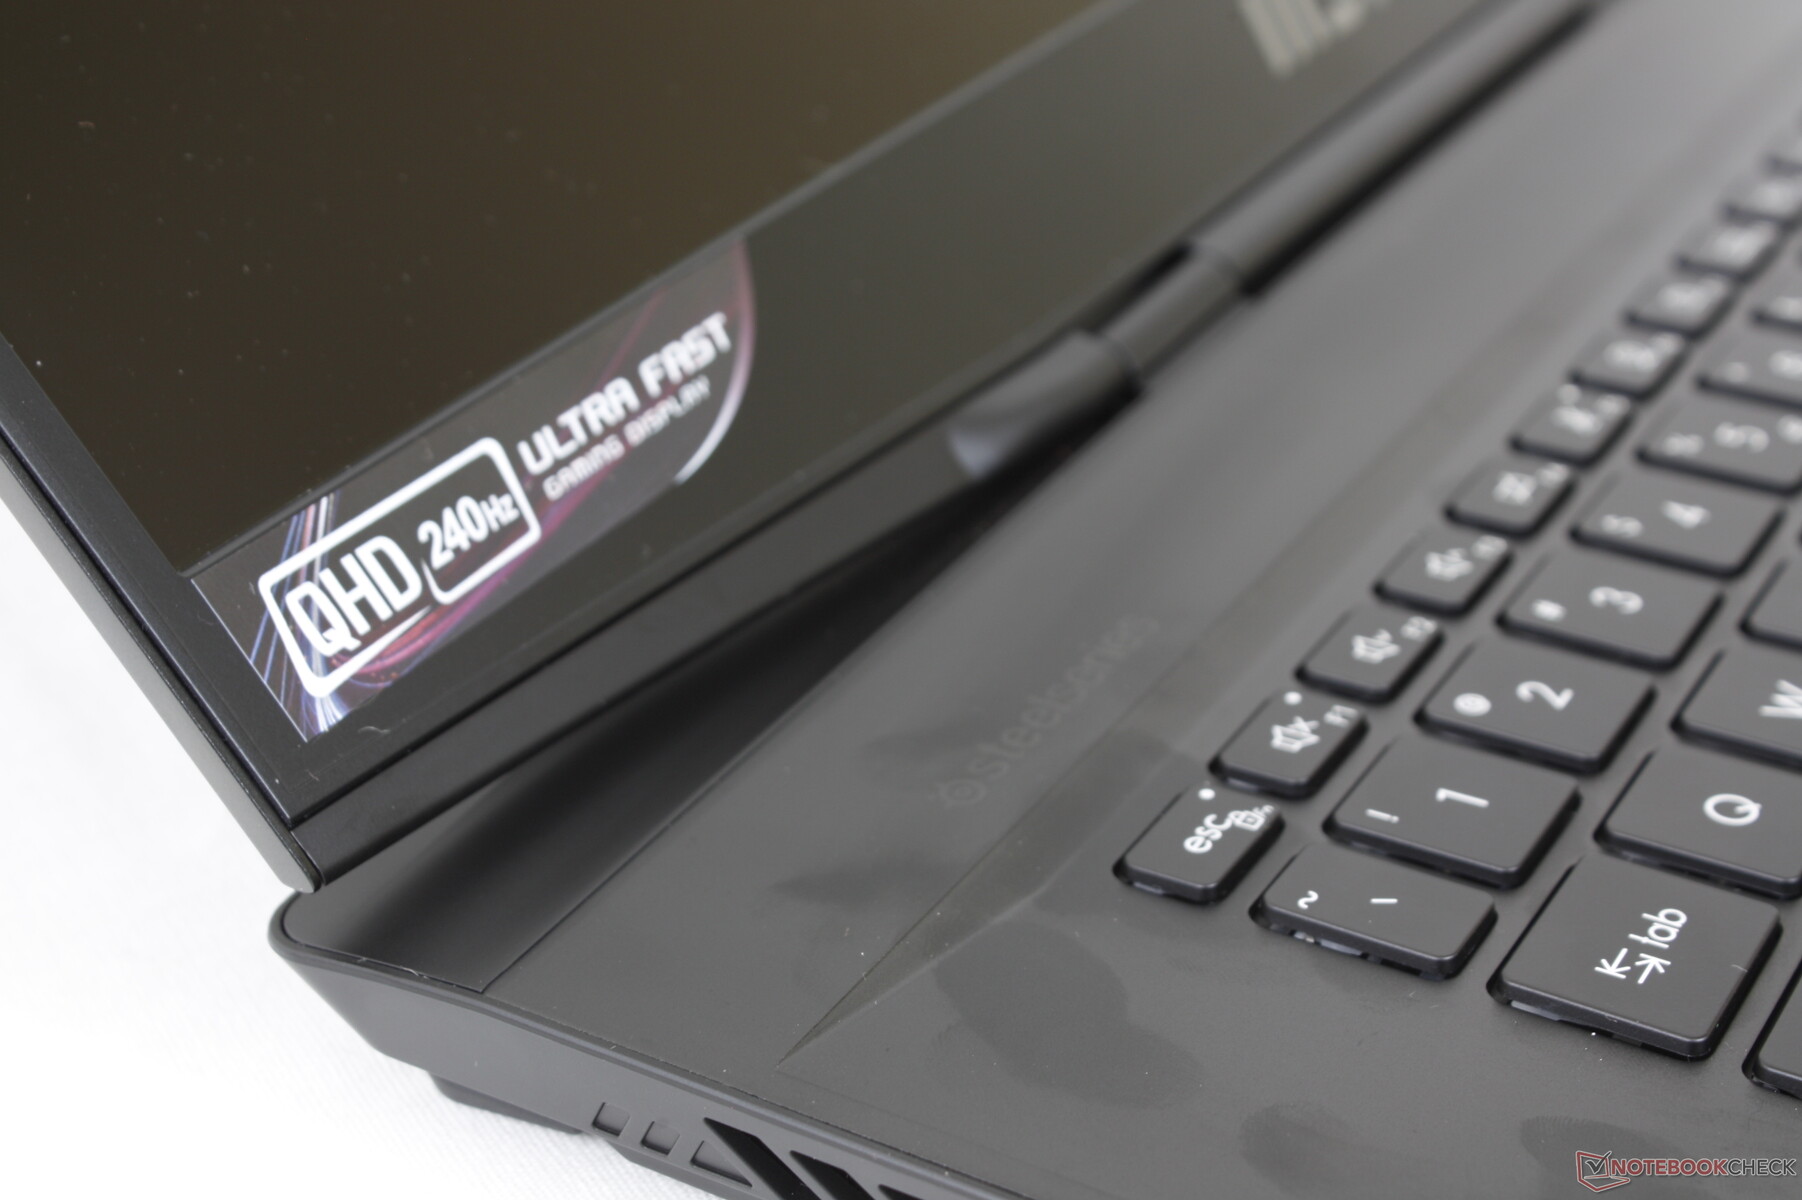
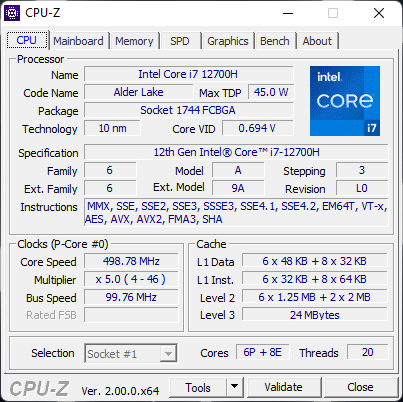
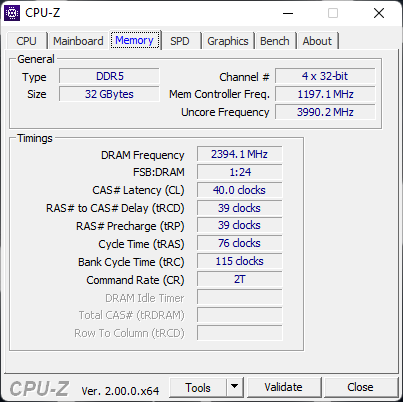
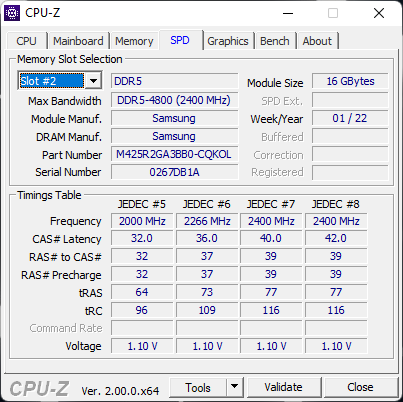
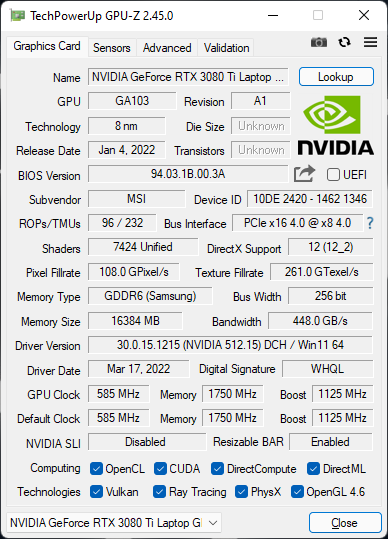
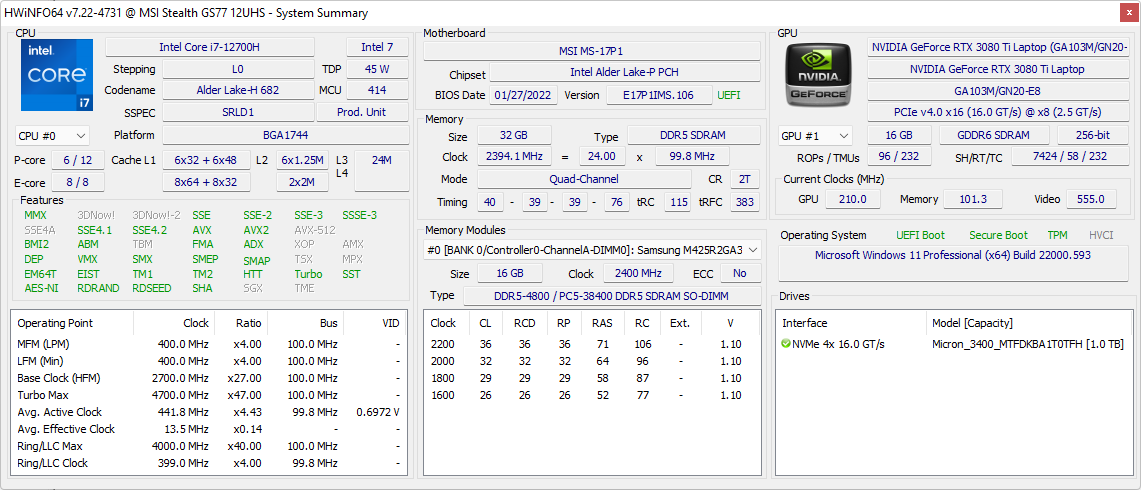
Nossa configuração em revisão vem cortesia do PC Xotic com uma CPU Core i7-12700H de 12ª geração, 105 W TGP GeForce RTX 3080 Ti GPU, 32 GB de DDR5-4800 RAM, 240 Hz 1440p IPS display, e um SSD PCIe4 x4 NVMe de 1 TB por aproximadamente $3700 USD no varejo. Outras SKUs estão disponíveis com os painéis Core i9-12900H, RTX 3070 Ti, RTX 3080, 360 Hz FHD, ou 120 Hz UHD
Os modelos concorrentes incluem outros ultramarinos no Lâmina Razer 17, Dell Alienware x17,Asus ROG Zephyrus S17e Gigabyte Aorus 17 série
Mais revisões da MSI
Potenziali concorrenti a confronto
Avaliação | Data | Modelo | Peso | Altura | Size | Resolução | Preço |
|---|---|---|---|---|---|---|---|
| 87.2 % v7 (old) | 04/2022 | MSI Stealth GS77 12UHS-083US i7-12700H, GeForce RTX 3080 Ti Laptop GPU | 2.9 kg | 20.8 mm | 17.30" | 2560x1440 | |
| 86.2 % v7 (old) | 09/2021 | MSI GS76 Stealth 11UH i9-11900H, GeForce RTX 3080 Laptop GPU | 2.4 kg | 20 mm | 17.30" | 3840x2160 | |
| 91.2 % v7 (old) | 03/2022 | Razer Blade 17 RTX 3080 Ti i7-12800H, GeForce RTX 3080 Ti Laptop GPU | 2.7 kg | 19.9 mm | 17.30" | 2560x1440 | |
| 87.5 % v7 (old) | 01/2022 | MSI GE76 Raider i9-12900HK, GeForce RTX 3080 Ti Laptop GPU | 3 kg | 26 mm | 17.30" | 1920x1080 | |
| 89 % v7 (old) | 09/2021 | Alienware x17 RTX 3080 P48E i7-11800H, GeForce RTX 3080 Laptop GPU | 3.2 kg | 21.4 mm | 17.30" | 3840x2160 | |
| 90.1 % v7 (old) | 07/2021 | Asus ROG Zephyrus S17 GX703HSD i9-11900H, GeForce RTX 3080 Laptop GPU | 2.8 kg | 19.9 mm | 17.30" | 2560x1440 |
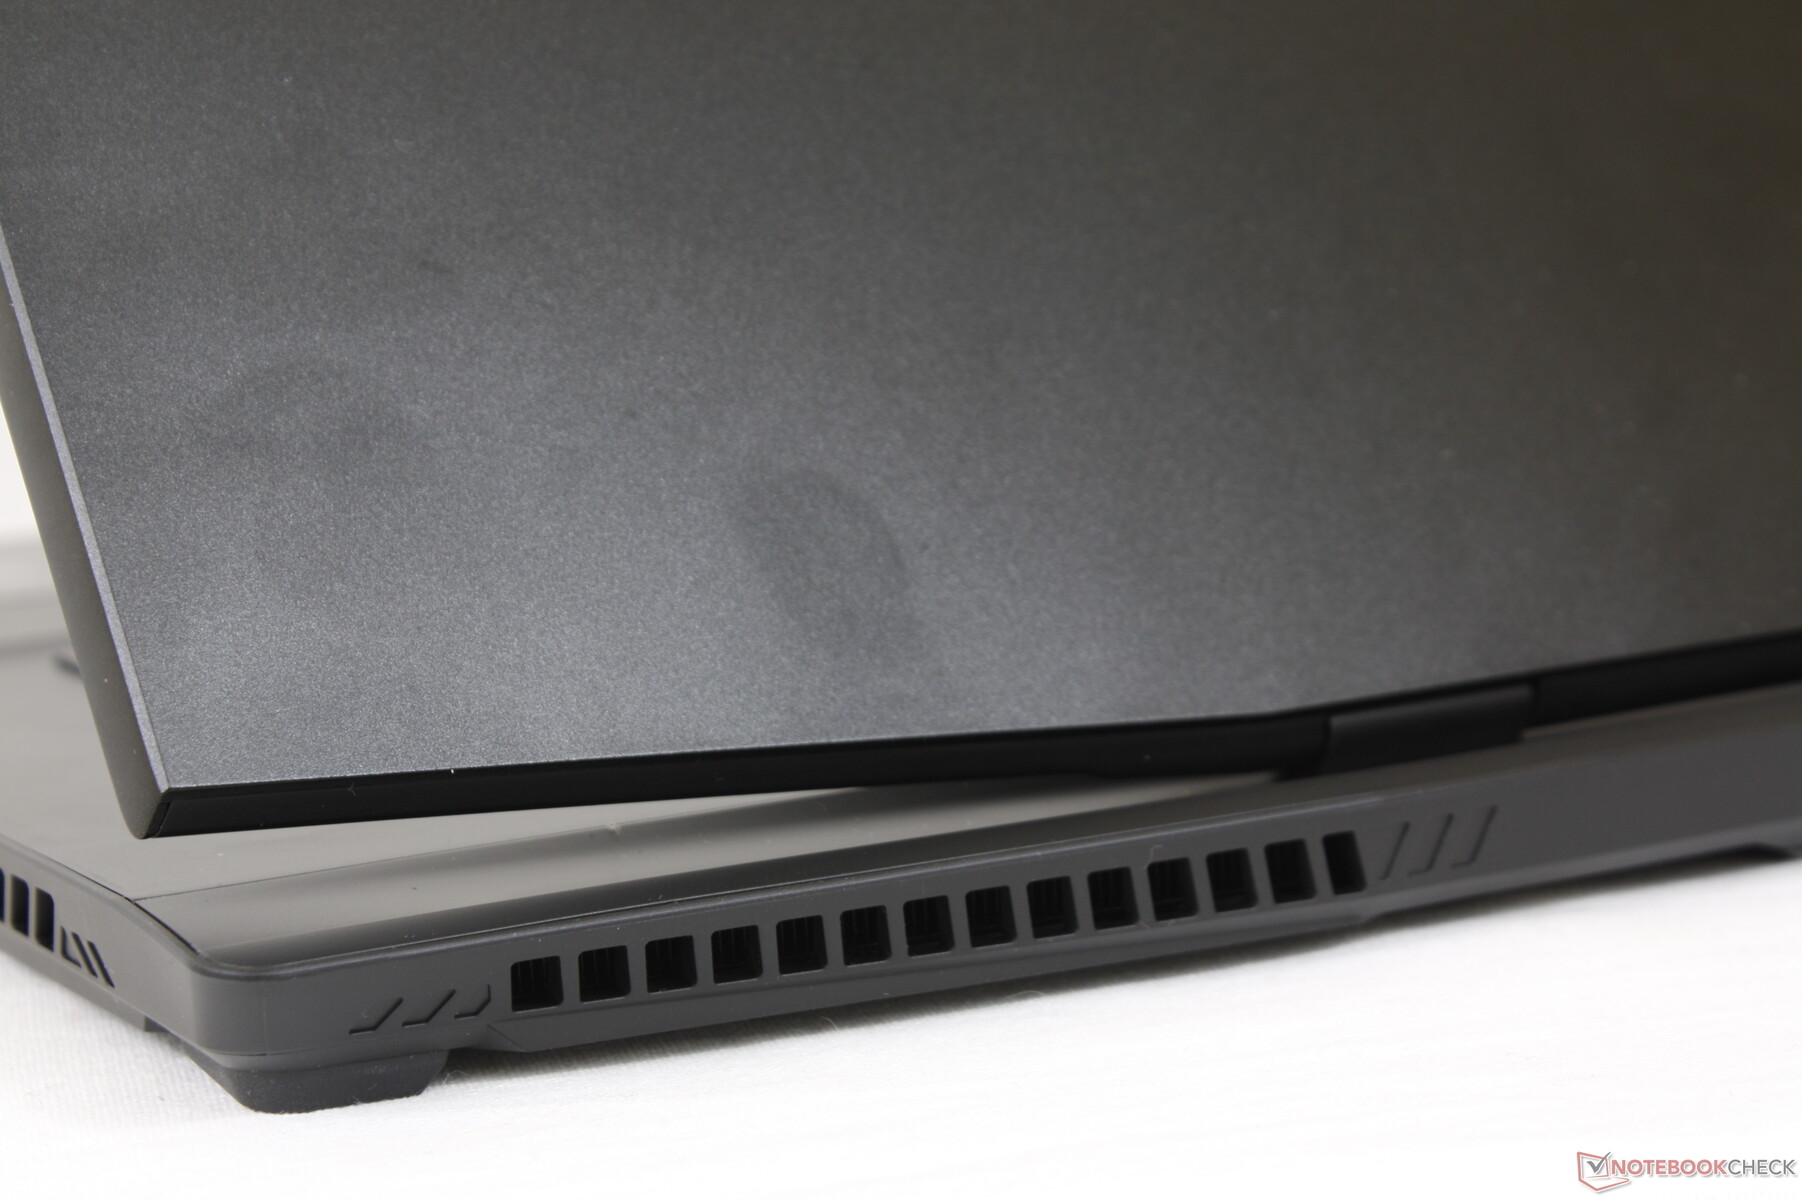
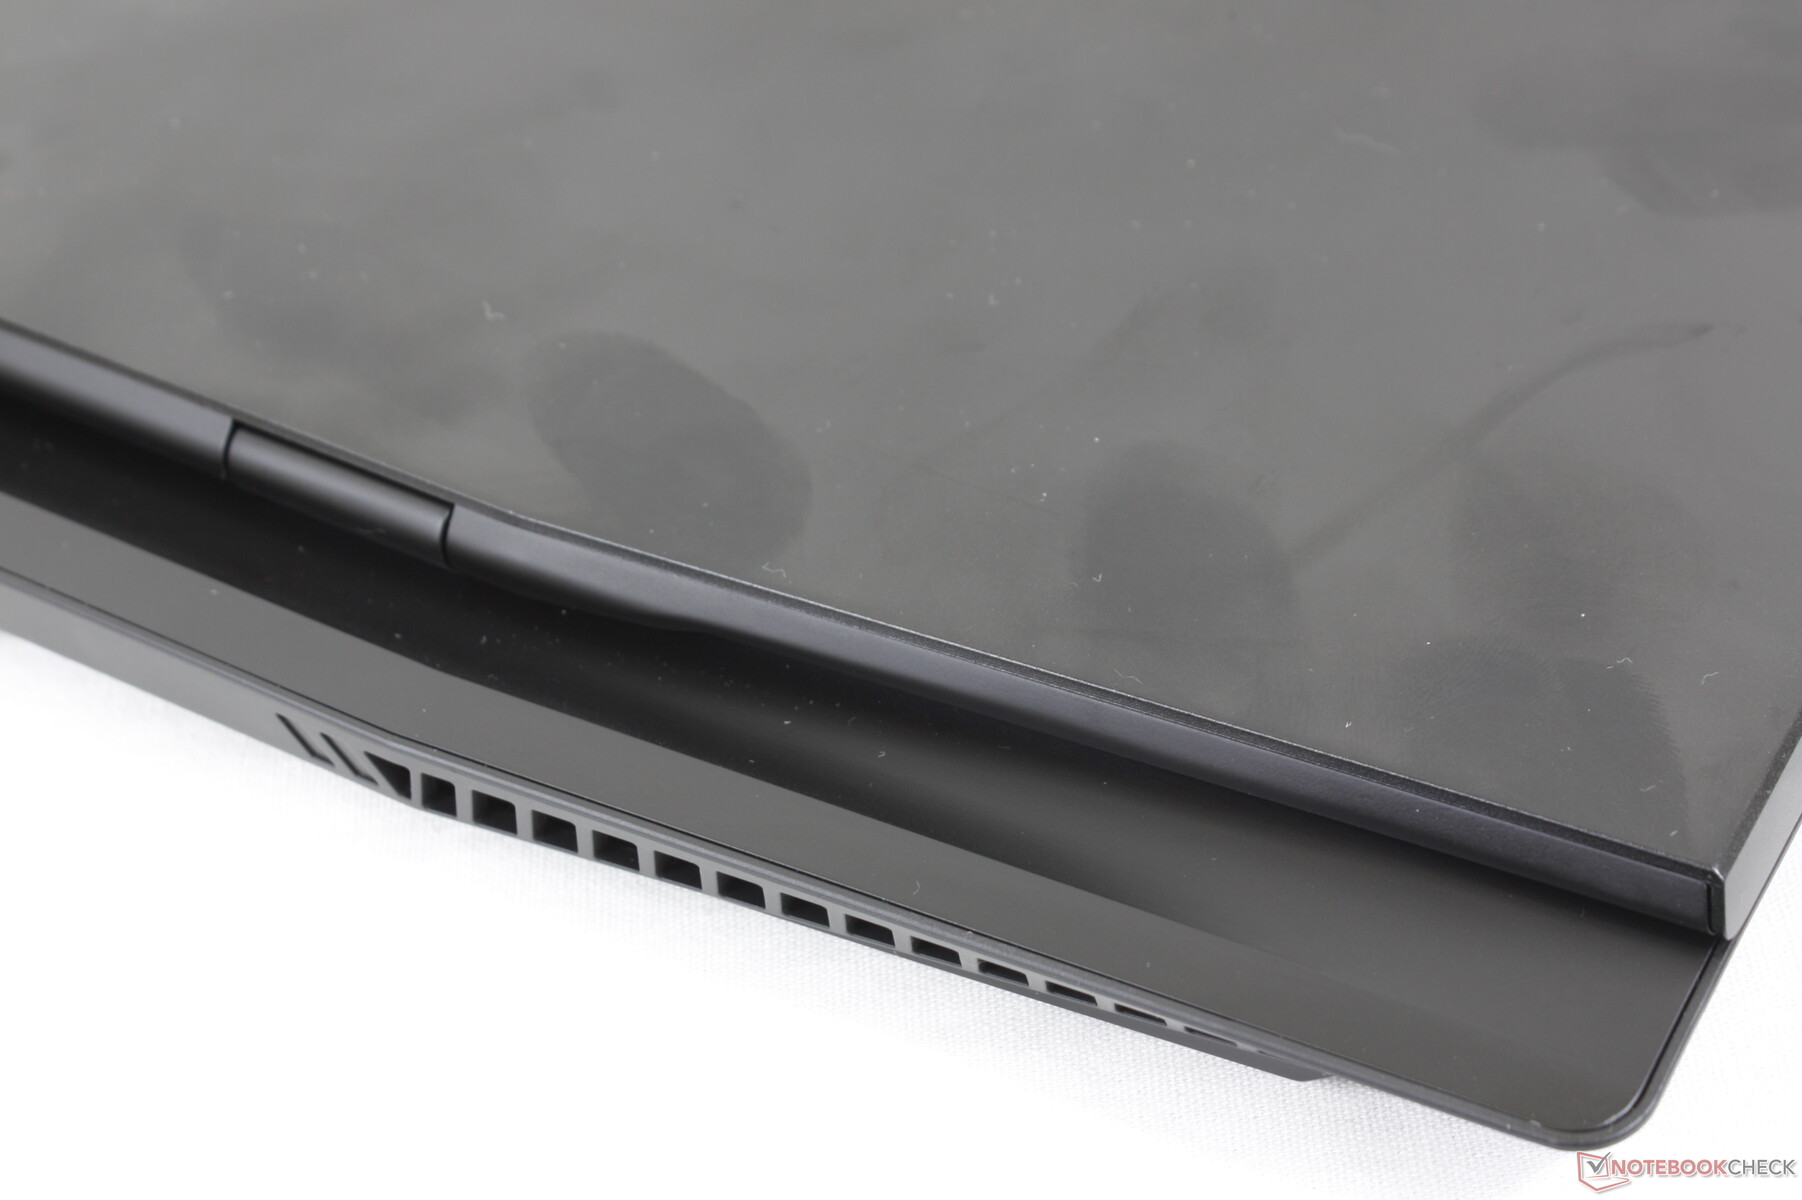
Estojo - Maior, mais pesado, mais duro
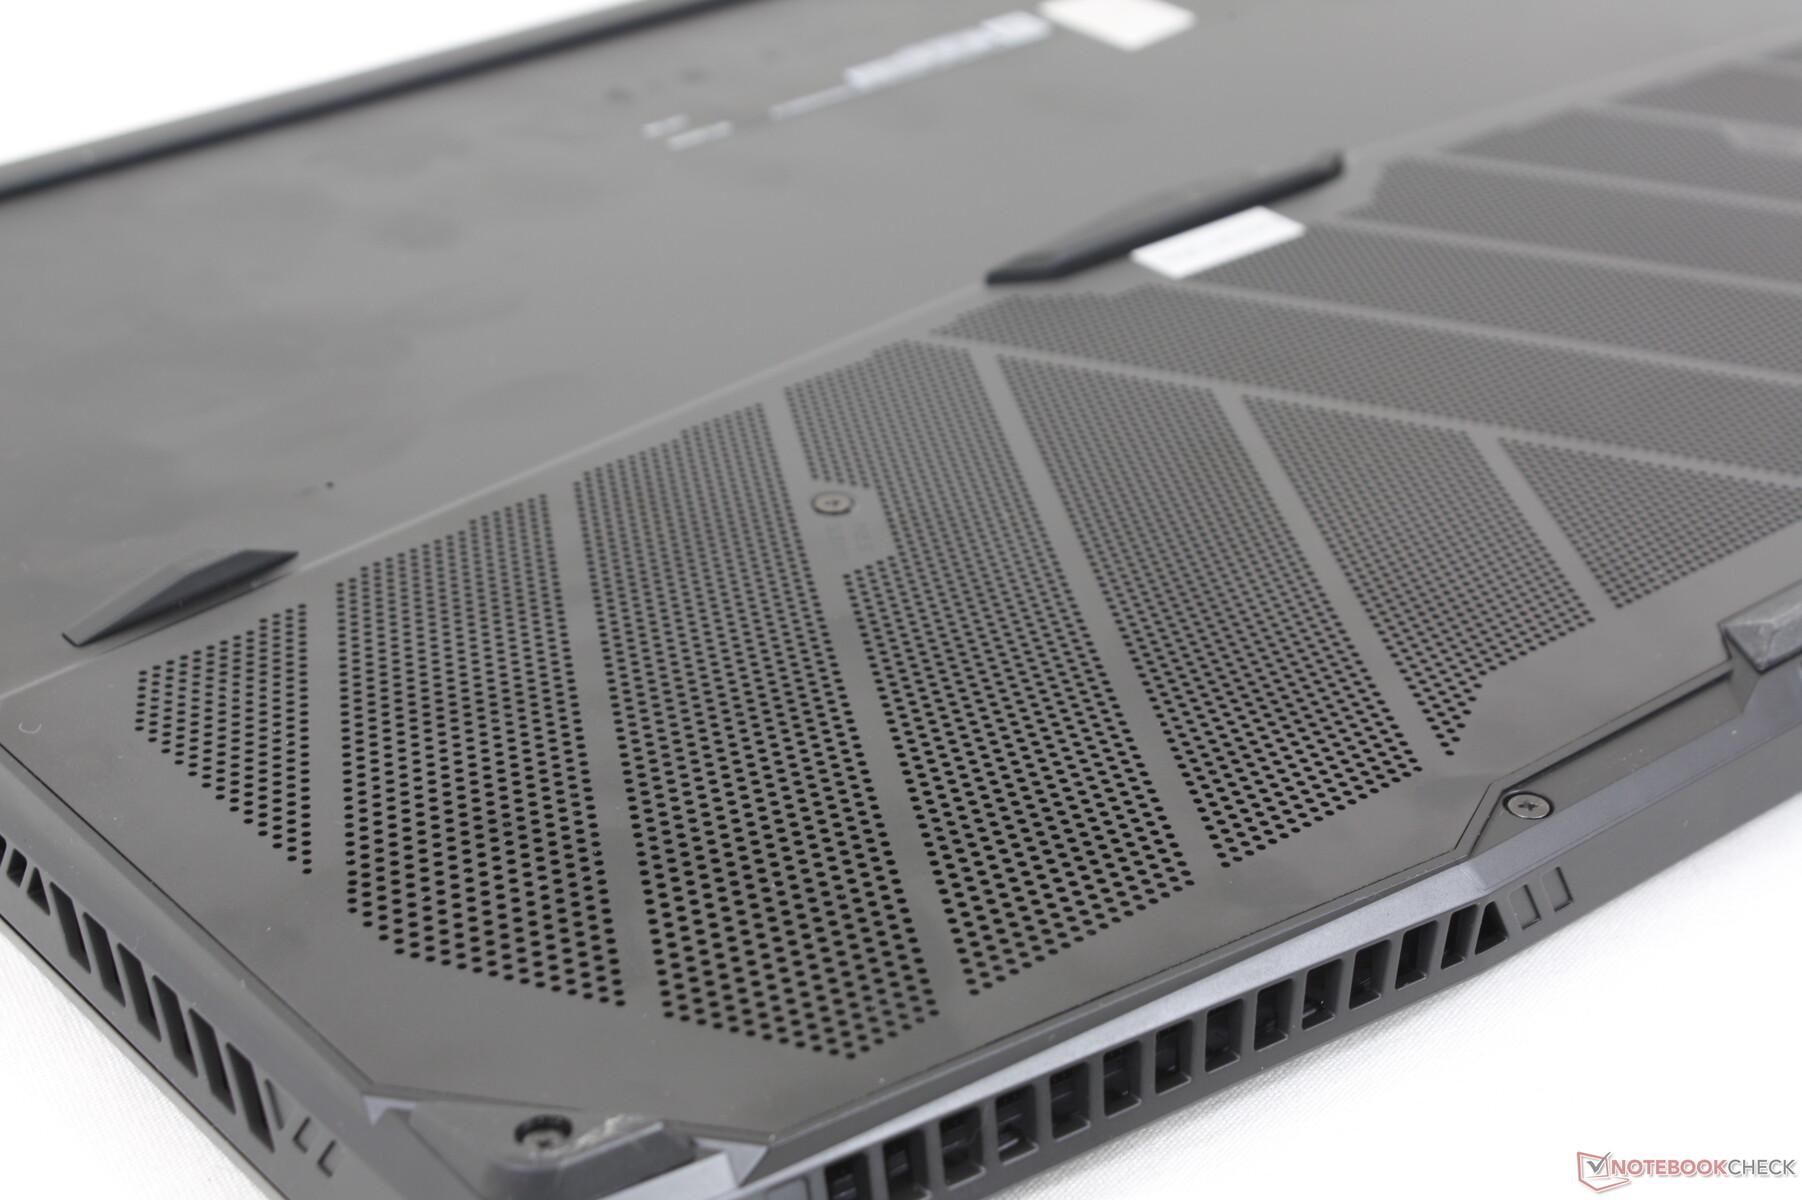
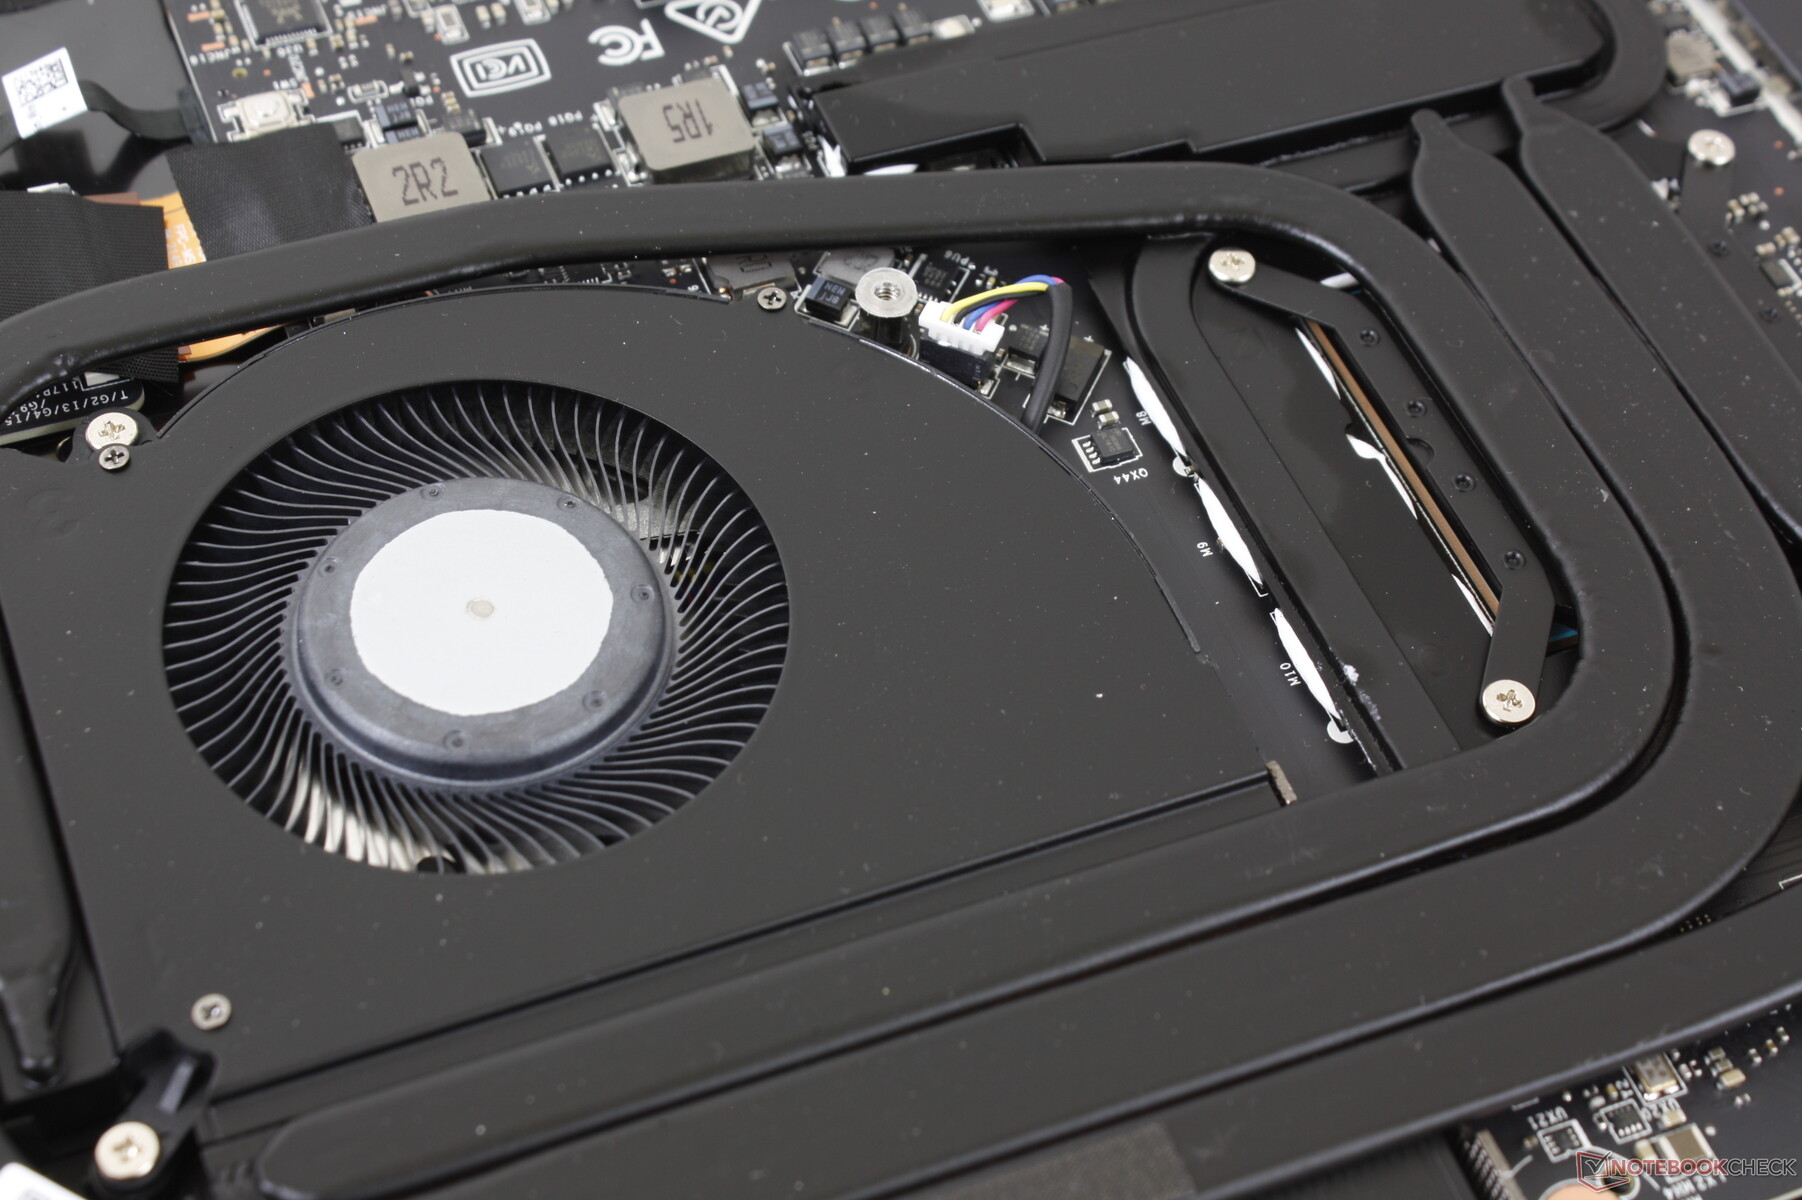
Uma de nossas maiores reclamações sobre o GS76 foi que ele sacrificou muito o desempenho por um fator de forma mais fino e leve. O GS77 redesenhado tratou disso introduzindo um motor a jato protuberante traseiro muito parecido com o da série Alienware x17 ou MSI GT. Estamos felizes em ver que a rigidez do chassi também melhorou, pois tanto a base quanto a tampa são mais resistentes a quaisquer torções ou depressões do que antes.
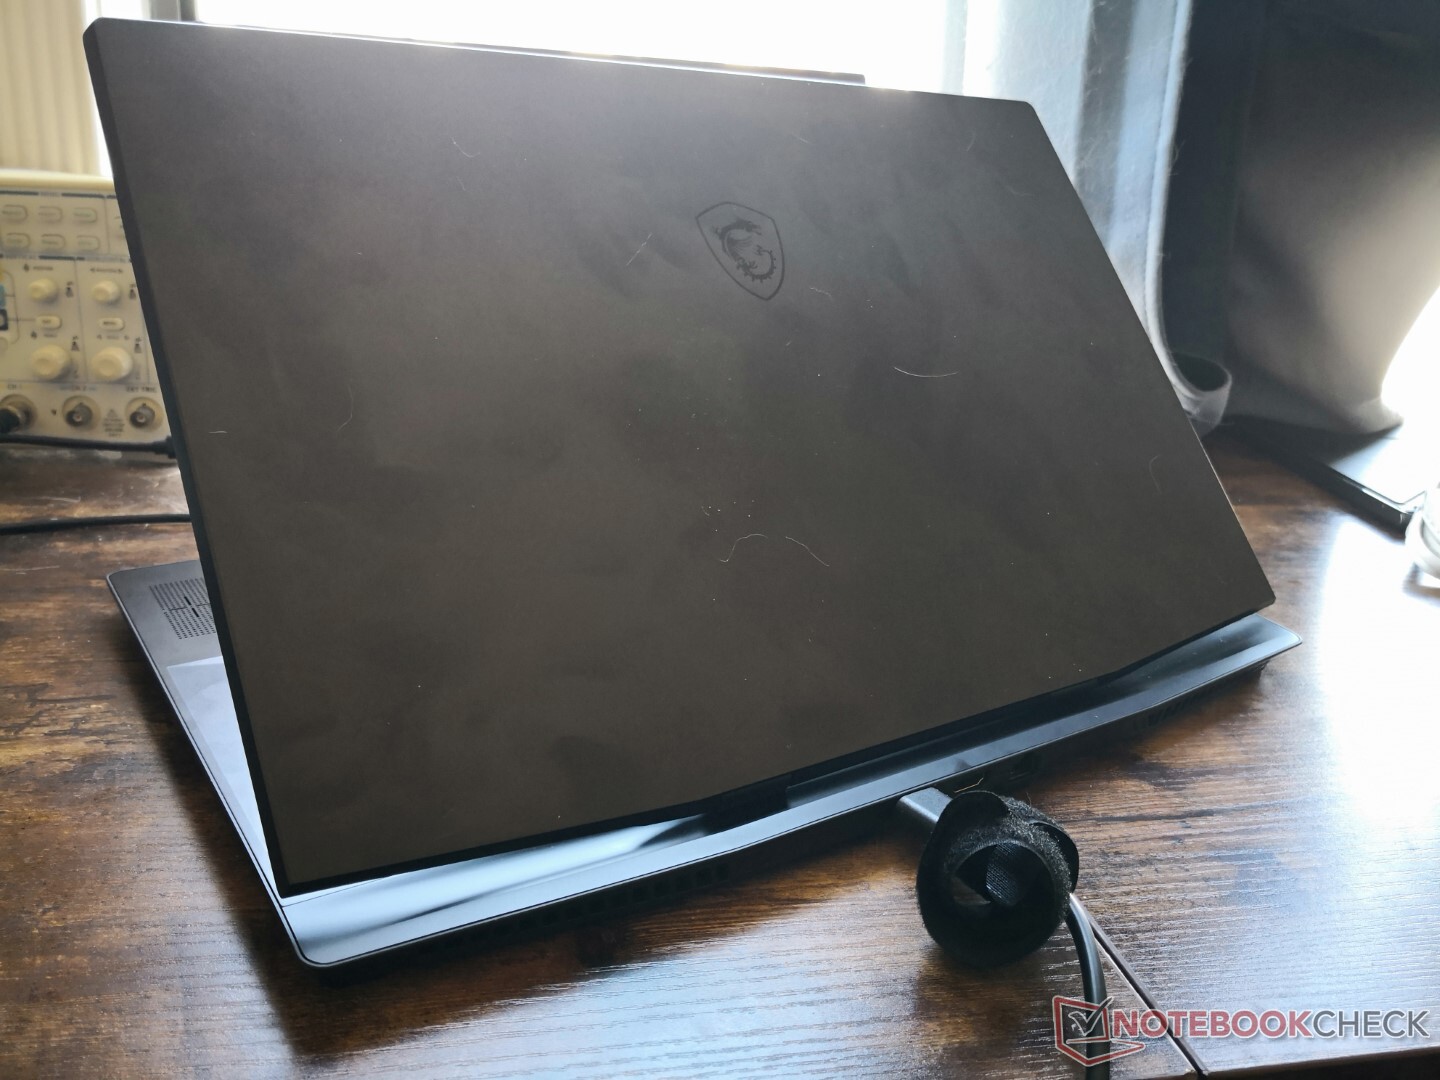
Em uma interessante reviravolta de eventos, o GS77 é visivelmente maior e mais pesado que o antigo GS76 por 14% e 21%, respectivamente. O aumento de tamanho e peso pode ser atribuído principalmente à parte traseira maior do GS77 e ao esqueleto mais grosso em geral. O modelo fica entre o Blade 17 e o Alienware x17, tanto em tamanho quanto em peso, como resultado. Em comparação, o antigo GS75 era significativamente mais leve em mais de 600 gramas.
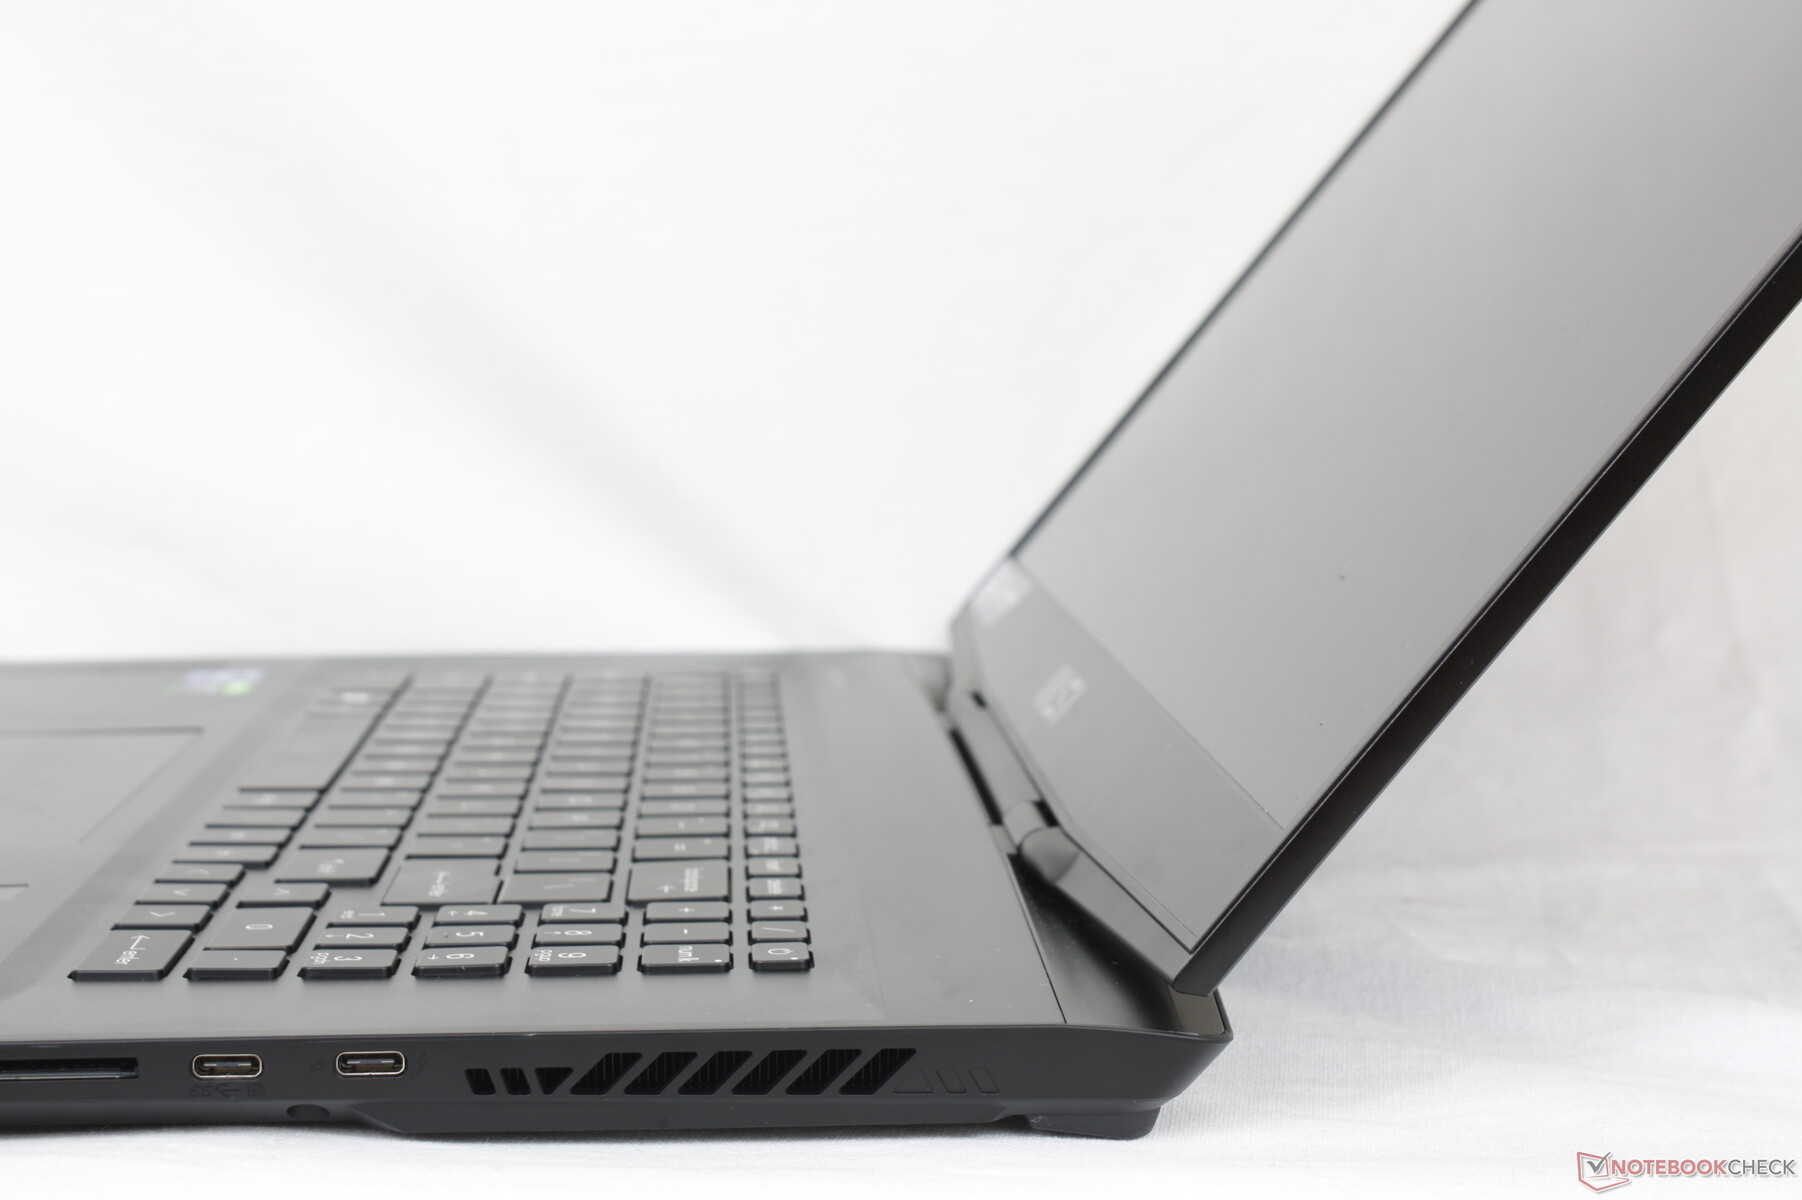
Conectividade - O mesmo de antes
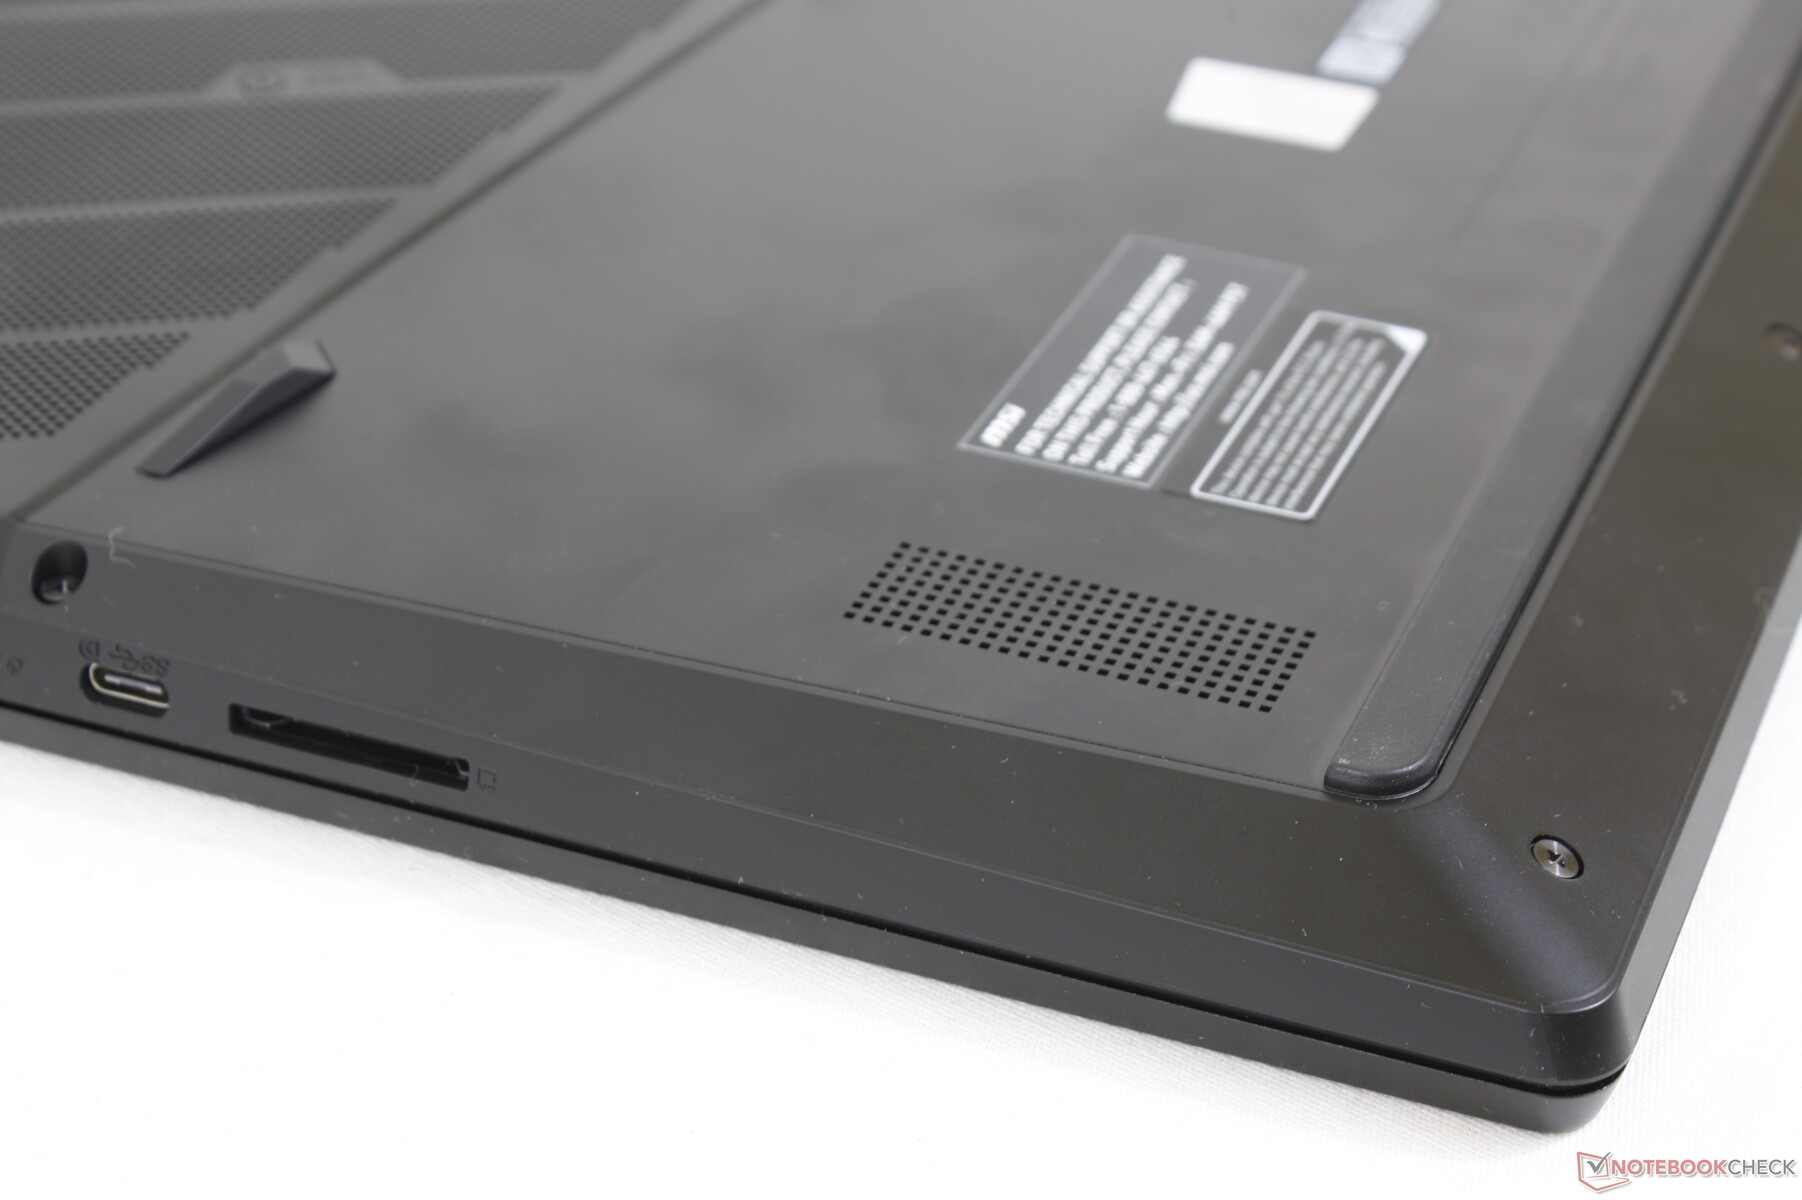
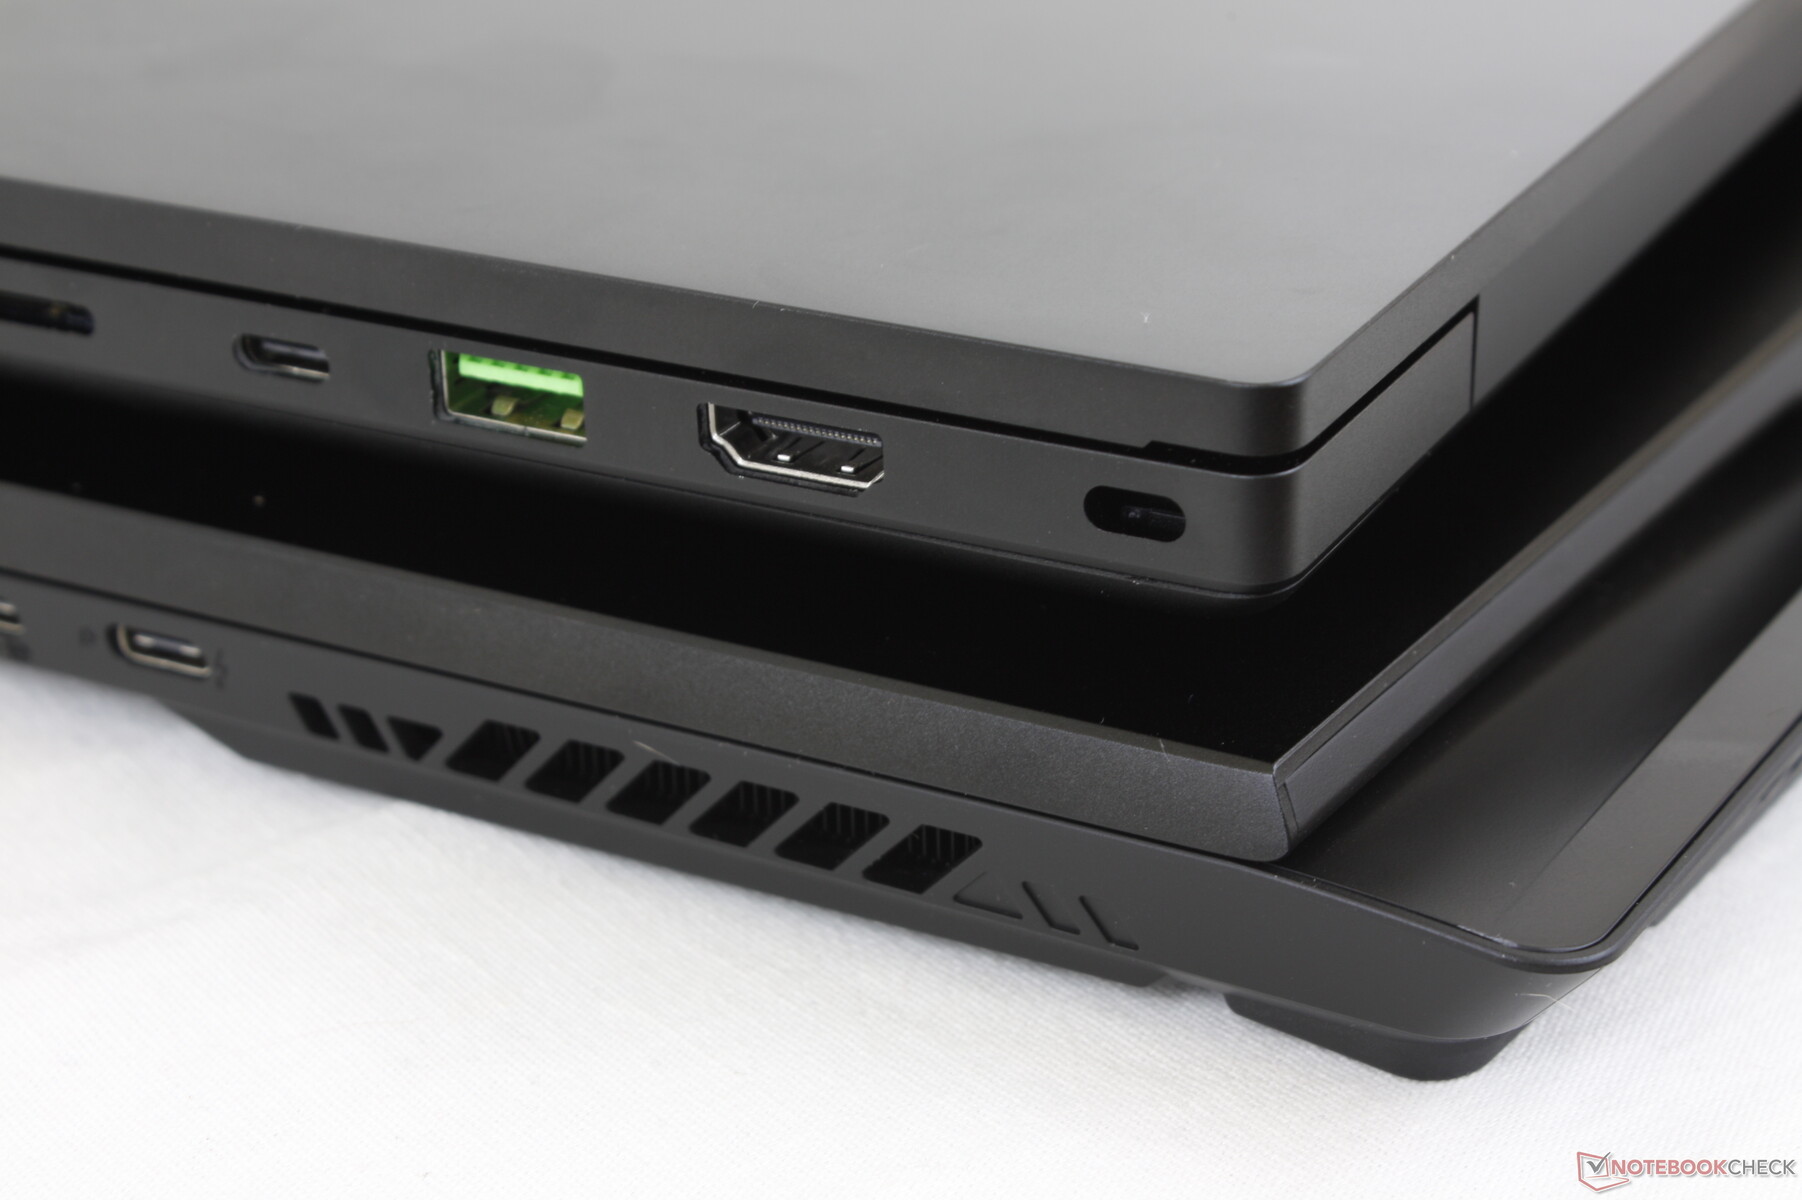
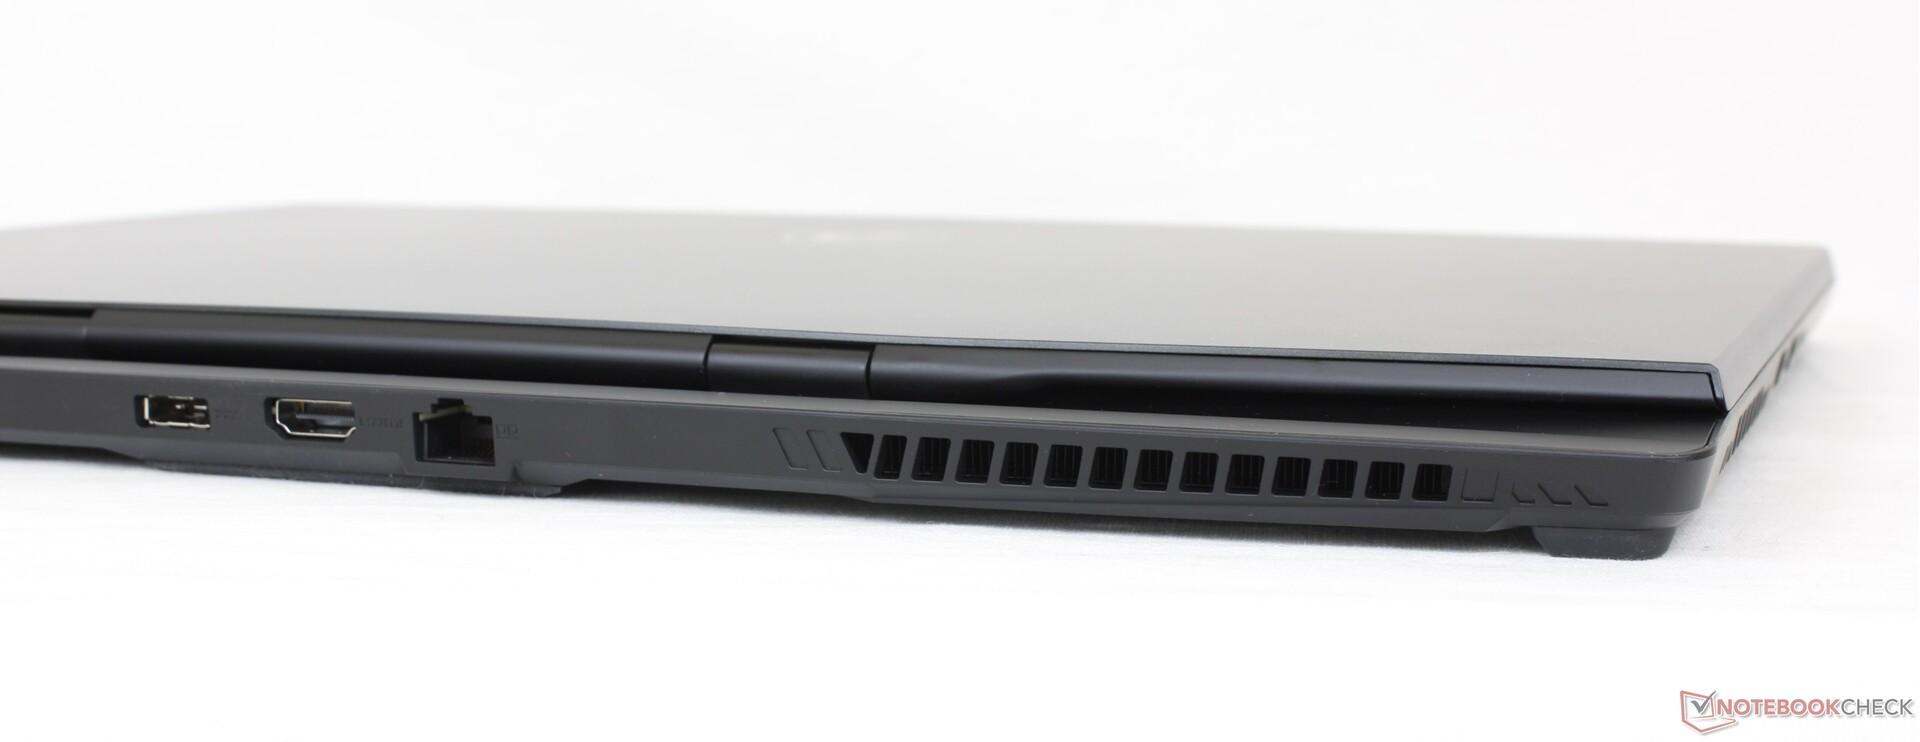
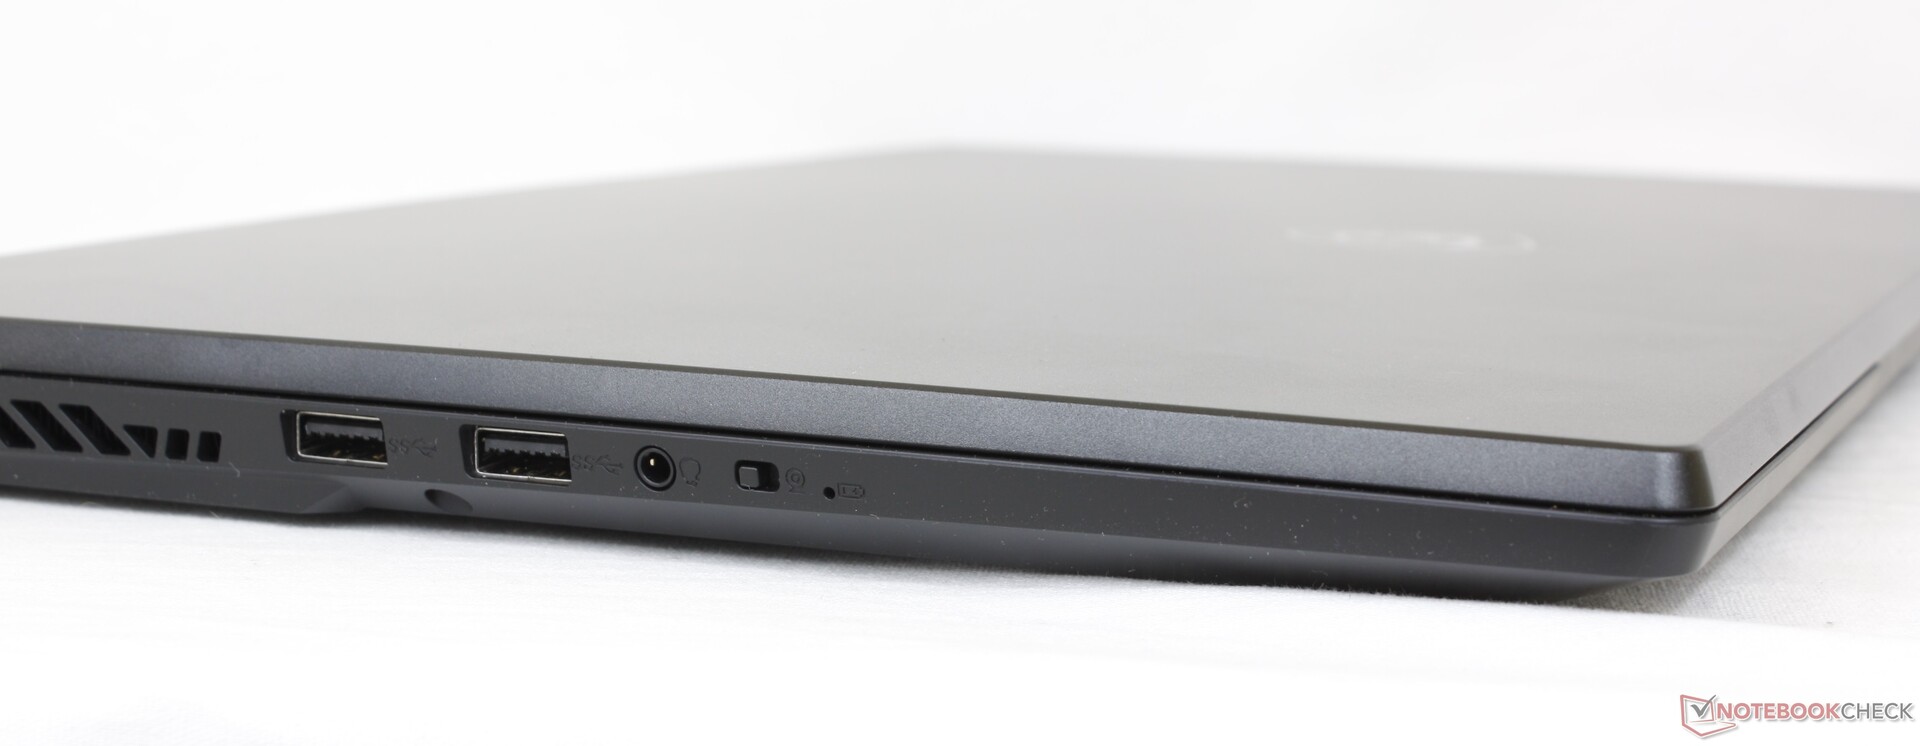
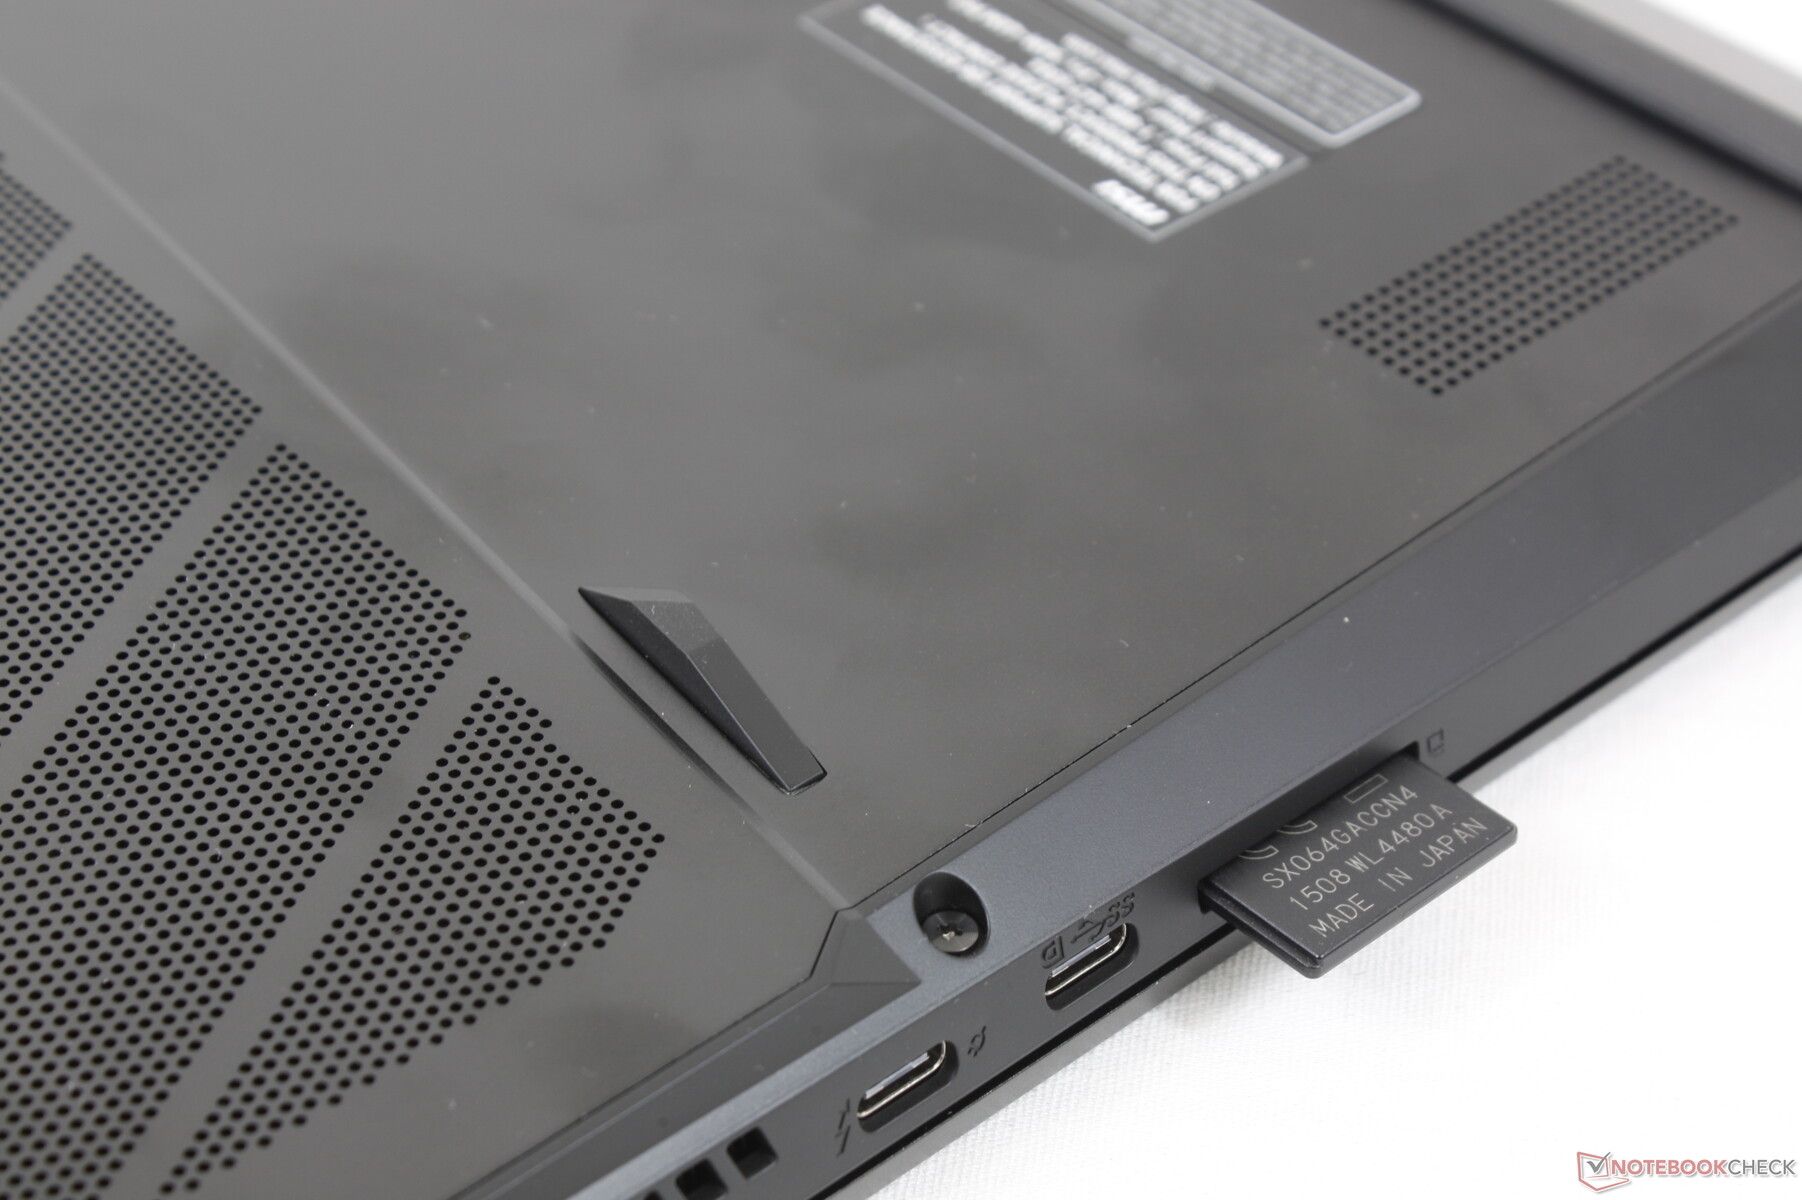
As opções de porta são idênticas às do GS76, embora rearranjadas. Enquanto o GS76 não tinha portas ao longo de sua traseira, o GS77 tem uma distribuição mais uniforme: 3 à esquerda, 3 à direita e 3 ao fundo.
Os usuários devem observar que apenas uma das duas portas USB-C ao longo da borda direita suporta Thunderbolt como no GS76. Além disso, a porta do adaptador AC mudou e, portanto, os adaptadores AC mais antigos não são compatíveis.
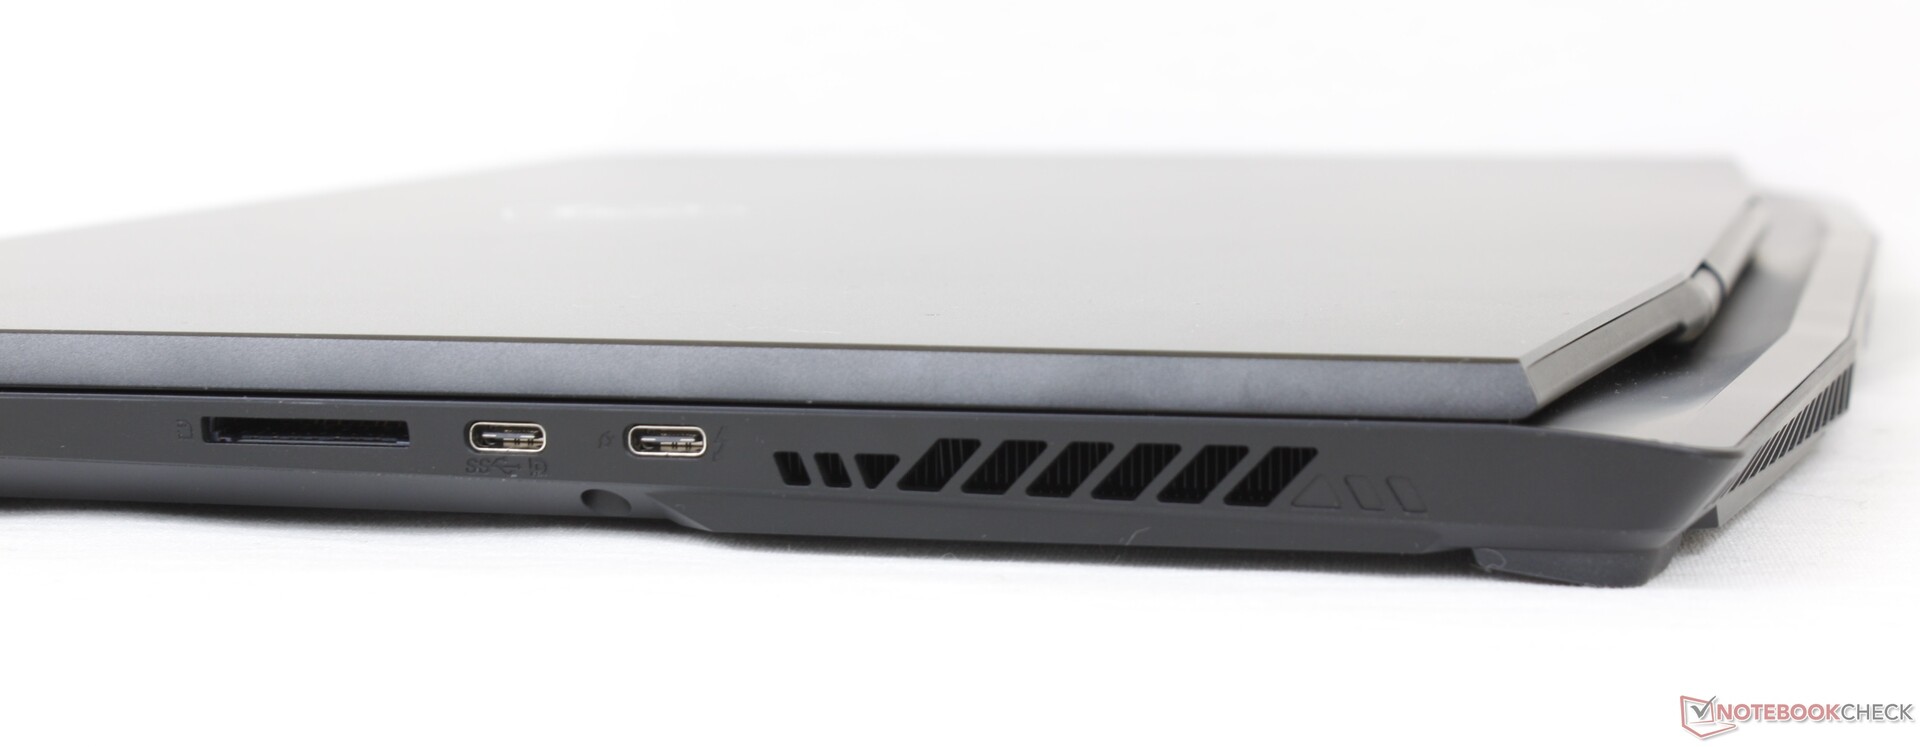
Leitor de cartões SD
A MSI reduziu para mais da metade a velocidade de seu leitor SD integrado da última geração GS76. A mudança de 1 GB de fotos de nosso cartão de teste UHS-II para o desktop em nosso GS77 leva cerca de 14 segundos em comparação a apenas 5 a 6 segundos no GS76. Os usuários que confiam freqüentemente no leitor SD podem ficar desapontados com esta redução de qualidade.
| SD Card Reader | |
| average JPG Copy Test (av. of 3 runs) | |
| MSI GS76 Stealth 11UH (AV PRO microSD 128 GB V60) | |
| Asus ROG Zephyrus S17 GX703HSD | |
| Alienware x17 RTX 3080 P48E (AV Pro V60) | |
| Razer Blade 17 RTX 3080 Ti (AV Pro V60) | |
| MSI Stealth GS77 12UHS-083US (AV Pro V60) | |
| maximum AS SSD Seq Read Test (1GB) | |
| Asus ROG Zephyrus S17 GX703HSD | |
| Alienware x17 RTX 3080 P48E (AV Pro V60) | |
| MSI GS76 Stealth 11UH (AV PRO microSD 128 GB V60) | |
| Razer Blade 17 RTX 3080 Ti (AV Pro V60) | |
| MSI Stealth GS77 12UHS-083US (AV Pro V60) | |
Comunicação
Webcam
A webcam foi melhorada de 720p no GS76 para 1080p no GS77 para uma imagem mais nítida em geral. IR é suportado para Windows Olá e um obturador eletrônico é acessível ao longo da borda esquerda.


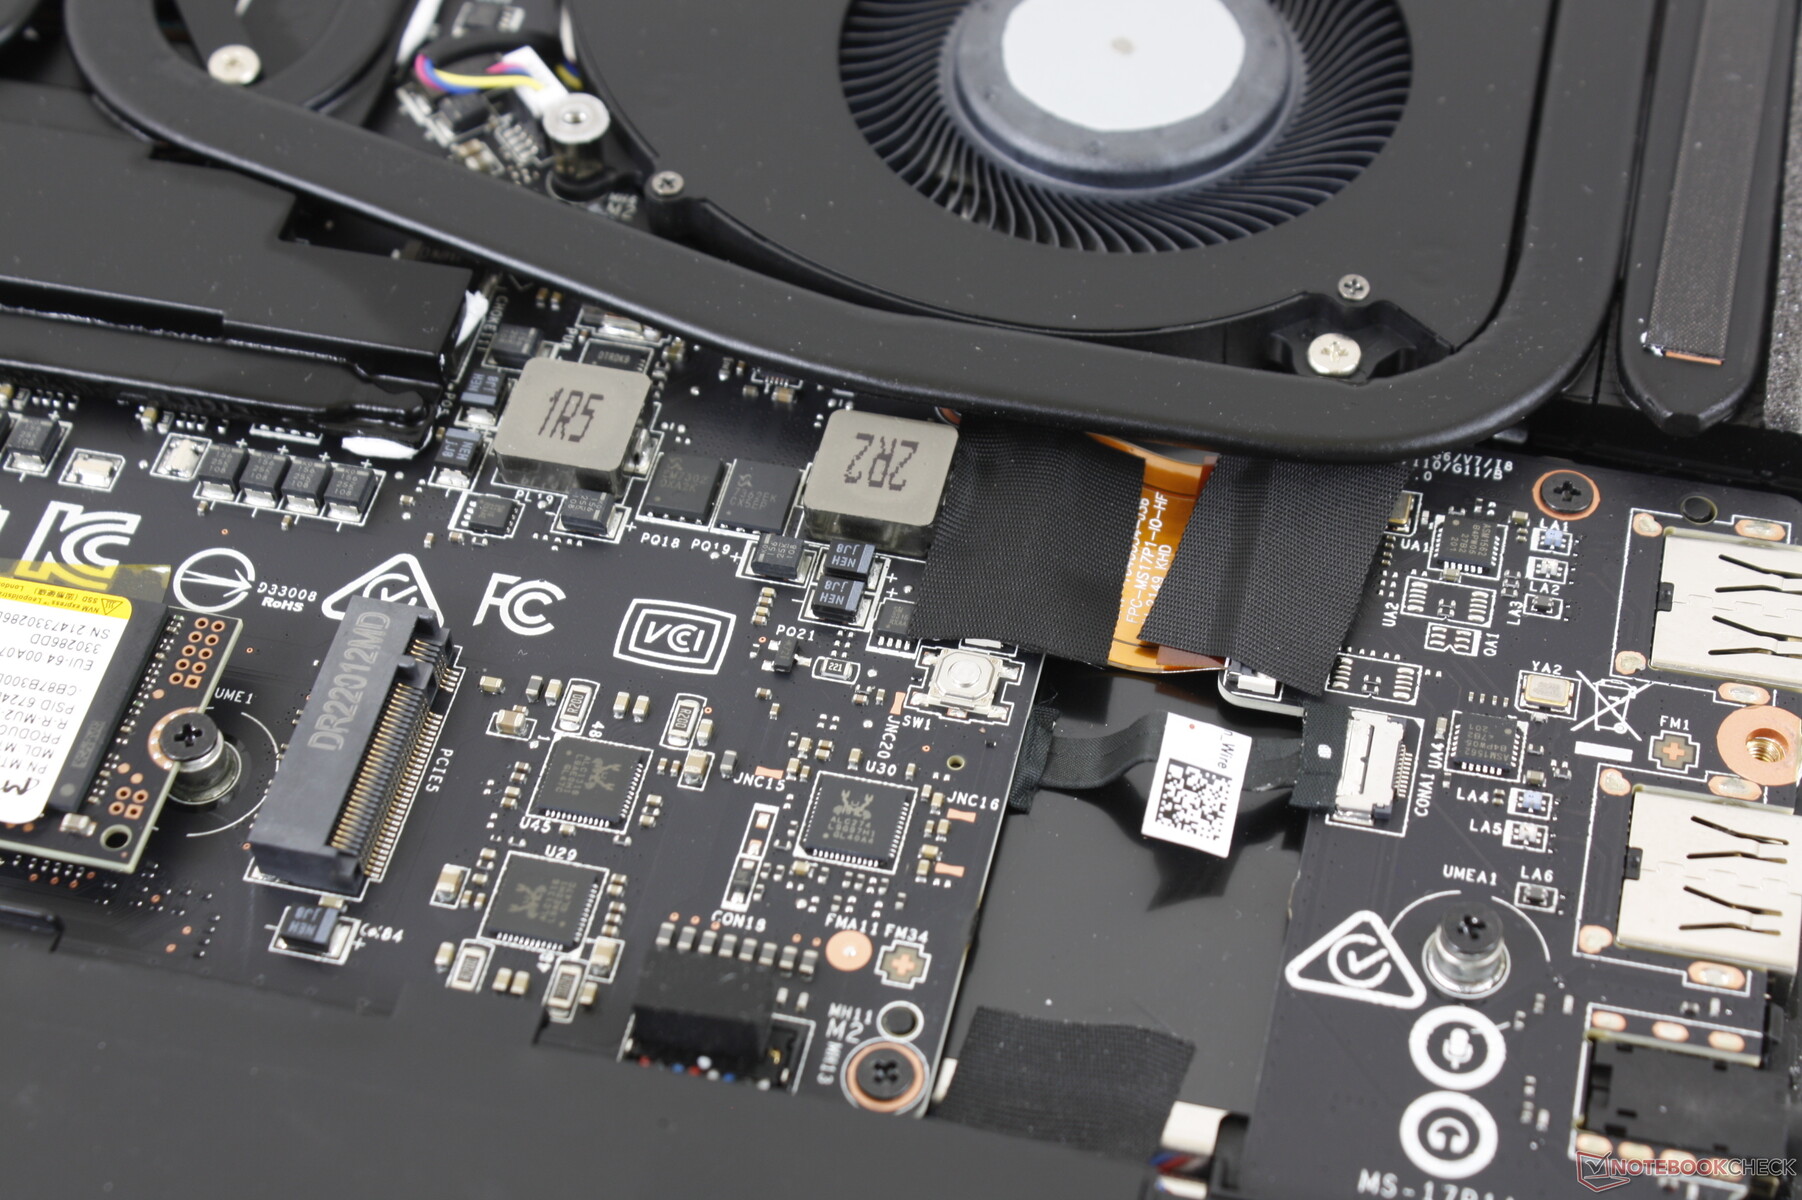
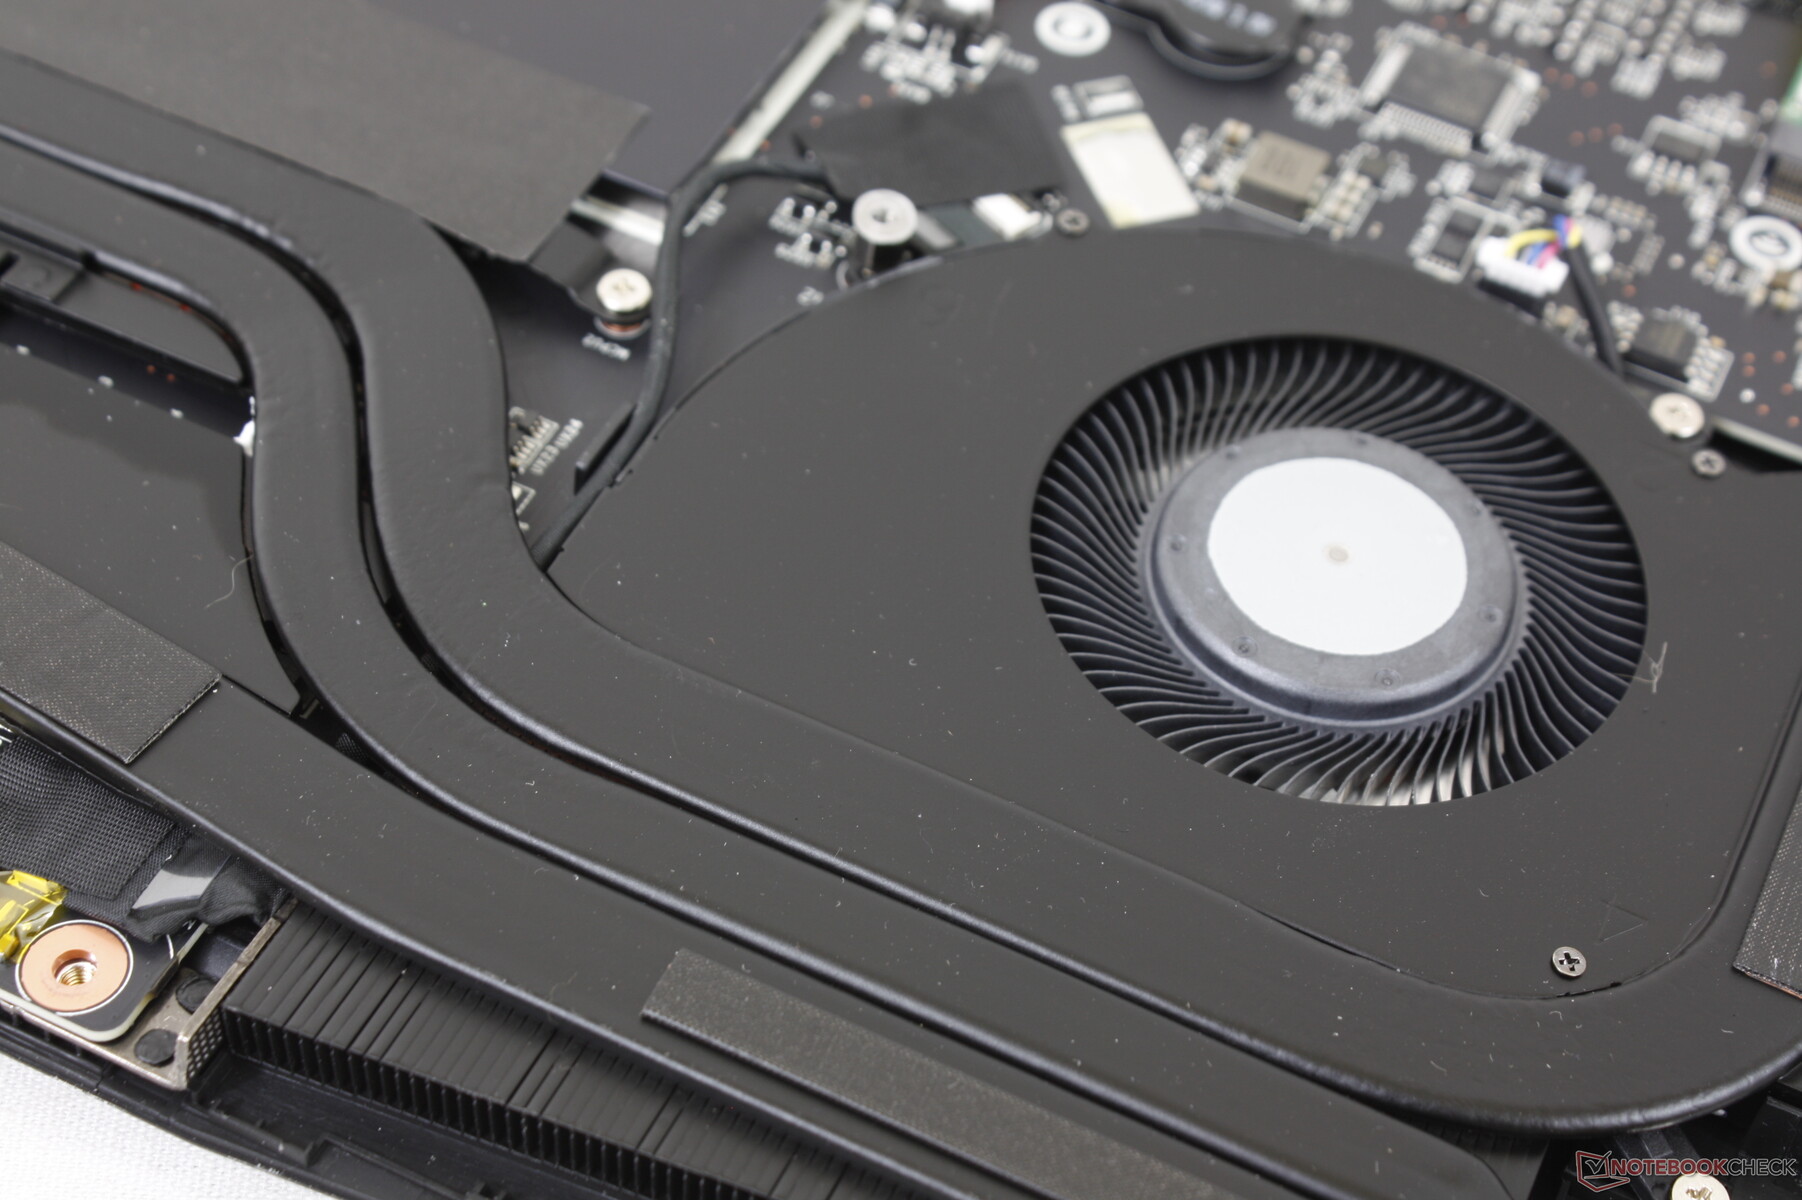
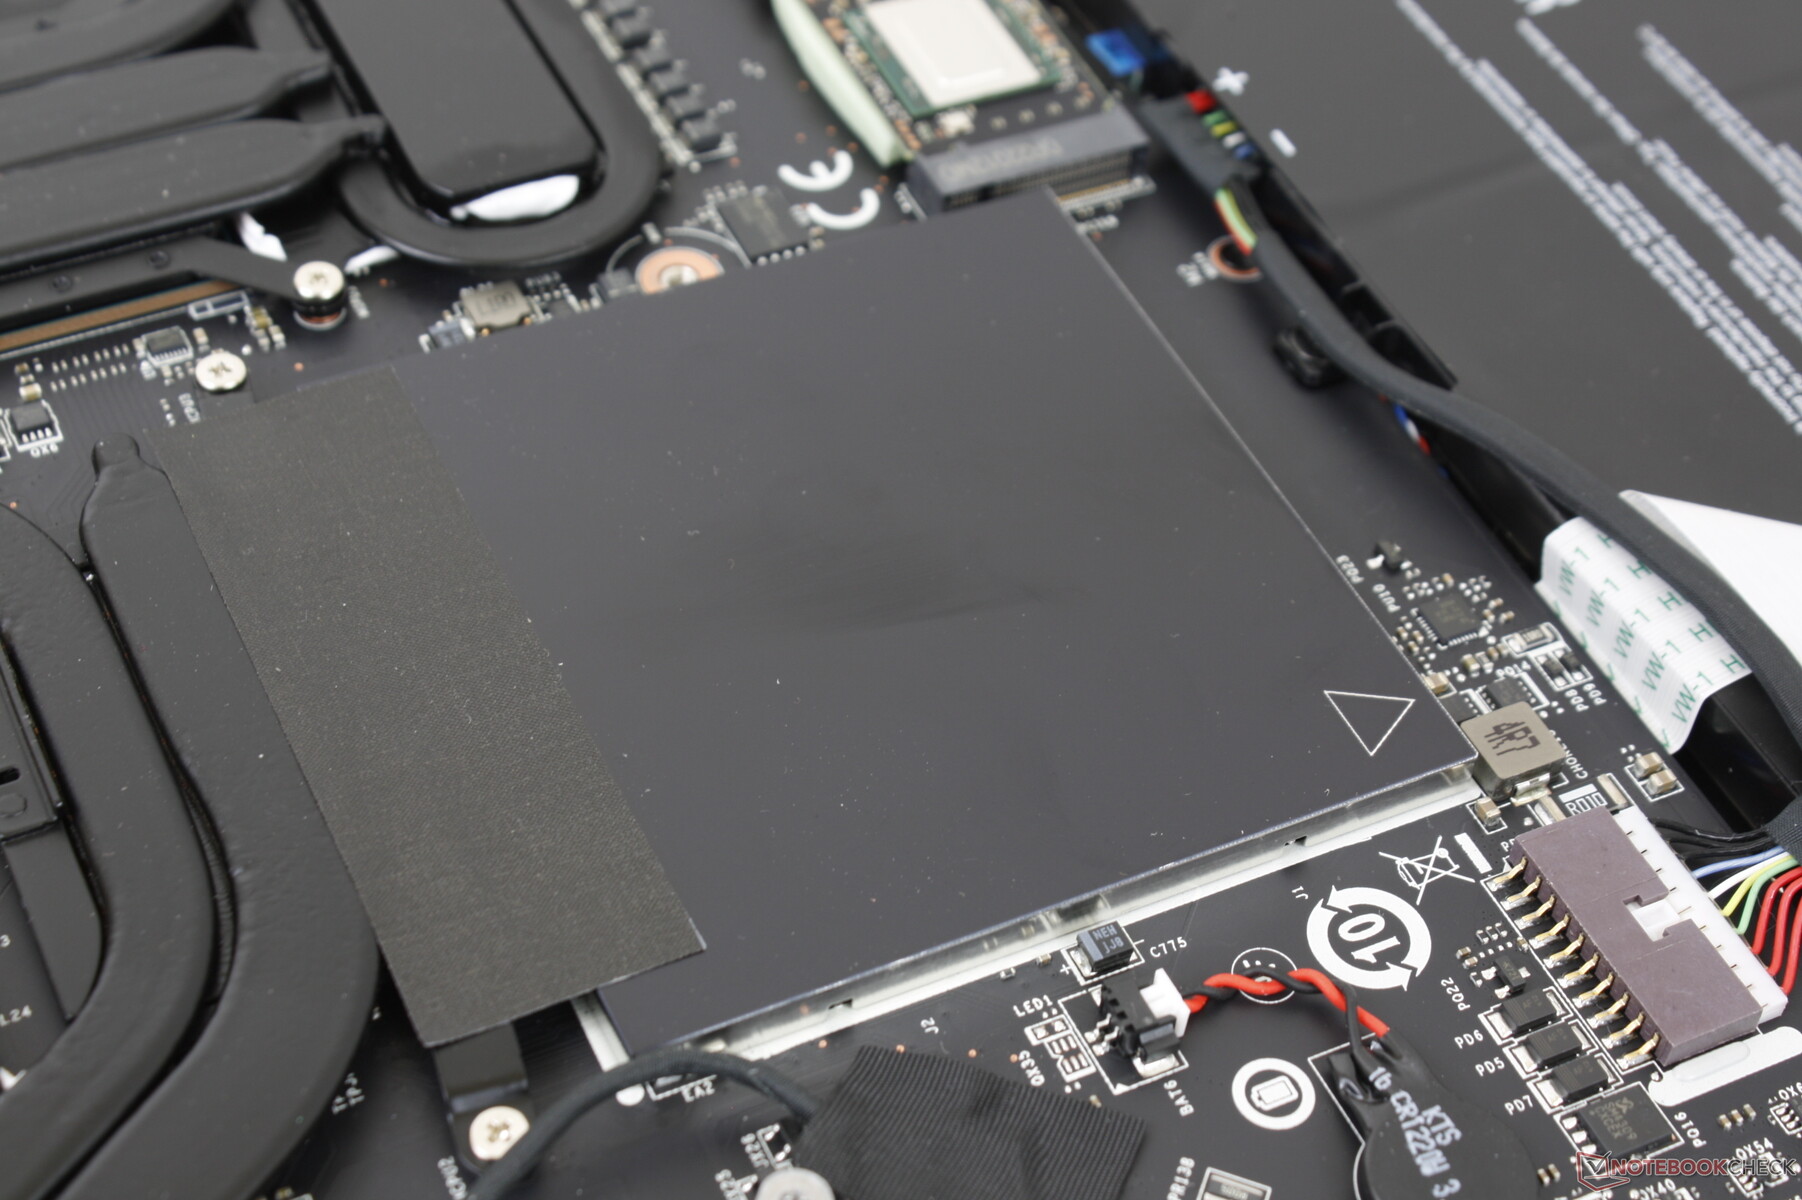
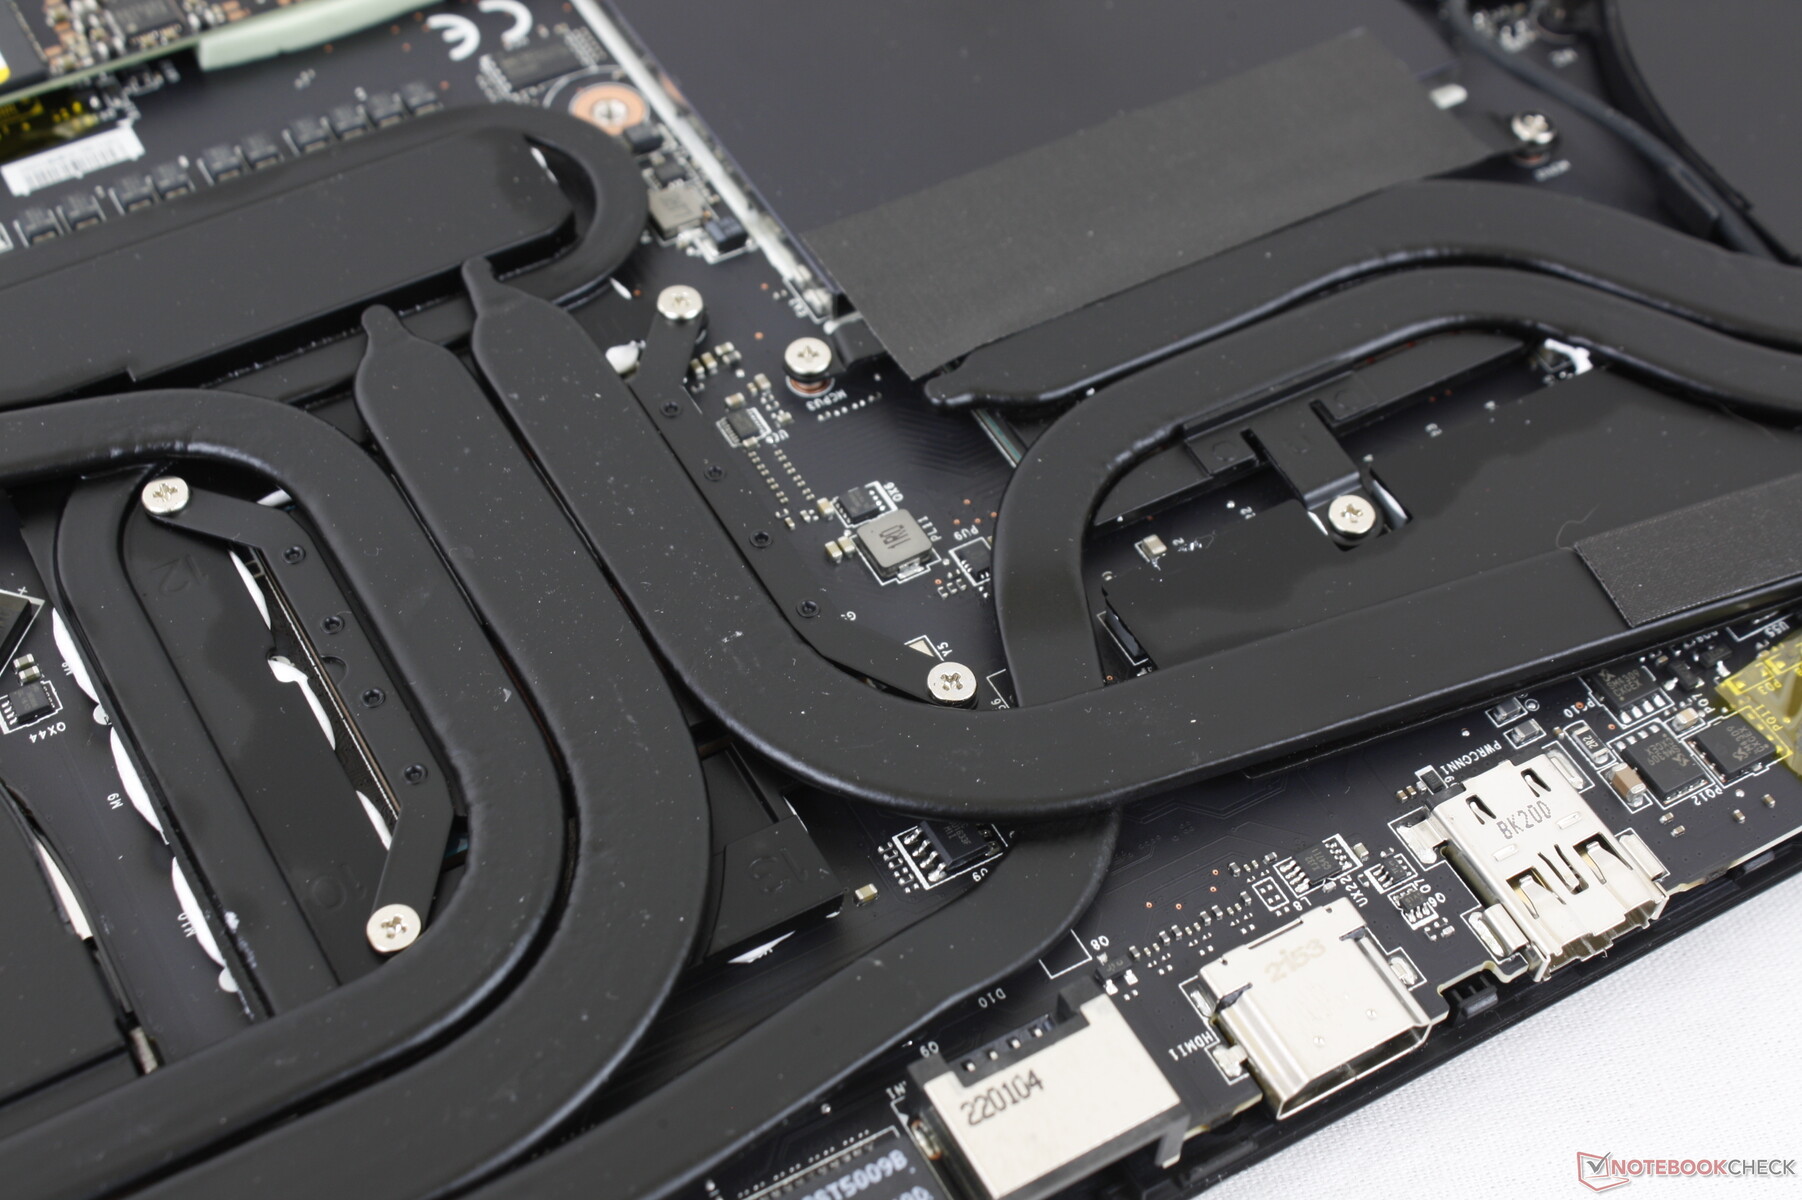
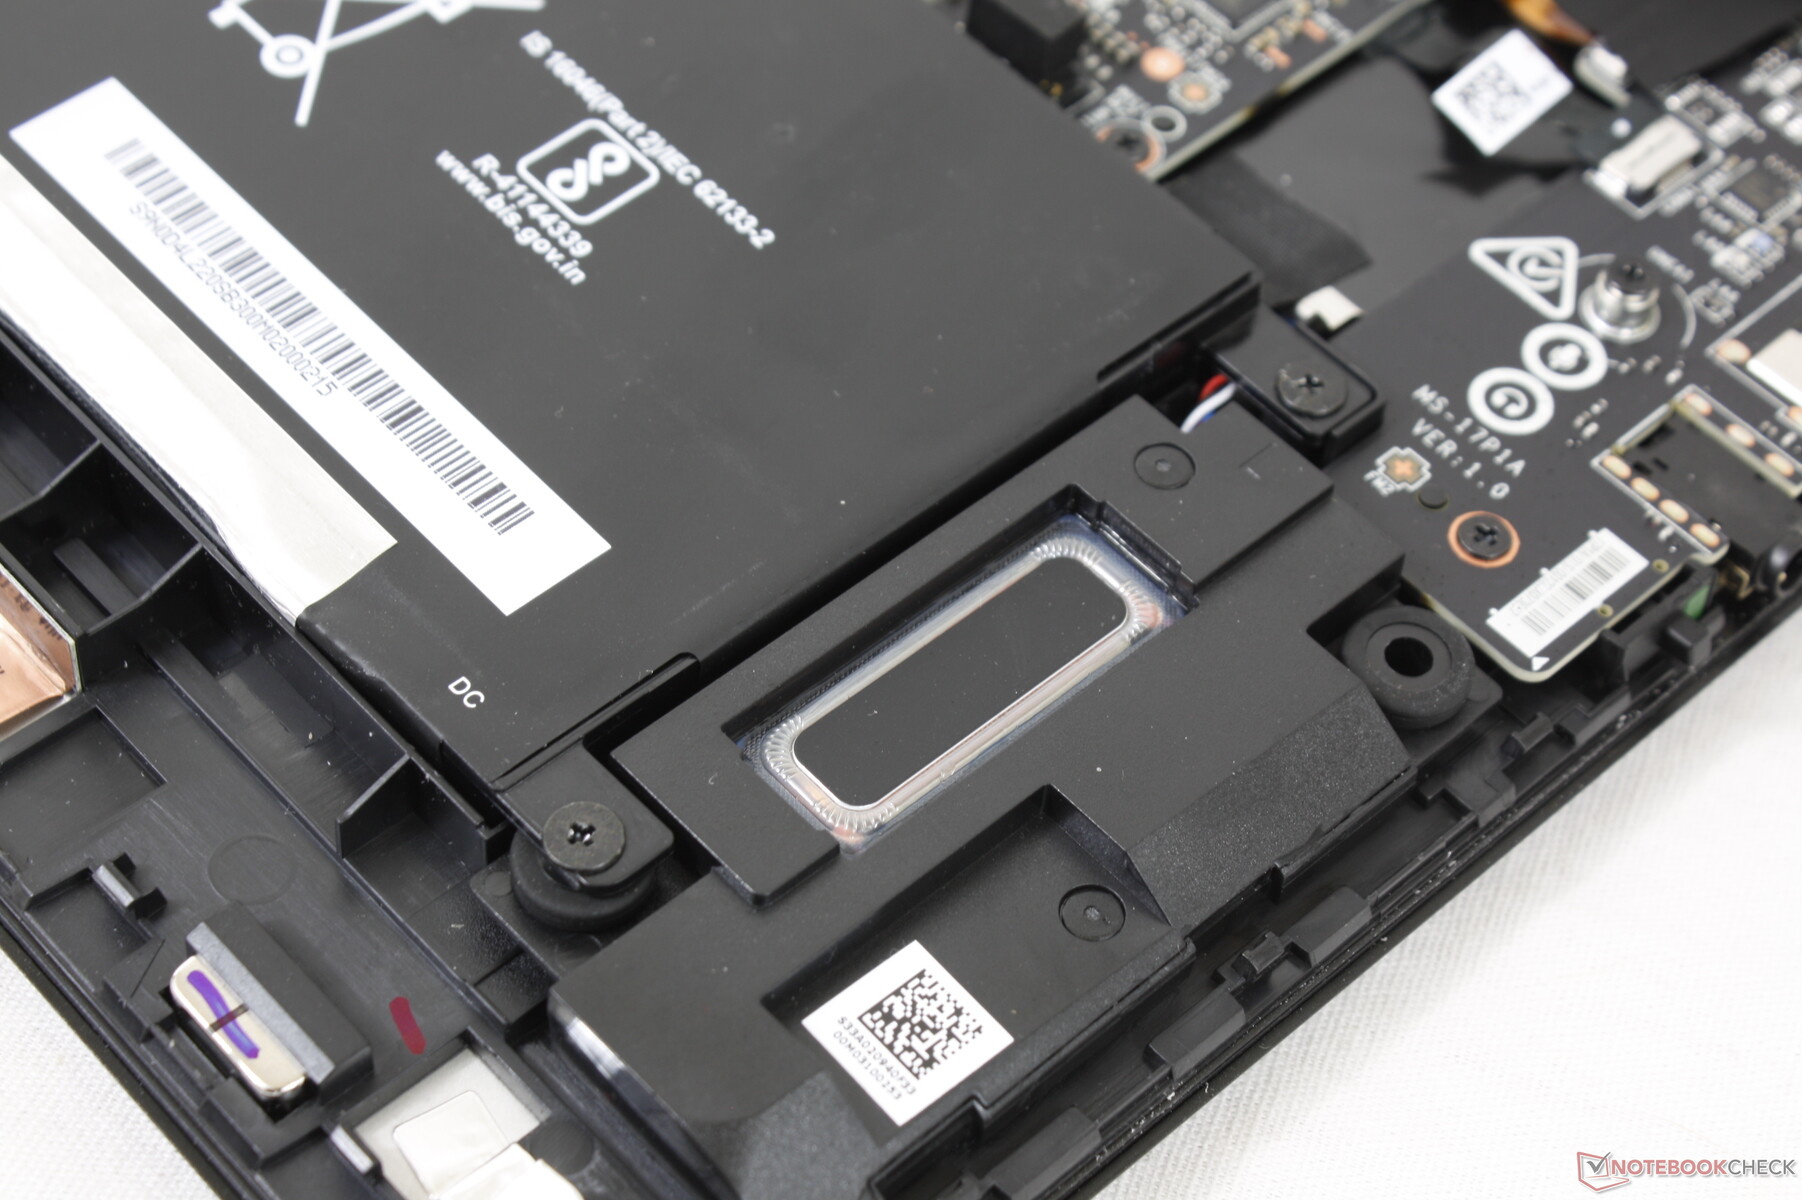
Manutenção
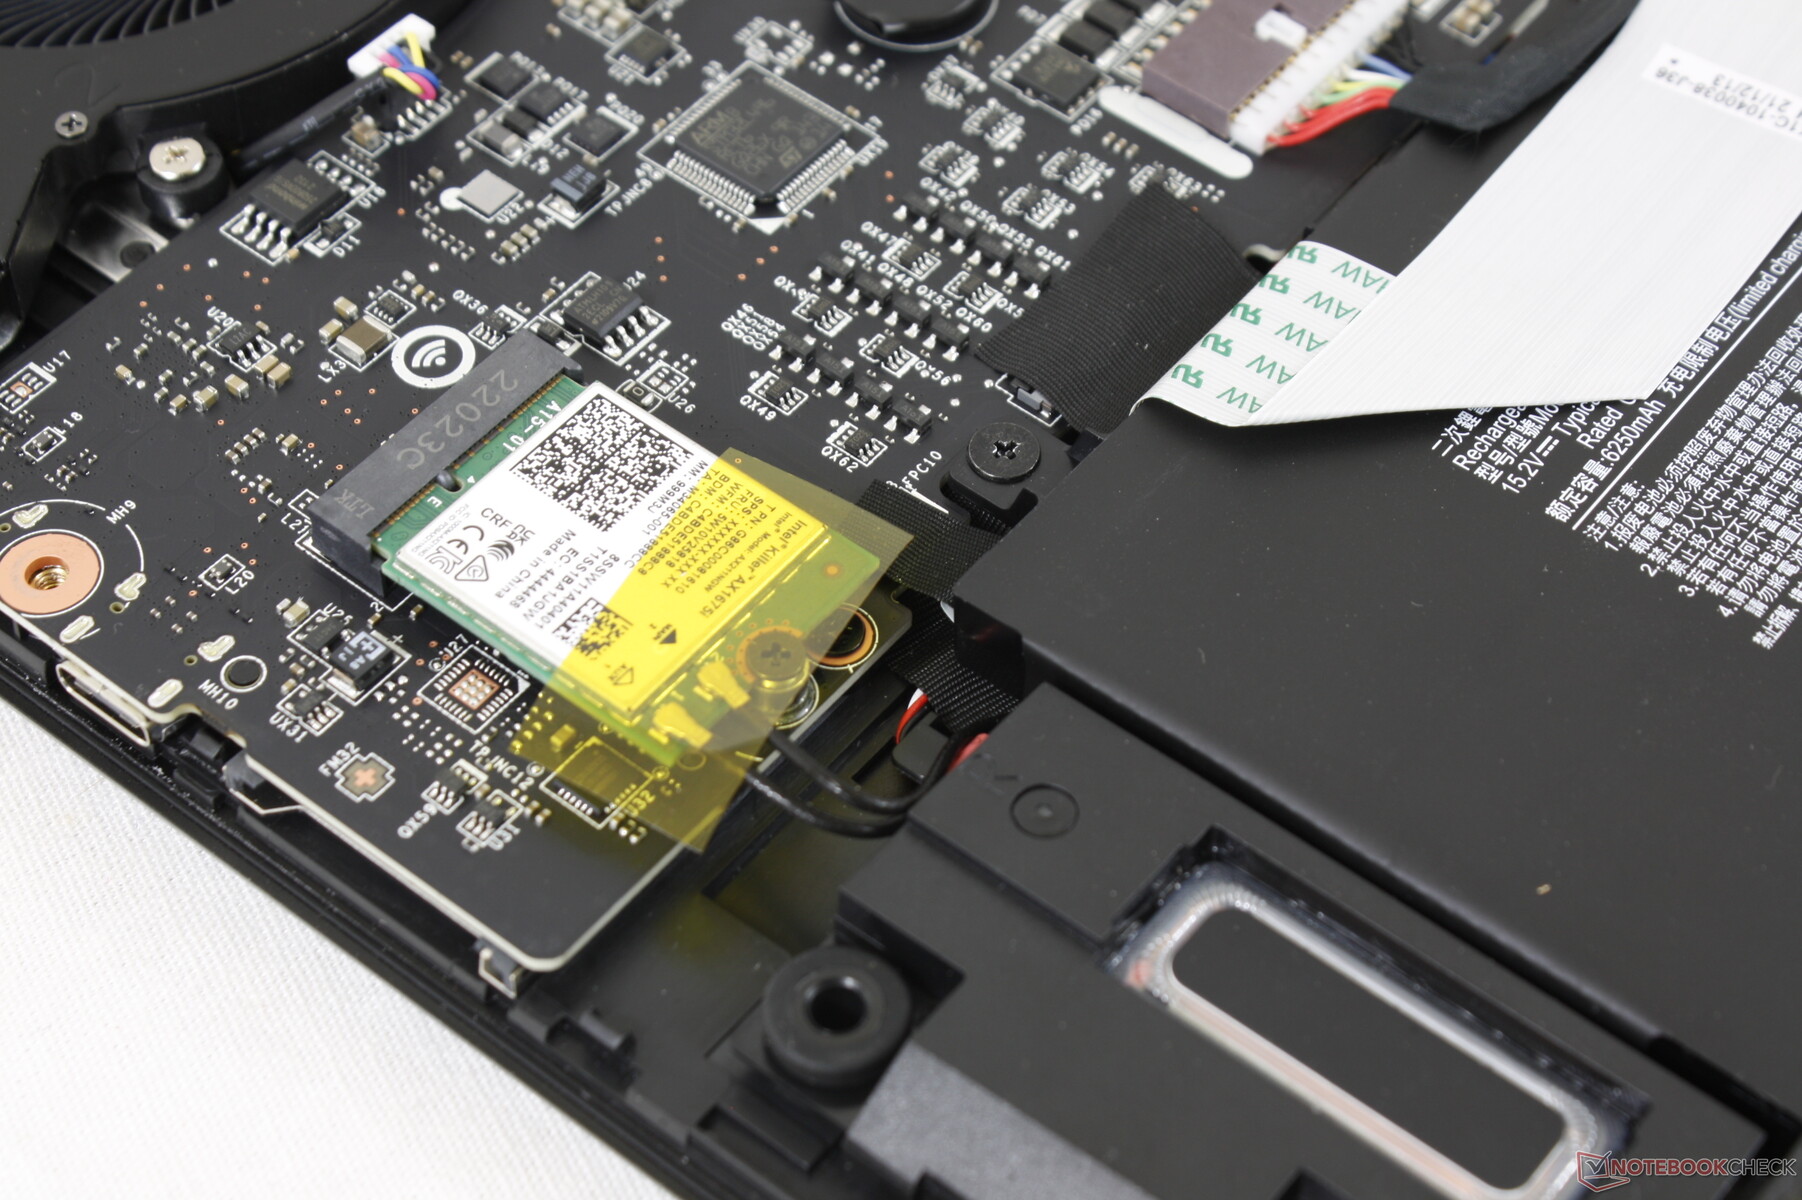
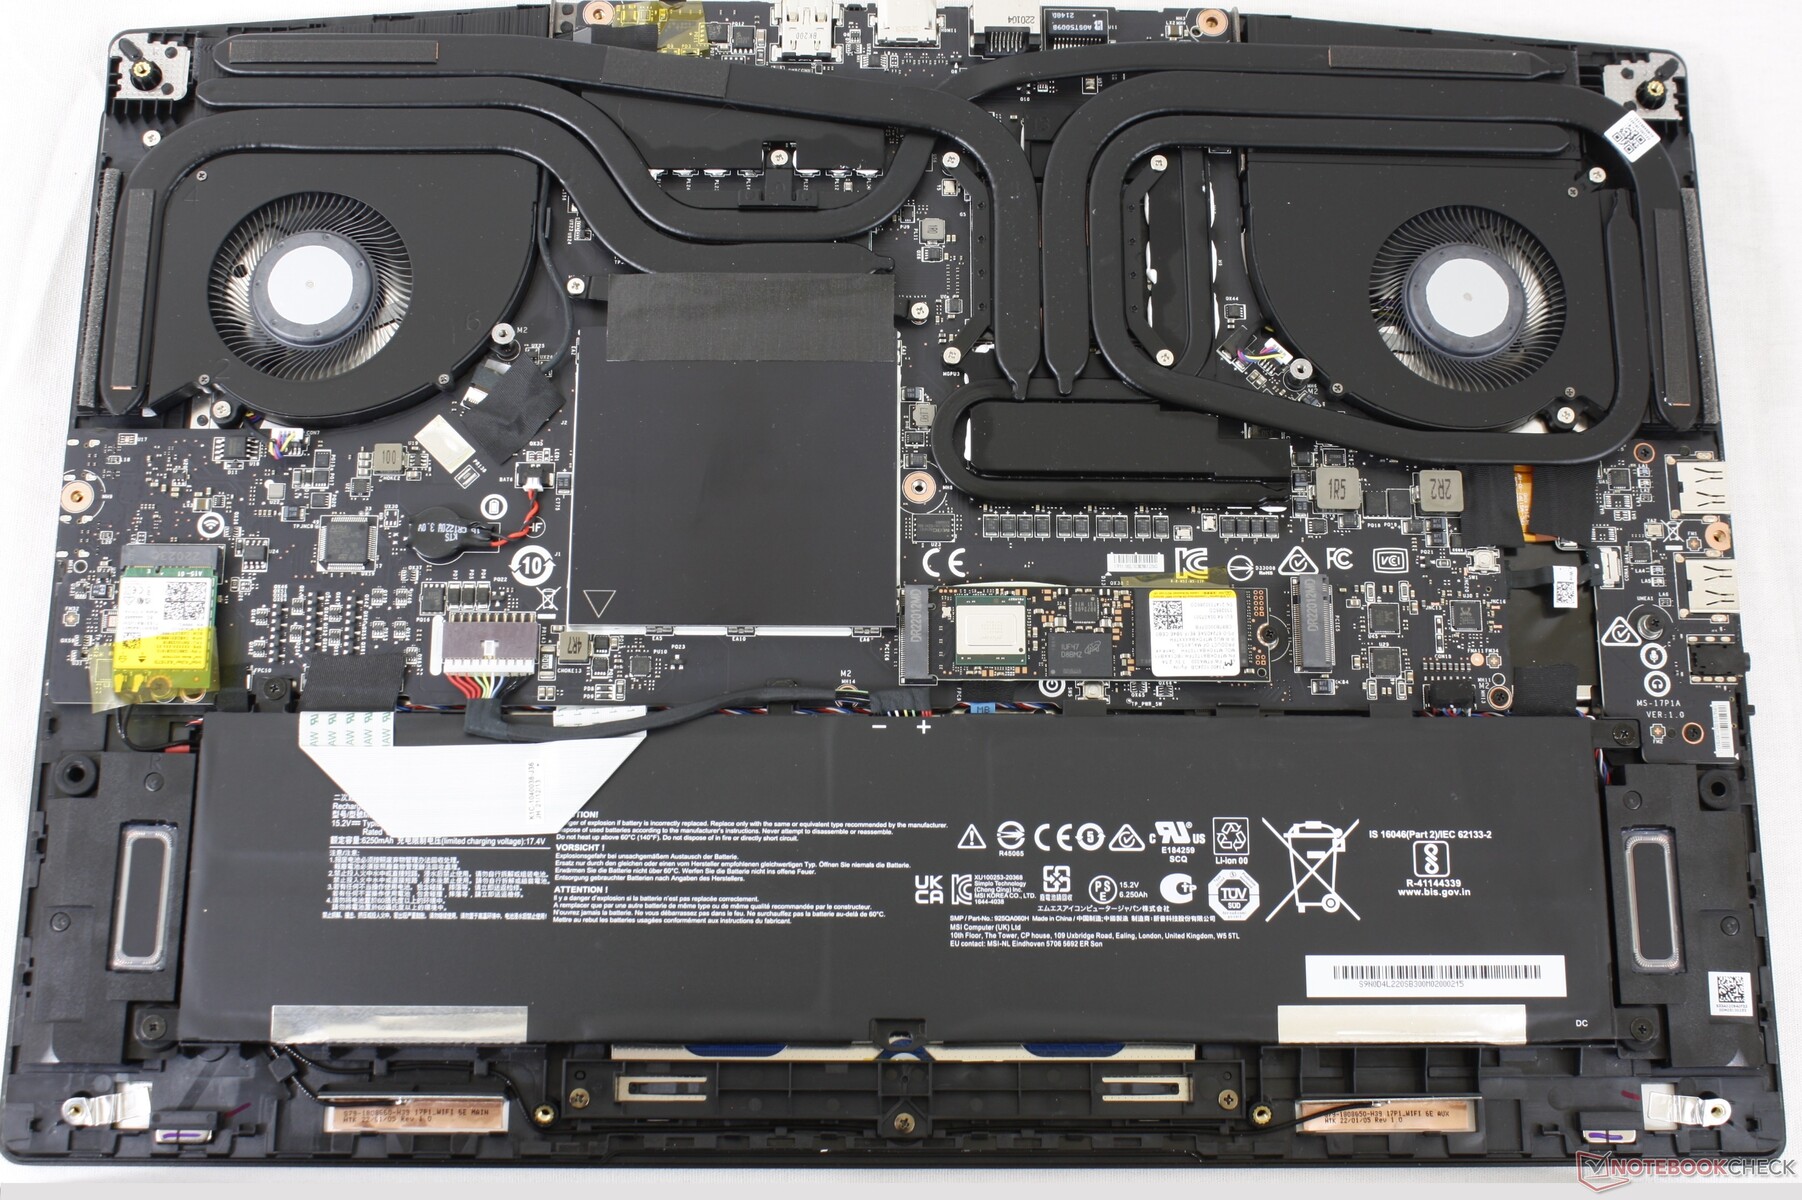
O painel inferior sai com bastante facilidade após a remoção dos 11 parafusos Philips que se encontram embaixo. Tenha em mente que um adesivo de fábrica deve ser quebrado ao contrário da maioria dos outros laptops de jogos de fabricantes concorrentes
Uma vez dentro, os usuários terão acesso a 2x SODIMM slots, 2x PCIe4 x4 2280 SSD slots, e ao módulo WLAN removível. Os dois slots SODIMM são protegidos por sua própria tampa de alumínio.
Acessórios e Garantia
A caixa de varejo inclui um pano de tela de veludo, além da papelada e adaptador AC. Aplica-se uma garantia de um ano do fabricante com opções de extensão se comprada no PC Xotic.
Dispositivos de entrada - Degrau Lateral
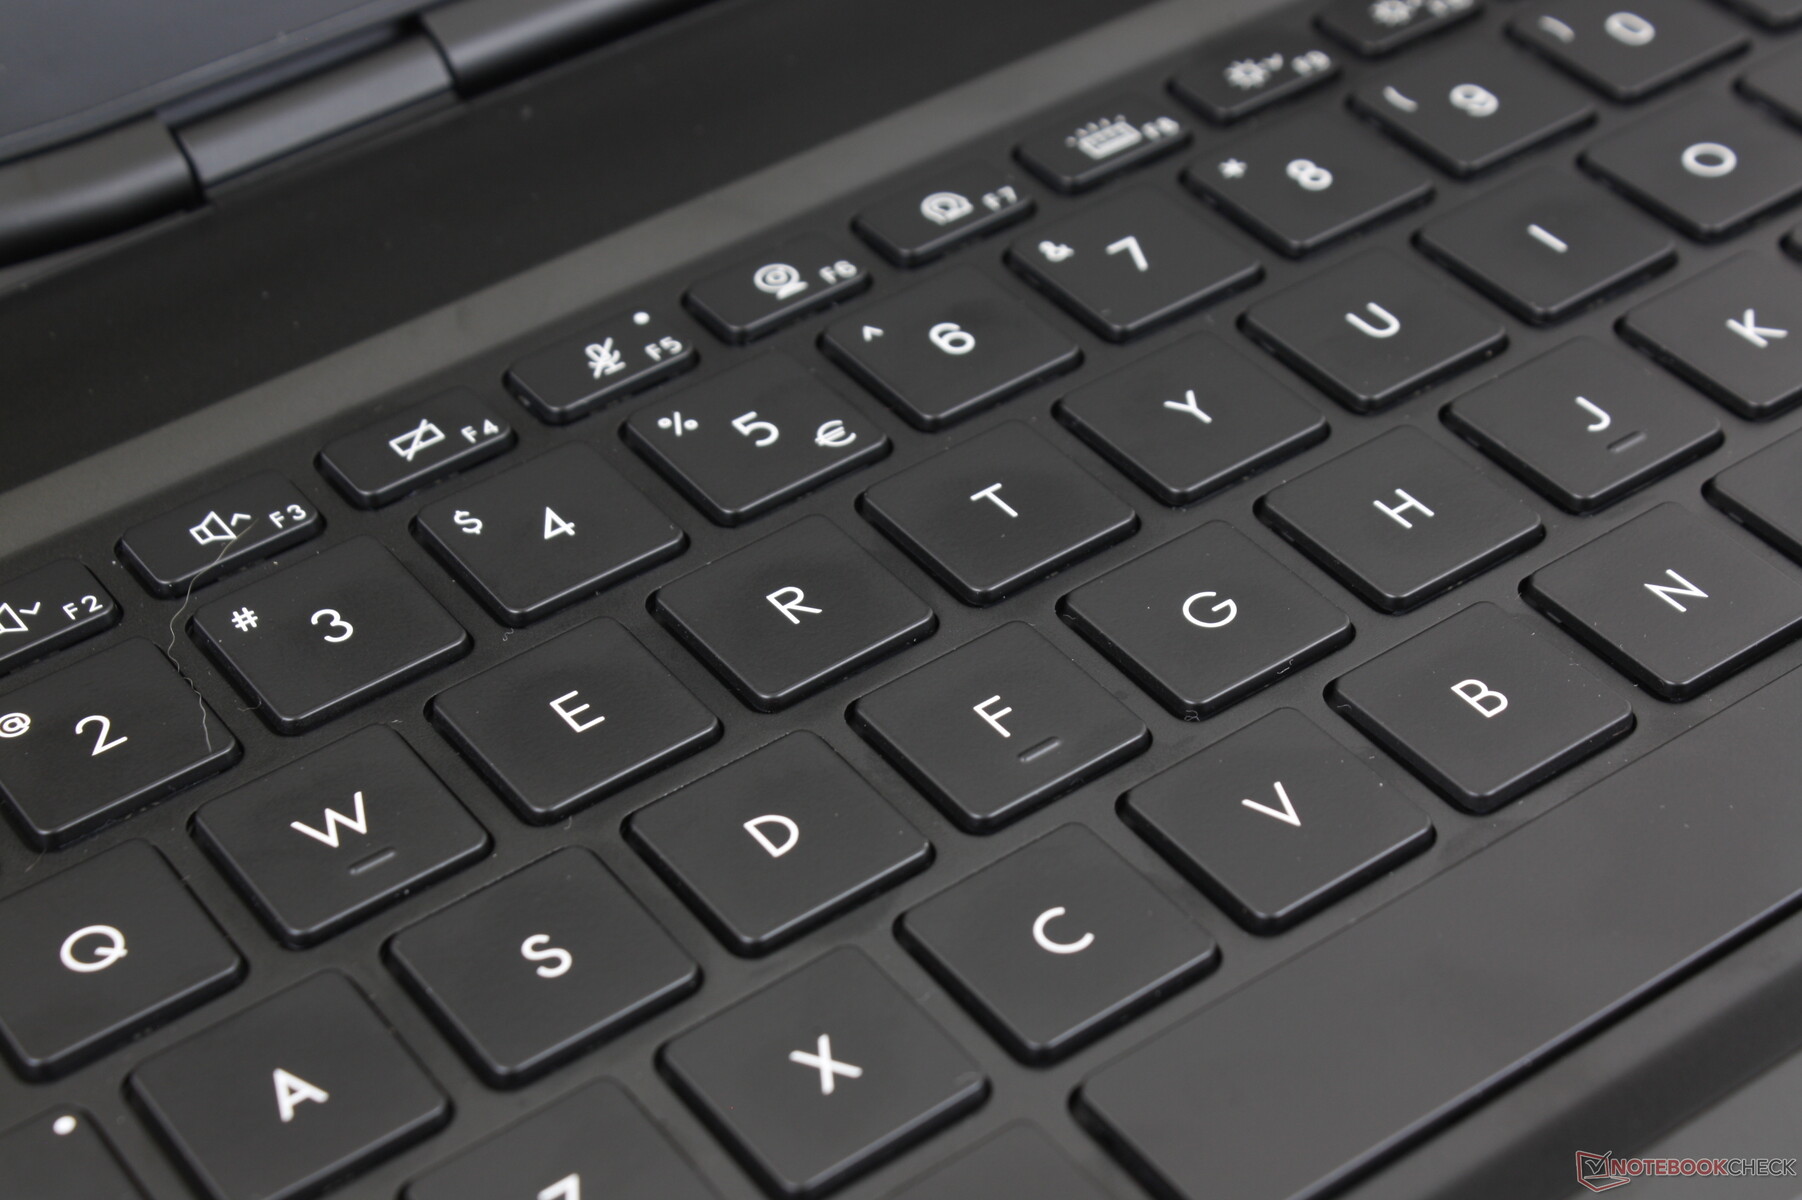
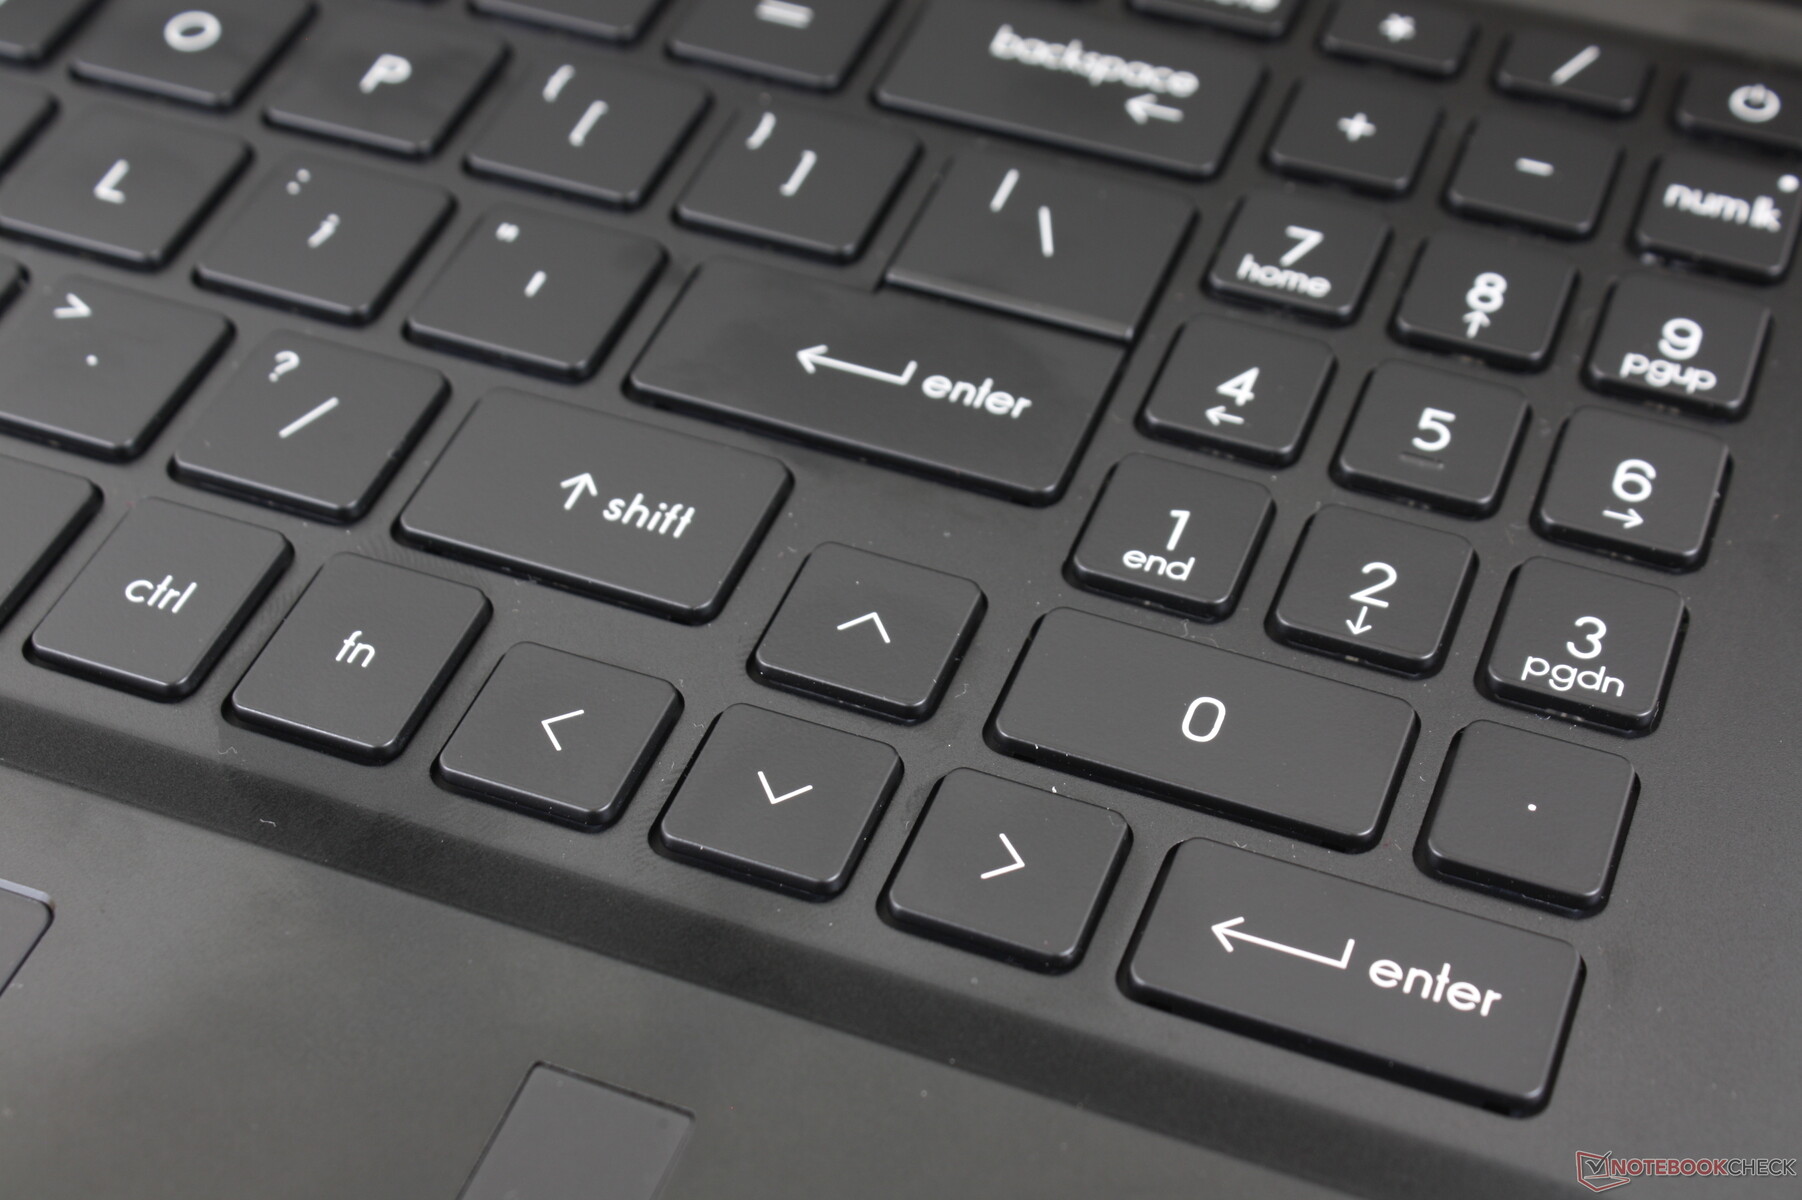
Teclado
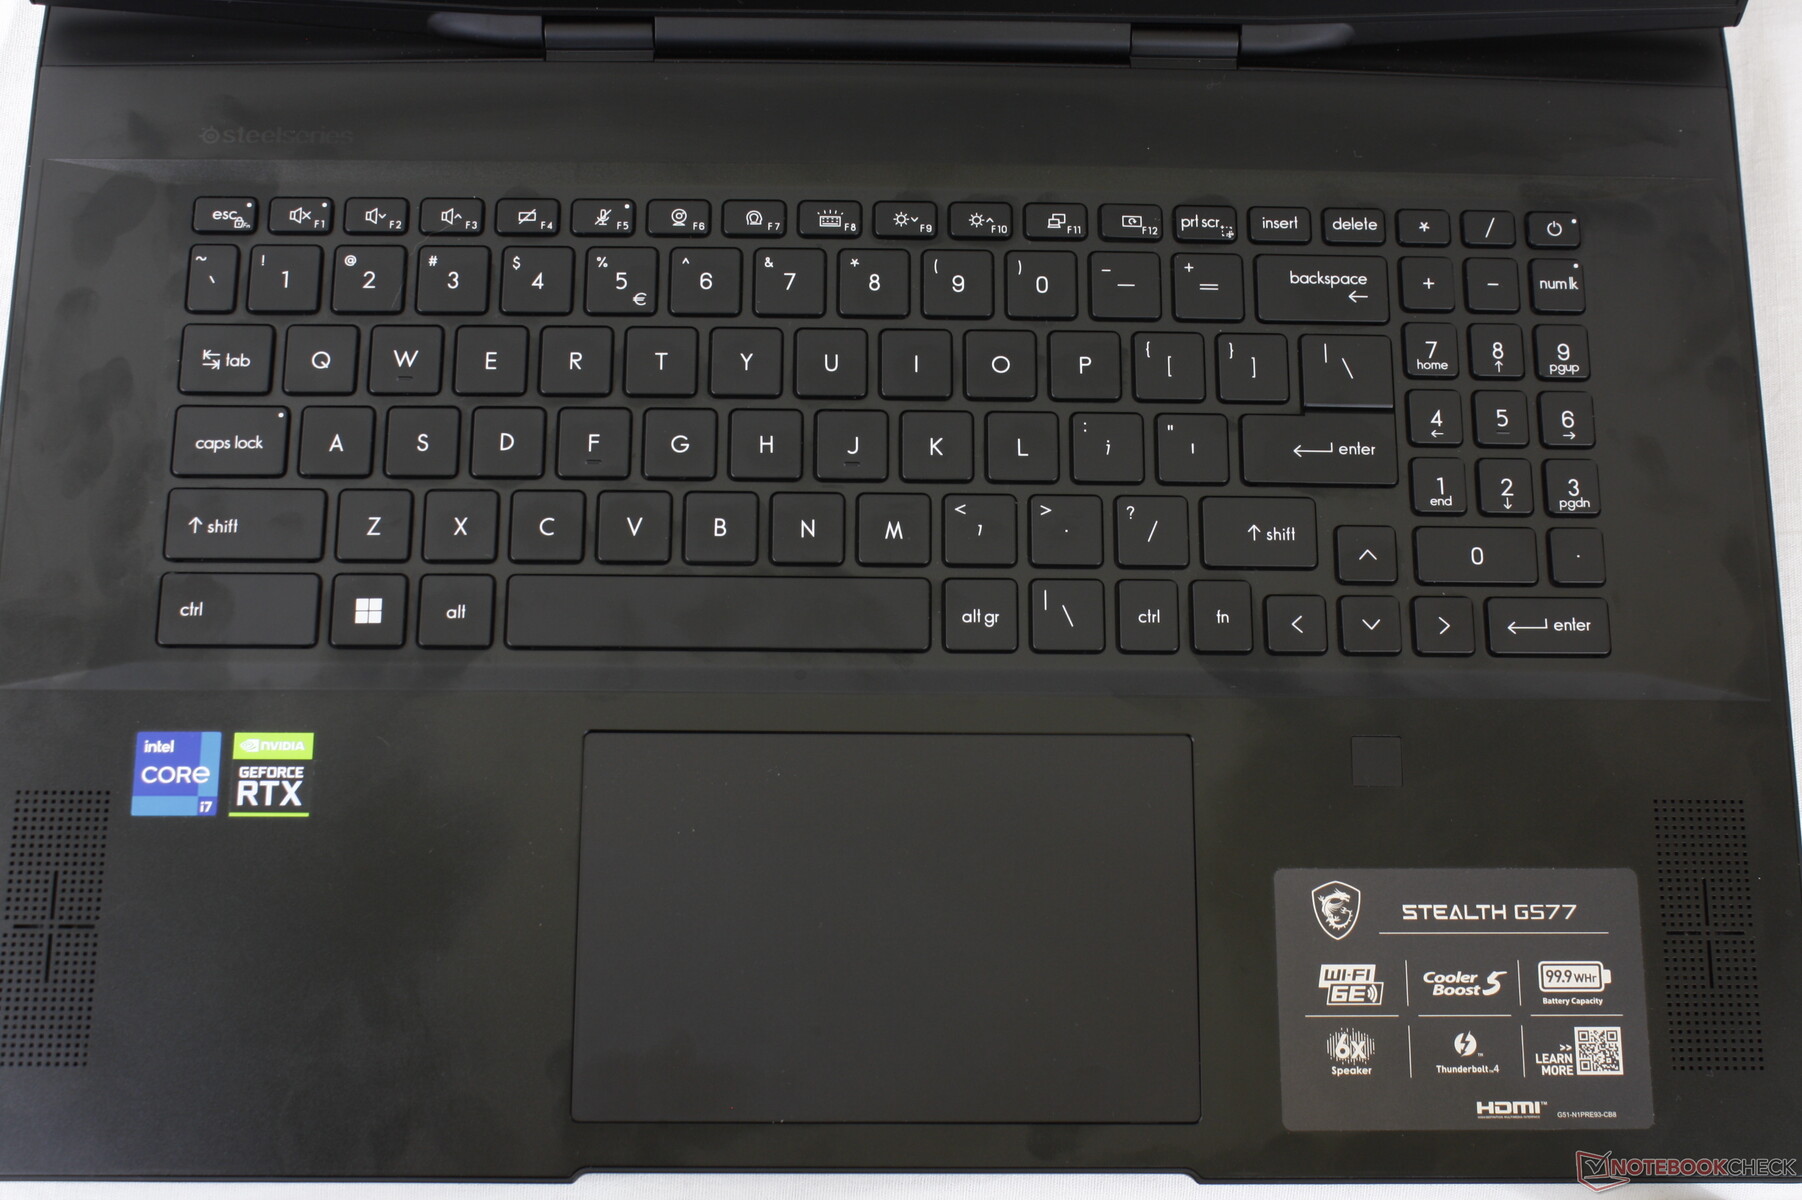
As teclas do teclado são ligeiramente mais macias e silenciosas que as teclas da Lâmina 17. Portanto, não é necessariamente melhor ou pior, pois alguns usuários podem preferir uma experiência de digitação mais silenciosa mesmo que isso signifique ter um feedback ligeiramente mais esponjoso. O GS77 integra até mesmo um numpad dedicado, enquanto que o Blade não
O tamanho da chave é a maior desvantagem do teclado GS77. Em particular, o numpad, as teclas de seta e a linha superior das teclas de função são todas muito menores do que as principais teclas QWERTY e, portanto, são visivelmente mais esponjosas e mais fracas no feedback. Pelo menos as teclas de função na lâmina 17 são do mesmo tamanho das teclas QWERTY principais para uma melhor uniformidade.
Touchpad
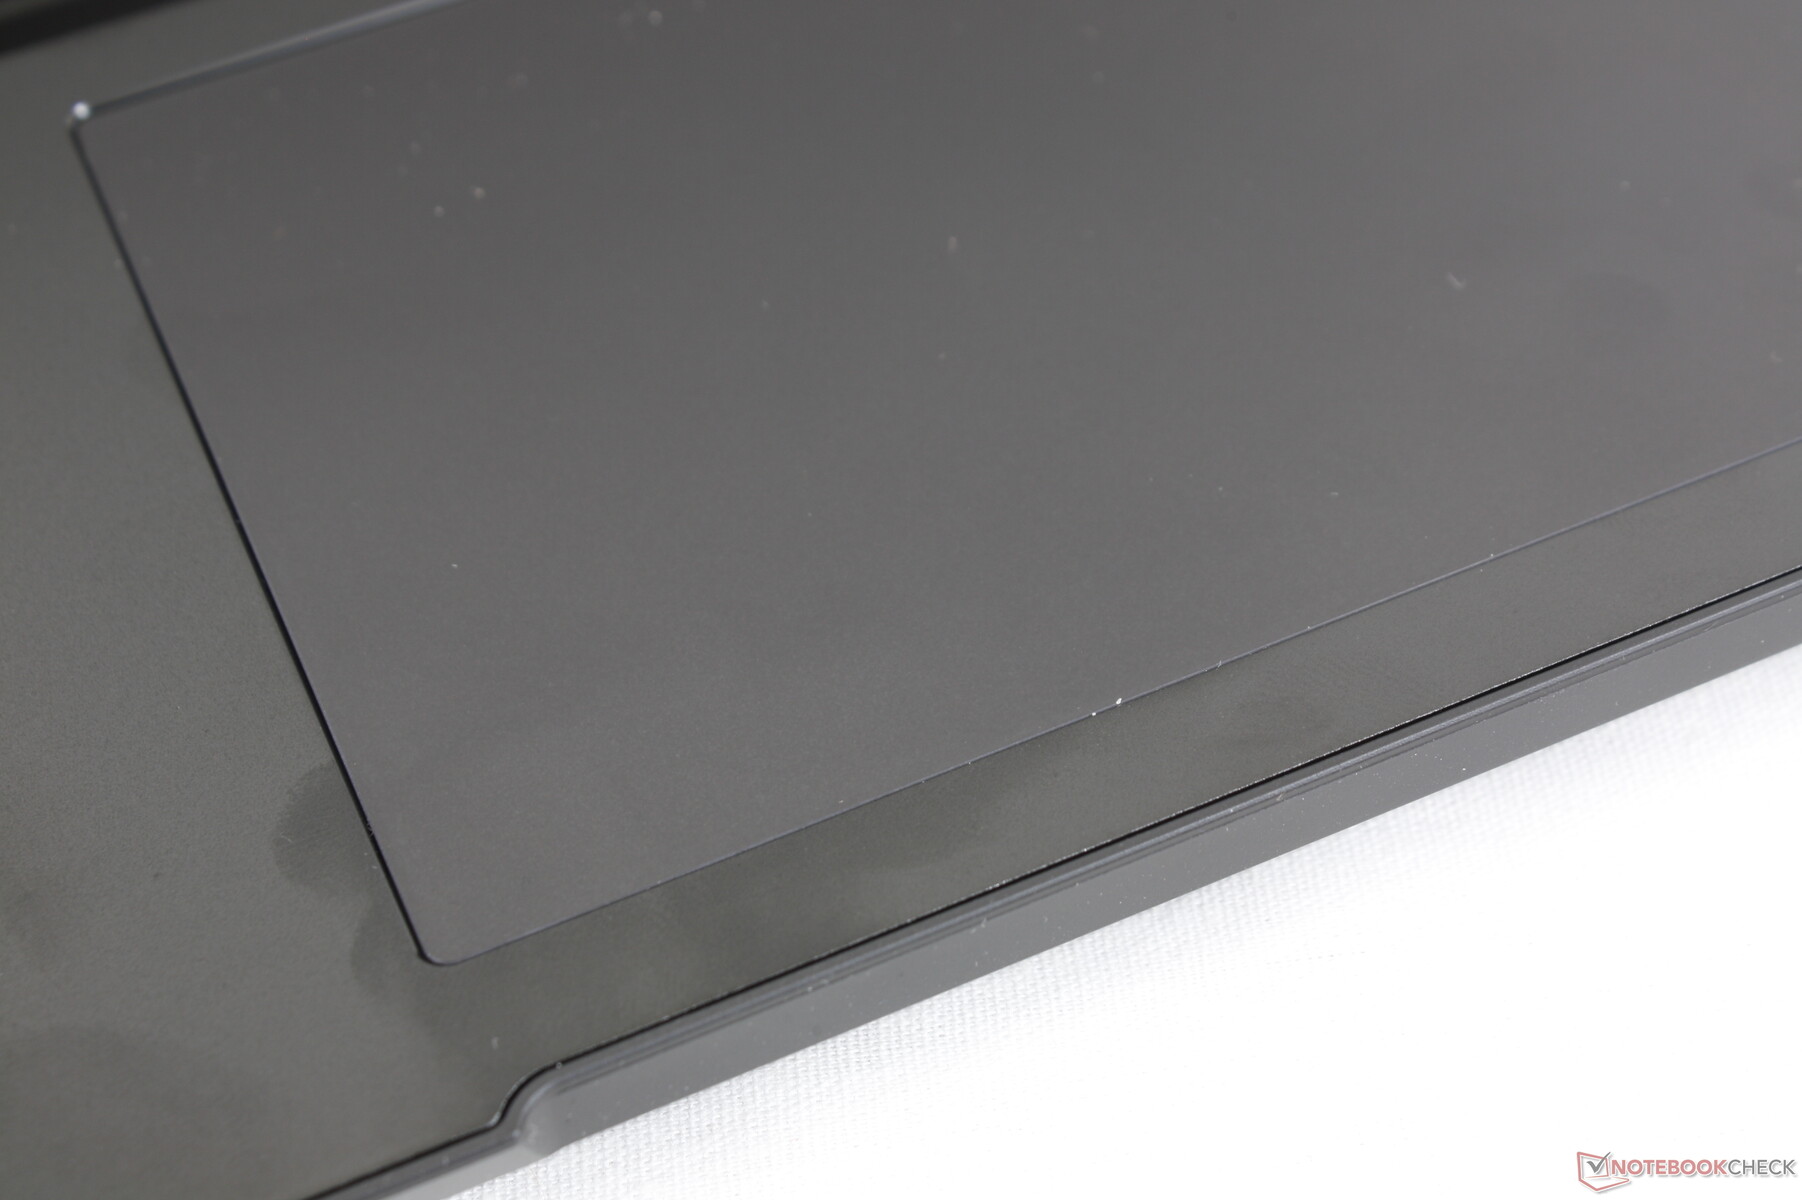
O "clickpad" é cada vez maior do que o da lâmina 17 (13,2 x 8,2 cm vs. 13 x 8 cm). A tração é muito suave mesmo quando se desliza a velocidades lentas para uma sensação muito semelhante à do clickpad da Lâmina 17. Em vez disso, a maior diferença entre eles é seu respectivo feedback, pois clicar no clickpad GS77 é mais firme e mais alto do que no Razer.
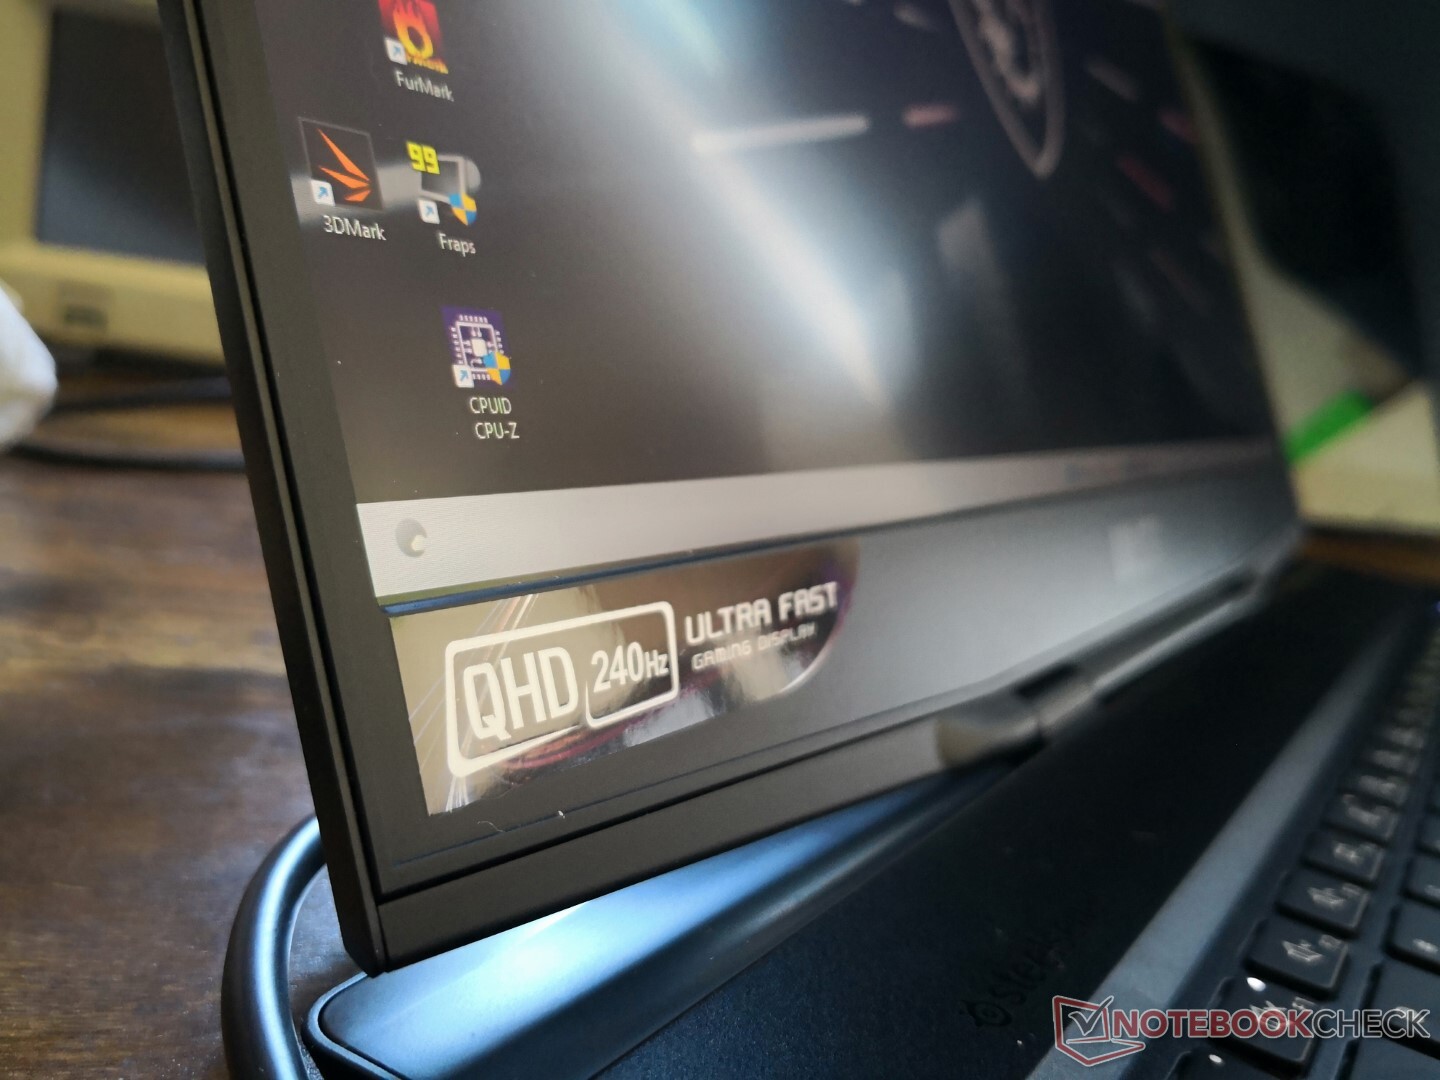
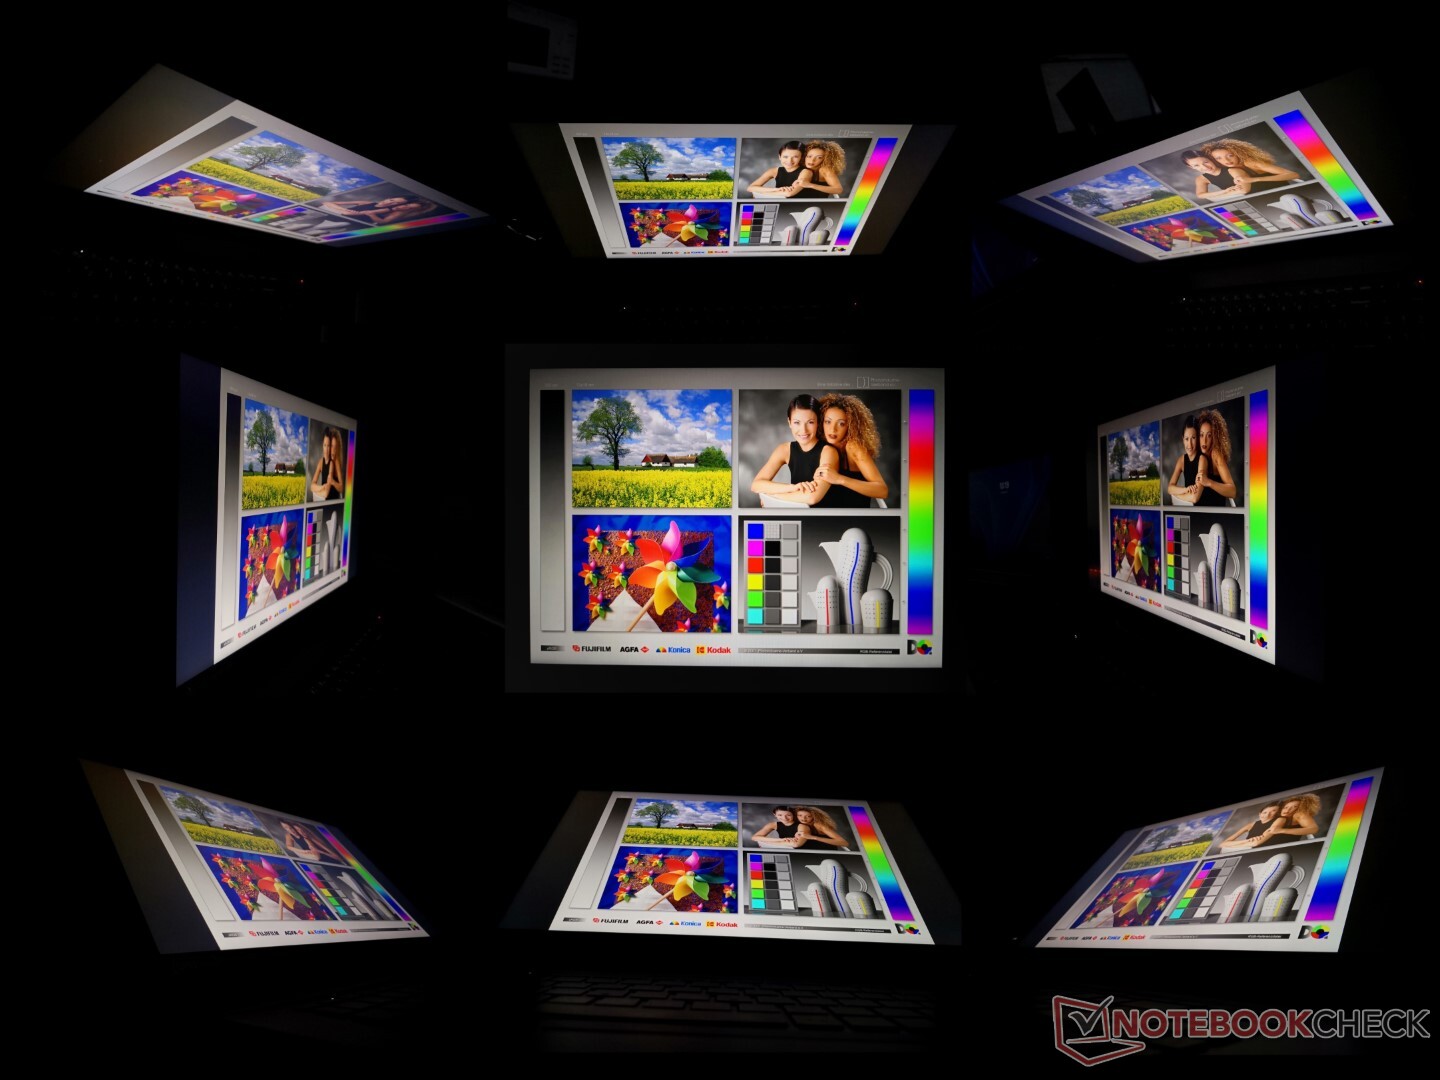
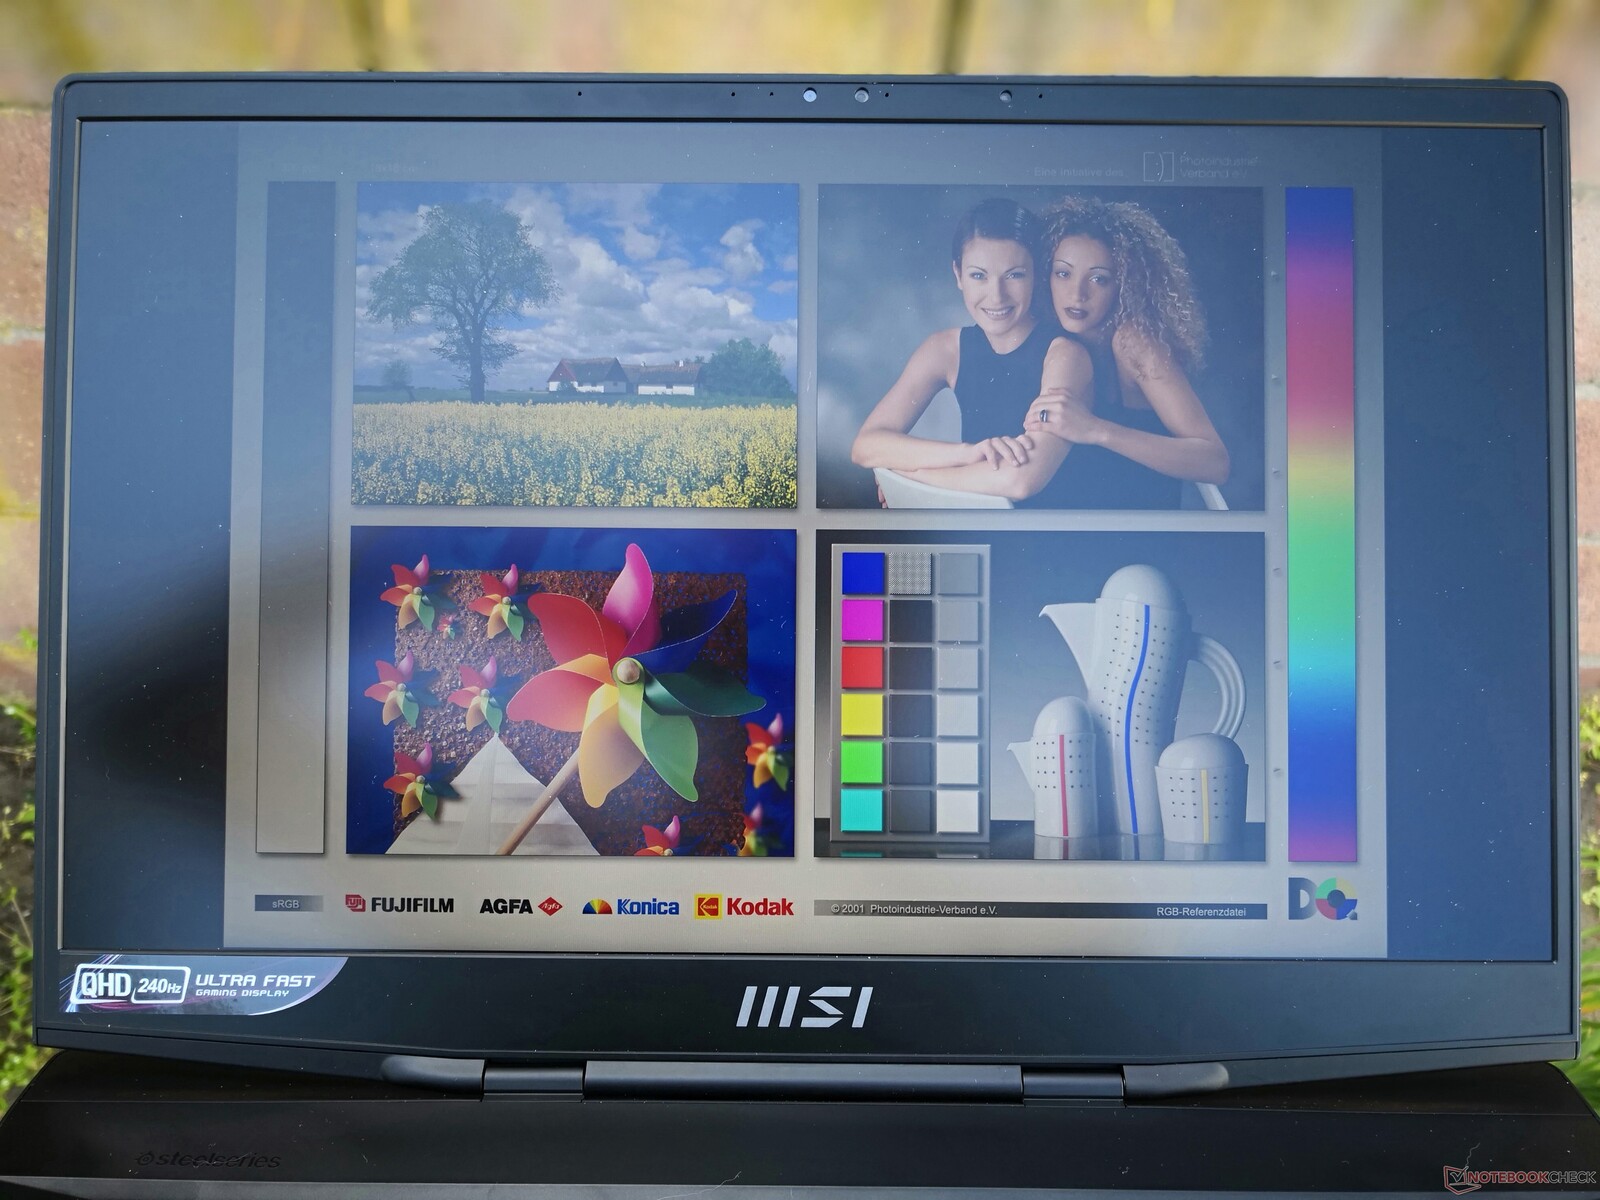
Mostrador - Alta Taxa de Atualização Como Padrão
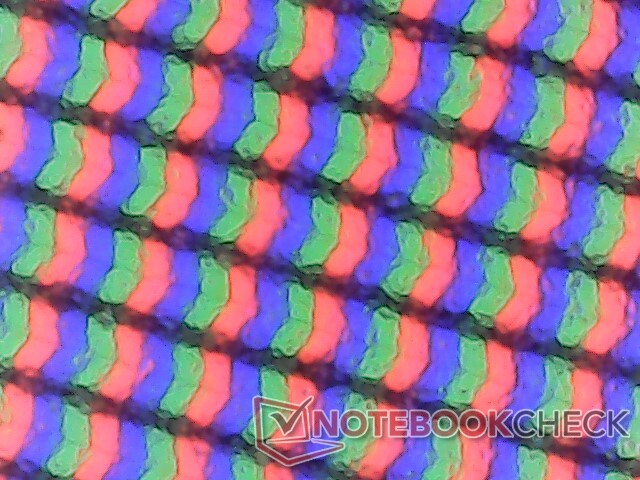
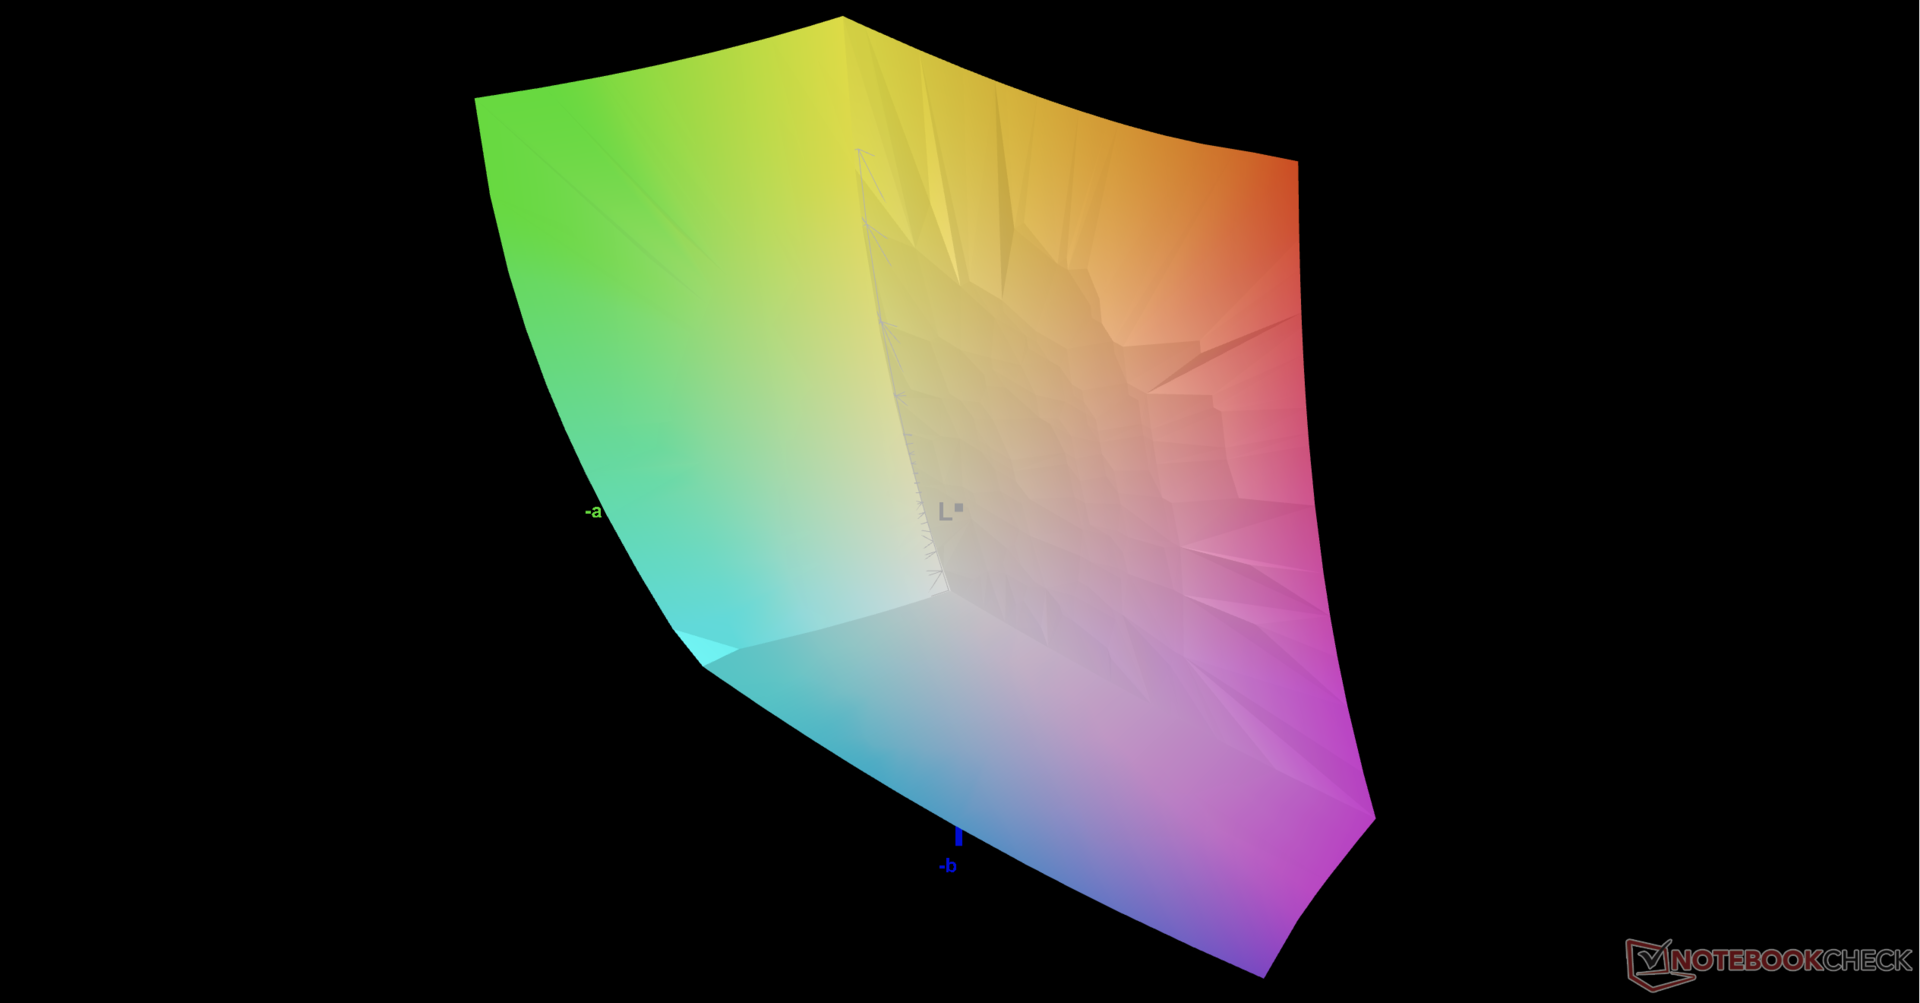
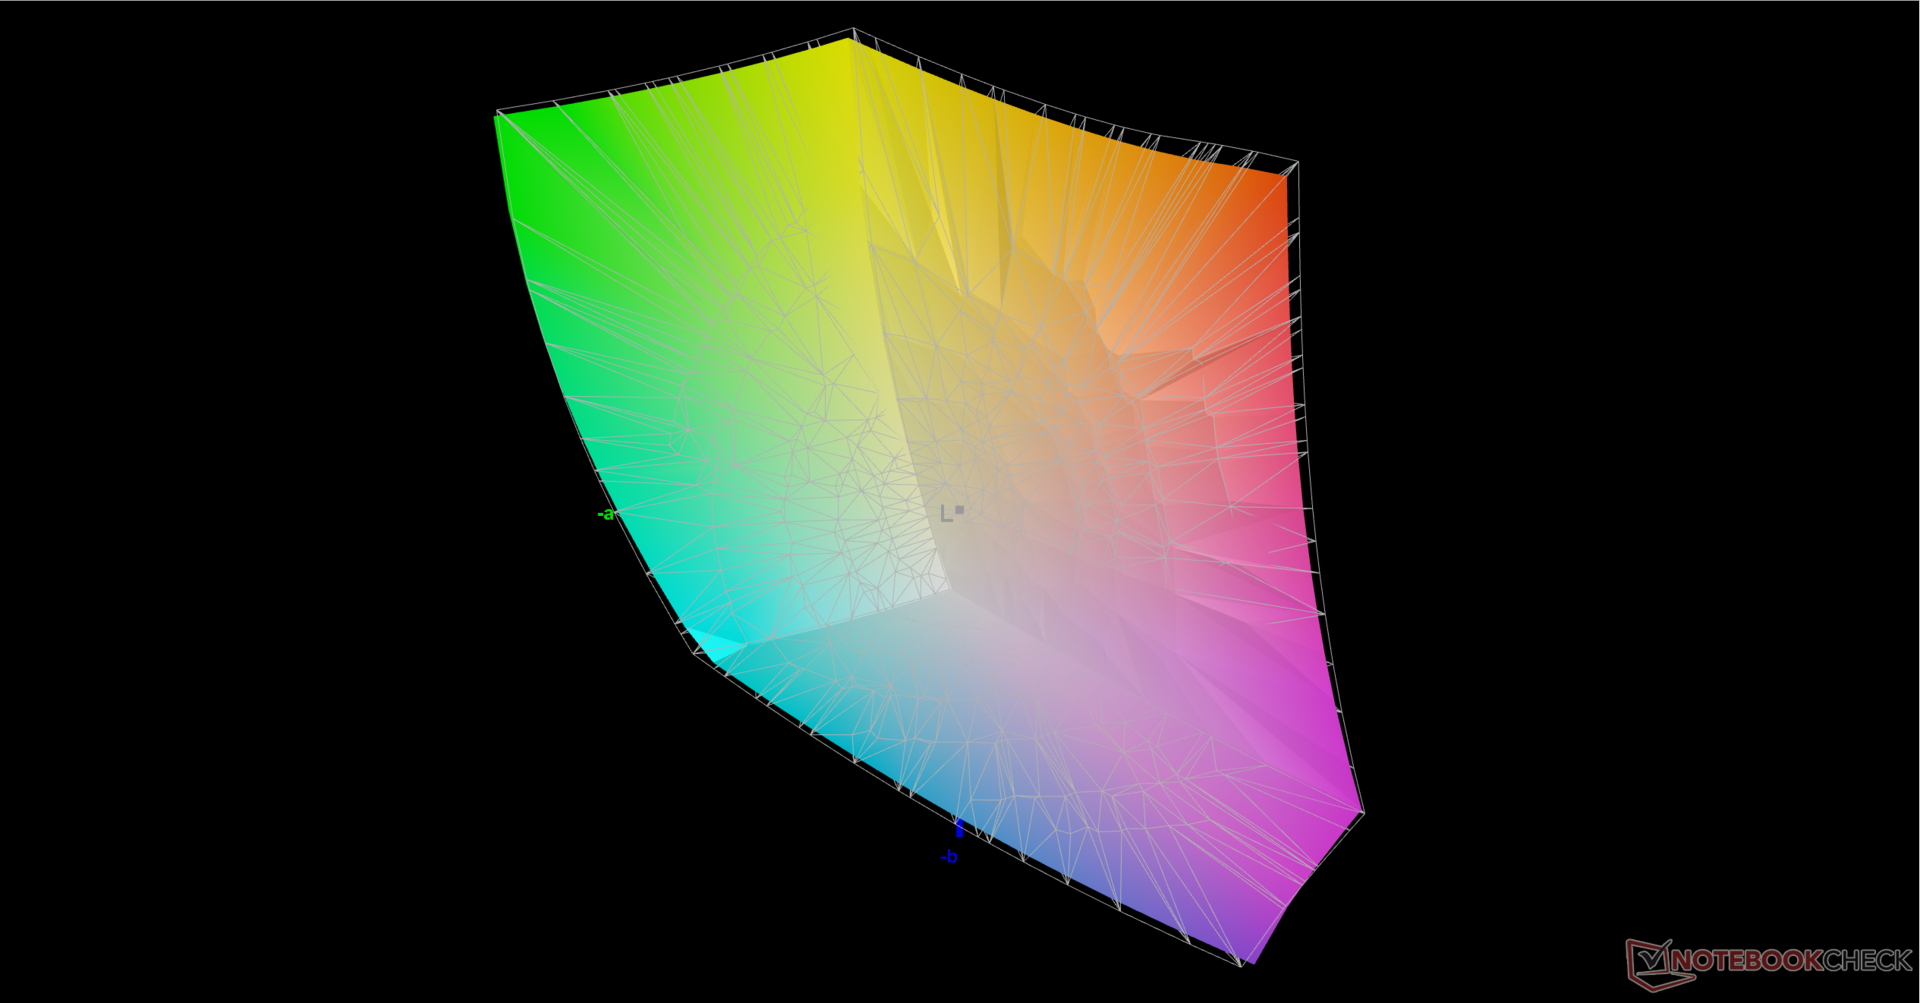
O GS77 está usando exatamente o mesmo painel IPS BOE NE173QHM-NZ1 1440p de alta qualidade que a Razer está usando para sua Lâmina 17. Assim, atributos centrais como a taxa de atualização nativa de 240 Hz, tempos de resposta rápidos, relação de contraste decente ~1000:1 e cobertura total DCI-P3 são idênticos entre os dois laptops concorrentes de 17,3 polegadas.
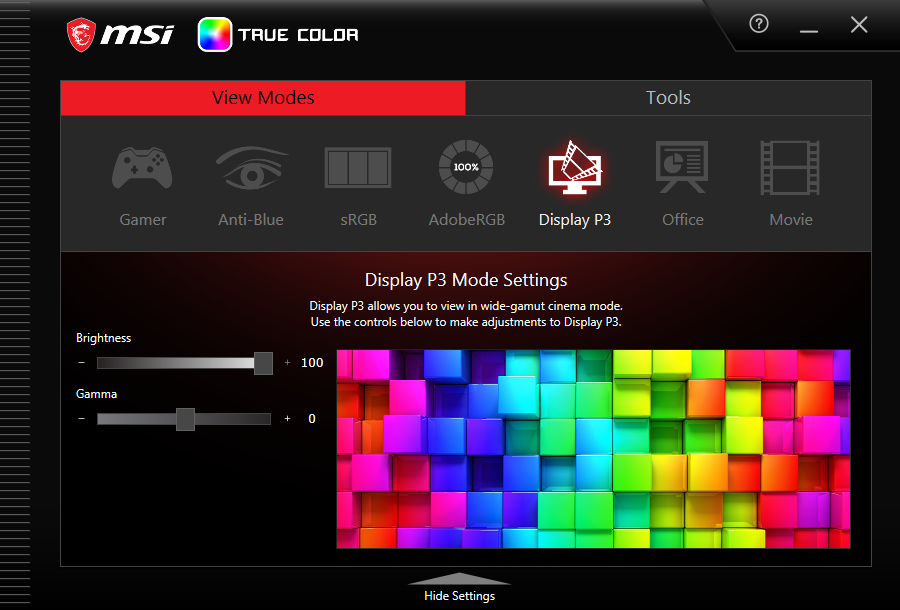
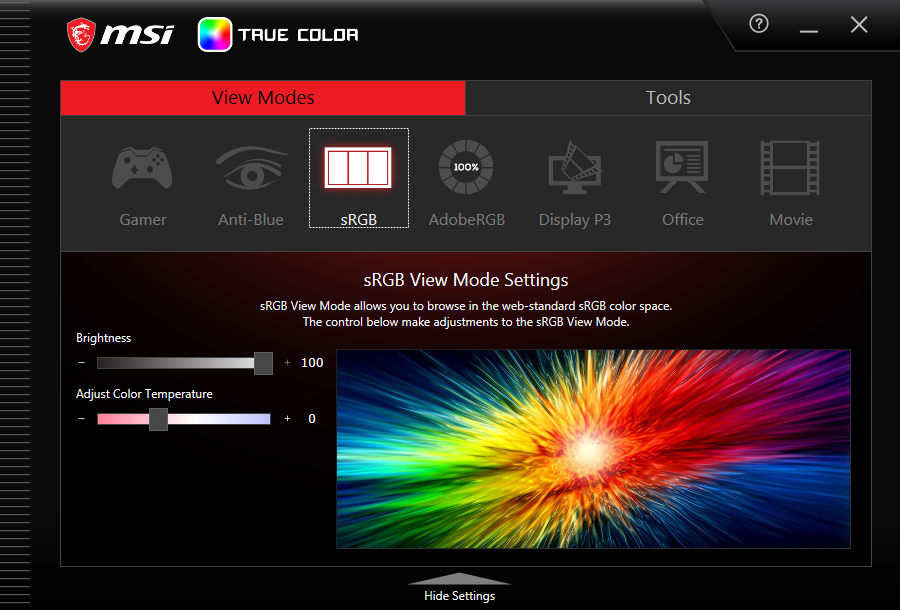
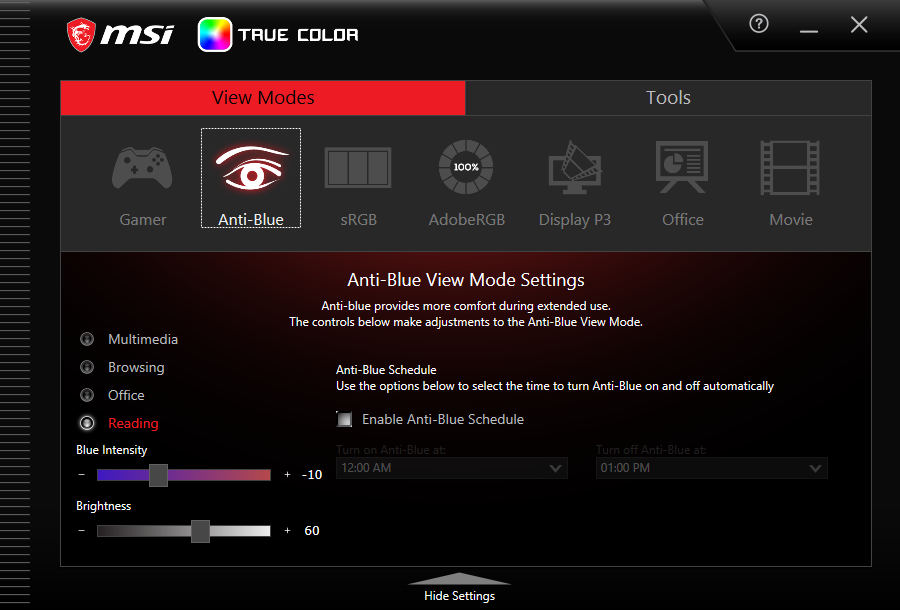
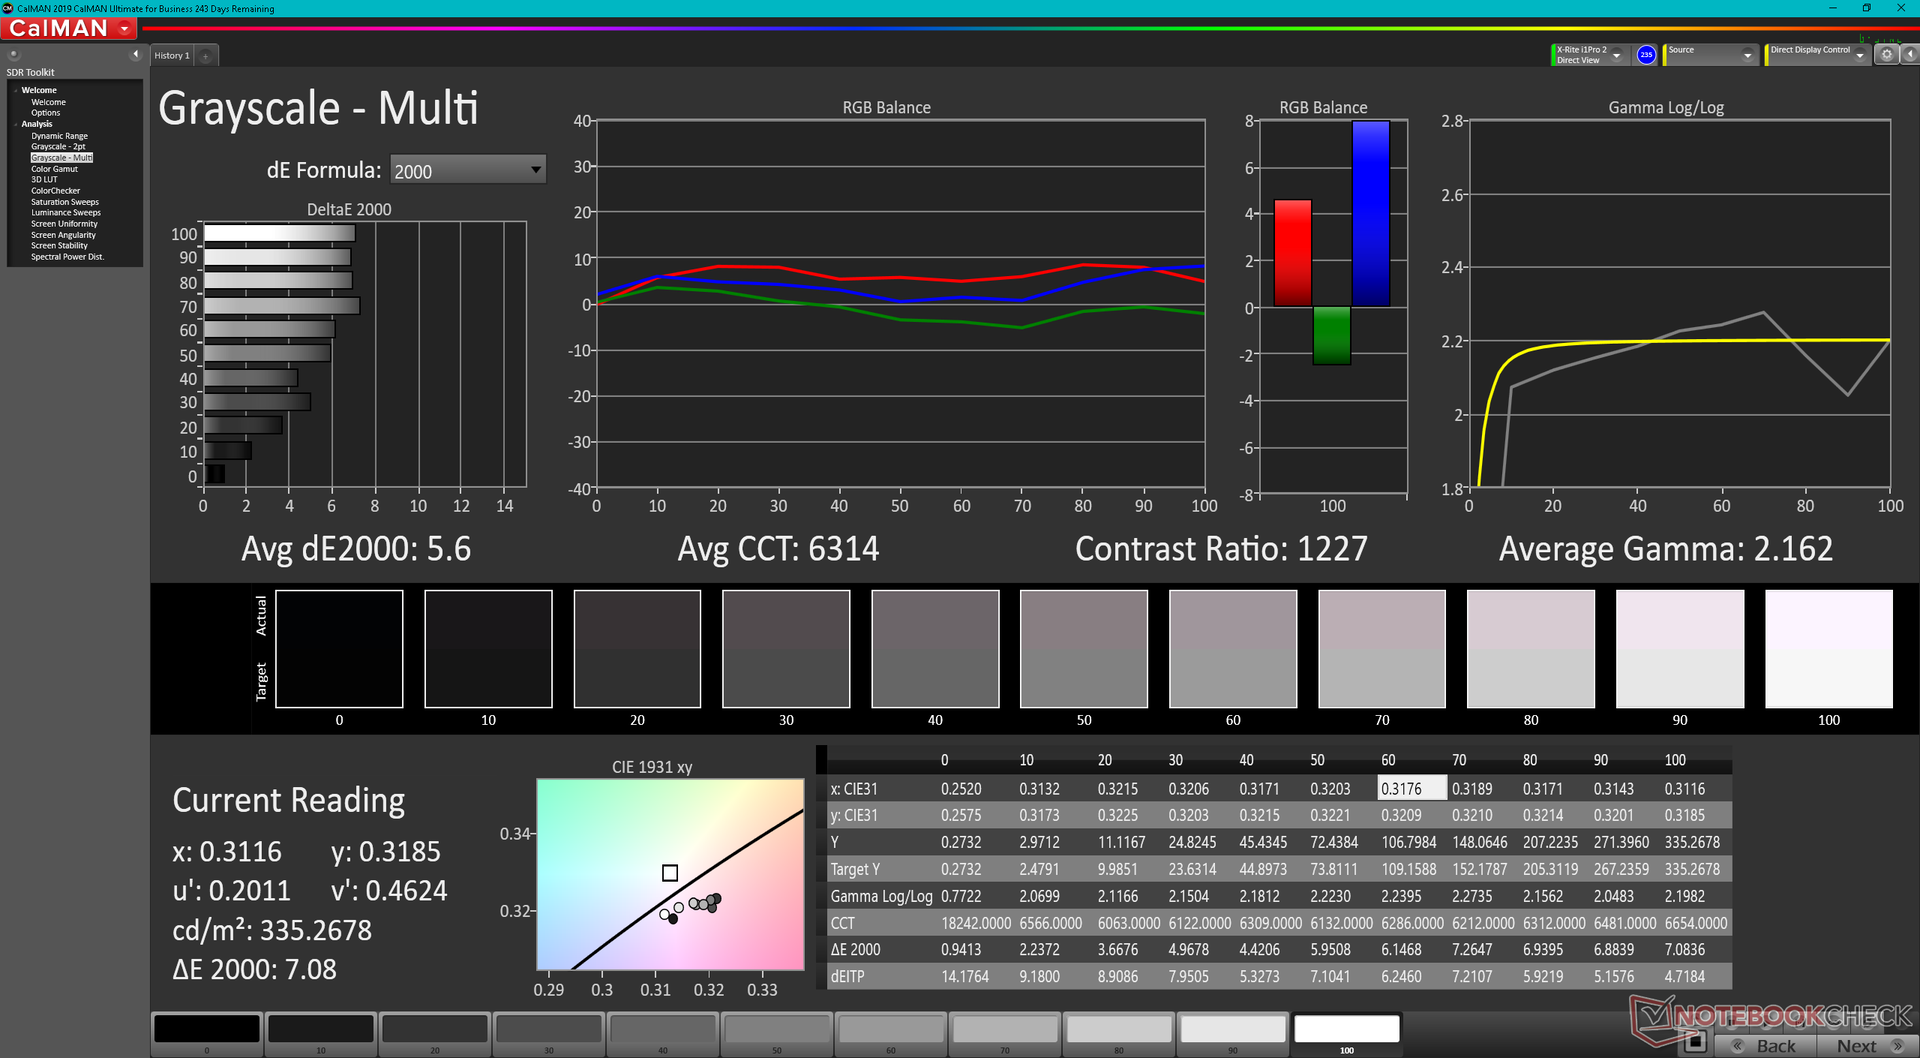
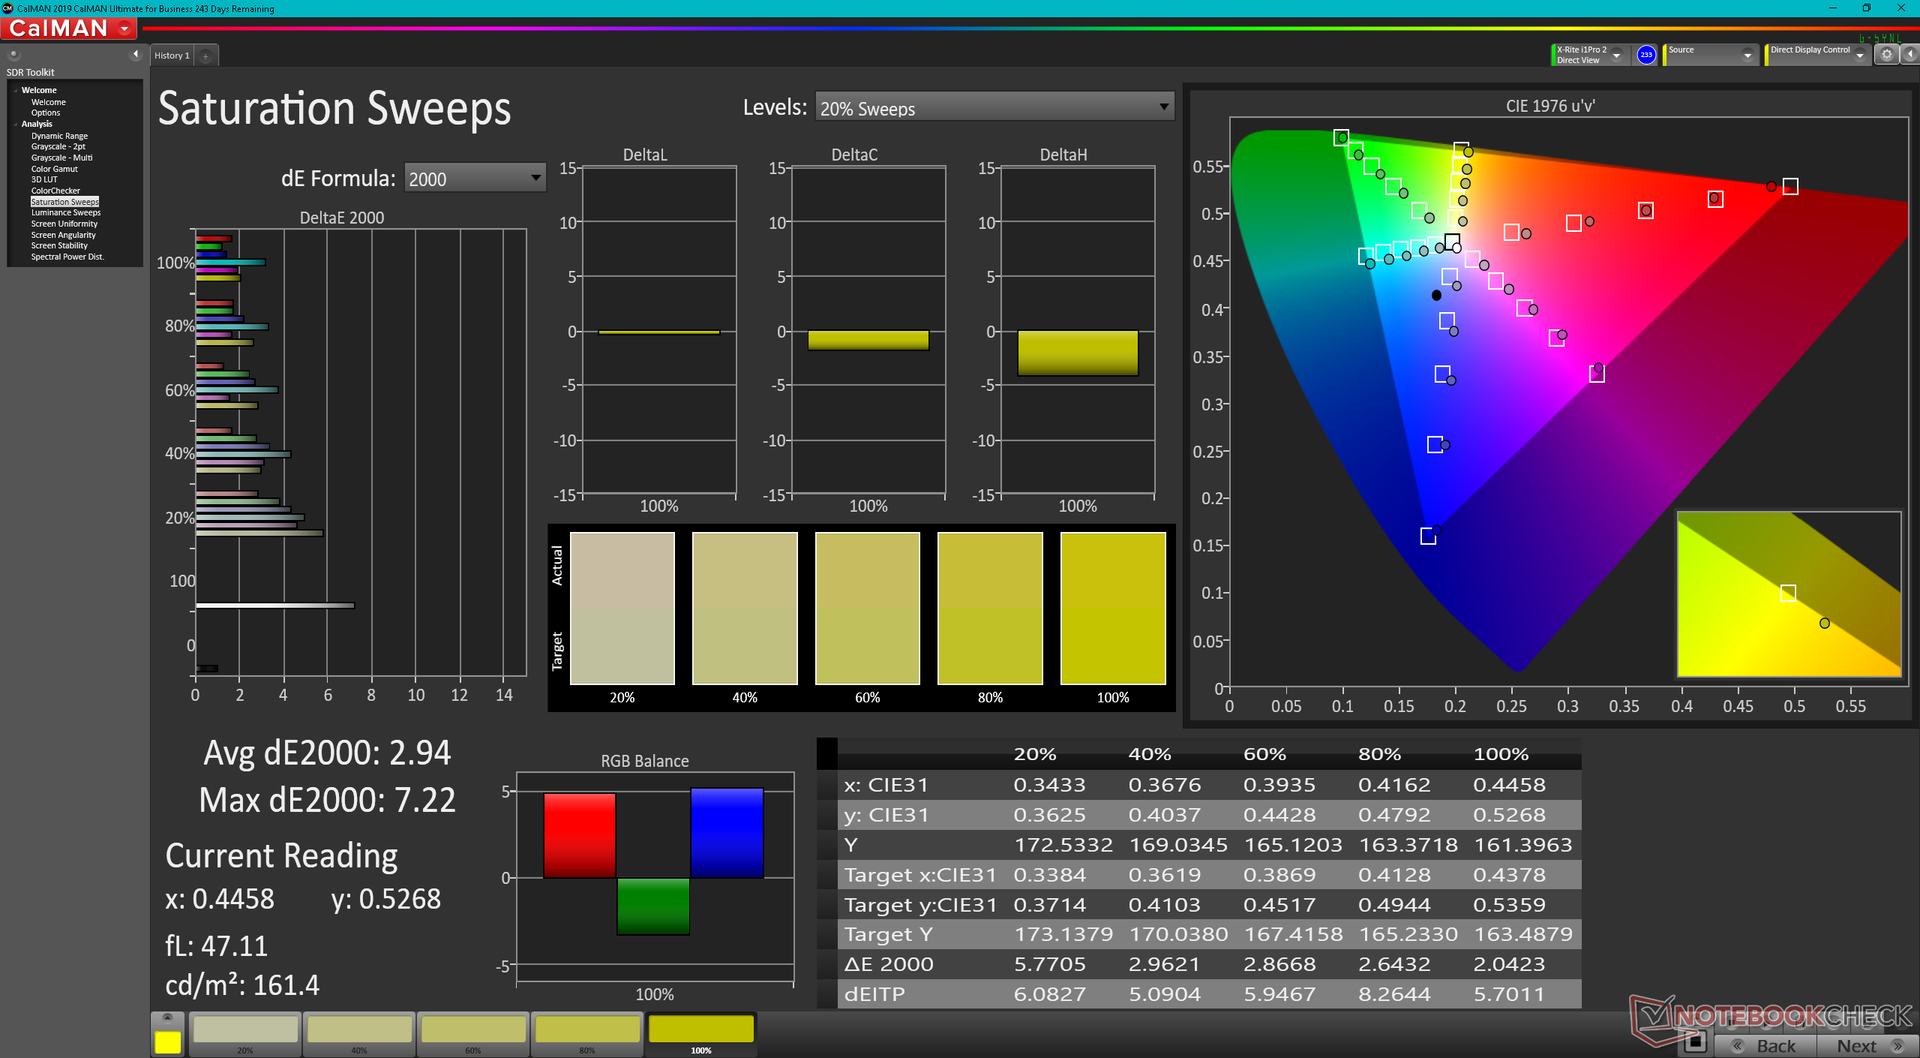
Há, no entanto, duas grandes diferenças entre o visor GS77 e o visor Blade 17. Primeiro, o display GS77 não suporta G-Sync ou sincronização adaptativa devido ao fato de que o modelo não suporta Advanced Optimus ou MUX. Em segundo lugar, o painel do GS77 não está calibrado de fábrica e, portanto, as cores estão visivelmente desalinhadas mesmo quando o perfil está definido para DCI-P3.
| |||||||||||||||||||||||||
iluminação: 79 %
iluminação com acumulador: 334.8 cd/m²
Contraste: 985:1 (Preto: 0.34 cd/m²)
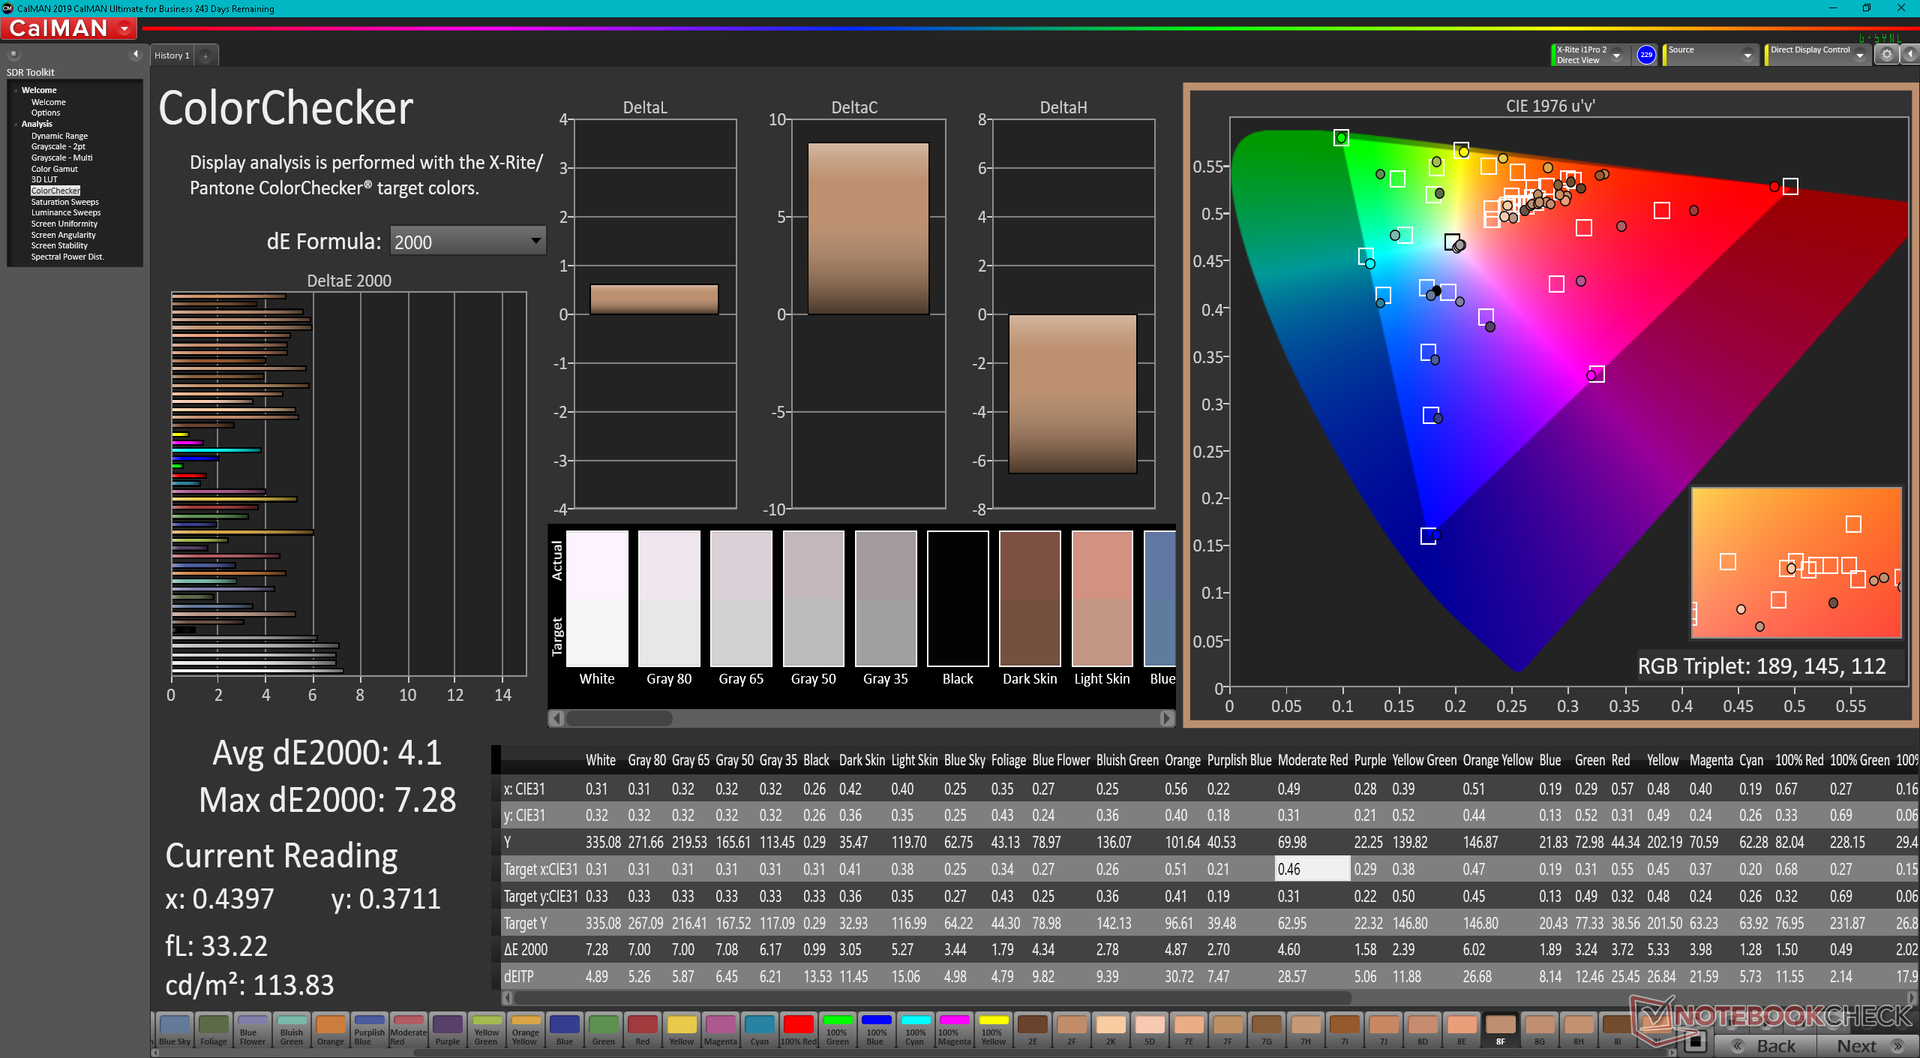
ΔE ColorChecker Calman: 4.1 | ∀{0.5-29.43 Ø4.71}
ΔE Greyscale Calman: 5.6 | ∀{0.09-98 Ø4.96}
85.8% AdobeRGB 1998 (Argyll 3D)
99.7% sRGB (Argyll 3D)
96.2% Display P3 (Argyll 3D)
Gamma: 2.16
CCT: 6314 K
| MSI Stealth GS77 12UHS-083US BOE NE173QHM-NZ1, IPS, 2560x1440, 17.3" | MSI GS76 Stealth 11UH AUO B173ZAN06.1 (AUODE95), IPS, 3840x2160, 17.3" | Razer Blade 17 RTX 3080 Ti BOE NE173QHM-NZ1, IPS, 2560x1440, 17.3" | MSI GE76 Raider AU Optronics B173HAN05.4 (AUOE295), IPS-Level, 1920x1080, 17.3" | Alienware x17 RTX 3080 P48E AU Optronics B173ZAN, IPS, 3840x2160, 17.3" | Asus ROG Zephyrus S17 GX703HSD BOE099D (BOE CQ NE173QHM-NY3), IPS, 2560x1440, 17.3" | |
|---|---|---|---|---|---|---|
| Display | -21% | 1% | -21% | 3% | -2% | |
| Display P3 Coverage (%) | 96.2 | 63 -35% | 98.7 3% | 63.1 -34% | 88.3 -8% | 94.2 -2% |
| sRGB Coverage (%) | 99.7 | 94.8 -5% | 99.9 0% | 94 -6% | 100 0% | 98.7 -1% |
| AdobeRGB 1998 Coverage (%) | 85.8 | 65 -24% | 86.2 0% | 65.2 -24% | 100 17% | 84.4 -2% |
| Response Times | 50% | 6% | 47% | 19% | 55% | |
| Response Time Grey 50% / Grey 80% * (ms) | 17.6 ? | 8.8 ? 50% | 17.6 ? -0% | 5.6 ? 68% | 14.4 ? 18% | 4.8 73% |
| Response Time Black / White * (ms) | 12.8 ? | 6.4 ? 50% | 11.4 ? 11% | 9.6 ? 25% | 10.4 ? 19% | 8 37% |
| PWM Frequency (Hz) | ||||||
| Screen | 26% | 13% | 30% | 12% | 13% | |
| Brightness middle (cd/m²) | 334.8 | 474 42% | 335.9 0% | 290 -13% | 438.7 31% | 322 -4% |
| Brightness (cd/m²) | 305 | 454 49% | 294 -4% | 290 -5% | 435 43% | 288 -6% |
| Brightness Distribution (%) | 79 | 88 11% | 75 -5% | 96 22% | 91 15% | 72 -9% |
| Black Level * (cd/m²) | 0.34 | 0.46 -35% | 0.38 -12% | 0.23 32% | 0.48 -41% | 0.3 12% |
| Contrast (:1) | 985 | 1030 5% | 884 -10% | 1261 28% | 914 -7% | 1073 9% |
| Colorchecker dE 2000 * | 4.1 | 1.5 63% | 2.82 31% | 1.59 61% | 4.34 -6% | 3.05 26% |
| Colorchecker dE 2000 max. * | 7.28 | 5.59 23% | 5.04 31% | 3.17 56% | 7.3 -0% | 5.23 28% |
| Greyscale dE 2000 * | 5.6 | 2.8 50% | 1.7 70% | 2.5 55% | 2.4 57% | 3.11 44% |
| Gamma | 2.16 102% | 2.158 102% | 2.14 103% | 2.253 98% | 2.09 105% | 2.13 103% |
| CCT | 6314 103% | 6597 99% | 6382 102% | 6640 98% | 6413 101% | 6553 99% |
| Colorchecker dE 2000 calibrated * | 0.86 | 0.87 | 0.72 | 1.92 | ||
| Color Space (Percent of AdobeRGB 1998) (%) | 84 | |||||
| Color Space (Percent of sRGB) (%) | 99 | |||||
| Média Total (Programa/Configurações) | 18% /
19% | 7% /
9% | 19% /
20% | 11% /
11% | 22% /
16% |
* ... menor é melhor
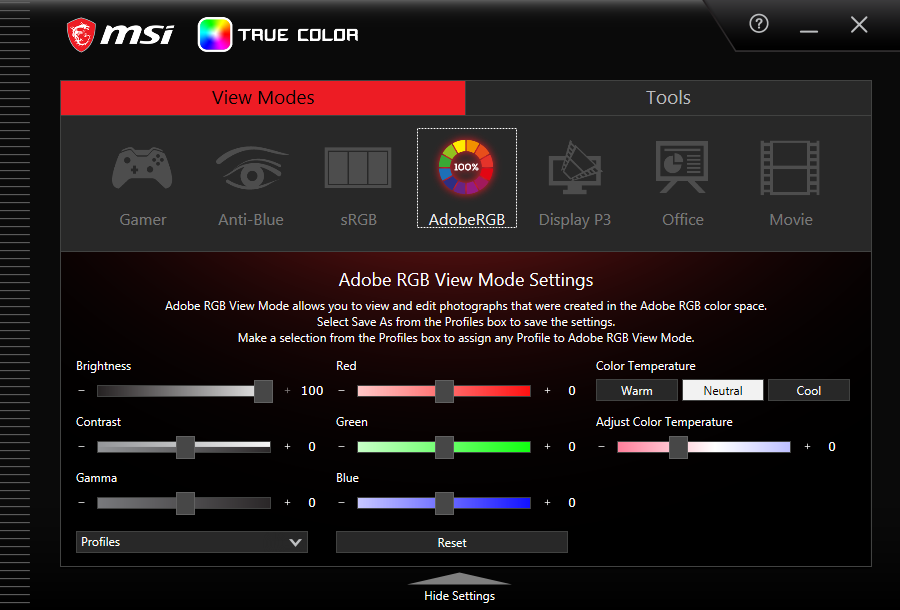
Como mencionado acima, a MSI não calibra cada painel na fábrica e isto mostra com nosso colorímetro X-Rite. A temperatura da cor é muito quente fora da caixa e por isso os valores médios DeltaE são relativamente altos no GS77 como resultado. Felizmente, os usuários podem ajustar manualmente a temperatura de cor e os valores RGB através do software MSI True Color pré-instalado sem grandes problemas.
Exibir tempos de resposta
| ↔ Tempo de resposta preto para branco | ||
|---|---|---|
| 12.8 ms ... ascensão ↗ e queda ↘ combinadas | ↗ 7.6 ms ascensão | 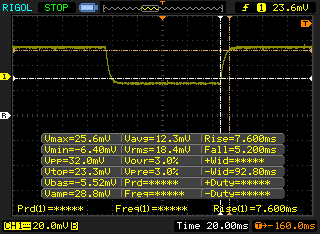 |
| ↘ 5.2 ms queda | ||
| A tela mostra boas taxas de resposta em nossos testes, mas pode ser muito lenta para jogadores competitivos. Em comparação, todos os dispositivos testados variam de 0.1 (mínimo) a 240 (máximo) ms. » 33 % de todos os dispositivos são melhores. Isso significa que o tempo de resposta medido é melhor que a média de todos os dispositivos testados (19.8 ms). | ||
| ↔ Tempo de resposta 50% cinza a 80% cinza | ||
| 17.6 ms ... ascensão ↗ e queda ↘ combinadas | ↗ 10 ms ascensão | 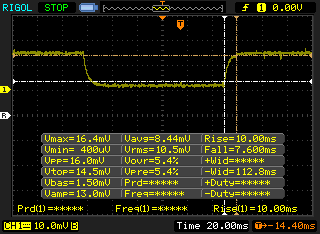 |
| ↘ 7.6 ms queda | ||
| A tela mostra boas taxas de resposta em nossos testes, mas pode ser muito lenta para jogadores competitivos. Em comparação, todos os dispositivos testados variam de 0.165 (mínimo) a 636 (máximo) ms. » 32 % de todos os dispositivos são melhores. Isso significa que o tempo de resposta medido é melhor que a média de todos os dispositivos testados (31 ms). | ||
Cintilação da tela / PWM (modulação por largura de pulso)
| Tela tremeluzindo / PWM não detectado | 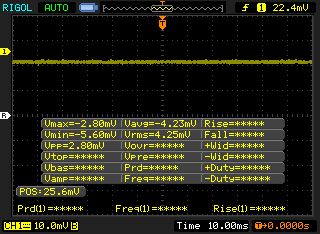 | ||
[pwm_comparison] Em comparação: 52 % de todos os dispositivos testados não usam PWM para escurecer a tela. Se PWM foi detectado, uma média de 7757 (mínimo: 5 - máximo: 343500) Hz foi medida. | |||
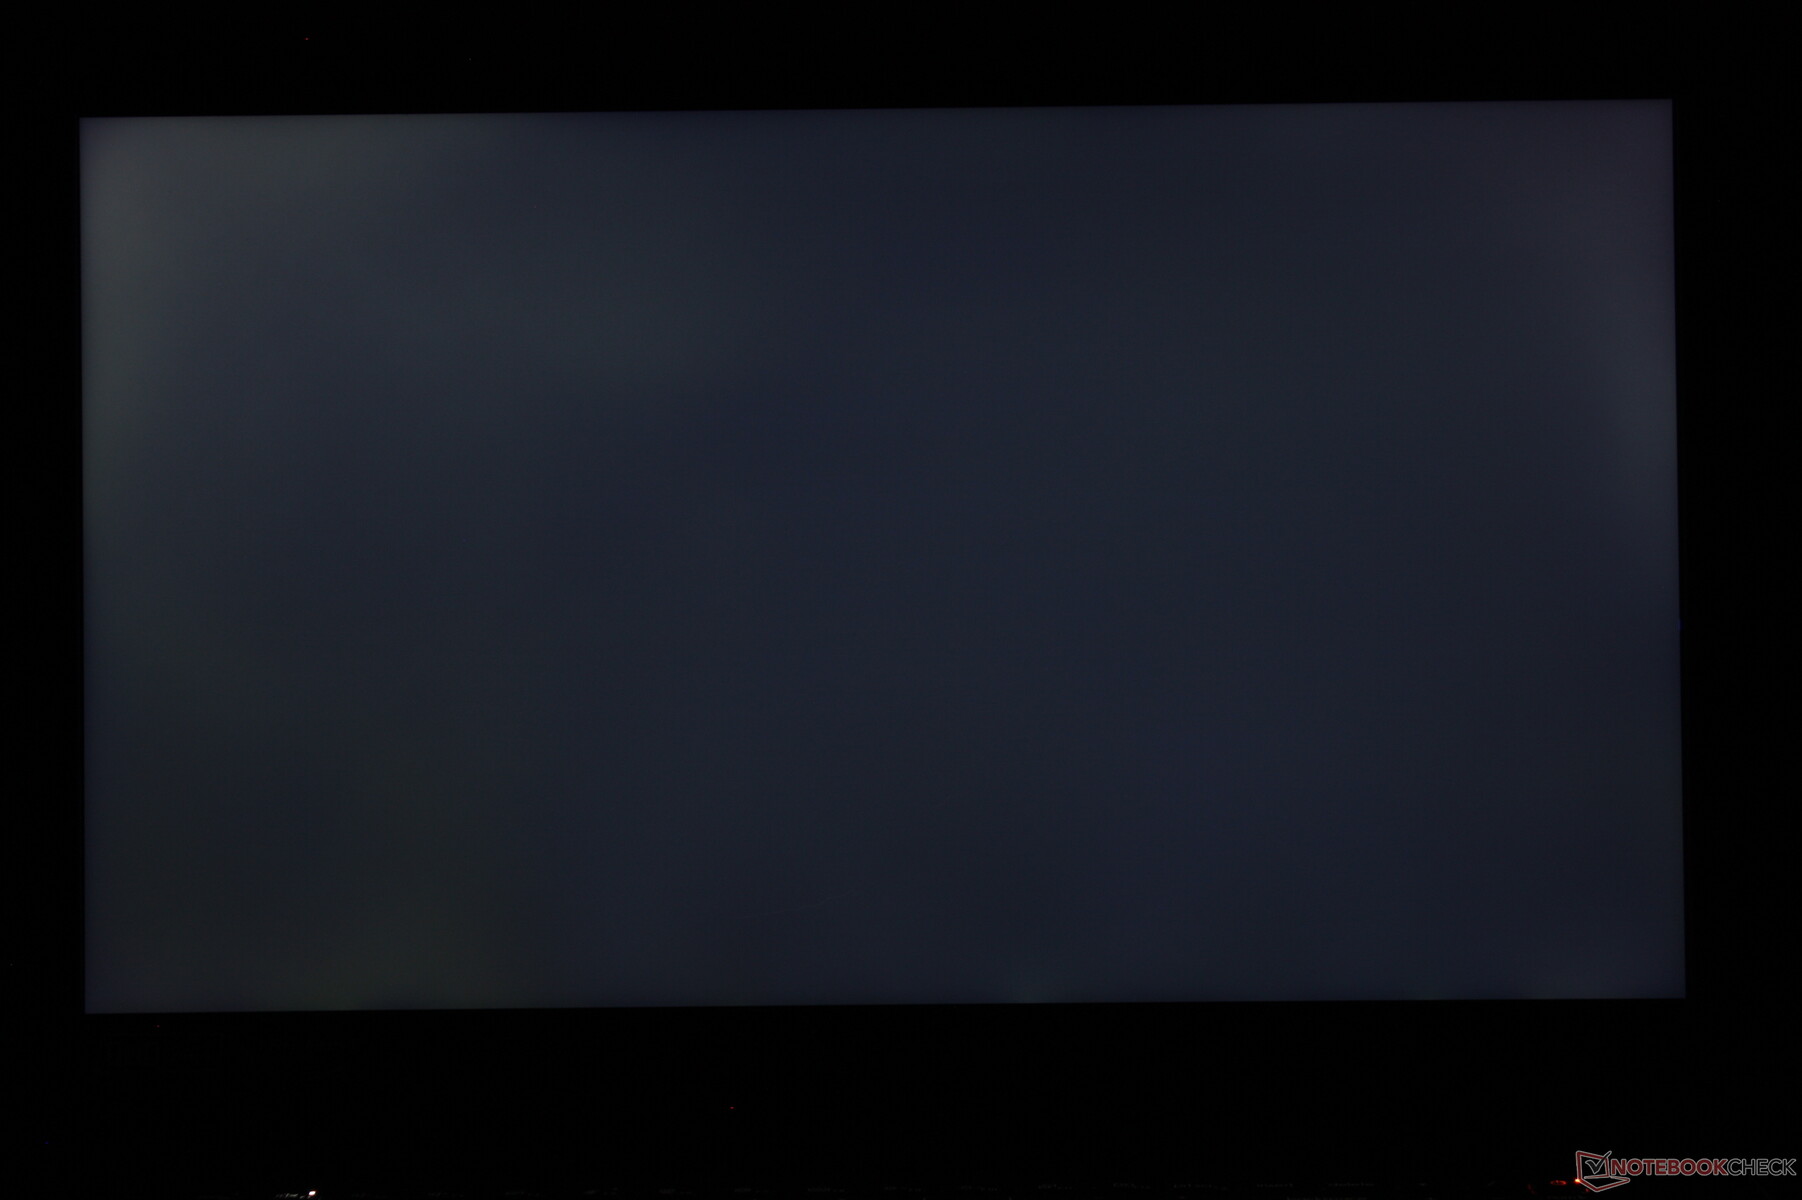
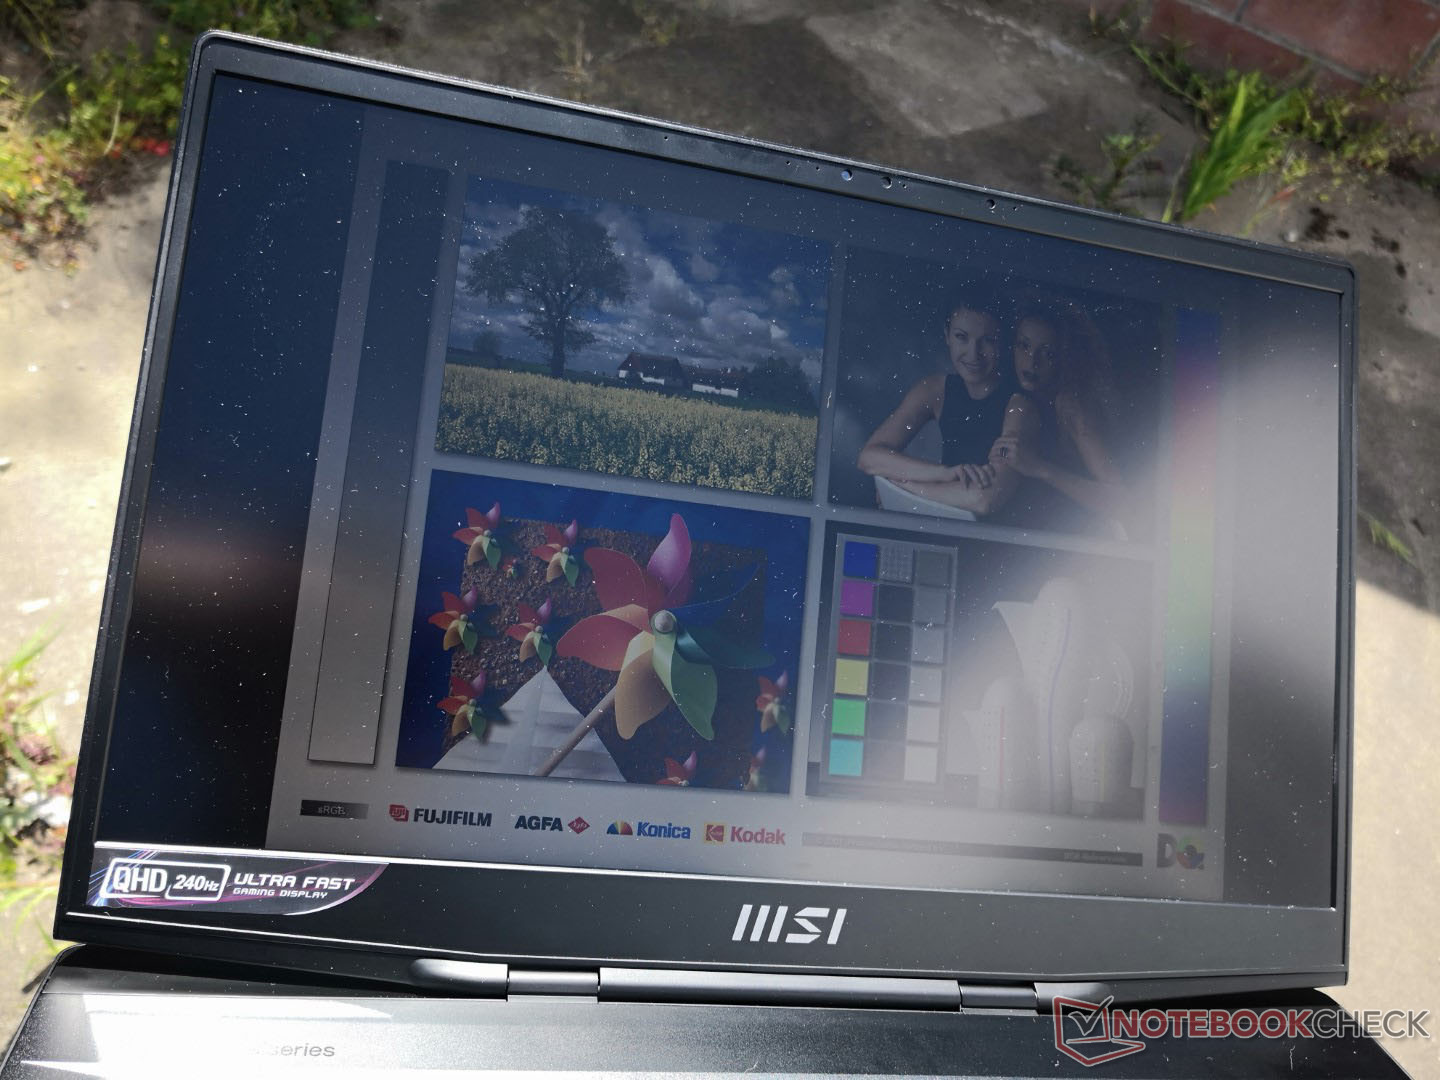
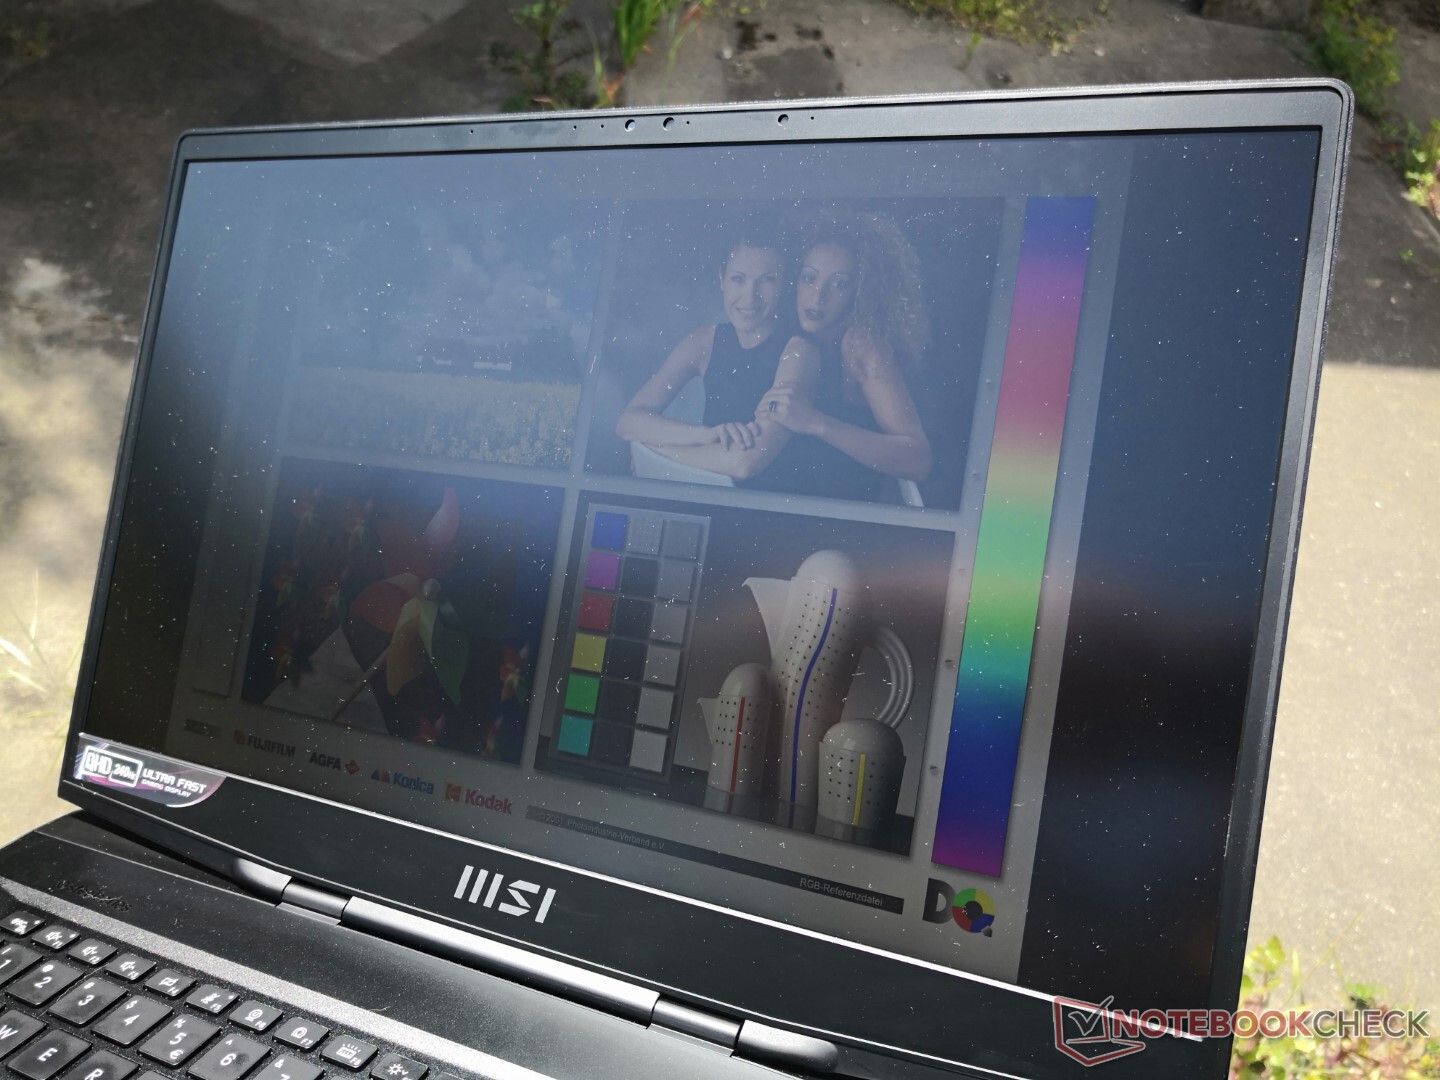
Nosso display de 1440p é quase 30% mais escuro do que o que registramos no 4K GS76 para estar em um nível mais similar ao do Blade 17. A visibilidade ao ar livre não é tão boa quanto no modelo do ano passado.
Desempenho - Intel da 12ª geração com gráficos TGP de 105 W
Condições de teste
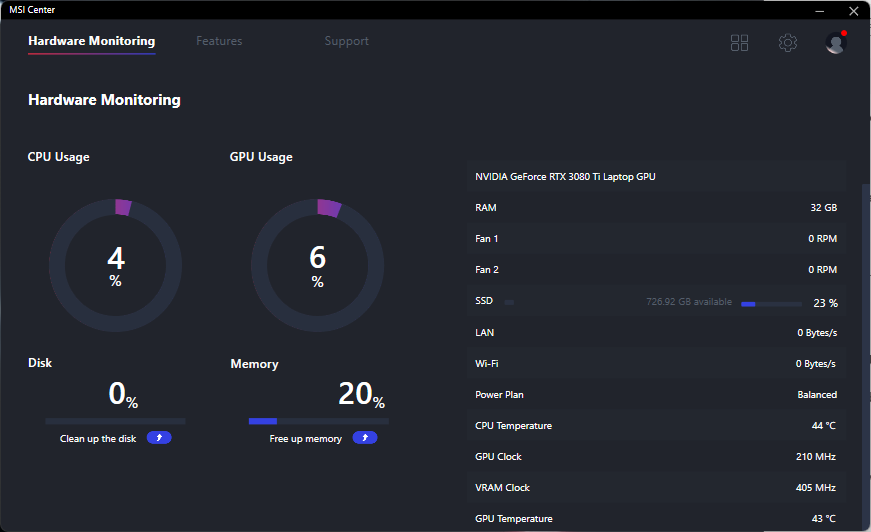
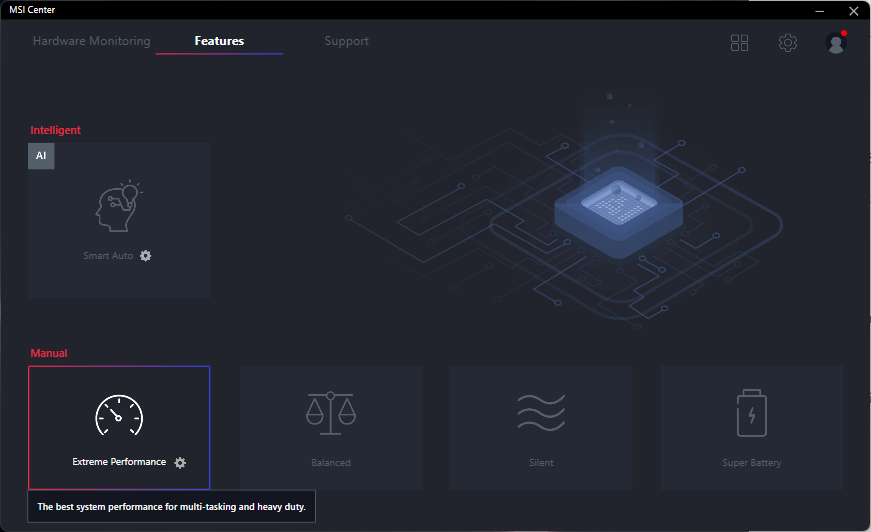
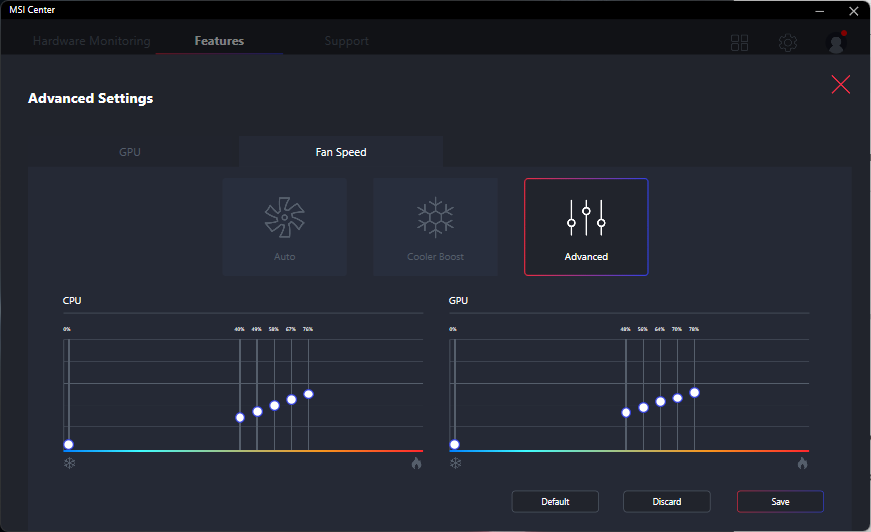
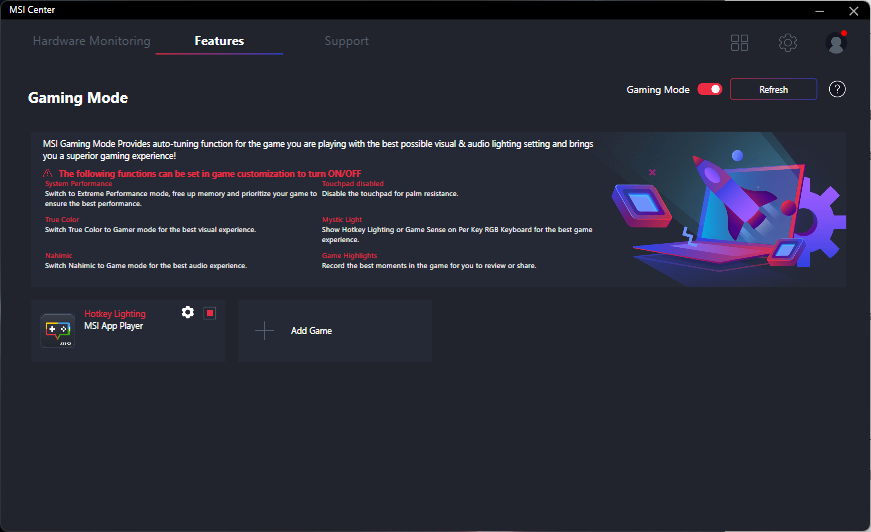
Configuramos nossa unidade para o modo Extreme Performance através do software MSI Control Center pré-instalado antes de executar quaisquer benchmarks abaixo. Recomendamos aos usuários que se familiarizem com este software, pois as principais características do sistema são combinadas aqui.
Processador - Grandes ganhos de ano para ano
O desempenho da CPU é excelente com resultados que estão dentro de um ou dois pontos percentuais da média do laptop em nosso banco de dados equipado com o mesmo Core i7-12700H CPU. O desempenho de múltiplas roscas é ainda mais rápido que o do Core i7-12800H na Lâmina 17 por 6 a 8 por cento. Embora a vantagem seja relativamente menor, ela explica as taxas de quadros ligeiramente mais altas quando se joga com resoluções mais baixas no GS77 versus na Lâmina 17.
O GS77 vem com um preço mais alto
Núcleo i9-12900H mas o aumento de desempenho deve ser de apenas alguns pontos percentuais sobre nosso Core i7-12700H com base em nossa experiência com um punhado de laptops Core i9-12900H já no mercado.O upgrade de desempenho ano após ano em relação à 11ª geração da Intel Tiger Lake-H série é mais significativo. Quando comparado com o Core i9-11900H no ano passado, o GS76o nosso Core i7-12700H é cerca de 15% e 25% a 30% mais rápido em operações de rosca única e rosca múltipla, respectivamente.
Cinebench R15 Multi Loop
Cinebench R23: Multi Core | Single Core
Cinebench R15: CPU Multi 64Bit | CPU Single 64Bit
Blender: v2.79 BMW27 CPU
7-Zip 18.03: 7z b 4 | 7z b 4 -mmt1
Geekbench 5.5: Multi-Core | Single-Core
HWBOT x265 Benchmark v2.2: 4k Preset
LibreOffice : 20 Documents To PDF
R Benchmark 2.5: Overall mean
Cinebench R23: Multi Core | Single Core
Cinebench R15: CPU Multi 64Bit | CPU Single 64Bit
Blender: v2.79 BMW27 CPU
7-Zip 18.03: 7z b 4 | 7z b 4 -mmt1
Geekbench 5.5: Multi-Core | Single-Core
HWBOT x265 Benchmark v2.2: 4k Preset
LibreOffice : 20 Documents To PDF
R Benchmark 2.5: Overall mean
* ... menor é melhor
AIDA64: FP32 Ray-Trace | FPU Julia | CPU SHA3 | CPU Queen | FPU SinJulia | FPU Mandel | CPU AES | CPU ZLib | FP64 Ray-Trace | CPU PhotoWorxx
| Performance rating | |
| MSI GE76 Raider | |
| Média Intel Core i7-12700H | |
| MSI Stealth GS77 12UHS-083US | |
| Razer Blade 17 RTX 3080 Ti | |
| AIDA64 / FP32 Ray-Trace | |
| Média Intel Core i7-12700H (2585 - 17957, n=64) | |
| MSI GE76 Raider | |
| MSI Stealth GS77 12UHS-083US | |
| Razer Blade 17 RTX 3080 Ti | |
| AIDA64 / FPU Julia | |
| Média Intel Core i7-12700H (12439 - 90760, n=64) | |
| MSI GE76 Raider | |
| MSI Stealth GS77 12UHS-083US | |
| Razer Blade 17 RTX 3080 Ti | |
| AIDA64 / CPU SHA3 | |
| MSI GE76 Raider | |
| MSI Stealth GS77 12UHS-083US | |
| Média Intel Core i7-12700H (833 - 4242, n=64) | |
| Razer Blade 17 RTX 3080 Ti | |
| AIDA64 / CPU Queen | |
| MSI GE76 Raider | |
| Razer Blade 17 RTX 3080 Ti | |
| MSI Stealth GS77 12UHS-083US | |
| Média Intel Core i7-12700H (57923 - 103202, n=63) | |
| AIDA64 / FPU SinJulia | |
| MSI GE76 Raider | |
| MSI Stealth GS77 12UHS-083US | |
| Razer Blade 17 RTX 3080 Ti | |
| Média Intel Core i7-12700H (3249 - 9939, n=64) | |
| AIDA64 / FPU Mandel | |
| Média Intel Core i7-12700H (7135 - 44760, n=64) | |
| MSI GE76 Raider | |
| MSI Stealth GS77 12UHS-083US | |
| Razer Blade 17 RTX 3080 Ti | |
| AIDA64 / CPU AES | |
| MSI GE76 Raider | |
| MSI Stealth GS77 12UHS-083US | |
| Média Intel Core i7-12700H (31839 - 144360, n=64) | |
| Razer Blade 17 RTX 3080 Ti | |
| AIDA64 / CPU ZLib | |
| MSI GE76 Raider | |
| MSI Stealth GS77 12UHS-083US | |
| Média Intel Core i7-12700H (305 - 1171, n=64) | |
| Razer Blade 17 RTX 3080 Ti | |
| AIDA64 / FP64 Ray-Trace | |
| Média Intel Core i7-12700H (1437 - 9692, n=64) | |
| MSI GE76 Raider | |
| MSI Stealth GS77 12UHS-083US | |
| Razer Blade 17 RTX 3080 Ti | |
| AIDA64 / CPU PhotoWorxx | |
| Razer Blade 17 RTX 3080 Ti | |
| MSI GE76 Raider | |
| MSI Stealth GS77 12UHS-083US | |
| Média Intel Core i7-12700H (12863 - 52207, n=64) | |
Desempenho do sistema
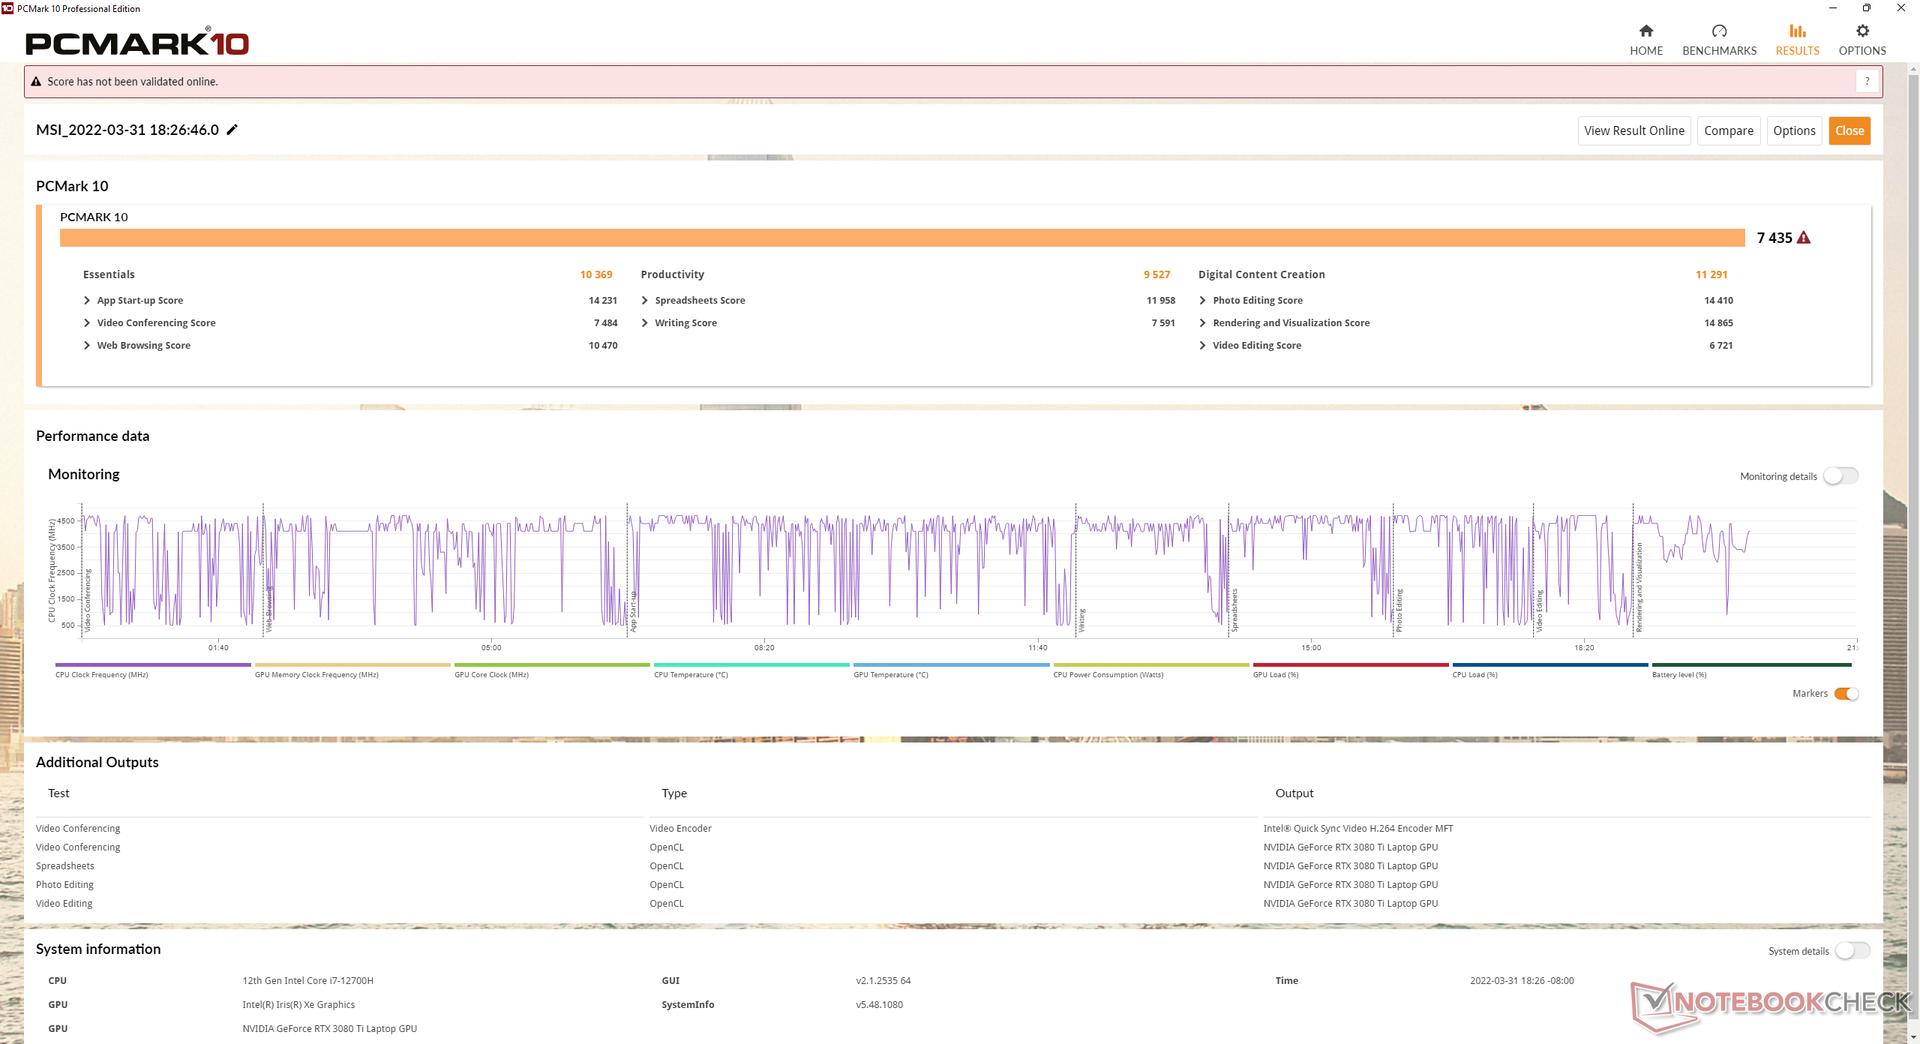
Os resultados da PCMark estão consistentemente à frente da GS76 do ano passado, mas ligeiramente atrás da última Lâmina 17
Experimentamos alguns problemas relacionados ao modo Sleep e à taxa de atualização que vale a pena mencionar em nossa unidade de revisão. Ao colocar o sistema para dormir, o consumo de energia às vezes seria anormalmente alto e com temperaturas de superfície muito quentes. Enquanto isso, alguns jogos, incluindo Witcher 3o Far Cry 5 e o Strange Brigade se transformariam em preto quando a taxa de atualização nativa do visor fosse ajustada para 240 Hz em vez de 60 Hz. Nenhuma destas questões apareceu em nossa unidade Blade 17, embora ambos os laptops estejam usando os mesmos painéis de 240 Hz da BOE.
| PCMark 10 / Score | |
| MSI GE76 Raider | |
| Razer Blade 17 RTX 3080 Ti | |
| Alienware x17 RTX 3080 P48E | |
| MSI Stealth GS77 12UHS-083US | |
| Média Intel Core i7-12700H, NVIDIA GeForce RTX 3080 Ti Laptop GPU (6868 - 7638, n=7) | |
| Asus ROG Zephyrus S17 GX703HSD | |
| MSI GS76 Stealth 11UH | |
| PCMark 10 / Essentials | |
| Razer Blade 17 RTX 3080 Ti | |
| MSI GE76 Raider | |
| Asus ROG Zephyrus S17 GX703HSD | |
| Média Intel Core i7-12700H, NVIDIA GeForce RTX 3080 Ti Laptop GPU (9987 - 11318, n=7) | |
| MSI Stealth GS77 12UHS-083US | |
| Alienware x17 RTX 3080 P48E | |
| MSI GS76 Stealth 11UH | |
| PCMark 10 / Productivity | |
| MSI GE76 Raider | |
| Alienware x17 RTX 3080 P48E | |
| MSI Stealth GS77 12UHS-083US | |
| Média Intel Core i7-12700H, NVIDIA GeForce RTX 3080 Ti Laptop GPU (8944 - 10726, n=7) | |
| Razer Blade 17 RTX 3080 Ti | |
| Asus ROG Zephyrus S17 GX703HSD | |
| MSI GS76 Stealth 11UH | |
| PCMark 10 / Digital Content Creation | |
| MSI GE76 Raider | |
| Razer Blade 17 RTX 3080 Ti | |
| Alienware x17 RTX 3080 P48E | |
| MSI Stealth GS77 12UHS-083US | |
| Média Intel Core i7-12700H, NVIDIA GeForce RTX 3080 Ti Laptop GPU (8956 - 12249, n=7) | |
| Asus ROG Zephyrus S17 GX703HSD | |
| MSI GS76 Stealth 11UH | |
| PCMark 10 Score | 7435 pontos | |
Ajuda | ||
| AIDA64 / Memory Copy | |
| MSI GE76 Raider | |
| Razer Blade 17 RTX 3080 Ti | |
| MSI Stealth GS77 12UHS-083US | |
| Média Intel Core i7-12700H (25615 - 80511, n=64) | |
| AIDA64 / Memory Read | |
| Razer Blade 17 RTX 3080 Ti | |
| MSI GE76 Raider | |
| MSI Stealth GS77 12UHS-083US | |
| Média Intel Core i7-12700H (25586 - 79442, n=64) | |
| AIDA64 / Memory Write | |
| Razer Blade 17 RTX 3080 Ti | |
| MSI Stealth GS77 12UHS-083US | |
| MSI GE76 Raider | |
| Média Intel Core i7-12700H (23679 - 88660, n=64) | |
| AIDA64 / Memory Latency | |
| MSI Stealth GS77 12UHS-083US | |
| MSI GE76 Raider | |
| Média Intel Core i7-12700H (76.2 - 133.9, n=62) | |
| Asus ROG Zephyrus S17 GX703HSD | |
| Alienware x17 RTX 3080 P48E | |
| Razer Blade 17 RTX 3080 Ti | |
* ... menor é melhor
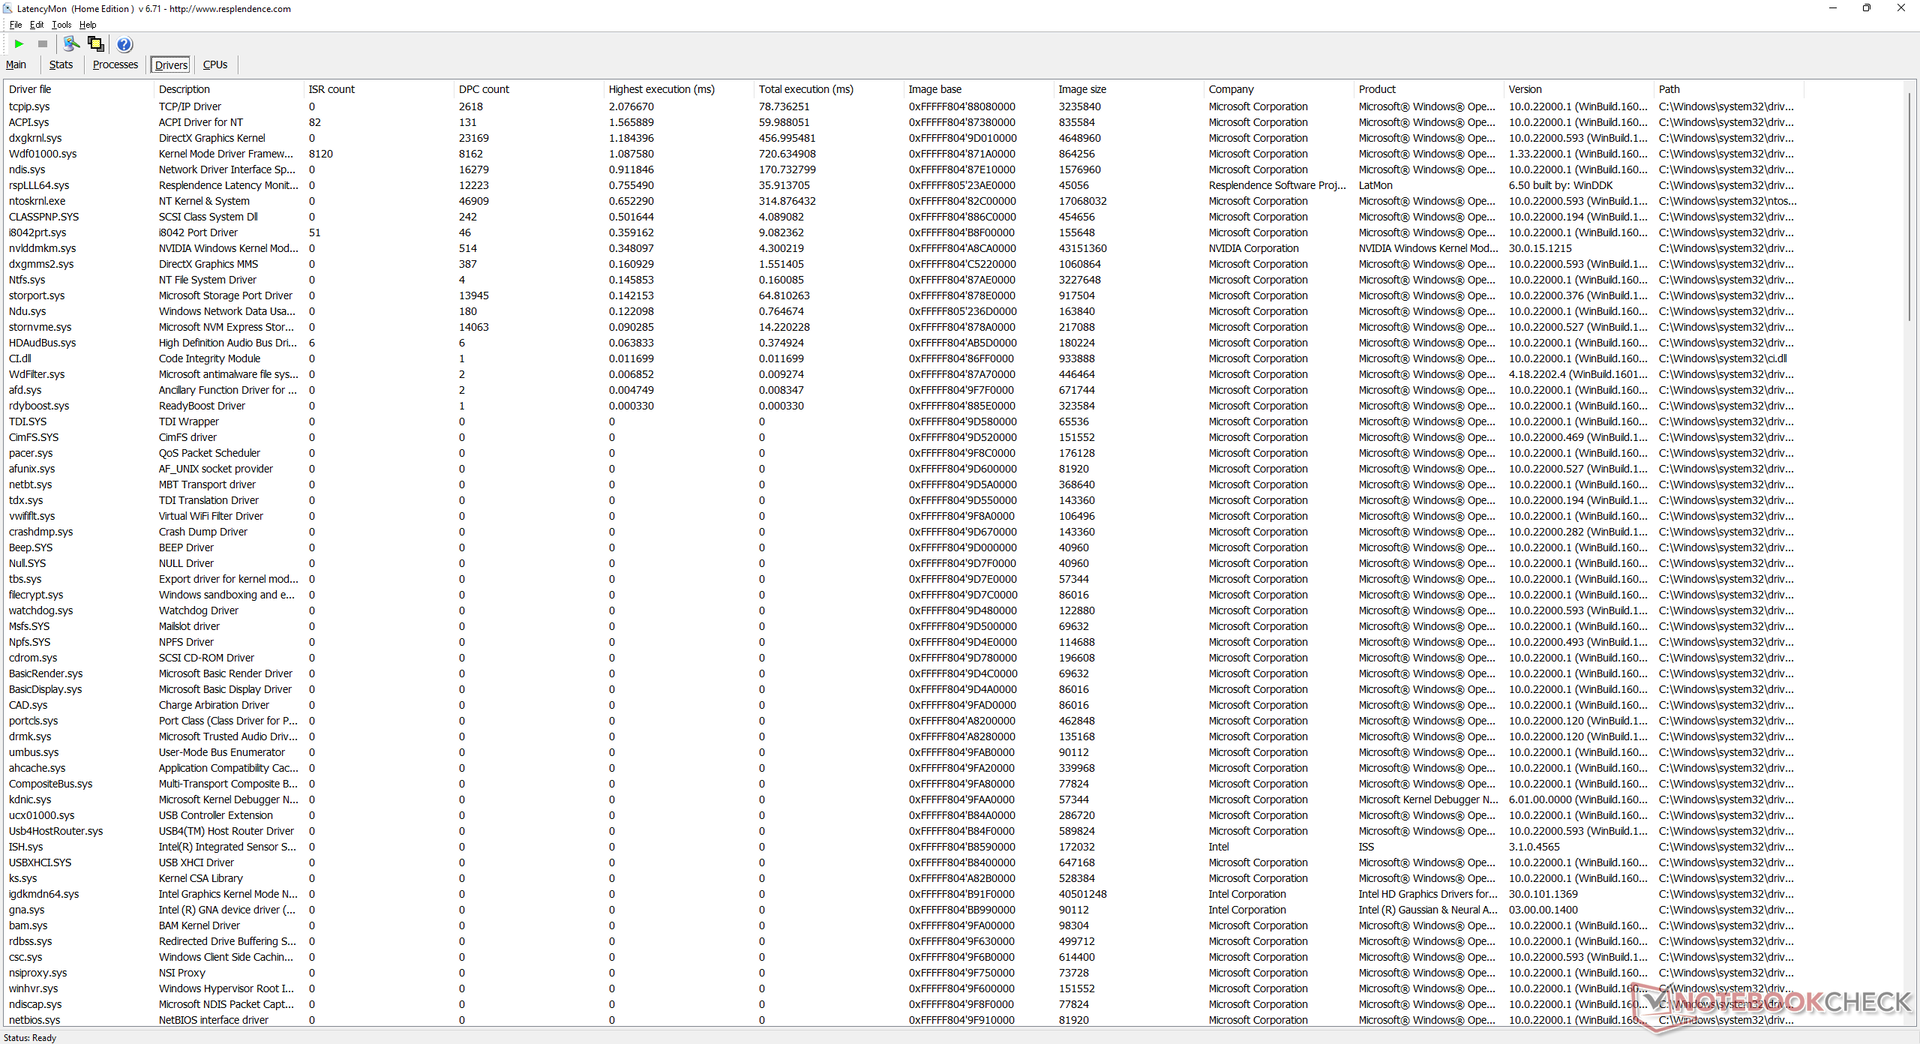
Latência do DPC
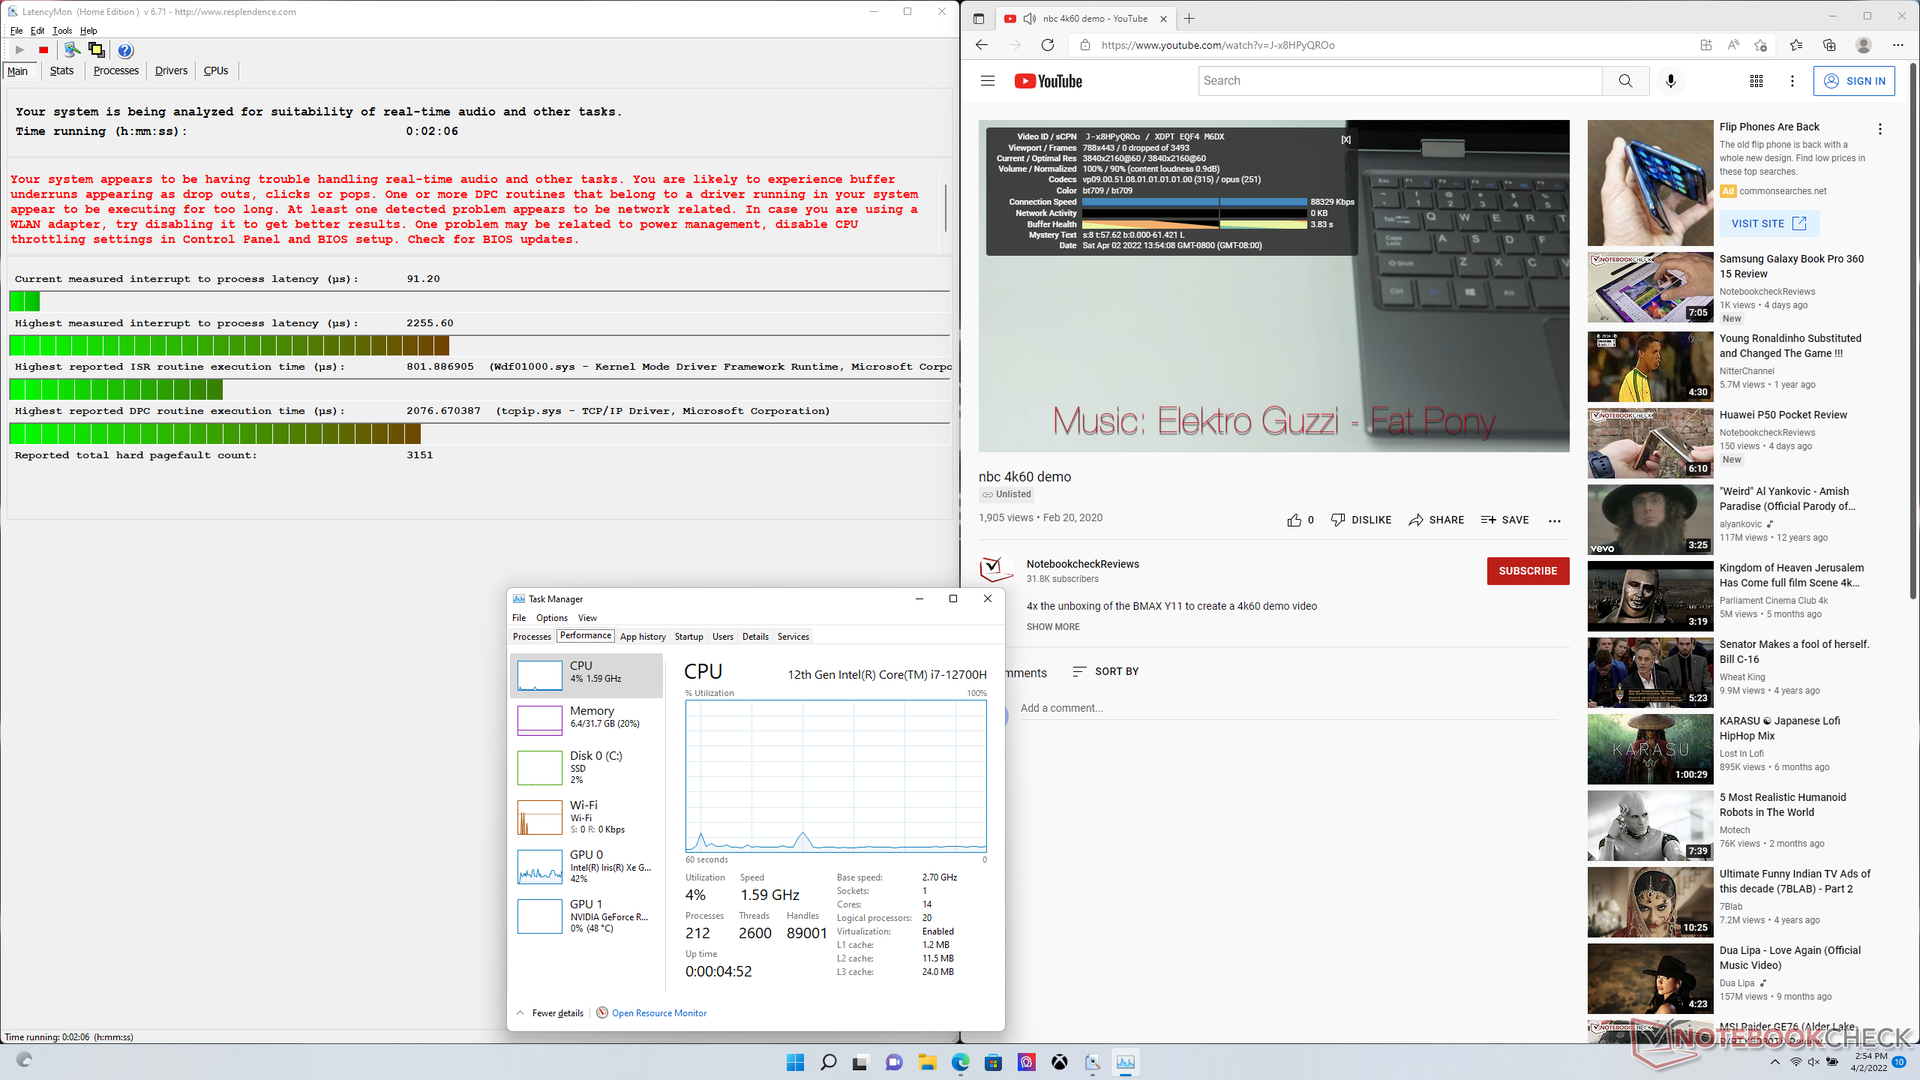
LatencyMon mostra os problemas de DPC ao abrir várias abas do navegador em nossa página inicial. a reprodução de vídeo de 4K a 60 FPS é, de outra forma, completamente suave e sem queda de quadros durante nossos testes no iGPU.
| DPC Latencies / LatencyMon - interrupt to process latency (max), Web, Youtube, Prime95 | |
| Alienware x17 RTX 3080 P48E | |
| MSI Stealth GS77 12UHS-083US | |
| MSI GE76 Raider | |
| Asus ROG Zephyrus S17 GX703HSD | |
| Razer Blade 17 RTX 3080 Ti | |
| MSI GS76 Stealth 11UH | |
* ... menor é melhor
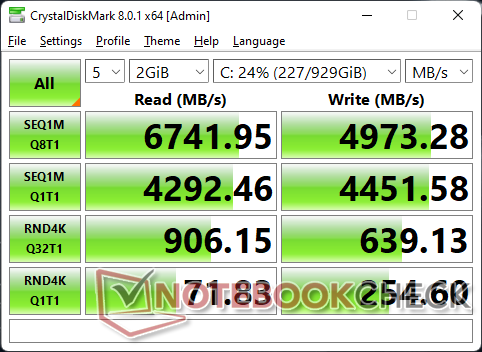
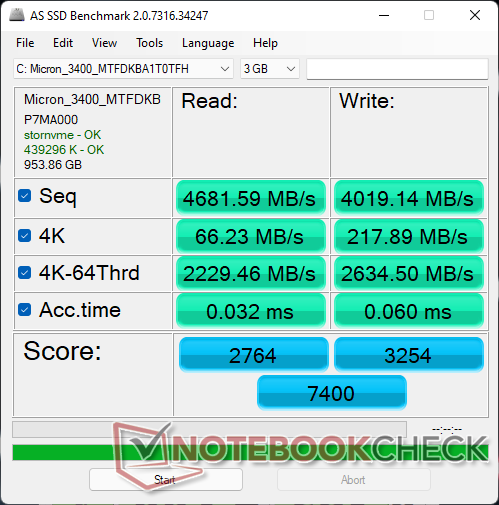
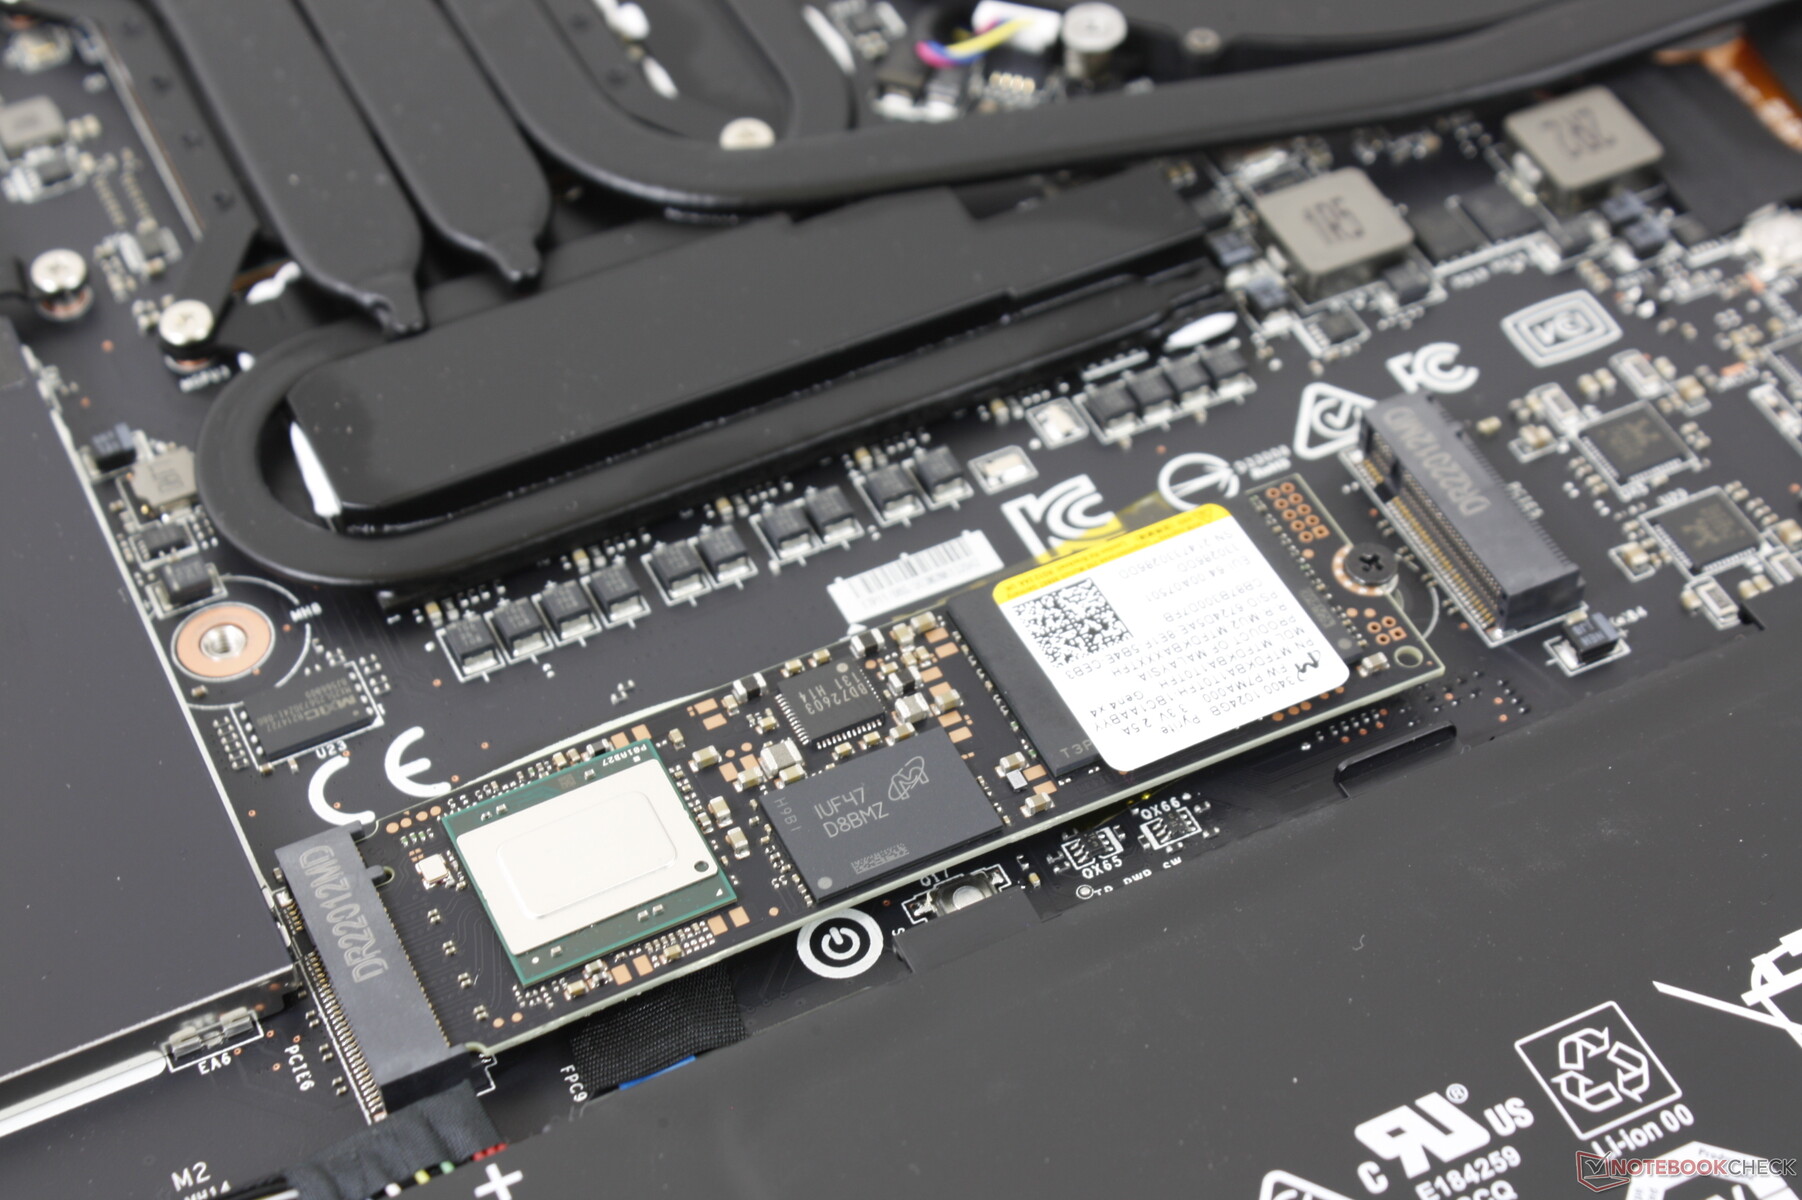
Dispositivos de armazenamento - Até 2x PCIe4 x4 NVMe SSDs
Nossa unidade de teste é fornecida com um Micron 3400 PCIe4 x4 NVMe SSD. Embora seja um drive de alta qualidade, o desempenho parece ser consistentemente mais lento do que o Samsung PM9A1 que vem como padrão na maioria dos laptops de jogos emblemáticos. No entanto, a sustentabilidade do desempenho é excelente quando submetido a nosso teste de loop DiskSpd.

| Drive Performance rating - Percent | |
| Asus ROG Zephyrus S17 GX703HSD | |
| MSI GE76 Raider | |
| Razer Blade 17 RTX 3080 Ti | |
| MSI GS76 Stealth 11UH | |
| MSI Stealth GS77 12UHS-083US | |
| Alienware x17 RTX 3080 P48E | |
* ... menor é melhor
Disk Throttling: DiskSpd Read Loop, Queue Depth 8
Desempenho da GPU - Um pouco mais rápido que o RTX 3080
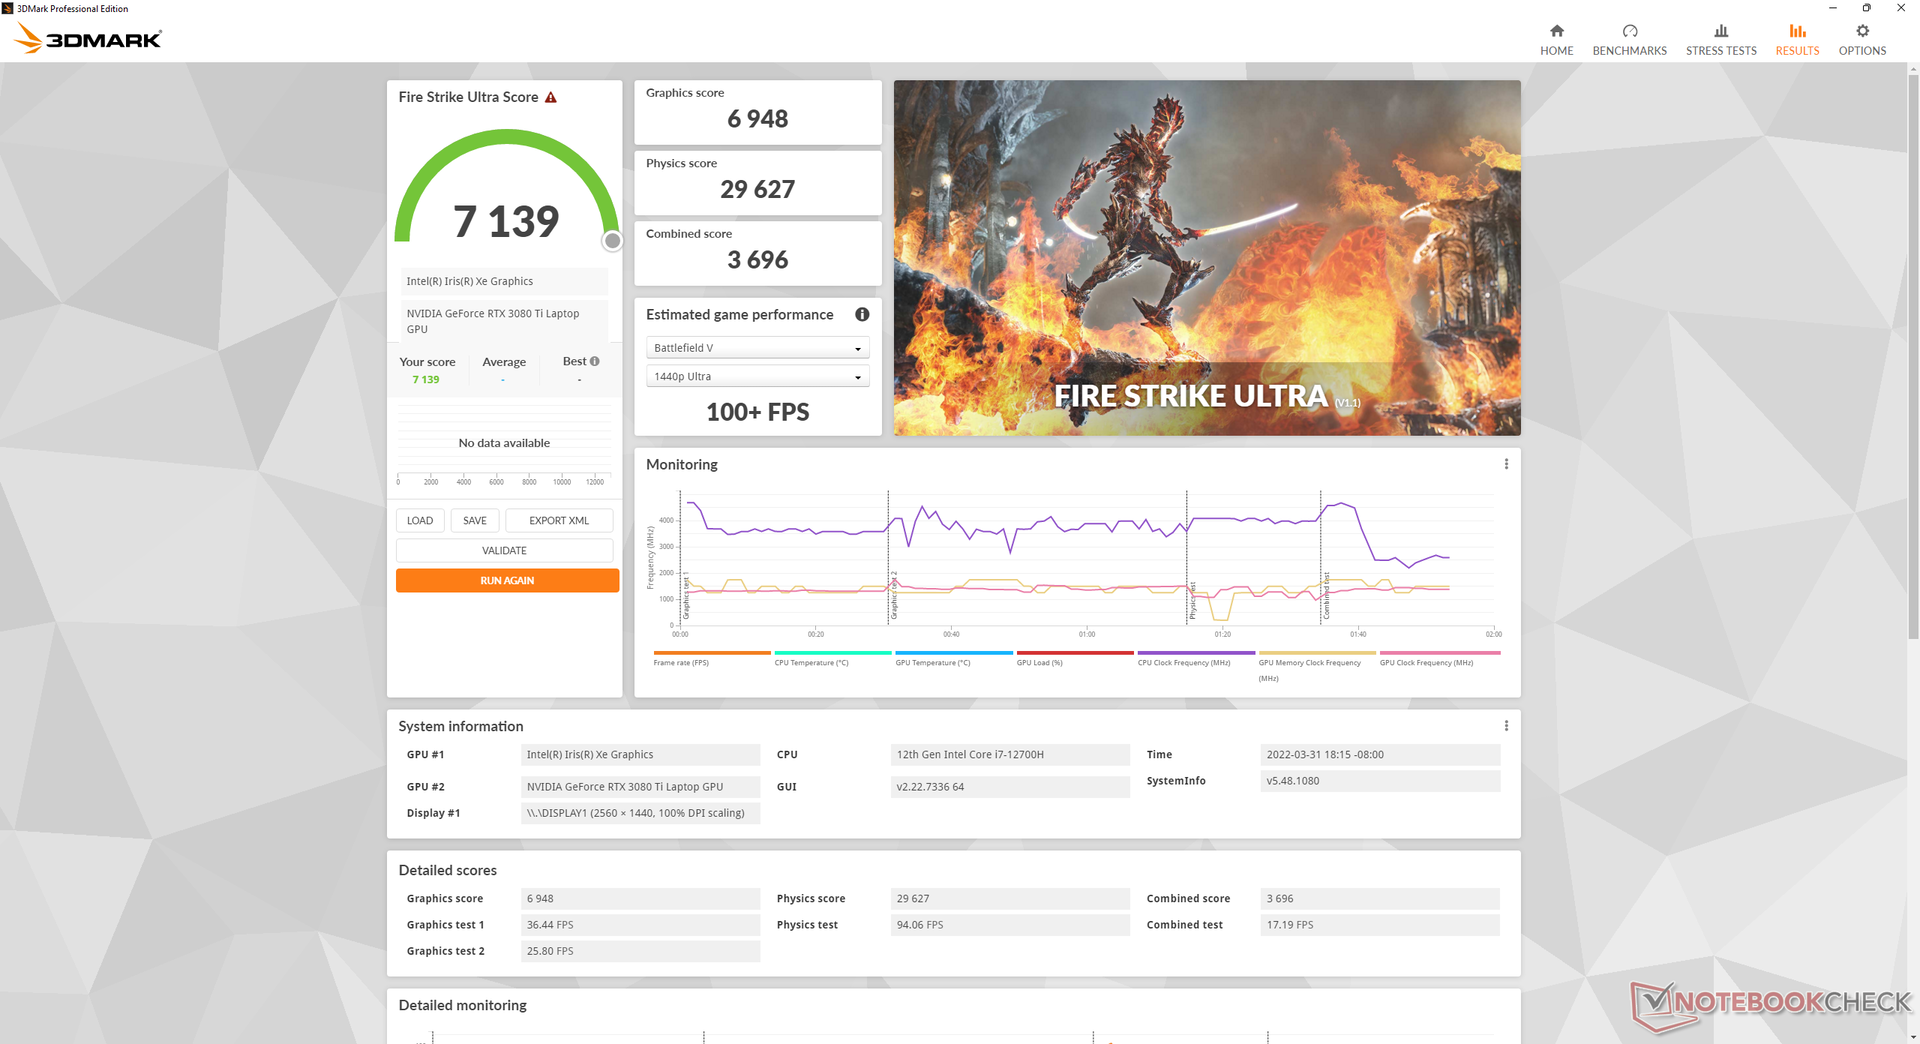
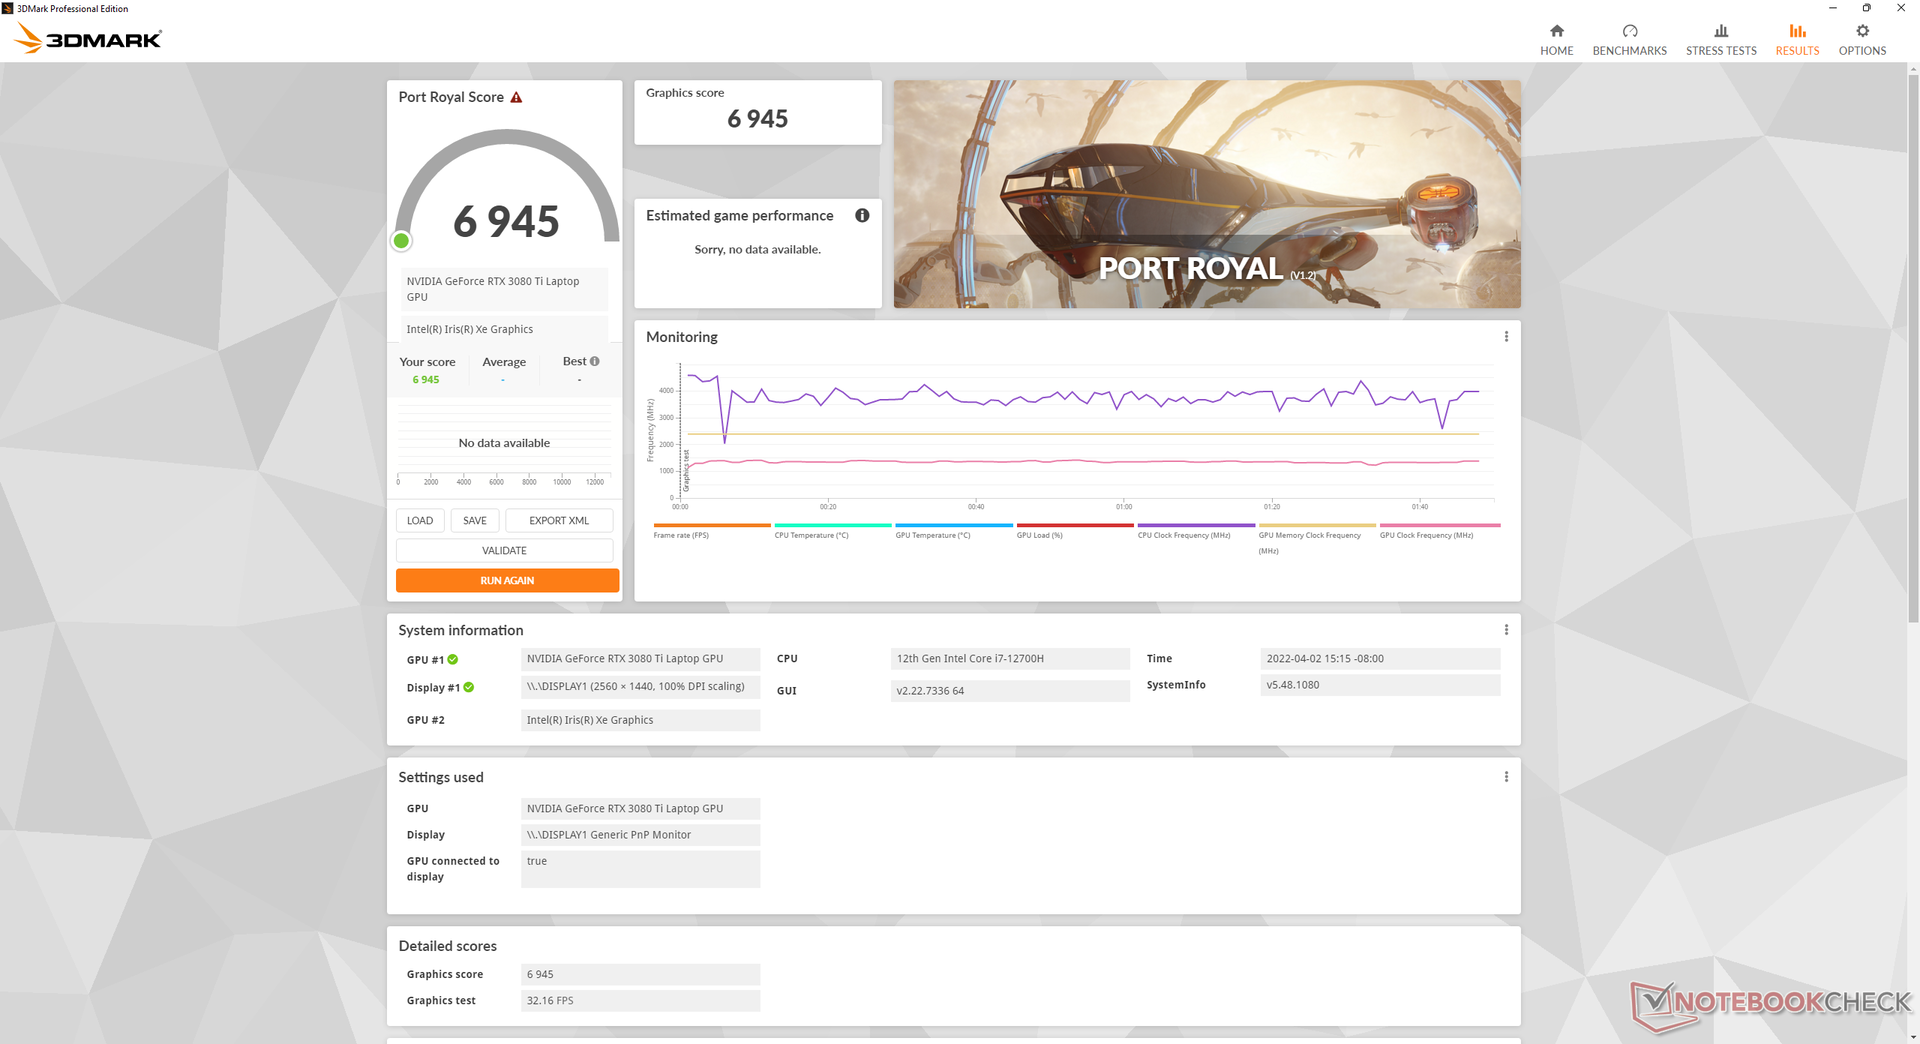
O GeForce RTX 3080 Ti no GS77 oferece um aumento de desempenho de 12 a 15 por cento sobre o RTX 3080 na GS76 do ano passado. Quando comparado com o RTX 3080 Ti de 165 W na Lâmina 17, porém, nosso RTX 3080 Ti de 105 W é cerca de 13 a 18 por cento mais lento. Este delta de desempenho é mais visível quando se joga em resoluções mais altas, onde nosso GS77 ficaria consistentemente atrás da alternativa Razer. Caso contrário, a diferença de desempenho entre um RTX 3080 Ti de 105 W e um RTX 3080 Ti de 165 W será muito mais pequena a 1080p ou resoluções mais baixas, onde os títulos provavelmente estarão vinculados à CPU.
A execução do GS77 no perfil de potência Equilibrado em vez de Desempenho Extremo reduzirá o desempenho da GPU em cerca de 12%.
O desktop GeForce RTX 3080 Ti ainda é significativamente mais rápido que nossa versão móvel em cerca de 65 a 80 por cento.
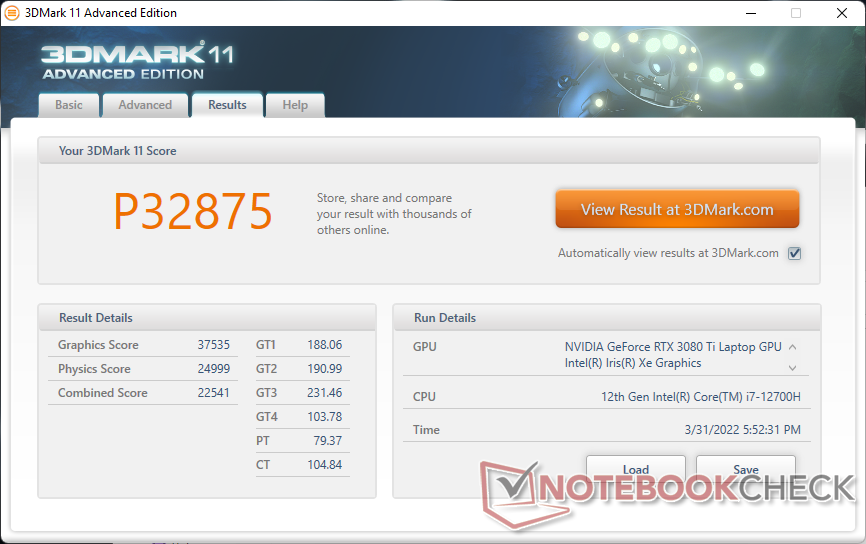
| 3DMark 11 Performance | 32875 pontos | |
| 3DMark Cloud Gate Standard Score | 55980 pontos | |
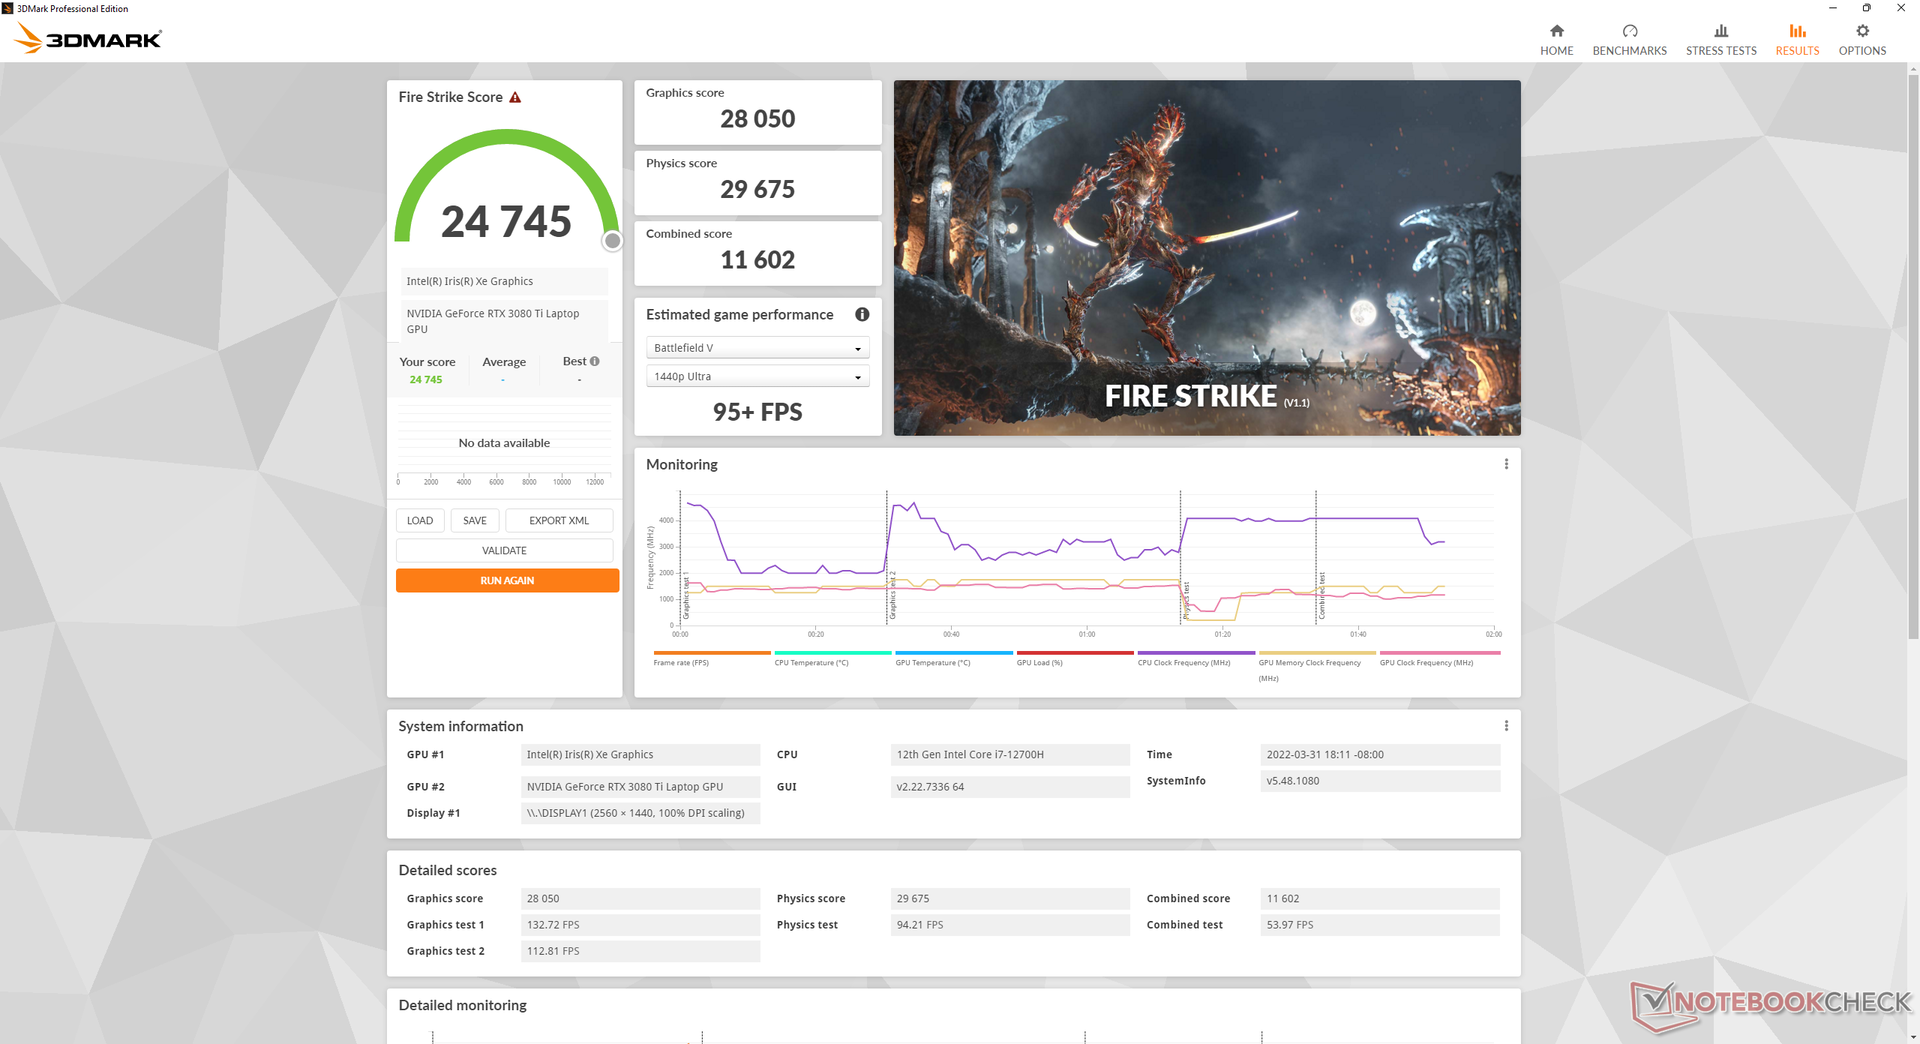
| 3DMark Fire Strike Score | 24745 pontos | |
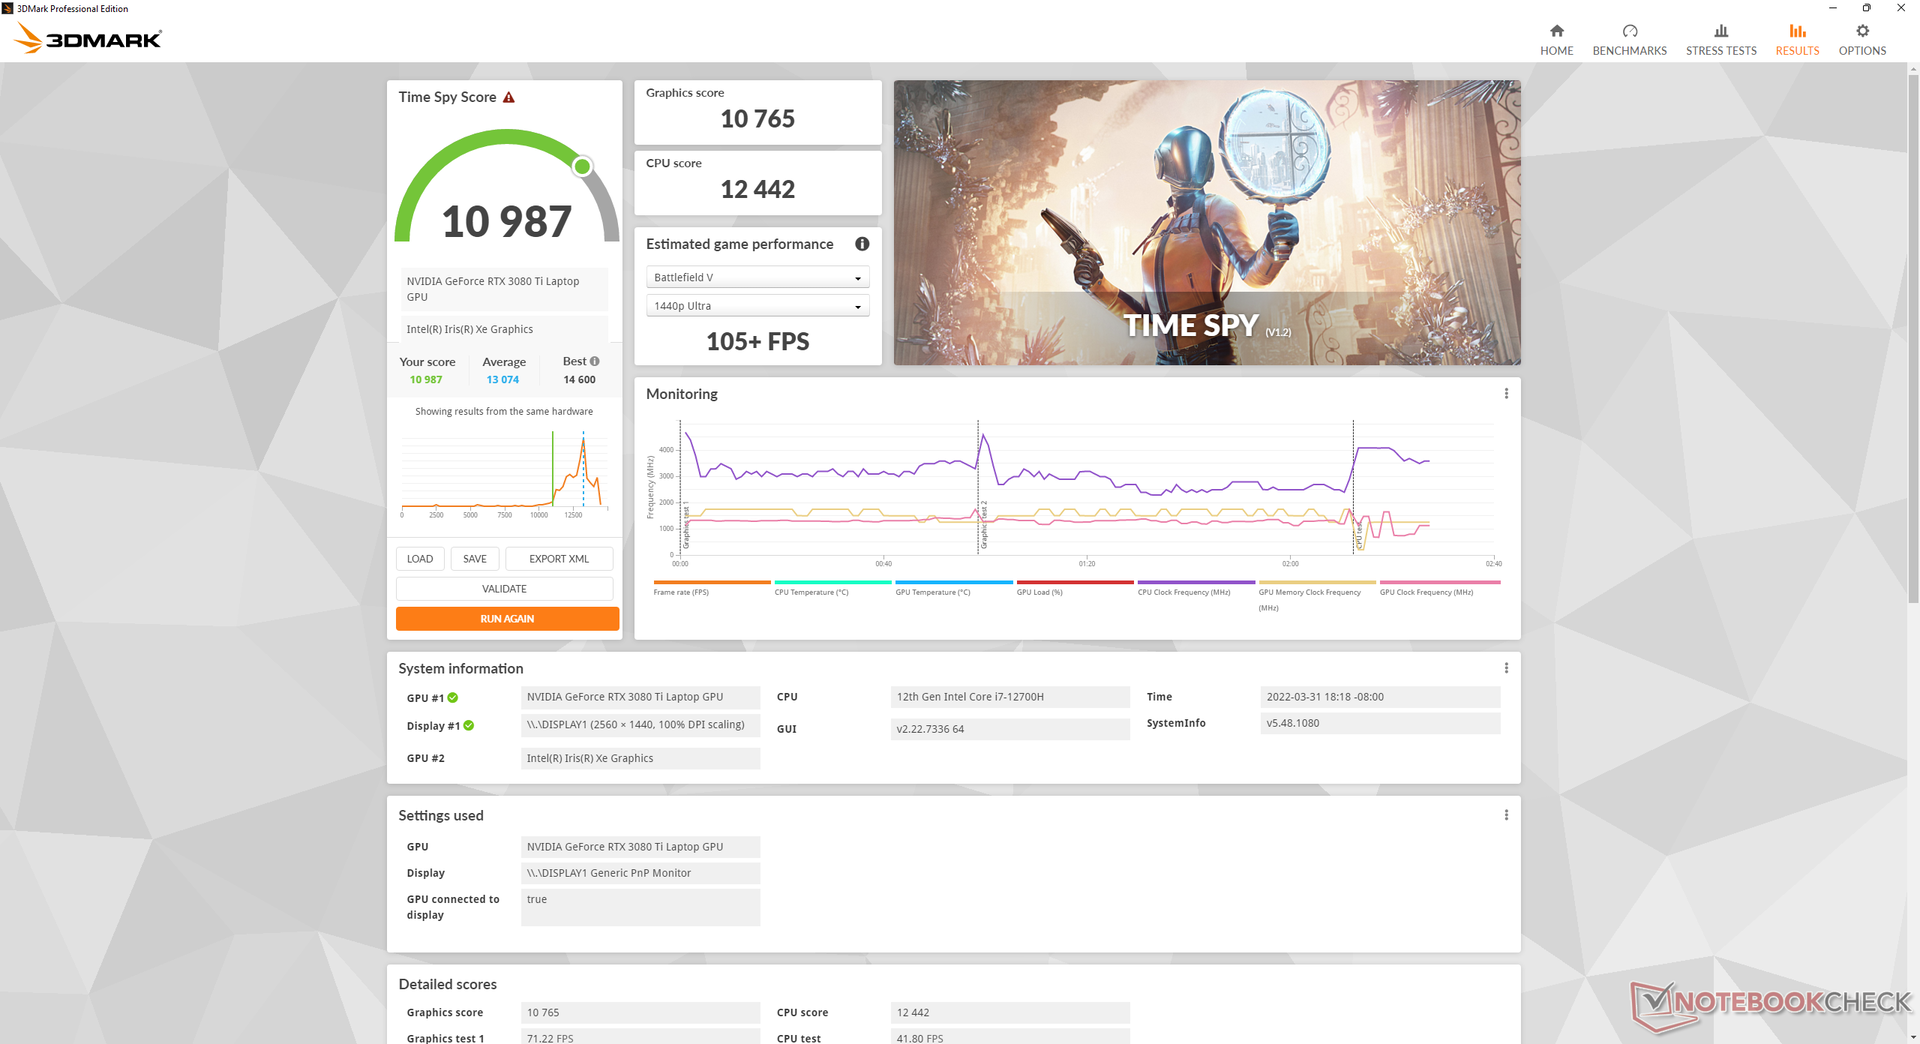
| 3DMark Time Spy Score | 10987 pontos | |
Ajuda | ||
| Cyberpunk 2077 1.6 | |
| 1920x1080 Low Preset | |
| Média NVIDIA GeForce RTX 3080 Ti Laptop GPU (89 - 169.8, n=14) | |
| MSI Stealth GS77 12UHS-083US | |
| Razer Blade 17 RTX 3080 Ti | |
| 1920x1080 Medium Preset | |
| Média NVIDIA GeForce RTX 3080 Ti Laptop GPU (78 - 159.7, n=14) | |
| MSI Stealth GS77 12UHS-083US | |
| Razer Blade 17 RTX 3080 Ti | |
| 1920x1080 High Preset | |
| Razer Blade 17 RTX 3080 Ti | |
| Média NVIDIA GeForce RTX 3080 Ti Laptop GPU (64 - 145.6, n=14) | |
| MSI Stealth GS77 12UHS-083US | |
| 1920x1080 Ultra Preset | |
| Razer Blade 17 RTX 3080 Ti | |
| Média NVIDIA GeForce RTX 3080 Ti Laptop GPU (54 - 144.1, n=16) | |
| MSI Stealth GS77 12UHS-083US | |
| 2560x1440 Ultra Preset | |
| Razer Blade 17 RTX 3080 Ti | |
| Média NVIDIA GeForce RTX 3080 Ti Laptop GPU (36 - 69.6, n=13) | |
| MSI Stealth GS77 12UHS-083US | |
Witcher 3 FPS Chart
| baixo | média | alto | ultra | QHD | |
|---|---|---|---|---|---|
| GTA V (2015) | 186 | 185 | 175 | 113 | 94.2 |
| The Witcher 3 (2015) | 447.2 | 298.8 | 206.8 | 109.1 | |
| Dota 2 Reborn (2015) | 182 | 169 | 161 | 154 | |
| Final Fantasy XV Benchmark (2018) | 196 | 130 | 101 | 79.5 | |
| X-Plane 11.11 (2018) | 146 | 126 | 103 | ||
| Far Cry 5 (2018) | 190 | 145 | 136 | 129 | 101 |
| Strange Brigade (2018) | 447 | 239 | 196 | 177 | 126 |
| Cyberpunk 2077 1.6 (2022) | 133.2 | 113.6 | 92.9 | 92.8 | 49.7 |
Emissões
Ruído do sistema - Sem mais ventiladores triplos
Os ventiladores internos fazem um bom trabalho para permanecerem silenciosos quando ajustados para os modos Battery Saver ou Silent. O ruído dos ventiladores pode ocasionalmente aparecer até 31 dB(A) contra um fundo silencioso de 24,5 dB(A) ao navegar ou transmitir vídeo para ser audível, mas sem distrair
Ruído do ventilador quando em funcionamento Witcher 3 no modo Extreme Performance é significativamente mais silencioso do que na lâmina 17 (46 dB(A) vs. 51 dB(A)). Se o modo Cooler Boost estiver ativado, entretanto, o GS77 se torna o laptop mais ruidoso a 57 dB(A). Felizmente, o modo Cooler Boost não é necessário para extrair o desempenho total do laptop
Executando o mesmo jogono modo Equilibrado em vez do modo de Desempenho Extremo resultaria em um ruído do ventilador ligeiramente mais silencioso de 44,1 dB(A), embora para um mergulho de 12% de desempenho gráfico, como mencionado anteriormente. Os usuários preocupados com o ruído do ventilador podem, em vez disso, querer considerar os jogos nestes perfis de potência mais baixos.
Barulho
| Ocioso |
| 24.5 / 24.5 / 30.8 dB |
| Carga |
| 34.6 / 56.8 dB |
 | ||
30 dB silencioso 40 dB(A) audível 50 dB(A) ruidosamente alto |
||
min: | ||
| MSI Stealth GS77 12UHS-083US GeForce RTX 3080 Ti Laptop GPU, i7-12700H, Micron 3400 1TB MTFDKBA1T0TFH | MSI GS76 Stealth 11UH GeForce RTX 3080 Laptop GPU, i9-11900H, Samsung PM9A1 MZVL22T0HBLB | Razer Blade 17 RTX 3080 Ti GeForce RTX 3080 Ti Laptop GPU, i7-12800H, Samsung PM9A1 MZVL21T0HCLR | MSI GE76 Raider GeForce RTX 3080 Ti Laptop GPU, i9-12900HK, Samsung PM9A1 MZVL22T0HBLB | Alienware x17 RTX 3080 P48E GeForce RTX 3080 Laptop GPU, i7-11800H, 2x WDC PC SN730 SDBPNTY-1T00 (RAID 0) | Asus ROG Zephyrus S17 GX703HSD GeForce RTX 3080 Laptop GPU, i9-11900H, Samsung PM9A1 MZVL22T0HBLB | |
|---|---|---|---|---|---|---|
| Noise | -8% | 3% | -15% | 1% | 5% | |
| desligado / ambiente * (dB) | 24.5 | 24 2% | 23.3 5% | 26 -6% | 24.9 -2% | 23 6% |
| Idle Minimum * (dB) | 24.5 | 24 2% | 23.3 5% | 26 -6% | 24.9 -2% | 23 6% |
| Idle Average * (dB) | 24.5 | 25 -2% | 23.3 5% | 27 -10% | 24.9 -2% | 23 6% |
| Idle Maximum * (dB) | 30.8 | 42 -36% | 26.3 15% | 40 -30% | 29.6 4% | 23 25% |
| Load Average * (dB) | 34.6 | 46 -33% | 38.2 -10% | 50 -45% | 31.1 10% | 41 -18% |
| Witcher 3 ultra * (dB) | 46.2 | 48 -4% | 50.9 -10% | 53 -15% | 49.7 -8% | 45 3% |
| Load Maximum * (dB) | 56.8 | 48 15% | 49.1 14% | 53 7% | 54.8 4% | 52 8% |
* ... menor é melhor
Temperatura
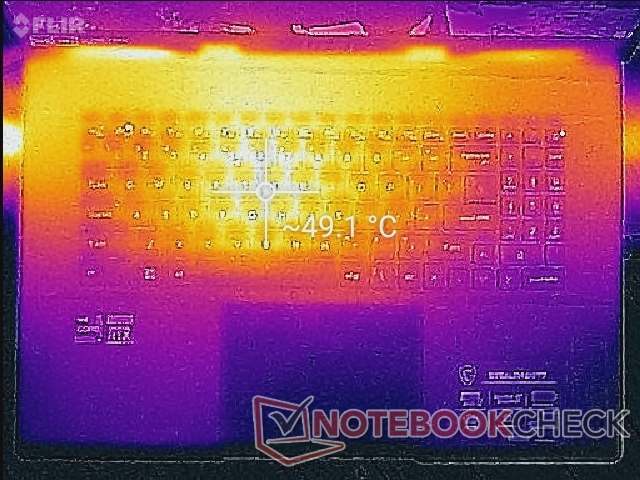
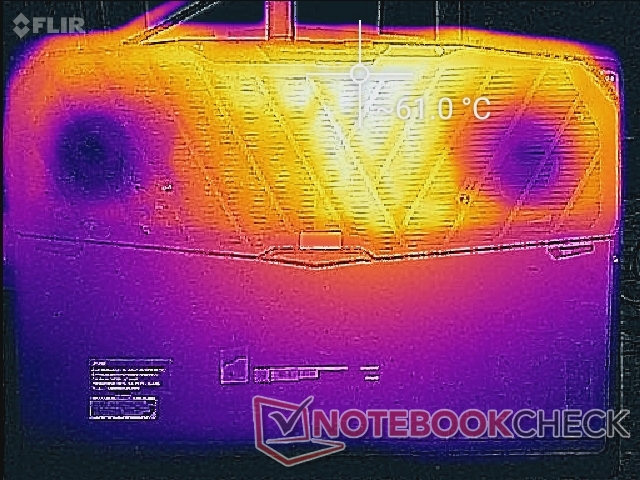
Os pontos quentes da superfície quando os jogos são mais ou menos os mesmos que gravamos no GS76 em cerca de 49 C perto do centro do teclado e 61 C na parte inferior. A distribuição de temperatura é melhor no modelo mais recente, porém, já que os descansos da palma da mão são agora muito mais frios a menos de 30 C em comparação com 35 C ou mais no GS76
O Blade 17 tem teclas WASD mais frias do que no GS77, já que o modelo Razer retira ar frio de suas teclas WASD. Isto pode ser visto ao comparar os mapas de temperatura entre o GS77 e a Lâmina 17.
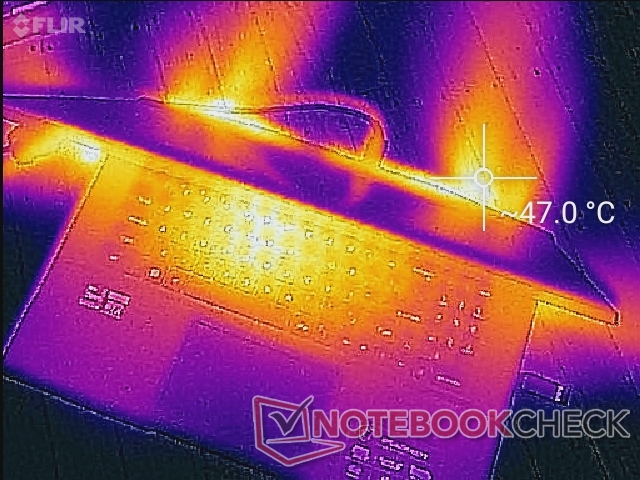
(-) A temperatura máxima no lado superior é 50.6 °C / 123 F, em comparação com a média de 40.4 °C / 105 F , variando de 21.2 a 68.8 °C para a classe Gaming.
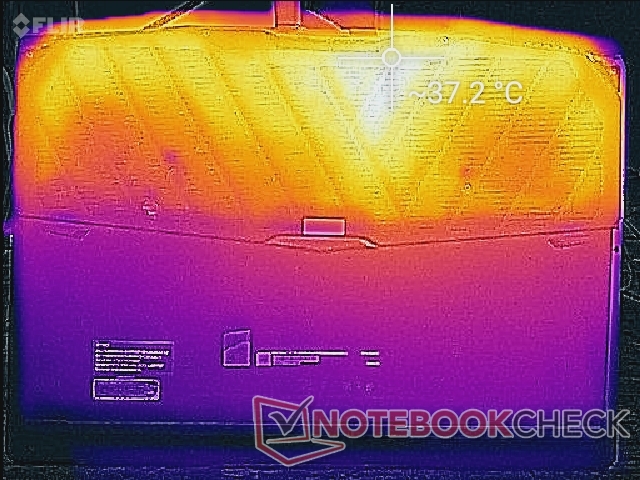
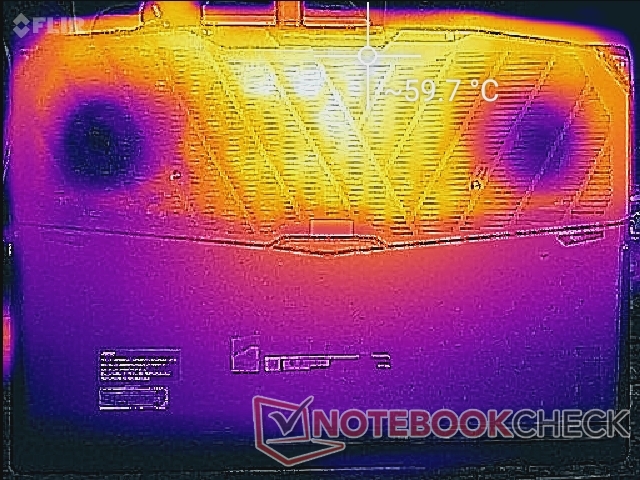
(-) A parte inferior aquece até um máximo de 59.6 °C / 139 F, em comparação com a média de 43.2 °C / 110 F
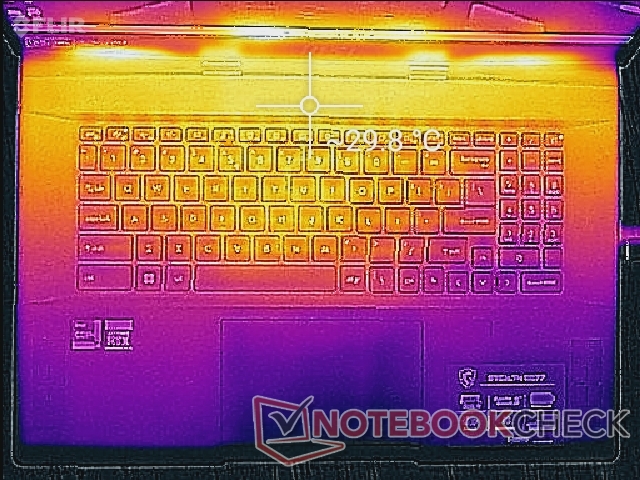
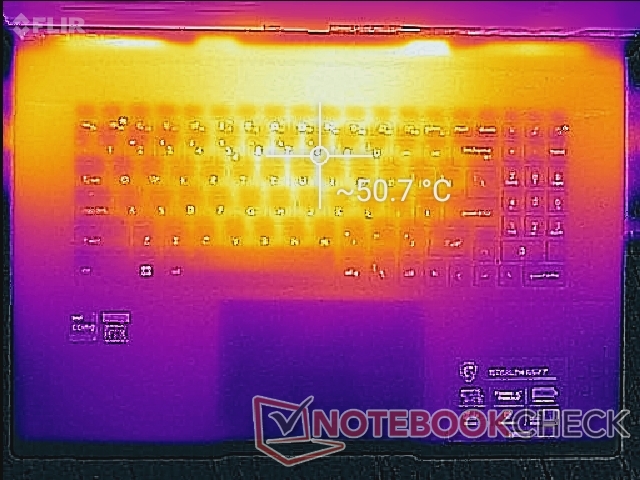
(+) Em uso inativo, a temperatura média para o lado superior é 26.9 °C / 80 F, em comparação com a média do dispositivo de 33.9 °C / ### class_avg_f### F.
(±) Jogando The Witcher 3, a temperatura média para o lado superior é 36.2 °C / 97 F, em comparação com a média do dispositivo de 33.9 °C / ## #class_avg_f### F.
(+) Os apoios para as mãos e o touchpad são mais frios que a temperatura da pele, com um máximo de 30 °C / 86 F e, portanto, são frios ao toque.
(±) A temperatura média da área do apoio para as mãos de dispositivos semelhantes foi 28.8 °C / 83.8 F (-1.2 °C / -2.2 F).
| MSI Stealth GS77 12UHS-083US Intel Core i7-12700H, NVIDIA GeForce RTX 3080 Ti Laptop GPU | MSI GS76 Stealth 11UH Intel Core i9-11900H, NVIDIA GeForce RTX 3080 Laptop GPU | Razer Blade 17 RTX 3080 Ti Intel Core i7-12800H, NVIDIA GeForce RTX 3080 Ti Laptop GPU | MSI GE76 Raider Intel Core i9-12900HK, NVIDIA GeForce RTX 3080 Ti Laptop GPU | Alienware x17 RTX 3080 P48E Intel Core i7-11800H, NVIDIA GeForce RTX 3080 Laptop GPU | Asus ROG Zephyrus S17 GX703HSD Intel Core i9-11900H, NVIDIA GeForce RTX 3080 Laptop GPU | |
|---|---|---|---|---|---|---|
| Heat | 9% | 2% | 7% | -1% | -4% | |
| Maximum Upper Side * (°C) | 50.6 | 49 3% | 46 9% | 43 15% | 58.4 -15% | 59 -17% |
| Maximum Bottom * (°C) | 59.6 | 57 4% | 46.8 21% | 47 21% | 49 18% | 53 11% |
| Idle Upper Side * (°C) | 30 | 28 7% | 36.2 -21% | 33 -10% | 33.6 -12% | 35 -17% |
| Idle Bottom * (°C) | 37.4 | 30 20% | 38.6 -3% | 37 1% | 34.6 7% | 35 6% |
* ... menor é melhor
Teste de estresse
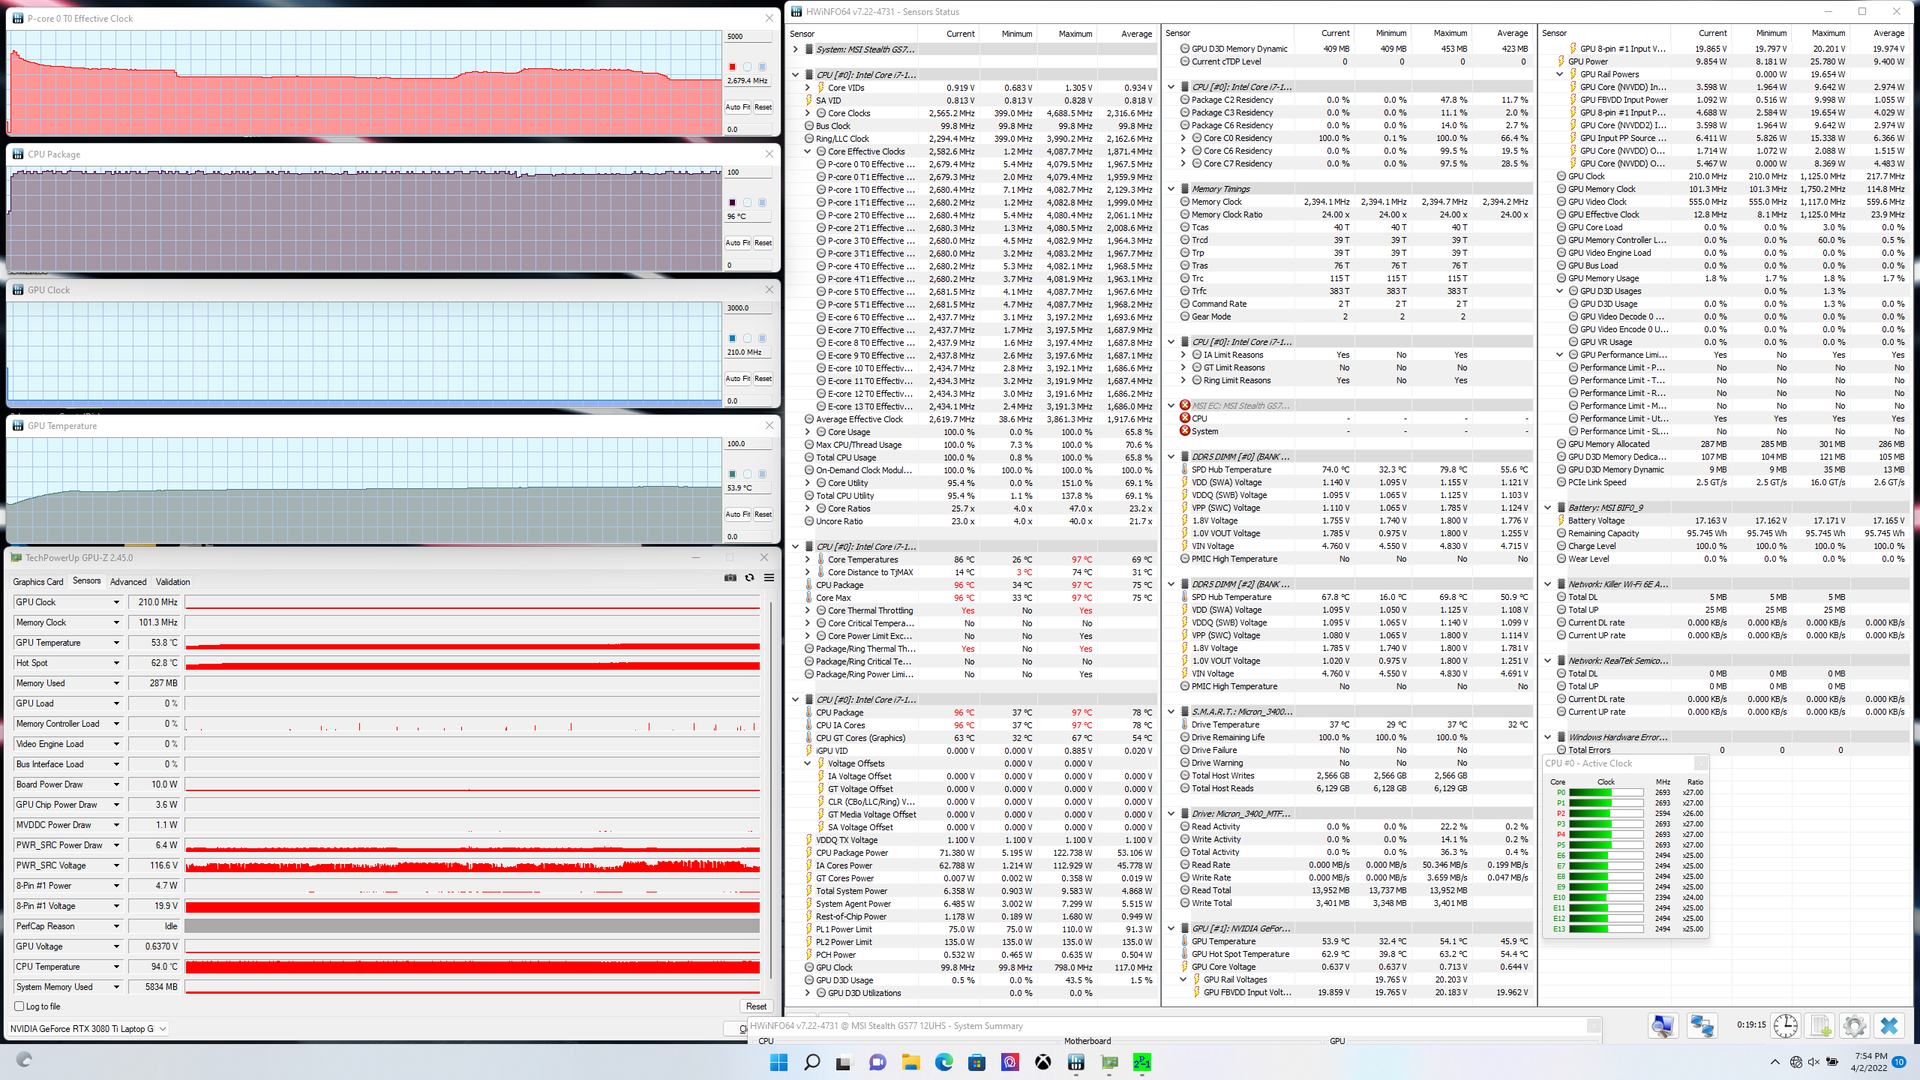
Ao executar Prime95 para enfatizar a CPU, as taxas do relógio e a temperatura central aumentariam para 4 GHz e 95 C durante os primeiros segundos antes de estabilizarem na faixa de 2,7 a 3 GHz, a fim de evitar que o processador fique mais quente. Em comparação, o Core i7-12800H na lâmina 17 funcionaria mais lentamente e mais frio a 2,4 a 2,6 GHz e 71 C, respectivamente, quando submetido a condições Prime95 similares. Portanto, a MSI está empurrando sua CPU muito mais quente, a fim de maximizar o desempenho do processador. A potência do pacote de CPU no GS77 seria de 122,7 W durante o início do teste antes de se estabilizar em torno de 71 W, que é novamente superior aos 61 W que registramos no Razer.
O relógio GPU, relógio de memória e temperatura estabilizariam em 1432 MHz, 1750 MHz e 75 C, respectivamente, quando em funcionamento Witcher 3. A execução deste mesmo teste na lâmina 17 resultaria em um relógio GPU, relógio de memória e temperatura de 1597 MHz, 2000 MHz, e 77 C, respectivamente. O desempenho mais rápido da GPU da Razer pode ser atribuído principalmente a seu alvo TGP muito mais alto em comparação com nosso MSI (165 W vs. 105 W). De fato, o GPU-Z registraria uma potência de placa GPU consistente de 104,5 W ao rodar o jogo.
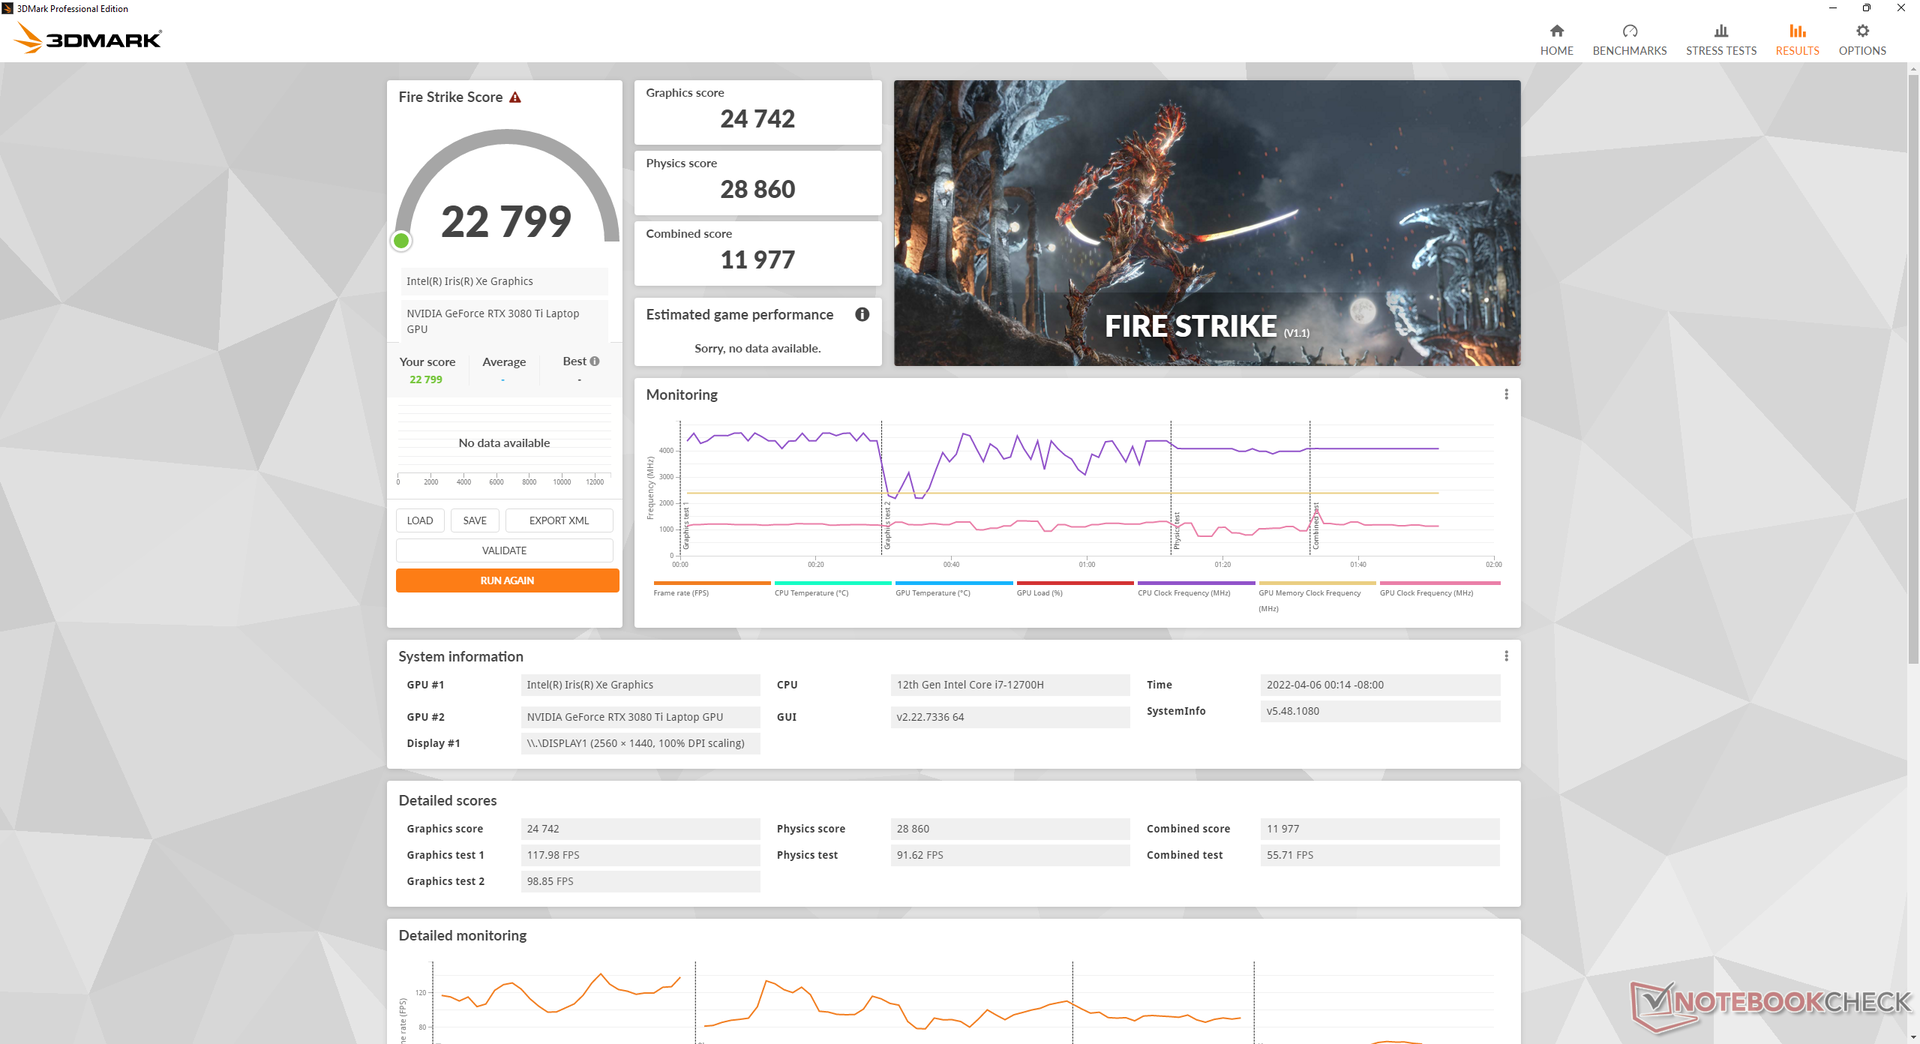
Funcionando com a bateria limita o desempenho. Um teste Fire Strike em baterias retornaria as pontuações de Física e Gráfica 29675 e 28050 pontos, respectivamente, em comparação com 14170 e 6220 pontos quando na rede elétrica.
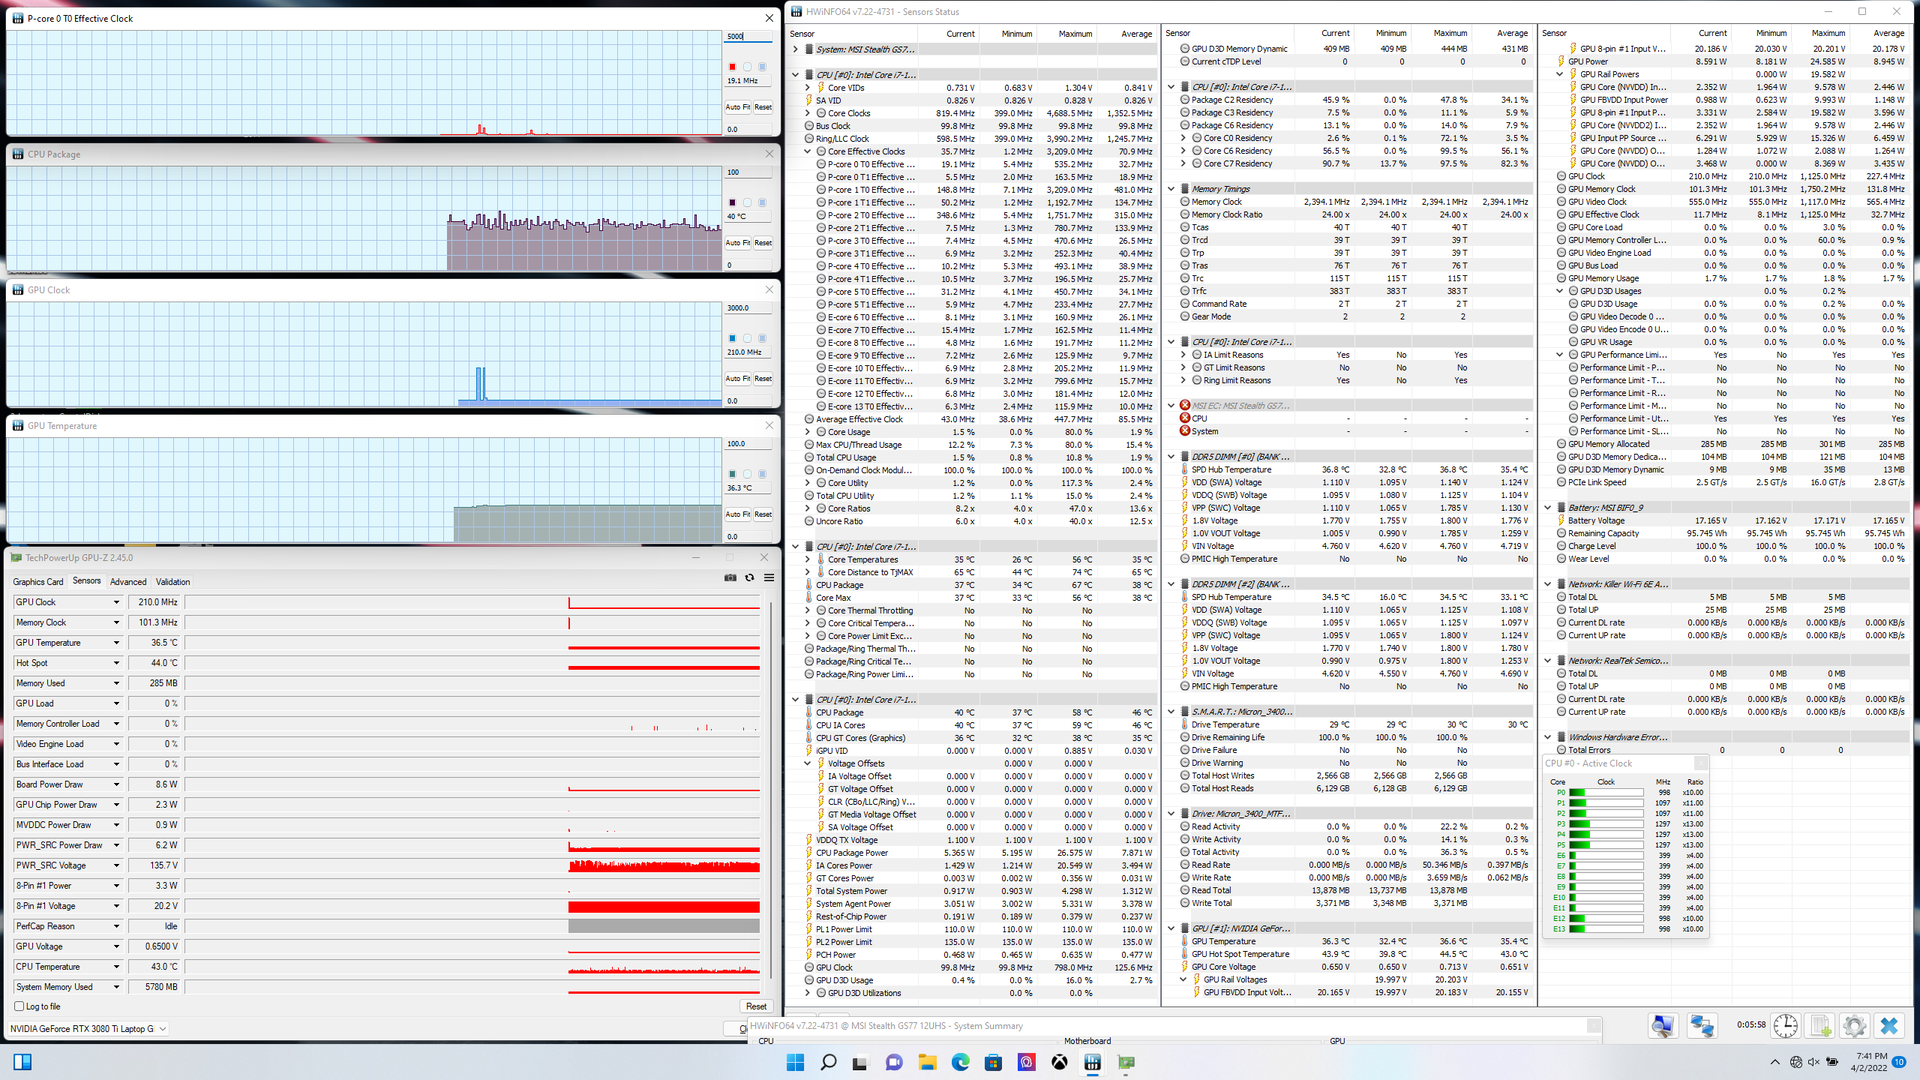
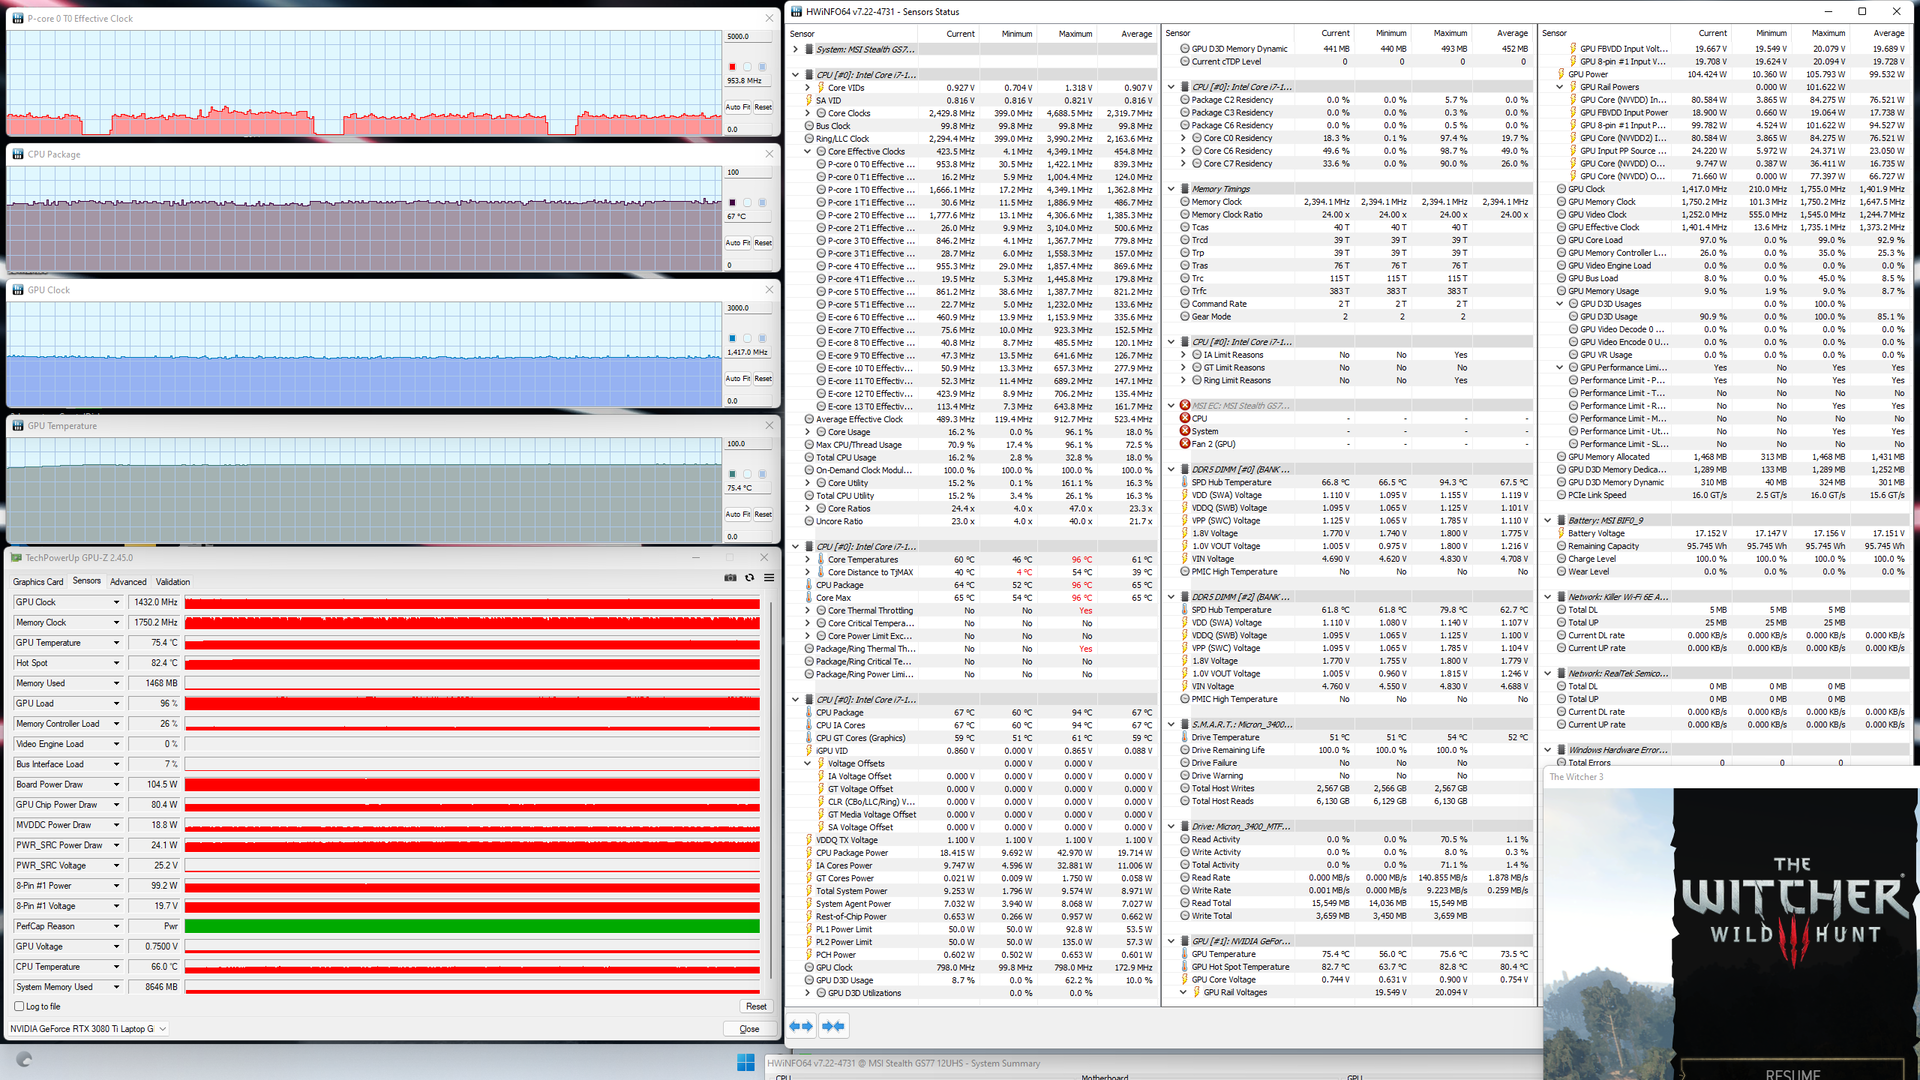
| Relógio CPU (GHz) | Relógio GPU (MHz) | Temperatura média da CPU (°C) | Temperatura média da GPU (°C) | |
| System Idle | -- | -- | 40 | 37 |
| Prime95 Stress | 2.7 - 3.0 | -- | 96 | 54 |
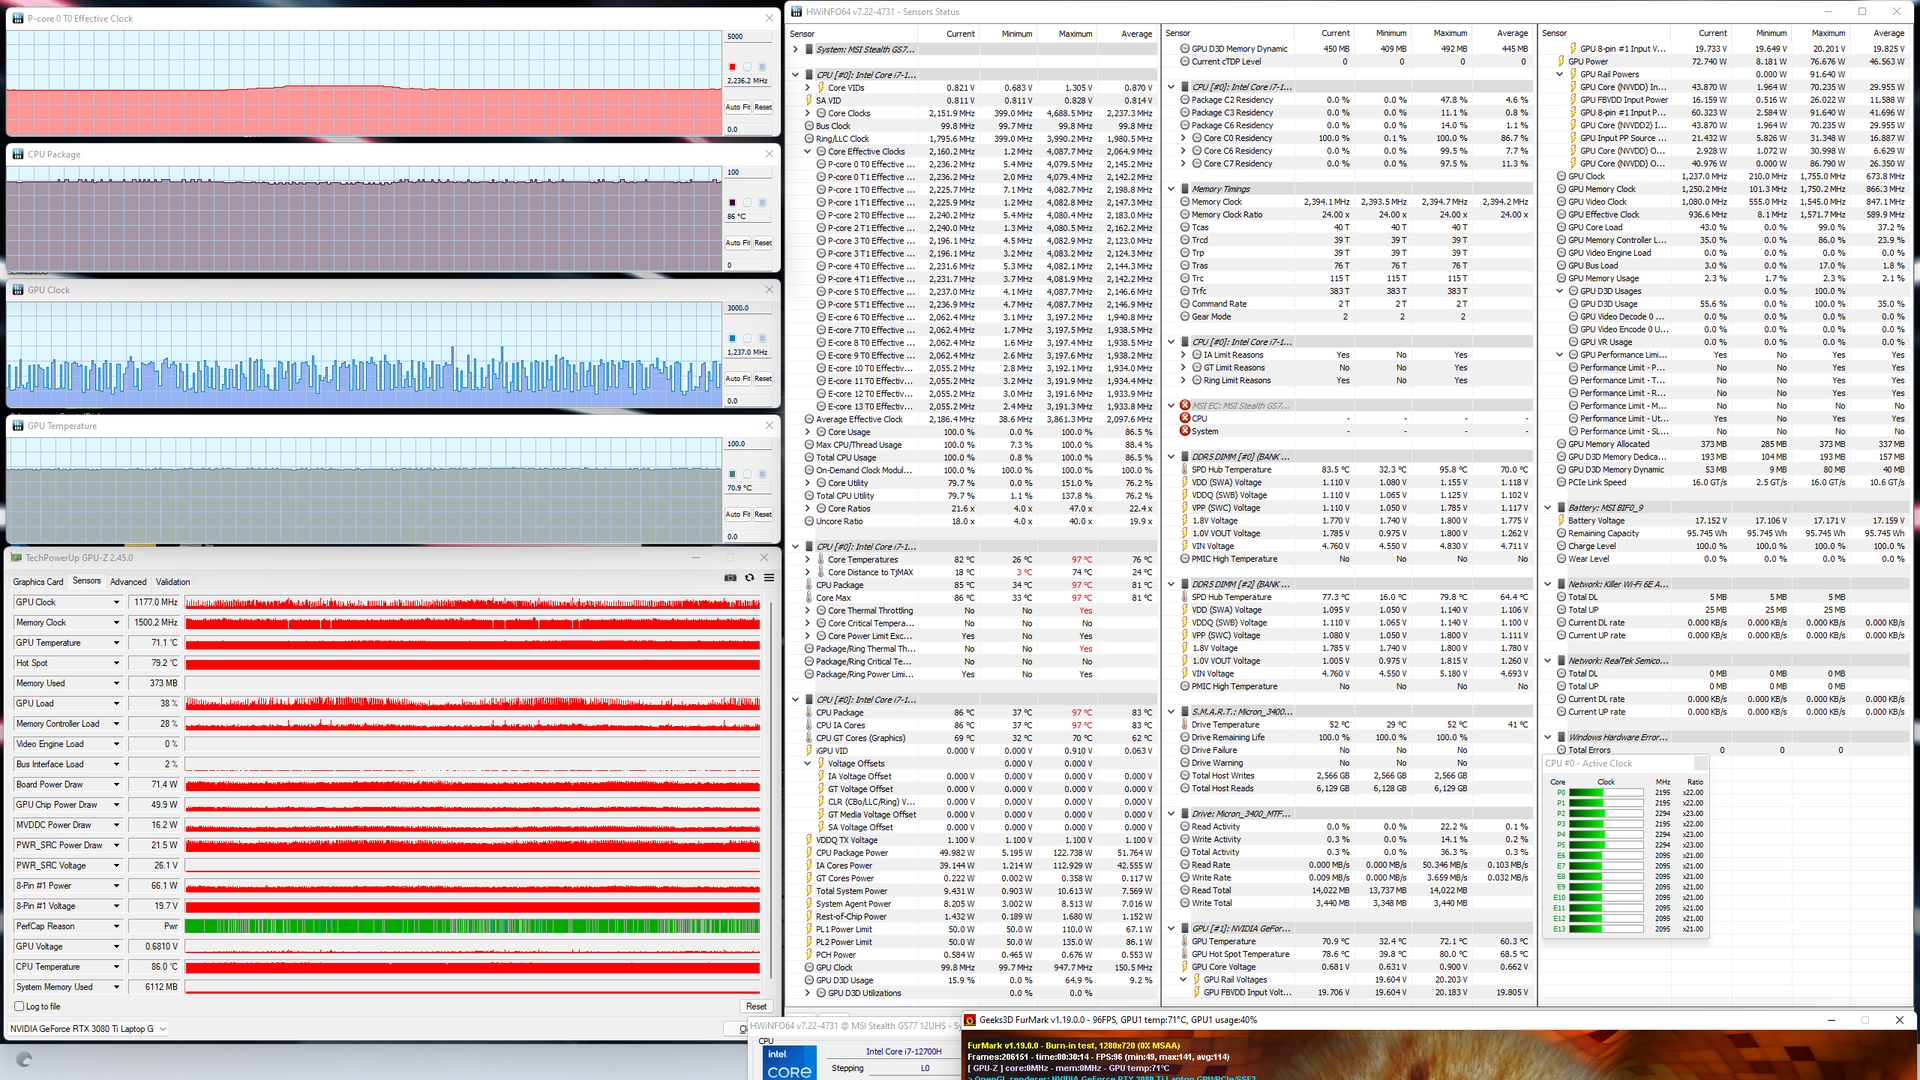
| Prime95 + FurMark Stress | 2.2 | 430 - 1237 | 86 | 71 |
| Witcher 3 Estresse | ~1.0 | 1432 | 67 | 75 |
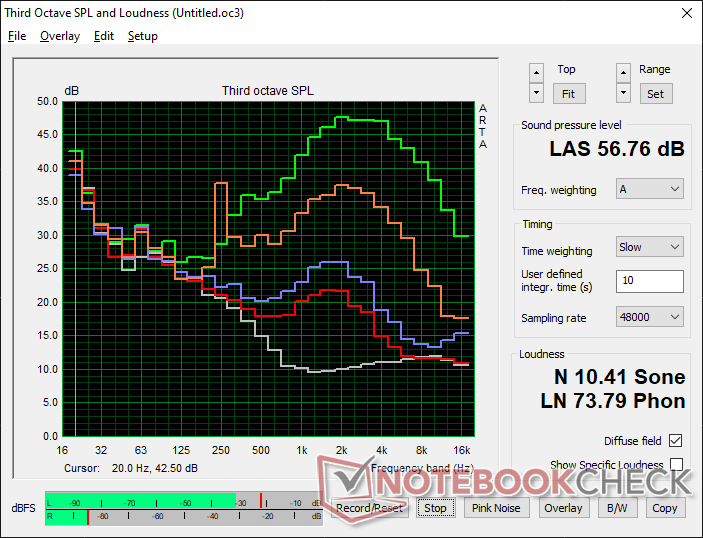
Oradores
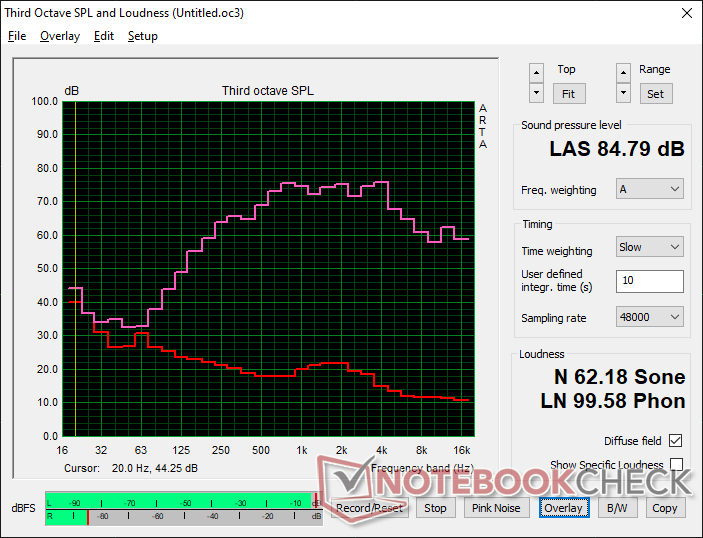
MSI Stealth GS77 12UHS-083US análise de áudio
(+) | os alto-falantes podem tocar relativamente alto (###valor### dB)
Graves 100 - 315Hz
(±) | graves reduzidos - em média 9.4% menor que a mediana
(±) | a linearidade dos graves é média (9.8% delta para a frequência anterior)
Médios 400 - 2.000 Hz
(±) | médios mais altos - em média 7% maior que a mediana
(+) | médios são lineares (4.9% delta para frequência anterior)
Altos 2 - 16 kHz
(±) | máximos mais altos - em média 5.8% maior que a mediana
(±) | a linearidade dos máximos é média (7.9% delta para frequência anterior)
Geral 100 - 16.000 Hz
(±) | a linearidade do som geral é média (15.9% diferença em relação à mediana)
Comparado com a mesma classe
» 38% de todos os dispositivos testados nesta classe foram melhores, 7% semelhantes, 56% piores
» O melhor teve um delta de 6%, a média foi 18%, o pior foi 132%
Comparado com todos os dispositivos testados
» 25% de todos os dispositivos testados foram melhores, 5% semelhantes, 70% piores
» O melhor teve um delta de 4%, a média foi 23%, o pior foi 134%
Apple MacBook Pro 16 2021 M1 Pro análise de áudio
(+) | os alto-falantes podem tocar relativamente alto (###valor### dB)
Graves 100 - 315Hz
(+) | bons graves - apenas 3.8% longe da mediana
(+) | o baixo é linear (5.2% delta para a frequência anterior)
Médios 400 - 2.000 Hz
(+) | médios equilibrados - apenas 1.3% longe da mediana
(+) | médios são lineares (2.1% delta para frequência anterior)
Altos 2 - 16 kHz
(+) | agudos equilibrados - apenas 1.9% longe da mediana
(+) | os máximos são lineares (2.7% delta da frequência anterior)
Geral 100 - 16.000 Hz
(+) | o som geral é linear (4.6% diferença em relação à mediana)
Comparado com a mesma classe
» 0% de todos os dispositivos testados nesta classe foram melhores, 0% semelhantes, 100% piores
» O melhor teve um delta de 5%, a média foi 17%, o pior foi 45%
Comparado com todos os dispositivos testados
» 0% de todos os dispositivos testados foram melhores, 0% semelhantes, 100% piores
» O melhor teve um delta de 4%, a média foi 23%, o pior foi 134%
Gestão de energia
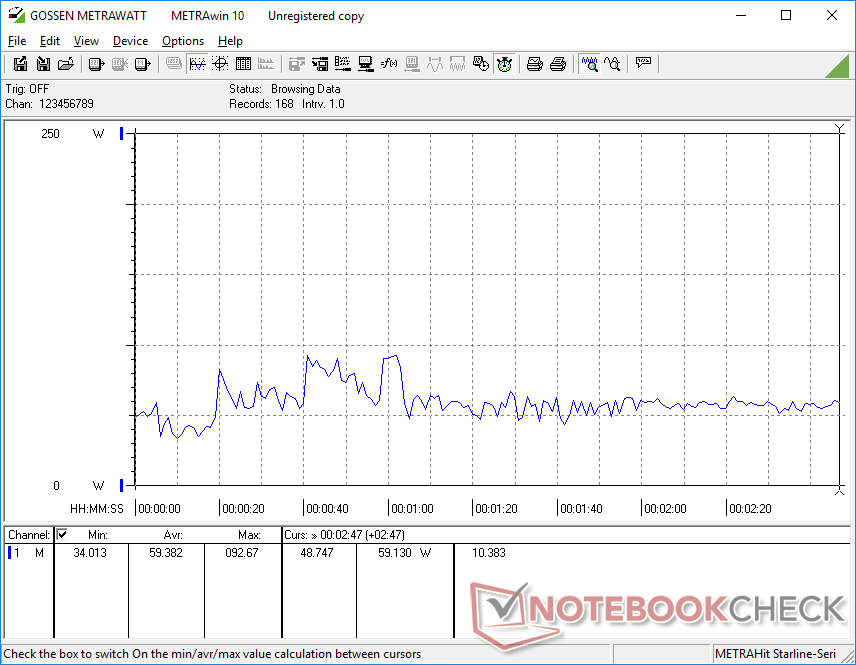
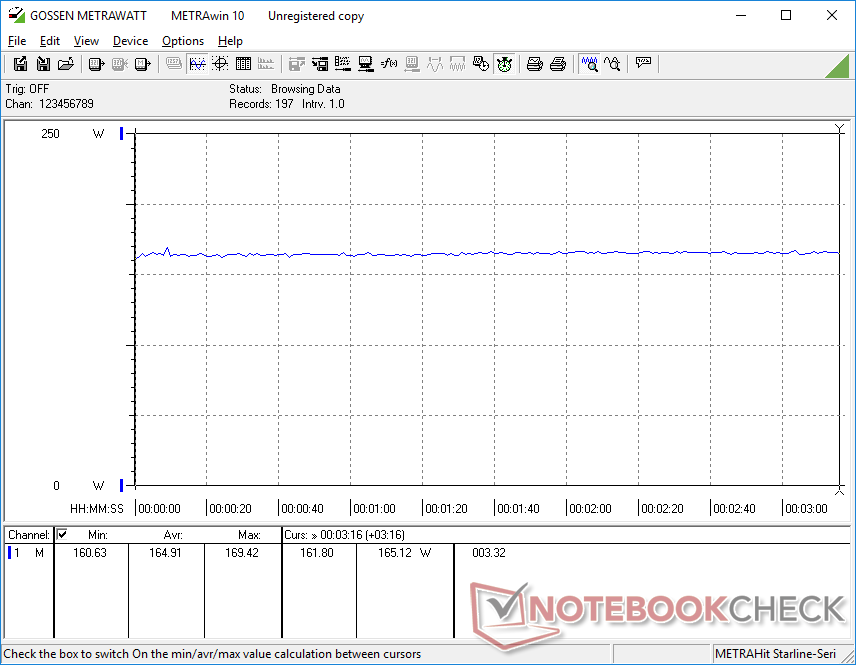
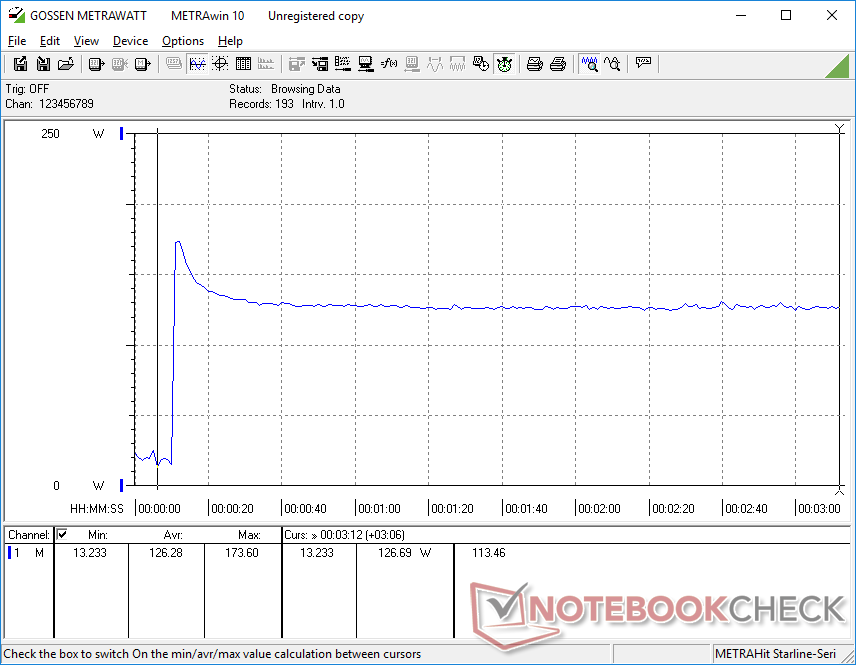
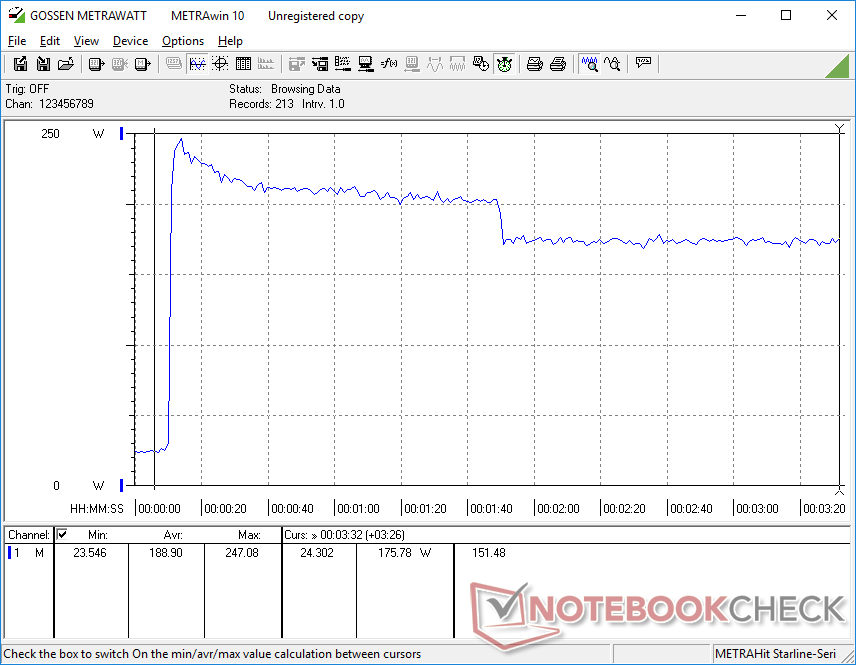
Consumo de energia - Um pouco mais faminto de energia
O GS77 não é tão mais exigente quanto o GS76 do ano passado, apesar do aumento de desempenho. Rodando Witcher 3por exemplo, a potência de apenas 5% a mais para um aumento de 12% a 15% no desempenho gráfico sobre o RTX 3080. A pequena diferença de consumo de energia pode ser atribuída à CPU e GPU no GS77 visando níveis de TDP e TGP relativamente similares aos dos processadores no GS76. Em contraste, a meta TGP entre os modelos Blade 17 de 2021 e 2022 aumentou substancialmente de 100 W para 165 W, levando a níveis significativamente maiores de consumo de energia para o Blade 17 quando comparado ao GS77, como mostra a tabela abaixo.
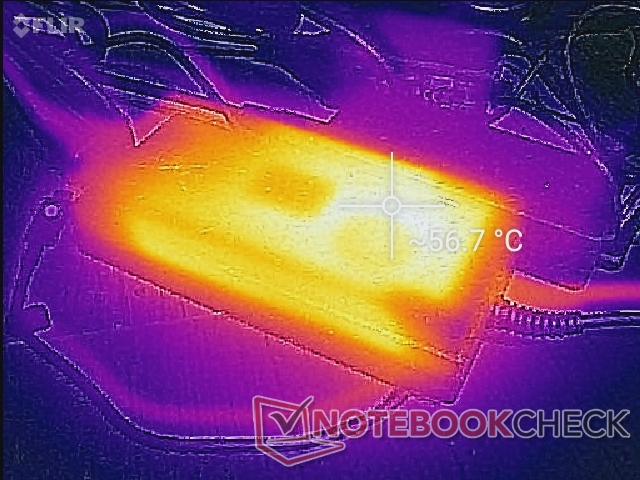
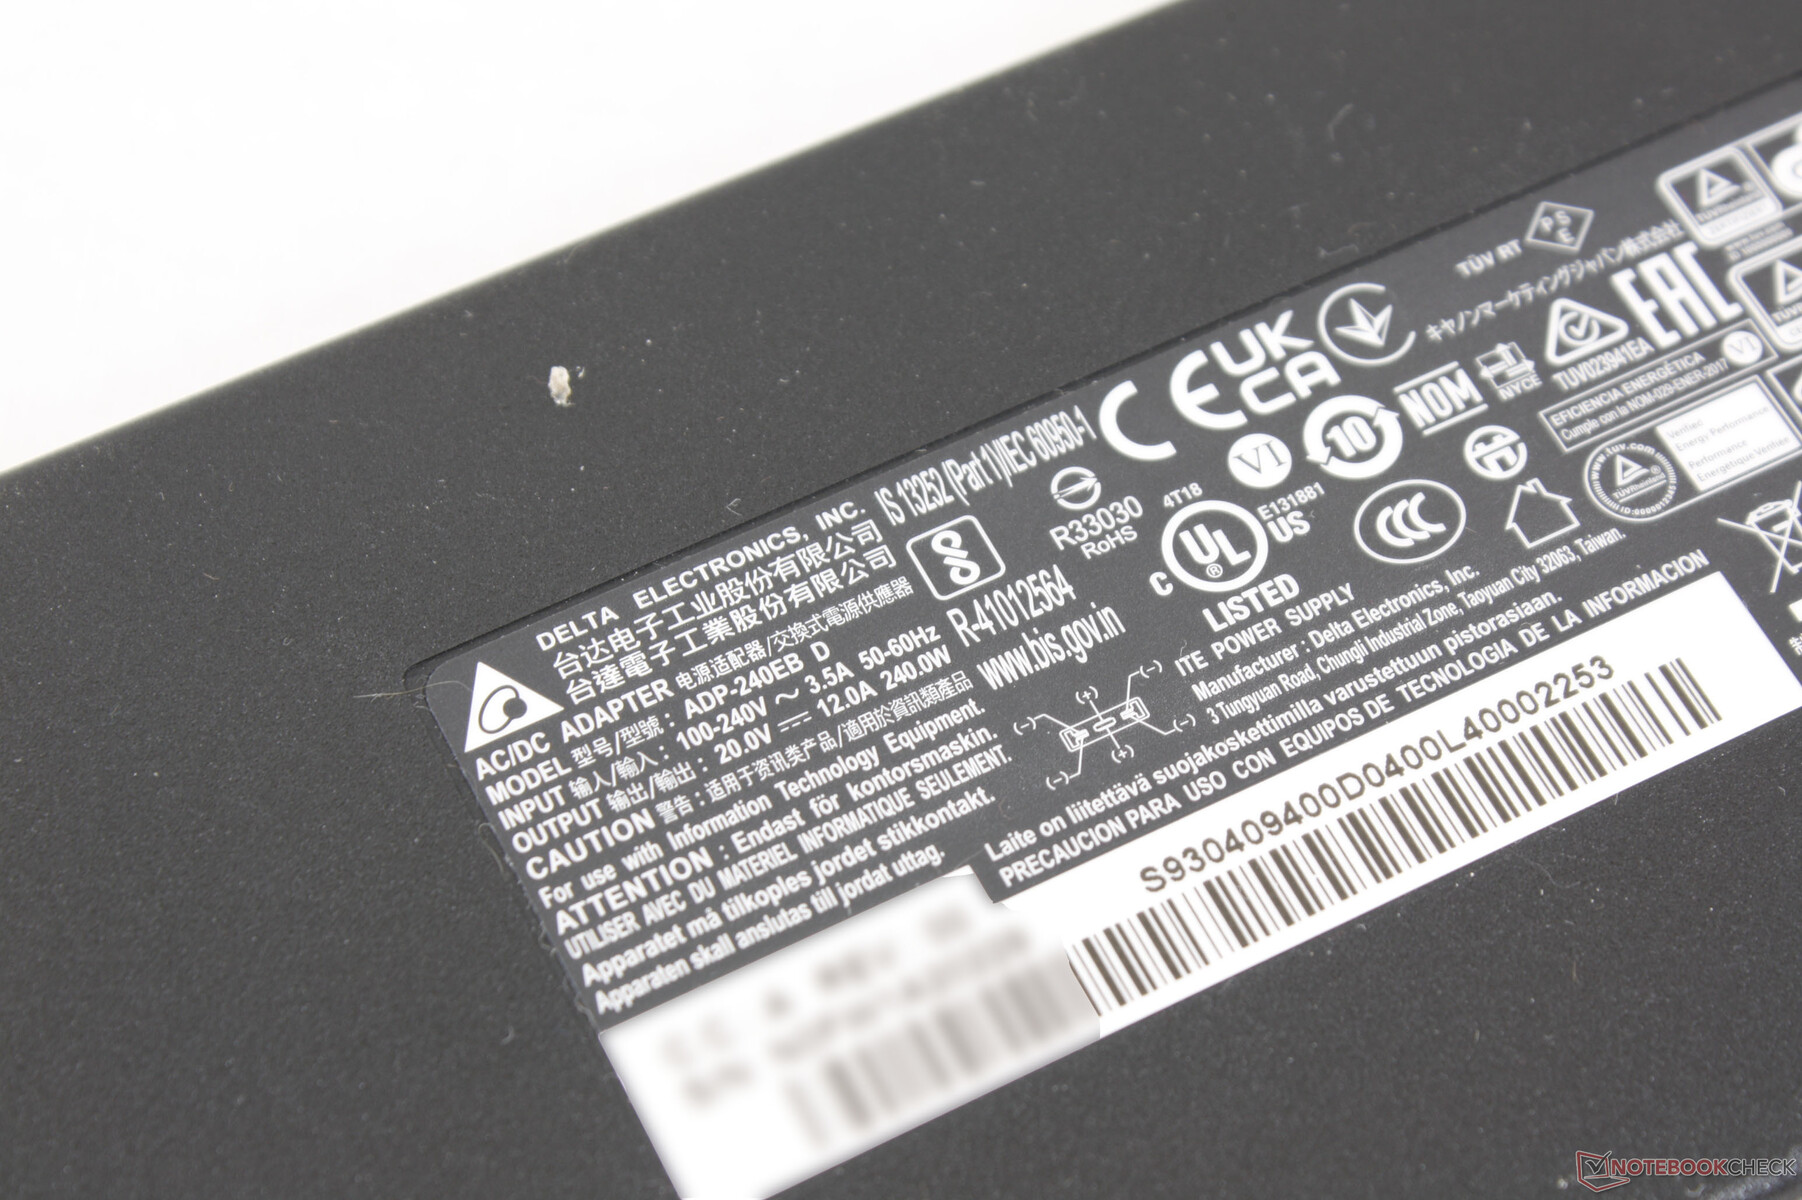
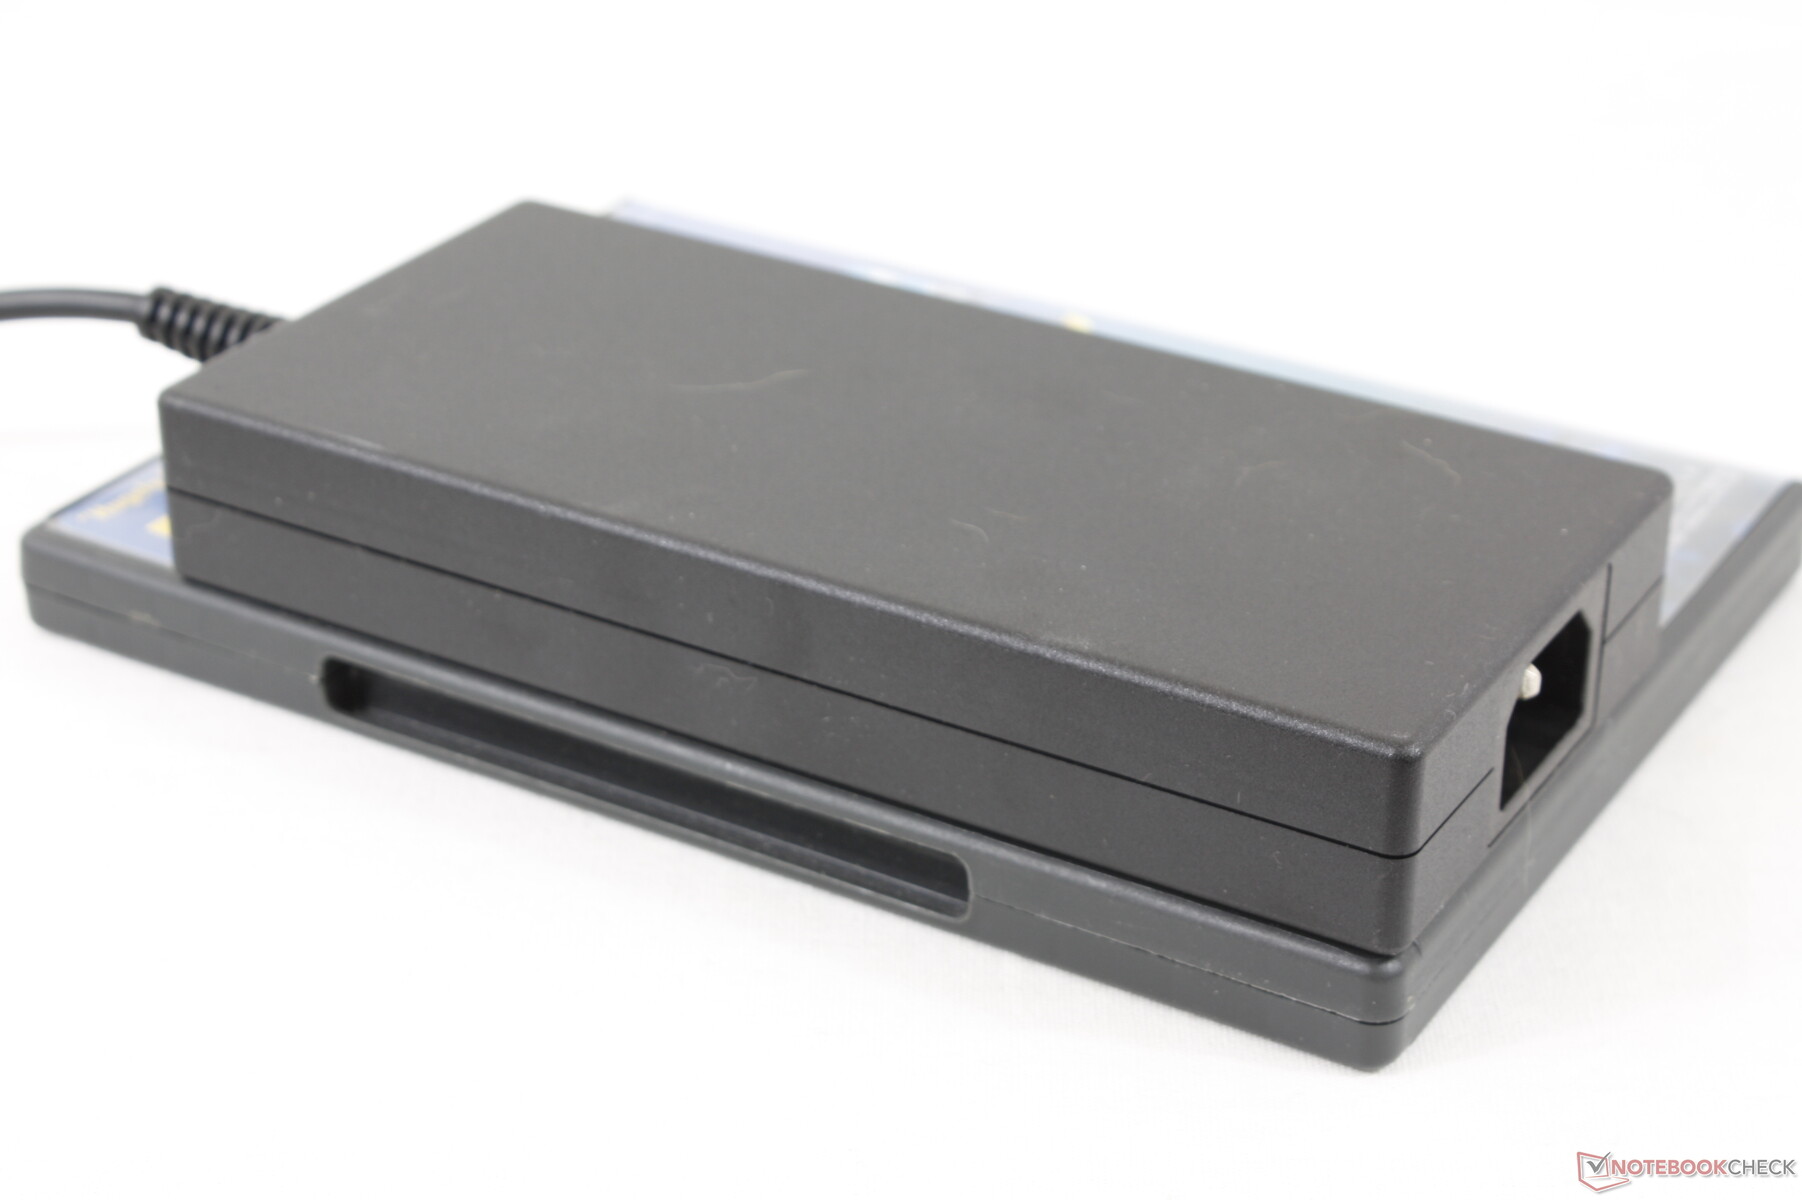
Um adaptador de 240 W AC vem de série, enquanto o Blade 17 vem com um adaptador de 280 W de maior capacidade. Pode-se esperar que o adaptador Razer seja maior, mas o adaptador de 240 W da MSI é na verdade o ligeiramente maior (~16,4 x 7,5 x 2,5 cm vs. ~16,4 x 7 x 2,5 cm).
| desligado | |
| Ocioso | |
| Carga |
|
Key:
min: | |
| MSI Stealth GS77 12UHS-083US i7-12700H, GeForce RTX 3080 Ti Laptop GPU, Micron 3400 1TB MTFDKBA1T0TFH, IPS, 2560x1440, 17.3" | MSI GS76 Stealth 11UH i9-11900H, GeForce RTX 3080 Laptop GPU, Samsung PM9A1 MZVL22T0HBLB, IPS, 3840x2160, 17.3" | Razer Blade 17 RTX 3080 Ti i7-12800H, GeForce RTX 3080 Ti Laptop GPU, Samsung PM9A1 MZVL21T0HCLR, IPS, 2560x1440, 17.3" | MSI GE76 Raider i9-12900HK, GeForce RTX 3080 Ti Laptop GPU, Samsung PM9A1 MZVL22T0HBLB, IPS-Level, 1920x1080, 17.3" | Alienware x17 RTX 3080 P48E i7-11800H, GeForce RTX 3080 Laptop GPU, 2x WDC PC SN730 SDBPNTY-1T00 (RAID 0), IPS, 3840x2160, 17.3" | Asus ROG Zephyrus S17 GX703HSD i9-11900H, GeForce RTX 3080 Laptop GPU, Samsung PM9A1 MZVL22T0HBLB, IPS, 2560x1440, 17.3" | |
|---|---|---|---|---|---|---|
| Power Consumption | 7% | -57% | -4% | -17% | -11% | |
| Idle Minimum * (Watt) | 20 | 14 30% | 29.8 -49% | 12 40% | 10.2 49% | 21.7 -9% |
| Idle Average * (Watt) | 21.4 | 19 11% | 37.1 -73% | 17 21% | 21.2 1% | 27 -26% |
| Idle Maximum * (Watt) | 27 | 31 -15% | 60.8 -125% | 28 -4% | 48.4 -79% | 33 -22% |
| Load Average * (Watt) | 100.5 | 97 3% | 135.3 -35% | 118 -17% | 118.7 -18% | 108 -7% |
| Witcher 3 ultra * (Watt) | 165 | 156 5% | 243 -47% | 252 -53% | 249 -51% | 195 -18% |
| Load Maximum * (Watt) | 247.1 | 231 7% | 273.1 -11% | 272 -10% | 262 -6% | 210 15% |
* ... menor é melhor
Power Consumption Witcher 3 / Stresstest
Power Consumption external Monitor
Vida útil da bateria - 99 Wh To The Rescue
Os tempos de execução são quase idênticos aos que registramos no GS76 do ano passado e um pouco mais longos do que os que registramos no novo Blade 17. Os últimos modelos GS são notáveis por sua grande bateria de 99 Wh em comparação com os 90 Wh ou menos na maioria dos outros laptops de jogos.
O carregamento da capacidade vazia à plena leva quase 2,5 horas a mais do que a maioria dos outros laptops. O sistema também pode ser recarregado via USB-C através de sua única porta Thunderbolt 4.
| MSI Stealth GS77 12UHS-083US i7-12700H, GeForce RTX 3080 Ti Laptop GPU, 99 Wh | MSI GS76 Stealth 11UH i9-11900H, GeForce RTX 3080 Laptop GPU, 99.9 Wh | Razer Blade 17 RTX 3080 Ti i7-12800H, GeForce RTX 3080 Ti Laptop GPU, 82 Wh | MSI GE76 Raider i9-12900HK, GeForce RTX 3080 Ti Laptop GPU, 99.99 Wh | Alienware x17 RTX 3080 P48E i7-11800H, GeForce RTX 3080 Laptop GPU, 87 Wh | Asus ROG Zephyrus S17 GX703HSD i9-11900H, GeForce RTX 3080 Laptop GPU, 90 Wh | |
|---|---|---|---|---|---|---|
| Duração da bateria | -4% | -19% | -18% | -28% | 57% | |
| Reader / Idle (h) | 10.8 | 9.9 -8% | 8 -26% | 7 -35% | ||
| WiFi v1.3 (h) | 6.2 | 6.4 3% | 5.5 -11% | 5.1 -18% | 5.9 -5% | 7.5 21% |
| Load (h) | 1.4 | 1.3 -7% | 1.1 -21% | 0.8 -43% | 2.7 93% | |
| H.264 (h) | 7.2 | |||||
| Witcher 3 ultra (h) | 1 |
Pro
Contra
Veredicto - Melhor que o GS76... Em sua maioria

O GS77 está a alguns passos à frente e alguns passos atrás do GS76. As melhorias são numerosas, incluindo o esqueleto mais forte e mais rígido, webcam de maior resolução, clickpad maior, facilidade de manutenção, tempos de funcionamento relativamente similares da bateria, opções de exibição mais recentes e maior desempenho com aproximadamente os mesmos níveis de TDP e TGP que antes. O desempenho da CPU é melhor do que o esperado, mesmo quando comparado a outros laptops com processadores Core i7 ou Core i9. O modelo mais novo parece mais substancial do que o de saída para impressões de maior qualidade também.
Por outro lado, o GS77 tem regredido em alguns aspectos chave. O tamanho e peso do chassi em particular são visivelmente maiores e mais pesados do que o GS76, o que significa que o GS77 não é tão fácil de viajar quanto seu predecessor. O painel de 240 Hz QHD também não é tão brilhante quanto o painel GS76 4K, enquanto o leitor de cartões SD é agora mais de duas vezes mais lento. O ângulo máximo das dobradiças é muito mais estreito desta vez também para menor liberdade de movimento.
Em geral, o modelo mais novo é um avanço geral para a série GS, apesar de alguns infelizes reveses. A GPU TGP de 105 W é um pouco preocupante, no entanto, pois pode sugerir que as futuras SKUs também serão travadas em GPUs de ~100 W, enquanto a lâmina 17 refrigerada por câmara de vapor pode utilizar versões de 165 W de potência mais alta. A MSI perdeu a oportunidade de adicionar características adicionais desejáveis ao GS77, incluindo um interruptor MUX, display calibrado de fábrica, ou suporte interno G-Sync, todos disponíveis nas versões menores Lâmina Razer 17.
Preço e Disponibilidade
O MSI Stealth GS77, conforme configurado nesta revisão, está agora disponível em Amazon por $3550 USD, Melhor compra por $3700 USD, ou no Xotic PC por $3700 USD.
MSI Stealth GS77 12UHS-083US
- 04/07/2022 v7 (old)
Allen Ngo
Price comparison

