Revisão de laptop Dell G15 5510: Orçamento de laptop para jogos com o RTX 3050

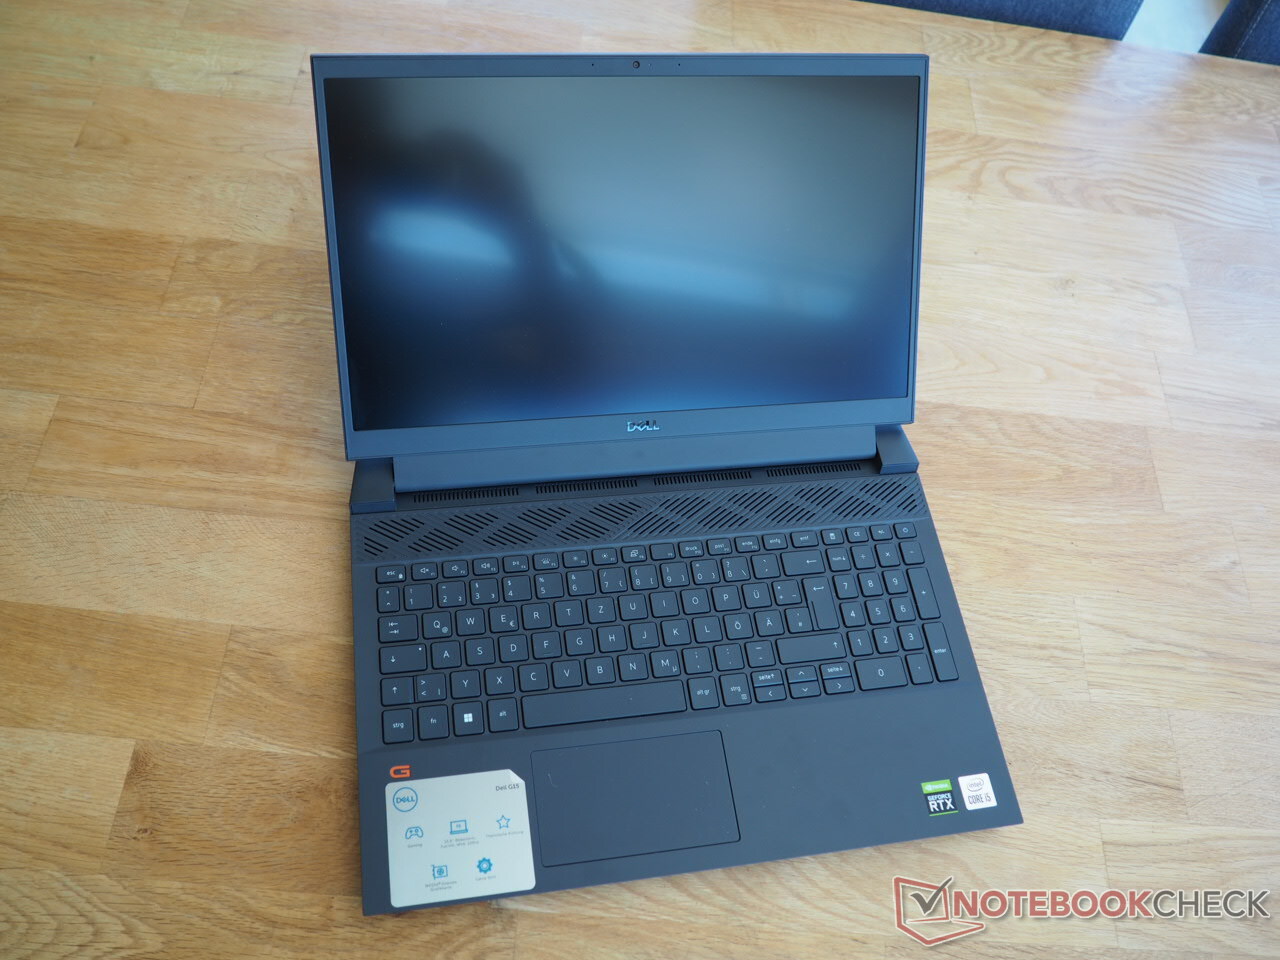
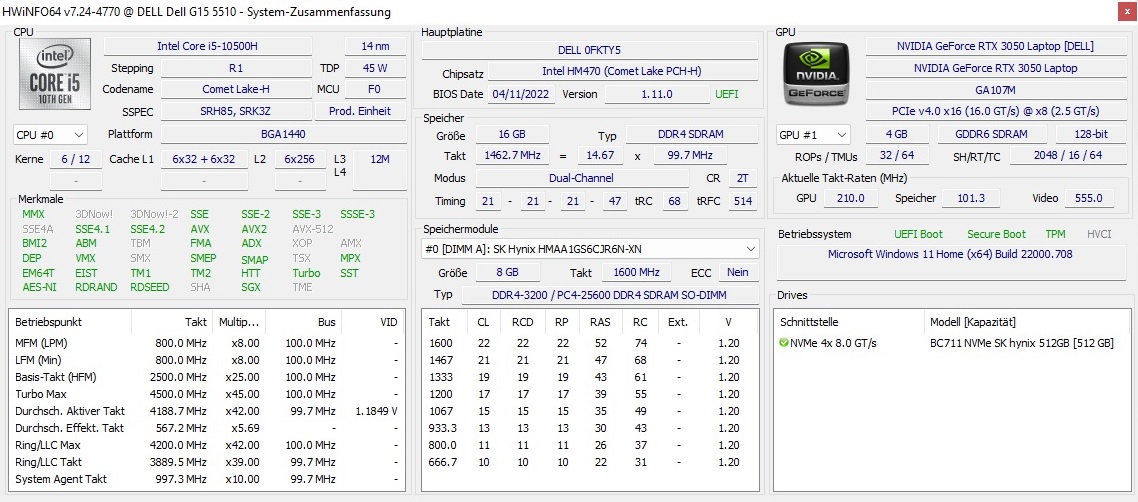
Os usuários que não estão dispostos ou capazes de gastar mais de 1.000 euros (~$1.050) por um laptop para jogos já devem ter se deparado com o Dell G15 5510. Embora a versão que revisamos não tenha mais a CPU mais atualizada com seu Núcleo i5-10500Hseis núcleos e 12 fios ainda são respeitáveis em 2022.
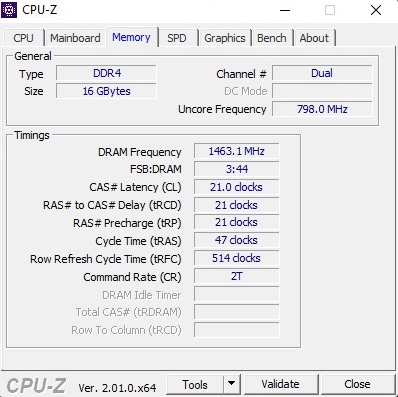
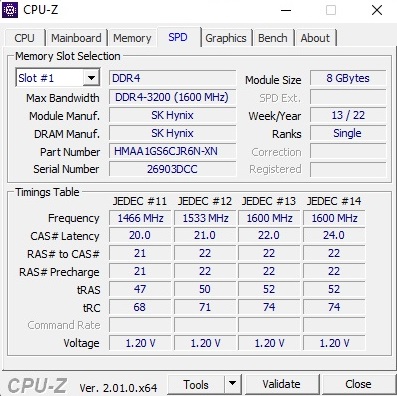
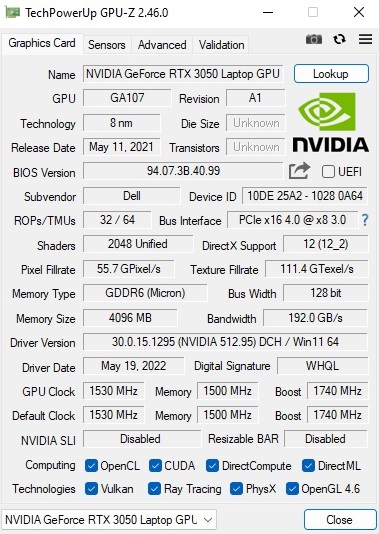
A placa gráfica, por outro lado, está atualizada graças ao suporte de traçado de raio, mesmo que oGeForce RTX 3050 rapidamente fica sem vapor em resoluções e configurações mais altas devido a sua configuração de pouca memória. A unidade de armazenamento em massa em nossa unidade de revisão é um SSD NVMe de 512 GB no formato M.2. Além disso, há sticks DDR4-3200 RAM de 2x 8 GB em modo de canal duplo. Um painel de visão ampla mate com uma taxa de atualização de 120 Hz trata da reprodução da imagem.
Os concorrentes da Dell G15 5510 incluem outros portáteis de jogos acessíveis com o GeForce RTX 3050 ou o RTX 3050 Ti, tais como o Acer Nitro 5 AN517oGigabyte G5 GDe o Lenovo IdeaPad Gaming 3 15IHUtodos eles aparecem nas tabelas como dispositivos de comparação
Possíveis concorrentes em comparação
Avaliação | Data | Modelo | Peso | Altura | Size | Resolução | Preço |
|---|---|---|---|---|---|---|---|
| 81 % v7 (old) | 06/2022 | Dell G15 5510 i5-10500H, GeForce RTX 3050 4GB Laptop GPU | 2.5 kg | 23 mm | 15.60" | 1920x1080 | |
| 81.1 % v7 (old) | 08/2021 | Acer Nitro 5 AN517-53-54DQ i5-11300H, GeForce RTX 3050 4GB Laptop GPU | 2.6 kg | 25 mm | 17.30" | 1920x1080 | |
| 81.7 % v7 (old) | 11/2021 | Gigabyte G5 GD i5-11400H, GeForce RTX 3050 4GB Laptop GPU | 2.1 kg | 31.6 mm | 15.60" | 1920x1080 | |
| 79.7 % v7 (old) | 03/2022 | Lenovo Ideapad Gaming 3 15IHU-82K1002RGE i5-11300H, GeForce RTX 3050 Ti Laptop GPU | 2 kg | 24.2 mm | 15.60" | 1920x1080 | |
| 79.1 % v7 (old) | 05/2022 | Dell G15 5510-43NHT i5-10200H, GeForce RTX 3050 Ti Laptop GPU | 2.5 kg | 23.33 mm | 15.60" | 1920x1080 |
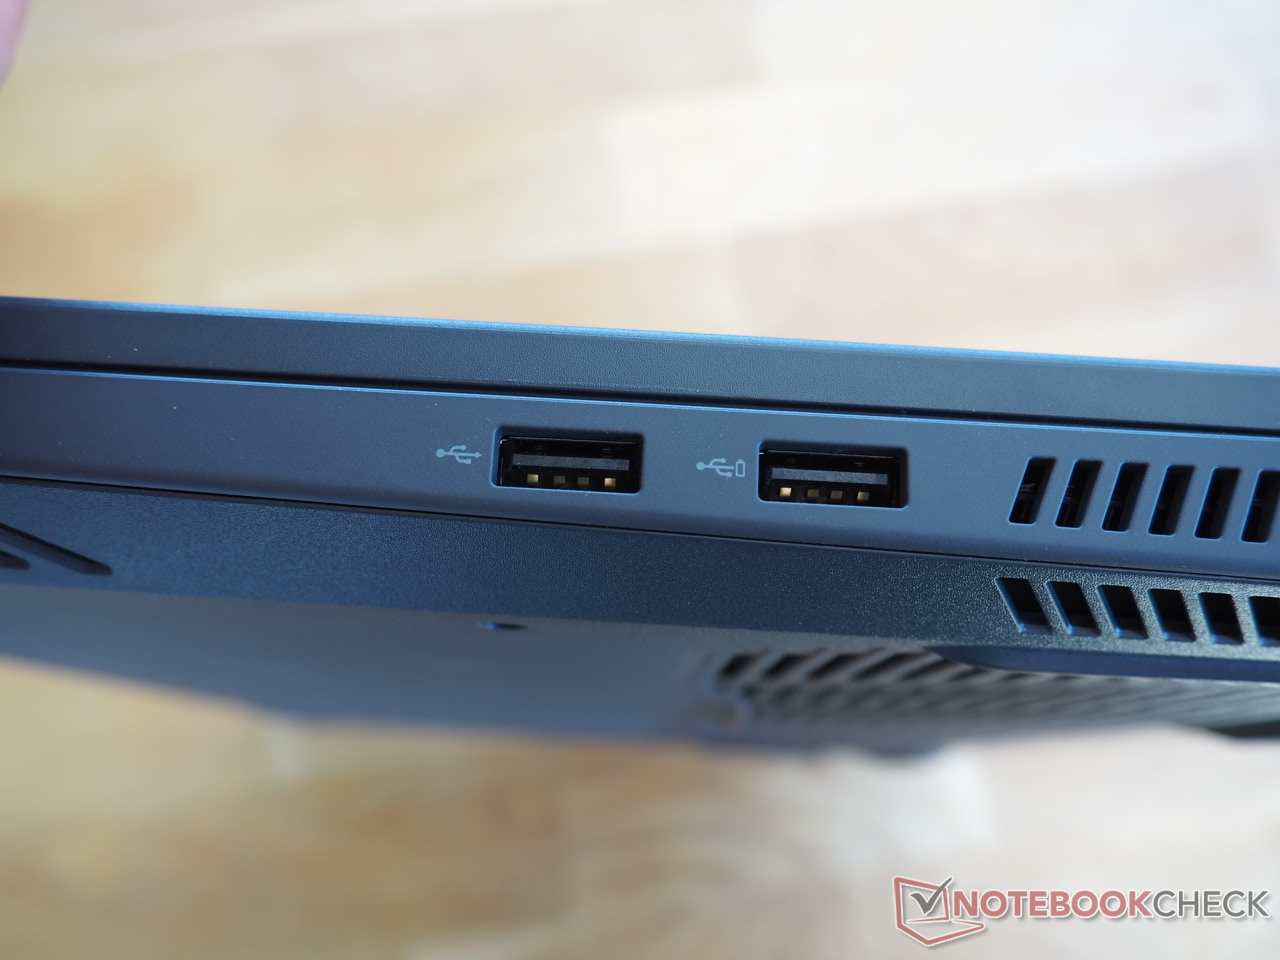
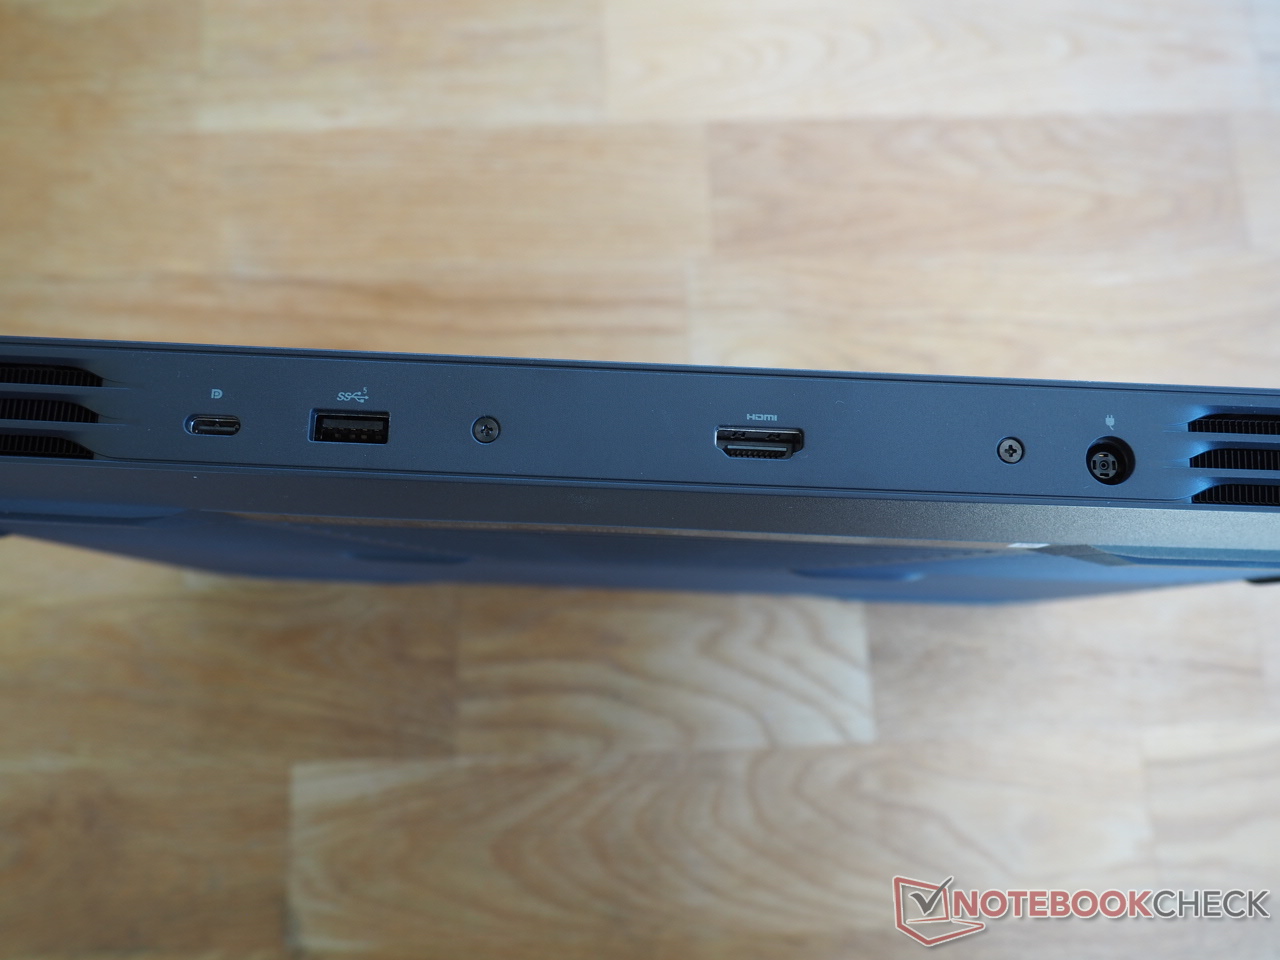
Uma vez que o caso é idêntico ao modelo revisto recentemente com oNúcleo i5-10200H e o RTX 3050 Tinão entraremos em detalhes sobre o chassi, a conectividade (portas, etc.), e os dispositivos de entrada aqui. As informações correspondentes podem ser encontradas na seção artigo ligado

Comunicação
| Networking - iperf3 receive AXE11000 | |
| Dell G15 5510 | |
| Média da turma Gaming (680 - 1745, n=93, últimos 2 anos) | |
Webcam


Mostrar
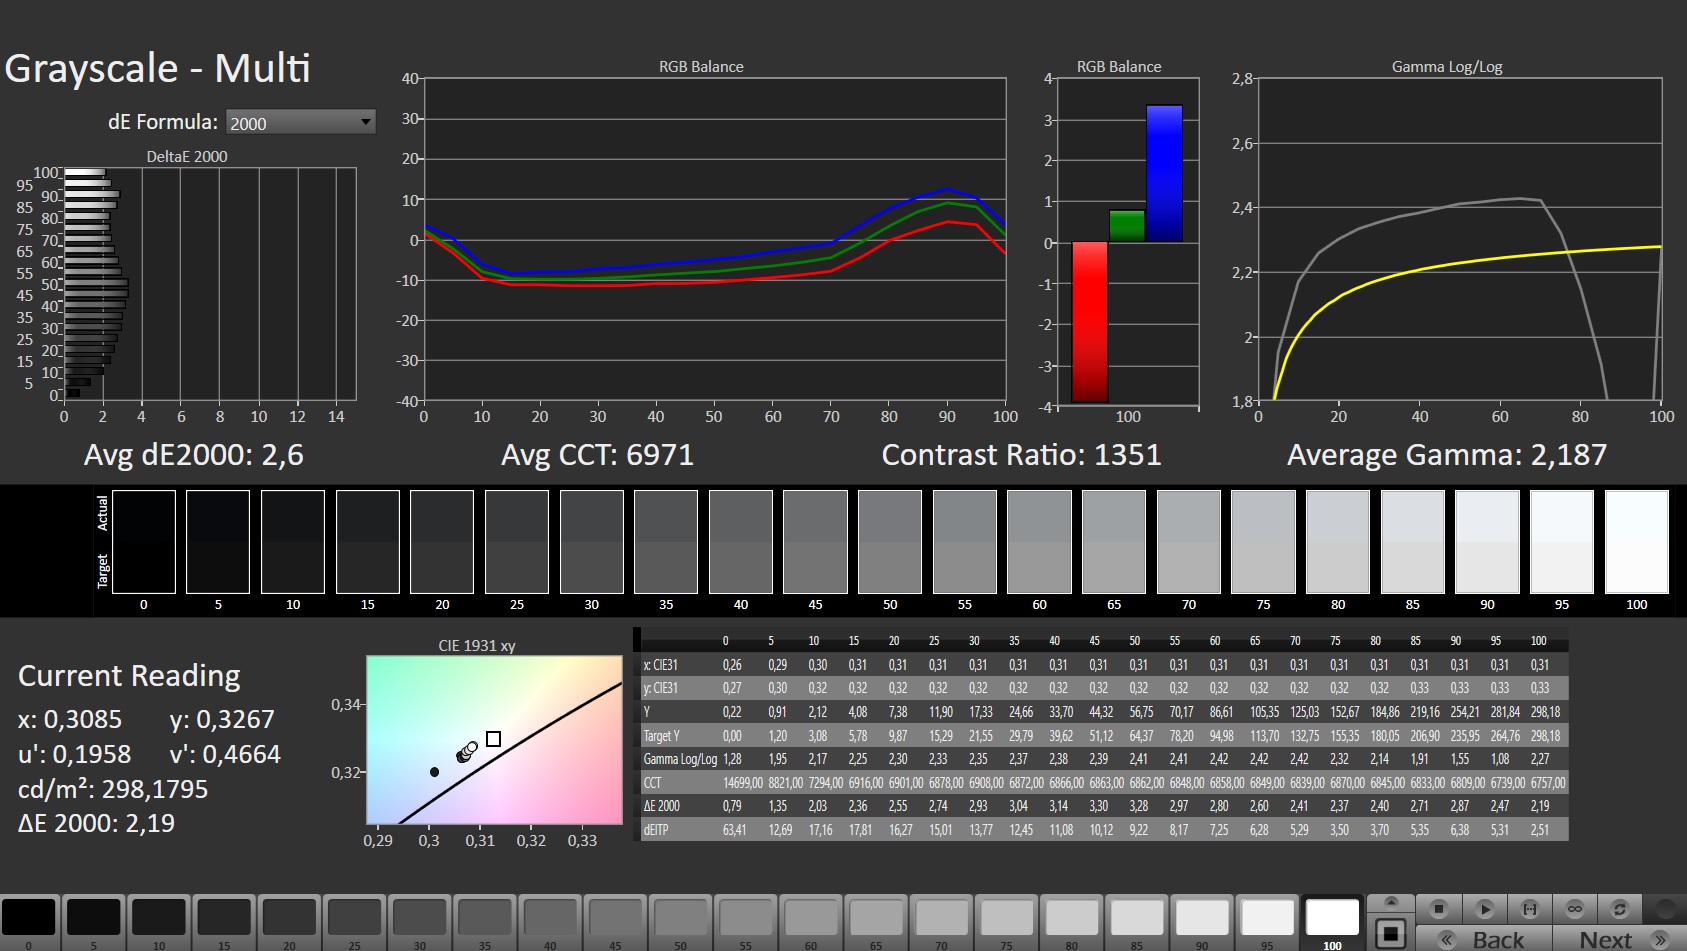
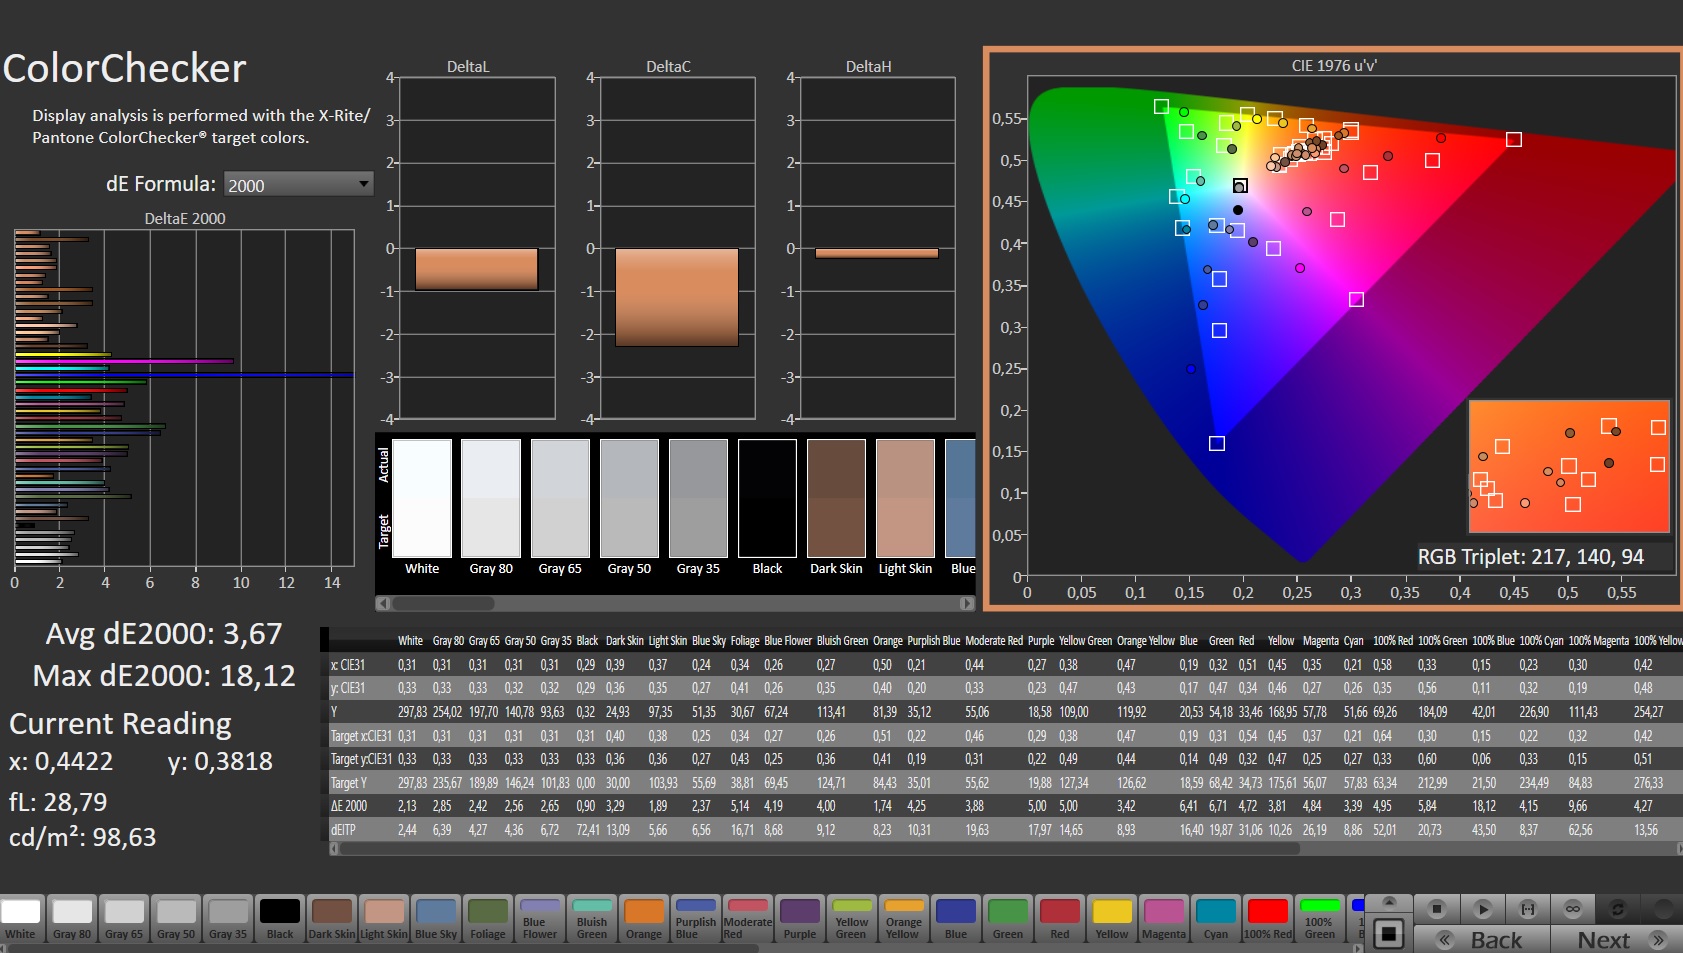
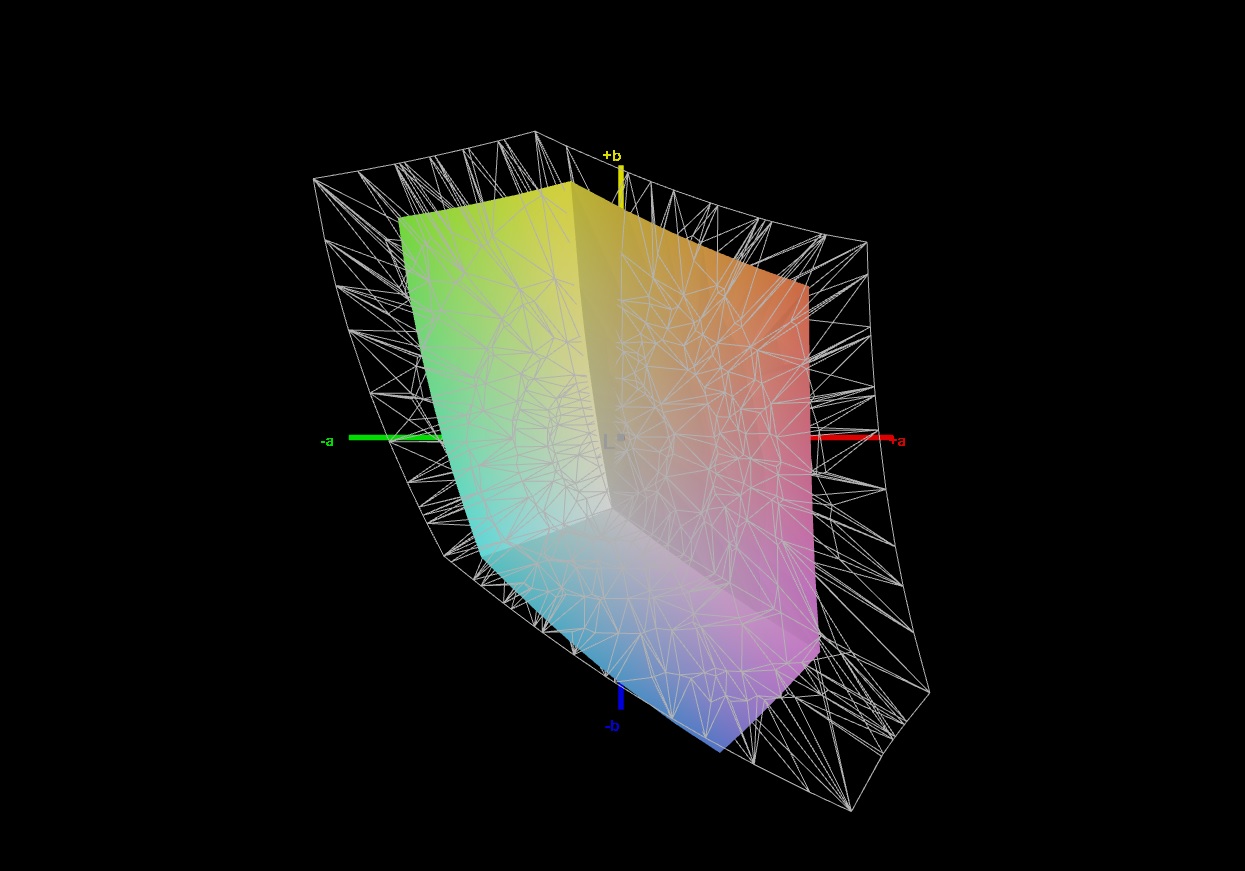
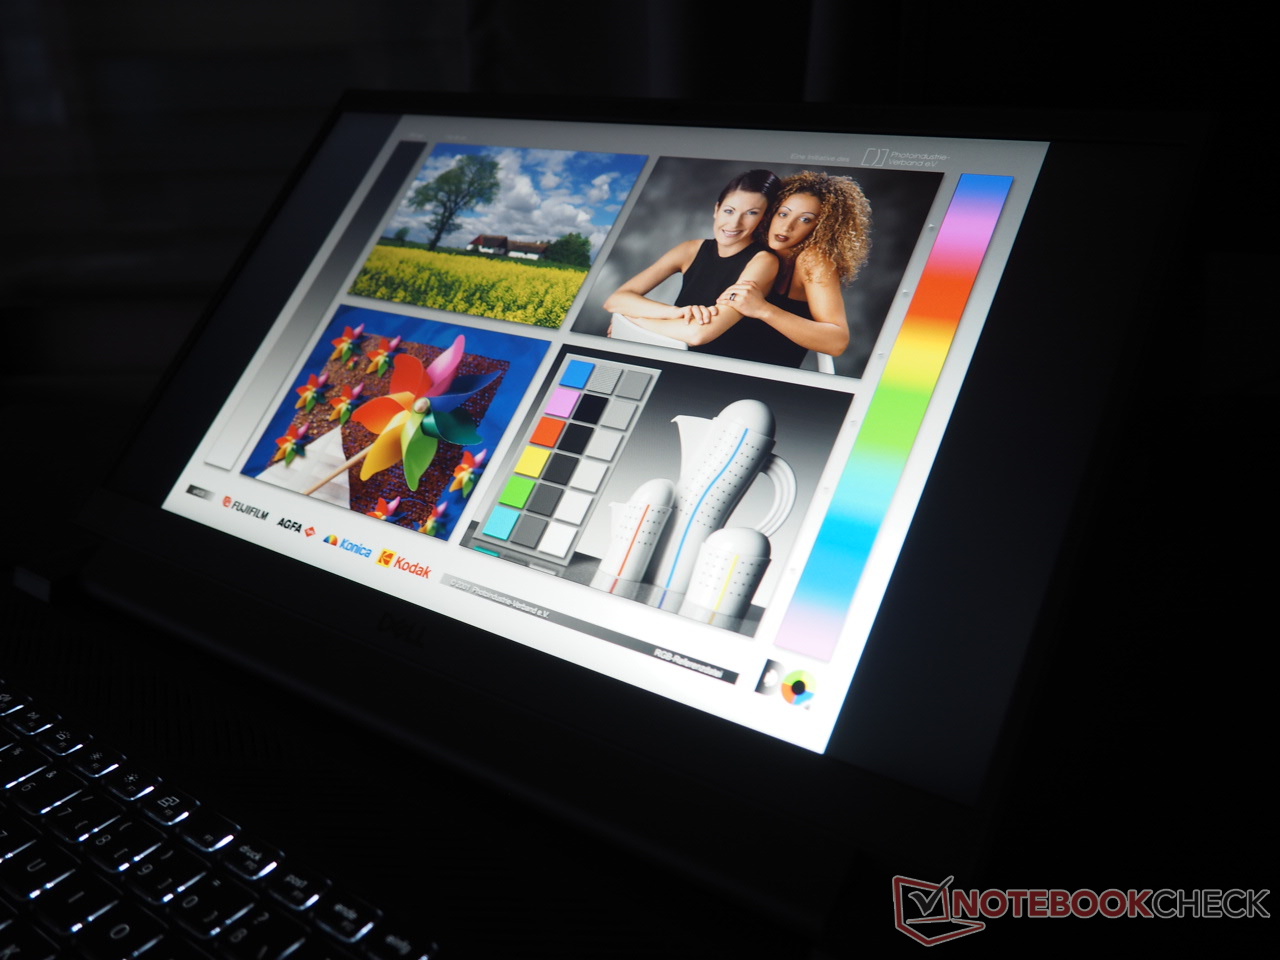
Como a maioria dos laptops para jogos de azar, o Dell G15 5510 infelizmente não tem uma boa tela. Enquanto o nível de preto e contraste são mais do que decentes para um laptop com um painel IPS (0,24 cd/m² e 1.200:1, respectivamente), o brilho e o espaço de cores deixam muito a desejar. Uma média de 264 cd/m² significa que o equipamento de 15 polegadas não é adequado para uso externo. O display teria que atingir pelo menos 350 cd/m² para isto.
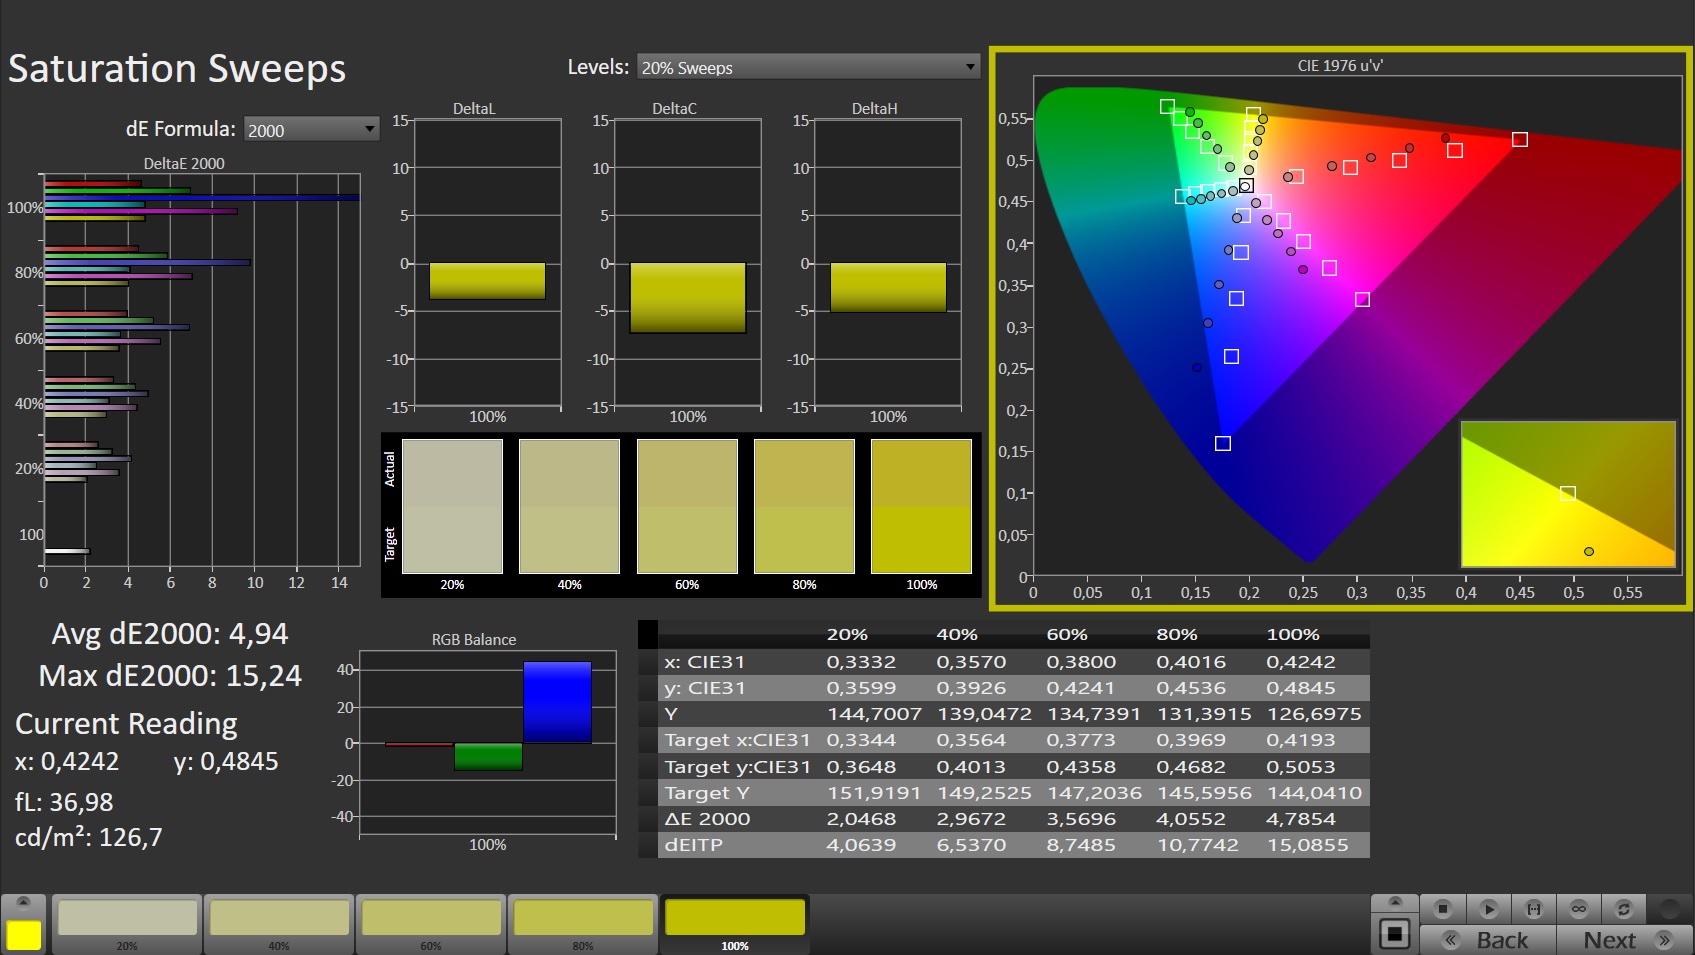
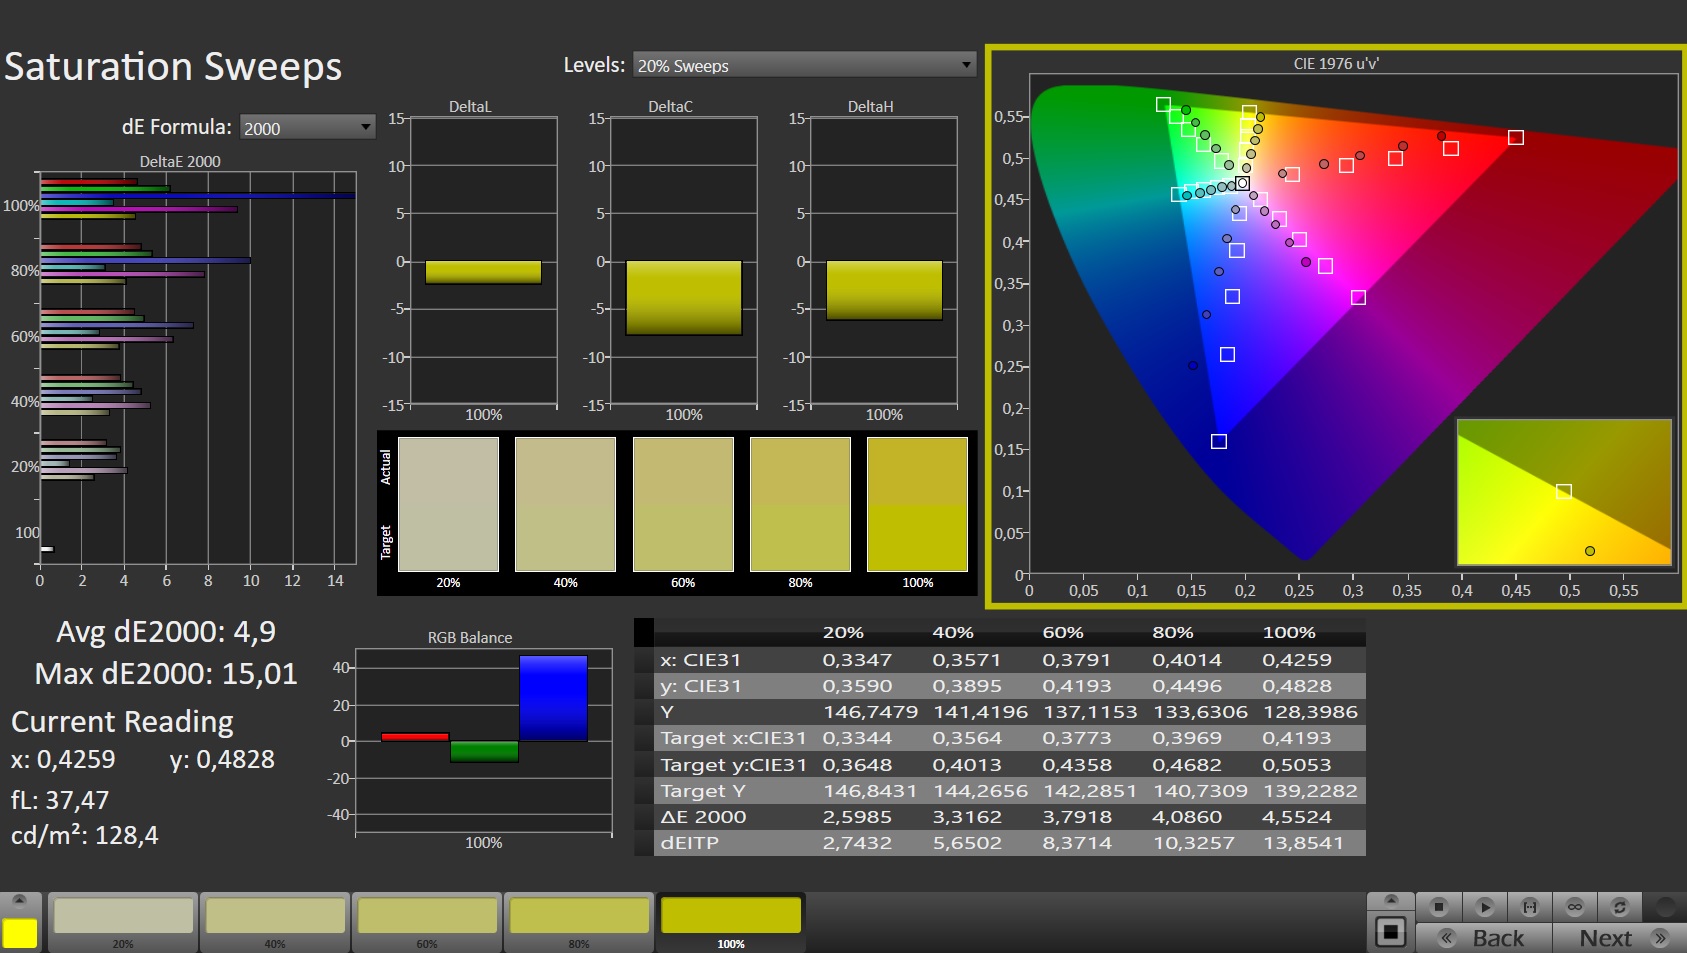
Uma escassa cobertura de 62% de sRGB também leva a cores relativamente pálidas, mas a precisão da cor é aceitável. O tempo de resposta também é pior do que o que estamos familiarizados com os laptops mais caros para jogos. Cerca de 21 ms de preto para branco e 33 ms de cinza para cinza podem levar a compromissos durante movimentos rápidos (por exemplo, em atiradores em primeira pessoa). Enquanto isso, há pouco a reclamar em termos de ângulos de visão - estes são agradavelmente estáveis.
| |||||||||||||||||||||||||
iluminação: 88 %
iluminação com acumulador: 288 cd/m²
Contraste: 1200:1 (Preto: 0.24 cd/m²)
ΔE ColorChecker Calman: 3.67 | ∀{0.5-29.43 Ø4.72}
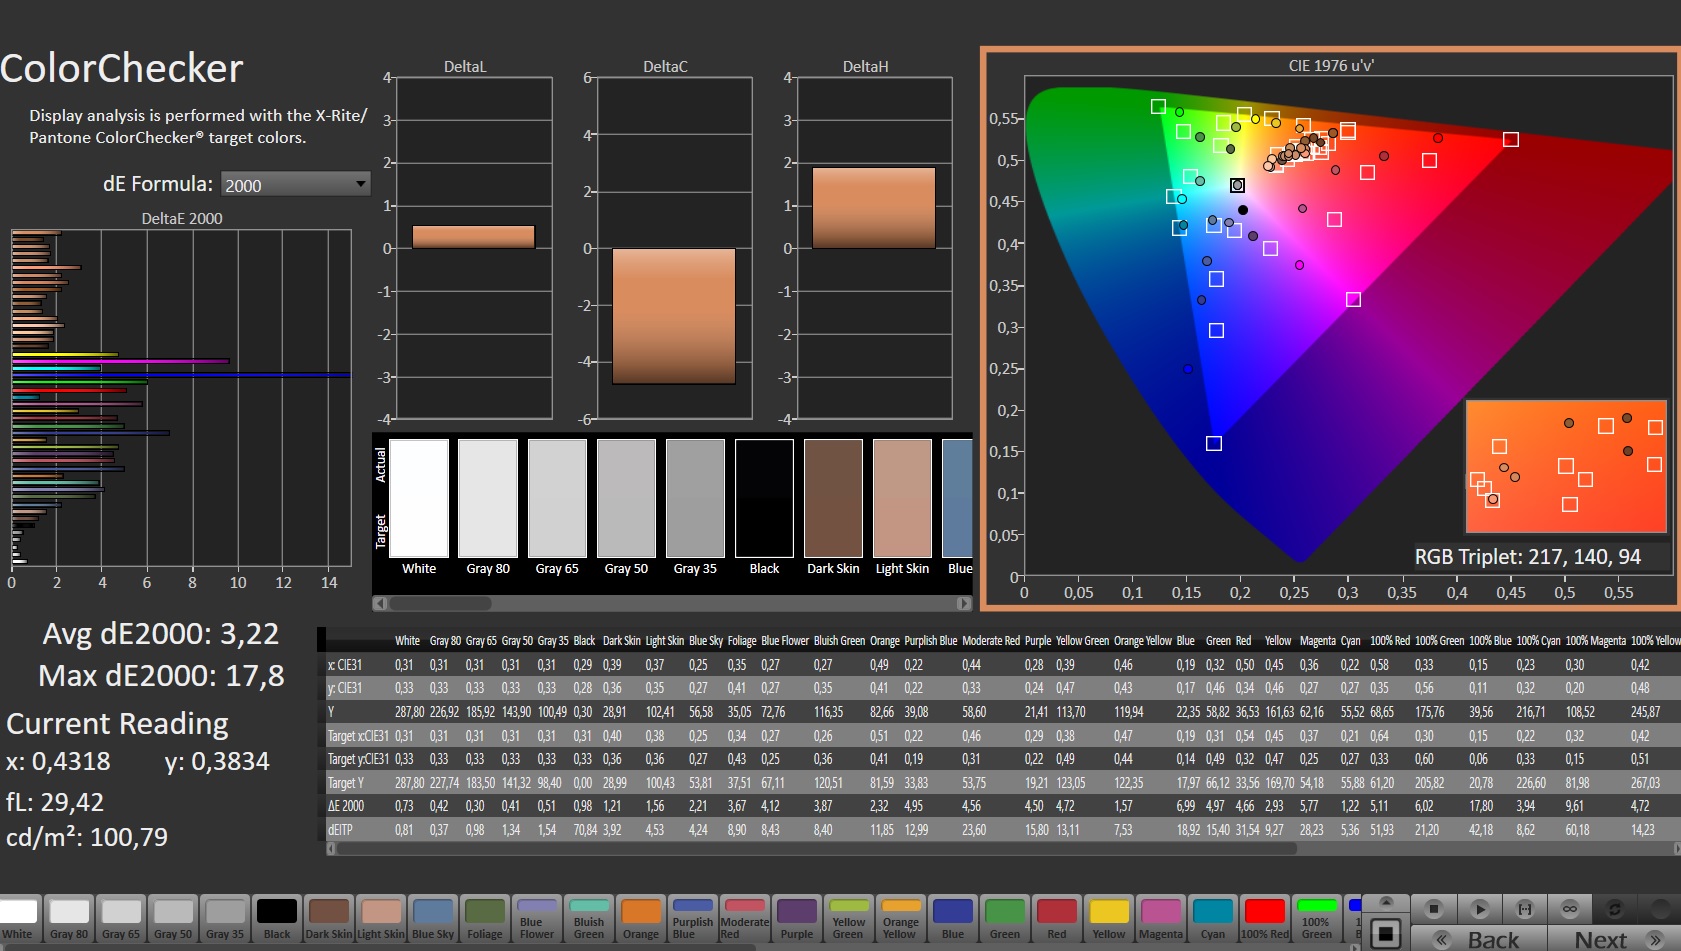
calibrated: 3.22
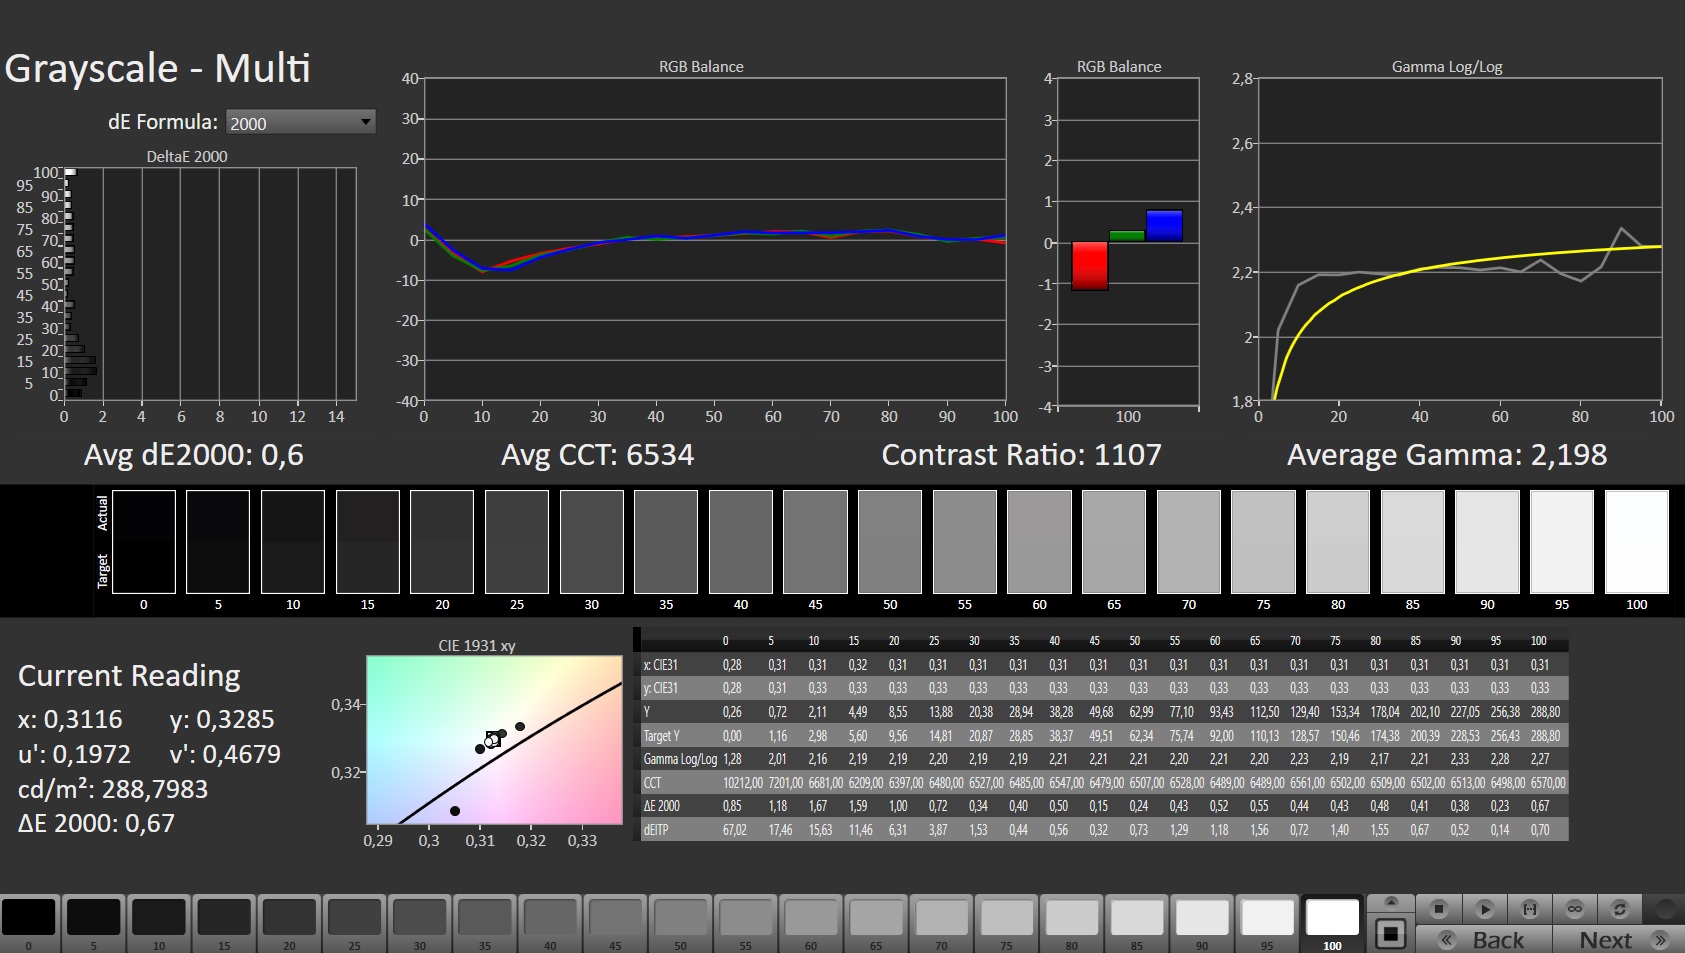
ΔE Greyscale Calman: 2.6 | ∀{0.09-98 Ø4.97}
43% AdobeRGB 1998 (Argyll 3D)
62.2% sRGB (Argyll 3D)
41.6% Display P3 (Argyll 3D)
Gamma: 2.187
CCT: 6971 K
| Dell G15 5510 YMHWH_156HRA (CMN1522), IPS, 1920x1080, 15.6" | Acer Nitro 5 AN517-53-54DQ BOE NV173FHM-NX4 (BOE09B4), IPS, 1920x1080, 17.3" | Gigabyte G5 GD Chi Mei N156HRA-EA1, IPS, 1920x1080, 15.6" | Lenovo Ideapad Gaming 3 15IHU-82K1002RGE LEN156FHD, IPS, 1920x1080, 15.6" | Dell G15 5510-43NHT Dell 156GL05, IPS, 1920x1080, 15.6" | |
|---|---|---|---|---|---|
| Display | -12% | 0% | -4% | -2% | |
| Display P3 Coverage (%) | 41.6 | 36.7 -12% | 41.8 0% | 39.7 -5% | 40.8 -2% |
| sRGB Coverage (%) | 62.2 | 55 -12% | 62.3 0% | 59.6 -4% | 61.4 -1% |
| AdobeRGB 1998 Coverage (%) | 43 | 37.9 -12% | 43.2 0% | 41.1 -4% | 42.2 -2% |
| Response Times | 18% | -8% | -55% | -18% | |
| Response Time Grey 50% / Grey 80% * (ms) | 33.3 ? | 24.8 ? 26% | 34.4 ? -3% | 46.4 ? -39% | 35 ? -5% |
| Response Time Black / White * (ms) | 20.7 ? | 18.8 ? 9% | 23.2 ? -12% | 35.2 ? -70% | 27 ? -30% |
| PWM Frequency (Hz) | |||||
| Screen | -7% | 0% | -18% | -68% | |
| Brightness middle (cd/m²) | 288 | 286 -1% | 261 -9% | 307 7% | 290 1% |
| Brightness (cd/m²) | 264 | 261 -1% | 246 -7% | 292 11% | 267 1% |
| Brightness Distribution (%) | 88 | 83 -6% | 87 -1% | 88 0% | 87 -1% |
| Black Level * (cd/m²) | 0.24 | 0.23 4% | 0.19 21% | 0.21 12% | 1.085 -352% |
| Contrast (:1) | 1200 | 1243 4% | 1374 15% | 1462 22% | 267 -78% |
| Colorchecker dE 2000 * | 3.67 | 4.92 -34% | 3.9 -6% | 5.9 -61% | 6.5 -77% |
| Colorchecker dE 2000 max. * | 18.12 | 19.29 -6% | 19.26 -6% | 21.6 -19% | 16.96 6% |
| Colorchecker dE 2000 calibrated * | 3.22 | 4.73 -47% | 3.24 -1% | 4.8 -49% | 4.11 -28% |
| Greyscale dE 2000 * | 2.6 | 1.9 27% | 2.7 -4% | 4.9 -88% | 4.85 -87% |
| Gamma | 2.187 101% | 2.175 101% | 2.248 98% | 2.26 97% | 2.22 99% |
| CCT | 6971 93% | 6782 96% | 6828 95% | 6504 100% | 7401 88% |
| Média Total (Programa/Configurações) | -0% /
-4% | -3% /
-1% | -26% /
-21% | -29% /
-47% |
* ... menor é melhor
Exibir tempos de resposta
| ↔ Tempo de resposta preto para branco | ||
|---|---|---|
| 20.7 ms ... ascensão ↗ e queda ↘ combinadas | ↗ 11.8 ms ascensão | 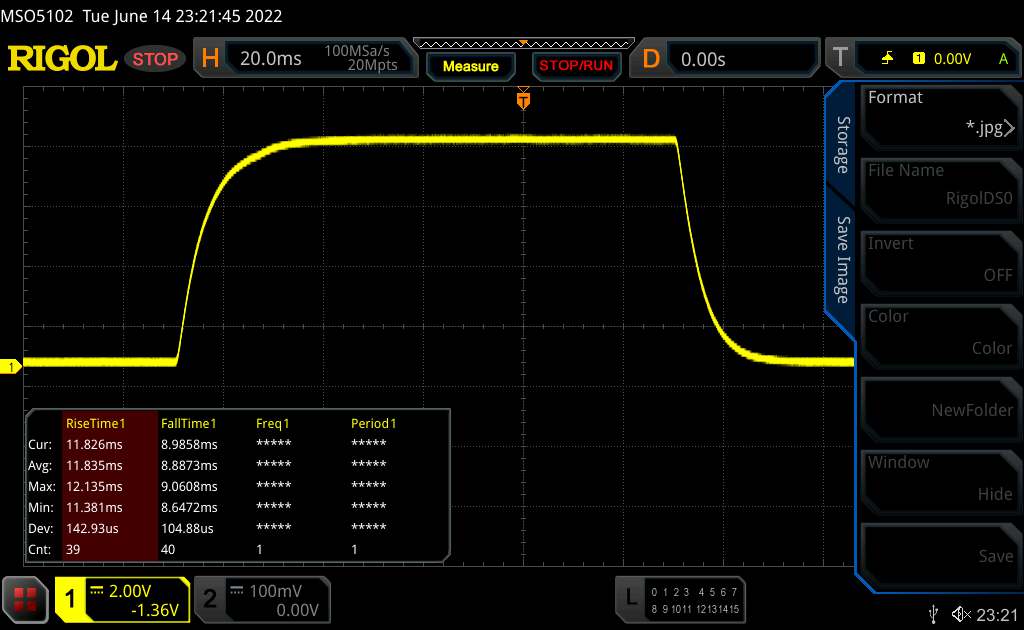 |
| ↘ 8.9 ms queda | ||
| A tela mostra boas taxas de resposta em nossos testes, mas pode ser muito lenta para jogadores competitivos. Em comparação, todos os dispositivos testados variam de 0.1 (mínimo) a 240 (máximo) ms. » 46 % de todos os dispositivos são melhores. Isso significa que o tempo de resposta medido é semelhante à média de todos os dispositivos testados (19.8 ms). | ||
| ↔ Tempo de resposta 50% cinza a 80% cinza | ||
| 33.3 ms ... ascensão ↗ e queda ↘ combinadas | ↗ 16.2 ms ascensão | 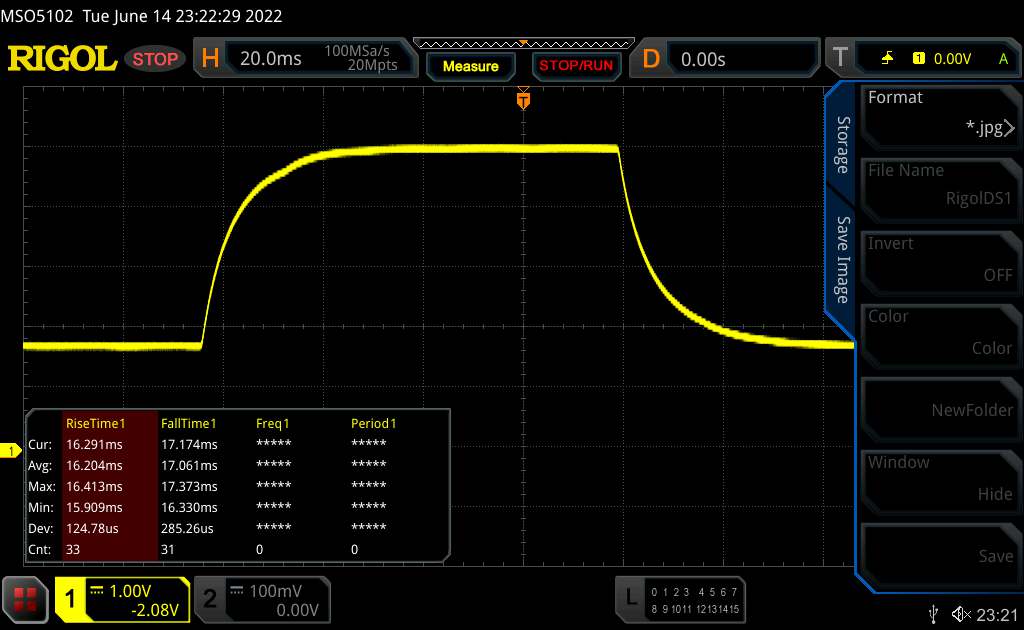 |
| ↘ 17.1 ms queda | ||
| A tela mostra taxas de resposta lentas em nossos testes e será insatisfatória para os jogadores. Em comparação, todos os dispositivos testados variam de 0.165 (mínimo) a 636 (máximo) ms. » 46 % de todos os dispositivos são melhores. Isso significa que o tempo de resposta medido é semelhante à média de todos os dispositivos testados (31 ms). | ||
Cintilação da tela / PWM (modulação por largura de pulso)
| Tela tremeluzindo / PWM não detectado | 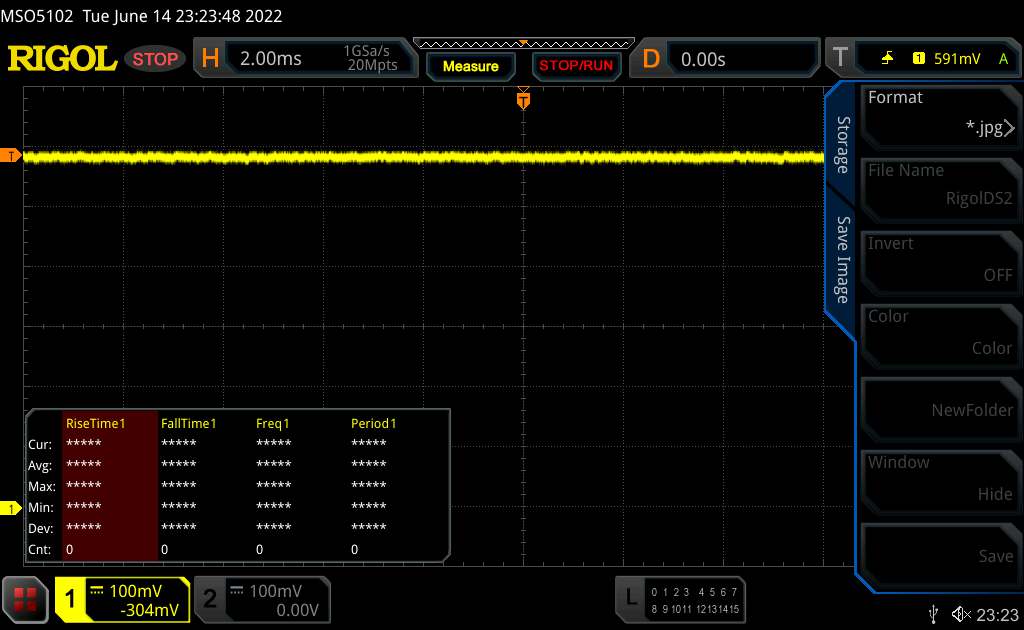 | ||
[pwm_comparison] Em comparação: 52 % de todos os dispositivos testados não usam PWM para escurecer a tela. Se PWM foi detectado, uma média de 7769 (mínimo: 5 - máximo: 343500) Hz foi medida. | |||
Desempenho
O Core i5-10500H e o GeForce RTX 3050 colocam o Dell G15 na faixa média. 16 GB de RAM e 512 GB de armazenamento também são padrão para um dispositivo de jogo econômico
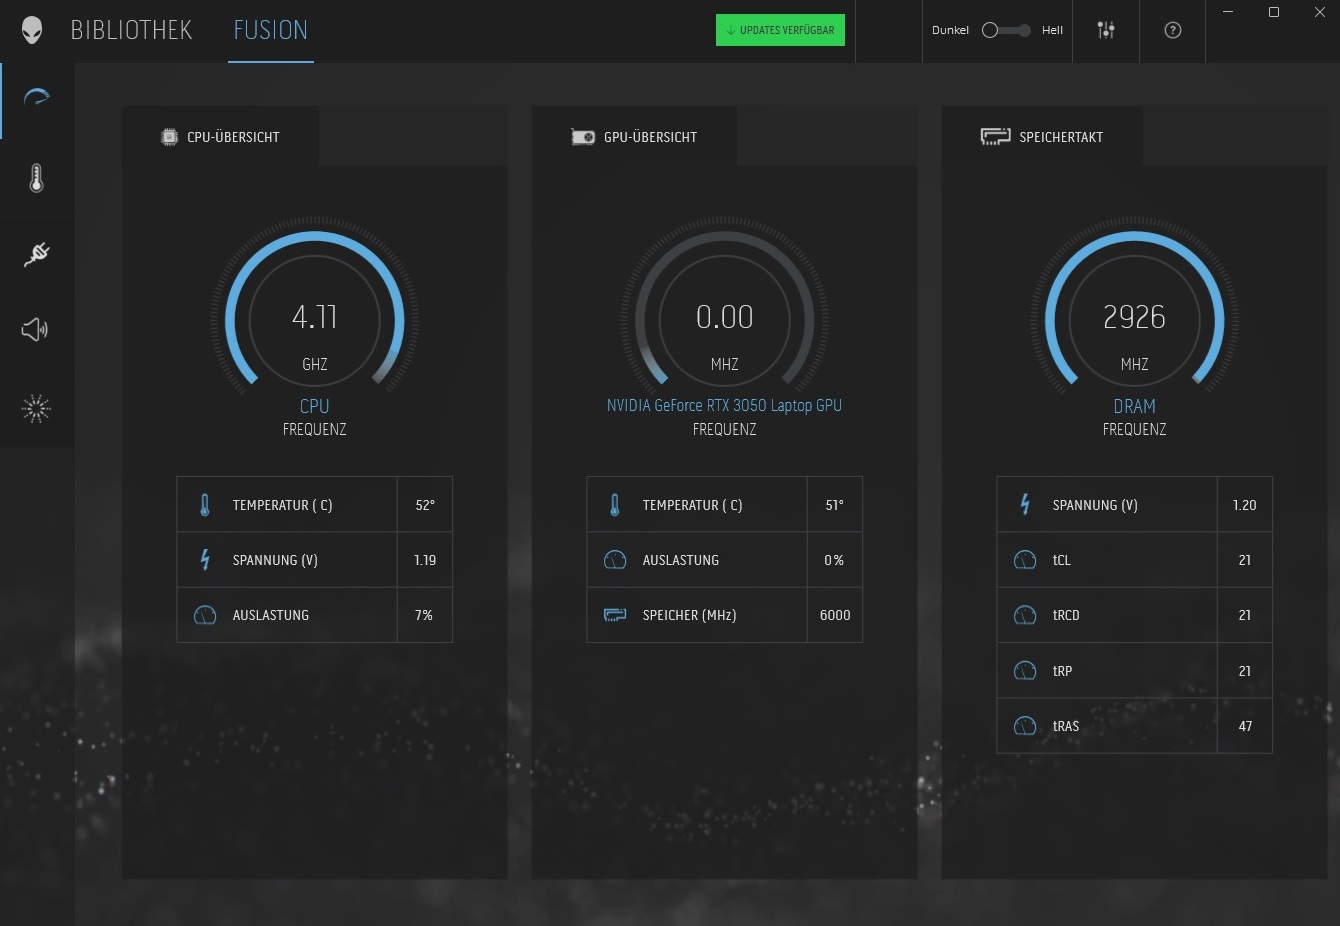
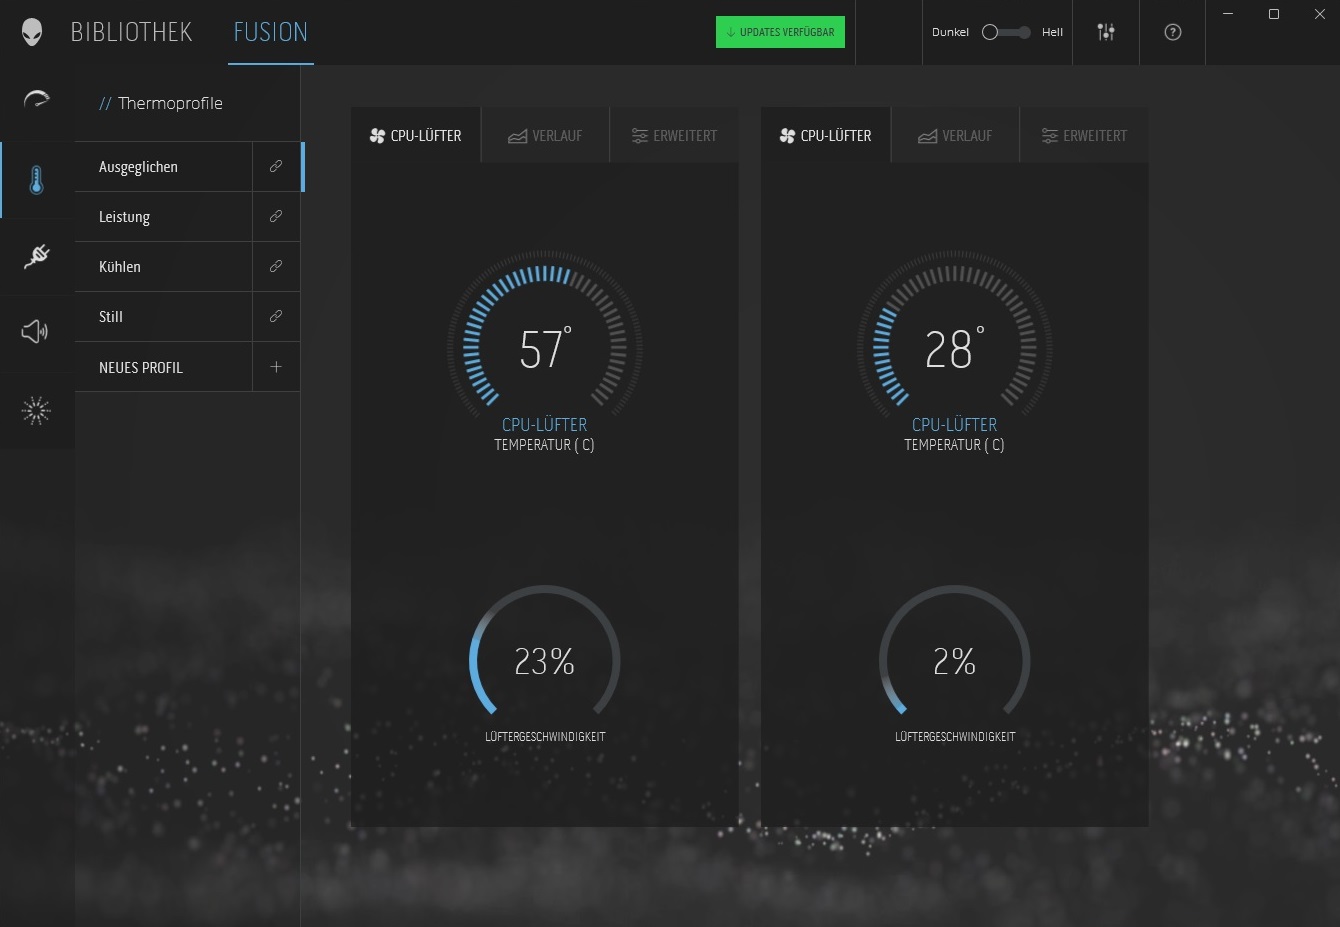
Condições de teste
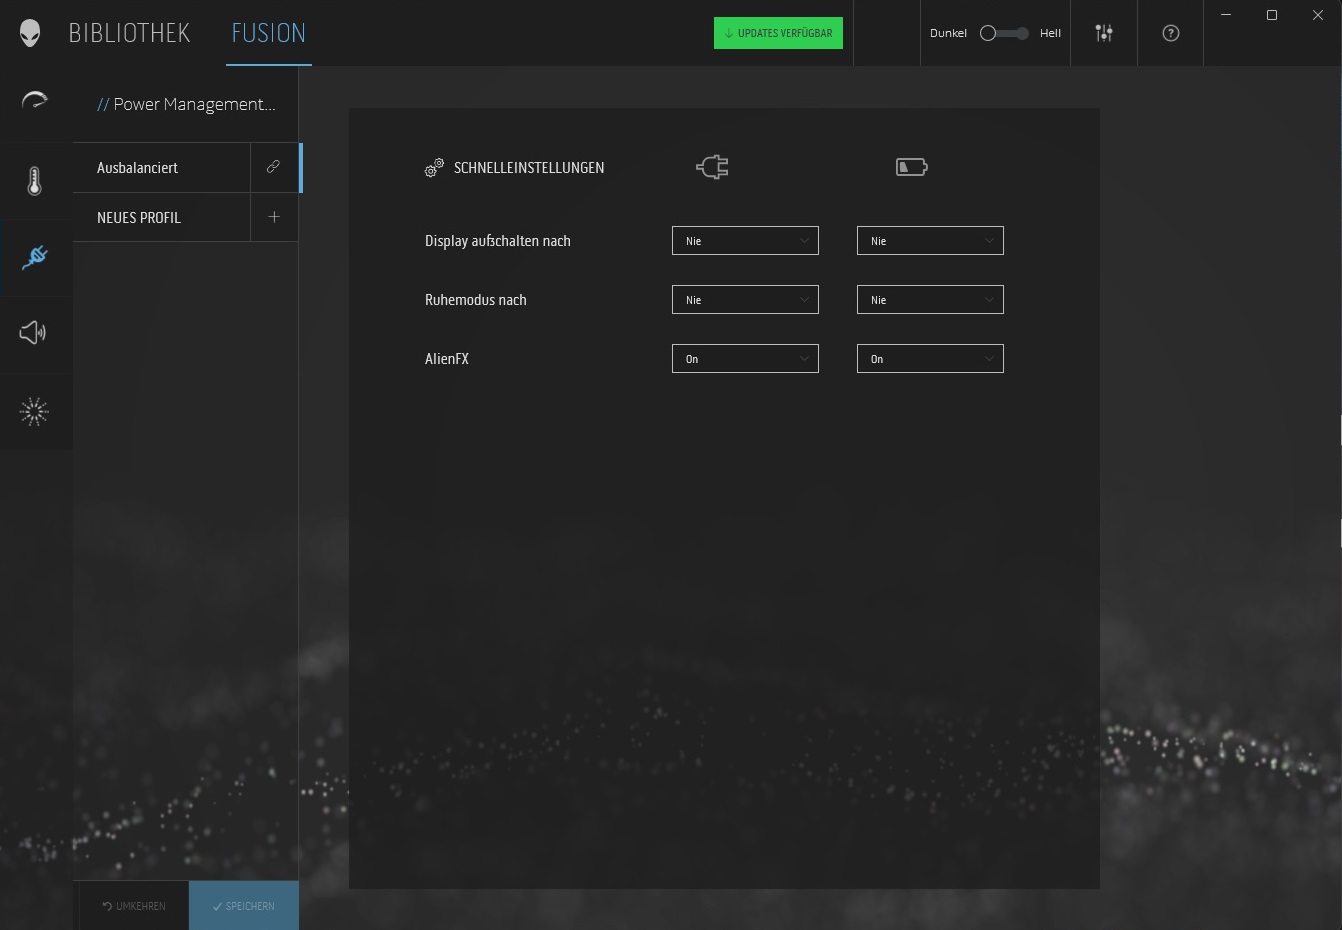
O Centro de Comando de Alienígenas pré-instalado permite o ajuste de dezenas de configurações do sistema. Nossos testes foram realizados utilizando a configuração padrão, onde tanto o gerenciamento de energia quanto o perfil térmico são definidos como "Balanceados" (veja screenshots)
Processador
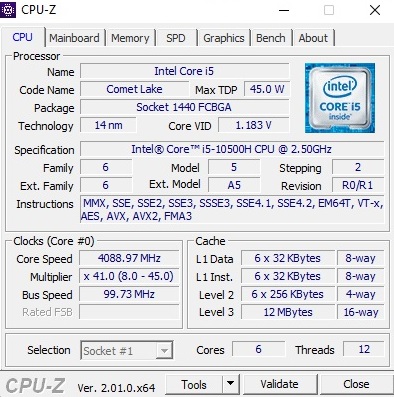
O Core i5-10500H é uma CPU hexa-core um pouco mais antiga da geração Comet Lake da Intel, que é fabricada no processo ultrapassado de 14 nm. Como mencionado anteriormente, o modelo de 45 watts pode processar até 12 roscas em paralelo. Quando a GPU Nvidia dedicada é ociosa, o chip gráfico interno, ou seja, oUHD Graphics 630 (tecnologia Optimus), assume o controle.
Em comparação com os laptops rivais com CPUs mais recentes, o desempenho de nossa unidade de revisão é decente. Conseqüentemente, a i5-10500H se instala confortavelmente entre osNúcleo i5-11300He o Núcleo i5-11400H no laço Cinebench R15, e supera facilmente a i5-10200H encontrada em seu modelo irmão de preço semelhante. Muito bom: O desempenho da CPU permanece bastante constante, mesmo em períodos prolongados de tempo.
Cinebench R15 Multi endurance test
| CPU Performance rating - Percent | |
| Média da turma Gaming | |
| Gigabyte G5 GD | |
| Acer Nitro 5 AN517-53-54DQ | |
| Média Intel Core i5-10500H | |
| Dell G15 5510 | |
| Lenovo Ideapad Gaming 3 15IHU-82K1002RGE | |
| Dell G15 5510-43NHT | |
* ... menor é melhor
AIDA64: FP32 Ray-Trace | FPU Julia | CPU SHA3 | CPU Queen | FPU SinJulia | FPU Mandel | CPU AES | CPU ZLib | FP64 Ray-Trace | CPU PhotoWorxx
| Performance rating | |
| Média da turma Gaming | |
| Gigabyte G5 GD | |
| Média Intel Core i5-10500H | |
| Dell G15 5510 | |
| Acer Nitro 5 AN517-53-54DQ | |
| Lenovo Ideapad Gaming 3 15IHU-82K1002RGE | |
| Dell G15 5510-43NHT | |
| AIDA64 / FP32 Ray-Trace | |
| Média da turma Gaming (10227 - 85542, n=107, últimos 2 anos) | |
| Gigabyte G5 GD | |
| Média Intel Core i5-10500H (9253 - 9580, n=2) | |
| Dell G15 5510 | |
| Acer Nitro 5 AN517-53-54DQ | |
| Lenovo Ideapad Gaming 3 15IHU-82K1002RGE | |
| Dell G15 5510-43NHT | |
| AIDA64 / FPU Julia | |
| Média da turma Gaming (51376 - 238426, n=107, últimos 2 anos) | |
| Média Intel Core i5-10500H (44720 - 47454, n=2) | |
| Dell G15 5510 | |
| Gigabyte G5 GD | |
| Acer Nitro 5 AN517-53-54DQ | |
| Lenovo Ideapad Gaming 3 15IHU-82K1002RGE | |
| Dell G15 5510-43NHT | |
| AIDA64 / CPU SHA3 | |
| Média da turma Gaming (2180 - 9817, n=107, últimos 2 anos) | |
| Gigabyte G5 GD | |
| Acer Nitro 5 AN517-53-54DQ | |
| Lenovo Ideapad Gaming 3 15IHU-82K1002RGE | |
| Dell G15 5510 | |
| Média Intel Core i5-10500H (2208 - 2248, n=2) | |
| Dell G15 5510-43NHT | |
| AIDA64 / CPU Queen | |
| Média da turma Gaming (49785 - 173351, n=95, últimos 2 anos) | |
| Média Intel Core i5-10500H (70396 - 70505, n=2) | |
| Dell G15 5510 | |
| Gigabyte G5 GD | |
| Acer Nitro 5 AN517-53-54DQ | |
| Lenovo Ideapad Gaming 3 15IHU-82K1002RGE | |
| Dell G15 5510-43NHT | |
| AIDA64 / FPU SinJulia | |
| Média da turma Gaming (4424 - 33636, n=107, últimos 2 anos) | |
| Média Intel Core i5-10500H (7577 - 7586, n=2) | |
| Dell G15 5510 | |
| Gigabyte G5 GD | |
| Dell G15 5510-43NHT | |
| Acer Nitro 5 AN517-53-54DQ | |
| Lenovo Ideapad Gaming 3 15IHU-82K1002RGE | |
| AIDA64 / FPU Mandel | |
| Média da turma Gaming (25115 - 128721, n=107, últimos 2 anos) | |
| Gigabyte G5 GD | |
| Média Intel Core i5-10500H (22652 - 24130, n=2) | |
| Dell G15 5510 | |
| Acer Nitro 5 AN517-53-54DQ | |
| Lenovo Ideapad Gaming 3 15IHU-82K1002RGE | |
| Dell G15 5510-43NHT | |
| AIDA64 / CPU AES | |
| Média da turma Gaming (39258 - 247074, n=107, últimos 2 anos) | |
| Gigabyte G5 GD | |
| Acer Nitro 5 AN517-53-54DQ | |
| Lenovo Ideapad Gaming 3 15IHU-82K1002RGE | |
| Média Intel Core i5-10500H (28648 - 28670, n=2) | |
| Dell G15 5510 | |
| Dell G15 5510-43NHT | |
| AIDA64 / CPU ZLib | |
| Média da turma Gaming (574 - 2531, n=107, últimos 2 anos) | |
| Gigabyte G5 GD | |
| Média Intel Core i5-10500H (533 - 548, n=2) | |
| Dell G15 5510 | |
| Lenovo Ideapad Gaming 3 15IHU-82K1002RGE | |
| Acer Nitro 5 AN517-53-54DQ | |
| Dell G15 5510-43NHT | |
| AIDA64 / FP64 Ray-Trace | |
| Média da turma Gaming (5509 - 45446, n=107, últimos 2 anos) | |
| Gigabyte G5 GD | |
| Média Intel Core i5-10500H (5011 - 5291, n=2) | |
| Dell G15 5510 | |
| Acer Nitro 5 AN517-53-54DQ | |
| Lenovo Ideapad Gaming 3 15IHU-82K1002RGE | |
| Dell G15 5510-43NHT | |
| AIDA64 / CPU PhotoWorxx | |
| Média da turma Gaming (12271 - 89891, n=107, últimos 2 anos) | |
| Gigabyte G5 GD | |
| Média Intel Core i5-10500H (15629 - 21126, n=2) | |
| Dell G15 5510 | |
| Acer Nitro 5 AN517-53-54DQ | |
| Lenovo Ideapad Gaming 3 15IHU-82K1002RGE | |
| Dell G15 5510-43NHT | |
Desempenho do sistema
O desempenho do sistema do dispositivo preenche todas as expectativas que você possa ter de um laptop para jogos. Embora os resultados no PCMark 10 sejam apenas bons o suficiente para o penúltimo lugar no campo de teste, o sistema operacional (Windows 11 Home) responde agradavelmente rápido de um ponto de vista subjetivo
CrossMark: Overall | Productivity | Creativity | Responsiveness
| PCMark 10 / Score | |
| Média da turma Gaming (5828 - 11574, n=95, últimos 2 anos) | |
| Gigabyte G5 GD | |
| Acer Nitro 5 AN517-53-54DQ | |
| Lenovo Ideapad Gaming 3 15IHU-82K1002RGE | |
| Dell G15 5510 | |
| Dell G15 5510-43NHT | |
| PCMark 10 / Essentials | |
| Média da turma Gaming (8810 - 12600, n=99, últimos 2 anos) | |
| Acer Nitro 5 AN517-53-54DQ | |
| Gigabyte G5 GD | |
| Lenovo Ideapad Gaming 3 15IHU-82K1002RGE | |
| Dell G15 5510 | |
| Dell G15 5510-43NHT | |
| PCMark 10 / Productivity | |
| Média da turma Gaming (6845 - 21327, n=97, últimos 2 anos) | |
| Lenovo Ideapad Gaming 3 15IHU-82K1002RGE | |
| Acer Nitro 5 AN517-53-54DQ | |
| Gigabyte G5 GD | |
| Dell G15 5510 | |
| Dell G15 5510-43NHT | |
| PCMark 10 / Digital Content Creation | |
| Média da turma Gaming (7602 - 19657, n=97, últimos 2 anos) | |
| Gigabyte G5 GD | |
| Dell G15 5510 | |
| Acer Nitro 5 AN517-53-54DQ | |
| Lenovo Ideapad Gaming 3 15IHU-82K1002RGE | |
| Dell G15 5510-43NHT | |
| CrossMark / Overall | |
| Média da turma Gaming (1366 - 2409, n=95, últimos 2 anos) | |
| Lenovo Ideapad Gaming 3 15IHU-82K1002RGE | |
| CrossMark / Productivity | |
| Média da turma Gaming (1386 - 2254, n=95, últimos 2 anos) | |
| Lenovo Ideapad Gaming 3 15IHU-82K1002RGE | |
| CrossMark / Creativity | |
| Média da turma Gaming (1343 - 2729, n=95, últimos 2 anos) | |
| Lenovo Ideapad Gaming 3 15IHU-82K1002RGE | |
| CrossMark / Responsiveness | |
| Média da turma Gaming (1226 - 2334, n=95, últimos 2 anos) | |
| Lenovo Ideapad Gaming 3 15IHU-82K1002RGE | |
| PCMark 10 Score | 5235 pontos | |
Ajuda | ||
| AIDA64 / Memory Copy | |
| Média da turma Gaming (21750 - 129946, n=107, últimos 2 anos) | |
| Gigabyte G5 GD | |
| Média Intel Core i5-10500H (31695 - 35357, n=2) | |
| Dell G15 5510 | |
| Acer Nitro 5 AN517-53-54DQ | |
| Lenovo Ideapad Gaming 3 15IHU-82K1002RGE | |
| Dell G15 5510-43NHT | |
| AIDA64 / Memory Read | |
| Média da turma Gaming (22956 - 118858, n=107, últimos 2 anos) | |
| Gigabyte G5 GD | |
| Média Intel Core i5-10500H (34772 - 40220, n=2) | |
| Dell G15 5510 | |
| Acer Nitro 5 AN517-53-54DQ | |
| Lenovo Ideapad Gaming 3 15IHU-82K1002RGE | |
| Dell G15 5510-43NHT | |
| AIDA64 / Memory Write | |
| Média da turma Gaming (22297 - 135096, n=107, últimos 2 anos) | |
| Gigabyte G5 GD | |
| Média Intel Core i5-10500H (37067 - 39449, n=2) | |
| Dell G15 5510 | |
| Acer Nitro 5 AN517-53-54DQ | |
| Lenovo Ideapad Gaming 3 15IHU-82K1002RGE | |
| Dell G15 5510-43NHT | |
| AIDA64 / Memory Latency | |
| Média da turma Gaming (75.3 - 259, n=107, últimos 2 anos) | |
| Gigabyte G5 GD | |
| Lenovo Ideapad Gaming 3 15IHU-82K1002RGE | |
| Acer Nitro 5 AN517-53-54DQ | |
| Dell G15 5510 | |
| Média Intel Core i5-10500H (57.5 - 76.9, n=2) | |
| Dell G15 5510-43NHT | |
* ... menor é melhor
Latências DPC
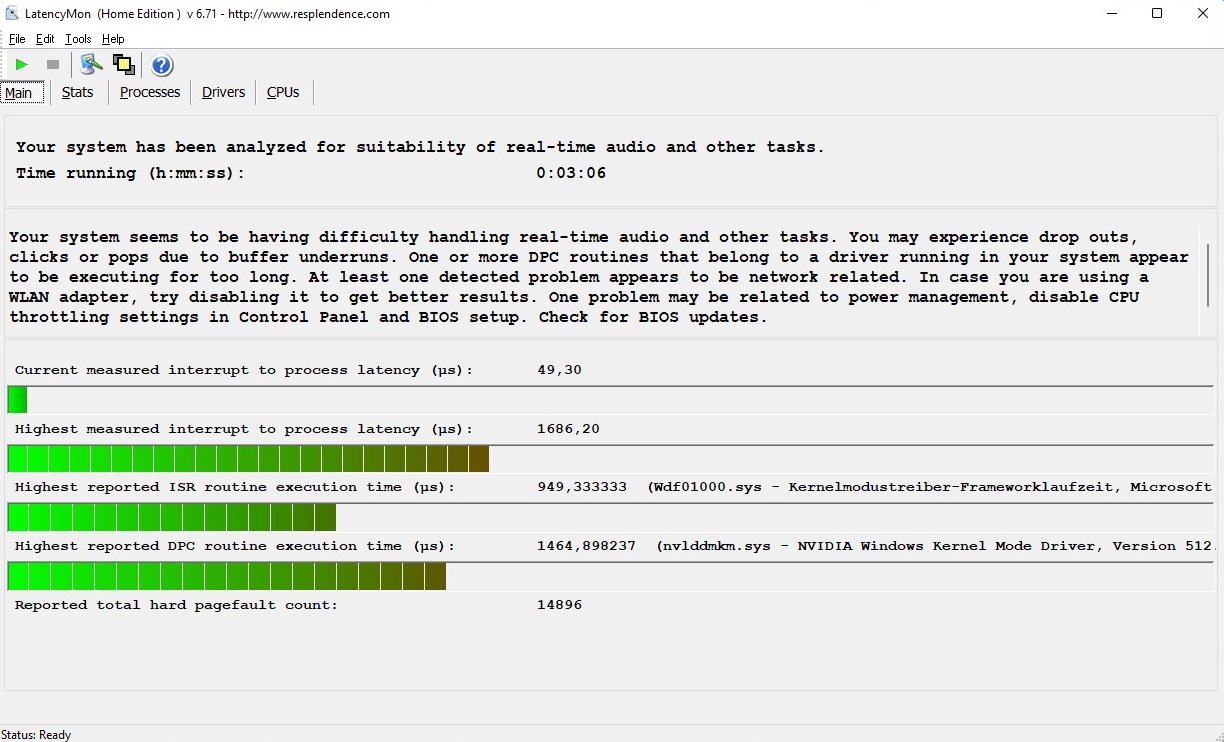
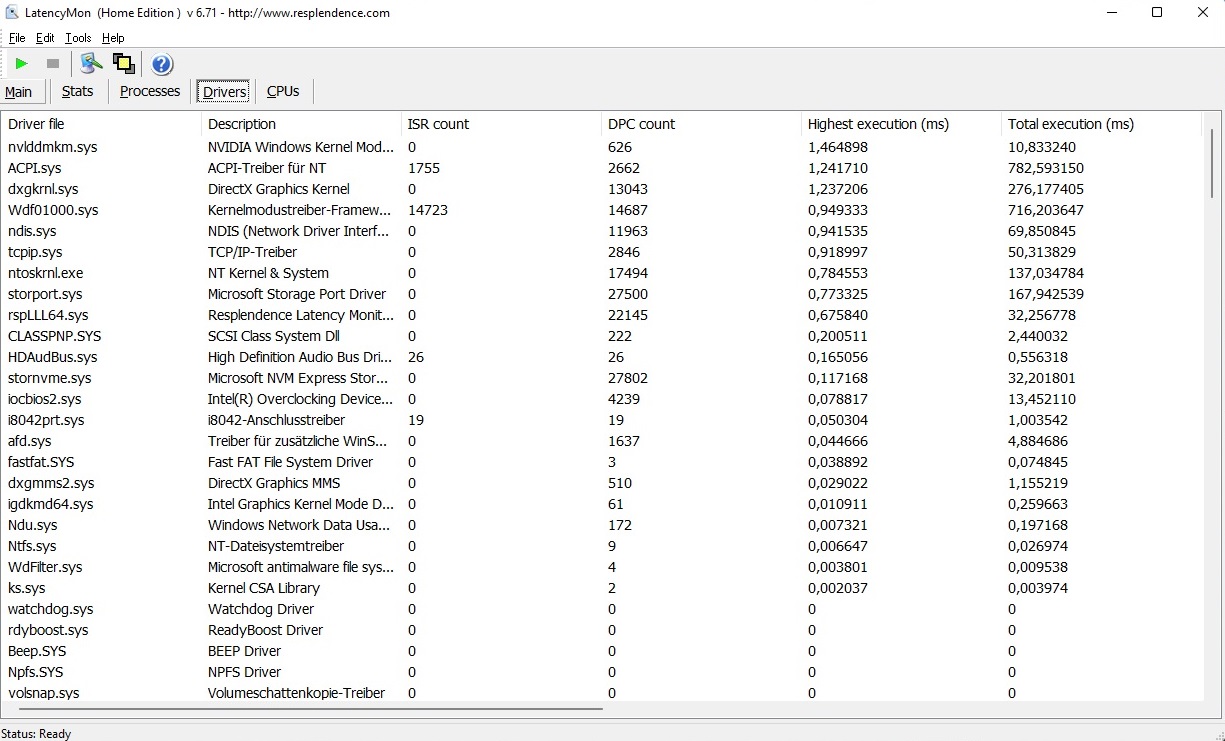
Em termos de latências, há definitivamente espaço para melhorias para a Dell. Fora da caixa, o G15 5510 não é particularmente adequado para edição de áudio e vídeo em tempo real de acordo com a ferramenta LatencyMon. Alguns concorrentes fazem melhor a este respeito
| DPC Latencies / LatencyMon - interrupt to process latency (max), Web, Youtube, Prime95 | |
| Dell G15 5510 | |
| Dell G15 5510-43NHT | |
| Acer Nitro 5 AN517-53-54DQ | |
| Lenovo Ideapad Gaming 3 15IHU-82K1002RGE | |
| Gigabyte G5 GD | |
* ... menor é melhor
Armazenamento
O desempenho do SSD SK Hynix M.2 incorporado é bastante incomparável. Pelos padrões da NVMe, o drive de 512 GB não é lento nem particularmente rápido; em vez disso, ele tende a funcionar em algum lugar no meio-campo

| Drive Performance rating - Percent | |
| Média da turma Gaming | |
| Gigabyte G5 GD | |
| Acer Nitro 5 AN517-53-54DQ | |
| Dell G15 5510 | |
| Lenovo Ideapad Gaming 3 15IHU-82K1002RGE | |
| Dell G15 5510-43NHT | |
* ... menor é melhor
Continuous load read: DiskSpd Read Loop, Queue Depth 8
Placa gráfica
A Dell é mais agressiva quando se trata da placa gráfica. Um TGP de 95 watts incluindo o Dynamic Boost é um valor muito alto para o RTX 3050, que tem que se contentar com 4 GB de GDDR6 VRAM. Isto também é perceptível em nosso curso de referência: O Dell G15 supera quase todos os outros portáteis com um RTX 3050. Muitas vezes chega até ao nível do supostamente melhor RTX 3050 Ti
| 3DMark Performance rating - Percent | |
| Média da turma Gaming | |
| Dell G15 5510-43NHT -1! | |
| Lenovo Ideapad Gaming 3 15IHU-82K1002RGE -1! | |
| Gigabyte G5 GD | |
| Dell G15 5510 | |
| Acer Nitro 5 AN517-53-54DQ | |
| Média NVIDIA GeForce RTX 3050 4GB Laptop GPU | |
| 3DMark 11 Performance | 15672 pontos | |
| 3DMark Cloud Gate Standard Score | 29259 pontos | |
| 3DMark Fire Strike Score | 11979 pontos | |
| 3DMark Time Spy Score | 5366 pontos | |
Ajuda | ||
Desempenho do jogo
Desde que o RTX 3050 não seja usado para traçado de raio ou resoluções além de 1.920x1.080, o modelo DirectX 12 tem potência suficiente para rodar os últimos jogos de alto a máximo detalhe. Somente jogos muito exigentes ou com uso intensivo de VRAM, tais como Luz Morrendo 2será problemático
| The Witcher 3 | |
| 1920x1080 High Graphics & Postprocessing (Nvidia HairWorks Off) | |
| Média da turma Gaming (181 - 341, n=3, últimos 2 anos) | |
| Gigabyte G5 GD | |
| Lenovo Ideapad Gaming 3 15IHU-82K1002RGE | |
| Dell G15 5510 | |
| Acer Nitro 5 AN517-53-54DQ | |
| Média NVIDIA GeForce RTX 3050 4GB Laptop GPU (53.5 - 105.1, n=17) | |
| Dell G15 5510-43NHT | |
| 1920x1080 Ultra Graphics & Postprocessing (HBAO+) | |
| Média da turma Gaming (95 - 240, n=8, últimos 2 anos) | |
| Dell G15 5510-43NHT | |
| Dell G15 5510 | |
| Gigabyte G5 GD | |
| Acer Nitro 5 AN517-53-54DQ | |
| Lenovo Ideapad Gaming 3 15IHU-82K1002RGE | |
| Média NVIDIA GeForce RTX 3050 4GB Laptop GPU (31.5 - 55.8, n=21) | |
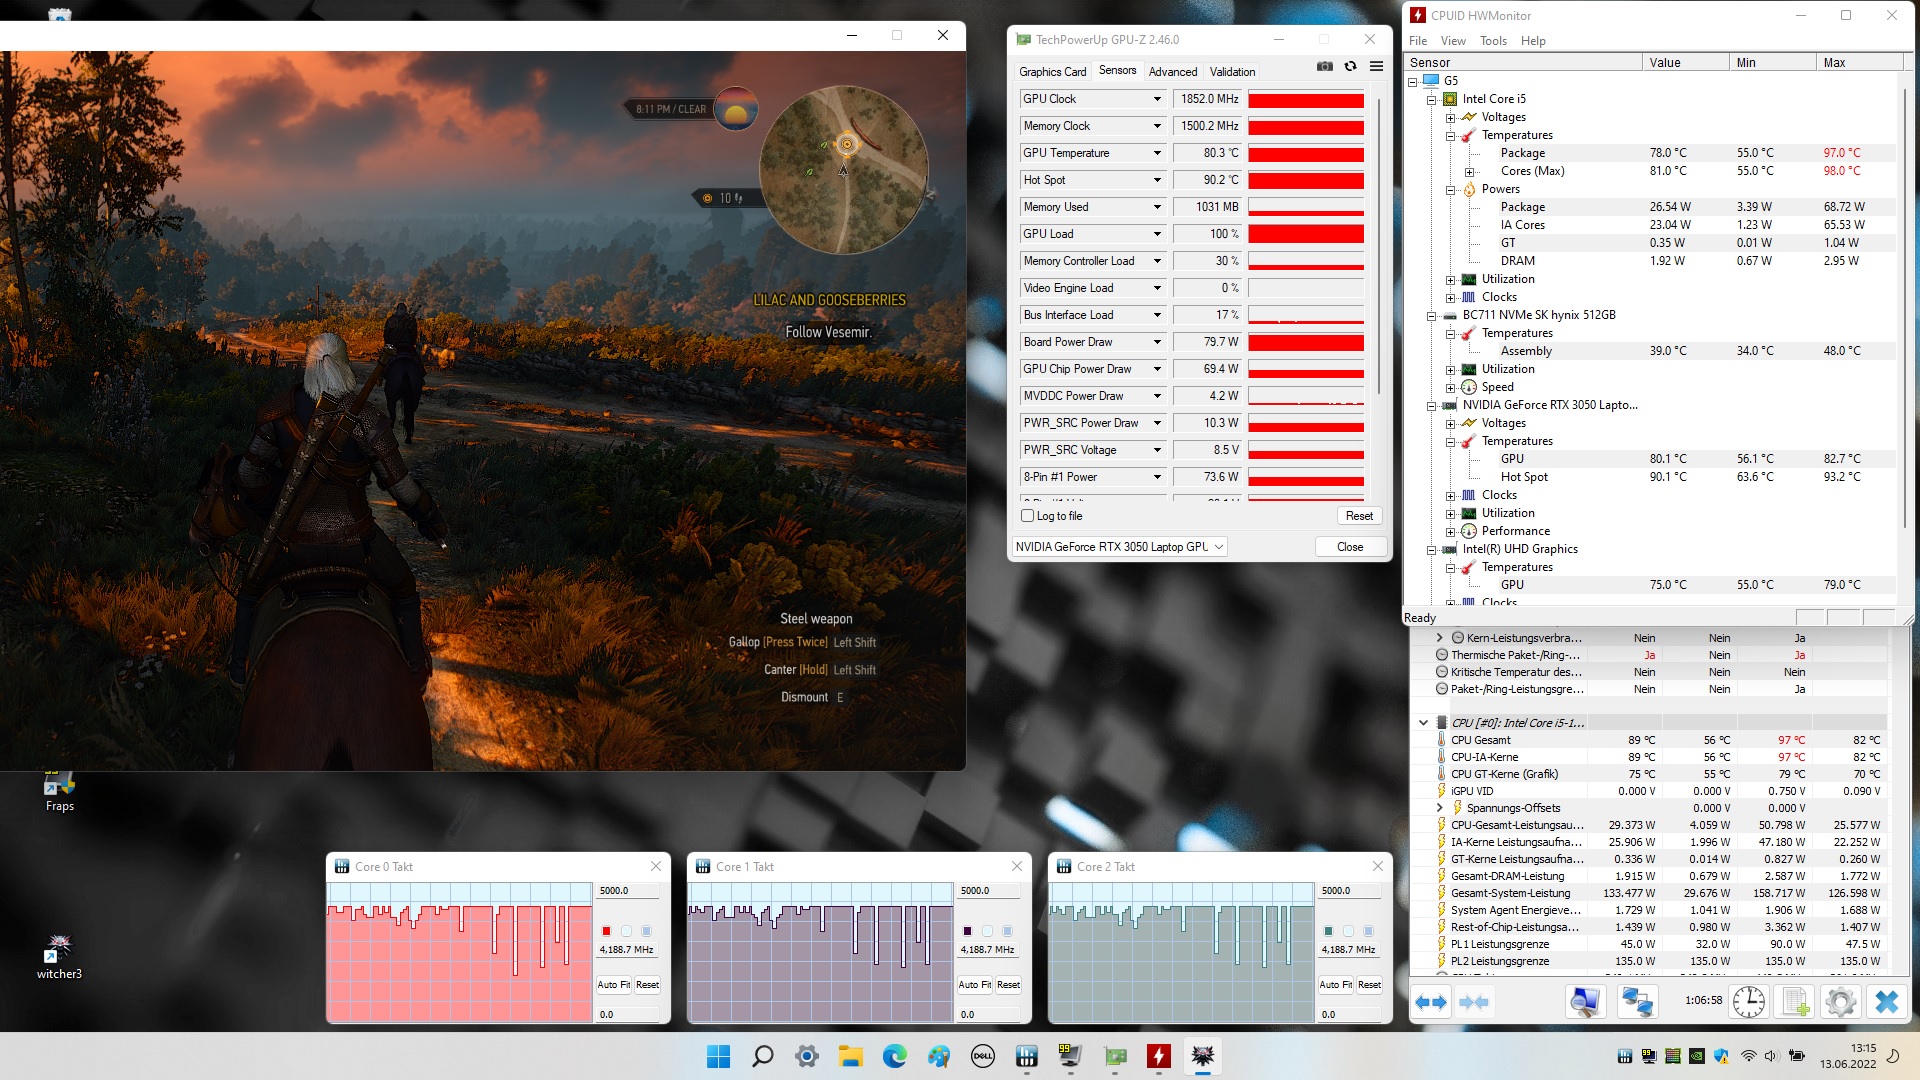
Louvável: Além do desempenho da CPU, o desempenho da GPU também permanece estável por períodos prolongados de tempo, como é mostrado em nosso teste de estresse de uma hora com o jogo de role-playing O Witcher 3
The Witcher 3 FPS diagram
| baixo | média | alto | ultra | |
|---|---|---|---|---|
| GTA V (2015) | 160.7 | 119 | 65.5 | |
| The Witcher 3 (2015) | 147 | 90.7 | 52.1 | |
| Dota 2 Reborn (2015) | 128.4 | 118.6 | 108.7 | 109.3 |
| Final Fantasy XV Benchmark (2018) | 74 | 52.5 | ||
| X-Plane 11.11 (2018) | 102.3 | 88.4 | 73.7 | |
| Strange Brigade (2018) | 132.4 | 105.7 | 90.7 | |
| Farming Simulator 22 (2021) | 123.1 | 105.3 | 90.1 | |
| Halo Infinite (2021) | 73.1 | 46.2 | 44.6 | |
| God of War (2022) | 59.6 | 47.1 | 31.7 | |
| Rainbow Six Extraction (2022) | 109 | 104 | 76 | |
| Dying Light 2 (2022) | 42.9 | 35.8 | ||
| GRID Legends (2022) | 113 | 98.6 | 72.9 | |
| Elden Ring (2022) | 58.6 | 56 | 52.8 | |
| Elex 2 (2022) | 55.6 | 54.2 | 48.2 | |
| Ghostwire Tokyo (2022) | 81.8 | 79.7 | 79.4 | |
| Tiny Tina's Wonderlands (2022) | 90.7 | 62.6 | 47.8 | |
| Vampire Bloodhunt (2022) | 121.5 | 117.4 | 113.3 | |
| F1 22 (2022) | 137 | 127 | 97 | 32 |
| The Quarry (2022) | 85.5 | 63.7 | 52 | 39.7 |
Emissões
Emissões sonoras
O controle dos ventiladores não é exatamente um dos pontos fortes da Dell. Também podemos ver espaço para melhorias no G15 5510. Em vez de deixar os ventiladores funcionar constantemente a um nível de ruído decente em uso ocioso, o sistema de resfriamento ou está completamente desligado, ou de repente ele faz efeito em voz alta. Sob carga, o ruído é semelhante ao do Acer Nitro 5. Embora 45 a 47 dB(A) não seja irritante (ainda), ainda é muito audível
Barulho
| Ocioso |
| 26 / 27 / 33 dB |
| Carga |
| 45 / 47 dB |
 | ||
30 dB silencioso 40 dB(A) audível 50 dB(A) ruidosamente alto |
||
min: | ||
| Dell G15 5510 i5-10500H, GeForce RTX 3050 4GB Laptop GPU | Acer Nitro 5 AN517-53-54DQ i5-11300H, GeForce RTX 3050 4GB Laptop GPU | Gigabyte G5 GD i5-11400H, GeForce RTX 3050 4GB Laptop GPU | Lenovo Ideapad Gaming 3 15IHU-82K1002RGE i5-11300H, GeForce RTX 3050 Ti Laptop GPU | Dell G15 5510-43NHT i5-10200H, GeForce RTX 3050 Ti Laptop GPU | |
|---|---|---|---|---|---|
| Noise | -0% | -9% | 4% | 2% | |
| desligado / ambiente * (dB) | 26 | 25 4% | 24 8% | 23.9 8% | 25 4% |
| Idle Minimum * (dB) | 26 | 25 4% | 29 -12% | 23.9 8% | 25 4% |
| Idle Average * (dB) | 27 | 31 -15% | 30 -11% | 26.8 1% | 25 7% |
| Idle Maximum * (dB) | 33 | 33 -0% | 32 3% | 26.8 19% | 25 24% |
| Load Average * (dB) | 45 | 43 4% | 53 -18% | 43.5 3% | 52.2 -16% |
| Witcher 3 ultra * (dB) | 45 | 44 2% | 52 -16% | 43.5 3% | |
| Load Maximum * (dB) | 47 | 47 -0% | 54 -15% | 53.1 -13% | 52.2 -11% |
* ... menor é melhor
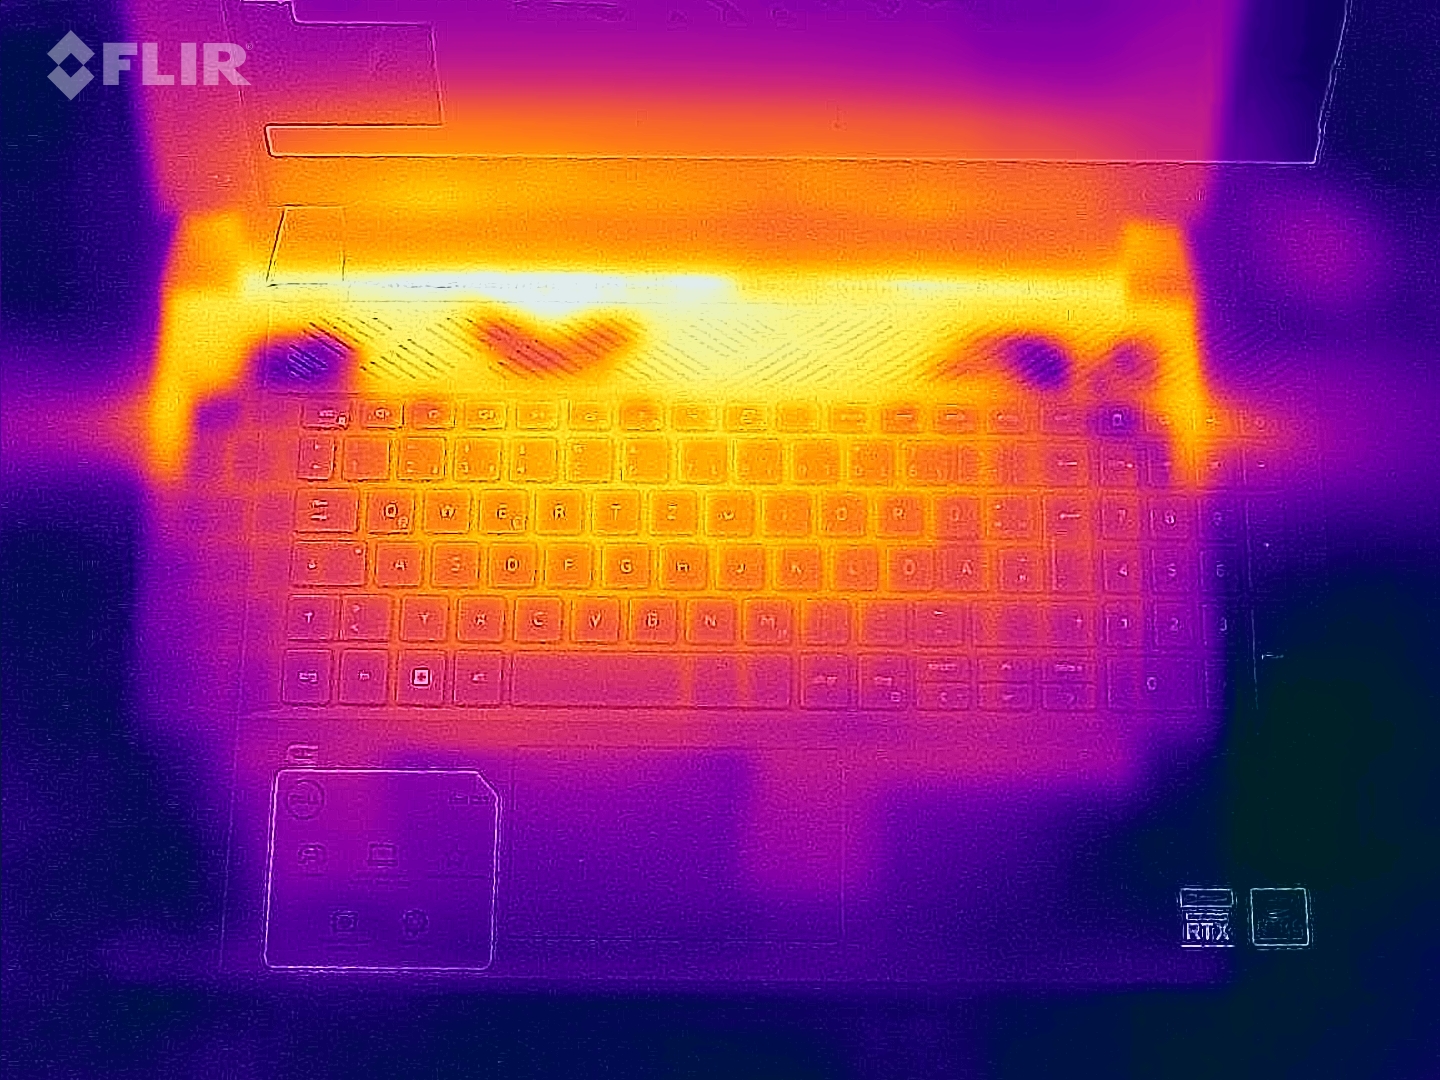
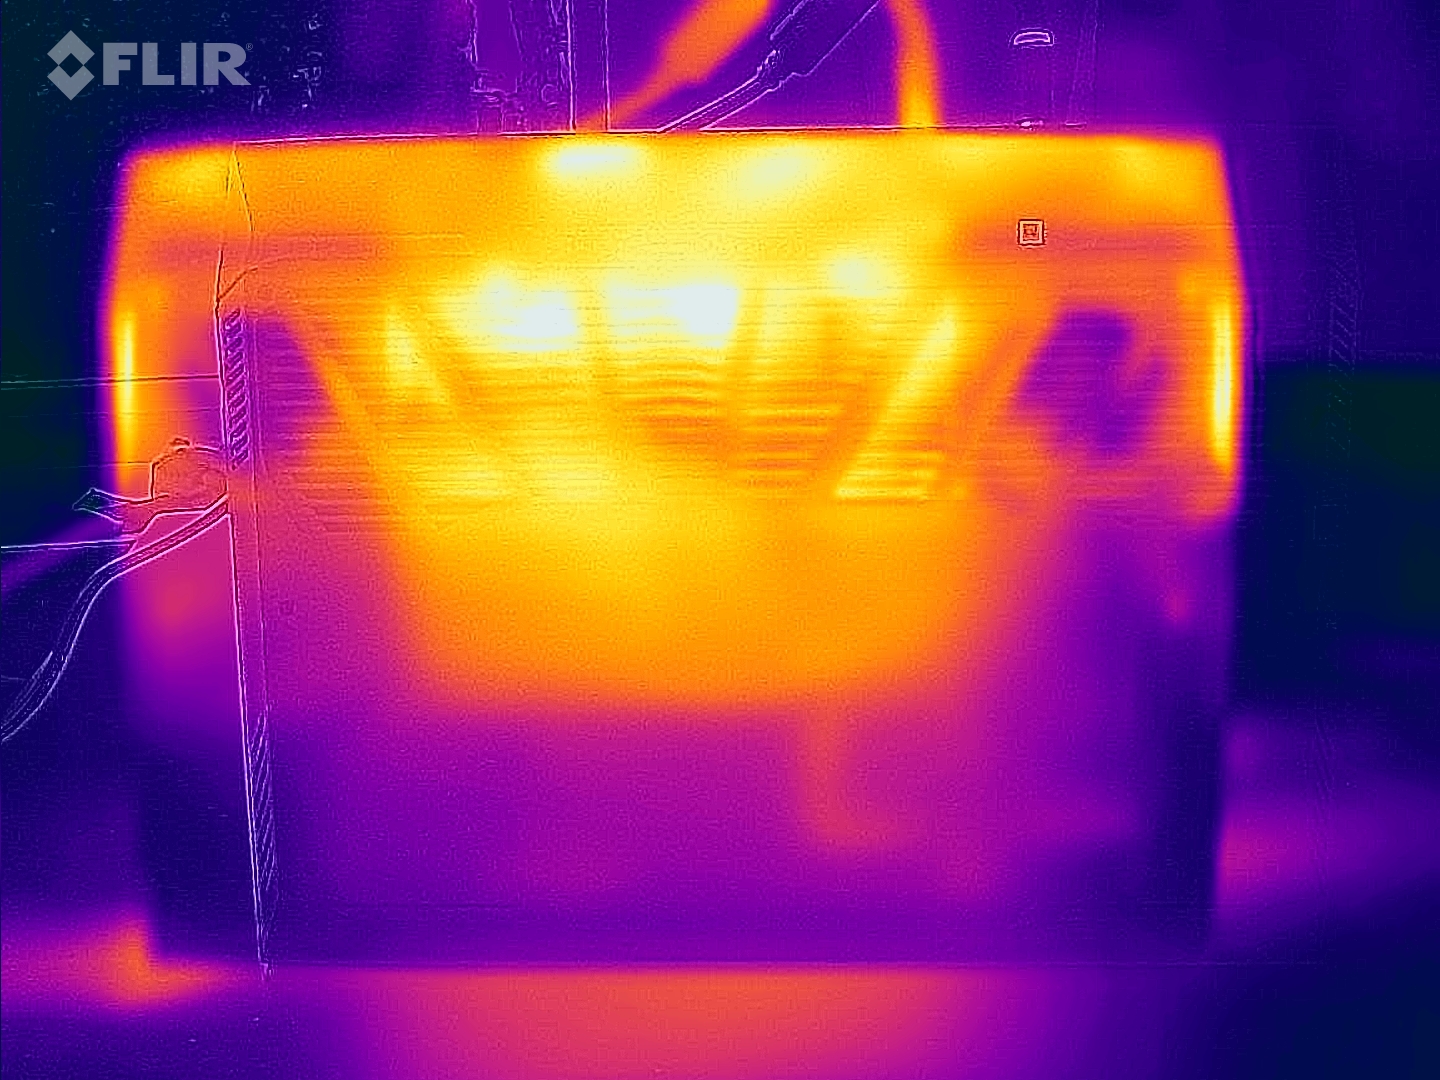
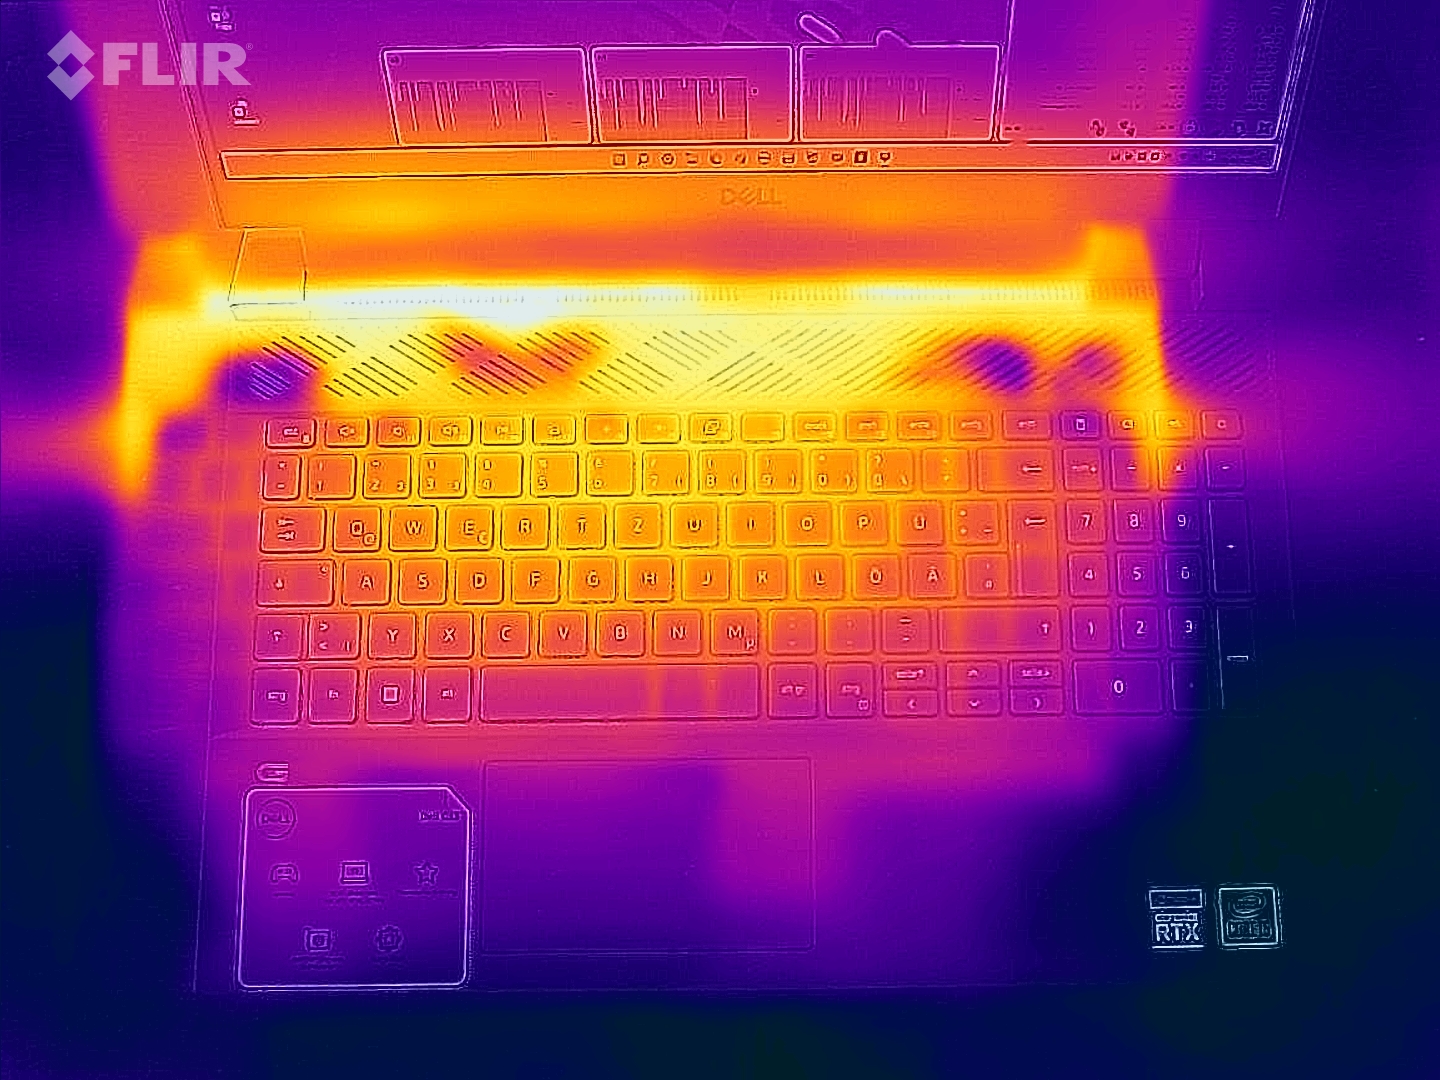
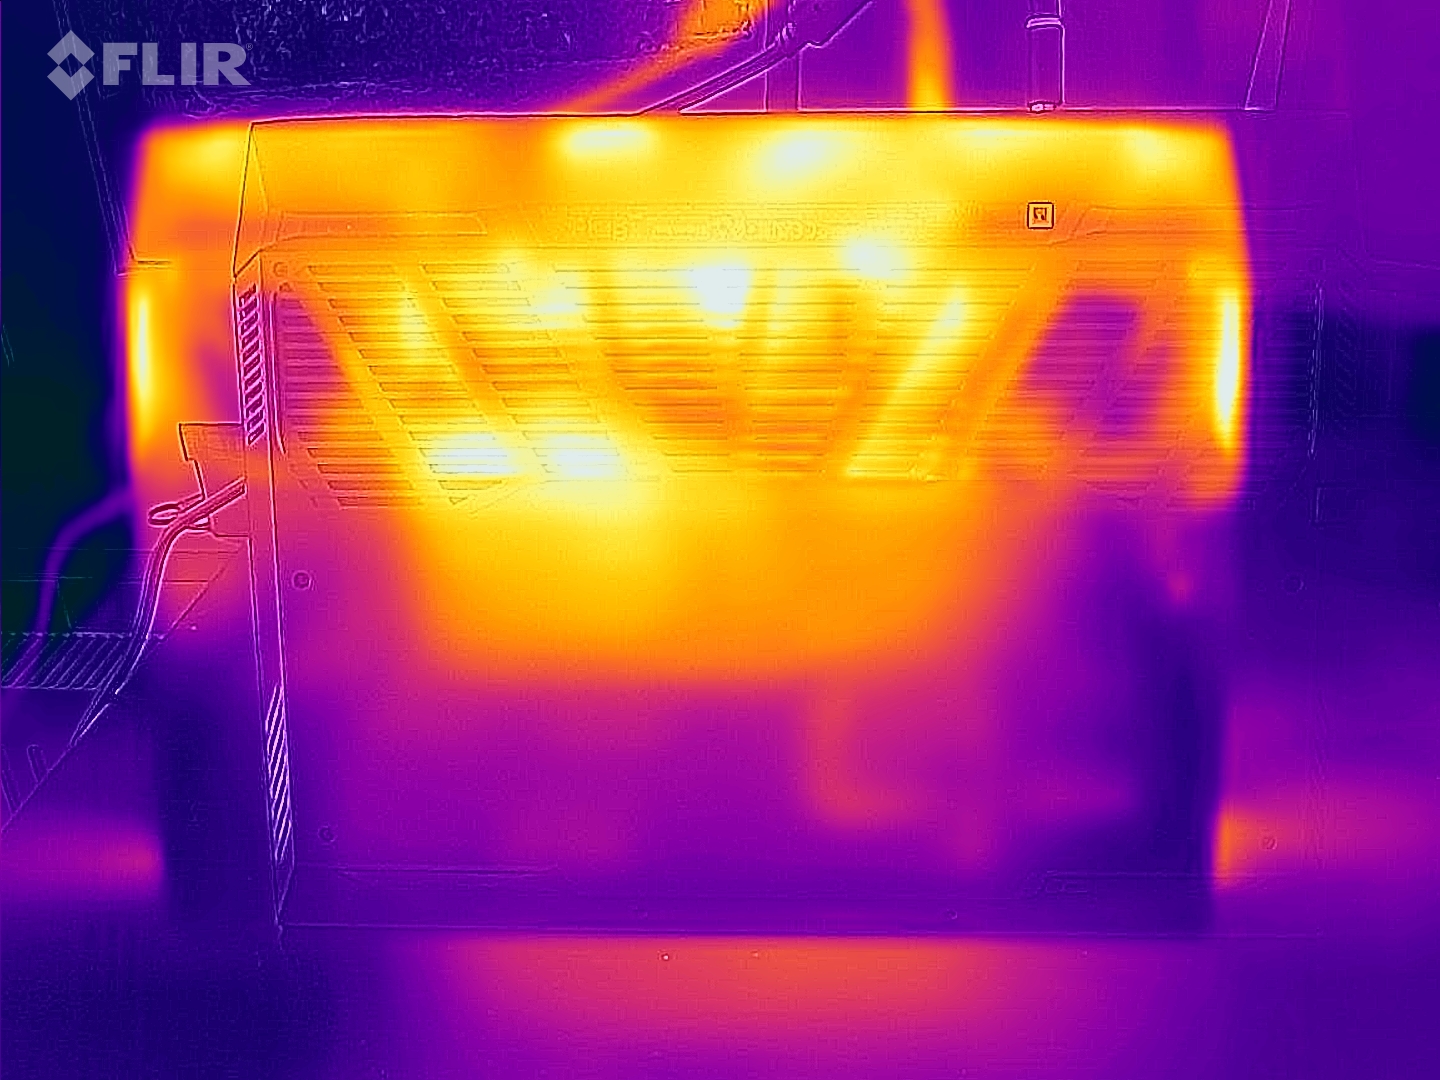
Temperatura
O desenvolvimento do calor também está de acordo com a concorrência. Um máximo de 49 °C (~120 °F) no fundo da caixa tende a falar contra as sessões de jogo usando o dispositivo na volta. A parte superior chega até 52 °C (~126 °F), embora este valor só afete o terço posterior do laptop. A área de descanso da palma da mão permanece agradavelmente fria o tempo todo
(-) A temperatura máxima no lado superior é 52 °C / 126 F, em comparação com a média de 40.4 °C / 105 F , variando de 21.2 a 68.8 °C para a classe Gaming.
(-) A parte inferior aquece até um máximo de 49 °C / 120 F, em comparação com a média de 43.2 °C / 110 F
(+) Em uso inativo, a temperatura média para o lado superior é 24.3 °C / 76 F, em comparação com a média do dispositivo de 33.9 °C / ### class_avg_f### F.
(-) Jogando The Witcher 3, a temperatura média para o lado superior é 41 °C / 106 F, em comparação com a média do dispositivo de 33.9 °C / ## #class_avg_f### F.
(+) Os apoios para as mãos e o touchpad estão atingindo a temperatura máxima da pele (33 °C / 91.4 F) e, portanto, não estão quentes.
(-) A temperatura média da área do apoio para as mãos de dispositivos semelhantes foi 28.8 °C / 83.8 F (-4.2 °C / -7.6 F).
| Dell G15 5510 i5-10500H, GeForce RTX 3050 4GB Laptop GPU | Acer Nitro 5 AN517-53-54DQ i5-11300H, GeForce RTX 3050 4GB Laptop GPU | Gigabyte G5 GD i5-11400H, GeForce RTX 3050 4GB Laptop GPU | Lenovo Ideapad Gaming 3 15IHU-82K1002RGE i5-11300H, GeForce RTX 3050 Ti Laptop GPU | Dell G15 5510-43NHT i5-10200H, GeForce RTX 3050 Ti Laptop GPU | |
|---|---|---|---|---|---|
| Heat | 2% | -4% | 5% | -7% | |
| Maximum Upper Side * (°C) | 52 | 47 10% | 45 13% | 43.2 17% | 45.9 12% |
| Maximum Bottom * (°C) | 49 | 54 -10% | 50 -2% | 47.9 2% | 51.9 -6% |
| Idle Upper Side * (°C) | 26 | 25 4% | 28 -8% | 24.9 4% | 30.1 -16% |
| Idle Bottom * (°C) | 26 | 25 4% | 31 -19% | 27 -4% | 30.1 -16% |
* ... menor é melhor
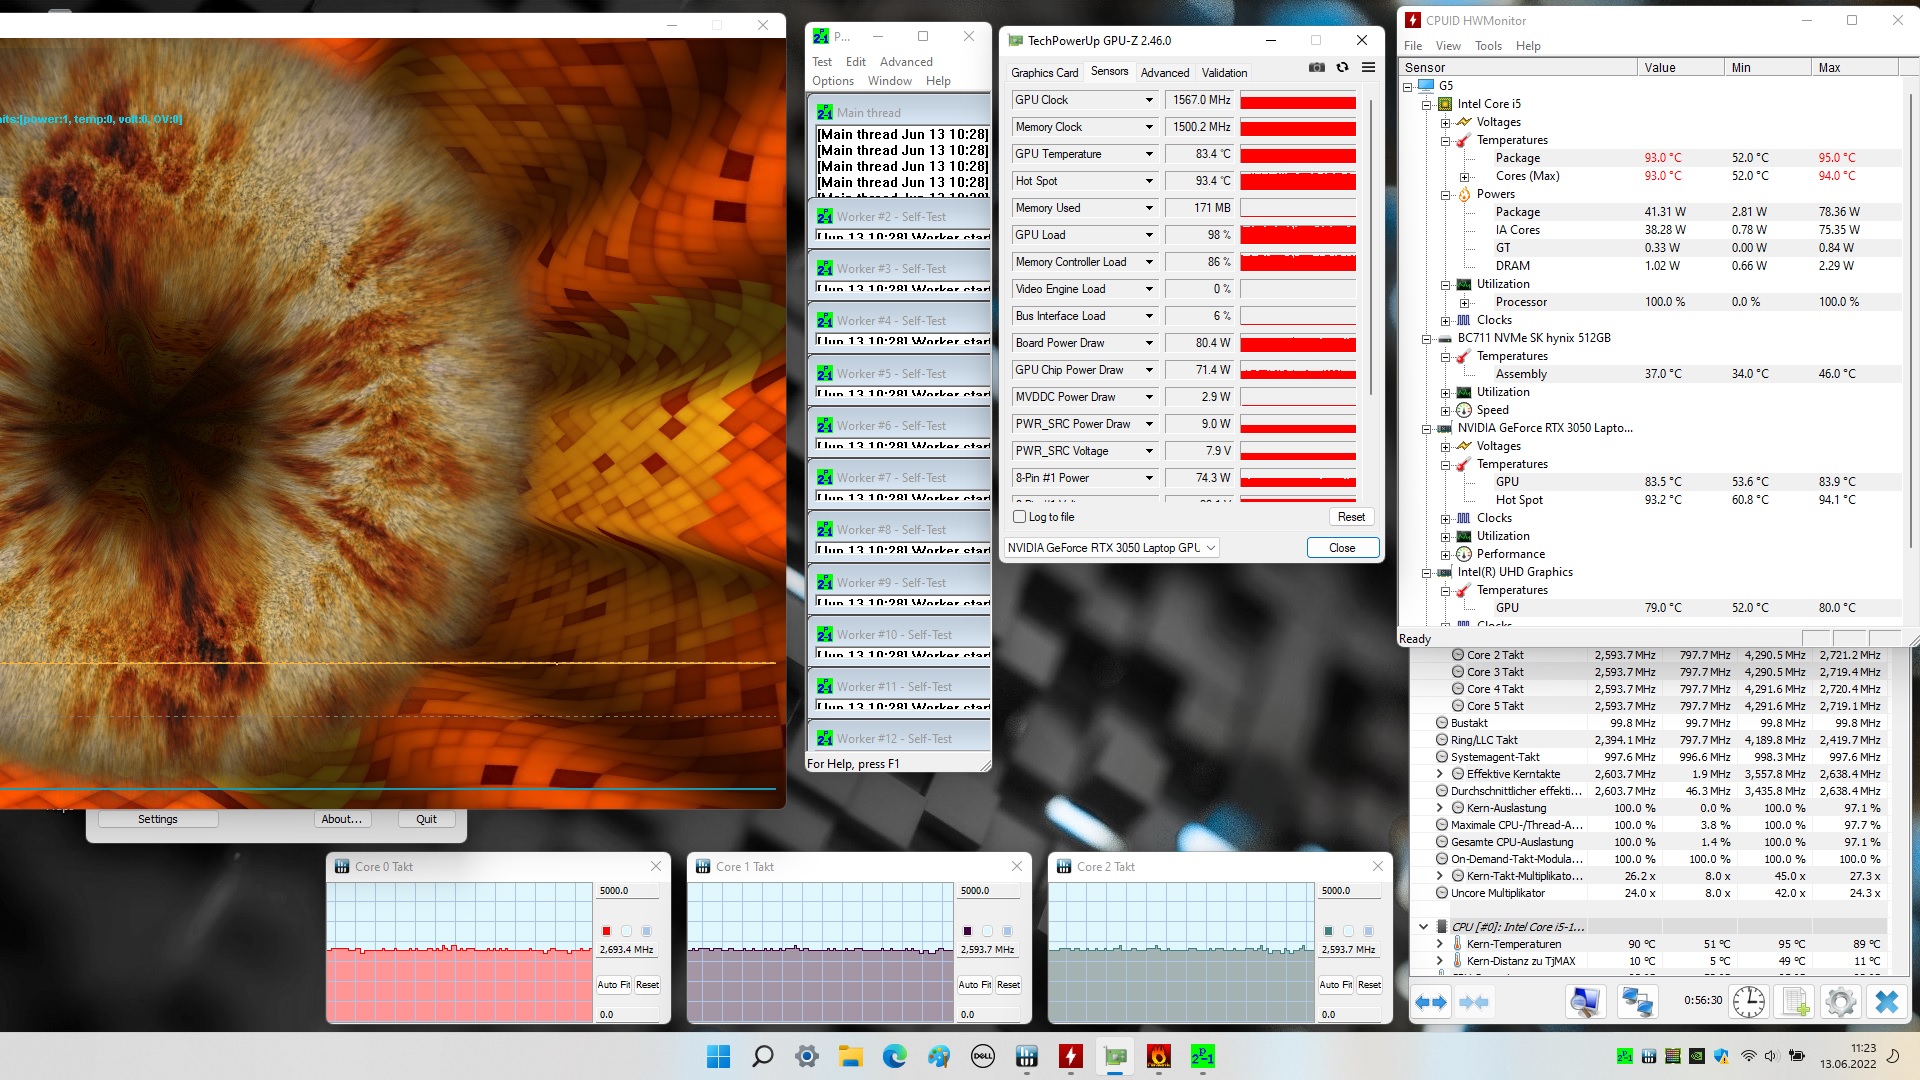
Teste de estresse
O teste de estresse de 60 minutos com as ferramentas FurMark e Prime95 não resultou em estrangulamento da CPU ou GPU. Enquanto o Core i5-10500H ficou quente em torno de 93 °C (~199 °F), o GeForce RTX 3050 também se estabeleceu a 83 °C (~181 °F), ainda não crítico
Oradores
Dell G15 5510 análise de áudio
(+) | os alto-falantes podem tocar relativamente alto (###valor### dB)
Graves 100 - 315Hz
(-) | quase nenhum baixo - em média 23.4% menor que a mediana
(±) | a linearidade dos graves é média (11.6% delta para a frequência anterior)
Médios 400 - 2.000 Hz
(±) | médios mais altos - em média 9.6% maior que a mediana
(+) | médios são lineares (6.8% delta para frequência anterior)
Altos 2 - 16 kHz
(+) | agudos equilibrados - apenas 3% longe da mediana
(+) | os máximos são lineares (5.5% delta da frequência anterior)
Geral 100 - 16.000 Hz
(±) | a linearidade do som geral é média (23.3% diferença em relação à mediana)
Comparado com a mesma classe
» 85% de todos os dispositivos testados nesta classe foram melhores, 4% semelhantes, 11% piores
» O melhor teve um delta de 6%, a média foi 18%, o pior foi 132%
Comparado com todos os dispositivos testados
» 70% de todos os dispositivos testados foram melhores, 5% semelhantes, 25% piores
» O melhor teve um delta de 4%, a média foi 24%, o pior foi 134%
Gigabyte G5 GD análise de áudio
(±) | o volume do alto-falante é médio, mas bom (###valor### dB)
Graves 100 - 315Hz
(-) | quase nenhum baixo - em média 25.4% menor que a mediana
(-) | graves não são lineares (16.2% delta para frequência anterior)
Médios 400 - 2.000 Hz
(+) | médios equilibrados - apenas 3.2% longe da mediana
(+) | médios são lineares (4.6% delta para frequência anterior)
Altos 2 - 16 kHz
(+) | agudos equilibrados - apenas 3.9% longe da mediana
(±) | a linearidade dos máximos é média (10.1% delta para frequência anterior)
Geral 100 - 16.000 Hz
(±) | a linearidade do som geral é média (19.1% diferença em relação à mediana)
Comparado com a mesma classe
» 64% de todos os dispositivos testados nesta classe foram melhores, 7% semelhantes, 28% piores
» O melhor teve um delta de 6%, a média foi 18%, o pior foi 132%
Comparado com todos os dispositivos testados
» 46% de todos os dispositivos testados foram melhores, 7% semelhantes, 47% piores
» O melhor teve um delta de 4%, a média foi 24%, o pior foi 134%
Gestão de energia
Consumo de energia
Graças à implementação de comutação gráfica, o G15 5510 é bastante frugal em uso ocioso com um consumo de 3 a 13 watts, se você excluir outliers de curto prazo acima deste nível. O adaptador de energia incluído de 240 watts tem que trabalhar muito mais no modo 3D. Entre 103 e 204 watts é relativamente alto para um laptop de médio alcance para jogos
| desligado | |
| Ocioso | |
| Carga |
|
Key:
min: | |
| Dell G15 5510 i5-10500H, GeForce RTX 3050 4GB Laptop GPU | Acer Nitro 5 AN517-53-54DQ i5-11300H, GeForce RTX 3050 4GB Laptop GPU | Gigabyte G5 GD i5-11400H, GeForce RTX 3050 4GB Laptop GPU | Lenovo Ideapad Gaming 3 15IHU-82K1002RGE i5-11300H, GeForce RTX 3050 Ti Laptop GPU | Dell G15 5510-43NHT i5-10200H, GeForce RTX 3050 Ti Laptop GPU | Média da turma Gaming | |
|---|---|---|---|---|---|---|
| Power Consumption | 3% | -73% | 3% | -4% | -119% | |
| Idle Minimum * (Watt) | 3 | 4 -33% | 13 -333% | 4.9 -63% | 4.6 -53% | 13.2 ? -340% |
| Idle Average * (Watt) | 8 | 9 -13% | 15 -88% | 8.3 -4% | 6.5 19% | 18.9 ? -136% |
| Idle Maximum * (Watt) | 13 | 15 -15% | 20 -54% | 8.9 32% | 10.1 22% | 24.5 ? -88% |
| Load Average * (Watt) | 103 | 85 17% | 102 1% | 81 21% | 129 -25% | 108.8 ? -6% |
| Witcher 3 ultra * (Watt) | 139.5 | 104 25% | 124 11% | 119 15% | 129 8% | |
| Load Maximum * (Watt) | 204 | 135 34% | 148 27% | 172 16% | 195 4% | 254 ? -25% |
* ... menor é melhor
Energy consumption during our The Witcher 3 / stress test
Energy consumption with an external monitor
Duração da bateria
A vida útil da bateria não é ruim em nada. Apesar da capacidade bastante ruim de 56 Wh, o G15 5510 dura mais de 11 horas em condições ideais. Os compradores podem esperar cerca de 6 horas em cenários do mundo real como a navegação na web sobre Wi-Fi - uma taxa sólida
| Dell G15 5510 i5-10500H, GeForce RTX 3050 4GB Laptop GPU, 56 Wh | Acer Nitro 5 AN517-53-54DQ i5-11300H, GeForce RTX 3050 4GB Laptop GPU, 57 Wh | Gigabyte G5 GD i5-11400H, GeForce RTX 3050 4GB Laptop GPU, 41 Wh | Lenovo Ideapad Gaming 3 15IHU-82K1002RGE i5-11300H, GeForce RTX 3050 Ti Laptop GPU, 45 Wh | Dell G15 5510-43NHT i5-10200H, GeForce RTX 3050 Ti Laptop GPU, 56 Wh | Média da turma Gaming | |
|---|---|---|---|---|---|---|
| Duração da bateria | 38% | -29% | 10% | 8% | 13% | |
| Reader / Idle (h) | 11.3 | 17.4 54% | 5.7 -50% | 8.71 ? -23% | ||
| WiFi v1.3 (h) | 6 | 7.2 20% | 3.1 -48% | 6.6 10% | 6.3 5% | 6.96 ? 16% |
| Load (h) | 1 | 1.4 40% | 1.1 10% | 1.1 10% | 1.1 10% | 1.47 ? 47% |
| H.264 (h) | 3.6 | 7.7 | 8.6 | 8.28 ? |
Pro
Contra
Veredicto
Além de seu design peculiar e do alto TGP do
o Dell G15 5510 tem dificuldade em se destacar da multidão de laptops para jogos de baixo custo. Como a maioria de seus concorrentes, o equipamento de 15 polegadas só vem com uma tela medíocre que carece tanto de brilho quanto de um espaço de cores decente.Em nossa opinião, tais painéis só devem ser usados em laptops de escritório muito baratos, no máximo. Quase todos os fabricantes devem melhorar consideravelmente nesta área no futuro.
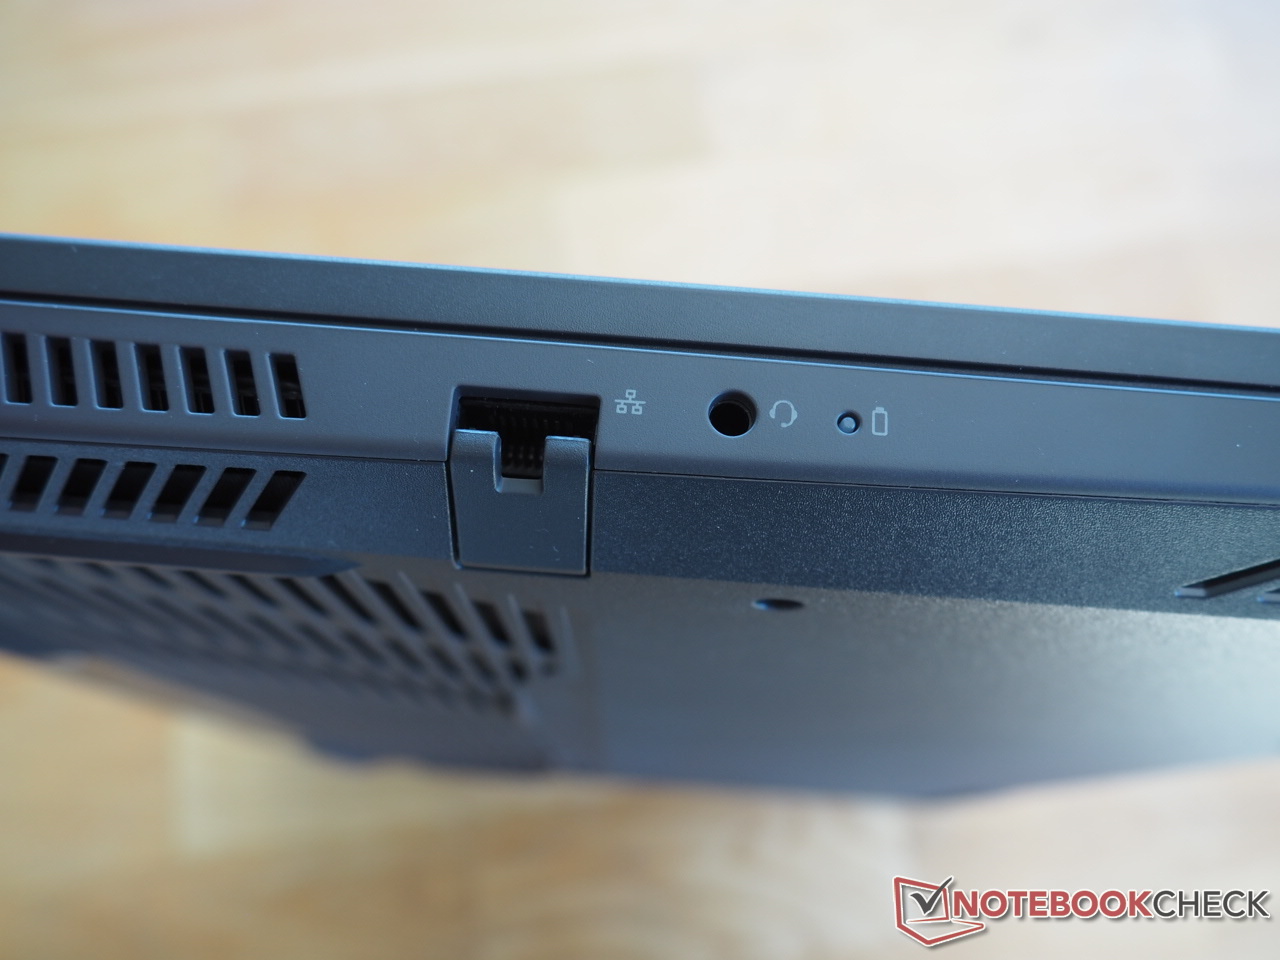
A conectividade do equipamento de 15 polegadas também não está muito atualizada. Duas portas USB 2.0, assim como a falta de um leitor de cartões e uma porta Thunderbolt levantam as sobrancelhas. Caso contrário, o Dell G15 5510 não é nem particularmente positivo nem particularmente negativo. Independentemente de se tratar de dispositivos de entrada, capacidade da bateria ou emissões: As propriedades e medidas determinadas fazem justiça ao preço do orçamento.
Em geral, a Dell G15 5510 está ao mesmo nível da concorrência (Acer Nitro 5,Gigabyte G5,Lenovo IdeaPad Gaming 3,...), e é interessante para os jogadores que estão dispostos a se comprometer e que têm um máximo de 1.000 Euros (~$1.050) à sua disposição.
A Dell criou aqui um pacote geral bem equilibrado.
Preço e disponibilidade
No momento em que escrevemos, a configuração exata que revisamos (i5-10500H e RTX 3050) parece difícil de ser encontrada nos Estados Unidos. No entanto, existem alternativas próximas na Amazônia, como a esta (i5-10500H, RTX 3050 Ti, 8 GB RAM, 512 GB SSD, $1.197), e este (i5-11400H, RTX 3050, 8 GB RAM, 512 GB SSD, $929).
Dell G15 5510
- 06/15/2022 v7 (old)
Florian Glaser
Price comparison

