Revisão do MSI Creator Z17 Laptop: O que os criativos e jogadores estão recebendo por cerca de 4.000 Euros?
O novo Criador Z17 segue as pegadas do Criador 17 (2020)mas seu projeto foi completamente revisado. Já temos um gosto do novo design quando revisando o Criador Z16Pque é a variante de 16 polegadas deste caro posto de trabalho voltado para os criativos.
Apresentando um Núcleo i9-12900H e um RTX 3070 Tio Criador Z17 certamente também vai apelar para os gamers. Mas o alto preço, o chassi metálico fino, a tela sensível ao toque refletiva de 2,2K e, para não mencionar, uma placa gráfica que não pode funcionar a plena potência, significa que o dispositivo é mais voltado para aqueles que fazem trabalho criativo.
Em nossa opinião, o Z17 está competindo com laptops multimídia ou jogos com hardware similar, como o Razer Blade 17. Além do Razer, também tivemos que incluir o Aorus 17X XES e Dell XPS 17 (infelizmente disponível apenas com RTX 3060) em nossa comparação. E como o modelo de 16 polegadas da MSI está disponível para nós, ele também vai fazer parte da comparação. Finalmente, vamos dar uma olhada no predecessor de dois anos para ver o que mudou.
Possíveis concorrentes em comparação
Avaliação | Data | Modelo | Peso | Altura | Size | Resolução | Preço |
|---|---|---|---|---|---|---|---|
| 83.8 % v7 (old) | 09/2022 | MSI Creator Z17 A12UGST-054 i9-12900H, GeForce RTX 3070 Ti Laptop GPU | 2.5 kg | 19 mm | 17.00" | 2560x1600 | |
| 82.5 % v7 (old) | 07/2020 | MSI Creator 17 A10SGS i7-10875H, GeForce RTX 2080 Super Max-Q | 2.4 kg | 20 mm | 17.30" | 3840x2160 | |
| 83.7 % v7 (old) | 06/2022 | MSI Creator Z16P B12UHST i9-12900H, GeForce RTX 3080 Ti Laptop GPU | 2.4 kg | 20.4 mm | 16.00" | 2560x1600 | |
| 90.1 % v7 (old) | 05/2022 | Razer Blade 17 (i7-12800H, RTX 3070 Ti) i7-12800H, GeForce RTX 3070 Ti Laptop GPU | 2.8 kg | 19.9 mm | 17.30" | 2560x1440 | |
| 83.7 % v7 (old) | 08/2022 | Aorus 17X XES i9-12900HX, GeForce RTX 3070 Ti Laptop GPU | 2.7 kg | 30 mm | 17.30" | 1920x1080 | |
| 88.8 % v7 (old) | 06/2022 | Dell XPS 17 9720 RTX 3060 i7-12700H, GeForce RTX 3060 Laptop GPU | 2.5 kg | 19.5 mm | 17.00" | 3840x2400 |
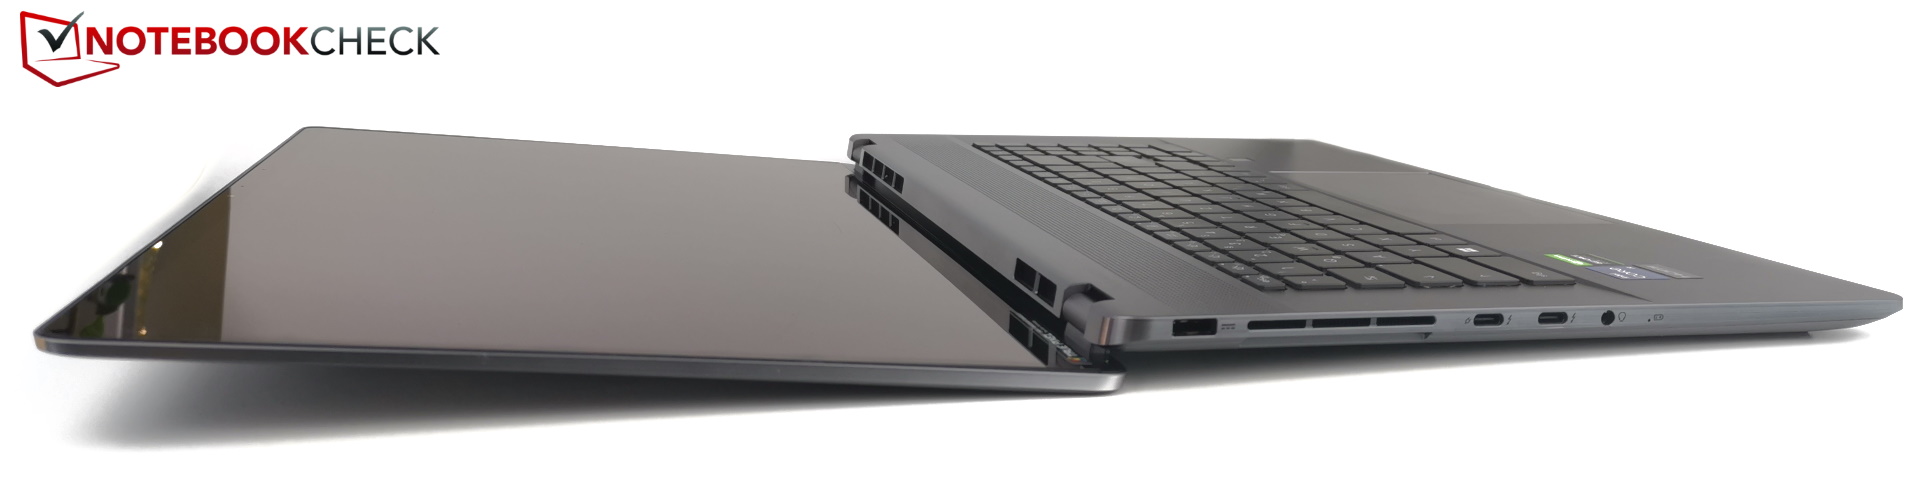
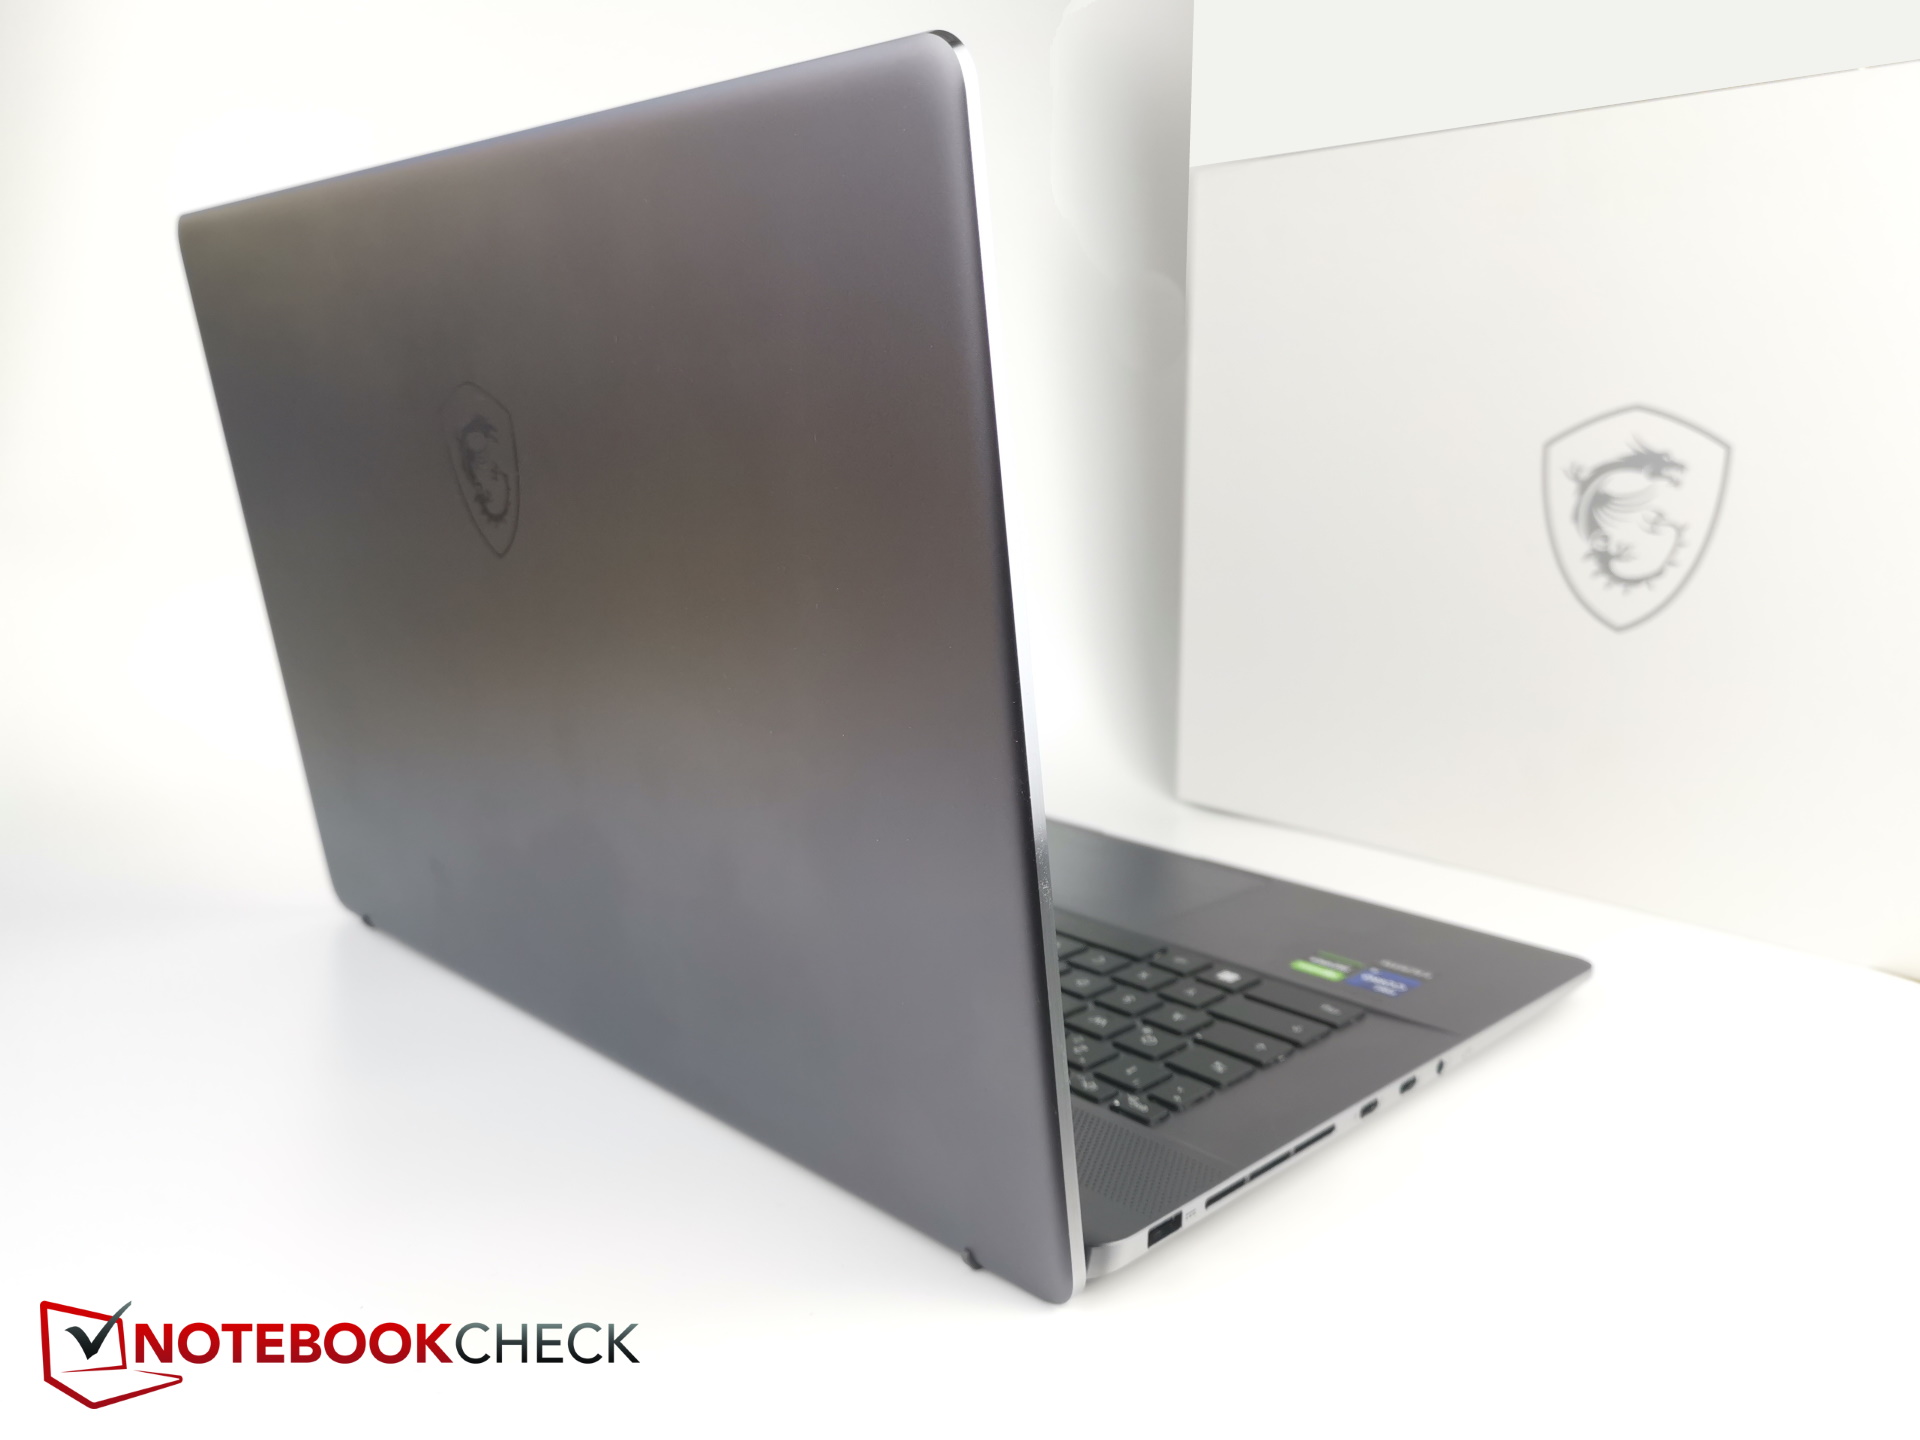
Chassis - Ultra-fino, robusto e feito de metal
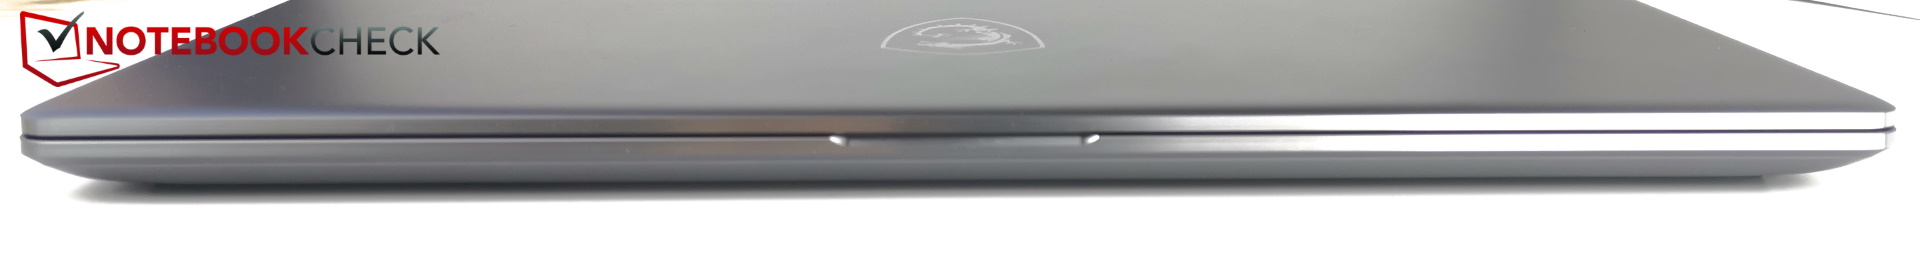
O chassi tem apenas 19 mm (0,75") de espessura e parece ser quase completamente feito de metal. Isto torna o dispositivo extremamente robusto. Como resultado, ele quase não apresenta nenhuma flexão quando torcido e faz apenas pequenos rangidos, particularmente ao redor das portas do lado direito. Mesmo a tampa do display, que pode ser aberta a 180 graus, é agradavelmente resistente à torção.
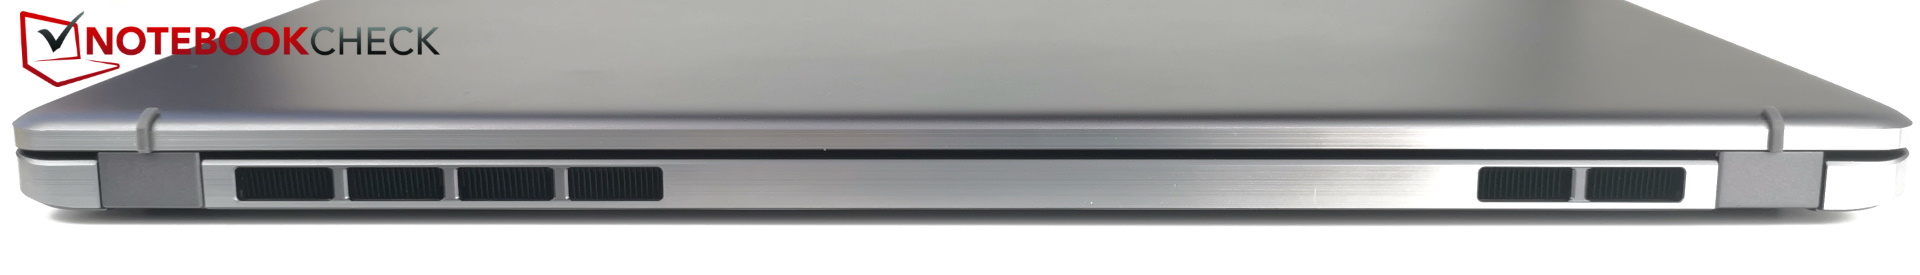
O design em metal cinza-escuro é limpo e elegante. Quase todas as bordas e cantos são arredondados. Há aberturas de ar por toda parte, mas as laterais são tão pequenas que não são muito visíveis.
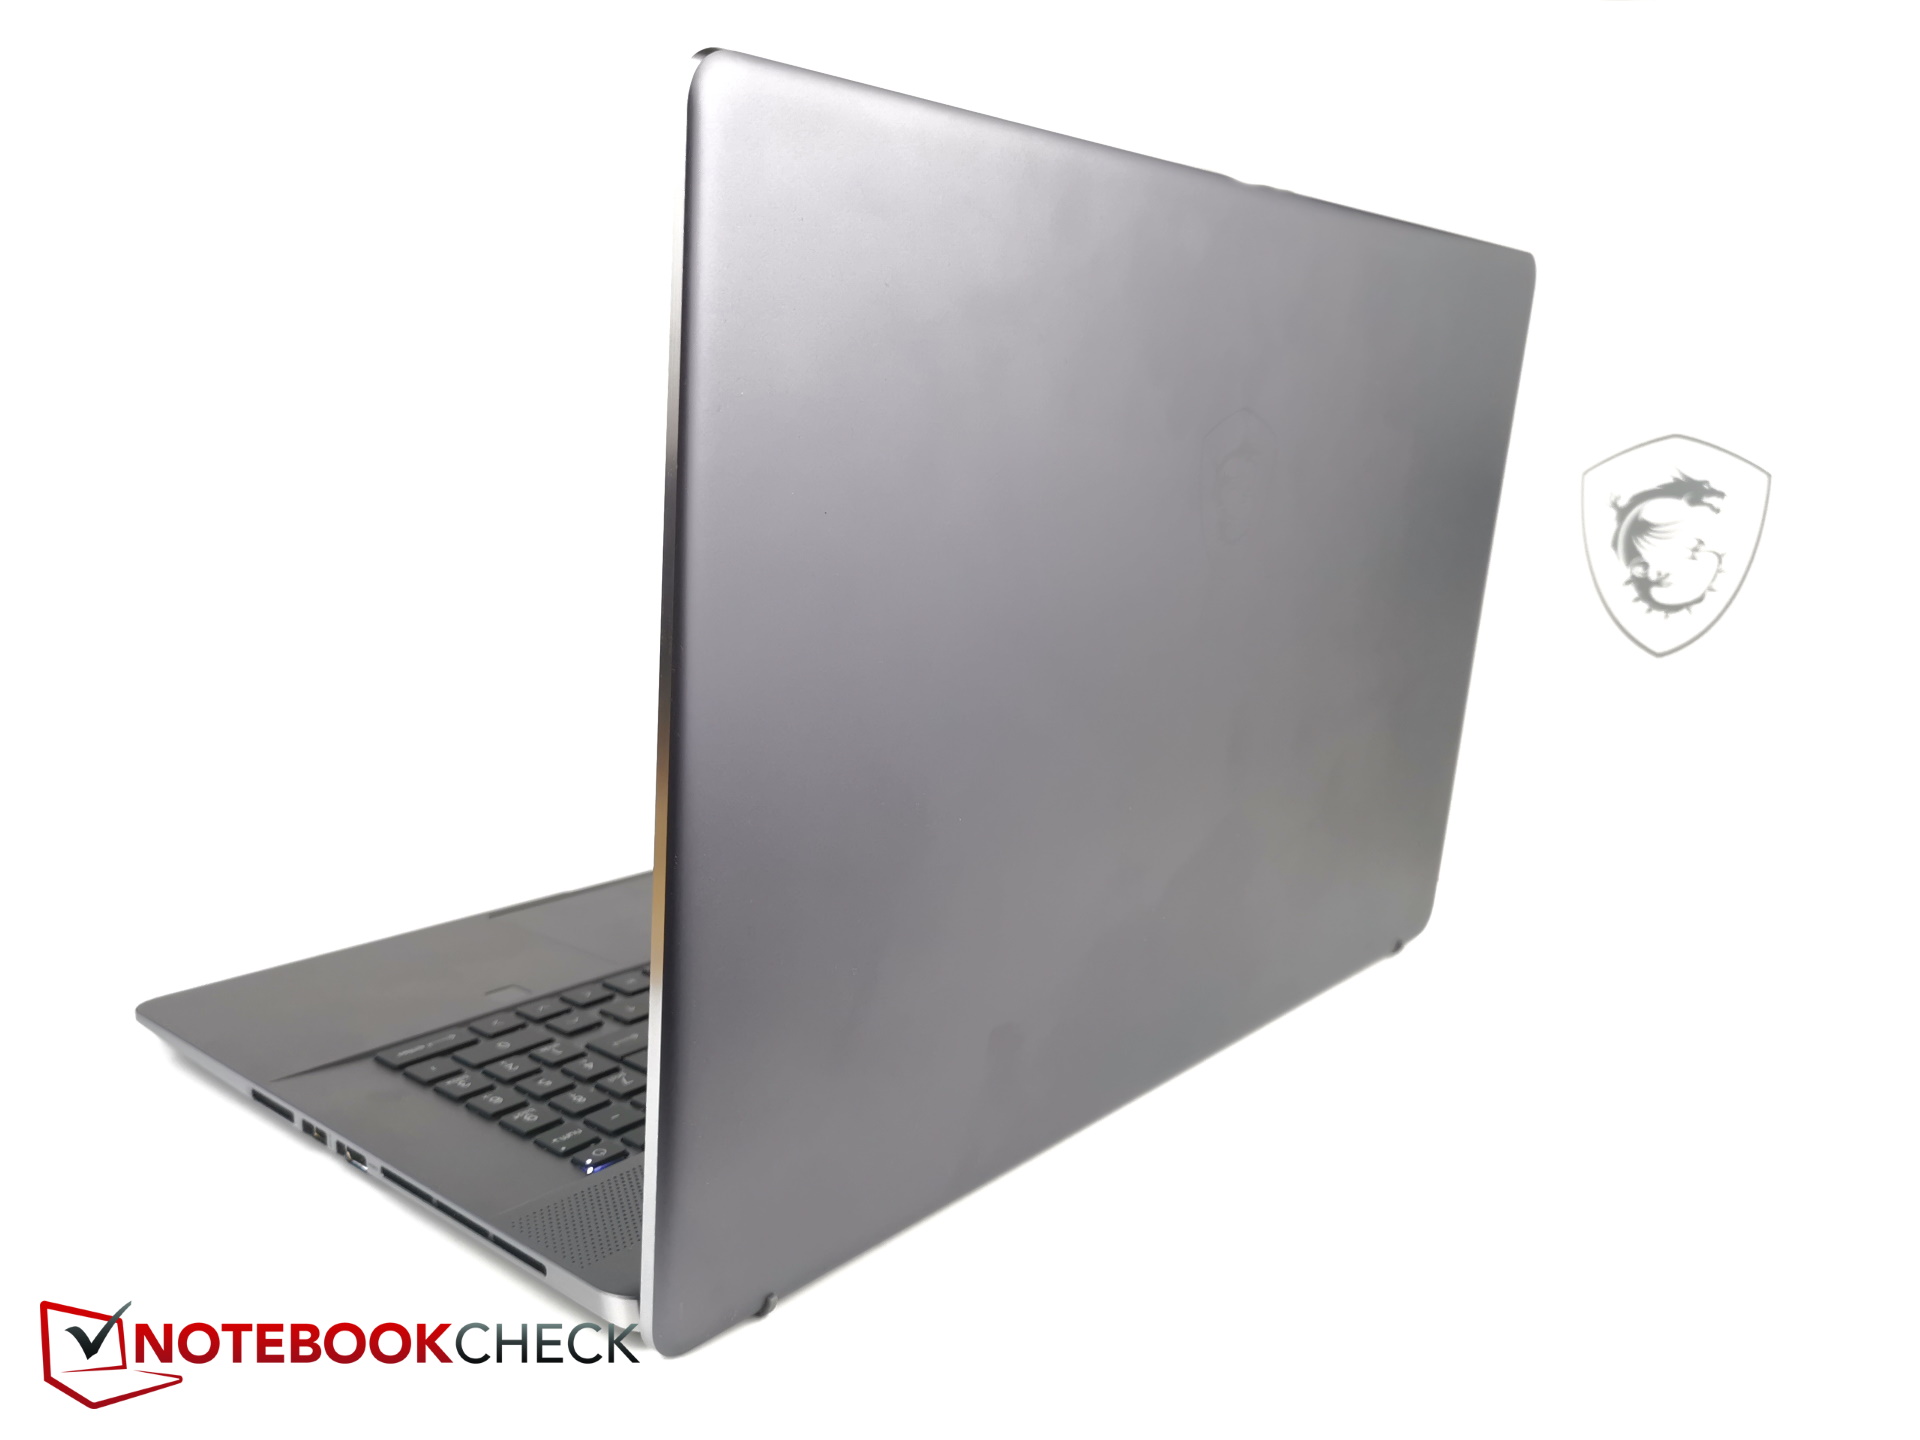
O Z17 é um pouco mais compacto do que seu predecessor, particularmente em largura. Tem uma espessura de apenas 19 mm (0,75"). Mesmo a lâmina Razer muito fina tem cerca de 1 mm (0,04") de espessura e não consegue igualar o quão fino é o Criador
Pesando cerca de 2,5 kg (5,5 lb), o Criador Z17 também é cerca de 300 g (0,66 lb) mais leve que a Lâmina 17. No geral, o dispositivo é o mais fino em nossa comparação, bem como um dos menores laptops de 17 polegadas.
Características - Estação de trabalho Slim MSI
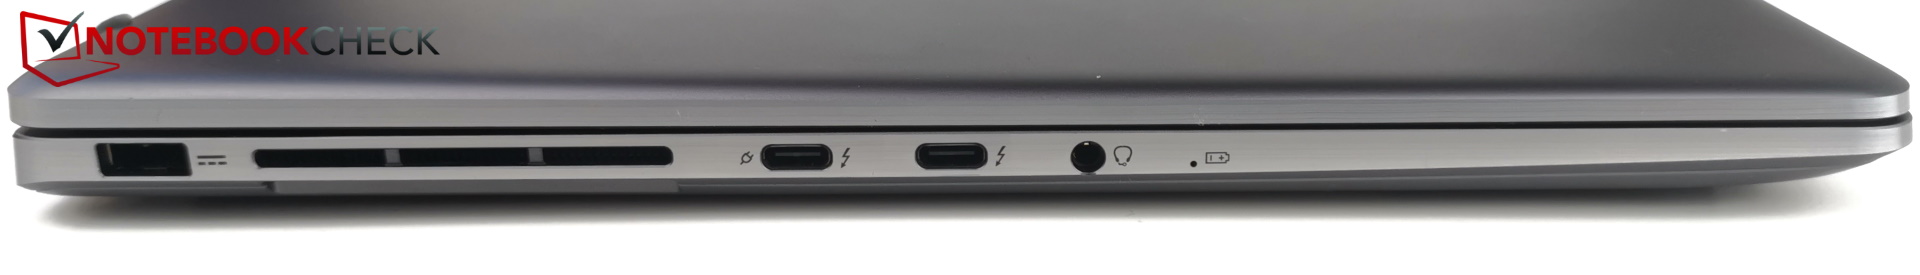
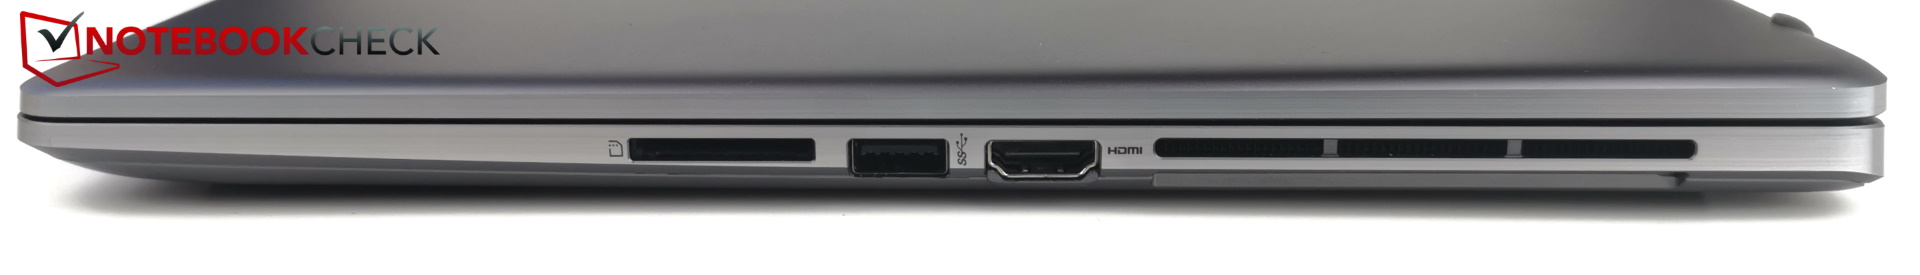
A seleção da porta é bastante fina para um dispositivo de 17 polegadas. Há um total de três portas USB, uma entrada para fone de ouvido, uma saída HDMI e um leitor de cartões SD. A Z17 não tem nem uma porta Ethernet nem um slot de trava Kensington. Você precisará comprar um adaptador USB opcional para conectividade Ethernet.
Em uma nota positiva, as duas portas USB-C suportam o Thunderbolt 4. Infelizmente, isto também significa que há apenas uma porta USB-A disponível no dispositivo. Para os criativos, portanto, é quase essencial usar um hub para o trabalho.
Apesar da pequena seleção de portas, a maneira como elas estão dispostas é menos do que ideal - pelo menos no lado direito. A saída HDMI e a porta USB-A, entre todas as coisas, estão localizadas muito próximas umas das outras e quase certamente irão interferir umas com as outras.
Leitor de cartões SD
Quando você insere um cartão SD no leitor, ele não trava no lugar, mas apenas fica ali sentado, com cerca de metade dele de fora. As taxas de transferência alcançadas com nosso cartão SD de referência (AV PRO microSD 128 GB V60) foram bastante modestas. Você deve poder esperar mais de um laptop com este preço. Por exemplo, o Razer Blade é duas vezes mais rápido, e o XPS 17 é ainda mais rápido neste departamento.
| SD Card Reader | |
| average JPG Copy Test (av. of 3 runs) | |
| Dell XPS 17 9720 RTX 3060 (Toshiba Exceria Pro SDXC 64 GB UHS-II) | |
| Razer Blade 17 (i7-12800H, RTX 3070 Ti) | |
| Média da turma Multimedia (23 - 531, n=37, últimos 2 anos) | |
| MSI Creator Z17 A12UGST-054 (AV Pro SD microSD 128 GB V60) | |
| MSI Creator Z16P B12UHST (AV PRO microSD 128 GB V60) | |
| maximum AS SSD Seq Read Test (1GB) | |
| Dell XPS 17 9720 RTX 3060 (Toshiba Exceria Pro SDXC 64 GB UHS-II) | |
| Média da turma Multimedia (37.3 - 1455, n=36, últimos 2 anos) | |
| Razer Blade 17 (i7-12800H, RTX 3070 Ti) | |
| MSI Creator Z17 A12UGST-054 (AV Pro SD microSD 128 GB V60) | |
Conectividade
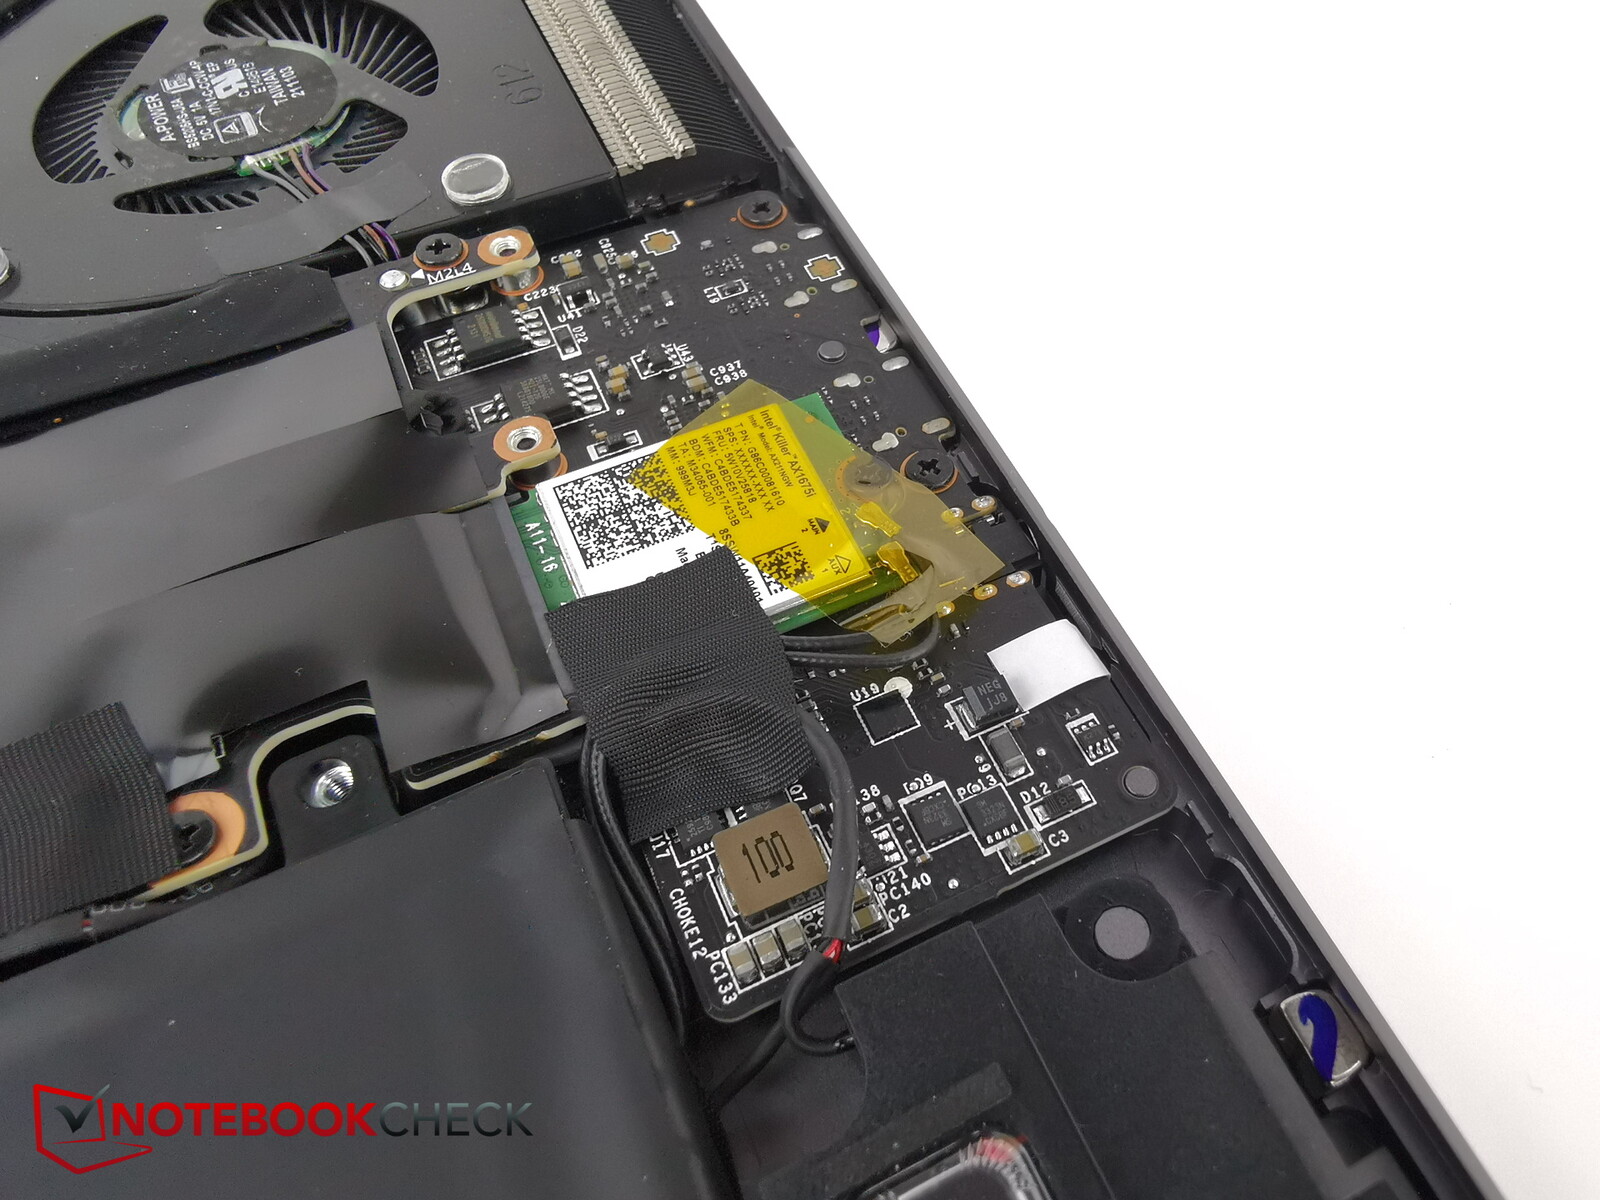
Como mencionado anteriormente, uma porta Ethernet está faltando no Z17. Sem um adaptador, você está limitado a usar conexões sem fio mesmo quando está em casa. Mas a MSI pelo menos incluiu um módulo sem fio Killer que suporta Wi-Fi 6E
As taxas de transferência são boas e rápidas, especialmente quando se usa a banda de 6 GHz. Em duas execuções de teste, houve um pequeno mergulho cada uma na taxa de transferência.
Webcam
A MSI incluiu uma webcam Full HD com sensor IR e reconhecimento facial. A qualidade da imagem é decente, mas os desvios de cor tendem a ser um pouco avermelhados.


Segurança
O Criador Z17 dispõe de um sensor de impressão digital. Além disso, sua câmera é equipada com um sensor IR e suporta login usando reconhecimento facial.
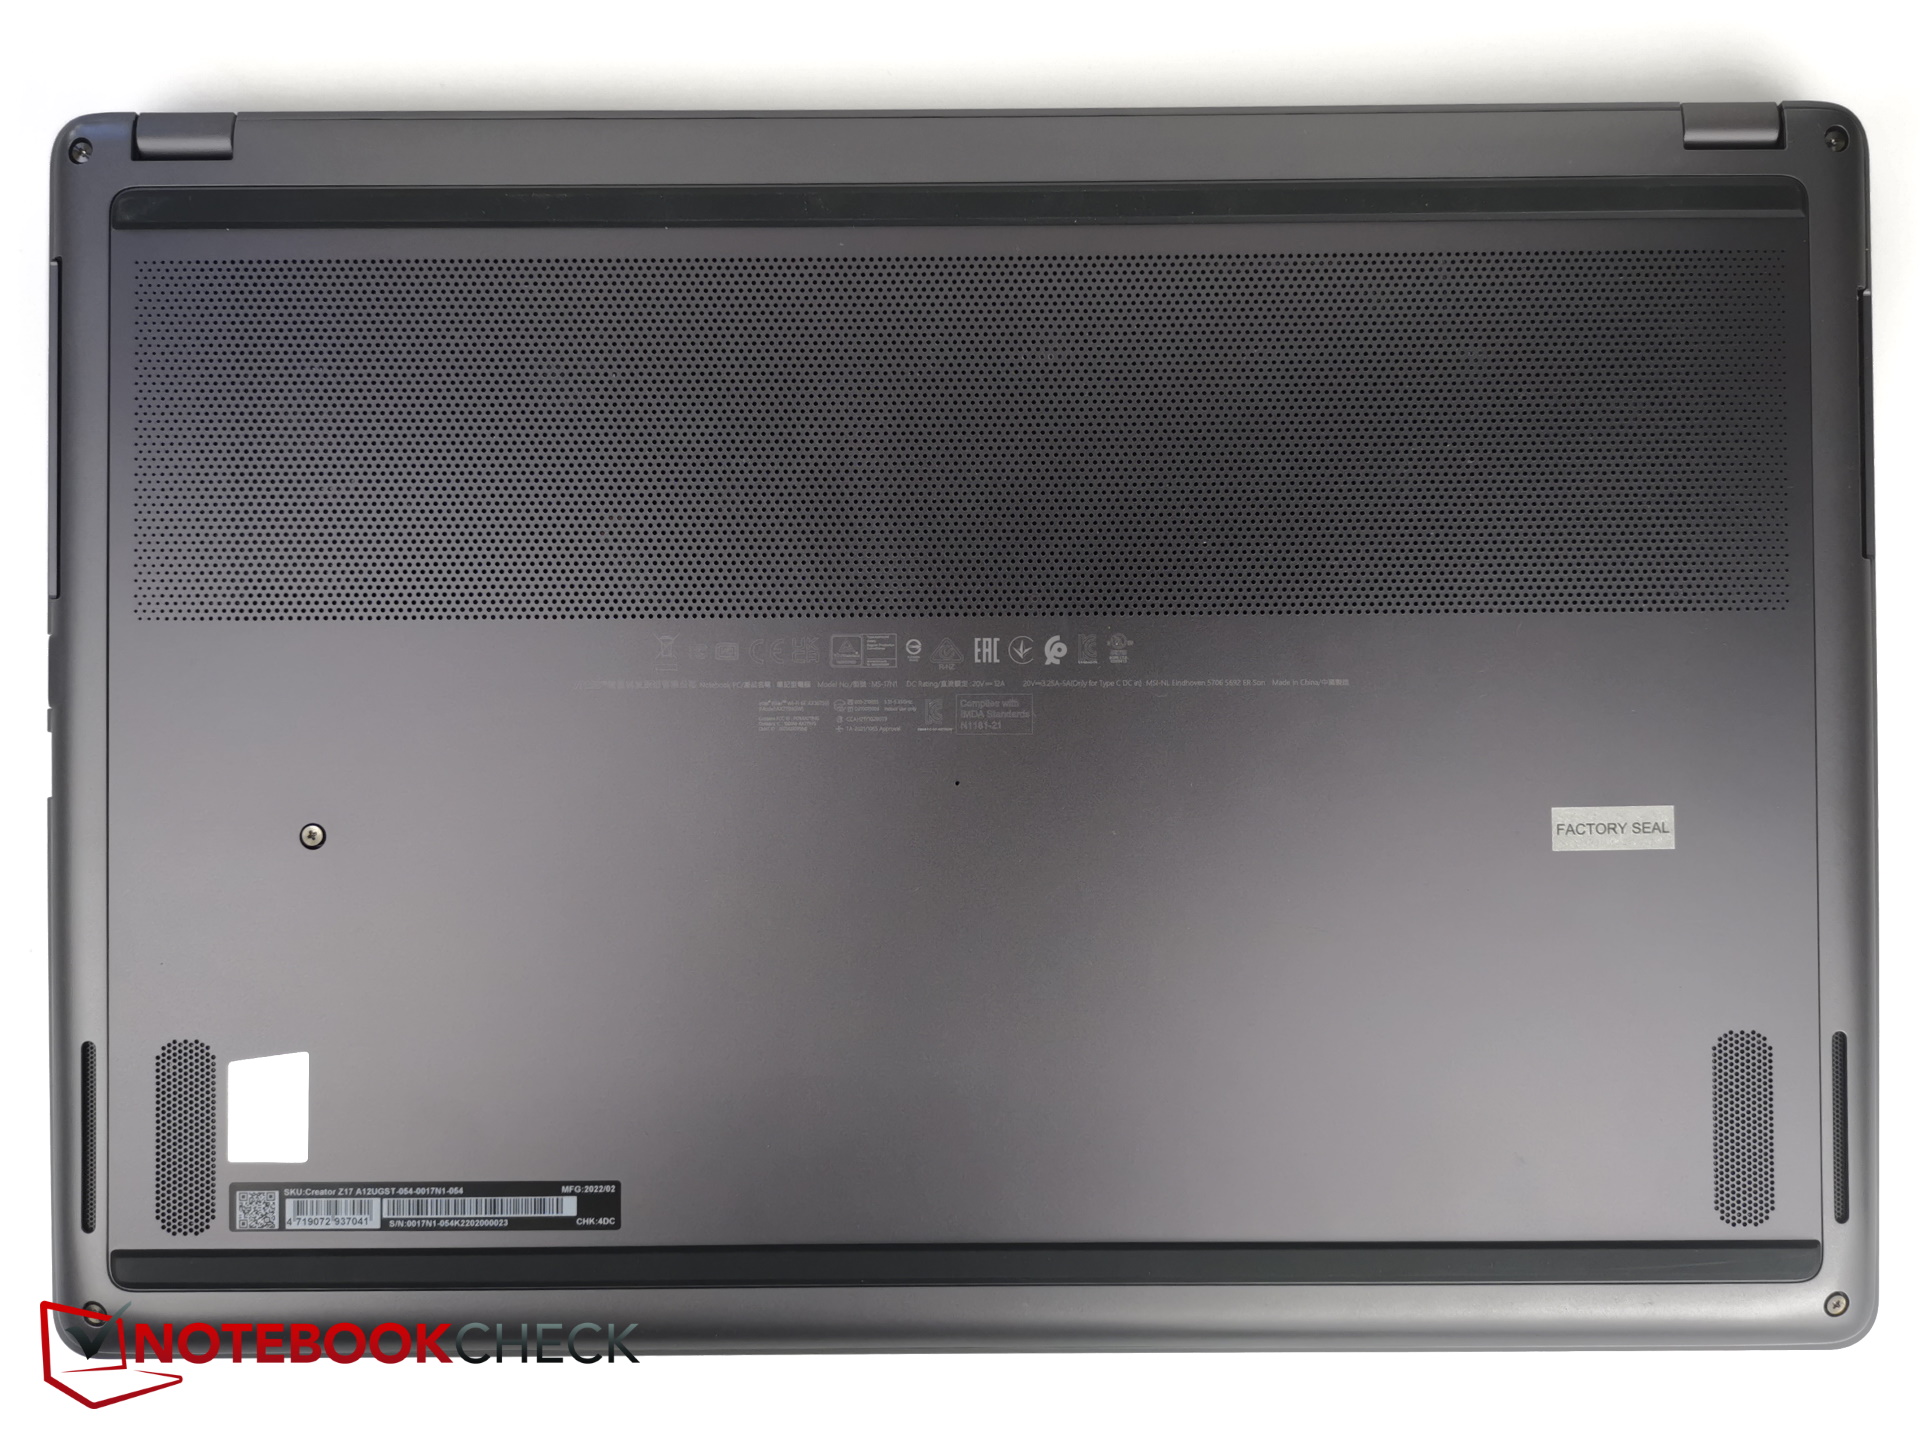
Manutenção
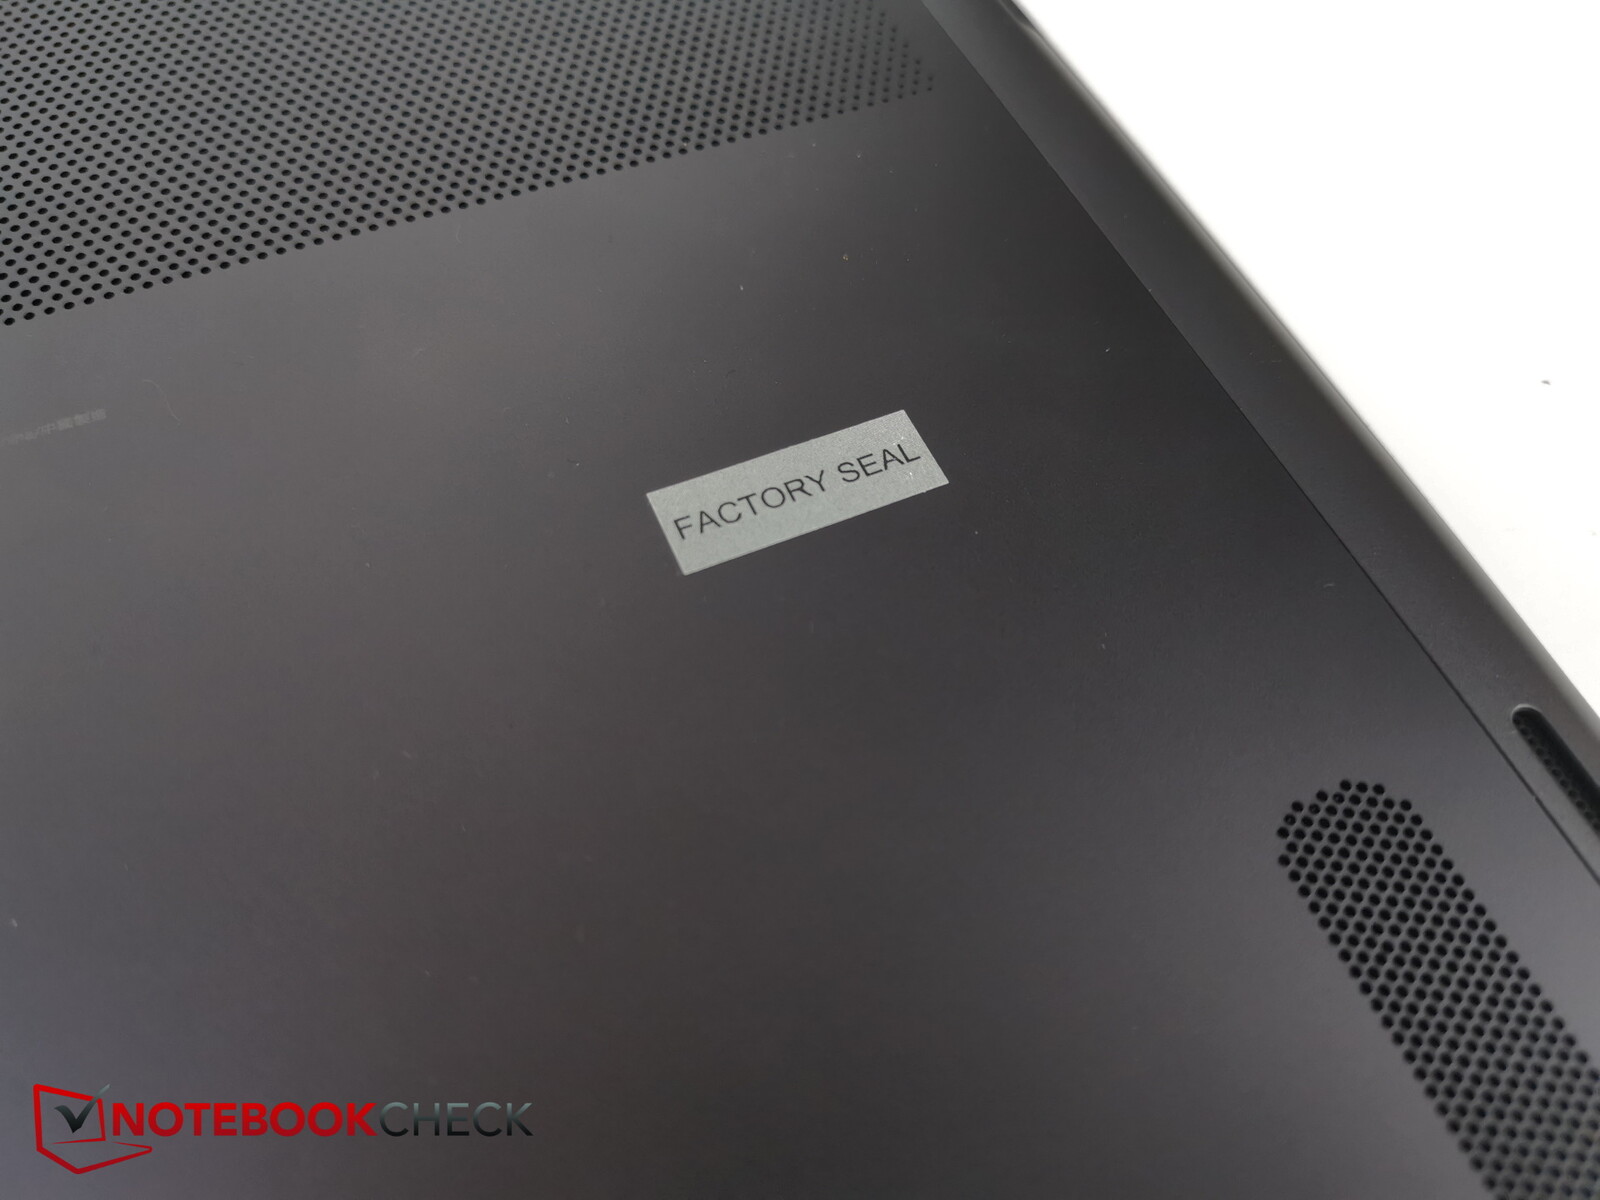
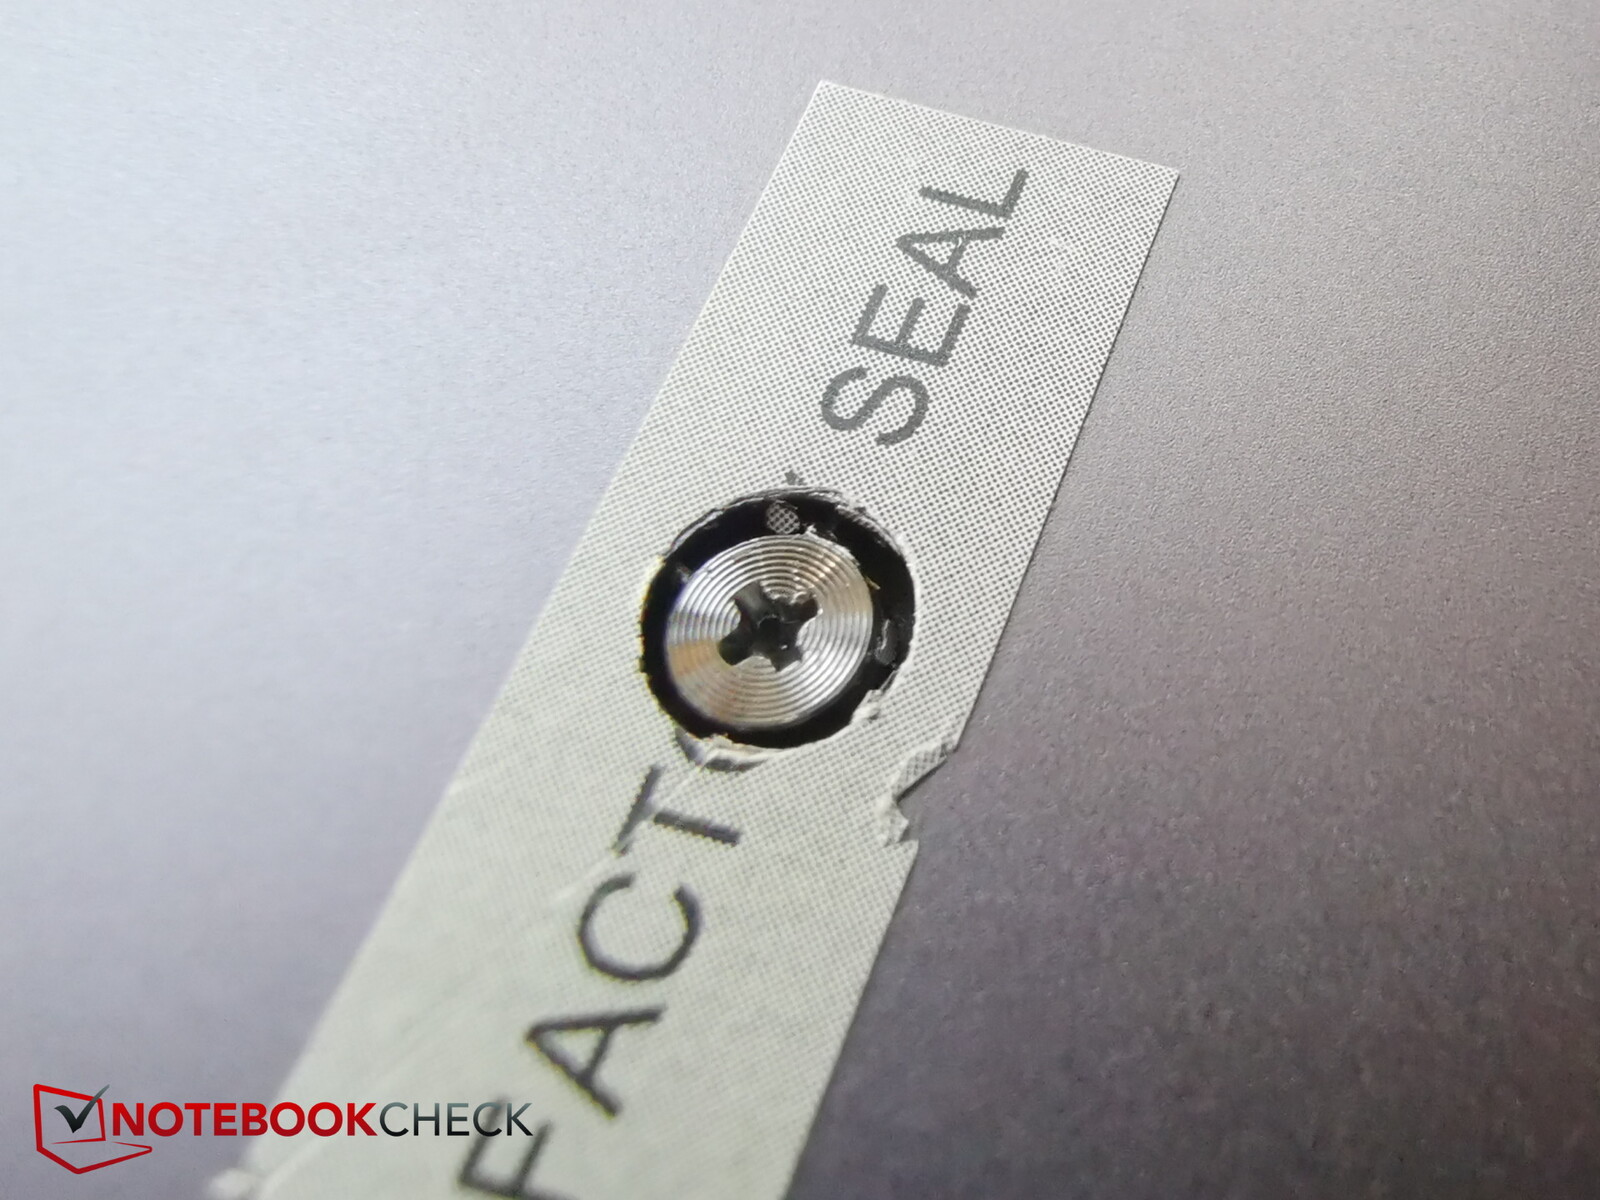
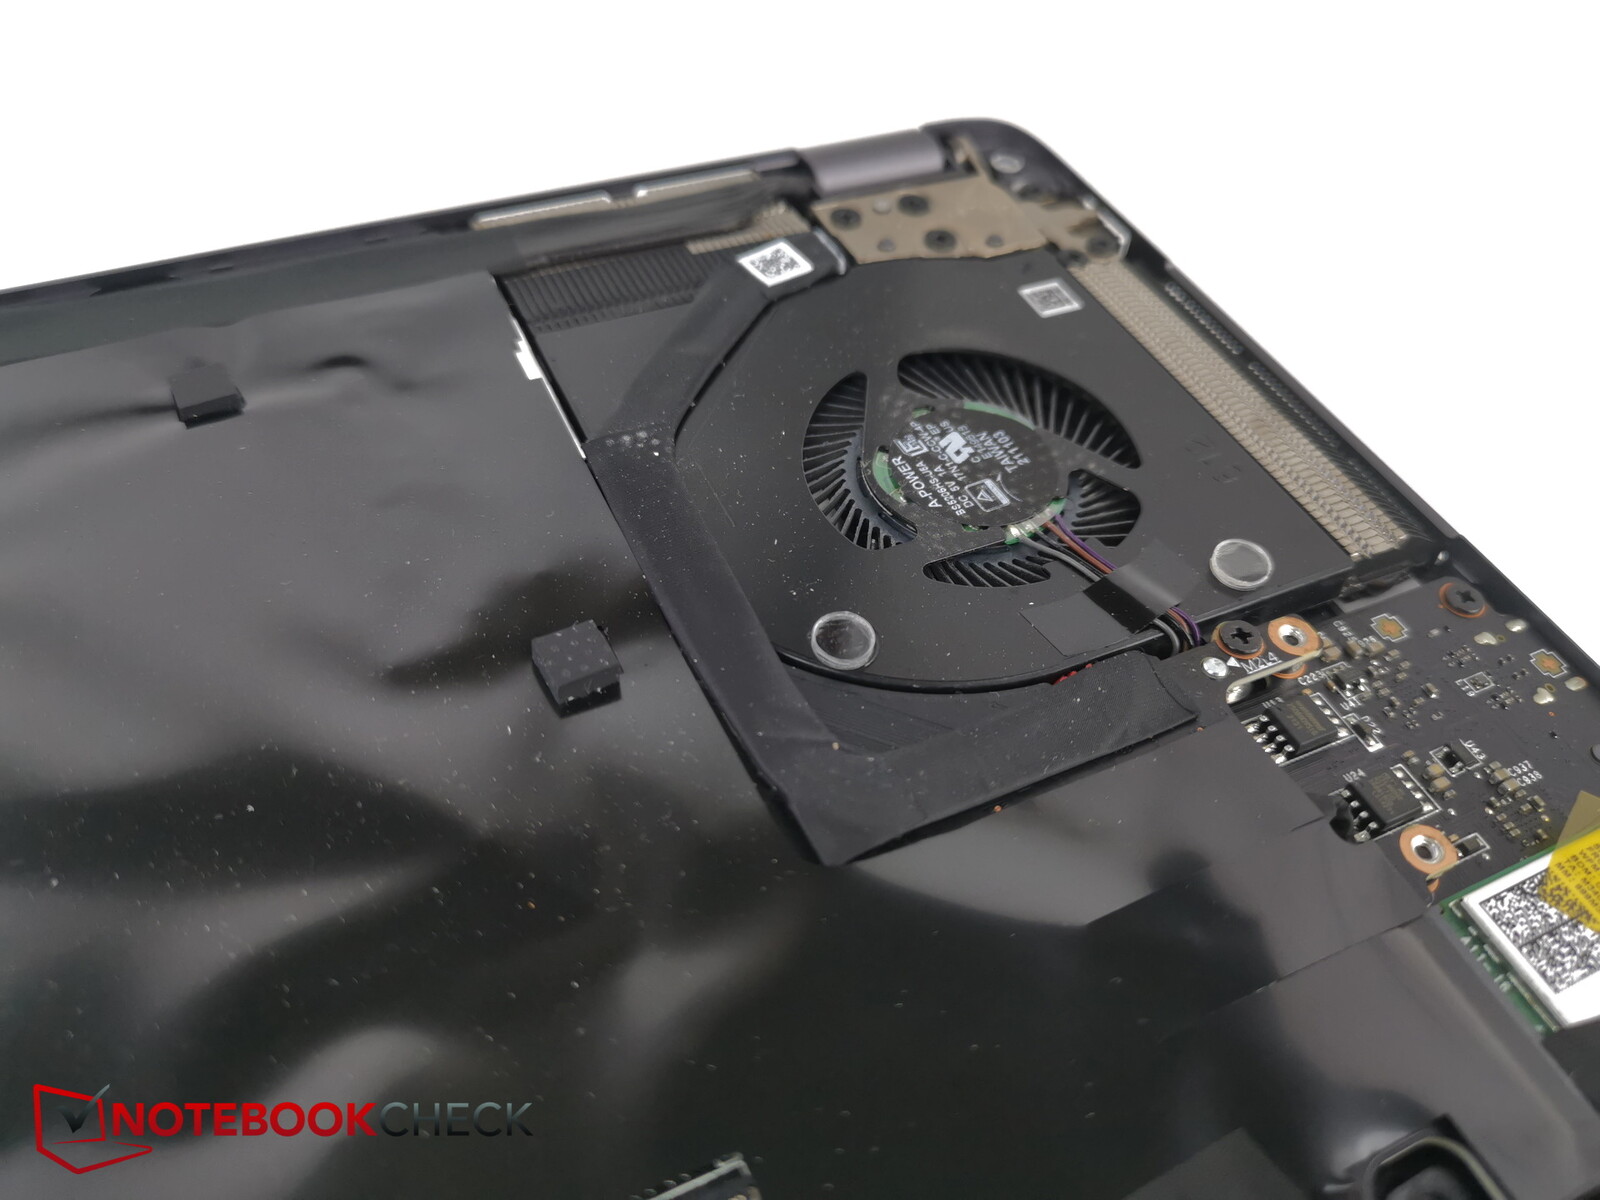
O painel inferior é fixado no lugar com apenas seis parafusos Phillips. Infelizmente, há um adesivo de vedação de fábrica cobrindo um deles. A danificação do adesivo pode afetar a validade de qualquer reclamação futura de garantia. Primeiro você precisará de uma ferramenta para prender o painel. Depois disso, o painel pode ser removido rapidamente e sem esforço.
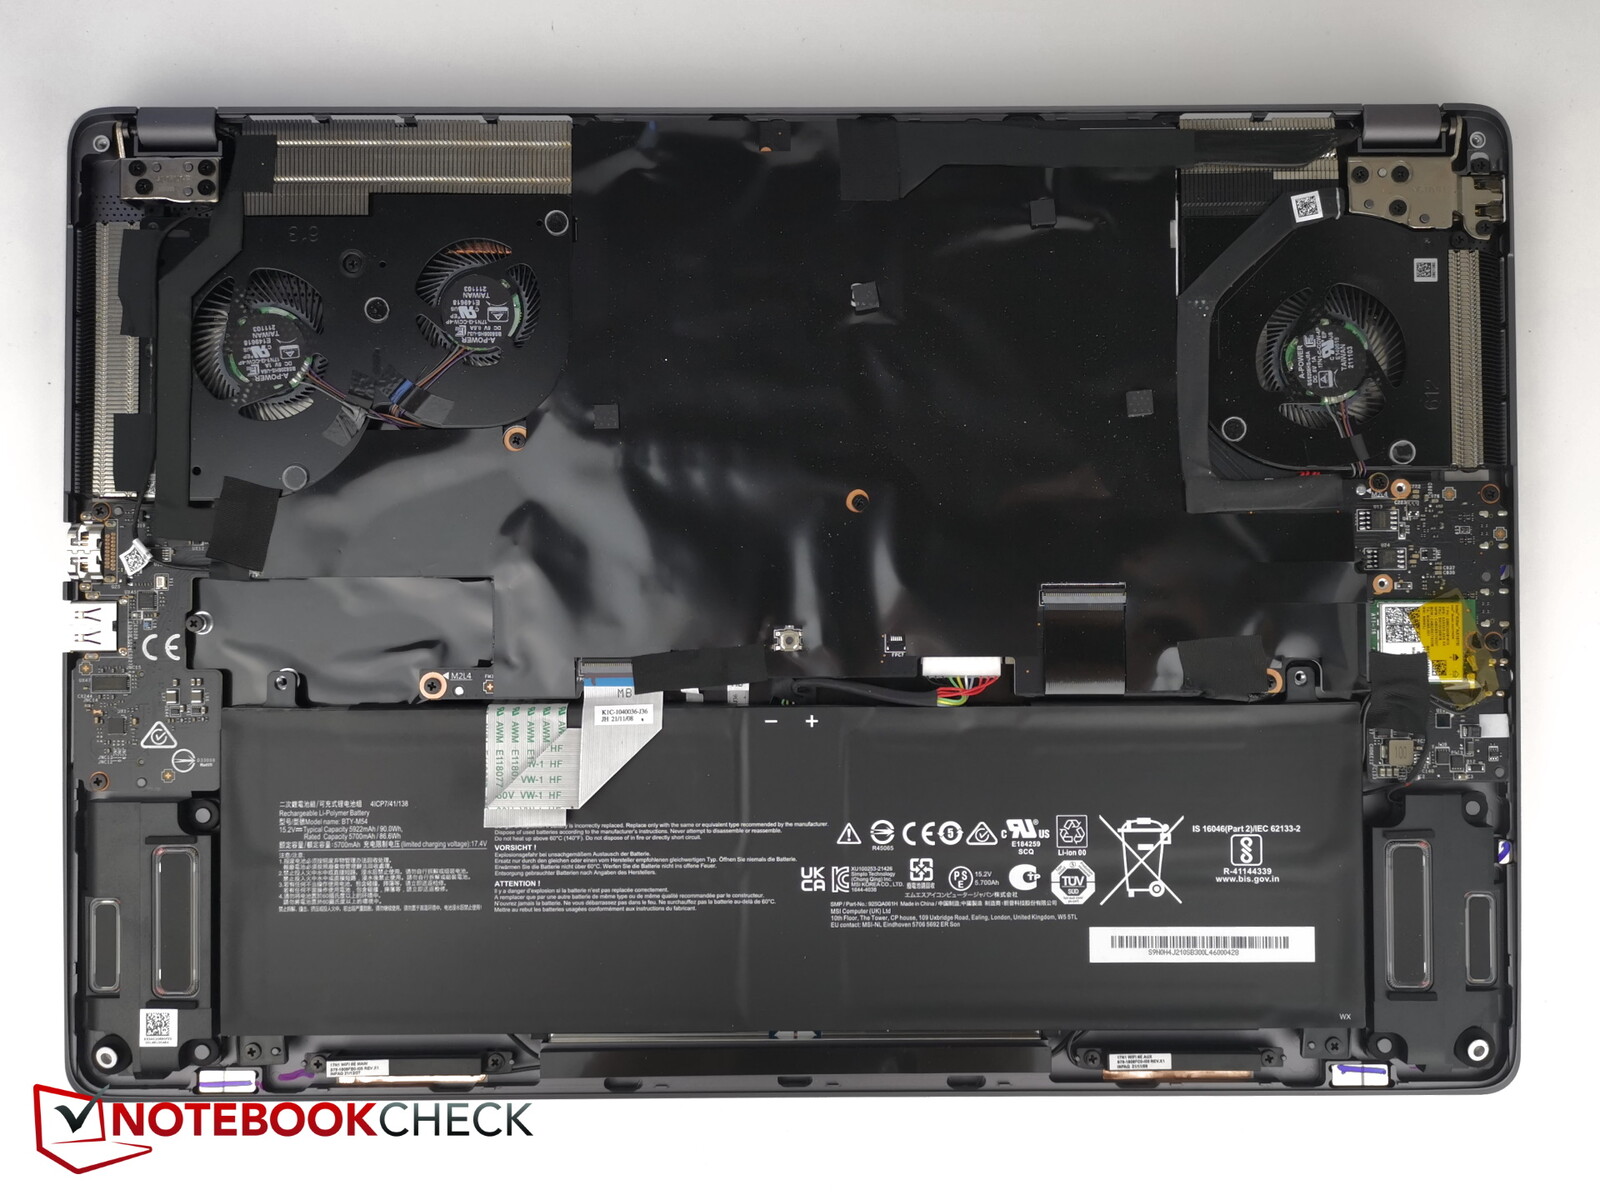
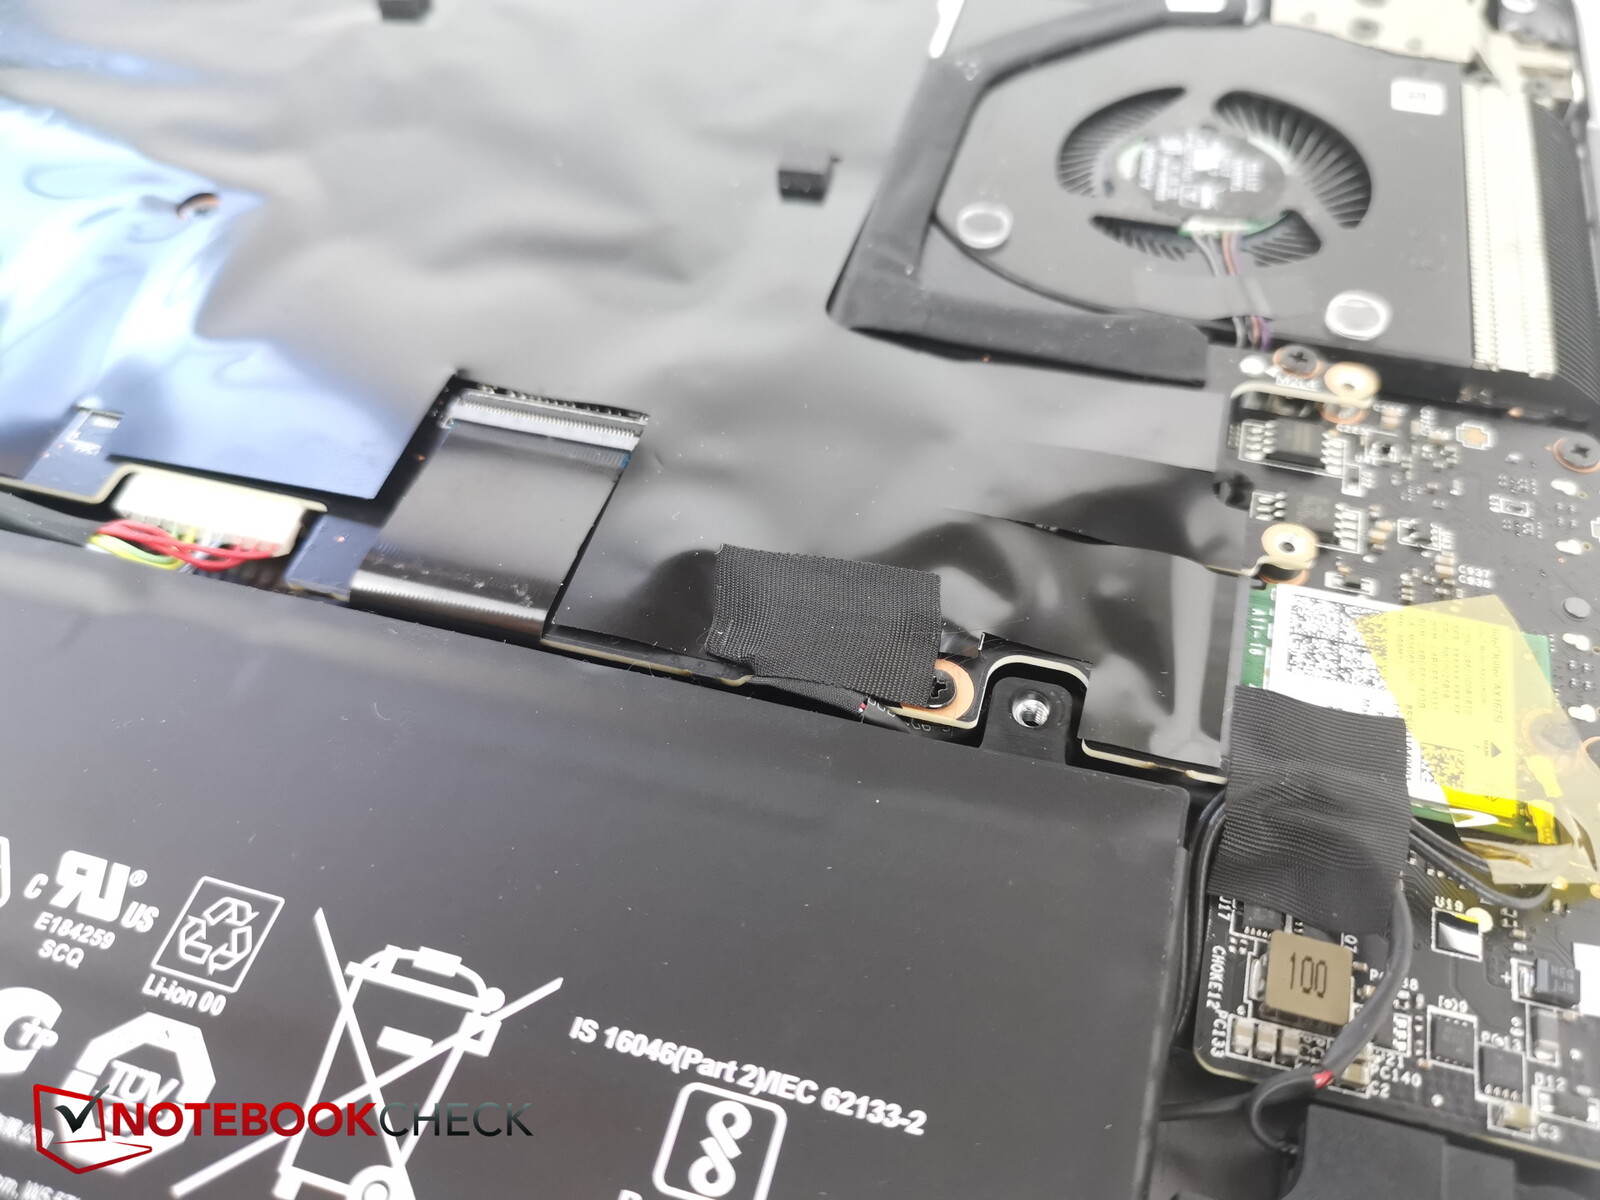
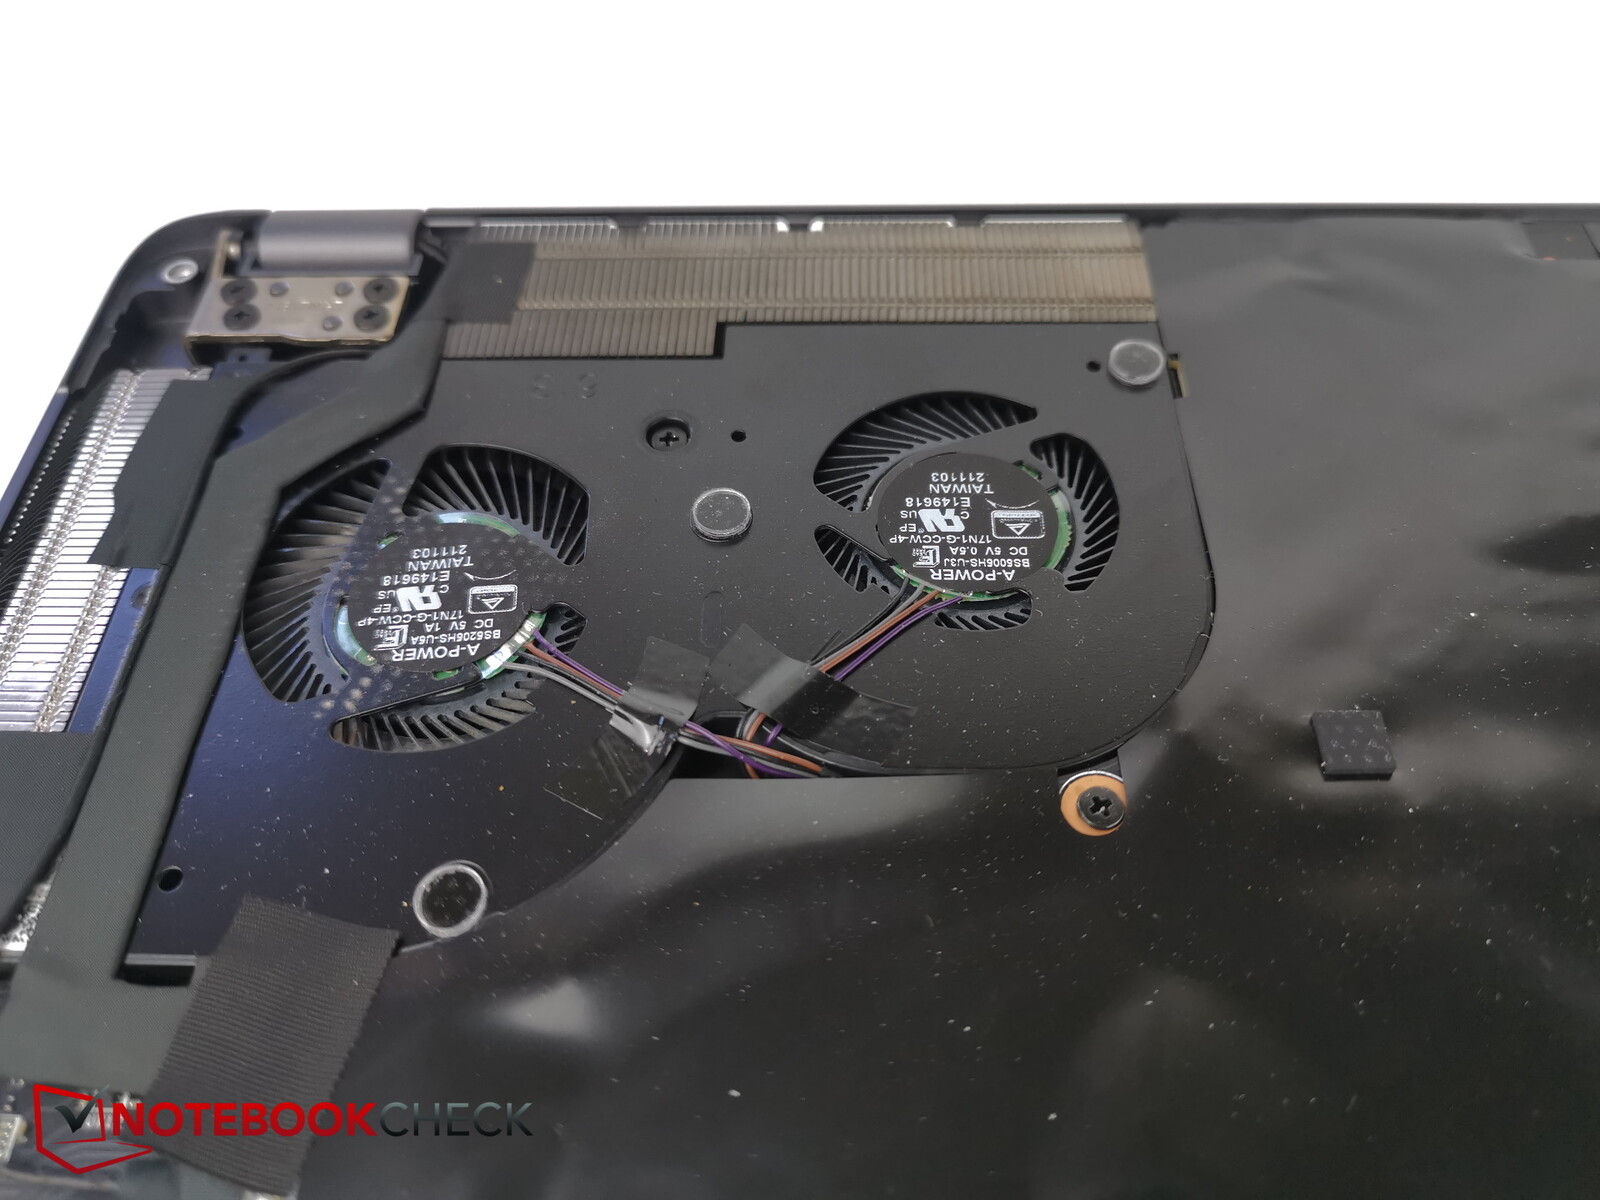
Os internos do Z17 são bastante difíceis de serem reparados e atualizados, já que quase todos os componentes são cobertos por uma grande folha de filme preto. Somente o módulo Wi-Fi e os ventiladores são acessíveis imediatamente. Mesmo depois de espreitar por baixo dos cantos do filme, não conseguimos encontrar onde a RAM e o SSD estão localizados. A folha foi colada de tal forma que não pode ser removida sem danificar nada.
Acessórios e garantia
Apesar da pesada etiqueta de preço do dispositivo, nenhum acessório está incluído na caixa. Um adaptador USB-para-Ethernet teria sido pelo menos agradável de se ter.
Na Alemanha, a MSI fornece uma garantia de dois anos para o laptop, incluindo um serviço de coleta e devolução. Nos EUA, o período de garantia é de um ano.
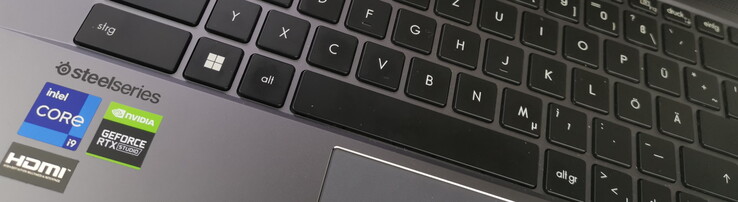
Input devices - Solid options for creators
Teclado
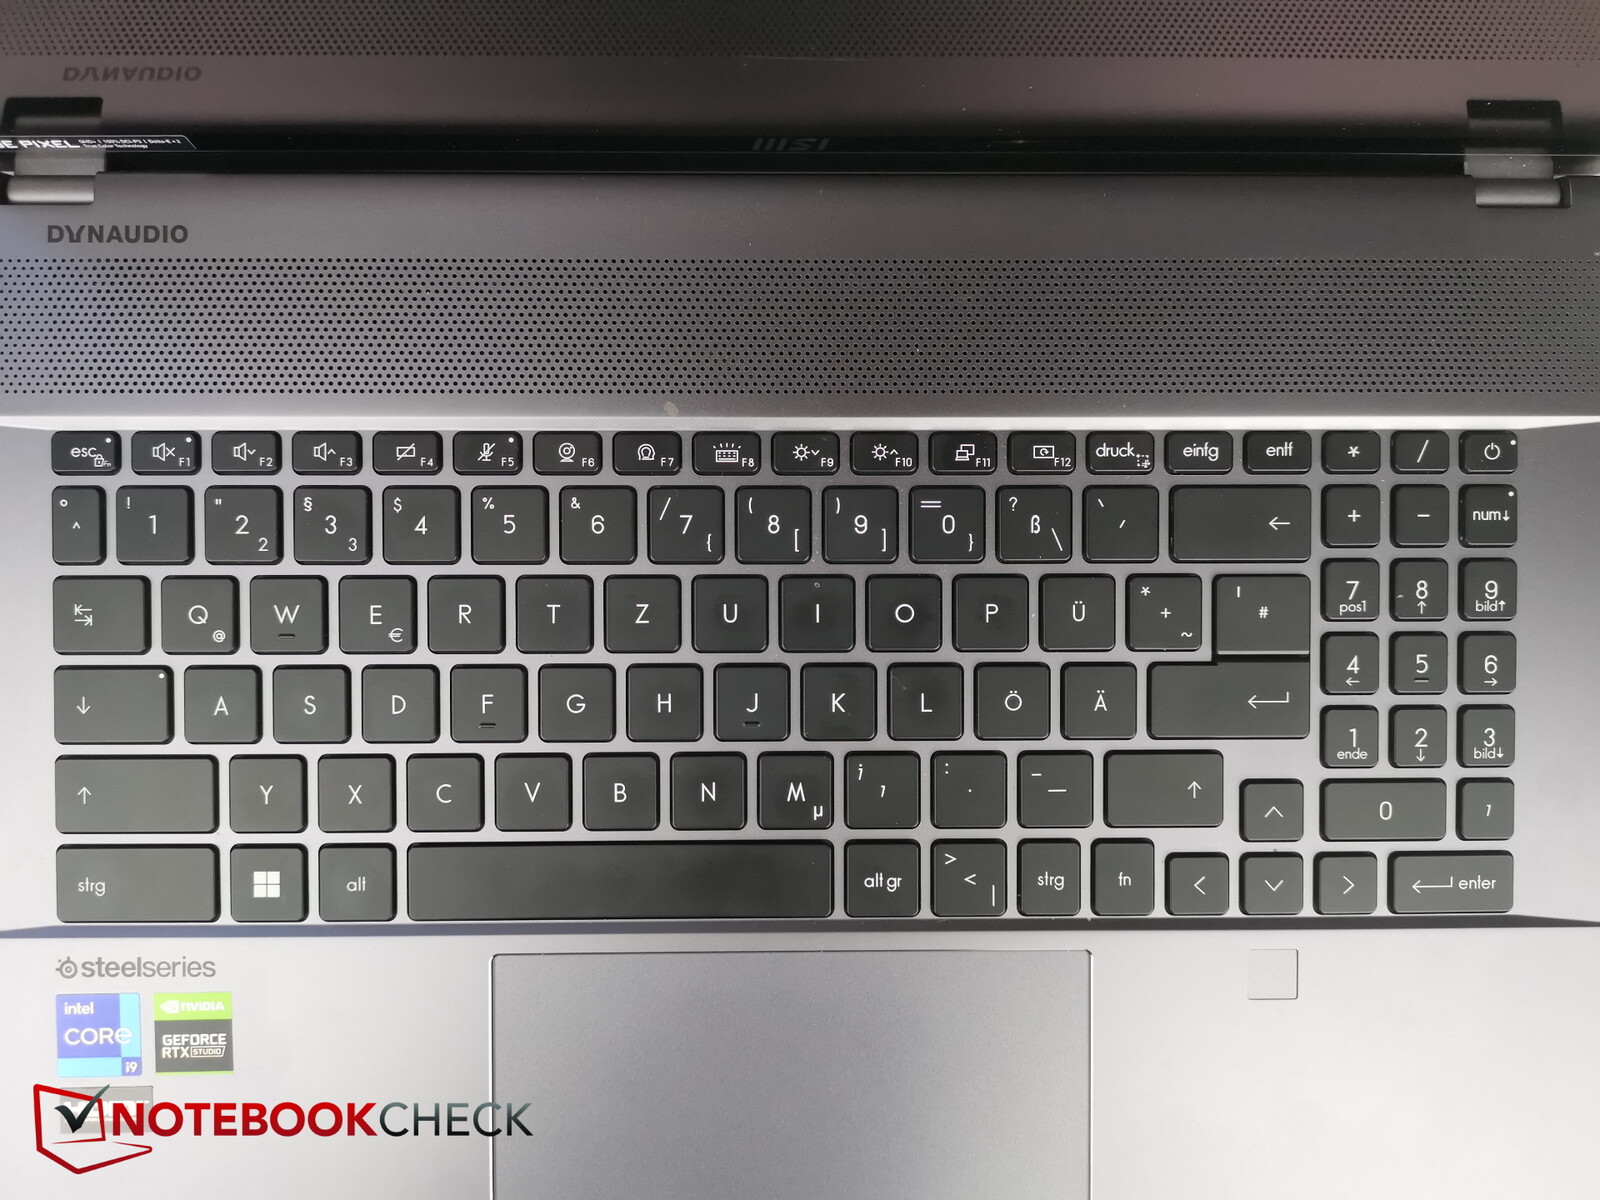
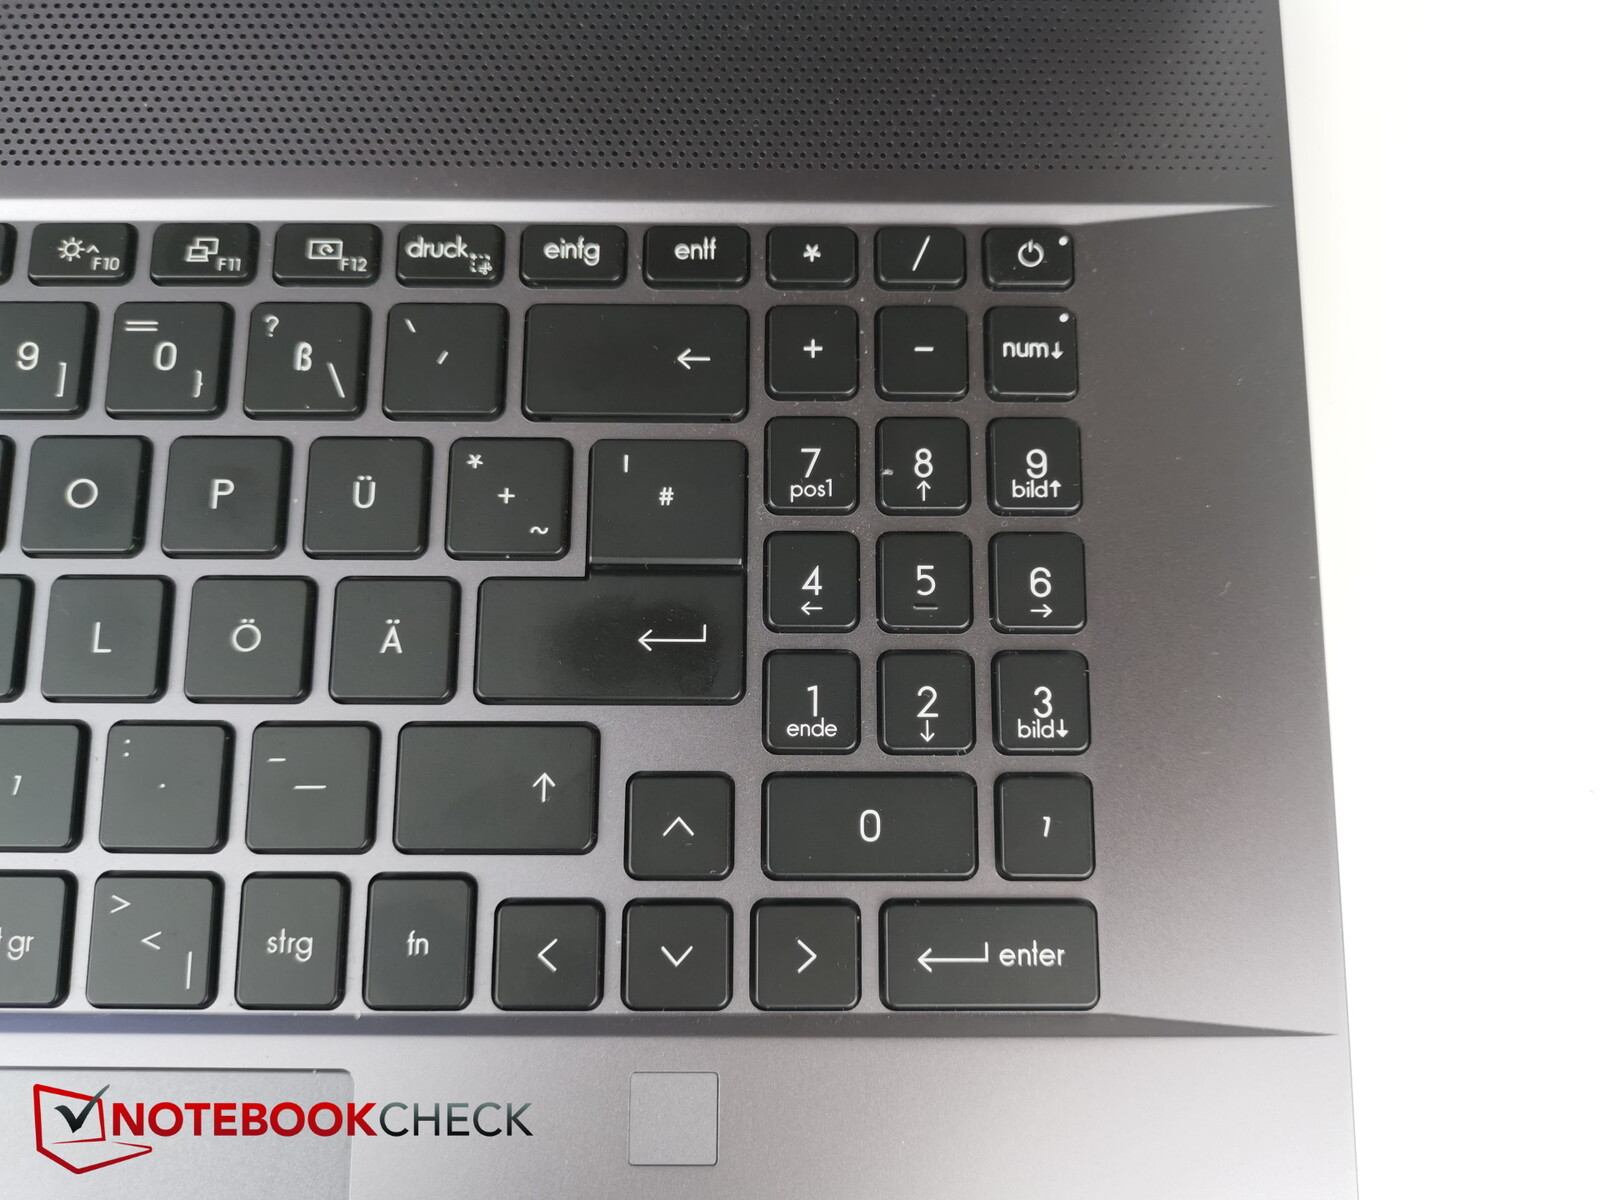
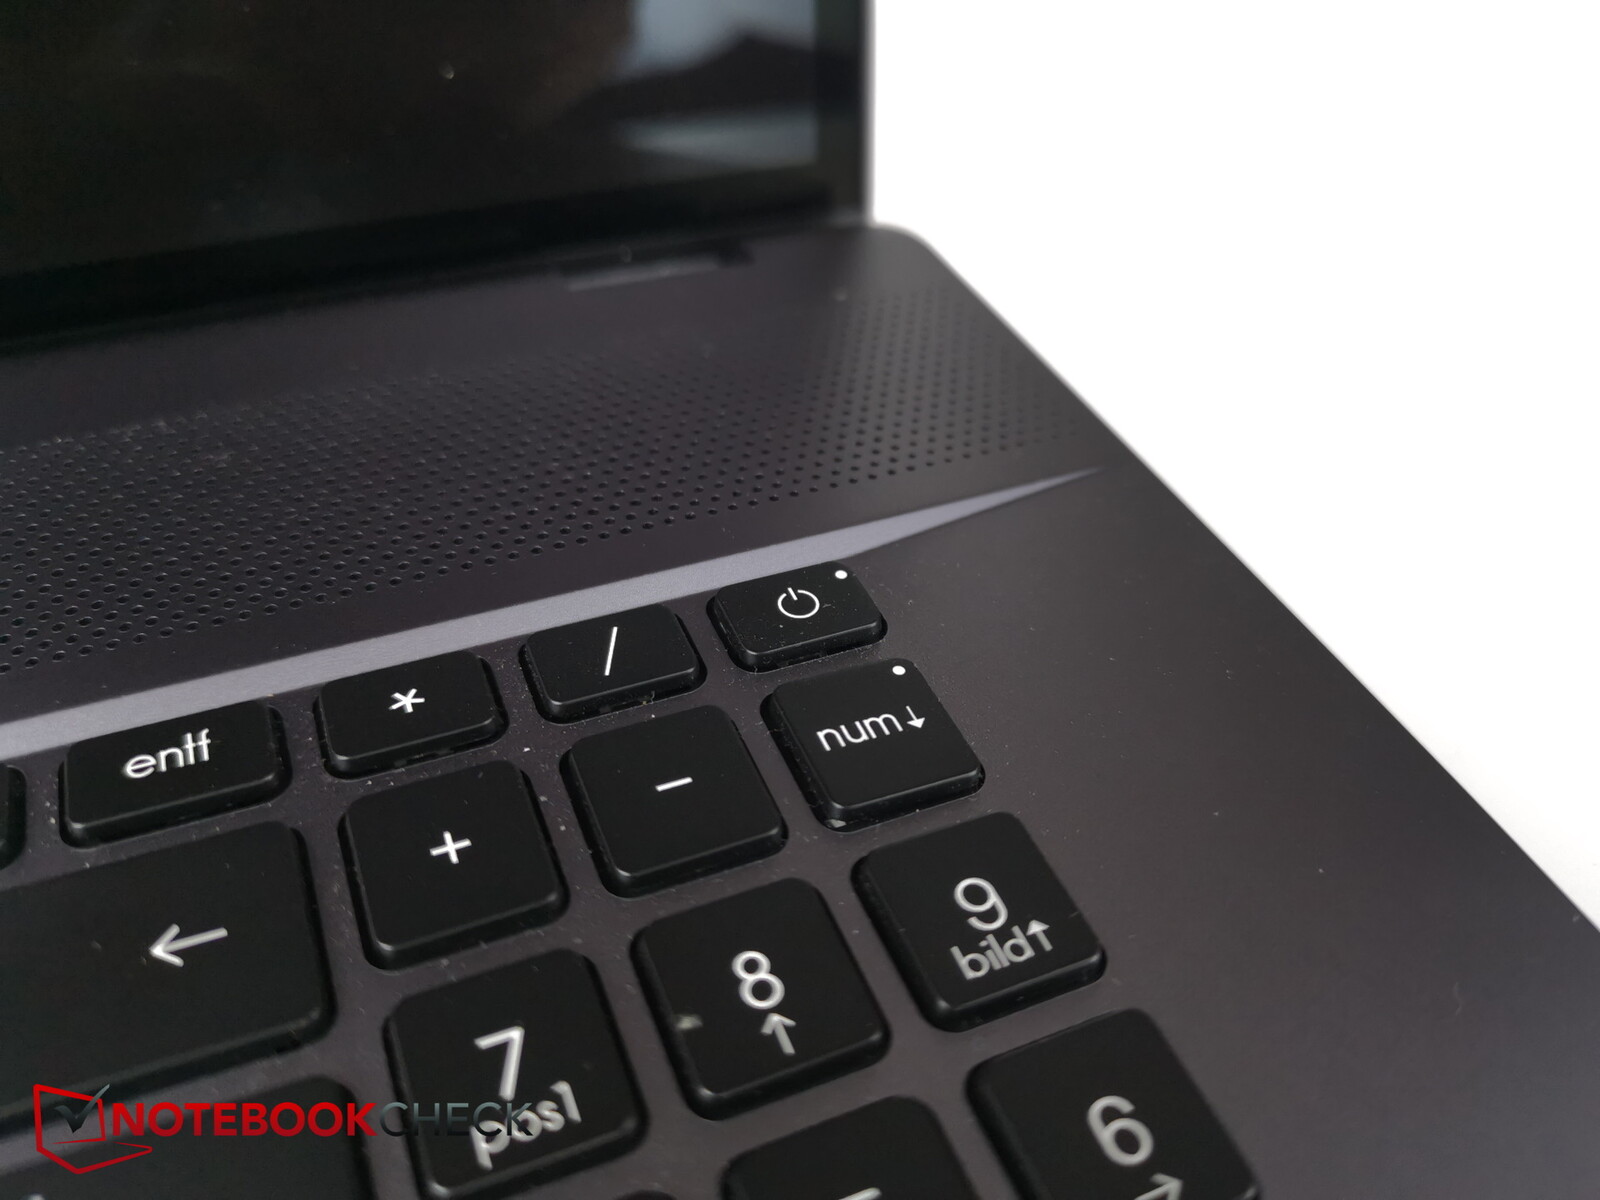
Embora este seja um laptop de 17 polegadas, ele não faz uso de toda sua largura para o teclado. Embora as teclas normais sejam suficientemente grandes e bem espaçadas, o teclado numérico à direita parece muito pequeno e esticado. Entretanto, a fonte nas teclas é claramente visível e legível em toda a sua extensão.
As teclas de seta também são muito pequenas. O mesmo se aplica à tecla Ctrl direita e à tecla Fn estreita (que, ao contrário da maioria dos teclados, é encontrada apenas do lado direito).
As próprias teclas têm uma viagem bastante curta, mas oferecem um feedback claro para permitir uma digitação rápida. O centro do teclado não tem nenhuma flexibilidade perceptível quando se está digitando - tudo parece rígido.
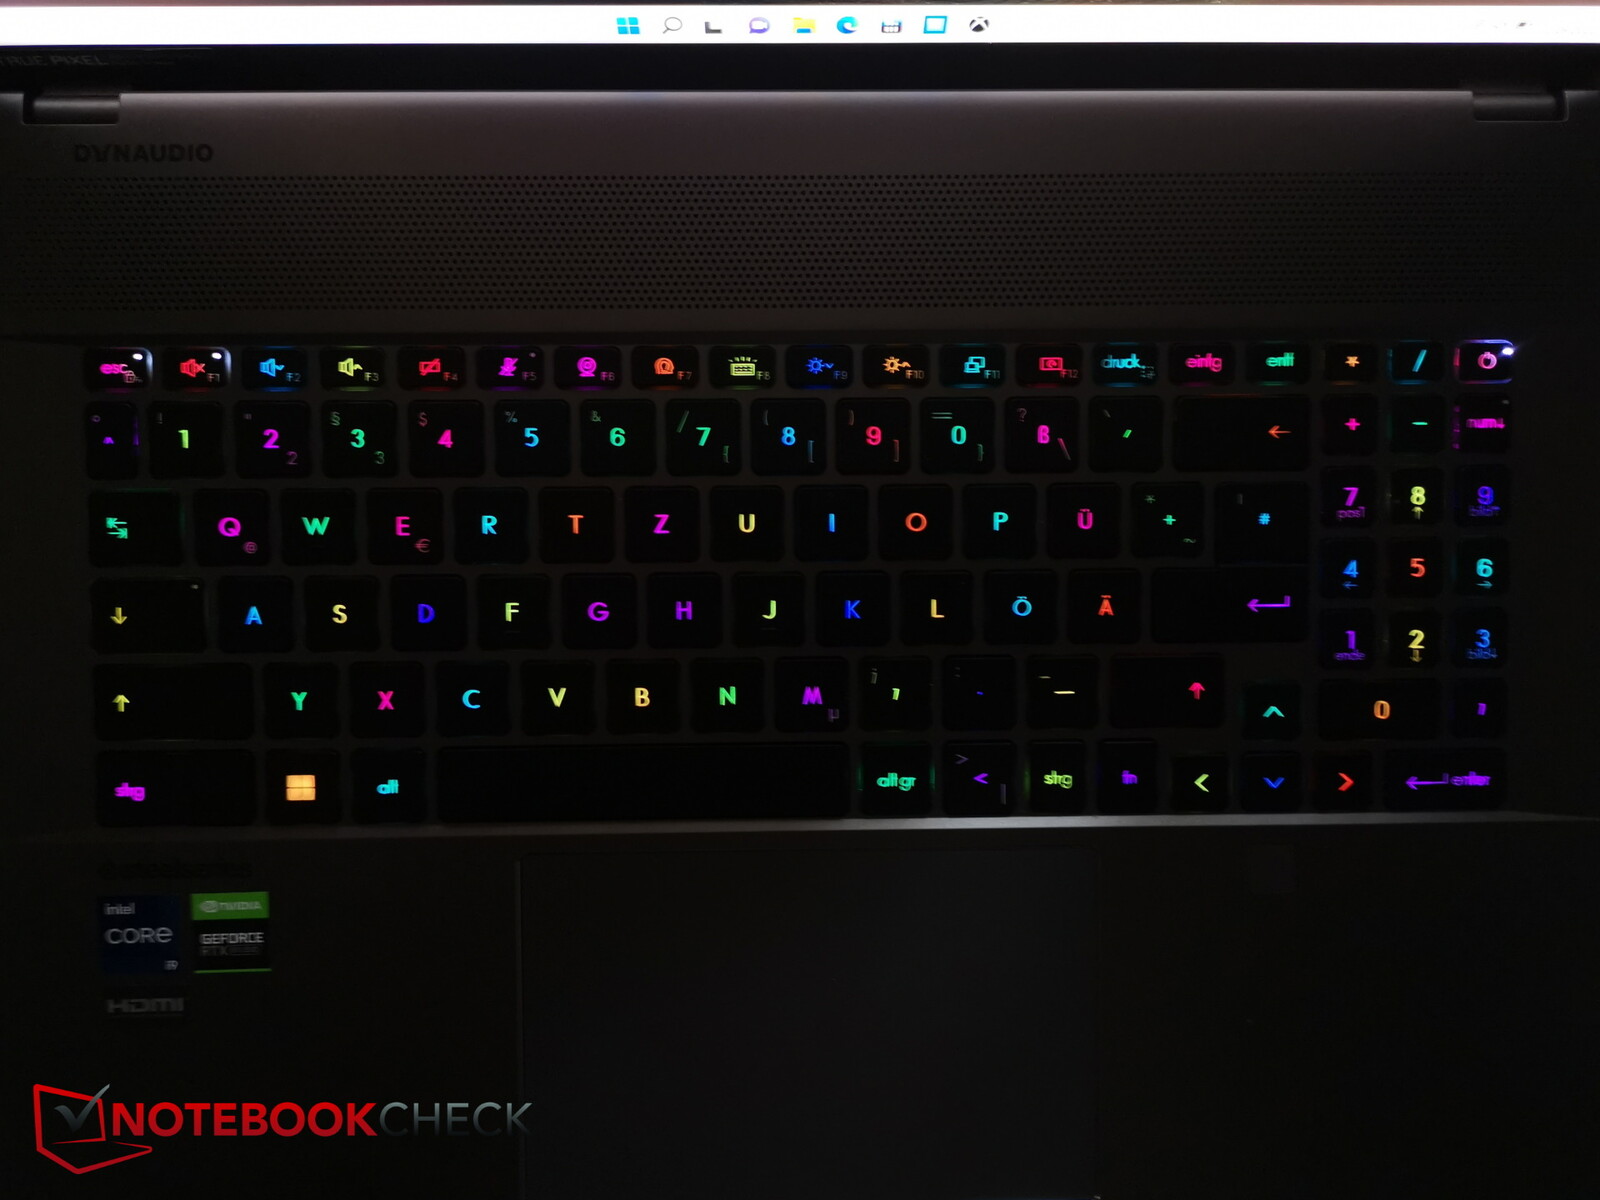
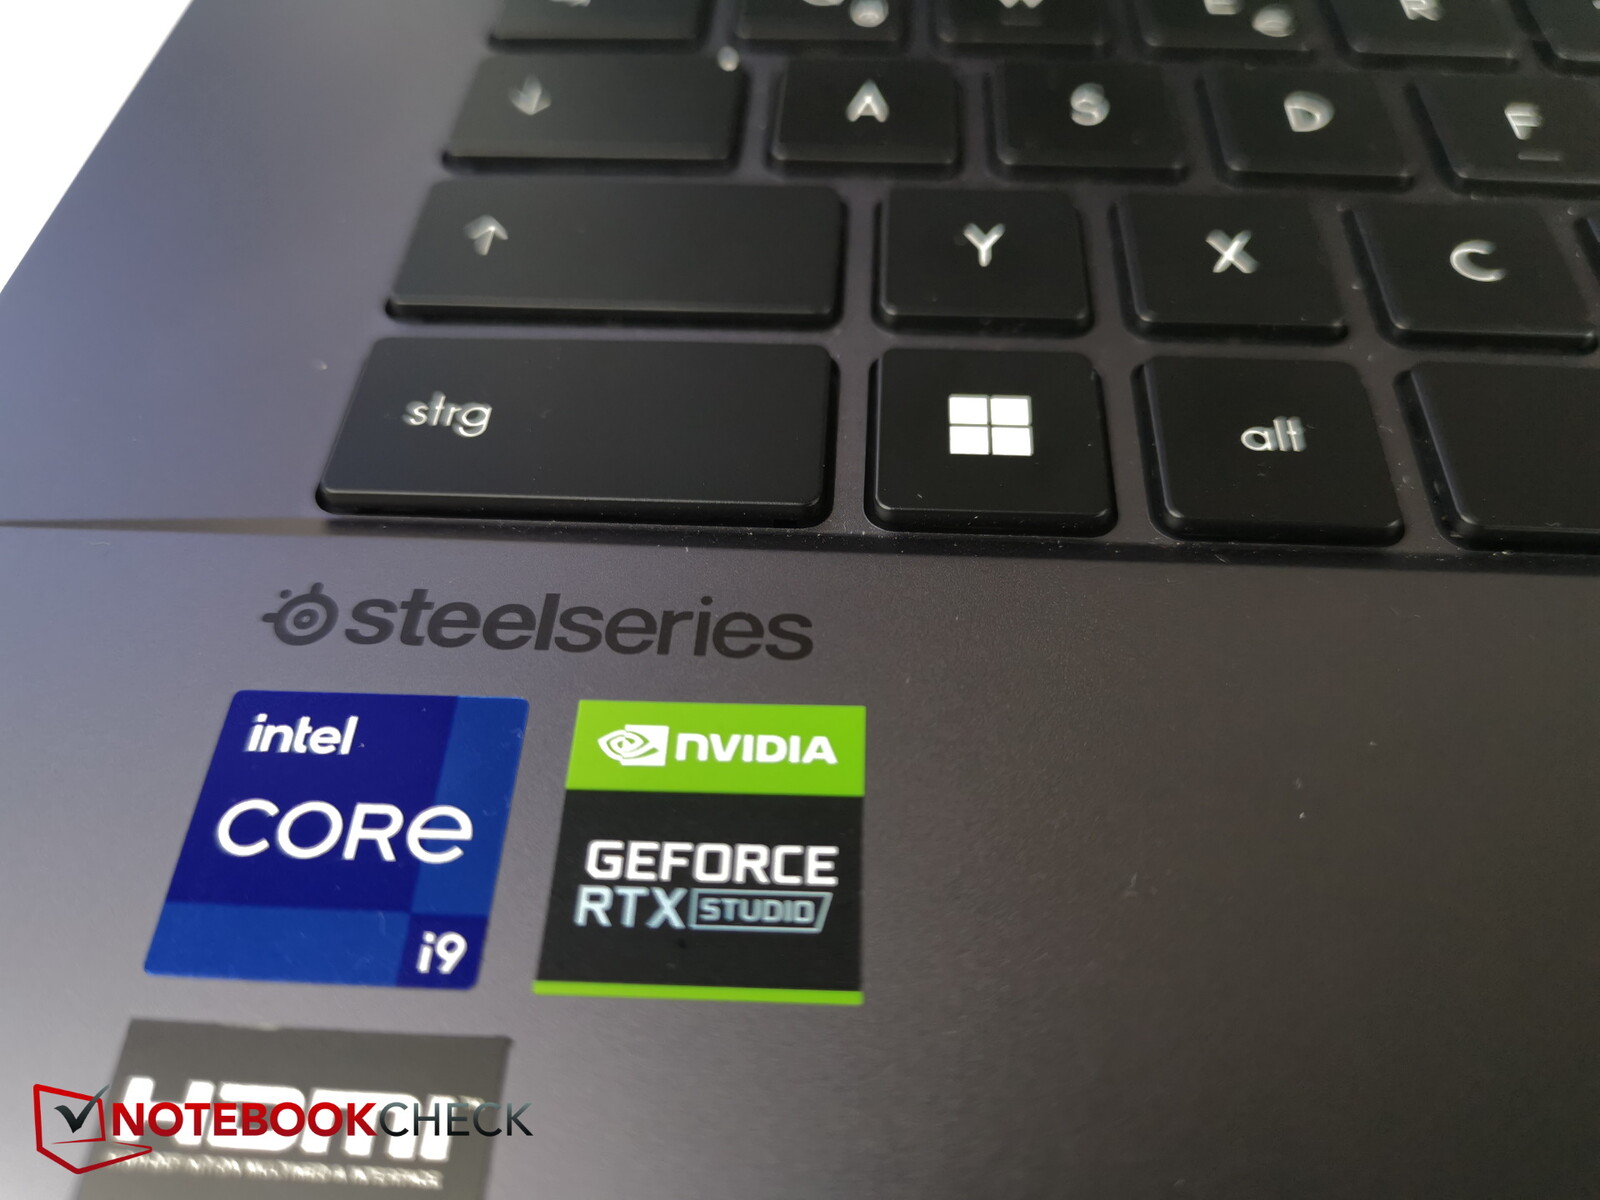
O teclado tem iluminação RGB individual para uso em ambientes de baixa luminosidade. Há quatro níveis de luminosidade para escolher, e a iluminação pode, naturalmente, ser desligada.
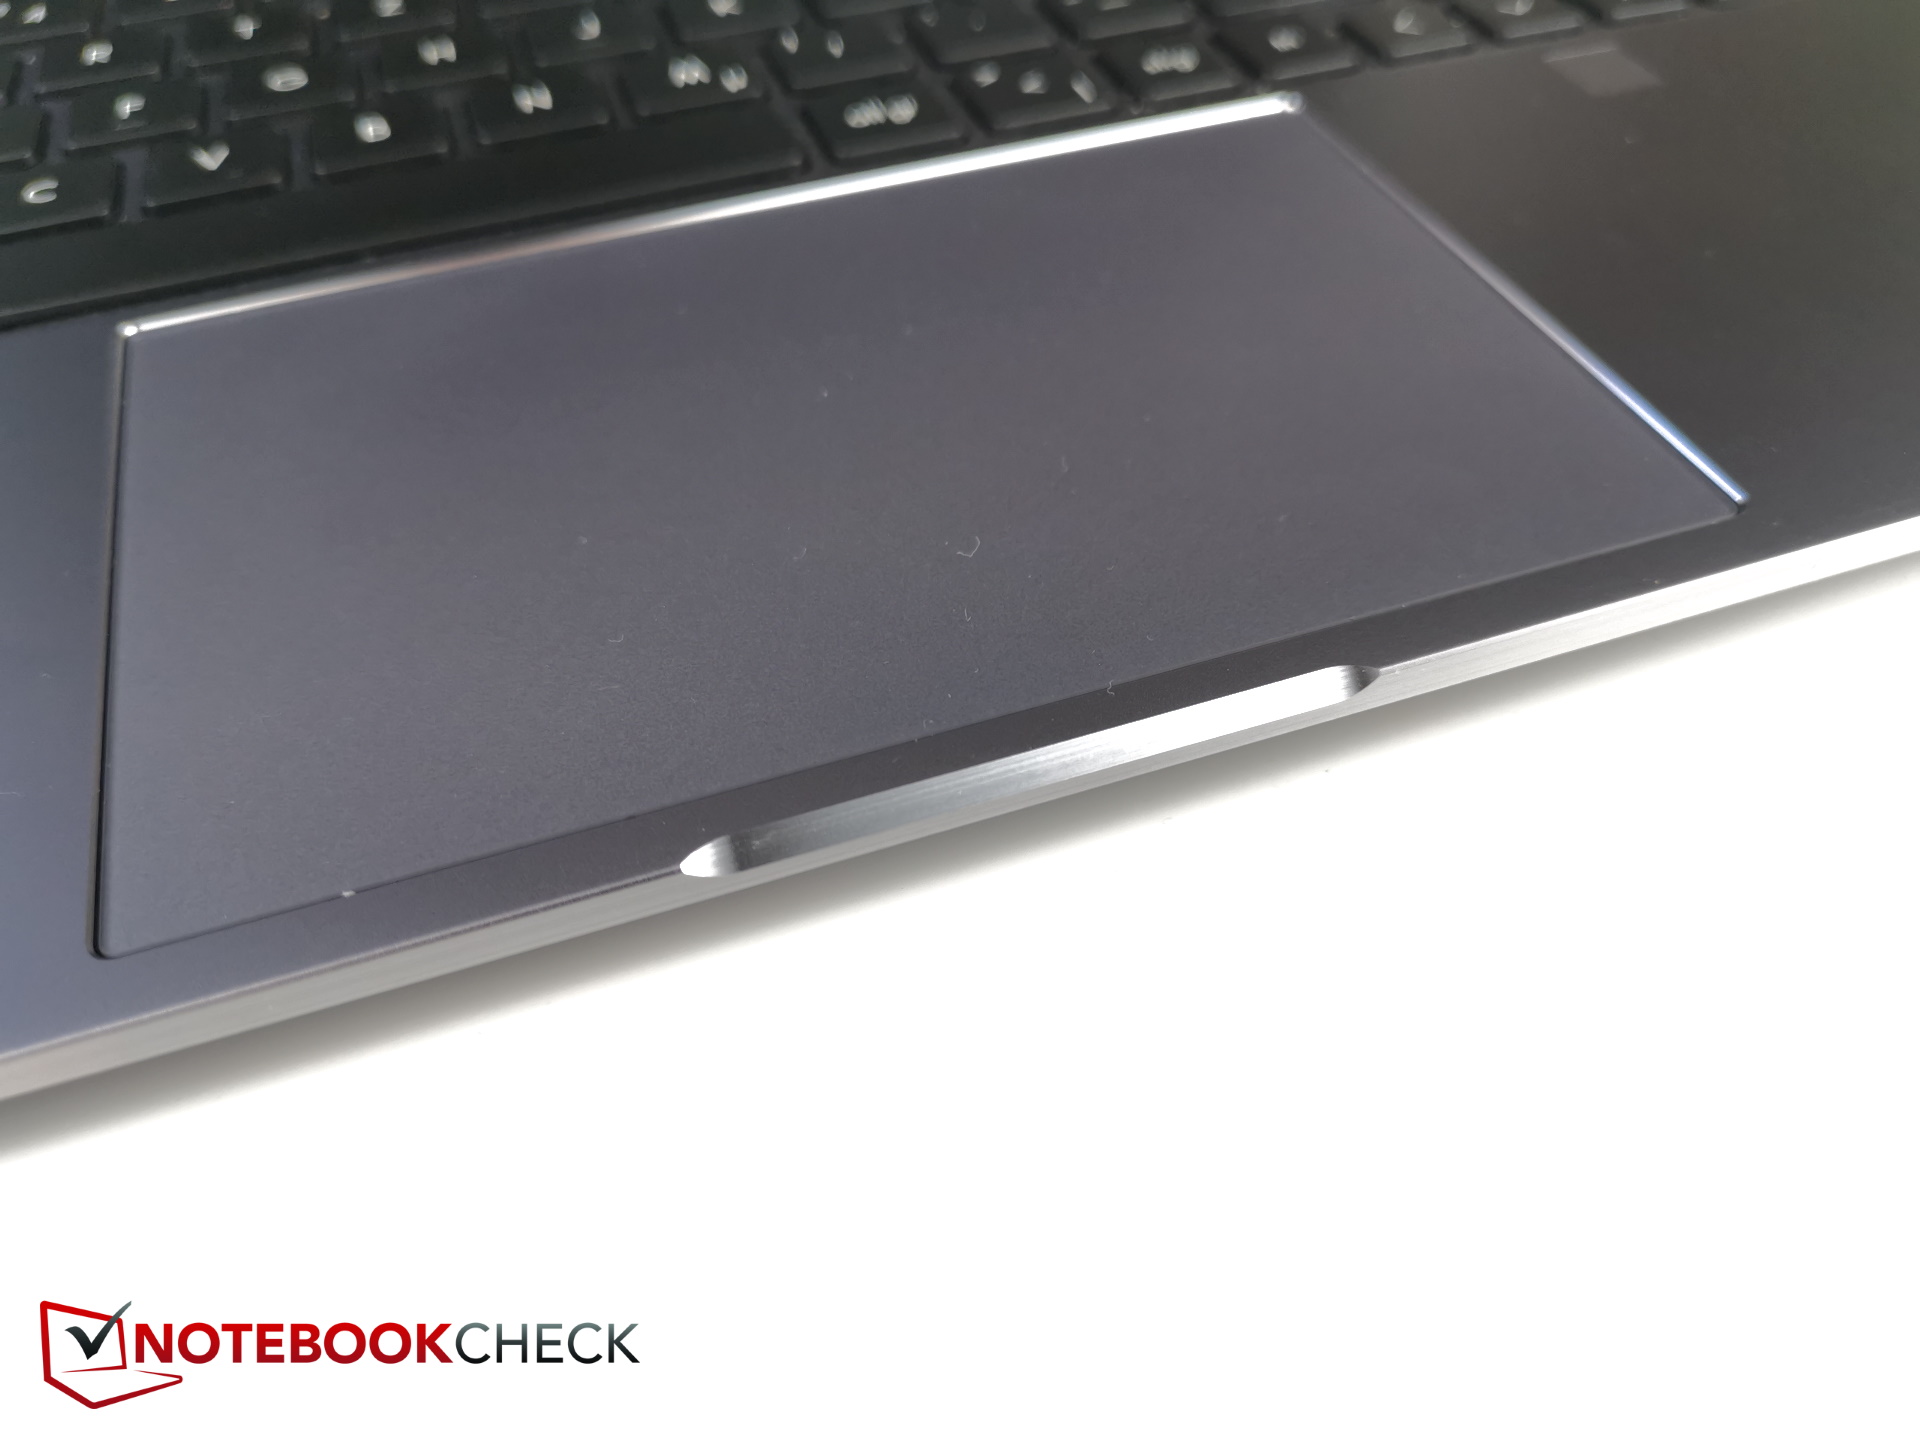
Touchpad
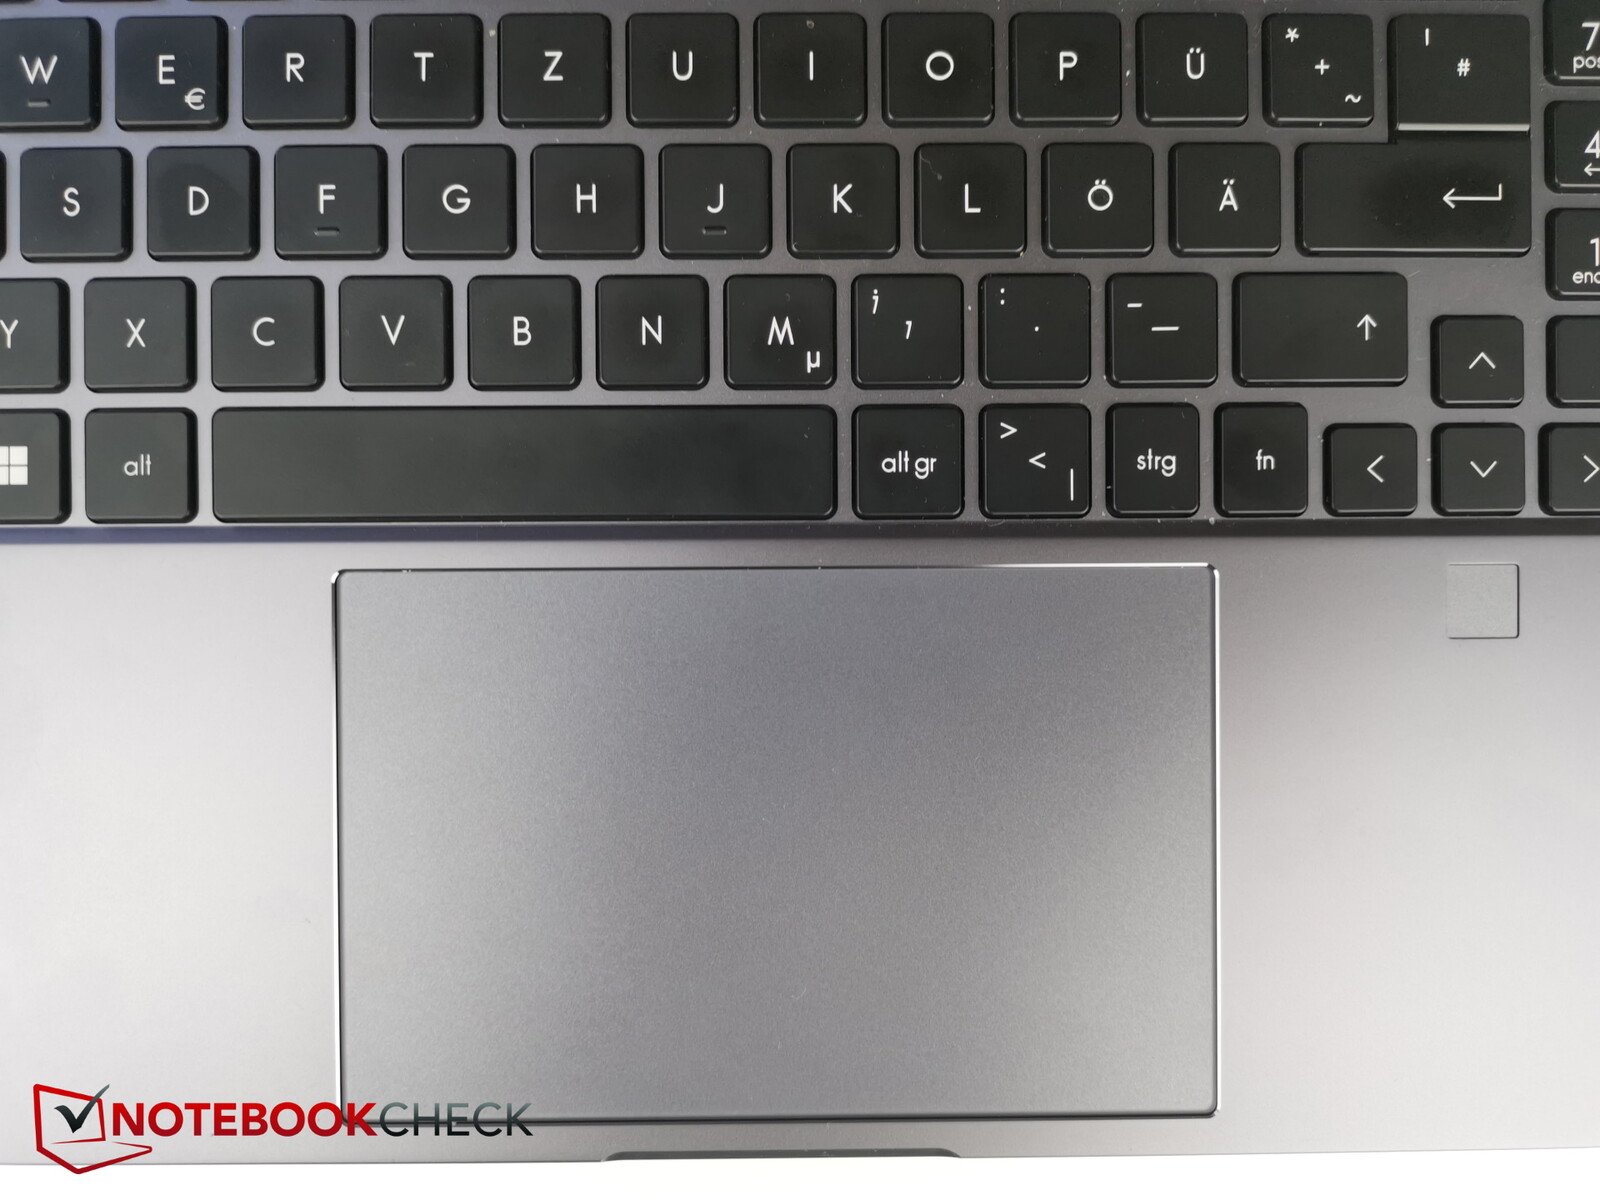
A primeira coisa que você notará sobre o touchpad é como ele é espaçoso (aprox. 13,1 x 8,2 cm, ou 5,16 x 3,23"). A superfície é soberbamente lisa e não se sente nada agarrada, mesmo quando você desliza seus dedos muito lentamente.
Os botões integrados têm um ponto de pressão distinto. A quantidade de força necessária para apertar os botões é simplesmente certa, ou talvez um pouco maior do que o necessário. O som de clique do touchpad é muito razoável.
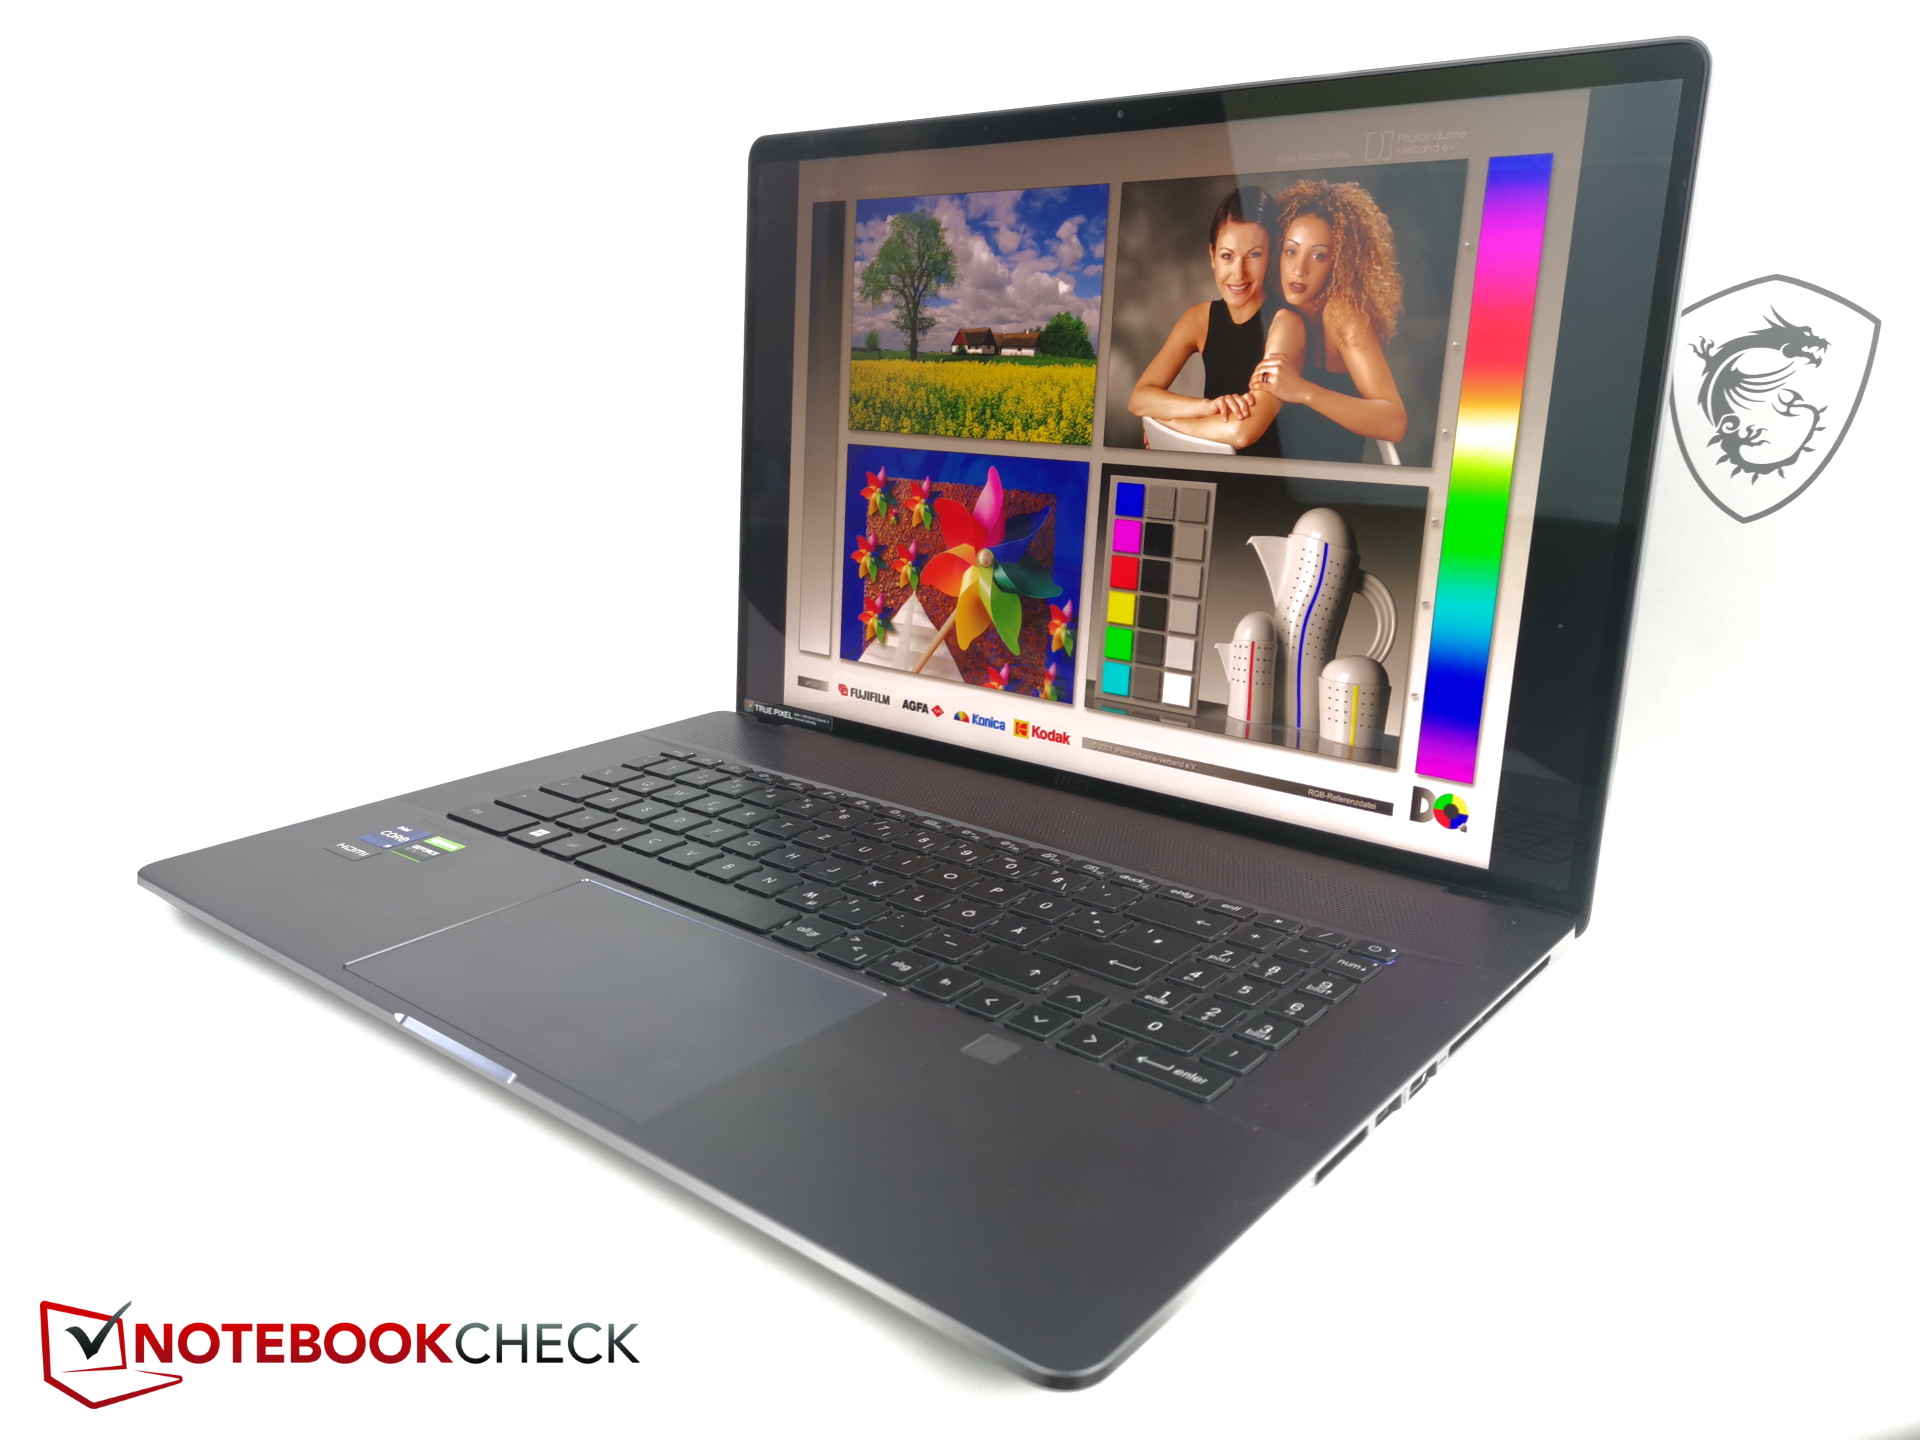
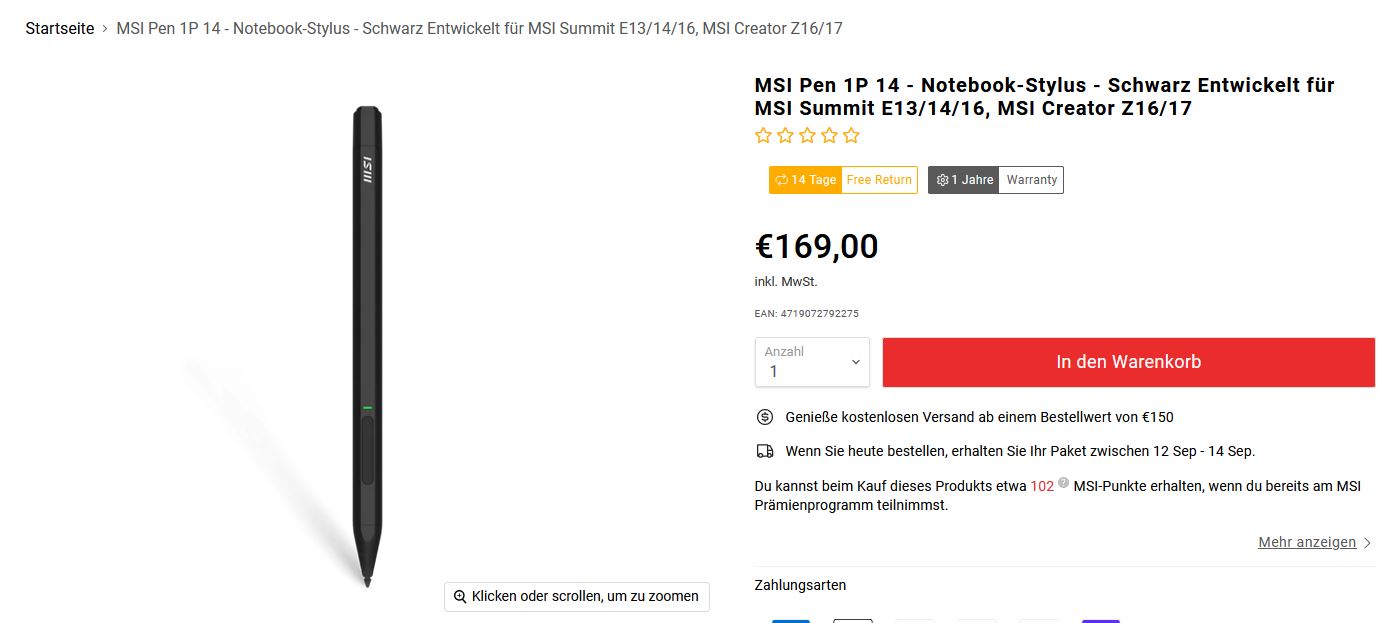
Tela sensível ao toque
As entradas por toque são registradas sem atrasos perceptíveis, resultando em uma tela sensível ao toque que é realmente fácil de usar. O MSI Creator Z17 também suporta entradas de caneta, mas infelizmente não está incluído um estilete, apesar do alto preço do produto. Por si só, a caneta MSI custa 169 euros (US$99 no Amazon.com). O uso da tela sensível ao toque com os dedos tende a deixar marcas desagradáveis.
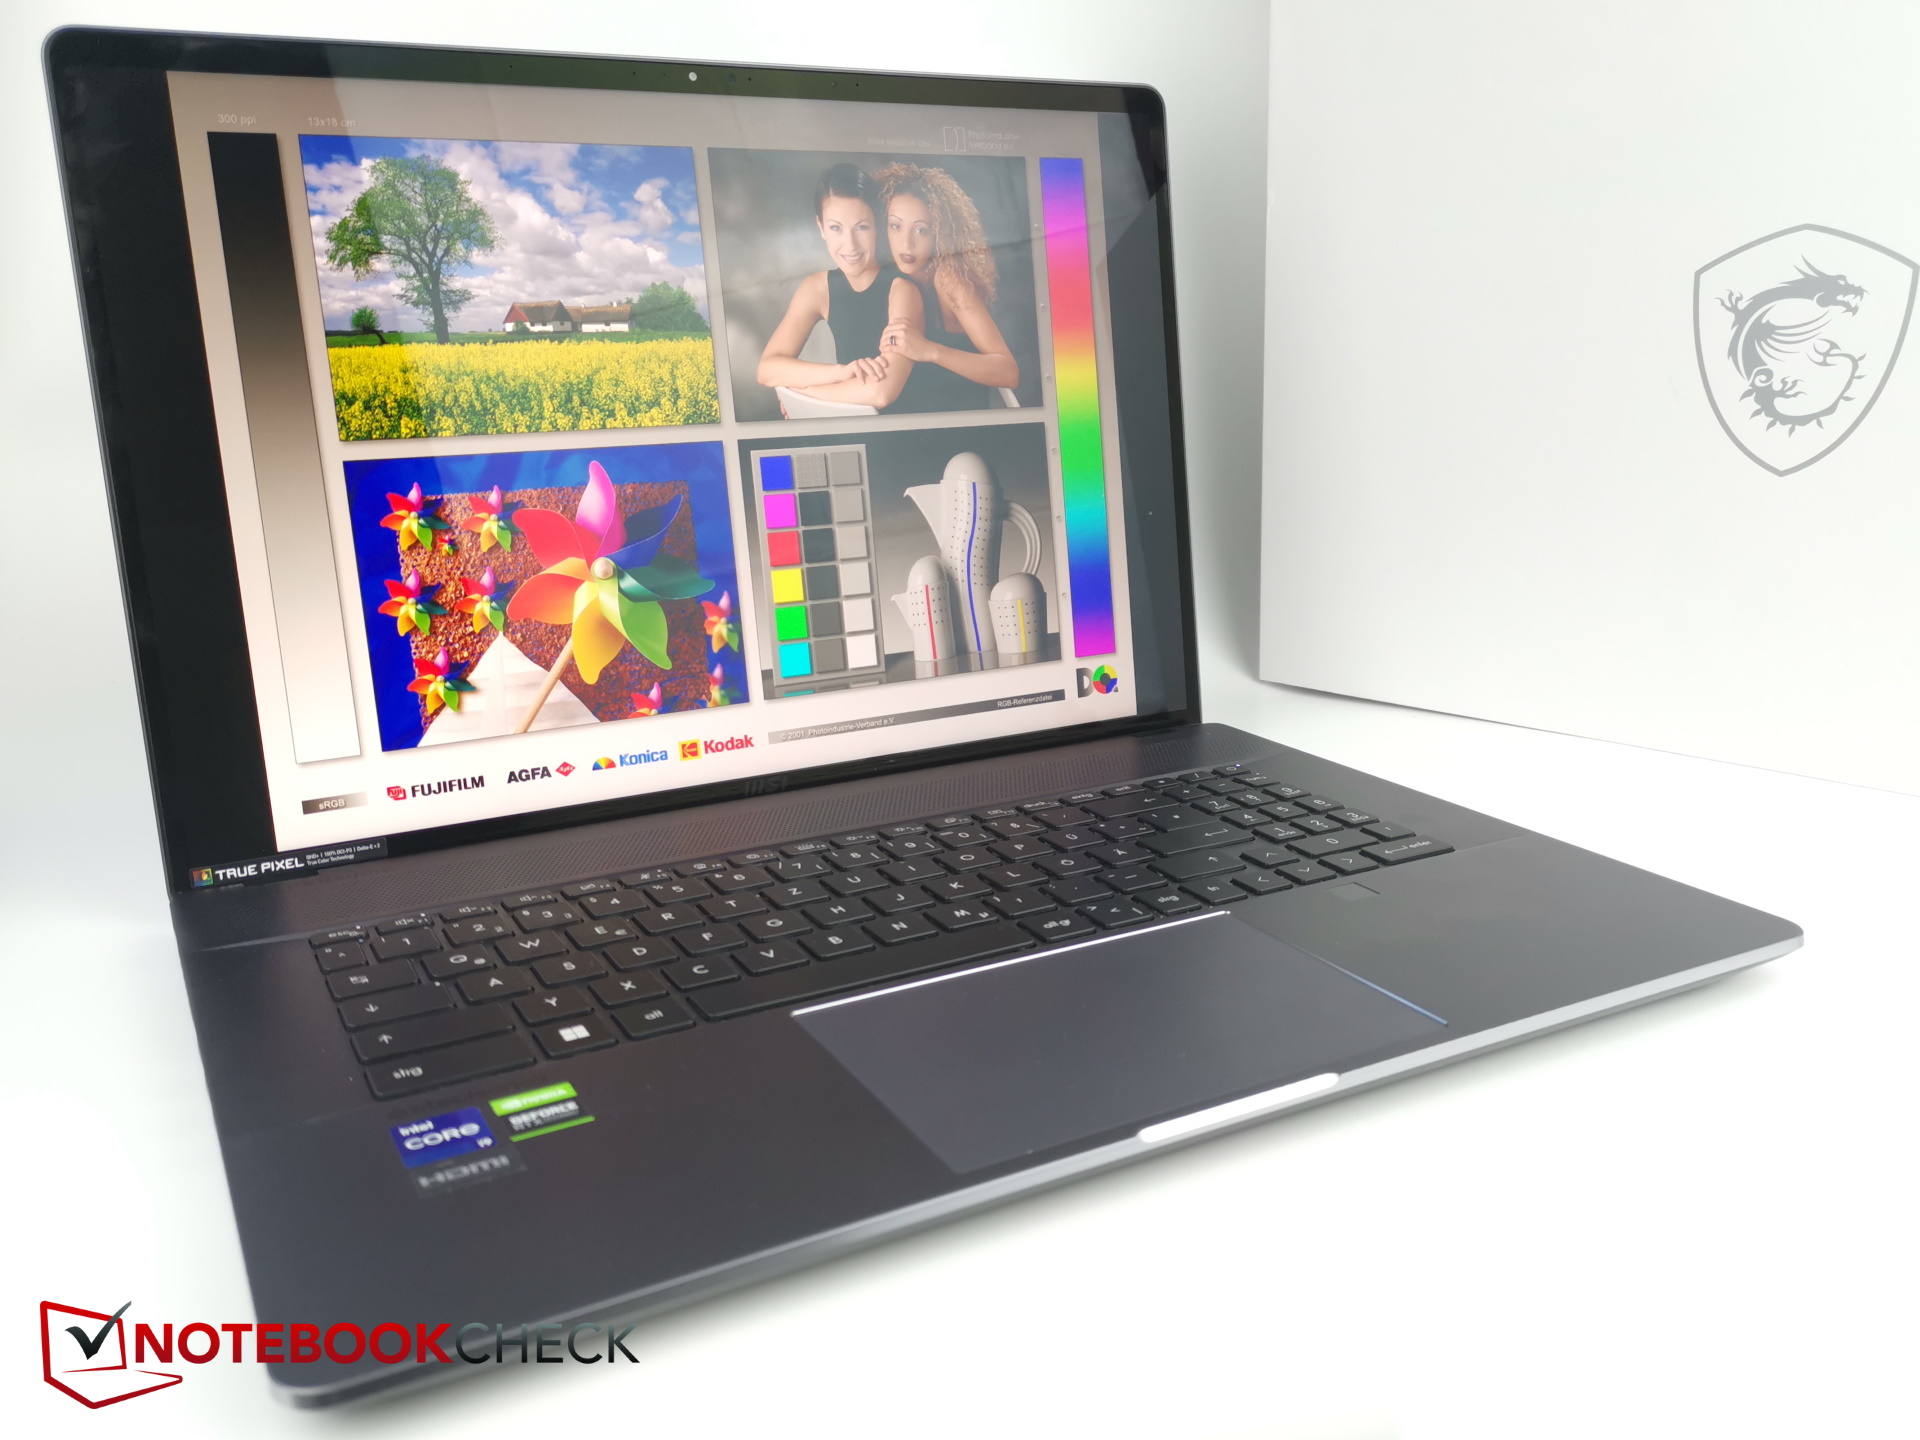
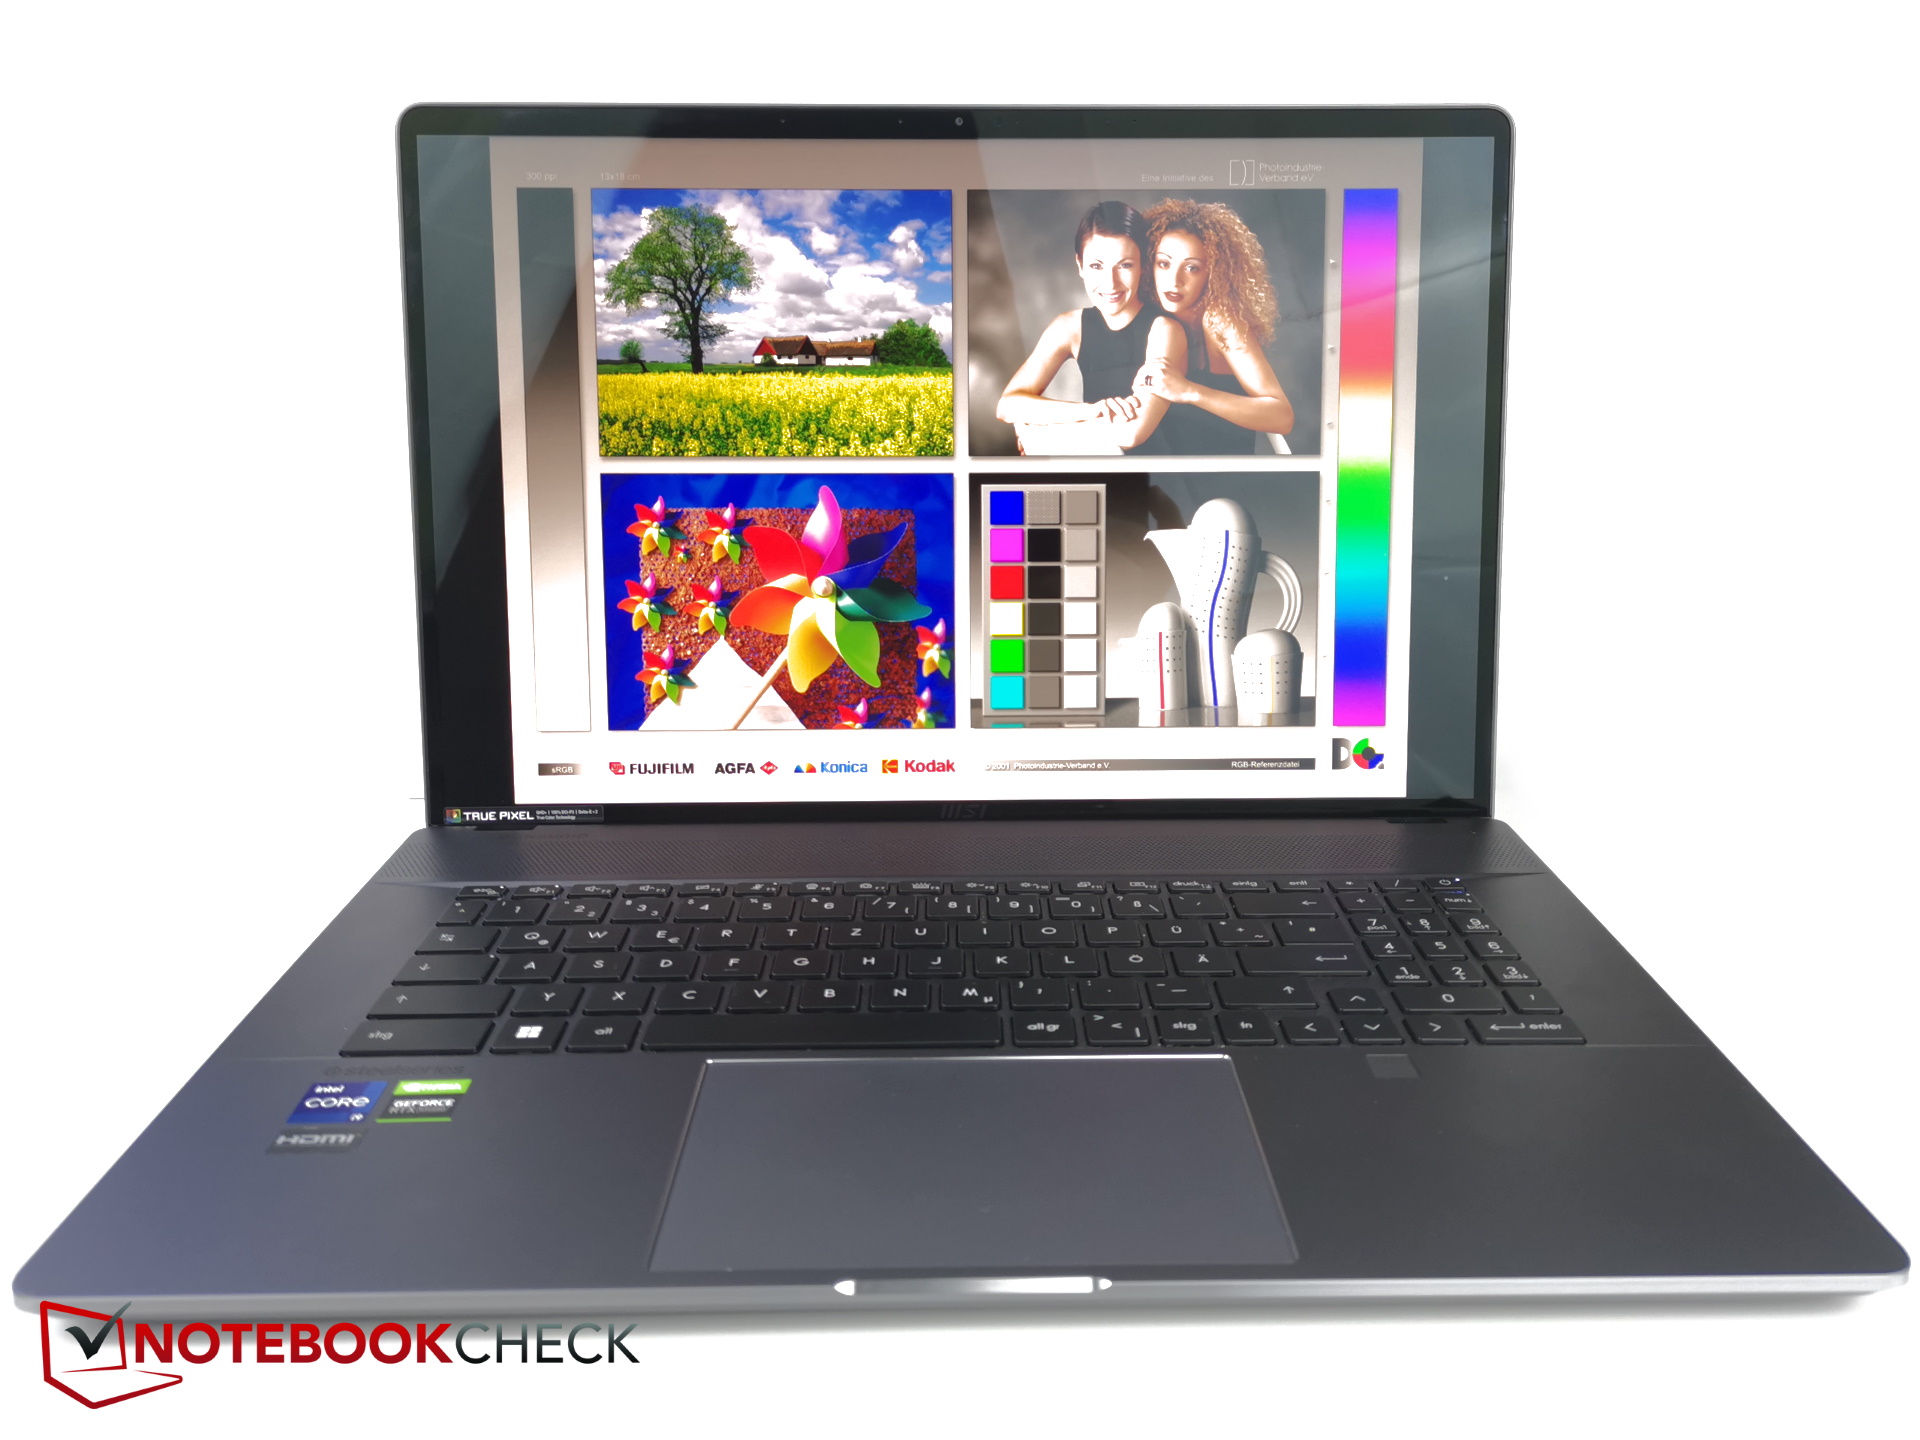
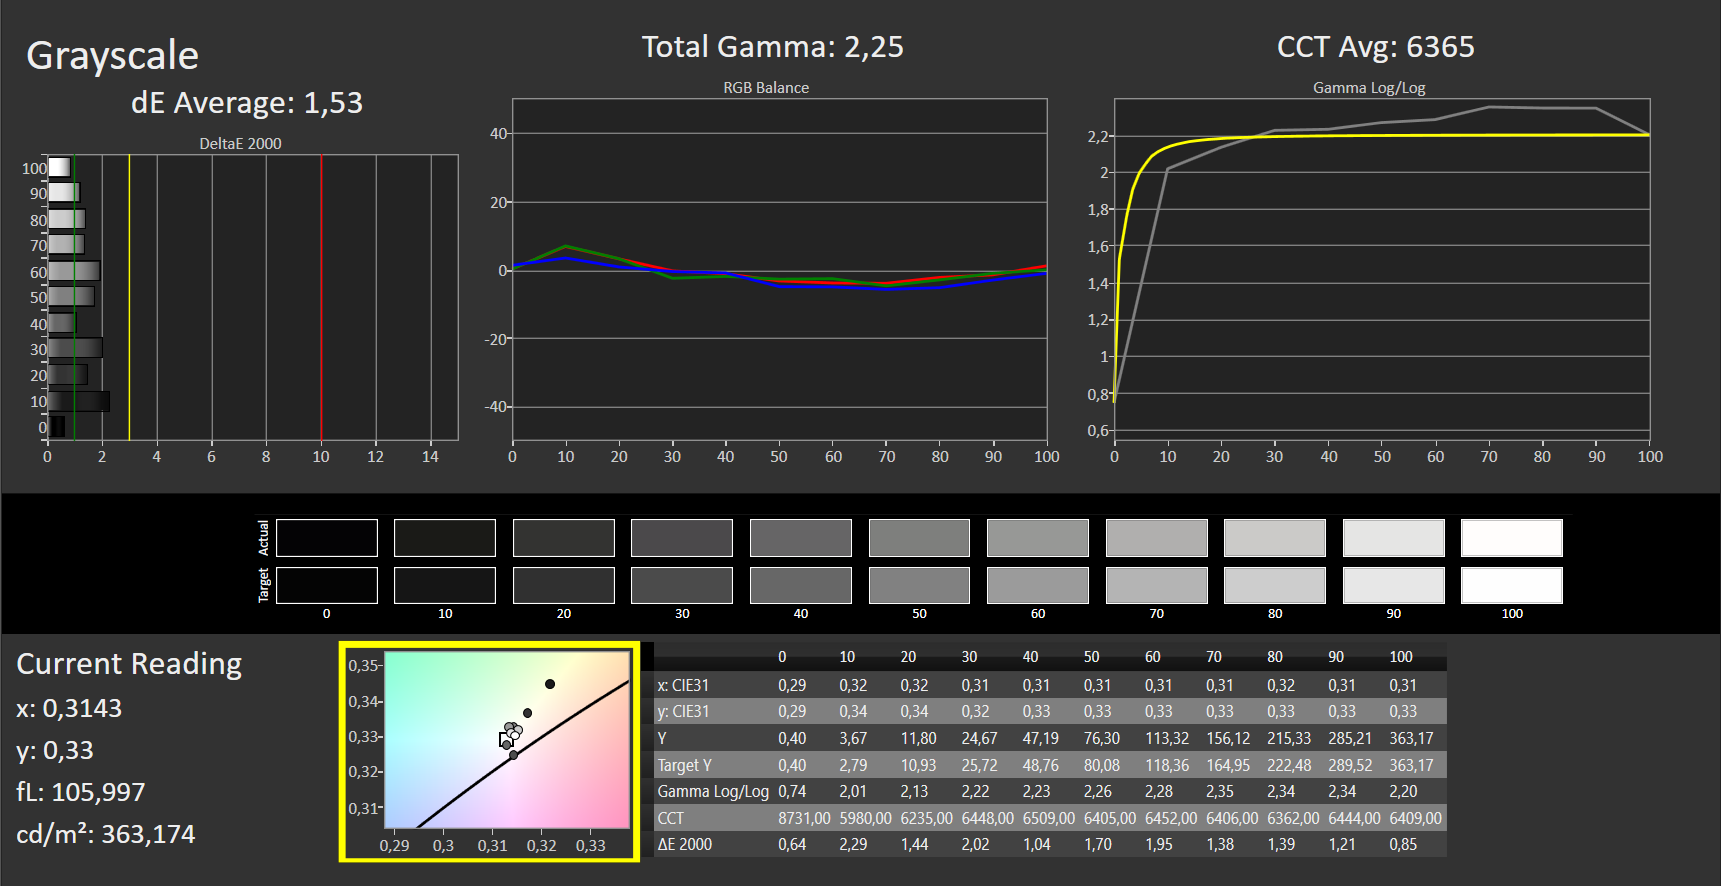
Visor - Tela sensível ao toque brilhante com visor completo P3
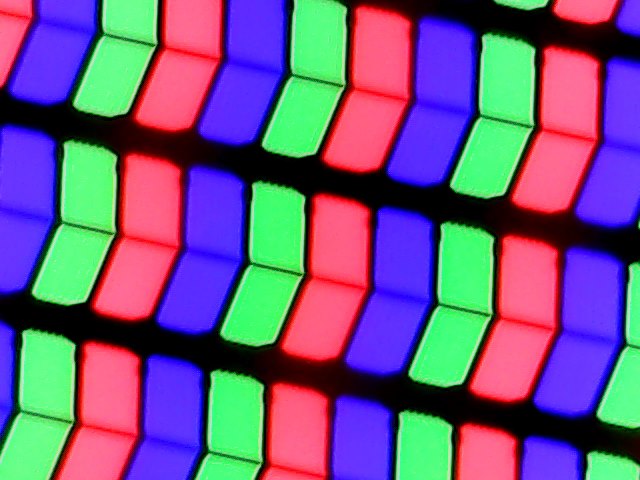
A MSI foi com uma tela sensível ao toque brilhante de 17 polegadas para o laptop. É um painel IPS de 165 Hz com uma resolução de 2.560 x 1.600 (ou seja, 16:10 aspect ratio).
A tela é capaz de fornecer um brilho de pico bastante alto de 400 lêndeas. E também é considerado bem iluminado com uma distribuição de brilho de 88 por cento. O nível de preto e o contraste são ligeiramente decepcionantes em relação aos valores que medimos. Com base em nossas impressões subjetivas, porém, as cores parecem muito vivas devido à superfície lustrosa.
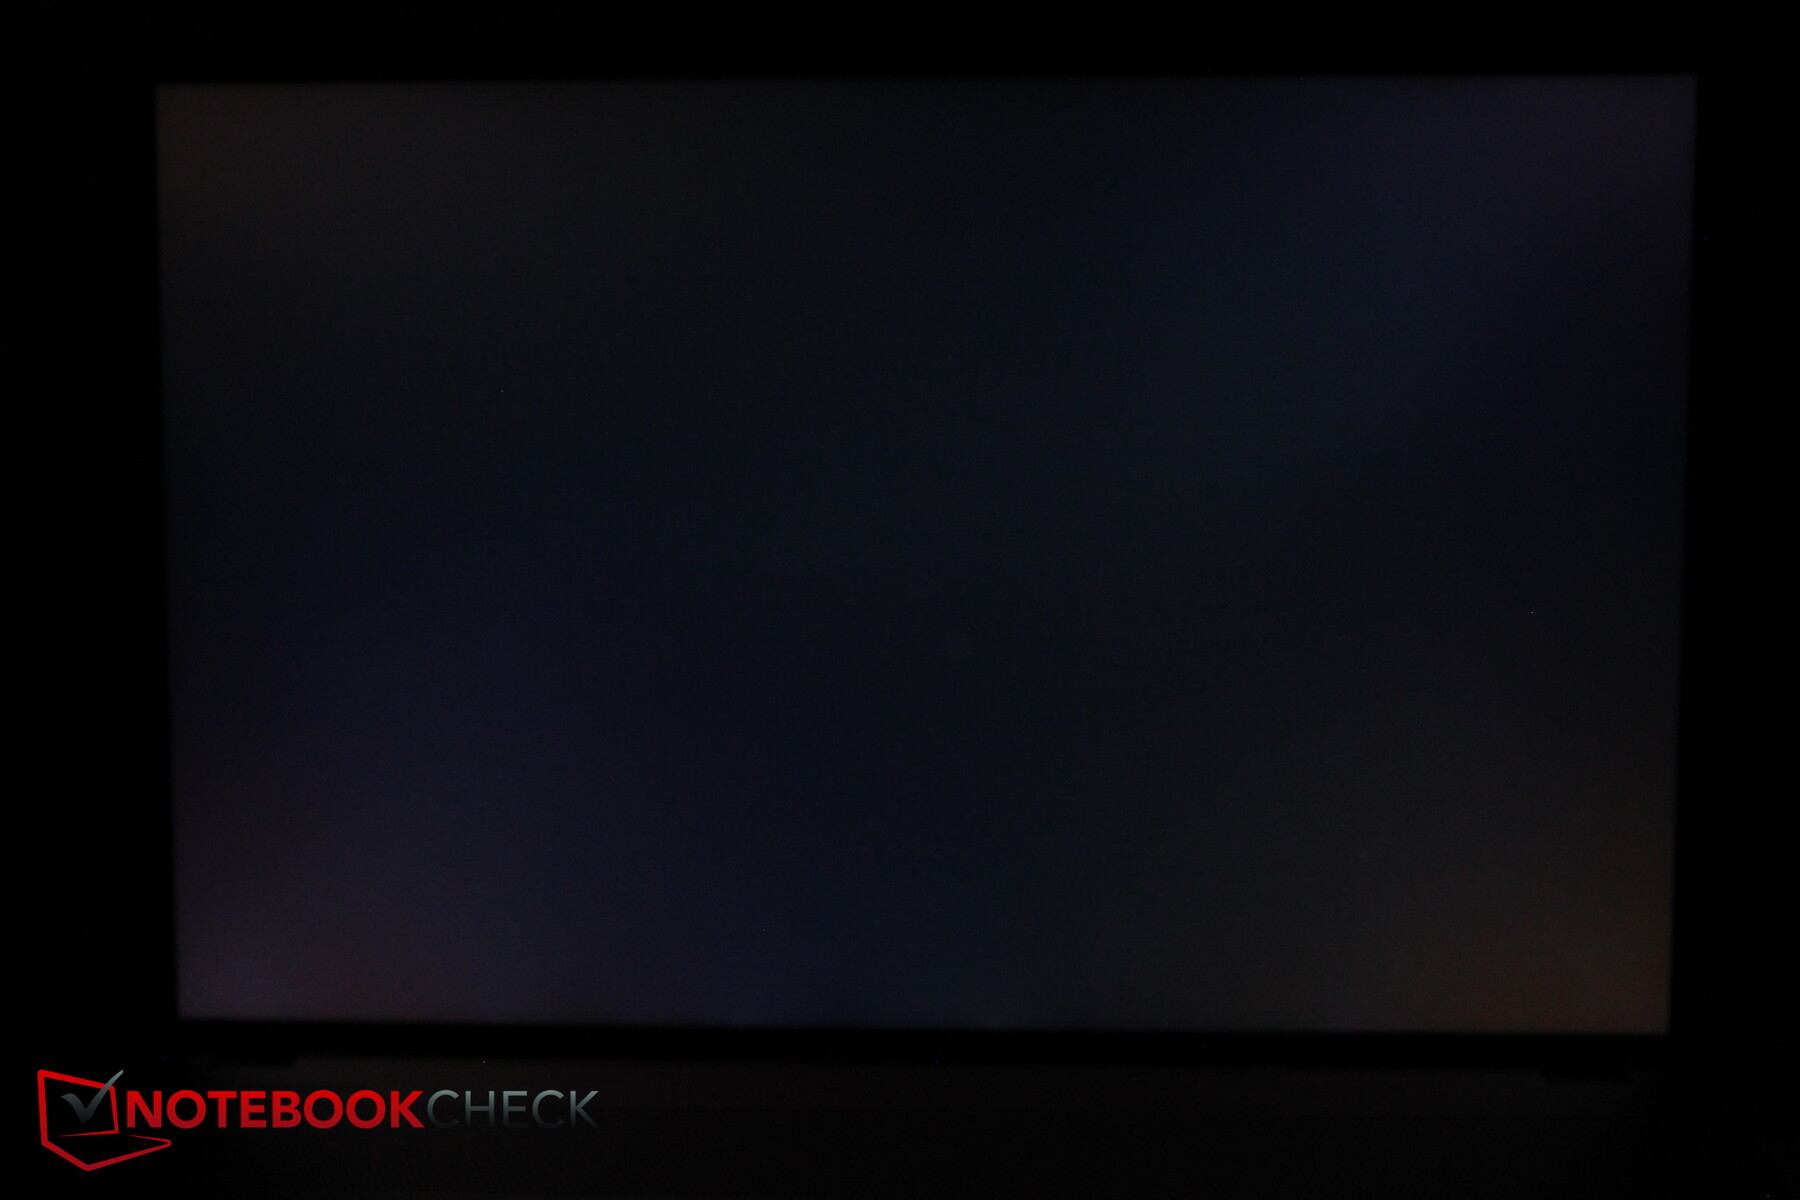
Os gamers também ficarão satisfeitos com os tempos de resposta extremamente rápidos. O sangramento da tela só é minimamente visível ao longo da borda inferior da tela em ambientes muito escuros.
| |||||||||||||||||||||||||
iluminação: 88 %
iluminação com acumulador: 444 cd/m²
Contraste: 634:1 (Preto: 0.7 cd/m²)
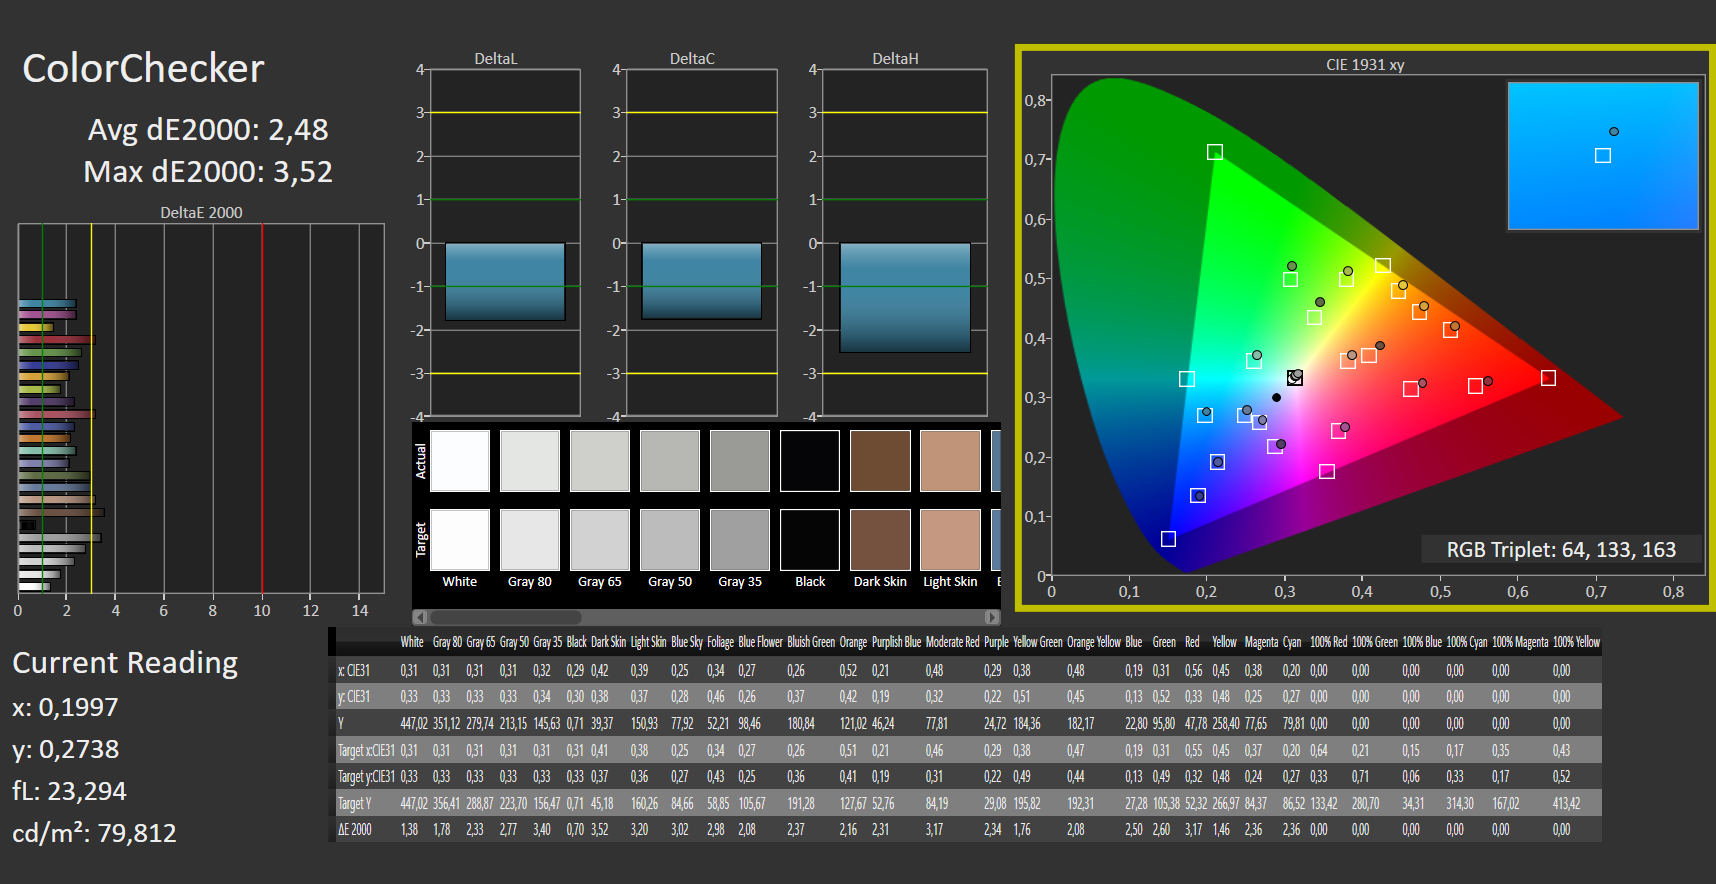
ΔE ColorChecker Calman: 2.48 | ∀{0.5-29.43 Ø4.71}
calibrated: 2.91
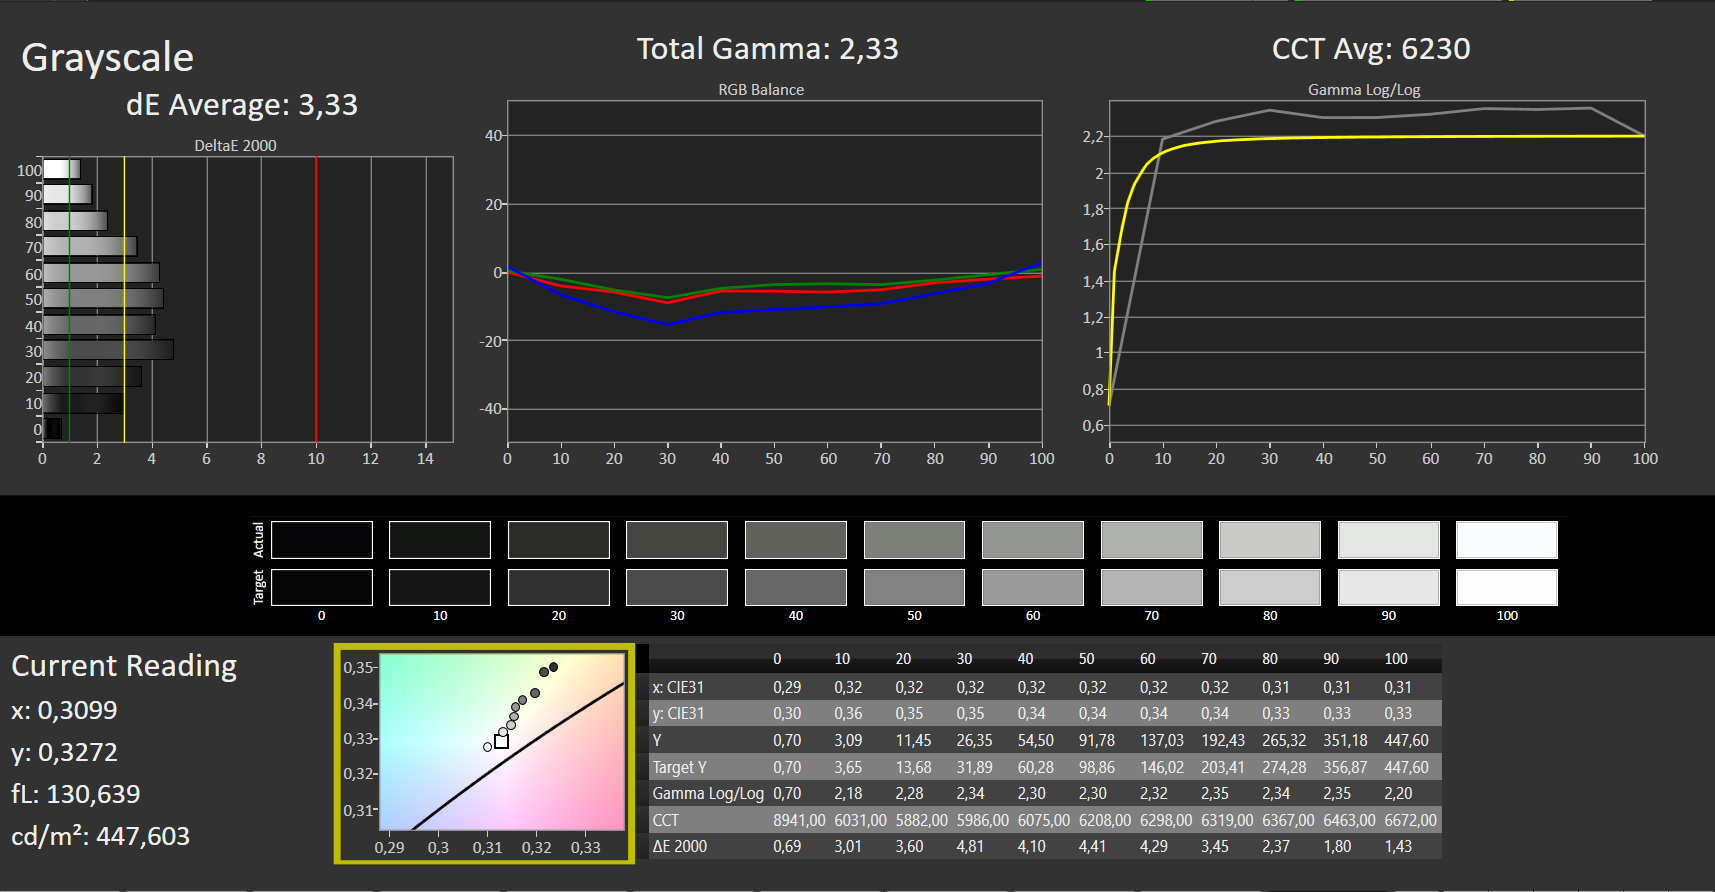
ΔE Greyscale Calman: 3.33 | ∀{0.09-98 Ø4.96}
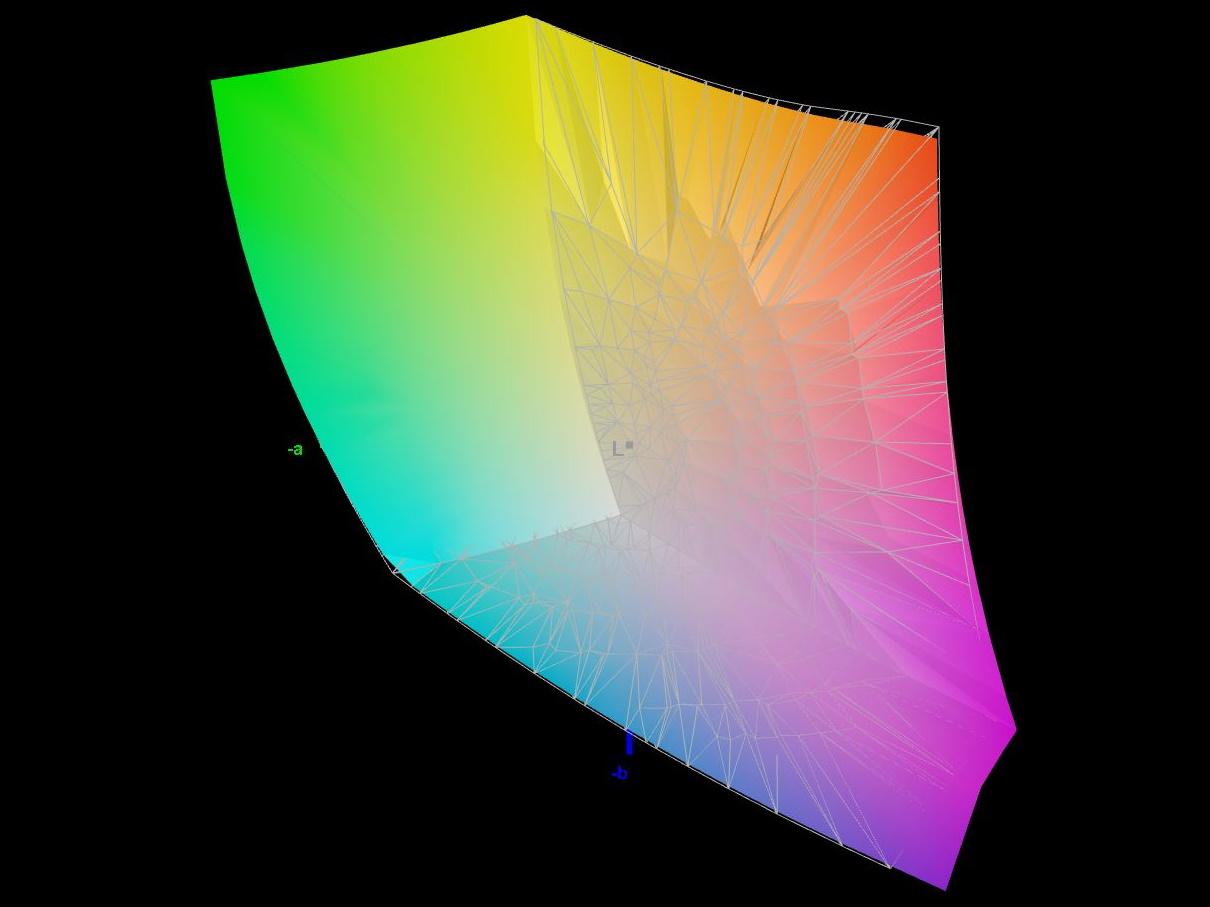
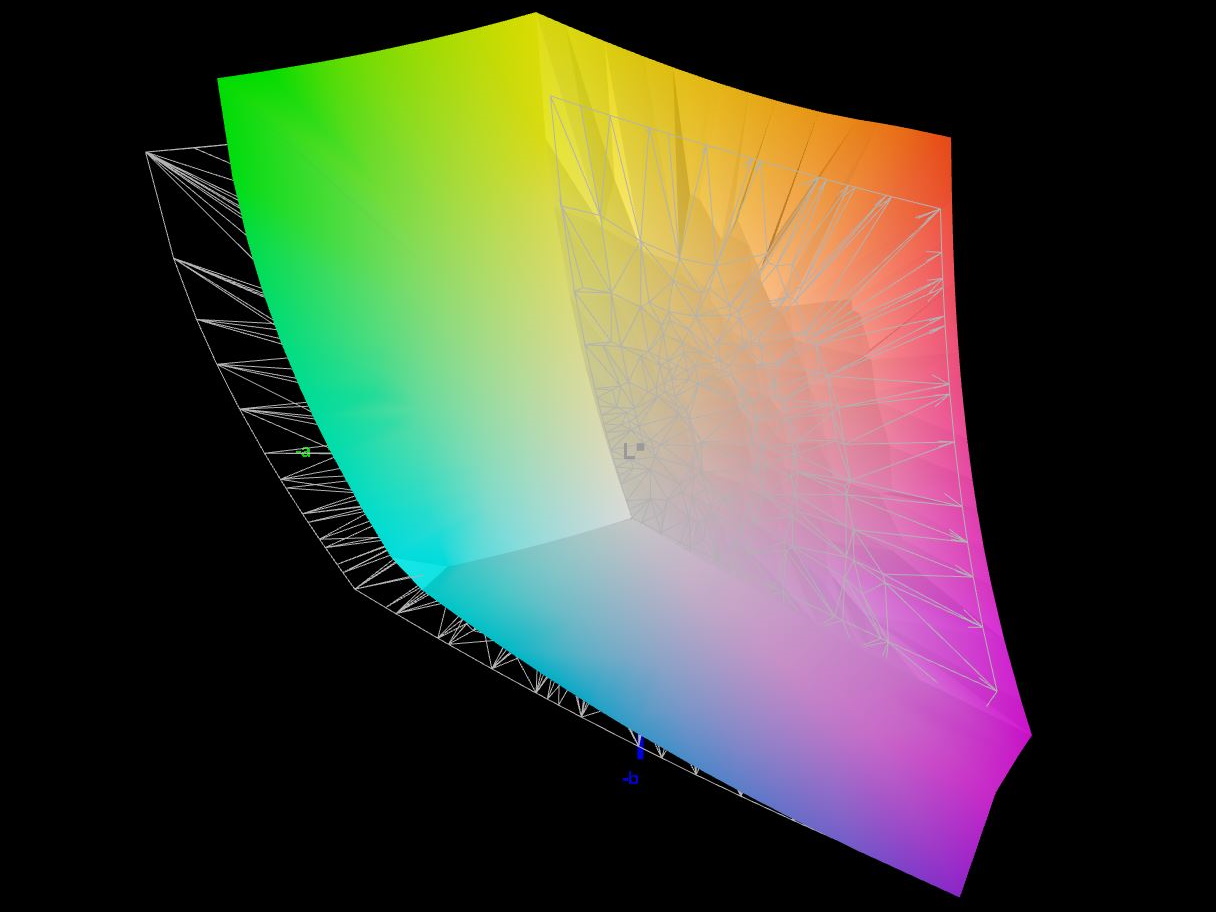
86.4% AdobeRGB 1998 (Argyll 3D)
99.9% sRGB (Argyll 3D)
98.9% Display P3 (Argyll 3D)
Gamma: 2.33
CCT: 6230 K
| MSI Creator Z17 A12UGST-054 AUO3C9B (B170QAN01.0), IPS, 2560x1600, 17" | MSI Creator 17 A10SGS B173ZAN05.0 (AUO278E), Mini-LED IPS-Level, 3840x2160, 17.3" | MSI Creator Z16P B12UHST AUOD298, IPS True Pixel (~100% DCI-P3), 2560x1600, 16" | Razer Blade 17 (i7-12800H, RTX 3070 Ti) BOE CQ NE173QHM-NZ1 (BOE09F9), IPS, 2560x1440, 17.3" | Aorus 17X XES Sharp SHP1563, IPS, 1920x1080, 17.3" | Dell XPS 17 9720 RTX 3060 Sharp LQ170R1, IPS, 3840x2400, 17" | |
|---|---|---|---|---|---|---|
| Display | -7% | -0% | -1% | -15% | -2% | |
| Display P3 Coverage (%) | 98.9 | 82 -17% | 97.6 -1% | 97.9 -1% | 70.1 -29% | 92.9 -6% |
| sRGB Coverage (%) | 99.9 | 97.5 -2% | 99.9 0% | 99.9 0% | 99.9 0% | 100 0% |
| AdobeRGB 1998 Coverage (%) | 86.4 | 84 -3% | 86.8 0% | 85.5 -1% | 71.9 -17% | 85.3 -1% |
| Response Times | -76% | -23% | -81% | 27% | -485% | |
| Response Time Grey 50% / Grey 80% * (ms) | 11 ? | 12.9 ? -17% | 15.2 ? -38% | 3.4 ? 69% | 51.2 ? -365% | |
| Response Time Black / White * (ms) | 5 ? | 8.8 ? -76% | 6.4 ? -28% | 11.2 ? -124% | 5.8 ? -16% | 35.2 ? -604% |
| PWM Frequency (Hz) | 26600 ? | |||||
| Screen | 26% | 16% | -28% | -28% | -34% | |
| Brightness middle (cd/m²) | 444 | 996 124% | 428 -4% | 341 -23% | 278 -37% | 512.7 15% |
| Brightness (cd/m²) | 415 | 952 129% | 394 -5% | 308 -26% | 273 -34% | 463 12% |
| Brightness Distribution (%) | 88 | 93 6% | 86 -2% | 82 -7% | 79 -10% | 85 -3% |
| Black Level * (cd/m²) | 0.7 | 0.68 3% | 0.42 40% | 0.45 36% | 0.26 63% | 0.32 54% |
| Contrast (:1) | 634 | 1465 131% | 1019 61% | 758 20% | 1069 69% | 1602 153% |
| Colorchecker dE 2000 * | 2.48 | 4.21 -70% | 1.67 33% | 4.16 -68% | 3.96 -60% | 5.98 -141% |
| Colorchecker dE 2000 max. * | 3.52 | 6.79 -93% | 5.71 -62% | 8.14 -131% | 10.78 -206% | 12.09 -243% |
| Colorchecker dE 2000 calibrated * | 2.91 | 2.03 30% | 0.71 76% | 3 -3% | 1.07 63% | |
| Greyscale dE 2000 * | 3.33 | 4.1 -23% | 3.1 7% | 5.09 -53% | 6.8 -104% | 7.2 -116% |
| Gamma | 2.33 94% | 2.207 100% | 2.195 100% | 2.48 89% | 2.224 99% | 2.54 87% |
| CCT | 6230 104% | 7491 87% | 6498 100% | 6884 94% | 7651 85% | 6914 94% |
| Color Space (Percent of AdobeRGB 1998) (%) | 84 | |||||
| Color Space (Percent of sRGB) (%) | 97 | |||||
| Média Total (Programa/Configurações) | -19% /
11% | -2% /
7% | -37% /
-30% | -5% /
-18% | -174% /
-96% |
* ... menor é melhor
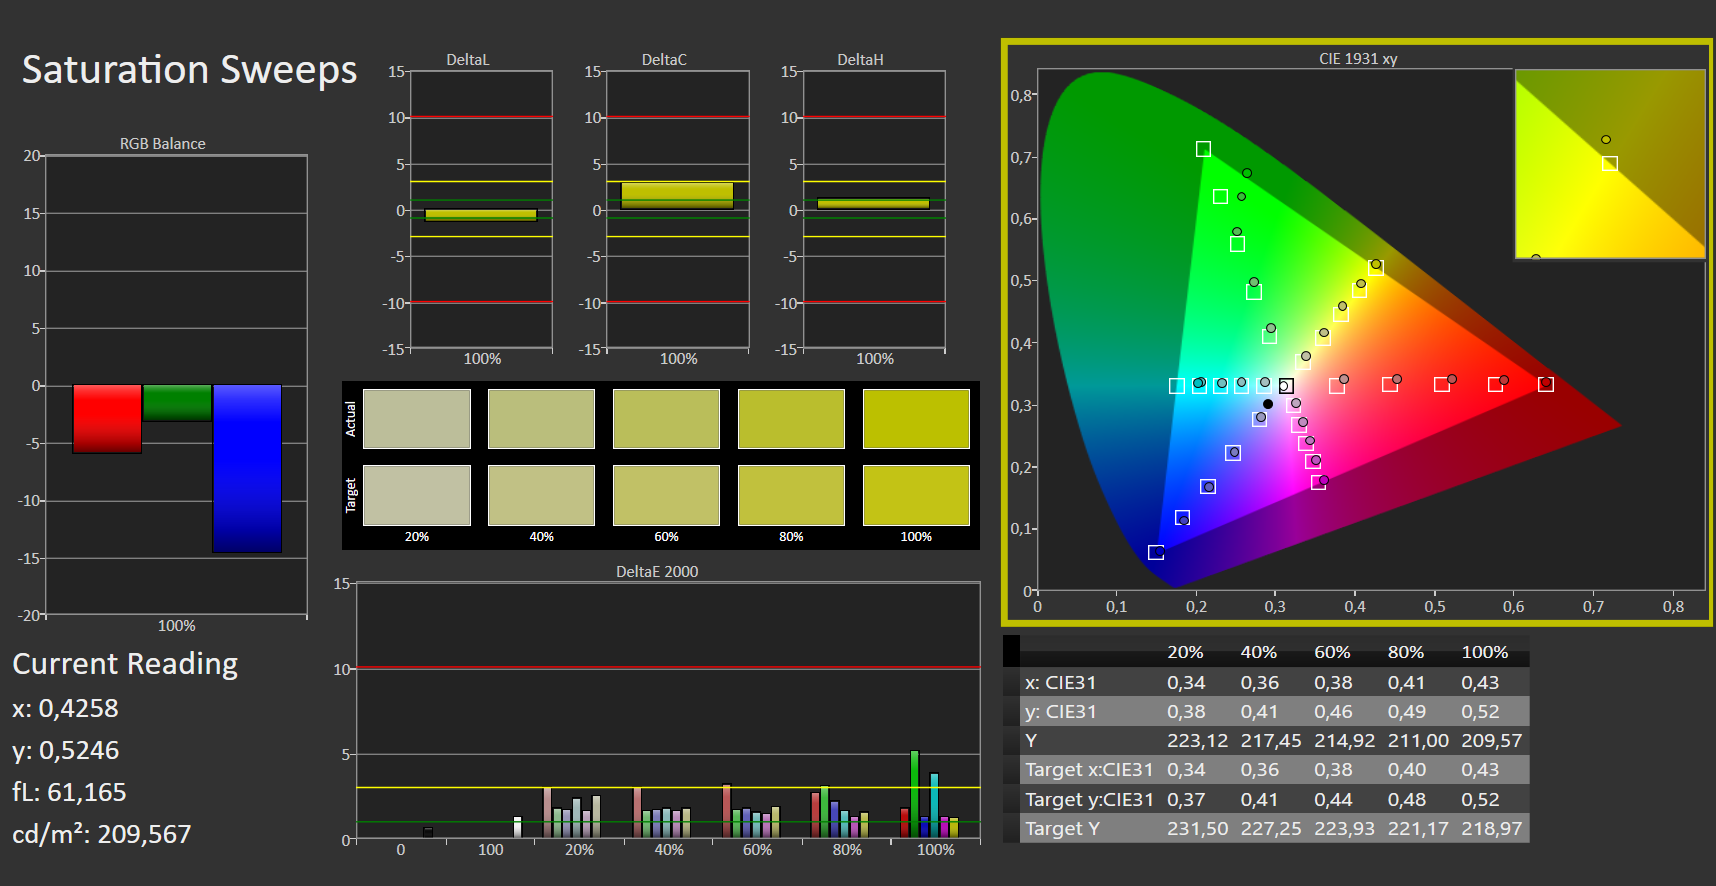
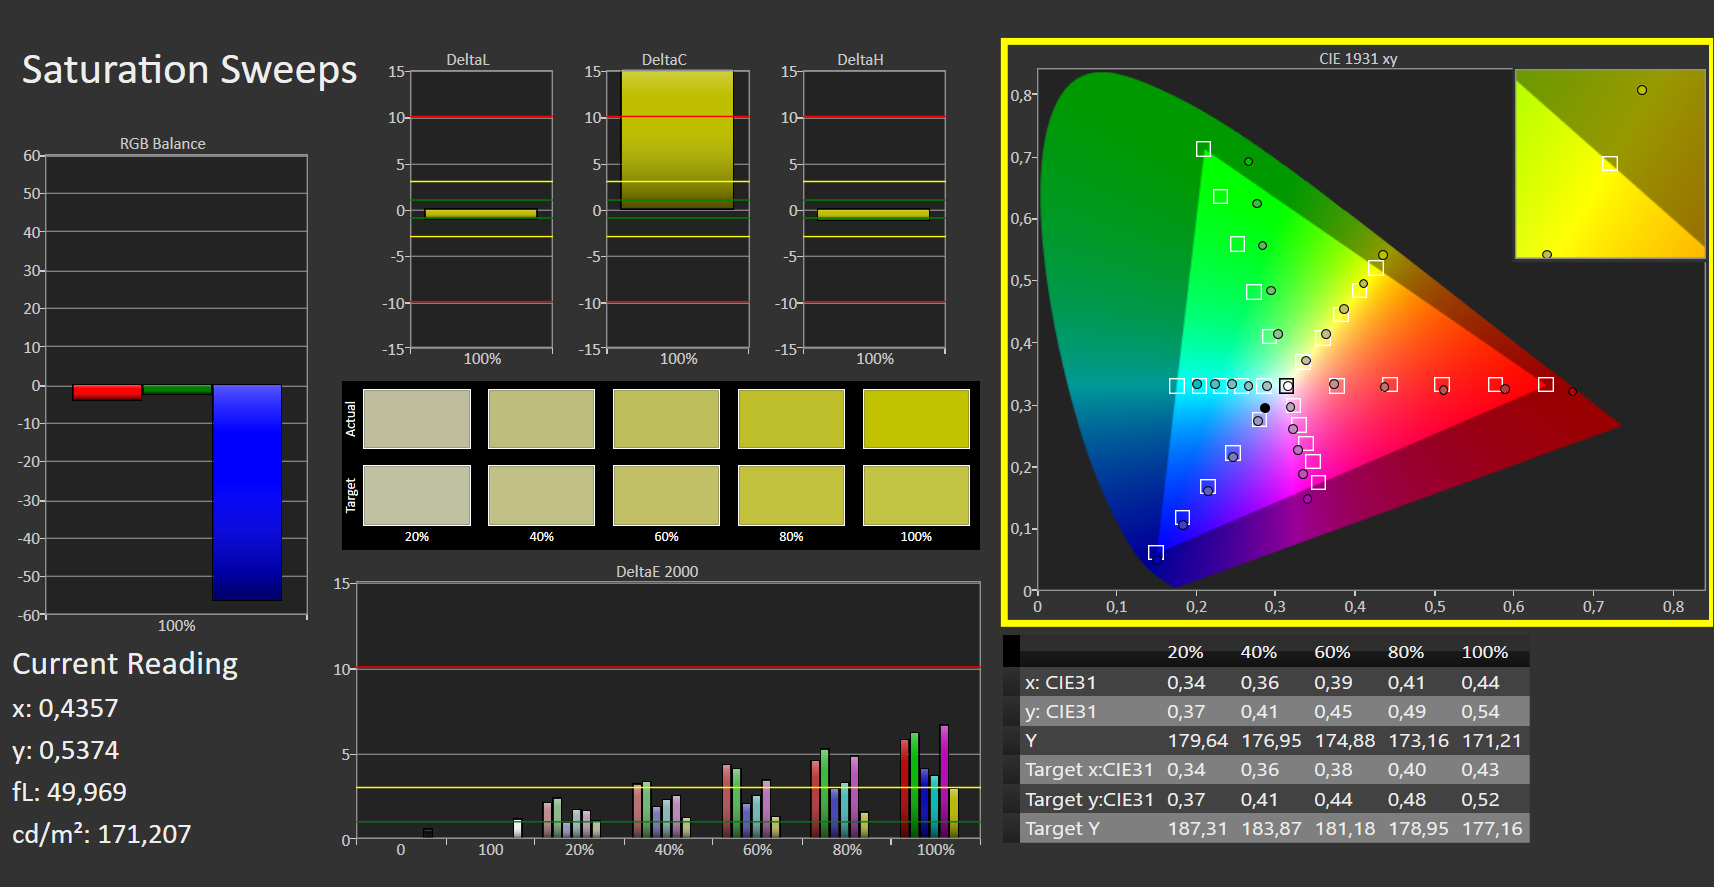
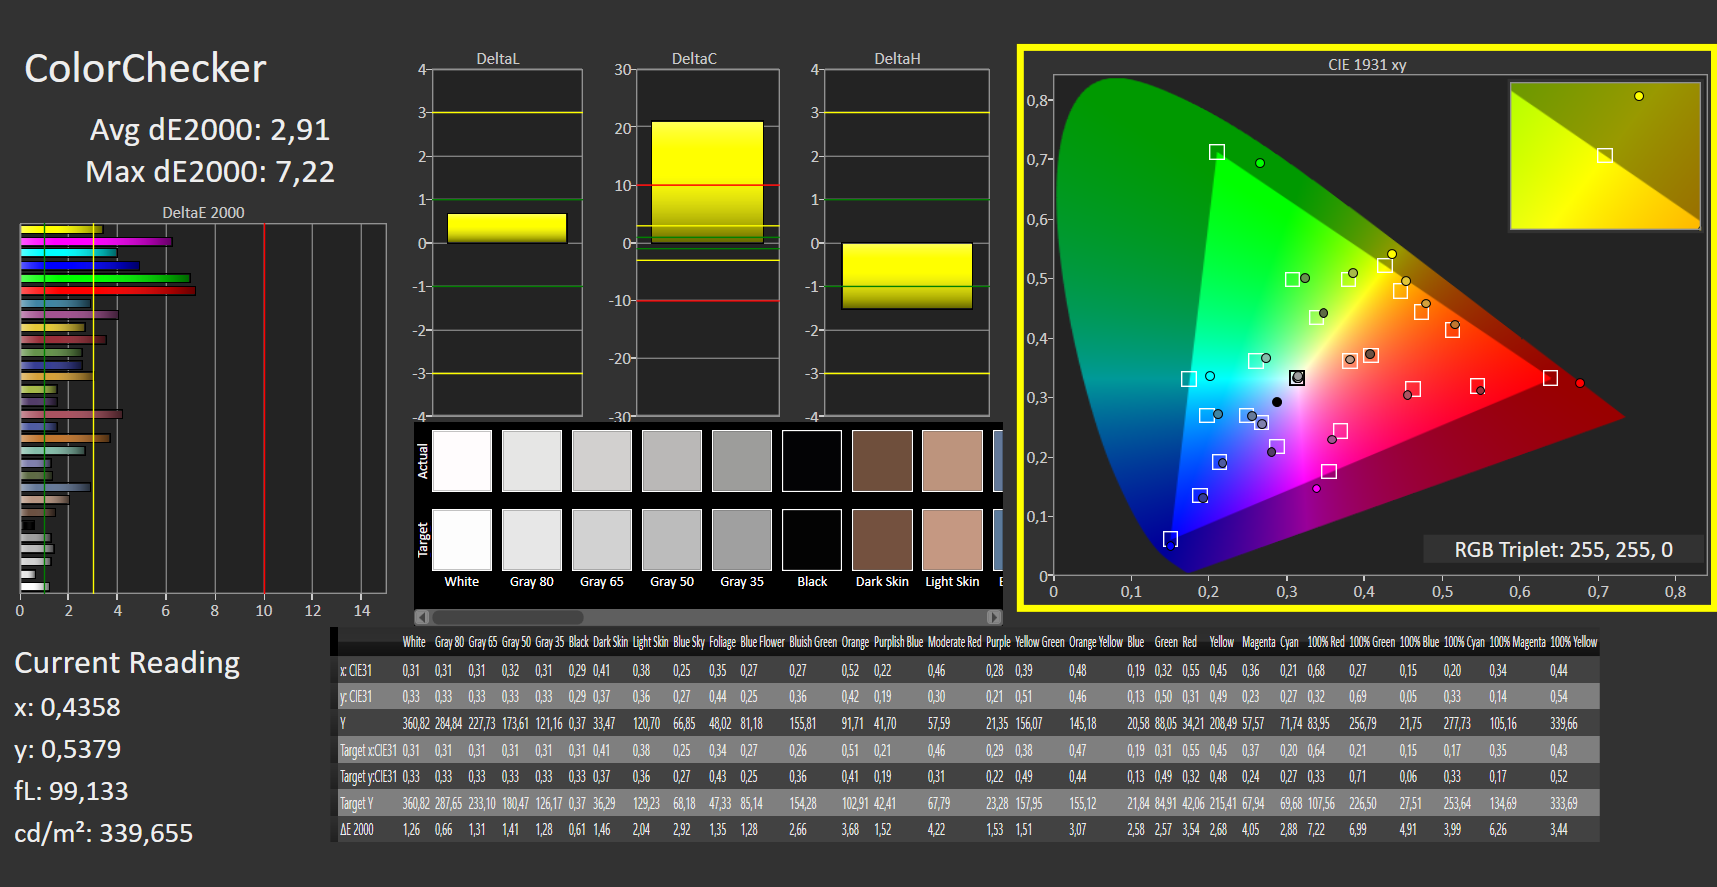
Boas notícias para os criativos: a tela tem cobertura total do Display P3 e sRGB e é capaz até de cobrir até 86% do espaço de cores do AdobeRGB.
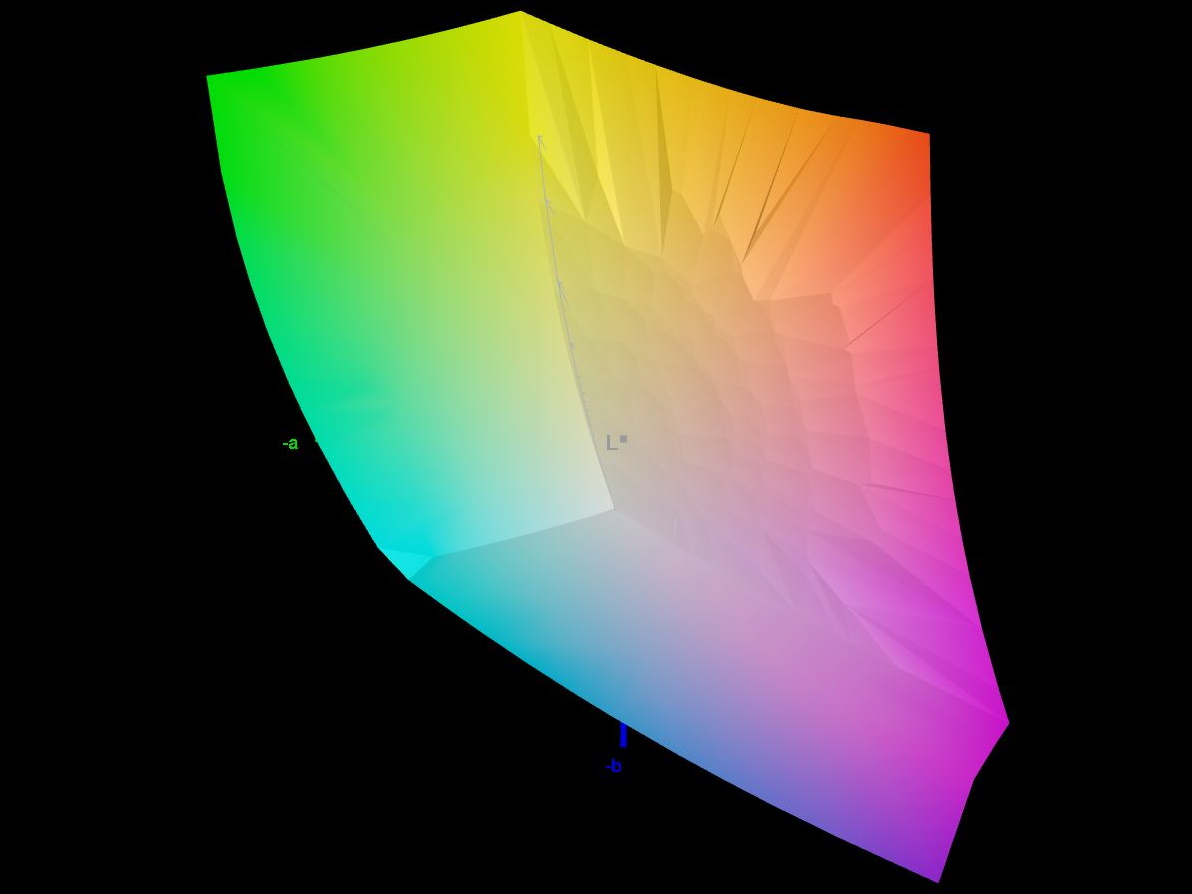
O display já está bem calibrado de fábrica. Os valores Delta E variam entre 2 e 3 para cores e tonalidades de cinza. A calibragem manual não melhorou mais os resultados.
Exibir tempos de resposta
| ↔ Tempo de resposta preto para branco | ||
|---|---|---|
| 5 ms ... ascensão ↗ e queda ↘ combinadas | ↗ 2 ms ascensão |  |
| ↘ 3 ms queda | ||
| A tela mostra taxas de resposta muito rápidas em nossos testes e deve ser muito adequada para jogos em ritmo acelerado. Em comparação, todos os dispositivos testados variam de 0.1 (mínimo) a 240 (máximo) ms. » 18 % de todos os dispositivos são melhores. Isso significa que o tempo de resposta medido é melhor que a média de todos os dispositivos testados (19.8 ms). | ||
| ↔ Tempo de resposta 50% cinza a 80% cinza | ||
| 11 ms ... ascensão ↗ e queda ↘ combinadas | ↗ 5 ms ascensão |  |
| ↘ 6 ms queda | ||
| A tela mostra boas taxas de resposta em nossos testes, mas pode ser muito lenta para jogadores competitivos. Em comparação, todos os dispositivos testados variam de 0.165 (mínimo) a 636 (máximo) ms. » 25 % de todos os dispositivos são melhores. Isso significa que o tempo de resposta medido é melhor que a média de todos os dispositivos testados (31 ms). | ||
Cintilação da tela / PWM (modulação por largura de pulso)
| Tela tremeluzindo / PWM não detectado |    | ||
[pwm_comparison] Em comparação: 52 % de todos os dispositivos testados não usam PWM para escurecer a tela. Se PWM foi detectado, uma média de 7754 (mínimo: 5 - máximo: 343500) Hz foi medida. | |||
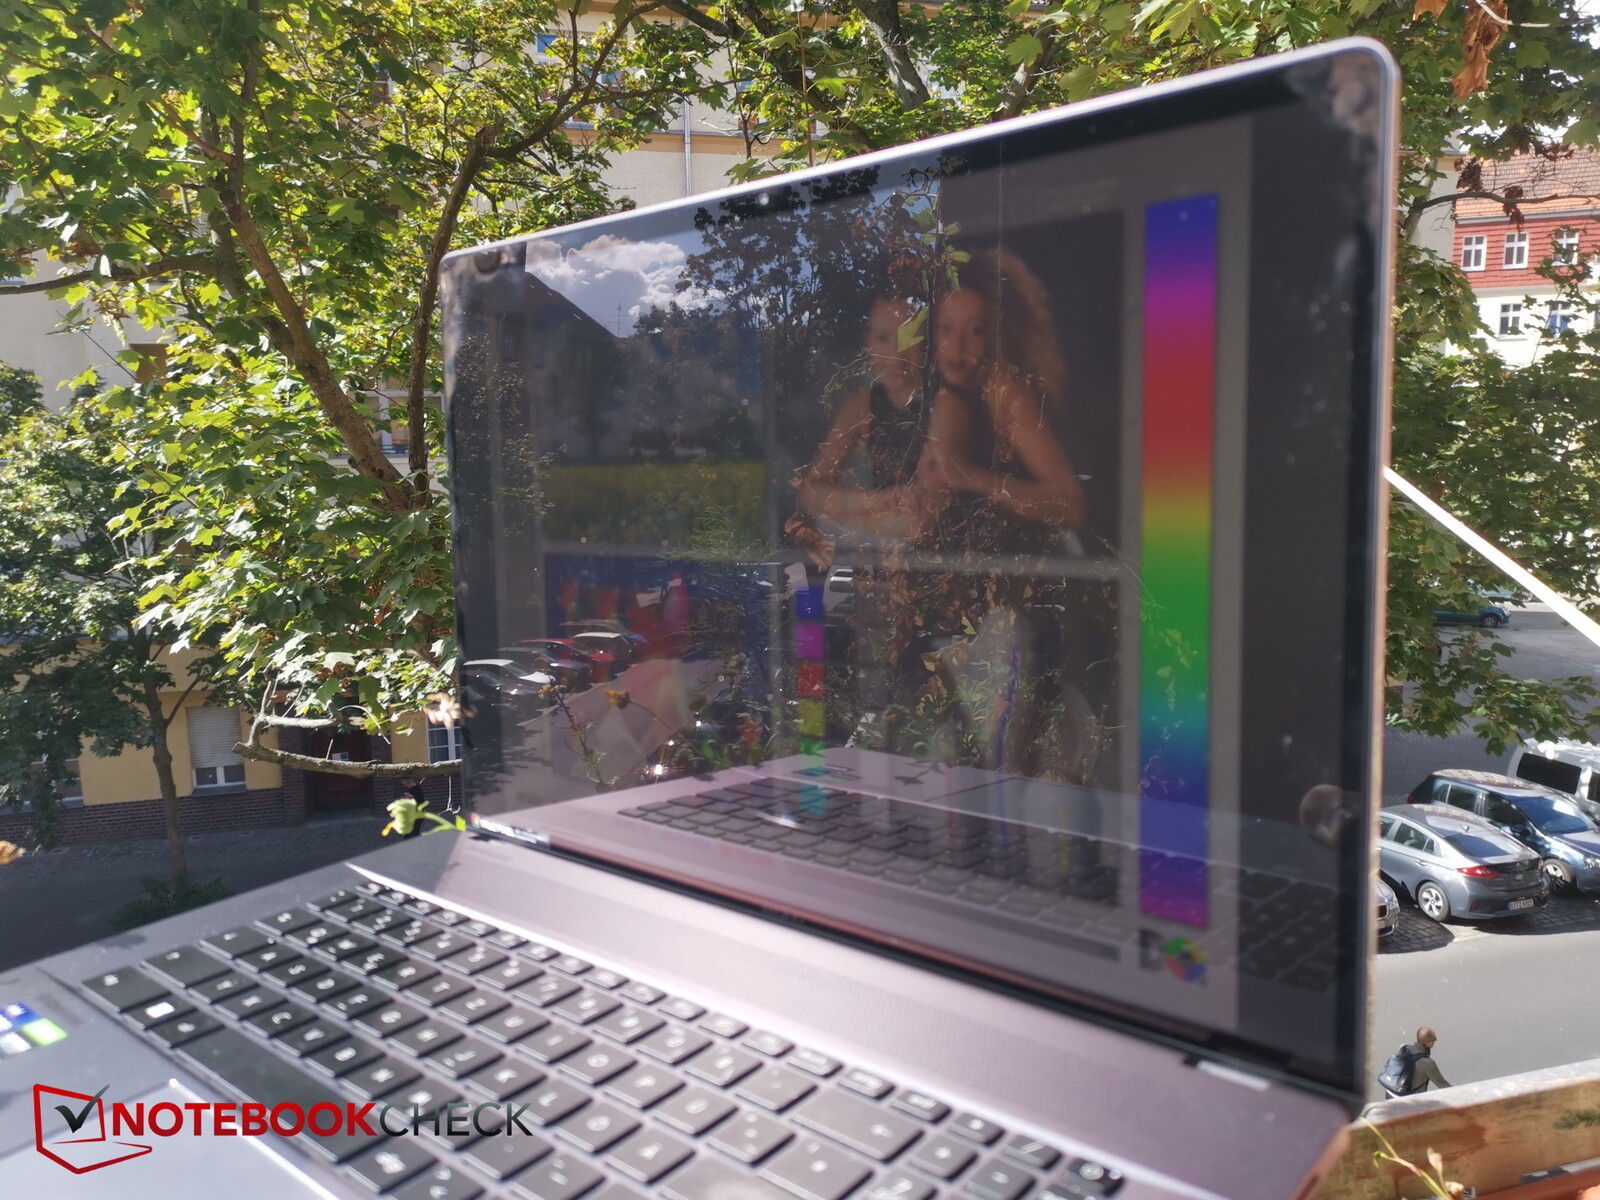
A superfície brilhante torna o laptop significativamente mais difícil de usar ao ar livre. Suas desvantagens são atenuadas apenas parcialmente pelo brilho bastante alto da tela. Você provavelmente deveria procurar um ponto sombreado se pretende trabalhar no exterior.
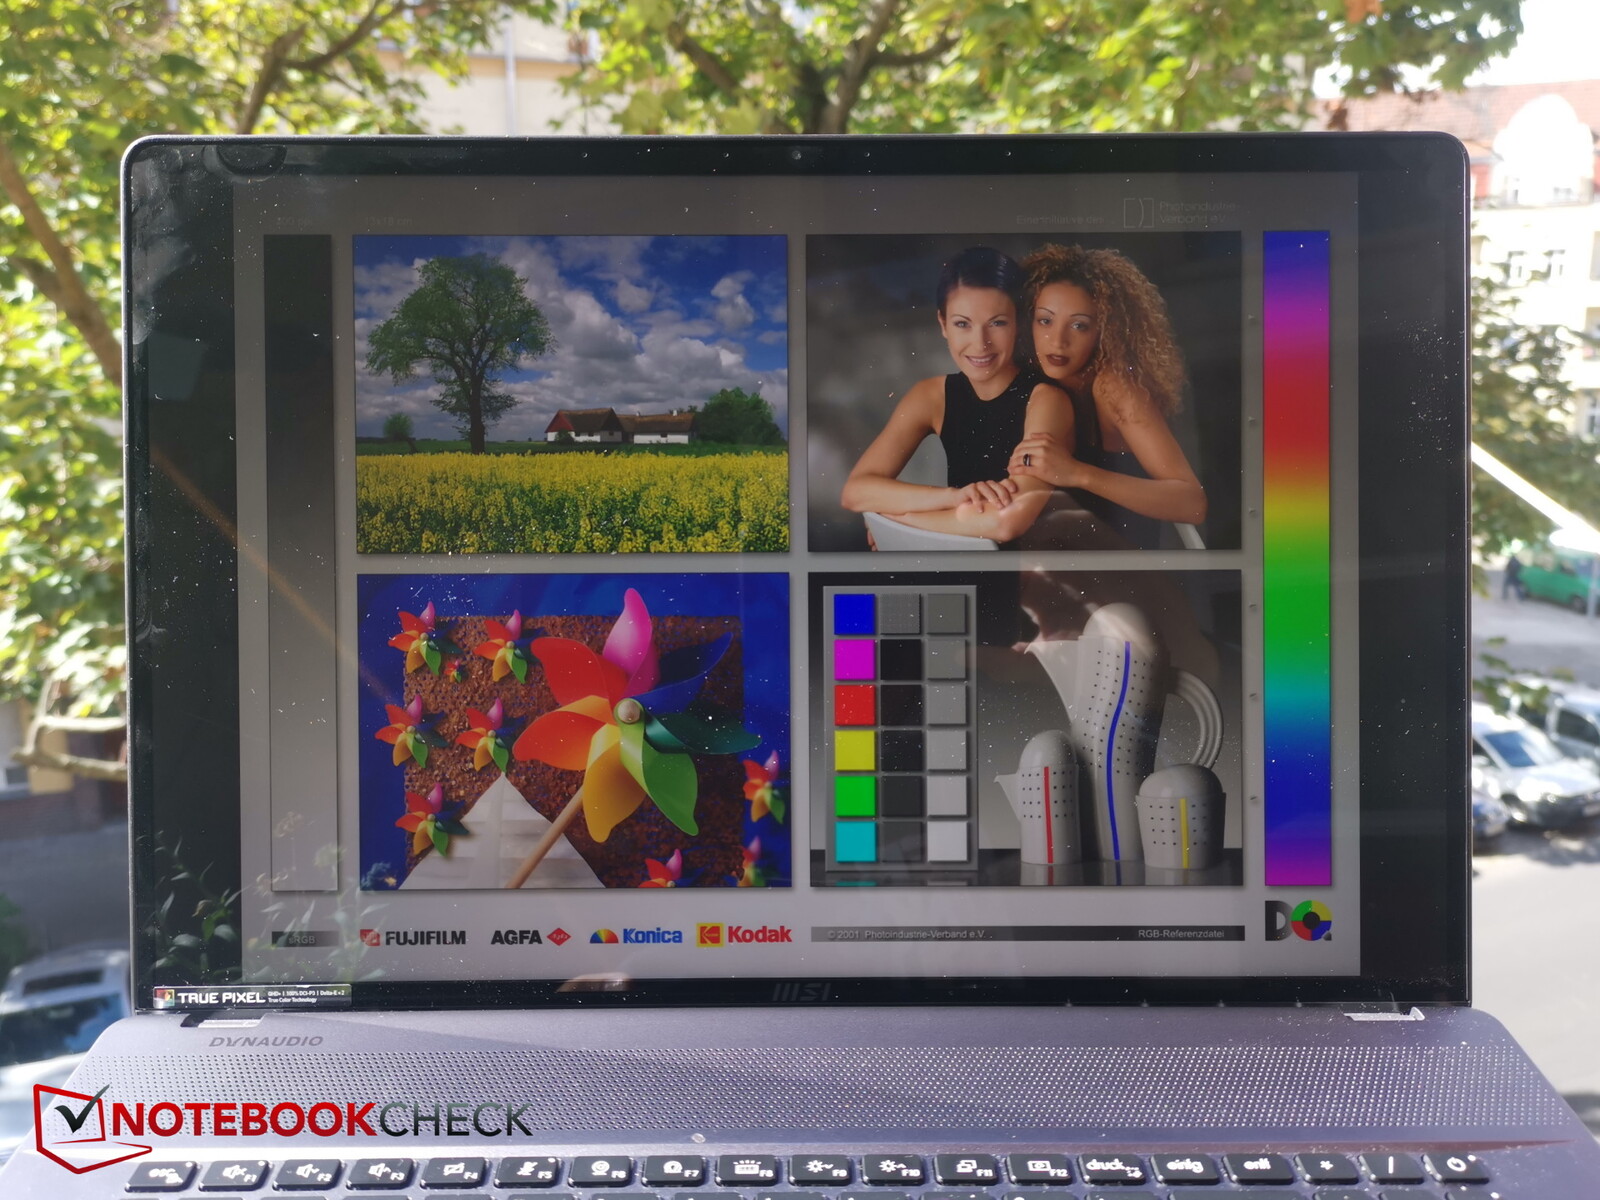
O visor tem um ângulo de visão bastante amplo. O brilho e o contraste só começam a cair quando a tela é vista de ângulos extremos.

Desempenho - Chassi estreito custa ao Z17 seu desempenho
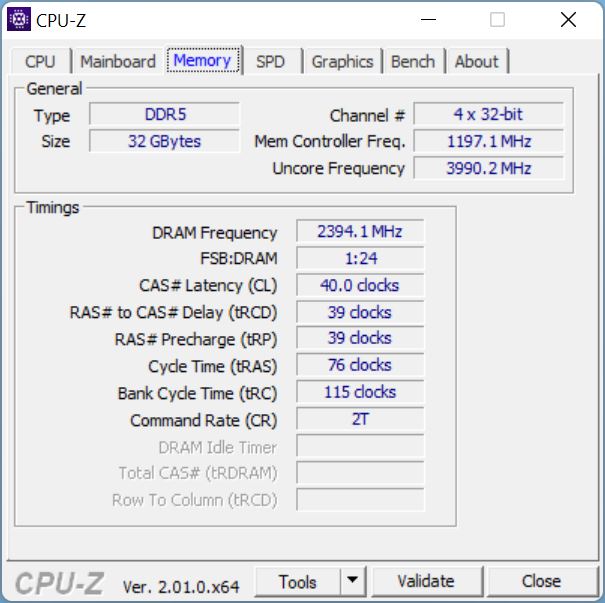
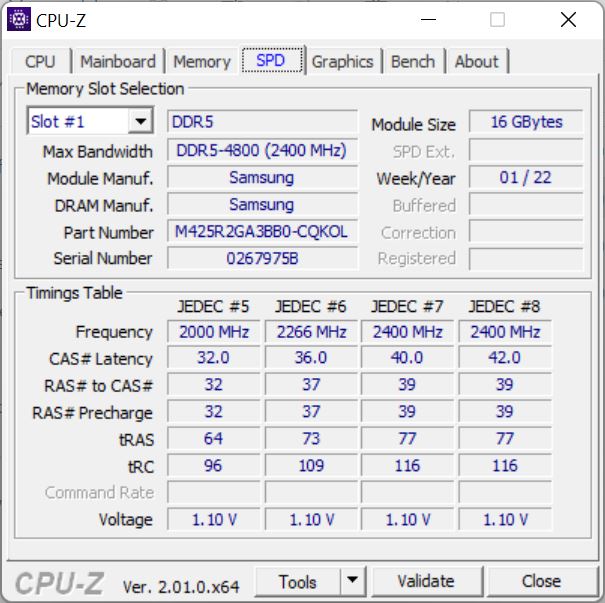
A combinação dos poderosos Núcleo i9-12900H e RTX 3070 Tidevem entusiasmar tanto os gamers quanto os criadores de conteúdo. A grande tela tátil, em particular, é algo que vai atrair os criadores de conteúdo. O laptop também tem uma generosa quantidade de 32 GB de RAM, que é exatamente a quantidade certa para projetos criativos.
O Z17 está disponível em três configurações. Além da configuração de revisão, há também uma com umRTX 3080 e 2 TB de armazenamento de SSD, bem como o modelo top-spec, que é equipado com um RTX 3080 Ti64 GB de RAM e 2 TB de armazenamento de SSD. Todos os três modelos utilizam a mesma CPU e display.
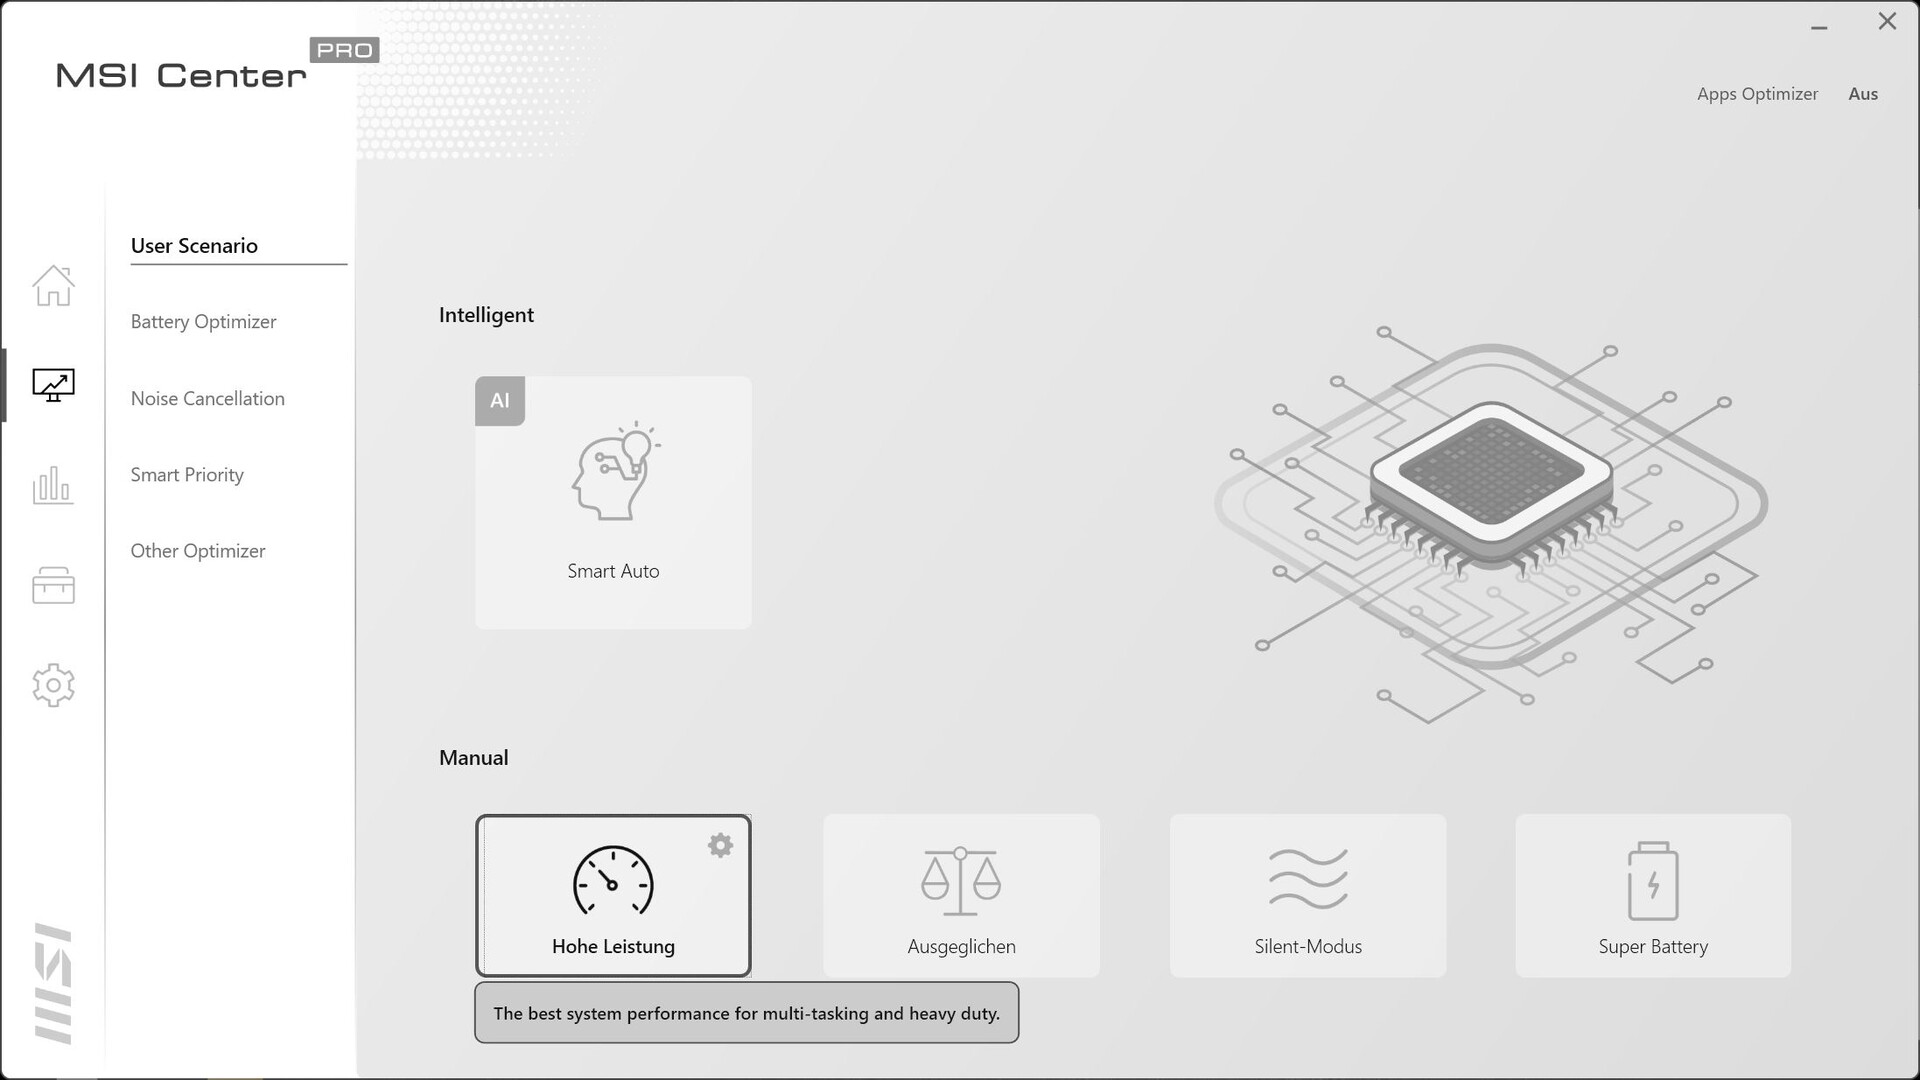
Condições de teste
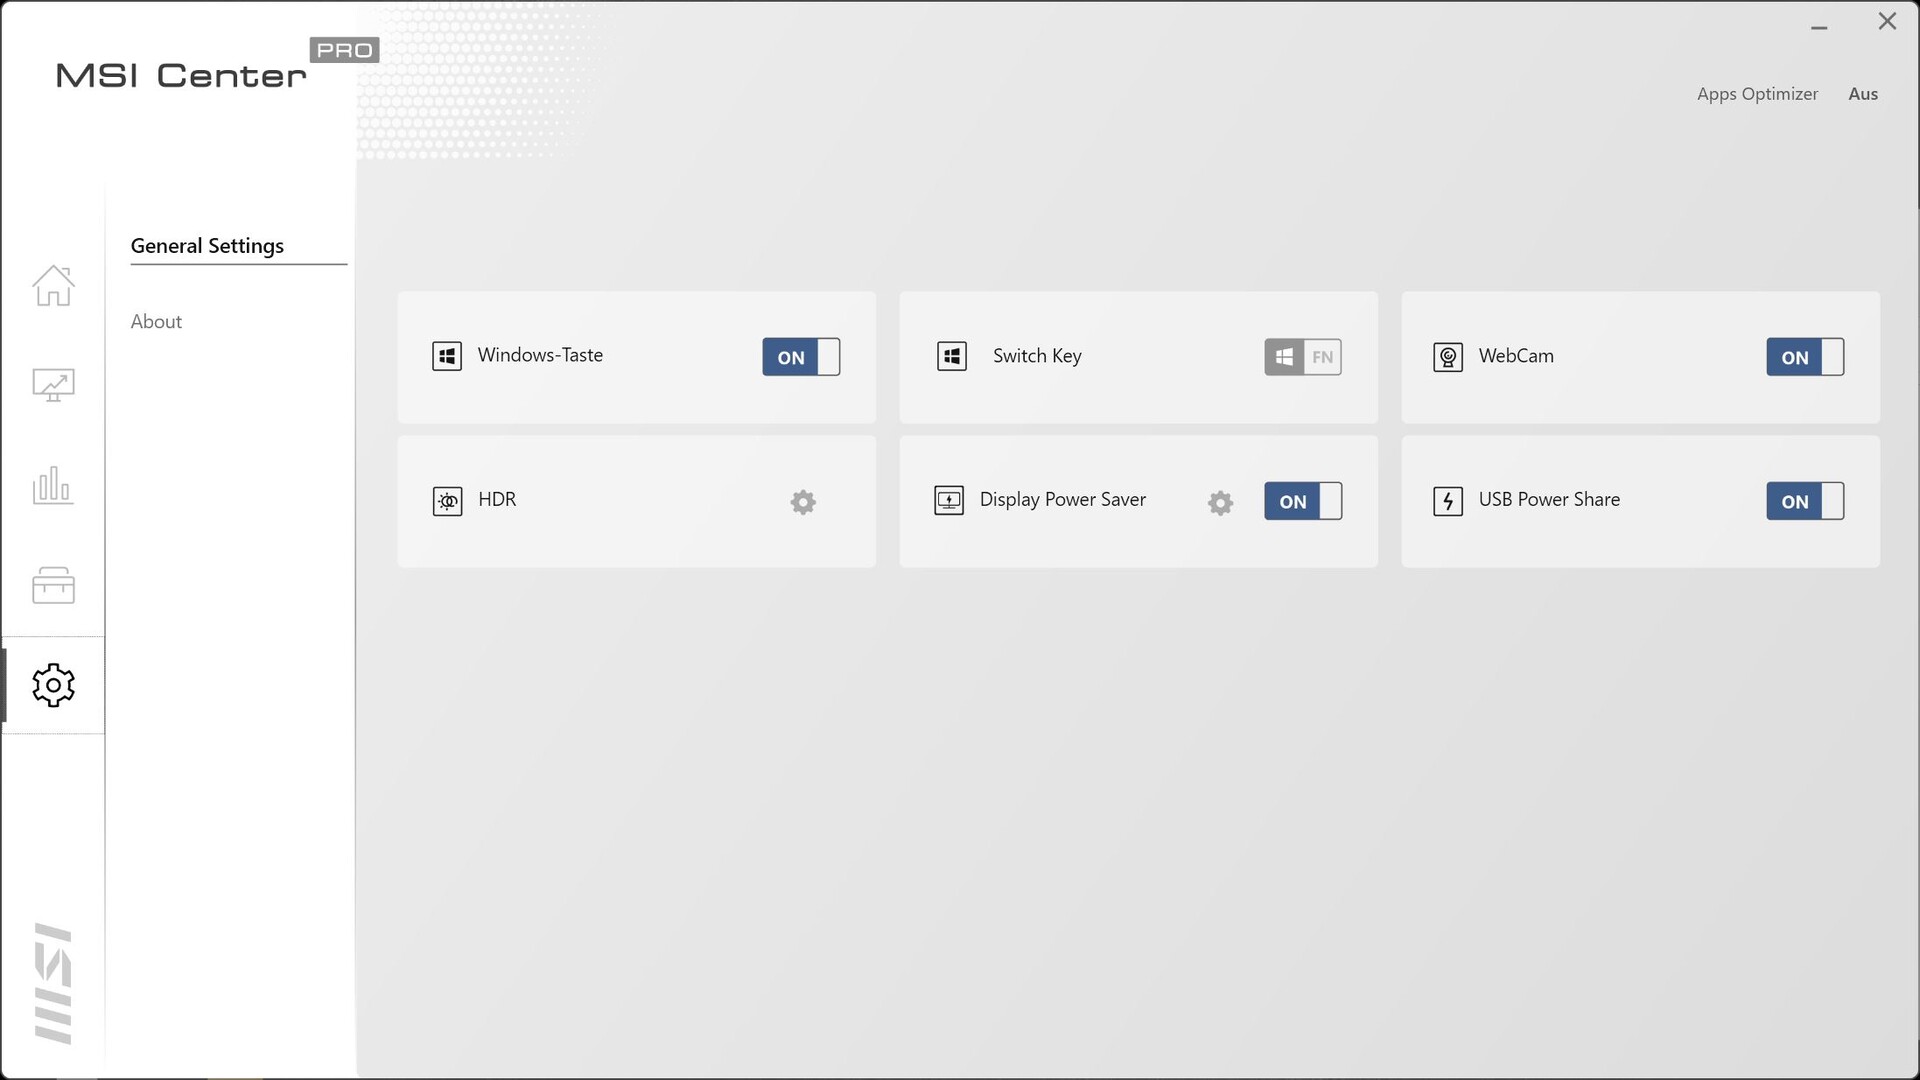
O laptop vem com o MSI Center Pro - o software do próprio fabricante que lhe permite personalizar várias configurações do sistema. Além do teste de bateria, todos os outros benchmarks foram realizados com o laptop em modo de alto desempenho, a fim de obter os melhores resultados possíveis. O software leva algum tempo para ser iniciado depois que você inicia o laptop.
Processador
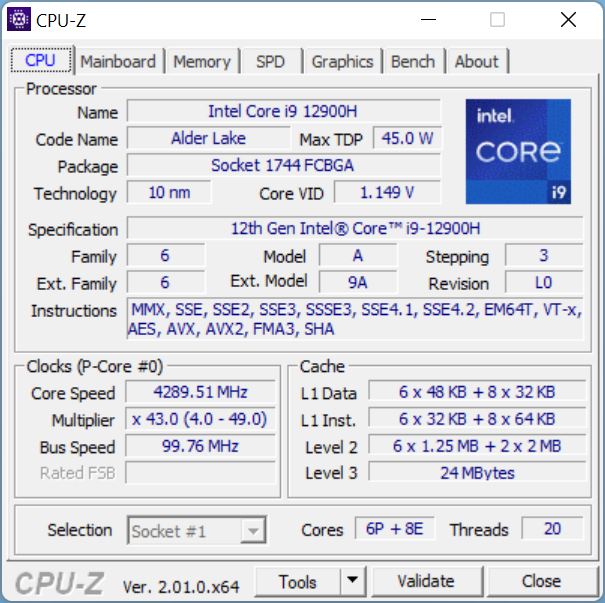
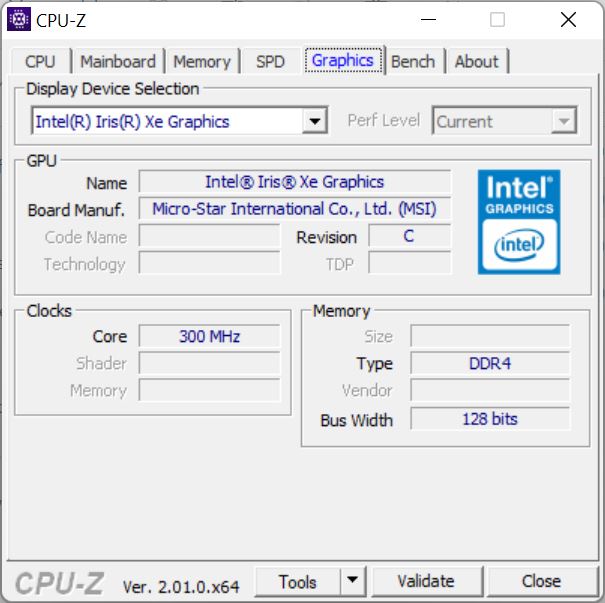
Com o Intel Core i9-12900Ha MSI colocou um dos mais rápidos processadores do Lago Alder da geração mais rápida do Z17. Isto é bastante incomum para um dispositivo com um fator de forma tão estreito. Há um total de 14 núcleos (20 fios; 6 P-cores e 8 E-cores) com velocidades de relógio variando de 1,8 a 5 GHz. O processador suporta o conjunto completo de recursos "Enterprise" do vPro (recursos de gerenciamento). Todos os 96 EUs estão ativos no Xe Graphics integrado.
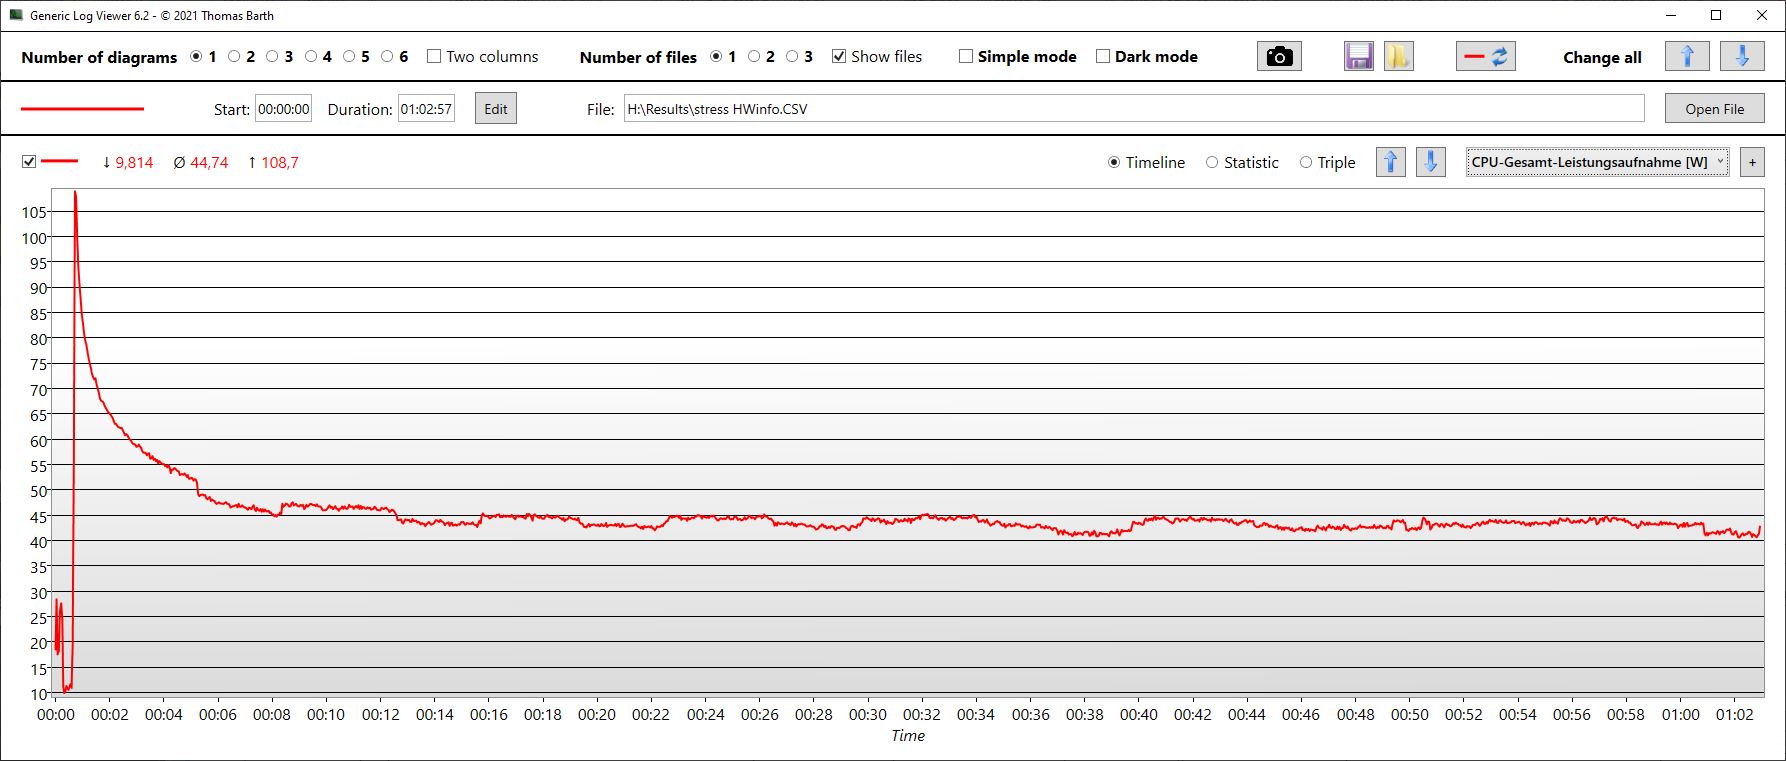
No teste de loop Cinebench, os concorrentes foram completamente superados pelo Z17, pelo menos em termos de desempenho sustentado da CPU. No entanto, esses laptops também não vêm instalados com uma CPU de primeira linha. O Núcleo i7-12800H no Lâmina 17 foi capaz de superar o desempenho da i9-12900H na Z17 no início. Mas o Z17 ainda tem um desempenho melhor sustentado.
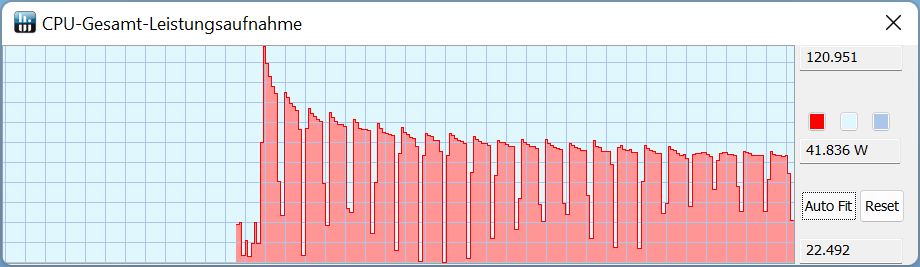
Você pode dizer como a CPU se comporta a partir da captura de tela à direita. O TDP só atingiu 120 watts durante a primeira corrida; depois o consumo de energia começou a cair gradualmente com o tempo. O TDP também diminuiu ligeiramente dentro de cada rodada.
Em geral, o Z17 apresentou uma diminuição acentuadamente menos severa no desempenho do que o Lâmina Razer com um i7 após as primeiras corridas. Curiosamente, o mesmo processador i9 no Z16P é consistentemente cerca de 10 a 15 por cento mais rápido apesar do fator de forma menor do laptop. Isto significa que o i9 no Z17 não está funcionando em todo o seu potencial. Assim, o ganho mínimo de desempenho sobre os concorrentes não justifica o uso do processador i9 Core i9 ávido de energia. O desempenho de uma única linha está um pouco abaixo do que se espera de um i9-12900H.
Enquanto funcionava com bateria, o laptop perdeu cerca de 25% de seu desempenho de CPU, conforme medido usando o Cinebench R15. A CPU só conseguiu atingir um TDP de 50 watts.
Cinebench R15 Multi Sustained Load
Cinebench R23: Multi Core | Single Core
Cinebench R20: CPU (Multi Core) | CPU (Single Core)
Cinebench R15: CPU Multi 64Bit | CPU Single 64Bit
Blender: v2.79 BMW27 CPU
7-Zip 18.03: 7z b 4 | 7z b 4 -mmt1
Geekbench 5.5: Multi-Core | Single-Core
HWBOT x265 Benchmark v2.2: 4k Preset
LibreOffice : 20 Documents To PDF
R Benchmark 2.5: Overall mean
| CPU Performance rating | |
| Aorus 17X XES | |
| MSI Creator Z16P B12UHST | |
| MSI Creator Z17 A12UGST-054 | |
| Média da turma Multimedia | |
| Dell XPS 17 9720 RTX 3060 | |
| Razer Blade 17 (i7-12800H, RTX 3070 Ti) | |
| Média Intel Core i9-12900H | |
| MSI Creator 17 A10SGS -2! | |
| Cinebench R23 / Multi Core | |
| MSI Creator Z16P B12UHST | |
| Aorus 17X XES | |
| Dell XPS 17 9720 RTX 3060 | |
| Média da turma Multimedia (4861 - 33362, n=74, últimos 2 anos) | |
| MSI Creator Z17 A12UGST-054 | |
| Razer Blade 17 (i7-12800H, RTX 3070 Ti) | |
| Média Intel Core i9-12900H (7359 - 19648, n=28) | |
| Cinebench R23 / Single Core | |
| Média da turma Multimedia (1128 - 2459, n=66, últimos 2 anos) | |
| Aorus 17X XES | |
| MSI Creator Z16P B12UHST | |
| MSI Creator Z17 A12UGST-054 | |
| Média Intel Core i9-12900H (1634 - 1930, n=28) | |
| Razer Blade 17 (i7-12800H, RTX 3070 Ti) | |
| Dell XPS 17 9720 RTX 3060 | |
| Cinebench R20 / CPU (Multi Core) | |
| Aorus 17X XES | |
| MSI Creator Z16P B12UHST | |
| Dell XPS 17 9720 RTX 3060 | |
| Média da turma Multimedia (1887 - 12912, n=57, últimos 2 anos) | |
| MSI Creator Z17 A12UGST-054 | |
| Média Intel Core i9-12900H (2681 - 7471, n=28) | |
| Razer Blade 17 (i7-12800H, RTX 3070 Ti) | |
| MSI Creator 17 A10SGS | |
| Cinebench R20 / CPU (Single Core) | |
| Aorus 17X XES | |
| MSI Creator Z16P B12UHST | |
| Média da turma Multimedia (425 - 853, n=57, últimos 2 anos) | |
| MSI Creator Z17 A12UGST-054 | |
| Razer Blade 17 (i7-12800H, RTX 3070 Ti) | |
| Média Intel Core i9-12900H (624 - 738, n=28) | |
| Dell XPS 17 9720 RTX 3060 | |
| MSI Creator 17 A10SGS | |
| Cinebench R15 / CPU Multi 64Bit | |
| MSI Creator Z16P B12UHST | |
| Aorus 17X XES | |
| Razer Blade 17 (i7-12800H, RTX 3070 Ti) | |
| MSI Creator Z17 A12UGST-054 | |
| Média da turma Multimedia (856 - 5224, n=61, últimos 2 anos) | |
| Média Intel Core i9-12900H (1395 - 3077, n=28) | |
| Dell XPS 17 9720 RTX 3060 | |
| MSI Creator 17 A10SGS | |
| Cinebench R15 / CPU Single 64Bit | |
| Média da turma Multimedia (184.8 - 326, n=59, últimos 2 anos) | |
| Aorus 17X XES | |
| MSI Creator Z16P B12UHST | |
| Razer Blade 17 (i7-12800H, RTX 3070 Ti) | |
| Média Intel Core i9-12900H (235 - 277, n=29) | |
| MSI Creator Z17 A12UGST-054 | |
| Dell XPS 17 9720 RTX 3060 | |
| MSI Creator 17 A10SGS | |
| Blender / v2.79 BMW27 CPU | |
| MSI Creator 17 A10SGS | |
| Média da turma Multimedia (100 - 557, n=58, últimos 2 anos) | |
| Média Intel Core i9-12900H (160 - 451, n=28) | |
| Razer Blade 17 (i7-12800H, RTX 3070 Ti) | |
| Dell XPS 17 9720 RTX 3060 | |
| MSI Creator Z17 A12UGST-054 | |
| Aorus 17X XES | |
| MSI Creator Z16P B12UHST | |
| 7-Zip 18.03 / 7z b 4 | |
| MSI Creator Z16P B12UHST | |
| Dell XPS 17 9720 RTX 3060 | |
| Aorus 17X XES | |
| MSI Creator Z17 A12UGST-054 | |
| Razer Blade 17 (i7-12800H, RTX 3070 Ti) | |
| Média Intel Core i9-12900H (34684 - 76677, n=28) | |
| Média da turma Multimedia (26062 - 130368, n=55, últimos 2 anos) | |
| MSI Creator 17 A10SGS | |
| 7-Zip 18.03 / 7z b 4 -mmt1 | |
| Aorus 17X XES | |
| MSI Creator Z16P B12UHST | |
| Média da turma Multimedia (3666 - 7545, n=56, últimos 2 anos) | |
| MSI Creator Z17 A12UGST-054 | |
| Média Intel Core i9-12900H (5302 - 6289, n=28) | |
| Razer Blade 17 (i7-12800H, RTX 3070 Ti) | |
| Dell XPS 17 9720 RTX 3060 | |
| MSI Creator 17 A10SGS | |
| Geekbench 5.5 / Multi-Core | |
| Aorus 17X XES | |
| MSI Creator Z16P B12UHST | |
| MSI Creator Z17 A12UGST-054 | |
| Média da turma Multimedia (4652 - 20422, n=56, últimos 2 anos) | |
| Razer Blade 17 (i7-12800H, RTX 3070 Ti) | |
| Dell XPS 17 9720 RTX 3060 | |
| Média Intel Core i9-12900H (8519 - 14376, n=31) | |
| MSI Creator 17 A10SGS | |
| Geekbench 5.5 / Single-Core | |
| Média da turma Multimedia (805 - 2974, n=56, últimos 2 anos) | |
| Aorus 17X XES | |
| MSI Creator Z16P B12UHST | |
| MSI Creator Z17 A12UGST-054 | |
| Média Intel Core i9-12900H (1631 - 1897, n=31) | |
| Razer Blade 17 (i7-12800H, RTX 3070 Ti) | |
| Dell XPS 17 9720 RTX 3060 | |
| MSI Creator 17 A10SGS | |
| HWBOT x265 Benchmark v2.2 / 4k Preset | |
| Aorus 17X XES | |
| MSI Creator Z16P B12UHST | |
| Média da turma Multimedia (5.26 - 36.1, n=56, últimos 2 anos) | |
| MSI Creator Z17 A12UGST-054 | |
| Média Intel Core i9-12900H (8.05 - 22.5, n=28) | |
| Razer Blade 17 (i7-12800H, RTX 3070 Ti) | |
| Dell XPS 17 9720 RTX 3060 | |
| MSI Creator 17 A10SGS | |
| LibreOffice / 20 Documents To PDF | |
| MSI Creator 17 A10SGS | |
| Média da turma Multimedia (23.9 - 146.7, n=57, últimos 2 anos) | |
| Média Intel Core i9-12900H (36.8 - 59.8, n=28) | |
| Dell XPS 17 9720 RTX 3060 | |
| Razer Blade 17 (i7-12800H, RTX 3070 Ti) | |
| MSI Creator Z17 A12UGST-054 | |
| MSI Creator Z16P B12UHST | |
| Aorus 17X XES | |
| R Benchmark 2.5 / Overall mean | |
| MSI Creator 17 A10SGS | |
| Média da turma Multimedia (0.3604 - 0.947, n=56, últimos 2 anos) | |
| Dell XPS 17 9720 RTX 3060 | |
| Razer Blade 17 (i7-12800H, RTX 3070 Ti) | |
| Média Intel Core i9-12900H (0.4218 - 0.506, n=28) | |
| MSI Creator Z17 A12UGST-054 | |
| MSI Creator Z16P B12UHST | |
| Aorus 17X XES | |
* ... menor é melhor
AIDA64: FP32 Ray-Trace | FPU Julia | CPU SHA3 | CPU Queen | FPU SinJulia | FPU Mandel | CPU AES | CPU ZLib | FP64 Ray-Trace | CPU PhotoWorxx
| Performance rating | |
| Aorus 17X XES | |
| Média da turma Multimedia | |
| Média Intel Core i9-12900H | |
| MSI Creator Z16P B12UHST | |
| MSI Creator Z17 A12UGST-054 | |
| Dell XPS 17 9720 RTX 3060 | |
| Razer Blade 17 (i7-12800H, RTX 3070 Ti) | |
| MSI Creator 17 A10SGS | |
| AIDA64 / FP32 Ray-Trace | |
| Média da turma Multimedia (2214 - 50388, n=53, últimos 2 anos) | |
| Aorus 17X XES | |
| Média Intel Core i9-12900H (4074 - 18289, n=29) | |
| MSI Creator 17 A10SGS | |
| MSI Creator Z16P B12UHST | |
| MSI Creator Z17 A12UGST-054 | |
| Razer Blade 17 (i7-12800H, RTX 3070 Ti) | |
| Dell XPS 17 9720 RTX 3060 | |
| AIDA64 / FPU Julia | |
| Média da turma Multimedia (12867 - 201874, n=54, últimos 2 anos) | |
| Aorus 17X XES | |
| Média Intel Core i9-12900H (22307 - 93236, n=29) | |
| MSI Creator 17 A10SGS | |
| MSI Creator Z16P B12UHST | |
| MSI Creator Z17 A12UGST-054 | |
| Razer Blade 17 (i7-12800H, RTX 3070 Ti) | |
| Dell XPS 17 9720 RTX 3060 | |
| AIDA64 / CPU SHA3 | |
| Média da turma Multimedia (626 - 8623, n=54, últimos 2 anos) | |
| Aorus 17X XES | |
| Média Intel Core i9-12900H (1378 - 4215, n=29) | |
| MSI Creator Z16P B12UHST | |
| MSI Creator Z17 A12UGST-054 | |
| Razer Blade 17 (i7-12800H, RTX 3070 Ti) | |
| Dell XPS 17 9720 RTX 3060 | |
| MSI Creator 17 A10SGS | |
| AIDA64 / CPU Queen | |
| MSI Creator Z16P B12UHST | |
| MSI Creator Z17 A12UGST-054 | |
| Aorus 17X XES | |
| Média Intel Core i9-12900H (78172 - 111241, n=28) | |
| Dell XPS 17 9720 RTX 3060 | |
| Razer Blade 17 (i7-12800H, RTX 3070 Ti) | |
| MSI Creator 17 A10SGS | |
| Média da turma Multimedia (13483 - 181505, n=41, últimos 2 anos) | |
| AIDA64 / FPU SinJulia | |
| Aorus 17X XES | |
| MSI Creator Z16P B12UHST | |
| Razer Blade 17 (i7-12800H, RTX 3070 Ti) | |
| MSI Creator Z17 A12UGST-054 | |
| Média Intel Core i9-12900H (5709 - 10410, n=29) | |
| Dell XPS 17 9720 RTX 3060 | |
| Média da turma Multimedia (886 - 28794, n=54, últimos 2 anos) | |
| MSI Creator 17 A10SGS | |
| AIDA64 / FPU Mandel | |
| Média da turma Multimedia (6395 - 105740, n=53, últimos 2 anos) | |
| Aorus 17X XES | |
| Média Intel Core i9-12900H (11257 - 45581, n=29) | |
| MSI Creator 17 A10SGS | |
| MSI Creator Z16P B12UHST | |
| MSI Creator Z17 A12UGST-054 | |
| Razer Blade 17 (i7-12800H, RTX 3070 Ti) | |
| Dell XPS 17 9720 RTX 3060 | |
| AIDA64 / CPU AES | |
| Aorus 17X XES | |
| MSI Creator Z16P B12UHST | |
| MSI Creator Z17 A12UGST-054 | |
| Média Intel Core i9-12900H (31935 - 151546, n=29) | |
| Dell XPS 17 9720 RTX 3060 | |
| Média da turma Multimedia (8171 - 126790, n=54, últimos 2 anos) | |
| Razer Blade 17 (i7-12800H, RTX 3070 Ti) | |
| MSI Creator 17 A10SGS | |
| AIDA64 / CPU ZLib | |
| MSI Creator Z16P B12UHST | |
| Razer Blade 17 (i7-12800H, RTX 3070 Ti) | |
| Aorus 17X XES | |
| Média da turma Multimedia (143.8 - 2022, n=54, últimos 2 anos) | |
| MSI Creator Z17 A12UGST-054 | |
| Média Intel Core i9-12900H (449 - 1193, n=29) | |
| Dell XPS 17 9720 RTX 3060 | |
| MSI Creator 17 A10SGS | |
| AIDA64 / FP64 Ray-Trace | |
| Média da turma Multimedia (1014 - 26875, n=54, últimos 2 anos) | |
| Aorus 17X XES | |
| Média Intel Core i9-12900H (2235 - 10511, n=29) | |
| MSI Creator Z16P B12UHST | |
| MSI Creator 17 A10SGS | |
| MSI Creator Z17 A12UGST-054 | |
| Dell XPS 17 9720 RTX 3060 | |
| Razer Blade 17 (i7-12800H, RTX 3070 Ti) | |
| AIDA64 / CPU PhotoWorxx | |
| Média da turma Multimedia (8187 - 88154, n=54, últimos 2 anos) | |
| Dell XPS 17 9720 RTX 3060 | |
| Aorus 17X XES | |
| MSI Creator Z16P B12UHST | |
| MSI Creator Z17 A12UGST-054 | |
| Média Intel Core i9-12900H (20960 - 48269, n=30) | |
| Razer Blade 17 (i7-12800H, RTX 3070 Ti) | |
| MSI Creator 17 A10SGS | |
Desempenho do sistema
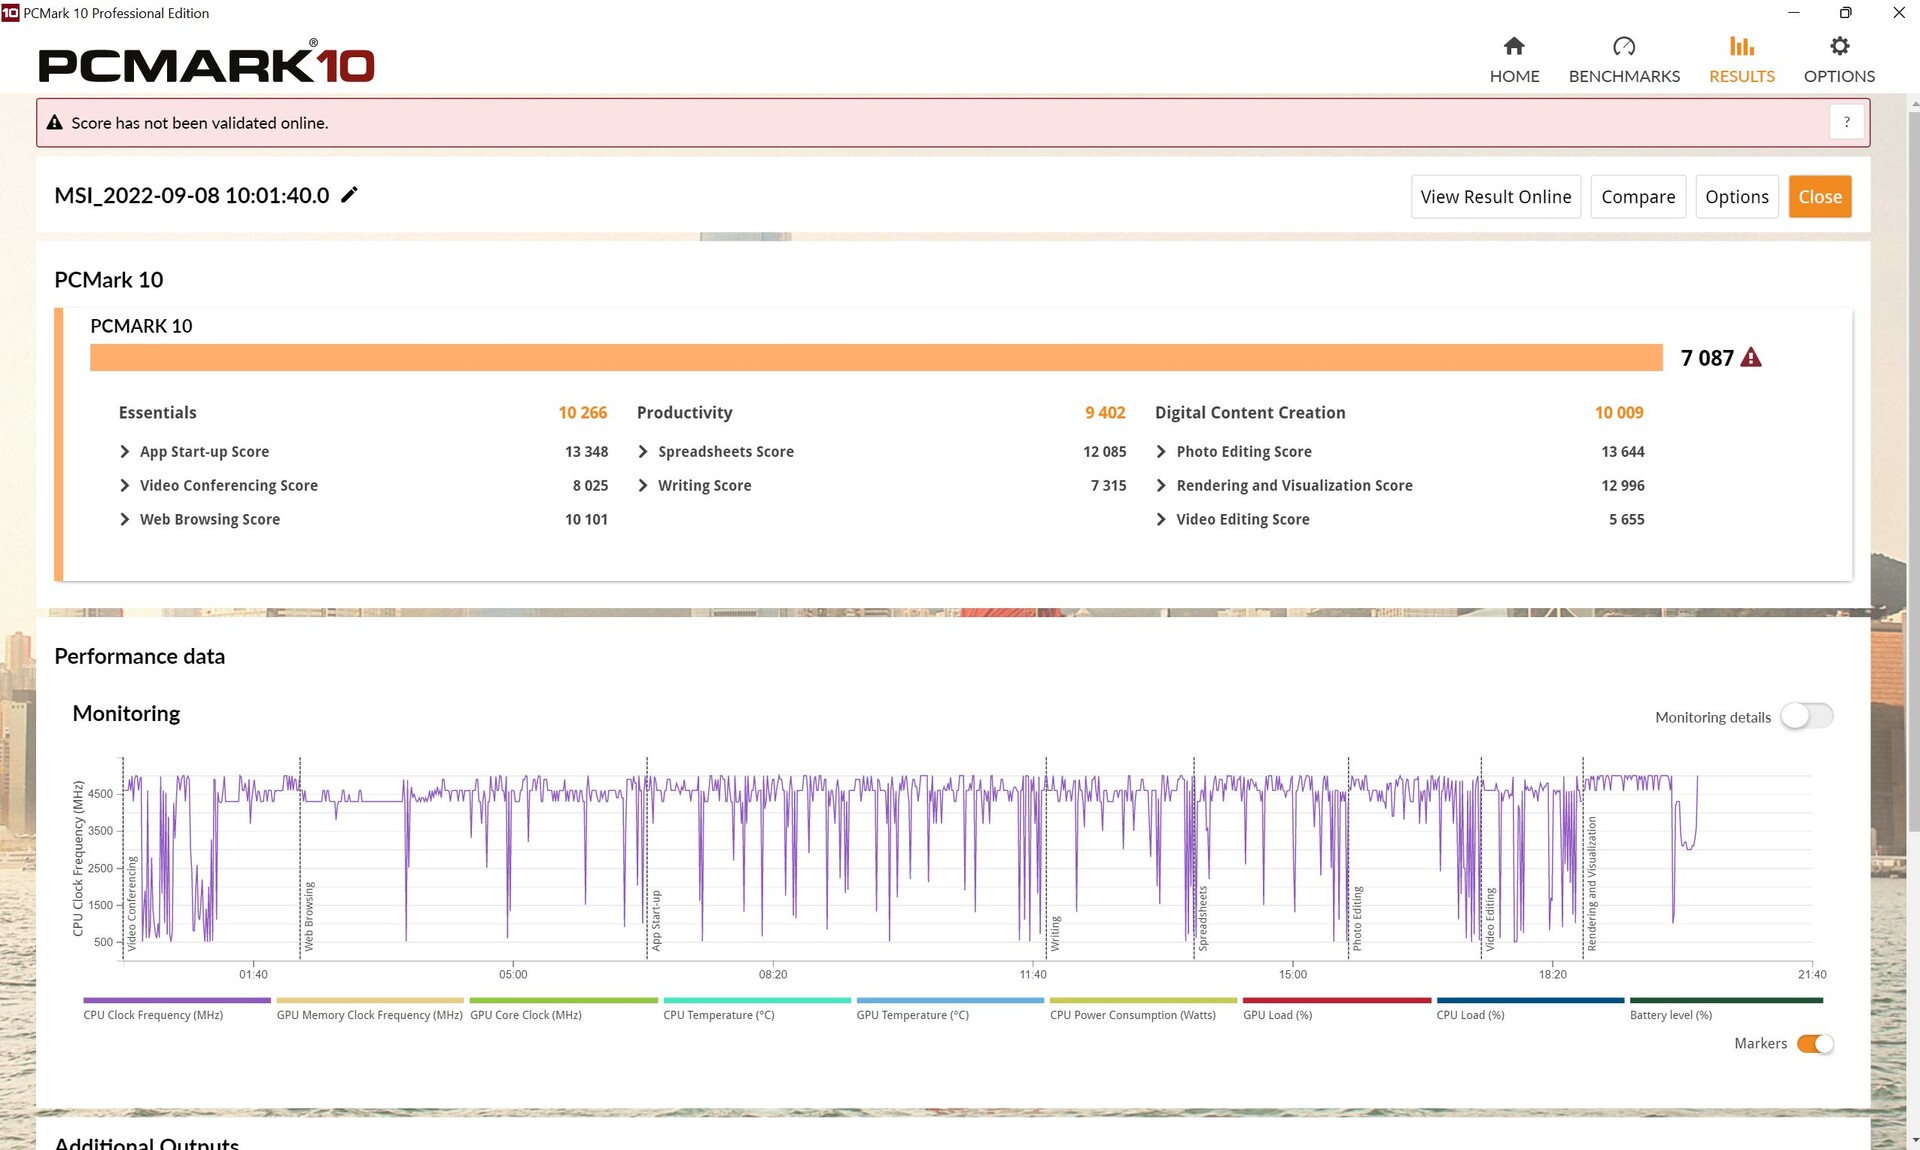
Surpreendentemente, o Z17 apresentou um desempenho ligeiramente abaixo da média no PCMark 10. A repetição do teste não produziu nenhum resultado melhor. Outros laptops com o mesmo combo CPU/GPU tiveram um desempenho 8% melhor em média.
No entanto, com base em nossa experiência com o Z17, ele funciona sem problemas e sem problemas durante o trabalho diário.
CrossMark: Overall | Productivity | Creativity | Responsiveness
| PCMark 10 / Score | |
| MSI Creator Z16P B12UHST | |
| Aorus 17X XES | |
| Média da turma Multimedia (4325 - 10386, n=52, últimos 2 anos) | |
| Média Intel Core i9-12900H, NVIDIA GeForce RTX 3070 Ti Laptop GPU (7087 - 8072, n=6) | |
| Dell XPS 17 9720 RTX 3060 | |
| Razer Blade 17 (i7-12800H, RTX 3070 Ti) | |
| MSI Creator Z17 A12UGST-054 | |
| MSI Creator 17 A10SGS | |
| PCMark 10 / Essentials | |
| MSI Creator Z16P B12UHST | |
| Média Intel Core i9-12900H, NVIDIA GeForce RTX 3070 Ti Laptop GPU (10266 - 11663, n=6) | |
| Dell XPS 17 9720 RTX 3060 | |
| Aorus 17X XES | |
| Média da turma Multimedia (8025 - 11664, n=51, últimos 2 anos) | |
| MSI Creator Z17 A12UGST-054 | |
| Razer Blade 17 (i7-12800H, RTX 3070 Ti) | |
| MSI Creator 17 A10SGS | |
| PCMark 10 / Productivity | |
| Média da turma Multimedia (7323 - 18233, n=51, últimos 2 anos) | |
| MSI Creator Z16P B12UHST | |
| Aorus 17X XES | |
| Média Intel Core i9-12900H, NVIDIA GeForce RTX 3070 Ti Laptop GPU (9402 - 10742, n=6) | |
| MSI Creator Z17 A12UGST-054 | |
| Dell XPS 17 9720 RTX 3060 | |
| Razer Blade 17 (i7-12800H, RTX 3070 Ti) | |
| MSI Creator 17 A10SGS | |
| PCMark 10 / Digital Content Creation | |
| Aorus 17X XES | |
| MSI Creator Z16P B12UHST | |
| Média Intel Core i9-12900H, NVIDIA GeForce RTX 3070 Ti Laptop GPU (10009 - 12541, n=6) | |
| Razer Blade 17 (i7-12800H, RTX 3070 Ti) | |
| Média da turma Multimedia (3651 - 16240, n=51, últimos 2 anos) | |
| Dell XPS 17 9720 RTX 3060 | |
| MSI Creator Z17 A12UGST-054 | |
| MSI Creator 17 A10SGS | |
| CrossMark / Overall | |
| Aorus 17X XES | |
| MSI Creator Z17 A12UGST-054 | |
| Dell XPS 17 9720 RTX 3060 | |
| Média da turma Multimedia (866 - 2728, n=60, últimos 2 anos) | |
| Média Intel Core i9-12900H, NVIDIA GeForce RTX 3070 Ti Laptop GPU (1664 - 2044, n=6) | |
| Razer Blade 17 (i7-12800H, RTX 3070 Ti) | |
| CrossMark / Productivity | |
| Aorus 17X XES | |
| MSI Creator Z17 A12UGST-054 | |
| Média Intel Core i9-12900H, NVIDIA GeForce RTX 3070 Ti Laptop GPU (1591 - 1968, n=6) | |
| Média da turma Multimedia (931 - 2489, n=60, últimos 2 anos) | |
| Dell XPS 17 9720 RTX 3060 | |
| Razer Blade 17 (i7-12800H, RTX 3070 Ti) | |
| CrossMark / Creativity | |
| Aorus 17X XES | |
| Média da turma Multimedia (907 - 3465, n=60, últimos 2 anos) | |
| MSI Creator Z17 A12UGST-054 | |
| Dell XPS 17 9720 RTX 3060 | |
| Média Intel Core i9-12900H, NVIDIA GeForce RTX 3070 Ti Laptop GPU (1797 - 2148, n=6) | |
| Razer Blade 17 (i7-12800H, RTX 3070 Ti) | |
| CrossMark / Responsiveness | |
| Aorus 17X XES | |
| MSI Creator Z17 A12UGST-054 | |
| Média Intel Core i9-12900H, NVIDIA GeForce RTX 3070 Ti Laptop GPU (1514 - 2069, n=6) | |
| Dell XPS 17 9720 RTX 3060 | |
| Razer Blade 17 (i7-12800H, RTX 3070 Ti) | |
| Média da turma Multimedia (605 - 2024, n=60, últimos 2 anos) | |
| PCMark 10 Score | 7087 pontos | |
Ajuda | ||
| AIDA64 / Memory Copy | |
| Média da turma Multimedia (11299 - 132135, n=54, últimos 2 anos) | |
| MSI Creator Z16P B12UHST | |
| Dell XPS 17 9720 RTX 3060 | |
| Aorus 17X XES | |
| MSI Creator Z17 A12UGST-054 | |
| Média Intel Core i9-12900H (34438 - 74264, n=29) | |
| Razer Blade 17 (i7-12800H, RTX 3070 Ti) | |
| MSI Creator 17 A10SGS | |
| AIDA64 / Memory Read | |
| Média da turma Multimedia (11624 - 174586, n=54, últimos 2 anos) | |
| Aorus 17X XES | |
| Dell XPS 17 9720 RTX 3060 | |
| MSI Creator Z16P B12UHST | |
| MSI Creator Z17 A12UGST-054 | |
| Média Intel Core i9-12900H (36365 - 74642, n=29) | |
| Razer Blade 17 (i7-12800H, RTX 3070 Ti) | |
| MSI Creator 17 A10SGS | |
| AIDA64 / Memory Write | |
| Média da turma Multimedia (11755 - 134998, n=54, últimos 2 anos) | |
| MSI Creator Z16P B12UHST | |
| MSI Creator Z17 A12UGST-054 | |
| Dell XPS 17 9720 RTX 3060 | |
| Aorus 17X XES | |
| Média Intel Core i9-12900H (32276 - 67858, n=29) | |
| Razer Blade 17 (i7-12800H, RTX 3070 Ti) | |
| MSI Creator 17 A10SGS | |
| AIDA64 / Memory Latency | |
| Média da turma Multimedia (7 - 535, n=53, últimos 2 anos) | |
| MSI Creator Z16P B12UHST | |
| MSI Creator Z17 A12UGST-054 | |
| Dell XPS 17 9720 RTX 3060 | |
| Aorus 17X XES | |
| Média Intel Core i9-12900H (74.7 - 118.1, n=28) | |
| MSI Creator 17 A10SGS | |
| Razer Blade 17 (i7-12800H, RTX 3070 Ti) | |
* ... menor é melhor
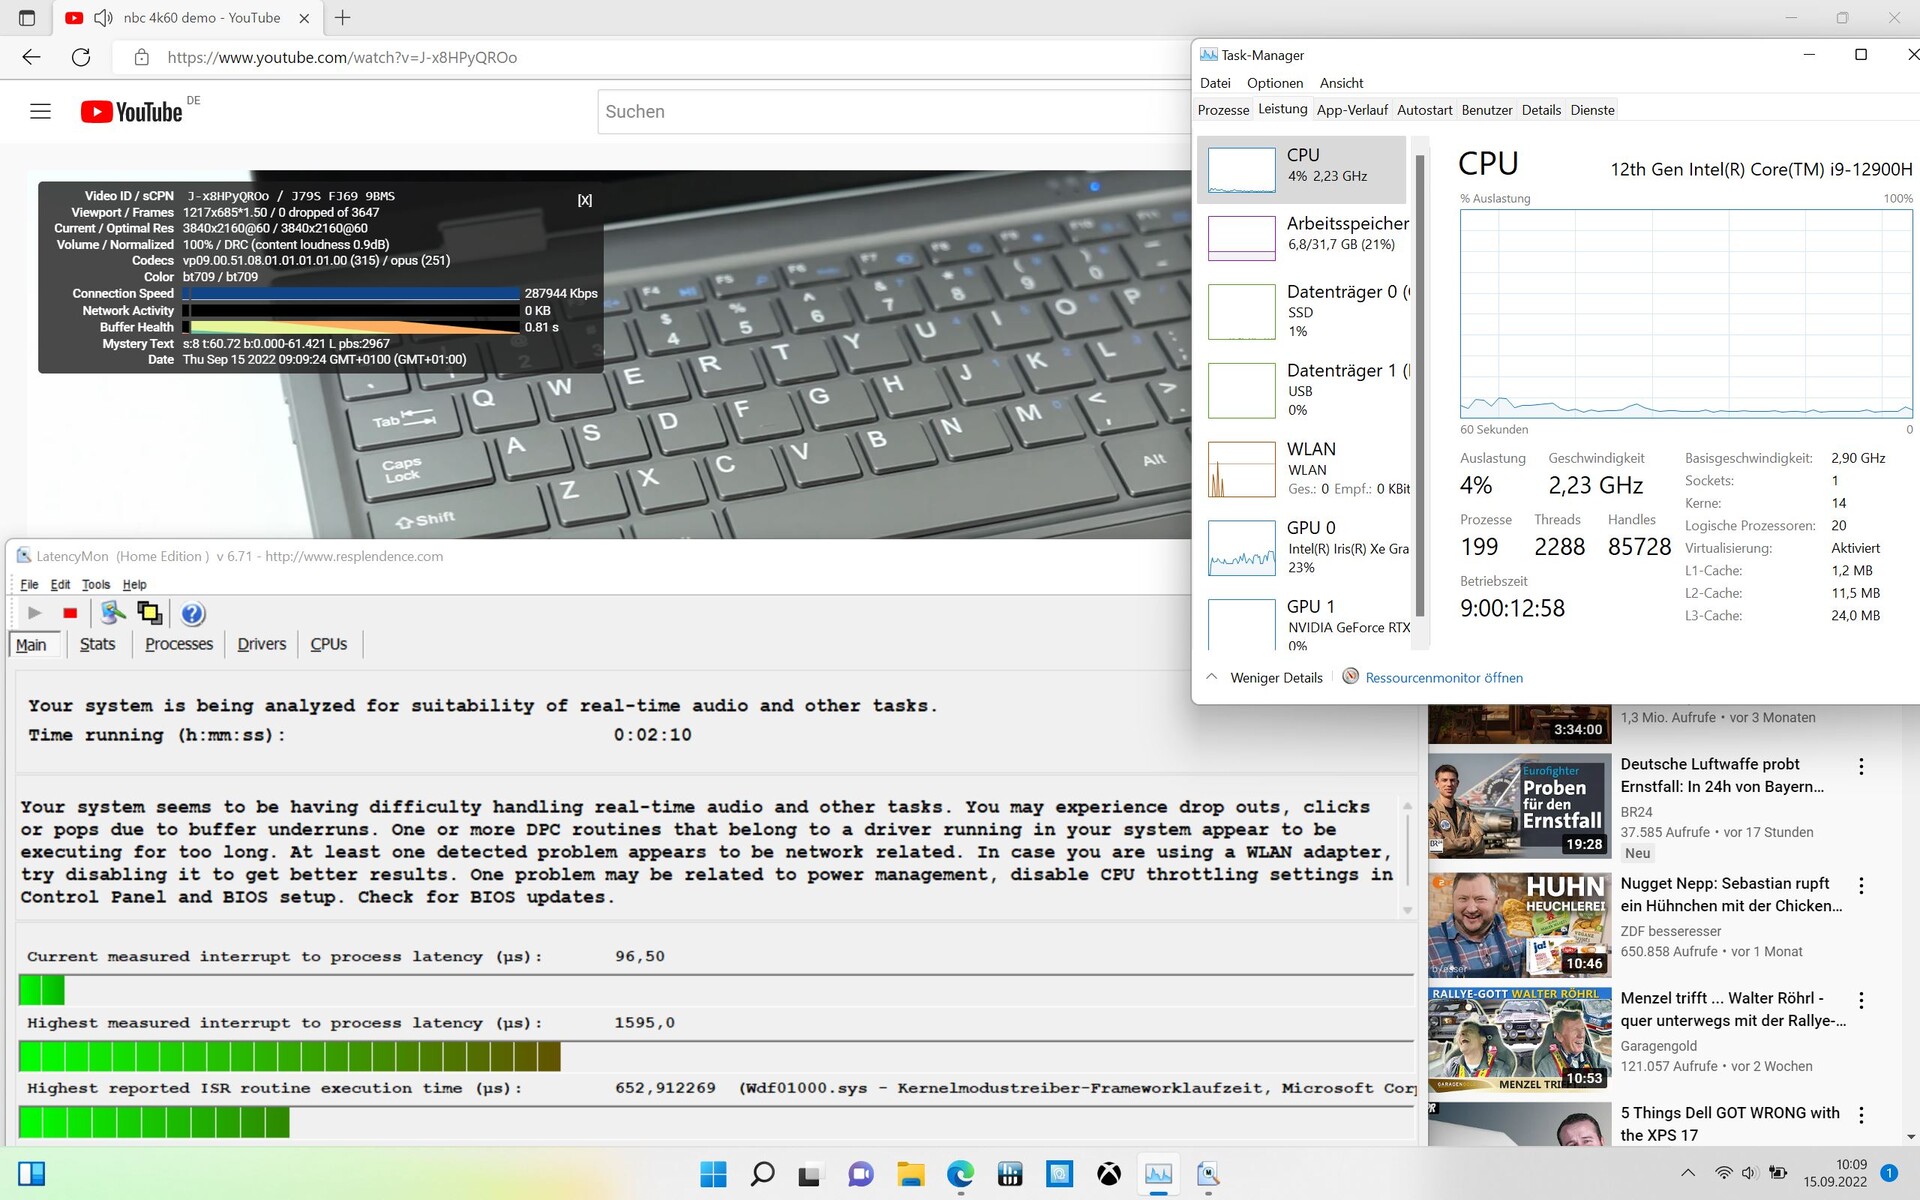
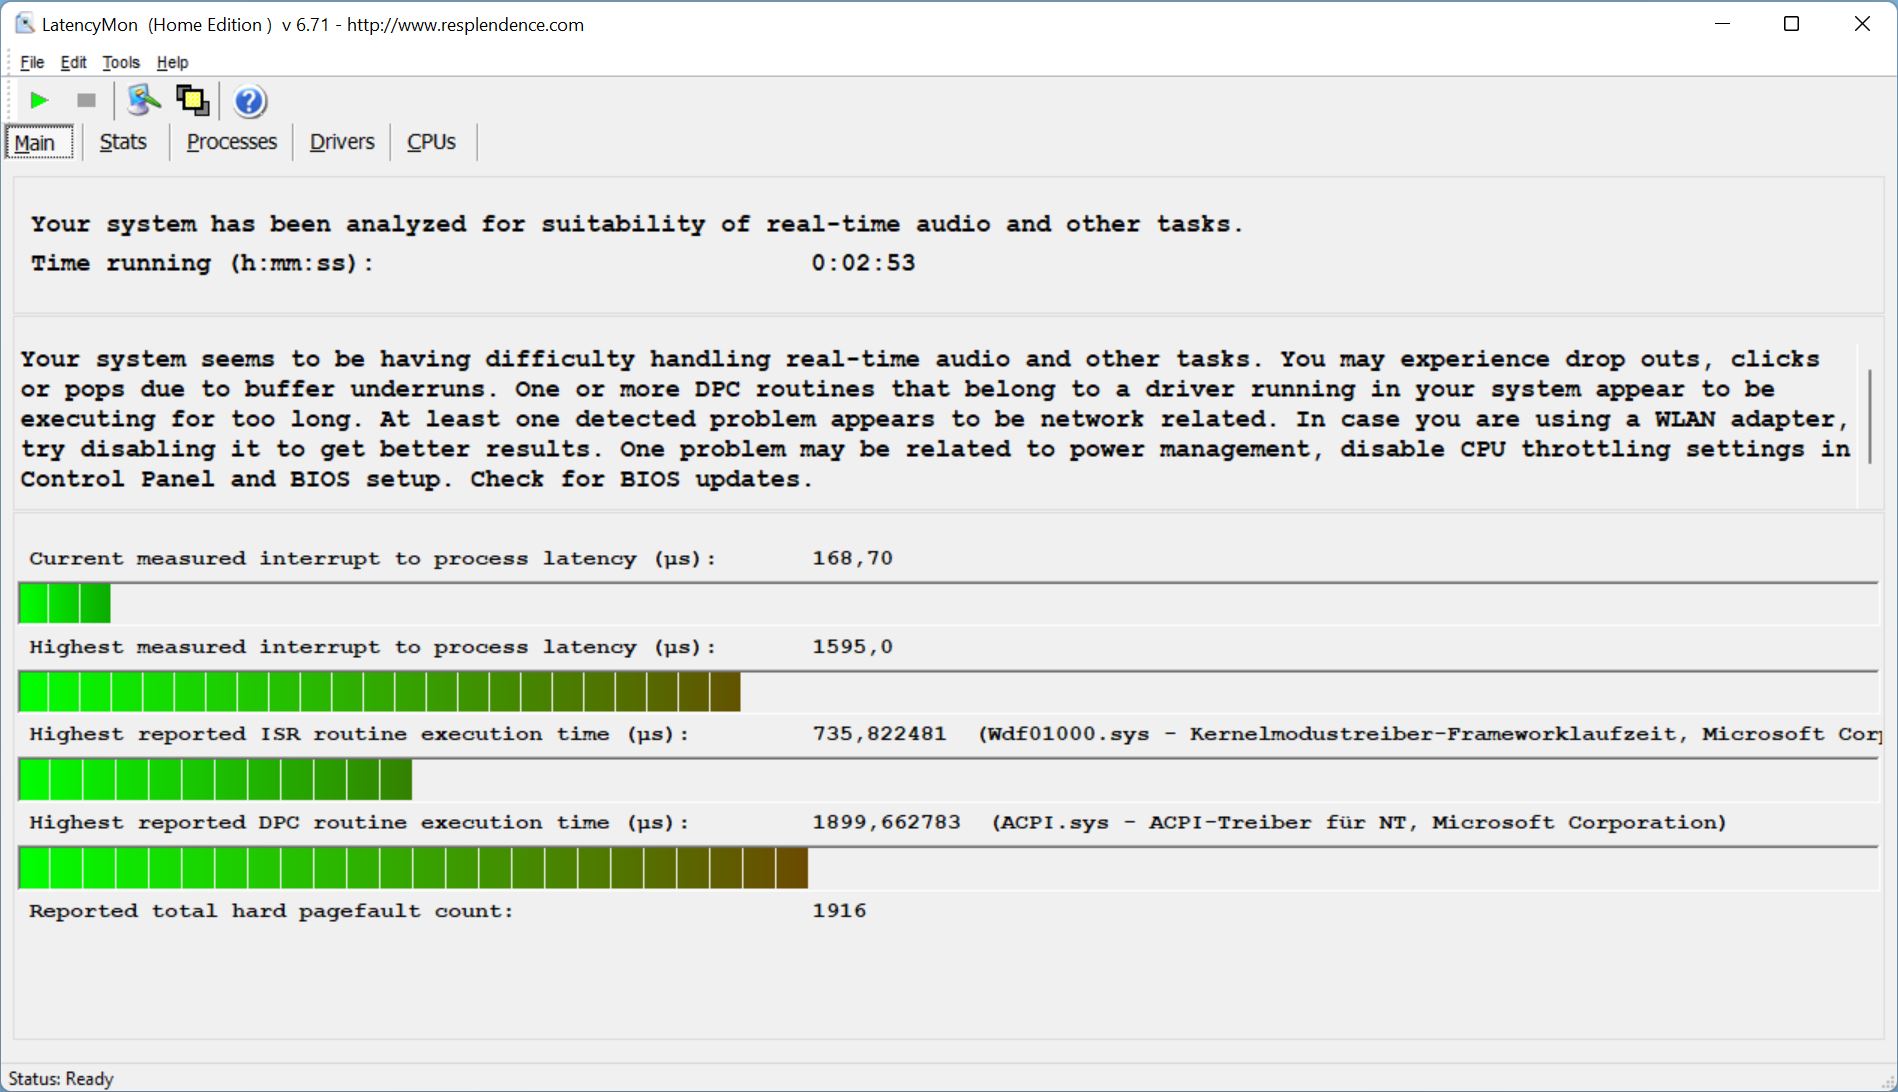
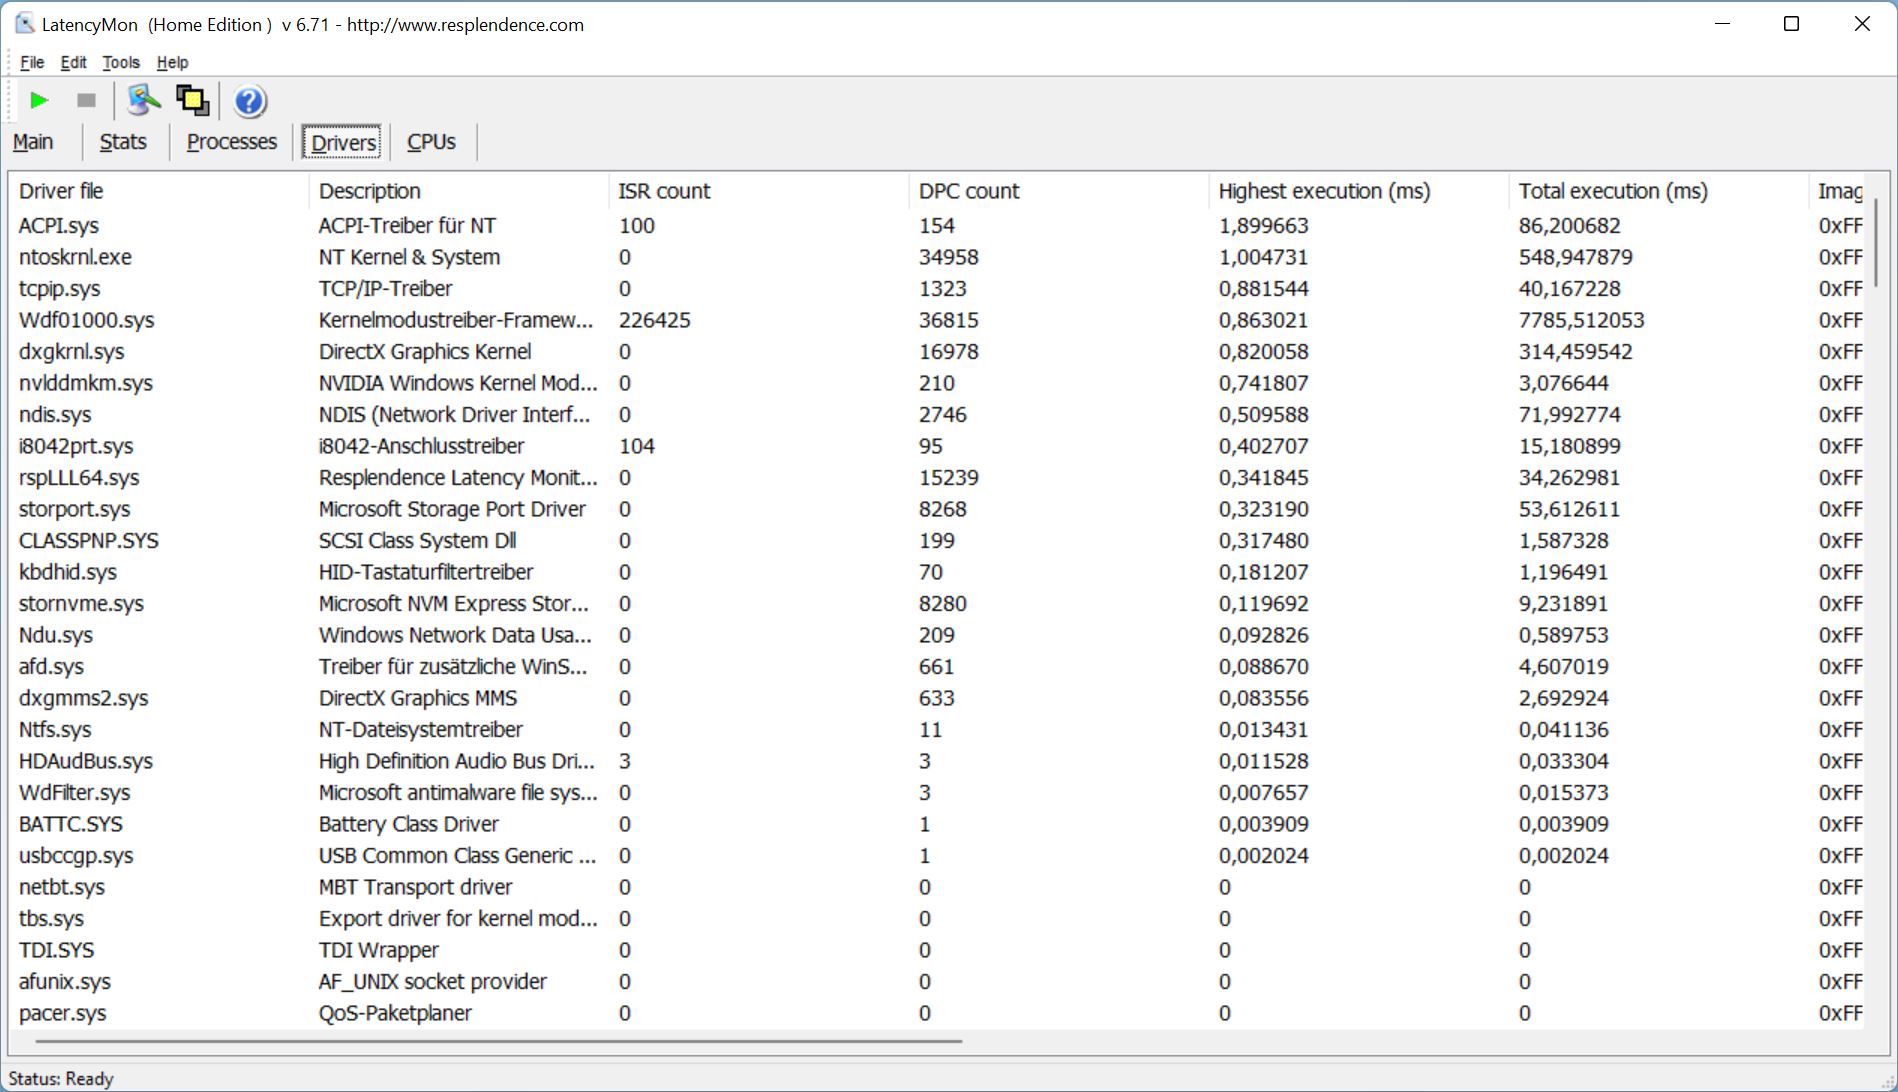
Latência do DPC
A LatencyMon não detectou nenhum problema quando um navegador foi aberto. Este não foi, entretanto, o caso quando várias abas foram abertas ao mesmo tempo para exibir nossa página inicial. A latência é decepcionantemente alta para um laptop criador.
No entanto, a reprodução de nossos vídeos 4K 60FPS no YouTube foi suave e não resultou em nenhuma queda de quadros
Durante nossa revisão, tivemos um erro de tela azul logo após a inicialização do laptop. Esperamos que o fabricante possa corrigir rapidamente os problemas através de uma atualização da BIOS.
| DPC Latencies / LatencyMon - interrupt to process latency (max), Web, Youtube, Prime95 | |
| MSI Creator Z17 A12UGST-054 | |
| Aorus 17X XES | |
| MSI Creator 17 A10SGS | |
| Razer Blade 17 (i7-12800H, RTX 3070 Ti) | |
| MSI Creator Z16P B12UHST | |
| Dell XPS 17 9720 RTX 3060 | |
* ... menor é melhor
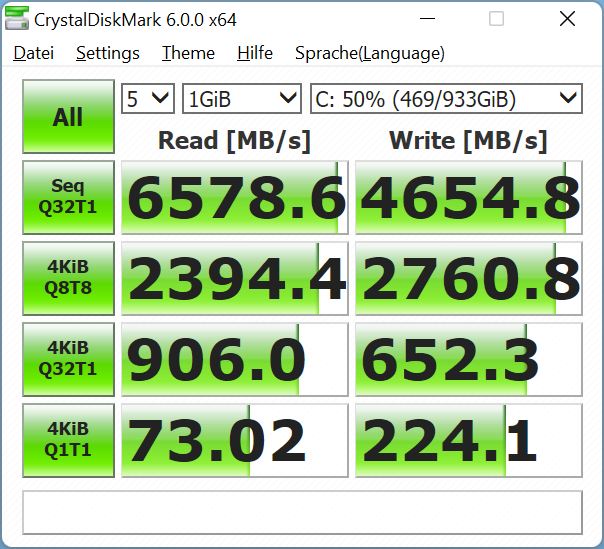
Armazenamento em massa
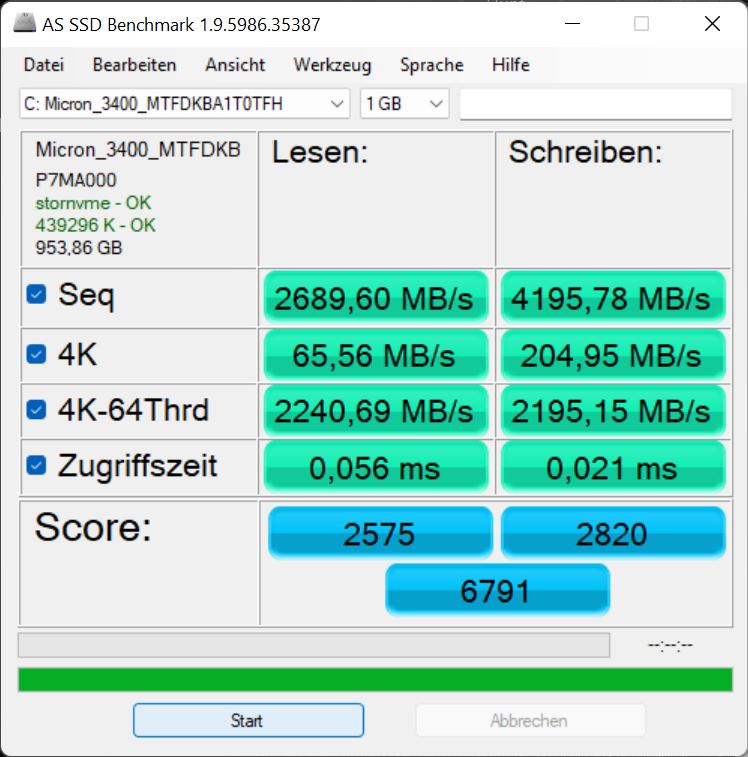
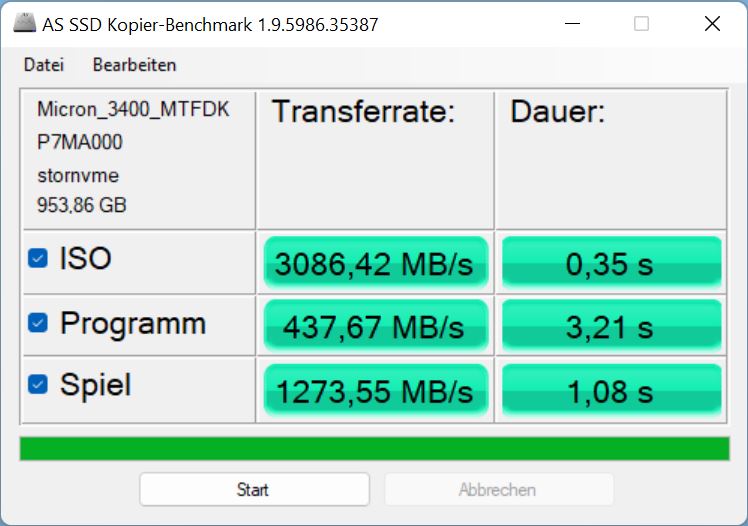
Em nosso modelo, a MSI instalou um Micron 3400 SSD com uma capacidade de 1 TB. A unidade PCIe 4 ocupa a 63ª posição no nosso gráfico de comparação de SSD https://www.notebookcheck.net/Laptop-harddisks-HDD-SSD-benchmarks.22089.0.html. O fabricante alega que tem uma velocidade máxima de leitura de 6.600 MB/s - algo que nossas medidas podem definitivamente atestar. O acionamento também tem um desempenho sustentado muito estável.
No entanto, o Samsung PM9A1 aciona no Lâmina Razer 17 e da própria MSI Z16P são um pouco mais rápidos, assim como o SSD Gigabyte no Aorus. Mas esta pequena diferença dificilmente poderia explicar o desempenho bastante ruim do sistema Z17.

* ... menor é melhor
Sustained Read Performance: DiskSpd Read Loop, Queue Depth 8
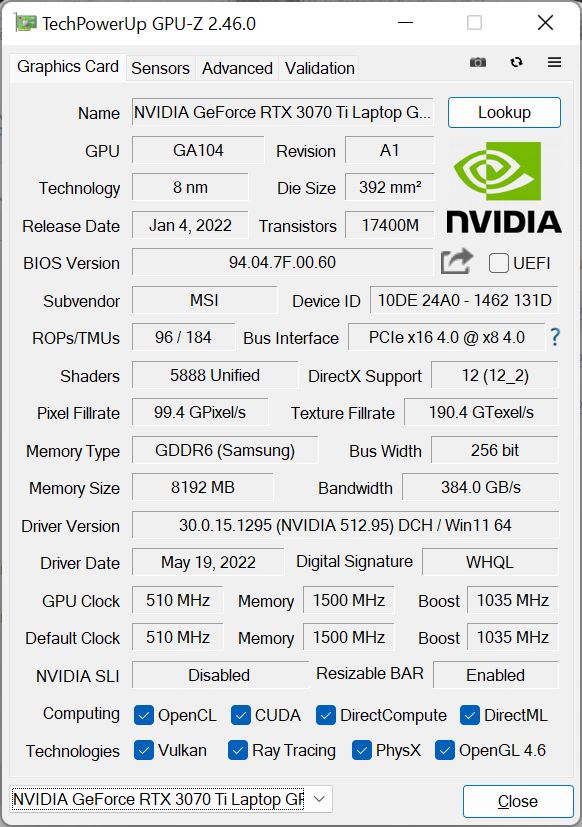
Placa gráfica
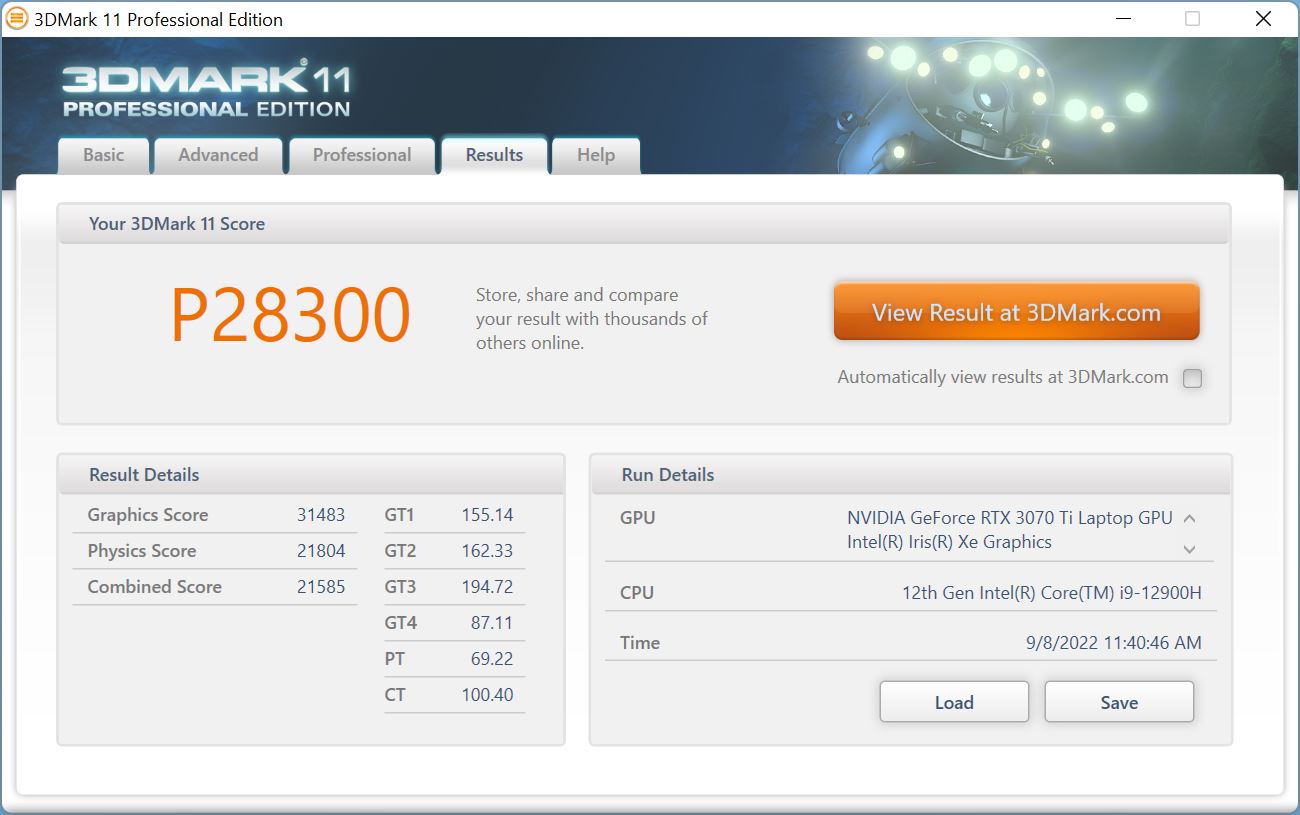
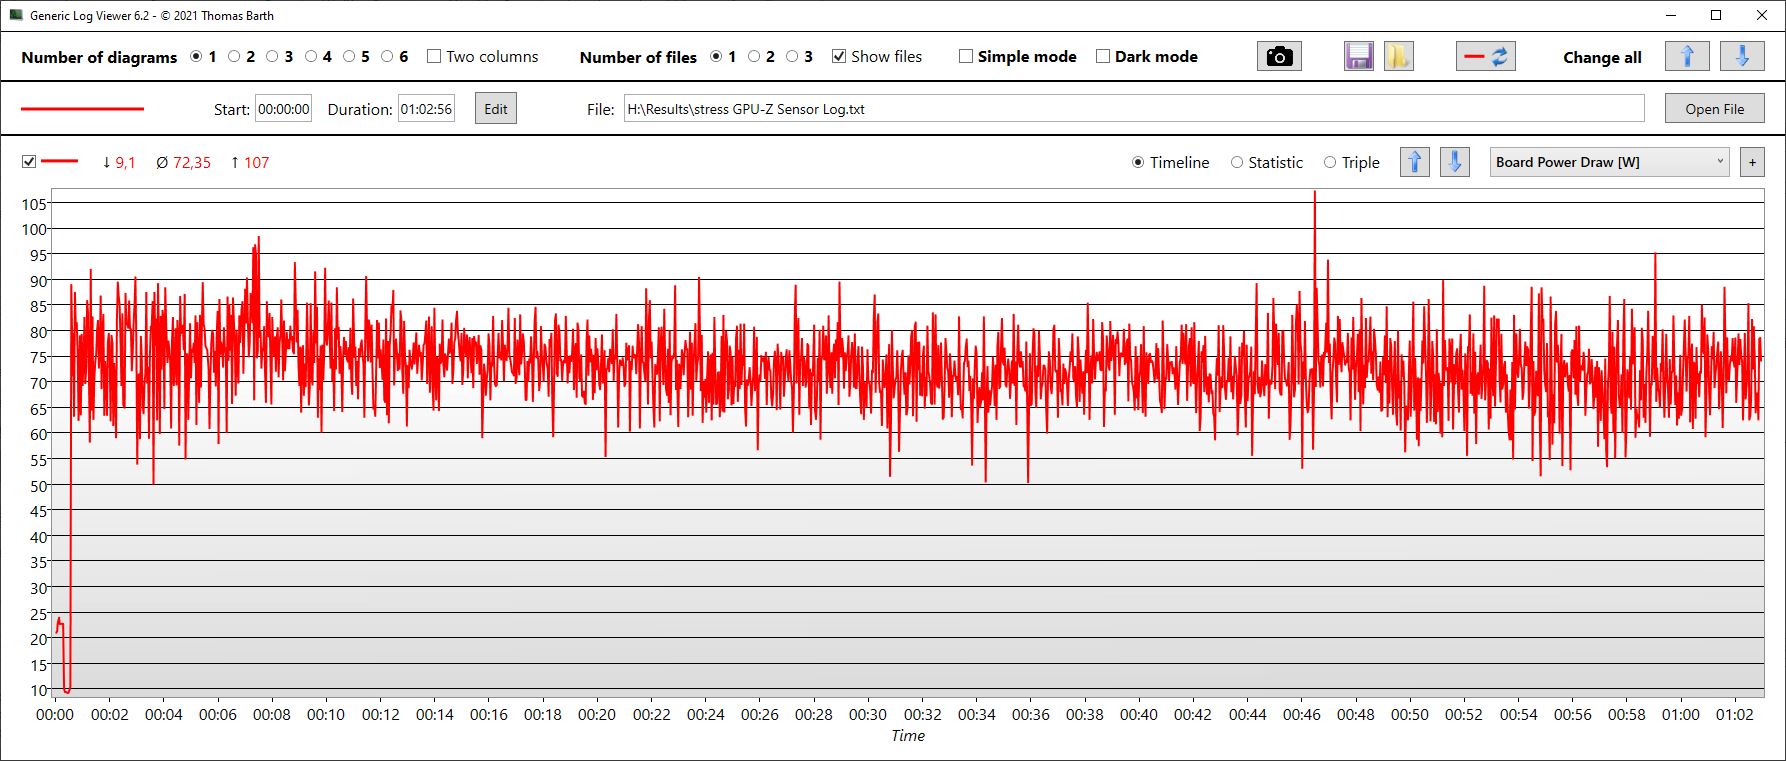
O Z17 apresenta um GeForce RTX 3070 Ti com 8 GB de memória de vídeo. Teoricamente, esta é uma placa gráfica muito poderosa, mas só tem acesso a 90 watts de potência (incluindo o Dynamic Boost) no fino Z17. Para comparação, a GPU no Lâmina 17 tem 150 watts à sua disposição.
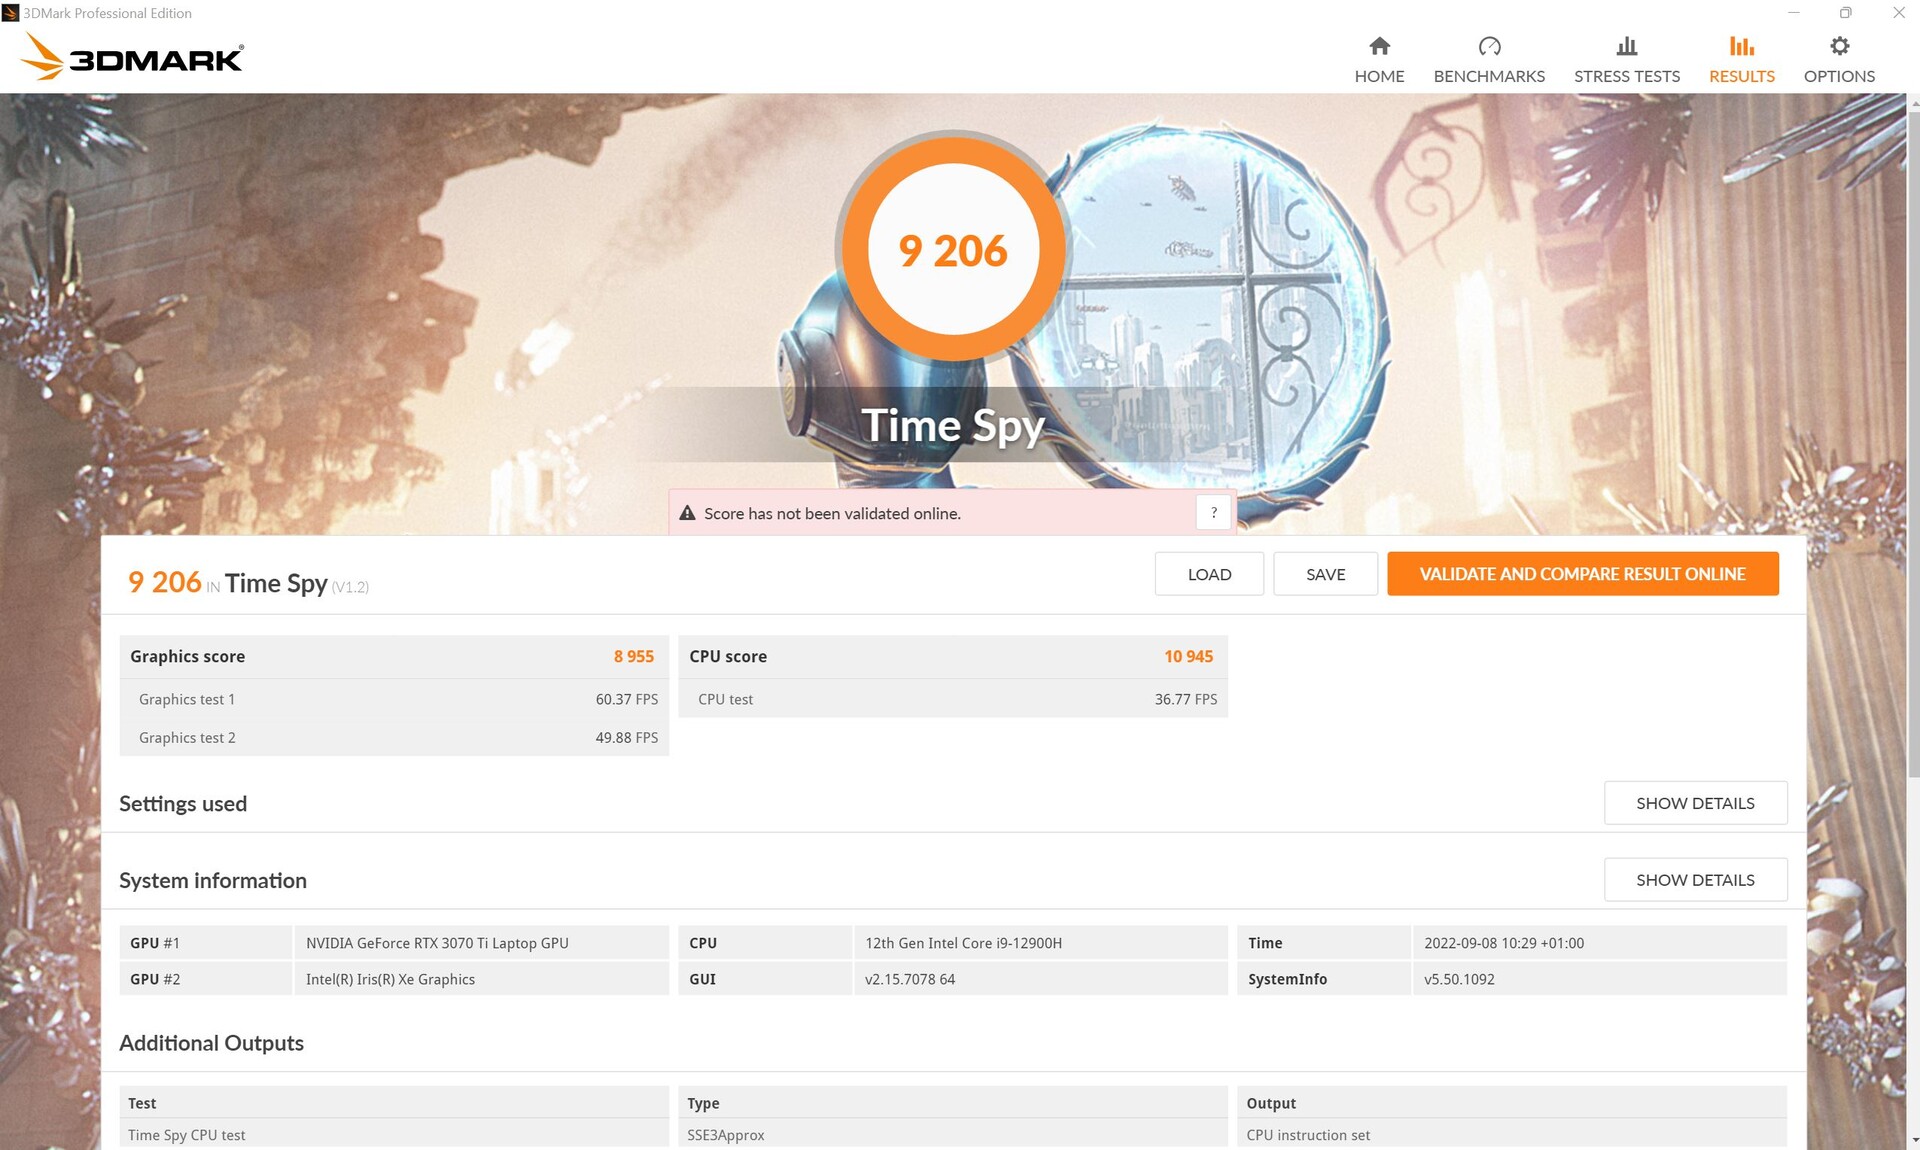
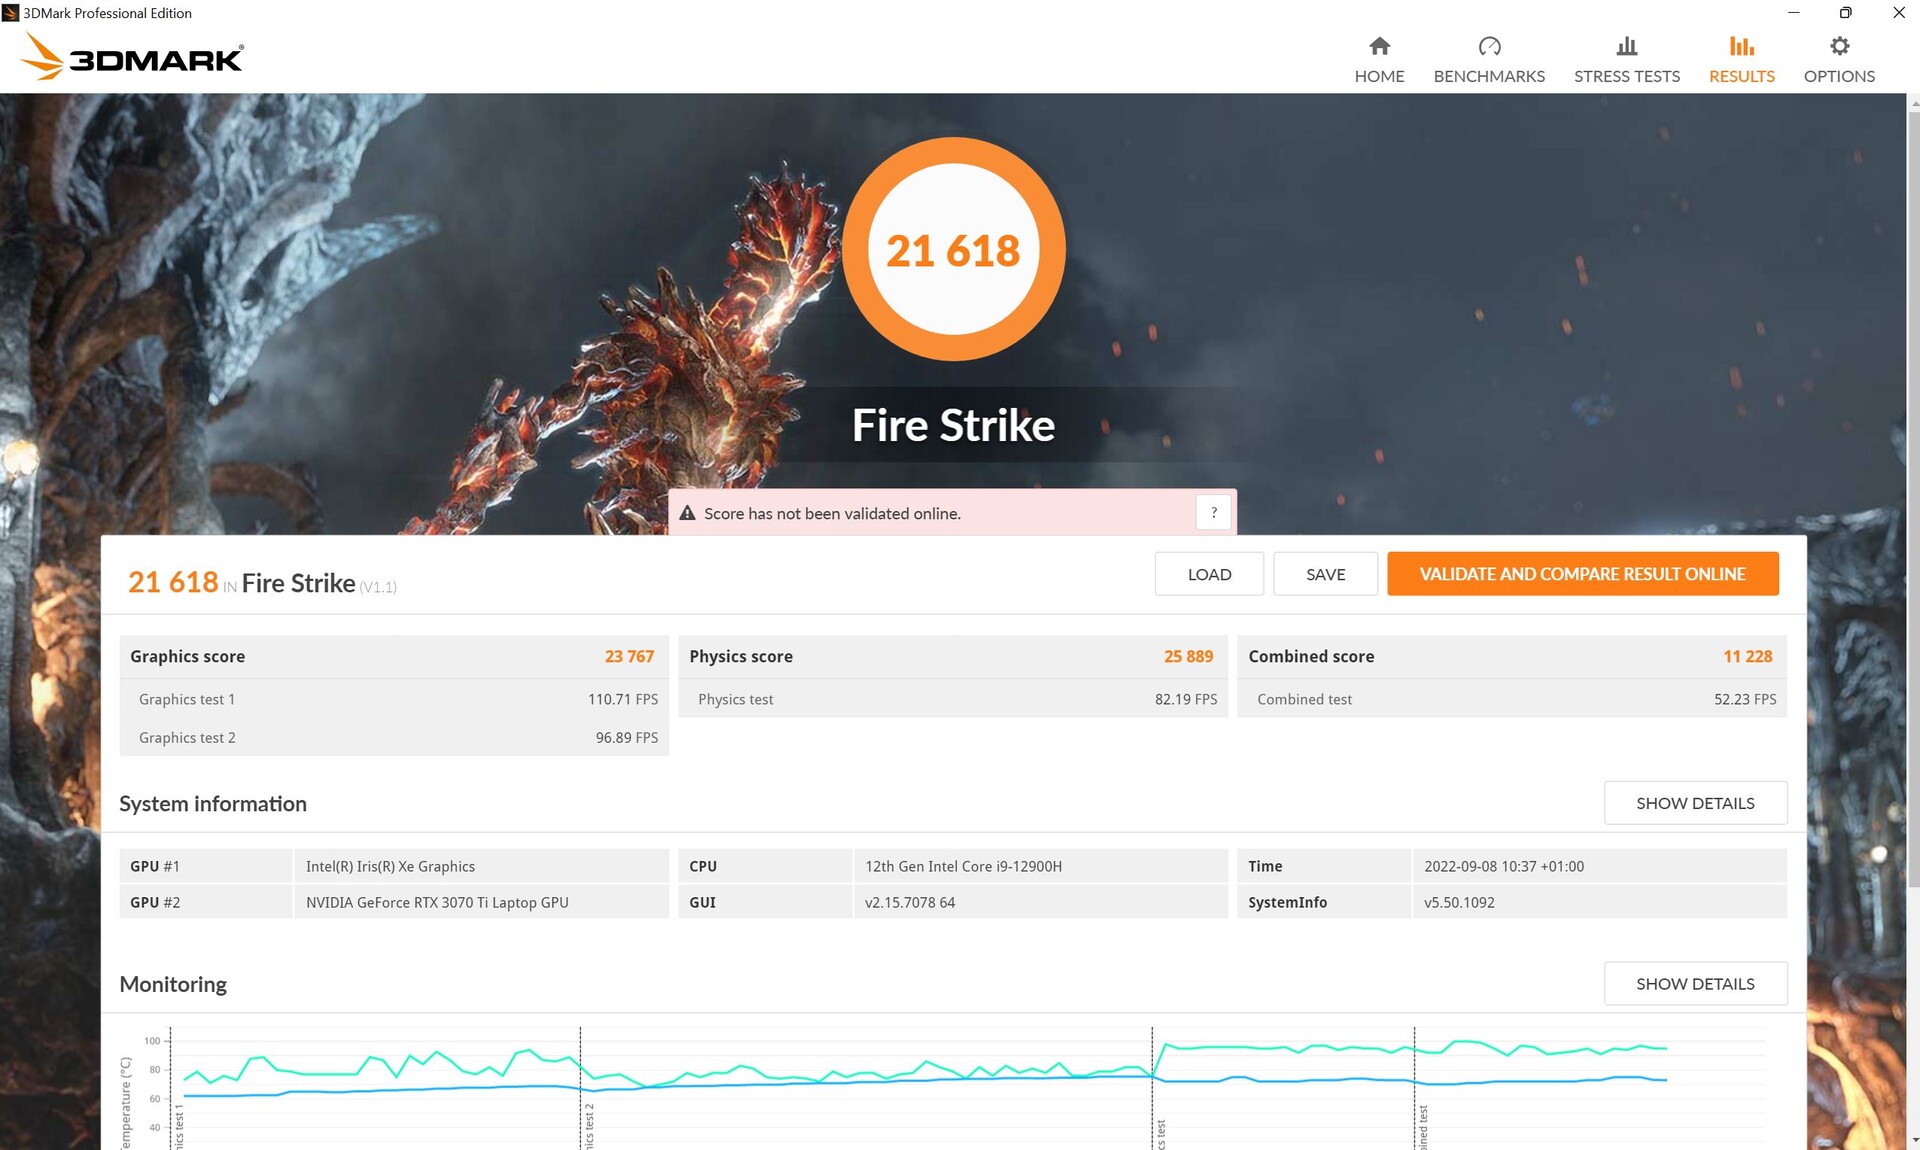
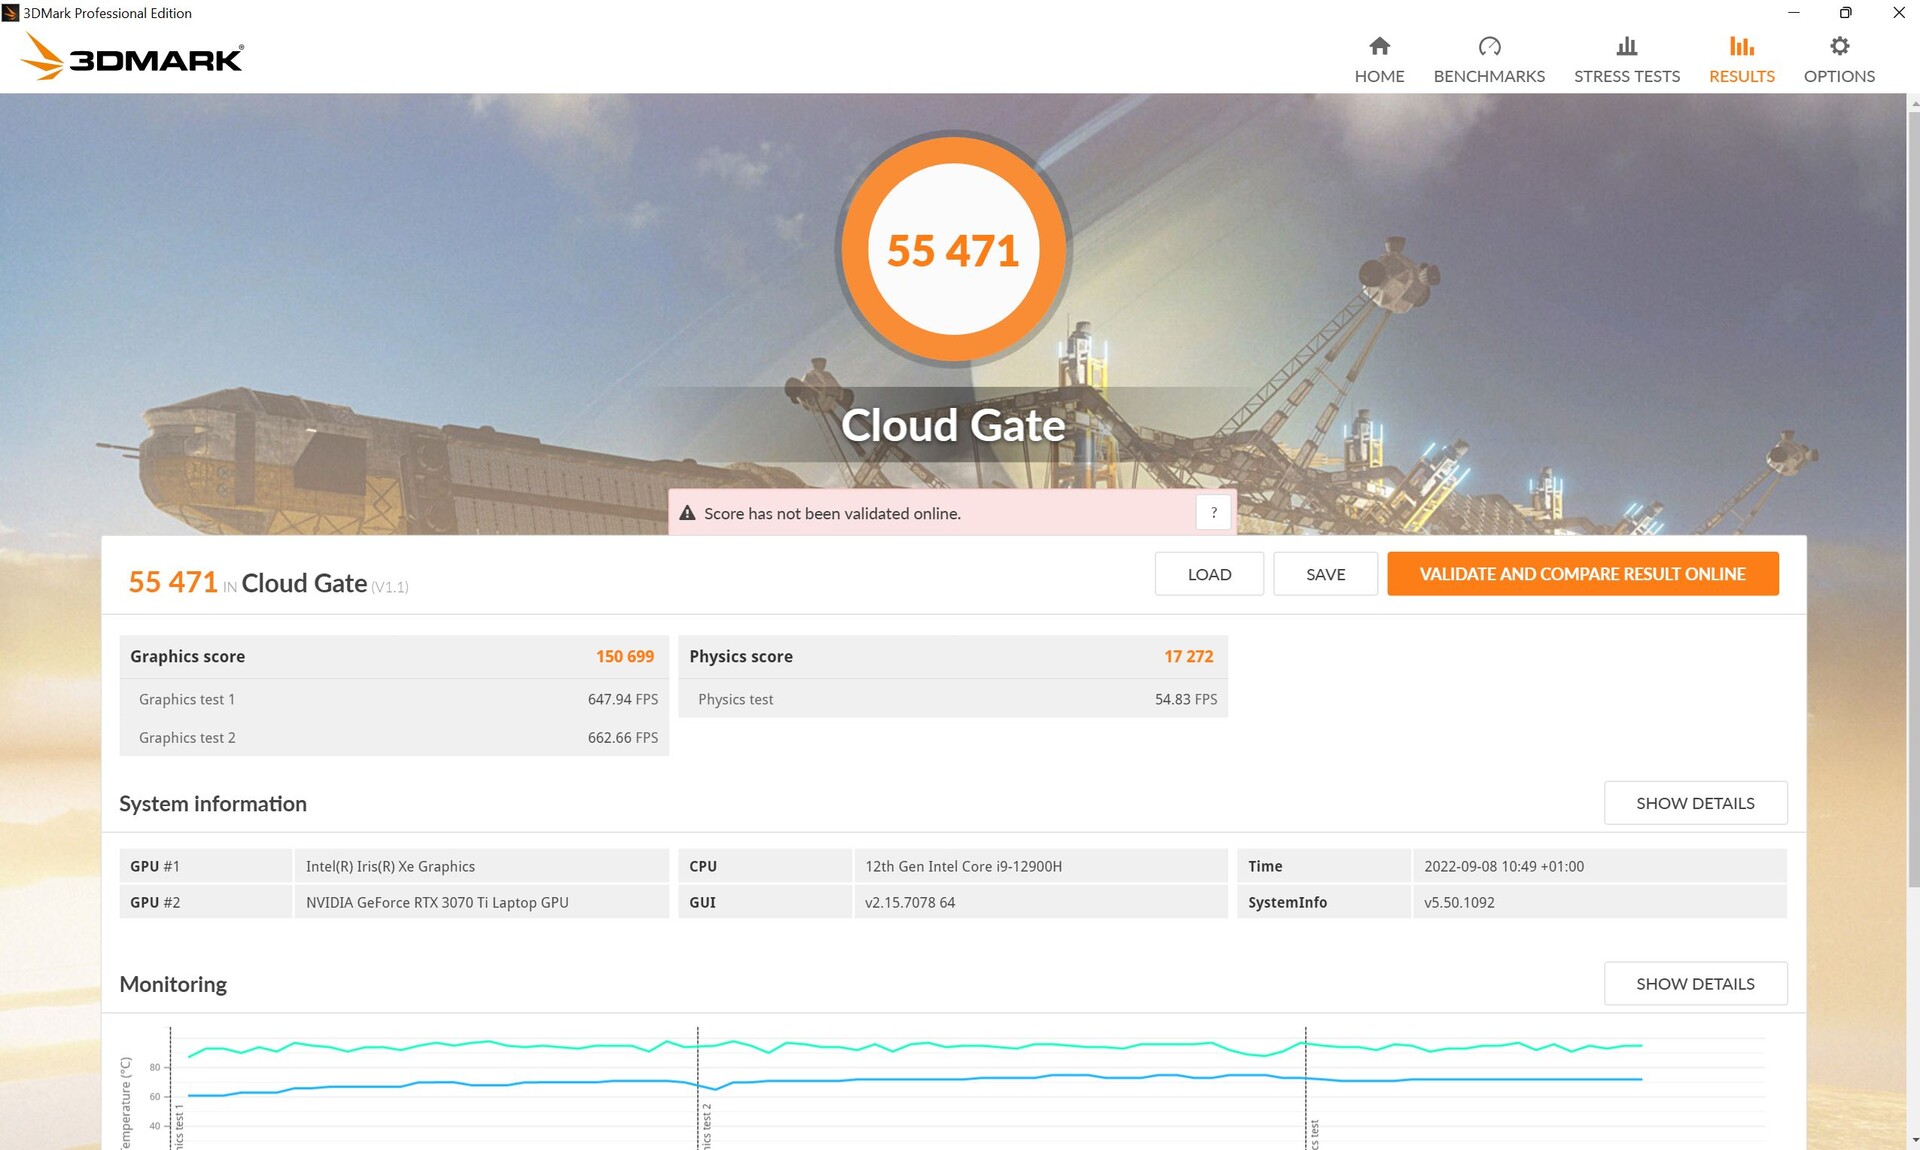
Conseqüentemente, o desempenho do Criador Z17 nos benchmarks sintéticos 3DMark está pelo menos 5% abaixo da média de todos os laptops com a mesma GPU.
Enquanto funcionando com bateria, o laptop perdeu cerca de 45% do desempenho de sua GPU no 3DMark 11.
| 3DMark 11 Performance | 28300 pontos | |
| 3DMark Cloud Gate Standard Score | 55471 pontos | |
| 3DMark Fire Strike Score | 21618 pontos | |
| 3DMark Time Spy Score | 9206 pontos | |
Ajuda | ||
| Blender | |
| v3.3 Classroom OPTIX/RTX | |
| Média da turma Multimedia (12 - 105, n=22, últimos 2 anos) | |
| Aorus 17X XES | |
| v3.3 Classroom CUDA | |
| Média da turma Multimedia (20 - 186, n=22, últimos 2 anos) | |
| Aorus 17X XES | |
| v3.3 Classroom CPU | |
| Média da turma Multimedia (134.5 - 1042, n=62, últimos 2 anos) | |
| Aorus 17X XES | |
* ... menor é melhor
Desempenho do jogo
A grande exibição em Far Cry 5 parece ser mais ou menos uma exceção. No total, avaliado em 90 watts, o RTX 3070 Ti realizou pelo menos 5 a 10 por cento abaixo da média. Em comparação com o Lâmina 17os diferenciais de desempenho podem chegar a 20 por cento, dependendo do jogo e das configurações utilizadas. Dito isto, a diferença é muito menos dramática na maioria dos jogos.
| The Witcher 3 | |
| 1920x1080 High Graphics & Postprocessing (Nvidia HairWorks Off) | |
| Média NVIDIA GeForce RTX 3070 Ti Laptop GPU (139.7 - 226, n=27) | |
| Razer Blade 17 (i7-12800H, RTX 3070 Ti) | |
| MSI Creator Z17 A12UGST-054 | |
| Aorus 17X XES | |
| MSI Creator Z16P B12UHST | |
| MSI Creator 17 A10SGS | |
| Dell XPS 17 9720 RTX 3060 | |
| Média da turma Multimedia (22 - 224, n=7, últimos 2 anos) | |
| 1920x1080 Ultra Graphics & Postprocessing (HBAO+) | |
| Razer Blade 17 (i7-12800H, RTX 3070 Ti) | |
| Média NVIDIA GeForce RTX 3070 Ti Laptop GPU (76.8 - 124.1, n=39) | |
| Aorus 17X XES | |
| MSI Creator Z17 A12UGST-054 | |
| MSI Creator 17 A10SGS | |
| MSI Creator Z16P B12UHST | |
| Dell XPS 17 9720 RTX 3060 | |
| Média da turma Multimedia (11 - 121, n=7, últimos 2 anos) | |
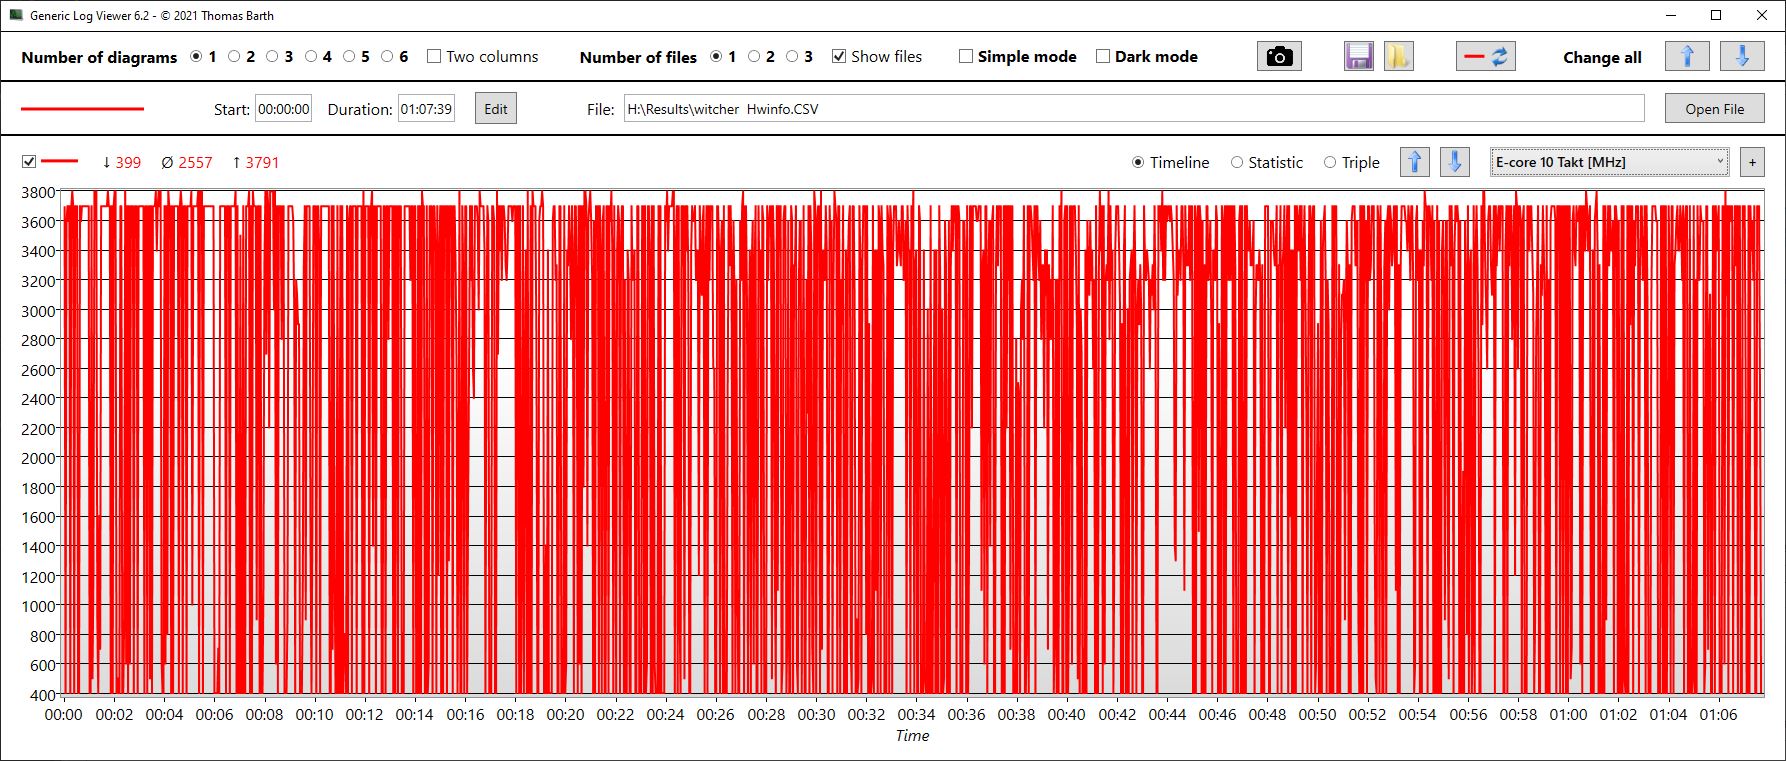
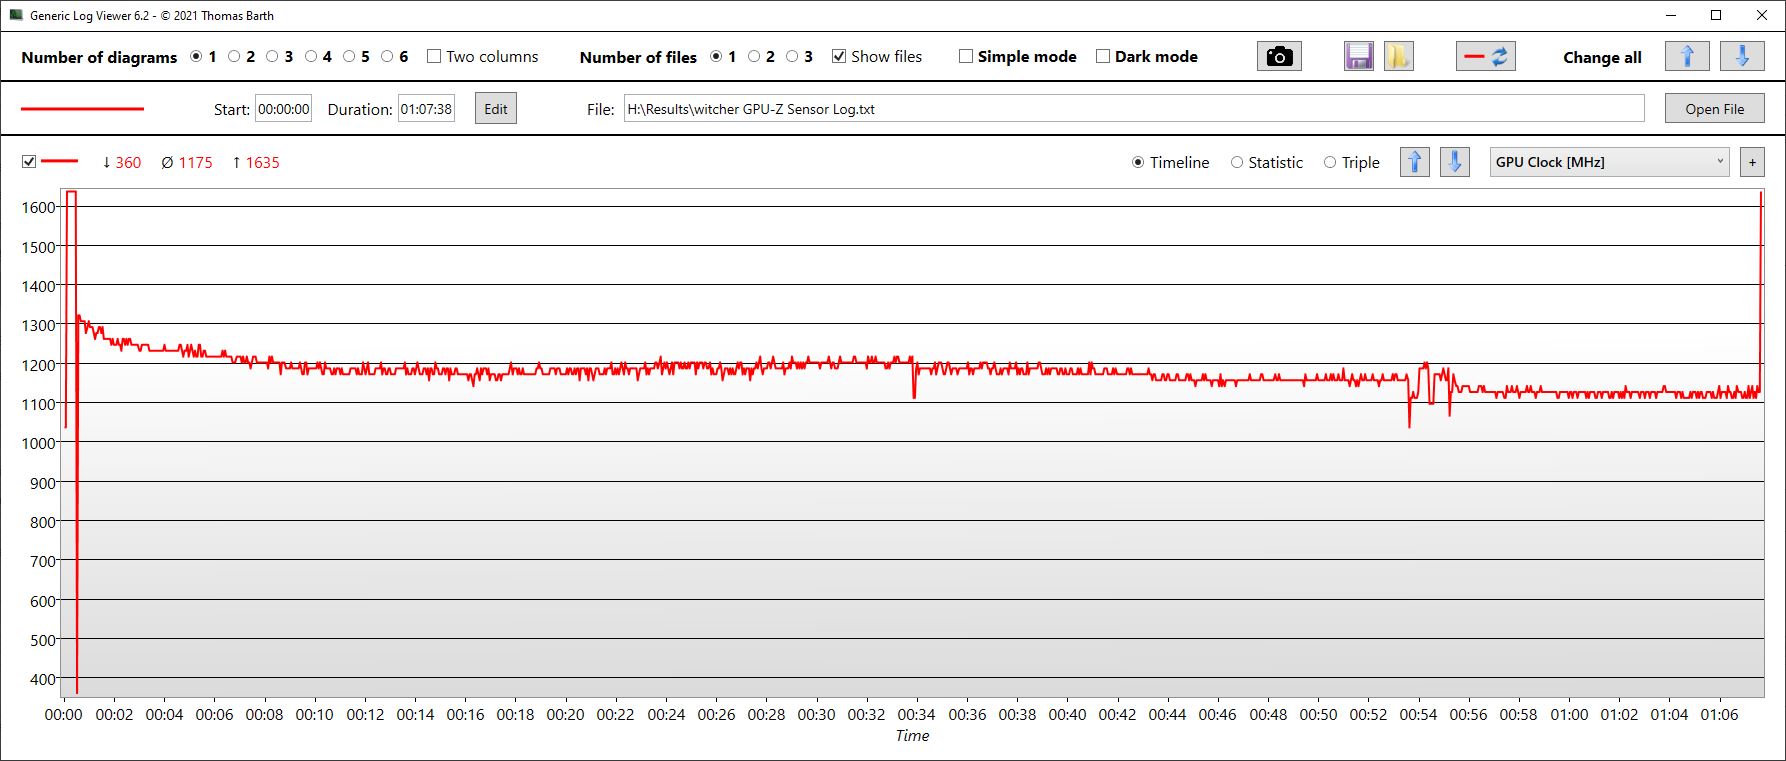
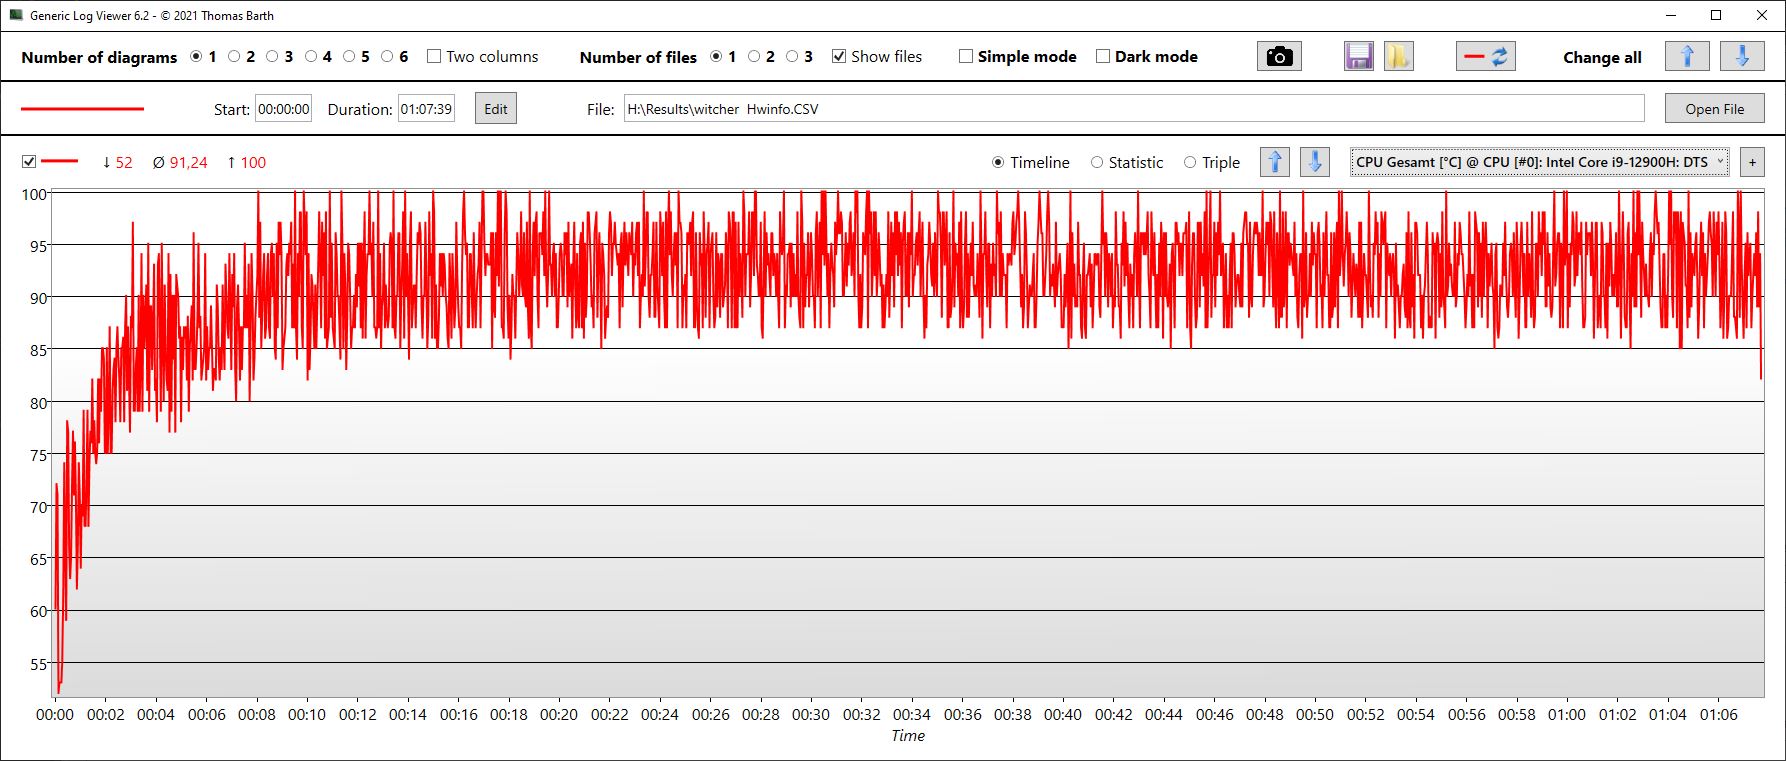
Durante o teste de laço Witcher 3, o desempenho diminuiu no decorrer de uma hora. Entre o início e o final, a taxa de quadros caiu 18%, o que é bastante. Isto pode ser devido às altas temperaturas que impedem o Z17 de fornecer constantemente seu desempenho máximo.
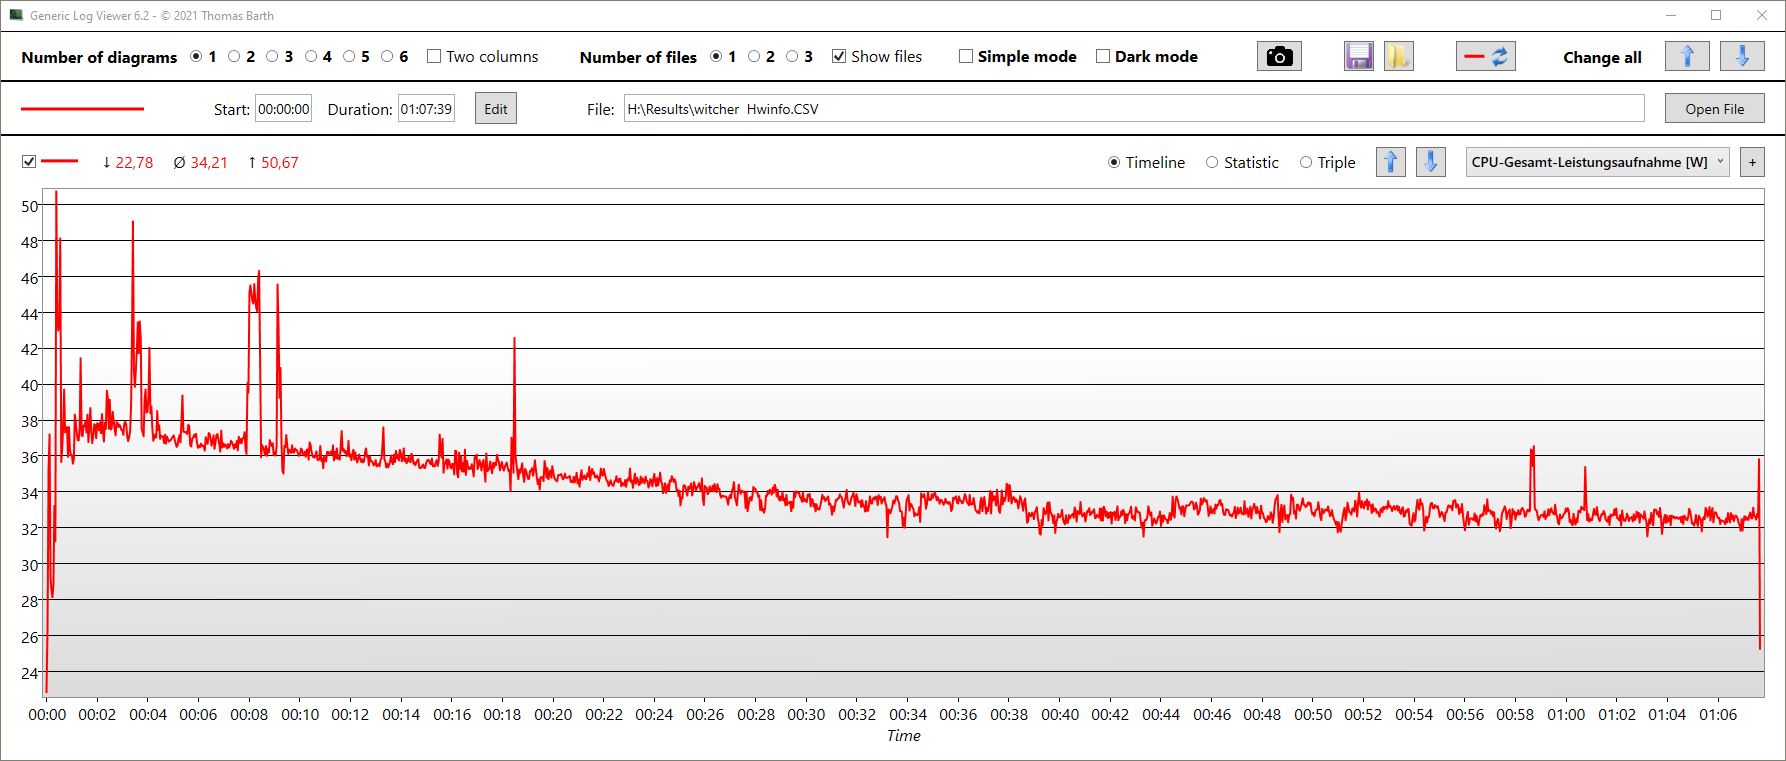
As velocidades do relógio da CPU flutuaram entre 2,5 e 3,3 GHz (dependendo do núcleo), com temperaturas médias de CPU de 91°C (196°F). O consumo total de energia diminuiu de 50 para 34 watts ao longo da duração do teste.
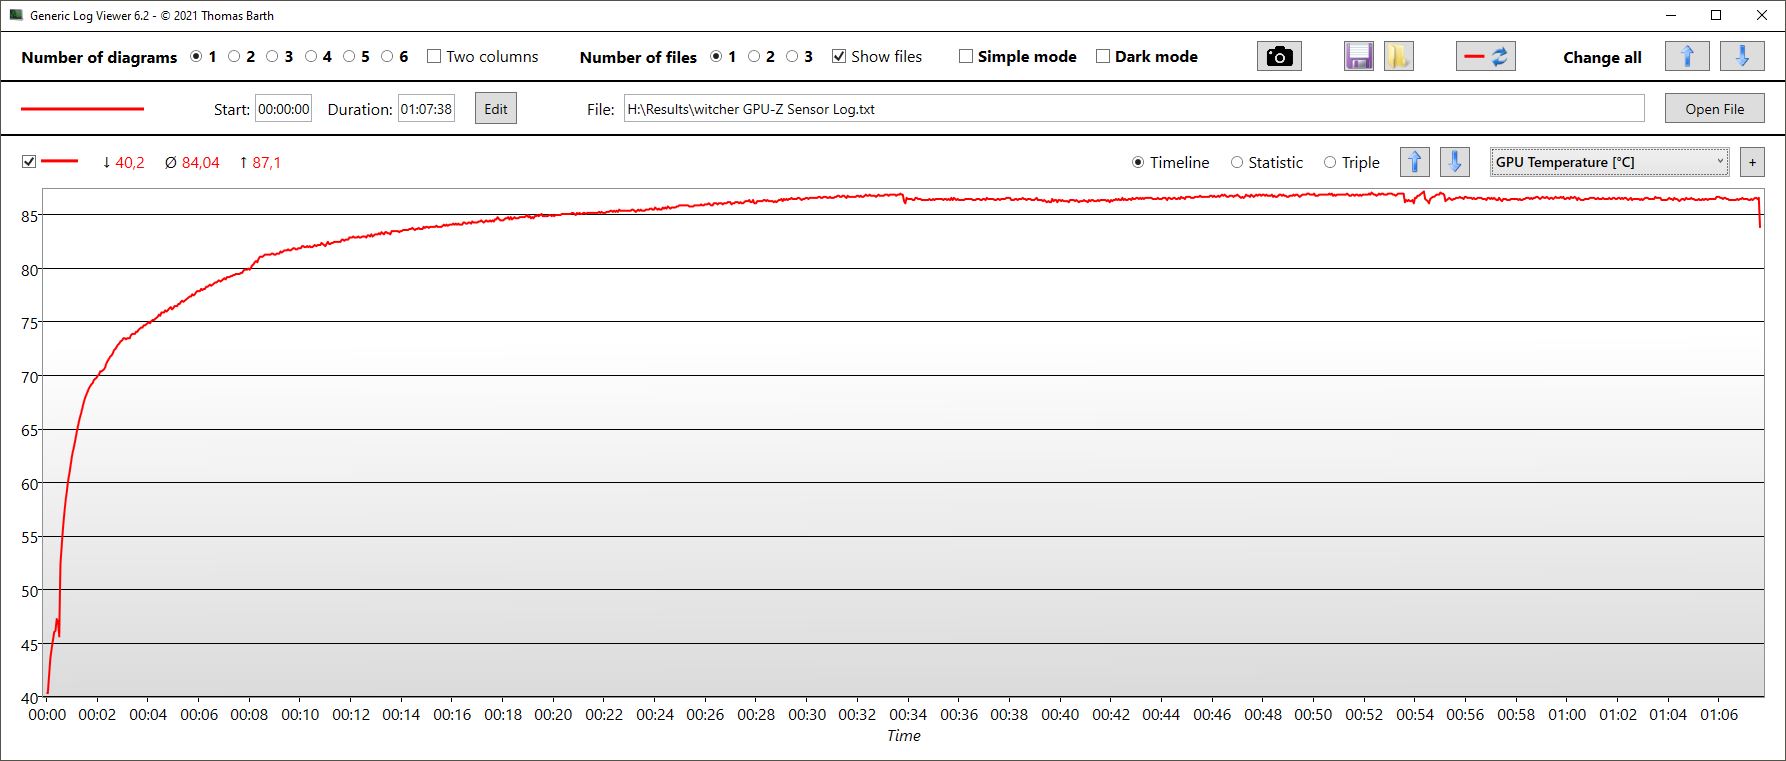
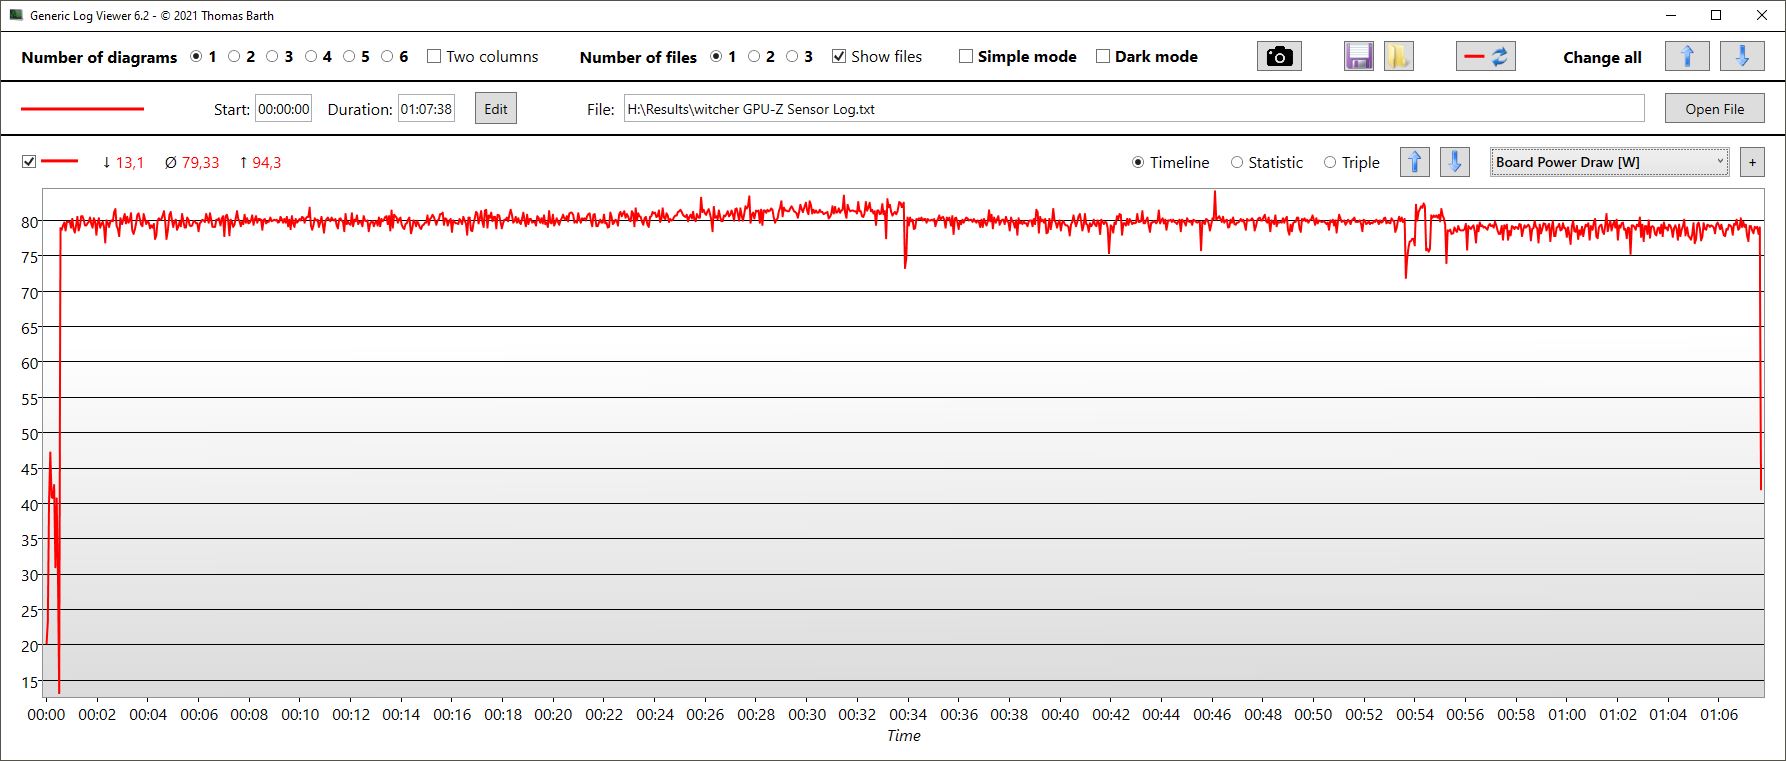
Ao mesmo tempo, a velocidade do relógio GPU atingiu brevemente 1,6 GHz antes de cair para apenas 1,1 GHz. A velocidade do relógio de memória permaneceu constante. As temperaturas da GPU ficaram em torno de 84°C (183°F), mas houve pontos quentes que atingiram 99°C (210°F). A GPU consumiu aproximadamente 79 watts de potência no total.
Witcher 3, FPS graph
| baixo | média | alto | ultra | QHD | |
|---|---|---|---|---|---|
| GTA V (2015) | 118.7 | 90.7 | |||
| The Witcher 3 (2015) | 307 | 289.4 | 165.6 | 90.5 | |
| Dota 2 Reborn (2015) | 191.9 | 177.5 | 168.3 | 158.5 | |
| Final Fantasy XV Benchmark (2018) | 186.6 | 117.9 | 85.4 | 62.5 | |
| X-Plane 11.11 (2018) | 152.5 | 135.3 | 107.6 | ||
| Far Cry 5 (2018) | 187 | 145 | 137 | 124 | 93 |
| Strange Brigade (2018) | 160.6 | 119.8 | |||
| Dying Light 2 (2022) | 100 | 81 | 67.2 | 46.7 |
Emissões - O Criador Z17 é quente e barulhento
Emissões sonoras
Os ventiladores no Z17 quase nunca param de funcionar, tornando assim o laptop fino mais alto do que seus concorrentes, mesmo em modo ocioso. O modo "Silencioso" no MSI Center Pro é quase uma brincadeira. Depois de ativá-lo, é muito provável que você esteja esperando em vão que os ventiladores parem de girar em algum momento.
Infelizmente, a situação de ruído continua quando o dispositivo está sob carga. Somente o Aorus mais grosso e significativamente mais performante é marginalmente mais alto sob estresse. Para ilustrar melhor o ponto, o Lâmina Razer 17o Z17, que é pelo menos tão rápido, é 10 a 30% mais silencioso que o Z17 sob carga.
Barulho
| Ocioso |
| 31.8 / 31.8 / 31.8 dB |
| Carga |
| 53.9 / 54.9 dB |
 | ||
30 dB silencioso 40 dB(A) audível 50 dB(A) ruidosamente alto |
||
min: | ||
| MSI Creator Z17 A12UGST-054 GeForce RTX 3070 Ti Laptop GPU, i9-12900H, Micron 3400 1TB MTFDKBA1T0TFH | MSI Creator 17 A10SGS GeForce RTX 2080 Super Max-Q, i7-10875H, Samsung SSD PM981 MZVLB2T0HMLB | MSI Creator Z16P B12UHST GeForce RTX 3080 Ti Laptop GPU, i9-12900H, Samsung PM9A1 MZVL22T0HBLB | Razer Blade 17 (i7-12800H, RTX 3070 Ti) GeForce RTX 3070 Ti Laptop GPU, i7-12800H, Samsung PM9A1 MZVL21T0HCLR | Aorus 17X XES GeForce RTX 3070 Ti Laptop GPU, i9-12900HX, Gigabyte AG470S1TB-SI B10 | Dell XPS 17 9720 RTX 3060 GeForce RTX 3060 Laptop GPU, i7-12700H, Samsung PM9A1 MZVL21T0HCLR | |
|---|---|---|---|---|---|---|
| Noise | -1% | 12% | 21% | -1% | 18% | |
| desligado / ambiente * (dB) | 26 | 30 -15% | 26 -0% | 23 12% | 26 -0% | 23.8 8% |
| Idle Minimum * (dB) | 31.8 | 32 -1% | 27 15% | 23 28% | 28 12% | 24.1 24% |
| Idle Average * (dB) | 31.8 | 33 -4% | 29 9% | 23 28% | 32 -1% | 24.1 24% |
| Idle Maximum * (dB) | 31.8 | 40 -26% | 31 3% | 23 28% | 38 -19% | 24.1 24% |
| Load Average * (dB) | 53.9 | 47 13% | 43 20% | 36.92 32% | 53 2% | 43.2 20% |
| Witcher 3 ultra * (dB) | 53.9 | 46 15% | 43 20% | 50 7% | 54 -0% | 48 11% |
| Load Maximum * (dB) | 54.9 | 48 13% | 46 16% | 50 9% | 55 -0% | 48 13% |
* ... menor é melhor
Temperatura
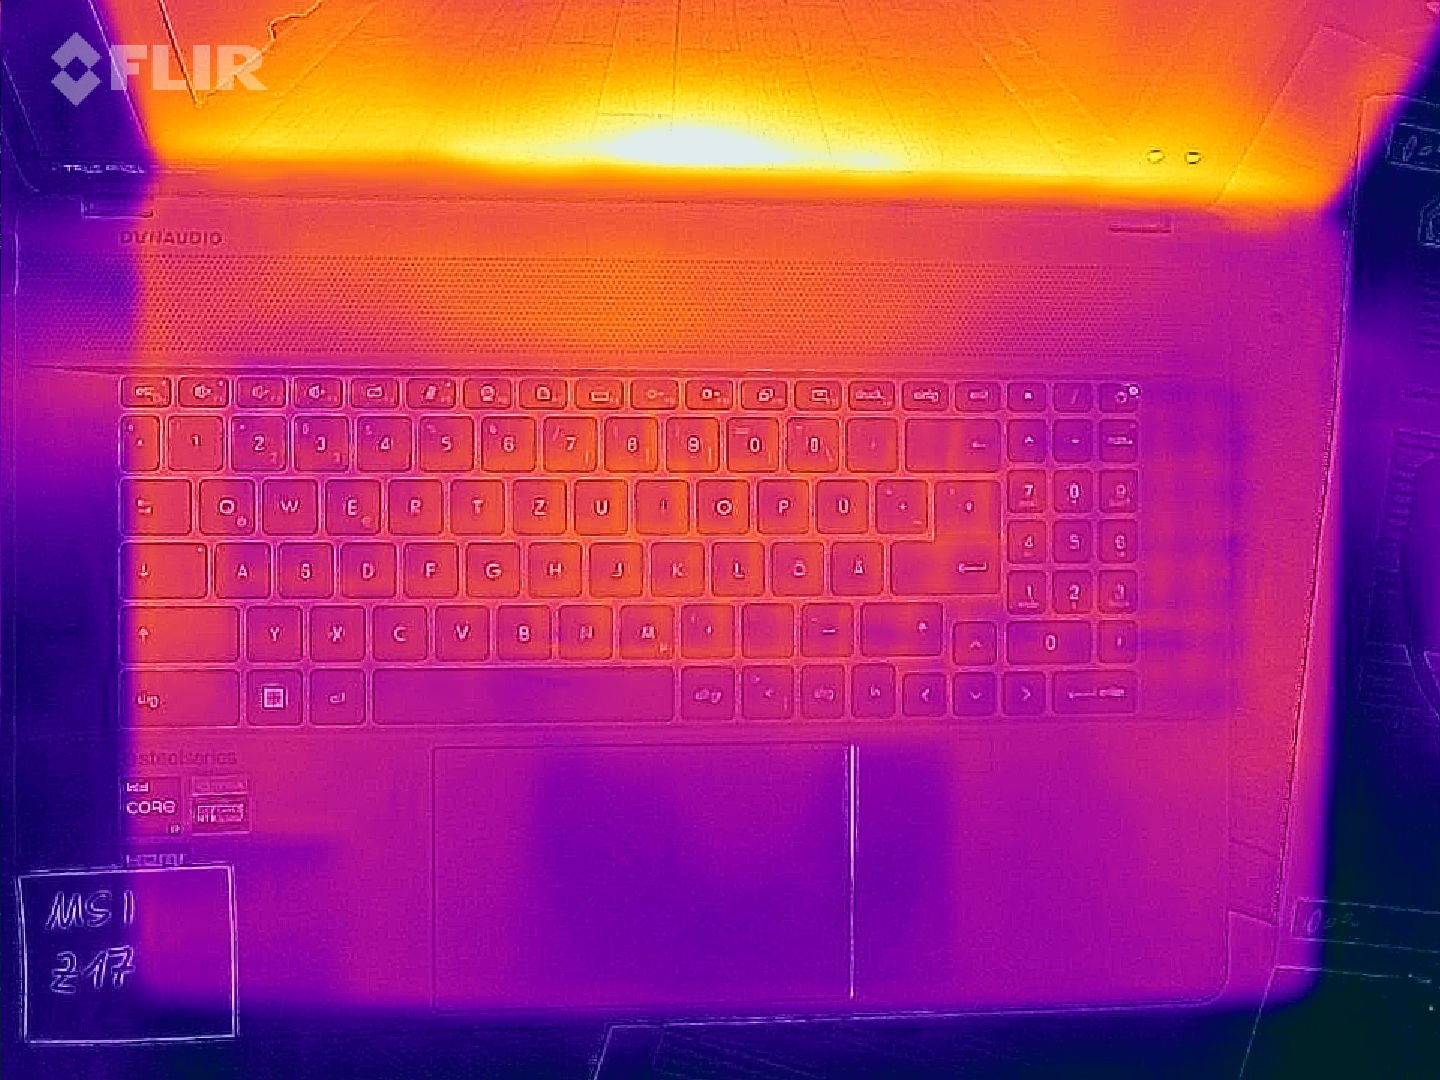
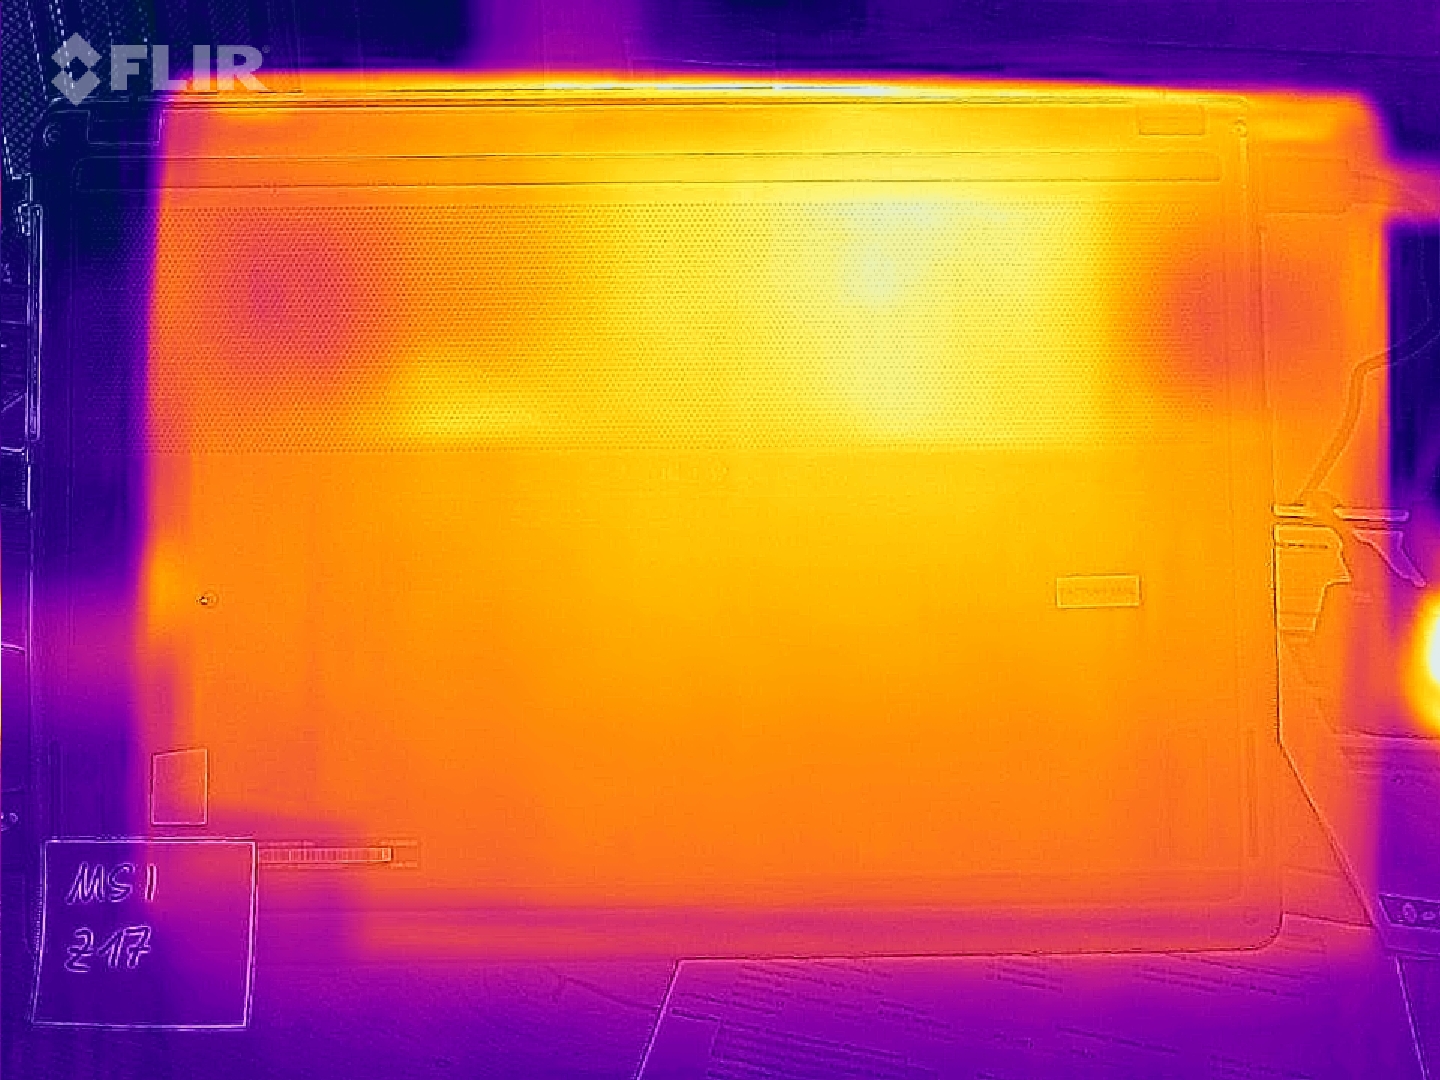
Você seria confundido por pensar que os ventiladores altos manteriam pelo menos o chassi frio. Sob carga (teste de esforço), havia pontos quentes com temperaturas de até 68°C (154°F) no meio do painel inferior (próximo ao display). Produtos concorrentes de outras empresas são pelo menos 10°C (50°F) mais frios, tanto sob carga quanto durante os jogos.
Mesmo os restos da palma da mão estavam próximos a 40°C (104°F) durante o teste de estresse e atingiram 36°C (97°F) quando o laptop estava rodando Witcher 3. Estes são também os valores mais altos dentro do grupo de comparação.
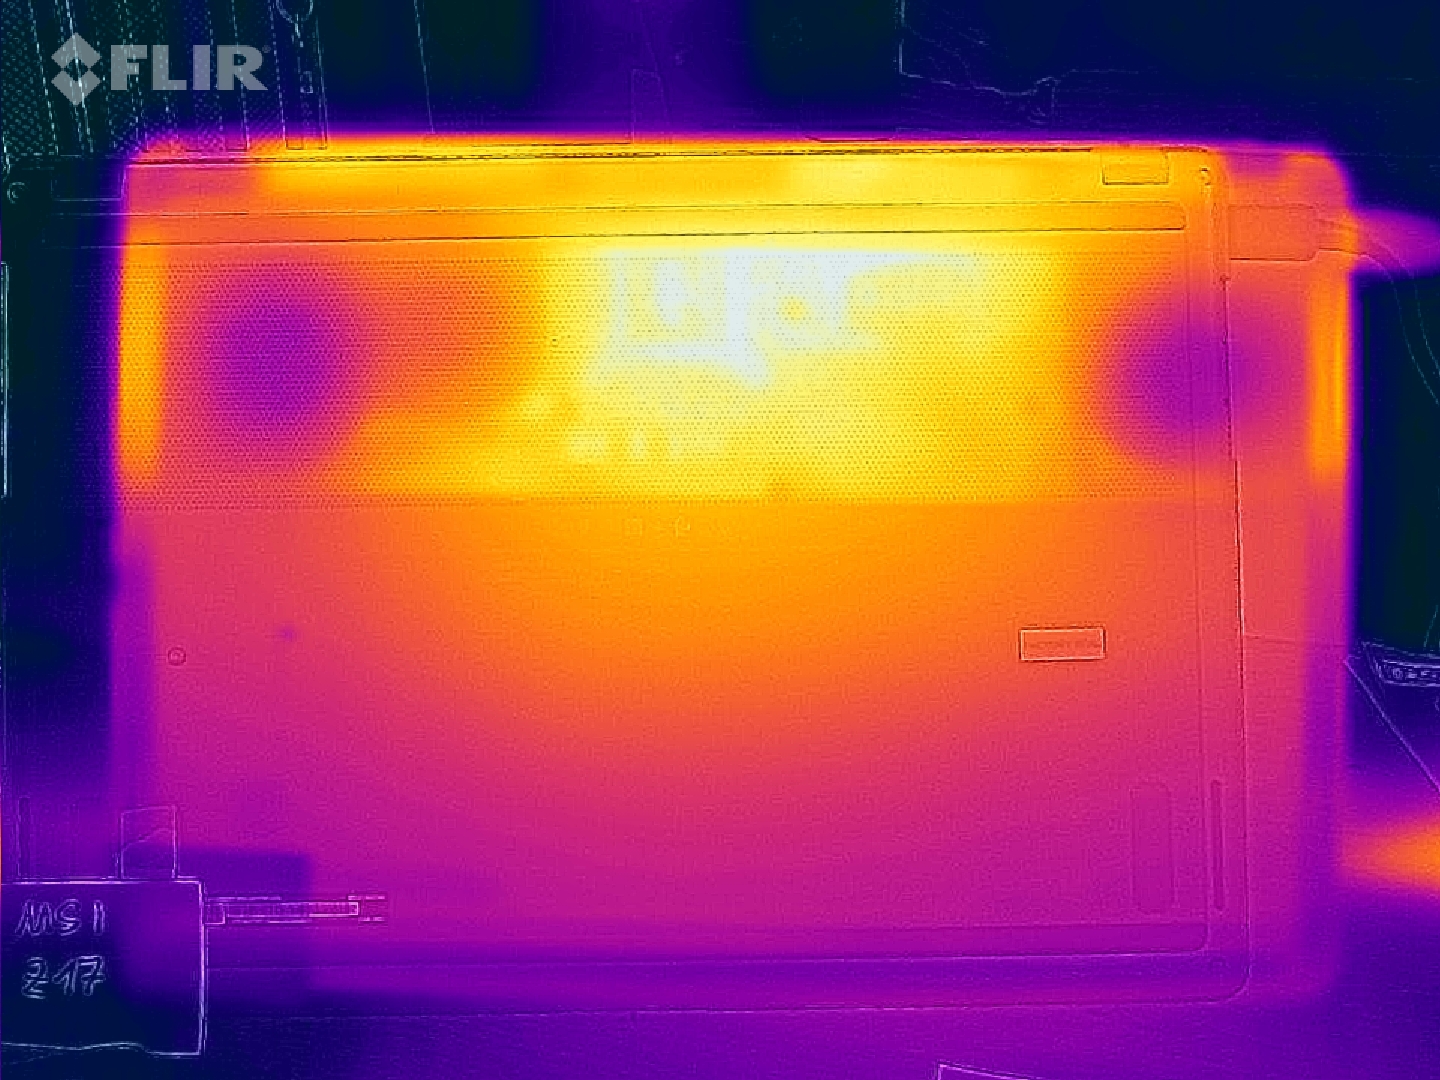
(-) A temperatura máxima no lado superior é 63.9 °C / 147 F, em comparação com a média de 36.8 °C / 98 F , variando de 21 a 71 °C para a classe Multimedia.
(-) A parte inferior aquece até um máximo de 68 °C / 154 F, em comparação com a média de 39.1 °C / 102 F
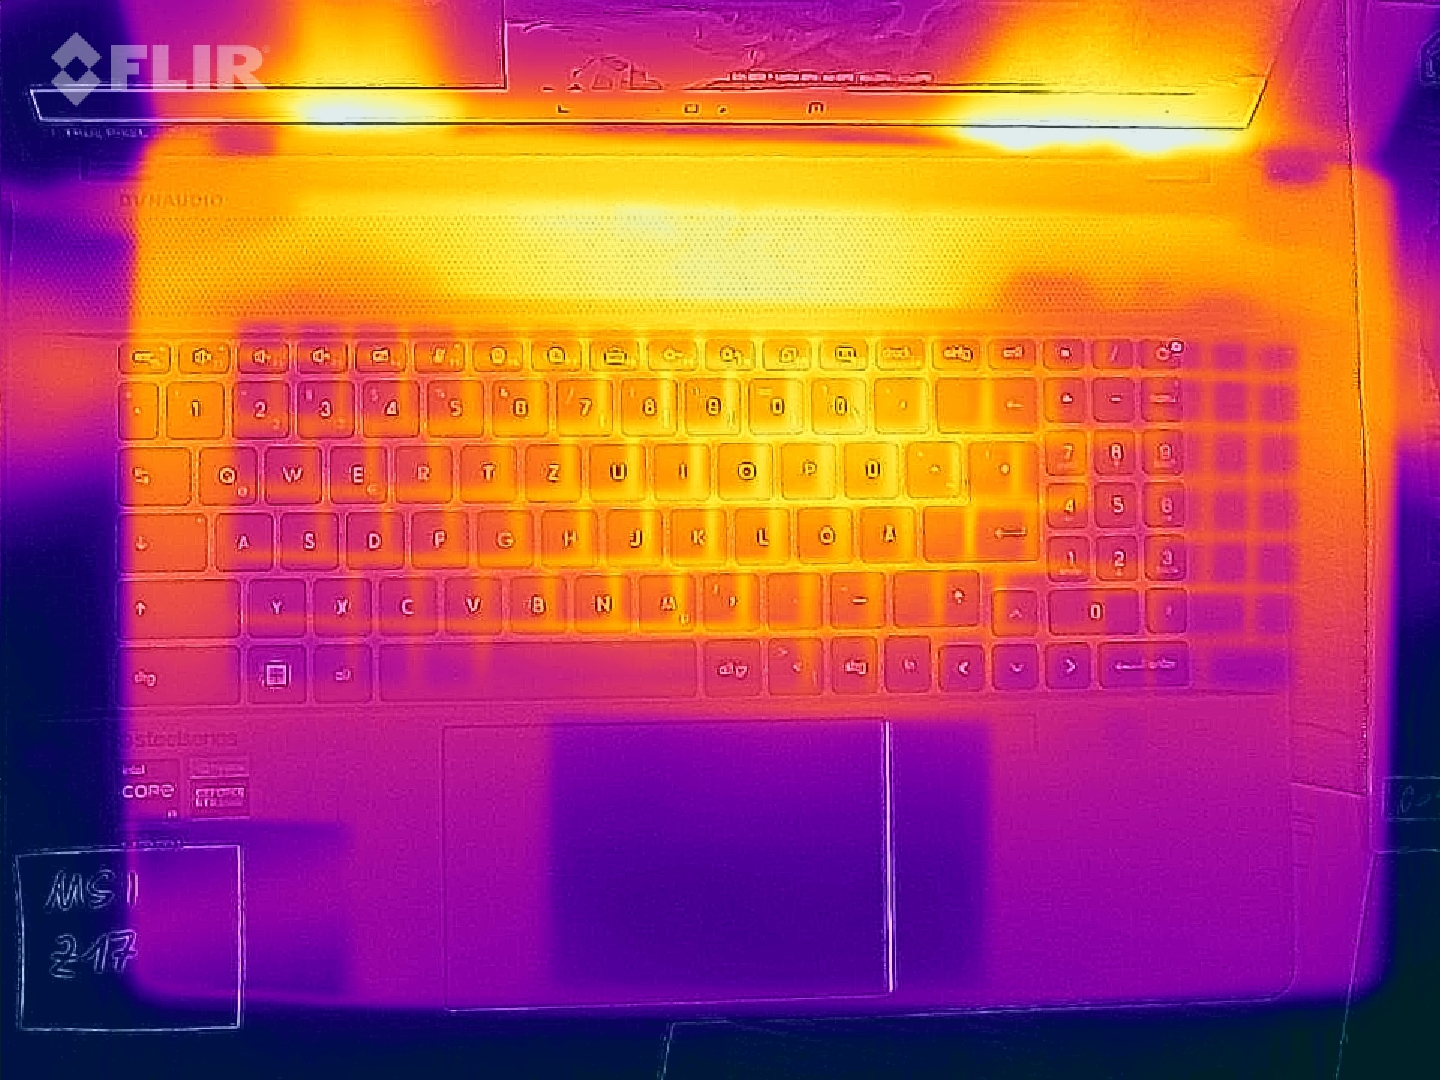
(+) Em uso inativo, a temperatura média para o lado superior é 27 °C / 81 F, em comparação com a média do dispositivo de 31.3 °C / ### class_avg_f### F.
(-) Jogando The Witcher 3, a temperatura média para o lado superior é 44.6 °C / 112 F, em comparação com a média do dispositivo de 31.3 °C / ## #class_avg_f### F.
(-) Os apoios para as mãos e o touchpad podem ficar muito quentes ao toque, com um máximo de 40 °C / 104 F.
(-) A temperatura média da área do apoio para as mãos de dispositivos semelhantes foi 28.7 °C / 83.7 F (-11.3 °C / -20.3 F).
| MSI Creator Z17 A12UGST-054 Intel Core i9-12900H, NVIDIA GeForce RTX 3070 Ti Laptop GPU | MSI Creator 17 A10SGS Intel Core i7-10875H, NVIDIA GeForce RTX 2080 Super Max-Q | MSI Creator Z16P B12UHST Intel Core i9-12900H, NVIDIA GeForce RTX 3080 Ti Laptop GPU | Razer Blade 17 (i7-12800H, RTX 3070 Ti) Intel Core i7-12800H, NVIDIA GeForce RTX 3070 Ti Laptop GPU | Aorus 17X XES Intel Core i9-12900HX, NVIDIA GeForce RTX 3070 Ti Laptop GPU | Dell XPS 17 9720 RTX 3060 Intel Core i7-12700H, NVIDIA GeForce RTX 3060 Laptop GPU | |
|---|---|---|---|---|---|---|
| Heat | 1% | -1% | 11% | -8% | 5% | |
| Maximum Upper Side * (°C) | 63.9 | 52 19% | 67 -5% | 43 33% | 54 15% | 51.8 19% |
| Maximum Bottom * (°C) | 68 | 59 13% | 69 -1% | 44 35% | 58 15% | 44.2 35% |
| Idle Upper Side * (°C) | 28.3 | 34 -20% | 29 -2% | 32 -13% | 37 -31% | 34.8 -23% |
| Idle Bottom * (°C) | 30.2 | 33 -9% | 29 4% | 34 -13% | 39 -29% | 33.2 -10% |
* ... menor é melhor
Teste de estresse
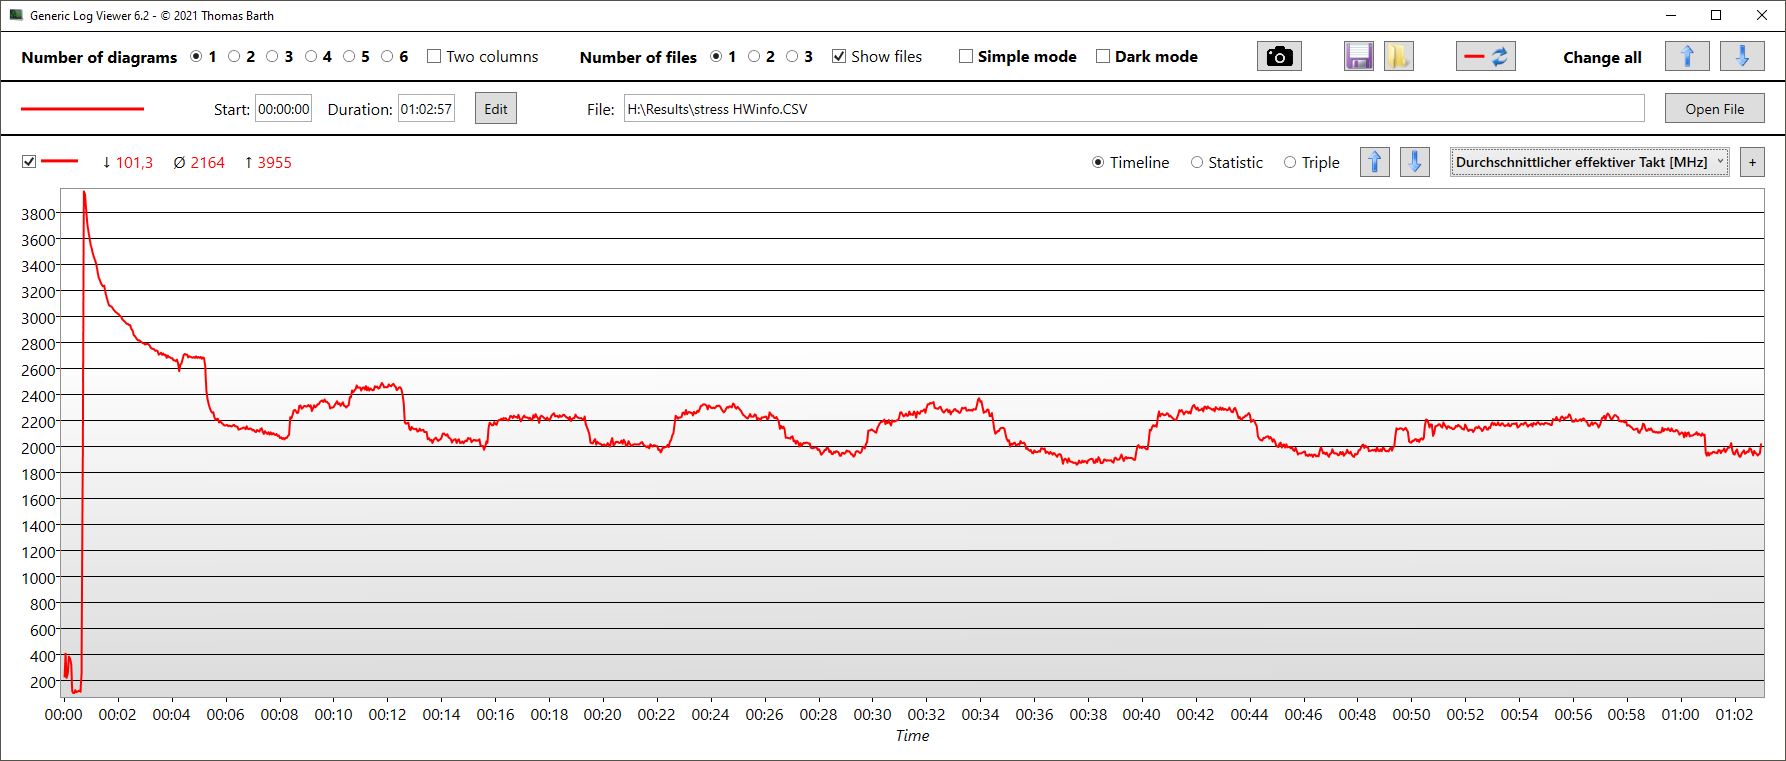
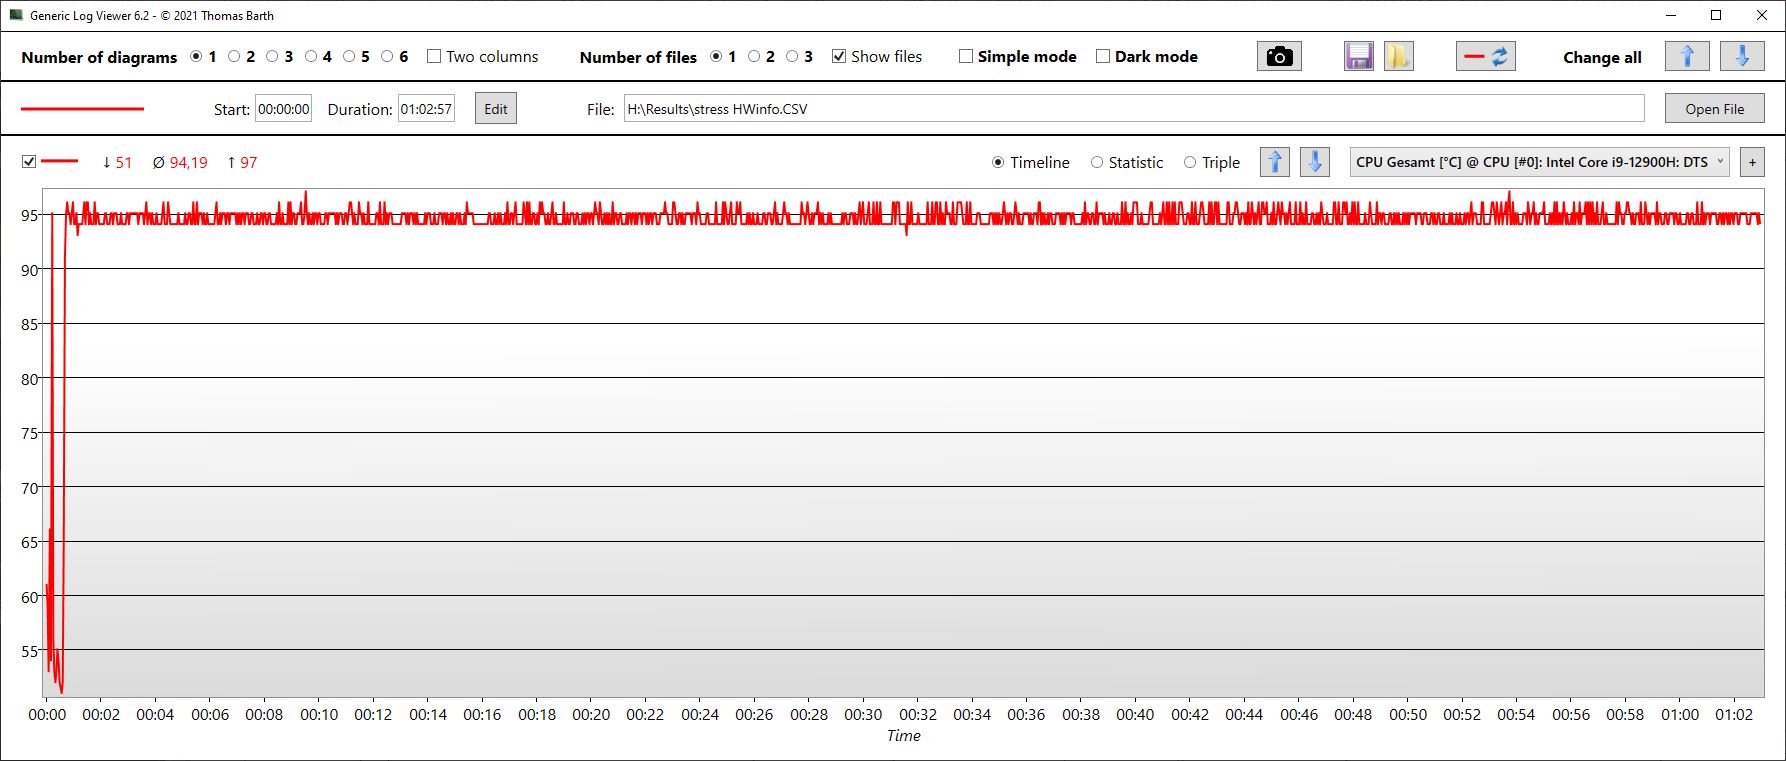
No início do nosso teste de estresse de uma hora, a velocidade do relógio da CPU aproximou-se muito rapidamente dos 4 GHz. Depois caiu rapidamente devido às altas temperaturas antes de se estabilizar em torno de 2,1 a 2,2 GHz. Os núcleos estavam atingindo seu limite de temperatura e funcionando a 94°C (201°C) em média.
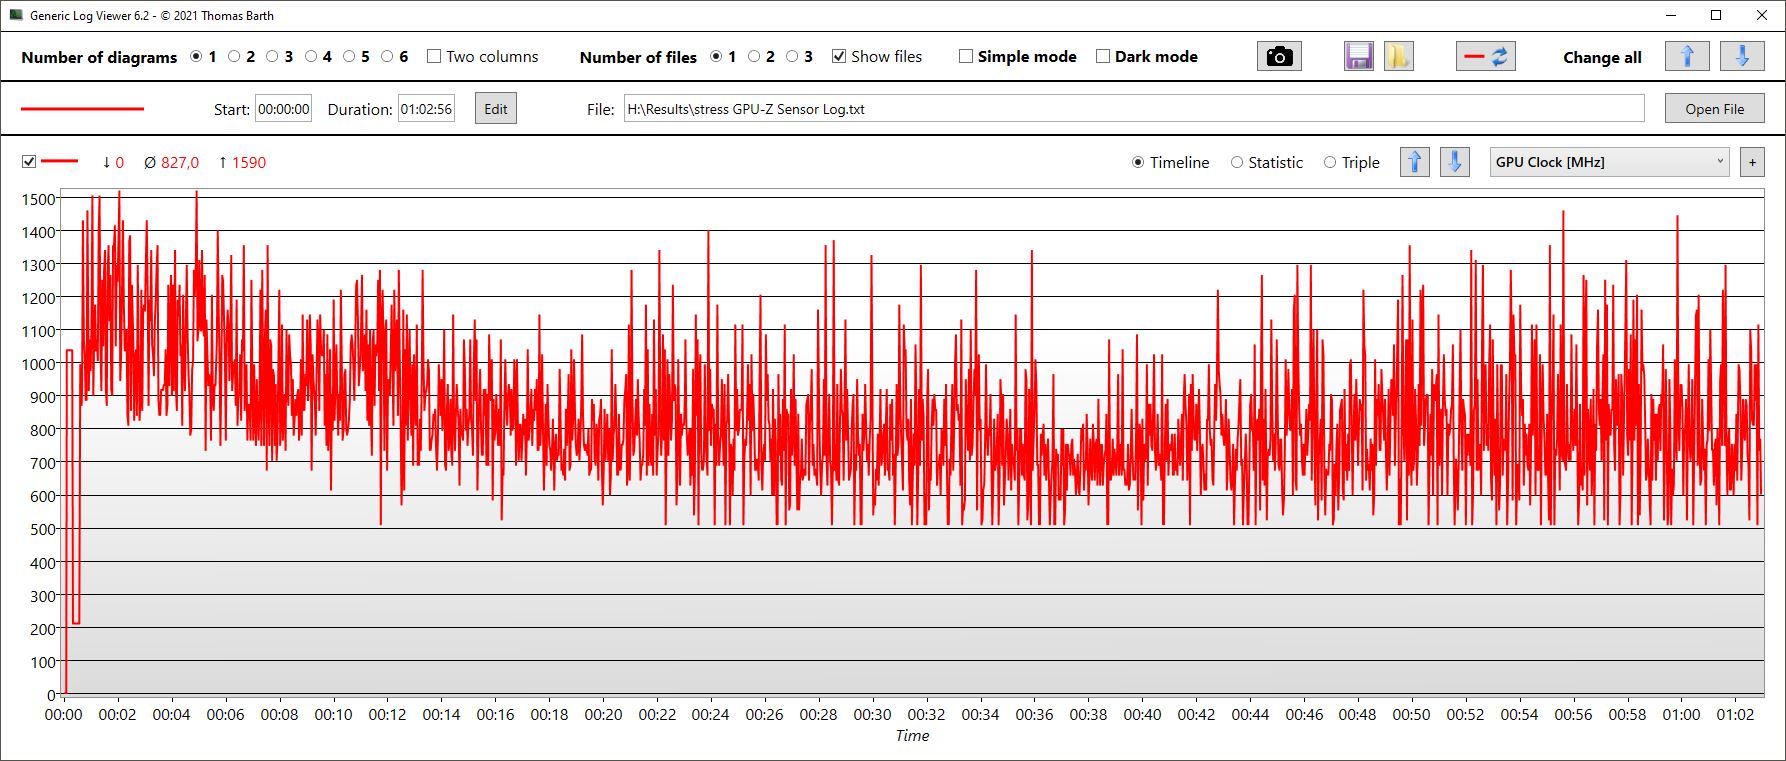
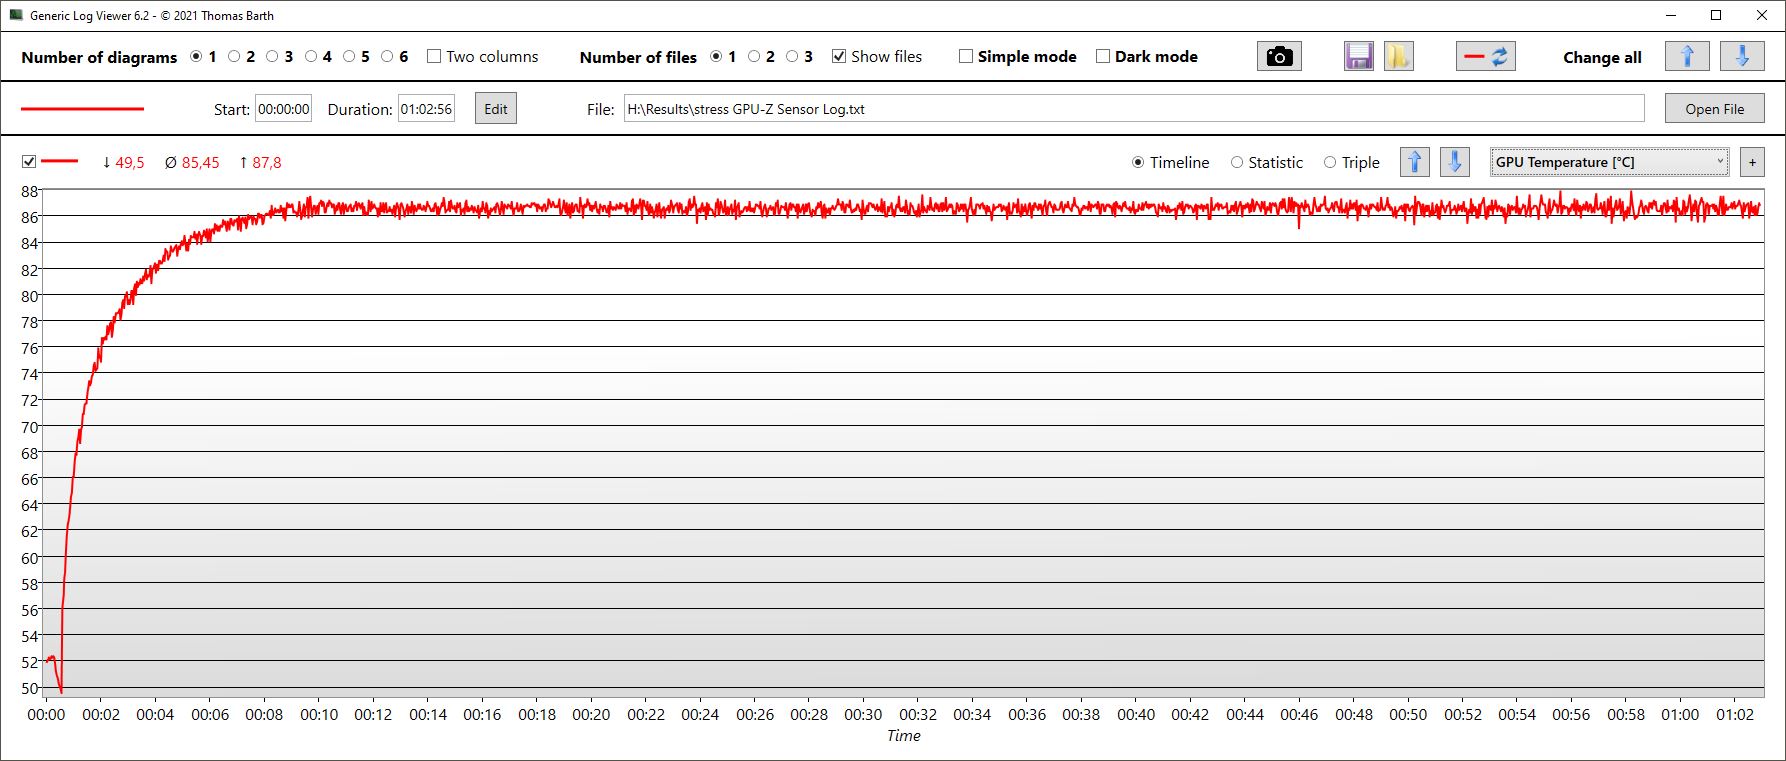
Ao mesmo tempo, a velocidade do relógio GPU flutuou drasticamente entre 500 MHz e 1,4 GHz, atingindo uma média bastante baixa de 827 MHz. A GPU permaneceu a uma temperatura constante de 85°C (185°F) e consumiu cerca de 72 watts de potência.
Oradores
Mesmo que os alto-falantes estéreo bidirecionais possam ficar mais altos, eles quase não têm baixo para falar. Esperávamos mais dos alto-falantes estereofônicos. Há apenas uma tomada de fone de ouvido disponível para conectar dispositivos de reprodução analógica.
MSI Creator Z17 A12UGST-054 análise de áudio
(+) | os alto-falantes podem tocar relativamente alto (###valor### dB)
Graves 100 - 315Hz
(-) | quase nenhum baixo - em média 29.6% menor que a mediana
(±) | a linearidade dos graves é média (12.8% delta para a frequência anterior)
Médios 400 - 2.000 Hz
(+) | médios equilibrados - apenas 2.4% longe da mediana
(±) | a linearidade dos médios é média (8.9% delta para frequência anterior)
Altos 2 - 16 kHz
(±) | máximos mais altos - em média 6.8% maior que a mediana
(+) | os máximos são lineares (6.5% delta da frequência anterior)
Geral 100 - 16.000 Hz
(±) | a linearidade do som geral é média (20.9% diferença em relação à mediana)
Comparado com a mesma classe
» 71% de todos os dispositivos testados nesta classe foram melhores, 8% semelhantes, 21% piores
» O melhor teve um delta de 5%, a média foi 17%, o pior foi 45%
Comparado com todos os dispositivos testados
» 57% de todos os dispositivos testados foram melhores, 8% semelhantes, 35% piores
» O melhor teve um delta de 4%, a média foi 23%, o pior foi 134%
Apple MacBook Pro 16 2021 M1 Pro análise de áudio
(+) | os alto-falantes podem tocar relativamente alto (###valor### dB)
Graves 100 - 315Hz
(+) | bons graves - apenas 3.8% longe da mediana
(+) | o baixo é linear (5.2% delta para a frequência anterior)
Médios 400 - 2.000 Hz
(+) | médios equilibrados - apenas 1.3% longe da mediana
(+) | médios são lineares (2.1% delta para frequência anterior)
Altos 2 - 16 kHz
(+) | agudos equilibrados - apenas 1.9% longe da mediana
(+) | os máximos são lineares (2.7% delta da frequência anterior)
Geral 100 - 16.000 Hz
(+) | o som geral é linear (4.6% diferença em relação à mediana)
Comparado com a mesma classe
» 0% de todos os dispositivos testados nesta classe foram melhores, 0% semelhantes, 100% piores
» O melhor teve um delta de 5%, a média foi 17%, o pior foi 45%
Comparado com todos os dispositivos testados
» 0% de todos os dispositivos testados foram melhores, 0% semelhantes, 100% piores
» O melhor teve um delta de 4%, a média foi 23%, o pior foi 134%
Gerenciamento de energia - estação de trabalho de acordo com as expectativas
Consumo de energia
Assim como o desempenho, o consumo de energia é razoável sob carga. Em comparação, o Lâmina Razer 17 usa significativamente mais energia durante os jogos ou enquanto funciona com carga máxima. O mesmo é válido também para o Aorus.
Em contraste, o uso de energia do Z17 é bastante incomum - é duas vezes maior do que o dos concorrentes. Porque o Criador Z16P usa apenas metade da energia em modo inativo que o Z17, apesar de ter uma GPU mais potente, acreditamos que um processo está fazendo com que a GPU RTX seja ativada.
Medimos uma potência de pico de 220 watts. O carregador de 240 watts (aproximadamente 16,4 x 7,5 x 2,5 cm, ou 6,5 x 3,0 x 1,0") não deve ter nenhum problema para lidar com este nível de uso de energia.
| desligado | |
| Ocioso | |
| Carga |
|
Key:
min: | |
| MSI Creator Z17 A12UGST-054 i9-12900H, GeForce RTX 3070 Ti Laptop GPU, Micron 3400 1TB MTFDKBA1T0TFH, IPS, 2560x1600, 17" | MSI Creator 17 A10SGS i7-10875H, GeForce RTX 2080 Super Max-Q, Samsung SSD PM981 MZVLB2T0HMLB, Mini-LED IPS-Level, 3840x2160, 17.3" | MSI Creator Z16P B12UHST i9-12900H, GeForce RTX 3080 Ti Laptop GPU, Samsung PM9A1 MZVL22T0HBLB, IPS True Pixel (~100% DCI-P3), 2560x1600, 16" | Razer Blade 17 (i7-12800H, RTX 3070 Ti) i7-12800H, GeForce RTX 3070 Ti Laptop GPU, Samsung PM9A1 MZVL21T0HCLR, IPS, 2560x1440, 17.3" | Aorus 17X XES i9-12900HX, GeForce RTX 3070 Ti Laptop GPU, Gigabyte AG470S1TB-SI B10, IPS, 1920x1080, 17.3" | Dell XPS 17 9720 RTX 3060 i7-12700H, GeForce RTX 3060 Laptop GPU, Samsung PM9A1 MZVL21T0HCLR, IPS, 3840x2400, 17" | Média NVIDIA GeForce RTX 3070 Ti Laptop GPU | Média da turma Multimedia | |
|---|---|---|---|---|---|---|---|---|
| Power Consumption | 18% | 33% | 21% | 3% | 45% | 31% | 67% | |
| Idle Minimum * (Watt) | 34.6 | 15 57% | 11 68% | 14.4 58% | 18 48% | 5.9 83% | 14.2 ? 59% | 5.66 ? 84% |
| Idle Average * (Watt) | 43 | 20 53% | 17 60% | 20 53% | 28 35% | 15.8 63% | 19.9 ? 54% | 10.2 ? 76% |
| Idle Maximum * (Watt) | 44.9 | 42 6% | 26 42% | 21.5 52% | 36 20% | 26.7 41% | 26.2 ? 42% | 12.5 ? 72% |
| Load Average * (Watt) | 145 | 150 -3% | 124 14% | 119 18% | 153 -6% | 117.4 19% | 125.8 ? 13% | 65.2 ? 55% |
| Witcher 3 ultra * (Watt) | 152.4 | 170 -12% | 133.5 12% | 218 -43% | 221 -45% | 114.8 25% | ||
| Load Maximum * (Watt) | 220 | 210 5% | 212 4% | 248 -13% | 290 -32% | 136.6 38% | 248 ? -13% | 113.5 ? 48% |
* ... menor é melhor
Power consumption Witcher 3 / stress test
Power consumption with external monitor
Duração da bateria
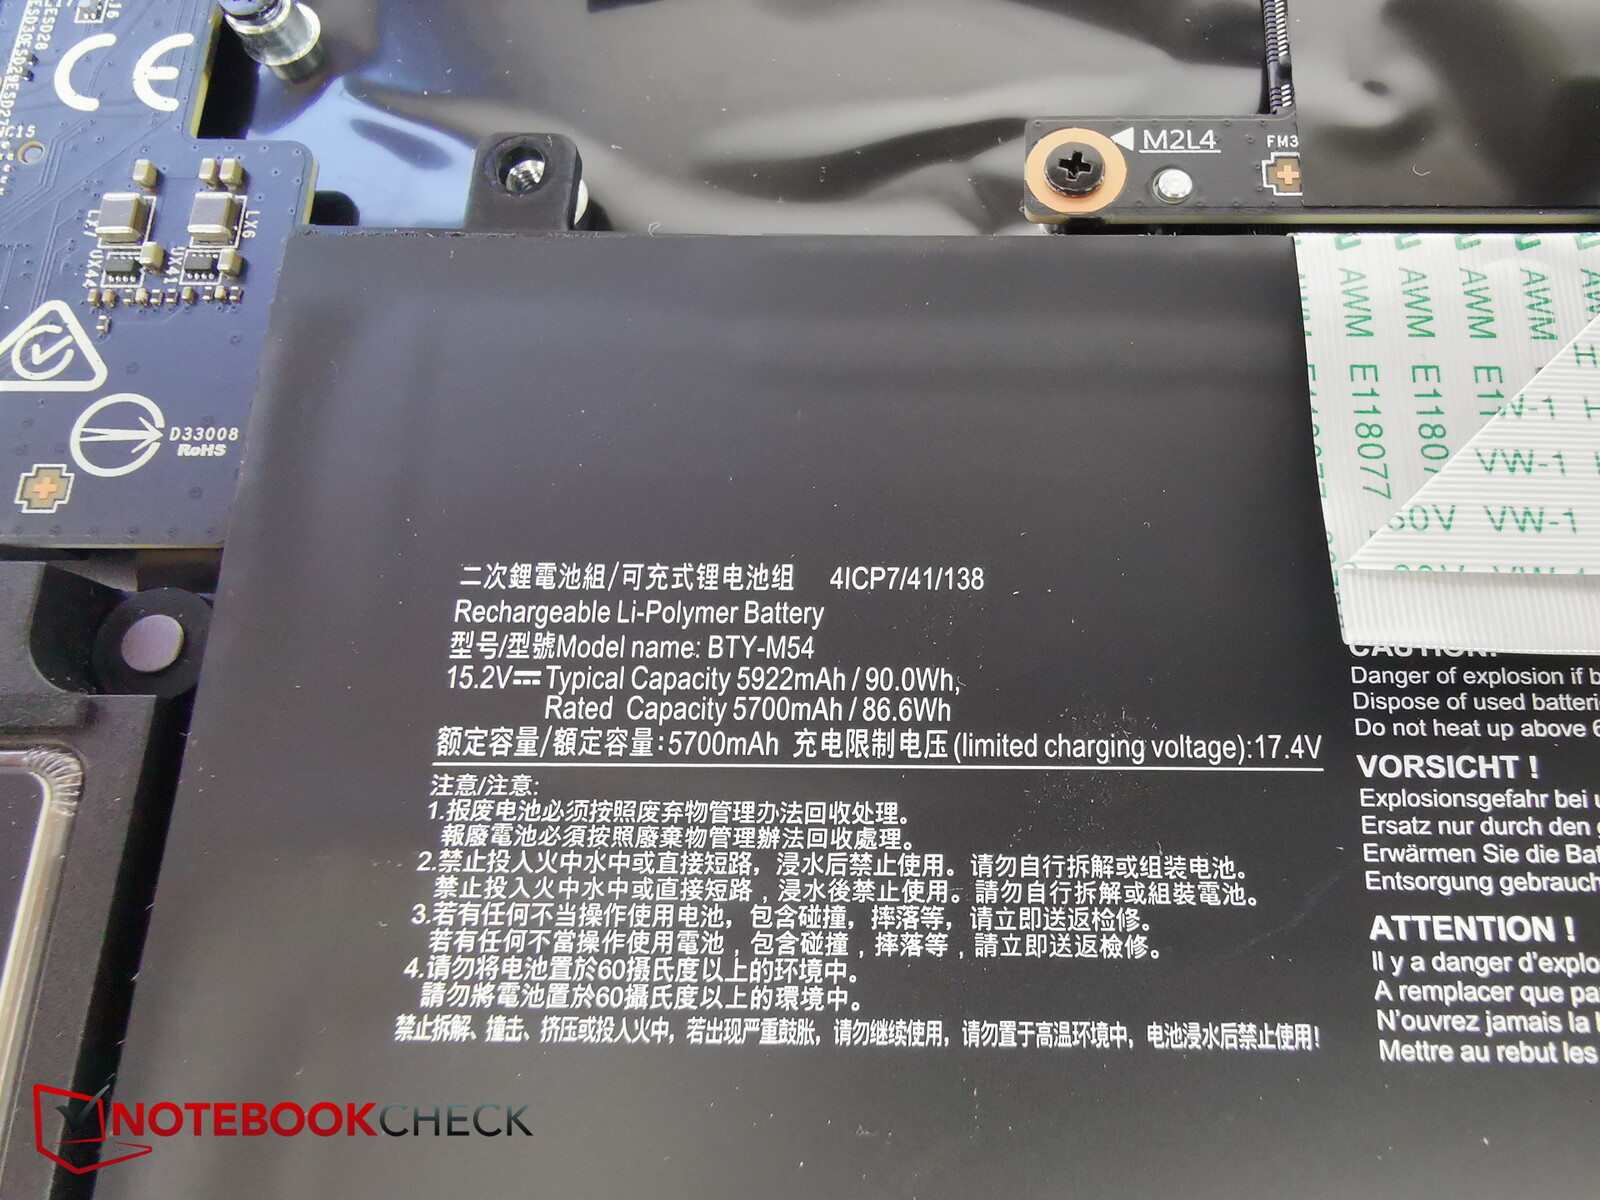
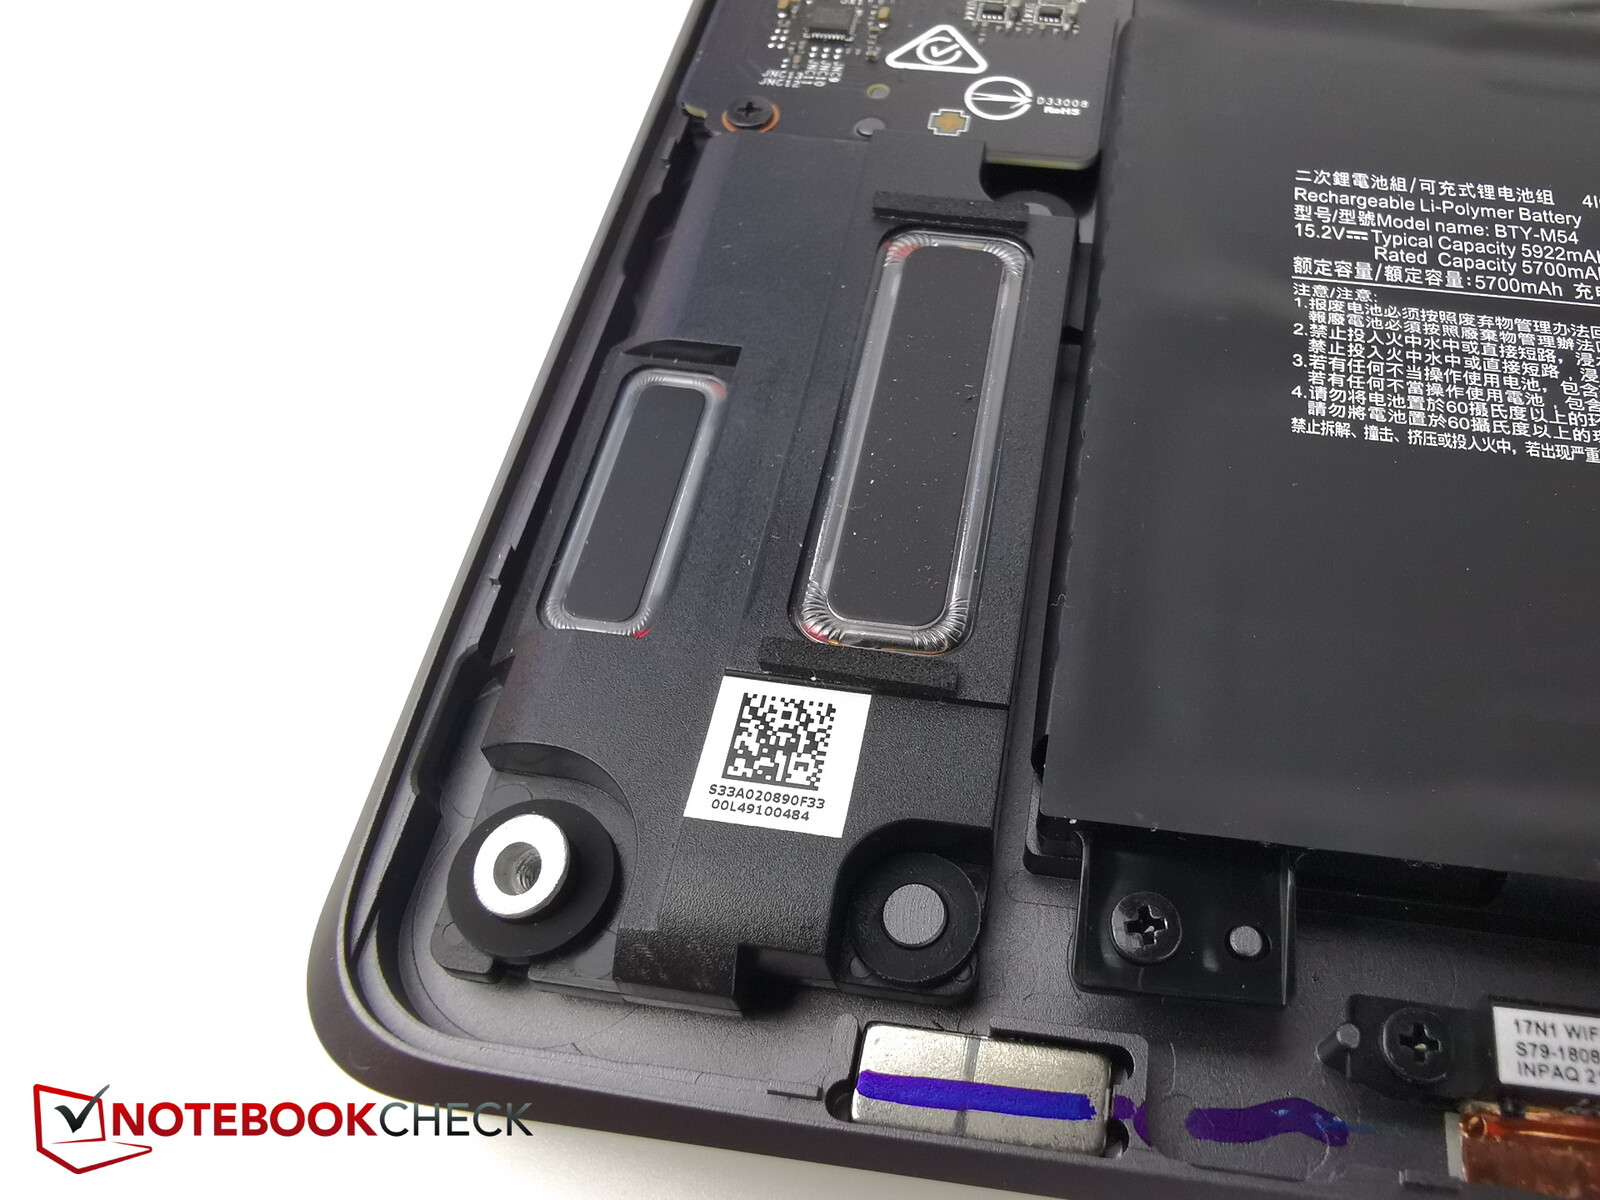
O Creator Z17 é alimentado por uma bateria de 90 Wh quando desconectado, que está no mesmo nível dos outros laptops na comparação. A vida útil da bateria resultante está mais na parte superior entre os dispositivos na comparação. Apesar de ter uma bateria marginalmente menor, a Lâmina Razer 17 é capaz de durar quase tanto tempo com uma única carga. A fim de maximizar a bateria de um laptop, é crucial reduzir a taxa de atualização do visor para 60 Hz. No Z17, isto acontece quase automaticamente quando o dispositivo é desconectado.
O Z17 durará entre 4,5 e 5,5 horas (dependendo do brilho da tela) ao navegar na web. A duração da bateria está na mesma faixa para reprodução de vídeo.
| MSI Creator Z17 A12UGST-054 i9-12900H, GeForce RTX 3070 Ti Laptop GPU, 90 Wh | MSI Creator 17 A10SGS i7-10875H, GeForce RTX 2080 Super Max-Q, 82 Wh | MSI Creator Z16P B12UHST i9-12900H, GeForce RTX 3080 Ti Laptop GPU, 90 Wh | Razer Blade 17 (i7-12800H, RTX 3070 Ti) i7-12800H, GeForce RTX 3070 Ti Laptop GPU, 82 Wh | Aorus 17X XES i9-12900HX, GeForce RTX 3070 Ti Laptop GPU, 99 Wh | Dell XPS 17 9720 RTX 3060 i7-12700H, GeForce RTX 3060 Laptop GPU, 97 Wh | Média da turma Multimedia | |
|---|---|---|---|---|---|---|---|
| Duração da bateria | -35% | -18% | -7% | -29% | 2% | 103% | |
| H.264 (h) | 5.5 | 5.8 5% | 4.9 -11% | 3.8 -31% | 17.1 ? 211% | ||
| WiFi v1.3 (h) | 5.5 | 4.4 -20% | 5.2 -5% | 5.9 7% | 4.4 -20% | 8.7 58% | 12.2 ? 122% |
| Load (h) | 2.2 | 1.1 -50% | 1 -55% | 1.8 -18% | 1.4 -36% | 1 -55% | 1.664 ? -24% |
| Reader / Idle (h) | 7.2 | 24.9 ? |
Pro
Contra
Veredicto - Regar os olhos 4.000 euros para a estação de trabalho MSI
À primeira vista, o MSI Creator Z17 parece ser um ótimo laptop de trabalho para os criativos. Seu preço elevado é atribuído não apenas ao seu hardware potente, mas também ao seu chassi metálico robusto, fator de forma fina excepcional, grande tela sensível ao toque e assim por diante.
É verdade que colocamos a fasquia relativamente alta para o Z17, mas isso ainda nos decepcionou como um todo. Isto se deve principalmente ao fato de que o dispositivo gera muito calor e ruído: apesar de ter três ventiladores, o sistema de resfriamento não é ideal para o chassi fino. Isto significa que o Z17 é mais quente e mais alto do que seus concorrentes e ainda tem pior desempenho em aplicações 3D porque o RTX 3070 Ti tem apenas 90 watts de potência à sua disposição. Não é possível aumentar a potência, dadas as temperaturas já altas.
Poderíamos ter negligenciado o desempenho um pouco abaixo da média em um laptop de trabalho se ele funcionasse mais silencioso e mais frio do que os concorrentes. No entanto, o oposto é verdadeiro para o Z17.
O Criador Z17 tem um tamanho fantástico, uma ótima tela sensível ao toque e um bom ajuste e acabamento, mas é prejudicado pelo fato de que a solução de resfriamento parece estar ligeiramente sobrecarregada e causar queda de desempenho ao longo do tempo
O excelente Lâmina Razer 17 é uma ótima alternativa para o Z17. É igualmente fino e premium, mas é mais silencioso, mais frio e até mesmo capaz de proporcionar um desempenho mais consistente. O próprio MSI Criador Z16Ptambém faz algumas coisas um pouco melhor do que o Z17, como os níveis de ruído.
Preço e disponibilidade
A Z17 deveria custar mais de 4.000 euros (US$ 3.875), o que nos parece muito caro, considerando as alternativas disponíveis. Entretanto, um modelo com especificações similares está agora disponível em Amazon.com por US$3.049.
MSI Creator Z17 A12UGST-054
- 09/20/2022 v7 (old)
Christian Hintze
Price comparison

